72 GE 2010 ANNUAL REPORT Note 1. Summary of Significant Accounting Policies Accounting Principles Our financial statements are prepared in conformity with U.S. generally accepted accounting principles (GAAP). Consolidation Our financial statements consolidate all of our affiliates—entities in which we have a controlling financial interest, most often because we hold a majority voting interest. To determine if we hold a controlling financial interest in an entity we first evaluate if we are required to apply the variable interest entity (VIE) model to the entity, otherwise the entity is evaluated under the voting interest model. Where we hold current or potential rights that give us the power to direct the activities of a VIE that most significantly impact the VIE’s economic performance combined with a variable interest that gives us the right to receive potentially significant benefits or the obligation to absorb potentially significant losses, we have a controlling financial interest in that VIE. Rights held by others to remove the party with power over the VIE are not considered unless one party can exercise those rights unilaterally. When changes occur to the design of an entity we reconsider whether it is subject to the VIE model. We continuously evaluate whether we have a controlling financial interest in a VIE. We hold a controlling financial interest in other entities where we currently hold, directly or indirectly, more than 50% of the voting rights or where we exercise control through substantive participating rights or as a general partner. Where we are a gen- eral partner we consider substantive removal rights held by other partners in determining if we hold a controlling financial interest. We evaluate whether we have a controlling financial interest in these entities when our voting or substantive participating rights change. Associated companies are unconsolidated VIEs and other entities in which we do not have a controlling financial interest, but over which we have significant influence, most often because we hold a voting interest of 20% to 50%. Associated companies are accounted for as equity method investments. Results of associated companies are presented on a one-line basis. Invest- ments in, and advances to, associated companies are presented on a one-line basis in the caption “All other assets” in our Statement of Financial Position, net of allowance for losses that represents our best estimate of probable losses inherent in such assets. Financial Statement Presentation We have reclassified certain prior-year amounts to conform to the current-year’s presentation. Financial data and related measurements are presented in the following categories: • GE—This represents the adding together of all affiliates other than General Electric Capital Services, Inc. (GECS), whose operations are presented on a one-line basis. • GECS—This affiliate owns all of the common stock of General Electric Capital Corporation (GECC). GECC and its respective affiliates are consolidated in the accompanying GECS columns and constitute the majority of its business. • CONSOLIDATED—This represents the adding together of GE and GECS, giving effect to the elimination of transactions between GE and GECS. • OPERATING SEGMENTS—These comprise our five businesses, focused on the broad markets they serve: Energy Infrastructure, Technology Infrastructure, NBC Universal (NBCU), GE Capital and Home & Business Solutions. Prior-period information has been reclassified to be consistent with how we managed our busi- nesses in 2010. Unless otherwise indicated, information in these notes to consoli- dated financial statements relates to continuing operations. Certain of our operations have been presented as discontinued. See Note 2. The effects of translating to U.S. dollars the financial state- ments of non-U.S. affiliates whose functional currency is the local currency are included in shareowners’ equity. Asset and liability accounts are translated at year-end exchange rates, while rev- enues and expenses are translated at average rates for the respective periods. Preparing financial statements in conformity with U.S. GAAP requires us to make estimates based on assumptions about current, and for some estimates future, economic and market conditions (for example, unemployment, market liquidity, the real estate market, etc.), which affect reported amounts and related disclosures in our financial statements. Although our current estimates contemplate current conditions and how we expect them to change in the future, as appropriate, it is reasonably possible that in 2011 actual conditions could be worse than antici- pated in those estimates, which could materially affect our results of operations and financial position. Among other effects, such changes could result in future impairments of investment securi- ties, goodwill, intangibles and long-lived assets, incremental losses on financing receivables, establishment of valuation allow- ances on deferred tax assets and increased tax liabilities. Sales of Goods and Services We record all sales of goods and services only when a firm sales agreement is in place, delivery has occurred or services have been rendered and collectibility of the fixed or determinable sales price is reasonably assured. Arrangements for the sale of goods and services sometimes include multiple components. Most of our multiple component arrangements involve the sale of goods and services in the Technology Infrastructure segment. Our arrangements with multiple components usually involve future service deliverables such as installation, training or the future delivery of ancillary equipment. In such agreements, the amount assigned to each component is based on the total price and the undelivered com- ponent’s objectively determined fair value, determined from sources such as the separate selling price for that or a similar component or from competitor prices for similar components. If fair value of an undelivered component cannot be satisfactorily notes to consolidated financial statements

Welcome message from author
This document is posted to help you gain knowledge. Please leave a comment to let me know what you think about it! Share it to your friends and learn new things together.
Transcript

72 GE 2010 ANNUAL REPORT
Note 1.
Summary of Significant Accounting Policies
Accounting PrinciplesOur financial statements are prepared in conformity with U.S.
generally accepted accounting principles (GAAP).
ConsolidationOur financial statements consolidate all of our affiliates—entities
in which we have a controlling financial interest, most often
because we hold a majority voting interest. To determine if we
hold a controlling financial interest in an entity we first evaluate if
we are required to apply the variable interest entity (VIE) model
to the entity, otherwise the entity is evaluated under the voting
interest model.
Where we hold current or potential rights that give us the
power to direct the activities of a VIE that most significantly impact
the VIE’s economic performance combined with a variable interest
that gives us the right to receive potentially significant benefits or
the obligation to absorb potentially significant losses, we have a
controlling financial interest in that VIE. Rights held by others to
remove the party with power over the VIE are not considered
unless one party can exercise those rights unilaterally. When
changes occur to the design of an entity we reconsider whether it is
subject to the VIE model. We continuously evaluate whether we
have a controlling financial interest in a VIE.
We hold a controlling financial interest in other entities where
we currently hold, directly or indirectly, more than 50% of the
voting rights or where we exercise control through substantive
participating rights or as a general partner. Where we are a gen-
eral partner we consider substantive removal rights held by other
partners in determining if we hold a controlling financial interest.
We evaluate whether we have a controlling financial interest in
these entities when our voting or substantive participating
rights change.
Associated companies are unconsolidated VIEs and other
entities in which we do not have a controlling financial interest,
but over which we have significant influence, most often because
we hold a voting interest of 20% to 50%. Associated companies
are accounted for as equity method investments. Results of
associated companies are presented on a one-line basis. Invest-
ments in, and advances to, associated companies are presented on
a one-line basis in the caption “All other assets” in our Statement
of Financial Position, net of allowance for losses that represents
our best estimate of probable losses inherent in such assets.
Financial Statement PresentationWe have reclassified certain prior-year amounts to conform to the
current-year’s presentation.
Financial data and related measurements are presented in
the following categories:
• GE—This represents the adding together of all affiliates other
than General Electric Capital Services, Inc. (GECS), whose
operations are presented on a one-line basis.
• GECS—This affiliate owns all of the common stock of General
Electric Capital Corporation (GECC). GECC and its respective
affiliates are consolidated in the accompanying GECS columns
and constitute the majority of its business.
• CONSOLIDATED—This represents the adding together of GE and
GECS, giving effect to the elimination of transactions between
GE and GECS.
• OPERATING SEGMENTS—These comprise our five businesses,
focused on the broad markets they serve: Energy Infrastructure,
Technology Infrastructure, NBC Universal (NBCU), GE Capital and
Home & Business Solutions. Prior-period information has been
reclassified to be consistent with how we managed our busi-
nesses in 2010.
Unless otherwise indicated, information in these notes to consoli-
dated financial statements relates to continuing operations.
Certain of our operations have been presented as discontinued.
See Note 2.
The effects of translating to U.S. dollars the financial state-
ments of non-U.S. affiliates whose functional currency is the local
currency are included in shareowners’ equity. Asset and liability
accounts are translated at year-end exchange rates, while rev-
enues and expenses are translated at average rates for the
respective periods.
Preparing financial statements in conformity with U.S. GAAP
requires us to make estimates based on assumptions about
current, and for some estimates future, economic and market
conditions (for example, unemployment, market liquidity, the real
estate market, etc.), which affect reported amounts and related
disclosures in our financial statements. Although our current
estimates contemplate current conditions and how we expect
them to change in the future, as appropriate, it is reasonably
possible that in 2011 actual conditions could be worse than antici-
pated in those estimates, which could materially affect our results
of operations and financial position. Among other effects, such
changes could result in future impairments of investment securi-
ties, goodwill, intangibles and long-lived assets, incremental
losses on financing receivables, establishment of valuation allow-
ances on deferred tax assets and increased tax liabilities.
Sales of Goods and ServicesWe record all sales of goods and services only when a firm sales
agreement is in place, delivery has occurred or services have
been rendered and collectibility of the fixed or determinable
sales price is reasonably assured.
Arrangements for the sale of goods and services sometimes
include multiple components. Most of our multiple component
arrangements involve the sale of goods and services in the
Technology Infrastructure segment. Our arrangements with
multiple components usually involve future service deliverables
such as installation, training or the future delivery of ancillary
equipment. In such agreements, the amount assigned to each
component is based on the total price and the undelivered com-
ponent’s objectively determined fair value, determined from
sources such as the separate selling price for that or a similar
component or from competitor prices for similar components. If
fair value of an undelivered component cannot be satisfactorily
notes to consolidated financial statements
GE 2010 ANNUAL REPORT 73
notes to consolidated financial statements
engines by applying our contract-specific estimated margin rates
to incurred costs. We routinely update our estimates of future
revenues and costs for commercial aircraft engine agreements in
process and report any cumulative effects of such adjustments
in current operations. Significant components of our revenue and
cost estimates include price concessions, performance-related
guarantees as well as material, labor and overhead costs. We
measure revenue for military propulsion equipment and spare
parts not subject to long-term product services agreements
based on the specific contract on a specifically-measured output
basis. We provide for any loss that we expect to incur on these
agreements when that loss is probable; consistent with industry
practice, for commercial aircraft engines, we make such provision
only if such losses are not recoverable from future highly probable
sales of spare parts for those engines.
We sell product services under long-term product mainte-
nance or extended warranty agreements in our Technology
Infrastructure and Energy Infrastructure segments, principally in
Aviation, Energy and Transportation, where costs of performing
services are incurred on other than a straight-line basis. We also
sell product services in Healthcare, where such costs generally are
expected to be on a straight-line basis. For the Aviation, Energy
and Transportation agreements, we recognize related sales based
on the extent of our progress towards completion measured by
actual costs incurred in relation to total expected costs. We rou-
tinely update our estimates of future costs for agreements in
process and report any cumulative effects of such adjustments in
current operations. For the Healthcare agreements, we recognize
revenues on a straight-line basis and expense related costs as
incurred. We provide for any loss that we expect to incur on any
of these agreements when that loss is probable.
NBC Universal records broadcast and cable television and
Internet advertising sales when advertisements are aired, net of
provision for any viewer shortfalls (make goods). We record sales
from theatrical distribution of films as the films are exhibited;
sales of home videos, net of a return provision, when the videos
are delivered to and available for sale by retailers; fees from cable/
satellite operators when services are provided; and licensing of
film and television programming when we make the material
available for airing.
GECS Revenues from Services (Earned Income)We use the interest method to recognize income on loans.
Interest on loans includes origination, commitment and other
non-refundable fees related to funding (recorded in earned
income on the interest method). We stop accruing interest at the
earlier of the time at which collection of an account becomes
doubtful or the account becomes 90 days past due. Previously
recognized interest income that was accrued but not collected
from the borrower is evaluated as part of the overall receivable in
determining the adequacy of the allowance for losses. Although
we stop accruing interest in advance of payments, we recognize
interest income as cash is collected when appropriate, provided
the amount does not exceed that which would have been earned
at the historical effective interest rate; otherwise, payments
received are applied to reduce the principal balance of the loan.
We resume accruing interest on nonaccrual, non-restructured
commercial loans only when (a) payments are brought current
determined, we defer revenue until all components of an arrange-
ment are delivered.
Except for goods sold under long-term agreements, we recog-
nize sales of goods under the provisions of U.S. Securities and
Exchange Commission (SEC) Staff Accounting Bulletin (SAB) 104,
Revenue Recognition. We often sell consumer products, home
videos and computer hardware and software products with a
right of return. We use our accumulated experience to estimate
and provide for such returns when we record the sale. In situa-
tions where arrangements include customer acceptance
provisions based on seller or customer-specified objective crite-
ria, we recognize revenue when we have reliably demonstrated
that all specified acceptance criteria have been met or when
formal acceptance occurs. In arrangements where we provide
goods for trial and evaluation purposes, we only recognize rev-
enue after customer acceptance occurs. Unless otherwise noted,
we do not provide for anticipated losses before we record sales.
Certain of our sales of goods and services involve inconse-
quential or perfunctory performance obligations. These
obligations can include non-essential installation or training, and
in some instances provision of product manuals and limited
technical product support. When the only remaining undelivered
performance obligation under an arrangement is inconsequential
or perfunctory, we recognize revenue on the total contract and
provide for the cost of the unperformed obligation.
We recognize revenue on agreements for sales of goods and
services under power generation unit and uprate contracts;
nuclear fuel assemblies; larger oil drilling equipment projects;
aeroderivative unit contracts; military development contracts;
and long-term construction projects, using long-term construc-
tion and production contract accounting. We estimate total
long-term contract revenue net of price concessions as well as
total contract costs. For goods sold under power generation unit
and uprate contracts, nuclear fuel assemblies, aeroderivative unit
contracts and military development contracts, we recognize sales
as we complete major contract-specified deliverables, most often
when customers receive title to the goods or accept the services
as performed. For larger oil drilling equipment projects and long-
term construction projects, we recognize sales based on our
progress towards contract completion measured by actual costs
incurred in relation to our estimate of total expected costs. We
measure long-term contract revenues by applying our contract-
specific estimated margin rates to incurred costs. We routinely
update our estimates of future costs for agreements in process
and report any cumulative effects of such adjustments in current
operations. We provide for any loss that we expect to incur on
these agreements when that loss is probable.
We recognize revenue upon delivery for sales of aircraft
engines, military propulsion equipment and related spare parts
not sold under long-term product services agreements. Delivery
of commercial engines, non-U.S. military equipment and all
related spare parts occurs on shipment; delivery of military pro-
pulsion equipment sold to the U.S. Government or agencies
thereof occurs upon receipt of a Material Inspection and Receiving
Report, DD Form 250 or Memorandum of Shipment. Commercial
aircraft engines are complex aerospace equipment manufactured
to customer order under a variety of sometimes complex, long-
term agreements. We measure sales of commercial aircraft
74 GE 2010 ANNUAL REPORT
notes to consolidated financial statements
NBC Universal Film and Television CostsWe defer film and television production costs, including direct
costs, production overhead, development costs and interest. We
do not defer costs of exploitation, which principally comprise
costs of film and television program marketing and distribution.
We amortize deferred film and television production costs, as well
as associated participation and residual costs, on an individual
production basis using the ratio of the current period’s gross
revenues to estimated total remaining gross revenues from all
sources; we state such costs at the lower of amortized cost or fair
value. Estimates of total revenues and costs are based on antici-
pated release patterns, public acceptance and historical results
for similar products. We defer the costs of acquired broadcast
material, including rights to material for use on NBC Universal’s
broadcast and cable/satellite television networks, at the earlier of
acquisition or when the license period begins and the material is
available for use. We amortize acquired broadcast material and
rights when we broadcast the associated programs; we state
such costs at the lower of amortized cost or net realizable value.
Losses on Financing ReceivablesLosses on financing receivables are recognized when they are
incurred, which requires us to make our best estimate of probable
losses inherent in the portfolio. The method for calculating the
best estimate of losses depends on the size, type and risk charac-
teristics of the related financing receivable. Such an estimate
requires consideration of historical loss experience, adjusted for
current conditions, and judgments about the probable effects of
relevant observable data, including present economic conditions
such as delinquency rates, financial health of specific customers
and market sectors, collateral values (including housing price
indices as applicable), and the present and expected future levels
of interest rates. The underlying assumptions, estimates and
assessments we use to provide for losses are updated periodi-
cally to reflect our view of current conditions. Changes in such
estimates can significantly affect the allowance and provision for
losses. It is possible that we will experience credit losses that are
different from our current estimates. Write-offs are deducted
from the allowance for losses when we judge the principal to be
uncollectible and subsequent recoveries are added to the allow-
ance at the time cash is received on a written-off account.
“Impaired” loans are defined as larger-balance or restructured
loans for which it is probable that the lender will be unable to
collect all amounts due according to the original contractual
terms of the loan agreement. TDRs are those loans for which we
have granted a concession to a borrower experiencing financial
difficulties where we do not receive adequate compensation.
Such loans are classified as impaired, and are individually
reviewed for specific reserves.
“Delinquent” receivables are those that are 30 days or more
past due based on their contractual terms; and “nonearning”
receivables are those that are 90 days or more past due (or for
which collection is otherwise doubtful). Nonearning receivables
exclude loans purchased at a discount (unless they have deterio-
rated post acquisition). Under ASC 310, Receivables, these loans
are initially recorded at fair value and accrete interest income over
the estimated life of the loan based on reasonably estimable cash
flows even if the underlying loans are contractually delinquent at
according to the loan’s original terms and (b) future payments are
reasonably assured. When we agree to restructured terms with
the borrower, we resume accruing interest only when it is reason-
ably assured that we will recover full contractual payments, and
such loans pass underwriting reviews equivalent to those applied
to new loans. We resume accruing interest on nonaccrual con-
sumer loans when the customer’s account is less than 90 days
past due and collection of such amounts is probable. Interest
accruals on modified consumer loans that are not considered to
be troubled debt restructurings (TDRs) may return to current
status (re-aged) only after receipt of at least three consecutive
minimum monthly payments or the equivalent cumulative
amount, subject to a re-aging limitation of once a year, or twice
in a five-year period.
We recognize financing lease income on the interest method
to produce a level yield on funds not yet recovered. Estimated
unguaranteed residual values are based upon management’s
best estimates of the value of the leased asset at the end of the
lease term. We use various sources of data in determining this
estimate, including information obtained from third parties, which
is adjusted for the attributes of the specific asset under lease.
Guarantees of residual values by unrelated third parties are con-
sidered part of minimum lease payments. Significant assumptions
we use in estimating residual values include estimated net cash
flows over the remaining lease term, anticipated results of future
remarketing, and estimated future component part and scrap
metal prices, discounted at an appropriate rate.
We recognize operating lease income on a straight-line basis
over the terms of underlying leases.
Fees include commitment fees related to loans that we do not
expect to fund and line-of-credit fees. We record these fees in
earned income on a straight-line basis over the period to which
they relate. We record syndication fees in earned income at the
time related services are performed, unless significant contingen-
cies exist.
Depreciation and AmortizationThe cost of GE manufacturing plant and equipment is depreciated
over its estimated economic life. U.S. assets are depreciated using
an accelerated method based on a sum-of-the-years digits for-
mula; non-U.S. assets are generally depreciated on a straight-
line basis.
The cost of GECS equipment leased to others on operating
leases is depreciated on a straight-line basis to estimated residual
value over the lease term or over the estimated economic life of
the equipment.
The cost of GECS acquired real estate investments is depreci-
ated on a straight-line basis to the estimated salvage value over
the expected useful life or the estimated proceeds upon sale of
the investment at the end of the expected holding period if that
approach produces a higher measure of depreciation expense.
The cost of individually significant customer relationships is
amortized in proportion to estimated total related sales; cost of
other intangible assets is generally amortized on a straight-line
basis over the asset’s estimated economic life. We review long-
lived assets for impairment whenever events or changes in
circumstances indicate that the related carrying amounts may
not be recoverable. See Notes 7 and 8.
GE 2010 ANNUAL REPORT 75
notes to consolidated financial statements
larger-balance, non-homogeneous loans and leases, we consider
the financial status, payment history, collateral value, industry
conditions and guarantor support related to specific customers.
Any delinquencies or bankruptcies are indications of potential
impairment requiring further assessment of collectibility. We
routinely receive financial as well as rating agency reports on our
customers, and we elevate for further attention those customers
whose operations we judge to be marginal or deteriorating. We
also elevate customers for further attention when we observe a
decline in collateral values for asset-based loans. While collateral
values are not always available, when we observe such a decline,
we evaluate relevant markets to assess recovery alternatives—
for example, for real estate loans, relevant markets are local;
for commercial aircraft loans, relevant markets are global.
Measurement of the loss on our impaired loans is based on the
present value of expected future cash flows discounted at the loan’s
effective interest rate or the fair value of collateral, net of
expected selling costs if the loan is determined to be collateral
dependent. We determine whether a loan is collateral dependent
if the repayment of the loan is expected to be provided solely by
the underlying collateral. Our review process can often result in
reserves being established in advance of a modification of terms
or designation as a TDR. After providing for specific incurred
losses, we then determine an allow ance for losses that have been
incurred in the balance of the portfolio but cannot yet be identi-
fied to a specific loan or lease. This estimate is based upon various
statistical analyses considering historical and projected default
rates and loss severity and aging, as well as our view on current
market and economic conditions. It is prepared by each respec-
tive line of business. For Real Estate, this includes converting
economic indicators into real estate market indicators that are
calibrated by market and asset class and which are used to pro-
ject expected performance of the portfolio based on specific
loan portfolio metrics.
We consider multiple factors in evaluating the adequacy of
our allowance for losses on Real Estate financing receivables,
including loan-to-value ratios, collateral values at the individual
loan level, debt service coverage ratios, delinquency status, and
economic factors including interest rate and real estate market
forecasts. In addition to evaluating these factors, we deem a Real
Estate loan to be impaired if its projected loan-to-value ratio at
maturity is in excess of 100%, even if the loan is currently paying
in accordance with its contractual terms. The allowance for losses
on Real Estate financing receivables is based on a discounted
cash flow methodology, except in situations where the loan is
within 24 months of maturity or foreclosure is deemed probable,
in which case reserves are based on collateral values. If foreclo-
sure is deemed probable or if repayment is dependent solely on
the sale of collateral, we deduct estimated selling costs from the
fair value of the underlying collateral values. Collateral values for
our Real Estate loans are determined based upon internal cash
flow estimates discounted at an appropriate rate and corrobo-
rated by external appraisals, as appropriate. Collateral valuations
are updated at least semi-annually, or more frequently, for higher
risk loans. A substantial majority of our Real Estate impaired loans
have specific reserves that are determined based on the underly-
ing collateral values. For further discussion on determining fair
value see the Fair Value Measurements section below.
acquisition. In addition, nonearning receivables exclude loans that
are paying on a cash accounting basis but classified as nonaccrual
and impaired. “Nonaccrual” financing receivables include all
nonearning receivables and are those on which we have stopped
accruing interest. We stop accruing interest at the earlier of the
time at which collection of an account becomes doubtful or
the account becomes 90 days past due. Recently restructured
financing receivables are not considered delinquent when pay-
ments are brought current according to the restructured terms,
but may remain classified as nonaccrual until there has been a
period of satisfactory payment performance by the borrower
and future payments are reasonably assured of collection.
When we repossess collateral in satisfaction of a loan, we
write down the receivable against the allowance for losses.
Repossessed collateral is included in the caption “All other assets”
in the Statement of Financial Position and carried at the lower of
cost or estimated fair value less costs to sell.
We write off unsecured closed-end installment loans at
120 days contractually past due and unsecured open-ended
revolving loans at 180 days contractually past due. We write
down consumer loans secured by collateral other than residential
real estate when such loans are 120 days past due. Consumer
loans secured by residential real estate (both revolving and
closed-end loans) are written down to the fair value of collateral,
less costs to sell, no later than when they become 360 days past
due. Unsecured consumer loans in bankruptcy are written off
within 60 days of notification of filing by the bankruptcy court or
within contractual write-off periods, whichever occurs earlier.
Write-offs on larger-balance impaired commercial loans are
based on amounts deemed uncollectible and are reviewed quar-
terly. Write-offs on Real Estate loans are recorded upon initiation
of foreclosure or early settlement by the borrower, or in some
cases, based on the passage of time depending on specific facts
and circumstances. In Commercial Lending and Leasing (CLL),
loans are written off when deemed uncollectible (e.g., when the
borrower enters restructuring, collateral is to be liquidated or at
180 days past due for smaller-balance homogeneous loans).
Our consumer loan portfolio consists of smaller-balance
homogeneous loans including card receivables, installment loans,
auto loans and leases and residential mortgages. We collectively
evaluate each portfolio for impairment quarterly. The allowance
for losses on these receivables is established through a process
that estimates the probable losses inherent in the portfolio based
upon statistical analyses of portfolio data. These analyses include
migration analysis, in which historical delinquency and credit loss
experience is applied to the current aging of the portfolio,
together with other analyses that reflect current trends and
conditions. We also consider overall portfolio indicators including
nonearning loans, trends in loan volume and lending terms, credit
policies and other observable environmental factors such as
unemployment rates and home price indices.
Our commercial loan and lease portfolio consists of a variety
of loans and leases, including both larger-balance, non-homoge-
neous loans and leases and smaller-balance homogeneous
commercial and equipment loans and leases. Losses on such
loans and leases are recorded when probable and estimable. We
routinely evaluate our entire portfolio for potential specific credit
or collection issues that might indicate an impairment. For
76 GE 2010 ANNUAL REPORT
notes to consolidated financial statements
Effective January 1, 2009, we adopted Accounting Standards
Update (ASU) 2010-02, Accounting and Reporting for Decreases in Ownership of a Subsidiary, which clarified the scope of Topic 810,
Consolidation. Prior to January 1, 2009, we recorded gains or losses
on sales of their own shares by affili ates except when realization of
gains was not reasonably assured, in which case we recorded the
results in shareowners’ equity. We recorded gains or losses on sales
of interests in commercial and military engine and aeroderivative
equipment programs.
Cash and EquivalentsDebt securities and money market instruments with original
maturities of three months or less are included in cash equiva-
lents unless designated as available-for-sale and classified as
investment securities.
Investment SecuritiesWe report investments in debt and marketable equity securities,
and certain other equity securities, at fair value. See Note 21 for
further information on fair value. Unrealized gains and losses on
available-for-sale investment securities are included in shareown-
ers’ equity, net of applicable taxes and other adjustments. We
regularly review investment securities for impairment using both
quantitative and qualitative criteria.
If we do not intend to sell the security or it is not more likely
than not that we will be required to sell the security before recov-
ery of our amortized cost, we evaluate qualitative criteria to
determine whether we do not expect to recover the amortized
cost basis of the security, such as the financial health of and
specific prospects for the issuer, including whether the issuer is in
compliance with the terms and covenants of the security. We also
evaluate quantitative criteria including determining whether there
has been an adverse change in expected future cash flows. If we
do not expect to recover the entire amortized cost basis of the
security, we consider the security to be other-than-temporarily
impaired, and we record the difference between the security’s
amortized cost basis and its recoverable amount in earnings and
the difference between the security’s recoverable amount and fair
value in other comprehensive income. If we intend to sell the
secur ity or it is more likely than not we will be required to sell the
security before recovery of its amortized cost basis, the security
is also considered other-than-temporarily impaired and we recog-
nize the entire difference between the security’s amortized cost
basis and its fair value in earnings.
Prior to April 1, 2009, unrealized losses that were other-than-
temporary were recognized in earnings at an amount equal to the
difference between the security’s amortized cost and fair value. In
determining whether the unrealized loss was other-than-tempo-
rary, we considered both quantitative and qualitative criteria.
Quantitative criteria included the length of time and magnitude of
the amount that each security was in an unrealized loss position
and, for securities with fixed maturities, whether the issuer was in
compliance with terms and covenants of the security. For struc-
tured securities, we evaluated whether there was an adverse
change in the timing or amount of expected cash flows. Qualitative
criteria included the financial health of and specific prospects for
the issuer, as well as our intent and ability to hold the security to
maturity or until forecasted recovery.
Experience is not available for new products; therefore, while
we are developing that experience, we set loss allowances based
on our experience with the most closely analogous products in
our portfolio.
Our loss mitigation strategy intends to minimize economic
loss and, at times, can result in rate reductions, principal forgive-
ness, extensions, forbearance or other actions, which may cause
the related loan to be classified as a TDR.
We utilize certain loan modification programs for borrowers
experiencing temporary financial difficulties in our Consumer loan
portfolio. These loan modification programs are primarily concen-
trated in our U.S. credit card and non-U.S. residential mortgage
portfolios and include short-term (12 months or less) interest rate
reductions and payment deferrals, which were not part of the
terms of the original contract. We sold our U.S. residential mort-
gage business in 2007 and as such, do not participate in the
U.S. government-sponsored mortgage modification programs.
Our allowance for losses on financing receivables on these
modified consumer loans is determined based upon a formulaic
approach that estimates the probable losses inherent in the
portfolio based upon statistical analyses of the portfolio. Data
related to redefault experience is also considered in our overall
reserve adequacy review. Once the loan has been modified, it
returns to current status (re-aged) only after receipt of at least
three consecutive minimum monthly payments or the equivalent
cumulative amount, subject to a re-aging limitation of once a year,
or twice in a five-year period in accordance with the Federal
Financial Institutions Examination Council guidelines on Uniform
Retail Credit Classification and Account Management policy issued
in June 2000. We believe that the allowance for losses would not
be materially different had we not re-aged these accounts.
For commercial loans, we evaluate changes in terms and
conditions to determine whether those changes meet the criteria
for classification as a TDR on a loan-by-loan basis. In CLL, these
changes primarily include: changes to covenants, short-term
payment deferrals and maturity extensions. For these changes,
we receive economic consideration, including additional fees and/
or increased interest rates, and evaluate them under our normal
underwriting standards and criteria. Changes to Real Estate’s
loans primarily include maturity extensions, principal payment
acceleration, changes to collateral terms, and cash sweeps, which
are in addition to, or sometimes in lieu of, fees and rate increases.
The determination of whether these changes to the terms and
conditions of our commercial loans meet the TDR criteria includes
our consideration of all of the relevant facts and circumstances.
When the borrower is experiencing financial difficulty, we care-
fully evaluate these changes to determine whether they meet the
form of a concession. In these circumstances, if the change is
deemed to be a concession, we classify the loan as a TDR.
Partial Sales of Business InterestsOn January 1, 2009, we adopted amendments to Accounting
Standards Codification (ASC) 810, Consolidation, which requires
that gains or losses on sales of affiliate shares where we retain a
controlling financial interest to be recorded in equity. Gains or
losses on sales that result in our loss of a controlling financial
interest are recorded in earnings along with remeasurement
gains or losses on any investments in the entity that we retained.
GE 2010 ANNUAL REPORT 77
notes to consolidated financial statements
For short-duration insurance contracts, including accident
and health insurance, we report premiums as earned income over
the terms of the related agreements, generally on a pro-rata
basis. For traditional long-duration insurance contracts including
term, whole life and annuities payable for the life of the annuitant,
we report premiums as earned income when due.
Premiums received on investment contracts (including annui-
ties without significant mortality risk) and universal life contracts
are not reported as revenues but rather as deposit liabilities. We
recognize revenues for charges and assessments on these con-
tracts, mostly for mortality, contract initiation, administration
and surrender. Amounts credited to policyholder accounts are
charged to expense.
Liabilities for traditional long-duration insurance contracts
represent the present value of such benefits less the present
value of future net premiums based on mortality, morbidity,
interest and other assumptions at the time the policies were
issued or acquired. Liabilities for investment contracts and uni-
versal life policies equal the account value, that is, the amount
that accrues to the benefit of the contract or policyholder includ-
ing credited interest and assessments through the financial
statement date.
Liabilities for unpaid claims and estimated claim settlement
expenses represent our best estimate of the ultimate obligations
for reported and incurred-but-not-reported claims and the
related estimated claim settlement expenses. Liabilities for
unpaid claims and estimated claim settlement expenses are
continually reviewed and adjusted through current operations.
Fair Value MeasurementsFor financial assets and liabilities measured at fair value on a
recurring basis, fair value is the price we would receive to sell
an asset or pay to transfer a liability in an orderly transaction with
a market participant at the measurement date. In the absence of
active markets for the identical assets or liabilities, such measure-
ments involve developing assumptions based on market
observable data and, in the absence of such data, internal informa-
tion that is consistent with what market participants would use in
a hypothetical transaction that occurs at the measurement date.
Observable inputs reflect market data obtained from indepen-
dent sources, while unobservable inputs reflect our market
assumptions. Preference is given to observable inputs. These
two types of inputs create the following fair value hierarchy:
Level 1— Quoted prices for identical instruments in active
markets.
Level 2— Quoted prices for similar instruments in active markets;
quoted prices for identical or similar instruments in
markets that are not active; and model-derived valua-
tions whose inputs are observable or whose significant
value drivers are observable.
Level 3— Significant inputs to the valuation model are
unobservable.
We maintain policies and procedures to value instruments using
the best and most relevant data available. In addition, we have
risk management teams that review valuation, including
Realized gains and losses are accounted for on the specific
identification method. Unrealized gains and losses on investment
securities classified as trading and certain retained interests are
included in earnings.
InventoriesAll inventories are stated at the lower of cost or realizable values.
Cost for a significant portion of GE U.S. inventories is determined
on a last-in, first-out (LIFO) basis. Cost of other GE inventories is
determined on a first-in, first-out (FIFO) basis. LIFO was used for
39% of GE inventories at both December 31, 2010 and 2009. GECS
inventories consist of finished products held for sale; cost is
determined on a FIFO basis.
Intangible AssetsWe do not amortize goodwill, but test it at least annually for
impairment at the reporting unit level. A reporting unit is the
operating segment, or a business one level below that operating
segment (the component level) if discrete financial information is
prepared and regularly reviewed by segment management.
However, components are aggregated as a single reporting unit
if they have similar economic characteristics. We recognize an
impairment charge if the carrying amount of a reporting unit
exceeds its fair value and the carrying amount of the reporting
unit’s goodwill exceeds the implied fair value of that goodwill. We
use discounted cash flows to establish fair values. When available
and as appropriate, we use comparative market multiples to
corroborate discounted cash flow results. When all or a portion of
a reporting unit is disposed of, goodwill is allocated to the gain or
loss on disposition based on the relative fair values of the busi-
ness disposed of and the portion of the reporting unit that will
be retained.
We amortize the cost of other intangibles over their estimated
useful lives unless such lives are deemed indefinite. The cost of
intangible assets is generally amortized on a straight-line basis
over the asset’s estimated economic life, except that individually
significant customer-related intangible assets are amortized in
relation to total related sales. Amortizable intangible assets are
tested for impairment based on undiscounted cash flows and, if
impaired, written down to fair value based on either discounted
cash flows or appraised values. Intangible assets with indefinite
lives are tested annually for impairment and written down to fair
value as required.
GECS Investment Contracts, Insurance Liabilities and Insurance Annuity BenefitsCertain entities, which we consolidate, provide guaranteed
investment contracts to states, municipalities and municipal
authorities.
Our insurance activities also include providing insurance and
reinsurance for life and health risks and providing certain annuity
products. Three product groups are provided: traditional insur-
ance contracts, investment contracts and universal life insurance
contracts. Insurance contracts are contracts with significant
mortality and/or morbidity risks, while investment contracts are
contracts without such risks. Universal life insurance contracts
are a particular type of long-duration insurance contract whose
terms are not fixed and guaranteed.

78 GE 2010 ANNUAL REPORT
notes to consolidated financial statements
management personnel conduct internal reviews of pricing for all
such investment securities quarterly to ensure reasonableness of
valuations used in our financial statements. These reviews are
designed to identify prices that appear stale, those that have
changed significantly from prior valuations, and other anomalies
that may indicate that a price may not be accurate. Based on the
information available, we believe that the fair values provided by
the brokers are representative of prices that would be received to
sell the assets at the measurement date (exit prices).
Retained interests in securitizations are valued using a dis-
counted cash flow model that considers the underlying structure
of the securitization and estimated net credit exposure, prepay-
ment assumptions, discount rates and expected life.
DERIVATIVES. We use closing prices for derivatives included in
Level 1, which are traded either on exchanges or liquid over-the-
counter markets.
The majority of our derivatives are valued using internal mod-
els. The models maximize the use of market observable inputs
including interest rate curves and both forward and spot prices
for currencies and commodities. Derivative assets and liabilities
included in Level 2 primarily represent interest rate swaps, cross-
currency swaps and foreign currency and commodity forward
and option contracts.
Derivative assets and liabilities included in Level 3 primarily
represent interest rate products that contain embedded optional-
ity or prepayment features.
Non-Recurring Fair Value Measurements.Certain assets are measured at fair value on a non-recurring basis.
These assets are not measured at fair value on an ongoing basis,
but are subject to fair value adjustments only in certain circum-
stances. These assets can include loans and long-lived assets
that have been reduced to fair value when they are held for sale,
impaired loans that have been reduced based on the fair value of
the underlying collateral, cost and equity method investments
and long-lived assets that are written down to fair value when
they are impaired and the remeasurement of retained invest-
ments in formerly consolidated subsidiaries upon a change in
control that results in deconsolidation of a subsidiary, if we sell a
controlling interest and retain a noncontrolling stake in the entity.
Assets that are written down to fair value when impaired and
retained investments are not subsequently adjusted to fair value
unless further impairment occurs.
The following describes the valuation methodologies we use
to measure financial and non-financial instruments accounted for
at fair value on a non-recurring basis and for assets within our
pension plans and retiree benefit plans at each reporting period,
as applicable.
LOANS. When available, we use observable market data, including
pricing on recent closed market transactions, to value loans that
are included in Level 2. When this data is unobservable, we use
valuation methodologies using current market interest rate data
adjusted for inherent credit risk, and such loans are included in
Level 3. When appropriate, loans are valued using collateral val-
ues as a practical expedient (see Long-Lived Assets below).
independent price validation for certain instruments. Further, in
other instances, we retain independent pricing vendors to assist
in valuing certain instruments.
The following section describes the valuation methodologies
we use to measure different financial instruments at fair value on
a recurring basis.
INVESTMENTS IN DEBT AND EQUITY SECURITIES. When available,
we use quoted market prices to determine the fair value of
investment securities, and they are included in Level 1. Level 1
securities primarily include publicly-traded equity securities.
When quoted market prices are unobservable, we obtain
pricing information from an independent pricing vendor. The
pricing vendor uses various pricing models for each asset class
that are consistent with what other market participants would
use. The inputs and assumptions to the model of the pricing
vendor are derived from market observable sources including:
benchmark yields, reported trades, broker/dealer quotes, issuer
spreads, benchmark securities, bids, offers, and other market-
related data. Since many fixed income securities do not trade on
a daily basis, the methodology of the pricing vendor uses avail-
able information as applicable such as benchmark curves,
benchmarking of like securities, sector groupings, and matrix
pricing. The pricing vendor considers available market observ-
able inputs in determining the evaluation for a security. Thus,
certain securities may not be priced using quoted prices, but
rather determined from market observable information. These
investments are included in Level 2 and primarily comprise our
portfolio of corporate fixed income, and government, mortgage
and asset-backed securities. In infrequent circumstances, our
pricing vendors may provide us with valuations that are based
on significant unobservable inputs, and in those circumstances
we classify the investment securities in Level 3.
Annually, we conduct reviews of our primary pricing vendor
to validate that the inputs used in that vendor’s pricing process
are deemed to be market observable as defined in the standard.
While we were not provided access to proprietary models of the
vendor, our reviews have included on-site walk-throughs of the
pricing process, methodologies and control procedures for each
asset class and level for which prices are provided. Our review
also included an examination of the underlying inputs and
assumptions for a sample of individual securities across asset
classes, credit rating levels and various durations, a process we
continue to perform for each reporting period. In addition, the
pricing vendor has an established challenge process in place for
all security valuations, which facilitates identification and resolu-
tion of potentially erroneous prices. We believe that the prices
received from our pricing vendor are representative of prices that
would be received to sell the assets at the measurement date
(exit prices) and are classified appropriately in the hierarchy.
We use non-binding broker quotes as our primary basis for
valuation when there is limited, or no, relevant market activity for
a specific instrument or for other instruments that share similar
characteristics. We have not adjusted the prices we have obtained.
Investment securities priced using non-binding broker quotes are
included in Level 3. As is the case with our primary pricing vendor,
third-party brokers do not provide access to their proprietary
valuation models, inputs and assumptions. Accordingly, our risk
GE 2010 ANNUAL REPORT 79
notes to consolidated financial statements
On January 1, 2010, we adopted ASU 2009-16 and
ASU 2009-17, amendments to ASC 860, Transfers and Servicing, and ASC 810, Consolidation, respectively (ASU 2009-16 & 17). ASU
2009-16 eliminated the qualified special purpose entity (QSPE)
concept, and ASU 2009-17 required that all such entities be evalu-
ated for consolidation as VIEs. Adoption of these amendments
resulted in the consolidation of all of our sponsored QSPEs. In
addition, we consolidated assets of VIEs related to direct invest-
ments in entities that hold loans and fixed income securities, a
media joint venture and a small number of companies to which
we have extended loans in the ordinary course of business and
subsequently were subject to a TDR.
We consolidated the assets and liabilities of these entities at
amounts at which they would have been reported in our financial
statements had we always consolidated them. We also deconsoli-
dated certain entities where we did not meet the definition of the
primary beneficiary under the revised guidance; however, the
effect was insignificant at January 1, 2010. The incremental effect
on total assets and liabilities, net of our investment in these enti-
ties, was an increase of $31,097 million and $33,042 million,
respectively, at January 1, 2010. The net reduction of total equity
(including noncontrolling interests) was $1,945 million at
January 1, 2010, principally related to the reversal of previously
recognized securitization gains as a cumulative effect adjustment
to retained earnings. See Note 24 for additional information.
On January 1, 2009, we adopted an amendment to ASC 805,
Business Combinations. This amendment significantly changed the
accounting for business acquisitions both during the period of the
acquisition and in subsequent periods. Among the more significant
changes in the accounting for acquisitions are the following:
• Acquired in-process research and development (IPR&D) is
accounted for as an asset, with the cost recognized as the
research and development is realized or abandoned. IPR&D
was previously expensed at the time of the acquisition.
• Contingent consideration is recorded at fair value as an
element of purchase price with subsequent adjustments
recognized in operations. Contingent consideration was
previously accounted for as a subsequent adjustment of
purchase price.
• Subsequent decreases in valuation allowances on acquired
deferred tax assets are recognized in operations after the
measurement period. Such changes were previously consid-
ered to be subsequent changes in consideration and were
recorded as decreases in goodwill.
• Transaction costs are expensed. These costs were previously
treated as costs of the acquisition.
• Upon gaining control of an entity in which an equity method
or cost basis investment was held, the carrying value of that
investment is adjusted to fair value with the related gain or
loss recorded in earnings. Previously, this fair value adjust-
ment would not have been made.
In April 2009, the FASB amended ASC 805 and changed the
previous accounting for assets and liabilities arising from contin-
gencies in a business combination. We adopted this amendment
retrospectively effective January 1, 2009. The amendment
COST AND EQUITY METHOD INVESTMENTS. Cost and equity method
investments are valued using market observable data such as
quoted prices when available. When market observable data is
unavailable, investments are valued using a discounted cash flow
model, comparative market multiples or a combination of both
approaches as appropriate. These investments are generally
included in Level 3.
Investments in private equity, real estate and collective funds
are valued using net asset values. The net asset values are deter-
mined based on the fair values of the underlying investments in
the funds. Investments in private equity and real estate funds are
generally included in Level 3 because they are not redeemable
at the measurement date. Investments in collective funds are
included in Level 2.
LONG-LIVED ASSETS. Fair values of long-lived assets, including
aircraft and real estate, are primarily derived internally and are
based on observed sales transactions for similar assets. In other
instances, for example, collateral types for which we do not have
comparable observed sales transaction data, collateral values are
developed internally and corroborated by external appraisal
information. Adjustments to third-party valuations may be per-
formed in circumstances where market comparables are not
specific to the attributes of the specific collateral or appraisal
information may not be reflective of current market conditions
due to the passage of time and the occurrence of market events
since receipt of the information. For real estate, fair values are
based on discounted cash flow estimates which reflect current
and projected lease profiles and available industry information
about capitalization rates and expected trends in rents and occu-
pancy and are corroborated by external appraisals. These
investments are generally included in Level 3.
RETAINED INVESTMENTS IN FORMERLY CONSOLIDATED
SUBSIDIARIES. Upon a change in control that results in deconsoli-
dation of a subsidiary, the fair value measurement of our retained
noncontrolling stake in the former subsidiary is valued using an
income approach, a market approach, or a combination of both
approaches as appropriate. In applying these methodologies, we
rely on a number of factors, including actual operating results,
future business plans, economic projections, market observable
pricing multiples of similar businesses and comparable transac-
tions, and possible control premium. These investments are
included in Level 3.
Accounting ChangesThe Financial Accounting Standards Board (FASB) made the
Accounting Standards Codification (ASC) effective for financial
statements issued for interim and annual periods ending after
September 15, 2009. The ASC combines all previously issued
authoritative GAAP into one set of guidance codified by subject
area. In these financial statements, references to previously
issued accounting standards have been replaced with the rel-
evant ASC references. Subsequent revisions to GAAP by the FASB
are incorporated into the ASC through issuance of Accounting
Standards Updates (ASU).

80 GE 2010 ANNUAL REPORT
notes to consolidated financial statements
non-recurring basis. This guidance establishes a new framework
for measuring fair value and expands related disclosures. See
Note 21.
Effective January 1, 2008, we adopted ASC 825, Financial Instruments. Upon adoption, we elected to report $172 million of
commercial mortgage loans at fair value in order to recognize
them on the same accounting basis (measured at fair value
through earnings) as the derivatives economically hedging
these loans.
Note 2.
Assets and Liabilities of Businesses Held for Sale and Discontinued Operations
Assets and Liabilities of Businesses Held for Sale
NBC UNIVERSAL
In December 2009, we entered into an agreement with Comcast
Corporation (Comcast) to transfer the assets of the NBCU busi-
ness to a newly formed entity, comprising our NBCU business and
Comcast’s cable networks, regional sports networks, certain
digital properties and certain unconsolidated investments, in
exchange for cash and a 49% interest in the newly formed entity.
On March 19, 2010, NBCU entered into a three-year credit
agreement and a 364-day bridge loan agreement. On April 30,
2010, NBCU issued $4,000 million of senior, unsecured notes with
maturities ranging from 2015 to 2040 (interest rates ranging from
3.65% to 6.40%). On October 4, 2010, NBCU issued $5,100 million
of senior, unsecured notes with maturities ranging from 2014 to
2041 (interest rates ranging from 2.10% to 5.95%). Subsequent to
these issuances, the credit agreement and bridge loan agree-
ments were terminated, with a $750 million revolving credit
agreement remaining in effect. Proceeds from these issuances
were used to repay $1,678 million of existing debt and pay a
dividend to GE.
On September 26, 2010, we acquired approximately 38% of
Vivendi S.A.’s (Vivendi) 20% interest in NBCU (7.7% of NBCU’s
outstanding shares) for $2,000 million.
Prior to and in connection with the transaction with Comcast,
we acquired the remaining Vivendi interest in NBCU (12.3% of
NBCU’s outstanding shares) for $3,578 million and made an
additional payment of $222 million related to the previously
purchased shares.
On January 28, 2011, we transferred the assets of the NBCU
business and Comcast transferred certain of its assets to a newly
formed entity, NBC Universal LLC (NBCU LLC). In connection with the
transaction, we received $6,197 million in cash from Comcast and a
49% interest in NBCU LLC. Comcast holds the remaining 51% inter-
est in NBCU LLC. We will account for our investment in NBCU LLC
under the equity method. As a result of the transaction, we expect
to recognize a small after-tax gain in the first quarter of 2011.
requires pre-acquisition contingencies to be recognized at fair
value, if fair value can be determined or reasonably estimated
during the measurement period. If fair value cannot be
deter mined or reasonably estimated, the standard requires mea-
surement based on the recognition and measurement criteria of
ASC 450, Contingencies.On January 1, 2009, we adopted an amendment to ASC 810,
that requires us to make certain changes to the presentation of
our financial statements. This amendment requires us to classify
earnings attributable to noncontrolling interests (previously
referred to as “minority interest”) as part of consolidated net
earnings ($535 million and $200 million for 2010 and 2009, respec-
tively) and to include the accumulated amount of noncontrolling
interests as part of shareowners’ equity ($5,262 million and
$7,845 million at December 31, 2010 and 2009, respectively). The
net earnings amounts we have previously reported are now
presented as “Net earnings attributable to the Company” and, as
required, earnings per share continues to reflect amounts attrib-
utable only to the Company. Similarly, in our presentation of
shareowners’ equity, we distinguish between equity amounts
attributable to GE shareowners and amounts attributable to the
noncontrolling interests—previously classified as minority inter-
est outside of shareowners’ equity. Beginning January 1, 2009,
dividends to noncontrolling interests ($317 million and $548 mil-
lion in 2010 and 2009, respectively) are classified as financing
cash flows. In addition to these financial reporting changes, this
guidance provides for significant changes in accounting related to
noncontrolling interests; specifically, increases and decreases in
our controlling financial interests in consolidated subsidiaries will
be reported in equity similar to treasury stock transactions. If a
change in ownership of a consolidated subsidiary results in loss of
control and deconsolidation, any retained ownership interests are
remeasured with the gain or loss reported in net earnings.
Effective January 1, 2009, we adopted ASC 808, Collaborative Arrangements, that requires gross basis presentation of revenues
and expenses for principal participants in collaborative arrange-
ments. Our Technology Infrastructure and Energy Infrastructure
segments enter into collaborative arrangements with manufac-
turers and suppliers of components used to build and maintain
certain engines, aeroderivatives, and turbines, under which GE
and these participants share in risks and rewards of these prod-
uct programs. Adoption of the standard had no effect as our
historical presentation had been consistent with the new
requirements.
We adopted amendments to ASC 320, Investments—Debt and Equity Securities, and recorded a cumulative effect adjust-
ment to increase retained earnings as of April 1, 2009, of
$62 million. See Note 3.
We adopted ASC 820, Fair Value Measurements and Disclosures, in two steps; effective January 1, 2008, we adopted it for all finan-
cial instruments and non-financial instruments accounted for at
fair value on a recurring basis and effective January 1, 2009, for
all non-financial instruments accounted for at fair value on a
GE 2010 ANNUAL REPORT 81
notes to consolidated financial statements
OTHER
In 2010, we committed to sell GE Capital Consumer businesses in
Argentina, Brazil, and Canada, a CLL business in South Korea, and
our Interpark business in Real Estate. Assets and liabilities of
these businesses of $3,127 million and $592 million, respectively,
were classified as held for sale at December 31, 2010.
On November 12, 2009, we committed to sell our Security
business (within Corporate Items and Eliminations). On
February 28, 2010, we completed the sale of our Security busi-
ness for $1,787 million. Assets and liabilities of $1,780 million
and $282 million, respectively, were classified as held for sale at
December 31, 2009.
On January 7, 2009, we exchanged our Consumer businesses
in Austria and Finland, the credit card and auto businesses in the
U.K., and the credit card business in Ireland for a 100% ownership
interest in Interbanca S.p.A., an Italian corporate bank. We recog-
nized a $184 million loss, net of tax, related to the classification of
the assets held for sale at the lower of carrying amount or esti-
mated fair value less costs to sell.
On December 24, 2008, we committed to sell a portion of our
Australian residential mortgage business, including certain
underlying mortgage receivables, and completed this sale during
the first quarter of 2009. We recognized a $38 million loss, net of
tax, related to the classifications of the assets held for sale at the
lower of carrying amount or estimated fair value less costs to sell.
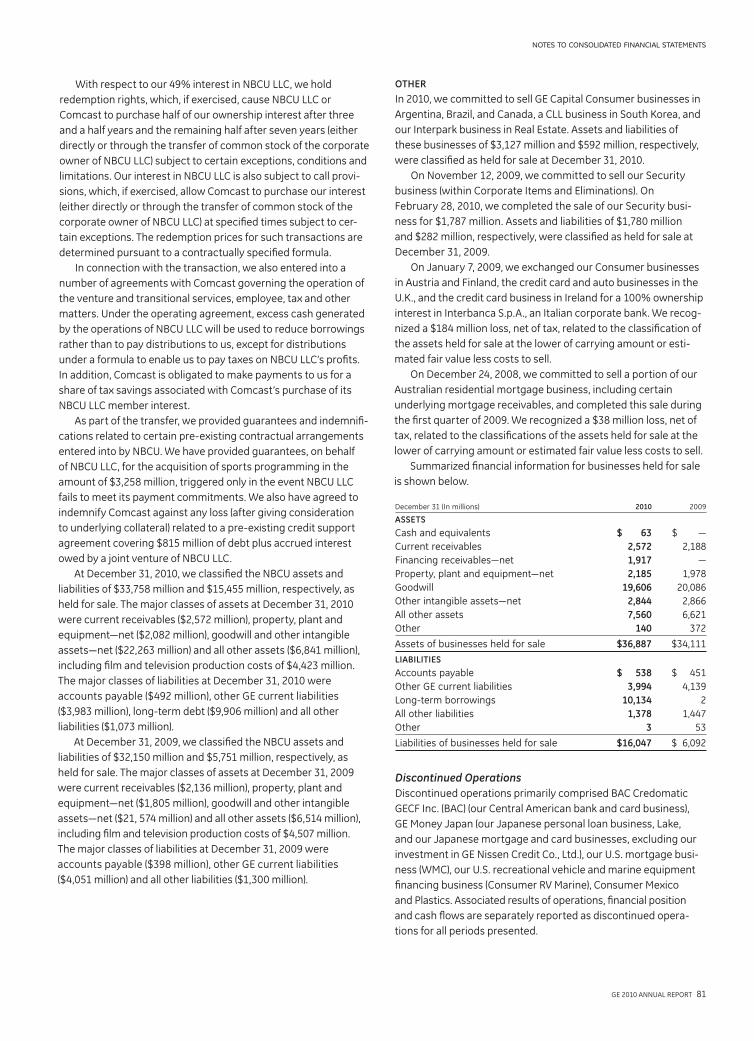
Summarized financial information for businesses held for sale
is shown below.
December 31 (In millions) 2010 2009
ASSETS
Cash and equivalents $ 63 $ —
Current receivables 2,572 2,188
Financing receivables—net 1,917 —
Property, plant and equipment—net 2,185 1,978
Goodwill 19,606 20,086
Other intangible assets—net 2,844 2,866
All other assets 7,560 6,621
Other 140 372
Assets of businesses held for sale $36,887 $34,111
LIABILITIES
Accounts payable $ 538 $ 451
Other GE current liabilities 3,994 4,139
Long-term borrowings 10,134 2
All other liabilities 1,378 1,447
Other 3 53
Liabilities of businesses held for sale $16,047 $ 6,092
Discontinued OperationsDiscontinued operations primarily comprised BAC Credomatic
GECF Inc. (BAC) (our Central American bank and card business),
GE Money Japan (our Japanese personal loan business, Lake,
and our Japanese mortgage and card businesses, excluding our
investment in GE Nissen Credit Co., Ltd.), our U.S. mortgage busi-
ness (WMC), our U.S. recreational vehicle and marine equipment
financing business (Consumer RV Marine), Consumer Mexico
and Plastics. Associated results of operations, financial position
and cash flows are separately reported as discontinued opera-
tions for all periods presented.
With respect to our 49% interest in NBCU LLC, we hold
redemption rights, which, if exercised, cause NBCU LLC or
Comcast to purchase half of our ownership interest after three
and a half years and the remaining half after seven years (either
directly or through the transfer of common stock of the corporate
owner of NBCU LLC) subject to certain exceptions, conditions and
limitations. Our interest in NBCU LLC is also subject to call provi-
sions, which, if exercised, allow Comcast to purchase our interest
(either directly or through the transfer of common stock of the
corporate owner of NBCU LLC) at specified times subject to cer-
tain exceptions. The redemption prices for such transactions are
determined pursuant to a contractually specified formula.
In connection with the transaction, we also entered into a
number of agreements with Comcast governing the operation of
the venture and transitional services, employee, tax and other
matters. Under the operating agreement, excess cash generated
by the operations of NBCU LLC will be used to reduce borrowings
rather than to pay distributions to us, except for distributions
under a formula to enable us to pay taxes on NBCU LLC’s profits.
In addition, Comcast is obligated to make payments to us for a
share of tax savings associated with Comcast’s purchase of its
NBCU LLC member interest.
As part of the transfer, we provided guarantees and indemnifi-
cations related to certain pre-existing contractual arrangements
entered into by NBCU. We have provided guarantees, on behalf
of NBCU LLC, for the acquisition of sports programming in the
amount of $3,258 million, triggered only in the event NBCU LLC
fails to meet its payment commitments. We also have agreed to
indemnify Comcast against any loss (after giving consideration
to underlying collateral) related to a pre-existing credit support
agreement covering $815 million of debt plus accrued interest
owed by a joint venture of NBCU LLC.
At December 31, 2010, we classified the NBCU assets and
liabilities of $33,758 million and $15,455 million, respectively, as
held for sale. The major classes of assets at December 31, 2010
were current receivables ($2,572 million), property, plant and
equipment—net ($2,082 million), goodwill and other intangible
assets—net ($22,263 million) and all other assets ($6,841 million),
including film and television production costs of $4,423 million.
The major classes of liabilities at December 31, 2010 were
accounts payable ($492 million), other GE current liabilities
($3,983 million), long-term debt ($9,906 million) and all other
liabilities ($1,073 million).
At December 31, 2009, we classified the NBCU assets and
liabilities of $32,150 million and $5,751 million, respectively, as
held for sale. The major classes of assets at December 31, 2009
were current receivables ($2,136 million), property, plant and
equipment—net ($1,805 million), goodwill and other intangible
assets—net ($21, 574 million) and all other assets ($6,514 million),
including film and television production costs of $4,507 million.
The major classes of liabilities at December 31, 2009 were
accounts payable ($398 million), other GE current liabilities
($4,051 million) and all other liabilities ($1,300 million).

82 GE 2010 ANNUAL REPORT
notes to consolidated financial statements
GE MONEY JAPAN
During the third quarter of 2007, we committed to a plan to sell
our Japanese personal loan business, Lake, upon determining
that, despite restructuring, Japanese regulatory limits for inter-
est charges on unsecured personal loans did not permit us to
earn an acceptable return. During the third quarter of 2008, we
completed the sale of GE Money Japan, which included Lake,
along with our Japanese mortgage and card businesses, exclud-
ing our investment in GE Nissen Credit Co., Ltd. As a result, we
recognized an after-tax loss of $908 million in 2007 and an incre-
mental loss of $361 million in 2008. In connection with the sale,
we reduced the proceeds on the sale for estimated interest
refund claims in excess of the statutory interest rate. Proceeds
from the sale were to be increased or decreased based on the
actual claims experienced in accordance with loss-sharing terms
specified in the sale agreement, with all claims in excess of
258 billion Japanese yen (approximately $3,000 million) remain-
ing our responsibility. The underlying portfolio to which this
obligation relates is in runoff and interest rates were capped for
all designated accounts by mid-2009. In the third quarter of 2010,
we began making reimbursements under this arrangement.
Our overall claims experience developed unfavorably through
2010. While our average daily claims continued to decline
through August 2010, the pace of the decline was slower than
expected, and claims severity increased. We believe that the
level of excess interest refund claims has been impacted by the
challenging global economic conditions, in addition to Japanese
legislative and regulatory changes. We accrued $566 million of
incremental reserves for these claims during the first six months
of 2010, in addition to the third quarter charge discussed below.
Significantly, in September 2010, a large independent per-
sonal loan company in Japan filed for bankruptcy, which
precipitated a significant amount of publicity surrounding excess
interest refund claims in the Japanese marketplace, along with
substantial legal advertising. We observed an increase in claims
during September 2010 and higher average daily claims in the
fourth quarter of 2010. Based on these factors and additional
analysis, we recorded an adjustment to our reserves of
$1,100 million in the third quarter of 2010 to bring the reserve to
a better estimate of our probable loss. This adjustment primarily
reflects revisions in our assumptions and calculations of the
number of estimated probable future incoming claims, increases
in claims severity assumptions, reflecting recent trends in
amounts paid per claim, and higher estimates of loss for claims in
process of settlement. As of December 31, 2010, our reserve for
reimbursement of claims in excess of the statutory interest rate
was $1,465 million.
Summarized financial information for discontinued operations
is shown below.
(In millions) 2010 2009 2008
OPERATIONS
Total revenues $ 1,417 $1,502 $ 1,626
Earnings (loss) from discontinued operations before income taxes $ 92 $ 208 $ (560)
Benefit (provision) for income taxes 113 (23) 282
Earnings (loss) from discontinued operations, net of taxes $ 205 $ 185 $ (278)
DISPOSAL
Loss on disposal before income taxes $(1,420) $ (196) $(1,458)
Benefit for income taxes 236 93 1,119
Loss on disposal, net of taxes $(1,184) $ (103) $ (339)
Earnings (loss) from discontinued operations, net of taxes (a) $ (979) $ 82 $ (617)
(a) The sum of GE industrial earnings (loss) from discontinued operations, net of taxes,
and GECS earnings (loss) from discontinued operations, net of taxes, is reported as
GE industrial earnings (loss) from discontinued operations, net of taxes, on the
Statement of Earnings.
December 31 (In millions) 2010 2009
ASSETS
Cash and equivalents $ 126 $ 1,956
Financing receivables—net 3,546 9,985
All other assets 42 142
Other 1,564 3,045
Assets of discontinued operations $5,278 $15,128
LIABILITIES
Short-term borrowings $ — $ 5,314
Long-term borrowings — 1,434
All other liabilities 1,933 1,394
Other 374 344
Liabilities of discontinued operations $2,307 $ 8,486
Assets at December 31, 2010 and 2009 primarily comprised cash,
financing receivables and a deferred tax asset for a loss carryfor-
ward, which expires in 2015, related to the sale of our GE Money
Japan business.
BAC CREDOMATIC GECF INC.
During the fourth quarter of 2010, we classified BAC as discontin-
ued operations and completed the sale of BAC for $1,920 million.
Immediately prior to the sale, and in accordance with terms of a
previous agreement, we increased our ownership interest in BAC
from 75% to 100% for a purchase price of $633 million. As a result
of the sale of our interest in BAC, we recognized an after-tax gain
of $780 million in 2010.
BAC revenues from discontinued operations were $983 million,
$943 million and $159 million in 2010, 2009 and 2008, respectively.
In total, BAC earnings from discontinued operations, net of taxes,
were $854 million, $292 million and $89 million in 2010, 2009 and
2008, respectively.
GE 2010 ANNUAL REPORT 83
notes to consolidated financial statements
total loans WMC originated and sold will be tendered for repur-
chase, and of those tendered, only a limited amount will qualify as
“validly tendered,” meaning the loans sold did not satisfy specified
contractual obligations. New claims received over the past three
years have declined from $859 million in 2008 to $320 million in
2010. WMC’s current reserve represents our best estimate of
losses with respect to WMC’s repurchase obligations. Actual losses
could exceed the reserve amount if actual claim rates, valid ten-
ders or losses WMC incurs on repurchased loans are higher than
historically observed.
WMC revenues from discontinued operations were $(4) million,
$2 million and $(71) million in 2010, 2009 and 2008, respectively.
In total, WMC’s losses from discontinued operations, net of taxes,
were $7 million, $1 million and $41 million in 2010, 2009 and
2008, respectively.
OTHER FINANCIAL SERVICES
In the fourth quarter of 2010, we entered into agreements to
sell our Consumer RV Marine portfolio and Consumer Mexico
business. Consumer RV Marine revenues from discontinued
operations were $210 million, $260 million and $296 million in
2010, 2009 and 2008, respectively. Consumer RV Marine losses
from discontinued operations, net of taxes, were $99 million,
$83 million and $58 million in 2010, 2009 and 2008, respectively.
Consumer Mexico revenues from discontinued operations were
$228 million, $303 million and $479 million in 2010, 2009 and
2008, respectively. Consumer Mexico earnings (loss) from discon-
tinued operations, net of taxes, were $(59) million, $66 million and
$31 million in 2010, 2009 and 2008, respectively.
GE INDUSTRIAL
GE industrial earnings (loss) from discontinued operations, net of
taxes, were $(4) million, $(18) million and $40 million in 2010, 2009
and 2008, respectively. The sum of GE industrial earnings (loss)
from discontinued operations, net of taxes, and GECS earnings
(loss) from discontinued operations, net of taxes, is reported as
GE industrial earnings (loss) from discontinued operations, net
of taxes, on the Statement of Earnings.
Assets of GE industrial discontinued operations were $50 mil-
lion at both December 31, 2010 and 2009. Liabilities of GE industrial
discontinued operations were $164 million and $163 million at
December 31, 2010 and 2009, respectively, and primarily represent
taxes payable and pension liabilities related to the sale of our
Plastics business in 2007.
The amount of these reserves is based on analyses of recent
and historical claims experience, pending and estimated future
excess interest refund requests, the estimated percentage of
customers who present valid requests, and our estimated pay-
ments related to those requests. Our estimated liability for
excess interest refund claims at December 31, 2010 assumes the
pace of incoming claims will decelerate, average exposure per
claim remains consistent with recent experience, and we see the
impact of our loss mitigation efforts. Estimating the pace of
decline in incoming claims can have a significant effect on the
total amount of our liability. For example, our third quarter 2010
estimate assumes incoming average daily claims will decline at a
long-term average rate of 4% monthly. Holding all other assump-
tions constant, if claims declined at a rate of one percent higher
or lower than assumed, our liability estimate would change by
approximately $250 million.
Uncertainties around the impact of laws and regulations,
challenging economic conditions, the runoff status of the under-
lying book of business and the effects of our mitigation efforts
make it difficult to develop a meaningful estimate of the aggre-
gate possible claims exposure. Recent trends, including the effect
of governmental actions, market activity regarding other personal
loan companies and consumer activity, may continue to have an
adverse effect on claims development.
GE Money Japan revenues from discontinued operations were
an insignificant amount in both 2010 and 2009, and $763 million in
2008. In total, GE Money Japan losses from discontinued operations,
net of taxes, were $1,671 million, $158 million and $651 million for
2010, 2009 and 2008, respectively.
WMC
During the fourth quarter of 2007, we completed the sale of
WMC, our U.S. mortgage business. WMC substantially discontin-
ued all new loan originations by the second quarter of 2007, and
is not a loan servicer. In connection with the sale, WMC retained
certain obligations related to loans sold prior to the disposal of
the business, including WMC’s contractual obligations to repur-
chase previously sold loans as to which there was an early
payment default or with respect to which certain contractual
representations and warranties were not met. All claims received
for early payment default have either been resolved or are no
longer being pursued.
Pending claims for unmet representations and warranties
have declined from approximately $800 million at December 31,
2009 to approximately $350 million at December 31, 2010.
Reserves related to these contractual representations and war-
ranties were $101 million at December 31, 2010, and $205 million
at December 31, 2009. The amount of these reserves is based
upon pending and estimated future loan repurchase requests, the
estimated percentage of loans validly tendered for repurchase,
and our estimated losses on loans repurchased. Based on our
historical experience, we estimate that a small percentage of the
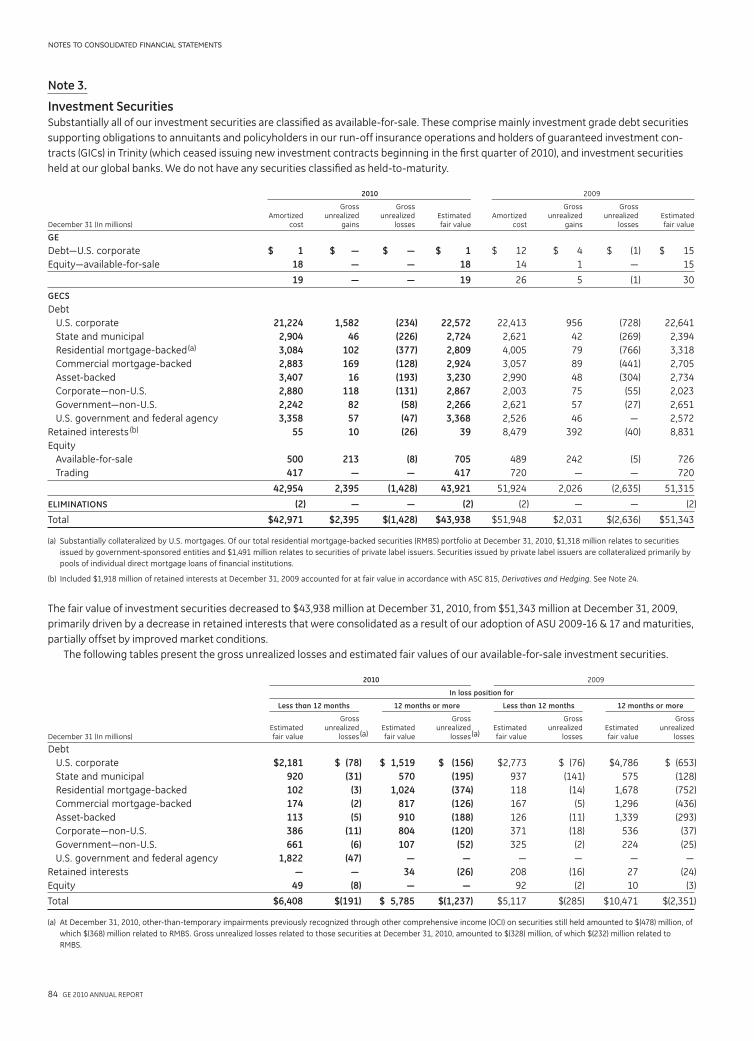
84 GE 2010 ANNUAL REPORT
notes to consolidated financial statements
Note 3.
Investment SecuritiesSubstantially all of our investment securities are classified as available-for-sale. These comprise mainly investment grade debt securities
supporting obligations to annuitants and policyholders in our run-off insurance operations and holders of guaranteed investment con-
tracts (GICs) in Trinity (which ceased issuing new investment contracts beginning in the first quarter of 2010), and investment securities
held at our global banks. We do not have any securities classified as held-to-maturity.
2010 2009
Gross Gross Gross Gross Amortized unrealized unrealized Estimated Amortized unrealized unrealized Estimated December 31 (In millions) cost gains losses fair value cost gains losses fair value
GE
Debt—U.S. corporate $ 1 $ — $ — $ 1 $ 12 $ 4 $ (1) $ 15
Equity—available-for-sale 18 — — 18 14 1 — 15
19 — — 19 26 5 (1) 30
GECS
Debt
U.S. corporate 21,224 1,582 (234) 22,572 22,413 956 (728) 22,641
State and municipal 2,904 46 (226) 2,724 2,621 42 (269) 2,394
Residential mortgage-backed (a) 3,084 102 (377) 2,809 4,005 79 (766) 3,318
Commercial mortgage-backed 2,883 169 (128) 2,924 3,057 89 (441) 2,705
Asset-backed 3,407 16 (193) 3,230 2,990 48 (304) 2,734
Corporate—non-U.S. 2,880 118 (131) 2,867 2,003 75 (55) 2,023
Government—non-U.S. 2,242 82 (58) 2,266 2,621 57 (27) 2,651
U.S. government and federal agency 3,358 57 (47) 3,368 2,526 46 — 2,572
Retained interests (b) 55 10 (26) 39 8,479 392 (40) 8,831
Equity
Available-for-sale 500 213 (8) 705 489 242 (5) 726
Trading 417 — — 417 720 — — 720
42,954 2,395 (1,428) 43,921 51,924 2,026 (2,635) 51,315
ELIMINATIONS (2) — — (2) (2) — — (2)
Total $42,971 $2,395 $(1,428) $43,938 $51,948 $2,031 $(2,636) $51,343
(a) Substantially collateralized by U.S. mortgages. Of our total residential mortgage-backed securities (RMBS) portfolio at December 31, 2010, $1,318 million relates to securities
issued by government-sponsored entities and $1,491 million relates to securities of private label issuers. Securities issued by private label issuers are collateralized primarily by
pools of individual direct mortgage loans of financial institutions.
(b) Included $1,918 million of retained interests at December 31, 2009 accounted for at fair value in accordance with ASC 815, Derivatives and Hedging. See Note 24.
The fair value of investment securities decreased to $43,938 million at December 31, 2010, from $51,343 million at December 31, 2009,
primarily driven by a decrease in retained interests that were consolidated as a result of our adoption of ASU 2009-16 & 17 and maturities,
partially offset by improved market conditions.
The following tables present the gross unrealized losses and estimated fair values of our available-for-sale investment securities.
2010 2009
In loss position for
Less than 12 months 12 months or more Less than 12 months 12 months or more
Gross Gross Gross Gross Estimated unrealized Estimated unrealized Estimated unrealized Estimated unrealized December 31 (In millions) fair value losses (a) fair value losses (a) fair value losses fair value losses
Debt
U.S. corporate $2,181 $ (78) $ 1,519 $ (156) $2,773 $ (76) $4,786 $ (653)
State and municipal 920 (31) 570 (195) 937 (141) 575 (128)
Residential mortgage-backed 102 (3) 1,024 (374) 118 (14) 1,678 (752)
Commercial mortgage-backed 174 (2) 817 (126) 167 (5) 1,296 (436)
Asset-backed 113 (5) 910 (188) 126 (11) 1,339 (293)
Corporate—non-U.S. 386 (11) 804 (120) 371 (18) 536 (37)
Government—non-U.S. 661 (6) 107 (52) 325 (2) 224 (25)
U.S. government and federal agency 1,822 (47) — — — — — —
Retained interests — — 34 (26) 208 (16) 27 (24)
Equity 49 (8) — — 92 (2) 10 (3)
Total $6,408 $(191) $ 5,785 $(1,237) $5,117 $(285) $10,471 $(2,351)
(a) At December 31, 2010, other-than-temporary impairments previously recognized through other comprehensive income (OCI) on securities still held amounted to $(478) million, of
which $(368) million related to RMBS. Gross unrealized losses related to those securities at December 31, 2010, amounted to $(328) million, of which $(232) million related to
RMBS.
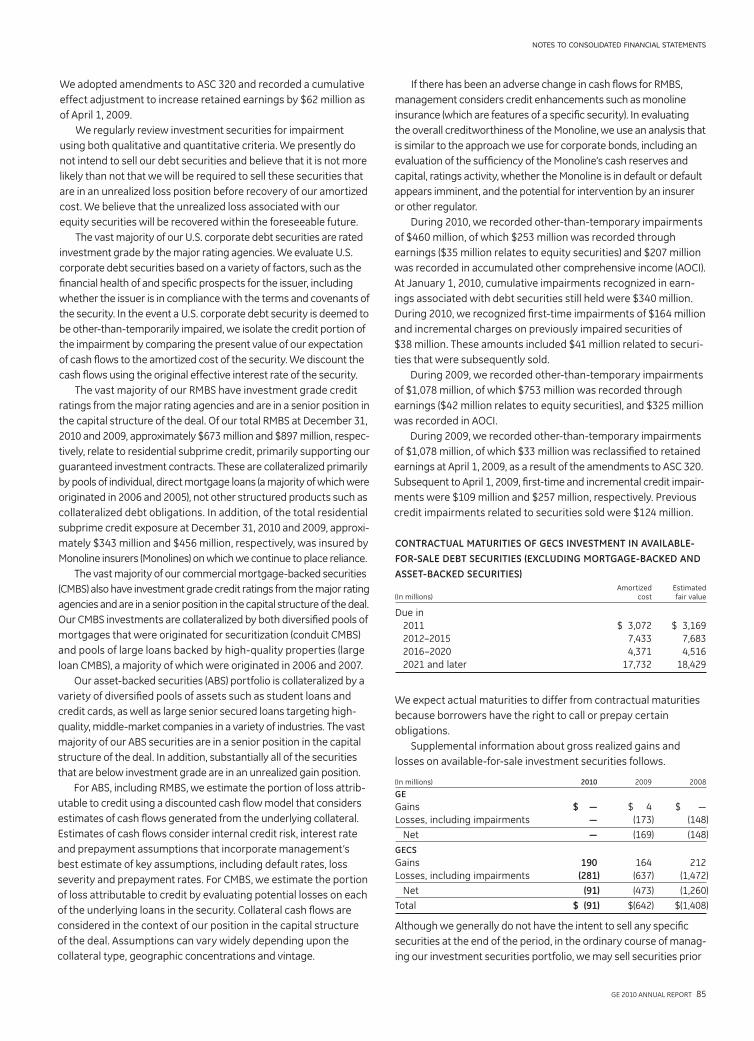
GE 2010 ANNUAL REPORT 85
notes to consolidated financial statements
If there has been an adverse change in cash flows for RMBS,
management considers credit enhancements such as monoline
insurance (which are features of a specific security). In evaluating
the overall creditworthiness of the Monoline, we use an analysis that
is similar to the approach we use for corporate bonds, including an
evaluation of the sufficiency of the Monoline’s cash reserves and
capital, ratings activity, whether the Monoline is in default or default
appears imminent, and the potential for intervention by an insurer
or other regulator.
During 2010, we recorded other-than-temporary impairments
of $460 million, of which $253 million was recorded through
earnings ($35 million relates to equity securities) and $207 million
was recorded in accumulated other comprehensive income (AOCI).
At January 1, 2010, cumulative impairments recognized in earn-
ings associated with debt securities still held were $340 million.
During 2010, we recognized first-time impairments of $164 million
and incremental charges on previously impaired securities of
$38 million. These amounts included $41 million related to securi-
ties that were subsequently sold.
During 2009, we recorded other-than-temporary impairments
of $1,078 million, of which $753 million was recorded through
earnings ($42 million relates to equity securities), and $325 million
was recorded in AOCI.
During 2009, we recorded other-than-temporary impairments
of $1,078 million, of which $33 million was reclassified to retained
earnings at April 1, 2009, as a result of the amendments to ASC 320.
Subsequent to April 1, 2009, first-time and incremental credit impair-
ments were $109 million and $257 million, respectively. Previous
credit impairments related to securities sold were $124 million.
CONTRACTUAL MATURITIES OF GECS INVESTMENT IN AVAILABLE-
FOR-SALE DEBT SECURITIES (EXCLUDING MORTGAGE-BACKED AND
ASSET-BACKED SECURITIES)
Amortized Estimated (In millions) cost fair value
Due in
2011 $ 3,072 $ 3,169
2012–2015 7,433 7,683
2016–2020 4,371 4,516
2021 and later 17,732 18,429
We expect actual maturities to differ from contractual maturities
because borrowers have the right to call or prepay certain
obligations.
Supplemental information about gross realized gains and
losses on available-for-sale investment securities follows.
(In millions) 2010 2009 2008
GE
Gains $ — $ 4 $ —
Losses, including impairments — (173) (148)
Net — (169) (148)
GECS
Gains 190 164 212
Losses, including impairments (281) (637) (1,472)
Net (91) (473) (1,260)
Total $ (91) $(642) $(1,408)
Although we generally do not have the intent to sell any specific
securities at the end of the period, in the ordinary course of manag-
ing our investment securities portfolio, we may sell securities prior
We adopted amendments to ASC 320 and recorded a cumulative
effect adjustment to increase retained earnings by $62 million as
of April 1, 2009.
We regularly review investment securities for impairment
using both qualitative and quantitative criteria. We presently do
not intend to sell our debt securities and believe that it is not more
likely than not that we will be required to sell these securities that
are in an unrealized loss position before recovery of our amortized
cost. We believe that the unrealized loss associated with our
equity securities will be recovered within the foreseeable future.
The vast majority of our U.S. corporate debt securities are rated
investment grade by the major rating agencies. We evaluate U.S.
corporate debt securities based on a variety of factors, such as the
financial health of and specific prospects for the issuer, including
whether the issuer is in compliance with the terms and covenants of
the security. In the event a U.S. corporate debt security is deemed to
be other-than-temporarily impaired, we isolate the credit portion of
the impairment by comparing the present value of our expectation
of cash flows to the amortized cost of the security. We discount the
cash flows using the original effective interest rate of the security.
The vast majority of our RMBS have investment grade credit
ratings from the major rating agencies and are in a senior position in
the capital structure of the deal. Of our total RMBS at December 31,
2010 and 2009, approximately $673 million and $897 million, respec-
tively, relate to residential subprime credit, primarily supporting our
guaranteed investment contracts. These are collateralized primarily
by pools of individual, direct mortgage loans (a majority of which were
originated in 2006 and 2005), not other structured products such as
collateralized debt obligations. In addition, of the total residential
subprime credit exposure at December 31, 2010 and 2009, approxi-
mately $343 million and $456 million, respectively, was insured by
Monoline insurers (Monolines) on which we continue to place reliance.
The vast majority of our commercial mortgage-backed securities
(CMBS) also have investment grade credit ratings from the major rating
agencies and are in a senior position in the capital structure of the deal.
Our CMBS investments are collateralized by both diversified pools of
mortgages that were originated for securitization (conduit CMBS)
and pools of large loans backed by high-quality properties (large
loan CMBS), a majority of which were originated in 2006 and 2007.
Our asset-backed securities (ABS) portfolio is collateralized by a
variety of diversified pools of assets such as student loans and
credit cards, as well as large senior secured loans targeting high-
quality, middle-market companies in a variety of industries. The vast
majority of our ABS securities are in a senior position in the capital
structure of the deal. In addition, substantially all of the securities
that are below investment grade are in an unrealized gain position.
For ABS, including RMBS, we estimate the portion of loss attrib-
utable to credit using a discounted cash flow model that considers
estimates of cash flows generated from the underlying collateral.
Estimates of cash flows consider internal credit risk, interest rate
and prepayment assumptions that incorporate management’s
best estimate of key assumptions, including default rates, loss
severity and prepayment rates. For CMBS, we estimate the portion
of loss attributable to credit by evaluating potential losses on each
of the underlying loans in the security. Collateral cash flows are
considered in the context of our position in the capital structure
of the deal. Assumptions can vary widely depending upon the
collateral type, geographic concentrations and vintage.

86 GE 2010 ANNUAL REPORT
notes to consolidated financial statements
Note 6.
GECS Financing Receivables and Allowance for Losses on Financing Receivables
At
December 31, January 1, December 31,(In millions) 2010 2010 (a) 2009
Loans, net of deferred income (b) $281,639 $321,589 $280,465
Investment in financing leases, net of deferred income 45,710 55,096 54,332
327,349 376,685 334,797
Less allowance for losses (8,072) (9,556) (7,856)
Financing receivables—net (c) $319,277 $367,129 $326,941
(a) Reflects the effects of our adoption of ASU 2009-16 & 17 on January 1, 2010.
(b) Excludes deferred income of $2,328 million and $2,338 million at December 31,
2010 and 2009, respectively.
(c) Financing receivables at December 31, 2010 and December 31, 2009 included
$1,503 million and $2,635 million, respectively, relating to loans that had been
acquired in a transfer but have been subject to credit deterioration since
origination per ASC 310, Receivables.
GECS financing receivables include both loans and financing
leases. Loans represent transactions in a variety of forms, includ-
ing revolving charge and credit, mortgages, installment loans,
intermediate-term loans and revolving loans secured by business
assets. The portfolio includes loans carried at the principal
amount on which finance charges are billed periodically, and
loans carried at gross book value, which includes finance charges.
Investment in financing leases consists of direct financing and
leveraged leases of aircraft, railroad rolling stock, autos, other
transportation equipment, data processing equipment, medical
equipment, commercial real estate and other manufacturing,
power generation, and commercial equipment and facilities.
For federal income tax purposes, the leveraged leases and the
majority of the direct financing leases are leases in which GECS
depreciates the leased assets and is taxed upon the accrual of
rental income. Certain direct financing leases are loans for federal
income tax purposes. For these transactions, GECS is taxable
only on the portion of each payment that constitutes interest,
unless the interest is tax-exempt (e.g., certain obligations of
state governments).
Investment in direct financing and leveraged leases repre-
sents net unpaid rentals and estimated unguaranteed residual
values of leased equipment, less related deferred income. GECS
has no general obligation for principal and interest on notes and
other instruments representing third-party participation related
to leveraged leases; such notes and other instruments have
not been included in liabilities but have been offset against the
related rentals receivable. The GECS share of rentals receivable on
leveraged leases is subordinate to the share of other participants
who also have security interests in the leased equipment. For
federal income tax purposes, GECS is entitled to deduct the
interest expense accruing on non-recourse financing related
to leveraged leases.
to their maturities for a variety of reasons, including diversification,
credit quality, yield and liquidity requirements and the funding of
claims and obligations to policyholders. In some of our bank sub-
sidiaries, we maintain a certain level of purchases and sales volume
principally of non-U.S. government debt securities. In these situa-
tions, fair value approximates carrying value for these securities.
Proceeds from investment securities sales and early redemp-
tions by issuers totaled $16,238 million, $7,823 million and
$3,942 million in 2010, 2009 and 2008, respectively, principally
from the sales of short-term securities in our bank subsidiaries in
2010 and 2009 and securities that supported the guaranteed
investment contract portfolio in 2008.
We recognized a pre-tax loss on trading securities of $7 million
and pre-tax gains of $408 million and $108 million in 2010, 2009
and 2008, respectively. Investments in retained interests decreased
$291 million and $113 million during 2009 and 2008, respectively,
reflecting changes in fair value. Effective January 1, 2010, with the
adoption of ASU 2009-16 & 17, we no longer have any retained
interests that are recorded at fair value through earnings.
Note 4.
Current Receivables Consolidated (a) GE
December 31 (In millions) 2010 2009 2010 2009
Technology Infrastructure $ 8,158 $ 7,226 $ 4,502 $ 4,110
Energy Infrastructure 7,377 7,328 5,349 5,641
Home & Business Solutions 1,426 775 240 209
Corporate items and eliminations 2,088 1,679 713 408
19,049 17,008 10,804 10,368
Less allowance for losses (428) (550) (421) (550)
Total $18,621 $16,458 $10,383 $ 9,818
(a) Included GE industrial customer receivables factored through a GECS affiliate and
reported as financing receivables by GECS. See Note 27.
GE current receivables balances at December 31, 2010 and 2009,
before allowance for losses, included $8,134 million and $7,455 mil-
lion, respectively, from sales of goods and services to customers,
and $24 million and $37 million at December 31, 2010 and 2009,
respectively, from transactions with asso cia ted companies.
GE current receivables of $193 million and $104 million at
December 31, 2010 and 2009, respectively, arose from sales,
principally of Aviation goods and services, on open account to
various agencies of the U.S. government. About 5% of GE sales
of goods and services were to the U.S. government in 2010,
compared with 6% in 2009 and 5% in 2008.
Note 5.
InventoriesDecember 31 (In millions) 2010 2009
GE
Raw materials and work in process $ 6,973 $ 7,581
Finished goods 4,435 4,105
Unbilled shipments 456 759
11,864 12,445
Less revaluation to LIFO (404) (529)
11,460 11,916
GECS
Finished goods 66 71
Total $11,526 $11,987

GE 2010 ANNUAL REPORT 87
notes to consolidated financial statements
CONTRACTUAL MATURITIES
Total Net rentals (In millions) loans receivable
Due in
2011 $ 67,741 $13,978
2012 29,947 8,921
2013 22,877 6,961
2014 21,074 4,610
2015 15,280 3,043
2016 and later 73,296 8,054
230,215 45,567
Consumer revolving loans 51,424 —
Total $281,639 $45,567
We expect actual maturities to differ from contractual maturities.
The following tables provide additional information about our
financing receivables and related activity in the allowance for
losses for our Commercial, Real Estate and Consumer portfolios.
NET INVESTMENT IN FINANCING LEASES
Total financing leases Direct financing leases (a) Leveraged leases (b)
December 31 (In millions) 2010 2009 2010 2009 2010 2009
Total minimum lease payments receivable $53,677 $63,997 $41,534 $49,985 $12,143 $14,012
Less principal and interest on third-party non-recourse debt (8,110) (9,660) — — (8,110) (9,660)
Net rentals receivables 45,567 54,337 41,534 49,985 4,033 4,352
Estimated unguaranteed residual value of leased assets 8,496 9,604 5,992 6,815 2,504 2,789
Less deferred income (8,353) (9,609) (6,616) (7,630) (1,737) (1,979)
Investment in financing leases, net of deferred income 45,710 54,332 40,910 49,170 4,800 5,162
Less amounts to arrive at net investment
Allowance for losses (402) (654) (384) (534) (18) (120)
Deferred taxes (6,168) (6,210) (2,266) (2,485) (3,902) (3,725)
Net investment in financing leases $39,140 $47,468 $38,260 $46,151 $ 880 $ 1,317
(a) Included $520 million and $599 million of initial direct costs on direct financing leases at December 31, 2010 and 2009, respectively.
(b) Included pre-tax income of $133 million and $164 million and income tax of $51 million and $64 million during 2010 and 2009, respectively. Net investment credits recognized
on leveraged leases during 2010 and 2009 were insignificant.
FINANCING RECEIVABLES—NET
The following table displays our financing receivables balances.
December 31, January 1, December 31,(In millions) 2010 2010 (a) 2009
COMMERCIAL
CLL (b)
Americas $ 86,596 $ 99,666 $ 87,496
Europe 37,498 43,403 41,455
Asia 11,943 13,159 13,202
Other 2,626 2,836 2,836
Total CLL 138,663 159,064 144,989
Energy Financial Services 7,011 7,790 7,790
GECAS (b) 12,615 13,254 13,254
Other (c) 1,788 2,614 2,614
Total Commercial financing receivables 160,077 182,722 168,647
REAL ESTATE
Debt 30,249 36,257 36,565
Business properties 9,962 12,416 8,276
Total Real Estate financing receivables 40,211 48,673 44,841
CONSUMER (b)
Non-U.S. residential mortgages 45,536 54,921 54,921
Non-U.S. installment and revolving credit 20,368 23,443 23,443
U.S. installment and revolving credit 43,974 44,008 20,027
Non-U.S. auto 8,877 12,762 12,762
Other 8,306 10,156 10,156
Total Consumer financing receivables 127,061 145,290 121,309
Total financing receivables 327,349 376,685 334,797
Less allowance for losses (8,072) (9,556) (7,856)
Total financing receivables—net $319,277 $367,129 $326,941
(a) Reflects the effects of our adoption of ASU 2009-16 & 17 on January 1, 2010.
(b) During the first quarter of 2010, we transferred the Transportation Financial
Services business from GE Capital Aviation Services (GECAS) to CLL and the
Consumer business in Italy from Consumer to CLL. Prior-period amounts were
reclassified to conform to the current-period presentation.
(c) Primarily consisted of loans and financing leases in former consolidated,
liquidating, securitization entities, which became wholly owned affiliates
in December 2010.

88 GE 2010 ANNUAL REPORT
notes to consolidated financial statements
ALLOWANCE FOR LOSSES ON FINANCING RECEIVABLES
The following tables provide a roll-forward of our allowance for losses on financing receivables.
Balance at Adoption of Balance at Provision Balance at December 31, ASU 2009 January 1, charged to Gross December 31, (In millions) 2009 16 & 17 (a) 2010 operations Other (b) write-offs (c) Recoveries (c) 2010
COMMERCIAL
CLL (d)
Americas $1,179 $ 66 $1,245 $1,058 $ (10) $ (1,136) $ 130 $1,287
Europe 575 — 575 272 (40) (440) 62 429
Asia 244 (10) 234 153 (6) (181) 22 222
Other 11 — 11 (4) 1 (1) — 7
Total CLL 2,009 56 2,065 1,479 (55) (1,758) 214 1,945
Energy Financial Services 28 — 28 65 — (72) 1 22
GECAS (d) 104 — 104 12 — (96) — 20
Other 34 — 34 32 — (9) 1 58
Total Commercial 2,175 56 2,231 1,588 (55) (1,935) 216 2,045
REAL ESTATE
Debt 1,358 (3) 1,355 764 9 (838) 2 1,292
Business properties 136 45 181 146 (7) (126) 2 196
Total Real Estate 1,494 42 1,536 910 2 (964) 4 1,488
CONSUMER (d)
Non-U.S. residential mortgages 926 — 926 272 (40) (408) 78 828
Non-U.S. installment and revolving credit 1,116 — 1,116 1,053 (70) (1,745) 591 945
U.S. installment and revolving credit 1,551 1,602 3,153 3,018 (6) (4,300) 468 2,333
Non-U.S. auto 303 — 303 85 (60) (324) 170 174
Other 291 — 291 265 7 (394) 90 259
Total Consumer 4,187 1,602 5,789 4,693 (169) (7,171) 1,397 4,539
Total $7,856 $1,700 $9,556 $7,191 $(222) $(10,070) $1,617 $8,072
(a) Reflects the effects of our adoption of ASU 2009-16 & 17 on January 1, 2010.
(b) Other primarily included the effects of currency exchange.
(c) Net write-offs (write-offs less recoveries) in certain portfolios may exceed the beginning allowance for losses as our revolving credit portfolios turn over more than once per
year or, in all portfolios, can reflect losses that are incurred subsequent to the beginning of the fiscal year due to information becoming available during the current year,
which may identify further deterioration on existing financing receivables.
(d) During the first quarter of 2010, we transferred the Transportation Financial Services business from GECAS to CLL and the Consumer business in Italy from Consumer to CLL.
Prior-period amounts were reclassified to conform to the current-period presentation.
Balance at Provision Balance at January 1, charged to Gross December 31, (In millions) 2009 operations Other (a) write-offs (b) Recoveries (b) 2009
COMMERCIAL
CLL (c)
Americas $ 843 $ 1,399 $ (39) $(1,117) $ 93 $1,179
Europe 311 625 (14) (431) 84 575
Asia 163 257 3 (203) 24 244
Other 4 9 2 (4) — 11
Total CLL 1,321 2,290 (48) (1,755) 201 2,009
Energy Financial Services 58 33 4 (67) — 28
GECAS (c) 58 65 (3) (16) — 104
Other 28 29 — (24) 1 34
Total Commercial 1,465 2,417 (47) (1,862) 202 2,175
REAL ESTATE
Debt 282 1,295 13 (232) — 1,358
Business properties 19 147 — (32) 2 136
Total Real Estate 301 1,442 13 (264) 2 1,494
CONSUMER (c)
Non-U.S. residential mortgages 346 909 86 (508) 93 926
Non-U.S. installment and revolving credit 1,010 1,751 43 (2,252) 564 1,116
U.S. installment and revolving credit 1,616 3,367 (975) (2,612) 155 1,551
Non-U.S. auto 197 395 31 (530) 210 303
Other 225 346 44 (389) 65 291
Total Consumer 3,394 6,768 (771) (6,291) 1,087 4,187
Total $5,160 $10,627 $(805) $(8,417) $1,291 $7,856
(a) Other primarily included the effects of securitization activity and currency exchange.
(b) Net write-offs (write-offs less recoveries) in certain portfolios may exceed the beginning allowance for losses as our revolving credit portfolios turn over more than once per
year or, in all portfolios, can reflect losses that are incurred subsequent to the beginning of the fiscal year due to information becoming available during the current year,
which may identify further deterioration on existing financing receivables.
(c) During the first quarter of 2010, we transferred the Transportation Financial Services business from GECAS to CLL and the Consumer business in Italy from Consumer to CLL.
Prior-period amounts were reclassified to conform to the current-period presentation.
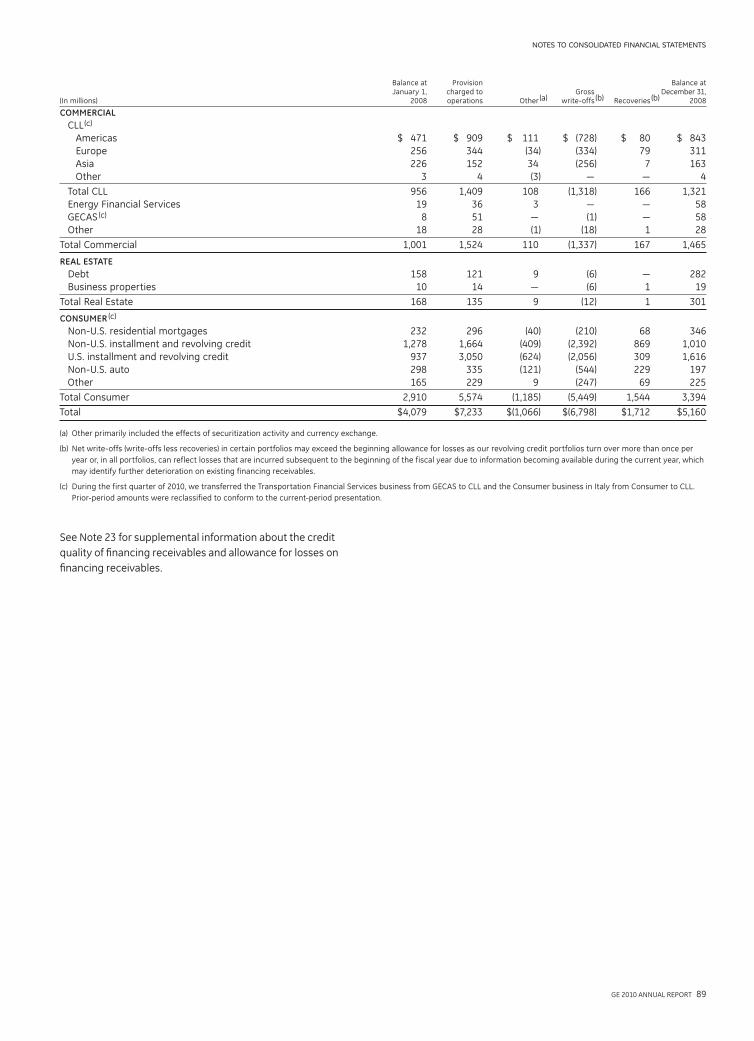
GE 2010 ANNUAL REPORT 89
notes to consolidated financial statements
Balance at Provision Balance at January 1, charged to Gross December 31, (In millions) 2008 operations Other (a) write-offs (b) Recoveries (b) 2008
COMMERCIAL
CLL (c)
Americas $ 471 $ 909 $ 111 $ (728) $ 80 $ 843
Europe 256 344 (34) (334) 79 311
Asia 226 152 34 (256) 7 163
Other 3 4 (3) — — 4
Total CLL 956 1,409 108 (1,318) 166 1,321
Energy Financial Services 19 36 3 — — 58
GECAS (c) 8 51 — (1) — 58
Other 18 28 (1) (18) 1 28
Total Commercial 1,001 1,524 110 (1,337) 167 1,465
REAL ESTATE
Debt 158 121 9 (6) — 282
Business properties 10 14 — (6) 1 19
Total Real Estate 168 135 9 (12) 1 301
CONSUMER (c)
Non-U.S. residential mortgages 232 296 (40) (210) 68 346
Non-U.S. installment and revolving credit 1,278 1,664 (409) (2,392) 869 1,010
U.S. installment and revolving credit 937 3,050 (624) (2,056) 309 1,616
Non-U.S. auto 298 335 (121) (544) 229 197
Other 165 229 9 (247) 69 225
Total Consumer 2,910 5,574 (1,185) (5,449) 1,544 3,394
Total $4,079 $7,233 $(1,066) $(6,798) $1,712 $5,160
(a) Other primarily included the effects of securitization activity and currency exchange.
(b) Net write-offs (write-offs less recoveries) in certain portfolios may exceed the beginning allowance for losses as our revolving credit portfolios turn over more than once per
year or, in all portfolios, can reflect losses that are incurred subsequent to the beginning of the fiscal year due to information becoming available during the current year, which
may identify further deterioration on existing financing receivables.
(c) During the first quarter of 2010, we transferred the Transportation Financial Services business from GECAS to CLL and the Consumer business in Italy from Consumer to CLL.
Prior-period amounts were reclassified to conform to the current-period presentation.
See Note 23 for supplemental information about the credit
quality of financing receivables and allowance for losses on
financing receivables.
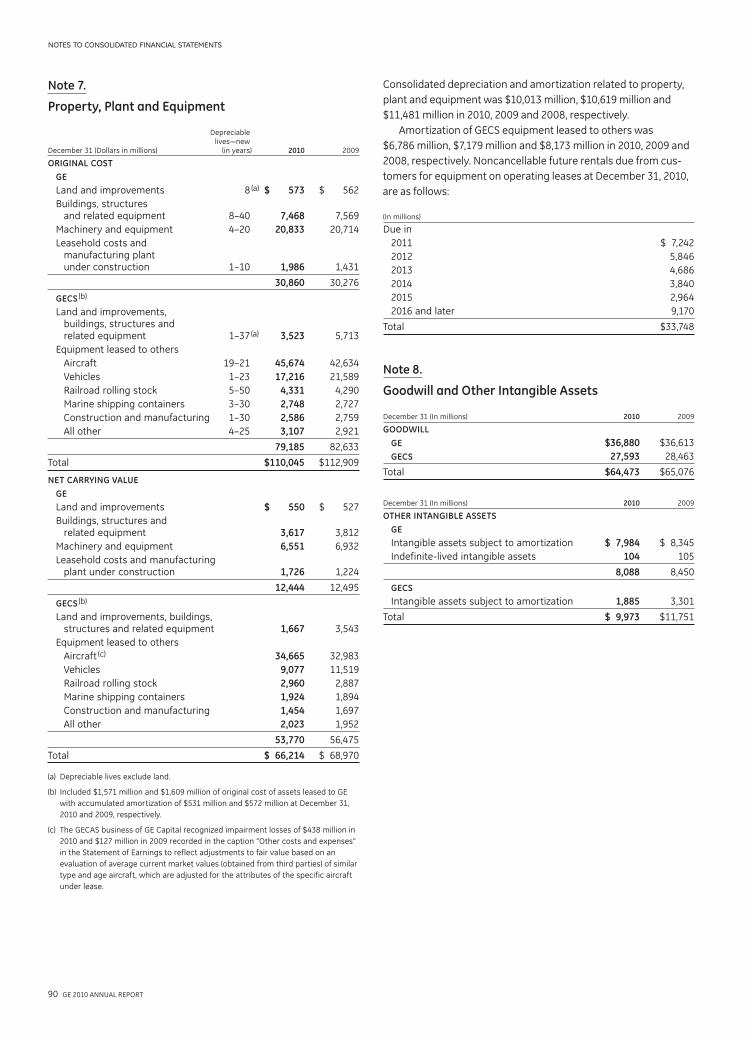
90 GE 2010 ANNUAL REPORT
notes to consolidated financial statements
Consolidated depreciation and amortization related to property,
plant and equipment was $10,013 million, $10,619 million and
$11,481 million in 2010, 2009 and 2008, respectively.
Amortization of GECS equipment leased to others was
$6,786 million, $7,179 million and $8,173 million in 2010, 2009 and
2008, respectively. Noncancellable future rentals due from cus-
tomers for equipment on operating leases at December 31, 2010,
are as follows:
(In millions)
Due in
2011 $ 7,242
2012 5,846
2013 4,686
2014 3,840
2015 2,964
2016 and later 9,170
Total $33,748
Note 8.
Goodwill and Other Intangible Assets
December 31 (In millions) 2010 2009
GOODWILL
GE $36,880 $36,613
GECS 27,593 28,463
Total $64,473 $65,076
December 31 (In millions) 2010 2009
OTHER INTANGIBLE ASSETS
GE
Intangible assets subject to amortization $ 7,984 $ 8,345
Indefinite-lived intangible assets 104 105
8,088 8,450
GECS
Intangible assets subject to amortization 1,885 3,301
Total $ 9,973 $11,751
Note 7.
Property, Plant and Equipment
Depreciable lives—new December 31 (Dollars in millions) (in years) 2010 2009
ORIGINAL COST
GE
Land and improvements 8 (a) $ 573 $ 562
Buildings, structures and related equipment 8–40 7,468 7,569
Machinery and equipment 4–20 20,833 20,714
Leasehold costs and manufacturing plant under construction 1–10 1,986 1,431
30,860 30,276
GECS (b)
Land and improvements, buildings, structures and related equipment 1–37 (a) 3,523 5,713
Equipment leased to others
Aircraft 19–21 45,674 42,634
Vehicles 1–23 17,216 21,589
Railroad rolling stock 5–50 4,331 4,290
Marine shipping containers 3–30 2,748 2,727
Construction and manufacturing 1–30 2,586 2,759
All other 4–25 3,107 2,921
79,185 82,633
Total $110,045 $112,909
NET CARRYING VALUE
GE
Land and improvements $ 550 $ 527
Buildings, structures and related equipment 3,617 3,812
Machinery and equipment 6,551 6,932
Leasehold costs and manufacturing plant under construction 1,726 1,224
12,444 12,495
GECS (b)
Land and improvements, buildings, structures and related equipment 1,667 3,543
Equipment leased to others
Aircraft (c) 34,665 32,983
Vehicles 9,077 11,519
Railroad rolling stock 2,960 2,887
Marine shipping containers 1,924 1,894
Construction and manufacturing 1,454 1,697
All other 2,023 1,952
53,770 56,475
Total $ 66,214 $ 68,970
(a) Depreciable lives exclude land.
(b) Included $1,571 million and $1,609 million of original cost of assets leased to GE
with accumulated amortization of $531 million and $572 million at December 31,
2010 and 2009, respectively.
(c) The GECAS business of GE Capital recognized impairment losses of $438 million in
2010 and $127 million in 2009 recorded in the caption “Other costs and expenses”
in the Statement of Earnings to reflect adjustments to fair value based on an
evaluation of average current market values (obtained from third parties) of similar
type and age aircraft, which are adjusted for the attributes of the specific aircraft
under lease.
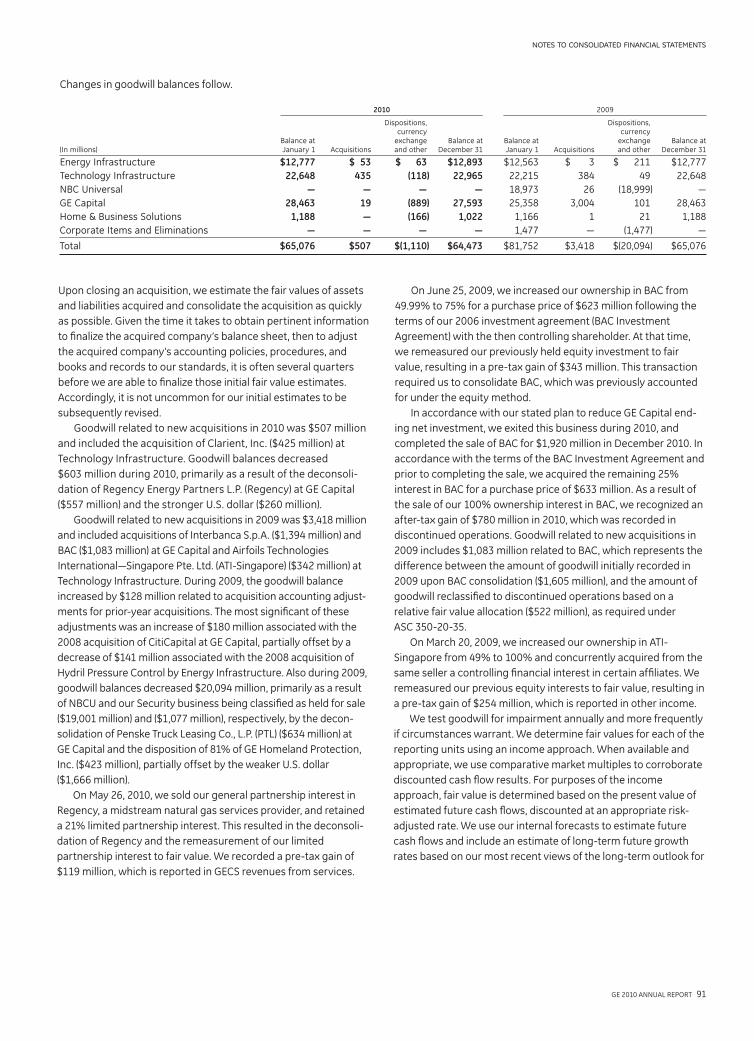
GE 2010 ANNUAL REPORT 91
notes to consolidated financial statements
On June 25, 2009, we increased our ownership in BAC from
49.99% to 75% for a purchase price of $623 million following the
terms of our 2006 investment agreement (BAC Investment
Agreement) with the then controlling shareholder. At that time,
we remeasured our previously held equity investment to fair
value, resulting in a pre-tax gain of $343 million. This transaction
required us to consolidate BAC, which was previously accounted
for under the equity method.
In accordance with our stated plan to reduce GE Capital end-
ing net investment, we exited this business during 2010, and
completed the sale of BAC for $1,920 million in December 2010. In
accordance with the terms of the BAC Investment Agreement and
prior to completing the sale, we acquired the remaining 25%
interest in BAC for a purchase price of $633 million. As a result of
the sale of our 100% ownership interest in BAC, we recognized an
after-tax gain of $780 million in 2010, which was recorded in
discontinued operations. Goodwill related to new acquisitions in
2009 includes $1,083 million related to BAC, which represents the
difference between the amount of goodwill initially recorded in
2009 upon BAC consolidation ($1,605 million), and the amount of
goodwill reclassified to discontinued operations based on a
relative fair value allocation ($522 million), as required under
ASC 350-20-35.
On March 20, 2009, we increased our ownership in ATI-
Singapore from 49% to 100% and concurrently acquired from the
same seller a controlling financial interest in certain affiliates. We
remeasured our previous equity interests to fair value, resulting in
a pre-tax gain of $254 million, which is reported in other income.
We test goodwill for impairment annually and more frequently
if circumstances warrant. We determine fair values for each of the
reporting units using an income approach. When available and
appropriate, we use comparative market multiples to corroborate
discounted cash flow results. For purposes of the income
approach, fair value is determined based on the present value of
estimated future cash flows, discounted at an appropriate risk-
adjusted rate. We use our internal forecasts to estimate future
cash flows and include an estimate of long-term future growth
rates based on our most recent views of the long-term outlook for
Upon closing an acquisition, we estimate the fair values of assets
and liabilities acquired and consolidate the acquisition as quickly
as possible. Given the time it takes to obtain pertinent information
to finalize the acquired company’s balance sheet, then to adjust
the acquired company’s accounting policies, procedures, and
books and records to our standards, it is often several quarters
before we are able to finalize those initial fair value estimates.
Accordingly, it is not uncommon for our initial estimates to be
subsequently revised.
Goodwill related to new acquisitions in 2010 was $507 million
and included the acquisition of Clarient, Inc. ($425 million) at
Technology Infrastructure. Goodwill balances decreased
$603 million during 2010, primarily as a result of the deconsoli-
dation of Regency Energy Partners L.P. (Regency) at GE Capital
($557 million) and the stronger U.S. dollar ($260 million).
Goodwill related to new acquisitions in 2009 was $3,418 million
and included acquisitions of Interbanca S.p.A. ($1,394 million) and
BAC ($1,083 million) at GE Capital and Airfoils Technologies
International—Singapore Pte. Ltd. (ATI-Singapore) ($342 million) at
Technology Infrastructure. During 2009, the goodwill balance
increased by $128 million related to acquisition accounting adjust-
ments for prior-year acquisitions. The most significant of these
adjustments was an increase of $180 million associated with the
2008 acquisition of CitiCapital at GE Capital, partially offset by a
decrease of $141 million associated with the 2008 acquisition of
Hydril Pressure Control by Energy Infrastructure. Also during 2009,
goodwill balances decreased $20,094 million, primarily as a result
of NBCU and our Security business being classified as held for sale
($19,001 million) and ($1,077 million), respectively, by the decon-
solidation of Penske Truck Leasing Co., L.P. (PTL) ($634 million) at
GE Capital and the disposition of 81% of GE Homeland Protection,
Inc. ($423 million), partially offset by the weaker U.S. dollar
($1,666 million).
On May 26, 2010, we sold our general partnership interest in
Regency, a midstream natural gas services provider, and retained
a 21% limited partnership interest. This resulted in the deconsoli-
dation of Regency and the remeasurement of our limited
partner ship interest to fair value. We recorded a pre-tax gain of
$119 million, which is reported in GECS revenues from services.
Changes in goodwill balances follow.
2010 2009
Dispositions, Dispositions, currency currency Balance at exchange Balance at Balance at exchange Balance at (In millions) January 1 Acquisitions and other December 31 January 1 Acquisitions and other December 31
Energy Infrastructure $12,777 $ 53 $ 63 $12,893 $12,563 $ 3 $ 211 $12,777
Technology Infrastructure 22,648 435 (118) 22,965 22,215 384 49 22,648
NBC Universal — — — — 18,973 26 (18,999) —
GE Capital 28,463 19 (889) 27,593 25,358 3,004 101 28,463
Home & Business Solutions 1,188 — (166) 1,022 1,166 1 21 1,188
Corporate Items and Eliminations — — — — 1,477 — (1,477) —
Total $65,076 $507 $(1,110) $64,473 $81,752 $3,418 $(20,094) $65,076
92 GE 2010 ANNUAL REPORT
notes to consolidated financial statements
therefore, the second step of the impairment test was not required
to be performed and no goodwill impairment was recognized.
Our Real Estate reporting unit had a goodwill balance of
$1,089 million at December 31, 2010. As of July 1, 2010, the carry-
ing amount exceeded the estimated fair value of our Real Estate
reporting unit by approximately $3.2 billion. The estimated fair
value of the Real Estate reporting unit is based on a number of
assumptions about future business performance and investment,
including loss estimates for the existing finance receivable and
investment portfolio, new debt origination volume and margins,
and anticipated stabilization of the real estate market allowing
for sales of real estate investments at normalized margins. Our
assumed discount rate was 12% and was derived by applying a
capital asset pricing model and corroborated using equity analyst
research reports and implied cost of equity based on forecasted
price to earnings per share multiples for similar companies. Given
the volatility and uncertainty in the current commercial real
estate environment, there is uncertainty about a number of
assumptions upon which the estimated fair value is based. Differ-
ent loss estimates for the existing portfolio, changes in the new
debt origination volume and margin assumptions, changes in the
expected pace of the commercial real estate market recovery, or
changes in the equity return expectation of market participants
may result in changes in the estimated fair value of the Real
Estate reporting unit.
Based on the results of the step one testing, we performed the
second step of the impairment test described above. Based on
the results of the second step analysis for the Real Estate report-
ing unit, the estimated implied fair value of goodwill exceeded the
carrying value of goodwill by approximately $3.5 billion. Accord-
ingly, no goodwill impairment was required. In the second step,
unrealized losses in an entity’s assets have the effect of increas-
ing the estimated implied fair value of goodwill. The results of the
second step analysis were attributable to several factors. The
primary driver was the excess of the carrying value over the
estimated fair value of our Real Estate equity investments, which
approximated $6.3 billion at that time. Other drivers for the favor-
able outcome include the unrealized losses in the Real Estate
finance receivable portfolio and the fair value premium on the
Real Estate reporting unit allocated debt. The results of the sec-
ond step analysis are highly sensitive to these measurements, as
well as the key assumptions used in determining the estimated
fair value of the Real Estate reporting unit.
Estimating the fair value of reporting units requires the use of
estimates and significant judgments that are based on a number
of factors including actual operating results. If current conditions
persist longer or deteriorate further than expected, it is reason-
ably possible that the judgments and estimates described above
could change in future periods.
each business. Actual results may differ from those assumed in
our forecasts. We derive our discount rates using a capital asset
pricing model and analyzing published rates for industries relevant
to our reporting units to estimate the cost of equity financing. We
use discount rates that are commensurate with the risks and
uncertainty inherent in the respective businesses and in our
internally developed forecasts. Discount rates used in our report-
ing unit valuations ranged from 9% to 14.5%. Valuations using
the market approach reflect prices and other relevant observable
information generated by market transactions involving compa-
rable businesses.
Compared to the market approach, the income approach more
closely aligns each reporting unit valuation to our business profile,
including geographic markets served and product offerings.
Required rates of return, along with uncertainty inherent in the
forecasts of future cash flows, are reflected in the selection of
the discount rate. Equally important, under this approach, reason-
ably likely scenarios and associated sensitivities can be developed
for alternative future states that may not be reflected in an observ-
able market price. A market approach allows for comparison to
actual market transactions and multiples. It can be somewhat
more limited in its application because the population of potential
comparables is often limited to publicly-traded companies where
the characteristics of the comparative business and ours can be
significantly different, market data is usually not available for
divisions within larger conglomerates or non-public subsidiaries
that could otherwise qualify as comparable, and the specific
circumstances surrounding a market transaction (e.g., synergies
between the parties, terms and conditions of the transaction, etc.)
may be different or irrelevant with respect to our business. It can
also be difficult, under certain market conditions, to identify
orderly transactions between market participants in similar busi-
nesses. We assess the valuation methodology based upon the
relevance and availability of the data at the time we perform
the valuation and weight the methodologies appropriately.
We performed our annual impairment test of goodwill for all of
our reporting units in the third quarter using data as of July 1,
2010. The impairment test consists of two steps: in step one, the
carrying value of the reporting unit is compared with its fair value;
in step two, which is applied when the carrying value is more than
its fair value, the amount of goodwill impairment, if any, is derived
by deducting the fair value of the reporting unit’s assets and
liabilities from the fair value of its equity, and comparing that
amount with the carrying amount of goodwill. In performing the
valuations, we used cash flows that reflected management’s
forecasts and discount rates that included risk adjustments con-
sistent with the current market conditions. Based on the results of
our step one testing, the fair values of each of the GE Industrial
reporting units and the CLL, Consumer, Energy Financial Services
and GECAS reporting units exceeded their carrying values;
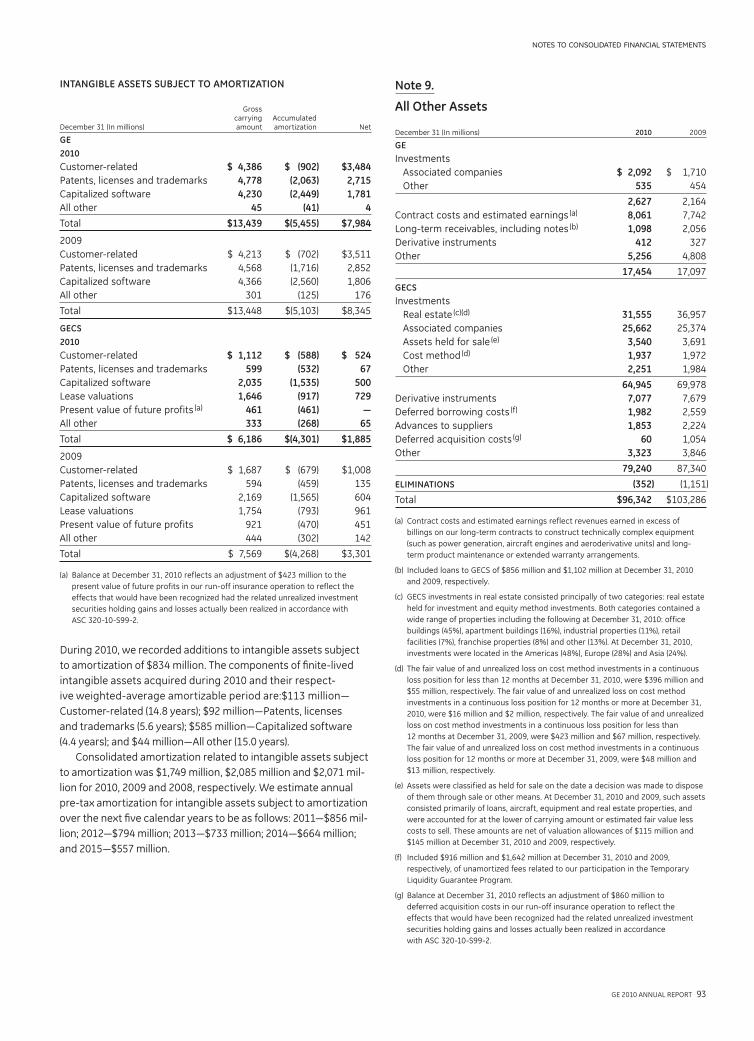
GE 2010 ANNUAL REPORT 93
notes to consolidated financial statements
Note 9.
All Other Assets
December 31 (In millions) 2010 2009
GE
Investments
Associated companies $ 2,092 $ 1,710
Other 535 454
2,627 2,164
Contract costs and estimated earnings (a) 8,061 7,742
Long-term receivables, including notes (b) 1,098 2,056
Derivative instruments 412 327
Other 5,256 4,808
17,454 17,097
GECS
Investments
Real estate (c)(d) 31,555 36,957
Associated companies 25,662 25,374
Assets held for sale (e) 3,540 3,691
Cost method (d) 1,937 1,972
Other 2,251 1,984
64,945 69,978
Derivative instruments 7,077 7,679
Deferred borrowing costs (f) 1,982 2,559
Advances to suppliers 1,853 2,224
Deferred acquisition costs (g) 60 1,054
Other 3,323 3,846
79,240 87,340
ELIMINATIONS (352) (1,151)
Total $96,342 $103,286
(a) Contract costs and estimated earnings reflect revenues earned in excess of
billings on our long-term contracts to construct technically complex equipment
(such as power generation, aircraft engines and aeroderivative units) and long-
term product maintenance or extended warranty arrangements.
(b) Included loans to GECS of $856 million and $1,102 million at December 31, 2010
and 2009, respectively.
(c) GECS investments in real estate consisted principally of two categories: real estate
held for investment and equity method investments. Both categories contained a
wide range of properties including the following at December 31, 2010: office
buildings (45%), apartment buildings (16%), industrial properties (11%), retail
facilities (7%), franchise properties (8%) and other (13%). At December 31, 2010,
investments were located in the Americas (48%), Europe (28%) and Asia (24%).
(d) The fair value of and unrealized loss on cost method investments in a continuous
loss position for less than 12 months at December 31, 2010, were $396 million and
$55 million, respectively. The fair value of and unrealized loss on cost method
investments in a continuous loss position for 12 months or more at December 31,
2010, were $16 million and $2 million, respectively. The fair value of and unrealized
loss on cost method investments in a continuous loss position for less than
12 months at December 31, 2009, were $423 million and $67 million, respectively.
The fair value of and unrealized loss on cost method investments in a continuous
loss position for 12 months or more at December 31, 2009, were $48 million and
$13 million, respectively.
(e) Assets were classified as held for sale on the date a decision was made to dispose
of them through sale or other means. At December 31, 2010 and 2009, such assets
consisted primarily of loans, aircraft, equipment and real estate properties, and
were accounted for at the lower of carrying amount or estimated fair value less
costs to sell. These amounts are net of valuation allowances of $115 million and
$145 million at December 31, 2010 and 2009, respectively.
(f) Included $916 million and $1,642 million at December 31, 2010 and 2009,
respectively, of unamortized fees related to our participation in the Temporary
Liquidity Guarantee Program.
(g) Balance at December 31, 2010 reflects an adjustment of $860 million to
deferred acquisition costs in our run-off insurance operation to reflect the
effects that would have been recognized had the related unrealized investment
securities holding gains and losses actually been realized in accordance
with ASC 320-10-S99-2.
INTANGIBLE ASSETS SUBJECT TO AMORTIZATION
Gross carrying Accumulated December 31 (In millions) amount amortization Net
GE
2010
Customer-related $ 4,386 $ (902) $3,484
Patents, licenses and trademarks 4,778 (2,063) 2,715
Capitalized software 4,230 (2,449) 1,781
All other 45 (41) 4
Total $13,439 $(5,455) $7,984
2009
Customer-related $ 4,213 $ (702) $3,511
Patents, licenses and trademarks 4,568 (1,716) 2,852
Capitalized software 4,366 (2,560) 1,806
All other 301 (125) 176
Total $13,448 $(5,103) $8,345
GECS
2010
Customer-related $ 1,112 $ (588) $ 524
Patents, licenses and trademarks 599 (532) 67
Capitalized software 2,035 (1,535) 500
Lease valuations 1,646 (917) 729
Present value of future profits (a) 461 (461) —
All other 333 (268) 65
Total $ 6,186 $(4,301) $1,885
2009
Customer-related $ 1,687 $ (679) $1,008
Patents, licenses and trademarks 594 (459) 135
Capitalized software 2,169 (1,565) 604
Lease valuations 1,754 (793) 961
Present value of future profits 921 (470) 451
All other 444 (302) 142
Total $ 7,569 $(4,268) $3,301
(a) Balance at December 31, 2010 reflects an adjustment of $423 million to the
present value of future profits in our run-off insurance operation to reflect the
effects that would have been recognized had the related unrealized investment
securities holding gains and losses actually been realized in accordance with
ASC 320-10-S99-2.
During 2010, we recorded additions to intangible assets subject
to amortization of $834 million. The components of finite-lived
intangible assets acquired during 2010 and their respect-
ive weighted-average amortizable period are:$113 million—
Customer-related (14.8 years); $92 million—Patents, licenses
and trademarks (5.6 years); $585 million—Capitalized software
(4.4 years); and $44 million—All other (15.0 years).
Consolidated amortization related to intangible assets subject
to amortization was $1,749 million, $2,085 million and $2,071 mil-
lion for 2010, 2009 and 2008, respectively. We estimate annual
pre-tax amortization for intangible assets subject to amortization
over the next five calendar years to be as follows: 2011—$856 mil-
lion; 2012—$794 million; 2013—$733 million; 2014—$664 million;
and 2015—$557 million.
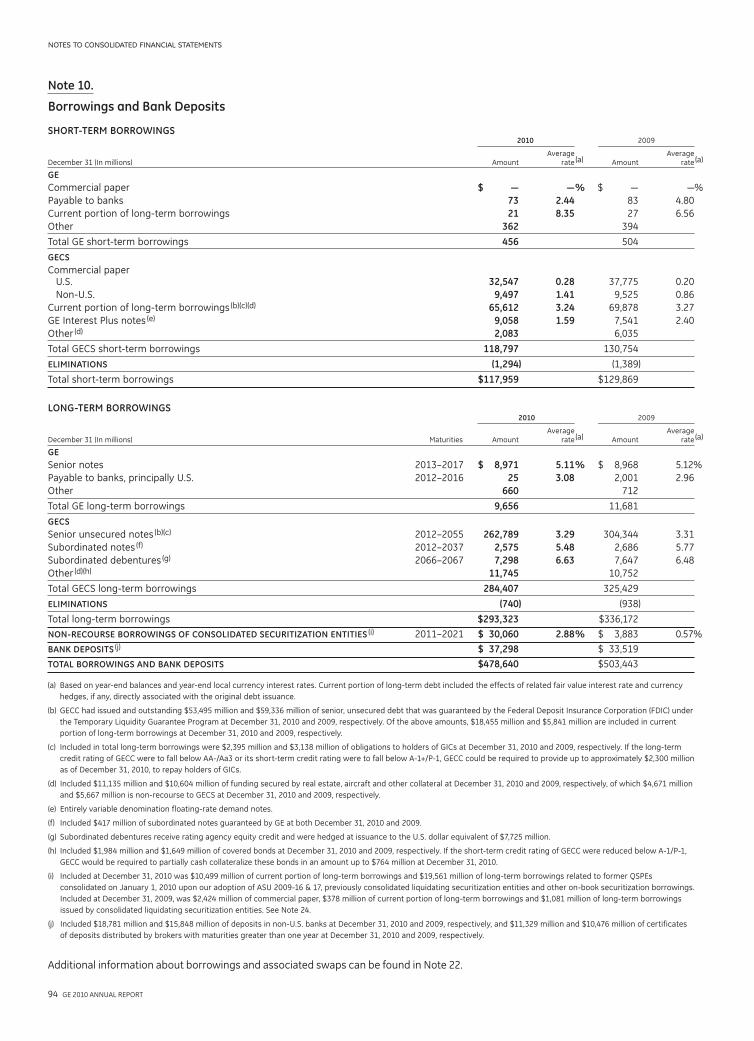
94 GE 2010 ANNUAL REPORT
notes to consolidated financial statements
Note 10.
Borrowings and Bank Deposits
SHORT-TERM BORROWINGS 2010 2009
Average Average December 31 (In millions) Amount rate (a) Amount rate (a)
GE
Commercial paper $ — — % $ — —%
Payable to banks 73 2.44 83 4.80
Current portion of long-term borrowings 21 8.35 27 6.56
Other 362 394
Total GE short-term borrowings 456 504
GECS
Commercial paper U.S. 32,547 0.28 37,775 0.20
Non-U.S. 9,497 1.41 9,525 0.86
Current portion of long-term borrowings (b)(c)(d) 65,612 3.24 69,878 3.27
GE Interest Plus notes (e) 9,058 1.59 7,541 2.40
Other (d) 2,083 6,035
Total GECS short-term borrowings 118,797 130,754
ELIMINATIONS (1,294) (1,389)
Total short-term borrowings $117,959 $129,869
LONG-TERM BORROWINGS 2010 2009
Average Average December 31 (In millions) Maturities Amount rate (a) Amount rate (a)
GE
Senior notes 2013–2017 $ 8,971 5.11 % $ 8,968 5.12%
Payable to banks, principally U.S. 2012–2016 25 3.08 2,001 2.96
Other 660 712
Total GE long-term borrowings 9,656 11,681
GECS
Senior unsecured notes (b)(c) 2012–2055 262,789 3.29 304,344 3.31
Subordinated notes (f) 2012–2037 2,575 5.48 2,686 5.77
Subordinated debentures (g) 2066–2067 7,298 6.63 7,647 6.48
Other (d)(h) 11,745 10,752
Total GECS long-term borrowings 284,407 325,429
ELIMINATIONS (740) (938)
Total long-term borrowings $293,323 $336,172
NON-RECOURSE BORROWINGS OF CONSOLIDATED SECURITIZATION ENTITIES (i) 2011–2021 $ 30,060 2.88 % $ 3,883 0.57%
BANK DEPOSITS (j) $ 37,298 $ 33,519
TOTAL BORROWINGS AND BANK DEPOSITS $478,640 $503,443
(a) Based on year-end balances and year-end local currency interest rates. Current portion of long-term debt included the effects of related fair value interest rate and currency
hedges, if any, directly associated with the original debt issuance.
(b) GECC had issued and outstanding $53,495 million and $59,336 million of senior, unsecured debt that was guaranteed by the Federal Deposit Insurance Corporation (FDIC) under
the Temporary Liquidity Guarantee Program at December 31, 2010 and 2009, respectively. Of the above amounts, $18,455 million and $5,841 million are included in current
portion of long-term borrowings at December 31, 2010 and 2009, respectively.
(c) Included in total long-term borrowings were $2,395 million and $3,138 million of obligations to holders of GICs at December 31, 2010 and 2009, respectively. If the long-term
credit rating of GECC were to fall below AA-/Aa3 or its short-term credit rating were to fall below A-1+/P-1, GECC could be required to provide up to approximately $2,300 million
as of December 31, 2010, to repay holders of GICs.
(d) Included $11,135 million and $10,604 million of funding secured by real estate, aircraft and other collateral at December 31, 2010 and 2009, respectively, of which $4,671 million
and $5,667 million is non-recourse to GECS at December 31, 2010 and 2009, respectively.
(e) Entirely variable denomination floating-rate demand notes.
(f) Included $417 million of subordinated notes guaranteed by GE at both December 31, 2010 and 2009.
(g) Subordinated debentures receive rating agency equity credit and were hedged at issuance to the U.S. dollar equivalent of $7,725 million.
(h) Included $1,984 million and $1,649 million of covered bonds at December 31, 2010 and 2009, respectively. If the short-term credit rating of GECC were reduced below A-1/P-1,
GECC would be required to partially cash collateralize these bonds in an amount up to $764 million at December 31, 2010.
(i) Included at December 31, 2010 was $10,499 million of current portion of long-term borrowings and $19,561 million of long-term borrowings related to former QSPEs
consolidated on January 1, 2010 upon our adoption of ASU 2009-16 & 17, previously consolidated liquidating securitization entities and other on-book securitization borrowings.
Included at December 31, 2009, was $2,424 million of commercial paper, $378 million of current portion of long-term borrowings and $1,081 million of long-term borrowings
issued by consolidated liquidating securitization entities. See Note 24.
(j) Included $18,781 million and $15,848 million of deposits in non-U.S. banks at December 31, 2010 and 2009, respectively, and $11,329 million and $10,476 million of certificates
of deposits distributed by brokers with maturities greater than one year at December 31, 2010 and 2009, respectively.
Additional information about borrowings and associated swaps can be found in Note 22.
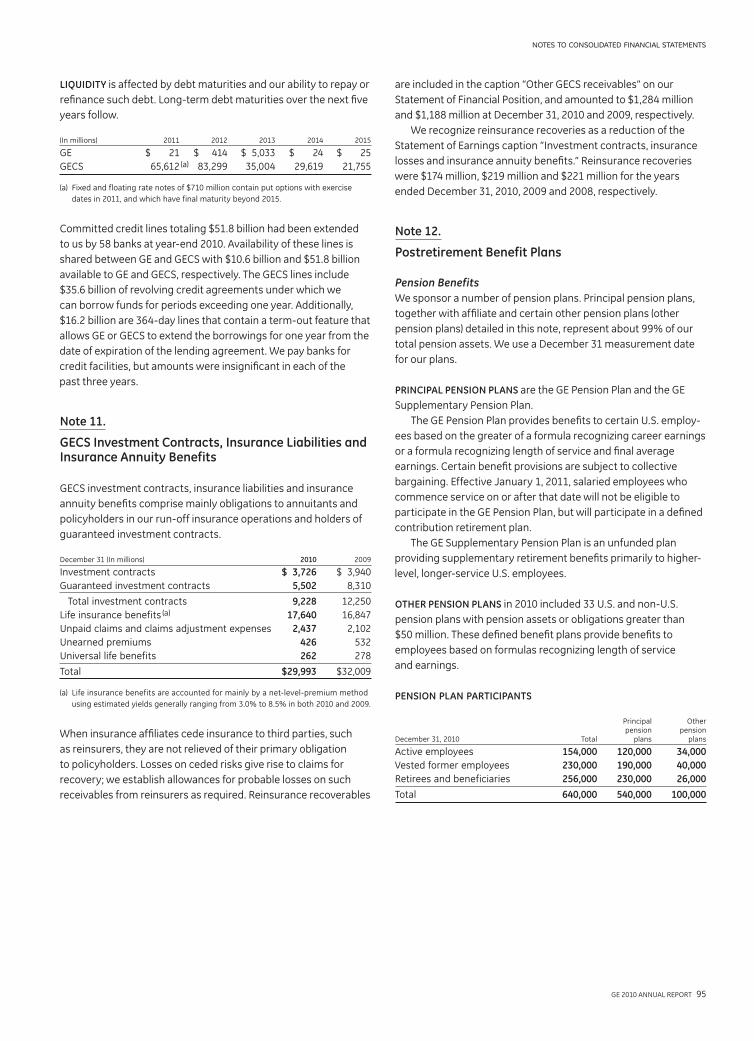
GE 2010 ANNUAL REPORT 95
notes to consolidated financial statements
are included in the caption “Other GECS receivables” on our
Statement of Financial Position, and amounted to $1,284 million
and $1,188 million at December 31, 2010 and 2009, respectively.
We recognize reinsurance recoveries as a reduction of the
Statement of Earnings caption “Investment contracts, insurance
losses and insurance annuity benefits.” Reinsurance recoveries
were $174 million, $219 million and $221 million for the years
ended December 31, 2010, 2009 and 2008, respectively.
Note 12.
Postretirement Benefit Plans
Pension BenefitsWe sponsor a number of pension plans. Principal pension plans,
together with affiliate and certain other pension plans (other
pension plans) detailed in this note, represent about 99% of our
total pension assets. We use a December 31 measurement date
for our plans.
PRINCIPAL PENSION PLANS are the GE Pension Plan and the GE
Supplementary Pension Plan.
The GE Pension Plan provides benefits to certain U.S. employ-
ees based on the greater of a formula recognizing career earnings
or a formula recognizing length of service and final average
earnings. Certain benefit provisions are subject to collective
bargaining. Effective January 1, 2011, salaried employees who
commence service on or after that date will not be eligible to
participate in the GE Pension Plan, but will participate in a defined
contribution retirement plan.
The GE Supplementary Pension Plan is an unfunded plan
providing supplementary retirement benefits primarily to higher-
level, longer-service U.S. employees.
OTHER PENSION PLANS in 2010 included 33 U.S. and non-U.S.
pension plans with pension assets or obligations greater than
$50 million. These defined benefit plans provide benefits to
employees based on formulas recognizing length of service
and earnings.
PENSION PLAN PARTICIPANTS
Principal Other pension pension December 31, 2010 Total plans plans
Active employees 154,000 120,000 34,000
Vested former employees 230,000 190,000 40,000
Retirees and beneficiaries 256,000 230,000 26,000
Total 640,000 540,000 100,000
LIQUIDITY is affected by debt maturities and our ability to repay or
refinance such debt. Long-term debt maturities over the next five
years follow.
(In millions) 2011 2012 2013 2014 2015
GE $ 21 $ 414 $ 5,033 $ 24 $ 25
GECS 65,612 (a) 83,299 35,004 29,619 21,755
(a) Fixed and floating rate notes of $710 million contain put options with exercise
dates in 2011, and which have final maturity beyond 2015.
Committed credit lines totaling $51.8 billion had been extended
to us by 58 banks at year-end 2010. Availability of these lines is
shared between GE and GECS with $10.6 billion and $51.8 billion
available to GE and GECS, respectively. The GECS lines include
$35.6 billion of revolving credit agreements under which we
can borrow funds for periods exceeding one year. Additionally,
$16.2 billion are 364-day lines that contain a term-out feature that
allows GE or GECS to extend the borrowings for one year from the
date of expiration of the lending agreement. We pay banks for
credit facilities, but amounts were insignificant in each of the
past three years.
Note 11.
GECS Investment Contracts, Insurance Liabilities and Insurance Annuity Benefits
GECS investment contracts, insurance liabilities and insurance
annuity benefits comprise mainly obligations to annuitants and
policyholders in our run-off insurance operations and holders of
guaranteed investment contracts.
December 31 (In millions) 2010 2009
Investment contracts $ 3,726 $ 3,940
Guaranteed investment contracts 5,502 8,310
Total investment contracts 9,228 12,250
Life insurance benefits (a) 17,640 16,847
Unpaid claims and claims adjustment expenses 2,437 2,102
Unearned premiums 426 532
Universal life benefits 262 278
Total $29,993 $32,009
(a) Life insurance benefits are accounted for mainly by a net-level-premium method
using estimated yields generally ranging from 3.0% to 8.5% in both 2010 and 2009.
When insurance affiliates cede insurance to third parties, such
as reinsurers, they are not relieved of their primary obligation
to policyholders. Losses on ceded risks give rise to claims for
recovery; we establish allowances for probable losses on such
receivables from reinsurers as required. Reinsurance recoverables

96 GE 2010 ANNUAL REPORT
notes to consolidated financial statements
PROJECTED BENEFIT OBLIGATION
Principal pension plans Other pension plans
(In millions) 2010 2009 2010 2009
Balance at January 1 $48,117 $45,168 $9,597 $7,748
Service cost for benefits earned 1,149 1,609 277 297
Interest cost on benefit obligations 2,693 2,669 486 460
Participant contributions 166 167 33 35
Plan amendments — — 23 3
Actuarial loss (gain) 2,799 (a) 1,331 (a) (12) 1,113
Benefits paid (2,925) (2,827) (421) (398)
Acquisitions (dispositions)—net — — 50 (219)
Exchange rate adjustments — — (126) 558
Balance at December 31 (b) $51,999 $48,117 $9,907 $9,597
(a) Principally associated with discount rate changes.
(b) The PBO for the GE Supplementary Pension Plan, which is an unfunded plan, was
$4,430 million and $3,828 million at year-end 2010 and 2009, respectively.
ACCUMULATED BENEFIT OBLIGATION
December 31 (In millions) 2010 2009
GE Pension Plan $46,046 $42,917
GE Supplementary Pension Plan 3,296 2,901
Other pension plans 9,134 8,947
PLANS WITH ASSETS LESS THAN ABO
December 31 (In millions) 2010 2009
Funded plans with assets less than ABO
Plan assets $51,286 $47,740
Accumulated benefit obligations 53,350 49,948
Projected benefit obligations 55,502 51,837
Unfunded plans (a)
Accumulated benefit obligations $ 4,086 $ 3,725
Projected benefit obligations 5,247 4,675
(a) Primarily related to the GE Supplementary Pension Plan.
To determine the expected long-term rate of return on pension
plan assets, we consider current and expected asset allocations,
as well as historical and expected returns on various categories
of plan assets. In developing future return expectations for our
principal benefit plans’ assets, we evaluate general market trends
as well as key elements of asset class returns such as expected
earnings growth, yields and spreads. Based on our analysis of
future expectations of asset performance, past return results, and
our current and expected asset allocations, we have assumed an
8.0% long-term expected return on those assets for cost recogni-
tion in 2011. This is a reduction from the 8.5% we had assumed in
2010, 2009 and 2008. For the principal pension plans, we apply
our expected rate of return to a market-related value of assets,
which stabilizes variability in the amounts to which we apply that
expected return.
We amortize experience gains and losses as well as the effects
of changes in actuarial assumptions and plan provisions over a
period no longer than the average future service of employees.
FUNDING POLICY for the GE Pension Plan is to contribute amounts
sufficient to meet minimum funding requirements as set forth in
employee benefit and tax laws plus such additional amounts as
we may determine to be appropriate. We have not made contri-
butions to the GE Pension Plan since 1987 and will not make any
such contributions in 2011. In 2011, we expect to pay approxi-
mately $200 million for benefit payments under our GE
Supplementary Pension Plan and administrative expenses of our
principal pension plans and expect to contribute approximately
$670 million to other pension plans. In 2010, comparative
amounts were $183 million and $573 million, respectively.
BENEFIT OBLIGATIONS are described in the following tables.
Accumulated and projected benefit obligations (ABO and PBO)
represent the obligations of a pension plan for past service as
of the measurement date. ABO is the present value of benefits
earned to date with benefits computed based on current com-
pensation levels. PBO is ABO increased to reflect expected
future compensation.
COST OF PENSION PLANS
Total Principal pension plans Other pension plans
(In millions) 2010 2009 2008 2010 2009 2008 2010 2009 2008
Service cost for benefits earned $ 1,426 $ 1,906 $ 1,663 $ 1,149 $ 1,609 $ 1,331 $ 277 $ 297 $ 332
Prior service cost amortization 252 437 332 238 426 (a) 321 14 11 11
Expected return on plan assets (4,857) (4,943) (4,850) (4,344) (4,505) (4,298) (513) (438) (552)
Interest cost on benefit obligations 3,179 3,129 3,152 2,693 2,669 2,653 486 460 499
Net actuarial loss amortization 1,546 482 316 1,336 348 237 210 134 79
Pension plans cost $ 1,546 $ 1,011 $ 613 $ 1,072 $ 547 $ 244 $ 474 $ 464 $ 369
(a) In 2009, included a $103 million loss as a result of our agreement with Comcast Corporation to transfer the NBCU business to a newly formed entity in which we will own
a 49% interest.
ACTUARIAL ASSUMPTIONS are described below. The actuarial assumptions at December 31 are used to measure the year-end benefit
obligations and the pension costs for the subsequent year.
Principal pension plans Other pension plans (weighted average)
December 31 2010 2009 2008 2007 2010 2009 2008 2007
Discount rate 5.28 % 5.78 % 6.11 % 6.34 % 5.11 % 5.31 % 6.03 % 5.65%
Compensation increases 4.25 4.20 4.20 5.00 4.44 4.56 4.47 4.50
Expected return on assets 8.00 8.50 8.50 8.50 7.25 7.29 7.41 7.51
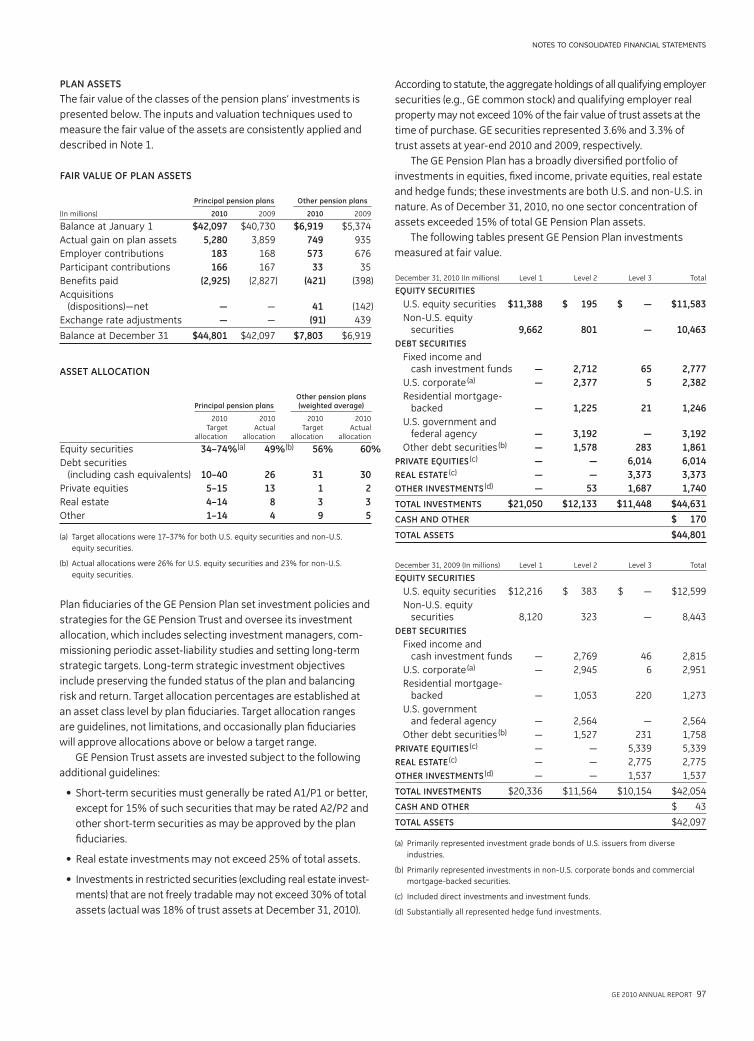
GE 2010 ANNUAL REPORT 97
notes to consolidated financial statements
According to statute, the aggregate holdings of all qualifying employer
securities (e.g., GE common stock) and qualifying employer real
property may not exceed 10% of the fair value of trust assets at the
time of purchase. GE securities represented 3.6% and 3.3% of
trust assets at year-end 2010 and 2009, respectively.
The GE Pension Plan has a broadly diversified portfolio of
investments in equities, fixed income, private equities, real estate
and hedge funds; these investments are both U.S. and non-U.S. in
nature. As of December 31, 2010, no one sector concentration of
assets exceeded 15% of total GE Pension Plan assets.
The following tables present GE Pension Plan investments
measured at fair value.
December 31, 2010 (In millions) Level 1 Level 2 Level 3 Total
EQUITY SECURITIES
U.S. equity securities $11,388 $ 195 $ — $11,583
Non-U.S. equity securities 9,662 801 — 10,463
DEBT SECURITIES
Fixed income and cash investment funds — 2,712 65 2,777
U.S. corporate (a) — 2,377 5 2,382
Residential mortgage- backed — 1,225 21 1,246
U.S. government and federal agency — 3,192 — 3,192
Other debt securities (b) — 1,578 283 1,861
PRIVATE EQUITIES (c) — — 6,014 6,014
REAL ESTATE (c) — — 3,373 3,373
OTHER INVESTMENTS (d) — 53 1,687 1,740
TOTAL INVESTMENTS $21,050 $12,133 $11,448 $44,631
CASH AND OTHER $ 170
TOTAL ASSETS $44,801
December 31, 2009 (In millions) Level 1 Level 2 Level 3 Total
EQUITY SECURITIES
U.S. equity securities $12,216 $ 383 $ — $12,599
Non-U.S. equity securities 8,120 323 — 8,443
DEBT SECURITIES
Fixed income and cash investment funds — 2,769 46 2,815
U.S. corporate (a) — 2,945 6 2,951
Residential mortgage- backed — 1,053 220 1,273
U.S. government and federal agency — 2,564 — 2,564
Other debt securities (b) — 1,527 231 1,758
PRIVATE EQUITIES (c) — — 5,339 5,339
REAL ESTATE (c) — — 2,775 2,775
OTHER INVESTMENTS (d) — — 1,537 1,537
TOTAL INVESTMENTS $20,336 $11,564 $10,154 $42,054
CASH AND OTHER $ 43
TOTAL ASSETS $42,097
(a) Primarily represented investment grade bonds of U.S. issuers from diverse
industries.
(b) Primarily represented investments in non-U.S. corporate bonds and commercial
mortgage-backed securities.
(c) Included direct investments and investment funds.
(d) Substantially all represented hedge fund investments.
PLAN ASSETS
The fair value of the classes of the pension plans’ investments is
presented below. The inputs and valuation techniques used to
measure the fair value of the assets are consistently applied and
described in Note 1.
FAIR VALUE OF PLAN ASSETS
Principal pension plans Other pension plans
(In millions) 2010 2009 2010 2009
Balance at January 1 $42,097 $40,730 $6,919 $5,374
Actual gain on plan assets 5,280 3,859 749 935
Employer contributions 183 168 573 676
Participant contributions 166 167 33 35
Benefits paid (2,925) (2,827) (421) (398)
Acquisitions (dispositions)—net — — 41 (142)
Exchange rate adjustments — — (91) 439
Balance at December 31 $44,801 $42,097 $7,803 $6,919
ASSET ALLOCATION
Other pension plans Principal pension plans (weighted average)
2010 2010 2010 2010 Target Actual Target Actual allocation allocation allocation allocation
Equity securities 34–74% (a) 49% (b) 56% 60%
Debt securities (including cash equivalents) 10–40 26 31 30
Private equities 5–15 13 1 2
Real estate 4–14 8 3 3
Other 1–14 4 9 5
(a) Target allocations were 17–37% for both U.S. equity securities and non-U.S.
equity securities.
(b) Actual allocations were 26% for U.S. equity securities and 23% for non-U.S.
equity securities.
Plan fiduciaries of the GE Pension Plan set investment policies and
strategies for the GE Pension Trust and oversee its investment
allocation, which includes selecting investment managers, com-
missioning periodic asset-liability studies and setting long-term
strategic targets. Long-term strategic investment objectives
include preserving the funded status of the plan and balancing
risk and return. Target allocation percentages are established at
an asset class level by plan fiduciaries. Target allocation ranges
are guidelines, not limitations, and occasionally plan fiduciaries
will approve allocations above or below a target range.
GE Pension Trust assets are invested subject to the following
additional guidelines:
• Short-term securities must generally be rated A1/P1 or better,
except for 15% of such securities that may be rated A2/P2 and
other short-term securities as may be approved by the plan
fiduciaries.
• Real estate investments may not exceed 25% of total assets.
• Investments in restricted securities (excluding real estate invest-
ments) that are not freely tradable may not exceed 30% of total
assets (actual was 18% of trust assets at December 31, 2010).

98 GE 2010 ANNUAL REPORT
notes to consolidated financial statements
The following tables present the changes in Level 3 investments for the GE Pension Plan.
CHANGES IN LEVEL 3 INVESTMENTS FOR THE YEAR ENDED DECEMBER 31, 2010
Net change in unrealized gains (losses) relating to Purchases, Transfers investments Net realized/ issuances in and/or still held at January 1, unrealized and out of December 31, December 31, (In millions) 2010 gains (losses) settlements Level 3 (a) 2010 2010 (b)
DEBT SECURITIES
Fixed income and cash investment funds $ 46 $ 16 $ 3 $ — $ 65 $ 15
U.S. corporate 6 7 (9) 1 5 1
Residential mortgage-backed 220 6 (211) 6 21 1
Other debt securities 231 17 41 (6) 283 15
PRIVATE EQUITIES 5,339 748 (73) — 6,014 694
REAL ESTATE 2,775 381 217 — 3,373 251
OTHER INVESTMENTS 1,537 132 65 (47) 1,687 156
$10,154 $1,307 $ 33 $(46) $11,448 $1,133
(a) Transfers in and out of Level 3 are considered to occur at the beginning of the period.
(b) The net change in unrealized gains (losses) was included in the year-end asset value.
CHANGES IN LEVEL 3 INVESTMENTS FOR THE YEAR ENDED DECEMBER 31, 2009
Net change in unrealized gains (losses) relating to Purchases, Transfers investments Net realized/ issuances in and/or still held at January 1, unrealized and out of December 31, December 31, (In millions) 2009 gains (losses) settlements Level 3 (a) 2009 2009 (b)
EQUITY SECURITIES
Non-U.S. equity securities $ 358 $ (8) $(350) $ — $ — $ —
DEBT SECURITIES
Fixed income and cash investment funds — 3 43 — 46 3
U.S. corporate 21 (1) (12) (2) 6 (7)
Residential mortgage-backed 64 15 124 17 220 (33)
Other debt securities 223 5 3 — 231 (23)
PRIVATE EQUITIES 4,893 88 358 — 5,339 23
REAL ESTATE 4,944 (2,225) 56 — 2,775 (2,407)
OTHER INVESTMENTS 1,613 192 (268) — 1,537 (30)
$12,116 $(1,931) $ (46) $15 $10,154 $(2,474)
(a) Transfers in and out of Level 3 are considered to occur at the beginning of the period.
(b) The net change in unrealized gains (losses) was included in the year-end asset value.
Other pension plans’ assets were $7,803 million and $6,919 million at December 31, 2010 and 2009, respectively. Equity and debt securi-
ties amounting to $6,938 million and $6,517 million represented approximately 90% and 95% of total investments at December 31, 2010
and 2009, respectively. The plans’ investments were classified as 15% Level 1, 75% Level 2 and 10% Level 3 at December 31, 2010. The
plans’ investments were classified as 15% Level 1, 80% Level 2 and 5% Level 3 at December 31, 2009. The changes in Level 3 investments
were insignificant for the years ended December 31, 2010 and 2009.

GE 2010 ANNUAL REPORT 99
notes to consolidated financial statements
COST OF PRINCIPAL RETIREE BENEFIT PLANS
(In millions) 2010 2009 2008
Service cost for benefits earned $ 241 $ 442 $ 326
Prior service cost amortization (a) 631 836 673
Expected return on plan assets (116) (129) (131)
Interest cost on benefit obligations 699 709 750
Net actuarial gain amortization (a) (22) (225) (49)
Retiree benefit plans cost (a) $1,433 $1,633 $1,569
(a) In 2009, we recognized a $45 million loss as a result of our agreement with
Comcast Corporation to transfer the NBCU business to a newly formed entity in
which we will own a 49% interest. Prior service cost amortization increased by
$164 million and net actuarial gain amortization increased by $119 million as a
result of this agreement.
ACTUARIAL ASSUMPTIONS are described below. The actuarial
assumptions at December 31 are used to measure the year-end
benefit obligations and the retiree benefit plan costs for the
subsequent year.
December 31 2010 2009 2008 2007
Discount rate 5.15 % 5.67 % 6.15 % 6.31
Compensation increases 4.25 4.20 4.20 5.00
Expected return on assets 8.00 8.50 8.50 8.50
Initial healthcare trend rate (b) 7.00 7.40 7.00 (c) 9.10
(a) Weighted average discount rate of 6.34% was used for determination of costs
in 2008.
(b) For 2010, ultimately declining to 6% for 2025 and thereafter.
(c) Includes benefits from new healthcare supplier contracts.
To determine the expected long-term rate of return on retiree life
plan assets, we consider current and expected asset allocations,
as well as historical and expected returns on various categories of
plan assets. In developing future return expectations for retiree
benefit plan assets, we evaluate general market trends as well as
key elements of asset class returns such as expected earnings
growth, yields and spreads. Based on our analysis of future
expectations of asset performance, past return results, and our
current and expected asset allocations, we have assumed an
8.0% long-term expected return on those assets for cost recogni-
tion in 2011. This is a reduction from the 8.5% we had assumed in
2010, 2009 and 2008. We apply our expected rate of return to a
market-related value of assets, which stabilizes variability in the
amounts to which we apply that expected return.
We amortize experience gains and losses as well as the effects
of changes in actuarial assumptions and plan provisions over a
period no longer than the average future service of employees.
FUNDING POLICY. We fund retiree health benefits on a pay-as-
you-go basis. We expect to contribute approximately $660 million
in 2011 to fund such benefits. We fund retiree life insurance
benefits at our discretion.
% (a)
PENSION ASSET (LIABILITY)
Principal pension plans Other pension plans
December 31 (In millions) 2010 2009 2010 2009
Funded status (a)(b) $ (7,198) $ (6,020) $(2,104) $(2,678)
Pension asset (liability) recorded in the Statement of Financial Position Pension asset $ — $ — $ 202 $ 98
Pension liabilities Due within one year (c) (141) (133) (52) (54)
Due after one year (7,057) (5,887) (2,254) (2,722)
Net amount recognized $ (7,198) $ (6,020) $(2,104) $(2,678)
Amounts recorded in shareowners’ equity (unamortized) Prior service cost $ 1,075 $ 1,313 $ 72 $ 61
Net actuarial loss 18,603 18,076 1,772 2,230
Total $19,678 $19,389 $ 1,844 $ 2,291
(a) Fair value of assets less PBO, as shown in the preceding tables.
(b) The GE Pension Plan was underfunded by $2.8 billion and $2.2 billion at
December 31, 2010 and 2009, respectively.
(c) For principal pension plans, represents the GE Supplementary Pension Plan liability.
In 2011, we estimate that we will amortize $195 million of prior
service cost and $2,285 million of net actuarial loss for the principal
pension plans from shareowners’ equity into pension cost. For
other pension plans, the estimated prior service cost and net actu-
arial loss to be amortized in 2011 will be $15 million and $135 million,
respectively. Comparable amortized amounts in 2010, respectively,
were $238 million and $1,336 million for the principal pension plans
and $14 million and $210 million for other pension plans.
ESTIMATED FUTURE BENEFIT PAYMENTS
2016– (In millions) 2011 2012 2013 2014 2015 2020
Principal pension plans $2,960 $2,990 $3,025 $3,075 $3,075 $16,800
Other pension plans $ 395 $ 410 $ 415 $ 425 $ 435 $ 2,340
Retiree Health and Life BenefitsWe sponsor a number of retiree health and life insurance benefit
plans (retiree benefit plans). Principal retiree benefit plans are
discussed below; other such plans are not significant individually
or in the aggregate. We use a December 31 measurement date for
our plans.
PRINCIPAL RETIREE BENEFIT PLANS provide health and life insurance
benefits to certain employees who retire under the GE Pension Plan
with 10 or more years of service. Eligible retirees share in the cost
of healthcare benefits. These plans cover approximately 216,000
retirees and dependents.
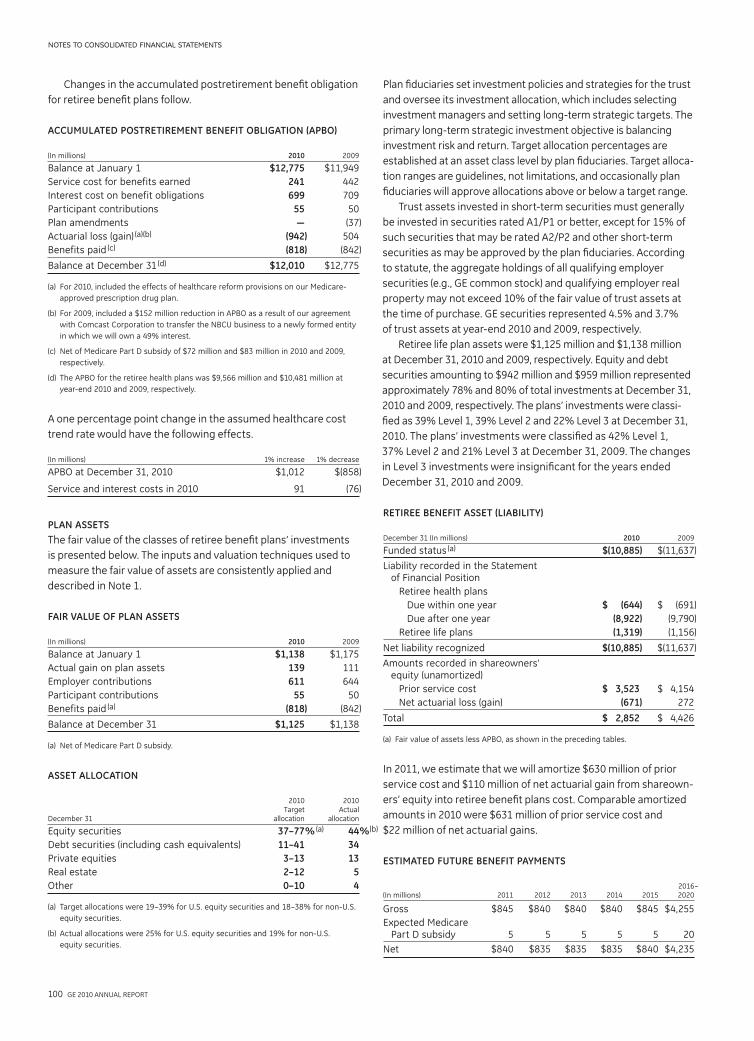
100 GE 2010 ANNUAL REPORT
notes to consolidated financial statements
Plan fiduciaries set investment policies and strategies for the trust
and oversee its investment allocation, which includes selecting
investment managers and setting long-term strategic targets. The
primary long-term strategic investment objective is balancing
investment risk and return. Target allocation percentages are
established at an asset class level by plan fiduciaries. Target alloca-
tion ranges are guidelines, not limitations, and occasionally plan
fiduciaries will approve allocations above or below a target range.
Trust assets invested in short-term securities must generally
be invested in securities rated A1/P1 or better, except for 15% of
such securities that may be rated A2/P2 and other short-term
securities as may be approved by the plan fiduciaries. According
to statute, the aggregate holdings of all qualifying employer
securities (e.g., GE common stock) and qualifying employer real
property may not exceed 10% of the fair value of trust assets at
the time of purchase. GE securities represented 4.5% and 3.7%
of trust assets at year-end 2010 and 2009, respectively.
Retiree life plan assets were $1,125 million and $1,138 million
at December 31, 2010 and 2009, respectively. Equity and debt
securities amounting to $942 million and $959 million represented
approximately 78% and 80% of total investments at December 31,
2010 and 2009, respectively. The plans’ investments were classi-
fied as 39% Level 1, 39% Level 2 and 22% Level 3 at December 31,
2010. The plans’ investments were classified as 42% Level 1,
37% Level 2 and 21% Level 3 at December 31, 2009. The changes
in Level 3 investments were insignificant for the years ended
December 31, 2010 and 2009.
RETIREE BENEFIT ASSET (LIABILITY)
December 31 (In millions) 2010 2009
Funded status (a) $(10,885) $(11,637)
Liability recorded in the Statement of Financial Position
Retiree health plans
Due within one year $ (644) $ (691)
Due after one year (8,922) (9,790)
Retiree life plans (1,319) (1,156)
Net liability recognized $(10,885) $(11,637)
Amounts recorded in shareowners’ equity (unamortized)
Prior service cost $ 3,523 $ 4,154
Net actuarial loss (gain) (671) 272
Total $ 2,852 $ 4,426
(a) Fair value of assets less APBO, as shown in the preceding tables.
In 2011, we estimate that we will amortize $630 million of prior
service cost and $110 million of net actuarial gain from shareown-
ers’ equity into retiree benefit plans cost. Comparable amortized
amounts in 2010 were $631 million of prior service cost and
$22 million of net actuarial gains.
ESTIMATED FUTURE BENEFIT PAYMENTS
2016 – (In millions) 2011 2012 2013 2014 2015 2020
Gross $845 $840 $840 $840 $845 $4,255
Expected Medicare Part D subsidy 5 5 5 5 5 20
Net $840 $835 $835 $835 $840 $4,235
Changes in the accumulated postretirement benefit obligation
for retiree benefit plans follow.
ACCUMULATED POSTRETIREMENT BENEFIT OBLIGATION (APBO)
(In millions) 2010 2009
Balance at January 1 $12,775 $11,949
Service cost for benefits earned 241 442
Interest cost on benefit obligations 699 709
Participant contributions 55 50
Plan amendments — (37)
Actuarial loss (gain) (a)(b) (942) 504
Benefits paid (c) (818) (842)
Balance at December 31 (d) $12,010 $12,775
(a) For 2010, included the effects of healthcare reform provisions on our Medicare-
approved prescription drug plan.
(b) For 2009, included a $152 million reduction in APBO as a result of our agreement
with Comcast Corporation to transfer the NBCU business to a newly formed entity
in which we will own a 49% interest.
(c) Net of Medicare Part D subsidy of $72 million and $83 million in 2010 and 2009,
respectively.
(d) The APBO for the retiree health plans was $9,566 million and $10,481 million at
year-end 2010 and 2009, respectively.
A one percentage point change in the assumed healthcare cost
trend rate would have the following effects.
(In millions) 1% increase 1% decrease
APBO at December 31, 2010 $1,012 $(858)
Service and interest costs in 2010 91 (76)
PLAN ASSETS
The fair value of the classes of retiree benefit plans’ investments
is presented below. The inputs and valuation techniques used to
measure the fair value of assets are consistently applied and
described in Note 1.
FAIR VALUE OF PLAN ASSETS
(In millions) 2010 2009
Balance at January 1 $1,138 $1,175
Actual gain on plan assets 139 111
Employer contributions 611 644
Participant contributions 55 50
Benefits paid (a) (818) (842)
Balance at December 31 $1,125 $1,138
(a) Net of Medicare Part D subsidy.
ASSET ALLOCATION
2010 2010 Target Actual December 31 allocation allocation
Equity securities 37–77 % (a) 44
Debt securities (including cash equivalents) 11–41 34
Private equities 3–13 13
Real estate 2–12 5
Other 0–10 4
(a) Target allocations were 19–39% for U.S. equity securities and 18–38% for non-U.S.
equity securities.
(b) Actual allocations were 25% for U.S. equity securities and 19% for non-U.S.
equity securities.
% (b)
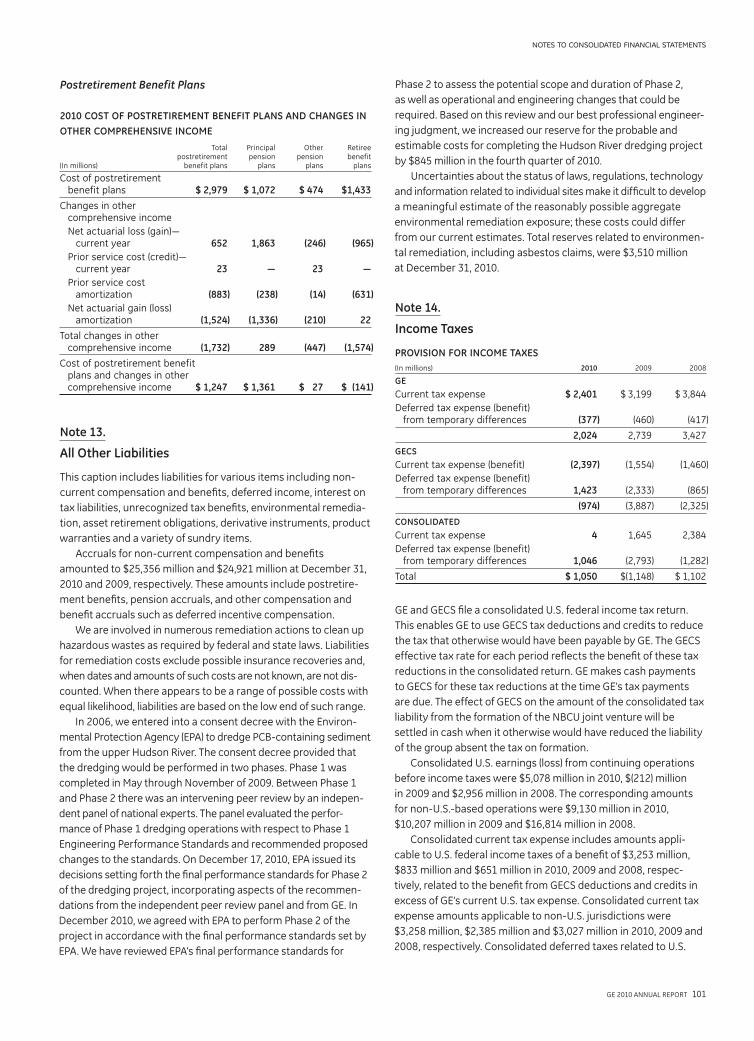
GE 2010 ANNUAL REPORT 101
notes to consolidated financial statements
Phase 2 to assess the potential scope and duration of Phase 2,
as well as operational and engineering changes that could be
required. Based on this review and our best professional engineer-
ing judgment, we increased our reserve for the probable and
estimable costs for completing the Hudson River dredging project
by $845 million in the fourth quarter of 2010.
Uncertainties about the status of laws, regulations, technology
and information related to individual sites make it difficult to develop
a meaningful estimate of the reasonably possible aggregate
environmental remediation exposure; these costs could differ
from our current estimates. Total reserves related to environmen-
tal remediation, including asbestos claims, were $3,510 million
at December 31, 2010.
Note 14.
Income Taxes
PROVISION FOR INCOME TAXES
(In millions) 2010 2009 2008
GE
Current tax expense $ 2,401 $ 3,199 $ 3,844
Deferred tax expense (benefit) from temporary differences (377) (460) (417)
2,024 2,739 3,427
GECS
Current tax expense (benefit) (2,397) (1,554) (1,460)
Deferred tax expense (benefit) from temporary differences 1,423 (2,333) (865)
(974) (3,887) (2,325)
CONSOLIDATED
Current tax expense 4 1,645 2,384
Deferred tax expense (benefit) from temporary differences 1,046 (2,793) (1,282)
Total $ 1,050 $(1,148) $ 1,102
GE and GECS file a consolidated U.S. federal income tax return.
This enables GE to use GECS tax deductions and credits to reduce
the tax that otherwise would have been payable by GE. The GECS
effective tax rate for each period reflects the benefit of these tax
reductions in the consolidated return. GE makes cash payments
to GECS for these tax reductions at the time GE’s tax payments
are due. The effect of GECS on the amount of the consolidated tax
liability from the formation of the NBCU joint venture will be
settled in cash when it otherwise would have reduced the liability
of the group absent the tax on formation.
Consolidated U.S. earnings (loss) from continuing operations
before income taxes were $5,078 million in 2010, $(212) million
in 2009 and $2,956 million in 2008. The corresponding amounts
for non-U.S.-based operations were $9,130 million in 2010,
$10,207 million in 2009 and $16,814 million in 2008.
Consolidated current tax expense includes amounts appli-
cable to U.S. federal income taxes of a benefit of $3,253 million,
$833 million and $651 million in 2010, 2009 and 2008, respec-
tively, related to the benefit from GECS deductions and credits in
excess of GE’s current U.S. tax expense. Consolidated current tax
expense amounts applicable to non-U.S. jurisdictions were
$3,258 million, $2,385 million and $3,027 million in 2010, 2009 and
2008, respectively. Consolidated deferred taxes related to U.S.
Postretirement Benefit Plans
2010 COST OF POSTRETIREMENT BENEFIT PLANS AND CHANGES IN
OTHER COMPREHENSIVE INCOME
Total Principal Other Retiree postretirement pension pension benefit (In millions) benefit plans plans plans plans
Cost of postretirement benefit plans $ 2,979 $ 1,072 $ 474 $1,433
Changes in other comprehensive income
Net actuarial loss (gain)— current year 652 1,863 (246) (965)
Prior service cost (credit)— current year 23 — 23 —
Prior service cost amortization (883) (238) (14) (631)
Net actuarial gain (loss) amortization (1,524) (1,336) (210) 22
Total changes in other comprehensive income (1,732) 289 (447) (1,574)
Cost of postretirement benefit plans and changes in other comprehensive income $ 1,247 $ 1,361 $ 27 $ (141)
Note 13.
All Other Liabilities
This caption includes liabilities for various items including non-
current compensation and benefits, deferred income, interest on
tax liabilities, unrecognized tax benefits, environmental remedia-
tion, asset retirement obligations, derivative instruments, product
warranties and a variety of sundry items.
Accruals for non-current compensation and benefits
amounted to $25,356 million and $24,921 million at December 31,
2010 and 2009, respectively. These amounts include postretire-
ment benefits, pension accruals, and other compensation and
benefit accruals such as deferred incentive compensation.
We are involved in numerous remediation actions to clean up
hazardous wastes as required by federal and state laws. Liabilities
for remediation costs exclude possible insurance recoveries and,
when dates and amounts of such costs are not known, are not dis-
counted. When there appears to be a range of possible costs with
equal likelihood, liabilities are based on the low end of such range.
In 2006, we entered into a consent decree with the Environ-
mental Protection Agency (EPA) to dredge PCB-containing sedi ment
from the upper Hudson River. The consent decree provided that
the dredging would be performed in two phases. Phase 1 was
completed in May through November of 2009. Between Phase 1
and Phase 2 there was an intervening peer review by an indepen-
dent panel of national experts. The panel evaluated the perfor-
mance of Phase 1 dredging operations with respect to Phase 1
Engineering Performance Standards and recommended proposed
changes to the standards. On December 17, 2010, EPA issued its
decisions setting forth the final performance standards for Phase 2
of the dredging project, incorporating aspects of the recommen-
dations from the independent peer review panel and from GE. In
December 2010, we agreed with EPA to perform Phase 2 of the
project in accordance with the final performance standards set by
EPA. We have reviewed EPA’s final performance standards for
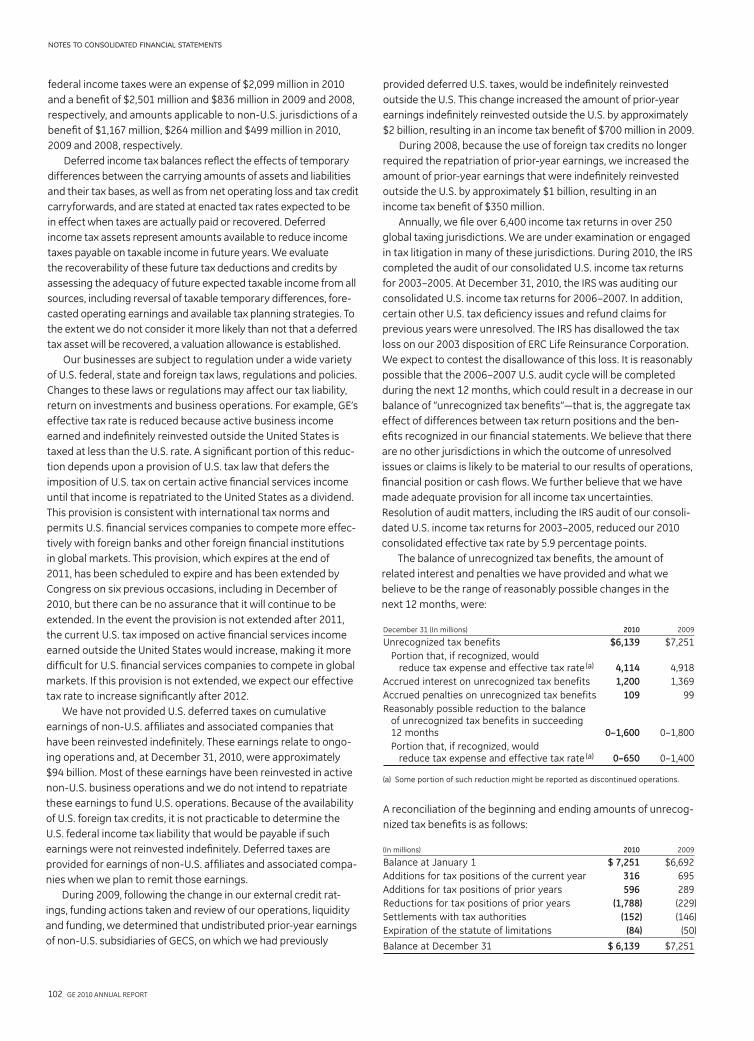
102 GE 2010 ANNUAL REPORT
notes to consolidated financial statements
provided deferred U.S. taxes, would be indefinitely reinvested
outside the U.S. This change increased the amount of prior-year
earnings indefinitely reinvested outside the U.S. by approximately
$2 billion, resulting in an income tax benefit of $700 million in 2009.
During 2008, because the use of foreign tax credits no longer
required the repatriation of prior-year earnings, we increased the
amount of prior-year earnings that were indefinitely reinvested
outside the U.S. by approximately $1 billion, resulting in an
income tax benefit of $350 million.
Annually, we file over 6,400 income tax returns in over 250
global taxing jurisdictions. We are under examination or engaged
in tax litigation in many of these jurisdictions. During 2010, the IRS
completed the audit of our consolidated U.S. income tax returns
for 2003–2005. At December 31, 2010, the IRS was auditing our
consolidated U.S. income tax returns for 2006–2007. In addition,
certain other U.S. tax deficiency issues and refund claims for
previous years were unresolved. The IRS has disallowed the tax
loss on our 2003 disposition of ERC Life Reinsurance Corporation.
We expect to contest the disallowance of this loss. It is reasonably
possible that the 2006–2007 U.S. audit cycle will be completed
during the next 12 months, which could result in a decrease in our
balance of “unrecognized tax benefits”—that is, the aggregate tax
effect of differences between tax return positions and the ben-
efits recognized in our financial statements. We believe that there
are no other jurisdictions in which the outcome of unresolved
issues or claims is likely to be material to our results of operations,
financial position or cash flows. We further believe that we have
made adequate provision for all income tax uncertainties.
Resolution of audit matters, including the IRS audit of our consoli-
dated U.S. income tax returns for 2003–2005, reduced our 2010
consolidated effective tax rate by 5.9 percentage points.
The balance of unrecognized tax benefits, the amount of
related interest and penalties we have provided and what we
believe to be the range of reasonably possible changes in the
next 12 months, were:
December 31 (In millions) 2010 2009
Unrecognized tax benefits $6,139 $7,251
Portion that, if recognized, would reduce tax expense and effective tax rate (a) 4,114 4,918
Accrued interest on unrecognized tax benefits 1,200 1,369
Accrued penalties on unrecognized tax benefits 109 99
Reasonably possible reduction to the balance of unrecognized tax benefits in succeeding 12 months 0–1,600 0–1,800
Portion that, if recognized, would reduce tax expense and effective tax rate (a) 0–650 0–1,400
(a) Some portion of such reduction might be reported as discontinued operations.
A reconciliation of the beginning and ending amounts of unrecog-
nized tax benefits is as follows:
(In millions) 2010 2009
Balance at January 1 $ 7,251 $6,692
Additions for tax positions of the current year 316 695
Additions for tax positions of prior years 596 289
Reductions for tax positions of prior years (1,788) (229)
Settlements with tax authorities (152) (146)
Expiration of the statute of limitations (84) (50)
Balance at December 31 $ 6,139 $7,251
federal income taxes were an expense of $2,099 million in 2010
and a benefit of $2,501 million and $836 million in 2009 and 2008,
respectively, and amounts applicable to non-U.S. jurisdictions of a
benefit of $1,167 million, $264 million and $499 million in 2010,
2009 and 2008, respectively.
Deferred income tax balances reflect the effects of temporary
differences between the carrying amounts of assets and liabilities
and their tax bases, as well as from net operating loss and tax credit
carryforwards, and are stated at enacted tax rates expected to be
in effect when taxes are actually paid or recovered. Deferred
income tax assets represent amounts available to reduce income
taxes payable on taxable income in future years. We evaluate
the recoverability of these future tax deductions and credits by
assessing the adequacy of future expected taxable income from all
sources, including reversal of taxable temporary differences, fore-
casted operating earnings and available tax planning strategies. To
the extent we do not consider it more likely than not that a deferred
tax asset will be recovered, a valuation allowance is established.
Our businesses are subject to regulation under a wide variety
of U.S. federal, state and foreign tax laws, regulations and policies.
Changes to these laws or regulations may affect our tax liability,
return on investments and business operations. For example, GE’s
effective tax rate is reduced because active business income
earned and indefinitely reinvested outside the United States is
taxed at less than the U.S. rate. A significant portion of this reduc-
tion depends upon a provision of U.S. tax law that defers the
imposition of U.S. tax on certain active financial services income
until that income is repatriated to the United States as a dividend.
This provision is consistent with international tax norms and
permits U.S. financial services companies to compete more effec-
tively with foreign banks and other foreign financial institutions
in global markets. This provision, which expires at the end of
2011, has been scheduled to expire and has been extended by
Congress on six previous occasions, including in December of
2010, but there can be no assurance that it will continue to be
extended. In the event the provision is not extended after 2011,
the current U.S. tax imposed on active financial services income
earned outside the United States would increase, making it more
difficult for U.S. financial services companies to compete in global
markets. If this provision is not extended, we expect our effective
tax rate to increase significantly after 2012.
We have not provided U.S. deferred taxes on cumulative
earnings of non-U.S. affiliates and associated companies that
have been reinvested indefinitely. These earnings relate to ongo-
ing operations and, at December 31, 2010, were approximately
$94 billion. Most of these earnings have been reinvested in active
non-U.S. business operations and we do not intend to repatriate
these earnings to fund U.S. operations. Because of the availability
of U.S. foreign tax credits, it is not practicable to determine the
U.S. federal income tax liability that would be payable if such
earnings were not reinvested indefinitely. Deferred taxes are
provided for earnings of non-U.S. affiliates and associated compa-
nies when we plan to remit those earnings.
During 2009, following the change in our external credit rat-
ings, funding actions taken and review of our operations, liquidity
and funding, we determined that undistributed prior-year earnings
of non-U.S. subsidiaries of GECS, on which we had previously
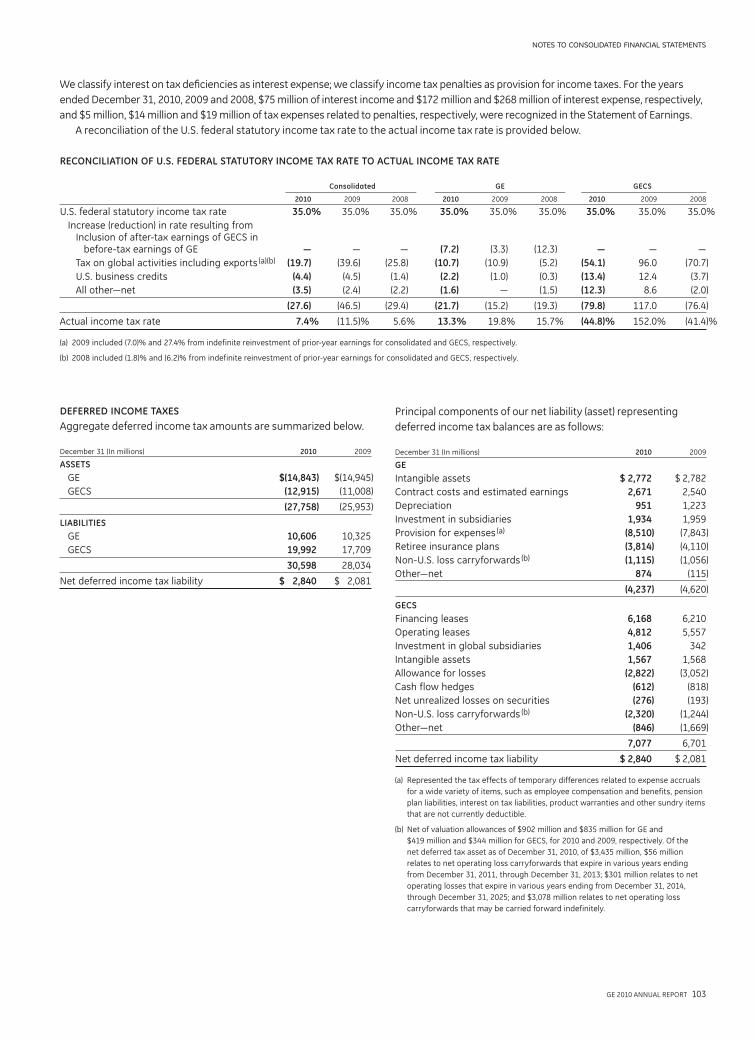
GE 2010 ANNUAL REPORT 103
notes to consolidated financial statements
Principal components of our net liability (asset) representing
deferred income tax balances are as follows:
December 31 (In millions) 2010 2009
GE
Intangible assets $ 2,772 $ 2,782
Contract costs and estimated earnings 2,671 2,540
Depreciation 951 1,223
Investment in subsidiaries 1,934 1,959
Provision for expenses (a) (8,510) (7,843)
Retiree insurance plans (3,814) (4,110)
Non-U.S. loss carryforwards (b) (1,115) (1,056)
Other—net 874 (115)
(4,237) (4,620)
GECS
Financing leases 6,168 6,210
Operating leases 4,812 5,557
Investment in global subsidiaries 1,406 342
Intangible assets 1,567 1,568
Allowance for losses (2,822) (3,052)
Cash flow hedges (612) (818)
Net unrealized losses on securities (276) (193)
Non-U.S. loss carryforwards (b) (2,320) (1,244)
Other—net (846) (1,669)
7,077 6,701
Net deferred income tax liability $ 2,840 $ 2,081
(a) Represented the tax effects of temporary differences related to expense accruals
for a wide variety of items, such as employee compensation and benefits, pension
plan liabilities, interest on tax liabilities, product warranties and other sundry items
that are not currently deductible.
(b) Net of valuation allowances of $902 million and $835 million for GE and
$419 million and $344 million for GECS, for 2010 and 2009, respectively. Of the
net deferred tax asset as of December 31, 2010, of $3,435 million, $56 million
relates to net operating loss carryforwards that expire in various years ending
from December 31, 2011, through December 31, 2013; $301 million relates to net
operating losses that expire in various years ending from December 31, 2014,
through December 31, 2025; and $3,078 million relates to net operating loss
carryforwards that may be carried forward indefinitely.
DEFERRED INCOME TAXES
Aggregate deferred income tax amounts are summarized below.
December 31 (In millions) 2010 2009
ASSETS
GE $(14,843) $(14,945)
GECS (12,915) (11,008)
(27,758) (25,953)
LIABILITIES
GE 10,606 10,325
GECS 19,992 17,709
30,598 28,034
Net deferred income tax liability $ 2,840 $ 2,081
We classify interest on tax deficiencies as interest expense; we classify income tax penalties as provision for income taxes. For the years
ended December 31, 2010, 2009 and 2008, $75 million of interest income and $172 million and $268 million of interest expense, respectively,
and $5 million, $14 million and $19 million of tax expenses related to penalties, respectively, were recognized in the Statement of Earnings.
A reconciliation of the U.S. federal statutory income tax rate to the actual income tax rate is provided below.
RECONCILIATION OF U.S. FEDERAL STATUTORY INCOME TAX RATE TO ACTUAL INCOME TAX RATE
Consolidated GE GECS
2010 2009 2008 2010 2009 2008 2010 2009 2008
U.S. federal statutory income tax rate 35.0% 35.0% 35.0% 35.0% 35.0% 35.0% 35.0% 35.0% 35.0%
Increase (reduction) in rate resulting from Inclusion of after-tax earnings of GECS in before-tax earnings of GE — — — (7.2) (3.3) (12.3) — — —
Tax on global activities including exports (a)(b) (19.7) (39.6) (25.8) (10.7) (10.9) (5.2) (54.1) 96.0 (70.7)
U.S. business credits (4.4) (4.5) (1.4) (2.2) (1.0) (0.3) (13.4) 12.4 (3.7)
All other—net (3.5) (2.4) (2.2) (1.6) — (1.5) (12.3) 8.6 (2.0)
(27.6) (46.5) (29.4) (21.7) (15.2) (19.3) (79.8) 117.0 (76.4)
Actual income tax rate 7.4% (11.5)% 5.6% 13.3% 19.8% 15.7% (44.8)% 152.0% (41.4)%
(a) 2009 included (7.0)% and 27.4% from indefinite reinvestment of prior-year earnings for consolidated and GECS, respectively.
(b) 2008 included (1.8)% and (6.2)% from indefinite reinvestment of prior-year earnings for consolidated and GECS, respectively.
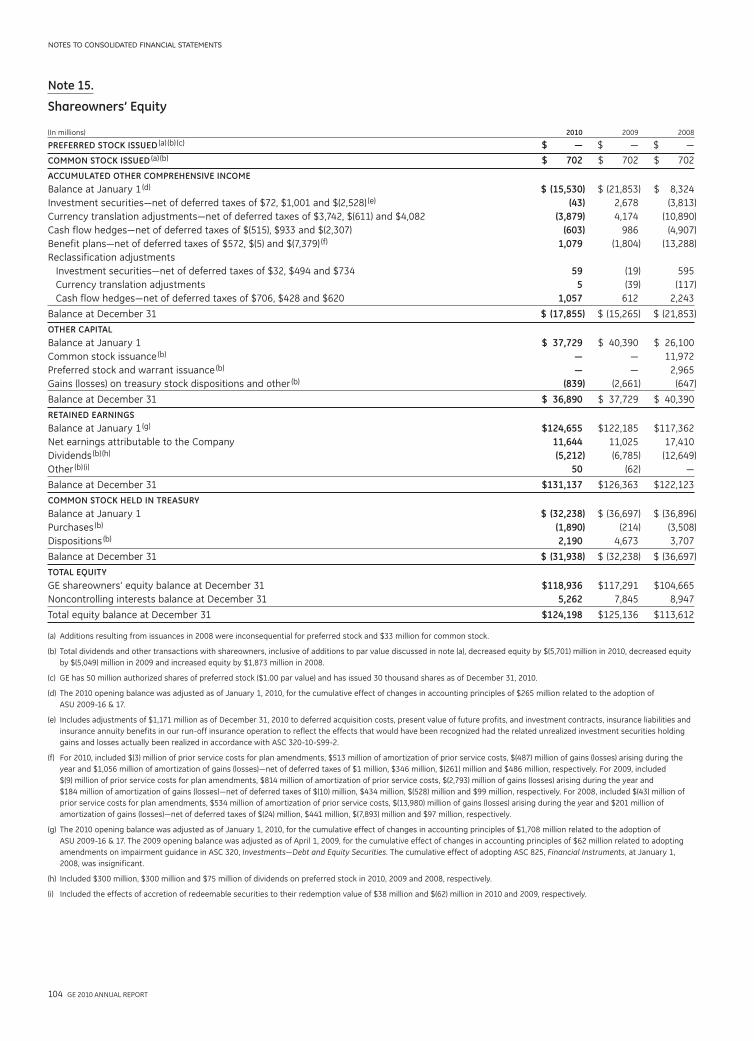
104 GE 2010 ANNUAL REPORT
notes to consolidated financial statements
Note 15.
Shareowners’ Equity
(In millions) 2010 2009 2008
PREFERRED STOCK ISSUED (a) (b) (c) $ — $ — $ —
COMMON STOCK ISSUED (a) (b) $ 702 $ 702 $ 702
ACCUMULATED OTHER COMPREHENSIVE INCOME
Balance at January 1 (d) $ (15,530) $ (21,853) $ 8,324
Investment securities—net of deferred taxes of $72, $1,001 and $(2,528) (e) (43) 2,678 (3,813)
Currency translation adjustments—net of deferred taxes of $3,742, $(611) and $4,082 (3,879) 4,174 (10,890)
Cash flow hedges—net of deferred taxes of $(515), $933 and $(2,307) (603) 986 (4,907)
Benefit plans—net of deferred taxes of $572, $(5) and $(7,379) (f) 1,079 (1,804) (13,288)
Reclassification adjustments
Investment securities—net of deferred taxes of $32, $494 and $734 59 (19) 595
Currency translation adjustments 5 (39) (117)
Cash flow hedges—net of deferred taxes of $706, $428 and $620 1,057 612 2,243
Balance at December 31 $ (17,855) $ (15,265) $ (21,853)
OTHER CAPITAL
Balance at January 1 $ 37,729 $ 40,390 $ 26,100
Common stock issuance (b) — — 11,972
Preferred stock and warrant issuance (b) — — 2,965
Gains (losses) on treasury stock dispositions and other (b) (839) (2,661) (647)
Balance at December 31 $ 36,890 $ 37,729 $ 40,390
RETAINED EARNINGS
Balance at January 1 (g) $124,655 $122,185 $117,362
Net earnings attributable to the Company 11,644 11,025 17,410
Dividends (b) (h) (5,212) (6,785) (12,649)
Other (b) (i) 50 (62) —
Balance at December 31 $131,137 $126,363 $122,123
COMMON STOCK HELD IN TREASURY
Balance at January 1 $ (32,238) $ (36,697) $ (36,896)
Purchases (b) (1,890) (214) (3,508)
Dispositions (b) 2,190 4,673 3,707
Balance at December 31 $ (31,938) $ (32,238) $ (36,697)
TOTAL EQUITY
GE shareowners’ equity balance at December 31 $118,936 $117,291 $104,665
Noncontrolling interests balance at December 31 5,262 7,845 8,947
Total equity balance at December 31 $124,198 $125,136 $113,612
(a) Additions resulting from issuances in 2008 were inconsequential for preferred stock and $33 million for common stock.
(b) Total dividends and other transactions with shareowners, inclusive of additions to par value discussed in note (a), decreased equity by $(5,701) million in 2010, decreased equity
by $(5,049) million in 2009 and increased equity by $1,873 million in 2008.
(c) GE has 50 million authorized shares of preferred stock ($1.00 par value) and has issued 30 thousand shares as of December 31, 2010.
(d) The 2010 opening balance was adjusted as of January 1, 2010, for the cumulative effect of changes in accounting principles of $265 million related to the adoption of
ASU 2009-16 & 17.
(e) Includes adjustments of $1,171 million as of December 31, 2010 to deferred acquisition costs, present value of future profits, and investment contracts, insurance liabilities and
insurance annuity benefits in our run-off insurance operation to reflect the effects that would have been recognized had the related unrealized investment securities holding
gains and losses actually been realized in accordance with ASC 320-10-S99-2.
(f) For 2010, included $(3) million of prior service costs for plan amendments, $513 million of amortization of prior service costs, $(487) million of gains (losses) arising during the
year and $1,056 million of amortization of gains (losses)—net of deferred taxes of $1 million, $346 million, $(261) million and $486 million, respectively. For 2009, included
$(9) million of prior service costs for plan amendments, $814 million of amortization of prior service costs, $(2,793) million of gains (losses) arising during the year and
$184 million of amortization of gains (losses)—net of deferred taxes of $(10) million, $434 million, $(528) million and $99 million, respectively. For 2008, included $(43) million of
prior service costs for plan amendments, $534 million of amortization of prior service costs, $(13,980) million of gains (losses) arising during the year and $201 million of
amortization of gains (losses)—net of deferred taxes of $(24) million, $441 million, $(7,893) million and $97 million, respectively.
(g) The 2010 opening balance was adjusted as of January 1, 2010, for the cumulative effect of changes in accounting principles of $1,708 million related to the adoption of
ASU 2009-16 & 17. The 2009 opening balance was adjusted as of April 1, 2009, for the cumulative effect of changes in accounting principles of $62 million related to adopting
amendments on impairment guidance in ASC 320, Investments—Debt and Equity Securities. The cumulative effect of adopting ASC 825, Financial Instruments, at January 1,
2008, was insignificant.
(h) Included $300 million, $300 million and $75 million of dividends on preferred stock in 2010, 2009 and 2008, respectively.
(i) Included the effects of accretion of redeemable securities to their redemption value of $38 million and $(62) million in 2010 and 2009, respectively.
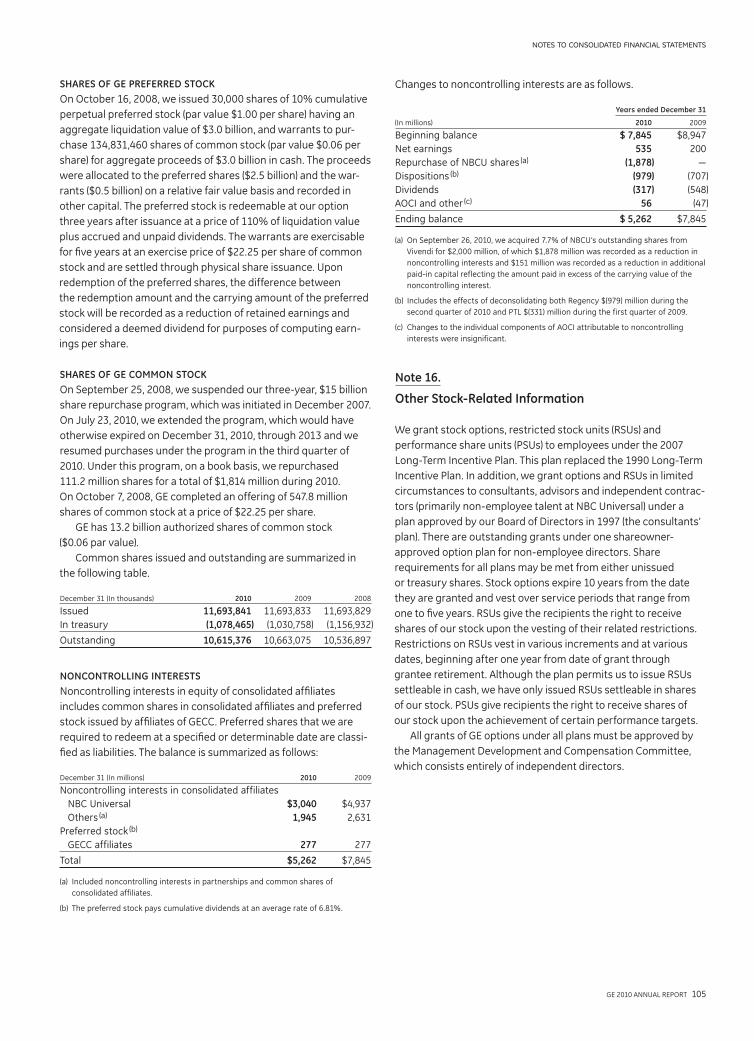
GE 2010 ANNUAL REPORT 105
notes to consolidated financial statements
SHARES OF GE PREFERRED STOCK
On October 16, 2008, we issued 30,000 shares of 10% cumulative
perpetual preferred stock (par value $1.00 per share) having an
aggregate liquidation value of $3.0 billion, and warrants to pur-
chase 134,831,460 shares of common stock (par value $0.06 per
share) for aggregate proceeds of $3.0 billion in cash. The proceeds
were allocated to the preferred shares ($2.5 billion) and the war-
rants ($0.5 billion) on a relative fair value basis and recorded in
other capital. The preferred stock is redeemable at our option
three years after issuance at a price of 110% of liquidation value
plus accrued and unpaid dividends. The warrants are exercisable
for five years at an exercise price of $22.25 per share of common
stock and are settled through physical share issuance. Upon
redemption of the preferred shares, the difference between
the redemption amount and the carrying amount of the preferred
stock will be recorded as a reduction of retained earnings and
considered a deemed dividend for purposes of computing earn-
ings per share.
SHARES OF GE COMMON STOCK
On September 25, 2008, we suspended our three-year, $15 billion
share repurchase program, which was initiated in December 2007.
On July 23, 2010, we extended the program, which would have
otherwise expired on December 31, 2010, through 2013 and we
resumed purchases under the program in the third quarter of
2010. Under this program, on a book basis, we repurchased
111.2 million shares for a total of $1,814 million during 2010.
On October 7, 2008, GE completed an offering of 547.8 million
shares of common stock at a price of $22.25 per share.
GE has 13.2 billion authorized shares of common stock
($0.06 par value).
Common shares issued and outstanding are summarized in
the following table.
December 31 (In thousands) 2010 2009 2008
Issued 11,693,841 11,693,833 11,693,829
In treasury (1,078,465) (1,030,758) (1,156,932)
Outstanding 10,615,376 10,663,075 10,536,897
NONCONTROLLING INTERESTS
Noncontrolling interests in equity of consolidated affiliates
includes common shares in consolidated affiliates and preferred
stock issued by affiliates of GECC. Preferred shares that we are
required to redeem at a specified or determinable date are classi-
fied as liabilities. The balance is summarized as follows:
December 31 (In millions) 2010 2009
Noncontrolling interests in consolidated affiliates
NBC Universal $3,040 $4,937
Others (a) 1,945 2,631
Preferred stock (b)
GECC affiliates 277 277
Total $5,262 $7,845
(a) Included noncontrolling interests in partnerships and common shares of
consolidated affiliates.
(b) The preferred stock pays cumulative dividends at an average rate of 6.81%.
Changes to noncontrolling interests are as follows.
Years ended December 31
(In millions) 2010 2009
Beginning balance $ 7,845 $8,947
Net earnings 535 200
Repurchase of NBCU shares (a) (1,878) —
Dispositions (b) (979) (707)
Dividends (317) (548)
AOCI and other (c) 56 (47)
Ending balance $ 5,262 $7,845
(a) On September 26, 2010, we acquired 7.7% of NBCU’s outstanding shares from
Vivendi for $2,000 million, of which $1,878 million was recorded as a reduction in
noncontrolling interests and $151 million was recorded as a reduction in additional
paid-in capital reflecting the amount paid in excess of the carrying value of the
noncontrolling interest.
(b) Includes the effects of deconsolidating both Regency $(979) million during the
second quarter of 2010 and PTL $(331) million during the first quarter of 2009.
(c) Changes to the individual components of AOCI attributable to noncontrolling
interests were insignificant.
Note 16.
Other Stock-Related Information
We grant stock options, restricted stock units (RSUs) and
performance share units (PSUs) to employees under the 2007
Long-Term Incentive Plan. This plan replaced the 1990 Long-Term
Incentive Plan. In addition, we grant options and RSUs in limited
circumstances to consultants, advisors and independent contrac-
tors (primarily non-employee talent at NBC Universal) under a
plan approved by our Board of Directors in 1997 (the consultants’
plan). There are outstanding grants under one shareowner-
approved option plan for non-employee directors. Share
requirements for all plans may be met from either unissued
or treasury shares. Stock options expire 10 years from the date
they are granted and vest over service periods that range from
one to five years. RSUs give the recipients the right to receive
shares of our stock upon the vesting of their related restrictions.
Restrictions on RSUs vest in various increments and at various
dates, beginning after one year from date of grant through
grantee retirement. Although the plan permits us to issue RSUs
settleable in cash, we have only issued RSUs settleable in shares
of our stock. PSUs give recipients the right to receive shares of
our stock upon the achievement of certain performance targets.
All grants of GE options under all plans must be approved by
the Management Development and Compensation Committee,
which consists entirely of independent directors.
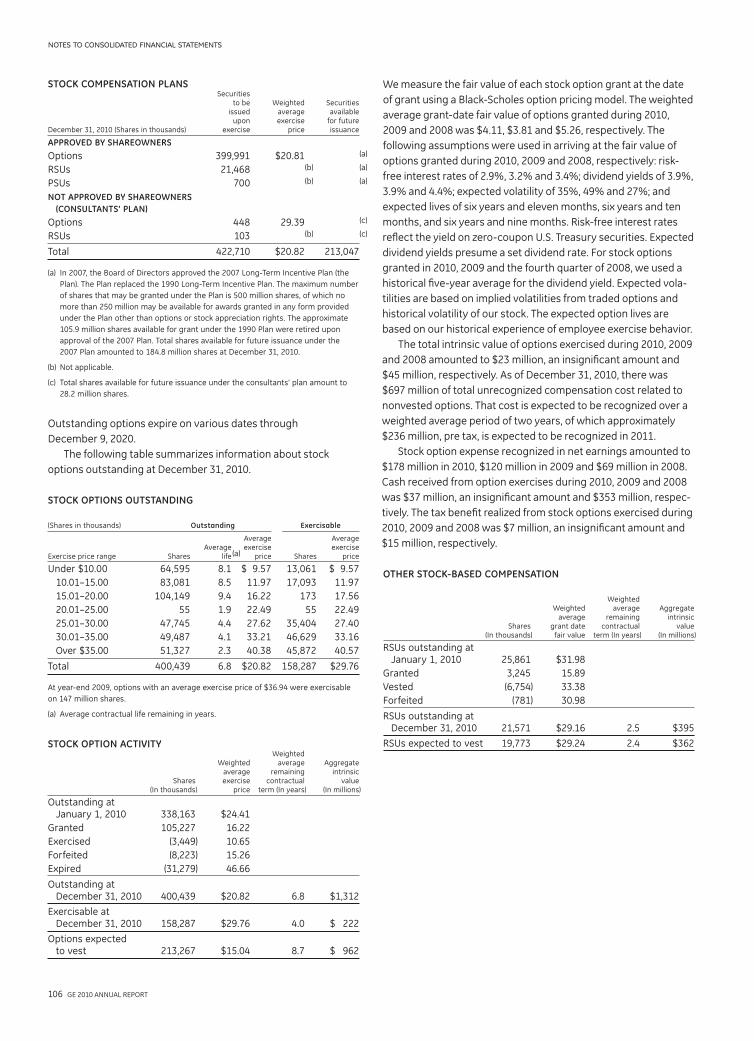
106 GE 2010 ANNUAL REPORT
notes to consolidated financial statements
We measure the fair value of each stock option grant at the date
of grant using a Black-Scholes option pricing model. The weighted
average grant-date fair value of options granted during 2010,
2009 and 2008 was $4.11, $3.81 and $5.26, respectively. The
following assumptions were used in arriving at the fair value of
options granted during 2010, 2009 and 2008, respectively: risk-
free interest rates of 2.9%, 3.2% and 3.4%; dividend yields of 3.9%,
3.9% and 4.4%; expected volatility of 35%, 49% and 27%; and
expected lives of six years and eleven months, six years and ten
months, and six years and nine months. Risk-free interest rates
reflect the yield on zero-coupon U.S. Treasury securities. Expected
dividend yields presume a set dividend rate. For stock options
granted in 2010, 2009 and the fourth quarter of 2008, we used a
historical five-year average for the dividend yield. Expected vola-
tilities are based on implied volatilities from traded options and
historical volatility of our stock. The expected option lives are
based on our historical experience of employee exercise behavior.
The total intrinsic value of options exercised during 2010, 2009
and 2008 amounted to $23 million, an insignificant amount and
$45 million, respectively. As of December 31, 2010, there was
$697 million of total unrecognized compensation cost related to
nonvested options. That cost is expected to be recognized over a
weighted average period of two years, of which approximately
$236 million, pre tax, is expected to be recognized in 2011.
Stock option expense recognized in net earnings amounted to
$178 million in 2010, $120 million in 2009 and $69 million in 2008.
Cash received from option exercises during 2010, 2009 and 2008
was $37 million, an insignificant amount and $353 million, respec-
tively. The tax benefit realized from stock options exercised during
2010, 2009 and 2008 was $7 million, an insignificant amount and
$15 million, respectively.
OTHER STOCK-BASED COMPENSATION
Weighted Weighted average Aggregate average remaining intrinsic Shares grant date contractual value (In thousands) fair value term (In years) (In millions)
RSUs outstanding at January 1, 2010 25,861 $31.98
Granted 3,245 15.89
Vested (6,754) 33.38
Forfeited (781) 30.98
RSUs outstanding at December 31, 2010 21,571 $29.16 2.5 $395
RSUs expected to vest 19,773 $29.24 2.4 $362
STOCK COMPENSATION PLANS Securities to be Weighted Securities issued average available upon exercise for future December 31, 2010 (Shares in thousands) exercise price issuance
APPROVED BY SHAREOWNERS
Options 399,991 $20.81 (a)
RSUs 21,468 (b) (a)
PSUs 700 (b) (a)
NOT APPROVED BY SHAREOWNERS
(CONSULTANTS’ PLAN)
Options 448 29.39 (c)
RSUs 103 (b) (c)
Total 422,710 $20.82 213,047
(a) In 2007, the Board of Directors approved the 2007 Long-Term Incentive Plan (the
Plan). The Plan replaced the 1990 Long-Term Incentive Plan. The maximum number
of shares that may be granted under the Plan is 500 million shares, of which no
more than 250 million may be available for awards granted in any form provided
under the Plan other than options or stock appreciation rights. The approximate
105.9 million shares available for grant under the 1990 Plan were retired upon
approval of the 2007 Plan. Total shares available for future issuance under the
2007 Plan amounted to 184.8 million shares at December 31, 2010.
(b) Not applicable.
(c) Total shares available for future issuance under the consultants’ plan amount to
28.2 million shares.
Outstanding options expire on various dates through
December 9, 2020.
The following table summarizes information about stock
options outstanding at December 31, 2010.
STOCK OPTIONS OUTSTANDING
(Shares in thousands) Outstanding Exercisable
Average Average Average exercise exercise Exercise price range Shares life (a) price Shares price
Under $10.00 64,595 8.1 $ 9.57 13,061 $ 9.57
10.01–15.00 83,081 8.5 11.97 17,093 11.97
15.01–20.00 104,149 9.4 16.22 173 17.56
20.01–25.00 55 1.9 22.49 55 22.49
25.01–30.00 47,745 4.4 27.62 35,404 27.40
30.01–35.00 49,487 4.1 33.21 46,629 33.16
Over $35.00 51,327 2.3 40.38 45,872 40.57
Total 400,439 6.8 $20.82 158,287 $29.76
At year-end 2009, options with an average exercise price of $36.94 were exercisable
on 147 million shares.
(a) Average contractual life remaining in years.
STOCK OPTION ACTIVITY Weighted Weighted average Aggregate average remaining intrinsic Shares exercise contractual value (In thousands) price term (In years) (In millions)
Outstanding at January 1, 2010 338,163 $24.41
Granted 105,227 16.22
Exercised (3,449) 10.65
Forfeited (8,223) 15.26
Expired (31,279) 46.66
Outstanding at December 31, 2010 400,439 $20.82 6.8 $1,312
Exercisable at December 31, 2010 158,287 $29.76 4.0 $ 222
Options expected to vest 213,267 $15.04 8.7 $ 962
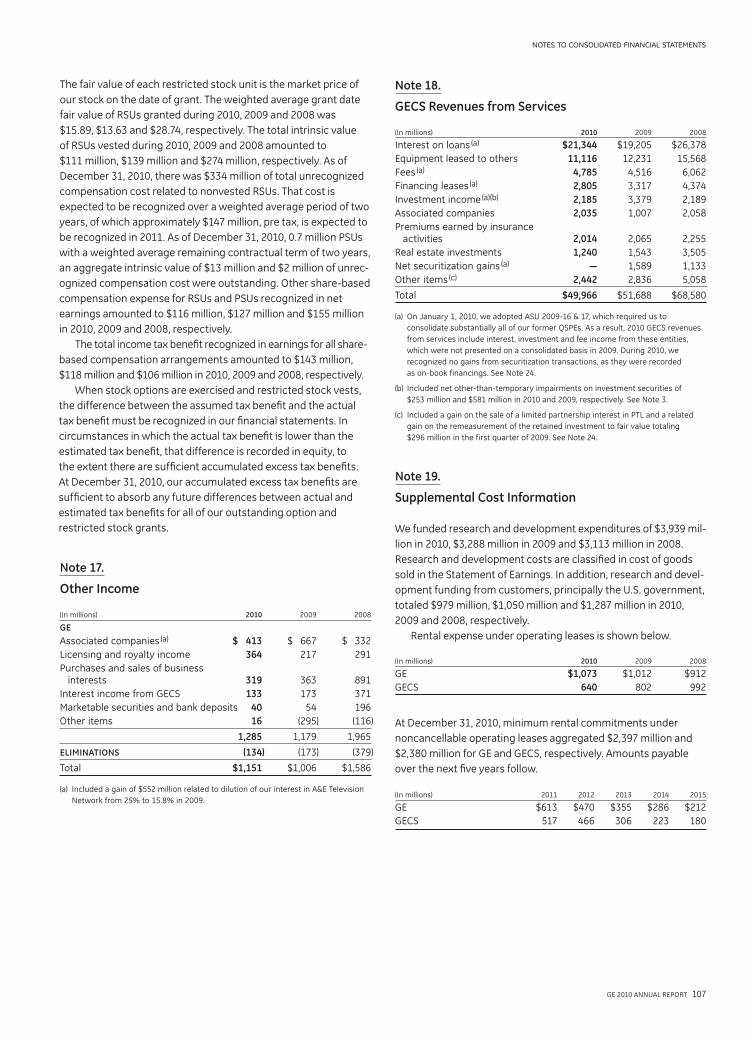
GE 2010 ANNUAL REPORT 107
notes to consolidated financial statements
Note 18.
GECS Revenues from Services
(In millions) 2010 2009 2008
Interest on loans (a) $21,344 $19,205 $26,378
Equipment leased to others 11,116 12,231 15,568
Fees (a) 4,785 4,516 6,062
Financing leases (a) 2,805 3,317 4,374
Investment income (a)(b) 2,185 3,379 2,189
Associated companies 2,035 1,007 2,058
Premiums earned by insurance activities 2,014 2,065 2,255
Real estate investments 1,240 1,543 3,505
Net securitization gains (a) — 1,589 1,133
Other items (c) 2,442 2,836 5,058
Total $49,966 $51,688 $68,580
(a) On January 1, 2010, we adopted ASU 2009-16 & 17, which required us to
consolidate substantially all of our former QSPEs. As a result, 2010 GECS revenues
from services include interest, investment and fee income from these entities,
which were not presented on a consolidated basis in 2009. During 2010, we
recognized no gains from securitization transactions, as they were recorded
as on-book financings. See Note 24.
(b) Included net other-than-temporary impairments on investment securities of
$253 million and $581 million in 2010 and 2009, respectively. See Note 3.
(c) Included a gain on the sale of a limited partnership interest in PTL and a related
gain on the remeasurement of the retained investment to fair value totaling
$296 million in the first quarter of 2009. See Note 24.
Note 19.
Supplemental Cost Information
We funded research and development expenditures of $3,939 mil-
lion in 2010, $3,288 million in 2009 and $3,113 million in 2008.
Research and development costs are classified in cost of goods
sold in the Statement of Earnings. In addition, research and devel-
opment funding from customers, principally the U.S. government,
totaled $979 million, $1,050 million and $1,287 million in 2010,
2009 and 2008, respectively.
Rental expense under operating leases is shown below.
(In millions) 2010 2009 2008
GE $1,073 $1,012 $912
GECS 640 802 992
At December 31, 2010, minimum rental commitments under
noncancellable operating leases aggregated $2,397 million and
$2,380 million for GE and GECS, respectively. Amounts payable
over the next five years follow.
(In millions) 2011 2012 2013 2014 2015
GE $613 $470 $355 $286 $212
GECS 517 466 306 223 180
The fair value of each restricted stock unit is the market price of
our stock on the date of grant. The weighted average grant date
fair value of RSUs granted during 2010, 2009 and 2008 was
$15.89, $13.63 and $28.74, respectively. The total intrinsic value
of RSUs vested during 2010, 2009 and 2008 amounted to
$111 million, $139 million and $274 million, respectively. As of
December 31, 2010, there was $334 million of total unrecognized
compensation cost related to nonvested RSUs. That cost is
expected to be recognized over a weighted average period of two
years, of which approximately $147 million, pre tax, is expected to
be recognized in 2011. As of December 31, 2010, 0.7 million PSUs
with a weighted average remaining contractual term of two years,
an aggregate intrinsic value of $13 million and $2 million of unrec-
ognized compensation cost were outstanding. Other share-based
compensation expense for RSUs and PSUs recognized in net
earnings amounted to $116 million, $127 million and $155 million
in 2010, 2009 and 2008, respectively.
The total income tax benefit recognized in earnings for all share-
based compensation arrangements amounted to $143 million,
$118 million and $106 million in 2010, 2009 and 2008, respectively.
When stock options are exercised and restricted stock vests,
the difference between the assumed tax benefit and the actual
tax benefit must be recognized in our financial statements. In
circumstances in which the actual tax benefit is lower than the
estimated tax benefit, that difference is recorded in equity, to
the extent there are sufficient accumulated excess tax benefits.
At December 31, 2010, our accumulated excess tax benefits are
sufficient to absorb any future differences between actual and
estimated tax benefits for all of our outstanding option and
restricted stock grants.
Note 17.
Other Income
(In millions) 2010 2009 2008
GE
Associated companies (a) $ 413 $ 667 $ 332
Licensing and royalty income 364 217 291
Purchases and sales of business interests 319 363 891
Interest income from GECS 133 173 371
Marketable securities and bank deposits 40 54 196
Other items 16 (295) (116)
1,285 1,179 1,965
ELIMINATIONS (134) (173) (379)
Total $1,151 $1,006 $1,586
(a) Included a gain of $552 million related to dilution of our interest in A&E Television
Network from 25% to 15.8% in 2009.

108 GE 2010 ANNUAL REPORT
notes to consolidated financial statements
Note 20.
Earnings Per Share Information
2010 2009 2008
(In millions; per-share amounts in dollars) Diluted Basic Diluted Basic Diluted Basic
AMOUNTS ATTRIBUTABLE TO THE COMPANY:
CONSOLIDATED
Earnings from continuing operations for per-share calculation (a) (b) $12,599 $12,598 $10,914 $10,913 $18,028 $18,027
Preferred stock dividends declared (300) (300) (300) (300) (75) (75)
Earnings from continuing operations attributable to common shareowners for per-share calculation (a)(b) 12,299 12,298 10,614 10,613 17,953 17,952
Earnings (loss) from discontinued operations for per-share calculation (a) (b) (975) (975) 83 82 (617) (617)
Net earnings attributable to common shareowners for per-share calculation (a) (b) $11,322 $11,322 $10,695 $10,694 $17,336 $17,335
AVERAGE EQUIVALENT SHARES
Shares of GE common stock outstanding 10,661 10,661 10,614 10,614 10,080 10,080
Employee compensation-related shares, including stock options 17 — 1 — 18 —
Total average equivalent shares 10,678 10,661 10,615 10,614 10,098 10,080
PER-SHARE AMOUNTS
Earnings from continuing operations $ 1.15 $ 1.15 $ 1.00 $ 1.00 $ 1.78 $ 1.78
Earnings (loss) from discontinued operations (0.09) (0.09) 0.01 0.01 (0.06) (0.06)
Net earnings 1.06 1.06 1.01 1.01 1.72 1.72
Effective January 1, 2009, our unvested restricted stock unit awards that contain non-forfeitable rights to dividends or dividend equivalents are considered participating securities
and, therefore, are included in the computation of earnings per share pursuant to the two-class method. Application of this treatment had an insignificant effect.
(a) Included an insignificant amount of dividend equivalents in each of the three years presented.
(b) Included an insignificant amount related to accretion of redeemable securities in 2010 and 2009.
For the years ended December 31, 2010, 2009 and 2008, there
were approximately 344 million, 328 million and 204 million,
respectively, of outstanding stock awards that were not included
in the computation of diluted earnings per share because their
effect was antidilutive.
Earnings-per-share amounts are computed independently
for earnings from continuing operations, earnings (loss) from
discontinued operations and net earnings. As a result, the sum
of per-share amounts from continuing operations and discontin-
ued operations may not equal the total per-share amounts for
net earnings.
GE’s selling, general and administrative expenses totaled
$16,341 million in 2010, $14,842 million in 2009 and $14,401 mil-
lion in 2008. The increase in 2010 is primarily due to increased
selling expenses to support global growth and higher pension
costs, partially offset by lower restructuring and other charges.
Our Technology Infrastructure and Energy Infrastructure
segments enter into collaborative arrangements with manufac-
turers and suppliers of components used to build and maintain
certain engines, aeroderivatives and turbines, under which GE
Note 21.
Fair Value Measurements
For a description of how we estimate fair value, see Note 1.
The following tables present our assets and liabilities mea-
sured at fair value on a recurring basis. Included in the tables are
investment securities of $27,141 million and $25,729 million at
December 31, 2010 and 2009, respectively, primarily supporting
obligations to annuitants and policyholders in our run-off
insurance operations, and $5,706 million and $6,629 million at
December 31, 2010 and 2009, respectively, supporting obligations
to holders of GICs in Trinity (which ceased issuing new investment
contracts beginning in the first quarter of 2010), and investment
securities held at our global banks. Such securities are mainly
investment grade.
and these participants share in risks and rewards of these prod-
uct programs. Under these arrangements, participation fees
earned and recorded as other income totaled $4 million, $1 mil-
lion and $394 million for the years 2010, 2009 and 2008,
respectively. Payments to participants are recorded as costs of
services sold ($563 million, $504 million and $423 million for the
years 2010, 2009 and 2008, respectively) or as cost of goods sold
($1,751 million, $1,731 million and $1,882 million for the years
2010, 2009 and 2008, respectively).
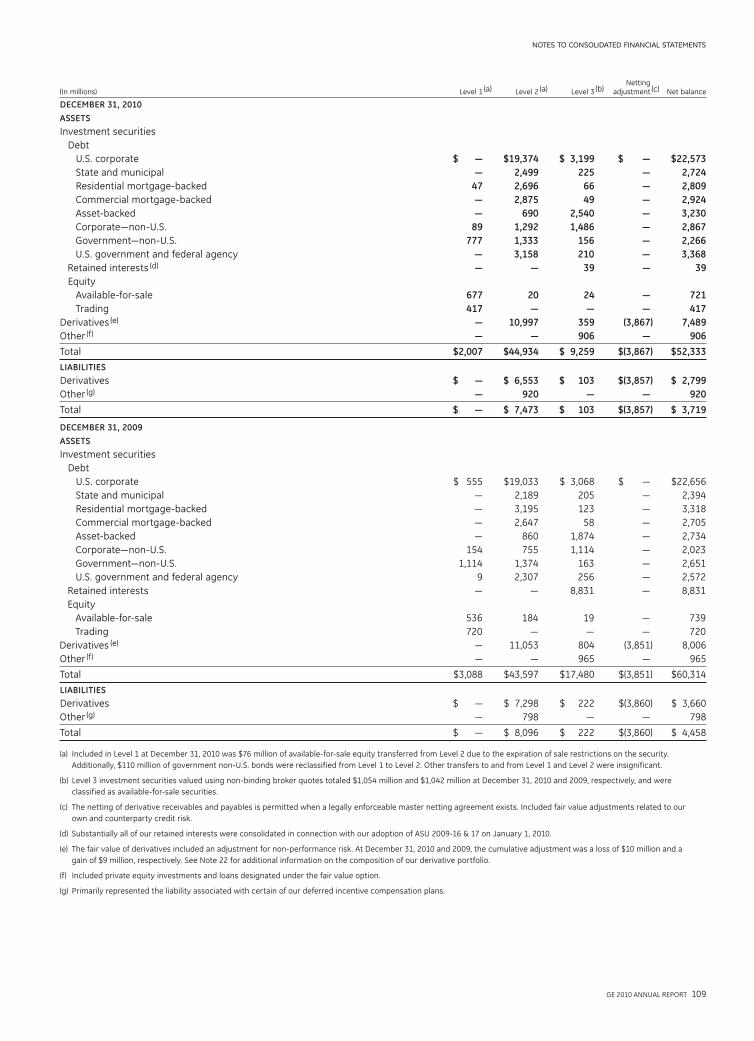
GE 2010 ANNUAL REPORT 109
notes to consolidated financial statements
Netting(In millions) Level 1 (a) Level 2 (a) Level 3 (b) adjustment (c) Net balance
DECEMBER 31, 2010
ASSETS
Investment securities
Debt
U.S. corporate $ — $19,374 $ 3,199 $ — $22,573
State and municipal — 2,499 225 — 2,724
Residential mortgage-backed 47 2,696 66 — 2,809
Commercial mortgage-backed — 2,875 49 — 2,924
Asset-backed — 690 2,540 — 3,230
Corporate—non-U.S. 89 1,292 1,486 — 2,867
Government—non-U.S. 777 1,333 156 — 2,266
U.S. government and federal agency — 3,158 210 — 3,368
Retained interests (d) — — 39 — 39
Equity
Available-for-sale 677 20 24 — 721
Trading 417 — — — 417
Derivatives (e) — 10,997 359 (3,867) 7,489
Other (f) — — 906 — 906
Total $2,007 $44,934 $ 9,259 $(3,867) $52,333
LIABILITIES
Derivatives $ — $ 6,553 $ 103 $(3,857) $ 2,799
Other (g) — 920 — — 920
Total $ — $ 7,473 $ 103 $(3,857) $ 3,719
DECEMBER 31, 2009
ASSETS
Investment securities
Debt
U.S. corporate $ 555 $19,033 $ 3,068 $ — $22,656
State and municipal — 2,189 205 — 2,394
Residential mortgage-backed — 3,195 123 — 3,318
Commercial mortgage-backed — 2,647 58 — 2,705
Asset-backed — 860 1,874 — 2,734
Corporate—non-U.S. 154 755 1,114 — 2,023
Government—non-U.S. 1,114 1,374 163 — 2,651
U.S. government and federal agency 9 2,307 256 — 2,572
Retained interests — — 8,831 — 8,831
Equity
Available-for-sale 536 184 19 — 739
Trading 720 — — — 720
Derivatives (e) — 11,053 804 (3,851) 8,006
Other (f) — — 965 — 965
Total $3,088 $43,597 $17,480 $(3,851) $60,314
LIABILITIES
Derivatives $ — $ 7,298 $ 222 $(3,860) $ 3,660
Other (g) — 798 — — 798
Total $ — $ 8,096 $ 222 $(3,860) $ 4,458
(a) Included in Level 1 at December 31, 2010 was $76 million of available-for-sale equity transferred from Level 2 due to the expiration of sale restrictions on the security.
Additionally, $110 million of government non-U.S. bonds were reclassified from Level 1 to Level 2. Other transfers to and from Level 1 and Level 2 were insignificant.
(b) Level 3 investment securities valued using non-binding broker quotes totaled $1,054 million and $1,042 million at December 31, 2010 and 2009, respectively, and were
classified as available-for-sale securities.
(c) The netting of derivative receivables and payables is permitted when a legally enforceable master netting agreement exists. Included fair value adjustments related to our
own and counterparty credit risk.
(d) Substantially all of our retained interests were consolidated in connection with our adoption of ASU 2009-16 & 17 on January 1, 2010.
(e) The fair value of derivatives included an adjustment for non-performance risk. At December 31, 2010 and 2009, the cumulative adjustment was a loss of $10 million and a
gain of $9 million, respectively. See Note 22 for additional information on the composition of our derivative portfolio.
(f) Included private equity investments and loans designated under the fair value option.
(g) Primarily represented the liability associated with certain of our deferred incentive compensation plans.
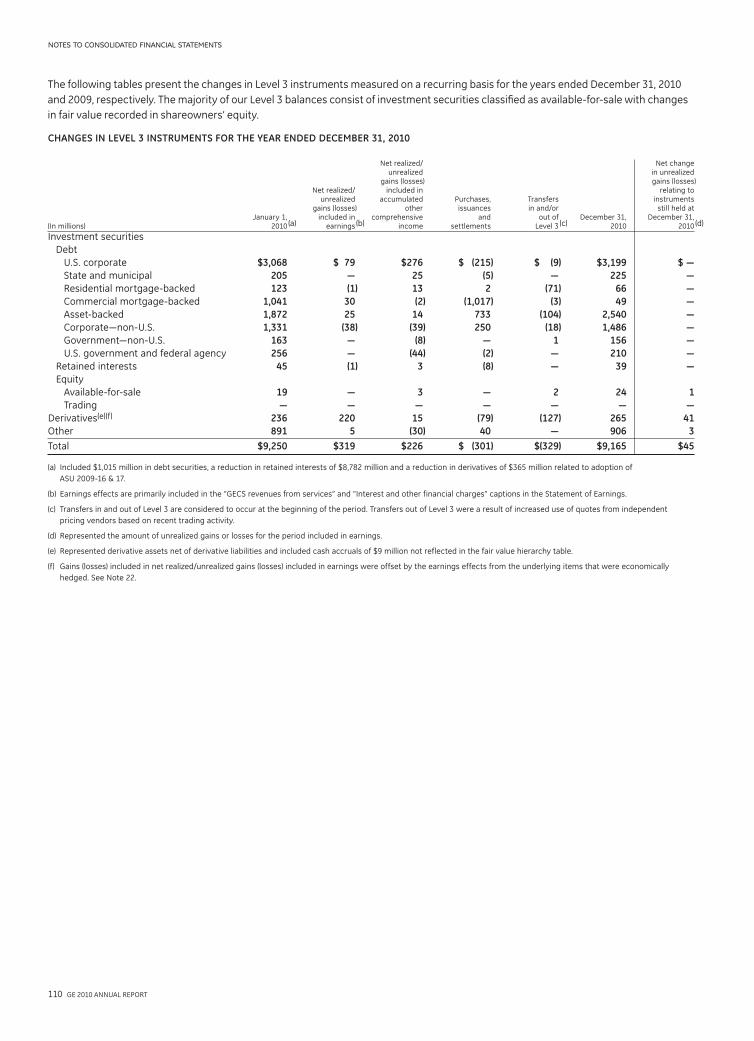
110 GE 2010 ANNUAL REPORT
notes to consolidated financial statements
The following tables present the changes in Level 3 instruments measured on a recurring basis for the years ended December 31, 2010
and 2009, respectively. The majority of our Level 3 balances consist of investment securities classified as available-for-sale with changes
in fair value recorded in shareowners’ equity.
CHANGES IN LEVEL 3 INSTRUMENTS FOR THE YEAR ENDED DECEMBER 31, 2010
Net realized/ Net change unrealized in unrealized gains (losses) gains (losses) Net realized/ included in relating to unrealized accumulated Purchases, Transfers instruments gains (losses) other issuances in and/or still held at January 1, included in comprehensive and out of December 31, December 31, (In millions) 2010 (a) earnings (b) income settlements Level 3 (c) 2010 2010 (d)
Investment securities
Debt
U.S. corporate $3,068 $ 79 $276 $ (215) $ (9) $3,199 $ —
State and municipal 205 — 25 (5) — 225 —
Residential mortgage-backed 123 (1) 13 2 (71) 66 —
Commercial mortgage-backed 1,041 30 (2) (1,017) (3) 49 —
Asset-backed 1,872 25 14 733 (104) 2,540 —
Corporate—non-U.S. 1,331 (38) (39) 250 (18) 1,486 —
Government—non-U.S. 163 — (8) — 1 156 —
U.S. government and federal agency 256 — (44) (2) — 210 —
Retained interests 45 (1) 3 (8) — 39 —
Equity
Available-for-sale 19 — 3 — 2 24 1
Trading — — — — — — —
Derivatives(e)(f) 236 220 15 (79) (127) 265 41
Other 891 5 (30) 40 — 906 3
Total $9,250 $319 $226 $ (301) $(329) $9,165 $45
(a) Included $1,015 million in debt securities, a reduction in retained interests of $8,782 million and a reduction in derivatives of $365 million related to adoption of
ASU 2009-16 & 17.
(b) Earnings effects are primarily included in the “GECS revenues from services” and “Interest and other financial charges” captions in the Statement of Earnings.
(c) Transfers in and out of Level 3 are considered to occur at the beginning of the period. Transfers out of Level 3 were a result of increased use of quotes from independent
pricing vendors based on recent trading activity.
(d) Represented the amount of unrealized gains or losses for the period included in earnings.
(e) Represented derivative assets net of derivative liabilities and included cash accruals of $9 million not reflected in the fair value hierarchy table.
(f) Gains (losses) included in net realized/unrealized gains (losses) included in earnings were offset by the earnings effects from the underlying items that were economically
hedged. See Note 22.

GE 2010 ANNUAL REPORT 111
notes to consolidated financial statements
CHANGES IN LEVEL 3 INSTRUMENTS FOR THE YEAR ENDED DECEMBER 31, 2009
Net realized/ Net change unrealized in unrealized gains (losses) gains (losses) Net realized/ included in relating to unrealized accumulated Purchases, Transfers instruments gains (losses) other issuances in and/or still held at January 1, included in comprehensive and out of December 31, December 31, (In millions) 2009 earnings (a) income settlements Level 3 (b) 2009 2009 (c)
Investment securities
Debt
U.S. corporate $ 3,114 $ (108) $ 360 $(304) $ 6 $ 3,068 $ 4
State and municipal 252 — (101) 18 36 205 —
Residential mortgage-backed 173 (1) (6) (20) (23) 123 —
Commercial mortgage-backed 70 — (5) (8) 1 58 —
Asset-backed 1,601 3 246 98 (74) 1,874 —
Corporate—non-U.S. 790 — 108 44 172 1,114 —
Government—non-U.S. 424 — 10 (10) (261) 163 —
U.S. government and federal agency 153 — 103 — — 256 —
Retained interests 6,356 1,273 (d) 382 820 — 8,831 252
Equity
Available-for-sale 23 (1) 3 (1) (5) 19 —
Trading — — — — — — —
Derivatives (e) 1,003 80 (29) (294) (159) 601 90
Other 1,105 (171) 30 (6) 7 965 (134)
Total $15,064 $1,075 $1,101 $ 337 $(300) $17,277 $ 212
(a) Earnings effects are primarily included in the “GECS revenues from services” and “Interest and other financial charges” captions in the Statement of Earnings.
(b) Transfers in and out of Level 3 are considered to occur at the beginning of the period. Transfers out of Level 3 were a result of increased use of quotes from independent pricing
vendors based on recent trading activity.
(c) Represented the amount of unrealized gains or losses for the period included in earnings.
(d) Primarily comprised of interest accretion.
(e) Represented derivative assets net of derivative liabilities and included cash accruals of $19 million not reflected in the fair value hierarchy table.
The following table represents the fair value adjustments to
assets measured at fair value on a non-recurring basis and still
held at December 31, 2010 and 2009.
Year ended December 31
(In millions) 2010 2009
Financing receivables and loans held for sale $(1,745) $(1,683)
Cost and equity method investments (a) (274) (921)
Long-lived assets, including real estate (b) (2,958) (1,107)
Retained investments in formerly consolidated subsidiaries 184 237
Total $(4,793) $(3,474)
(a) Includes fair value adjustments associated with private equity and real estate
funds of $(198) million and $(238) million during 2010 and 2009, respectively.
(b) Includes $2,089 million of impairments related to real estate equity properties and
investments recorded in other costs and expenses during 2010.
Non-Recurring Fair Value MeasurementsThe following table represents non-recurring fair value amounts
(as measured at the time of the adjustment) for those assets
remeasured to fair value on a non-recurring basis during the fiscal
year and still held at December 31, 2010 and 2009. These assets
can include loans and long-lived assets that have been reduced to
fair value when they are held for sale, impaired loans that have
been reduced based on the fair value of the underlying collateral,
cost and equity method investments and long-lived assets that
are written down to fair value when they are impaired and the
remeasurement of retained investments in formerly consolidated
subsidiaries upon a change in control that results in deconsolida-
tion of a subsidiary, if we sell a controlling interest and retain a
noncontrolling stake in the entity. Assets that are written down to
fair value when impaired and retained investments are not subse-
quently adjusted to fair value unless further impairment occurs.
Remeasured during the year ended December 31
2010 2009
(In millions) Level 2 Level 3 Level 2 Level 3
Financing receivables and loans held for sale $ 54 $ 6,833 $ 81 $ 5,352
Cost and equity method investments(a) — 510 — 1,006
Long-lived assets, including real estate 1,025 5,811 435 5,074
Retained investments in formerly consolidated subsidiaries(b) — 113 — 5,903
Total $1,079 $13,267 $516 $17,335
(a) Includes the fair value of private equity and real estate funds included in Level 3
of $296 million and $409 million at December 31, 2010 and 2009, respectively.
(b) During 2010, our retained investment in Regency, a formerly consolidated
subsidiary, was remeasured to a Level 1 fair value of $549 million.
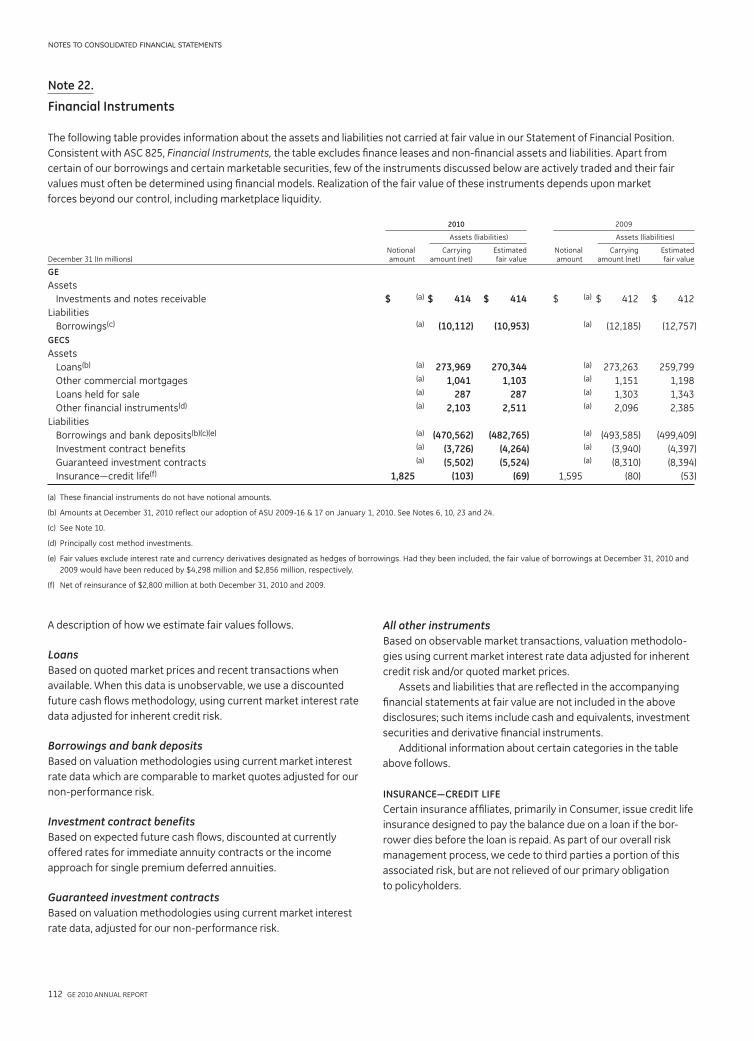
112 GE 2010 ANNUAL REPORT
notes to consolidated financial statements
Note 22.
Financial Instruments
The following table provides information about the assets and liabilities not carried at fair value in our Statement of Financial Position.
Consistent with ASC 825, Financial Instruments, the table excludes finance leases and non-financial assets and liabilities. Apart from
certain of our borrowings and certain marketable securities, few of the instruments discussed below are actively traded and their fair
values must often be determined using financial models. Realization of the fair value of these instruments depends upon market
forces beyond our control, including marketplace liquidity.
2010 2009
Assets (liabilities) Assets (liabilities)
Notional Carrying Estimated Notional Carrying Estimated December 31 (In millions) amount amount (net) fair value amount amount (net) fair value
GE
Assets
Investments and notes receivable $ (a) $ 414 $ 414 $ (a) $ 412 $ 412
Liabilities
Borrowings(c) (a) (10,112) (10,953) (a) (12,185) (12,757)
GECS
Assets
Loans(b) (a) 273,969 270,344 (a) 273,263 259,799
Other commercial mortgages (a) 1,041 1,103 (a) 1,151 1,198
Loans held for sale (a) 287 287 (a) 1,303 1,343
Other financial instruments(d) (a) 2,103 2,511 (a) 2,096 2,385
Liabilities
Borrowings and bank deposits(b)(c)(e) (a) (470,562) (482,765) (a) (493,585) (499,409)
Investment contract benefits (a) (3,726) (4,264) (a) (3,940) (4,397)
Guaranteed investment contracts (a) (5,502) (5,524) (a) (8,310) (8,394)
Insurance—credit life(f) 1,825 (103) (69) 1,595 (80) (53)
(a) These financial instruments do not have notional amounts.
(b) Amounts at December 31, 2010 reflect our adoption of ASU 2009-16 & 17 on January 1, 2010. See Notes 6, 10, 23 and 24.
(c) See Note 10.
(d) Principally cost method investments.
(e) Fair values exclude interest rate and currency derivatives designated as hedges of borrowings. Had they been included, the fair value of borrowings at December 31, 2010 and
2009 would have been reduced by $4,298 million and $2,856 million, respectively.
(f) Net of reinsurance of $2,800 million at both December 31, 2010 and 2009.
All other instrumentsBased on observable market transactions, valuation methodolo-
gies using current market interest rate data adjusted for inherent
credit risk and/or quoted market prices.
Assets and liabilities that are reflected in the accompanying
financial statements at fair value are not included in the above
disclosures; such items include cash and equivalents, investment
securities and derivative financial instruments.
Additional information about certain categories in the table
above follows.
INSURANCE—CREDIT LIFE
Certain insurance affiliates, primarily in Consumer, issue credit life
insurance designed to pay the balance due on a loan if the bor-
rower dies before the loan is repaid. As part of our overall risk
management process, we cede to third parties a portion of this
associated risk, but are not relieved of our primary obligation
to policyholders.
A description of how we estimate fair values follows.
LoansBased on quoted market prices and recent transactions when
available. When this data is unobservable, we use a discounted
future cash flows methodology, using current market interest rate
data adjusted for inherent credit risk.
Borrowings and bank depositsBased on valuation methodologies using current market interest
rate data which are comparable to market quotes adjusted for our
non-performance risk.
Investment contract benefitsBased on expected future cash flows, discounted at currently
offered rates for immediate annuity contracts or the income
approach for single premium deferred annuities.
Guaranteed investment contractsBased on valuation methodologies using current market interest
rate data, adjusted for our non-performance risk.

GE 2010 ANNUAL REPORT 113
notes to consolidated financial statements
The following table provides information about the fair value
of our derivatives, by contract type, separating those accounted
for as hedges and those that are not.
2010 2009
Fair value Fair value
December 31 (In millions) Assets Liabilities Assets Liabilities
DERIVATIVES ACCOUNTED
FOR AS HEDGES
Interest rate contracts $ 5,959 $ 2,675 $ 4,477 $ 3,469
Currency exchange contracts 2,965 2,533 4,273 2,361
Other contracts 5 — 16 4
8,929 5,208 8,766 5,834
DERIVATIVES NOT ACCOUNTED
FOR AS HEDGES
Interest rate contracts 294 552 974 892
Currency exchange contracts 1,602 846 1,639 658
Other contracts 531 50 478 136
2,427 1,448 3,091 1,686
NETTING ADJUSTMENTS (a) (3,867) (3,857) (3,851) (3,860)
Total $ 7,489 $ 2,799 $ 8,006 $ 3,660
Derivatives are classified in the captions “All other assets” and “All other liabilities” in
our financial statements.
(a) The netting of derivative receivables and payables is permitted when a legally
enforceable master netting agreement exists. Amounts included fair value
adjustments related to our own and counterparty non-performance risk. At
December 31, 2010 and 2009, the cumulative adjustment for non-performance
risk was a loss of $10 million and a gain of $9 million, respectively.
FAIR VALUE HEDGES
We use interest rate and currency exchange derivatives to hedge
the fair value effects of interest rate and currency exchange rate
changes on local and non-functional currency denominated
fixed-rate debt. For relationships designated as fair value hedges,
changes in fair value of the derivatives are recorded in earnings
within interest and other financial charges, along with offsetting
adjustments to the carrying amount of the hedged debt. The
following table provides information about the earnings effects
of our fair value hedging relationships for the years ended
December 31, 2010 and 2009.
2010 2009
Gain (loss) Gain (loss) Gain (loss) Gain (loss) Year ended on hedging on hedged on hedging on hedged December 31 (In millions) derivatives items derivatives items
Interest rate contracts $2,387 $(2,924) $(5,194) $4,998
Currency exchange contracts 47 (60) (1,106) 1,093
Fair value hedges resulted in $(550) million and $(209) million of ineffectiveness in
2010 and 2009, respectively. In 2010 and 2009, there were insignificant amounts and
$(225) million excluded from the assessment of effectiveness, respectively.
CASH FLOW HEDGES
We use interest rate, currency exchange and commodity deriva-
tives to reduce the variability of expected future cash flows
associated with variable rate borrowings and commercial pur-
chase and sale transactions, including commodities. For
derivatives that are designated in a cash flow hedging relation-
ship, the effective portion of the change in fair value of the
derivative is reported as a component of AOCI and reclassified
LOAN COMMITMENTS
Notional amount
December 31 (In millions) 2010 2009
Ordinary course of business lending commitments (a)(b) $ 4,507 $ 6,676
Unused revolving credit lines (c)
Commercial (d) 23,779 31,760
Consumer—principally credit cards 227,006 229,386
(a) Excluded investment commitments of $1,990 million and $2,659 million as of
December 31, 2010 and 2009, respectively.
(b) Included a $972 million commitment as of December 31, 2009, associated with
a secured financing arrangement that could have increased to a maximum of
$4,998 million based on the asset volume under the arrangement. This
commitment was terminated during the third quarter of 2010.
(c) Excluded inventory financing arrangements, which may be withdrawn at our
option, of $11,840 million and $13,889 million as of December 31, 2010 and
2009, respectively.
(d) Included commitments of $16,243 million and $17,643 million as of December 31,
2010 and 2009, respectively, associated with secured financing arrangements that
could have increased to a maximum of $20,268 million and $23,992 million at
December 31, 2010 and 2009, respectively, based on asset volume under the
arrangement.
Derivatives and hedgingAs a matter of policy, we use derivatives for risk management
purposes, and we do not use derivatives for speculative purposes.
A key risk management objective for our financial services busi-
nesses is to mitigate interest rate and currency risk by seeking to
ensure that the characteristics of the debt match the assets they
are funding. If the form (fixed versus floating) and currency
denomination of the debt we issue do not match the related
assets, we typically execute derivatives to adjust the nature and
tenor of funding to meet this objective. The determination of
whether we enter into a derivative transaction or issue debt
directly to achieve this objective depends on a number of
factors, including market related factors that affect the type
of debt we can issue.
The notional amounts of derivative contracts represent the
basis upon which interest and other payments are calculated and
are reported gross, except for offsetting foreign currency forward
contracts that are executed in order to manage our currency risk
of net investment in foreign subsidiaries. Of the outstanding
notional amount of $347,000 million, approximately 86% or
$300,000 million, is associated with reducing or eliminating the
interest rate, currency or market risk between financial assets
and liabilities in our financial services businesses. The remaining
derivative activities primarily relate to hedging against adverse
changes in currency exchange rates and commodity prices
related to anticipated sales and purchases and contracts contain-
ing certain clauses which meet the accounting definition of a
derivative. The instruments used in these activities are desig-
nated as hedges when practicable. When we are not able to apply
hedge accounting, or when the derivative and the hedged item
are both recorded in earnings currently, the derivatives are
deemed economic hedges and hedge accounting is not applied.
This most frequently occurs when we hedge a recognized foreign
currency transaction (e.g., a receivable or payable) with a deriva-
tive. Since the effects of changes in exchange rates are reflected
currently in earnings for both the derivative and the transaction,
the economic hedge does not require hedge accounting.

114 GE 2010 ANNUAL REPORT
notes to consolidated financial statements
The amounts related to the change in the fair value of the forward
points that are excluded from the measure of effectiveness were
$(906) million and $(899) million for the years ended December 31,
2010 and 2009, respectively, and are recorded in interest and
other financial charges.
FREE-STANDING DERIVATIVES
Changes in the fair value of derivatives that are not designated as
hedges are recorded in earnings each period. As discussed above,
these derivatives are typically entered into as economic hedges of
changes in interest rates, currency exchange rates, commodity
prices and other risks. Gains or losses related to the derivative are
typically recorded in GECS revenues from services or other
income, based on our accounting policy. In general, the earnings
effects of the item that represent the economic risk exposure are
recorded in the same caption as the derivative. Losses for the
year ended December 31, 2010 on derivatives not designated as
hedges were $(302) million comprised of amounts related to
interest rate contracts of $185 million, currency exchange con-
tracts of $(666) million, and other derivatives of $179 million.
These losses were more than offset by the earnings effects from
the underlying items that were economically hedged. Gains for
the year ended December 31, 2009 on derivatives not designated
as hedges, without considering the offsetting earnings effects
from the item representing the economic risk exposure, were
$1,021 million comprised of amounts related to interest rate
contracts of $211 million, currency exchange contracts of
$499 million, and other derivatives of $311 million.
COUNTERPARTY CREDIT RISK
Fair values of our derivatives can change significantly from period
to period based on, among other factors, market movements and
changes in our positions. Accordingly, we actively monitor these
exposures and take appropriate actions in response. We manage
counterparty credit risk (the risk that counterparties will default
and not make payments to us according to the terms of our
standard master agreements) on an individual counterparty basis.
Where we have agreed to netting of derivative exposures with a
counterparty, we offset our exposures with that counterparty and
apply the value of collateral posted to us to determine the expo-
sure. When net exposure to a counterparty, based on the current
market values of agreements and collateral, exceeds credit expo-
sure limits (see following table), we typically take action to reduce
such exposures. These actions may include prohibiting additional
transactions with the counterparty, requiring additional collateral
from the counterparty (as described below) and terminating or
restructuring transactions.
As discussed above, we have provisions in certain of our
master agreements that require counterparties to post collateral
(typically, cash or U.S. Treasuries) when our receivable due from
the counterparty, measured at current market value, exceeds a
specified limit. At December 31, 2010, our exposure to counter-
parties, including interest due, net of collateral we hold, was
$1,232 million. The fair value of such collateral was $7,689 million,
of which $2,112 million was cash and $5,577 million was in the
into earnings contemporaneously and in the same caption with
the earnings effects of the hedged transaction.
The following table provides information about the amounts
recorded in AOCI, as well as the gain (loss) recorded in earnings,
primarily in interest and other financial charges, when reclassified
out of AOCI, for the years ended December 31, 2010 and 2009.
Gain (loss) recognized Gain (loss) reclassified from
Year ended in AOCI AOCI into earnings
December 31 (In millions) 2010 2009 2010 2009
CASH FLOW HEDGES
Interest rate contracts $ (571) $ (854) $(1,356) $(2,047)
Currency exchange contracts (550) 2,579 (445) 972
Commodity contracts 10 (5) 2 (5)
Total $(1,111) $1,720 $(1,799) $(1,080)
The total pre-tax amount in AOCI related to cash flow hedges of forecasted
transactions was $1,941 million at December 31, 2010. We expect to transfer
$(1,004) million to earnings as an expense in the next 12 months contemporaneously
with the earnings effects of the related forecasted transactions. In 2010, we
recognized insignificant gains and losses related to hedged forecasted transactions
and firm commitments that did not occur by the end of the originally specified period.
At December 31, 2010 and 2009, the maximum term of derivative instruments that
hedge forecasted transactions was 25 years and 26 years, respectively, and related to
hedges of anticipated interest payments associated with external debt.
For cash flow hedges, the amount of ineffectiveness in the hedg-
ing relationship and amount of the changes in fair value of the
derivatives that are not included in the measurement of ineffec-
tiveness are both reflected in earnings each reporting period.
These amounts are primarily reported in GECS revenues from
services and totaled $19 million and $49 million for the years
ended December 31, 2010 and 2009, respectively, of which
$(18) million represents amounts excluded from the assessment
of effectiveness for the year ended December 31, 2009.
Net investment hedges in foreign operationsWe use currency exchange derivatives to protect our net invest-
ments in global operations conducted in non-U.S. dollar
currencies. For derivatives that are designated as hedges of net
investment in a foreign operation, we assess effectiveness based
on changes in spot currency exchange rates. Changes in spot
rates on the derivative are recorded as a component of AOCI until
such time as the foreign entity is substantially liquidated or sold.
The change in fair value of the forward points, which reflects the
interest rate differential between the two countries on the deriva-
tive, is excluded from the effectiveness assessment.
The following table provides information about the amounts
recorded in AOCI for the years ended December 31, 2010 and
2009, as well as the gain (loss) recorded in GECS revenues from
services when reclassified out of AOCI.
Gain (loss) recognized Gain (loss) reclassified
Year ended in CTA from CTA
December 31 (In millions) 2010 2009 2010 2009
NET INVESTMENT HEDGES
Currency exchange contracts $(2,023) $(6,240) $(38) $(84)
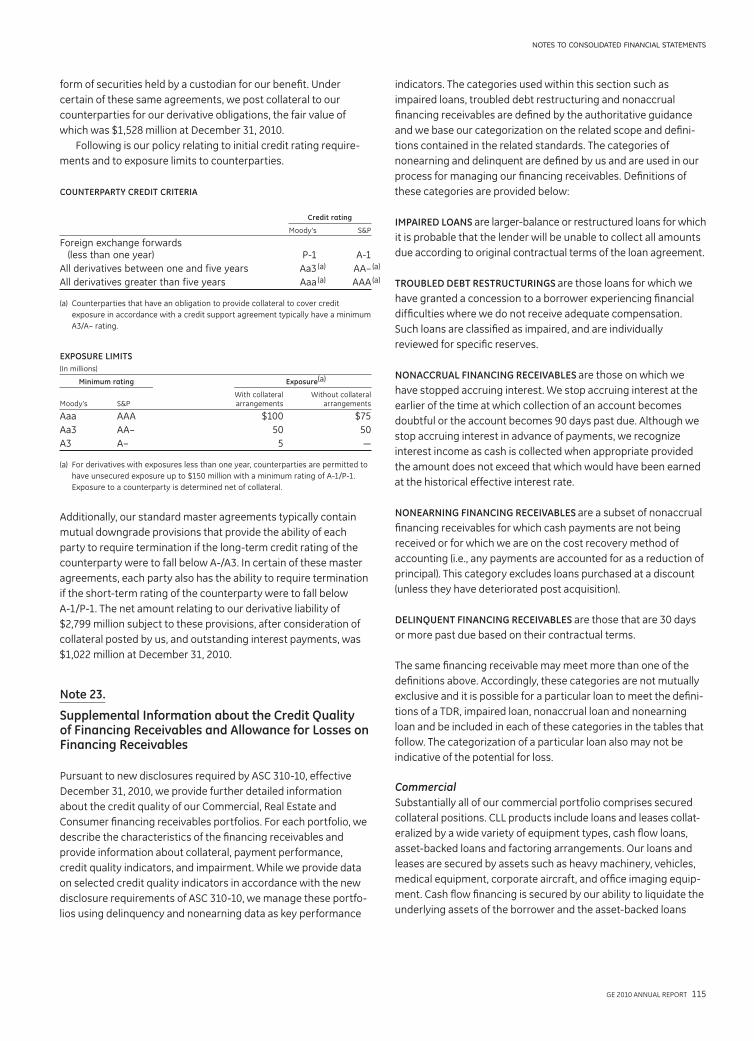
GE 2010 ANNUAL REPORT 115
notes to consolidated financial statements
indicators. The categories used within this section such as
impaired loans, troubled debt restructuring and nonaccrual
financing receivables are defined by the authoritative guidance
and we base our categorization on the related scope and defini-
tions contained in the related standards. The categories of
nonearning and delinquent are defined by us and are used in our
process for managing our financing receivables. Definitions of
these categories are provided below:
IMPAIRED LOANS are larger-balance or restructured loans for which
it is probable that the lender will be unable to collect all amounts
due according to original contractual terms of the loan agreement.
TROUBLED DEBT RESTRUCTURINGS are those loans for which we
have granted a concession to a borrower experiencing financial
difficulties where we do not receive adequate compensation.
Such loans are classified as impaired, and are individually
reviewed for specific reserves.
NONACCRUAL FINANCING RECEIVABLES are those on which we
have stopped accruing interest. We stop accruing interest at the
earlier of the time at which collection of an account becomes
doubtful or the account becomes 90 days past due. Although we
stop accruing interest in advance of payments, we recognize
interest income as cash is collected when appropriate provided
the amount does not exceed that which would have been earned
at the historical effective interest rate.
NONEARNING FINANCING RECEIVABLES are a subset of nonaccrual
financing receivables for which cash payments are not being
received or for which we are on the cost recovery method of
accounting (i.e., any payments are accounted for as a reduction of
principal). This category excludes loans purchased at a discount
(unless they have deteriorated post acquisition).
DELINQUENT FINANCING RECEIVABLES are those that are 30 days
or more past due based on their contractual terms.
The same financing receivable may meet more than one of the
definitions above. Accordingly, these categories are not mutually
exclusive and it is possible for a particular loan to meet the defini-
tions of a TDR, impaired loan, nonaccrual loan and nonearning
loan and be included in each of these categories in the tables that
follow. The categorization of a particular loan also may not be
indicative of the potential for loss.
CommercialSubstantially all of our commercial portfolio comprises secured
collateral positions. CLL products include loans and leases collat-
eralized by a wide variety of equipment types, cash flow loans,
asset-backed loans and factoring arrangements. Our loans and
leases are secured by assets such as heavy machinery, vehicles,
medical equipment, corporate aircraft, and office imaging equip-
ment. Cash flow financing is secured by our ability to liquidate the
underlying assets of the borrower and the asset-backed loans
form of securities held by a custodian for our benefit. Under
certain of these same agreements, we post collateral to our
counterparties for our derivative obligations, the fair value of
which was $1,528 million at December 31, 2010.
Following is our policy relating to initial credit rating require-
ments and to exposure limits to counterparties.
COUNTERPARTY CREDIT CRITERIA
Credit rating
Moody’s S&P
Foreign exchange forwards (less than one year) P-1 A-1
All derivatives between one and five years Aa3 (a) AA– (a)
All derivatives greater than five years Aaa (a) AAA (a)
(a) Counterparties that have an obligation to provide collateral to cover credit
exposure in accordance with a credit support agreement typically have a minimum
A3/A – rating.
EXPOSURE LIMITS
(In millions)
Minimum rating Exposure(a)
With collateral Without collateral Moody’s S&P arrangements arrangements
Aaa AAA $100 $75
Aa3 AA – 50 50
A3 A – 5 —
(a) For derivatives with exposures less than one year, counterparties are permitted to
have unsecured exposure up to $150 million with a minimum rating of A-1/P-1.
Exposure to a counterparty is determined net of collateral.
Additionally, our standard master agreements typically contain
mutual downgrade provisions that provide the ability of each
party to require termination if the long-term credit rating of the
counterparty were to fall below A-/A3. In certain of these master
agreements, each party also has the ability to require termination
if the short-term rating of the counterparty were to fall below
A-1/P-1. The net amount relating to our derivative liability of
$2,799 million subject to these provisions, after consideration of
collateral posted by us, and outstanding interest payments, was
$1,022 million at December 31, 2010.
Note 23.
Supplemental Information about the Credit Quality of Financing Receivables and Allowance for Losses on Financing Receivables
Pursuant to new disclosures required by ASC 310-10, effective
December 31, 2010, we provide further detailed information
about the credit quality of our Commercial, Real Estate and
Consumer financing receivables portfolios. For each portfolio, we
describe the characteristics of the financing receivables and
provide information about collateral, payment performance,
credit quality indicators, and impairment. While we provide data
on selected credit quality indicators in accordance with the new
disclosure requirements of ASC 310-10, we manage these portfo-
lios using delinquency and nonearning data as key performance
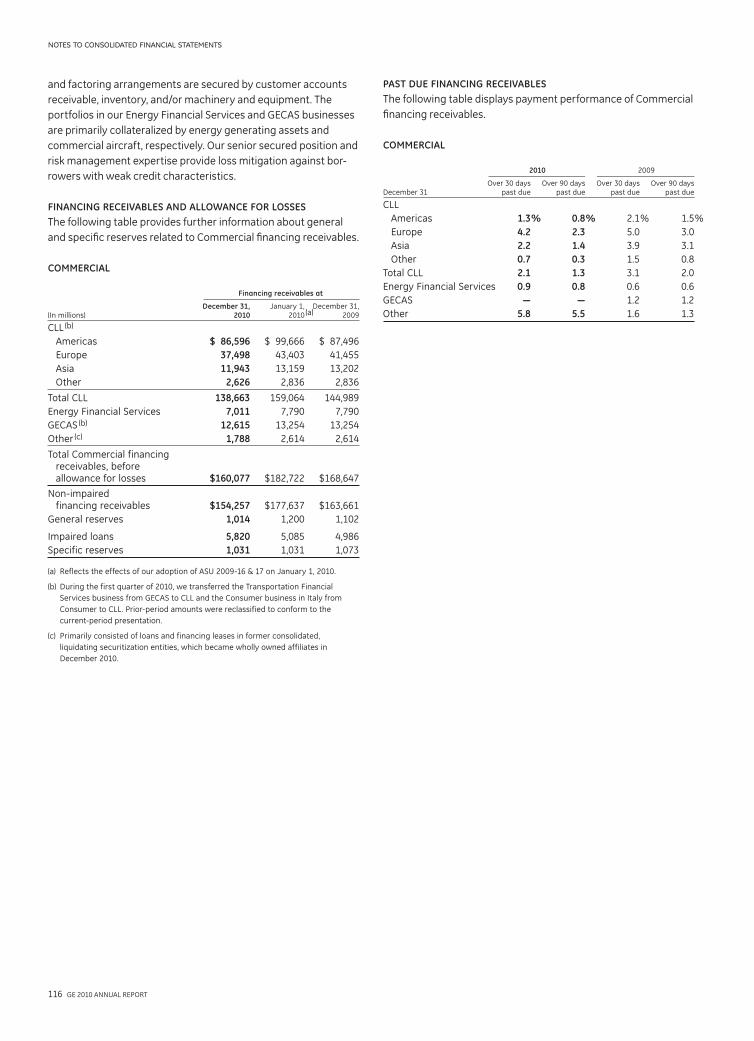
116 GE 2010 ANNUAL REPORT
notes to consolidated financial statements
PAST DUE FINANCING RECEIVABLES
The following table displays payment performance of Commercial
financing receivables.
COMMERCIAL
2010 2009
Over 30 days Over 90 days Over 30 days Over 90 days December 31 past due past due past due past due
CLL
Americas 1.3 % 0.8 % 2.1 % 1.5 %
Europe 4.2 2.3 5.0 3.0
Asia 2.2 1.4 3.9 3.1
Other 0.7 0.3 1.5 0.8
Total CLL 2.1 1.3 3.1 2.0
Energy Financial Services 0.9 0.8 0.6 0.6
GECAS — — 1.2 1.2
Other 5.8 5.5 1.6 1.3
and factoring arrangements are secured by customer accounts
receivable, inventory, and/or machinery and equipment. The
portfolios in our Energy Financial Services and GECAS businesses
are primarily collateralized by energy generating assets and
commercial aircraft, respectively. Our senior secured position and
risk management expertise provide loss mitigation against bor-
rowers with weak credit characteristics.
FINANCING RECEIVABLES AND ALLOWANCE FOR LOSSES
The following table provides further information about general
and specific reserves related to Commercial financing receivables.
COMMERCIAL
Financing receivables at
December 31, January 1, December 31,(In millions) 2010 2010 (a) 2009
CLL (b)
Americas $ 86,596 $ 99,666 $ 87,496
Europe 37,498 43,403 41,455
Asia 11,943 13,159 13,202
Other 2,626 2,836 2,836
Total CLL 138,663 159,064 144,989
Energy Financial Services 7,011 7,790 7,790
GECAS (b) 12,615 13,254 13,254
Other (c) 1,788 2,614 2,614
Total Commercial financing receivables, before allowance for losses $160,077 $182,722 $168,647
Non-impaired financing receivables $154,257 $177,637 $163,661
General reserves 1,014 1,200 1,102
Impaired loans 5,820 5,085 4,986
Specific reserves 1,031 1,031 1,073
(a) Reflects the effects of our adoption of ASU 2009-16 & 17 on January 1, 2010.
(b) During the first quarter of 2010, we transferred the Transportation Financial
Services business from GECAS to CLL and the Consumer business in Italy from
Consumer to CLL. Prior-period amounts were reclassified to conform to the
current-period presentation.
(c) Primarily consisted of loans and financing leases in former consolidated,
liquidating securitization entities, which became wholly owned affiliates in
December 2010.
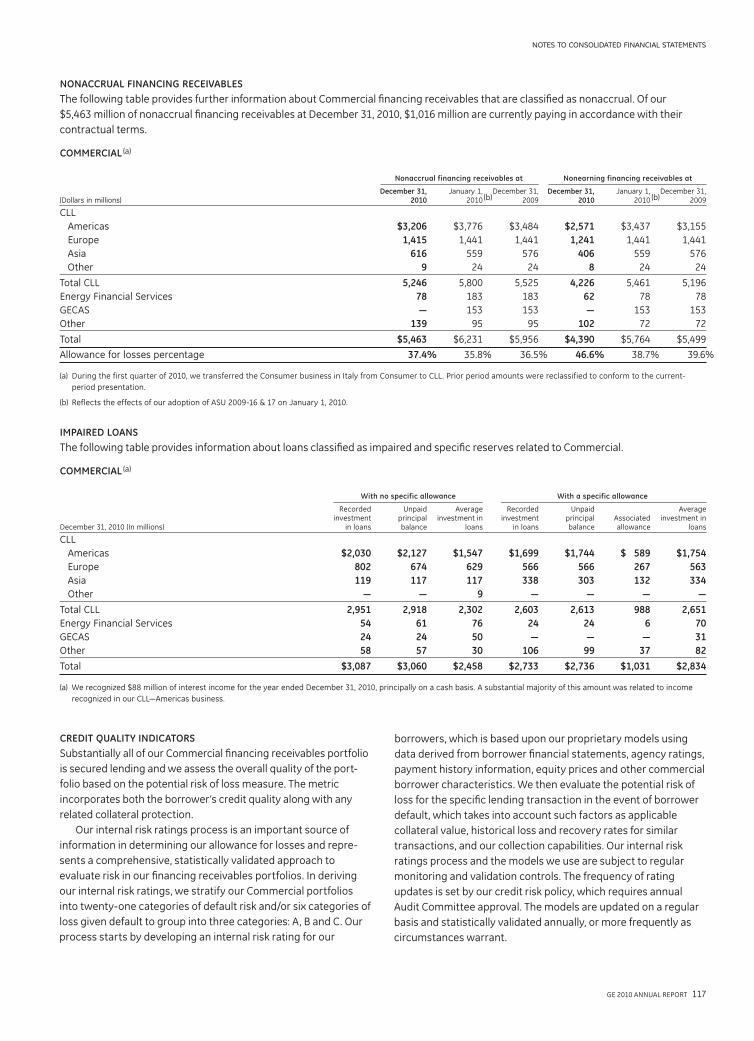
GE 2010 ANNUAL REPORT 117
notes to consolidated financial statements
NONACCRUAL FINANCING RECEIVABLES
The following table provides further information about Commercial financing receivables that are classified as nonaccrual. Of our
$5,463 million of nonaccrual financing receivables at December 31, 2010, $1,016 million are currently paying in accordance with their
contractual terms.
COMMERCIAL (a)
Nonaccrual financing receivables at Nonearning financing receivables at
December 31, January 1, December 31, December 31, January 1, December 31,(Dollars in millions) 2010 2010 (b) 2009 2010 2010 (b) 2009
CLL
Americas $3,206 $3,776 $3,484 $2,571 $3,437 $3,155
Europe 1,415 1,441 1,441 1,241 1,441 1,441
Asia 616 559 576 406 559 576
Other 9 24 24 8 24 24
Total CLL 5,246 5,800 5,525 4,226 5,461 5,196
Energy Financial Services 78 183 183 62 78 78
GECAS — 153 153 — 153 153
Other 139 95 95 102 72 72
Total $5,463 $6,231 $5,956 $4,390 $5,764 $5,499
Allowance for losses percentage 37.4% 35.8% 36.5% 46.6% 38.7% 39.6%
(a) During the first quarter of 2010, we transferred the Consumer business in Italy from Consumer to CLL. Prior period amounts were reclassified to conform to the current-
period presentation.
(b) Reflects the effects of our adoption of ASU 2009-16 & 17 on January 1, 2010.
IMPAIRED LOANS
The following table provides information about loans classified as impaired and specific reserves related to Commercial.
COMMERCIAL (a)
With no specific allowance With a specific allowance
Recorded Unpaid Average Recorded Unpaid Average investment principal investment in investment principal Associated investment in December 31, 2010 (In millions) in loans balance loans in loans balance allowance loans
CLL
Americas $2,030 $2,127 $1,547 $1,699 $1,744 $ 589 $1,754
Europe 802 674 629 566 566 267 563
Asia 119 117 117 338 303 132 334
Other — — 9 — — — —
Total CLL 2,951 2,918 2,302 2,603 2,613 988 2,651
Energy Financial Services 54 61 76 24 24 6 70
GECAS 24 24 50 — — — 31
Other 58 57 30 106 99 37 82
Total $3,087 $3,060 $2,458 $2,733 $2,736 $1,031 $2,834
(a) We recognized $88 million of interest income for the year ended December 31, 2010, principally on a cash basis. A substantial majority of this amount was related to income
recognized in our CLL—Americas business.
CREDIT QUALITY INDICATORS
Substantially all of our Commercial financing receivables portfolio
is secured lending and we assess the overall quality of the port-
folio based on the potential risk of loss measure. The metric
incorporates both the borrower’s credit quality along with any
related collateral protection.
Our internal risk ratings process is an important source of
information in determining our allowance for losses and repre-
sents a comprehensive, statistically validated approach to
evaluate risk in our financing receivables portfolios. In deriving
our internal risk ratings, we stratify our Commercial portfolios
into twenty-one categories of default risk and/or six categories of
loss given default to group into three categories: A, B and C. Our
process starts by developing an internal risk rating for our
borrowers, which is based upon our proprietary models using
data derived from borrower financial statements, agency ratings,
payment history information, equity prices and other commercial
borrower characteristics. We then evaluate the potential risk of
loss for the specific lending transaction in the event of borrower
default, which takes into account such factors as applicable
collateral value, historical loss and recovery rates for similar
transactions, and our collection capabilities. Our internal risk
ratings process and the models we use are subject to regular
monitoring and validation controls. The frequency of rating
updates is set by our credit risk policy, which requires annual
Audit Committee approval. The models are updated on a regular
basis and statistically validated annually, or more frequently as
circumstances warrant.
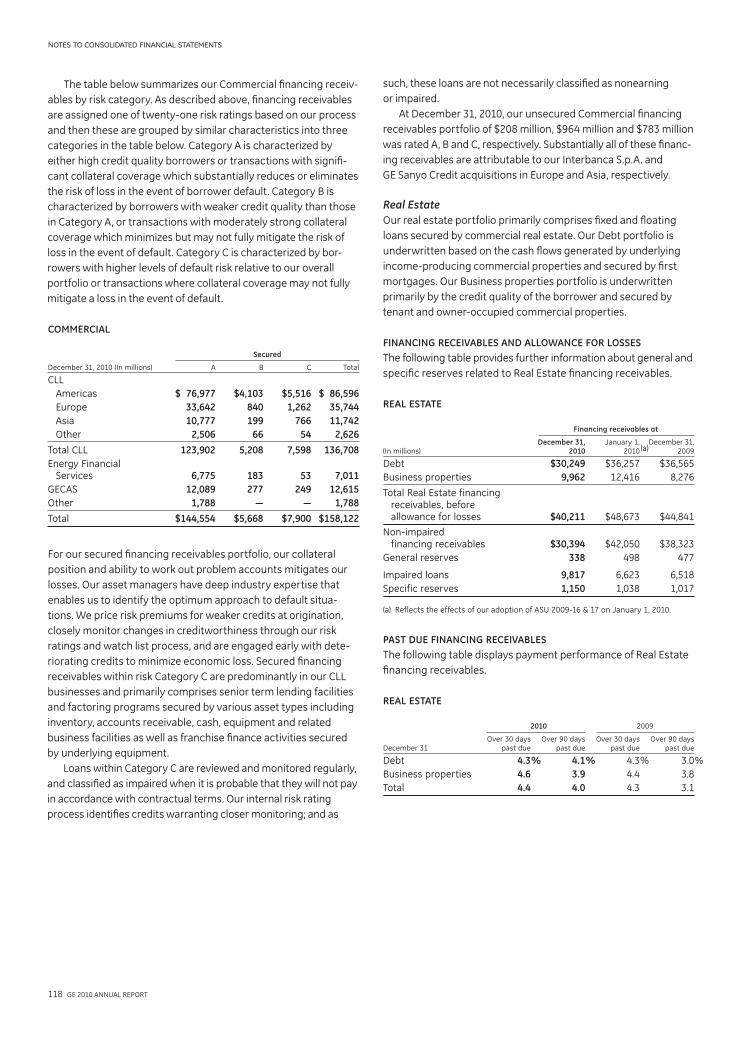
118 GE 2010 ANNUAL REPORT
notes to consolidated financial statements
such, these loans are not necessarily classified as nonearning
or impaired.
At December 31, 2010, our unsecured Commercial financing
receivables portfolio of $208 million, $964 million and $783 million
was rated A, B and C, respectively. Substantially all of these financ-
ing receivables are attributable to our Interbanca S.p.A. and
GE Sanyo Credit acquisitions in Europe and Asia, respectively.
Real EstateOur real estate portfolio primarily comprises fixed and floating
loans secured by commercial real estate. Our Debt portfolio is
underwritten based on the cash flows generated by underlying
income-producing commercial properties and secured by first
mortgages. Our Business properties portfolio is underwritten
primarily by the credit quality of the borrower and secured by
tenant and owner-occupied commercial properties.
FINANCING RECEIVABLES AND ALLOWANCE FOR LOSSES
The following table provides further information about general and
specific reserves related to Real Estate financing receivables.
REAL ESTATE
Financing receivables at
December 31, January 1, December 31,(In millions) 2010 2010 (a) 2009
Debt $30,249 $36,257 $36,565
Business properties 9,962 12,416 8,276
Total Real Estate financing receivables, before allowance for losses $40,211 $48,673 $44,841
Non-impaired financing receivables $30,394 $42,050 $38,323
General reserves 338 498 477
Impaired loans 9,817 6,623 6,518
Specific reserves 1,150 1,038 1,017
(a) Reflects the effects of our adoption of ASU 2009-16 & 17 on January 1, 2010.
PAST DUE FINANCING RECEIVABLES
The following table displays payment performance of Real Estate
financing receivables.
REAL ESTATE
2010 2009
Over 30 days Over 90 days Over 30 days Over 90 days December 31 past due past due past due past due
Debt 4.3 % 4.1 % 4.3 % 3.0 %
Business properties 4.6 3.9 4.4 3.8
Total 4.4 4.0 4.3 3.1
The table below summarizes our Commercial financing receiv-
ables by risk category. As described above, financing receivables
are assigned one of twenty-one risk ratings based on our process
and then these are grouped by similar characteristics into three
categories in the table below. Category A is characterized by
either high credit quality borrowers or transactions with signifi-
cant collateral coverage which substantially reduces or eliminates
the risk of loss in the event of borrower default. Category B is
characterized by borrowers with weaker credit quality than those
in Category A, or transactions with moderately strong collateral
coverage which minimizes but may not fully mitigate the risk of
loss in the event of default. Category C is characterized by bor-
rowers with higher levels of default risk relative to our overall
portfolio or transactions where collateral coverage may not fully
mitigate a loss in the event of default.
COMMERCIAL
Secured
December 31, 2010 (In millions) A B C Total
CLL
Americas $ 76,977 $4,103 $5,516 $ 86,596
Europe 33,642 840 1,262 35,744
Asia 10,777 199 766 11,742
Other 2,506 66 54 2,626
Total CLL 123,902 5,208 7,598 136,708
Energy Financial Services 6,775 183 53 7,011
GECAS 12,089 277 249 12,615
Other 1,788 — — 1,788
Total $144,554 $5,668 $7,900 $158,122
For our secured financing receivables portfolio, our collateral
position and ability to work out problem accounts mitigates our
losses. Our asset managers have deep industry expertise that
enables us to identify the optimum approach to default situa-
tions. We price risk premiums for weaker credits at origination,
closely monitor changes in creditworthiness through our risk
ratings and watch list process, and are engaged early with dete-
riorating credits to minimize economic loss. Secured financing
receivables within risk Category C are predominantly in our CLL
businesses and primarily comprises senior term lending facilities
and factoring programs secured by various asset types including
inventory, accounts receivable, cash, equipment and related
business facilities as well as franchise finance activities secured
by underlying equipment.
Loans within Category C are reviewed and monitored regularly,
and classified as impaired when it is probable that they will not pay
in accordance with contractual terms. Our internal risk rating
process identifies credits warranting closer monitoring; and as

GE 2010 ANNUAL REPORT 119
notes to consolidated financial statements
with loan-to-value ratios greater than 95% are paying in accor-
dance with contractual terms. Substantially all of these loans and
substantially all of the Real Estate—Business properties financing
receivables included in Category C are impaired loans which are
subject to the specific reserve evaluation process described in
Note 1. The ultimate recoverability of impaired loans is driven by
collection strategies that do not necessarily depend on the sale of
the underlying collateral and include full or partial repayments
through third-party refinancing and restructurings.
ConsumerOur Consumer portfolio is largely non-U.S. and primarily comprises
residential mortgage, sales finance, and auto and personal loans in
various European and Asian countries. At December 31, 2010, our
U.S. consumer financing receivables included private-label credit
card and sales financing for over 51 million customers across the
U.S. with no metropolitan area accounting for more than 6% of the
portfolio. Of the total U.S. consumer financing receivables, approxi-
mately 63% relate to credit card loans, which are often subject to
profit and loss sharing arrangements with the retailer (which are
recorded in revenues), and the remaining 37% are sales finance
receivables, which provide financing to customers in areas such
as electronics, recreation, medical and home improvement.
CREDIT QUALITY INDICATORS
Due to the primarily non-recourse nature of our Debt portfolio,
loan-to-value ratios provide the best indicators of the credit
quality of the portfolio. By contrast, the credit quality of the
Business properties portfolio is primarily influenced by the
strength of the borrower’s general credit quality, which is
reflected in our internal risk rating process, consistent with the
process we use for our Commercial portfolio.
Loan-to-value ratio
Less than 80% to Greater than December 31, 2010 (In millions) 80% 95% 95%
Debt $12,362 $9,392 $8,495
Internal risk rating
December 31, 2010 (In millions) A B C
Business properties $ 8,746 $ 437 $ 779
Within Real Estate, these financing receivables are primarily
concentrated in our North American and European Lending
platforms and are secured by various property types. Collateral
values for Real Estate—Debt financing receivables are updated at
least semi-annually, or more frequently for higher risk loans. A
substantial majority of the Real Estate—Debt financing receivables
NONACCRUAL FINANCING RECEIVABLES
The following table provides further information about Real Estate financing receivables that are classified as nonaccrual. Of our $9,719 mil-
lion of nonaccrual financing receivables at December 31, 2010, $7,888 million are currently paying in accordance with their contractual terms.
REAL ESTATE
Nonaccrual financing receivables at Nonearning financing receivables at
December 31, January 1, December 31, December 31, January 1, December 31,(Dollars in millions) 2010 2010 (a) 2009 2010 2010 (a) 2009
Debt $9,039 $6,342 $6,649 $ 961 $ 939 $ 939
Business properties 680 493 388 386 419 313
Total $9,719 $6,835 $7,037 $1,347 $1,358 $1,252
Allowance for losses percentage 15.3% 22.5% 21.2% 110.5% 113.1% 119.3%
(a) Reflects the effects of our adoption of ASU 2009-16 & 17 on January 1, 2010.
IMPAIRED LOANS
The following table provides information about loans classified as impaired and specific reserves related to Real Estate.
REAL ESTATE (a)
With no specific allowance With a specific allowance
Recorded Unpaid Average Recorded Unpaid Average investment principal investment investment principal Associated investment December 31, 2010 (In millions) in loans balance in loans in loans balance allowance in loans
Debt $2,814 $2,873 $1,598 $6,323 $6,498 $1,007 $6,116
Business properties 191 213 141 489 476 143 382
Total $3,005 $3,086 $1,739 $6,812 $6,974 $1,150 $6,498
(a) We recognized $189 million of interest income for the year ended December 31, 2010, principally on a cash basis. A substantial majority of this amount related to our
Real Estate—Debt business.
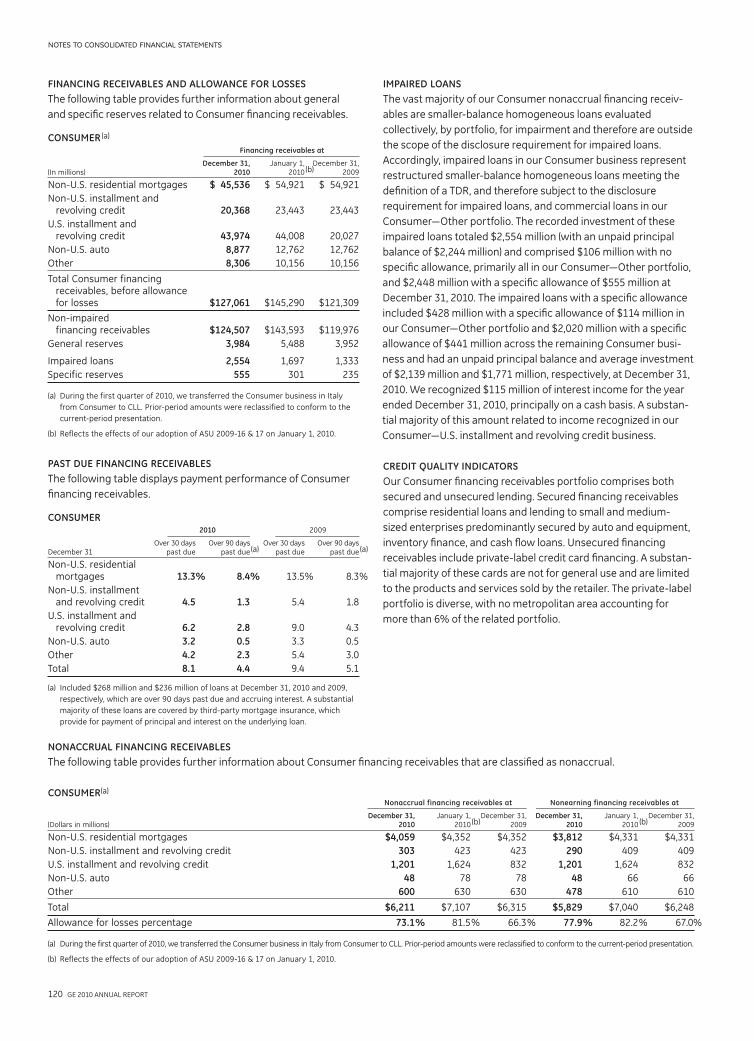
120 GE 2010 ANNUAL REPORT
notes to consolidated financial statements
IMPAIRED LOANS
The vast majority of our Consumer nonaccrual financing receiv-
ables are smaller-balance homogeneous loans evaluated
collectively, by portfolio, for impairment and therefore are outside
the scope of the disclosure requirement for impaired loans.
Accordingly, impaired loans in our Consumer business represent
restructured smaller-balance homogeneous loans meeting the
definition of a TDR, and therefore subject to the disclosure
requirement for impaired loans, and commercial loans in our
Consumer—Other portfolio. The recorded investment of these
impaired loans totaled $2,554 million (with an unpaid principal
balance of $2,244 million) and comprised $106 million with no
specific allowance, primarily all in our Consumer—Other portfolio,
and $2,448 million with a specific allowance of $555 million at
December 31, 2010. The impaired loans with a specific allowance
included $428 million with a specific allowance of $114 million in
our Consumer—Other portfolio and $2,020 million with a specific
allowance of $441 million across the remaining Consumer busi-
ness and had an unpaid principal balance and average investment
of $2,139 million and $1,771 million, respectively, at December 31,
2010. We recognized $115 million of interest income for the year
ended December 31, 2010, principally on a cash basis. A substan-
tial majority of this amount related to income recognized in our
Consumer—U.S. installment and revolving credit business.
CREDIT QUALITY INDICATORS
Our Consumer financing receivables portfolio comprises both
secured and unsecured lending. Secured financing receivables
comprise residential loans and lending to small and medium-
sized enterprises predominantly secured by auto and equipment,
inventory finance, and cash flow loans. Unsecured financing
receivables include private-label credit card financing. A substan-
tial majority of these cards are not for general use and are limited
to the products and services sold by the retailer. The private-label
portfolio is diverse, with no metropolitan area accounting for
more than 6% of the related portfolio.
FINANCING RECEIVABLES AND ALLOWANCE FOR LOSSES
The following table provides further information about general
and specific reserves related to Consumer financing receivables.
CONSUMER (a)
Financing receivables at
December 31, January 1, December 31,(In millions) 2010 2010 (b) 2009
Non-U.S. residential mortgages $ 45,536 $ 54,921 $ 54,921
Non-U.S. installment and revolving credit 20,368 23,443 23,443
U.S. installment and revolving credit 43,974 44,008 20,027
Non-U.S. auto 8,877 12,762 12,762
Other 8,306 10,156 10,156
Total Consumer financing receivables, before allowance for losses $127,061 $145,290 $121,309
Non-impaired financing receivables $124,507 $143,593 $119,976
General reserves 3,984 5,488 3,952
Impaired loans 2,554 1,697 1,333
Specific reserves 555 301 235
(a) During the first quarter of 2010, we transferred the Consumer business in Italy
from Consumer to CLL. Prior-period amounts were reclassified to conform to the
current-period presentation.
(b) Reflects the effects of our adoption of ASU 2009-16 & 17 on January 1, 2010.
PAST DUE FINANCING RECEIVABLES
The following table displays payment performance of Consumer
financing receivables.
CONSUMER 2010 2009
Over 30 days Over 90 days Over 30 days Over 90 days December 31 past due past due (a) past due past due (a)
Non-U.S. residential mortgages 13.3% 8.4% 13.5% 8.3%
Non-U.S. installment and revolving credit 4.5 1.3 5.4 1.8
U.S. installment and revolving credit 6.2 2.8 9.0 4.3
Non-U.S. auto 3.2 0.5 3.3 0.5
Other 4.2 2.3 5.4 3.0
Total 8.1 4.4 9.4 5.1
(a) Included $268 million and $236 million of loans at December 31, 2010 and 2009,
respectively, which are over 90 days past due and accruing interest. A substantial
majority of these loans are covered by third-party mortgage insurance, which
provide for payment of principal and interest on the underlying loan.
NONACCRUAL FINANCING RECEIVABLES
The following table provides further information about Consumer financing receivables that are classified as nonaccrual.
CONSUMER(a)
Nonaccrual financing receivables at Nonearning financing receivables at
December 31, January 1, December 31, December 31, January 1, December 31,(Dollars in millions) 2010 2010 (b) 2009 2010 2010 (b) 2009
Non-U.S. residential mortgages $4,059 $4,352 $4,352 $3,812 $4,331 $4,331
Non-U.S. installment and revolving credit 303 423 423 290 409 409
U.S. installment and revolving credit 1,201 1,624 832 1,201 1,624 832
Non-U.S. auto 48 78 78 48 66 66
Other 600 630 630 478 610 610
Total $6,211 $7,107 $6,315 $5,829 $7,040 $6,248
Allowance for losses percentage 73.1 % 81.5 % 66.3 % 77.9 % 82.2 % 67.0%
(a) During the first quarter of 2010, we transferred the Consumer business in Italy from Consumer to CLL. Prior-period amounts were reclassified to conform to the current-period presentation.
(b) Reflects the effects of our adoption of ASU 2009-16 & 17 on January 1, 2010.
GE 2010 ANNUAL REPORT 121
notes to consolidated financial statements
collection efforts to mitigate the potential risk of loss in these
portfolios and we have experienced an improvement in nonearn-
ing assets.
CONSUMER—OTHER
Secured lending in Consumer—Other comprises loans to small and
medium-sized enterprises predominantly secured by auto and
equipment, inventory finance, and cash flow loans. We develop our
internal risk ratings for this portfolio in a manner consistent with
the process used to develop our Commercial credit quality indica-
tors, described above. We use the borrower’s credit quality and
underlying collateral strength to determine the potential risk of
loss from these activities.
At December 31, 2010, Consumer—Other financing receivables
of $6,417 million, $822 million and $1,067 million were rated A, B,
and C, respectively.
Note 24.
Variable Interest Entities
We securitize financial assets and arrange other forms of asset-
backed financing in the ordinary course of business. These
transactions are similar to those used by many financial institu-
tions. Beyond improving returns, these transactions serve as
alternative funding sources for a variety of diversified lending
and securities transactions. Historically, we have used both
GE-supported and third-party VIEs to execute off-balance sheet
securitization transactions funded in the commercial paper and
term markets. The largest group of VIEs that we are involved
with are former QSPEs, which under guidance in effect through
December 31, 2009 were excluded from the scope of consolida-
tion standards based on their characteristics. Except as noted
below, investors in these entities only have recourse to the assets
owned by the entity and not to our general credit. We do not have
implicit support arrangements with any VIE. We did not provide
non-contractual support for previously transferred financing
receivables to any VIE in 2010 or 2009.
On January 1, 2010, we adopted ASU 2009-16 & 17, which
amended ASC 860, Transfers and Servicing, and ASC 810,
Consolidation, respectively. These amendments eliminated the
scope exception for QSPEs and required that all such entities be
evaluated for consolidation as VIEs, which resulted in the consoli-
dation of all of our sponsored QSPEs. Among other changes, the
amendments to ASC 810 replaced the existing quantitative
approach for identifying the party that should consolidate a VIE,
which was based on exposure to a majority of the risks and
rewards, with a qualitative approach, based on determination of
which party has the power to direct the most economically sig-
nificant activities of the entity. The revised guidance will
sometimes change the composition of entities that meet the
definition of a VIE and the determination about which party
should consolidate a VIE, as well as requiring the latter to be
evaluated continuously.
In evaluating whether we have the power to direct, as defined
in the standard, we consider the purpose for which the VIE was
created, the importance of each of the activities in which it is
engaged and our decision-making role, if any, in those activities
NON-U.S. RESIDENTIAL MORTGAGES
For our secured non-U.S. residential mortgage book, we assess
the overall credit quality of the portfolio through loan-to-value
ratios (the ratio of the outstanding debt on a property to the value
of that property at origination). In the event of default and repos-
session of the underlying collateral, we have the ability to remarket
and sell the properties to eliminate or mitigate the potential risk of
loss. The table below provides additional information about our
non-U.S. residential mortgages based on loan-to-value ratios.
Loan-to-value ratio
80% or Greater than Greater than December 31, 2010 (In millions) less 80% to 90% 90%
Non-U.S. residential mortgages $25,393 $7,515 $12,628
The majority of these financing receivables are in our U.K. and
France portfolios and have re-indexed loan-to-value ratios of 83%
and 60%, respectively. We have third-party mortgage insurance
for approximately 73% of the balance of Consumer non-U.S.
residential mortgage loans with loan-to-value ratios greater than
90% at December 31, 2010. Such loans were primarily originated
in the U.K. and France.
INSTALLMENT AND REVOLVING CREDIT
For our unsecured lending products, including the non-U.S. and
U.S. installment and revolving credit and non-U.S. auto portfolios,
we assess overall credit quality using internal and external credit
scores. Our internal credit scores imply a probability of default,
which we consistently translate into three approximate credit
bureau equivalent credit score categories, including (a) 681 or
higher, which are considered the strongest credits; (b) 615 to 680,
considered moderate credit risk; and (c) 614 or less, which are
considered weaker credits.
Internal ratings translated to approximate credit bureau equivalent score
681 or 615 to 614 or December 31, 2010 (In millions) higher 680 less
Non-U.S. installment and revolving credit $10,298 $5,859 $4,211
U.S. installment and revolving credit 25,940 8,846 9,188
Non-U.S. auto 6,397 1,551 929
Of those financing receivable accounts with credit bureau equiva-
lent scores of 614 or less at December 31, 2010, 94% and 6%
relate to installment and revolving credit accounts and non-U.S.
auto accounts, respectively. These smaller-balance accounts have
an average outstanding balance less than one thousand U.S. dol-
lars and are primarily concentrated in our retail card and sales
finance receivables in the U.S. (which are often subject to profit
and loss sharing arrangements), and closed-end loans outside the
U.S., which minimizes the potential for loss in the event of default.
For lower credit scores, we adequately price for the incremental
risk at origination and monitor credit migration through our risk
ratings process. We continuously adjust our credit line underwrit-
ing management and collection strategies based on customer
behavior and risk profile changes. During 2008 through 2010, we
strengthened our underwriting processes by actively reducing
credit lines and approval rates, along with increasing our
122 GE 2010 ANNUAL REPORT
notes to consolidated financial statements
If the long-term credit rating of GECC were to fall below AA-/
Aa3 or its short-term credit rating were to fall below A-1+/P-1,
GECC would be required to provide approximately $1,508 mil-
lion to such entities as of December 31, 2010 pursuant to
letters of credit issued by GECC. To the extent that the entities’
liabilities exceed the ultimate value of the proceeds from the
sale of their assets and the amount drawn under the letters of
credit, GECC is required to provide such excess amount. As the
borrowings of these entities are already reflected in our con-
solidated Statement of Financial Position, there would be no
change in our debt if this were to occur. As of December 31,
2010, the carrying value of the liabilities of these entities’ was
$5,690 million and the fair value of their assets was $5,989 mil-
lion (which included net unrealized losses on investment
securities of $690 million). With respect to these investment
securities, we intend to hold them at least until such time as
their individual fair values exceed their amortized cost. We
have the ability to hold all such debt securities until maturity.
• Securitization QSPEs comprise previously off-book QSPEs that
were consolidated on January 1, 2010 in connection with our
adoption of ASU 2009-16 & 17. These entities were created to
facilitate securitization of financial assets and other forms of
asset-backed financing which serve as an alternative funding
source by providing access to the commercial paper and term
markets. The securitization transactions executed with these
entities are similar to those used by many financial institutions
and substantially all are non-recourse. We provide servicing
for substantially all of the assets in these entities.
The financing receivables in these entities have similar risks
and characteristics to our other financing receivables and
were underwritten to the same standard. Accordingly, the
performance of these assets has been similar to our other
financing receivables; however, the blended performance of
the pools of receivables in these entities reflects the eligibility
criteria that we apply to determine which receivables are
selected for transfer. Contractually the cash flows from these
financing receivables must first be used to pay third-party
debt holders as well as other expenses of the entity. Excess
cash flows are available to GE. The creditors of these entities
have no claim on other assets of GE.
• Other remaining assets and liabilities of consolidated VIEs
relate primarily to five categories of entities: (1) enterprises we
acquired that had previously created asset-backed financing
entities to fund commercial real estate, middle-market and
equipment loans; we are the collateral manager for these
entities; (2) joint ventures that lease light industrial equipment
and that hold a limited partnership interest in certain media
properties; (3) entities that have executed on-balance sheet
securitizations of financial assets and of third-party trade
receivables; (4) insurance entities that, among other lines of
business, provide property and casualty and workers’ compen-
sation coverage for GE; and (5) other entities that are involved
in power generating, leasing and real estate activities.
that significantly determine the entity’s economic performance
as compared to other economic interest holders. This evaluation
requires consideration of all facts and circumstances relevant to
decision-making that affects the entity’s future performance and
the exercise of professional judgment in deciding which decision-
making rights are most important.
In determining whether we have the right to receive benefits
or the obligation to absorb losses that could potentially be signifi-
cant to the VIE, we evaluate all of our economic interests in the
entity, regardless of form (debt, equity, management and servic-
ing fees, and other contractual arrangements). This evaluation
considers all relevant factors of the entity’s design, including: the
entity’s capital structure, contractual rights to earnings (losses),
subordination of our interests relative to those of other investors,
contingent payments, as well as other contractual arrangements
that have potential to be economically significant. The evaluation
of each of these factors in reaching a conclusion about the poten-
tial significance of our economic interests is a matter that
requires the exercise of professional judgment.
As of January 1, 2010 and subsequently, we evaluated all
entities that fall within the scope of the amended ASC 810 to
determine whether we were required to consolidate or deconsoli-
date them based on the approach described above. In addition to
the securitization QSPEs described above, we were required to
consolidate assets of VIEs related to direct investments in entities
that hold loans and fixed income securities, a media joint venture
and a small number of companies to which we have extended
loans in the ordinary course of business and have subsequently
been subject to a TDR. The incremental effect of these entities on
our total assets and liabilities, net of our investment in them, was
an increase of approximately $31,097 million and $33,042 million,
respectively, at January 1, 2010. There also was a net reduction of
total equity (including noncontrolling interests) of approximately
$1,945 million at January 1, 2010, principally related to the rever-
sal of previously recognized securitization gains as a cumulative
effect adjustment to retained earnings.
The assets of QSPEs that we consolidated were $29,792 mil-
lion, net of our existing retained interests of $8,782 million, and
liabilities were $31,616 million at January 1, 2010. Significant
assets of the QSPEs included net financing receivables and trade
receivables of $39,463 million and investment securities of
$1,015 million at January 1, 2010. Significant liabilities included
non-recourse borrowings of $36,112 million. The assets and
liabilities of other VIEs we consolidated were $1,305 million
and $1,426 million, respectively.
Consolidated Variable Interest EntitiesWe consolidate VIEs because we have the power to direct the
activities that significantly affect the VIEs’ economic performance,
typically because of our role as either servicer or manager for the
VIE. Our consolidated VIEs fall into three main groups, which are
further described below:
• Trinity is a group of sponsored special purpose entities that
holds investment securities, the majority of which are invest-
ment grade, and are funded by the issuance of GICs. These
entities were consolidated in 2003, and ceased issuing new
investment contracts beginning in the first quarter of 2010.

GE 2010 ANNUAL REPORT 123
notes to consolidated financial statements
The table below summarizes the assets and liabilities of consolidated VIEs described above.
Consolidated Liquidating Securitization Securitization (In millions) Trinity (a) Entities (a) QSPEs (b) (c) Other (c) Total
DECEMBER 31, 2010
ASSETS
Financing receivables, net $ — $ — $33,997 $ 5,475 $39,472
Investment securities 5,706 — — 964 6,670
Other assets (d) 283 — 520 3,711 4,514
Total $5,989 $ — $34,517 $10,150 $50,656
LIABILITIES
Borrowings (d) $ — $ — $ 210 $ 948 $ 1,158
Non-recourse borrowings of consolidated securitization entities — — 26,554 2,890 29,444
Other liabilities (d) 5,690 — 123 1,882 7,695
Total $5,690 $ — $26,887 $ 5,720 $38,297
DECEMBER 31, 2009
ASSETS
Financing receivables, net $ — $2,576 $ — $ 4,277 $ 6,853
Investment securities 6,629 — — 944 7,573
Other assets (d) 716 32 — 1,820 2,568
Total $7,345 $2,608 $ — $ 7,041 $16,994
LIABILITIES
Borrowings (d) $ — $ — $ — $ 1,835 $ 1,835
Non-recourse borrowings of consolidated securitization entities — 2,424 — 684 3,108
Other liabilities (d) 8,519 80 — 1,689 10,288
Total $8,519 $2,504 $ — $ 4,208 $15,231
(a) Entities consolidated on July 1, 2003 or January 1, 2004 as a result of amendments to U.S. GAAP. During 2010, the capital structure of the consolidated liquidating securitization
entities changed and they are now consolidated under the voting interest model.
(b) Entities consolidated on January 1, 2010 by the initial application of ASU 2009-16 & 17.
(c) In certain transactions entered into prior to December 31, 2004, we provided contractual credit and liquidity support to third parties who funded the purchase of securitized or
participated interests in assets. We have not entered into additional arrangements since that date. Liquidity and credit support was $936 million at December 31, 2010 and
$2,088 million at December 31, 2009.
(d) Other assets, borrowings and other liabilities exclude intercompany balances that are eliminated in consolidation.
GECS revenues from services from our consolidated VIEs were $6,914 million in 2010. Related expenses consisted primarily of provisions
for losses of $1,596 million and interest and other financial charges of $767 million in 2010. These amounts do not include intercompany
revenues and costs, principally fees and interest between GE and the VIEs, which are eliminated in consolidation.
The gross financing receivables and outstanding debt, which is substantially all non-recourse, in Securitization QSPEs at December 31,
2010 and December 31, 2009 is provided below.
Credit card (In millions) receivables Real estate Equipment (a) Other (b) Total
DECEMBER 31, 2010
Asset amount outstanding $21,636 $4,433 $ 7,645 $1,981 $35,695
Outstanding debt 12,824 4,301 6,669 2,970 26,764
DECEMBER 31, 2009
Asset amount outstanding $25,573 $7,381 $10,414 $3,528 $46,896
Outstanding debt 18,799 7,367 9,312 4,206 39,684
(a) Included floorplan receivables.
(b) Asset amounts exclude intercompany receivables for cash collected on behalf of the entities by GE as servicer, which are eliminated in consolidation. Such receivables provide
the cash to repay the entities’ liabilities. If these intercompany receivables were included in the table above, assets would exceed the outstanding debt shown.
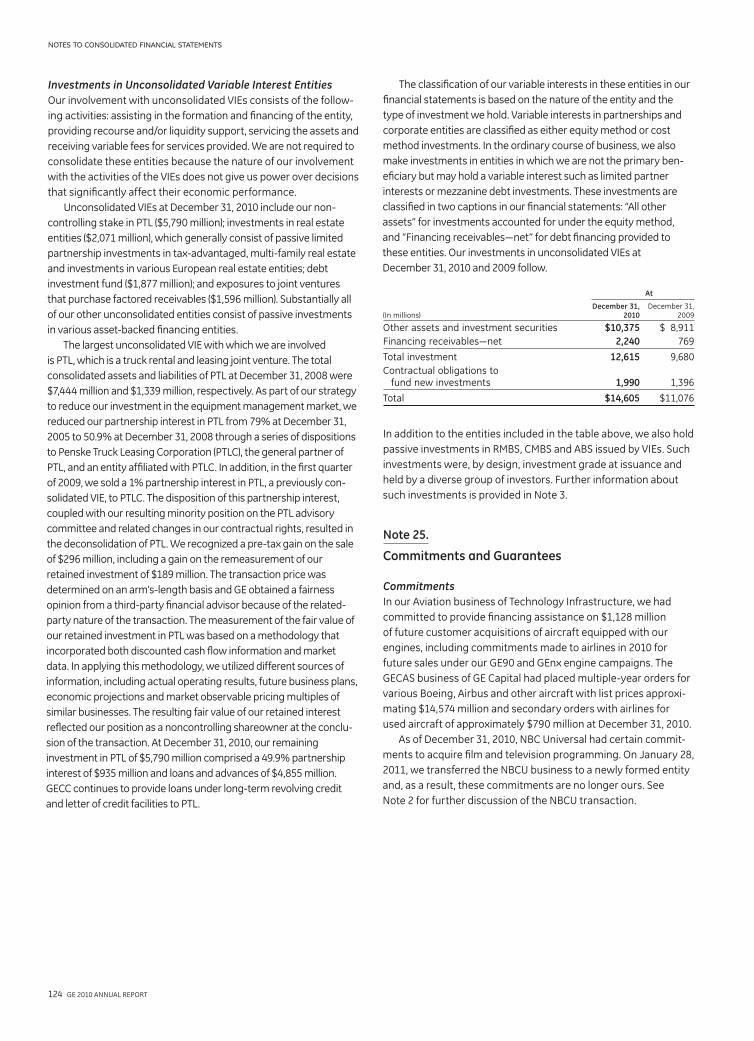
124 GE 2010 ANNUAL REPORT
notes to consolidated financial statements
Investments in Unconsolidated Variable Interest EntitiesOur involvement with unconsolidated VIEs consists of the follow-
ing activities: assisting in the formation and financing of the entity,
providing recourse and/or liquidity support, servicing the assets and
receiving variable fees for services provided. We are not required to
consolidate these entities because the nature of our involvement
with the activities of the VIEs does not give us power over decisions
that significantly affect their economic performance.
Unconsolidated VIEs at December 31, 2010 include our non-
controlling stake in PTL ($5,790 million); investments in real estate
entities ($2,071 million), which generally consist of passive limited
partnership investments in tax-advantaged, multi-family real estate
and investments in various European real estate entities; debt
investment fund ($1,877 million); and exposures to joint ventures
that purchase factored receivables ($1,596 million). Substantially all
of our other unconsolidated entities consist of passive investments
in various asset-backed financing entities.
The largest unconsolidated VIE with which we are involved
is PTL, which is a truck rental and leasing joint venture. The total
consolidated assets and liabilities of PTL at December 31, 2008 were
$7,444 million and $1,339 million, respectively. As part of our strategy
to reduce our investment in the equipment management market, we
reduced our partnership interest in PTL from 79% at December 31,
2005 to 50.9% at December 31, 2008 through a series of dispositions
to Penske Truck Leasing Corporation (PTLC), the general partner of
PTL, and an entity affiliated with PTLC. In addition, in the first quarter
of 2009, we sold a 1% partnership interest in PTL, a previously con-
solidated VIE, to PTLC. The disposition of this partnership interest,
coupled with our resulting minority position on the PTL advisory
committee and related changes in our contractual rights, resulted in
the deconsolidation of PTL. We recognized a pre-tax gain on the sale
of $296 million, including a gain on the remeasurement of our
retained investment of $189 million. The transaction price was
determined on an arm’s-length basis and GE obtained a fairness
opinion from a third-party financial advisor because of the related-
party nature of the transaction. The measurement of the fair value of
our retained investment in PTL was based on a methodology that
incorporated both discounted cash flow information and market
data. In applying this methodology, we utilized different sources of
information, including actual operating results, future business plans,
economic projections and market observable pricing multiples of
similar businesses. The resulting fair value of our retained interest
reflected our position as a noncontrolling shareowner at the conclu-
sion of the transaction. At December 31, 2010, our remaining
investment in PTL of $5,790 million comprised a 49.9% partnership
interest of $935 million and loans and advances of $4,855 million.
GECC continues to provide loans under long-term revolving credit
and letter of credit facilities to PTL.
The classification of our variable interests in these entities in our
financial statements is based on the nature of the entity and the
type of investment we hold. Variable interests in partnerships and
corporate entities are classified as either equity method or cost
method investments. In the ordinary course of business, we also
make investments in entities in which we are not the primary ben-
eficiary but may hold a variable interest such as limited partner
interests or mezzanine debt investments. These investments are
classified in two captions in our financial statements: “All other
assets” for investments accounted for under the equity method,
and “Financing receivables—net” for debt financing provided to
these entities. Our investments in unconsolidated VIEs at
December 31, 2010 and 2009 follow.
At
December 31, December 31,(In millions) 2010 2009
Other assets and investment securities $10,375 $ 8,911
Financing receivables—net 2,240 769
Total investment 12,615 9,680
Contractual obligations to fund new investments 1,990 1,396
Total $14,605 $11,076
In addition to the entities included in the table above, we also hold
passive investments in RMBS, CMBS and ABS issued by VIEs. Such
investments were, by design, investment grade at issuance and
held by a diverse group of investors. Further information about
such investments is provided in Note 3.
Note 25.
Commitments and Guarantees
CommitmentsIn our Aviation business of Technology Infrastructure, we had
committed to provide financing assistance on $1,128 million
of future customer acquisitions of aircraft equipped with our
engines, including commitments made to airlines in 2010 for
future sales under our GE90 and GEnx engine campaigns. The
GECAS business of GE Capital had placed multiple-year orders for
various Boeing, Airbus and other aircraft with list prices approxi-
mating $14,574 million and secondary orders with airlines for
used aircraft of approximately $790 million at December 31, 2010.
As of December 31, 2010, NBC Universal had certain commit-
ments to acquire film and television programming. On January 28,
2011, we transferred the NBCU business to a newly formed entity
and, as a result, these commitments are no longer ours. See
Note 2 for further discussion of the NBCU transaction.
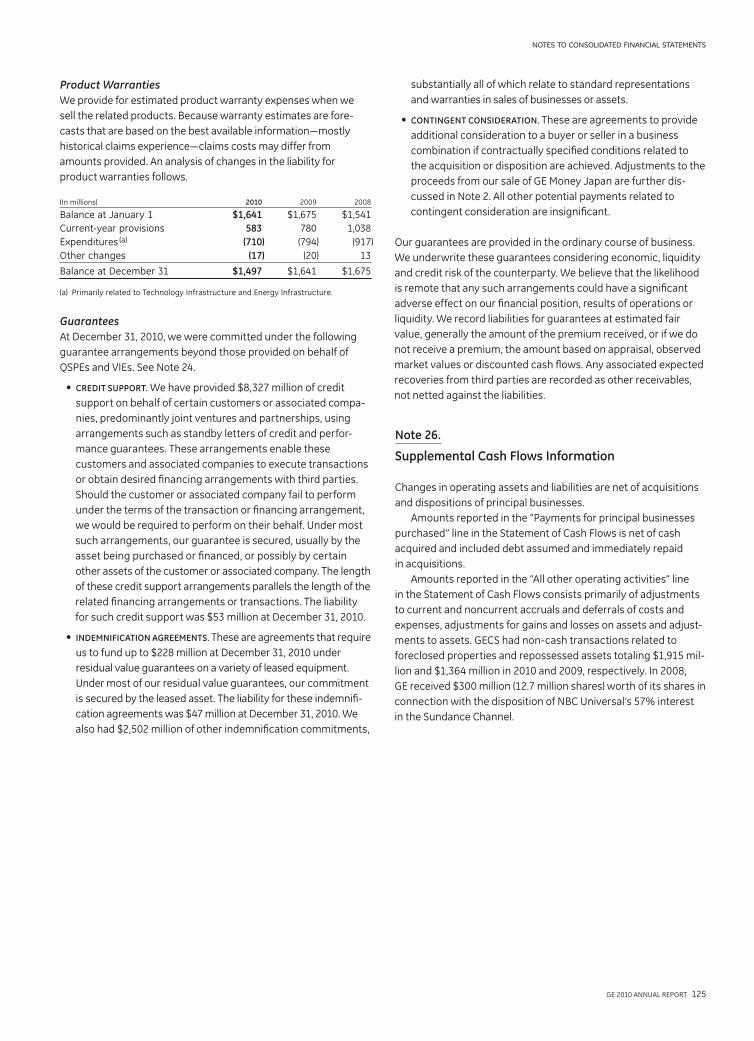
GE 2010 ANNUAL REPORT 125
notes to consolidated financial statements
substantially all of which relate to standard representations
and warranties in sales of businesses or assets.
• CONTINGENT CONSIDERATION. These are agreements to provide
additional consideration to a buyer or seller in a business
combination if contractually specified conditions related to
the acquisition or disposition are achieved. Adjustments to the
proceeds from our sale of GE Money Japan are further dis-
cussed in Note 2. All other potential payments related to
contingent consideration are insignificant.
Our guarantees are provided in the ordinary course of business.
We underwrite these guarantees considering economic, liquidity
and credit risk of the counterparty. We believe that the likelihood
is remote that any such arrangements could have a significant
adverse effect on our financial position, results of operations or
liquidity. We record liabilities for guarantees at estimated fair
value, generally the amount of the premium received, or if we do
not receive a premium, the amount based on appraisal, observed
market values or discounted cash flows. Any associated expected
recoveries from third parties are recorded as other receivables,
not netted against the liabilities.
Note 26.
Supplemental Cash Flows Information
Changes in operating assets and liabilities are net of acquisitions
and dispositions of principal businesses.
Amounts reported in the “Payments for principal businesses
purchased” line in the Statement of Cash Flows is net of cash
acquired and included debt assumed and immediately repaid
in acquisitions.
Amounts reported in the “All other operating activities” line
in the Statement of Cash Flows consists primarily of adjustments
to current and noncurrent accruals and deferrals of costs and
expenses, adjustments for gains and losses on assets and adjust-
ments to assets. GECS had non-cash transactions related to
foreclosed properties and repossessed assets totaling $1,915 mil-
lion and $1,364 million in 2010 and 2009, respectively. In 2008,
GE received $300 million (12.7 million shares) worth of its shares in
connection with the disposition of NBC Universal’s 57% interest
in the Sundance Channel.
Product WarrantiesWe provide for estimated product warranty expenses when we
sell the related products. Because warranty estimates are fore-
casts that are based on the best available information—mostly
historical claims experience—claims costs may differ from
amounts provided. An analysis of changes in the liability for
product warranties follows.
(In millions) 2010 2009 2008
Balance at January 1 $1,641 $1,675 $1,541
Current-year provisions 583 780 1,038
Expenditures (a) (710) (794) (917)
Other changes (17) (20) 13
Balance at December 31 $1,497 $1,641 $1,675
(a) Primarily related to Technology Infrastructure and Energy Infrastructure.
GuaranteesAt December 31, 2010, we were committed under the following
guarantee arrangements beyond those provided on behalf of
QSPEs and VIEs. See Note 24.
• CREDIT SUPPORT. We have provided $8,327 million of credit
support on behalf of certain customers or associated compa-
nies, predominantly joint ventures and partnerships, using
arrangements such as standby letters of credit and perfor-
mance guarantees. These arrangements enable these
customers and associated companies to execute transactions
or obtain desired financing arrangements with third parties.
Should the customer or associated company fail to perform
under the terms of the transaction or financing arrangement,
we would be required to perform on their behalf. Under most
such arrangements, our guarantee is secured, usually by the
asset being purchased or financed, or possibly by certain
other assets of the customer or associated company. The length
of these credit support arrangements parallels the length of the
related financing arrangements or transactions. The liability
for such credit support was $53 million at December 31, 2010.
• INDEMNIFICATION AGREEMENTS. These are agreements that require
us to fund up to $228 million at December 31, 2010 under
residual value guarantees on a variety of leased equipment.
Under most of our residual value guarantees, our commitment
is secured by the leased asset. The liability for these indemnifi-
cation agreements was $47 million at December 31, 2010. We
also had $2,502 million of other indemnification commitments,

126 GE 2010 ANNUAL REPORT
notes to consolidated financial statements
Certain supplemental information related to GE and GECS cash flows is shown below.
December 31 (In millions) 2010 2009 2008
GE
NET DISPOSITIONS (PURCHASES) OF GE SHARES FOR TREASURY
Open market purchases under share repurchase program $ (1,715) $ (85) $ (3,222)
Other purchases (77) (129) (286)
Dispositions 529 837 2,259
$ (1,263) $ 623 $ (1,249)
GECS
ALL OTHER OPERATING ACTIVITIES
Net change in other assets $ 28 $ (344) $ (1,370)
Amortization of intangible assets 654 906 981
Realized losses on investment securities 91 473 1,260
Cash collateral on derivative contracts — (6,858) 7,769
Change in other liabilities (3,397) (4,919) (3,238)
Other 4,486 578 3,248
$ 1,862 $ (10,164) $ 8,650
NET DECREASE (INCREASE) IN GECS FINANCING RECEIVABLES
Increase in loans to customers $(310,581) $(278,536) $(409,308)
Principal collections from customers—loans 331,214 283,743 361,384
Investment in equipment for financing leases (10,225) (9,509) (21,671)
Principal collections from customers—financing leases 15,118 17,460 20,159
Net change in credit card receivables (4,559) (28,534) (34,691)
Sales of financing receivables 5,331 58,555 67,093
$ 26,298 $ 43,179 $ (17,034)
ALL OTHER INVESTING ACTIVITIES
Purchases of securities by insurance activities $ (1,712) $ (3,106) $ (4,190)
Dispositions and maturities of securities by insurance activities 3,136 3,962 4,690
Other assets—investments 2,690 (258) (228)
Change in other receivables 482 821 3,313
Other 2,805 (2,655) 2,867
$ 7,401 $ (1,236) $ 6,452
NEWLY ISSUED DEBT (MATURITIES LONGER THAN 90 DAYS)
Short-term (91 to 365 days) $ 2,496 $ 5,801 $ 34,445
Long-term (longer than one year) 35,474 75,216 81,614
Proceeds—non-recourse, leveraged leases — 48 113
$ 37,970 $ 81,065 $ 116,172
REPAYMENTS AND OTHER REDUCTIONS (MATURITIES LONGER THAN 90 DAYS)
Short-term (91 to 365 days) $ (95,170) $ (77,444) $ (65,958)
Long-term (longer than one year) (1,792) (5,217) (462)
Principal payments—non-recourse, leveraged leases (638) (680) (637)
$ (97,600) $ (83,341) $ (67,057)
ALL OTHER FINANCING ACTIVITIES
Proceeds from sales of investment contracts $ 5,339 $ 7,840 $ 11,433
Redemption of investment contracts (8,647) (10,713) (13,304)
Other (9) 182 9
$ (3,317) $ (2,691) $ (1,862)
GE 2010 ANNUAL REPORT 127
notes to consolidated financial statements
segment called Home & Business Solutions that includes the
Appliances and Lighting businesses from our previous Consumer &
Industrial segment and the retained portion of the GE Fanuc
Intelligent Platforms business of our previous Enterprise Solutions
business (formerly within our Technology Infrastructure segment).
In addition, the Industrial business of our previous Consumer &
Industrial segment and the Sensing & Inspection Technologies and
Digital Energy businesses of Enterprise Solutions are now part of
the Energy business within the Energy Infrastructure segment. The
Security business of Enterprise Solutions is reported in Corporate
Items and Eliminations prior to its sale in the first quarter of 2010.
Also, effective January 1, 2010, the Capital Finance segment was
renamed GE Capital and includes all of the continuing operations
of General Electric Capital Corporation. In addition, the
Transportation Financial Services business, previously reported
in GECAS, is included in CLL and our Consumer business in Italy,
previously reported in Consumer, is included in CLL.
A description of our operating segments as of December 31,
2010, can be found below, and details of segment profit by oper-
ating segment can be found in the Summary of Operating
Segments table in Management’s Discussion and Analysis.
Energy InfrastructurePower plant products and services, including design, installation,
operation and maintenance services are sold into global markets.
Gas, steam and aeroderivative turbines, generators, combined
cycle systems, controls and related services, including total asset
optimization solutions, equipment upgrades and long-term main-
tenance service agreements are sold to power generation and
other industrial customers. Renewable energy solutions include
wind turbines and solar technology. Water treatment services and
equipment include specialty chemical treatment programs, water
purification equipment, mobile treatment systems and desalina-
tion processes. Energy offers integrated solutions using sensors
for temperature, pressure, moisture, gas and flow rate as well as
non-destructive testing inspection equipment, including radio-
graphic, ultrasonic, remote visual and eddy current. In addition,
it provides protection and control, communications, power sens-
ing and power quality products and services that increase the
reliability of electrical power networks and critical equipment and
offering wireless data transmission. Electrical equipment
and control products include power panels, switchgear and
circuit breakers.
The Oil & Gas business sells surface and subsea drilling and
production systems including blowout preventers, equipment for
floating production platforms, compressors, turbines, turbo-
expanders and high pressure reactors to national, international
and independent oil and gas companies. Services include equip-
ment overhauls and upgrades, pipeline inspection and integrity
services, remote monitoring and diagnostic, and contractual
service agreements.
Note 27.
Intercompany Transactions
Effects of transactions between related companies are made on
an arms-length basis, are eliminated and consist primarily of
GECS dividends to GE or capital contributions from GE to GECS;
GE customer receivables sold to GECS; GECS services for trade
receivables management and material procurement; buildings
and equipment (including automobiles) leased between GE and
GECS; information technology (IT) and other services sold to GECS
by GE; aircraft engines manufactured by GE that are installed on
aircraft purchased by GECS from third-party producers for lease
to others; and various investments, loans and allocations of
GE corporate overhead costs.
These intercompany transactions are reported in the GE and
GECS columns of our financial statements, but are eliminated in
deriving our consolidated financial statements. Effects of these
eliminations on our consolidated cash flows from operating,
investing and financing activities include the following. Net
decrease (increase) in GE customer receivables sold to GECS of
$81 million, $(157) million and $90 million have been eliminated
from consolidated cash from operating and investing activities at
December 31, 2010, 2009 and 2008, respectively. Capital contribu-
tions from GE to GECS of $9,500 million and $5,500 million have
been eliminated from consolidated cash from investing and
financing activities at December 31, 2009 and 2008, respectively.
There were no such capital contributions at December 31, 2010.
GECS dividends to GE of $2,351 million have been eliminated from
consolidated cash from operating and financing activities at
December 31, 2008. There were no such dividends at Decem-
ber 31, 2010 and 2009, respectively. Eliminations of intercompany
borrowings (includes GE investment in GECS short-term borrow-
ings, such as commercial paper) of $293 million, $715 million and
$(471) million have been eliminated from financing activities at
December 31, 2010, 2009 and 2008, respectively. Other reclassifi-
cations and eliminations of $(205) million, $741 million and
$(188) million have been eliminated from consolidated cash from
operating activities and $107 million, $(817) million and $(320) mil-
lion have been eliminated from consolidated cash from investing
activities at December 31, 2010, 2009 and 2008, respectively.
Note 28.
Operating Segments
Basis for PresentationOur operating businesses are organized based on the nature of
markets and customers. Segment accounting policies are the
same as described in Note 1. Segment results for our financial
services businesses reflect the discrete tax effect of transactions.
Effective January 1, 2010, we reorganized our segments to
better align our Consumer & Industrial and Energy businesses for
growth. As a result of this reorganization, we created a new

128 GE 2010 ANNUAL REPORT
notes to consolidated financial statements
regional sports networks, certain digital properties and certain
unconsolidated investments to a newly formed entity, NBCU LLC.
In connection with the transaction, we received cash of $6,197 mil-
lion from Comcast and a 49% interest in NBCU LLC. Comcast holds
the remaining 51% interest in NBCU LLC. We will account for our
investment in NBCU LLC under the equity method.
GE CapitalCLL products include loans, leases and other financial services
to customers, includ ing manufacturers, distributors and end-
users for a variety of equipment and major capital assets. These
assets include indus trial-related facilities and equipment; vehi-
cles; corporate aircraft; and equipment used in many industries,
including the construction, manufacturing, transportation, media,
communications, entertainment and healthcare industries.
Consumer offers a range of financial products including private-
label credit cards; personal loans; bank cards; auto loans and leases;
mortgages; debt consolidation; home equity loans; deposits and
other savings products; and small and medium enterprise lending
on a global basis.
Real Estate offers a comprehensive range of capital and
investment solutions and finances, with both equity and loan
structures, the acquisition, refinancing and renovation of office
buildings, apartment buildings, retail facilities, hotels, parking
facilities and industrial properties.
Energy Financial Services offers financial products to the
global energy and water industries including structured equity,
debt, leasing, partnership financing, product finance, and broad-
based commercial finance.
GECAS provides financial products to airlines, aircraft opera-
tors, owners, lend ers and investors, including leases, and secured
loans on commercial passenger aircraft, freighters and regional
jets; engine leasing and financing services; aircraft parts solu-
tions; and airport equity and debt financing.
Home & Business SolutionsProducts include major appliances and related services for prod-
ucts such as refrigerators, freezers, electric and gas ranges,
cooktops, dishwashers, clothes washers and dryers, microwave
ovens, room air conditioners, residential water systems for filtra-
tion, softening and heating, and hybrid water heaters. These
products are distributed both to retail outlets and direct to con-
sumers, mainly for the replacement market, and to building
contractors and distributors for new installations. Lighting
products include a wide variety of lamps and lighting fixtures,
including light-emitting diodes. Plant automation hardware,
software and embedded computing systems including control-
lers, embedded systems, advanced software, motion control,
operator interfaces and industrial computers are also provided
by Home & Business Solutions. Products and services are sold in
North America and in global markets under various GE and private-
label brands.
Technology InfrastructureAviation products and services include jet engines, aerospace
systems and equipment, replacement parts and repair and
maintenance services for all categories of commercial aircraft;
for a wide variety of military aircraft, includ ing fighters, bombers,
tankers and helicopters; for marine appli cations; and for executive
and regional aircraft. Products and services are sold worldwide to
airframe manufacturers, airlines and government agencies.
Healthcare products include diagnostic imaging systems such
as Magnetic Resonance (MR), Computed Tomography (CT) and
Positron Emission Tomography (PET) scanners, X-ray, nuclear
imaging, digital mammography, and Molecular Imaging technolo-
gies. Healthcare-manufactured technologies include patient and
resident monitoring, diagnostic cardiology, ultrasound, bone
densitometry, anesthesiology and oxygen therapy, and neonatal
and critical care devices. Related services include equipment
monitoring and repair, information technologies and customer
productivity services. Products also include diagnostic imaging
agents used in medical scanning procedures, drug discovery,
biopharmaceutical manufacturing and purification, and tools for
pro tein and cellular analysis for pharmaceutical and academic
research, including a pipeline of precision molecular diagnostics
in development for neurology, cardiology and oncology applica-
tions. Products and services are sold worldwide to hospitals,
medical facilities, pharmaceutical and biotechnology companies,
and to the life science research market.
Transportation products and maintenance services include
diesel electric locomotives, transit propulsion equipment, motor-
ized wheels for off-highway vehicles, gearing technology for wind
turbines, drill motors, marine and stationary power generation,
railway signaling and office systems.
Effective January 1, 2011, we reorganized the Technology
Infrastructure segment into three segments—Aviation,
Healthcare and Transportation. Results for 2010 and prior periods
are reported on the basis under which we managed our busi-
nesses in 2010 and do not reflect the January 1, 2011
reorganization.
NBC UniversalPrincipal businesses are the broadcast of U.S. network television,
production and distribution of films and television programs,
operation of television stations, operation of cable/satellite televi-
sion networks around the world, operation of theme parks, and
investment and programming activities in digital media and
the Internet.
Prior to September 2010, we owned 80% of NBCU and Vivendi
owned 20%. In September 2010, we acquired approximately
38% of Vivendi’s 20% ownership interest in NBCU (7.7% of NBCU’s
outstanding shares). Prior to and in connection with the transac-
tion with Comcast, we acquired the remaining Vivendi interest in
NBCU (12.3% of NBCU’s outstanding shares). On January 28, 2011,
we transferred the assets of the NBCU business and Comcast
transferred certain of its assets comprising cable networks,

GE 2010 ANNUAL REPORT 129
notes to consolidated financial statements
Total revenues (a) Intersegment revenues (b) External revenues
(In millions) 2010 2009 2008 2010 2009 2008 2010 2009 2008
Energy Infrastructure $ 37,514 $ 40,648 $ 43,046 $ 316 $ 633 $ 1,098 $ 37,198 $ 40,015 $ 41,948
Technology Infrastructure 37,860 38,517 41,605 250 304 372 37,610 38,213 41,233
NBC Universal 16,901 15,436 16,969 105 71 89 16,796 15,365 16,880
GE Capital 47,040 49,746 67,645 1,207 1,469 1,708 45,833 48,277 65,937
Home & Business Solutions 8,648 8,443 10,117 49 33 68 8,599 8,410 10,049
Corporate items and eliminations 2,248 2,488 2,199 (1,927) (2,510) (3,335) 4,175 4,998 5,534
Total $150,211 $155,278 $181,581 $ — $ — $ — $150,211 $155,278 $181,581
(a) Revenues of GE businesses include income from sales of goods and services to customers and other income.
(b) Sales from one component to another generally are priced at equivalent commercial selling prices.
Revenues from customers located in the United States were $70,506 million, $72,240 million and $85,012 million in 2010, 2009 and 2008,
respectively. Revenues from customers located outside the United States were $79,705 million, $83,038 million and $96,569 million in
2010, 2009 and 2008, respectively.
Property, plant and Assets (a) (b) equipment additions (c) Depreciation and amortization
At December 31 For the years ended December 31 For the years ended December 31
(In millions) 2010 2009 2008 2010 2009 2008 2010 2009 2008
Energy Infrastructure $ 38,606 $ 36,663 $ 36,973 $ 954 $1,012 $ 1,382 $ 911 $ 994 $ 973
Technology Infrastructure 51,474 50,245 51,863 789 812 1,247 1,643 1,496 1,343
NBC Universal 33,792 32,282 33,781 286 282 131 — 345 354
GE Capital 575,908 607,707 627,501 7,674 6,440 15,325 8,375 9,177 10,226
Home & Business Solutions 4,280 4,955 4,908 229 201 195 354 366 342
Corporate items and eliminations 47,156 50,049 42,815 (111) (79) 349 479 297 299
Total $751,216 $781,901 $797,841 $9,821 $8,668 $18,629 $11,762 $12,675 $13,537
(a) Assets of discontinued operations are included in Corporate items and eliminations for all periods presented.
(b) Total assets of the Energy Infrastructure, Technology Infrastructure, GE Capital and Home & Business Solutions operating segments at December 31, 2010, include investments
in, and advances to, associated companies of $667 million, $856 million, $25,662 million and $430 million, respectively. Investments in, and advances to, associated companies
contributed approximately $58 million, $40 million, $284 million, $2,035 million and $30 million to segment pre-tax income of Energy Infrastructure, Technology Infrastructure,
NBC Universal, GE Capital and Home & Business Solutions operating segments, respectively, for the year ended December 31, 2010. Aggregate summarized financial
information for significant associated companies assuming a 100% ownership interest included: total assets of $198,571 million, primarily financing receivables of
$97,561 million; total liabilities of $152,812 million, primarily bank deposits of $75,661 million; revenues totaling $15,659 million; and net earnings totaling $2,895 million.
(c) Additions to property, plant and equipment include amounts relating to principal businesses purchased.
Property, plant and equipment—net associated with operations based in the United States were $17,596 million, $19,798 million and
$27,667 million at year-end 2010, 2009 and 2008, respectively. Property, plant and equipment—net associated with operations based
outside the United States were $48,618 million, $49,172 million and $50,861 million at year-end 2010, 2009 and 2008, respectively.
Interest and other financial charges Provision (benefit) for income taxes
(In millions) 2010 2009 2008 2010 2009 2008
GE Capital $14,924 $17,491 $24,570 $ (932) $(3,812) $(2,137)
Corporate items and eliminations (a) 1,059 818 1,188 1,982 2,664 3,239
Total $15,983 $18,309 $25,758 $1,050 $(1,148) $ 1,102
(a) Included amounts for Energy Infrastructure, Technology Infrastructure, NBC Universal and Home & Business Solutions for which our measure of segment profit excludes
interest and other financial charges and income taxes.
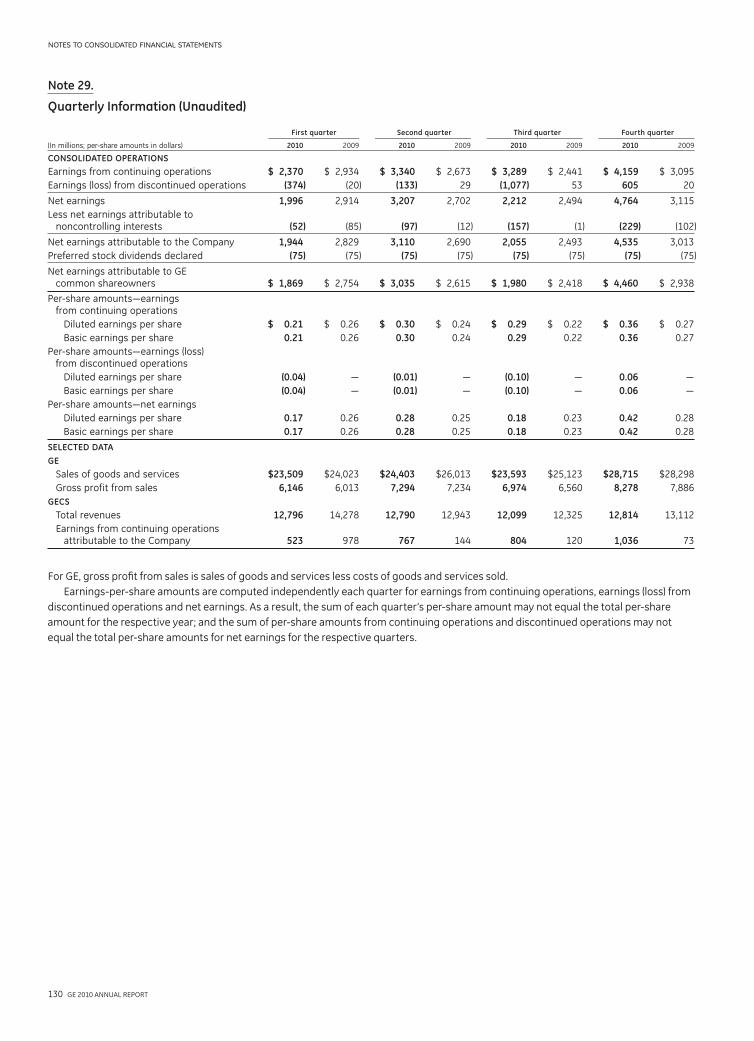
130 GE 2010 ANNUAL REPORT
notes to consolidated financial statements
Note 29.
Quarterly Information (Unaudited)
First quarter Second quarter Third quarter Fourth quarter
(In millions; per-share amounts in dollars) 2010 2009 2010 2009 2010 2009 2010 2009
CONSOLIDATED OPERATIONS
Earnings from continuing operations $ 2,370 $ 2,934 $ 3,340 $ 2,673 $ 3,289 $ 2,441 $ 4,159 $ 3,095
Earnings (loss) from discontinued operations (374) (20) (133) 29 (1,077) 53 605 20
Net earnings 1,996 2,914 3,207 2,702 2,212 2,494 4,764 3,115
Less net earnings attributable to noncontrolling interests (52) (85) (97) (12) (157) (1) (229) (102)
Net earnings attributable to the Company 1,944 2,829 3,110 2,690 2,055 2,493 4,535 3,013
Preferred stock dividends declared (75) (75) (75) (75) (75) (75) (75) (75)
Net earnings attributable to GE common shareowners $ 1,869 $ 2,754 $ 3,035 $ 2,615 $ 1,980 $ 2,418 $ 4,460 $ 2,938
Per-share amounts—earnings from continuing operations
Diluted earnings per share $ 0.21 $ 0.26 $ 0.30 $ 0.24 $ 0.29 $ 0.22 $ 0.36 $ 0.27
Basic earnings per share 0.21 0.26 0.30 0.24 0.29 0.22 0.36 0.27
Per-share amounts—earnings (loss) from discontinued operations
Diluted earnings per share (0.04) — (0.01) — (0.10) — 0.06 —
Basic earnings per share (0.04) — (0.01) — (0.10) — 0.06 —
Per-share amounts—net earnings
Diluted earnings per share 0.17 0.26 0.28 0.25 0.18 0.23 0.42 0.28
Basic earnings per share 0.17 0.26 0.28 0.25 0.18 0.23 0.42 0.28
SELECTED DATA
GE
Sales of goods and services $23,509 $24,023 $24,403 $26,013 $23,593 $25,123 $28,715 $28,298
Gross profit from sales 6,146 6,013 7,294 7,234 6,974 6,560 8,278 7,886
GECS
Total revenues 12,796 14,278 12,790 12,943 12,099 12,325 12,814 13,112
Earnings from continuing operations attributable to the Company 523 978 767 144 804 120 1,036 73
For GE, gross profit from sales is sales of goods and services less costs of goods and services sold.
Earnings-per-share amounts are computed independently each quarter for earnings from continuing operations, earnings (loss) from
discontinued operations and net earnings. As a result, the sum of each quarter’s per-share amount may not equal the total per-share
amount for the respective year; and the sum of per-share amounts from continuing operations and discontinued operations may not
equal the total per-share amounts for net earnings for the respective quarters.
Related Documents


![View Filing Data - Energy ElevenAccounting Policies [Abstract] Significant Accounting Policies [Text Block] Note 2. Summary of Significant Accounting Policies Basis of Presentation](https://static.cupdf.com/doc/110x72/603b5e6986e82e41465695c7/view-filing-data-energy-eleven-accounting-policies-abstract-significant-accounting.jpg)