Summary of Enhanced BSE Surveillance in the United States Prepared by Centers for Epidemiology and Animal Health National Surveillance Unit April 27, 2006

Welcome message from author
This document is posted to help you gain knowledge. Please leave a comment to let me know what you think about it! Share it to your friends and learn new things together.
Transcript

Summary of Enhanced BSE Surveillance in the United States
Prepared by Centers for Epidemiology and Animal Health
National Surveillance Unit April 27, 2006
2
Summary of Enhanced BSE Surveillance in the United States
Introduction
Since 1990, the U.S. Department of Agriculture (USDA) has taken aggressive measures to prevent the introduction and potential spread of bovine spongiform encephalopathy (BSE). Following the confirmation of BSE in an imported cow in December 2003, USDA designed and implemented an Enhanced BSE Surveillance Program to more accurately determine the level of disease present in the U.S. cattle population. The following report summarizes the data collected during the Enhanced BSE Surveillance Program as well as the information gathered from earlier surveillance efforts.
The Enhanced BSE Surveillance Program tested as many cattle as possible in the targeted high-risk population beginning June 1, 2004. Collection at an enhanced level has continued beyond 18 months to ameliorate concerns of trading partners. Experience in the United Kingdom and Europe has shown that if present, BSE is most likely to be detected in adult cattle exhibiting clinical signs consistent with the disease.
Base Estimate of High Risk Population
In general, the highest risk categories are adult cattle showing clinical signs involving the central nervous system (CNS), and dead and non-ambulatory cattle with clinical signs that could not be adequately evaluated. This population was estimated to total 445,886 adult cattle per year in the United States. This number was derived in part from National Animal Health Monitoring System (NAHMS) surveys of livestock producers and other estimates.
Specifically, in the 1997 NAHMS breeding beef cattle survey,1 U.S. producers reported that approximately 1.5 percent of the adult cattle population died annually. Producers attributed these losses to a variety of causes including digestive, respiratory, weather, and calving-related problems, as well as other known and unknown causes.
Similarly, in 2002, NAHMS data estimated that 4.8 percent of adult dairy cows die annually. Again, these losses were attributed to various causes. Calculations resulted in an estimate that 251,532 adult cattle die on-farm each year for unknown reasons, or reasons that could be consistent with BSE-related clinical signs.2 In addition, other described populations include 194,225 animals in the Food Safety and Inspection Service (FSIS) condemnation categories, and 129 reported foreign animal disease (FAD) investigations related to CNS abnormalities. These totals provide the basis for USDA’s estimate of 445,886 adult cattle per year in the targeted high-risk population.
1 NAHMS Part I: Reference of 1997 Beef Cow-Calf Management Practices. USDA:APHIS:VS: CEAH,
National Animal Health Monitoring System. June 1997. Fort Collins, CO. #N238.398. 2 NAHMS Part I: Reference of Dairy Health and Management in the United States. National Animal Health
Monitoring System. 2002. Fort Collins, CO. #N377.1202.

3
This estimate includes adult cattle in the following categories: • Condemned at slaughter for CNS signs; • Moribund; dead; injured or emaciated (FSIS data 2002); • CNS abnormalities reported for FAD investigations (APHIS data 2003); • Died on-farm of unknown causes; • Lameness or injury that resulted in euthanasia; and • Cattle that died with signs of incoordination or severe depression.
The sampling strategy was designed to target animals in these categories. Designation of Samples Collected during Enhanced BSE Surveillance Samples collected during the enhanced surveillance period were designated as “targeted” and “non-targeted.” Samples with valid test results having any of the following reasons for submission, regardless of age or other criteria, were categorized as “targeted” in the enhanced surveillance program:
• Highly suspicious for BSE; • CNS signs; • Rabies suspect; • FSIS antemortem condemnation code of “CNS signs” or “rabies.”
Other samples collected during the period associated with the enhanced surveillance that did not meet the above criteria were considered as follows:
• Samples with a reason for submission of “FSIS antemortem condemnation” were recorded as targeted only if the condemnation code listed nonambulatory, injuries, tetanus, dead, or moribund. In addition, the sample must have originated from cattle with a recorded age of 30 months or older, or from cattle with a recorded age of 24 to 29 months with the second set of incisors erupted.3
• Samples with a reason for submission of nonambulatory, dead, or other clinical signs that may be associated with BSE were recorded as targeted if they originated from cattle with a recorded age of 30 months or older, or from cattle with a recorded age of 24 to 29 months with the second set of incisors erupted.
• Samples with a reason for submission of “apparently healthy animal at slaughter” were recorded as targeted if they were collected at a slaughter plant and they originated from cattle with a recorded age of 30 months or older, or with the second set of incisors erupted.
3 Eruption of at least one of the second set of permanent incisors was used as the criterion upon which
cattle were determined to be at least 30 months of age.

4
Samples with the following invalid test results were not included in the targeted population and were excluded from this report:
• Samples in which submitted tissue was not obex;4 and • Samples not tested or where results have not been recorded in the BSE
Surveillance database.
Between June 1, 2004, and March 17, 2006, BSE samples were collected from 5,776 unique locations across the United States. These locations included slaughter plants, renderers, farms, public health laboratories, veterinary diagnostic laboratories, and salvage slaughter (3D-4D)5 plants.
Overall, 647,045 samples were designated as “targeted” based on the enhanced surveillance criteria discussed above. Among these samples USDA identified two confirmed positives over this time period (0.0003 percent test positive). Table 1 summarizes the number of samples from each type of collection site.
Sample collectors were required to categorize submissions into one of eight submission type categories. These categories were not those provided in the World Organization for Animal Health (OIE) Code for BSE surveillance, but offered a greater level of detail that facilitated later classification into the OIE surveillance streams.
Samples categorized as antemortem condemnations by FSIS personnel were further classified by 1 of 30 specific condemnation reasons providing further detail about each submission. Table 2 summarizes the number of targeted samples for each submission type.
Table 1. Number of targeted samples tested by collection site type from June 1, 2004, through March 17, 2006
Collection Site Targeted Samples % of Total
Slaughter Plant* 32,560 5.03
Renderer 356,879 55.16
On-Farm 34,464 5.33
Public Health Lab 191 0.03
Diagnostic Lab 2,804 0.43
3D-4D 202,844 31.35
Other 17,303 2.67
TOTAL 647,045 100.00* Does not include antemortem condemned animals transported to offsite facilities (3D/4D collection sites) for sampling.
4 The BSE test employed was designed for use on brain tissue from the obex region. Significance of results
from outside the obex region is unknown, so these results were considered invalid. 5 3D/4D facilities are slaughter facilities that salvage meat from dead, dying, disabled, or diseased animals,
the meat from which would not likely pass inspection for human consumption (i.e., edible meat). Much of this meat goes into either pet food or rendering.
5
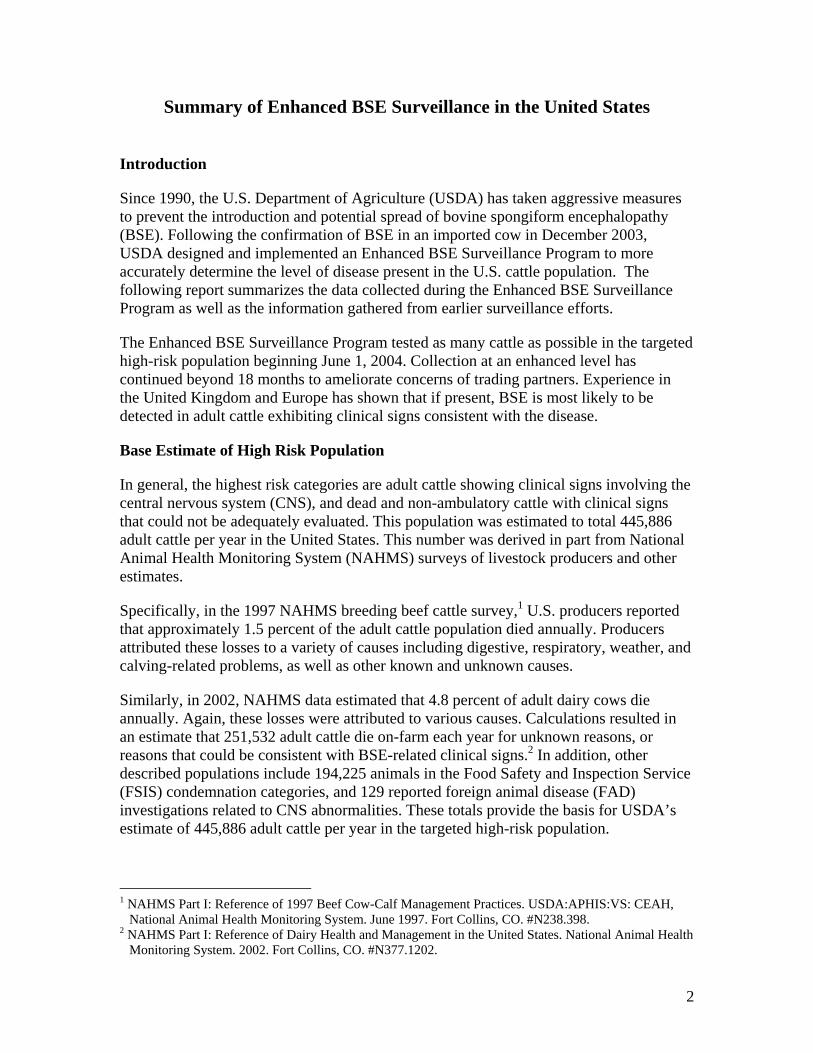
Table 2. Number of targeted samples tested by submission category from June 1, 2004, through March 17, 2006
Submission Type Targeted Samples % of Total
Highly suspicious 8 0.001
Non-ambulatory 38,629 5.97
Dead 550,179 85.03
CNS signs 373 0.06
Other clinical signs (that may be associated with BSE) 807 0.12
Rabies suspect 353 0.05
Antemortem condemnation^ 35,549 5.49
Condemnation reason=CNS disorders Condemnation reason=Dead Condemnation reason=Moribund Condemnation reason=Non-ambulatory Condemnation reason=Other condemnation category
410 24,695
749 9,340
355
0.063.820.121.440.05
Apparently normal 21,147 3.27
TOTAL 647,045 100.00^ All samples from cattle condemned at antemortem inspection are included in this category (e.g., cattle condemned as
“non-ambulatory” at antemortem inspection are included here, not in the separate “non-ambulatory” category above). Antemortem condemned animals were sampled in the slaughter plant or transported to an offsite facility (3D/4D site).
Distribution of Samples To promote national representation and to facilitate management of the surveillance effort, targeted sampling goals were provided for each of six pre-defined regions. These regions were defined primarily for administrative purposes and not by epidemiologic factors, in order to achieve the surveillance goal of detecting BSE at specific levels in the United States as a whole.
Regional goals were based on the planned number of samples to be collected nationwide (268,500) and apportioned by the total cattle population estimates in each region.
The distribution of samples is summarized by the region of the sample collection site (Table 3 and Figure 1) and by the last residence of the sampled animal (Table 4 and Figure 2).

6
Table 3. Number of targeted samples tested from June 1, 2004, through March 17, 2006, by region of collection site
Region States Within Region Targeted samples % of Total
Northeast (NE) ME, NH, VT, MA, CT, RI, NY, PA, NJ, DE, MD, WV, OH, DC 84,621 13.08
Southeast (SE) VA, NC, SC, KY, TN, MS, AL, GA, FL, PR 54,982 8.50
North Central (NC) MN, WI, IL, IN, MI 166,956 25.80
South Central (SC) TX, OK, KS, NE, IA, MO, AR, LA 129,510 20.02
Southwest (SW) CA, NV, UT, AZ, CO, NM, HI 161,369 24.94
Northwest (NW) WA, OR, ID, MT, WY, ND, SD, AK 49,607 7.67
TOTAL 647,045 100.00
Figure 1. Number of targeted samples collected from June 1, 2004, through March 17, 2006, by region of collection site
NW49,607
SW161,369
NC166,956 NE
84,621
SE54,982SC
129,510
7
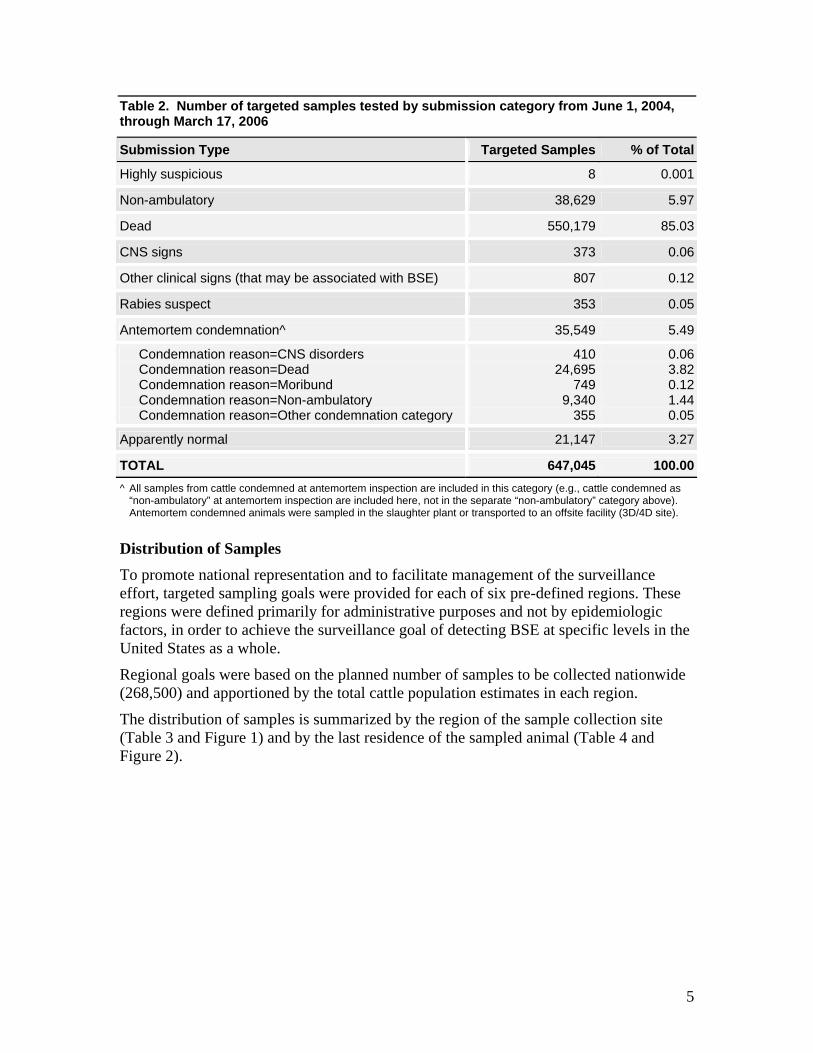
Table 4. Number of targeted samples tested from June 1, 2004, through March 17, 2006, by region where animal last resided
Region States Within Region Targeted samples % of Total
Northeast (NE) ME, NH, VT, MA, CT, RI, NY, PA, NJ, DE, MD, WV, OH, DC 88,568 13.69
Southeast (SE) VA, NC, SC, KY, TN, MS, AL, GA, FL, PR 51,078 7.89
North Central (NC) MN, WI, IL, IN, MI 181,577 28.06
South Central (SC) TX, OK, KS, NE, IA, MO, AR, LA 117,879 18.22
Southwest (SW) CA, NV, UT, AZ, CO, NM, HI 156,828 24.24
Northwest (NW) WA, OR, ID, MT, WY, ND, SD, AK 51,115 7.90
TOTAL 647,045 100.00
Figure 2. Number of targeted samples tested from June 1, 2004, through March 17, 2006, by region where animal last resided over the regional targeted sampling goals, including percentage of target
NW51,11536,500
= 140%
= 303%SW
156,82851,723
= 175%SC
117,87967,403
= 158%SE
51,07832,264
= 250%NE
88,56835,394
= 402%NC
181,57745,166
8
The enhanced surveillance plan6 was designed to provide a 99 percent confidence level; i.e., if 268,500 animals were sampled with zero positive, USDA’s Animal and Plant Health Inspection Service (APHIS) would be 99 percent confident that the prevalence of BSE was less than 1 in 10 million adult cattle. The BSE enhanced surveillance data represent a very large, targeted sample covering all cattle producing regions in the country. The original sample size for each region was based on the assumption that the number of animals in the target population was a fixed proportion of the number of cows in the region. Because cattle infected with BSE are nearly always infected within their first year of life, their location at the time of infection is most relevant to BSE prevalence estimation. The original sampling design considered this by targeting numbers of samples according to the proportion of adult cows within each region. However, because APHIS did not restrict the number of samples that would be collected by region, collection site type or submission type in this voluntary program, the degree to which each region exceeded its goals differs.
OIE Standards for BSE Surveillance
The OIE was created in 1924 when 28 countries agreed to form an intergovernmental organization to provide guidance on animal health issues. Currently, a total of 167 member countries belong to the OIE, which is based in Paris. Within its mandate under the World Trade Organization Sanitary and Phytosanitary Agreement, the OIE helps to safeguard world trade by publishing health standards for international trade in animals and animal products. The OIE guidelines facilitate international trade. To determine the extent to which the U.S. surveillance is consistent with the OIE guidelines, we have evaluated and classified surveillance data over the past seven years according to OIE standards.
The OIE collects and analyzes the latest scientific information on animal disease control. This information is then made available to the member countries to help them improve the methods used to control and eradicate these diseases. Guidelines are prepared by a network of 156 OIE collaborating centers and reference laboratories around the world. The OIE develops normative documents relating to rules that member countries can use to protect themselves from the introduction of diseases and pathogens, without establishing unjustified sanitary barriers.7
In May 2005, the OIE General Assembly approved a new chapter and appendix for BSE surveillance. This approach assigned point values to each sample, based on animal age and the subpopulation it was from, and the likelihood of detecting infected cattle of that age in that subpopulation. (Prior to May 2005, the OIE had recommended a surveillance level based on the size of the adult cattle population – for the United States that number was 433 samples with clinical signs consistent with BSE per year.) Sample values were classified in the OIE system as belonging to four surveillance strata (streams): clinical suspect, casualty slaughter, fallen stock, and healthy slaughter. Samples were also
6 USDA BSE Surveillance Plan: http://www.aphis.usda.gov/lpa/issues/bse/BSEOIG.pdf, available as of
April 20, 2006. 7 http://www.oie.int/eng/OIE/en_oie.htm available as of April 20, 2006.
9
stratified by age. Because the clinical suspect animals are much more valuable for surveillance and are thus awarded more points than the other streams, it is critically important to correctly identify animals in this category. Under-reporting would result in more intensive surveillance than necessary to achieve public and animal health safety. Conversely, wrongly classifying non-suspect animals would inflate the value of surveillance and bias the disease prevalence estimate.
Allocation of Samples to OIE Surveillance Streams
Most countries in the world, including the United States, have not collected BSE data specifically based on the four surveillance streams. Moreover, neither the OIE nor countries which have classified animals in the streams have published objective criteria for categorizing animals. Instead, these entities have generally relied on expert opinion or qualitative descriptions of signs compatible with BSE to categorize animals (OIE 2005).
The U.S. Enhanced BSE Surveillance Program collected 667,767 samples8 between June 1, 2004, and March 17, 2006, that were eligible for the surveillance points described in Table 2 of the new code. Personnel from APHIS’ Veterinary Services (VS) and contractors submitted samples under one of the following eight submission types: highly suspicious for BSE, CNS signs, rabies suspect, nonambulatory, dead, other clinical signs that may be associated with BSE, antemortem condemned by FSIS, and apparently healthy. Each submission was accompanied by at least 1 of 38 specific clinical signs. Samples submitted under the submission type of “antemortem condemned” included the reason for condemnation (selected from 30 condemnation codes).
The four surveillance streams identified in the OIE Code9 are as follows:
1. Clinical suspects. These cattle are over 12 months old, displaying behavioral or clinical signs consistent with BSE. Because they are valued by the OIE tables at several tens to hundreds of times higher than the other categories, this stream was given increased attention in the analysis.
2. Casualty slaughter. These cattle are over 12 months, non-ambulatory, recumbent, unable to rise or to walk without assistance, sent for emergency slaughter, or condemned at antemortem inspection.
3. Fallen stock. These cattle are over 12 months and found dead on-farm or during transport to or at an abattoir.
4. Healthy slaughter. These cattle are over 12 months or with the second incisor erupted exhibiting no clinical signs consistent with BSE or other diseases. Only in 2005 were healthy animals specifically targeted for inclusion in the overall surveillance.
8 Note that this includes the healthy slaughter surveillance stream that was not included in the targeted
population for enhanced surveillance. 9 Surveillance guidelines and points table for surveillance streams available as of March 1, 2006 at
http://www.oie.int/eng/normes/mcode/en_chapitre_3.8.4.htm

10
Cattle were categorized in the clinical suspect stream if they were submitted under the submission types of highly suspicious for BSE, rabies suspects, CNS signs, or antemortem-condemned by FSIS with condemnation codes for CNS signs or rabies. In addition, many samples with a clinical history of signs likely to be associated with BSE were submitted in other categories. Many of these represented valuable samples, but the OIE definition of “clinical suspect” did not readily differentiate them from animals with other clinical signs compatible with BSE. Some of these cattle were subsequently categorized as clinical suspects by comparing the likelihood of finding the signs in histopathologically confirmed cases reported in the United Kingdom10 with the likelihood of finding the signs in uninfected animals from the enhanced surveillance targeted population. For example, if a sign or combination of signs were found 30 percent of the time in BSE cases, but only once in every 1,000 uninfected animals (0.1 percent), then it would be 0.30/0.001= 300 times more likely to occur in the cases (likelihood ratio=300 in this case). A likelihood ratio threshold of 807 was established as a cutoff value for determination of clinical suspects. This threshold was estimated using input data from the United Kingdom in the BSurvE11 model, which provided the average (expected) value for the ratio of probability of an infected animal showing clinical signs to an uninfected animal showing clinical signs (see appendix for more information on determination of cutoff value). Thus, if a sample was submitted from an animal with combinations of clinical signs at least 807 times more likely to have been seen in BSE cases than in the U.S. high-risk population, it was classified as a clinical suspect.
Cattle with likelihood ratios below the threshold were allocated into surveillance streams according to the animal’s submission type as follows:
• Submission types of “Nonambulatory” were classified in the “casualty slaughter” stream;
• Submission types of “Other clinical signs that may be associated with BSE” were classified in the “casualty slaughter” stream;
• Submission types of “FSIS antemortem condemned” were classified in the “casualty slaughter” stream as long as the condemnation reason was not “dead”;
• Submission types of “FSIS antemortem condemned” with a condemnation code of “dead” were classified in the “fallen stock” stream;
• Submission types of “dead” were classified in the “fallen stock” stream; and
• Submission types of “apparently healthy” were classified in the “healthy slaughter” stream.
10 Wilesmith JW, Ryan JB, and Hueston WD. 1992. Bovine spongiform encephalopathy: Case-control
studies of calf feeding practices and meat and bonemeal inclusion in proprietary concentrates. Research in Veterinary Science 52:325:31.
11 Available as of April 20, 2006 at http://www.bsurve.com. The BSurvE tool is a Microsoft Excel spreadsheet application designed to estimate BSE prevalence based on targeted sampling strategies.

11
Samples without valid test results were excluded from the analysis. These included 5,558 samples not tested (ex., because of poor sample quality upon arrival at the laboratory); 7,378 samples in which the submitted tissue was not obex; 4,570 samples for which no test result was recorded; and 27 samples for which no submission type was recorded.
Recording of cattle age was required for all samples submitted during the enhanced surveillance period. Following the first 5 months of sample collection, ages were recorded in a continuous fashion in years or months (i.e., not an age range) according to the actual or estimated age of the animal. However, during the first 5 months of sample collection, ages were recorded categorically. Two of the categories, “5 years or more,” and “adult cannot estimate age,” did not correspond to a specific analogous age as recorded in a continuous fashion. Therefore, ages for these samples were distributed proportionate to samples with known ages. Ages for cattle categorized as “5 years or more” were distributed proportionate to the known ages of 5 years or greater, and ages for cattle categorized as “adult, cannot estimate age” were distributed proportionate to the known ages of 30 months or greater. Allocation of Earlier Samples into OIE Surveillance Streams BSE surveillance samples from 1999 through 2003 were collected before the OIE surveillance streams were established in 2005 and were not submitted with the same clinical history as that used for the enhanced surveillance in 2004-2005. In order to apply the OIE point tables, data about these samples were requested from the National Veterinary Services Laboratories (NVSL) and were sorted by Centers for Epidemiology and Animal Health (CEAH) epidemiologists based on the history included with sample submission records.
Animals submitted as rabies suspect negative, FSIS antemortem condemned for CNS signs, and FAD investigations for BSE were categorized as clinical suspects. Additionally, the epidemiologists evaluated animals with other signs compatible with BSE for inclusion in the clinical suspect category on a case-by-case basis.
Because age determination was not mandatory for sample collectors in 1999-2003, many samples were submitted with age recorded as “unknown.” Age is important in determination of point values assigned to samples within each surveillance stream. As such, we chose the most straightforward assumption, and ages for these samples were distributed proportionate to the number of samples within the same time period with known ages. Table 5 summarizes the total BSE surveillance samples collected in each OIE surveillance stream from April 1, 1999, through March 17, 2006.

12
Table 5. OIE points from BSE surveillance in the U.S. accumulated for 7 years
Year of testinga Total samplesb
Clinical suspects
Fallen Stock
Casualty slaughter
Healthy slaughter
OIE pointsc
10/1/2005 to 03/17/2006d 181,564 438 142,337 18,991 19,798 285,491
FY e 2005 413,647 1,527 361,557 50,557 6 899,642
FY 2004 90,085 1,066 62,054 25,096 1,869 592,369
FY 2003 20,778 577 3106 16,613 482 267,480
FY 2002 20,380 569 2,818 16,045 948 251,740
FY 2001 5,340 665 1 4,515 159 299,177
FY 2000 2,753 664 0 2,064 25 266,891
4/1/1999 to 9/30/1999f 666 265 15 351 35 111,014
Total surveillance (including enhanced
surveillance) 735,213 5,771 571,888 134,232 23,322 2,973,804
Total for enhanced surveillance only
6/1/2004 to 03/17/2006 667,767 2,602 559,546 84,534 21,085 1,583,127
a Testing includes the most recent 7 years of data collected from Apr. 1, 1999, through March 17, 2006. b Number of samples and clinical suspects represents animals eligible for surveillance according to the Terrestrial Animal
Health Code Article 3.8.4. c NOTE: Animals counted as eligible for OIE points included animals older than 1 year according to the OIE point
allocation table. Removal of points from the “juvenile” category of the OIE points table would decrease the total by 2,843 points. Other documents showing U.S. data may vary due to inclusion or exclusion of young animals.
d Includes 6 months of Fiscal Year 2006 e Fiscal Year extends from Oct. 1 through Sept. 30, e.g., FY 2005 begins on 10/1/2004 and ends on 9/30/2005. f Includes 6 months of Fiscal Year 1999
Note that cattle younger than 30 months old (indicated by second set of incisors not erupted) were not counted as “targeted” in the U.S. Enhanced BSE Surveillance Program. However, sample totals that appear in this table of OIE points included cattle 1 year or older, which explains the differences in enhanced BSE surveillance totals above (667,767) from totals reported for “targeted” samples (647,045). There is also a discrepancy in the OIE code text definition of age for clinical suspects (over 30 months) and that found in the tables used to calculate surveillance points (12 months or older). Although samples from animals in the youngest (“juvenile”) category of the OIE table were included in the points analysis, they represent only 2,843 of a total 2,973,804 points and had a negligible influence on the outcome of the analysis.

13
Conclusions It is evident from Table 5 that the level of BSE surveillance in the United States for the last 7 years far exceeds OIE guidelines. The target number of points that a country uses to establish Type A surveillance – surveillance associated with a status of controlled risk –may be accumulated over a maximum of 7 years12. For example, a “target” for a large cattle population is 300,000 points or 1/7 x 300,000 for each of 7 years (42,857 total points per year). Data acquired through the Enhanced BSE Surveillance Program will be used in designing a BSE maintenance surveillance plan for the United States. As compared to enhanced surveillance, maintenance surveillance levels require a much smaller sample size. Efforts to optimize the sensitivity and representativeness of the surveillance findings are especially necessary for maintenance surveillance. Analysis of the data collected in the enhanced surveillance program will facilitate maximizing the value of each sample collected in the maintenance surveillance program. Data acquired in the Enhanced BSE Surveillance Program will also be used to calculate a probable prevalence of BSE in the United States.
12 OIE code Appendix; article 3.8.4.3
14
Appendix
Allocation of cattle as Clinical Suspects using a likelihood-based approach Both the BSurvE model and the OIE (2005) surveillance standards refer to four surveillance streams: healthy slaughter, fallen stock, casualty slaughter, and clinical suspect. Although the United States and most other countries have not collected BSE data specifically based on the four surveillance streams, in many cases, they have collected data on clinical signs exhibited by the animals. The OIE has not published objective criteria for the categorization of animals. It relies heavily on expert opinion or qualitative descriptions of signs that are compatible with BSE to categorize animals (OIE 2005). Because samples collected in the U.S. enhanced surveillance effort were not identified as members of particular surveillance streams, allocating the samples was a post-hoc exercise. Allocating samples into the clinical suspect surveillance stream should be done objectively and transparently. One method compatible with OIE guidelines is to rely on expert opinion or judgment to allocate animals according to their clinical presentation. Another method is to quantify the likelihood of samples being from BSE infected cattle, based on the theory that cattle with the highest likelihood of being BSE-infected should be considered clinical suspects. Although any means of assigning animals to surveillance streams relies in part on expert judgment, the method described below provides a more objective and reproducible approach than the alternative based on expert opinion alone. Samples from animals with obvious evidence of CNS disease (e.g., cattle with submission types of CNS signs, rabies suspects, highly suspicious for BSE, or condemned by FSIS for CNS disease) were designated as clinical suspects since CNS disease is clearly consistent with BSE. For other samples for which the clinical suspect determination was not as apparent, we used a threshold likelihood value to determine which samples were, and were not, clinical suspects. The threshold value of interest distinguishes between clinical suspects and all other surveillance streams. It is assumed that an animal that is not a clinical suspect can be easily determined to fit within the fallen stock, casualty slaughter, or healthy slaughter surveillance streams. We derived this threshold value by applying United Kingdom data to the BSurvE model. A Likelihood-Based Algorithm The probability of finding BSE clinical signs among BSE-infected cattle was determined from 17,154 histopathologically diagnosed animals in the United Kingdom (Wilesmith 1992, see table A1). The probability of a clinical sign given an animal is diseased is equivalent to determining the sensitivity (Se) of a test: [P(s|D)], where “s” denotes the clinical sign and “D” denotes the presence of disease. Similarly, the probability of a clinical sign given no disease is equivalent to one minus the specificity of a test where specificity is the probability of not having the sign given that the animal is not infected: [1-P(~s|~D)], where ~s and ~D denote the absence of the clinical sign and disease, respectively. This likelihood was calculated from U.S.
15
surveillance data in which all samples were negative (except two cases). The probability of a clinical sign given no disease was then equal to the number of submissions having the sign divided by the number of animals without disease: [P(s|~D)]. The ratio of these two numbers is the likelihood that an animal with the clinical sign has BSE compared to an animal without BSE: P(s|D) / P(s|~D). For example, if an animal is presented with the clinical sign “loss of weight” where Se=79.1 percent and Sp=99.627 percent, the ratio of Se/(1-Sp)=212. In other words, an animal presenting with a clinical sign of “loss of weight” is 212 times more likely to have BSE than to not have BSE. If n clinical signs are present, the likelihood ratio becomes the product of the sensitivity of each sign divided by the product of the complement of specificity of each sign: (Se1*Se2*…,Sen )/ ((1-Sp1)*(1-Sp2)*…(1-Spn)). Animals were considered to be clinical suspects if the likelihood ratio was greater than or equal to 807. That is, any animals with signs that were at least 807 times more likely among BSE cases than in APHIS’ uninfected population were considered to be clinical suspects. Estimating the Specificity of BSE Clinical Signs There are 38 clinical signs on the USDA BSE sample submission form. Researchers in the United Kingdom summarized the frequency of 23 clinical signs that occurred at a frequency greater than 1 percent among known BSE-infected cattle (Wilesmith et al. 1992). Our first challenge, therefore, was to categorize the USDA’s 38 clinical signs into the 23 clinical signs of Wilesmith et al.1992 Six of the 23 signs were either not recorded in the U.S. surveillance or were not easily matched. For example, U.S. surveillance did not explicitly report the following clinical signs: parlor kicking, fetlock knuckling, temperament changes, nervous of entrances, abnormal ear carriage, or head shyness. Likewise, the United Kingdom data did not include the sign of “bulging eyeballs” (exopthalmia). The U.S. data categories collapsed readily into the remaining 17 clinical signs from the United Kingdom report. For example, both “ataxic” and “abnormal gait” were considered to be signs of “ataxia.” In the context of clinical signs, specificity is the likelihood that uninfected cattle will not exhibit a clinical sign. The complement of this specificity is the likelihood that uninfected cattle will exhibit the clinical sign. Estimation of specificity requires sampling of uninfected cattle and noting the frequency of clinical signs within the sample. In this manner, specificity is estimated as:
i
iClinicalSign
No. with ClinicalSignSp 1Total uninfected cattle sampled
= − .
We estimate the specificity of each of the 23 clinical signs using the U.S. enhanced surveillance data. This approach assumes all cattle (except two) sampled in the U.S.
16
surveillance were BSE-uninfected. This approach also assumes our categorization of U.S. clinical signs into the clinical signs from the United Kingdom report is accurate. In some cases, there is a one-to-one correspondence between the United States and Wilesmith et al. (1992) clinical signs (Table A1). In these cases, specificity was calculated as described above. For example, the U.S. clinical sign “decreased milk yield” directly corresponds with “reduced milk yield” from the United Kingdom report. Because 562 cattle in the U.S. enhanced surveillance effort reportedly had decreased milk yield, the estimated specificity of “reduced milk yield” is:
Spreduced milk yield = 1 – ___562 = 99.916% 667,767 We base this estimate on the 667,767 cattle tested in the U.S. enhanced surveillance program. Similar estimation procedures apply to the following clinical signs: apprehension, abnormal head carriage, excessive licking, falling, teeth grinding, and head pressing/rubbing. Two or more USDA clinical signs often fit within one of the clinical signs from Wilesmith et al. (1992). In such cases, estimation of clinical sign specificity is complicated because cattle in the U.S. enhanced surveillance effort could potentially exhibit multiple clinical signs that overlapped with one of the United Kingdom report’s categories. For example, the clinical sign “loss of weight” comprises USDA’s “off feed” (591 samples) and “thin (underweight)” (1899 samples) clinical signs. If cattle in the U.S. enhanced surveillance effort could only exhibit one of the two clinical signs, then we can calculate specificity using the total number of cattle that exhibited either USDA clinical sign (i.e., 591 + 1899). Nevertheless, there were 165 cattle that exhibited both “Off Feed” and “thin (underweight)” clinical signs. These cattle must be subtracted to estimate specificity of “loss of weight.” In other words, the specificity for “loss of Weight” is estimated as:
Sploss of weight = 1 – (591+1899-165) = 99.652% 667,767 A similar procedure was used to estimate specificity for the United Kingdom report’s clinical signs of ataxia, abnormal behavior, frenzy, recumbency, paresis and tremors. For other clinical signs (e.g., hyperesthesia), there was no overlap in the occurrence of apparently similar USDA clinical signs.

17
Table A1. The correspondence between USDA and Wilesmith et al. (Wilesmith 1992) clinical signs. Specificity estimates are based on the U.S. enhanced surveillance data as explained in the text. Sensitivity was previously estimated by Wilesmith et al. The likelihood ratio is calculated for each of Wilesmith’s clinical signs. *Number of cattle in U.S. survey reporting the following signs.
USDA BSE Clinical Signs *Number of cattle in USDA survey
Estimated Specificity
Wilesmith et al. (1992) Clinical Signs
Estimated Sensitivity
Likelihood ratio
Aggressive 230 99.758% Abnormal Behavior 0.63 260Belligerent 73 99.758% Abnormal Behavior 0.63 260Depressed 1,197 99.758% Abnormal Behavior 0.63 260Excessive Bellowing 37 99.758% Abnormal Behavior 0.63 260Stupor 81 99.758% Abnormal Behavior 0.63 260Droopy Lip or Eyelid 76 99.989% Abnormal Head Carriage 0.492 4,323Apprehension / nervous 150 99.978% Apprehension 0.858 3,820Abnormal Gait 265 99.865% Ataxia 0.77 570Ataxia (uncoordinated) 637 99.865% Ataxia 0.77 570Blindness 245 99.953% Blindness 0.017 36Pupils Dilated 61 99.953% Blindness 0.017 36Pupils Pinpoint 7 99.953% Blindness 0.017 36Aimless wandering 12 99.971% Circling 0.02 69Circling 181 99.971% Circling 0.02 69Licking Muzzle 38 99.994% Excessive Licking 0.416 7,310Injuries (poss. CNS related) 205 99.969% Falling 0.4 1,303Frenzy / Hysteria / Mania 21 99.981% Frenzy 0.305 1,643Overly Excitable 103 99.981% Frenzy 0.305 1,643Head Pressing (against object) 48 99.993% Head Pressing/Rubbing 0.181 2,518Sensitive to Light 1 99.997% Hyperesthesia 0.753 27,936Shifting Ears 17 99.997% Hyperesthesia 0.753 27,936Off Feed 591 99.627% Loss of Weight 0.791 212Thin (underweight) 1,899 99.627% Loss of Weight 0.791 212Coma (unconscious) 53 99.404% Paresis 0.08 13Paralyzed / rigid or relaxed 3,930 99.404% Paresis 0.08 13Convulsions / Seizures 108 91.708% Recumbency 0.146 2Down (describe in comments) 45,403 91.708% Recumbency 0.146 2On Side (head back, paddling) 3,056 91.708% Recumbency 0.146 2Tetany 65 91.708% Recumbency 0.146 2Weak / rigid or relaxed 6,740 91.708% Recumbency 0.146 2Decreased Milk Yield 562 99.916% Reduced Milk Yield 0.608 722Grinding Teeth 97 99.985% Teeth Grinding 0.391 2,692Head Tremors 77 99.963% Tremors 0.682 1,829Nystagmus (eye movements) 47 99.963% Tremors 0.682 1,829Tremors 125 99.963% Tremors 0.682 1,829

18
Combinations of BSE Clinical Signs: Estimating Sensitivity and Specificity Cattle sampled for BSE often exhibited multiple clinical signs prior to sampling. Estimating the sensitivity and specificity of combinations of clinical signs has been accomplished using datasets consisting of known infected and uninfected cattle (Braun 1999;Cockcroft 2000). Nevertheless, these datasets comprised 100 or fewer cattle and the analyses only considered a limited number of clinical signs. The frequency of combinations of clinical signs was directly assessed from those data. In the United States, we are unable to assess the frequency of all possible combinations of clinical signs among BSE-infected cattle. Furthermore, if we had data from infected cattle to analyze, it seems that credible estimates of the sensitivity of combinations of large numbers of clinical signs could only be made with very large datasets. A similar problem exists for estimating the specificity of combinations of clinical signs. Although we have a large dataset from uninfected cattle, the low frequency at which most individual clinical signs typically occur provides limited observations of combinations of clinical signs. In lieu of an empiric method, we can use an analytic method to estimate the sensitivity and specificity of combinations of clinical signs (Figure A1). Consider two clinical signs (s1 and s2) that occur among infected and/or uninfected cattle. The likelihood of an animal having both clinical signs equals p1 x p2 where p1 and p2 are the probabilities for occurrence of each sign. If we consider an infected animal – and assume the clinical signs are uncorrelated – then p1 and p2 are the sensitivities of s1 and s2, respectively. If an animal is uninfected and the clinical signs are uncorrelated, then p1 and p2 equal one minus the specificities of s1 and s2, respectively. Because p1 and p2 are both less than one, their product is small and the specificity of the combination of clinical signs [1 – (p1 x p2)] is large. Combinations of clinical signs are more specific but less sensitive than clinical signs that occur singly. This conclusion is analogous to interpreting the results of two diagnostic tests in series. The sensitivity of two diagnostic tests interpreted in series is less than the sensitivity of either test alone. We are requiring an infected animal to be positive for both tests (clinical signs) before we classify the animal as positive. Similarly, the specificity of two diagnostic tests interpreted in series is greater than the specificity of either test alone. We are requiring an uninfected animal to be positive on both tests (clinical signs) before we consider it positive. This method for estimating the sensitivity and specificity of combinations of clinical signs is valid if: (1) we wish to maximize the positive predictive value of the combined clinical signs (maximize the chance of disease given signs) and (2) we assume the occurrences of clinical signs are uncorrelated.

19
Because we are using this method to identify BSE-clinical suspects from among the cattle sampled, it is prudent to emphasize positive predictive value in our analysis. Positive predictive value tells us the likelihood that an animal with a particular set of clinical signs is truly infected. We want BSE-clinical suspects to be cattle that are most likely to be BSE-infected. Although the clinical signs may correlate among sampled cattle, an assumption of no correlation makes our analysis easier to manage. An alternative approach that accounts for correlation among clinical signs would require examining all two-, three-, four-way etc. combinations of clinical signs and imputing the specificity of these combinations using Bayes Theorem. Estimates derived using this approach would be uncertain because numbers would be small. Furthermore, this method could only be used for specificity because we do not have access to infected cattle data. Assuming uncorrelated clinical signs could be conservative with respect to estimated positive predictive values. Positive predictive values increase as sensitivity and specificity increase, but accounting for correlations will likely increase sensitivity and decrease specificity. Therefore, the relative changes in sensitivity and specificity would ultimately determine if positive predictive value increased or decreased once we incorporated the effects of correlation. There is some empiric evidence suggesting the assumption of uncorrelated clinical signs is reasonable (Table A2). From a study involving 50 BSE-infected cows and 22 cows without BSE, the sensitivity and specificity of three broad clinical sign categories were estimated (Braun 1999). The sensitivity and specificity of combinations of these clinical
Infected orNon - infectedanimal
s1|D
s2|D
p1
1 – p1
p2
1- p2
p2
1- p2
Infected orNon - infectedanimal
s2|D
s2|~D
p1
1 – p1
p2
1- p2
p2
1- p2
s1|~D
s2|~D
Figure A1. A schematic representation of the occurrence of two clinical signs (s1 and s2) is shown.

20
signs were also directly observed from the data. Assuming uncorrelated clinical signs, we can predict the sensitivity of combinations by calculating the product of the sensitivities of each clinical sign. For example, we calculate the sensitivity of a combination of changes in behavior, response to stimuli and locomotion as:
86.4% 96.0% 98.0% 91.8%= × × Assuming uncorrelated clinical signs, we similarly predict the specificity of combined clinical signs. For example, the specificity of a combination of changes in behavior, response to stimuli and locomotion was calculated as follows:
( ) ( )61.0% 1 1 0.091 (1 0.409) 1 0.273= − − × − × −⎡ ⎤⎣ ⎦ In general, the results in Table A2 suggest it is reasonable to assume uncorrelated clinical signs. Nevertheless, the reported specificity of the combination of changes in response to stimuli and locomotion does suggest some correlation in these clinical signs. In this case, the predicted specificity (57 percent) is greater than the observed specificity (36.4 percent), a result that suggests these clinical signs are correlated among uninfected cattle. Table A2. Sensitivity and specificity of clinical signs estimated from Braun et al. (Braun 1999) are shown for three categories of clinical signs, as well as their combinations. The predicted sensitivity and specificity of combinations assumes clinical signs are uncorrelated.
Clinical sign category Observed sensitivity
Predicted sensitivity
(assuming no correlation)
Observed specificity
Predicted specificity
(assuming no correlation)
Changes in behavior* 96.0% NA 9.1% NA Changes in response to stimuli 98.0% NA 40.9% NA Changes in locomotion 91.8% NA 27.3% NA Changes in behavior, response to stimuli and locomotion 85.7% 86.4% 63.6% 61.0%
Changes in behavior and response to stimuli 94.0% 94.1% 45.4% 46.0%
Changes in response to stimuli and locomotion 89.8% 89.9% 36.4% 57.0%
Changes in behavior and locomotion 87.8% 88.0% 36.4% 34.0%
* Sensitivity is calculated as 48/50; specificity is calculated as 2/22.

21
Determining Threshold Likelihood Ratio Value for Clinical Suspect Category
The likelihood ratio ( Se1-Sp
=l ) we calculate from our analysis of clinical signs describes
the relative likelihood of having a set of clinical signs given that an animal is infected (Se) or uninfected (1-Sp). In other words, an infected animal is l times more likely than an uninfected animal to present with the set of clinical signs used to estimate l . Clinical suspects are defined as those “animals showing neurological signs that may be due to BSE” (User Instructions for BSurvE Workshops, June 14-17, 2004). There is no objective criteria (i.e., clinical signs, or combinations of clinical signs), that classify an animal as a clinical suspect. Seemingly, those cattle whose clinical signs result in the largest values of l should be considered clinical suspects. Yet, the value for l that constitutes the threshold between members of the clinical suspect surveillance stream and members of the other, less valuable, surveillance streams has not been previously provided. The BSurvE model determines the value of samples within surveillance streams based on a likelihood ratio. For the clinical suspect surveillance stream, the value of each sample ranges from 2 to ~2,000 points depending on the age of the animal sampled. Because the point values are likelihood ratios, it is reasonable to compare these ratios to those calculated for clinical signs in the U.S. enhanced surveillance effort. In the BSurvE model, the parameter vj,,t is used to estimate the points of each sample in a surveillance stream (Table A3). A detectable infected animal is vj,,t times more likely than a uninfected animal to leave the herd via surveillance stream j at age t;
where ,,
,
j tj t
j t
gv
d= .
If we limit ourselves to considering just the clinical suspect surveillance stream, the parameter gClinSuspect,t (in the numerator of tj ,ν ) describes the probability of developing clinical signs consistent with being a clinical suspect and infected. Sensitivity of clinical signs comprising the clinical suspect stream is defined as the proportion of cows with BSE exhibiting those signs. It is useful to consider gClinSuspect,t as equivalent to P(Clinical signs | ClinicalSuspect, Infected), because both sensitivity and gClinSuspect, t pertain to cattle that exit at age t.

22
Table A3. Ratio of detectable infected to uninfected animals ( tj ,ν = tjtj dg ,, / ) that would exit via stream j at age t, which gives the number of points in the BSurvE model.
Surveillance stream Age (years)
Healthy slaughter Fallen stock Casualty slaughter Clinical suspect
0 0.00080 0.00080 0.00080 0.00080 1 0.00351 0.01756 0.03192 21.54481 2 0.02141 0.18020 0.34439 246.30914 3 0.08937 0.45394 0.83588 572.98430 4 0.16157 1.62173 3.15147 1835.77329 5 0.16584 2.13516 4.19833 2063.23616 6 0.11945 1.61872 3.18943 1346.37676 7 0.08457 1.18752 2.34303 866.66963 8 0.05443 0.77679 1.53357 504.54441 9 0.03432 0.41866 0.82131 241.60941 10 0.02496 0.29687 0.58173 155.39413 11 0.01660 0.19705 0.38609 94.53129 12 0.00693 0.11028 0.21856 49.97784 13 0.00311 0.02641 0.05082 10.46284 14 0.00300 0.02386 0.04573 8.74740 15 0.00290 0.02177 0.04155 7.41697 16 0.00028 0.00625 0.01250 2.20588
The parameter dClinSuspect,t is also used to estimate vClinSuspect,t. It is the probability of being culled (or otherwise exiting the national herd) and exhibiting clinical signs consistent with being a clinical suspect, given that the animal is uninfected. In other words, parameter dj,t is essentially the complement of the specificity of the clinical signs comprising the clinical suspect stream. For the clinical suspect stream, dClinSuspect,t is represented as P(Clinical Signs | ClinicalSuspect, Uninfected) . From these arguments, we can recognize the points awarded to clinical suspects in the BSurvE model are;
P(Clinical Signs | Clinical Suspect, Infected) SeP(Clinical Signs | Clinical Suspect, Uninfected) 1-Sp
tt
t
gvd
= = =
It follows that ν is essentially equivalent in meaning to thel calculated for samples in the U.S. enhanced surveillance effort. Consequently, we assume that samples with ν≥l (at some age-weighted, threshold value of ν ) constitute cattle that came from the clinical suspect surveillance stream. An age-weighted estimate for ν is needed because l is not an age-dependent estimate.
23
For the clinical suspect surveillance stream in Table A4, the expected value of ν is 807. To reflect the targeted ages of cattle in the U.S. enhanced surveillance effort (i.e., >30 months of age), this expectation is calculated using the fraction of the U.S. cattle population within each age cohort >2 years. Based on this method, we consider any cattle not submitted as clinical suspects but with
values > 807l to be clinical suspects. Cattle that do not meet this criterion belong to one of the other surveillance streams and their classification is based on other factors (e.g., reason for submission). This algorithm for allocating samples to the clinical suspect stream results in 2,602 (0.39 percent) clinical suspects among the 667,767 sampled in the U.S. enhanced surveillance effort.
Related Documents