Summary of Consolidated Financial Results for Fiscal Year Ended March 2017 (Japanese accounting standards) Released May 9, 2017 Name of listed firm: Nojima Corporation Listed on the Tokyo Stock Exchange, First Section Code No.: 7419 URL http://www.nojima.co.jp Representative: Hiroshi Nojima, President & Representative Executive Officer Contact: Atsushi Yamasaki, Executive Officer/General Manager, Finance and Accounting Division Tel.: +81-50-3116-1220 Scheduled date of regular general meeting of shareholders: June 16, 2017 Scheduled start date of dividend payments: May 31, 2017 Scheduled date of securities report filing: June 19, 2017 Supplemental materials on annual results: Yes Presentation on annual results: Yes (Amounts are rounded down to the nearest million yen.) 1. Consolidated financial results for the fiscal year ended March 2017 (April 1, 2016 - March 31, 2017) (1) Consolidated results of operations (Percentages indicate YoY changes.) Net sales Operating income Ordinary income Net income attributable to shareholders of the parent company Millions of yen % Millions of yen % Millions of yen % Millions of yen % FY ended March 2017 432,064 -5.0 15,091 3.4 15,479 3.9 10,158 -23.2 FY ended March 2016 454,842 86.4 14,593 125.5 14,892 121.1 13,226 269.6 Note: Comprehensive income: FY ended March 2017: 10,369 million yen (-21.2%) FY ended March 2016: 13,152 million yen (274.2%) Reference: EBITDA FY ended March 2017: 24,250 million yen (0.5%) FY ended March 2016: 24,137 million yen (153.5%) For detailed information, including definitions and methods used to calculate indicators, see p. 2, “1. Overview of operating results and other indicators: (1) Overview of operating results.” Net income before amortization of goodwill: FY ended March 2017: 15,998 million yen (-16.1%) FY ended March 2016: 19,069 million yen (345.6%) Net income per share Diluted net income per share ROE ROA Operating income margin Yen Yen % % % FY ended March 2017 208.28 199.27 19.7 6.5 3.5 FY ended March 2016 276.59 260.40 32.9 6.3 3.2 Reference: Equity in net income (losses) of affiliates: FY ended March 2017: 65 million yen FY ended March 2016: 18 million yen Note: The Company undertook a 1:2 stock split on common stock effective July 1, 2015. Amounts under net income per share and diluted net income per share are calculated assuming this stock split took place at the start of the previous consolidated fiscal year. (2) Consolidated financial position Total assets Net assets Equity ratio Net assets per share Millions of yen Millions of yen % Yen FY ended March 2017 245,467 56,855 23.0 1,143.23 FY ended March 2016 233,434 46,844 20.0 965.97 Reference: Equity: FY ended March 2017: 56,466 million yen FY ended March 2016: 46,646 million yen Note: Net assets per share are calculated based on the assumption that the stock split took place at the start of the previous consolidated fiscal year. (3) Consolidated cash flow Cash flow from operating activities Cash flow from investment activities Cash flow from financing activities Cash and cash equivalents at end of year Millions of yen Millions of yen Millions of yen Millions of yen FY ended March 2017 20,393 -30,616 3,734 6,275 FY ended March 2016 21,496 -5,921 -13,186 12,765 2. Dividends Dividends per share Total dividends for the year Payout ratio (consolidated) Ratio of dividends to net assets (consolidated) End of Q1 End of Q2 End of Q3 Year-end Total Yen Yen Yen Yen Yen Millions of yen % % FY ended March 2016 - 10.00 - 12.00 22.00 1,064 8.0 2.6 FY ended March 2017 - 12.00 - 13.00 25.00 1,230 12.0 2.4 FY ending March 2018 (planned) - 13.00 - 13.00 26.00 12.6 3. Forecasts of consolidated financial results for the fiscal year ending March 2018 (April 1, 2017 - March 31, 2018) (Percentages indicate changes from the previous year for full-year forecasts and changes from the same quarter of the previous fiscal year for quarterly forecasts) Net sales Operating income Ordinary income Net income attributable to shareholders of the parent company Net income per share Millions of yen % Millions of yen % Millions of yen % Millions of yen % Yen Q2 (cumulative) 230,300 12.8 6,150 10.1 6,550 11.1 3,800 4.3 76.93 Full-year 484,000 12.0 15,700 4.0 16,500 6.6 10,200 0.4 206.51 Reference: EBITDA: FY ending March 2018 full-year (forecast): 28,800 million yen (18.8%) Net income before amortization of goodwill: FY ending March 2018 full-year (forecast): 19,700 million yen (23.1%)

Welcome message from author
This document is posted to help you gain knowledge. Please leave a comment to let me know what you think about it! Share it to your friends and learn new things together.
Transcript

Summary of Consolidated Financial Results for Fiscal Year Ended March 2017
(Japanese accounting standards) Released May 9, 2017
Name of listed firm: Nojima Corporation Listed on the Tokyo Stock Exchange, First Section Code No.: 7419 URL http://www.nojima.co.jp Representative: Hiroshi Nojima, President & Representative Executive Officer
Contact: Atsushi Yamasaki, Executive Officer/General Manager, Finance and Accounting Division Tel.: +81-50-3116-1220 Scheduled date of regular general meeting of shareholders: June 16, 2017
Scheduled start date of dividend payments: May 31, 2017
Scheduled date of securities report filing: June 19, 2017 Supplemental materials on annual results: Yes
Presentation on annual results: Yes (Amounts are rounded down to the nearest million yen.)
1. Consolidated financial results for the fiscal year ended March 2017 (April 1, 2016 - March 31, 2017)
(1) Consolidated results of operations (Percentages indicate YoY changes.)
Net sales Operating income Ordinary income Net income attributable to shareholders of the parent
company
Millions of yen % Millions of yen % Millions of yen % Millions of yen % FY ended March 2017 432,064 -5.0 15,091 3.4 15,479 3.9 10,158 -23.2
FY ended March 2016 454,842 86.4 14,593 125.5 14,892 121.1 13,226 269.6
Note: Comprehensive income: FY ended March 2017: 10,369 million yen (-21.2%) FY ended March 2016: 13,152 million yen (274.2%)
Reference: EBITDA FY ended March 2017: 24,250 million yen (0.5%) FY ended March 2016: 24,137 million yen (153.5%)
For detailed information, including definitions and methods used to calculate indicators, see p. 2, “1. Overview of operating results and other
indicators: (1) Overview of operating results.”
Net income before amortization of goodwill: FY ended March 2017: 15,998 million yen (-16.1%)
FY ended March 2016: 19,069 million yen (345.6%)
Net income per share Diluted net income per
share ROE ROA
Operating income
margin
Yen Yen % % % FY ended March 2017 208.28 199.27 19.7 6.5 3.5
FY ended March 2016 276.59 260.40 32.9 6.3 3.2 Reference: Equity in net income (losses) of affiliates: FY ended March 2017: 65 million yen FY ended March 2016: 18 million yen Note: The Company undertook a 1:2 stock split on common stock effective July 1, 2015. Amounts under net income per share and diluted net income per
share are calculated assuming this stock split took place at the start of the previous consolidated fiscal year.
(2) Consolidated financial position
Total assets Net assets Equity ratio Net assets per share
Millions of yen Millions of yen % Yen FY ended March 2017 245,467 56,855 23.0 1,143.23
FY ended March 2016 233,434 46,844 20.0 965.97 Reference: Equity: FY ended March 2017: 56,466 million yen FY ended March 2016: 46,646 million yen Note: Net assets per share are calculated based on the assumption that the stock split took place at the start of the previous consolidated fiscal year.
(3) Consolidated cash flow
Cash flow from
operating activities Cash flow from
investment activities Cash flow from
financing activities Cash and cash
equivalents at end of year Millions of yen Millions of yen Millions of yen Millions of yen
FY ended March 2017 20,393 -30,616 3,734 6,275
FY ended March 2016 21,496 -5,921 -13,186 12,765
2. Dividends
Dividends per share Total dividends
for the year
Payout ratio
(consolidated)
Ratio of dividends to net assets
(consolidated) End of Q1 End of Q2 End of Q3 Year-end Total
Yen Yen Yen Yen Yen Millions of yen % % FY ended March 2016 - 10.00 - 12.00 22.00 1,064 8.0 2.6
FY ended March 2017 - 12.00 - 13.00 25.00 1,230 12.0 2.4
FY ending March 2018 (planned) - 13.00 - 13.00 26.00 12.6
3. Forecasts of consolidated financial results for the fiscal year ending March 2018 (April 1, 2017 - March 31, 2018) (Percentages indicate changes from the previous year for full-year forecasts and changes from the same quarter of the previous fiscal year for quarterly forecasts)
Net sales Operating income Ordinary income Net income attributable to shareholders of the parent
company Net income per share
Millions of yen % Millions of yen % Millions of yen % Millions of yen % Yen Q2 (cumulative) 230,300 12.8 6,150 10.1 6,550 11.1 3,800 4.3 76.93
Full-year 484,000 12.0 15,700 4.0 16,500 6.6 10,200 0.4 206.51
Reference: EBITDA: FY ending March 2018 full-year (forecast): 28,800 million yen (18.8%) Net income before amortization of goodwill: FY ending March 2018 full-year (forecast): 19,700 million yen (23.1%)

* Notes (1) Significant changes in subsidiaries during this fiscal year (changes in designated
subsidiaries resulting in changes in the scope of consolidation): No
Added: ___ company (name: ____________) Removed: ___ company (name: ____________)
(2) Changes in accounting policies, changes in accounting estimates, and restatement of prior period financial statements
① Changes in accounting policies due to revisions in accounting standards and other regulations: Yes
② Changes in accounting policies for reasons other than ①: No
③ Changes in accounting estimates: No
④ Restatement of prior period financial statements: No
Note: See p.16 of attached document, “3. Consolidated financial statements: (5) Notes to the consolidated financial statements: (Changes in accounting policies)” for details.
(3) Number of shares issued and outstanding (common stock)
① Total number of shares issued and outstanding at the
end of the period (including treasury stock)
FY ended March 2017
49,534,816 shares FY ended March 2016
48,646,816 shares
② Number of shares of treasury stock at the end of the
period
FY ended March 2017
142,417 shares FY ended March 2016
356,341 shares
③ Average number of shares during the period FY ended March 2017
48,772,193 shares FY ended March 2016
47,817,706 shares
Note: Total number of shares issued and outstanding at the end of the period (including treasury stock), number of shares of treasury stock at the end of the period, and average number of shares during the period are calculated based on the assumption that the stock split took place at the start of the previous consolidated fiscal year.
Note: The numbers of shares of treasury stock above include shares held in trust accounts (11,700 shares in FY ended March 2017 and 241,000 shares in FY ended March 2016) for the employee stock ownership plan (ESOP). Shares of Company stock held in ESOP trust accounts are included in treasury stock subtracted from calculations of the average number of shares during the period (132,428 shares in FY ended March 2017 and 336,485 shares in FY ended March 2016).
Reference: Summary of nonconsolidated financial results
1. Nonconsolidated financial results for the fiscal year ended March 2017 (April 1, 2016 - March 31, 2017)
(1) Nonconsolidated results of operations (Percentages indicate YoY changes.)
Net sales Operating income Ordinary income Net income
Millions of yen % Millions of yen % Millions of yen % Millions of yen %
FY ended March 2017 205,738 0.6 11,149 24.4 12,819 21.5 8,947 43.8
FY ended March 2016 204,412 4.5 8,964 90.7 10,548 62.3 6,222 71.7
Net income per share Diluted net income per
share Yen Yen
FY ended March 2017 183.46 175.52
FY ended March 2016 130.13 122.51 Note: Net income per share and diluted net income per share are calculated based on the assumption that the stock split took place at the
start of the previous fiscal year. (2) Nonconsolidated financial position
Total assets Net assets Equity ratio Net assets per share
Millions of yen Millions of yen % Yen
FY ended March 2017 135,638 48,168 35.2 967.34
FY ended March 2016 106,970 39,587 36.8 815.69 Reference: Equity: FY ended March 2017: 47,779 million yen FY ended March 2016: 39,389 million yen
Note: Net assets per share are calculated based on the assumption that the stock split took place at the start of the previous fiscal year.
* Financial Statements are outside the scope of audit
* Explanation concerning the appropriate use of forecasts of business performance and other notes
Note on forward-looking statements: Forecasts of business performance and other forward-looking statements in this release are based on information currently available and certain assumptions the Company deems reasonable at the time of preparation. They do not constitute a guarantee of future results. Actual results may differ materially from those of any forward-looking statements for various reasons.

Nojima Corporation (7419) summary of consolidated financial results for fiscal year ended March 2017 (Japanese accounting standards)
1
Contents of attached documents
1. Overview of operating results and other indicators ............................................................................................................. 2
(1) Overview of operating results .................................................................................................................................... 2
(2) Overview of financial position .................................................................................................................................. 3
(3) Overview of cash flow ............................................................................................................................................... 4
(4) Future outlook ........................................................................................................................................................... 5
2. Basic approach to selection of accounting standards ........................................................................................................... 5
3. Consolidated financial statements ....................................................................................................................................... 6
(1) Consolidated balance sheet ........................................................................................................................................ 6
(2) Consolidated income statement and consolidated statement of comprehensive income ............................................ 8
Consolidated income statement ........................................................................................................................................ 8
Consolidated statement of comprehensive income ........................................................................................................... 9
(3) Consolidated statement of changes in net assets ........................................................................................................ 10
(4) Consolidated cash flow statement .............................................................................................................................. 12
(5) Notes to the consolidated financial statements .......................................................................................................... 13
(Notes on going concern assumption) .............................................................................................................................. 13
(Important principles for the preparation of consolidated financial statements) ............................................................... 13
(Changes in Accounting Policies and Accounting-based Estimates, and Restatements) .................................................. 16
(Additional information) .................................................................................................................................................. 17
(Notes to the consolidated balance sheet)......................................................................................................................... 19
(Notes to the consolidated cash flow statement) .............................................................................................................. 19
(Segment information, etc.) .............................................................................................................................................. 20
(Per-share information) .................................................................................................................................................... 23
(Important subsequent information) ................................................................................................................................. 24
4. Other notes .......................................................................................................................................................................... 32
Changes to directors ............................................................................................................................................................ 32

Nojima Corporation (7419) summary of consolidated financial results for fiscal year ended March 2017 (Japanese accounting standards)
2
1. Overview of operating results and other indicators
(1) Overview of operating results
During the consolidated fiscal year under review, employment and income conditions continued to improve, and Japan’s
economy maintained a course toward a moderate recovery, due in part to the effects of various policies. Personal consumption
was generally solid, while consumer confidence appeared to follow a trend toward recovery.
On the other hand, concerns arose regarding the future economic prospects of China and other emerging Asian countries,
and the potential consequences of the normalization of monetary policy in the United States, uncertainty related to policies, and
movements in financial and capital markets.
The market for home electronics was weaker than the previous fiscal year, with sales mainly of digital cameras and PCs
performing poorly, despite steady sales of air conditioners, refrigerators, washing machines, beauty appliances, and TVs.
The market for sales of mobile phones and other mobile devices overall was weaker than the previous fiscal year, with
sales of mobile phones of carrier brands decreasing in response to the issuing of guidelines by the Ministry of Internal Affairs and
Communications on excessive smartphone purchase discounts, which led to a reduction of excessive sales competition, and an
increase in mobile virtual network operators (MVNOs) and inexpensive smartphones. On the other hand, carriers concentrated on
long-term contracted consumer-oriented benefits and product development unrelated to the telecommunications field, including
electric, insurance, and sales products in order to boost customer satisfaction.
Under these conditions, the Nojima Group focused on being the leader in the digital field and achieving the industry’s
highest customer satisfaction. To achieve these goals, we sought to establish sales floors where shoppers can easily find what
they want, and provide customer services reflecting the perspectives of customers, while working to improve consulting-based
sales and enhancing customer services to meet their needs.
In the operation of digital home electronics retail stores, we hold study meetings and training to acquire knowledge and
experience from colleagues, in order to understand the perspectives of customers, thereby improving consulting-based sales and
providing services that meet the needs of our customers.
In the operation of mobile carrier stores, we have been focusing on creating synergies within the Group and improving the
quality of stores by promoting education and training, and sharing management policies.
With 20 new store openings (including scrap-and-build) and four store closures, the number of digital home electronics
retail stores stood at 150. The number of digital home electronics retail stores operated stood at 174, when combining dedicated
communications device stores.
In the operation of mobile carrier stores, following the opening of new stores, including scrap-and-build, the acquisition of
23 stores, and the closure of or suspension of operations at six stores, the number of stores, including both directly-operated
carrier stores and franchises, stood at 637.
In the light of these factors, the number of stores as of March 31, 2017 was 811 (excluding one store directly operated by
an overseas subsidiary).
Stores in operation
Classification Directly operated Franchises Total
Operation of digital home electronics
retail stores 174 stores - 174 stores
Digital home electronics retail stores 150 stores - 150 stores
Dedicated communications device
stores 24 stores - 24 stores
Operation of mobile carrier stores 400 stores 237 stores 637 stores
Carrier stores 390 stores 235 stores 625 stores
Other 10 stores 2 stores 12 stores
Total 574 stores 237 stores 811 stores
Note: Excludes one store directly operated by an overseas subsidiary.
As a result, during this consolidated fiscal year, we recorded net sales of 432,064 million yen (95.0% of the figure for
the previous fiscal year); operating income of 15,091 million yen (103.4% of the figure for the previous fiscal year);
ordinary income of 15,479 million yen (103.9% of the figure for the previous fiscal year); and, net income attributable to
shareholders of the parent company of 10,158 million yen (76.8% of the figure for the previous fiscal year).
EBITDA,* which the Group considers to be an important indicator of business performance, stood at 24,250 million
yen (100.5% of the figure for the previous fiscal year).
(*) EBITDA = ordinary income + interest expenses + depreciation + amortization of goodwill
Net income before amortization of goodwill = net income attributable to shareholders of the parent company +
amortization of goodwill + amortization of contractual intangible assets.

Nojima Corporation (7419) summary of consolidated financial results for fiscal year ended March 2017 (Japanese accounting standards)
3
Business performance by segment is outlined below.
(Operation of digital home electronics retail stores)
Sales of TVs, supported by 4K TVs, were satisfactory, while sales of air conditioners, washing machines, beauty
appliances, and PCs were steady; on the other hand, digital cameras performed poorly.
As a result, net sales in this segment totaled 185,527 million yen (101.0% of the figure for the previous fiscal year);
segment income was 10,278 million yen (123.4% of the figure for the previous fiscal year); and, segment net income
before amortization of goodwill was 10,281 million yen (123.4% of the figure for the previous fiscal year).
(Operation of mobile carrier stores)
In the operation of mobile carrier stores, despite enhanced education, training, and similar programs as investments
in human resource development to move toward a quality orientation in anticipation of future needs, ITX Corporation, the
major subsidiary, recorded lower sales and income than last year due to its failure to reduce total sales, general, and
administrative expenses in reaction to a decrease in sales of mobile phones.
As a result, net sales in this segment totaled 245,805 million yen (90.9% of the figure for the previous fiscal year);
segment income was 5,043 million yen (76.9% of the figure for the previous fiscal year); and, segment net income before
amortization of goodwill was 10,867 million yen (87.8% of the figure for the previous fiscal year).
* Segment net income before amortization of goodwill = segment net income + amortization of goodwill + amortization of
contractual intangible assets.
(2) Overview of financial position
(Assets)
Total assets as of the end of this consolidated fiscal year stood at 245,467 million yen, up 12,033 million yen from the
end of the previous consolidated fiscal year.
This increase was mainly due to an increase of 14,883 million yen to 125,581 million yen in current assets, despite a
decrease of 2,850 million yen to 119,886 million yen in non-current assets.
The primary factors underlying the increase in current assets included an increase of 25,000 million yen from the
acquisition of shares in NIFTY Corporation, despite a decrease of 6,340 million yen and 4,284 million yen in cash and
deposits and accounts receivable-trade, respectively.
Major causes of the decrease in non-current assets included decreases of 4,283 million yen and 1,422 million yen in
contractual intangible assets and goodwill, respectively, despite the acquisition of tangible non-current assets in
connection with new store openings.
(Liabilities)
Total liabilities as of the end of this consolidated fiscal year stood at 188,612 million yen, up 2,022 million yen from the
end of the previous consolidated fiscal year due to the borrowing of 20,000 million yen to acquire shares in NIFTY
Corporation, although loans were repaid smoothly.
This was mainly due to an increase of 3,748 million yen to 104,758 million yen in non-current liabilities, and a decrease
of 1,726 million yen to 83,854 million yen in current liabilities.
The main causes of the decrease in current liabilities, despite an increase of 1,040 million yen in short-term loans
payable, included decreases of 1,973 million yen and 1,202 million yen in accounts payable-trade and accrued income
taxes, respectively.
The main causes of the increase in non-current liabilities included an increase of 3,471 million yen in long-term loans
payable.
(Net assets)
Net assets as of the end of the current fiscal year totaled 56,855 million yen, up 10,011 million yen from the end of the
previous fiscal year, due to factors including an increase of 8,988 million yen in retained earnings.
These factors resulted in an equity ratio of 23.0%, up 3.0 points from the end of the previous fiscal year.

Nojima Corporation (7419) summary of consolidated financial results for fiscal year ended March 2017 (Japanese accounting standards)
4
(3) Overview of cash flow
Cash and cash equivalents (“funds” hereinafter) in this consolidated fiscal year totaled 6,275 million yen, down 6,490
million yen from 12,765 million yen for the previous consolidated fiscal year.
The position of each type of cash flow in this consolidated fiscal year and the main reasons thereof are described below.
(Cash flow from operating activities)
Funds gained by operating activities totaled 20,393 million yen (94.9% of the figure for the previous fiscal year).
This increase was mainly due to securing net income before taxes and other adjustments of 15,297 million yen,
depreciation of 6,778 million yen, and a decrease of 4,284 million yen in accounts receivable-trade. It occurred despite
income taxes paid of 6,116 million yen, a decrease of 1,973 million yen in accounts payable-trade and other
expenditures.
(Cash flow from investment activities)
Funds used in investment activities totaled 30,616 million yen (517.0% of the figure for the previous fiscal year).
This was mainly due to an increase of 25,000 million yen in an advance payment for the acquisition of shares in NIFTY
Corporation.
(Cash flow from financing activities)
Funds gained in financing activities totaled 3,734 million yen (compared to funds used of 13,186 million yen in the
previous fiscal year).
This was mainly due to expenditures of 22,114 million yen on the repayment of long-term loans payable, occurring
despite borrowings of 26,000 million yen in long-term loans payable and other factors.
Reference: Trends of cash flow indicators
51st period
FY ended March 2013
52nd period FY ended March
2014
53rd period FY ended March
2015
54th period FY ended March
2016
55th period FY ended March
2017
Equity ratio (%) 33.9 33.1 14.3 20.0 23.0
Market equity ratio (%) 16.1 18.7 25.5 25.3 28.6
Interest-bearing debt to cash flow (years)
1.3 4.8 14.0 3.9 4.4
Interest coverage ratio (times) 57.1 24.1 33.0 21.1 23.9
Equity ratio: equity/total assets
Market equity ratio: total market capitalization/total assets
Interest-bearing debt to cash flow: interest-bearing debt/cash flow
Interest coverage ratio: cash flow/interest expense
Notes:
1. Each of the above indicators is calculated based on financial figures on a consolidated basis.
2. Total market capitalization is calculated based on the number of shares issued and outstanding, not including treasury
stock. In calculations for the 51st period, 53rd period, 54th period, and 55th period, this figure includes shares of
Company stock held in an employee stock ownership plan (ESOP) trust accounts.
3. Cash flow generated by operating activities is used above for cash flow.
4. Interest-bearing debt refers to all liabilities on the consolidated balance sheet on which interest is paid.

Nojima Corporation (7419) summary of consolidated financial results for fiscal year ended March 2017 (Japanese accounting standards)
5
(4) Future outlook
Future prospects reflect expectations of a continued moderate economic recovery due to various factors, including
various government economic policies and continued monetary easing by the Bank of Japan. These expectations arise
despite concerns about the impacts of various global instabilities, including economic trends in European countries,
increasing geopolitical risks, and the transition of the new administration in United States.
Due to competition with e-commerce firms, the already competitive environment, and other factors, conditions in the
market for sales of home electronics are expected to remain harsh.
In the market for sales of mobile phones and other mobile devices, effective sale prices of mobile phones are expected to
grow due to various factors, including the Ministry of Internal Affairs and Communications’ guidelines on excessive
discounts on purchases of smartphones. Sales volumes are projected to decrease as a result. On the other hand, new
products and services, such as bundled landline services, insurance, electricity, and other services, are being released one
after another, and carriers will continue to focus on product development in order to boost customer satisfaction.
In the light of these conditions, the Group will continue to invest in human resources and enhance its strengths in
consulting, as well as opening 25 digital home electronics retail stores and 25 carrier stores a year and optimizing our
store network.
As a result, we project the following full-year consolidated business performance for the next fiscal year: net sales of
484,000 million yen (112.0% of the figure for this fiscal year), operating income of 15,700 million yen (104.0% of the
figure for this fiscal year), ordinary income of 16,500 million yen (106.6% of the figure for this fiscal year), and net
income attributable to shareholders of the parent company of 10,200 million yen (100.4% of the figure for this fiscal
year).
We also project EBITDA of 28,800 million yen (118.8% of the figure for this fiscal year) and net income before
amortization of goodwill of 19,700 million yen (123.1% of the figure for this fiscal year).
Note: The above forecasts of business performance are based on information currently available at the time this release
was prepared. They involve uncertainties, and actual results may differ from forecasts of full-year consolidated
business performance for various reasons.
2. Basic approach to selection of accounting standards The Nojima Group is in the process of acquiring knowledge on international accounting standards, analyzing differences
between international and Japanese standards, studying the impacts of adopting international standards, and undertaking
related preparations to adopt international accounting standards at some time in the future. We have yet to determine
precisely when we will adopt international accounting standards.

Nojima Corporation (7419) summary of consolidated financial results for fiscal year ended March 2017 (Japanese accounting standards)
6
3. Consolidated financial statements
(1) Consolidated balance sheet
(Unit: millions of yen)
Previous consolidated fiscal year
(March 31, 2016) This consolidated fiscal year
(March 31, 2017)
Assets
Current assets
Cash and deposits *1 12,830 *1 6,489
Notes and accounts receivable-trade 50,752 46,467
Merchandise and products 36,775 37,844
Deferred tax assets 4,018 2,812
Advance payment - 25,000
Accounts receivable-other 4,928 5,505
Other 1,435 1,505
Allowance for doubtful accounts -41 -41
Total current assets 110,697 125,581
Non-current assets
Tangible non-current assets
Buildings and structures *1 21,363 *1 24,998
Accumulated depreciation -10,263 -11,266
Buildings and structures (net) 11,099 13,732
Machinery, equipment and vehicles 873 894
Accumulated depreciation -251 -346
Machinery, equipment and vehicles (net) 621 548
Tools, fixtures, and facilities 7,858 8,443
Accumulated depreciation -6,257 -6,755
Tools, fixtures, and facilities (net) 1,600 1,687
Land *1 8,375 *1 8,467
Other (net) 482 142
Total tangible non-current assets 22,179 24,578
Intangible assets
Goodwill 21,293 19,870
Software 566 444
Contractual intangible assets 63,547 59,263
Other 399 319
Total intangible assets 85,807 79,898
Investments and other assets
Investment securities *1 1,739 *1 1,768
Deferred tax assets 2,500 2,802
Lease and guarantee deposits *1 10,185 *1 10,538
Other 364 344
Allowance for doubtful accounts -40 -44
Total investments and other assets 14,749 15,409
Total non-current assets 122,736 119,886
Total assets 233,434 245,467

Nojima Corporation (7419) summary of consolidated financial results for fiscal year ended March 2017 (Japanese accounting standards)
7
(Unit: millions of yen)
Previous consolidated fiscal year
(March 31, 2016) This consolidated fiscal year
(March 31, 2017)
Liabilities
Current liabilities
Notes and accounts payable-trade 50,237 48,263
Short-term loans payable 1,560 2,600
Current portion of long-term loans payable *1 9,696 *110,111
Accounts payable-other 6,178 6,265
Accrued income taxes 4,225 3,022
Accrued consumption tax 1,731 1,081
Unearned revenue 4,057 4,706
Reserve for points 3,029 2,565
Reserve for bonuses 1,263 1,046
Other 3,601 4,192
Total current liabilities 85,580 83,854
Non-current liabilities
Long-term loans payable *1 73,027 *176,498
Reserve for guarantees for merchandise sold 3,442 3,651
Reserve for directors’ retirement benefits 156 182
Retirement benefit liabilities 5,158 5,497
Deferred tax liabilities 17,956 17,607
Other 1,267 1,320
Total non-current liabilities 101,009 104,758
Total liabilities 186,590 188,612
Net assets
Shareholders’ equity
Capital stock 5,720 5,905
Capital surplus 5,913 6,097
Retained earnings 35,376 44,364
Treasury stock -319 -67
Total shareholders’ equity 46,690 56,299
Accumulated other comprehensive income
Valuation difference on available-for-sale securities 198 185
Currency conversion adjustments 1 -18
Accumulated adjustment to retirement benefits -243 0
Total accumulated other comprehensive income -43 167
Stock acquisition rights 197 388
Total net assets 46,844 56,855
Total liabilities and net assets 233,434 245,467

Nojima Corporation (7419) summary of consolidated financial results for fiscal year ended March 2017 (Japanese accounting standards)
8
(2) Consolidated income statement and consolidated statement of comprehensive income
Consolidated income statement
(Unit: millions of yen)
Previous consolidated fiscal year (April 1, 2015 - March 31, 2016)
This consolidated fiscal year (April 1, 2016 - March 31, 2017)
Net sales 454,842 432,064
Cost of sales 358,810 333,643
Gross profit on sales 96,031 98,421
Sales, general, and administrative expenses
Advertising expenses 10,674 10,343
Salaries, allowances, and bonuses 28,668 29,891
Provision of reserve for bonuses 1,264 1,042
Provision of reserve for directors’ retirement benefits 14 27
Retirement benefit expenses 951 981
Rents 11,299 12,118
Depreciation 6,759 6,515
Amortization of goodwill 1,468 1,464
Other 20,337 20,945
Total sales, general, and administrative expenses 81,438 83,330
Operating income 14,593 15,091
Non-operating income
Interest income 20 17
Purchase discounts 1,365 1,487
Other 359 451
Total non-operating income 1,745 1,956
Non-operating expenses
Interest expenses 1,018 791
Commission fees 120 587
Other 307 189
Total non-operating expenses 1,446 1,568
Ordinary income 14,892 15,479
Extraordinary income
Gain on reversal of loss on valuation of investment securities - 50
Gain on reversal of stock subscription rights 6 8
Total extraordinary income 6 59
Extraordinary losses
Loss on valuation of investment securities 22 -
Impairment loss 888 241
Total extraordinary losses 911 241
Net income before taxes and other adjustments 13,987 15,297
Income taxes-current 5,379 4,679
Income taxes-deferred -4,618 459
Total income taxes 761 5,138
Net income 13,226 10,158
Net income attributable to shareholders of the parent
company 13,226 10,158

Nojima Corporation (7419) summary of consolidated financial results for fiscal year ended March 2017 (Japanese accounting standards)
9
Consolidated statement of comprehensive income
(Unit: millions of yen)
Previous consolidated fiscal year (April 1, 2015 - March 31, 2016)
This consolidated fiscal year (April 1, 2016 - March 31, 2017)
Net income 13,226 10,158
Other comprehensive income
Valuation difference on available-for-sale securities -4 -12
Currency conversion adjustments -12 -4
Adjustments for retirement benefit obligations -35 243
Share in other comprehensive income of equity-method
affiliates -20 -16
Total other comprehensive income -73 210
Comprehensive income 13,152 10,369
(Breakdown)
Comprehensive income attributable to shareholders of the
parent company 13,152 10,369
Comprehensive income attributable to noncontrolling interests - -

Nojima Corporation (7419) summary of consolidated financial results for fiscal year ended March 2017 (Japanese accounting standards)
10
(3) Consolidated statement of changes in net assets
Previous consolidated fiscal year (April 1, 2015 - March 31, 2016)
(Unit: millions of yen)
Shareholders’ equity
Capital stock Capital surplus Retained
earnings Treasury stock
Total shareholders’
equity
Balance at start of fiscal
year 5,669 5,795 23,061 -690 33,835
Changes this fiscal year
Issuance of new shares or
exercise of stock
acquisition rights 50 50 101
Distribution of surplus -911 -911
Net income attributable
to shareholders of the
parent company 13,226 13,226
Acquisition of treasury
stock -2 -2
Disposal of treasury
stock 67 373 440
Changes this fiscal year
in items other than
shareholders’ equity (net)
Total change this fiscal
year 50 117 12,314 371 12,854
Balance at end of fiscal
year 5,720 5,913 35,376 -319 46,690
Accumulated other comprehensive income Stock
acquisition
rights
Noncontrolling
interests Total net assets Valuation difference
on available-for-sale
securities
Currency
conversion
adjustments
Accumulated
adjustment to
retirement benefits
Total accumulated
other comprehensive
income
Balance at start of fiscal
year 203 35 -208 29 154 337 34,357
Changes this fiscal year
Issuance of new shares or
exercise of stock
acquisition rights
101
Distribution of surplus -911
Net income attributable
to shareholders of the
parent company 13,226
Acquisition of treasury
stock -2
Disposal of treasury
stock 440
Changes this fiscal year
in items other than
shareholders’ equity (net) -4 -33 -35 -73 42 -337 -368
Total change this fiscal year
-4 -33 -35 -73 42 -337 12,486
Balance at end of fiscal
year 198 1 -243 -43 197 - 46,844

Nojima Corporation (7419) summary of consolidated financial results for fiscal year ended March 2017 (Japanese accounting standards)
11
This consolidated fiscal year (April 1, 2016 - March 31, 2017)
(Unit: millions of yen)
Shareholders’ equity
Capital stock Capital surplus Retained
earnings Treasury stock
Total shareholders’
equity
Balance at start of fiscal
year 5,720 5,913 35,376 -319 46,690
Changes this fiscal year
Issuance of new shares or
exercise of stock
acquisition rights 184 184 369
Distribution of surplus -1,170 -1,170
Net income attributable
to shareholders of the
parent company 10,158 10,158
Acquisition of treasury
stock -21 -21
Disposal of treasury
stock 273 273
Changes due to the
decrease in consolidated
subsidiaries 0 0
Changes this fiscal year
in items other than
shareholders’ equity (net)
Total change this fiscal
year 184 184 8,988 251 9,609
Balance at end of fiscal year
5,905 6,097 44,364 -67 56,299
Accumulated other comprehensive income Stock
acquisition
rights
Noncontrolling
interests Total net assets Valuation difference
on available-for-sale
securities
Currency
conversion
adjustments
Accumulated
adjustment to
retirement benefits
Total accumulated
other comprehensive
income
Balance at start of fiscal
year 198 1 -243 -43 197 - 46,844
Changes this fiscal year
Issuance of new shares or
exercise of stock
acquisition rights 369
Distribution of surplus -1,170
Net income attributable
to shareholders of the
parent company
10,158
Acquisition of treasury
stock -21
Disposal of treasury
stock 273
Changes due to the
decrease in consolidated
subsidiaries 0
Changes this fiscal year
in items other than
shareholders’ equity (net) -12 -20 243 210 191 - 402
Total change this fiscal
year -12 -20 243 210 191 - 10,011
Balance at end of fiscal
year 185 -18 0 167 388 - 56,855

Nojima Corporation (7419) summary of consolidated financial results for fiscal year ended March 2017 (Japanese accounting standards)
12
(4) Consolidated cash flow statement
(Unit: millions of yen)
Previous consolidated fiscal year (April 1, 2015 - March 31, 2016)
This consolidated fiscal year (April 1, 2016 - March 31, 2017)
Cash flow from operating activities
Net income before taxes and other adjustments 13,987 15,297
Depreciation 7,017 6,778
Impairment loss 888 241
Amortization of goodwill 1,468 1,464
Increase (decrease) in reserve for retirement benefits 788 338
Increase (decrease) in reserve for points 737 -463
Increase (decrease) in reserve for guarantees for merchandise
sold 241 209
Interest and dividend income -50 -34
Interest expense 1,018 791
Commission fee 120 587
Decrease (increase) in accounts receivable-trade 4,536 4,284
Decrease (increase) in inventories -3,559 -1,123
Decrease (increase) in accounts receivable-other 506 -577
Increase (decrease) in notes and accounts payable-trade -1,694 -1,973
Increase (decrease) in accrued consumption taxes -1,028 -649
Increase (decrease) in advances received 406 523
Increase (decrease) in unearned revenue 1,978 648
Other -973 939
Subtotal 26,389 27,281
Interest and dividends income received 94 81
Interest expenses paid -1,017 -852
Income tax paid -3,969 -6,116
Cash flow from operating activities 21,496 20,393
Cash flow from investment activities
Purchase of tangible non-current assets -2,485 -4,514
Purchase of intangible non-current assets -132 -140
Sales of investment securities 376 17
Purchase of investments in subsidiaries -2,725 -
Purchase of stocks of affiliates -242 -
Payments for lease and guarantee deposits -979 -970
Proceeds from collection of lease and guarantee deposits 299 381
Decrease (increase) in advance payment - 25,000
Other -33 -391
Cash flow from investment activities -5,921 30,616
Cash flow from financing activities
Increase (decrease) in short-term loans payable 1,308 1,040
Proceeds from long-term loans payable 12,000 26,000
Repayment of long-term loans payable -25,946 -22,114
Proceeds from sales of treasury stock 213 273
Purchase of treasury stock -2 -21
Cash dividends paid -910 -1,170
Commission fees paid -120 -587
Other 272 314
Cash flow from financing activities -13,186 3,734
Effect of exchange rate changes on cash and cash equivalents -35 -2
Increase (decrease) in cash and cash equivalents 2,352 -6,490
Starting balance of cash and cash equivalents 10,413 12,765
Ending balance of cash and cash equivalents * 12,765 * 6,275

Nojima Corporation (7419) summary of consolidated financial results for fiscal year ended March 2017 (Japanese accounting standards)
13
(5) Notes to the consolidated financial statements
(Notes on going concern assumption)
Not applicable
(Important principles for the preparation of consolidated financial statements)
1. Scope of consolidation
(1) Number of consolidated subsidiaries: Six companies
Names of consolidated subsidiaries:
Nishinihon Mobile Co., Ltd.
Geobit Mobile Corporation
Nojima (Cambodia) Co., Ltd.
NOJIMA STELLA SPORTS CLUB Co., Ltd.
Business Grand Works Co., Ltd.
ITX Corporation
The Group has liquidated Cross Bridge Co., Ltd., a consolidated subsidiary, effective August 25, 2016.
(2) Names of nonconsolidated subsidiaries and other information
Not applicable.
2. Application of equity method
(1) Number of equity-method affiliates: Two companies
AbelNet Co., Ltd.
Tran Anh Digital World Joint Stock Company
The Group has liquidated Nijicom Co., Ltd., a consolidated subsidiary, effective June 24, 2016.
(2) Fiscal years of equity-method affiliates
The financial statements for the affiliate’s most recent fiscal year are used if the fiscal year of an equity-method affiliate
ends on a different date from that of the Company’s consolidated fiscal year.
3. Fiscal years of consolidated subsidiaries and other matters
The closing dates of fiscal years of the following consolidated subsidiaries differ from the closing date of the Company’s
consolidated fiscal year:
Company Year ends
Business Grand Works Co., Ltd. October 31
Nojima (Cambodia) Co., Ltd. December 31
NOJIMA STELLA SPORTS CLUB Co., Ltd. January 31
Consolidated financial statements for these companies are prepared based on financial statements obtained from tentative
settlements of accounts undertaken as of the date of the consolidated settlement of accounts.
The closing dates of fiscal years of other consolidated subsidiaries are the same as the closing date of the Company’s
consolidated fiscal year.
Nojima Corporation (7419) summary of consolidated financial results for fiscal year ended March 2017 (Japanese accounting standards)
14
4. Accounting standards
(1) Standards and methods applied in the valuation of important assets
A. Securities
Available-for-sale securities:
a. Those having fair market value:
Mark-to-market based on market values and other information as of the date of settlement of accounts (A part of
revaluation gains/losses is booked directly to net assets. Costs of securities sold are calculated using the moving
average method.)
b. Those without fair market value:
Moving average cost method
B. Inventories
Merchandise:
The moving average cost method (the balance sheet figure is calculated by writing down book values based on
decreased profitability). For recycled (used) merchandise, the cost accounting method employed is the retail method
(the balance sheet figure is calculated by writing down book values based on decreased profitability).
(2) Depreciation methods for important depreciable assets
A. Tangible non-current assets (not including leased assets)
Nojima and domestic consolidated subsidiary Business Grand Works Co., Ltd. primarily use the declining balance
method. However, they use the straight-line method for buildings (not including equipment attached to buildings)
acquired on or after April 1, 1998, and equipment attached to buildings and structures acquired on or after April 1, 2016.
Domestic consolidated subsidiaries Geobit Mobile Corporation and ITX Corporation (“ITX” hereinafter) use the
straight-line method.
The overseas consolidated subsidiary Nojima (Cambodia) Co., Ltd. mainly uses the straight-line method in accordance
with Cambodian accounting standards.
Main useful lives for depreciation purposes are shown below.
Buildings and structures: 7-47 years
Machinery, equipment, and vehicles: 2-17 years
Tools, fixtures, and facilities: 2-20 years
B. Intangible non-current assets (not including leased assets)
The straight-line method is applied.
Main useful lives for depreciation purposes are shown below.
Software: 5 years
Contractual intangible assets: 15 or 16 years
C. Leased assets
The straight-line method is applied using the term of the lease as the useful life of the asset and zero as the residual
value.
(3) Accounting standards for important reserves
A. Allowance for doubtful accounts
Providing for losses from unrecoverable claims, the anticipated amount of unrecoverable claims is booked as follows:
The actual loan loss ratio is applied for ordinary claims (general accounts receivable); for extraordinary claims (doubtful
accounts receivable) such as those involving the possibility of default and those in bankruptcy reorganization, the
possibility of recovery is considered for each claim.
B. Reserve for point card certificates
Providing for costs resulting from the future use of loyalty points by customers based on a system that awards points to
customers based on past purchases and other factors, the anticipated amount of points used in the future is booked based
on past performance.
C. Reserve for bonuses
Providing for bonuses paid to employees, some consolidated subsidiaries book the required amount of reserve for
bonuses based on the anticipated amount payable.
D. Reserve for guarantees for merchandise sold
Providing for costs of after-sales services for products sold, the anticipated amount of service costs during product
guarantee periods is booked based on past performance.
E. Reserve for directors’ retirement benefits
Providing for retirement benefits paid to directors, the amount payable as of the end of the current fiscal year is booked
based on internal rules.
Nojima Corporation (7419) summary of consolidated financial results for fiscal year ended March 2017 (Japanese accounting standards)
15
(4) Accounting treatment of retirement benefits
A. Period of attribution of estimated retirement benefits
Straight-line attribution is used to attribute estimated amounts of retirement benefits to periods through the end of this
consolidated fiscal year in calculations of retirement benefit obligations.
B. Treatment of actuarial gains and losses and past service costs
Past service costs are booked as expenses using the straight-line method, setting a fixed number of years (six years)
within the average remaining number of years of service for personnel employed at the time such obligations arise.
Actuarial gains or losses are booked as expenses in the fiscal years in which they arise. Some consolidated subsidiaries
book actuarial gains or losses as expenses beginning the following consolidated fiscal year using the straight-line
method, setting an amount prorated over a fixed number of years (six years) within the average remaining number of
years of employment for personnel employed at the time each of such gains or losses arise in each consolidated fiscal
year.
C. Application of simplified method for small businesses, etc.
Some consolidated subsidiaries apply the simplified method to calculations of obligations related to retirement benefits
and costs of retirement benefits, treating as the amount of retirement benefit obligations the amount payable to
employees retiring of their own accord as of the end of the fiscal year.
(5) Standards for converting major assets or liabilities in foreign currencies into Japanese yen
Monetary claims and obligations in foreign currencies are converted into yen at the spot exchange rate as of the date of the
consolidated settlement of accounts. Any difference from this conversion is recorded as a profit or loss. Assets and
liabilities of overseas consolidated subsidiaries, etc. are converted into yen at the spot exchange rate as of the date of the
consolidated settlement of accounts. Income and expenses of overseas subsidiaries, etc. are converted into yen at the
average exchange rate over the fiscal year. Differences due to conversion are included under Net assets as “Currency
conversion adjustments.”
(6) Major hedge accounting methods
A. Hedge accounting methods
The only transactions that meet the requirements for hedge accounting are interest rate swaps. Exceptional processing is
applied.
B. Hedge schemes and hedged items
Hedge schemes: Interest rate swaps
Hedged items: Loans payable
C. Hedging policy
The Company uses hedge accounting within the scope of eligible obligations to reduce interest rate risks and to improve
its financial balance.
D. Method of evaluating the efficacy of hedging
The efficacy of hedging is not evaluated for interest rate swaps to which exceptional processing is applied.
(7) Method and period of amortization of goodwill
Goodwill is amortized using the straight-line method over an amortization period of 5-16 years from the fiscal year in
which the goodwill arises.
(8) Scope of funds on the consolidated cash flow statement
The funds included on the consolidated cash flow statement are cash on hand, deposits that may be withdrawn at any time,
and short-term investments easily convertible to cash that have maturities of three months or less from the date of
purchase and only minor risks of fluctuations in value.
(9) Other important matters concerning preparation of the consolidated financial statements
Account processing of consumption tax, etc.:
The tax-excluded method is applied.
Nojima Corporation (7419) summary of consolidated financial results for fiscal year ended March 2017 (Japanese accounting standards)
16
(Changes in Accounting Policies and Accounting-based Estimates, and Restatements)
(Changes in accounting policies)
(Application of Practical Solution of a Change in Depreciation Method due to Tax Reform 2016)
In response to the revised Corporation Tax Law, the Group replaced the declining-balance method with the straight-
line method for facilities attached to buildings and structures acquired on and after April 1, 2016, because the Group has
applied “Practical Solution on a Change in Depreciation Method due to Tax Reform 2016” (ASBJ Practical Issues Task
Force (PITF) No. 32, June 17, 2016) from the current consolidated fiscal year.
As a result, operating income, ordinary income and net income before taxes and other adjustments increased 72
million yen, respectively, for the current fiscal year.

Nojima Corporation (7419) summary of consolidated financial results for fiscal year ended March 2017 (Japanese accounting standards)
17
(Additional information)
(Restrictive financial covenants)
1. The following restrictive financial covenants apply under the term loan agreements and revolving credit facilities
agreements entered into by the Company to raise working capital.
i) The amount of net assets indicated on the consolidated and nonconsolidated balance sheets on the closing date of
each fiscal year and the first half of each fiscal year must be maintained at not less than the higher of the following
figures:
A. 80% of the amount of net assets indicated on the consolidated and nonconsolidated balance sheets on the closing
date of the fiscal year immediately preceding conclusion of the agreement
B. 80% of the amount of net assets indicated on the consolidated and nonconsolidated balance sheets on the closing
date of the immediately preceding fiscal year or first half of the fiscal year
ii) An ordinary loss may not be recorded on the consolidated or nonconsolidated income statement for any fiscal year.
The amounts of agreements and remaining balances of debt are indicated below.
Previous consolidated
accounting period (March 31, 2016)
This consolidated accounting period (March 31, 2017)
Agreement amount*1 17,000 million yen 13,500 million yen
Remaining
balance of
debt
Short-term loans payable - 2,000 Current portion of long-term loans
payable*1 766 -
Long-term loans payable*1 168 - *1 The agreement amount and remaining balance of debt in the previous consolidated fiscal year are based on the
previous loan agreement.
2. The following restrictive financial covenants apply under the loan agreement entered into by the Company as of March
28, 2016 to refinance a previous loan agreement entered into by the Company as of December 24, 2014 to raise funds
for acquiring stock in ITX (pre-merger).
i) From the fiscal year ended March 2016, the amount of net assets indicated on the consolidated and nonconsolidated
balance sheets on the closing date of each fiscal year and the first half of each fiscal year must be maintained at not
less than the higher of the following figures:
A. 80% of the amount of net assets indicated on the consolidated and nonconsolidated balance sheets on the closing
date of the fiscal year ended March 2015
B. 80% of the amount of net assets indicated on the consolidated and nonconsolidated balance sheets on the closing
date of the immediately preceding fiscal year or first half of the fiscal year
ii) From the fiscal year ended March 2016, an ordinary loss may not be recorded on the consolidated or nonconsolidated
income statement for any fiscal year.
The amounts of agreements and remaining balances of debt are indicated below.
Previous consolidated
accounting period (March 31, 2016)
This consolidated accounting period (March 31, 2017)
Agreement amount 10,000 million yen 10,000 million yen
Remaining
balance of
debt
Current portion of long-term loans
payable 2,000 2,000
Long-term loans payable 8,000 4,000
3. The following restrictive financial covenants apply under the loan agreement, in which part of the agreement was
modified on September 30, 2016, concluded by the consolidated subsidiary ITX as of December 24, 2014 to raise funds
to acquire stock in ITX (pre-merger) and working capital for ITX.
i) In the 12-month period of each fiscal year starting with the fiscal year ended March 2016 and the 12 months through
the first half of each fiscal year starting with the first half ended September 2015, the borrower’s gross leverage ratio
(*2) on a consolidated basis may not exceed the figure specified by the financial institution two consecutive times.
*2 Gross leverage ratio = interest-bearing debt/EBITDA (*3)
*3 EBITDA = operating income + depreciation + amortization of goodwill + amortization of long-term prepaid
expenses + acquisition cost
ii) In the 12-month period of each fiscal year starting with the fiscal year ended March 2016 and the 12 months through
the first half of each fiscal year starting with the first half ended September 2016, the debt service coverage ratio (*4)
may not be less than 1.00 two consecutive times.
*4 Debt service coverage ratio = free cash flow/(principal repayments + interest payments + commitment fees)
iii) From the fiscal year ended March 2015, an operating loss may not be recorded two consecutive times on the
consolidated income statement during the 12-month period of each fiscal year.
iv) From the fiscal year ended March 2016, the amount of net assets indicated on the consolidated balance sheet on the
closing date of each fiscal year may not be less than 70% of the amount of net assets indicated on the consolidated
balance sheet on the closing date of the immediately preceding fiscal year.
The amounts of agreements and remaining balances of debt are shown below.
Previous consolidated
accounting period (March 31, 2016)
This consolidated accounting period (March 31, 2017)
Agreement amount 73,000 million yen 77,000 million yen
Remaining
balance of
debt
Current portion of long-term loans payable 3,500 2,000
Long-term loans payable 57,564 45,314

Nojima Corporation (7419) summary of consolidated financial results for fiscal year ended March 2017 (Japanese accounting standards)
18
4. The following restrictive financial covenants apply under the loan agreement entered into by the Company as of January
1, 2017 to raise funds to acquire stock in NIFTY Corporation.
i) From the fiscal year ended March 2017, the amount of net assets indicated on the consolidated and nonconsolidated
balance sheets on the closing date of each fiscal year and the first half of each fiscal year must be maintained at not
less than the higher of the following figures:
A. 80% of the amount of net assets indicated on the consolidated and nonconsolidated balance sheets on the closing
date of the fiscal year ended March 2016
B. 80% of the amount of net assets indicated on the consolidated and nonconsolidated balance sheets on the closing
date of the immediately preceding fiscal year or first half of the fiscal year
ii) From the fiscal year ended March 2017, an ordinary loss may not be recorded on the consolidated or nonconsolidated
income statement for any fiscal year.
The amounts of agreements and remaining balances of debt are indicated below.
Previous consolidated
accounting period (March 31, 2016)
This consolidated accounting period (March 31, 2017)
Agreement amount - million yen 20,000 million yen
Remaining
balance of
debt
Current portion of long-term loans
payable - 1,666
Long-term loans payable - 18,334
(Trading of issuing shares from treasury stock through a trust to employees)
The Group transacts to issue shares from treasury stock through an employee stock ownership trust for the welfare of
employees on their behalf.
1. Overview of trading
The Group introduced “the employee stock ownership plan (ESOP) trust” (“the System” hereinafter) in March 2015 to
increase corporate value over the medium to long term. The System acquires the amount of shares at one time in
advance, which takes three years for the “NEX employee stock ownership plan” (“Our shareholding association”
hereinafter) to acquire, and sells them to our shareholding association to transfer treasury stock to it.
2. Treasury stock retained in trust
Treasury stock retained in trust is allocated as net assets in accordance with trust book value, excluding incidental
expenses. The book value and number of shares of applicable treasury stock were 287 million yen and 241,000 shares,
respectively, for the previous fiscal year; and 13 million yen and 11,000 shares, respectively, for the current fiscal year.
Note: The Company implemented a 1:2 stock split with the effective date set for July 1, 2015, thereby assuming the
stock split occurred at the beginning of the previous fiscal year to calculate the applicable treasury stock retained
in trust for the previous fiscal year and the current fiscal year.
3. Recorded book value of loans payable after applying total method
A total of 334 million yen for the previous consolidated fiscal year and - million yen for the current fiscal year.
(Application of Revised Implementation Guidance on Recoverability of Deferred Tax Assets)
The Group has applied “Revised Implementation Guidance on Recoverability of Deferred Tax Assets” (ASBJ Guidance No.
26, March 28, 2016) from the current consolidated fiscal year.

Nojima Corporation (7419) summary of consolidated financial results for fiscal year ended March 2017 (Japanese accounting standards)
19
(Notes to the consolidated balance sheet)
*1 Hypothecated assets and collateralized obligations:
Assets pledged as collateral are shown below.
Previous consolidated fiscal year
(March 31, 2016) This consolidated fiscal year
(March 31, 2017)
Cash and deposits 4,803 million yen 2,216 million yen
Short-term loans to affiliates* 180 -
Buildings and structures 368 355
Land 1,051 1,051
Investment securities 24 25
Stock of affiliates* 20,000 20,000
Lease and guarantee deposits 481 474
Total 26,909 24,123
* Short-term loans to affiliates and stock of affiliates above are offset in consolidated financial statements.
Collateralized obligations are shown below.
Previous consolidated fiscal year
(March 31, 2016) This consolidated fiscal year
(March 31, 2017)
Current portion of long-term loans payable
3,630 million yen 2,130 million yen
Long-term loans payable 58,344 45,964
Total 61,974 48,094
2 To enable the flexible and stable raising of working capital, the Nojima Group has concluded agreements with its main
financial institutions on overdrafts and loan commitments. Shown below are available balances under these agreements
as of the end of the consolidated fiscal year.
Previous consolidated fiscal year
(March 31, 2016) This consolidated fiscal year
(March 31, 2017)
Credit line 31,000 million yen 35,000 million yen
Outstanding balance 1,100 2,000
Difference: Available balance 29,900 33,000
(Notes to the consolidated cash flow statement)
* Relationship between amounts of the closing balance of cash and cash equivalents and items shown on the consolidated
balance sheet:
Previous consolidated fiscal year (April 1, 2015 - March 31, 2016)
This consolidated fiscal year (April 1, 2016 - March 31, 2017)
Cash and deposits 12,830 million yen 6,489 million yen
Time deposits with terms of more than three months
-64 -214
Transfers to escrow account (account with restricted deposits and withdrawals)
-0 -0
Cash and cash equivalents 12,765 6,275

Nojima Corporation (7419) summary of consolidated financial results for fiscal year ended March 2017 (Japanese accounting standards)
20
(Segment information, etc.)
[Segment information]
1. Overview of reporting segments
(1) Method for determining reporting segments
The Nojima Group periodically reviews its reporting segments to assess business performance and to allow informed
decision-making by top management decision-making bodies on the use of management resources. The reporting
segments are based on financial information for units of the Group’s organization that can be separated from the rest
of the organization.
(2) Types of product and service within each reporting segment
The operating segment of digital home electronics retail stores sells digital audio video products, IT devices, and
home electronics, and provides related solutions, setup, repairs, and other services.
The operating segment of mobile carrier stores sells communication devices (primarily mobile phones) and provides
related services.
2. Calculating net sales, income or loss, assets, liabilities, and other accounts by reporting segment
Account processing methods for each reporting business segment are identical to those described under “Important
principles for the preparation of consolidated financial statements.”
Income figures for reporting segments are based on ordinary income.
Internal transactions and transfers between segments are recorded based on market prices.

Nojima Corporation (7419) summary of consolidated financial results for fiscal year ended March 2017 (Japanese accounting standards)
21
3. Amounts of net sales, income or loss, assets, liabilities, and other accounts by reporting segment
Previous consolidated fiscal year (April 1, 2015 - March 31, 2016)
(Unit: millions of yen)
Reporting segment
Other (*1) Total Adjustments (*2)
Amount on
consolidated
financial
statements
Digital home
electronics retail
stores
Mobile carrier
stores Subtotal
Net sales
Net sales to external
customers 183,493 270,545 454,038 803 454,842 - 454,842
Internal sales or transfers
between segments 134 1 135 336 472 -472 -
Subtotal 183,627 270,547 454,174 1,140 455,315 -472 454,842
Segment income 8,332 6,555 14,887 200 15,087 -195 14,892
Segment assets 65,495 153,609 219,104 7,503 226,608 6,826 233,434
Segment liabilities 44,148 131,325 175,473 158 175,632 10,957 186,590
Other accounts
Depreciation 1,434 5,293 6,728 288 7,017 - 7,017
Amortization of goodwill 2 1,452 1,455 12 1,468 - 1,468
Interest income 0 0 0 0 0 19 20
Interest expense 0 802 802 - 802 215 1,018
Equity in earnings of
affiliates 18 - 18 - 18 - 18
Impairment loss 767 120 888 - 888 - 888
Investment in equity-method
affiliates 1,003 - 1,003 - 1,003 - 1,003
Unamortized balance of
goodwill 12 21,211 21,223 69 21,293 - 21,293
Increase in tangible and
intangible non-current assets 1,221 3,651 4,872 9 4,882 - 4,882
Notes:
*1. The “Other” business segment consists of businesses not included in the two reporting segments above. These include
the shopping mall business, the sports business, the training business, and the mega-solar business.
*2. Adjustments of segment income consist of companywide costs not distributed between reporting segments. Adjustments
of segment assets and liabilities consist of companywide assets not distributed between reporting segments and offsetting
between segments.
*3. Segment income is adjusted against ordinary income on the consolidated income statement.

Nojima Corporation (7419) summary of consolidated financial results for fiscal year ended March 2017 (Japanese accounting standards)
22
This consolidated fiscal year (April 1, 2016 - March 31, 2017)
(Unit: millions of yen)
Reporting segment
Other (*1) Total Adjustments (*2)
Amount on
consolidated financial
statements
Digital home electronics retail
stores
Mobile carrier stores
Subtotal
Net sales
Net sales to external
customers 185,403 245,800 431,204 860 432,064 - 432,064
Internal sales or transfers
between segments 124 4 129 357 486 -486 -
Subtotal 185,527 245,805 431,333 1,218 432,551 -486 432,064
Segment income 10,278 5,043 15,322 291 15,613 -134 15,479
Segment assets 98,006 137,153 235,159 7,312 242,472 2,995 245,467
Segment liabilities 46,147 109,771 155,918 183 156,102 32,509 188,612
Other accounts
Depreciation 1,163 5,357 6,521 257 6,778 - 6,778
Amortization of goodwill 3 1,448 1,451 12 1,464 - 1,464
Interest income 0 0 0 -0 0 16 17
Interest expense 0 640 640 - 640 151 791
Equity in earnings of
affiliates 65 - 65 - 65 - 65
Impairment loss 201 39 241 - 241 - 241
Investment in equity-method affiliates
1,028 - 1,028 - 1,028 - 1,028
Unamortized balance of
goodwill 9 19,804 19,813 57 19,870 - 19,870
Increase in tangible and intangible non-current assets
3,713 1,142 4,856 3 4,859 - 4,859
Notes:
*1. The “Other” business segment consists of businesses not included in the two reporting segments above. These include
the shopping mall business, the sports business, the training business, and the mega-solar business.
*2. Adjustments to segment income consist of companywide costs not distributed between reporting segments. Adjustments
to segment assets and liabilities consist of companywide assets not distributed between reporting segments and offsetting
between segments.
*3. Segment income is adjusted against ordinary income on the consolidated income statement.
[Impairment loss on non-current assets by reporting segment]
Previous consolidated fiscal year (April 1, 2015 - March 31, 2016)
Omitted here because the information is provided under segment information
This consolidated fiscal year (April 1, 2016 - March 31, 2017)
Omitted here because the information is provided under segment information
[Amount of amortization of goodwill and unamortized balance of goodwill by reporting segment]
Previous consolidated fiscal year (April 1, 2015 - March 31, 2016)
Omitted here because the information is provided under segment information
This consolidated fiscal year (April 1, 2016 - March 31, 2017)
Omitted here because the information is provided under segment information
[Gain on negative goodwill by reporting segment]
Previous consolidated fiscal year (April 1, 2015 - March 31, 2016)
Not applicable
This consolidated fiscal year (April 1, 2016 - March 31, 2017)
Not applicable

Nojima Corporation (7419) summary of consolidated financial results for fiscal year ended March 2017 (Japanese accounting standards)
23
(Per-share information)
Previous consolidated fiscal year
(April 1, 2015 - March 31, 2016)
This consolidated fiscal year
(April 1, 2016 - March 31, 2017)
Net assets per share 965.97 yen 1,143.23 yen
Net earnings per share 276.59 yen 208.28 yen
Diluted earnings per share 260.40 yen 199.27 yen
Notes:
1. The Company undertook a 1:2 stock split on common stock with an effective date of July 1, 2015. Amounts under
net assets per share, net earnings per share, and diluted earnings per share are calculated based on the assumption
that this stock split took place at the start of the previous consolidated fiscal year.
2. Calculations of net earnings per share and diluted earnings per share are based on the following information:
Previous consolidated fiscal year (April 1, 2015 - March 31, 2016)
This consolidated fiscal year (April 1, 2016 - March 31, 2017)
Net earnings per share
Net income attributable to shareholders of the parent company (millions of yen)
13,226 10,158
Amount not reverting to common shareholders (millions of yen)
- -
Net income attributable to shareholders of the parent company related to common stock (millions of yen)
13,226 10,158
Average number of shares during the fiscal year (thousands of shares)
47,817 48,772
Diluted net earnings per share
Adjustments of net income attributable to shareholders of the parent company (millions of yen)
- -
Increase in common stock (thousands of shares)
2,972 2,205
(Amount of the above corresponding to stock acquisition rights [thousands of shares])
(2,972) (2,205)
Summary of potential dilution not included in the calculation of diluted net earnings per share due to lack of dilution effect
Stock acquisition rights no. 13 (2015 stock options) (6,313 stock acquisition rights)
Stock acquisition rights no. 13 (2015 stock options) (5,976 stock acquisition rights) Stock acquisition rights no. 14 (2016 stock options) (13,415 stock acquisition rights)
3. Shares of Company stock remaining in trust recorded as treasury stock under shareholders’ equity are included
under treasury stock excluded from calculations of the average number of shares during the fiscal year for the
purposes of calculating net earnings per share and are included under treasury stock excluded from total shares
issued and outstanding at the end of the fiscal year for the purposes of calculating net assets per share.
The average number of shares of such treasury stock excluded from calculations of net income per share during the
fiscal year was 336,000 shares in the previous consolidated fiscal year and 132,000 shares in this consolidated fiscal
year. The number of shares of such treasury stock excluded from calculations of net assets per share at the end of the
fiscal year was 241,000 shares in the previous consolidated fiscal year and 11,000 shares in this consolidated fiscal
year.

Nojima Corporation (7419) summary of consolidated financial results for fiscal year ended March 2017 (Japanese accounting standards)
24
(Important subsequent information)
(Merger of shares acquisition)
We have entered into a stock purchase agreement with Fujitsu Limited (“Fujitsu” hereinafter) upon a resolution of the
Board of Directors approved on January 31, 2017 that we acquire the consumer-oriented business of NIFTY Corporation
(“NIFTY” hereinafter), which was a wholly-owned subsidiary of Fujitsu.
We have made a payment for the acquisition to Fujitsu based on the contract on March 31, 2017, and acquired all of
NIFTY’s shares to make it a wholly-owned subsidiary on April 1, 2017.
Further, the acquisition amount is booked as an advance payment on consolidated balance sheet.
1. Outline of Merger
(1) Outline of acquired company and its business
a. Name: NIFTY Corporation
b. Business: Internet Service Provider, and Web Service Business
(2) Main Reason for the Merger
We have decided to welcome NIFTY’s consumer-oriented business, which comprises an ISP business and a Web service
business, in order to evolve from the current business model that sells digital appliances and mobile phones to a “Total
Solution Business” in anticipation of the IoT era. NIFTY, which has developed progressive services by capturing the timely
needs of customers for many years, has development capabilities and knowhow related to its services, customer base, and
brand strengths that the Nojima Group does not have. As a result, we believe we can significantly differentiate ourselves
from competitors in the consumer electronics retailer and mobile phone distributor sector.
(3) Date of Merger
April 1, 2017
(4) Merger Method
Acquisition of shares
(5) Name of the Company after Merger
NIFTY Corporation
(6) Percentage of Voting Rights Acquired
100%
(7) Main Valuation Principle for Acquired Company
Based on having acquired 100% of the company through shares acquired at an assumed cash value.
2. Cost of Acquisition of Acquired Company and Its breakdown
Value of acquisition: (cash) 25,166 million yen
Cost of acquisition: 25,166 million yen
3. Breakdown and Amount of the Main Acquisition-related Fees
Advisory Fee, etc.: JPY 183 million (*)
(*) Advisory Fee, etc. includes fee of the acquisition, remuneration, and other expenses.
4. Financing Method
We borrowed 20 billion yen from financial institutions on March 31, 2017, putting up all NIFTY shares as collateral on April
3, 2017.
5. Distribution of Cost of Acquisition
(1) Amount and its breakdown of received asset and liability:
It is not fixed as of now.
(2) Goodwill generated, how it is generated, and its amortization method
It is not fixed as of now.

Nojima Corporation (7419) summary of consolidated financial results for fiscal year ended March 2017 (Japanese accounting standards)
25
(Issuance of Unsecured Straight Bond)
We have decided to issue 1st series Unsecured Straight Bond (Term: three years) and 2nd series Unsecured Straight Bond (Term:
five years) on April 25, 2017 by a resolution of the president at the discretion of the Board of Directors approved on March 21,
2017, and issued them on May 1, 2017.
1st series Unsecured Straight Bond (Term: three years)
1. Amount of issue: 10 billion yen
2. Issue Price: 100% of principal amount
3. Coupon: 0.6 % per annual
4. Maturity Date: May 1, 2020
The Bond will be redeemed in full upon maturity.
5. Closing date: May 1, 2017
6. Use of proceeds: repayment of Loans
2nd series Unsecured Straight Bond (Term: five years)
1. Amount of issue: five billion yen
2. Issue Price: 100% of principal amount
3. Coupon: 0.98 % per annual
4. Maturity Date: April 28, 2022
The Bond will be redeemed in full upon maturity.
5. Closing date: May 1, 2017
6. Use of proceeds: repayment of Loans
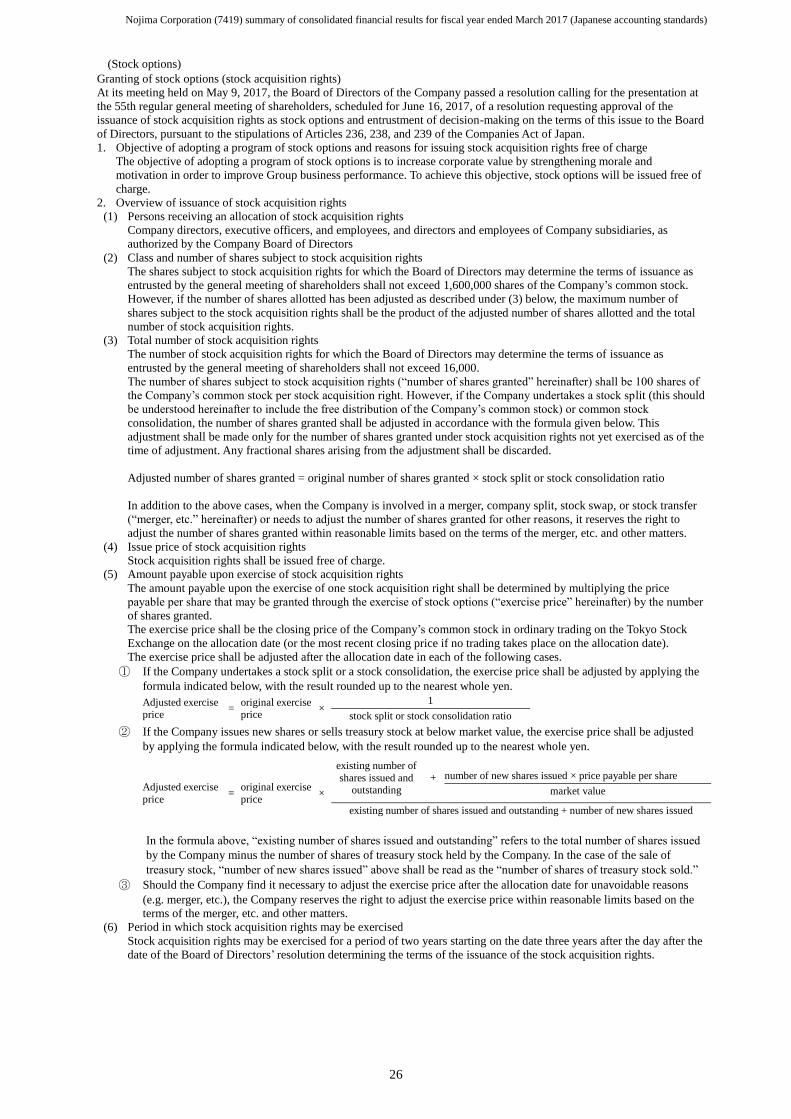
Nojima Corporation (7419) summary of consolidated financial results for fiscal year ended March 2017 (Japanese accounting standards)
26
(Stock options)
Granting of stock options (stock acquisition rights)
At its meeting held on May 9, 2017, the Board of Directors of the Company passed a resolution calling for the presentation at
the 55th regular general meeting of shareholders, scheduled for June 16, 2017, of a resolution requesting approval of the
issuance of stock acquisition rights as stock options and entrustment of decision-making on the terms of this issue to the Board
of Directors, pursuant to the stipulations of Articles 236, 238, and 239 of the Companies Act of Japan.
1. Objective of adopting a program of stock options and reasons for issuing stock acquisition rights free of charge
The objective of adopting a program of stock options is to increase corporate value by strengthening morale and
motivation in order to improve Group business performance. To achieve this objective, stock options will be issued free of
charge.
2. Overview of issuance of stock acquisition rights
(1) Persons receiving an allocation of stock acquisition rights
Company directors, executive officers, and employees, and directors and employees of Company subsidiaries, as
authorized by the Company Board of Directors
(2) Class and number of shares subject to stock acquisition rights
The shares subject to stock acquisition rights for which the Board of Directors may determine the terms of issuance as
entrusted by the general meeting of shareholders shall not exceed 1,600,000 shares of the Company’s common stock.
However, if the number of shares allotted has been adjusted as described under (3) below, the maximum number of
shares subject to the stock acquisition rights shall be the product of the adjusted number of shares allotted and the total
number of stock acquisition rights.
(3) Total number of stock acquisition rights
The number of stock acquisition rights for which the Board of Directors may determine the terms of issuance as
entrusted by the general meeting of shareholders shall not exceed 16,000.
The number of shares subject to stock acquisition rights (“number of shares granted” hereinafter) shall be 100 shares of
the Company’s common stock per stock acquisition right. However, if the Company undertakes a stock split (this should
be understood hereinafter to include the free distribution of the Company’s common stock) or common stock
consolidation, the number of shares granted shall be adjusted in accordance with the formula given below. This
adjustment shall be made only for the number of shares granted under stock acquisition rights not yet exercised as of the
time of adjustment. Any fractional shares arising from the adjustment shall be discarded.
Adjusted number of shares granted = original number of shares granted × stock split or stock consolidation ratio
In addition to the above cases, when the Company is involved in a merger, company split, stock swap, or stock transfer
(“merger, etc.” hereinafter) or needs to adjust the number of shares granted for other reasons, it reserves the right to
adjust the number of shares granted within reasonable limits based on the terms of the merger, etc. and other matters.
(4) Issue price of stock acquisition rights
Stock acquisition rights shall be issued free of charge.
(5) Amount payable upon exercise of stock acquisition rights
The amount payable upon the exercise of one stock acquisition right shall be determined by multiplying the price
payable per share that may be granted through the exercise of stock options (“exercise price” hereinafter) by the number
of shares granted.
The exercise price shall be the closing price of the Company’s common stock in ordinary trading on the Tokyo Stock
Exchange on the allocation date (or the most recent closing price if no trading takes place on the allocation date).
The exercise price shall be adjusted after the allocation date in each of the following cases.
① If the Company undertakes a stock split or a stock consolidation, the exercise price shall be adjusted by applying the
formula indicated below, with the result rounded up to the nearest whole yen.
Adjusted exercise price
= original exercise price
× 1
stock split or stock consolidation ratio
② If the Company issues new shares or sells treasury stock at below market value, the exercise price shall be adjusted
by applying the formula indicated below, with the result rounded up to the nearest whole yen.
Adjusted exercise
price =
original exercise
price ×
existing number of
shares issued and outstanding
+ number of new shares issued × price payable per share
market value
existing number of shares issued and outstanding + number of new shares issued
In the formula above, “existing number of shares issued and outstanding” refers to the total number of shares issued
by the Company minus the number of shares of treasury stock held by the Company. In the case of the sale of
treasury stock, “number of new shares issued” above shall be read as the “number of shares of treasury stock sold.”
③ Should the Company find it necessary to adjust the exercise price after the allocation date for unavoidable reasons
(e.g. merger, etc.), the Company reserves the right to adjust the exercise price within reasonable limits based on the
terms of the merger, etc. and other matters.
(6) Period in which stock acquisition rights may be exercised
Stock acquisition rights may be exercised for a period of two years starting on the date three years after the day after the
date of the Board of Directors’ resolution determining the terms of the issuance of the stock acquisition rights.

Nojima Corporation (7419) summary of consolidated financial results for fiscal year ended March 2017 (Japanese accounting standards)
27
(7) Conditions for exercise of stock acquisition rights A. A person allocated stock acquisition rights (“stock option holder” hereinafter) must hold the title of director,
executive officer, or employee of the Company or a Company subsidiary at the time of exercise. This does not apply in cases deemed appropriate by the Board of Directors.
B. Stock acquisition rights may not be passed on to legal heirs. C. A stock acquisition right must be exercised in full. D. Other terms and conditions shall be as specified in the stock option contract concluded between the Company and
the stock option holder, based on a decision of the Board of Directors. (8) Reasons for acquisition by the Company and conditions for cancellation of stock acquisition rights
A. The Company may acquire stock acquisition rights free of charge on a date specified separately by the Board of Directors if the general meeting of shareholders approves a proposal for a merger agreement whereby the Company is to be dissolved or a proposal for a share exchange agreement or a share transfer plan whereby the Company becomes a wholly-owned subsidiary.
B. If a stock option holder is unable to exercise the option because he or she no longer satisfies the requirements for execution under (7) above or has relinquished such right, the Company may acquire the stock acquisition rights free of charge.
C. The Company may cancel stock acquisition rights it has acquired and holds free of charge at any time. (9) Restrictions on the acquisition of stock acquisition rights through a transfer
Approval of the Company’s Board of Directors is required for the acquisition of stock acquisition rights through a transfer of ownership.
(10) Increases in capital and capital reserves due to the issuance of stock through the exercise of stock acquisition rights A. The amount of an increase in capital due to the issuance of stock through the exercise of stock acquisition rights
shall be one-half of the limit for an increase in capital calculated pursuant to Article 17, Paragraph 1 of the Ordinance on Accounting of Companies, with the result rounded up to the nearest whole yen.
B. The amount of an increase in capital reserves due to the issuance of stock through the exercise of stock acquisition rights shall be the amount remaining after subtracting the increase in capital specified under A above from the limit for an increase in capital under A.
(11) Policies for the treatment of stock acquisition rights in the case of stock swap or stock transfer If the Company is involved in a merger leading to the dissolution of the Company, an absorption-type corporate divestiture, an establishment-type corporate divestiture (in both cases, only if the Company is to be divided), or a stock swap or stock transfer (only if the Company is to become a wholly-owned subsidiary) (the term “organizational restructuring” hereafter to encompass all such events), the Company shall grant stock acquisition rights in the company described in Article 236, Paragraph 1, Item 8, A to E of the Companies Act of Japan (“restructured Company” hereinafter), in each respective case, to stock option holders with unexercised stock acquisition rights not acquired by the Company (“remaining stock options” hereinafter) as of the date the organizational restructuring takes effect (that is, the effective date of absorption-type merger, consolidation-type merger, absorption-type corporate divestiture, establishment-type corporate divestiture, stock swap, or stock transfer). In such cases, the remaining stock options shall be cancelled, and the restructured Company shall issue new stock acquisition rights. This provision is limited to cases in which the merger agreement, new company merger agreement, absorption-type corporate divestiture agreement, establishment-type corporate divestiture plan, stock swap agreement, or stock transfer plan specifies grants of stock acquisition rights in the restructured Company in accordance with the conditions indicated below. A. Number of stock acquisition rights in the restructured Company to be granted
The same number of stock acquisition rights as the number of remaining stock options held by each stock option holder
B. Class of stock in the restructured Company to be issued for the purpose of issuing stock acquisition rights The restructured Company’s common stock
C. Number of shares of stock in the restructured Company to be issued for the purpose of issuing stock acquisition rights Determined in accordance with “(2) Class and number of shares subject to stock acquisition rights” above, based on consideration of the terms of the organizational restructuring and other matters.
D. Amount to be invested upon the exercise of stock acquisition rights The amount to be invested upon the exercise of each stock acquisition right to be granted shall be determined by multiplying the number of shares of stock in the restructured Company to be issued for the purpose of issuing stock acquisition rights determined, as described under C above, by the adjusted exercise price, as described under 5 ③ above.
E. Period in which stock acquisition rights may be exercised Stock acquisition rights may be exercised from the starting date of the period described under “(6) Period in which stock acquisition rights may be exercised” above or the effective date of the organizational restructuring, whichever is later, to the closing date of the period described under “(6) Period in which stock acquisition rights may be exercised” above.
F. Increases in capital and capital reserves due to the issuance of stock through the exercise of stock acquisition rights Determined according to “(10) Increases in capital and capital reserves due to the issuance of stock through the exercise of stock acquisition rights” above.
G. Restrictions on acquisition of stock acquisition rights through transfer Approval of the restructured Company’s Board of Directors is required for the acquisition of stock acquisition rights through a transfer of ownership.
H. Reasons and conditions for acquisition of stock acquisition rights by the restructured Company Determined according to “(8) Reasons for acquisition by the Company and conditions for cancellation of stock acquisition rights” above.
(12) Date of allocation of stock acquisition rights The date shall be determined separately by the Board of Directors.
Note: The details above are conditional upon the approval in the 55th regular general meeting of shareholders scheduled for
June 16, 2017 of the resolution on the issuance of stock acquisition rights free of charge as stock options and on approval by the compensation committee at a meeting held after the 55th regular general meeting of shareholders on individual compensation for directors and executive officers.

Nojima Corporation (7419) summary of consolidated financial results for fiscal year ended March 2017 (Japanese accounting standards)
28
(Equity-method affiliates through shares acquisition)
We decided to conclude a capital and business alliance with Hascom Mobile Corporation upon a resolution of the Board of Directors approved on March 21, 2017. We concluded a contract for underwriting shares documents based on a third-party allocation of new shares with Hascom Mobile Corporation, and a contract on business alliance documents and shareholder’s agreements on a third-party allocation of new shares with Hascom Mobile Corporation and Hascom Corporation, which is the parent company. We acquired 33.9% of Hascom Mobile Corporation shares on April 3, 2017, making it an equity-method affiliate company.
1. Purpose of Share Acquisition
In addition to human resource training and consulting sales, which are our strengths, we expect joint ownership to provide benefits including access to the know-how of the communication departments of both companies, thus creating synergies that include reinforcing customer convenience.
2. Name and Business of Company Purchasing Shares
Name: Hascom Mobile Corporation Business: Sales of Mobile phones
3. Name of Company of Shares To Be Acquired
Hascom Mobile Corporation 4. Number of Shares Acquired and Number of Shares Owned Before and After Acquisition
Number of shares owned before
acquisition -
Acquisition cost
The amount of consideration of shares: 533 million yen
Advisory costs etc.: 11 million yen (*)
Total: 545 million yen
Number of shares acquired 1,006 shares (number of voting rights: 1,006)
Number of shares owned after
acquisition
1,006 shares
(Number of voting rights: 1,006; portion of voting rights owned: 33.9%)
(*)Advisory costs etc. include commission fees of acquisition, remuneration, and other costs. 5. Acquisition Time
April 3, 2017 6. Financing Method Self-funded

Nojima Corporation (7419) summary of consolidated financial results for fiscal year ended March 2017 (Japanese accounting standards)
29
(Exclusion from Equity-method affiliates by the sales of shares) We decided to sell shares of AbelNet Co., Ltd., which is an equity-method affiliate, upon a resolution of the Board of Directors approved on May 9, 2017. It will be excluded from equity-method affiliates upon the sale of its shares. 1. Purpose of Selling Shares
We performed a capital investment and entered into a business alliance that mainly assumed products supplied for AbelNet Co., Ltd. since October 2012; however, we decided to review part of the capital investment and, in conclusion, made adjustments to the alliance because four and a half years had passed.
2. Name and Business of Company Selling Shares
Name: AbelNet Co., Ltd. Business: Import and Export of PCs, digital cameras, household appliances, watches, office appliances, image and music
software, and communications equipment 3. Name of Company Shares To Be Sold
AbelNet Co., Ltd.
4. Number of Shares Selling and the Number of Shares Owned Before and After Sale
Number of shares owned before
sale 320 shares
Cost of sale 640 million yen
Number of shares sold 236 shares (number of voting rights: 236)
Number of shares owned after
sale
84 shares
(Number of voting rights: 84; portion of voting rights owned: 19.8%)
5. Timing of Sale May 18, 2017 (planned)

Nojima Corporation (7419) summary of consolidated financial results for fiscal year ended March 2017 (Japanese accounting standards)
30
(Under common control transaction) On May 9, 2017, Our Board of Directors resolved that Geobit Mobile Corporation (“Geobit” hereinafter) would succeed a part of the business of ITX, and Softbank and Ymobile Businesses, and it concluded a contract with ITX and Geobit on May 9, 2017. Furthermore, ITX’s the Board of Directors approved the resolution on April 17, 2017, and Geobit’s Board of Directors approved it on April 24, 2017.
1. Purpose of Absorption-type split We aim to provide a hub for a smart life to customers, with the evolution into a total solution company that can provide new value in the global IoT era, in which every home electric appliance is connected to the Internet and mobile terminals. This will make it possible for rapid management decisions to be made in a fast-changing mobile phone sales market by creating synergies through the concentration of financial resources and know-how of ITX and Geobit. Our Group is integrating the Softbank and Ymobile businesses of ITX into Geobit to promote our further growth. 2. Names of Companies and Businesses related to the Integration (1) Splitting company: ITX Corporation (2) Inheriting the splitting company: Geobit Mobile Corporation (3) Business: Softbank and Ymobile Business 3. Merger Time
July 1, 2017 (Planned) 4. Merger Method
Splitting company (Absorption-type split) 5. Outline of accounting procedures
“Accounting Standard for Business Combinations” (ASBJ No. 21, September 13, 2013) and “Guidance on Accounting Standard for Business Combinations and Accounting Standard for Business Divestitures” (ASBJ Guidance No. 10, September 13, 2013) We are scheduled to proceed as a transaction under common control, based on the above-mentioned guidelines.

Nojima Corporation (7419) summary of consolidated financial results for fiscal year ended March 2017 (Japanese accounting standards)
31
(ESOP Trust Utilizing Employee Shareholding Association)
On May 9, 2017, Our Board of Directors resolved that we would introduce an employee incentive plan called the “ESOP Trust
Utilizing Employee Shareholding Association” (ESOP Trust), with the aim of raising corporate value over the medium and long
terms.
1. Purpose of introducing ESOP Trust
We have decided to introduce the ESOP Trust with the purpose of expanding the welfare program system for employees and
further support our growth, further raising the consciousness of employees of our performance and stock value by giving
incentives to increase the stock price, thereby raising corporate value over the medium and long terms.
We introduced it in March 2015; however, following its termination, we have decided to reintroduce it.
2. Outline of ESOP Trust
We have established the ESOP Trust, in which beneficiaries are employees who join the Employee Shareholding Association
named the NEX employee stock ownership plan (“Our shareholding association” hereinafter), and will satisfy the prescribed
conditions.
The ESOP Trust purchases stocks equivalent to the expected amount over the next three years our shareholding association
will purchase through the period of the trust. ESOP Trust sells the stocks to our shareholding association once a month. In
accordance with the terms of the trust, stocks remaining in the trust due to an increase in the stock price will be cashed out, and
the beneficiaries will receive the proceeds according to their contribution ratio. Because we will pay it to a bank based on the
Guarantee terms of a loan agreement if the loan remains due to a stock price decline at the end of the term, there will be no
additional charge from employees.
3. Content of ESOP Trust
(1) Type of Trust Agreement: Specified Money in Trust
(2) Purpose: Stable and continuous supply of stock to our shareholding association and improvement of welfare for employees
who are qualified as beneficiaries.
(3) Consigner: Nojima Corporation
(4) Trustee: Mitsubishi UFJ Trust and Banking Corporation
(5) Beneficiary: Members of our shareholding association who satisfy the necessary conditions.
(6) Administrator: A third party that does not have an interest
(7) Date of Agreement: May 11, 2017
(8) Term of Trust: May 11, 2017 to May 25, 2020
(9) Exercise of Right to vote: ESOP Trust will exercise the right to vote according to votes of the association.
(10) Type of stock to be purchased: Common stock issued by Nojima Corporation
(11) Total amount to be purchased: 1,200 million yen
(12) Transaction Period for purchasing stocks: May 17, 2017 to June 16, 2017 (planned)
(13) Terms of acquisition: Purchase of stocks through a stock market.

Nojima Corporation (7419) summary of consolidated financial results for fiscal year ended March 2017 (Japanese accounting standards)
32
4. Other notes
Changes to directors
① Changes to representatives
Not applicable
② Changes to other directors
Candidates as new directors
Name New title Previous title
Atsushi Yamasaki
Director/Executive Officer/General
Manager, Finance and Accounting
Division
Executive Officer/General Manager,
Finance and Accounting Division
Yukihiro Nojiri Director -
Satoshi Akutsu Outside Director -
Daisuke Koriya Outside Director -
Jun Ikeda Outside Director -
Planned retiring directors
Name New title Previous title
Yozo Ishizaka Advisor
Director/Managing Executive
Officer/General Manager, Mobile
Communication Promotion Division
Wataru Yamauchi Advisor Director
Hideki Nomura Outside Director
Mitsuhiro Aso Outside Director
Shin Yoshidome Outside Director
③ Planned appointment/retirement date
Plans call for the above appointments and retirements to take effect on June 16, 2017 (after the regular general meeting
of shareholders scheduled for that date).
Related Documents


