Stonewater Group June 2015 Summary of Benchmarking Results 2013/14

Welcome message from author
This document is posted to help you gain knowledge. Please leave a comment to let me know what you think about it! Share it to your friends and learn new things together.
Transcript
Stonewater Group
June 2015
Summary of Benchmarking
Results 2013/14
HouseMark 2013/14 Benchmarking Report June 2015 _______________________________________________________________________
HouseMark 2015
1
Dear Member Please find attached your annual benchmarking report. We are in the first year of a change programme to reconfigure our services and deliver ‘business intelligence’ to our members. In this context, this report embodies changes to data reporting and the way we analyse the data. See Appendix 1 for more detail. In summary, in terms of data inputting, we offered a ‘lighter touch’ option - which around 15% of our members have elected to take up. In terms of the report, we have also made some changes, which we believe are improvements in line with what members have asked for:
Move from bar charts to histograms – to move away from ‘league tables’ and display the actual range of performance
VFM Scorecard beta version – we are trialling it this year and welcome your comments for improvement.
A bespoke section looking at the impact of welfare reform Our change process is a five year plan, so what can you expect next year? We are looking at:
Collecting and benchmarking customer satisfaction data based on ‘transactional’ rolling satisfaction surveys – to complement our reporting on STAR periodic ‘perception’ surveys
A review of STAR surveys themselves
Adding Social Value outcomes to our VFM scorecard
Greater clarity regarding the (specific) costs of supported housing, Supporting People and care/nursing home provision
Further measures to simplify data collection Some of these projects are complex and we may not achieve all by next May – but I’m hoping for three out of five at least with the rest following in 2016. I would like to thank all of our members who have suggested areas for improvement that we have tried to incorporate in this report. I’m sure we haven’t got everything just right – it would be counter-intuitive to expect otherwise – and I’m looking forward to your further feedback as we move into the second year of our change programme. Regards Ross Fraser Chief Executive On another note, I hope you – or colleagues - have had the chance to experience the Commercial Knowledge Transfer element of our Offer’:
Our Business Connect visits are going down really well with members – particularly the John Lewis, Greggs and social enterprise visits
Our Business Insight ‘round tables’ are also going well.
HouseMark 2013/14 Benchmarking Report June 2015 _______________________________________________________________________
HouseMark 2015
2
Contents
1. Introduction ...................................................................................................................... 4
1.1 Importance of Peer Groups .......................................................................................... 4
1.2 Feedback on this report ................................................................................................ 6
2. Value for Money............................................................................................................... 7
2.1 The Context – Operating environment .......................................................................... 8
2.2 Regulation and your VFM Scorecard ............................................................................ 9
2.3 Value for Money Scorecard: Beta Version .................................................................. 10
3. Welfare Reform taster analysis ...................................................................................... 13
3.1 Key Findings .............................................................................................................. 14
3.2 External data .............................................................................................................. 21
4. Business Health ............................................................................................................. 25
4.1 Growth in Turnover .................................................................................................... 26
4.2 Operating Margin ....................................................................................................... 27
4.3 Housing Management ................................................................................................ 29
4.4 Housing Maintenance ................................................................................................. 30
4.5 Overheads ................................................................................................................. 31
4.6 Maximising rental income ........................................................................................... 32
5. People ........................................................................................................................... 35
5.1 Staff turnover rates ..................................................................................................... 36
5.2 Average days lost to sickness .................................................................................... 37
5.3 Staff satisfaction with employer .................................................................................. 38
5.4 Ratio of top earner to average earner ......................................................................... 39
6. Process ......................................................................................................................... 40
6.1 Rent collected as a % of rent due ............................................................................... 41
6.2 Average re-let time ..................................................................................................... 42
6.3 % of repairs completed at the first visit ....................................................................... 43
6.4 Tenancy turnover rate ................................................................................................ 44
6.5 ASB % cases that were closed successfully resolved ................................................ 45
6.6 Customer services ..................................................................................................... 46
HouseMark 2013/14 Benchmarking Report June 2015 _______________________________________________________________________
HouseMark 2015
3
7. Value ............................................................................................................................. 47
7.1 Tenant satisfaction with the quality of their new home ................................................ 48
7.2 Tenant satisfaction with the overall service provided by their landlord ........................ 49
7.3 Tenant satisfaction with the repairs and maintenance service provided ..................... 50
7.4 Tenant satisfaction with the neighbourhood as a place to live .................................... 51
7.5 Tenants who believe their rent provided VFM............................................................. 52
7.6 Social Value ............................................................................................................... 53
7.7 Other Value Measures ............................................................................................... 53
Appendices .............................................................................................................................. 54
Appendix 1: Changes to HouseMark Benchmarking ................................................................. 54
Appendix 2: Disclosure of information ...................................................................................... 56
Appendix 3: Benchmarking Methodology, Validation and Quality Assurance ............................ 57
Appendix 4: Other services available from HouseMark............................................................. 59
HouseMark 2013/14 Benchmarking Report June 2015 _______________________________________________________________________
HouseMark 2015
4
1. Introduction
As a result of customer research undertaken in 2013, we became aware that some members wanted changes to be made to the benchmarking service. So, following extensive customer consultation we have embarked on a three-year improvement and refresh programme for our benchmarking services. Please see Appendix 1 of this report for more details. As part of this improvement programme, we have changed the format of the report, adding in an executive summary, which includes:
your VFM Scorecard results
Sector analysis on the impact of welfare reform – including your own results
Within the main body of the report, we have continued the theme of Value for Money, with more detailed information being provided in the format of the VFM Scorecard. You will also see that the format of the charts has been changed this year. We have made this change at the request of members who felt that the previous format encouraged “a league table mentality”. This report therefore presents data in the format of tables or histograms. Histograms allow you to see quickly and easily the distribution of data for the whole of your peer group by grouping similar results together. We have maintained a link to the previous way of reporting results by providing quartile information in the table below the histogram. If you would prefer to see your results in the form of a ranked bar chart, this facility is still available via the New Core benchmarking which can be found at http://www.housemark.co.uk/hmkb2.nsf/BMCore?OpenForm The use of tables and histograms in the report means that it is not possible to identify other organisations’ results from the tables themselves. However, a full set of schedules is included in the Appendices which allows you to identify the top performers1. Appendix 3 of this report provides an overview of the benchmarking methodology and outlines the three-stage validation process that HouseMark undertakes to ensure the validity of the data in this report.
1.1 Importance of Peer Groups
Benchmarking is important to any business. It provides key business comparisons with other similar organisations, enabling understanding of areas of strength and weakness, and allowing learning from ‘the best’. Commercially, this information would be used to maintain competitive advantage. In social housing, particularly around the landlord function, competition is less of an issue; but the identification of areas for improvement and learning from your peers is essential business intelligence.
If you are going to use benchmarking data as part of your business planning and improvement process, you need to be assured that the organisations that you are comparing against are similar to your own organisation. This could relate to stock size, region, organisation type or
1 Providing you and the other organisations have agreed to openly share their data
HouseMark 2013/14 Benchmarking Report June 2015 _______________________________________________________________________
HouseMark 2015
5
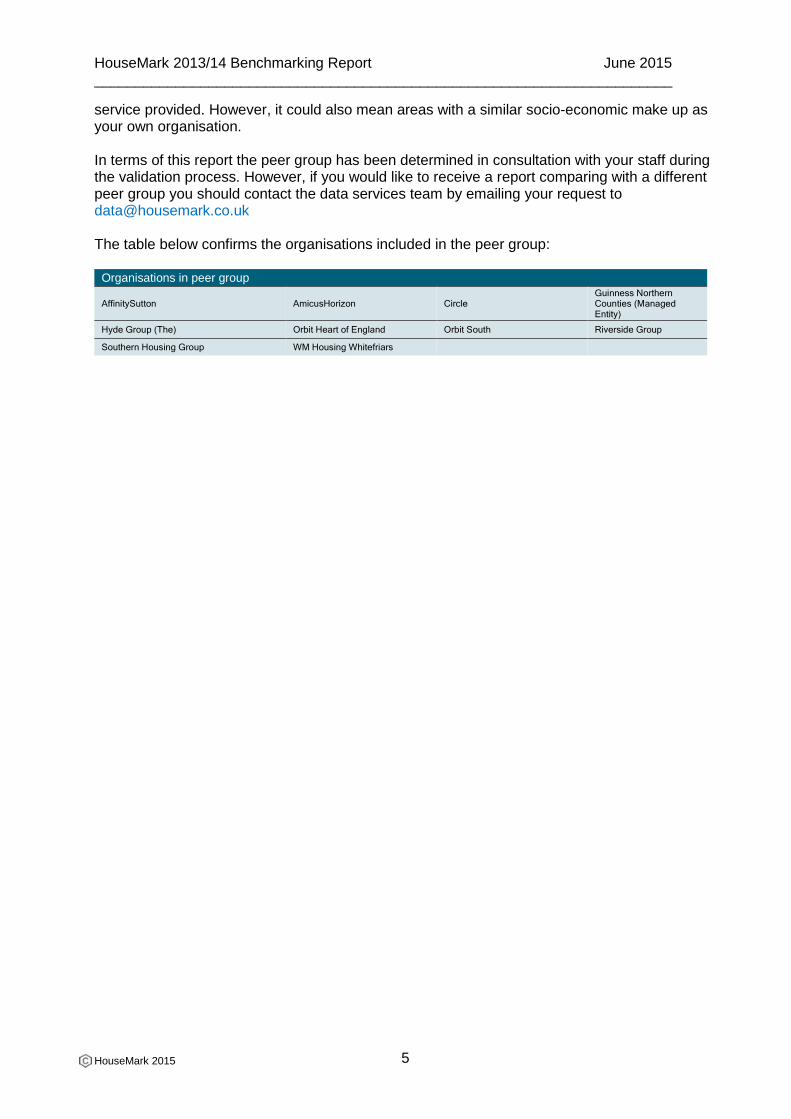
service provided. However, it could also mean areas with a similar socio-economic make up as your own organisation. In terms of this report the peer group has been determined in consultation with your staff during the validation process. However, if you would like to receive a report comparing with a different peer group you should contact the data services team by emailing your request to [email protected] The table below confirms the organisations included in the peer group:
Organisations in peer group
AffinitySutton AmicusHorizon Circle Guinness Northern Counties (Managed Entity)
Hyde Group (The) Orbit Heart of England Orbit South Riverside Group
Southern Housing Group WM Housing Whitefriars

HouseMark 2013/14 Benchmarking Report June 2015 _______________________________________________________________________
HouseMark 2015
6
1.2 Feedback on this report
HouseMark would welcome feedback on this new-style report, we are particularly interested in your thoughts on the Insight section and the VFM Scorecard. Please forward any comments to Paul Edwards or Jonathan Cox on [email protected] or [email protected]
HouseMark 2013/14 Benchmarking Report June 2015 _______________________________________________________________________
HouseMark 2015
7
Executive Summary
HouseMark 2013/14 Benchmarking Report June 2015 _______________________________________________________________________
HouseMark 2015
8
2. Value for Money
2.1 The Context – Operating environment
The HCA’s 2013 Global Accounts of Housing Providers is a useful place to start when considering what the future holds for the social housing sector, and its potential to adversely affect business plans and limit ambition. The following is a summary of the current key issues:
Interest rates will start to go up, increasing the cost of capital.
Reduced social housing grant rates place a greater reliance on debt to fund
development.
The continued lack of plentiful and cheap bank loans has resulted in an increased
reliance on alternative forms of finance which come with a different set of risks that the
sector needs to understand and manage.
Business models that are dependent on the performance of the housing market, e.g.
achieving sales, are likely to be adversely affected by a downturn as assumed income
dries up.
Until Universal Credit is rolled out the full impact of welfare reform on revenue has yet to
materialise.
Plans to implement a new rent-setting regime in 2015 will adversely impact revenue for
many.
Diversifying into other activities to cross-subsidise core objectives is understandable, but
comes with new risks that need to be understood and managed so that social housing
assets are not jeopardised
The skills and experience of board members and executives are critical in terms of managing these risks and planning for the simultaneous crystallisation of multiple risks.
The nature of these risks accentuates the essential role value for money (VFM) has in realising members’ social missions as well as simply maintaining financial viability.
Good quality business data, such as that found in this report, provides invaluable intelligence about business health in order to understand the current state and plan for the future. It also serves as a credible evidence base to demonstrate VFM to the regulator and other stakeholders.
HouseMark 2013/14 Benchmarking Report June 2015 _______________________________________________________________________
HouseMark 2015
9
2.2 Regulation and your VFM Scorecard
The regulatory principle underpinning the VFM standard requires housing associations to develop and deliver a strategy to continuously improve their performance on operating costs and the use of their assets. The VFM self-assessment is intended to demonstrate to the regulator and other stakeholders how associations are performing against this requirement. The VFM self-assessment, therefore, is about providing assurance, which is why the regulator is looking for a robust, transparent, self-aware and honest statement. This means providing sufficient, appropriate evidence to underpin your ‘VFM story’ and to enable the reader to make their own judgements. Amongst other things, the regulator criticised the sector in 2013 for failing to adequately evidence its cost and performance. HouseMark data provides an essential role here, hence the development of the VFM scorecard below. Over the last few months the regulator has further clarified its expectations, notably in the Global Accounts of Housing Providers2. In terms of reporting operational cost and performance3, the HCA is looking for quantified evidence on the cost of delivering services compared with previous years and a relevant peer group, with clear links between the cost and quality of outcomes.
This means:
Setting out the absolute and comparative costs of delivering services in4:
o Your own organisation over time
o Your organisation compared to others, stating the peer group, currency of
data and avoiding the selective reporting of the services you are best at.
A succinct and accessible commentary on headline unit costs, performance and
satisfaction indicators and any other evidence. Coverage should include:
o Your key cost drivers and what you have done or can do about them
o An explanation of your direction of travel. Are costs and performance going
up or down? How does cost and performance relate?
o What are you doing to contain overheads?
o What can you say about the efficiency and effectiveness of your operating
model?
o What are your strengths and weaknesses? What will you do to address areas
of weakness?
2 2013 Global Accounts of Housing Providers http://bit.ly/1jpXhGt
3 Further suggestions for drafting a robust and transparent self-assessment, including asset management, are set out in the HouseMark briefing: Where are we now with VFM self-assessment http://www.housemarkbusinessintelligence.co.uk/SiteAssets/Site%20attachments/Where_are_we_now_with_VFM_self_assessment_vFINAL2.pdf
4 Other evidence to consider alongside this includes internal business metrics, local offer data, care indicators, Social Return on Investment (SROI) exercises and qualitative information eg: tenant scrutiny, service reviews, accreditation, feedback.
HouseMark 2013/14 Benchmarking Report June 2015 _______________________________________________________________________
HouseMark 2015
10
2.3 Value for Money Scorecard: Beta Version
HouseMark has developed a Beta Version of a VFM Scorecard as a business effectiveness tool that can be used by boards, executives, tenants and other stakeholders to help them understand and challenge organisational performance in the round.
In addition, it can usefully feature in housing associations’ VFM self-assessments (alongside other data outputs such as the current HouseMark social housing dashboard) to provide credible, comprehensive, absolute and comparative evidence of cost and performance.
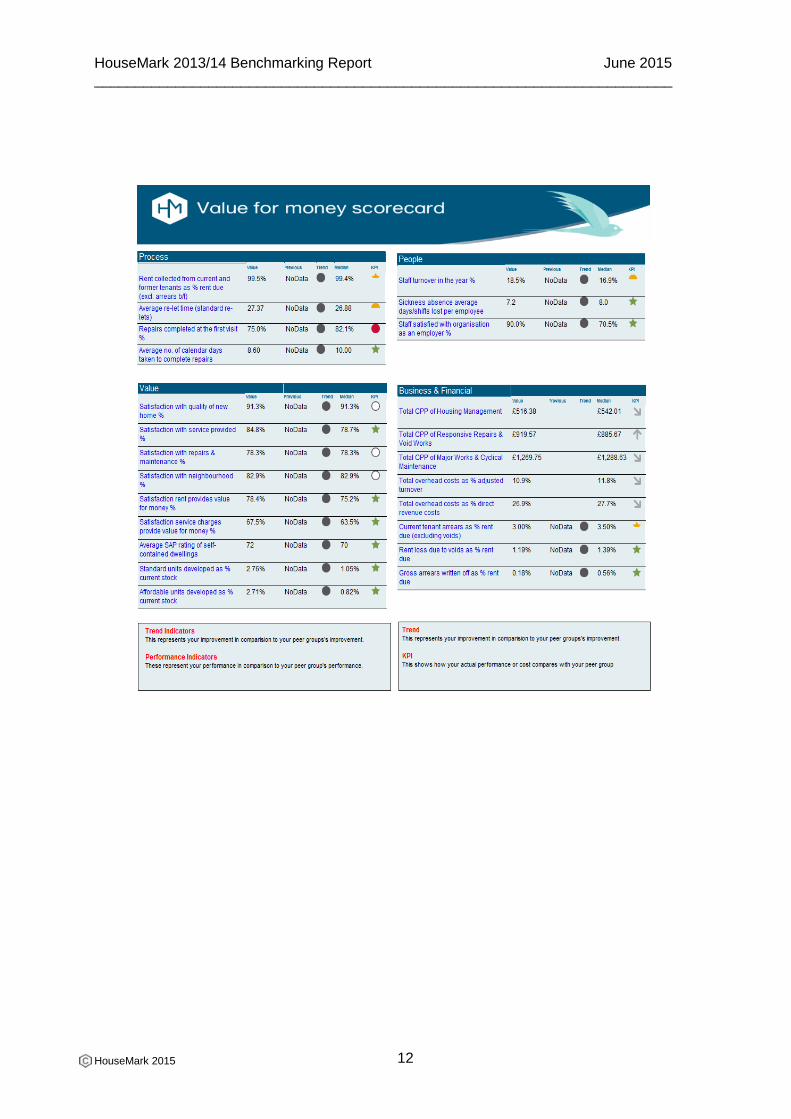
Borrowing from accepted scorecard practice, the data is set out across four domains:
business health – operating efficiency, profitability and maximising income
people – getting the most out of your most important resource
process – effectiveness of key business processes
value – effectiveness of service outcomes
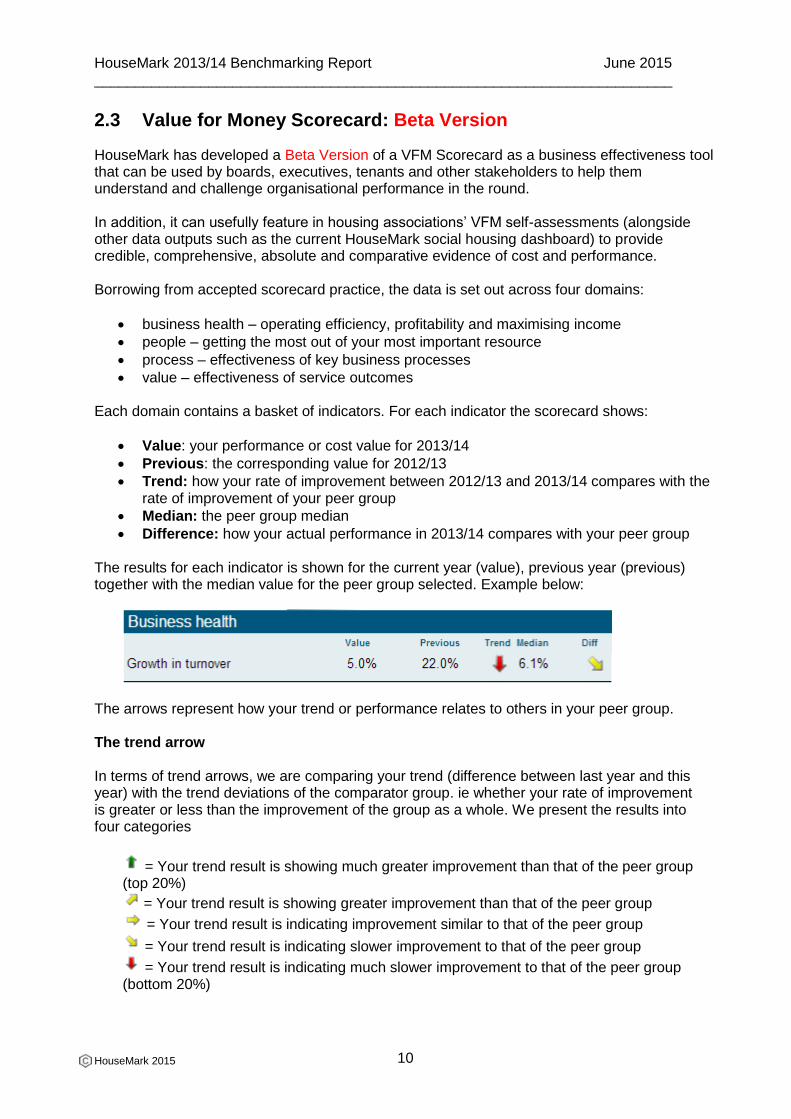
Each domain contains a basket of indicators. For each indicator the scorecard shows:
Value: your performance or cost value for 2013/14
Previous: the corresponding value for 2012/13
Trend: how your rate of improvement between 2012/13 and 2013/14 compares with the rate of improvement of your peer group
Median: the peer group median
Difference: how your actual performance in 2013/14 compares with your peer group The results for each indicator is shown for the current year (value), previous year (previous) together with the median value for the peer group selected. Example below:
The arrows represent how your trend or performance relates to others in your peer group.
The trend arrow In terms of trend arrows, we are comparing your trend (difference between last year and this year) with the trend deviations of the comparator group. ie whether your rate of improvement is greater or less than the improvement of the group as a whole. We present the results into four categories
= Your trend result is showing much greater improvement than that of the peer group (top 20%)
= Your trend result is showing greater improvement than that of the peer group
= Your trend result is indicating improvement similar to that of the peer group
= Your trend result is indicating slower improvement to that of the peer group
= Your trend result is indicating much slower improvement to that of the peer group (bottom 20%)
HouseMark 2013/14 Benchmarking Report June 2015 _______________________________________________________________________
HouseMark 2015
11
The ‘diff arrow’ (performance indicator)
The performance indicator (diff arrow) compares your value to the median of the comparator group for each KPI measure.
= Your performance result is significantly better than the median of the peer group (top 20%)
= Your performance result is better than the median of the peer group
= Your performance result is similar to the median of the peer group
= The median for the peer group is better than your performance result
= The median for the peer group is significantly better than your performance result (bottom 20%)
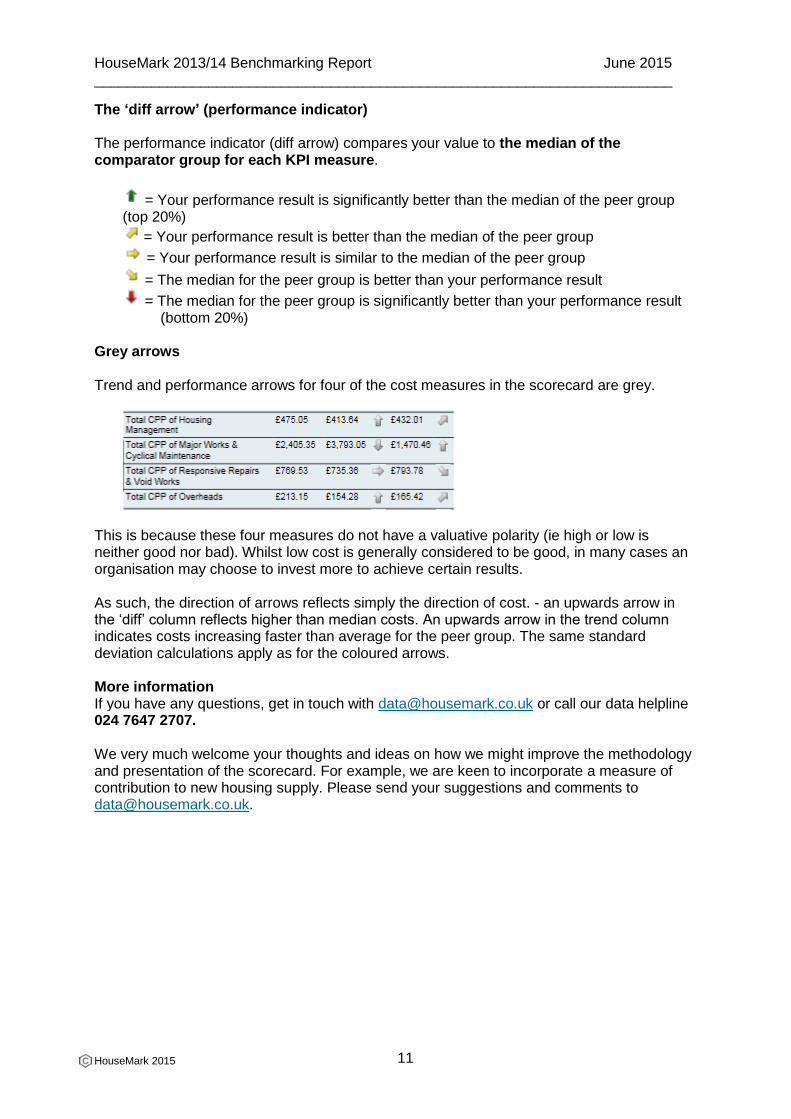
Grey arrows
Trend and performance arrows for four of the cost measures in the scorecard are grey.
This is because these four measures do not have a valuative polarity (ie high or low is neither good nor bad). Whilst low cost is generally considered to be good, in many cases an organisation may choose to invest more to achieve certain results.
As such, the direction of arrows reflects simply the direction of cost. - an upwards arrow in the ‘diff’ column reflects higher than median costs. An upwards arrow in the trend column indicates costs increasing faster than average for the peer group. The same standard deviation calculations apply as for the coloured arrows.
More information If you have any questions, get in touch with [email protected] or call our data helpline 024 7647 2707. We very much welcome your thoughts and ideas on how we might improve the methodology and presentation of the scorecard. For example, we are keen to incorporate a measure of contribution to new housing supply. Please send your suggestions and comments to [email protected].
HouseMark 2013/14 Benchmarking Report June 2015 _______________________________________________________________________
HouseMark 2015
12
HouseMark 2013/14 Benchmarking Report June 2015 _______________________________________________________________________
HouseMark 2015
13
3. Welfare Reform taster analysis
This analysis considers the impact of the changes in welfare support on social landlords’ income, arrears, collection costs and empty properties, as well as the indirect effects on other areas of social housing businesses – such as satisfaction and viability. This report includes the latest available data – up to March 2014 for performance and March 2014 (or 2013/14 inflated) for costs. The main sources of data in this report are HouseMark’s core benchmarking (now New Core) and PI (performance indicator) tracking systems (now Priority Performance Benchmarking). This is presented alongside new data gathered from our welfare reform impact club and publicly available research. Based on performance to the end of 2013/14, our data shows that the impact of welfare reform on rent collection and arrears rates has been quite small. The year-end figures show no new pattern of decline in any of our rent collection or arrears measures. The cost of managing rent arrears and collection increased slightly across the dataset up to the end of 2012/13 – both in real terms and as a proportion of housing management costs. Void levels have changed over the last two years with vacancy rates and relet times increasing for particular groups of landlords. Eviction rates across the country have also gone up – this concurs with Inside Housing research (13 June) and CORE lettings data, which both suggest that evictions rose between 2012/13 and 2013/14.
HouseMark 2013/14 Benchmarking Report June 2015 _______________________________________________________________________
HouseMark 2015
14
3.1 Key Findings
3.1.1 Rent arrears and collection performance
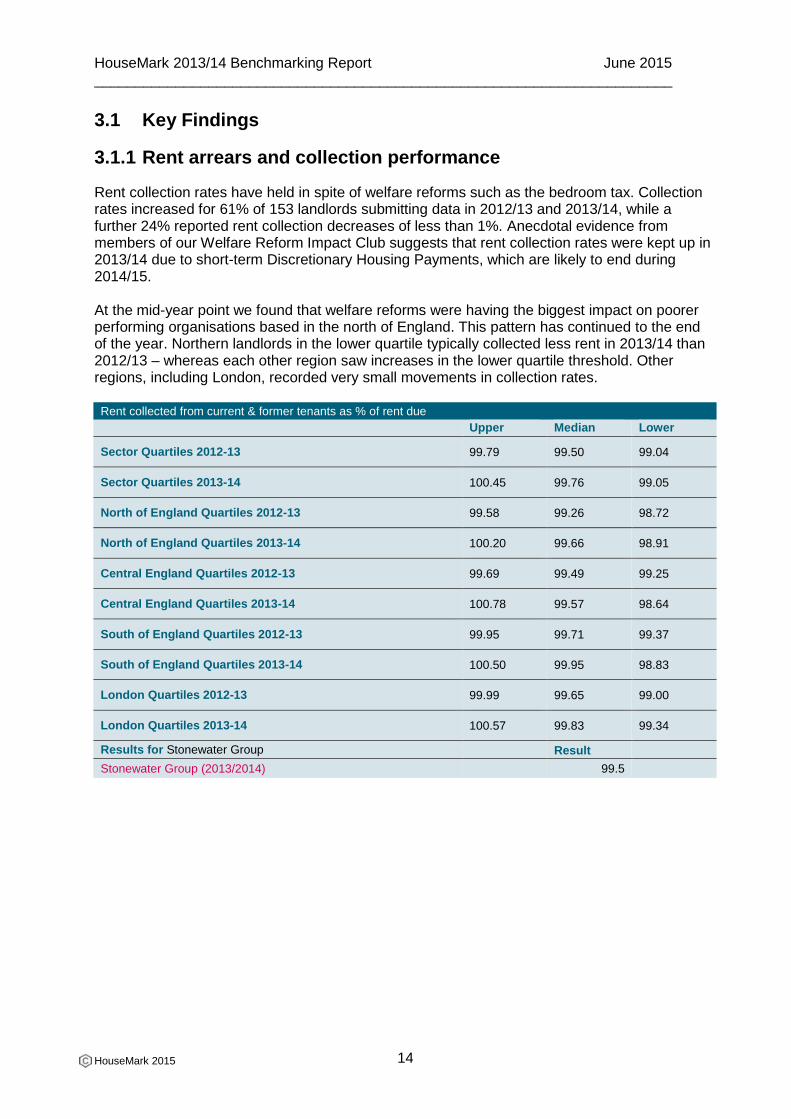
Rent collection rates have held in spite of welfare reforms such as the bedroom tax. Collection rates increased for 61% of 153 landlords submitting data in 2012/13 and 2013/14, while a further 24% reported rent collection decreases of less than 1%. Anecdotal evidence from members of our Welfare Reform Impact Club suggests that rent collection rates were kept up in 2013/14 due to short-term Discretionary Housing Payments, which are likely to end during 2014/15. At the mid-year point we found that welfare reforms were having the biggest impact on poorer performing organisations based in the north of England. This pattern has continued to the end of the year. Northern landlords in the lower quartile typically collected less rent in 2013/14 than 2012/13 – whereas each other region saw increases in the lower quartile threshold. Other regions, including London, recorded very small movements in collection rates. Rent collected from current & former tenants as % of rent due
Upper Median Lower
Sector Quartiles 2012-13 99.79 99.50 99.04
Sector Quartiles 2013-14 100.45 99.76 99.05
North of England Quartiles 2012-13 99.58 99.26 98.72
North of England Quartiles 2013-14 100.20 99.66 98.91
Central England Quartiles 2012-13 99.69 99.49 99.25
Central England Quartiles 2013-14 100.78 99.57 98.64
South of England Quartiles 2012-13 99.95 99.71 99.37
South of England Quartiles 2013-14 100.50 99.95 98.83
London Quartiles 2012-13 99.99 99.65 99.00
London Quartiles 2013-14 100.57 99.83 99.34
Results for Stonewater Group Result
Stonewater Group (2013/2014) 99.5
HouseMark 2013/14 Benchmarking Report June 2015 _______________________________________________________________________
HouseMark 2015
15
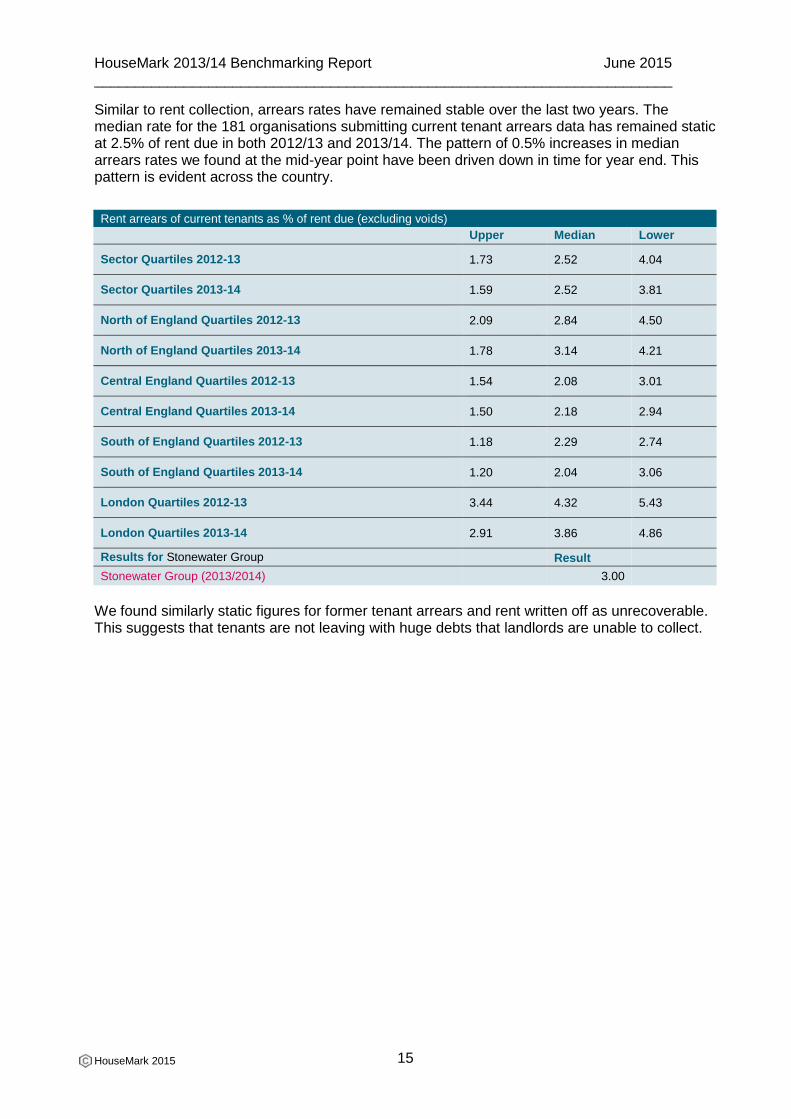
Similar to rent collection, arrears rates have remained stable over the last two years. The median rate for the 181 organisations submitting current tenant arrears data has remained static at 2.5% of rent due in both 2012/13 and 2013/14. The pattern of 0.5% increases in median arrears rates we found at the mid-year point have been driven down in time for year end. This pattern is evident across the country.
Rent arrears of current tenants as % of rent due (excluding voids)
Upper Median Lower
Sector Quartiles 2012-13 1.73 2.52 4.04
Sector Quartiles 2013-14 1.59 2.52 3.81
North of England Quartiles 2012-13 2.09 2.84 4.50
North of England Quartiles 2013-14 1.78 3.14 4.21
Central England Quartiles 2012-13 1.54 2.08 3.01
Central England Quartiles 2013-14 1.50 2.18 2.94
South of England Quartiles 2012-13 1.18 2.29 2.74
South of England Quartiles 2013-14 1.20 2.04 3.06
London Quartiles 2012-13 3.44 4.32 5.43
London Quartiles 2013-14 2.91 3.86 4.86
Results for Stonewater Group Result
Stonewater Group (2013/2014) 3.00
We found similarly static figures for former tenant arrears and rent written off as unrecoverable. This suggests that tenants are not leaving with huge debts that landlords are unable to collect.
HouseMark 2013/14 Benchmarking Report June 2015 _______________________________________________________________________
HouseMark 2015
16
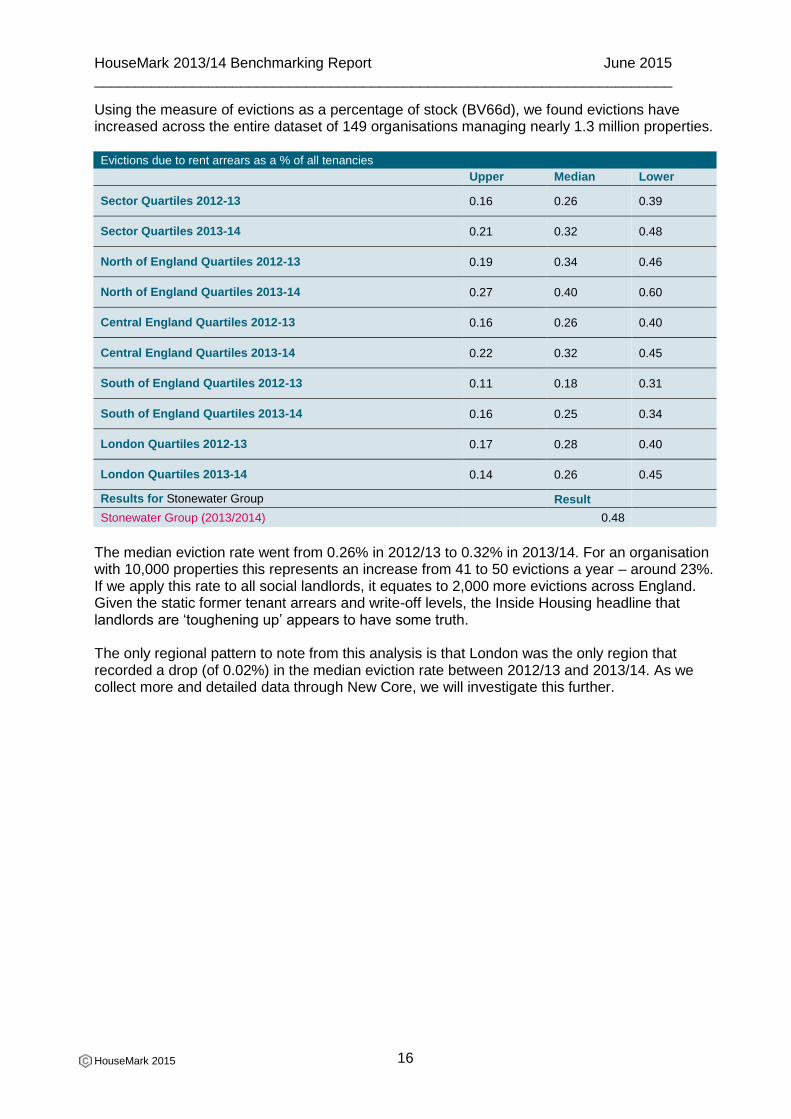
Using the measure of evictions as a percentage of stock (BV66d), we found evictions have increased across the entire dataset of 149 organisations managing nearly 1.3 million properties. Evictions due to rent arrears as a % of all tenancies
Upper Median Lower
Sector Quartiles 2012-13 0.16 0.26 0.39
Sector Quartiles 2013-14 0.21 0.32 0.48
North of England Quartiles 2012-13 0.19 0.34 0.46
North of England Quartiles 2013-14 0.27 0.40 0.60
Central England Quartiles 2012-13 0.16 0.26 0.40
Central England Quartiles 2013-14 0.22 0.32 0.45
South of England Quartiles 2012-13 0.11 0.18 0.31
South of England Quartiles 2013-14 0.16 0.25 0.34
London Quartiles 2012-13 0.17 0.28 0.40
London Quartiles 2013-14 0.14 0.26 0.45
Results for Stonewater Group Result
Stonewater Group (2013/2014) 0.48
The median eviction rate went from 0.26% in 2012/13 to 0.32% in 2013/14. For an organisation with 10,000 properties this represents an increase from 41 to 50 evictions a year – around 23%. If we apply this rate to all social landlords, it equates to 2,000 more evictions across England. Given the static former tenant arrears and write-off levels, the Inside Housing headline that landlords are ‘toughening up’ appears to have some truth. The only regional pattern to note from this analysis is that London was the only region that recorded a drop (of 0.02%) in the median eviction rate between 2012/13 and 2013/14. As we collect more and detailed data through New Core, we will investigate this further.
HouseMark 2013/14 Benchmarking Report June 2015 _______________________________________________________________________
HouseMark 2015
17
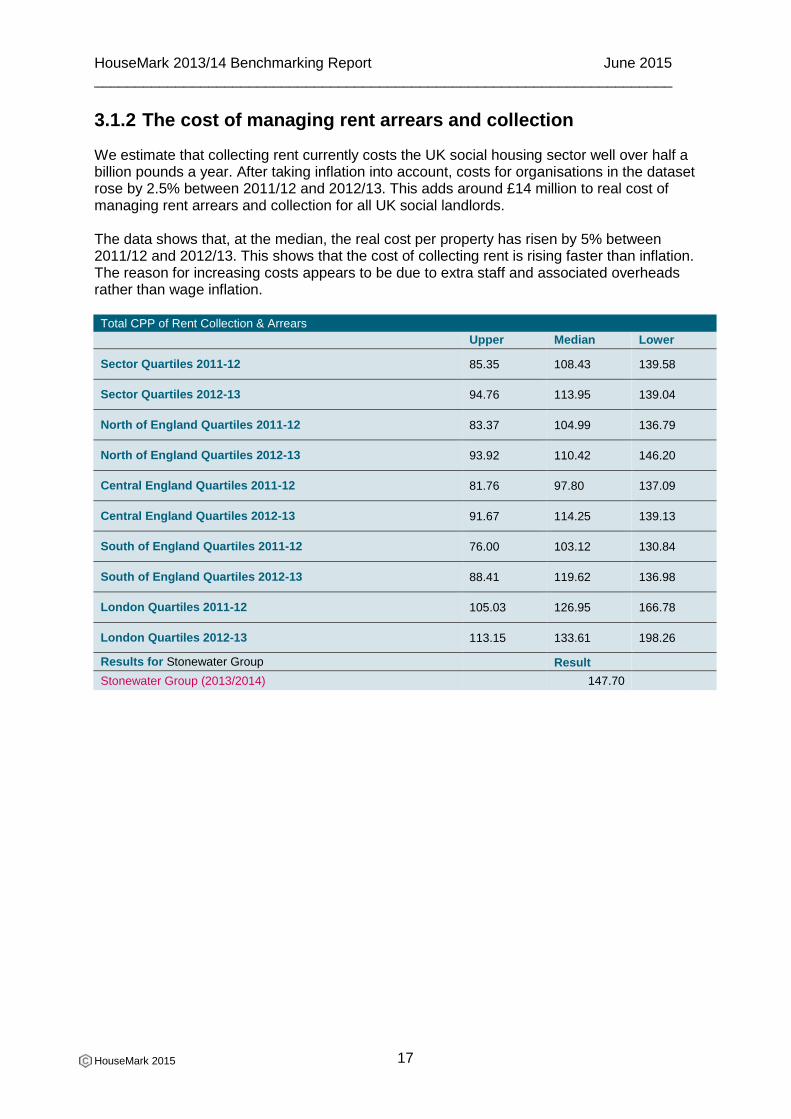
3.1.2 The cost of managing rent arrears and collection
We estimate that collecting rent currently costs the UK social housing sector well over half a billion pounds a year. After taking inflation into account, costs for organisations in the dataset rose by 2.5% between 2011/12 and 2012/13. This adds around £14 million to real cost of managing rent arrears and collection for all UK social landlords. The data shows that, at the median, the real cost per property has risen by 5% between 2011/12 and 2012/13. This shows that the cost of collecting rent is rising faster than inflation. The reason for increasing costs appears to be due to extra staff and associated overheads rather than wage inflation. Total CPP of Rent Collection & Arrears
Upper Median Lower
Sector Quartiles 2011-12 85.35 108.43 139.58
Sector Quartiles 2012-13 94.76 113.95 139.04
North of England Quartiles 2011-12 83.37 104.99 136.79
North of England Quartiles 2012-13 93.92 110.42 146.20
Central England Quartiles 2011-12 81.76 97.80 137.09
Central England Quartiles 2012-13 91.67 114.25 139.13
South of England Quartiles 2011-12 76.00 103.12 130.84
South of England Quartiles 2012-13 88.41 119.62 136.98
London Quartiles 2011-12 105.03 126.95 166.78
London Quartiles 2012-13 113.15 133.61 198.26
Results for Stonewater Group Result
Stonewater Group (2013/2014) 147.70
HouseMark 2013/14 Benchmarking Report June 2015 _______________________________________________________________________
HouseMark 2015
18
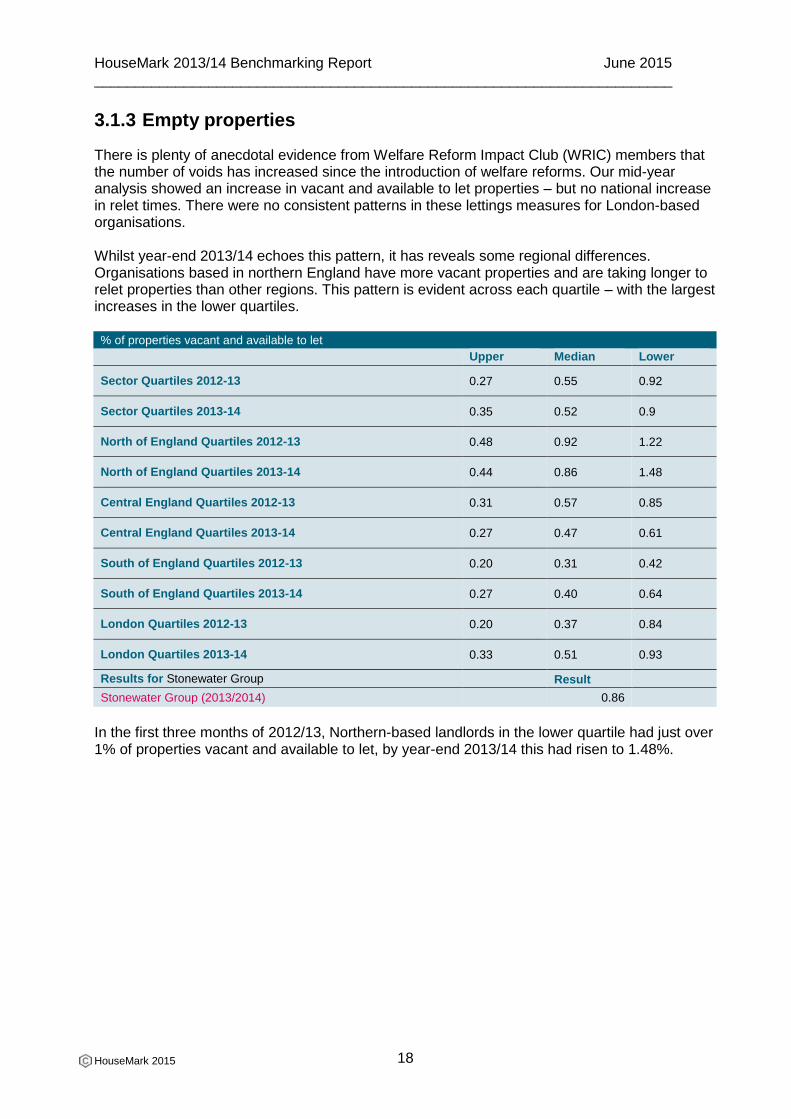
3.1.3 Empty properties
There is plenty of anecdotal evidence from Welfare Reform Impact Club (WRIC) members that the number of voids has increased since the introduction of welfare reforms. Our mid-year analysis showed an increase in vacant and available to let properties – but no national increase in relet times. There were no consistent patterns in these lettings measures for London-based organisations. Whilst year-end 2013/14 echoes this pattern, it has reveals some regional differences. Organisations based in northern England have more vacant properties and are taking longer to relet properties than other regions. This pattern is evident across each quartile – with the largest increases in the lower quartiles. % of properties vacant and available to let
Upper Median Lower
Sector Quartiles 2012-13 0.27 0.55 0.92
Sector Quartiles 2013-14 0.35 0.52 0.9
North of England Quartiles 2012-13 0.48 0.92 1.22
North of England Quartiles 2013-14 0.44 0.86 1.48
Central England Quartiles 2012-13 0.31 0.57 0.85
Central England Quartiles 2013-14 0.27 0.47 0.61
South of England Quartiles 2012-13 0.20 0.31 0.42
South of England Quartiles 2013-14 0.27 0.40 0.64
London Quartiles 2012-13 0.20 0.37 0.84
London Quartiles 2013-14 0.33 0.51 0.93
Results for Stonewater Group Result
Stonewater Group (2013/2014) 0.86
In the first three months of 2012/13, Northern-based landlords in the lower quartile had just over 1% of properties vacant and available to let, by year-end 2013/14 this had risen to 1.48%.
HouseMark 2013/14 Benchmarking Report June 2015 _______________________________________________________________________
HouseMark 2015
19
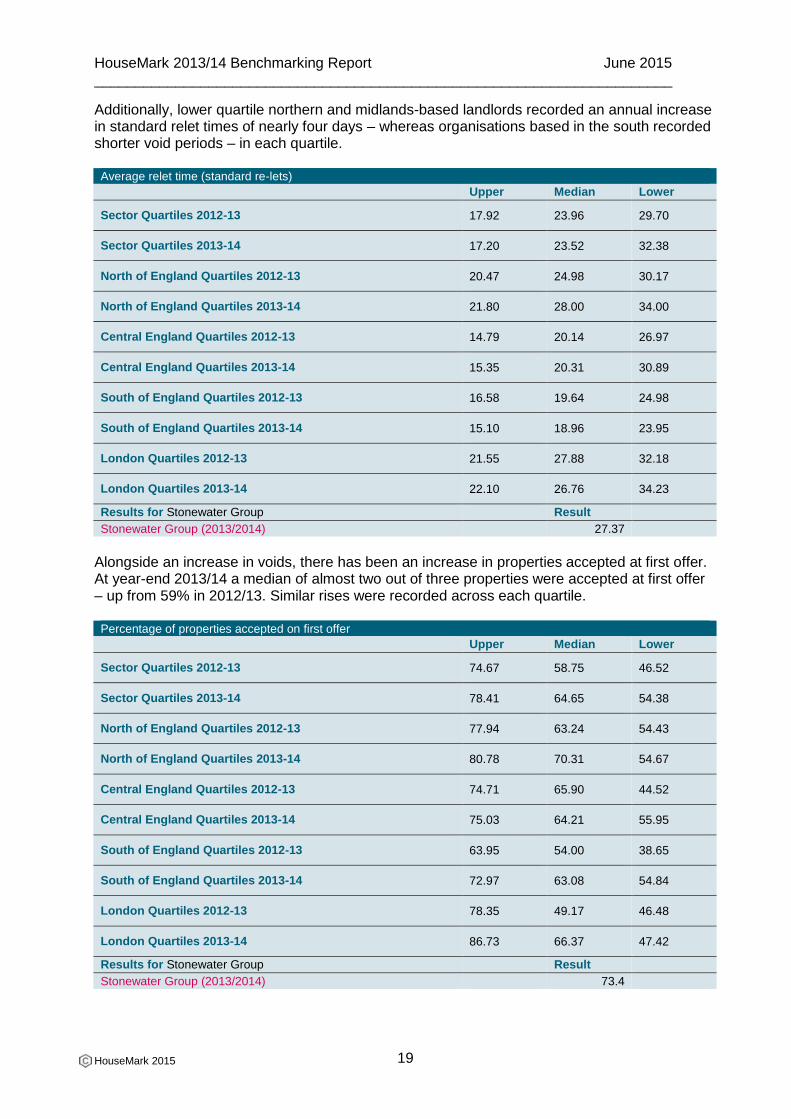
Additionally, lower quartile northern and midlands-based landlords recorded an annual increase in standard relet times of nearly four days – whereas organisations based in the south recorded shorter void periods – in each quartile. Average relet time (standard re-lets)
Upper Median Lower
Sector Quartiles 2012-13 17.92 23.96 29.70
Sector Quartiles 2013-14 17.20 23.52 32.38
North of England Quartiles 2012-13 20.47 24.98 30.17
North of England Quartiles 2013-14 21.80 28.00 34.00
Central England Quartiles 2012-13 14.79 20.14 26.97
Central England Quartiles 2013-14 15.35 20.31 30.89
South of England Quartiles 2012-13 16.58 19.64 24.98
South of England Quartiles 2013-14 15.10 18.96 23.95
London Quartiles 2012-13 21.55 27.88 32.18
London Quartiles 2013-14 22.10 26.76 34.23
Results for Stonewater Group Result
Stonewater Group (2013/2014) 27.37
Alongside an increase in voids, there has been an increase in properties accepted at first offer. At year-end 2013/14 a median of almost two out of three properties were accepted at first offer – up from 59% in 2012/13. Similar rises were recorded across each quartile. Percentage of properties accepted on first offer
Upper Median Lower
Sector Quartiles 2012-13 74.67 58.75 46.52
Sector Quartiles 2013-14 78.41 64.65 54.38
North of England Quartiles 2012-13 77.94 63.24 54.43
North of England Quartiles 2013-14 80.78 70.31 54.67
Central England Quartiles 2012-13 74.71 65.90 44.52
Central England Quartiles 2013-14 75.03 64.21 55.95
South of England Quartiles 2012-13 63.95 54.00 38.65
South of England Quartiles 2013-14 72.97 63.08 54.84
London Quartiles 2012-13 78.35 49.17 46.48
London Quartiles 2013-14 86.73 66.37 47.42
Results for Stonewater Group Result
Stonewater Group (2013/2014) 73.4
HouseMark 2013/14 Benchmarking Report June 2015 _______________________________________________________________________
HouseMark 2015
20
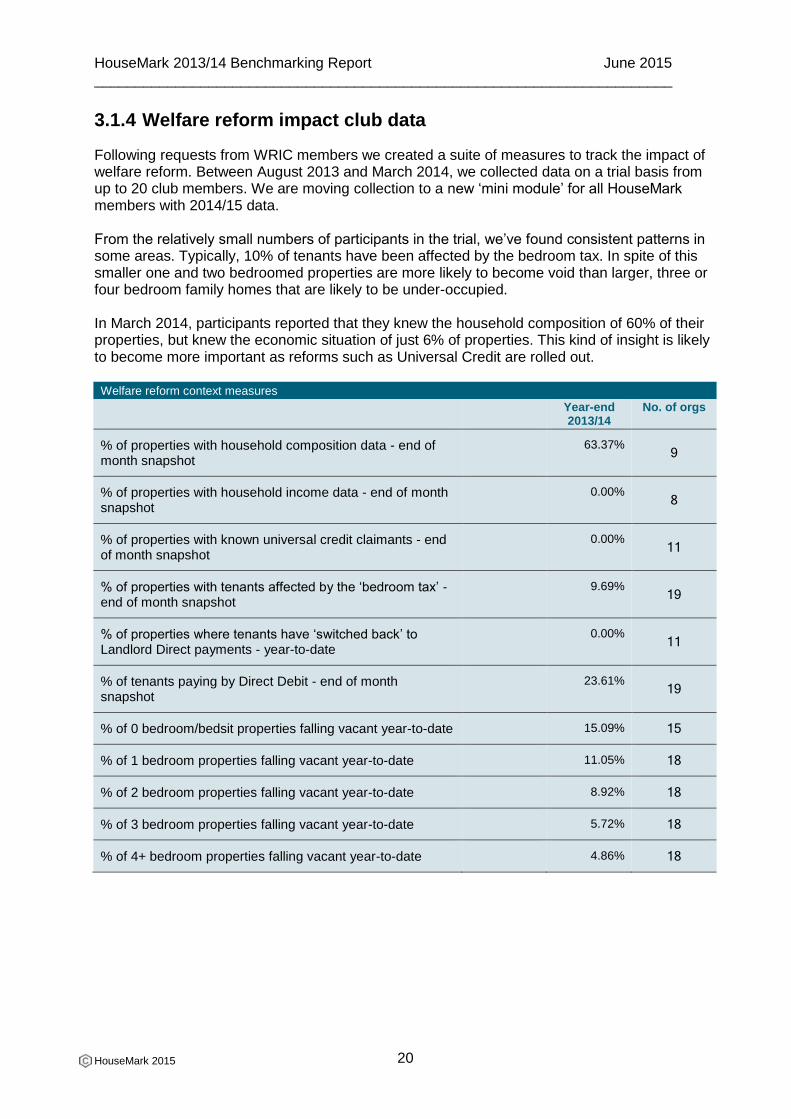
3.1.4 Welfare reform impact club data
Following requests from WRIC members we created a suite of measures to track the impact of welfare reform. Between August 2013 and March 2014, we collected data on a trial basis from up to 20 club members. We are moving collection to a new ‘mini module’ for all HouseMark members with 2014/15 data. From the relatively small numbers of participants in the trial, we’ve found consistent patterns in some areas. Typically, 10% of tenants have been affected by the bedroom tax. In spite of this smaller one and two bedroomed properties are more likely to become void than larger, three or four bedroom family homes that are likely to be under-occupied. In March 2014, participants reported that they knew the household composition of 60% of their properties, but knew the economic situation of just 6% of properties. This kind of insight is likely to become more important as reforms such as Universal Credit are rolled out. Welfare reform context measures
Year-end 2013/14
No. of orgs
% of properties with household composition data - end of month snapshot
63.37% 9
% of properties with household income data - end of month snapshot
0.00% 8
% of properties with known universal credit claimants - end of month snapshot
0.00% 11
% of properties with tenants affected by the ‘bedroom tax’ - end of month snapshot
9.69% 19
% of properties where tenants have ‘switched back’ to Landlord Direct payments - year-to-date
0.00% 11
% of tenants paying by Direct Debit - end of month snapshot
23.61% 19
% of 0 bedroom/bedsit properties falling vacant year-to-date 15.09% 15
% of 1 bedroom properties falling vacant year-to-date 11.05% 18
% of 2 bedroom properties falling vacant year-to-date 8.92% 18
% of 3 bedroom properties falling vacant year-to-date 5.72% 18
% of 4+ bedroom properties falling vacant year-to-date 4.86% 18
HouseMark 2013/14 Benchmarking Report June 2015 _______________________________________________________________________
HouseMark 2015
21
3.2 External data
3.2.1 Department for Work and Pensions statistics
The DWP produces a great deal of welfare statistics, but only a few are relevant to the social housing sector. In terms of numbers, the DWP has published a handful of useful reports on gov.uk since April 2013:
Around 40,0005 people will be affected by the benefits cap, which will save around £110m in year one, and £300m over the next two years
Prior to the cap, 10 households received over £958.50 a week – equating to £50,000 a year. No one received more than £100,000 a year
Around 3.4 million social housing tenants claim housing benefit
British social rented properties have 1.5 million spare bedrooms
The bedroom tax will cost local authorities, social landlords and tenants around £930 million
44% of the general public support removal of the spare room subsidy or the ‘bedroom tax’
The government is providing additional funding through Discretionary Housing Payments (DHPs) of £65 million in 2013/14 and up to £35 million in 2014/15 to support those claimants affected by the benefit cap.
The total value of Britain’s housing benefit overpayments outstanding at the beginning of Q4 2012/13 stood at nearly £1.3 billion; a year-on-year increase of 11%.Since the summer there have been an increasing number of legal challenges to welfare reforms coming through the court system – including judicial reviews of size criteria and a rejection of the challenge to the benefit cap by the High Court. To try and get a clearer picture, the DWP is tracking the number of First-tier Tribunal decisions where bedroom tax is the main issue. In an urgent bulletin6 issued 30 October it ‘asked’ local authorities to notify DWP of all First-tier Tribunal decisions relating to this subject regardless of whether the decision is overturned or whether they intend to appeal.
3.2.2 Bedroom tax finder
In February 2014 we created a data visualisation7 showing how the bedroom tax has affected different parts of the UK. Using open data sourced from the Department for Work and Pensions, we found that:
Scotland, Wales and Northern England all had more than 10% of social tenants affected
whereas less than 10% of social tenants in London and the South East were affected
The housing benefit bill has risen 24% in real terms since 2008 – due to 20% increase in
caseload
Private sector HB claimants have increased from a quarter to a third of all claimants
Proportion of in-work HB claims has doubled from 1 in 10 to 1 in 5 of all claims over a
five year period
5 This figure was revised downwards from an early estimate of 56,000. http://bit.ly/17kblQ2
6 www.gov.uk/government/publications/hb-bulletin-u72013-removal-of-the-spare-room-subsidy-and-first-tier-tribunal-decisions
7 See http://bit.ly/1oJqRMH
HouseMark 2013/14 Benchmarking Report June 2015 _______________________________________________________________________
HouseMark 2015
22
3.2.3 Mutual exchanges
Following requests from WRIC members, we’ve extracted the number of mutual exchanges from the HCA’s statistical data return and the DCLG’s local authority housing statistics (LAHS) release. Together these showed that there were 37,969 mutual exchanges in 2012/13. Of these 21,944 were recorded by housing associations and 16,025 from local authorities. The HCA didn’t publish any 2011/12 data on mutual exchanges, but LAHS returns indicate an increase of around 1,000 mutual exchanges in the local authority sector. The numbers are still quite small compared to the 295,940 general needs lettings recorded in the same year. The DCLG and HCA are scheduled to publish 2013/14 data in this area in the autumn.
3.2.4 Direct payment demonstration projects
Perhaps most relevant DWP reports to the housing sector are on the direct payment demonstration projects8, which have been testing how Universal Credit (UC) payments direct to tenants will work in practice. These will provide the basis for administering direct payments from 2014 as existing housing benefit claimants move onto UC. All of these projects have shown that collection rates fall when rent is paid direct to tenants rather than to the landlord. The most recent report shows that after nine payment cycles:
Levels of payments by tenants on the projects varied from 91% to 97%
The average rent collected as a percentage of rent charged was 94% - up from 92% in the first four months
Around 17% of tenants involved in the projects had their housing payments switched back to their landlord.
The report contains case study progress reports on each pilot with details about lessons learned and feedback from tenants.
8 www.gov.uk/government/publications/direct-payments-demonstration-projects-learning-the-lessons-6-months-in-rr-839
HouseMark 2013/14 Benchmarking Report June 2015 _______________________________________________________________________
HouseMark 2015
23
Main report findings
HouseMark 2013/14 Benchmarking Report June 2015 _______________________________________________________________________
HouseMark 2015
24
The remainder of this document provides the main report findings. The format follows the four key areas that form the VFM scorecard.
In each section you will be presented with a narrative explaining why this section is an important part of the overall scorecard. This introduction will be followed by a series of charts and tables. The charts are in the format of a histogram which shows a range of results across the horizontal axis and the number of organisations with result in that range along the vertical axis. The first table under the histogram provides the full range of results available and includes your own result on the second row. The ranges are system generated and will be different for each indicator dependent on the range of results received for that particular indicator. There are ten segments of varying size provided for each indicator. Finally, the second table below the chart presents the results for your organisation for three consecutive years where this is available and allows you to compare your result with the quartiles for the peer group. We have included the quartile information to maintain a link to the previous way of reporting results. If you would prefer to see your results in the form of a ranked bar chart, this facility is still available on New Core benchmarking which can be found at http://www.housemark.co.uk/hmkb2.nsf/BMCore?OpenForm Summary tables have been provided in a number of places where we wish to present a large amount of data together. These contain data for two consecutive years where this is available.
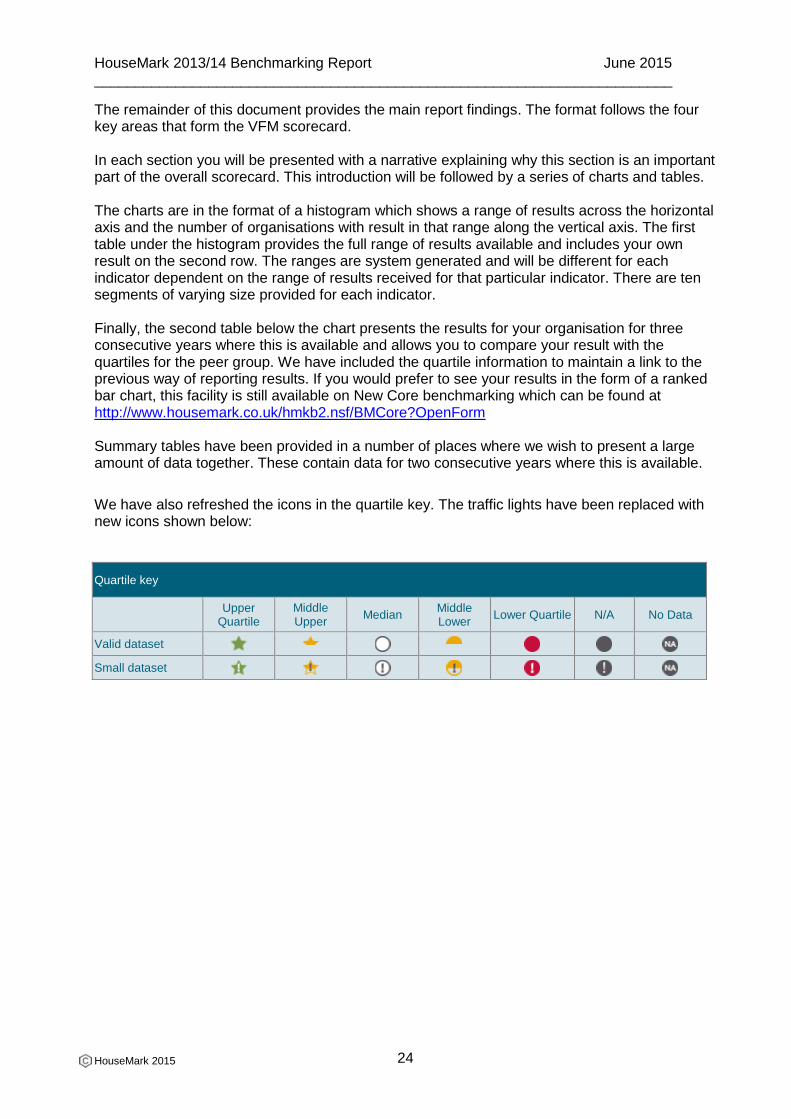
We have also refreshed the icons in the quartile key. The traffic lights have been replaced with new icons shown below:
Quartile key
Upper
Quartile Middle Upper
Median Middle Lower
Lower Quartile N/A No Data
Valid dataset
Small dataset
HouseMark 2013/14 Benchmarking Report June 2015 _______________________________________________________________________
HouseMark 2015
25
4. Business Health
Two of the main financial indicators of business health are Growth in turnover and Operating margin. Together they enable you to tell a story about the:
Growth of your business, and indicate the extent to which your strategic and operational
goals are being achieved. Business growth is also associated with the potential for
increased financial capacity and a dilution of the overhead burden.
Level of surplus generated from operational activities, and as such is an indicator of
efficiency where costs from housing management, maintenance and overheads (noted
below) are the key variables. Surplus is potentially an important source of financial
capacity that can be reinvested to support your social mission. However, unlike with
commercial businesses, a housing association’s operating margin and costs cannot be
looked at in relative isolation. The quality or effectiveness of service outcomes is key.
Therefore margin and costs must be considered alongside the service offered and
delivered (as noted in the Value section).
This section also includes the key income measures that underpin turnover. Cash flow is the lifeblood of the business – poor performance erodes surplus and then potentially threatens service delivery itself. Accordingly your stakeholders will want assurance about this key business area. The charts that follow compare your performance for the last two years together with the other organisations in your peer group. The table shows you the median and quartile positions for the group.
HouseMark 2013/14 Benchmarking Report June 2015 _______________________________________________________________________
HouseMark 2015
26
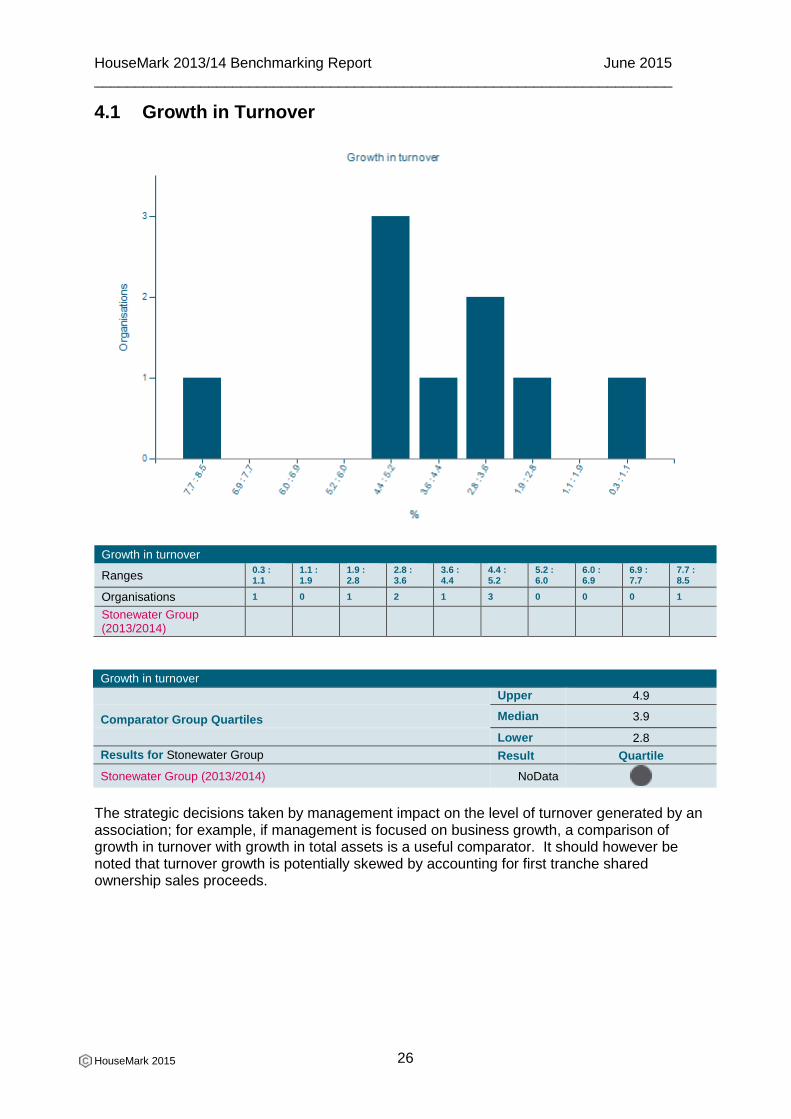
4.1 Growth in Turnover
Growth in turnover
Ranges 0.3 : 1.1
1.1 : 1.9
1.9 : 2.8
2.8 : 3.6
3.6 : 4.4
4.4 : 5.2
5.2 : 6.0
6.0 : 6.9
6.9 : 7.7
7.7 : 8.5
Organisations 1 0 1 2 1 3 0 0 0 1
Stonewater Group (2013/2014)
Growth in turnover
Upper 4.9
Comparator Group Quartiles Median 3.9
Lower 2.8
Results for Stonewater Group Result Quartile
Stonewater Group (2013/2014) NoData
The strategic decisions taken by management impact on the level of turnover generated by an association; for example, if management is focused on business growth, a comparison of growth in turnover with growth in total assets is a useful comparator. It should however be noted that turnover growth is potentially skewed by accounting for first tranche shared ownership sales proceeds.
HouseMark 2013/14 Benchmarking Report June 2015 _______________________________________________________________________
HouseMark 2015
27
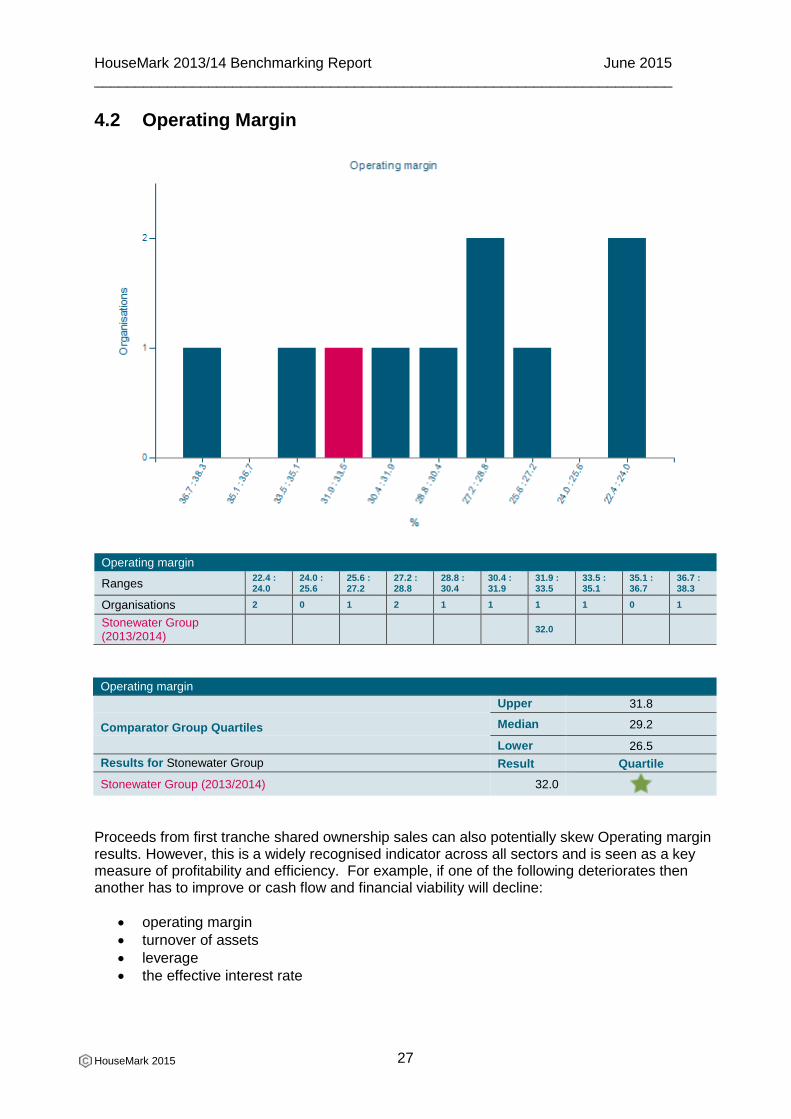
4.2 Operating Margin
Operating margin
Ranges 22.4 : 24.0
24.0 : 25.6
25.6 : 27.2
27.2 : 28.8
28.8 : 30.4
30.4 : 31.9
31.9 : 33.5
33.5 : 35.1
35.1 : 36.7
36.7 : 38.3
Organisations 2 0 1 2 1 1 1 1 0 1
Stonewater Group (2013/2014)
32.0
Operating margin
Upper 31.8
Comparator Group Quartiles Median 29.2
Lower 26.5
Results for Stonewater Group Result Quartile
Stonewater Group (2013/2014) 32.0
Proceeds from first tranche shared ownership sales can also potentially skew Operating margin results. However, this is a widely recognised indicator across all sectors and is seen as a key measure of profitability and efficiency. For example, if one of the following deteriorates then another has to improve or cash flow and financial viability will decline:
operating margin
turnover of assets
leverage
the effective interest rate
HouseMark 2013/14 Benchmarking Report June 2015 _______________________________________________________________________
HouseMark 2015
28
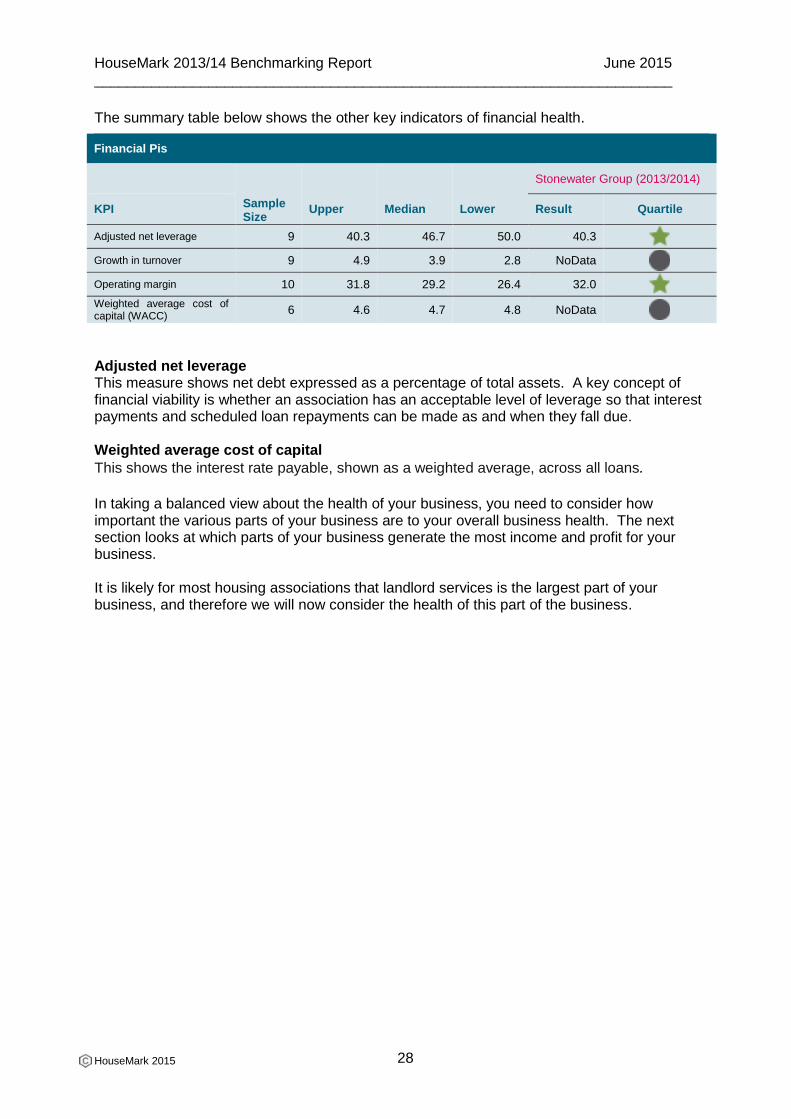
The summary table below shows the other key indicators of financial health.
Financial Pis
Sample Size
Upper Median Lower
Stonewater Group (2013/2014)
KPI Result Quartile
Adjusted net leverage 9 40.3 46.7 50.0 40.3
Growth in turnover 9 4.9 3.9 2.8 NoData
Operating margin 10 31.8 29.2 26.4 32.0
Weighted average cost of capital (WACC)
6 4.6 4.7 4.8 NoData
Adjusted net leverage This measure shows net debt expressed as a percentage of total assets. A key concept of financial viability is whether an association has an acceptable level of leverage so that interest payments and scheduled loan repayments can be made as and when they fall due. Weighted average cost of capital
This shows the interest rate payable, shown as a weighted average, across all loans. In taking a balanced view about the health of your business, you need to consider how important the various parts of your business are to your overall business health. The next section looks at which parts of your business generate the most income and profit for your business. It is likely for most housing associations that landlord services is the largest part of your business, and therefore we will now consider the health of this part of the business.
HouseMark 2013/14 Benchmarking Report June 2015 _______________________________________________________________________
HouseMark 2015
29
4.3 Housing Management
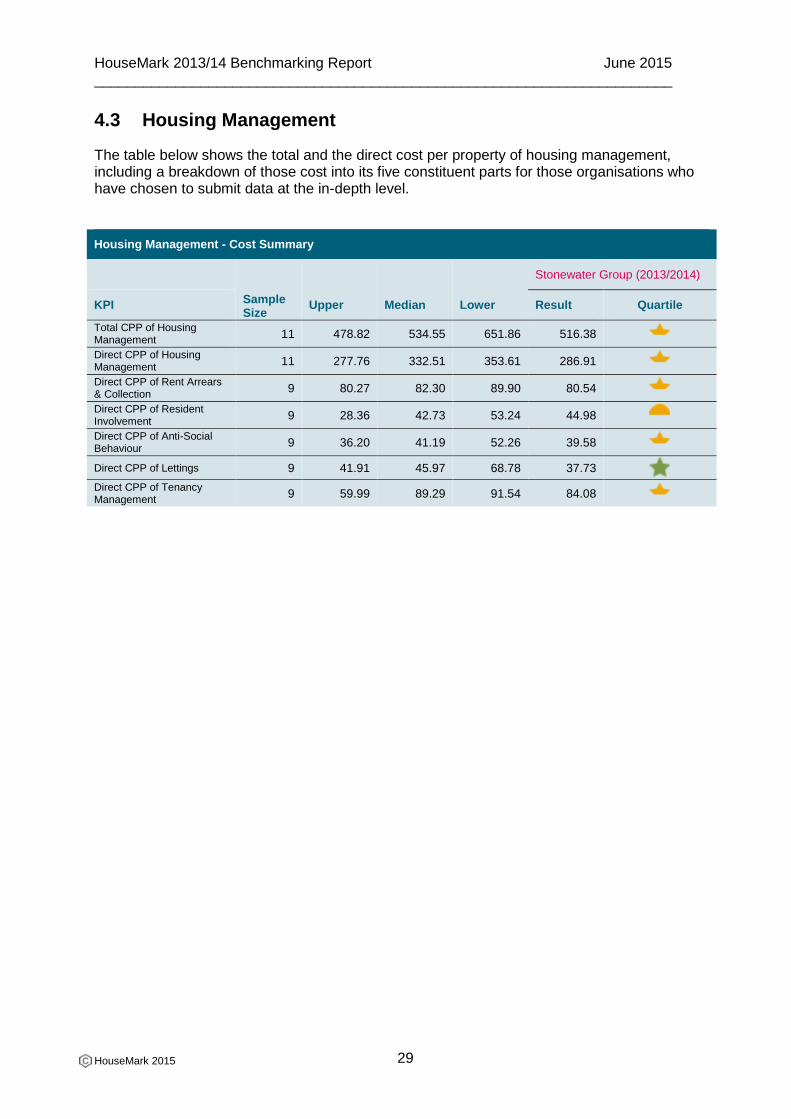
The table below shows the total and the direct cost per property of housing management, including a breakdown of those cost into its five constituent parts for those organisations who have chosen to submit data at the in-depth level.
Housing Management - Cost Summary
Sample Size
Upper Median Lower
Stonewater Group (2013/2014)
KPI Result Quartile
Total CPP of Housing Management
11 478.82 534.55 651.86 516.38
Direct CPP of Housing Management
11 277.76 332.51 353.61 286.91
Direct CPP of Rent Arrears & Collection
9 80.27 82.30 89.90 80.54
Direct CPP of Resident Involvement
9 28.36 42.73 53.24 44.98
Direct CPP of Anti-Social Behaviour
9 36.20 41.19 52.26 39.58
Direct CPP of Lettings 9 41.91 45.97 68.78 37.73
Direct CPP of Tenancy Management
9 59.99 89.29 91.54 84.08
HouseMark 2013/14 Benchmarking Report June 2015 _______________________________________________________________________
HouseMark 2015
30
4.4 Housing Maintenance
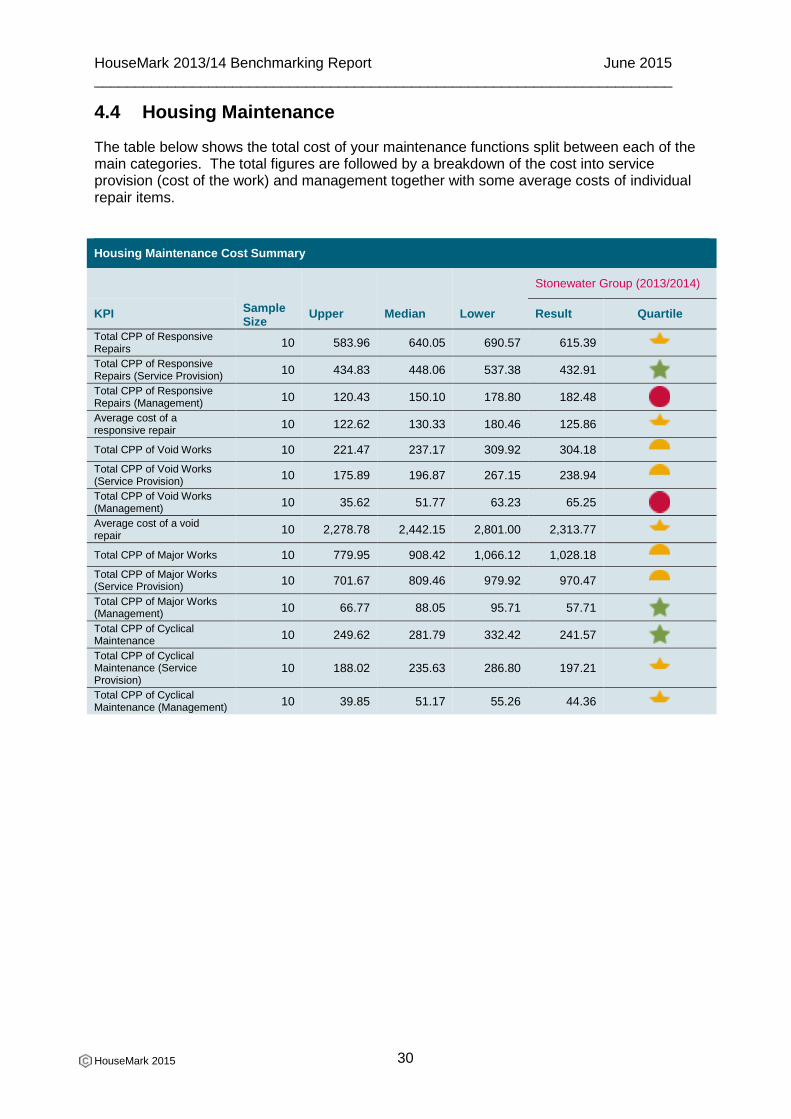
The table below shows the total cost of your maintenance functions split between each of the main categories. The total figures are followed by a breakdown of the cost into service provision (cost of the work) and management together with some average costs of individual repair items.
Housing Maintenance Cost Summary
Sample Size
Upper Median Lower
Stonewater Group (2013/2014)
KPI Result Quartile
Total CPP of Responsive Repairs
10 583.96 640.05 690.57 615.39
Total CPP of Responsive Repairs (Service Provision)
10 434.83 448.06 537.38 432.91
Total CPP of Responsive Repairs (Management)
10 120.43 150.10 178.80 182.48
Average cost of a responsive repair
10 122.62 130.33 180.46 125.86
Total CPP of Void Works 10 221.47 237.17 309.92 304.18
Total CPP of Void Works (Service Provision)
10 175.89 196.87 267.15 238.94
Total CPP of Void Works (Management)
10 35.62 51.77 63.23 65.25
Average cost of a void repair
10 2,278.78 2,442.15 2,801.00 2,313.77
Total CPP of Major Works 10 779.95 908.42 1,066.12 1,028.18
Total CPP of Major Works (Service Provision)
10 701.67 809.46 979.92 970.47
Total CPP of Major Works (Management)
10 66.77 88.05 95.71 57.71
Total CPP of Cyclical Maintenance
10 249.62 281.79 332.42 241.57
Total CPP of Cyclical Maintenance (Service Provision)
10 188.02 235.63 286.80 197.21
Total CPP of Cyclical Maintenance (Management)
10 39.85 51.17 55.26 44.36
HouseMark 2013/14 Benchmarking Report June 2015 _______________________________________________________________________
HouseMark 2015
31
4.5 Overheads
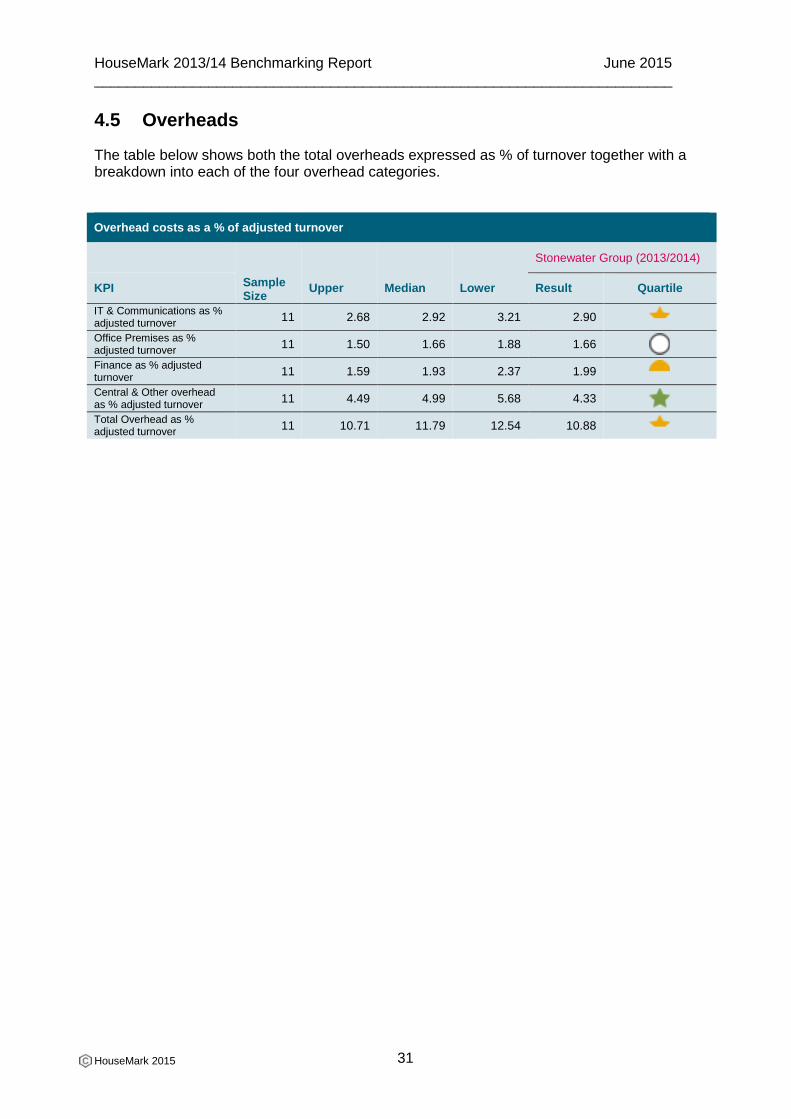
The table below shows both the total overheads expressed as % of turnover together with a breakdown into each of the four overhead categories.
Overhead costs as a % of adjusted turnover
Sample Size
Upper Median Lower
Stonewater Group (2013/2014)
KPI Result Quartile
IT & Communications as % adjusted turnover
11 2.68 2.92 3.21 2.90
Office Premises as % adjusted turnover
11 1.50 1.66 1.88 1.66
Finance as % adjusted turnover
11 1.59 1.93 2.37 1.99
Central & Other overhead as % adjusted turnover
11 4.49 4.99 5.68 4.33
Total Overhead as % adjusted turnover
11 10.71 11.79 12.54 10.88
HouseMark 2013/14 Benchmarking Report June 2015 _______________________________________________________________________
HouseMark 2015
32
4.6 Maximising rental income
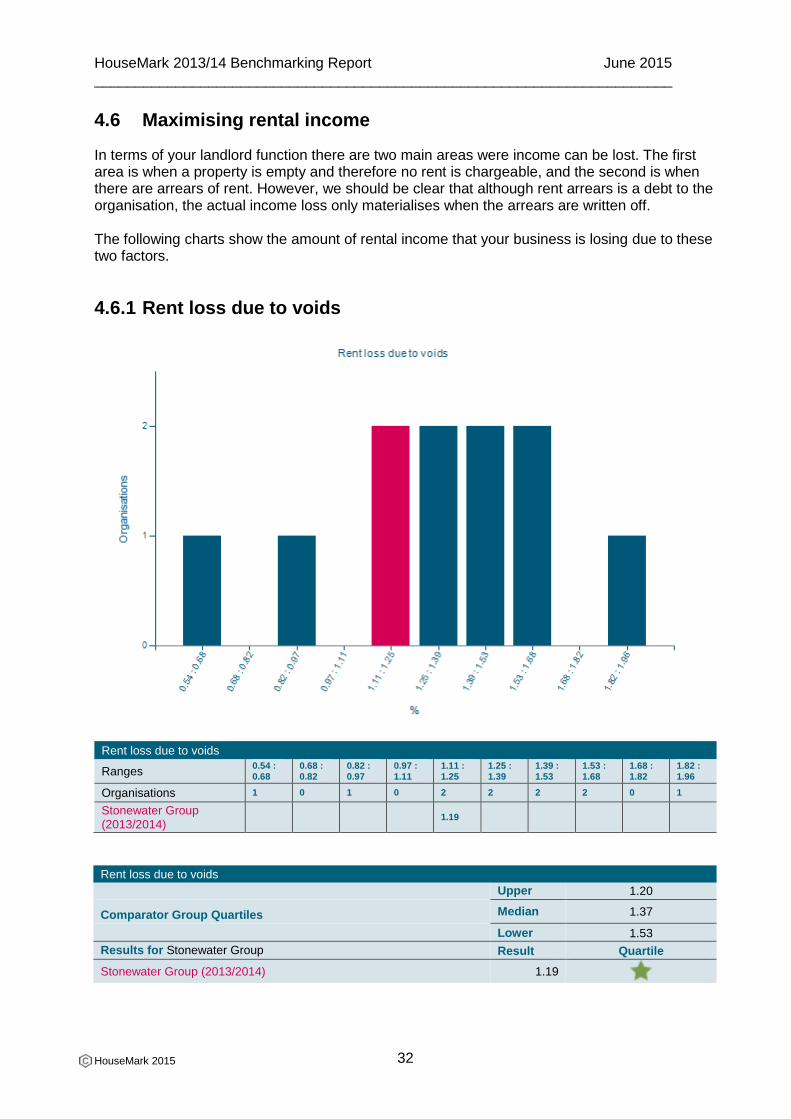
In terms of your landlord function there are two main areas were income can be lost. The first area is when a property is empty and therefore no rent is chargeable, and the second is when there are arrears of rent. However, we should be clear that although rent arrears is a debt to the organisation, the actual income loss only materialises when the arrears are written off. The following charts show the amount of rental income that your business is losing due to these two factors.
4.6.1 Rent loss due to voids
Rent loss due to voids
Ranges 0.54 : 0.68
0.68 : 0.82
0.82 : 0.97
0.97 : 1.11
1.11 : 1.25
1.25 : 1.39
1.39 : 1.53
1.53 : 1.68
1.68 : 1.82
1.82 : 1.96
Organisations 1 0 1 0 2 2 2 2 0 1
Stonewater Group (2013/2014)
1.19
Rent loss due to voids
Upper 1.20
Comparator Group Quartiles Median 1.37
Lower 1.53
Results for Stonewater Group Result Quartile
Stonewater Group (2013/2014) 1.19
HouseMark 2013/14 Benchmarking Report June 2015 _______________________________________________________________________
HouseMark 2015
33
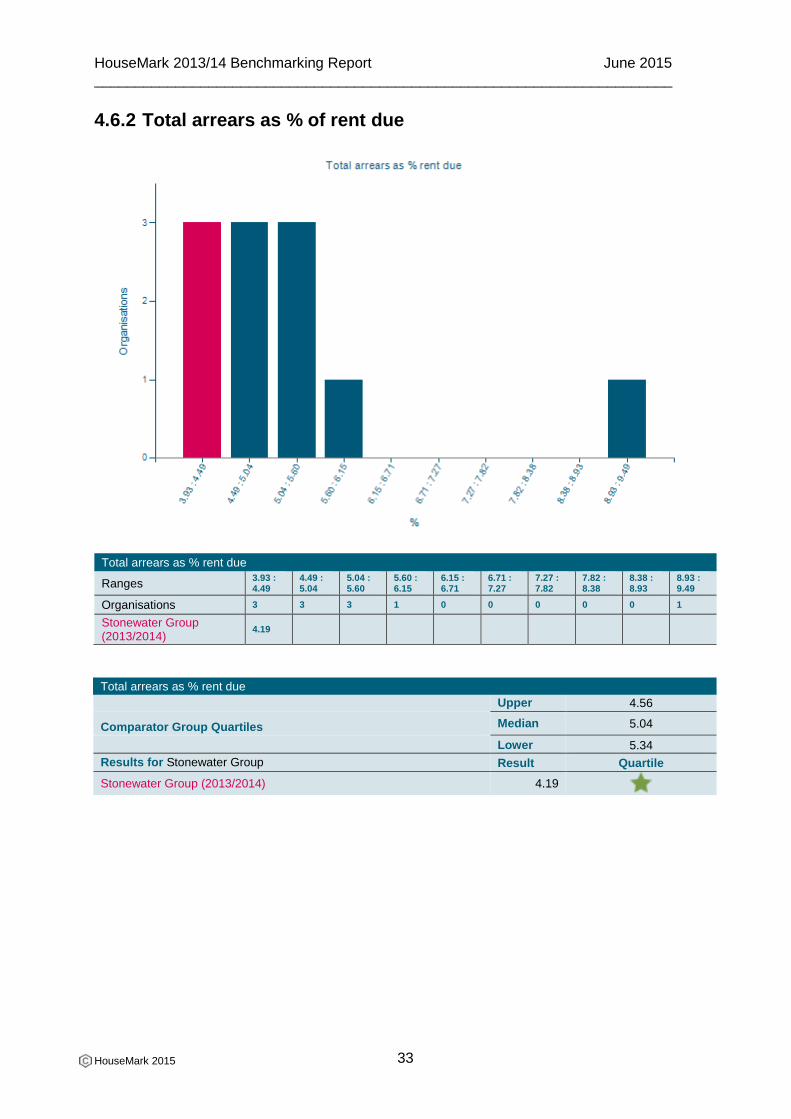
4.6.2 Total arrears as % of rent due
Total arrears as % rent due
Ranges 3.93 : 4.49
4.49 : 5.04
5.04 : 5.60
5.60 : 6.15
6.15 : 6.71
6.71 : 7.27
7.27 : 7.82
7.82 : 8.38
8.38 : 8.93
8.93 : 9.49
Organisations 3 3 3 1 0 0 0 0 0 1
Stonewater Group (2013/2014)
4.19
Total arrears as % rent due
Upper 4.56
Comparator Group Quartiles Median 5.04
Lower 5.34
Results for Stonewater Group Result Quartile
Stonewater Group (2013/2014) 4.19
HouseMark 2013/14 Benchmarking Report June 2015 _______________________________________________________________________
HouseMark 2015
34
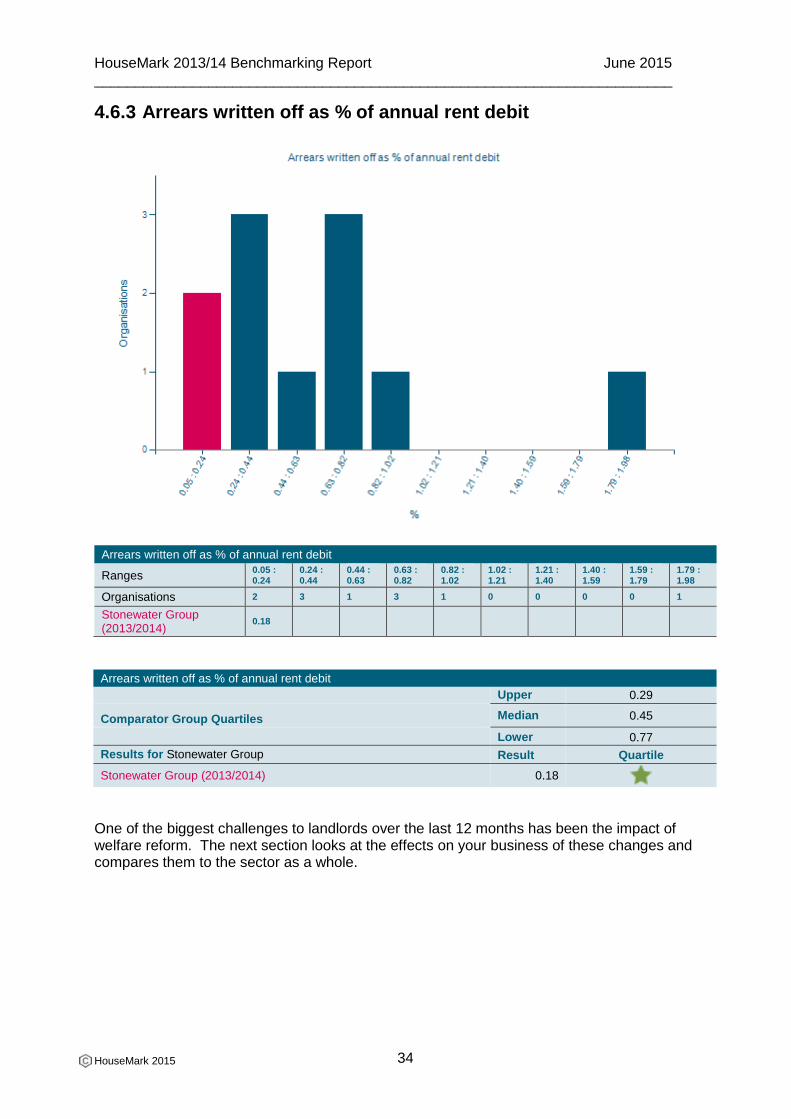
4.6.3 Arrears written off as % of annual rent debit
Arrears written off as % of annual rent debit
Ranges 0.05 : 0.24
0.24 : 0.44
0.44 : 0.63
0.63 : 0.82
0.82 : 1.02
1.02 : 1.21
1.21 : 1.40
1.40 : 1.59
1.59 : 1.79
1.79 : 1.98
Organisations 2 3 1 3 1 0 0 0 0 1
Stonewater Group (2013/2014)
0.18
Arrears written off as % of annual rent debit
Upper 0.29
Comparator Group Quartiles Median 0.45
Lower 0.77
Results for Stonewater Group Result Quartile
Stonewater Group (2013/2014) 0.18
One of the biggest challenges to landlords over the last 12 months has been the impact of welfare reform. The next section looks at the effects on your business of these changes and compares them to the sector as a whole.
HouseMark 2013/14 Benchmarking Report June 2015 _______________________________________________________________________
HouseMark 2015
35
5. People
The delivery of the ‘social housing product’ is heavily dependent upon any organisation’s greatest resource – its staff. This is not simply about productivity in the shape of efficient systems and process, it is about effectiveness - the way services are delivered, where staff motivation and engagement are crucial. The data in this section enable you to tell a story about the extent to which your staff are engaged in the delivery of your social mission and what you are doing to maintain or improve the situation. The charts below allow you to compare your staff turnover, sickness absence and staff
satisfaction with other landlords. High staff turnover can impact significantly on costs and
performance and tackling absenteeism can help produce productivity gains.
This year, we have also introduced a new indicator which is looking at the ratio between the
person in your organisations who earns the most and the average salary for all staff.
HouseMark 2013/14 Benchmarking Report June 2015 _______________________________________________________________________
HouseMark 2015
36
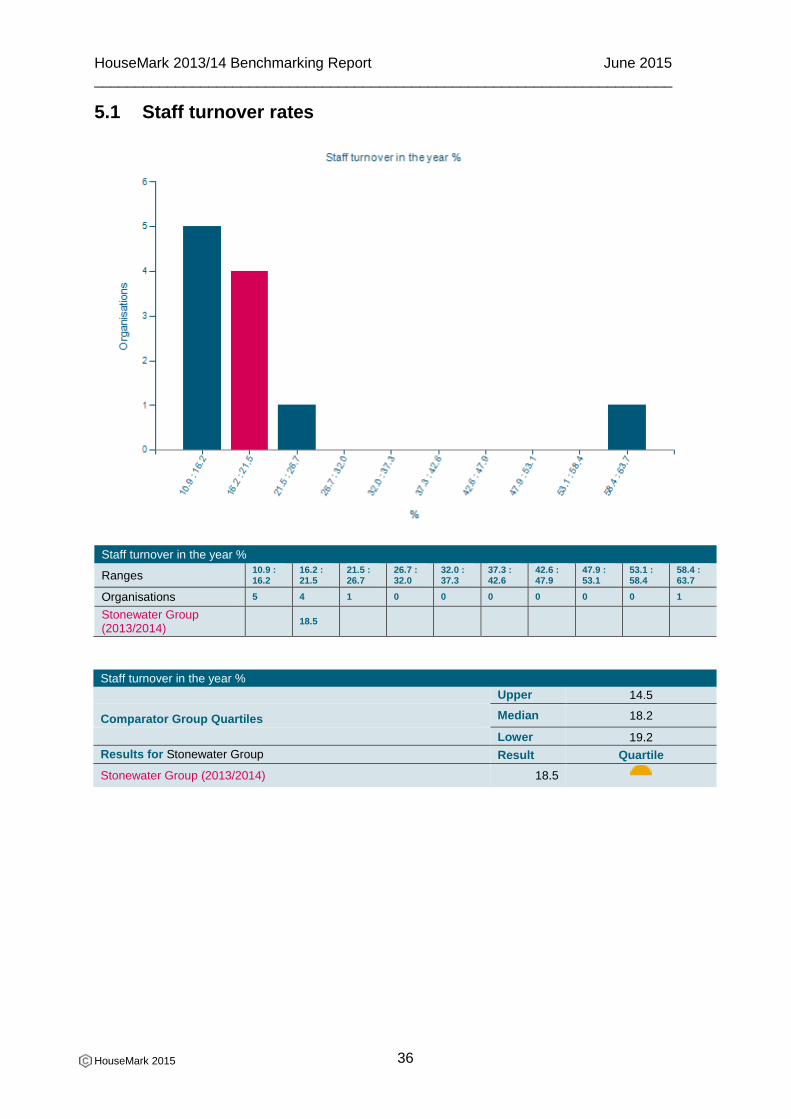
5.1 Staff turnover rates
Staff turnover in the year %
Ranges 10.9 : 16.2
16.2 : 21.5
21.5 : 26.7
26.7 : 32.0
32.0 : 37.3
37.3 : 42.6
42.6 : 47.9
47.9 : 53.1
53.1 : 58.4
58.4 : 63.7
Organisations 5 4 1 0 0 0 0 0 0 1
Stonewater Group (2013/2014)
18.5
Staff turnover in the year %
Upper 14.5
Comparator Group Quartiles Median 18.2
Lower 19.2
Results for Stonewater Group Result Quartile
Stonewater Group (2013/2014) 18.5
HouseMark 2013/14 Benchmarking Report June 2015 _______________________________________________________________________
HouseMark 2015
37
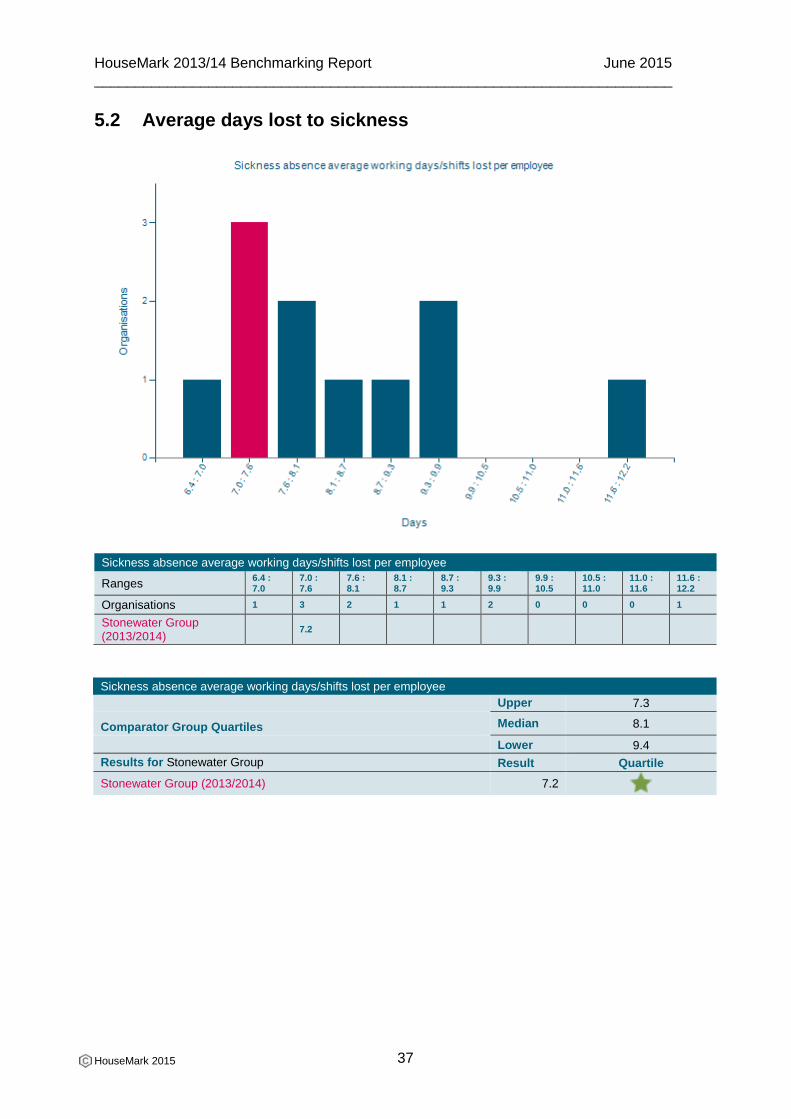
5.2 Average days lost to sickness
Sickness absence average working days/shifts lost per employee
Ranges 6.4 : 7.0
7.0 : 7.6
7.6 : 8.1
8.1 : 8.7
8.7 : 9.3
9.3 : 9.9
9.9 : 10.5
10.5 : 11.0
11.0 : 11.6
11.6 : 12.2
Organisations 1 3 2 1 1 2 0 0 0 1
Stonewater Group (2013/2014)
7.2
Sickness absence average working days/shifts lost per employee
Upper 7.3
Comparator Group Quartiles Median 8.1
Lower 9.4
Results for Stonewater Group Result Quartile
Stonewater Group (2013/2014) 7.2
HouseMark 2013/14 Benchmarking Report June 2015 _______________________________________________________________________
HouseMark 2015
38
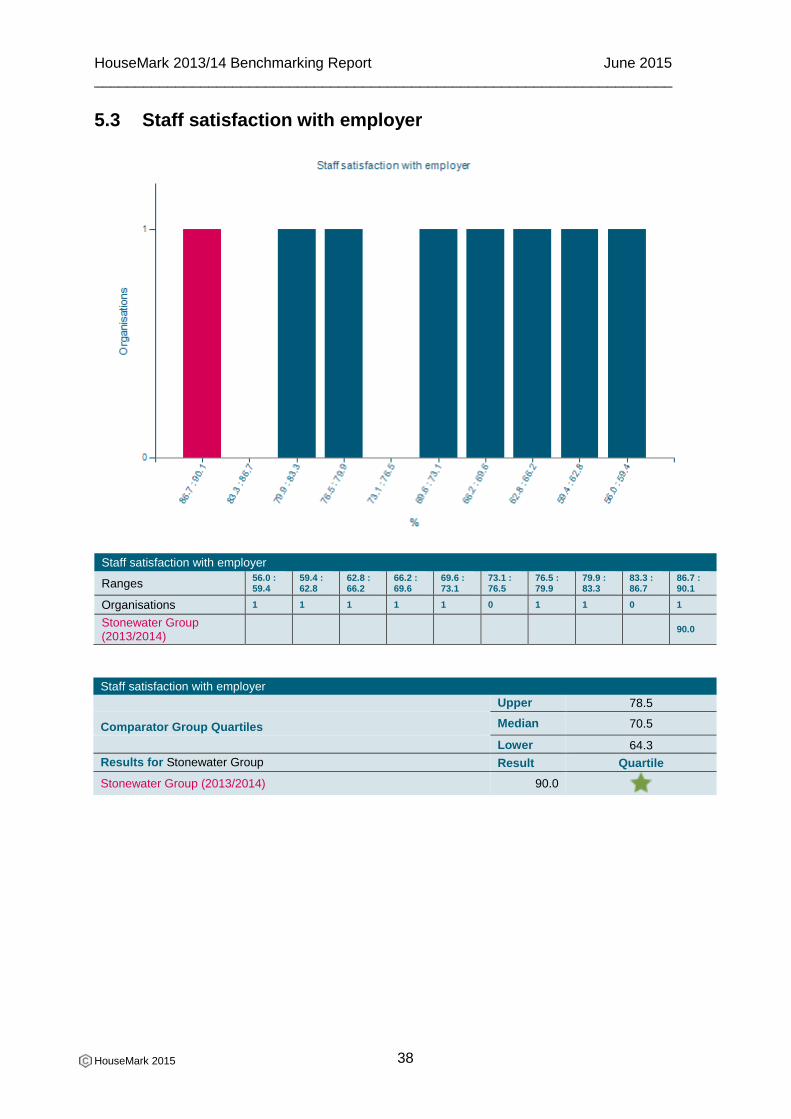
5.3 Staff satisfaction with employer
Staff satisfaction with employer
Ranges 56.0 : 59.4
59.4 : 62.8
62.8 : 66.2
66.2 : 69.6
69.6 : 73.1
73.1 : 76.5
76.5 : 79.9
79.9 : 83.3
83.3 : 86.7
86.7 : 90.1
Organisations 1 1 1 1 1 0 1 1 0 1
Stonewater Group (2013/2014)
90.0
Staff satisfaction with employer
Upper 78.5
Comparator Group Quartiles Median 70.5
Lower 64.3
Results for Stonewater Group Result Quartile
Stonewater Group (2013/2014) 90.0
HouseMark 2013/14 Benchmarking Report June 2015 _______________________________________________________________________
HouseMark 2015
39
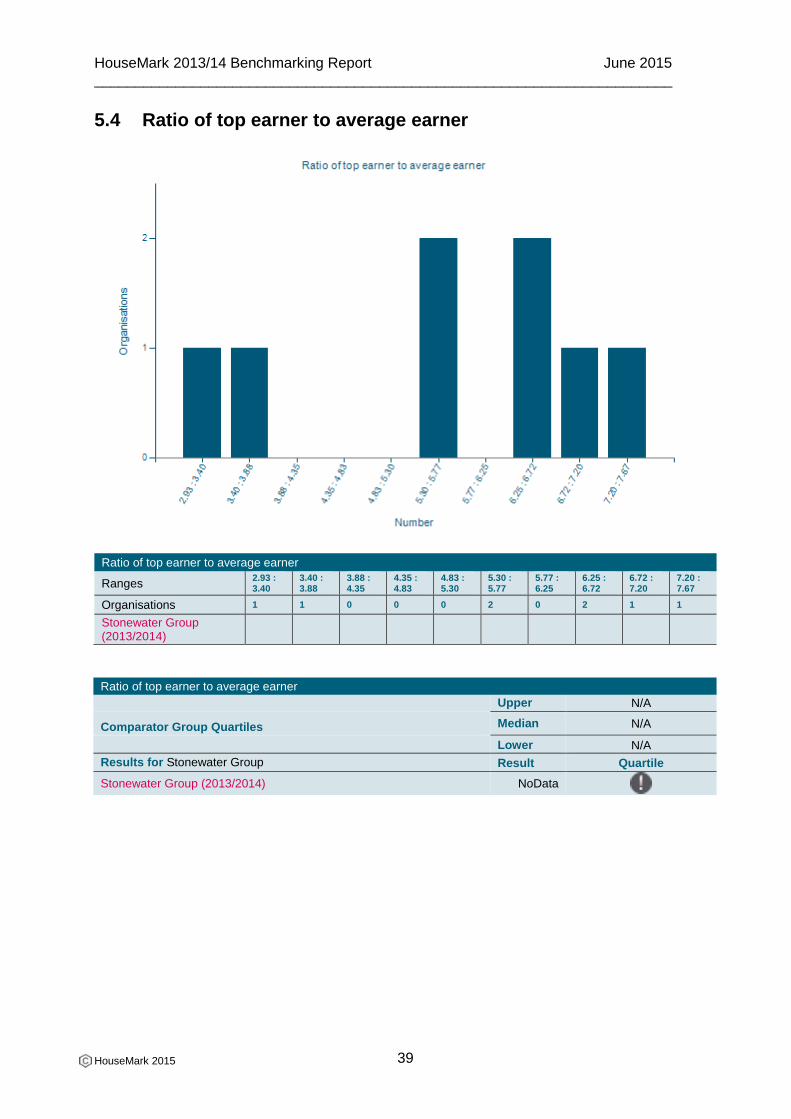
5.4 Ratio of top earner to average earner
Ratio of top earner to average earner
Ranges 2.93 : 3.40
3.40 : 3.88
3.88 : 4.35
4.35 : 4.83
4.83 : 5.30
5.30 : 5.77
5.77 : 6.25
6.25 : 6.72
6.72 : 7.20
7.20 : 7.67
Organisations 1 1 0 0 0 2 0 2 1 1
Stonewater Group (2013/2014)
Ratio of top earner to average earner
Upper N/A
Comparator Group Quartiles Median N/A
Lower N/A
Results for Stonewater Group Result Quartile
Stonewater Group (2013/2014) NoData
HouseMark 2013/14 Benchmarking Report June 2015 _______________________________________________________________________
HouseMark 2015
40
6. Process
This section enables you to tell your VFM story from the perspective of your key business processes. The effectiveness of these processes is vital to success and an indicator of VFM. The key income areas noted in the Business Health section are revisited to understand how well the associated processes are working. It also includes an important repairs process indicator – percentage of repairs completed at the first visit. This effectively doubles up as a ‘value’ measure too, as tenants want the convenience of getting the job done ‘in one go’. This section looks at how well your business processes are working and the comparison to your peer group will allow you to judge whether this is an area which needs improvement
HouseMark 2013/14 Benchmarking Report June 2015 _______________________________________________________________________
HouseMark 2015
41
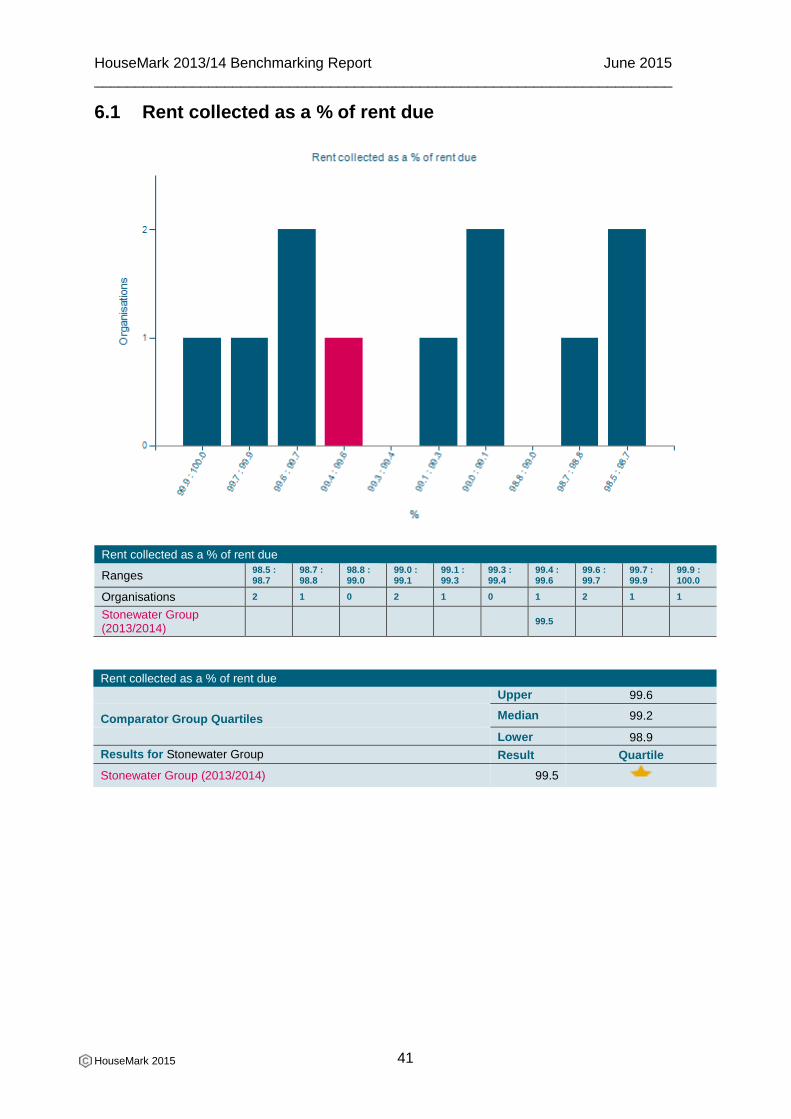
6.1 Rent collected as a % of rent due
Rent collected as a % of rent due
Ranges 98.5 : 98.7
98.7 : 98.8
98.8 : 99.0
99.0 : 99.1
99.1 : 99.3
99.3 : 99.4
99.4 : 99.6
99.6 : 99.7
99.7 : 99.9
99.9 : 100.0
Organisations 2 1 0 2 1 0 1 2 1 1
Stonewater Group (2013/2014)
99.5
Rent collected as a % of rent due
Upper 99.6
Comparator Group Quartiles Median 99.2
Lower 98.9
Results for Stonewater Group Result Quartile
Stonewater Group (2013/2014) 99.5
HouseMark 2013/14 Benchmarking Report June 2015 _______________________________________________________________________
HouseMark 2015
42
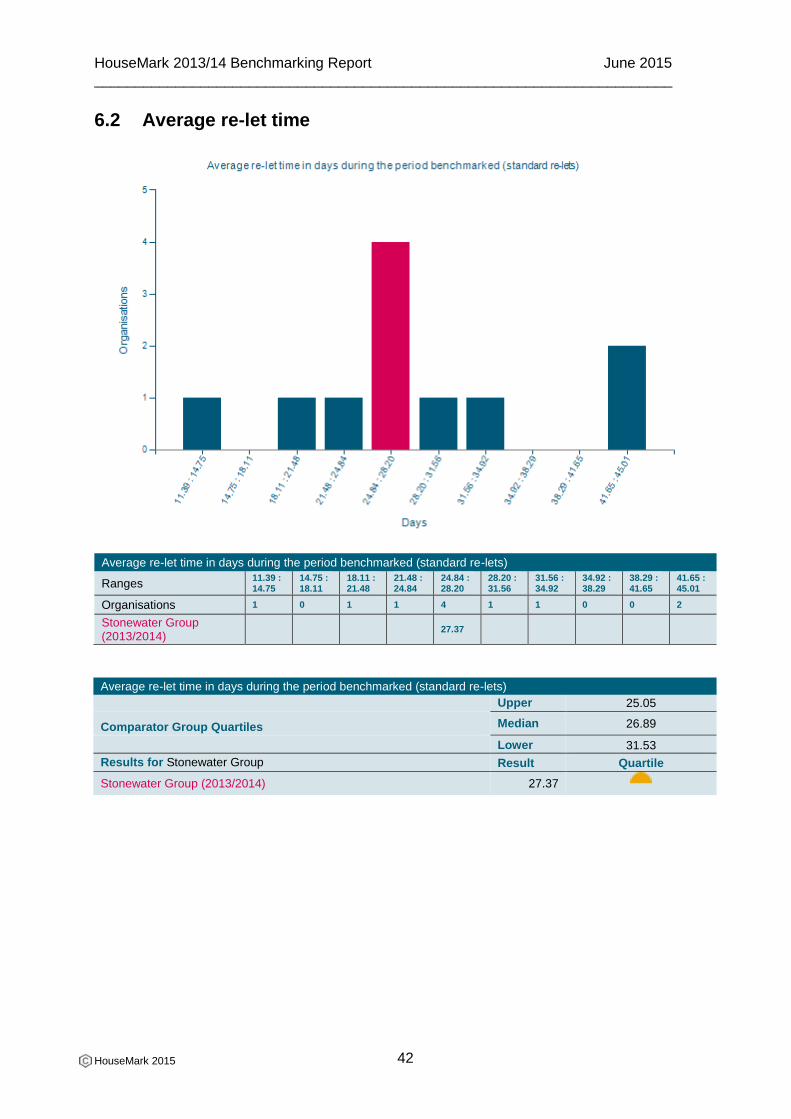
6.2 Average re-let time
Average re-let time in days during the period benchmarked (standard re-lets)
Ranges 11.39 : 14.75
14.75 : 18.11
18.11 : 21.48
21.48 : 24.84
24.84 : 28.20
28.20 : 31.56
31.56 : 34.92
34.92 : 38.29
38.29 : 41.65
41.65 : 45.01
Organisations 1 0 1 1 4 1 1 0 0 2
Stonewater Group (2013/2014)
27.37
Average re-let time in days during the period benchmarked (standard re-lets)
Upper 25.05
Comparator Group Quartiles Median 26.89
Lower 31.53
Results for Stonewater Group Result Quartile
Stonewater Group (2013/2014) 27.37
HouseMark 2013/14 Benchmarking Report June 2015 _______________________________________________________________________
HouseMark 2015
43
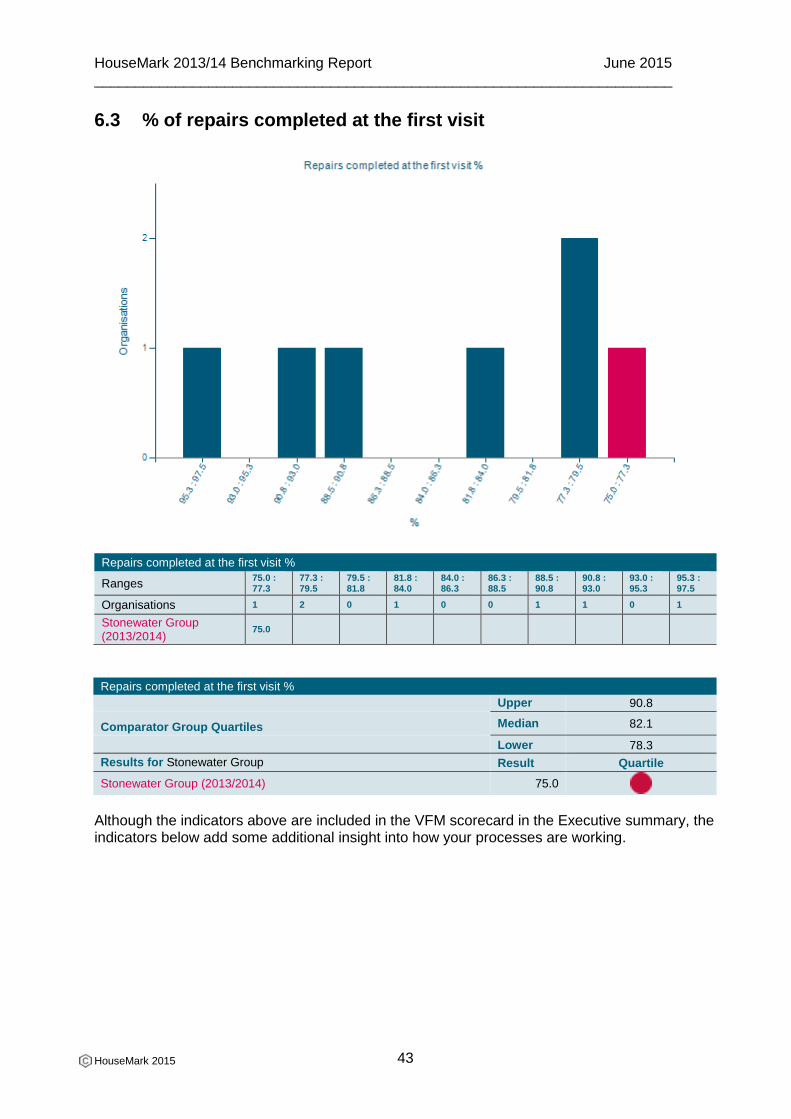
6.3 % of repairs completed at the first visit
Repairs completed at the first visit %
Ranges 75.0 : 77.3
77.3 : 79.5
79.5 : 81.8
81.8 : 84.0
84.0 : 86.3
86.3 : 88.5
88.5 : 90.8
90.8 : 93.0
93.0 : 95.3
95.3 : 97.5
Organisations 1 2 0 1 0 0 1 1 0 1
Stonewater Group (2013/2014)
75.0
Repairs completed at the first visit %
Upper 90.8
Comparator Group Quartiles Median 82.1
Lower 78.3
Results for Stonewater Group Result Quartile
Stonewater Group (2013/2014) 75.0
Although the indicators above are included in the VFM scorecard in the Executive summary, the indicators below add some additional insight into how your processes are working.
HouseMark 2013/14 Benchmarking Report June 2015 _______________________________________________________________________
HouseMark 2015
44
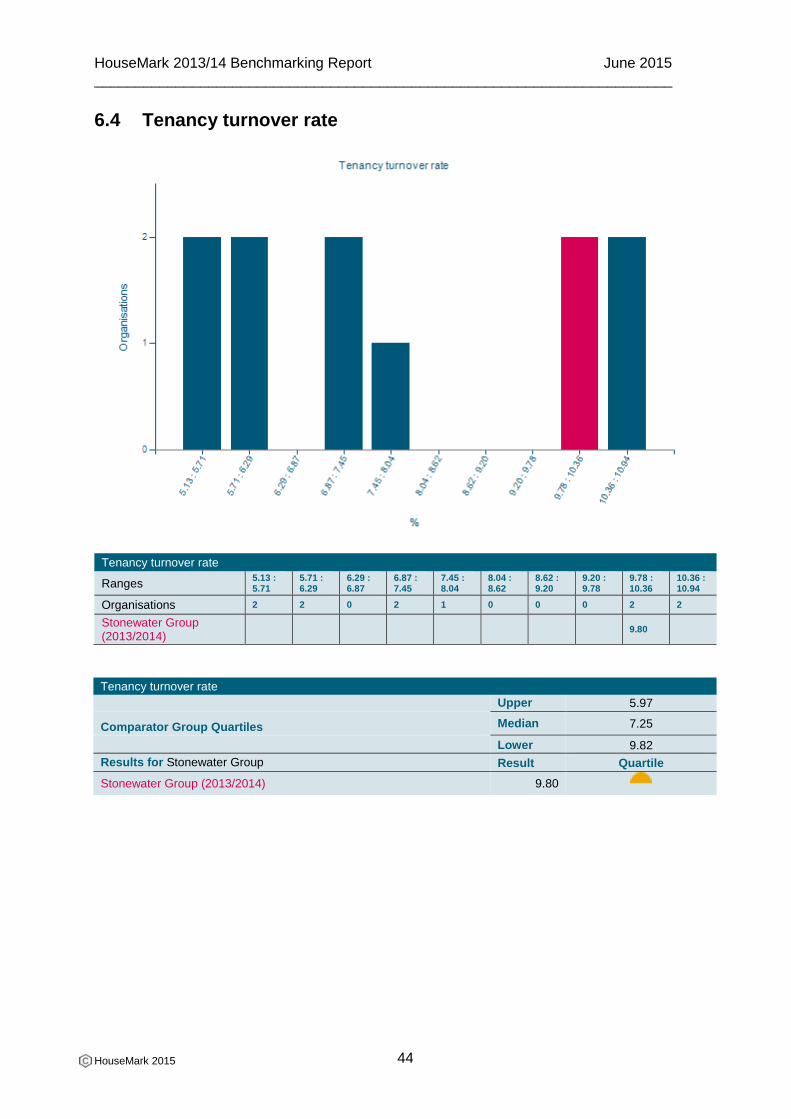
6.4 Tenancy turnover rate
Tenancy turnover rate
Ranges 5.13 : 5.71
5.71 : 6.29
6.29 : 6.87
6.87 : 7.45
7.45 : 8.04
8.04 : 8.62
8.62 : 9.20
9.20 : 9.78
9.78 : 10.36
10.36 : 10.94
Organisations 2 2 0 2 1 0 0 0 2 2
Stonewater Group (2013/2014)
9.80
Tenancy turnover rate
Upper 5.97
Comparator Group Quartiles Median 7.25
Lower 9.82
Results for Stonewater Group Result Quartile
Stonewater Group (2013/2014) 9.80
HouseMark 2013/14 Benchmarking Report June 2015 _______________________________________________________________________
HouseMark 2015
45
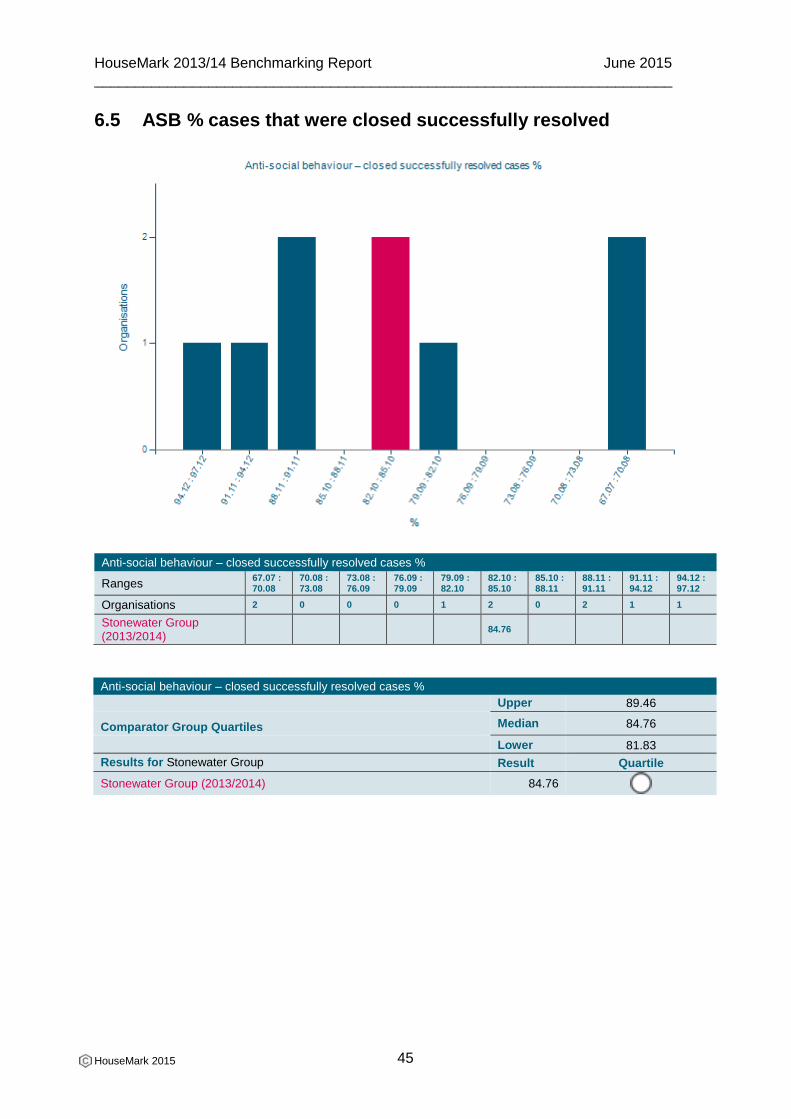
6.5 ASB % cases that were closed successfully resolved
Anti-social behaviour – closed successfully resolved cases %
Ranges 67.07 : 70.08
70.08 : 73.08
73.08 : 76.09
76.09 : 79.09
79.09 : 82.10
82.10 : 85.10
85.10 : 88.11
88.11 : 91.11
91.11 : 94.12
94.12 : 97.12
Organisations 2 0 0 0 1 2 0 2 1 1
Stonewater Group (2013/2014)
84.76
Anti-social behaviour – closed successfully resolved cases %
Upper 89.46
Comparator Group Quartiles Median 84.76
Lower 81.83
Results for Stonewater Group Result Quartile
Stonewater Group (2013/2014) 84.76
HouseMark 2013/14 Benchmarking Report June 2015 _______________________________________________________________________
HouseMark 2015
46
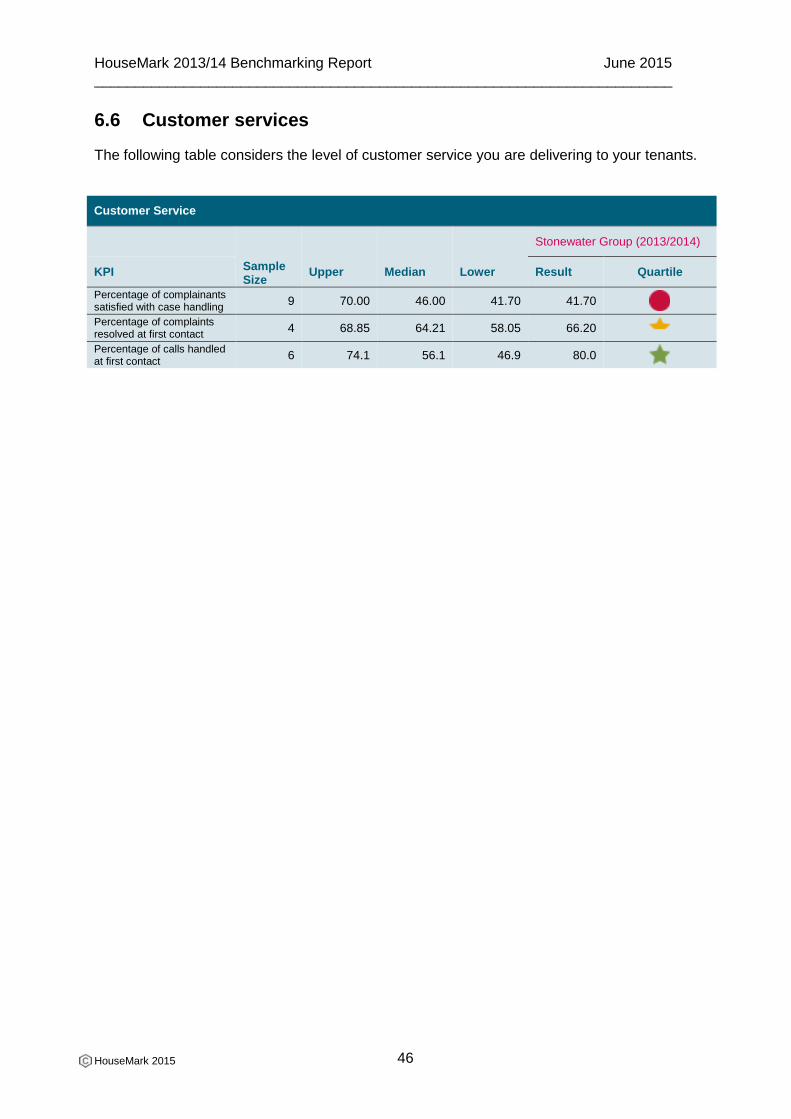
6.6 Customer services
The following table considers the level of customer service you are delivering to your tenants.
Customer Service
Sample Size
Upper Median Lower
Stonewater Group (2013/2014)
KPI Result Quartile
Percentage of complainants satisfied with case handling
9 70.00 46.00 41.70 41.70
Percentage of complaints resolved at first contact
4 68.85 64.21 58.05 66.20
Percentage of calls handled at first contact
6 74.1 56.1 46.9 80.0
HouseMark 2013/14 Benchmarking Report June 2015 _______________________________________________________________________
HouseMark 2015
47
7. Value
The measures in this section are all about the outcomes (or value) that your organisation generates for tenants. They provide the basis for you to tell your VFM story in terms of the effectiveness of your social housing services. These measures may be complemented by your own data on, for example, new homes, worklessness or financial inclusion initiatives and care and support, to represent the full extent of the social value you produce. It is important to judge how much value the association is providing and this can be measured by outcomes as judged by tenants. For example, if your organisation is a developing organisation, it would be important to find out whether the newly built properties that have been provided are satisfying the needs of the residents who are subsequently occupying them. Associations also need to be clear whether their tenants are satisfied with the services they provide, and therefore a regular measure of satisfaction through a STAR satisfaction survey can help landlords measure how satisfied their tenants really are across a number of key services. STAR is a framework which allows a range of survey types and methods (details can be found in STAR Features). HouseMark will be reviewing the framework later this year and will consult with members who are interested. To express your interest please email
[email protected] providing your contact details.
HouseMark 2013/14 Benchmarking Report June 2015 _______________________________________________________________________
HouseMark 2015
48
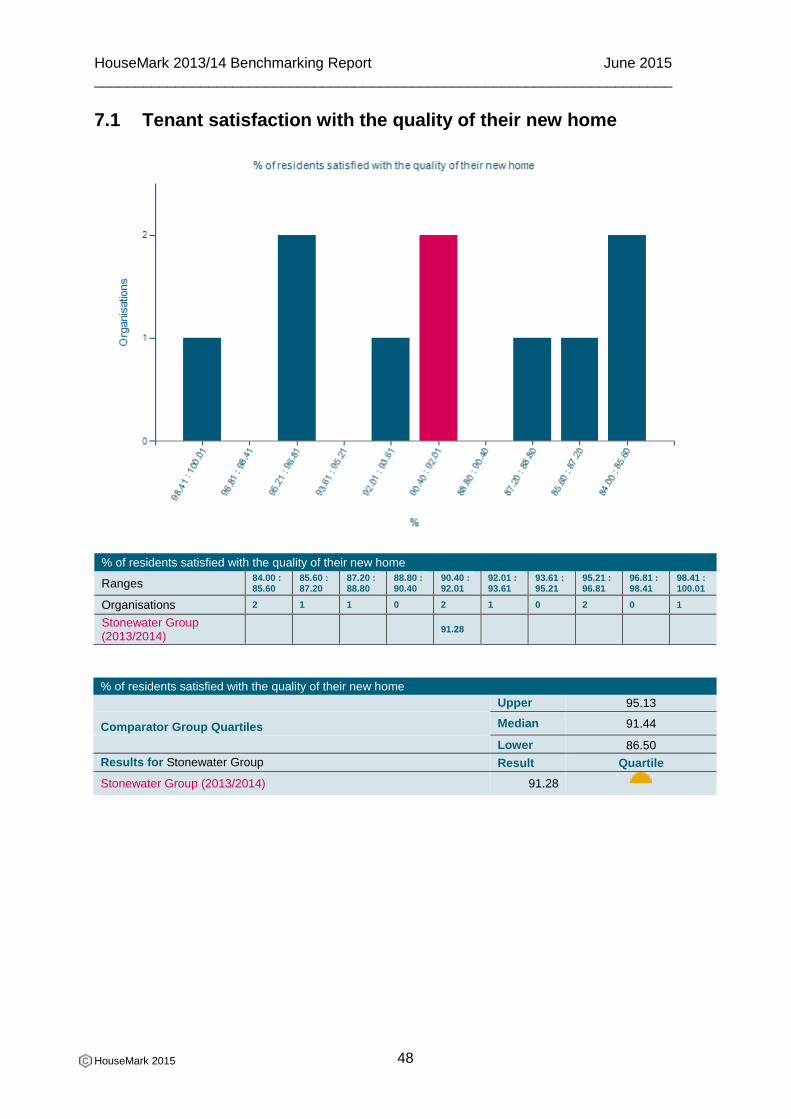
7.1 Tenant satisfaction with the quality of their new home
% of residents satisfied with the quality of their new home
Ranges 84.00 : 85.60
85.60 : 87.20
87.20 : 88.80
88.80 : 90.40
90.40 : 92.01
92.01 : 93.61
93.61 : 95.21
95.21 : 96.81
96.81 : 98.41
98.41 : 100.01
Organisations 2 1 1 0 2 1 0 2 0 1
Stonewater Group (2013/2014)
91.28
% of residents satisfied with the quality of their new home
Upper 95.13
Comparator Group Quartiles Median 91.44
Lower 86.50
Results for Stonewater Group Result Quartile
Stonewater Group (2013/2014) 91.28
HouseMark 2013/14 Benchmarking Report June 2015 _______________________________________________________________________
HouseMark 2015
49
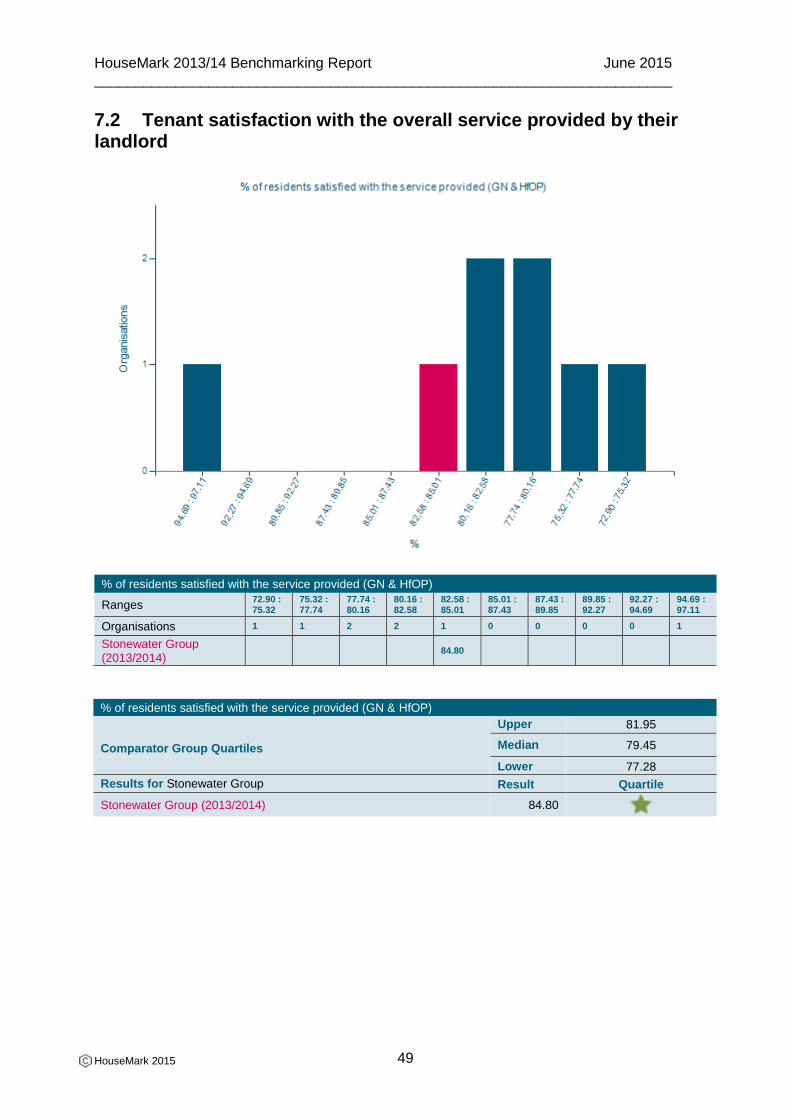
7.2 Tenant satisfaction with the overall service provided by their landlord
% of residents satisfied with the service provided (GN & HfOP)
Ranges 72.90 : 75.32
75.32 : 77.74
77.74 : 80.16
80.16 : 82.58
82.58 : 85.01
85.01 : 87.43
87.43 : 89.85
89.85 : 92.27
92.27 : 94.69
94.69 : 97.11
Organisations 1 1 2 2 1 0 0 0 0 1
Stonewater Group (2013/2014)
84.80
% of residents satisfied with the service provided (GN & HfOP)
Upper 81.95
Comparator Group Quartiles Median 79.45
Lower 77.28
Results for Stonewater Group Result Quartile
Stonewater Group (2013/2014) 84.80
HouseMark 2013/14 Benchmarking Report June 2015 _______________________________________________________________________
HouseMark 2015
50
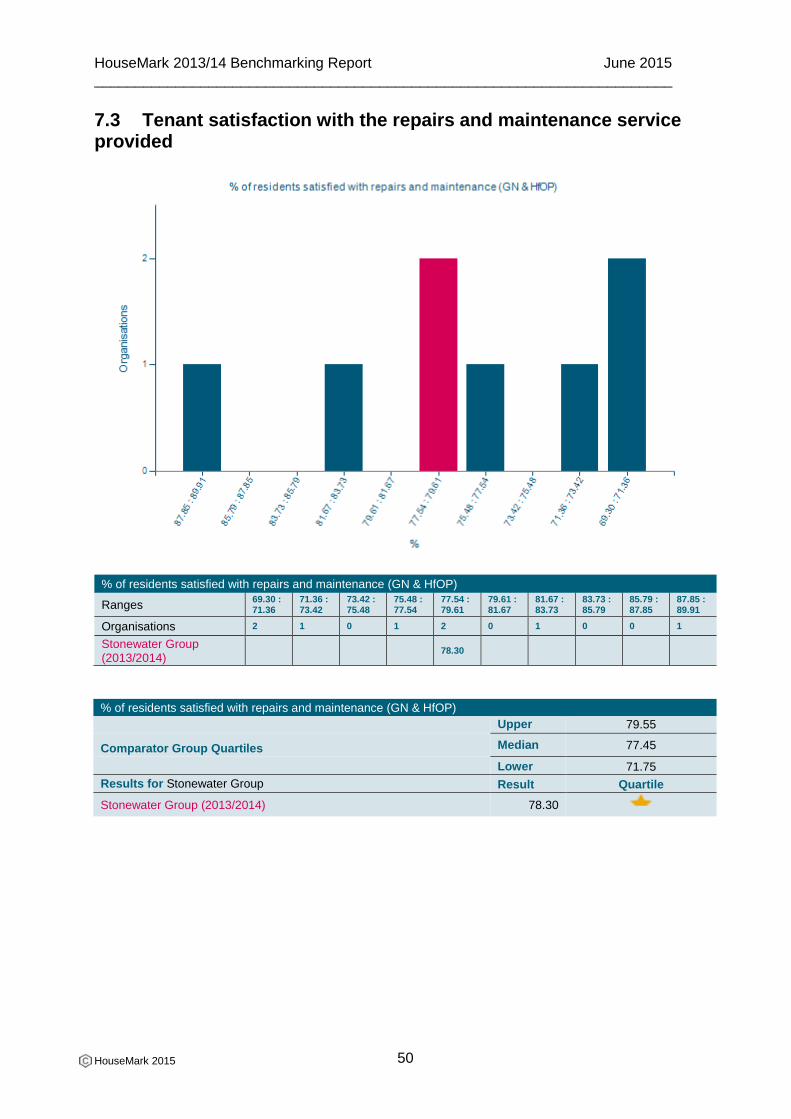
7.3 Tenant satisfaction with the repairs and maintenance service provided
% of residents satisfied with repairs and maintenance (GN & HfOP)
Ranges 69.30 : 71.36
71.36 : 73.42
73.42 : 75.48
75.48 : 77.54
77.54 : 79.61
79.61 : 81.67
81.67 : 83.73
83.73 : 85.79
85.79 : 87.85
87.85 : 89.91
Organisations 2 1 0 1 2 0 1 0 0 1
Stonewater Group (2013/2014)
78.30
% of residents satisfied with repairs and maintenance (GN & HfOP)
Upper 79.55
Comparator Group Quartiles Median 77.45
Lower 71.75
Results for Stonewater Group Result Quartile
Stonewater Group (2013/2014) 78.30
HouseMark 2013/14 Benchmarking Report June 2015 _______________________________________________________________________
HouseMark 2015
51
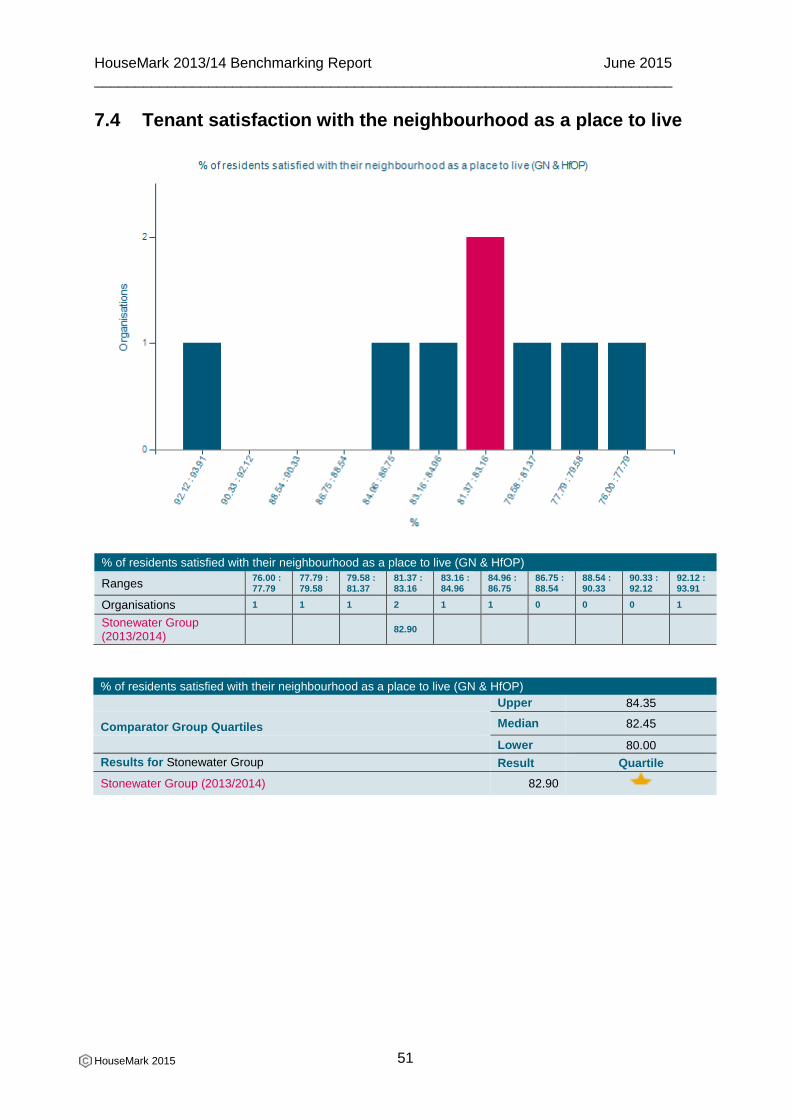
7.4 Tenant satisfaction with the neighbourhood as a place to live
% of residents satisfied with their neighbourhood as a place to live (GN & HfOP)
Ranges 76.00 : 77.79
77.79 : 79.58
79.58 : 81.37
81.37 : 83.16
83.16 : 84.96
84.96 : 86.75
86.75 : 88.54
88.54 : 90.33
90.33 : 92.12
92.12 : 93.91
Organisations 1 1 1 2 1 1 0 0 0 1
Stonewater Group (2013/2014)
82.90
% of residents satisfied with their neighbourhood as a place to live (GN & HfOP)
Upper 84.35
Comparator Group Quartiles Median 82.45
Lower 80.00
Results for Stonewater Group Result Quartile
Stonewater Group (2013/2014) 82.90
HouseMark 2013/14 Benchmarking Report June 2015 _______________________________________________________________________
HouseMark 2015
52
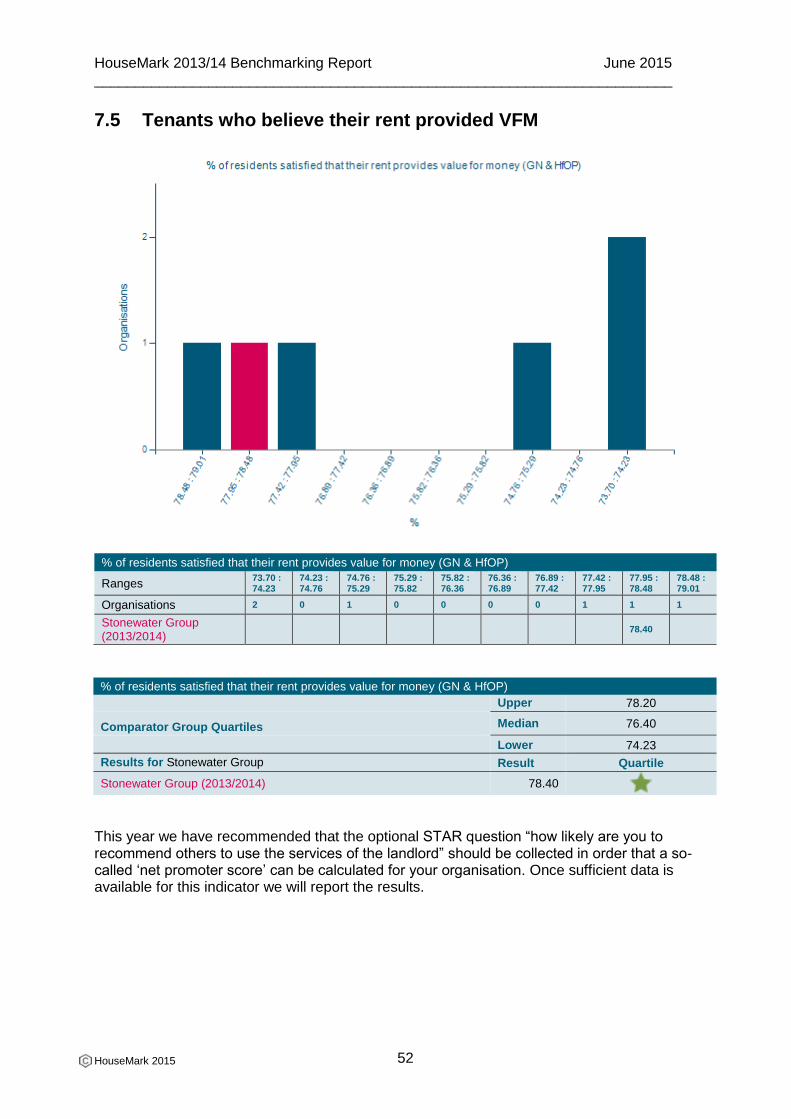
7.5 Tenants who believe their rent provided VFM
% of residents satisfied that their rent provides value for money (GN & HfOP)
Ranges 73.70 : 74.23
74.23 : 74.76
74.76 : 75.29
75.29 : 75.82
75.82 : 76.36
76.36 : 76.89
76.89 : 77.42
77.42 : 77.95
77.95 : 78.48
78.48 : 79.01
Organisations 2 0 1 0 0 0 0 1 1 1
Stonewater Group (2013/2014)
78.40
% of residents satisfied that their rent provides value for money (GN & HfOP)
Upper 78.20
Comparator Group Quartiles Median 76.40
Lower 74.23
Results for Stonewater Group Result Quartile
Stonewater Group (2013/2014) 78.40
This year we have recommended that the optional STAR question “how likely are you to recommend others to use the services of the landlord” should be collected in order that a so-called ‘net promoter score’ can be calculated for your organisation. Once sufficient data is available for this indicator we will report the results.
HouseMark 2013/14 Benchmarking Report June 2015 _______________________________________________________________________
HouseMark 2015
53
7.6 Social Value
There is fast-growing interest in the sector in terms of measuring social value. The reasons for this are:
Organisations are seeking to ensure that they are getting a return on their investment for what they are doing in this area
The HCA VFM self-assessment methodology invites English housing associations to include social value in their self-assessment
The sector as a whole seeks to demonstrate the added value that it is delivering in return for public investment
There are a number of different techniques being used to measure social value, notably SROI and the HACT ‘wellbeing index’ together with ‘home grown’ approaches. No single technique has yet established market dominance. It is not our current intention to add another methodology to the list. Instead, we want to include social value in our model. As a first step, we have this year included benchmarking of the cost of social value activity. Over the coming year we will consider whether or not social value outcomes can be benchmarked – which may be difficult due to the range of approaches being adopted – or whether outcomes are best included as non-comparative but still very important contextual data. For anyone wanting to know more about the issues we suggest you read the recent Midland Heart/HouseMark publication Journey to Impact – which is available from our website. http://www.housemark.co.uk/hmresour.nsf/lookup/JourneyToImpact.pdf/$File/JourneyToImpact.pdf
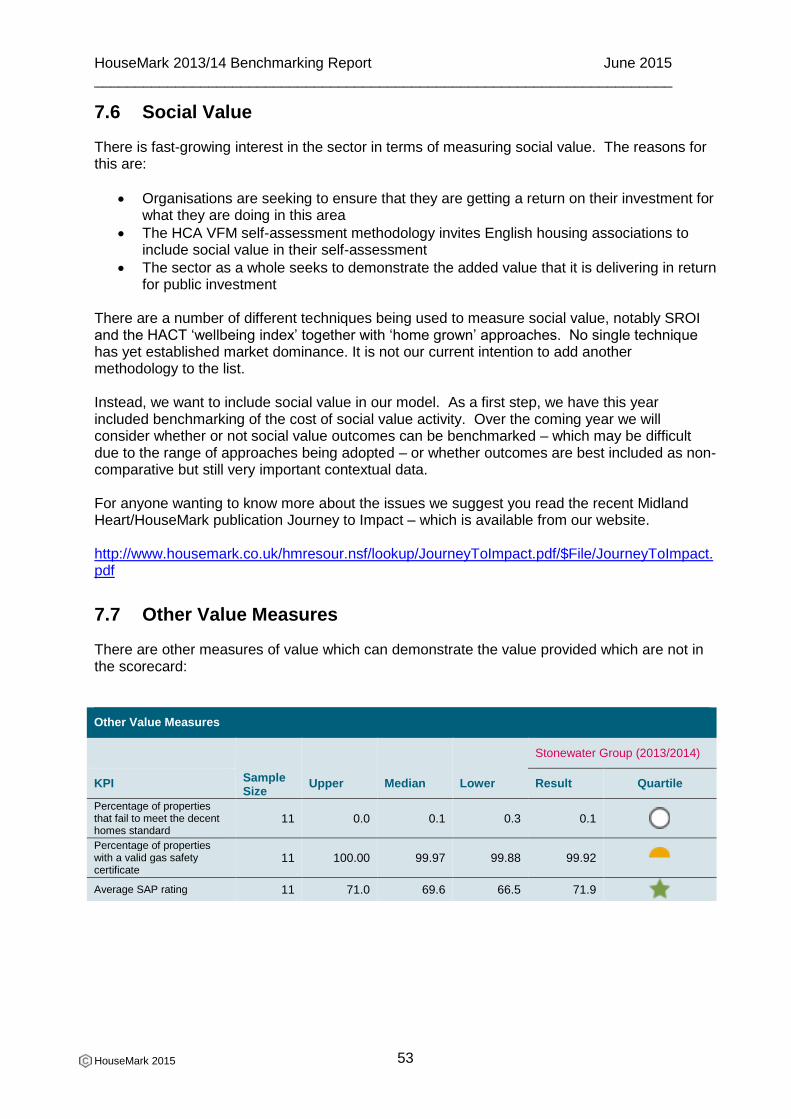
7.7 Other Value Measures
There are other measures of value which can demonstrate the value provided which are not in the scorecard:
Other Value Measures
Sample Size
Upper Median Lower
Stonewater Group (2013/2014)
KPI Result Quartile
Percentage of properties that fail to meet the decent homes standard
11 0.0 0.1 0.3 0.1
Percentage of properties with a valid gas safety certificate
11 100.00 99.97 99.88 99.92
Average SAP rating 11 71.0 69.6 66.5 71.9
HouseMark 2013/14 Benchmarking Report June 2015 _______________________________________________________________________
HouseMark 2015
54
Appendices
Appendix 1: Changes to HouseMark Benchmarking
As a result of customer research undertaken in 2013, we became aware that some members wanted changes to be made to the benchmarking service.
There were a number of reasons for this, including increasing diversification in the sector, the need to move on from ‘old regulatory PIs’ to more business-focused indicators and a strong, common desire for the benchmarking process to be simpler, quicker and better value. So, beginning last autumn and extending into the early New Year, we embarked on an extensive benchmarking-specific consultation process. By means of focus groups, on-site interviews and an online questionnaire, we offered every member the opportunity to contribute and ultimately we received feedback from around 150 organisations. What lessons did we take from the research feedback?
Members want benchmarking that is fit-for-purpose and reflective of their organisational needs
Views were fairly evenly split between those wanting to continue benchmarking as before, those wanting radical change and others who would welcome only minor change
We need to reduce the number of performance indicators that we collect and make them more business-focused
We need to improve the analysis of data in our benchmarking reports and provide members with more support in selecting peer groups.
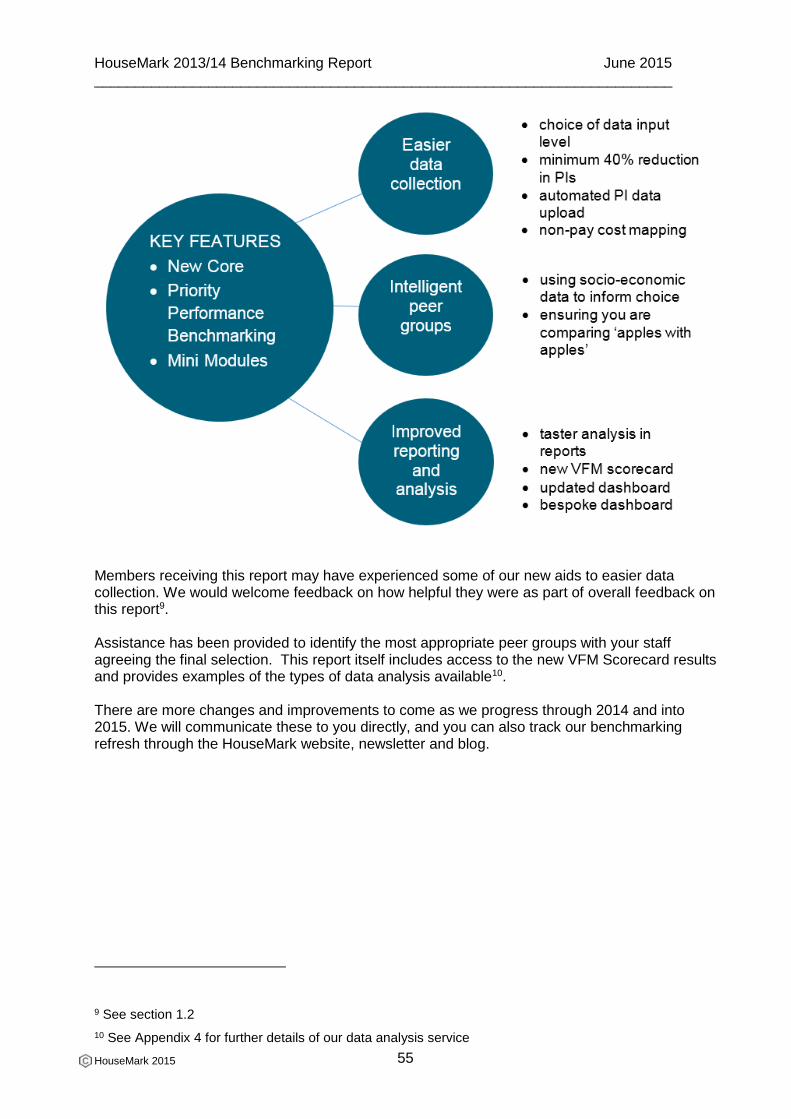
We have therefore embarked on a two-year improvement and refresh programme for our benchmarking services. This year, we’ve placed choice and flexibility at the very core of our 2014 data offer. If you still want to do benchmarking as you’ve always done it, you can. If, however, you want to do it differently, there are now more opportunities to do so. It’s benchmarking the way you want it. All new and improved features of our new benchmarking system revolve around data collection that is faster and easier, with greater flexibility and better outputs and new visualisation tools for reporting; all of which will deliver greater value to you. The key features of the new system are shown in the diagram below and represent the main issues members wanted addressed:
HouseMark 2013/14 Benchmarking Report June 2015 _______________________________________________________________________
HouseMark 2015
55
Members receiving this report may have experienced some of our new aids to easier data collection. We would welcome feedback on how helpful they were as part of overall feedback on this report9. Assistance has been provided to identify the most appropriate peer groups with your staff agreeing the final selection. This report itself includes access to the new VFM Scorecard results and provides examples of the types of data analysis available10. There are more changes and improvements to come as we progress through 2014 and into 2015. We will communicate these to you directly, and you can also track our benchmarking refresh through the HouseMark website, newsletter and blog.
9 See section 1.2
10 See Appendix 4 for further details of our data analysis service
HouseMark 2013/14 Benchmarking Report June 2015 _______________________________________________________________________
HouseMark 2015
56
Appendix 2: Disclosure of information
The information and data contained in this report are subject to the following clauses in HouseMark members' subscription agreements. These refer to future and further use of the information. Where any compilations of Benchmarking Data or statistics or Good Practice Examples produced from data (other than Data submitted by the Subscriber) stored on the database forming part of the System are made for internal or external reports by or on behalf of the Subscriber, the Subscriber shall ensure that credit is given with reasonable prominence in respect of each part of the data used every time it is used (whether orally or in writing) and such credit shall include the words ‘Source: HouseMark’. The Subscriber shall use best endeavours to ensure that any and all uses of the System shall be made with reasonable care and skill and in a way which is not misleading. The Subscriber may not sell, lease, license, transfer, give or otherwise dispose of the whole or any part of the System or any Copy. The provisions of this clause shall survive termination or expiry of this Agreement, however caused. The Subscriber shall not make any Copy or reproduce in any way the whole or a part of the System except that the Subscriber may make such copies (paper based or electronic) of the data and information displayed on the System as are reasonably necessary to use the System in the manner specifically and expressly permitted by this Agreement. The Subscriber agrees not to use the System (or any part of it) except in accordance with the express terms and conditions of this Agreement.
HouseMark 2013/14 Benchmarking Report June 2015 _______________________________________________________________________
HouseMark 2015
57
Appendix 3: Benchmarking Methodology, Validation and Quality Assurance
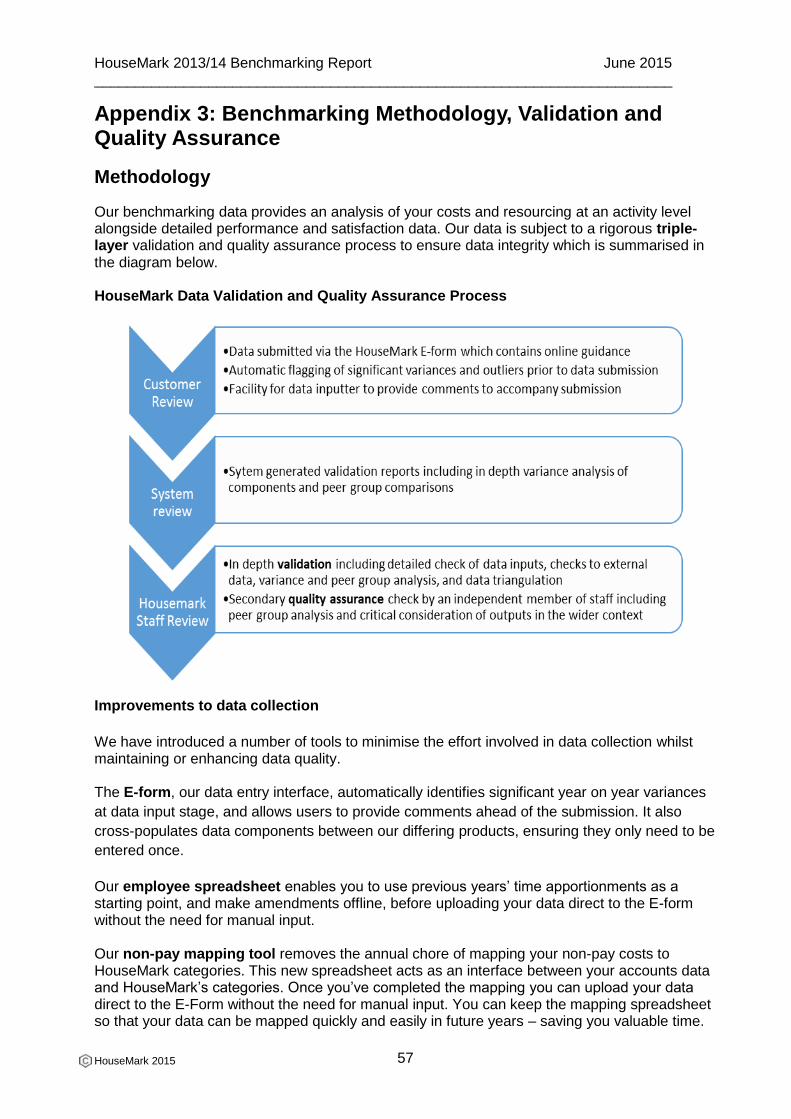
Methodology
Our benchmarking data provides an analysis of your costs and resourcing at an activity level alongside detailed performance and satisfaction data. Our data is subject to a rigorous triple-layer validation and quality assurance process to ensure data integrity which is summarised in the diagram below. HouseMark Data Validation and Quality Assurance Process
Improvements to data collection
We have introduced a number of tools to minimise the effort involved in data collection whilst maintaining or enhancing data quality. The E-form, our data entry interface, automatically identifies significant year on year variances
at data input stage, and allows users to provide comments ahead of the submission. It also
cross-populates data components between our differing products, ensuring they only need to be
entered once.
Our employee spreadsheet enables you to use previous years’ time apportionments as a starting point, and make amendments offline, before uploading your data direct to the E-form without the need for manual input. Our non-pay mapping tool removes the annual chore of mapping your non-pay costs to HouseMark categories. This new spreadsheet acts as an interface between your accounts data and HouseMark’s categories. Once you’ve completed the mapping you can upload your data direct to the E-Form without the need for manual input. You can keep the mapping spreadsheet so that your data can be mapped quickly and easily in future years – saving you valuable time.

HouseMark 2013/14 Benchmarking Report June 2015 _______________________________________________________________________
HouseMark 2015
58
Our dedicated data services team was introduced in 2014 to assist you with entering your data and understanding your results. You can contact the Benchmarking helpline on 024 7647 2707 or email [email protected]

HouseMark 2013/14 Benchmarking Report June 2015 _______________________________________________________________________
HouseMark 2015
59
Appendix 4: Other services available from HouseMark
Knowledge
Knowledge transfer
Business intelligence is more than just data. It's about connecting you with the right knowledge. Our new, commercial knowledge offer will support members in making your organisation more robust and agile in the constant climate of change, diversification and competition. In moving on from 'templates of good practice', our new knowledge transfer offer incorporates a wider, more business-focused set of services that will sit alongside data as one of the key pillars of our new vision.
Building on and enhancing existing services such as our sector knowledge, sector forum and research support, we will be introducing timely, tailored alerts and services covering sector news as well as commercial and business news which impacts on your organisation and the wider social housing environment.
We are working to make our website more accessible and dynamic, giving you access to member “community sites” where you can share knowledge and learning through know-how, discussion forums, thought leadership initiatives and more…..
Our new offer also includes a refreshed 'in sector' best practice element, widened to include new ways of learning from inside the sector through 'best in class' study visits, expanded specialist clubs and refocused regional performance improvement clubs.
Additionally, we have unique experiential learning opportunities which capture learning from the commercial and third sectors – our popular Business Connect programme empowers you through engagement and interaction with world-class private sector businesses and commercially successful in-sector initiatives.
If you would like to know more, please contact our Head of Knowledge Management. Wendy Small at [email protected]
HouseMark 2013/14 Benchmarking Report June 2015 _______________________________________________________________________
HouseMark 2015
60
Consultancy
Consultancy support HouseMark provides additional high quality consultancy support to help landlords achieve business insight, performance improvement and efficiencies through a range of performance improvement and VFM services. These include fixed price products, such as accreditations as well as bespoke support, helping organisations get the most out of HouseMark’s data services. There is more information on our website (www.housemark.co.uk), but the following provides a summary of what we offer: Value for money Achieving VFM and maximising the return on all your assets is central to the assurance agenda, a regulatory requirement for housing associations and good business sense for all organisations. Our VFM experts will support you in developing your approach by ensuring you ‘do the right things’ and ‘do things right.’ Data analysis In addition to helping you with benchmarking data collection and using external data alongside your own business intelligence and benchmarking data, we can interpret and analyse the information to assist you (for example) to identify cost and performance drivers, recommending and, where necessary, co-delivering organisational change. Where a more ‘drilled down approach’ is required, our VFM Repairs Toolkit provides greater detail to identify costs and performance drivers in this key spend area. HouseMark is developing a range of data consultancy services that will offer members tailored analysis, and tools enabling you to capitalise on the value of the broad variety of data that is available, aiming to help improve your business decision-making processes. Accreditation Our three accreditation services for complaints, anti-social behaviour and repairs provide robust external validation of services. We involve tenants in the assessment process to ensure that there is a customer focus. These accreditation schemes are independently assessed, valid for three years and stimulate continuous improvement, as well as providing you with an evidence base of reaching the standards set for your stakeholders. In partnership with TPAS and CIH, we offer Quality Assured Scrutiny Accreditation, making sure organisations are adopting best practice in the design and implementation of tenant scrutiny. Accreditations are a useful tool to evidence VFM and provide independent assurance around your service delivery. Business Assurance As businesses become more diverse and commercially focused, we can support your executive management team and board to meet the expectations of the HCA and to be more effective businesses.
HouseMark 2013/14 Benchmarking Report June 2015 _______________________________________________________________________
HouseMark 2015
61
We have recently launched Business and Service Assurance, delivered in partnership with Campbell Tickell, a service which offers independent assurance that the organisation has effective systems and strategic management. It also supports improvement work in risk management, regulatory compliance and strategic reporting. Performance management and improvement To ensure you are ‘doings things right’, HouseMark can provide you with support through our range of performance measurement, validation and data assurance services. We offer both bespoke and fixed price products, such as our Performance Management MOT. The MOT offers you a chance to subject organisation-wide or service-based performance management frameworks to critical challenge against assessment criteria using a robust methodology, resulting in clear recommendations for improvement. For more information, or to arrange a more detailed discussion with one of our consultants, please contact Lynn Dexter on (024) 7646 0500 or email [email protected]
Further information For further information visit our website
www.housemark.co.uk or call 024 7646 0500.
HouseMark, 4 Riley Court, Millburn Hill Road,
University of Warwick Science Park, Coventry CV4 7HP.
About HouseMark HouseMark is the leading provider of integrated data and analysis, insightful
knowledge transfer, high quality consultancy support and via Procurement for
Housing, cost effective procurement services to the social housing sector.
Related Documents