CGIAR Research Program on Climate Change, Agriculture and Food Security (CCAFS) Summary of Baseline Household Survey Results: Karnal, Haryana State, India May 2013 R K P Singh

Welcome message from author
This document is posted to help you gain knowledge. Please leave a comment to let me know what you think about it! Share it to your friends and learn new things together.
Transcript

CGIAR Research Program on
Climate Change, Agriculture and Food Security (CCAFS)
Summary of Baseline Household Survey Results:
Karnal, Haryana State, India
May 2013
R K P Singh
1
Correct citation:
Singh RKP. 2013. Summary of Baseline Household Survey Results: Karnal, Haryana State, India.
CGIAR Research Program on Climate Change, Agriculture and Food Security (CCAFS).
Copenhagen, Denmark. Available online at: www.ccafs.cgiar.org.
Published by the CGIAR Research Program on Climate Change, Agriculture and Food Security
(CCAFS).
CCAFS Coordinating Unit - Department of Agriculture and Ecology, Faculty of Life Sciences,
University of Copenhagen, Rolighedsvej 21, DK-1958 Frederiksberg C, Denmark. Tel: +45
35331046; Email: [email protected].
Creative Commons License
This Report is licensed under a Creative Commons Attribution – Non Commercial–NoDerivs 3.0
Unported License.
This publication may be freely quoted and reproduced provided the source is acknowledged. No use
of this publication may be made for resale or other commercial purposes.
© 2013 CGIAR Research Program on Climate Change, Agriculture and Food Security (CCAFS).
DISCLAIMER:
This report has been prepared as an output for Theme 4/baseline under the CCAFS program and has
not been peer reviewed. Any opinions stated herein are those of the author(s) and do not necessarily
reflect the policies or opinions of CCAFS.
All images remain the sole property of their source and may not be used for any purpose without
written permission of the source.

2
Executive Summary
This report presents a summary of the main results of a survey carried out between November -
December 2012 in 7 villages with 140 households (HHs) in Karnal, a benchmark site of the CGIAR
Research Program on Climate Change, Agriculture, and Food Security (CCAFS)1. Karnal is located in
Haryana State in north west India. The survey was carried out using the standardised CCAFS
household baseline tool.
The results show that the majority of the surveyed households in the area are male-headed and less
than 3% are female-headed, with an average of 6 persons per household. Most of the surveyed
households belong to the forward castes (79%), followed by scheduled castes (11%) and other
backward classes (9%). Almost all households (98%) have someone who obtained some level of
education, and four out of ten households have a member who has attained post-secondary education.
There are a variety of livelihoods present in the surveyed area. Most of the household have integrated
farming systems, integrating crops with livestock. Households produce food crops, livestock, fodder
and vegetables, in general. Only 2% of the households were subsistence farmers, producing food and
livestock only for their subsistence and not selling any products in the market. A majority of the
households produced several products on the farm (5 to 8 products) and many households sold their
products in the market irrespective of the number of products they produced last year.
The most important crops in Karnal are wheat, rice, and fodder and the most important livestock are
buffaloes and crossbred cows. Fertilizer use in the area is very high. For our surveyed households
only 1% face food shortages in an average year. Ninety percent of the households have made changes
to their crops and cropping practices in the past 10 years as a result of market and climate -related
reasons, and 94% have made changes in livestock and animal keeping practices.
The television is the major source of weather and climate related information in the area. This
information in most cases is received by men. The most changed aspects of farming upon receipt of
all the information were land management and change in crop/variety.
Karnal is a prosperous area and most of the surveyed households fall in the high asset ownership
category of the asset index created. Almost all households own cell phones, televisions and electric
fans.
Keywords
India, baseline, household survey, livelihoods, agriculture products
1 For more information about CCAFS, see: http://www.ccafs.cgiar.org. A complementary community-level survey was also
conducted in Karnal and those survey guidelines and reports will also be available on the website.
3
About the author
RKP Singh worked as a Professor of Agricultural Economics at Rajendra Agricultural University,
Pusa, Bihar, India. He also served as Advisor, State Farmers Commission, Bihar and conducted
several national and international projects.
4
Table of contents
Executive Summary......................................................................................................................... 2
Keywords ..................................................................................................................................... 2
About the author ............................................................................................................................. 3
1.0 Introduction ............................................................................................................................... 5
1.1 Household respondents and type ............................................................................................ 6
2.0 Household demographics ..................................................................................................... 6
2.1 Household size ....................................................................................................................... 7 2.2 Education levels ..................................................................................................................... 7
3.0 Sources of Livelihoods ......................................................................................................... 8
3.1 On-farm livelihood sources .................................................................................................... 8 3.2 Off-farm livelihood sources ................................................................................................... 9 3.3 Diversification and commercialization indices...................................................................... 10 3.4 Participation in on-farm and off-farm activities in the households ......................................... 11 3.5 Sources of cash in the household .......................................................................................... 12 3.6 Discussion ........................................................................................................................... 13
4.0 Crop, Livestock, Land and Water Management Changes................................................ 13
4.1 Crop-related changes ........................................................................................................... 13 4.2 Reasons for crop-related changes ......................................................................................... 15 4.3 Livestock-related changes .................................................................................................... 17 4.4 Adaptability/Innovation index .............................................................................................. 18 4.5 Mitigation indices ................................................................................................................ 19 4.6 Discussion ........................................................................................................................... 19
5.0 Food Security ..................................................................................................................... 20
5.1 Food security index .............................................................................................................. 22 5.2 Discussion ........................................................................................................................... 22
6.0 Land and Water ................................................................................................................. 22
6.1 Water for agriculture ............................................................................................................ 22 6.2 Land use .............................................................................................................................. 22 6.3 Discussion ........................................................................................................................... 23
7.0 Inputs and Credit ............................................................................................................... 24
7.1 Fertilizer use ........................................................................................................................ 24 7.2 Discussion ........................................................................................................................... 25
8.0 Climate and Weather Information .................................................................................... 25
8.1 Information recipients in the households .............................................................................. 25 8.2 Types of weather-related information ................................................................................... 26 8.3 Discussion ........................................................................................................................... 28
9.0 Community Groups ........................................................................................................... 28
9.1 Climate related crises ........................................................................................................... 29 9.2 Discussion ........................................................................................................................... 29
10.0 Assets .................................................................................................................................. 29
10.1 Asset index................................................................................................................... 31 10.2 Discussion .................................................................................................................... 32
Appendix 1: List of villages in Karnal .......................................................................................... 33
Appendix 2: Study team members ................................................................................................ 34
5
1.0 Introduction
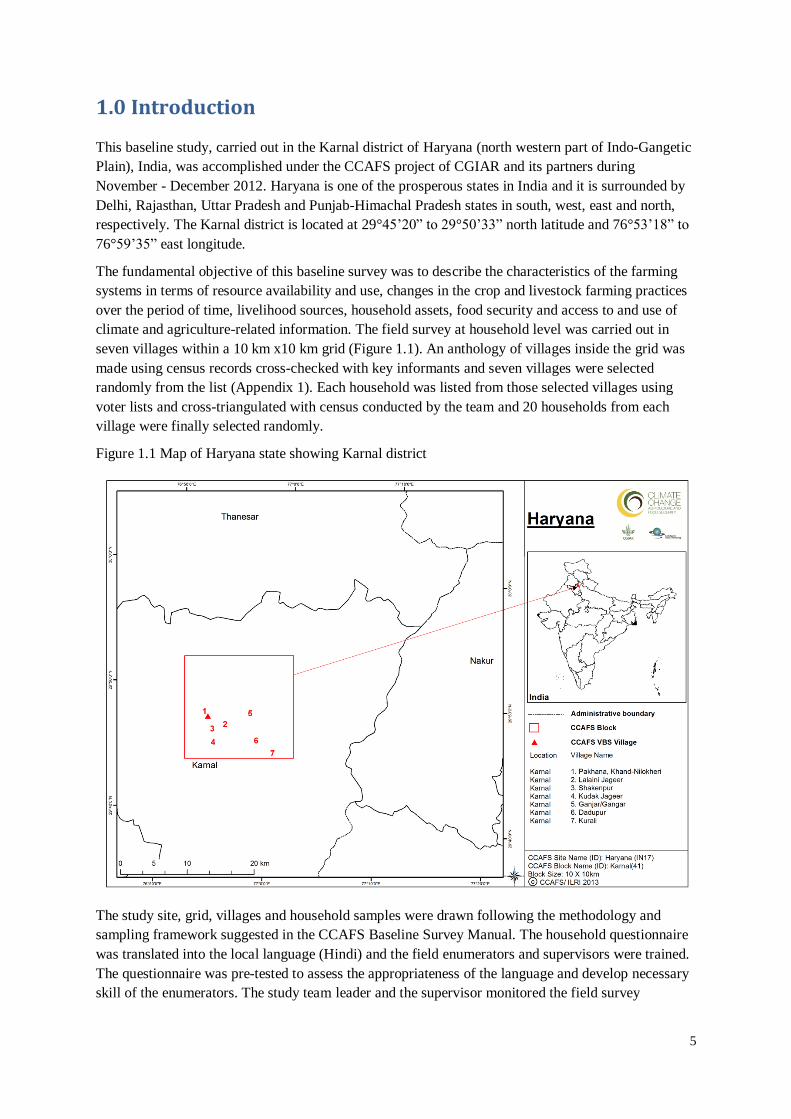
This baseline study, carried out in the Karnal district of Haryana (north western part of Indo-Gangetic
Plain), India, was accomplished under the CCAFS project of CGIAR and its partners during
November - December 2012. Haryana is one of the prosperous states in India and it is surrounded by
Delhi, Rajasthan, Uttar Pradesh and Punjab-Himachal Pradesh states in south, west, east and north,
respectively. The Karnal district is located at 29°45’20” to 29°50’33” north latitude and 76°53’18” to
76°59’35” east longitude.
The fundamental objective of this baseline survey was to describe the characteristics of the farming
systems in terms of resource availability and use, changes in the crop and livestock farming practices
over the period of time, livelihood sources, household assets, food security and access to and use of
climate and agriculture-related information. The field survey at household level was carried out in
seven villages within a 10 km x10 km grid (Figure 1.1). An anthology of villages inside the grid was
made using census records cross-checked with key informants and seven villages were selected
randomly from the list (Appendix 1). Each household was listed from those selected villages using
voter lists and cross-triangulated with census conducted by the team and 20 households from each
village were finally selected randomly.
Figure 1.1 Map of Haryana state showing Karnal district
The study site, grid, villages and household samples were drawn following the methodology and
sampling framework suggested in the CCAFS Baseline Survey Manual. The household questionnaire
was translated into the local language (Hindi) and the field enumerators and supervisors were trained.
The questionnaire was pre-tested to assess the appropriateness of the language and develop necessary
skill of the enumerators. The study team leader and the supervisor monitored the field survey
6
activities and checked the quality of data regularly. The field team was led and supervised by RKP
Singh. The name of the study team members and the Field Enumerators are listed in the Appendix 2.
1.1 Household respondents and type
The field enumerators interviewed both male and female respondents. The female respondents were
either widows or wives/mothers of the migrants who were away from home at the time of interview.
Eighty-two percent of the surveyed respondents were males and the rest were females. Of the
surveyed households, 97% were headed by male members and only 3% were female headed
households. Indian society has consisted of thousands of clans and groups called castes (jatis) since
ancient times. Moreover, the government has specified nomenclatures for broader groups of various
castes, which aims to provide certain benefits to the selected castes. Accordingly, a household could
be forward caste (GC), other backward castes (OBC), extremely backward caste (EBC), scheduled
caste (SC) or scheduled tribe (ST). Forward caste is considered a higher caste in social hierarchy
while OBC, EBC and SC are lower ones. The majority of inhabitants in the surveyed villages
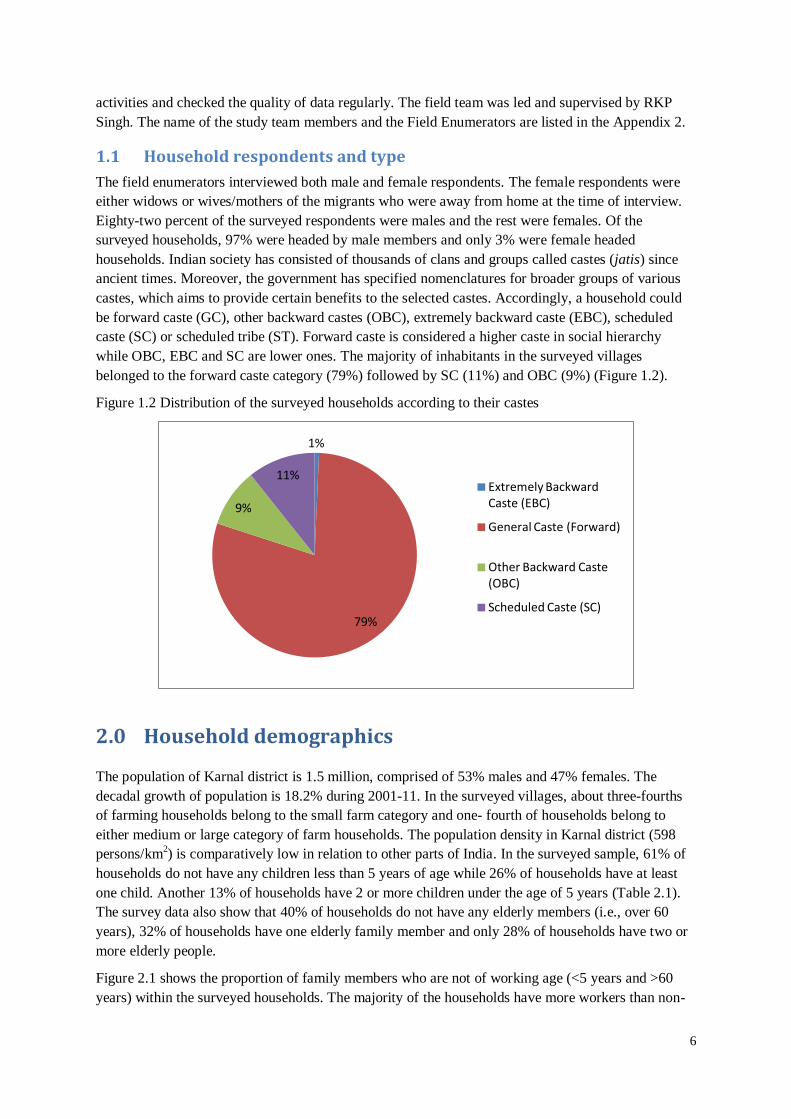
belonged to the forward caste category (79%) followed by SC (11%) and OBC (9%) (Figure 1.2).
Figure 1.2 Distribution of the surveyed households according to their castes
2.0 Household demographics
The population of Karnal district is 1.5 million, comprised of 53% males and 47% females. The
decadal growth of population is 18.2% during 2001-11. In the surveyed villages, about three-fourths
of farming households belong to the small farm category and one- fourth of households belong to
either medium or large category of farm households. The population density in Karnal district (598
persons/km2) is comparatively low in relation to other parts of India. In the surveyed sample, 61% of
households do not have any children less than 5 years of age while 26% of households have at least
one child. Another 13% of households have 2 or more children under the age of 5 years (Table 2.1).
The survey data also show that 40% of households do not have any elderly members (i.e., over 60
years), 32% of households have one elderly family member and only 28% of households have two or
more elderly people.
Figure 2.1 shows the proportion of family members who are not of working age (<5 years and >60
years) within the surveyed households. The majority of the households have more workers than non-
1%
79%
9%
11% Extremely Backward Caste (EBC)
General Caste (Forward)
Other Backward Caste (OBC)
Scheduled Caste (SC)

7
workers in the household. It also shows that 47% of the surveyed households have up to 20%
dependent members (blue area), 31% have 20-40% dependent members (green area), 12% have 40-
60% dependent members (gray area) and 10% have more than 60% dependent family members
(purple and yellow areas).
Figure 2.1 Proportion of the household that is of non-working age
2.1 Household size
The average household size in the surveyed area was 5.9 (SD=3.3, n=140) with minimum one
member and maximum 27 members. About 40% of the respondents have a family size of less than 5
members and this is considered as a small family with husband, wife and two children in the family,
in general. A large proportion of households (46%) are medium sized in terms of number of members
in the household (less than 8 family members). Only 14% of surveyed households have extended
family living in the household. Within extended family, 4% of households have more than 12
members in the household (Table 2.3). These results show that extended family is still a common
practice in the Karnal site.
Table 2.3 Distribution of households by size in Karnal
Household size Number of households Percentage distribution
1-4 (small family) 56 40
5-8 (medium family size) 64 46
9-12 (large family size) 14 10
>12 (large family size) 6 4
2.2 Education levels
Haryana is one of the most literate states in India with 77% literacy. The literacy rate in Karnal district
is 76%, with 84% literacy among males and 68% among females. Among the surveyed households
about 98% have someone who obtained some level of education while 2% do not have any members

8
in the household with any formal education, indicating a high level of literacy in these villages (Table
2.4).
Table 2.4 Highest levels of education within the households
Highest level of education of any
resident household member
Number of
households
% of
households
No formal education 3 2
Primary 20 14
Secondary 57 41
Post-secondary 60 43
Among the educated members, 14% are educated up to primary level, 41% obtained education up to
secondary level and 43% received post-secondary as the highest level of education. Hence, it may be
inferred that the literacy as well as education level is high in the surveyed villages in Karnal.
Analysis of association between family size and highest level of education in household revealed that
all the three households with no formal education belong to the category of small family size (up to 6
members) however two- thirds of households of large family size (>9 members) have at least one
family member with postgraduate education. All categories of family size have someone post
graduate educated but proportion of these households is higher in large family size category to small
family (21%). The above observation does not lead to a conclusion that the size of family played a
role in obtaining higher education but size of family has strong relationship with prosperity hence
prosperity might have played a role in obtaining higher education by households with large family
size.
3.0 Sources of Livelihoods
3.1 On-farm livelihood sources
The households in the surveyed villages derive their livelihoods from diversified sources, and
agriculture is the mainstay of livelihoods for many of them. Most of the households have integrated
farming systems, integrating crops with livestock. Households produce food crops, cash crops, fruits,
vegetables, livestock, fodder and manure and in a few cases fish as well (Table 3.1). Only 2% of the
households were subsistence farmers, producing food and livestock only for their subsistence and did
not sell any products in the market.
Table 3.1 Percentage of household producing and selling farm products produced on-farm
Produced in the farm % household
producing
% households
selling
Food crops, fruits, vegetables,
etc
93 88
Livestock and crops 90 70
Livestock only 7 5
Timber, fuel wood, honey,
manure etc
89 2
Fish 2 1
A total of 93% of the households produced food crops (raw and processed), fruits, vegetables and
fodder, 7% of the households kept livestock only while 90% of households integrate crops with
9
livestock. A large number of crop growers sold their products in the market (88%). Similarly 70%
engaged in production of both crops and livestock sold their products in the market (Table 3.1). A
large proportion of households also produced timber, manure, fuel wood and honey (89%) but only
2% sold these products in the market. These products are produced for mainly home consumption.
Only 2 households were engaged in fish production but one of them sold fish in the market.
In order to understand production and selling behaviour of the farmers, households were asked which
specific products they produced and sold in the market last year. In the surveyed villages, 127
households produced food crops and only one of them processed food crops for consumption purpose.
Food crops (rice and wheat) are considered as cash crops in the villages under study. Farmers do not
produce cash crops in the area. Fruit crops are grown by 28% of households for consumption
purposes, and 56% of households produced vegetables. Main fruits grown in the area are mango,
guava and lemon while key vegetables are cauliflower, cabbage, brinjal and ladies finger (okra). A
majority of the households (95%) raised large livestock (cows and buffaloes), mainly for milk
production and to obtain by-products such as manure and compost. Only 12% of households have
small livestock (goats) (Table 3.2).The production of small livestock is both for consumption and sale.
The comparatively poor households sell small ruminants to meet their cash requirements. Almost all
households engaged in livestock production cultivate fodder crops for their livestock and the main
fodder crops are berseem, clover, maize and oats. Production of timber and fuel wood is not common
in the area. About 16% of households produce fuel wood/timber, only for household needs. Out of
127 food crop producers, 123 households (97%) sell surplus in the market. In the area under study the
majority of households sell almost all the surplus food crops just after harvest and retain a portion of
the products for consumption purposes. Fruits are grown for consumption whereas commercial
production of vegetables has started in the surveyed villages. Twenty-eight percent of households sold
vegetables in the market.
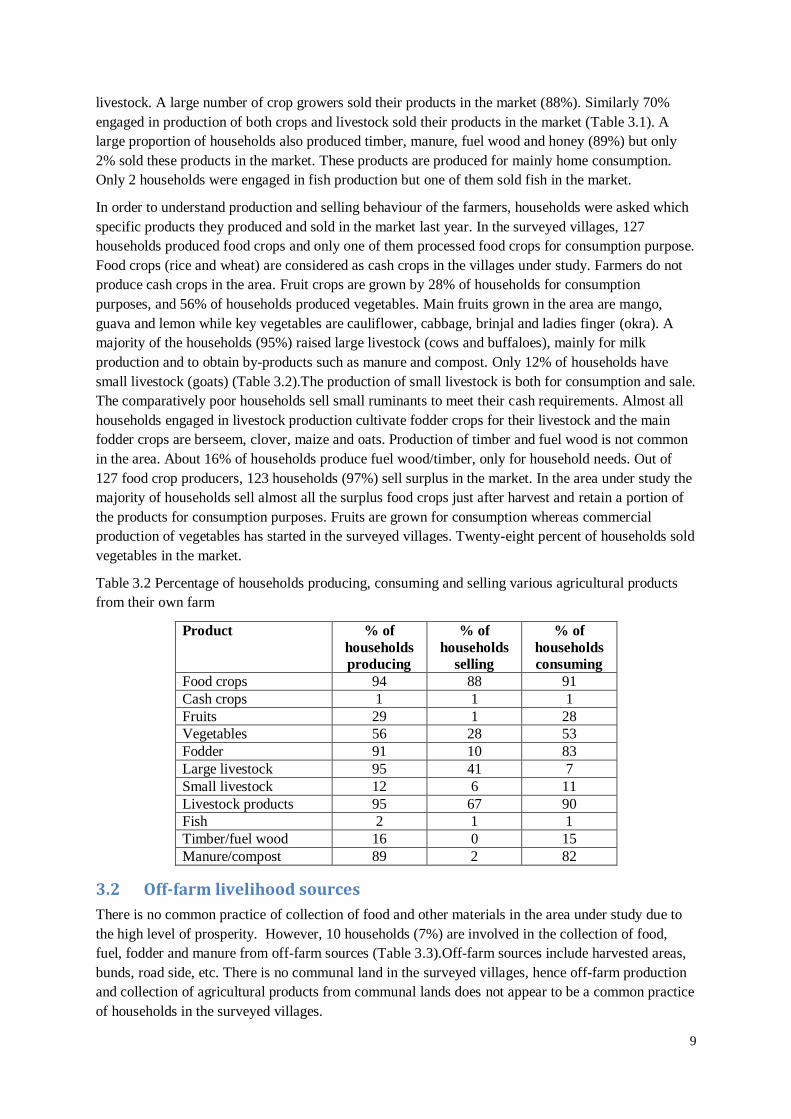
Table 3.2 Percentage of households producing, consuming and selling various agricultural products
from their own farm
Product % of
households
producing
% of
households
selling
% of
households
consuming
Food crops 94 88 91
Cash crops 1 1 1
Fruits 29 1 28
Vegetables 56 28 53
Fodder 91 10 83
Large livestock 95 41 7
Small livestock 12 6 11
Livestock products 95 67 90
Fish 2 1 1
Timber/fuel wood 16 0 15
Manure/compost 89 2 82
3.2 Off-farm livelihood sources
There is no common practice of collection of food and other materials in the area under study due to
the high level of prosperity. However, 10 households (7%) are involved in the collection of food,
fuel, fodder and manure from off-farm sources (Table 3.3).Off-farm sources include harvested areas,
bunds, road side, etc. There is no communal land in the surveyed villages, hence off-farm production
and collection of agricultural products from communal lands does not appear to be a common practice
of households in the surveyed villages.

10
Table 3.3 shows that, of the households engaged in off-farm production, 67% collected food crops,
17% collected fodder and 8% each fuel and manure. All the households engaged in off-farm
collection of food, fodder, fuel and manure belong to the weaker section of society. Selling of
collected food and fodder from off-farm is not a common practice in the surveyed area because they
collect for consumption purpose. Only one household sold the collected product in the market.
Table 3.3 Agricultural products coming from off-farm sources
Products coming
from off-farm
sources
Number of
households
% of
households
Food crops 8 67
Fodder 2 17
Fuel wood 1 8
Manure 1 8
3.3 Diversification and commercialization indices
A production diversification index was created by adding up the total number of agricultural products produced on-farm:
1 = 1-4 product(s) (low production diversification)
2 = 5-8 products (intermediate production diversification)
3 = >8 products (high production diversification)
On the selling/commercialization side, the total numbers of agricultural products produced on their
own farms, with some of the products sold were added up to calculate commercialization index:
0 = no products sold (no commercialization)
1 = 1-2 products sold (low commercialization)
2 = 3-5 products sold (intermediate commercialization)
3 = >5 products sold (high commercialization)
The results of these diversification indices for the surveyed households in Karnal are shown in Table
3.4. The data shows that there are only 2 households (2%) who produce more than 8 items (high level
of diversification); 81% of households produce 5-8 products (intermediate level of diversification)
and 15% of households produce 1-4 products on-farm (low diversification). Five households,
however, did not produce any product in the last year.
Table 3.4 Production and commercialization diversification indices
Production Diversification % of households
1-4 products (low production diversification) 15
5-8 products (intermediate production diversification) 81
>8 products (high production diversification) 2
Selling/Commercialization Diversification
No products sold (no commercialization) 5
1-2 products sold (low commercialization) 45
3-5 products sold (intermediate commercialization) 50
>5 products sold (high commercialization) 1
Many households sold their products in the market irrespective of the number of products they
produced last year. All those households who produced a larger number of products (higher
diversification) had tendency to sell their products on the market (higher commercialization). This

11
clearly shows that the higher the level of diversification on farm, the higher the commercial motive of
the farmers.
3.4 Participation in on-farm and off-farm activities in the households
In India, both men and women are involved in on-farm and off-farm activities. However, Haryana is a
male dominated society and the parda system among females is still prevalent, particularly in
villages. Most of the decisions are taken by males, with females playing just a supporting role. At the
same time, almost all of the household chores are the responsibility of females. Males and females
including adult children share responsibilities of on-farm and off-farm activities although the nature
and intensity of involvement are different. Males of about two-thirds of surveyed households are
responsible for farm activities work whereas women are responsible for farm work in only 6% of
households and children in only two households are responsible for small livestock and compost.
Male and women jointly share farm work responsibility in about 10% of households (Figure 3.1).
Figure 3.1 Agricultural workload on farm by gender
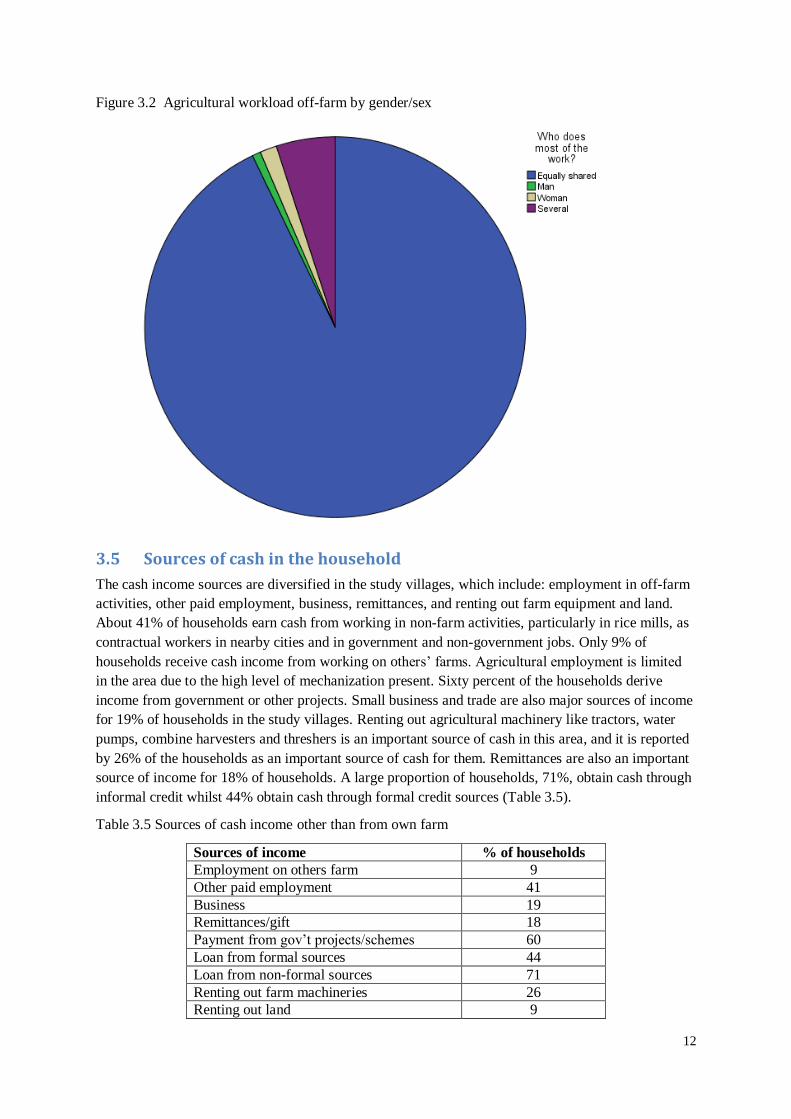
For off-farm activities, both male and females are involved. A large proportion of the off-farm
activities are being done conjointly by men and women. Similarly, 15% of the households noted that
all members of the household share off-farm activities. For 6% of cases, only men are involved and in
5% of cases only women are involved (Figure 3.2).
12
Figure 3.2 Agricultural workload off-farm by gender/sex
3.5 Sources of cash in the household
The cash income sources are diversified in the study villages, which include: employment in off-farm
activities, other paid employment, business, remittances, and renting out farm equipment and land.
About 41% of households earn cash from working in non-farm activities, particularly in rice mills, as
contractual workers in nearby cities and in government and non-government jobs. Only 9% of
households receive cash income from working on others’ farms. Agricultural employment is limited
in the area due to the high level of mechanization present. Sixty percent of the households derive
income from government or other projects. Small business and trade are also major sources of income
for 19% of households in the study villages. Renting out agricultural machinery like tractors, water
pumps, combine harvesters and threshers is an important source of cash in this area, and it is reported
by 26% of the households as an important source of cash for them. Remittances are also an important
source of income for 18% of households. A large proportion of households, 71%, obtain cash through
informal credit whilst 44% obtain cash through formal credit sources (Table 3.5).
Table 3.5 Sources of cash income other than from own farm
Sources of income % of households
Employment on others farm 9
Other paid employment 41
Business 19
Remittances/gift 18
Payment from gov’t projects/schemes 60
Loan from formal sources 44
Loan from non-formal sources 71
Renting out farm machineries 26
Renting out land 9

13
In terms of number of cash sources, about two-thirds of households have two to three sources of cash
income whereas 17% of households reported four sources of cash. There are 10% of households in the
surveyed villages who have five or more sources of income. Hence, it may be inferred that there are
diversified sources of income in the villages under study.
3.6 Discussion
Results show that a majority of the households attain an intermediate level of diversification. There is
specialized farming in Karnal. Ninety percent of the gross cropped area is covered under rice and
wheat, and other crops are grown in small areas.
There are 95% of households who sell their products in the market. Forty-five percent of households
sell 1-2 products and 50% of households sell 3-5 products. About half of surveyed households attain
an intermediate level of commercialization in the surveyed villages. We observed a very high level of
commercialization, if measured in term of proportion of quantity sold. Almost all households sell their
food grains just after harvest and keep a minimum quantity for consumption purposes.
4.0 Crop, Livestock, Land and Water Management Changes
Adoption of modern farm technologies for crop and livestock production, soil, land and water
management, and agro-forestry practices is a prerequisite for increasing employment, agricultural
production and income of farming households. In the Karnal site, about three-fourths of interviewed
households have land holding of more than one hectare and most of them are progressive in adopting
modern crop and livestock technology. There is no strong institutional support for providing easy
access to modern methods but they are prosperous and make efforts to acquire modern agricultural
technology. However, private seed, fertilizer, feed and agricultural chemical companies are active in
the area and facilitate access to modern technology for the farming communities.
4.1 Crop-related changes
Households were asked what their 3 most important crops are (from an overall livelihoods
perspective). The main crops identified as per the number of households cultivating them are wheat,
rice and fodder crops. While the most important crops a decade before were wheat, rice, fodder and
pulses but pulses have now been completely replaced by wheat.
They were then asked about what changes they had made to their farming system/practices over the
last 10 years, and for which crops. Looking at the proportion of households who have made changes
to one or more of their most important crops, we found that substantial changes have been made in
crop production practices including varietal changes in the surveyed villages by most of the
interviewed households (90% of households). On an average, households made 5 changes (SD=2.33;
n= 140) to their main crops and maximum changes made were reported to be 12. Almost 84% of the
households made changes to more than three crops and 6% of them made changes up to two crops in
the last 10 years while 10% of the households did not make any change in the crops. The major
changes happened in wheat and rice.
Adopters of new crops/varieties
We looked into more detail at the type of farming practice changes households had made. The rate of
introduction of new crop varieties was high but few crops were introduced in the Karnal area. With
respect to how many households in the last 10 years had introduced new crops and/or new varieties,
we found that many households had introduced some new crops and/or varieties. In the surveyed

14
villages, 79% of households introduced new crops/varieties and some of the new crops introduced in
the area are tomato, carrot, cucumber, brinjal, okra, and hybrid rice. Among new introduced crops,
tomato is cultivated mainly for market purposes. However, some farmers started producing vegetables
at least in the kitchen garden. Hybrid rice is now the most common rice variety in the surveyed
villages.
At the same time, some of the farmers reported that they stopped growing some crops in the last 10
years. Some of the crops that disappeared from the selected farmland are pulses, sugarcane and
millets. Wheat is the principal crop in the area and the majority of farm households reported changes
in wheat varieties at least once in two years.
Cropping-related changes
With respect to cropping-related changes, we examined whether households had made one or more of
the following changes over the last 10 years:
Introduced intercropping (e.g., mustard in wheat)
Earlier land preparation for rice
Mechanization (harvesting, threshing)
Earlier planting of rice
Expanded area of wheat
Reduced area of pulses and millets
Started using pesticides/herbicides
Integrated pest management
Integrated crop management
The results showed that most of the households had made cropping-related changes mentioned above.
However, the key changes made are area expansion, mechanization, earlier planting, started using
agro-chemicals, and manure and compost. Cropping-related changes took place mainly in rice, wheat
and fodder crops.
Water management-related changes
For the water management-related changes, the following changes in practice were considered:
Started use of groundwater for irrigation
Introduced micro-irrigation appliances
Introduced improved irrigation practices
In this area, they have traditionally relied on the traditional irrigation system, namely natural ponds
and seasonal streams. However, the traditional irrigation system collapsed and farmers have not been
able to irrigate their crops through these sources for the last several years. In the 1970s, shallow tube
wells were introduced which could not sustain for longer periods due to a rapid decline in the water
table. Presently, all tube wells are submersible. All farming households under study have started
using submersible tube wells for irrigation purposes in the last 10 years. Micro-irrigation devices have
already been introduced in the surveyed villages. The results indicate that 85% of surveyed
households made one or more changes in water management activity.
Soil management-related changes
For the soil management-related changes, the study considered the following behavioural changes:
Reduced burning of crop residues

15
Introduced crop cover in vegetable crops
Introduced ridges or bunds for some crops
Introduced minimum tillage
Introduced rotations
Started using more mineral/chemical fertiliser
Reintroduced use of manure/compost
The results show many households had introduced soil management changes in the last 10 years. The
survey information shows that 66% of households had made at least one change in soil management
and 22% of households made two changes in soil management. There are reports of alarming soil
degradation in the area due to unbalanced use of chemical fertilizers (NPK). Farmers have started
using compost, micro nutrients and green manure to maintain the soil fertility. However, 11% of
households said they had not made any changes to their soil management practices who are either
marginal farmers, or absentee landlords.
In the study area, the use of compost increased for cultivation of vegetable crops. The awareness
among farmers about use of organic manure in food grain crops also increased for maintaining soil
fertility. There is lack of institutional efforts in the area for advising farmers about improving and
maintaining soil fertility. Farmers are progressive but they do not have easy access to a soil testing
facility.
Tree/Agro-forestry management-related changes
Agro-forestry practices are still not common in the surveyed villages in Karnal. There are some
Eucalyptus trees planted decades ago but very few trees planted during the last 10 years. The area was
full of trees and groves before the year 1950 but almost all green coverage was converted into crop
fields. Eighty percent of surveyed households did not make any attempt to integrate agro-forestry to
their crop/livestock farming systems.
4.2 Reasons for crop-related changes
An attempt has been made to identify the reasons why households had made the specified changes.
Farmers reported six important reasons for crop related changes which are markets, climate, land,
labour, pest and diseases, and government projects. We found interesting results in the sense that
almost all farming households mentioned multiple reasons of making changes in crops, land, water
and agro-forestry. Sixty percent of households mentioned four or more reasons for changes in farming
practices and 91% of households indicated reasons for change in farming practices which are other
than market, climate and land. Hence, it would be difficult to single out the key factors that made
farmers change farming practices.
This means that the reasons of making changes in this section are not only related to climate, market
and land but several others beyond the purview of the questionnaire governed those changes in crops,
varieties, and land and water management.
Markets emerged as the most important reason mentioned by all farming households for making
cropping related changes because even food grains are produced for the market in the area. Climate is
the second most important reason for changes in farming practices; 86% of households mentioned
climate as a reason for change in farming practices in the area (Table 4.1).Scarcity of labour and
suitability of land are mentioned as third and fourth important reasons by 66% and 60% of
respondents, respectively, for changes in cropping practices in the area. Incidence of pest and diseases
16
and government projects are also important reasons for change in cropping in the area which were
mentioned by half and one-third of interviewed households, respectively.
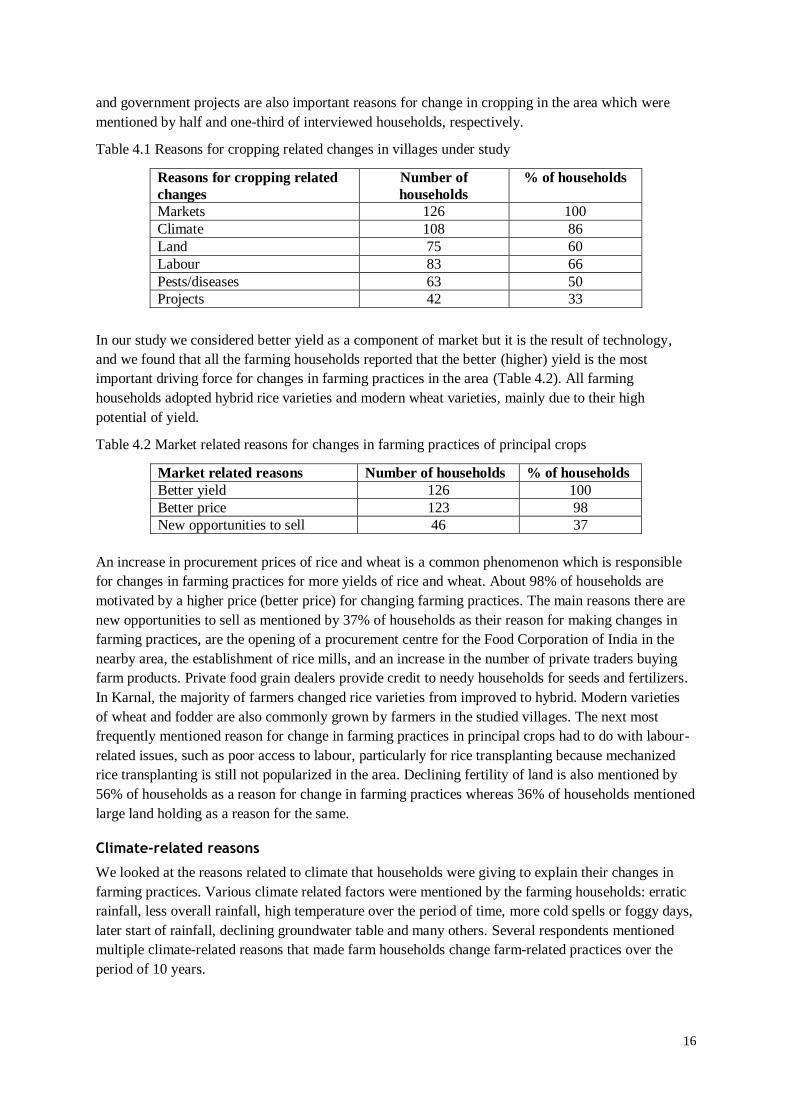
Table 4.1 Reasons for cropping related changes in villages under study
Reasons for cropping related
changes
Number of
households
% of households
Markets 126 100
Climate 108 86
Land 75 60
Labour 83 66
Pests/diseases 63 50
Projects 42 33
In our study we considered better yield as a component of market but it is the result of technology,
and we found that all the farming households reported that the better (higher) yield is the most
important driving force for changes in farming practices in the area (Table 4.2). All farming
households adopted hybrid rice varieties and modern wheat varieties, mainly due to their high
potential of yield.
Table 4.2 Market related reasons for changes in farming practices of principal crops
Market related reasons Number of households % of households
Better yield 126 100
Better price 123 98
New opportunities to sell 46 37
An increase in procurement prices of rice and wheat is a common phenomenon which is responsible
for changes in farming practices for more yields of rice and wheat. About 98% of households are
motivated by a higher price (better price) for changing farming practices. The main reasons there are
new opportunities to sell as mentioned by 37% of households as their reason for making changes in
farming practices, are the opening of a procurement centre for the Food Corporation of India in the
nearby area, the establishment of rice mills, and an increase in the number of private traders buying
farm products. Private food grain dealers provide credit to needy households for seeds and fertilizers.
In Karnal, the majority of farmers changed rice varieties from improved to hybrid. Modern varieties
of wheat and fodder are also commonly grown by farmers in the studied villages. The next most
frequently mentioned reason for change in farming practices in principal crops had to do with labour-
related issues, such as poor access to labour, particularly for rice transplanting because mechanized
rice transplanting is still not popularized in the area. Declining fertility of land is also mentioned by
56% of households as a reason for change in farming practices whereas 36% of households mentioned
large land holding as a reason for the same.
Climate-related reasons
We looked at the reasons related to climate that households were giving to explain their changes in
farming practices. Various climate related factors were mentioned by the farming households: erratic
rainfall, less overall rainfall, high temperature over the period of time, more cold spells or foggy days,
later start of rainfall, declining groundwater table and many others. Several respondents mentioned
multiple climate-related reasons that made farm households change farm-related practices over the
period of 10 years.

17
Table 4.3 Weather/Climate-related reasons for changes in farming practices in surveyed villages
Weather/Climate related reason Percent of
households that
cited reason
More erratic rainfall 30
Less overall rainfall 2
Strong winds 1
Later start of rains 1
More cold spells or foggy days 40
Higher temperatures 4
Lower groundwater table 50
Climate-related reasons were given by 85% of interviewed households. We also asked farmers to
indicate what kind of climate-related reasons had driven them to make changes in farm practices of
principal crops (Table 4.3). Among farmers who responded with climate-related reasons, lower
ground water was mentioned by 50%. The water table declined by about 50 feet during the last 40
years whereas the decline was rapid during the last 10 years. The decline in the groundwater table is
caused by low rainfall along with absence of water harvesting and aquifer recharging arrangements in
the area under study.
More cold spells or foggy days is the second most important climatic reason, mentioned by about 40%
of households because this phenomenon has been very common during the last 10 years, and it
adversely affects production potential of pulses, rape seeds/mustard, potato and vegetables. More
erratic rainfall has become a common phenomenon in all of northern India, and it holds true for the
Karnal site also. Thirty percent of households mentioned it as an important reason for changes in
farming practices. High temperature is mentioned by 4% of households as a reason for change in
farming practices whereas low rainfall and later start of rainfall are not considered as important
reasons in the area due to assured and subsidized irrigation facility available to most farm households.
4.3 Livestock-related changes
In the Karnal site, livestock farming is an important complementary enterprise to crop production. Of
the surveyed households, 95% are engaged in crop-livestock mixed farming and 12% of households
keep small ruminants. This is because farm households derive certain products from livestock that can
be used in agriculture and agriculture in turns supplies feed to livestock resources. The results show
that the majority of households have livestock in the locality and only 10 households reported that
they do not have any animals. Buffalo is the most important dairy animal but the incidence of keeping
this particular species of livestock declined from 84% to 76%, while the incidence of dairy cow
keeping increased from 12% to 15% during the last 10 years in the studied villages. Tractors have
been introduced in the area but use of buffalo for traction purpose is still in vogue in Karnal. Animals
are also still used for transport of small quantities of materials for short distances. Goats have not been
an important animal species in the area for the last several years.
On an average, households reported making 2 changes in livestock keeping practices. Out of 130
households owning livestock, 122 reported some changes in livestock. Eleven percent of the
household made changes in one animal, 44% in two animals and 41% in more than two animal
species and their management practices. The maximum number of changes in dairy cow keeping is
noted to be 8. The results suggest that all households introduced new types of animal and/or new
breeds and made associated changes in herd size, and care and management of livestock.
18
For herd related changes the following indicators were considered:
Reduction in herd size
Increase in herd size
Change in herd composition
Almost all livestock owners made herd-related changes over the past 10 years in the locality. For
animal management related changes the study considered the following changes:
Stall keeping introduced
Fencing introduced
Cut and carry introduced
All livestock owners made changes in animal management practices in the last 10 year. For feed
related changes we consider both the growing of fodder crops and fodder storage. Almost all livestock
owners made one or more of the above mentioned changes in feed.
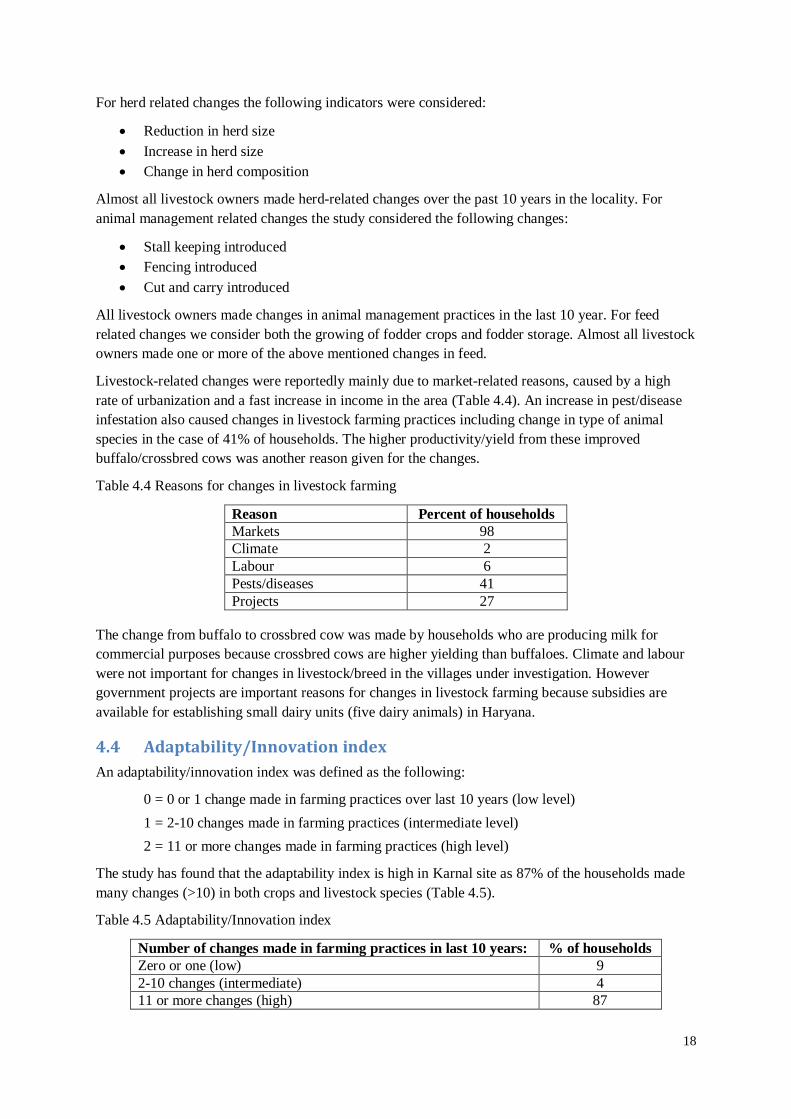
Livestock-related changes were reportedly mainly due to market-related reasons, caused by a high
rate of urbanization and a fast increase in income in the area (Table 4.4). An increase in pest/disease
infestation also caused changes in livestock farming practices including change in type of animal
species in the case of 41% of households. The higher productivity/yield from these improved
buffalo/crossbred cows was another reason given for the changes.
Table 4.4 Reasons for changes in livestock farming
Reason Percent of households
Markets 98
Climate 2
Labour 6
Pests/diseases 41
Projects 27
The change from buffalo to crossbred cow was made by households who are producing milk for
commercial purposes because crossbred cows are higher yielding than buffaloes. Climate and labour
were not important for changes in livestock/breed in the villages under investigation. However
government projects are important reasons for changes in livestock farming because subsidies are
available for establishing small dairy units (five dairy animals) in Haryana.
4.4 Adaptability/Innovation index
An adaptability/innovation index was defined as the following:
0 = 0 or 1 change made in farming practices over last 10 years (low level)
1 = 2-10 changes made in farming practices (intermediate level)
2 = 11 or more changes made in farming practices (high level)
The study has found that the adaptability index is high in Karnal site as 87% of the households made
many changes (>10) in both crops and livestock species (Table 4.5).
Table 4.5 Adaptability/Innovation index
Number of changes made in farming practices in last 10 years: % of households
Zero or one (low) 9
2-10 changes (intermediate) 4
11 or more changes (high) 87

19
4.5 Mitigation indices
Several climate mitigation-related behavioural changes were used to create the following indices:
Tree management: This index shows whether a household has either protected or planted trees
within the last year. Twenty-one percent of the households undertook tree management activities in
the locality during the last 10 years and only 13% of the households planted and/or protected trees in
the last year.
Soil amendments: This index shows if the household has used fertilizer in the last year, or has started
using fertilizer or manure on at least one crop. Among the surveyed households, 90% undertook soil
management activities.
Input intensification: This index shows the level of input use in farming practices. Seven “changes
in agricultural practices/behaviour” over the last 10 years were considered to create an index with 3
levels: a) no intensification (none of the following), b) low intensification (1-3 of the following), and
c) high intensification (4-7 of the following).
The changes are:
Purchased fertilizer
Improved irrigation practices
Started using more manure/compost
Started using minerals and higher quantum of chemical fertilizers
Started using pesticides/herbicides
Started using integrated pest management techniques
Planted higher yielding varieties
Started use of micro-irrigation appliances
There is quite a developed infrastructure but relatively weak institutional arrangements for
agricultural development in Karnal. However, 88% of the households belong to the high input
intensification category, while only 2% of households reported a low level of input intensification and
10% of households reported no input intensification.
Productivity index:
This index shows if a household has reported achieving a better yield from any crop, or that their land
is more productive for any crop over the last 10 years – such households are classified as showing an
"increase in productivity". A total of 90% of households have reported that their farm productivity
increased at a certain level in the last 10 years. Table 4.6 shows the multiple mitigation indices.
Table 4.6 Mitigation-related indices
Index No
(% of hh’s)
Yes
(% of hh’s)
Tree management 79 21
Soil amendments 10 90
Increase in productivity 10 90
Input intensification 10 Low – 2 High – 88
4.6 Discussion
Karnal represents a production bowl of rice and wheat. Strong minimum support price (MSP) given
by the Government for many years has been a key driving force behind several changes in rice and
wheat cultivation. Recently, commercial vegetable production is also gaining popularity in this area.
Changes in crop type, varieties, livestock and/or management are mainly due to the market drivers

20
including higher yields, technological availability and availability of higher yielding (such as hybrid
rice) varieties of the crops. Some traditional crops such as pulses, millets and sugarcane have
disappeared mainly because farmers get a minimum price for rice and wheat from the Government.
Mechanization has been very much accelerated in this area due to several reasons: relatively higher
land size, government subsidy in the machines, pro-mechanization policy of the government and
availability of the market, among others.
Changes in water management practices have also occurred and farmers now realize that the
groundwater table has been declining every year due to over-exploitation of the precious water
resource. Residue burning is a common issue in this area. Use of organic manure, green manure,
balanced fertilization, zero tillage and cover cropping are some of the key soil management practices
changed in the last 10 years. Tree plantation and agro-forestry are rarely practiced in Karnal. Multiple
climate related factors that farmers have experienced in this area are: erratic rainfall, lower or higher
overall rainfall, terminal heat during grain filling period, more cold spells or foggy days, declining
groundwater table and many others. Livestock is an integral component of farming system in Karnal
and most of the farm households possess some units of buffaloes. The key changes in livestock are an
introduction of new breeds of livestock, changes in herd size and new animal husbandry practices.
Farmers in Karnal are highly innovative as almost 87% of the farm households made more than 10
changes in farming practices over the last 10 years. Similarly, input intensification is higher in this
area than other regions.
5.0 Food Security
The monthly sources of food for the family were queried, i.e. whether it came mainly from their own
farm, or elsewhere (from off-farm) for each month (in an average year). The survey found that 90% of
households consume food from their own farms throughout the year while there are 10% who rely on
food from off-farm sources throughout the year. This happens mainly because non-farm sources are
their main source of livelihood however some of them do not have adequate land to grow the required
food quantities. Households were also asked during which months of the year they struggled to have
enough food to feed their family, from any source.
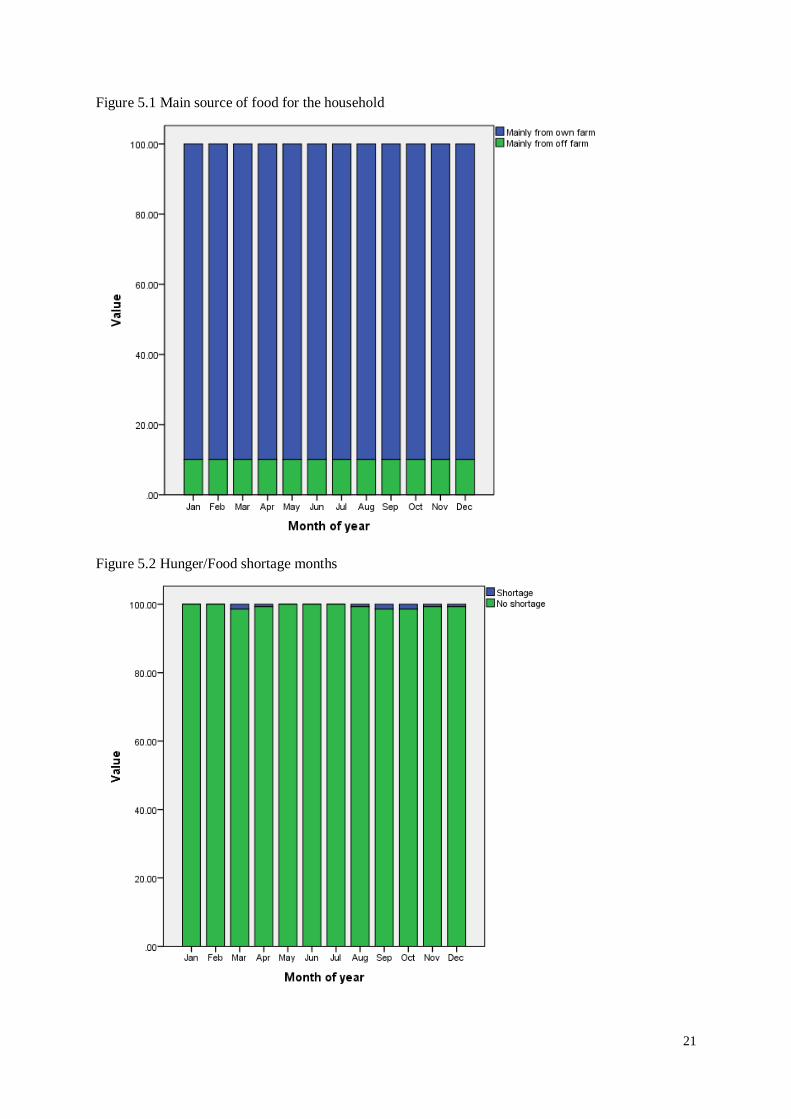
Figure 5.1 shows the households who take food from own sources as well as from off-farm in 12
months of the year. Almost all the farming households take food from own sources during January to
December from own farm sources whereas non-farm households (10%) depend on off-farm sources,
mainly the market however some poor households depend on relatives, friends and the public for
their family food intake who are either agricultural labour households or engaged non-farm activities
including wage employment. Number of households depending on off-farm source is same for all the
months because they depend on off-farm but they do not face hunger in any month of the year.
Figure 5.2 shows a trend of food shortage in the study villages. Almost all the households (farming
and non farming) do not face hunger in any month of the year. There is one surveyed household
which faced hunger in April, August, and October to December whereas 2 households faced hunger in
March and September. These households are agricultural labour households and they face hunger the
months preceding the harvesting of the wheat crop (March and April) and rice harvest (August and
September).
21
Figure 5.1 Main source of food for the household
Figure 5.2 Hunger/Food shortage months
22
5.1 Food security index
The food security index we created is based upon the number of months that the household has
difficulty in getting food from any source (i.e. from their own farm or stores, gifts, purchases or
transfers). For the surveyed households, 99% do not have a hungry period during an average year.
Table 5.1 Food security index
Percent of households reporting:
More than 6
hunger months
5-6 hunger
months
3-4 hunger
months
1-2 hunger
months
Food all year
round/No hungry
period
0 1 1 0 99
5.2 Discussion
Households in Karnal are quite food secure and very few of the survey respondents reported facing
food shortages. High agricultural productivity in the area due to use of inputs and irrigation coupled
with diversified income sources from other livelihood activities help the population remain food
secure throughout the year.
6.0 Land and Water
6.1 Water for agriculture
Water is one of the important critical inputs because rainfall is inadequate and erratic in the Karnal
area. Irrigation infrastructure is well developed but the system of irrigation (using groundwater) is
threatened due to a decline in the water table in the area which is the result of over exploitation of
groundwater resources however government is trying to improve the situation by imposing some
restriction on over exploitation of groundwater. About 89% of households have access to an irrigation
source, either owned or hired. The bore well (submersible) is the main source of irrigation and 89% of
households have access to this source of irrigation. Sixty-four percent of households have access to
water pumps for irrigation purposes. However, resource poor farmers are constrained by not having
their own pump and lack the ability to invest in water for irrigation.
Table 6.1 Water sources for agriculture on-farm
On-farm agricultural water source % of households
Irrigation 89
Ponds/dams for water harvesting 1
Bore wells (submersible tube well) 89
Water pumps 64
Inlet/water gate 1
None of the above sources 10
6.2 Land use
Farmers in the northwest part of the IGP have comparatively large parcels of land but the majority of
farm households belong to the medium size farm category. However, a few of them (marginal farm
households) are subsistence farmers. It holds true to the surveyed households in the Karnal site. The
majority of farmers are prosperous in the locality both in terms of resource ownership and income.
23
Twenty-seven percent of them have more than five hectares of land, 52% of households have between
1-5 hectares and 21% of farm households belong to the marginal category (<1 hectare) (Table
6.2).There is no communal land in the studied villages. All categories of households used almost all
land for crop production. There is no wasted land but some lands are degraded due to unbalanced use
of chemical fertilizers in crop production. The majority of interviewed farmers (95%) reported they do
not have any land available for expansion of cultivation.
Table 6.2 Total land size accessed by households
Number of hectares of land
owned and rented in
% of households
Less than one hectare 21
1-5 hectares 52
More than 5 hectares 27
Nineteen percent of the households planted trees in the last 12 months. Among these households, 13%
planted less than 10 trees, 5% planted 11-50 trees and only 2 households planted more than 51 trees in
their farmlands. Fourteen percent of surveyed households protected trees around their farmland in the
past 12 months, and 20% of the surveyed households either purchased and /or produced tree seedlings
during the last 12 months.
Communal land
None of the surveyed households uses communal land.
Hired machinery or labour
Agricultural machineries were introduced during the late 1960s in Karnal. Bullock drawn ploughs and
other equipments have already been replaced by modern machineries. Hiring a tractor, harvester
thresher and pump set is very common in this area. Sixty-three percent of households hired a tractor
and/or other farm machineries for land preparation, crop harvesting and threshing. Hiring farm labour
is also common in this part of the world as household farm labourers are not sufficient during the peak
seasons. Of the surveyed households, 86% hired external labour. Thirteen percent of the households
did not hire any farm machinery or labour. Households who did not hire farm machineries and labours
are engaged either in off-farm or non-farm occupation.
6.3 Discussion
Almost all farmers in the Haryana State of India have access to irrigation water. The irrigation
infrastructures are highly developed in the state including in the surveyed area. In the survey district,
89% of households have access to an irrigation source, either owned or hired. The bore well
(submersible) is the main source of irrigation. Over-exploitation of groundwater is quite common in
this area and farmers now realize that the water table is falling, leading to a threat on groundwater
resources. Unlike other parts of the IGP, medium sized farmers (1-5 ha land) dominates in Karnal
followed by large landholders (>5 ha) which constitutes almost 27% of the farm households. Only a
few farmers planted trees in their land and as such land is intensively cultivated with no or low
coverage by plantations/trees. The area lacks communal land. Hiring a tractor, harvester, thresher and
pump set is very common in this area and bullock driven ploughs are almost completely replaced by
the recent machineries. The surveyed area faces an acute scarcity of household farm labourers and
hiring seasonal on-farm labour is common.

24
7.0 Inputs and Credit
The surveyed farmers use various agricultural inputs including improved certified seeds, chemical
fertilizers, pesticides and veterinary medicines in the locality and a few also purchase crop and
livestock insurance. The survey reveals that 90% of farmers buy seeds and fertilizers from markets.
Sometimes such inputs are sought from the local government as government distributes high yielding
varieties of the seeds to a few farmers for testing them in the farmers’ fields. Similarly, 90% buy and
use pesticides because they are engaged in intensive cultivation of food crops and a few of them
started commercial vegetable cultivation.
Livestock is also an important enterprise in the area hence 87% of farm households purchased and
used veterinary medicines to maintain good health of their dairy animals. The formal credit system is
weak in this area. Half of the surveyed households obtained loans for agricultural purposes but the
majority of them obtained credit from non-institutional sources, mainly from traders and commission
agents. There is not widespread awareness of crop or livestock insurance in this area; only 4% of
households had purchased crop insurance during the last 12 months. The low level of crop insurance
is only due to less popularity of the Kisan Credit Card and a large number of non-functional KCC in
the area which emerged as the most important instrument for credit and crop insurance in other parts
of India. Weather based insurance is still in an experimental stage here, but 3% of the households took
part in a pilot project of weather-based insurance. This shows that weather index based insurance is
penetrating at the ground level these days although lots of effort must be done to materialize the
benefits from index based insurance to the farmers.
Table 7.1 Purchased input use
In the last year, did you purchase: % of households
Certified/Improved Seeds 89
Fertilizer 90
Pesticides 90
Veterinary medicine 87
Any credit for agricultural activities 51
Insurance for crop and livestock 4
Weather based insurance 3
None of the above 7
7.1 Fertilizer use
Eighty-nine percent of the surveyed households used purchased fertilizers from the market. More than
70% of households used two or three types of fertilizers. While probing farmers about types of
fertilizers used by them, urea emerged as the most important fertilizer, used by all farm households. In
the studied villages, 47% of the households used three types of fertilizer while 24% used two different
types of fertilizers. DAP is almost equally important as urea; it is used by 99% of households. NPK is
also used by 24% of farm households. Rock phosphate, however, is not commonly used in the area.
Several fertilizers, including CAN, MP and micro-nutrients are used by 58% of households. Farmers
have restarted using compost and green manure to increase soil fertility and enhance productivity. Ten
percent of farmers did not use any fertilizer in the past year.
Among the surveyed households, 90% applied fertilizer to their most important crop, 90% applied it
to their second most important crop and 70% applied to the third important crop. The most common
crops that fertilizer was applied to are wheat (100% farmers applied), hybrid rice (100% farmers
applied), fodder crops (60% farmers applied) and tomato (33% farmers applied).

25
Table 7.2 Different types of fertilizers used by farm families
Fertilizer types % of households
Urea 100
DAP 99
NPK 25
Rock phosphate 4
Local mixture 10
Several types 56
7.2 Discussion
Use of improved inputs such as hybrid seeds, certified seeds, agro-chemicals and veterinary medicines
is quite common in the surveyed area and farmers often obtain such inputs from the market which is
well-developed. Local government also distributes such inputs, particularly seeds of high yielding
varieties of the crops. Urea is the number one fertilizer applied by the farmers. All farmers apply
fertilizers (mostly urea and DAP) to rice and wheat. Similarly, use of pesticide is also common,
mainly on the vegetable crops. Crop insurance is still in a formative stage in this area.
8.0 Climate and Weather Information
The survey data show that 85% of respondents get climate and weather related information from
various sources including radio, television, government department (agricultural extension), private
organizations and community members. Households receive information on extreme events, pest or
disease outbreak, start of the rains and extended periods of weather information.
8.1 Information recipients in the households
Eighty-five percent of surveyed households reported receiving information on weather/climate over
the past 12 months. Both male and female members of the surveyed households get information on
weather. However, in most cases, males are the primary recipient of the information from the external
sources in Karnal. Seventy-two percent of households reported that the forecast information is
received by men only but there are also some households in which both males and females receive
weather related information (Table 8.1). Information on pest or disease outbreak is received by males
in 94% of the surveyed households. No females in any of the surveyed households exclusively
received weather information of extreme weather, pest or disease outbreak, weather for next 2-3
months and weather for the next 2-3 days, but information on these aspects were received by both
males and females according to the percentages in Table 8.1 below.
Table 8.1 Gender breakdown of different kinds of weather-related information
Type of weather-related
information
% of households
receiving
information
% of households
reporting men
are receiving this
information
% of households
reporting both are
receiving this
information
Extreme events 64 84 16
Pest or disease outbreak 73 94 6
Start of the rains 80 80 16
Weather for the next 2-3 months 22 72 26
Weather for the next 2-3 days 36 80 20
26
8.2 Types of weather-related information
Respondents reported receiving weather related information from various sources including radio,
television, agricultural extension, friends, relatives, neighbour, newspaper, cell phone and,internet. An
attempt has been made to analyze main weather information, extreme events, pests and diseases
outbreak, forecast of start of rainfall, predictions of 2-3 months of rainfall, and 2-3 days of rainfall.
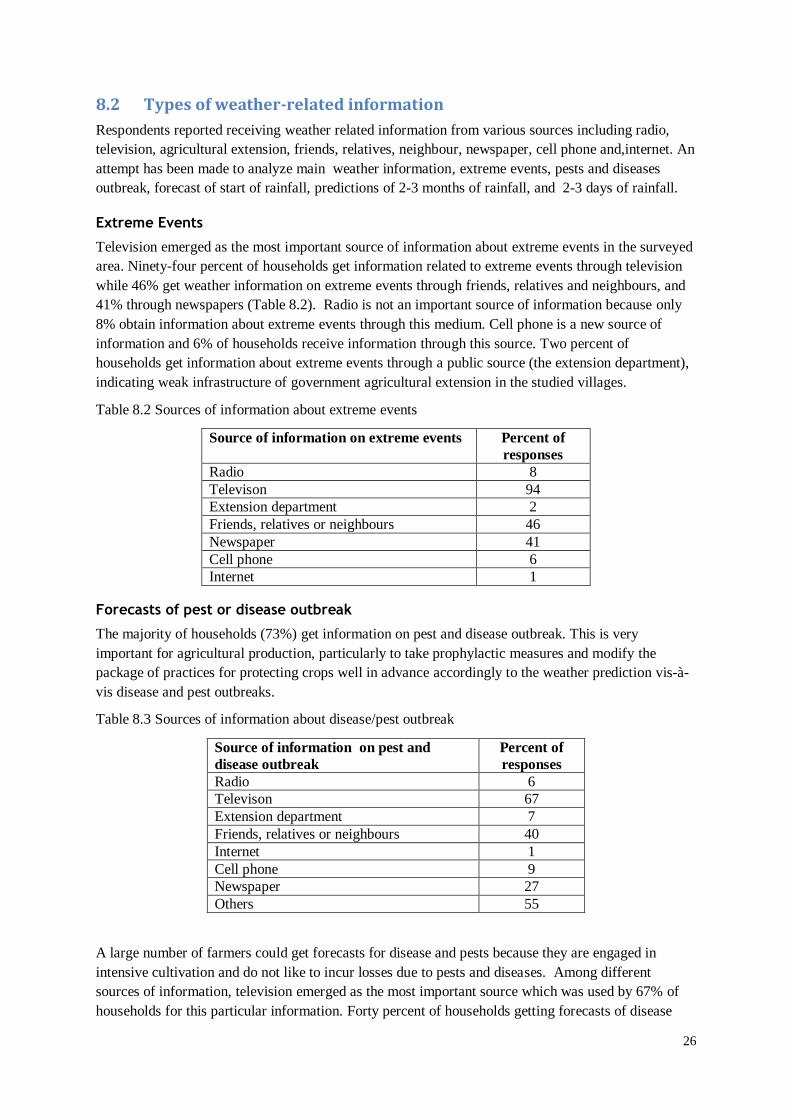
Extreme Events
Television emerged as the most important source of information about extreme events in the surveyed
area. Ninety-four percent of households get information related to extreme events through television
while 46% get weather information on extreme events through friends, relatives and neighbours, and
41% through newspapers (Table 8.2). Radio is not an important source of information because only
8% obtain information about extreme events through this medium. Cell phone is a new source of
information and 6% of households receive information through this source. Two percent of
households get information about extreme events through a public source (the extension department),
indicating weak infrastructure of government agricultural extension in the studied villages.
Table 8.2 Sources of information about extreme events
Source of information on extreme events Percent of
responses
Radio 8
Televison 94
Extension department 2
Friends, relatives or neighbours 46
Newspaper 41
Cell phone 6
Internet 1
Forecasts of pest or disease outbreak
The majority of households (73%) get information on pest and disease outbreak. This is very
important for agricultural production, particularly to take prophylactic measures and modify the
package of practices for protecting crops well in advance accordingly to the weather prediction vis-à-
vis disease and pest outbreaks.
Table 8.3 Sources of information about disease/pest outbreak
Source of information on pest and
disease outbreak
Percent of
responses
Radio 6
Televison 67
Extension department 7
Friends, relatives or neighbours 40
Internet 1
Cell phone 9
Newspaper 27
Others 55
A large number of farmers could get forecasts for disease and pests because they are engaged in
intensive cultivation and do not like to incur losses due to pests and diseases. Among different
sources of information, television emerged as the most important source which was used by 67% of
households for this particular information. Forty percent of households getting forecasts of disease

27
and pest outbreaks receive such information from friends, neighbour and relatives. Newspapers are
also an important source of information for disease and pest outbreaks, and 27% of households
received the information from this source (Table 8.3). Cell phones are emerging as an important of
source of information but they are still utilized by only 9% of surveyed households for getting
information about diseases and pests outbreak. Internet is still not common in the rural area of Karnal
site hence only one household obtained information of diseases and pest outbreak from the internet.
Seventy percent of households obtaining information about outbreaks of pests and diseases reported
that they received the forecasts along with advice in regards to farming practices, and 79% of them
were able to utilize the advice. Farm households utilized the forecasts of diseases and pest outbreak
for changing the crop varieties from susceptible ones to varieties that are disease and pest resistant
(58%) and readjusted the use of inputs (98%).
Forecasts of the start of the rains
The farmers and community people sometimes get predictions about the timing of rain, which is very
important for planning agricultural activities. In Karnal, 80% of households obtained forecasts for the
start of rainfall. Television is the main sources for the rainfall prediction (91%) and TV channels
generally get such forecasts through the government meteorological department and local met office.
Newspapers and friends and relatives are the next important sources of information which were
accessed by 32% and 31% households, respectively. Cell phone, internet and the met office are not
important sources of information about forecasts of start of rainfall in the Karnal area. Own
observations based on experiences and religious faiths have also helped in predicting the start of
rainfall (Table 8.4).Government development offices provided prediction of start of rainfall to only
2% of surveyed households. Some of the households get such information through local people,
particularly during meetings or satsang (gatherings) in Gurudwara.
Thirty-six percent of households receiving information on prediction of start of rainfall reported that
they obtained cropping advice along with the prediction, however only 45% of them (18 households)
could utilize the advice in changing cultivation practices. Fourteen households reported that they
made changes in land management practices according to forecasts for start of rainfall.
Table 8.4 Sources of information on the predicted timing of the start of the rains
Source of information on start of the rains % of households
Radio 6
Televison 91
Government agricultural or vet extension 2
Friends, relatives or neighbours 31
Newspaper 32
Own observation 4
Cell phones 2
Met office 1
Internet 1
Religious or local faith 2
Weather forecasts for the next 2-3 months and 2-3 days
Extended periods of weather forecasts are being provided in many places in India including in the
surveyed area. Such forecasts are crucial for agricultural operations. In the surveyed villages in
Karnal, 22% of surveyed households received weather forecasts for the next 2-3 months, and 36% of
households obtained weather forecasts for the next 2-3 days. The sources of information are common
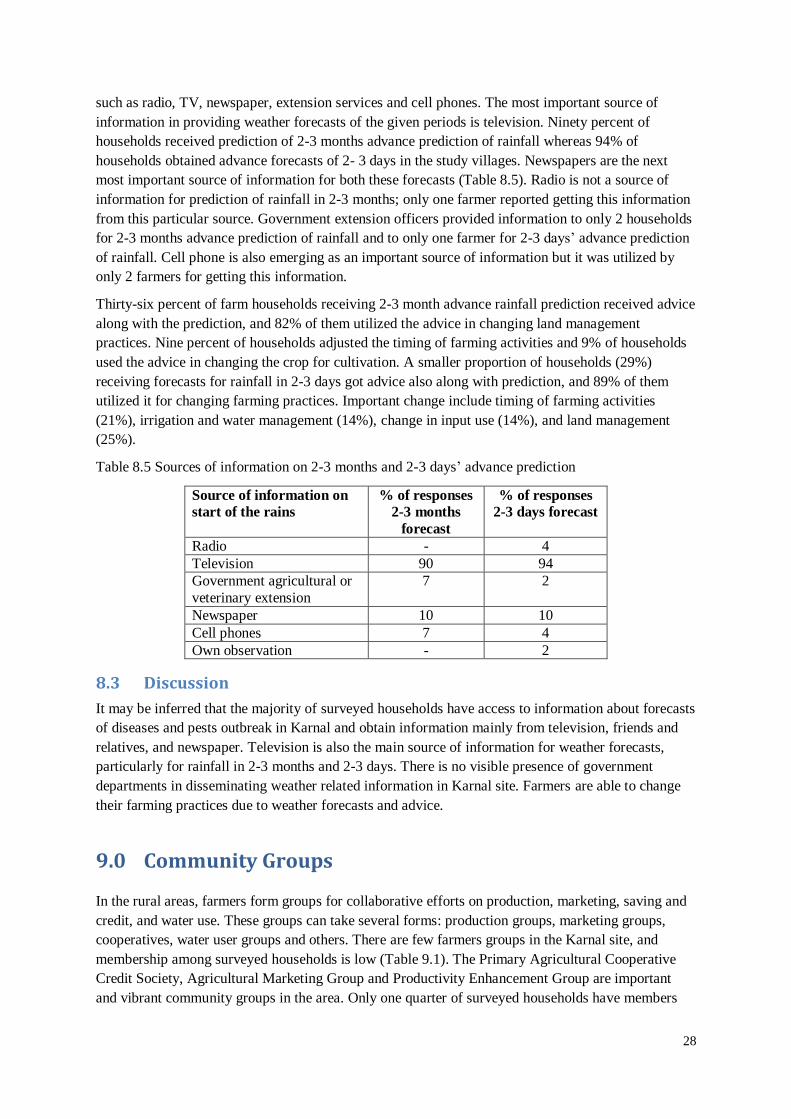
28
such as radio, TV, newspaper, extension services and cell phones. The most important source of
information in providing weather forecasts of the given periods is television. Ninety percent of
households received prediction of 2-3 months advance prediction of rainfall whereas 94% of
households obtained advance forecasts of 2- 3 days in the study villages. Newspapers are the next
most important source of information for both these forecasts (Table 8.5). Radio is not a source of
information for prediction of rainfall in 2-3 months; only one farmer reported getting this information
from this particular source. Government extension officers provided information to only 2 households
for 2-3 months advance prediction of rainfall and to only one farmer for 2-3 days’ advance prediction
of rainfall. Cell phone is also emerging as an important source of information but it was utilized by
only 2 farmers for getting this information.
Thirty-six percent of farm households receiving 2-3 month advance rainfall prediction received advice
along with the prediction, and 82% of them utilized the advice in changing land management
practices. Nine percent of households adjusted the timing of farming activities and 9% of households
used the advice in changing the crop for cultivation. A smaller proportion of households (29%)
receiving forecasts for rainfall in 2-3 days got advice also along with prediction, and 89% of them
utilized it for changing farming practices. Important change include timing of farming activities
(21%), irrigation and water management (14%), change in input use (14%), and land management
(25%).
Table 8.5 Sources of information on 2-3 months and 2-3 days’ advance prediction
Source of information on
start of the rains
% of responses
2-3 months
forecast
% of responses
2-3 days forecast
Radio - 4
Television 90 94
Government agricultural or
veterinary extension
7 2
Newspaper 10 10
Cell phones 7 4
Own observation - 2
8.3 Discussion
It may be inferred that the majority of surveyed households have access to information about forecasts
of diseases and pests outbreak in Karnal and obtain information mainly from television, friends and
relatives, and newspaper. Television is also the main source of information for weather forecasts,
particularly for rainfall in 2-3 months and 2-3 days. There is no visible presence of government
departments in disseminating weather related information in Karnal site. Farmers are able to change
their farming practices due to weather forecasts and advice.
9.0 Community Groups
In the rural areas, farmers form groups for collaborative efforts on production, marketing, saving and
credit, and water use. These groups can take several forms: production groups, marketing groups,
cooperatives, water user groups and others. There are few farmers groups in the Karnal site, and
membership among surveyed households is low (Table 9.1). The Primary Agricultural Cooperative
Credit Society, Agricultural Marketing Group and Productivity Enhancement Group are important
and vibrant community groups in the area. Only one quarter of surveyed households have members
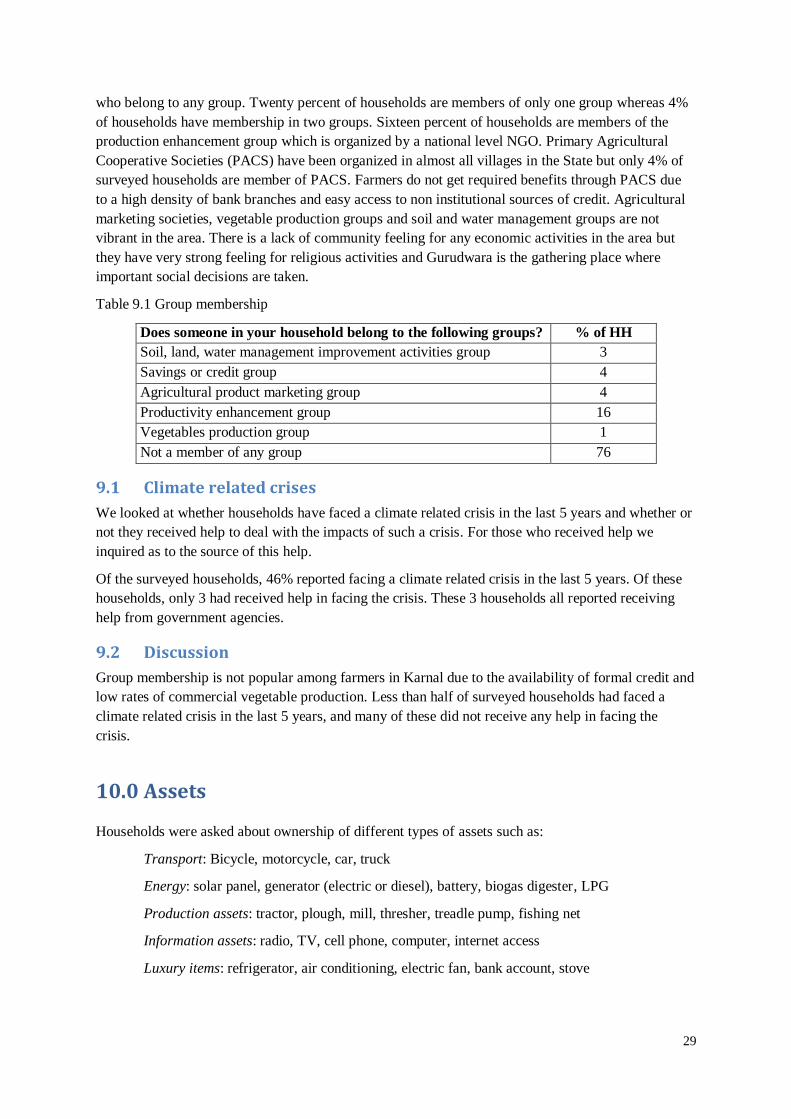
29
who belong to any group. Twenty percent of households are members of only one group whereas 4%
of households have membership in two groups. Sixteen percent of households are members of the
production enhancement group which is organized by a national level NGO. Primary Agricultural
Cooperative Societies (PACS) have been organized in almost all villages in the State but only 4% of
surveyed households are member of PACS. Farmers do not get required benefits through PACS due
to a high density of bank branches and easy access to non institutional sources of credit. Agricultural
marketing societies, vegetable production groups and soil and water management groups are not
vibrant in the area. There is a lack of community feeling for any economic activities in the area but
they have very strong feeling for religious activities and Gurudwara is the gathering place where
important social decisions are taken.
Table 9.1 Group membership
Does someone in your household belong to the following groups? % of HH
Soil, land, water management improvement activities group 3
Savings or credit group 4
Agricultural product marketing group 4
Productivity enhancement group 16
Vegetables production group 1
Not a member of any group 76
9.1 Climate related crises
We looked at whether households have faced a climate related crisis in the last 5 years and whether or
not they received help to deal with the impacts of such a crisis. For those who received help we
inquired as to the source of this help.
Of the surveyed households, 46% reported facing a climate related crisis in the last 5 years. Of these
households, only 3 had received help in facing the crisis. These 3 households all reported receiving
help from government agencies.
9.2 Discussion
Group membership is not popular among farmers in Karnal due to the availability of formal credit and
low rates of commercial vegetable production. Less than half of surveyed households had faced a
climate related crisis in the last 5 years, and many of these did not receive any help in facing the
crisis.
10.0 Assets
Households were asked about ownership of different types of assets such as:
Transport: Bicycle, motorcycle, car, truck
Energy: solar panel, generator (electric or diesel), battery, biogas digester, LPG
Production assets: tractor, plough, mill, thresher, treadle pump, fishing net
Information assets: radio, TV, cell phone, computer, internet access
Luxury items: refrigerator, air conditioning, electric fan, bank account, stove

30
The Karnal site is prosperous and the majority of households are asset rich. Ninety-six percent of
households own 4 or more assets. The majority of these households (90%) are high adopters of
modern agricultural technology.
The survey data reveal that 94% of households own transport assets, 82% own production assets, 86%
own energy assets, 99% possess information assets, and 97% have luxury assets. Eighty-two percent
of the households use a motorcycle as the primary means of transport, and 29% of surveyed
households own a car or truck. Bicycles are still a common mode of transport, owned by 66 % of
households. This mode of transport is used for small distances and is generally used by children. Only
8 surveyed households (6%) do not possess any transport assets (Table 10.1).
Table 10.1 Ownership of transport assets
Transportation assets No. of
responses
% of
households
Bicycle 92 66
Motorcycle 110 79
Car/truck 40 29
Among production assets, 47% of households own a tractor and 42% have a mechanical plough.
These assets are used for crop production purposes. Water pumps and treadle pumps are very
common in the area and 72% of households own this particular production asset. A thresher is another
production asset, owned by 16% of households. Mills are a production asset but they are generally
established for business purposes, hence only 4% of surveyed households own this asset. Nineteen
percent of households do not own any of the production assets listed (Table 10.2).
Table 10.2 Ownership of various production assets
Production assets % of households
Tractor 46
Mechanical plough 42
Mill 4
Water pump and treadle pump 72
Thresher 16
No assets in production category 19
Energy consumption is high in the area due to a high level of development and high per capita
income. Liquid propane gas (LPG) is used for cooking fuel, and it is possessed by 84% of surveyed
households. Battery (large, e.g. car battery) is the next important energy asset and is owned by 61% of
households. It is generally used for lighting purposes because the electricity supply is erratic for
domestic purposes. For the same reason, 21% of households own a generator. These households are
comparatively wealthy in their village. Solar panels and biogas digesters are not common energy
assets in the study area (Table 10.3).
Table 10.3 Ownership of various energy assets
Energy assets % of households
Solar panel 4
Generator 21
Battery(including inverter) 61
Biogas digester 4
LPG 84
No assets in energy category 14
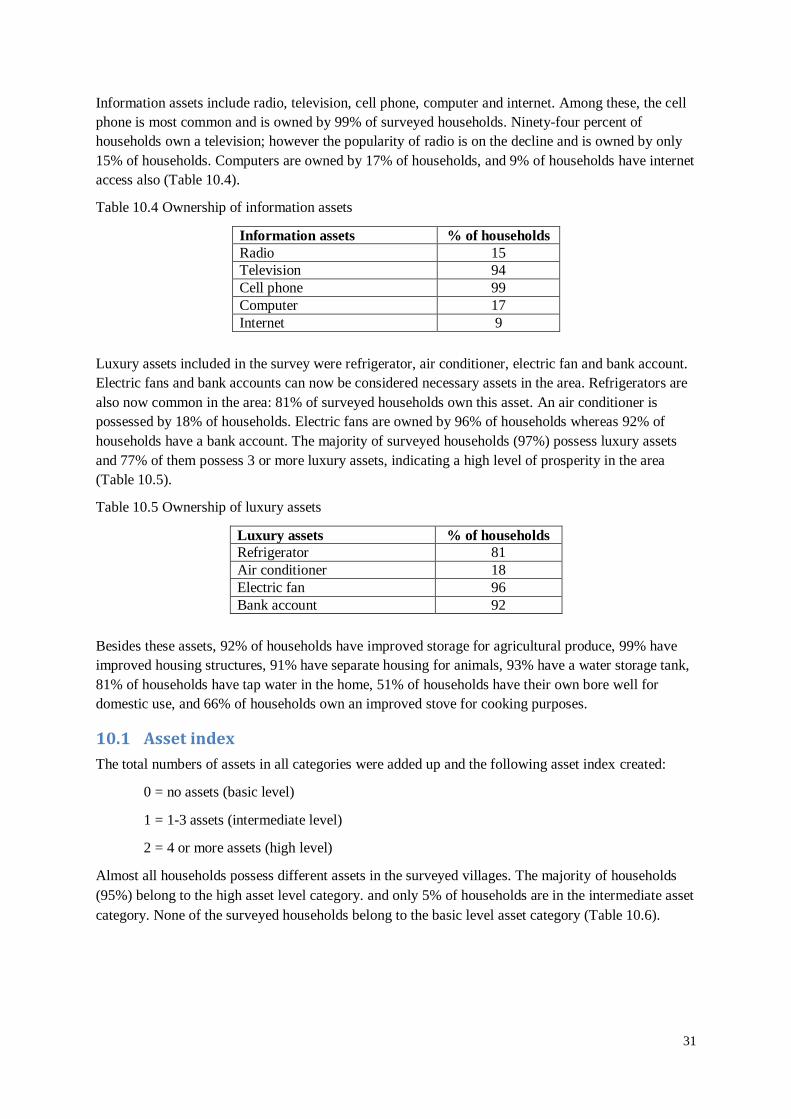
31
Information assets include radio, television, cell phone, computer and internet. Among these, the cell
phone is most common and is owned by 99% of surveyed households. Ninety-four percent of
households own a television; however the popularity of radio is on the decline and is owned by only
15% of households. Computers are owned by 17% of households, and 9% of households have internet
access also (Table 10.4).
Table 10.4 Ownership of information assets
Information assets % of households
Radio 15
Television 94
Cell phone 99
Computer 17
Internet 9
Luxury assets included in the survey were refrigerator, air conditioner, electric fan and bank account.
Electric fans and bank accounts can now be considered necessary assets in the area. Refrigerators are
also now common in the area: 81% of surveyed households own this asset. An air conditioner is
possessed by 18% of households. Electric fans are owned by 96% of households whereas 92% of
households have a bank account. The majority of surveyed households (97%) possess luxury assets
and 77% of them possess 3 or more luxury assets, indicating a high level of prosperity in the area
(Table 10.5).
Table 10.5 Ownership of luxury assets
Luxury assets % of households
Refrigerator 81
Air conditioner 18
Electric fan 96
Bank account 92
Besides these assets, 92% of households have improved storage for agricultural produce, 99% have
improved housing structures, 91% have separate housing for animals, 93% have a water storage tank,
81% of households have tap water in the home, 51% of households have their own bore well for
domestic use, and 66% of households own an improved stove for cooking purposes.
10.1 Asset index
The total numbers of assets in all categories were added up and the following asset index created:
0 = no assets (basic level)
1 = 1-3 assets (intermediate level)
2 = 4 or more assets (high level)
Almost all households possess different assets in the surveyed villages. The majority of households
(95%) belong to the high asset level category. and only 5% of households are in the intermediate asset
category. None of the surveyed households belong to the basic level asset category (Table 10.6).
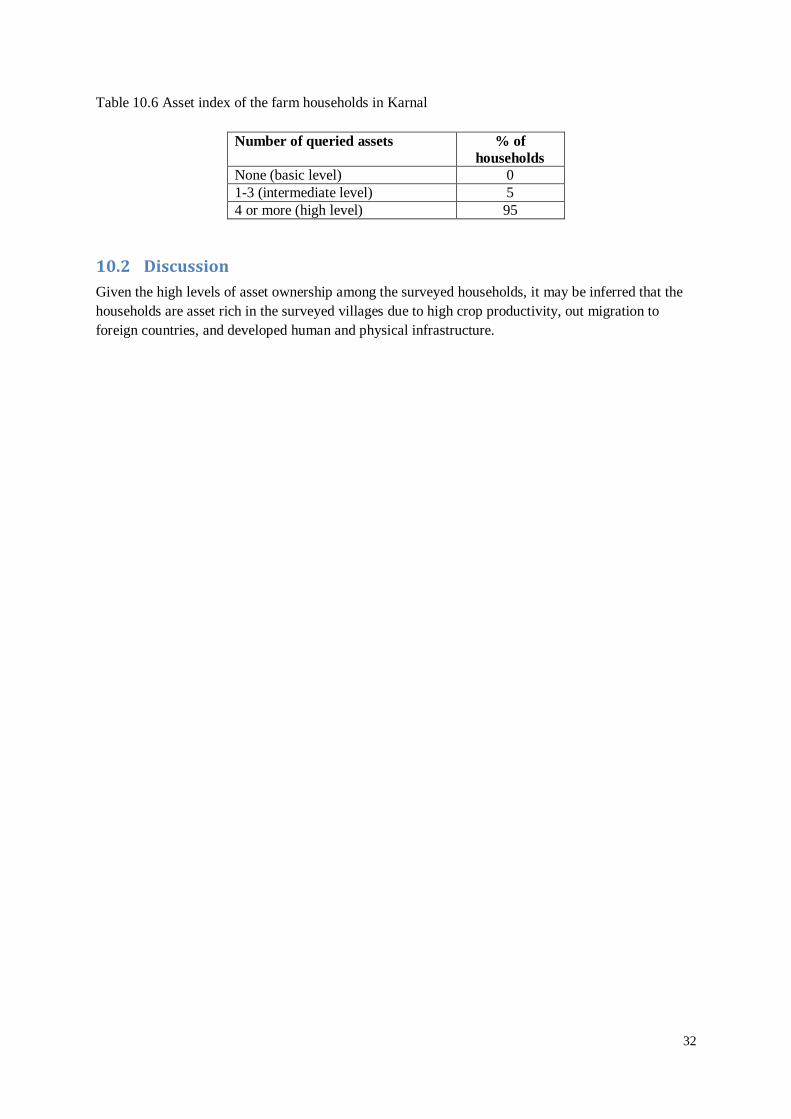
32
Table 10.6 Asset index of the farm households in Karnal
Number of queried assets % of
households
None (basic level) 0
1-3 (intermediate level) 5
4 or more (high level) 95
10.2 Discussion
Given the high levels of asset ownership among the surveyed households, it may be inferred that the
households are asset rich in the surveyed villages due to high crop productivity, out migration to
foreign countries, and developed human and physical infrastructure.

33
Appendix 1: List of villages in Karnal
(Villages in bold are the surveyed villages)
1. Pakhana
2. Ganger
3. Badeshpur
4. Shamgarh
5. Daudpur
6. Kurak
7. Padhana
8. Takhana
9. Sandir
10. Laliani
11. Taraori
12. Chopri
13. Rambha
14. Saidpur
15. Anjalithali
16. Bhainikhurd
17. Nilokheri
18. Shekanpura
19. Dudwa
20. Galibkheri
21. Jogimara
22. Gobindgarh
23. Kudak Jagir
24. Jhanjari Gaon
25. Kuraili
26. Rajgarh

34
Appendix 2: Study team members
R K P Singh-Team Leader
Manoj Kumar -Team Manager
Shashi Kumar-Supervisor
Vijay Narain Singh-Enumerator
Dhananjay Kumar-Enumerator
Rajesh Kumar—Enumerator
Vishal Kumar-Data Entry Operator
Julli -Data Entry Operator
Related Documents