~ . . . NASA p TI? x 'NASA Technical Paper 1389 . . - . . . .C . . I. , Summary of. Atmospheric ,' Wind' , Design Criteria ,..For .Wind Energy ,' , . . Conversion., System- ,Development' '- . - - -

Welcome message from author
This document is posted to help you gain knowledge. Please leave a comment to let me know what you think about it! Share it to your friends and learn new things together.
Transcript

~ . . .
NASA p TI?
x
'NASA Technical Paper 1389 . . - .
. . .C . .
I .
, Summary o f . Atmospheric
, '
Wind' ,
Design Criteria ,..For .Wind Energy , '
, . . Conversion., System- ,Development' ' - . - - -

"
NASA Technical Paper 1389
TECH LIBRARY KAFB. NM
Summary of Atmospheric Wind Design Criteria For Wind Energy Conversion System Development
Walter Frost The Utziversity of Tennessee Space Institute Tzdlahoma, Tennessee
and
Robert E. Turner George C. Marshall Space Flight Center Marshall Space Flight Center, Alabama
National Aeronautics and Space Administration
Scientific and Technical Information Office
OL34b75
1979

ACKNOWLEDGMENTS
A portion of this work was funded by the George C. Marshall Space Flight Center, Atmospheric Sciences Division under NASA contract NAS8-32118.
The authors have worked very closely with the personnel from NASA Lewis Research Center, Cleveland, Ohio, and have received from them many inputs and much sound advice. In particular, Bob Wolf, Harold Neustadter, and Dave Spera have contributed immensely to the final document. Review of the work with Bill Cliff, Chuck Elderkin, La r ry Wendell, Chris Doran, and others from Battelle Pacific Northwest Laboratories has added significantly to the handbook.
The initiation of the project by George Fichtl, NASA Marshall Space Flight Center , is appreciated.
The authors also wish to thankDonTeague, George Tennyson, and Carl Aspliden from the Wind Characteristics Program, Wind Energy Conversion Branch, Division of Solar Energy, Department of Energy, for their inputs. In particular, Don Teague's guidance has set the tenor of the engineering philosophy contained throughout the report.

TABLE OF CONTENTS
Chapter Page
1.0 INTRODUCTION ............................. 1
2.0 WINDSPEED ............................... 2
2.1 Extreme Wind Speed ....................... 2
2.1.1 Extreme Wind Speed at a Height of 10 m ... 2 2.1.2 Adjustment of Extreme Wind Speed for
Height .......................... 2 2.1.3 Adjustment for Time of Structural Response
to Gust .......................... 2
2.2 MeanWindSpeed ......................... 3
2.2.1 Annual Mean Wind Speed .............. 3 2.2.2 Adjustment of Annual Mean Wind Speed
with Height ....................... 3 2.2.3 Wind Speed Duration Curve ............ 3
3.0 MEAN WIND SPEED VERTICAL GRADIENT ........... 11
4.0 TURBULENCE .............................. 13
4.1 Spectral Model .......................... 13
4.1.1 Spectra ......................... 13 4.1.2 Turbulence Intensity ................. 14
4.2 Discrete Gust Model ....................... 14
4.2.1 Extreme Discrete Gust ............... 14
4.2.1.1 Shape of Longitudinal Extreme Discrete Gust .............. 14
4.2.1.2 Gust Period ............... 15 4.2.1.3 Extreme. Longitudinal Discrete
Gust Amplitude. W ........... 16 1
4.2.2 Cyclic. Discrete Gust Model ........... 16
4.2.2.1 Cyclic. Discrete Gust Shape .... 16 4.2.2.2 Cyclic. Discrete Gust
Amplitude ................. 17 4.2.2.3 Number of Cycles ........... 18
iii

TABLE OF CONTENTS (Concluded)
Chapter Page
5.0 WINDDIRECTION ............................ 33
5 . 1 Wind Direction Probability .................. 33 5.2 Wind Direction Fluctuations .................. 33
iv

L I S T OF ILLUSTRATIONS
Figure
2-1.
2-2.
2-3.
2-4.
2-5.
2-6.
3-1.
4-1.
4-2.
4-3.
4-4.
4-5.
4-6.
Title Page
Extreme wind speed based on risk of exceedance . . . . . . . . 5
Factor for adjusting extreme wind speed with height . . . . . 6
Adjustment factor for response time of structure . . . . . . . 7
Percent area of contiguous USA with annu9 mean wind speed equal to or greater than k Factor for adjusting annual mean wind speed with height. . . 9
h=lO m (wh=30 f t ) . . .... 8
Number of hours per year, T , wind speed is expected to be greater than W (wind speed duration curve) . . . . . . . . 10
Dimensionless vertical gradient in horizontal mean wind speed ..................................... 12
P
Dimensionless turbulence kinetic energy spectra. . . . . . . . 19
Turbulence intensity u -
W 'wh=10 m (dimensionless) . . . . . 20 CY
Period of gust 50-percent coherent over the horizontal distance, Aa = A x . . . . . . . . . . . . . . . . . . . . . . . . . . . 21
Period of gust 50-percent coherent over the lateral o r vertical distance, A a = Ay = A z . . . . . . . . . . . . . . . . . . 22
Factor for computing the discrete gust amplitude, W . = k k W , where k is given in Figure 4-9
and = 5 m s - * ......................... 23 1 5 6 h=10 m 6
h=10 m
Factor for computing the discrete gust amplitude, W . = k k F , where k is given in Figure 4-9
and wh=10 m
1 5 6 h=10 m 6 - = 1 0 m s - ~ .... .... .. .............. 24
V

LIST OF ILLUSTRATIONS (Continued)
Page Figure
4-7.
Title
Factor for computing the discrete gust amplitude, W . = k k E where k is given in Figure 4-9
and wh=10 m
1 5 6 h=10 m y 6 - = 1 5 m s - ........................ 25
Factor for computing the discrete gust amplitude, W . = k k E where k is given in Figure 4-9
1 5 6 h=10 m y 6 and 2 25111s- I . . . . . . . . . . . . . . . . . . . . . . . . h=10 m
Factor for adjusting towh . .. .. ...... .. . .. h=10 m
4-8.
26
27 4-9.
4-10. Probability density function of the discrete gust amplitude, W . . . . . . . . . . . . . . . . . . . . . . . . . . . .
ACY 28
Factor for estimating effective rms value, cr for cyclic gusts . . . . . . . . . . . . . . . . . . . . . . . . . . . . . . . . eff’ 4-11.
4-12.
29
Factor for calculating the number of times per year the wind speed exceeds the value W . . . . . . . . . . . . . . . . . ACY
30
Zero crossing factor . . . . . . . . . . . . . . . . . . . . . . . 31
32
4-13.
4-14.
5-1.
Scaling factor . . . . . . . . . . . . . . . . . . . . . . . . . . . . . . . Cumulative probability distribution of angular displacement of mean wind, h = 10 m . . . . . . . . . . . . . . . . . . . . . . . . . 34
5-2. Cumulative probability distribution of angular displacement of mean wind, h = 30 m . . . . . . . . . . . . . . . . . . . . . . . . . 35
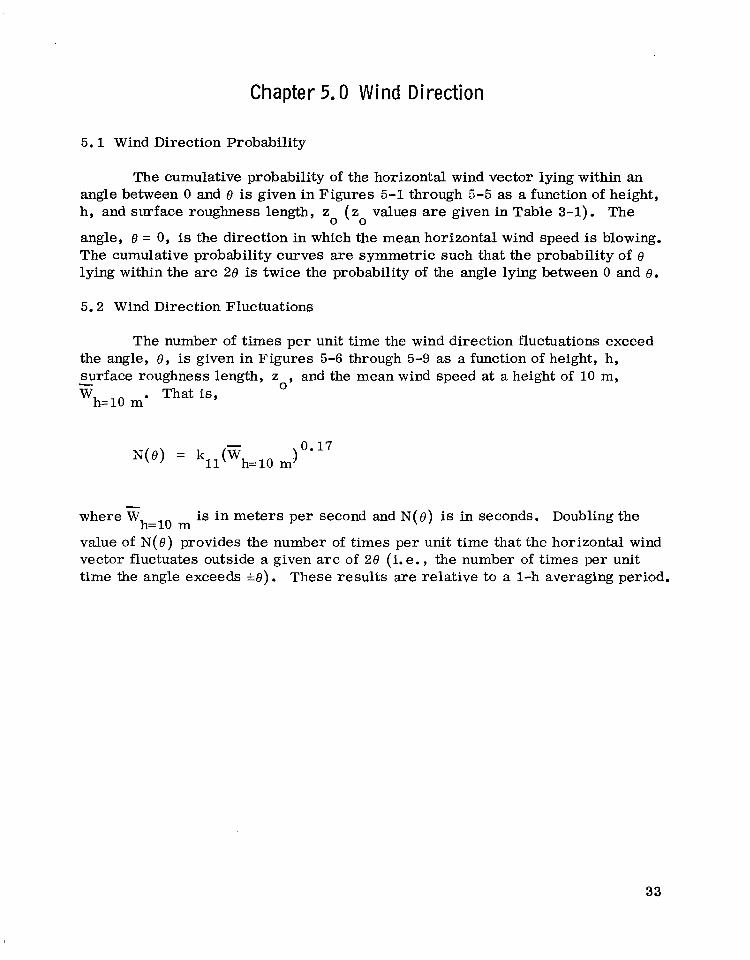
Cumulative probability distribution of angular displacement of mean wind, h = 50 m . . . . . . . . . . . . . . . . . . . . . . . . . 5-3.
36
Cumulative probability distribution of angular displacement of mean wind, h = 100 m . . . . . . . . . . . . . . . . . . . . . . 5-4.
37
vi

L I S T OF ILLUSTRATIONS (Concluded)
Figure Title Page
5-5. Cumulative probability distribution of angular displacement of mean wind, h = 150 m ........................ 38
5-6. Factor for computing the number of times per unit time the wind vector fluctuation exceeds the angle e measured from the direction of the mean wind vector, z =O.OOlm. . . ............................. 39
0
5-7. Factor for computing the number of times per unit time the wind vector fluctuation exceeds the angle e measured from the direction of the mean wind vector = 0.01 m . . 40 , zo
5-8. Factor for computing the number of times per unit time the wind vector fluctuation exceeds the angle e measured from the direction of the mean wind vector, z = 0.1 m . . . 0
41
5-9. Factor for computing the number of times per unit time the wind vector fluctuation exceeds the angle e measured from the direction of the mean wind vector, z = 1.0 m ... 0 42
vii

NOMENCLATURE
a
a Ci
m
A n
t
T
- wh
Effective gust rise time
Coherence function decay constant
Number of crossings per unit time of the dimensionless wind fluctuation fb
ACi
Number of crossings per unit time of the angle e
Height above natural grade
i = 1, 2, 3, . . . , adjustment factor in metric units
i = 1, 2, 3, . . . , adjustment factor in the engineering system of units
Number of standard deviations
Cyclic frequency
Time
Number of hours
Mean horizontal wind speed (averaging period from 10 min to 1 h) at height h
Peak wind speed
Instantaneous horizontal wind speed in excess of the mean; i.e., wG(t) = W ( t ) - Wh
-
Instantaneous wind speed
Wind speed averaged over the period T centered around the peak wind speed
viii

NOMENCLATURE (Continued)
wh
W P
wh c
'h
wAo,
wACY
W CY
X
MEAN
- WIND SPEED
Horizontal wind speed of arbitrary averaging period at height h
Prescribed value of horizontal wind speed
Extreme horizontal wind speed at height h
Effective discrete horizontal gust amplitude; W. = W(T) -
1 - wh
Annual mean horizontal wind speed at height h
Discrete gust amplitude in the direction CY relative to mean wind speed
Dimensionless gust amplitude klOQ WACY &h
Fluctuating component of wind speed, Le. W x = w ( t ) -
w = W y ( t ) , w = wz (t) X - wh, Y Z
Spatial coordinate in the longitudinal direction oriented along the horizontal mean wind vector
Y Spatial coordinate lateral to x
ix

NOMENCLATURE (Concluded)
z
z 0
Greek Symbols
a!
Aa!
t
77
%CY
e
U
U eff
V
7
Spatial coordinate vertical to x
Surface roughness length
Designates the quantity has directional dependence, i. e. , x, Y, or z
Spatial distance over which a gust is assumed coherent
Dimensionless time, t = t/-r
Reduced frequency, 77 = hfih
Reduced frequency characteristic scaling value
Direction of the horizontal wind vector ( e = 0 corresponds to the direction of the horizontal mean wind vector)
Turbulence intensity or r m s value of turbulent fluctuations
Turbulence intensity over a frequency gusts of length scale significant to the investigation, i.e. ,
A n max
CT eff = J uw (QdG
CY B min CY
range associated with problem under
Ratio of W to the effect turbulence intensity ~7 ACY eff
Gust period
Spectral density of turbulence kinetic energy associated with the w fluctuating wind component
CY
X

TECHNICAL PAPER-1389
SUMMARY OF ATMOSPHERIC WIND DESIGN CRITERIA FOR W I N D ENERGY CONVERSION SYSTEM DEVELOPMENT
Chapter 1.0 Introduction
A highly condensed version of Chapters 2 through 5 on wind characteris- tics from the "Engineering Handbook on the Atmospheric Environmental Guide- lines for U s e in Wind Turbine Generator Development, ? ? NASA TP-1359, is presented in this report. Basic design values of the most significant wind criteria are presented in graphical format. The design values are given without discussion of the physical processes involved o r of the analytical methods used to develop the design curves. For these details the reader should consult the previously mentioned engineering handbook.

Chapter ?. 0 Wind Speed
2.1 Extreme Wind Speed
2.1.1 Extreme Wind Speed at a Height of 10 m
The extreme wind speed at a height of 10 m, ,w
h=lOm (Wk30 ft) 3 is given by Figure 2-1 in terms of r i sk of exceedance. The engineer must select the degree of risk he is willing to accept that the extreme wind speed designed for will be exceeded at least once during the expected life of a Wind Turbine Generator (WTG) . The degree of r i sk conventionally used ranges from aero- space values of 10 percent for an expected life of 25 years to building code values of 63 percent for an expected life of 50 years.
2.1.2 Adjustment of Extreme Wind Speed for Height
The value of wind speed selected from Figure 2-1 is adjusted for height, h, by the adjustment factor, k (k' ), given in Figure 2-2, i. e.,
1 1
i@ = k c h 1 h=10 m 1 h=30 f t ) ( k ' %'
where
% = extreme wind speed at height h h
kl = adjustment factor for height h.
2.1.3 Adjustment for Time of Structural Response to Gust
The extreme wind speed, adjusted for height as described in Section 2.1.2, is further adjusted for the response time of the structure by multiplying by the factor k (k' ) given in Figure 2-3. The adjustment factor is a function
of the extreme wind at height h as determined from Sections 2.1.1 and 2.1.2. 2 2
Three categories based on structure size are specified in this regard:
2

Category a - Structures o r structural components of 20 m (65 ft) or less in extent in any dimension.
Category b - Structures o r structural components larger than 20 m (65 ft) but for which neither the greatest lateral nor vertical dimension exceeds 50 m ( 165 f t ) .
Category c - All structures larger than those in Category b; for Category c, k = 1.0 (k’ = 1.0). 2 2
2.2 Mean Wind Speed
2.2.1 Annual Mean Wind Speed
The approximate areal distribution over the contiguous United States of annual mean wind speed equal to o r greater than $ in Figure 2-4. The designer should select the design value of annual mean wind speed from this curve based on the percentage of the area of the country to which he anticipates sale of the WTG.
h=10 m (‘h=30 f t ) is given
2.2.2 Adjustment of Annual Mean Wind Speed with Height
The adjustment of annual mean wind speed with height is achieved by multiplying the wind speed determined in Section 2.2.1 with the adjustment factor k ( k ’ ) given in Figure 2-5, i.e., 3 3
Gh = k 6 A
3 h=10 m (“iwh=30 ft )
where
Wh = annual mean wind speed at height h A
k = adjustment factor for height h. 3
2.2.3 Wind Speed Duration Curve
The number of hours, T, for which the wind speed, W is expected to be h’
equal to or exceed a prescribed value, W is estimated by PY
3

T = 8766 e-[-n(W /2Wh) . A 2 P (2.3)
Any unit2 can be employed for the wind speed provided they are consistent for W and Wh, respectively. A plot of the wind speed duration curve is given in
Figure 2-6. P
4

RISK OF EXCEEDANCE (%I
Figure 2-1. Extreme wind speed based on risk of exceedance.
90
80
40

HEIGHT, h ( r n )
2 5 10 50 100
HEIGHT, h (ftt)
500 800
Figure 2-2. Factor for adjusting extreme wind speed with height.
6

10 20 100 200 1.36
1.32
1.28
1.24
1.2a
1.16
1 .li
1 .OE 10
T
T 1
I I
CATEGORY a
CATEGORY b
TI n i I I
Figure 2-3.
20 50
(rnph)
100 200
Adjustment factor for response time of structure.
7

5.1
5.l
5.r
5.;
5s
7 In 4.E
I E E
4.f II
< s= 4.4
4.2
4.0
3.8
3.6
3.4
3.2 0 10 20 30 40 50 60 70 80 90 100
AREA (%I
- 13.0
- 12.5
- 12.0
- 11.5
- 11.0
- 10.5
- 10.0
- 9.5 <
- 9.0
- 8.5
- 8.0
Figure 2-4. Percent area of contiguouf USA withAannual mean wind speed equal to or greater than W h=10 m (wh=30 f t > *
8

v) v)
w
Figure 2-5. Factor for adjusting annual mean wind speed with height.

TIME, T (h)
Figure 2-6. Number of hours per year, T, wind speed is expected to be greater than W (wind speed duration curve).
P

Chapter 3.0 Mean Wind Speed Ver t i ca l Grad ien t
The variation of horizontal, mean wind speed with height, A= /Ah, is
presented in Figure 3-1. The wind shear is expressed in dimensionless form (hfih) A E /Ah and is given as a function of height made dimensionless with
surface roughness length, z . Typical values of surface roughness length are given in Table 3-1.
h
h
0
TABLE 3-1. TYPICAL VALUES OF SURFACE ROUGHNESS LENGTH
Sea or large bodies of water
Open country with no obstructions
Open country with scattered windbreaks
Country with many windbreaks, small towns, outskirts of large cities
Surfaces with large and frequent obstructions (e. g. , city centers)
Surface Roughness Length, z 0
10-~ - 10-4
3 x 10⁻² - 3 x 10⁻¹ 10-2 - 10-1
3 x 10⁻⁴ - 3 x 1 0 - 2 - 10-2
3 X 10⁻⁵ - 3 x 10⁻⁴
10-1 - 1 3 x 10⁻¹ - 3
1 - 4 3 N 13
11

101
htz,
102
htz 0
Figure 3-1. Dimensionless vertical gradient in horizontal mean wind speed.

Chapter 4.0 Turbulence
4.1 Spectral Model
4 . 1 . 1 Spectra
The turbulence kinetic energy spectral densities for the atmospheric boundary layer (to elevations of 150 m) recommended for WTG design are:
Longitudinal
12.3 % hlPn( 1O/z + 1) In(h/z + I)] -' 6 (n\ = A h=lO m 0 0
w '"I X 1 + 192 [hhn( lO/z + 1)m In(h/z -t- 1) ] 5/3
0 h=10 m 0
Lateral
4.0% h [ l n ( 10/zo + 1) Pn(h/z + 1) ] -' A
q w ( 4 = h=10 m 0
Y 1 + 70 [ h h n ( 1O/z + 1) / i $ Pn(h/zo + l ) ] 5/3 0 h=10 m
Vertical
0 . 5 % hlPn(lO/zo + 1) Bn(h/z + 1 ) I - l A Pw ( 4 =
h=lO m 0 (4 .1)
Z 1 + 8[hhn(10/z + 1) /vh=lo Pn(h/z + 1) ] 5/3 0 0
where
@W (2) = spectral density distribution of turbulence kinetic energy
CY
CY = designates either x, y, or z component of the fluctuation w
n = frequency in cycles per second, Hz A
13

- wh=10 m = horizontal mean wind speed at h = 10 m
h = height above natural grade
z = surface roughness length (typical values of surface roughness 0 length, zo, are given in Table 3-1).
The terms h, z and are expressed in meters and meters per second,
respectively. The units for $ are then meters square per second. The sub-
scripts w , w , and w refer to the longitudinal, lateral, and vertical wind speed,
Wh. The coordinate system (x, y, z) is chosen with the x-axis oriented along
the mean wind direction which is assumed to lie in a plane parallel to the Earth’s surf ace.
0’ h=10 m
W CY
- X Y Z
A plot of the turbulence kinetic energy spectra in dimensionless coordi- nates is given in Figure 4-1. In dimensionless coordinates, the spectra for all three wind speed fluctuations lie on the same curve.
4 . 1 . 2 Turbulence Intensity ( rms Value)
The recommended value of turbulence intensity, (T , is given by W
CY
(T = k4 W W
CY CY h=lO m
where k is given in Figure 4-2 as a function of surface roughness, z and
height, h.
4 0’ CY
4 . 2 Discrete Gust Model
4 . 2 . 1 Extreme Discrete Gust
4 . 2 . 1 . 1 Shape of Longitudinal Extreme Discrete Gus t
The extreme, longitudinal discrete gust shape recommended for design is given by
14

where
t; = t /T ; a = 0 . 1 2 + 0 . 0 5 I n h
and
wG(t;) = instantaneous horizontal wind speed fluctuation about the mean, i .e., wG(t;) = ~ ( t ; ) -Eh
W. = the effective average horizontal, discrete gust amplitude, i.e. , 1 w. = W ( T ) - wh -
1
W ( T ) = the average over the period T of the wind speed centered around the peak wind speed
t = time
T = period of gust
h = height
a = effective gust rise time.
4.2.1.2 Gust Period
The recommended period of the gust in seconds, T, is given in Figures 4-3 and 4-4. The period T is expressed as a function of the spatial distance, A a , over which the gust is 50-percent coherent (i. e., the spatial distance over which the gust is estimated to be effectively uniform or the distance it would engulf). Figure 4-3 gives the period of a gust effectively coherent over a hori- zontal distance, A a = Ax, and Figure 4-4 gives the period of a gust effectively coherent over either the lateral or the vertical distance, A a = A y = A z, whichever is of interest.
15

4.2.1.3 Extreme, Longitudinal Discrete Gust Amplitude, W. 1
Values of W. are computed from W = k w where k is given in Figures 1 i 5 h 5
4-5 through 4-8 as a function of height, h, period, T , and mean wind speed at the 10-m level, W The value W . represents the three standard deviation
value ( 9 9 percentile). That is, there is only an approximate 1-percent chance that W. will be greater than the value given in Figures 4-5 through 4-8. The
value of b? is computed from h given on the respective figure by the
relationship
h=10 m e 1
1
h=10 m
- - W h = k W
6 h=10 m (4- 3)
where k which is a function of z and h, is determined from Figure 4-9. Thus 6’ 0
W. = k k W 1 5 6 h=10 m
4.2.2 Cyclic, Discrete Gust Model
4.2.2.1 Cyclic, Discrete G u s t Shape
The conventional shape used for a cyclic, discrete gust is:
wGCi ( q ) = w ( 1 - c o s 2 n 5 ) ; 0 1 t; 5 1
AG! (4.4)
where
16

and
T = period of gust
wACY = gust amplitude relative to the mean wind speed in the direction CY
= instantaneous wind speed relative to the mean wind speed in the
G x Gz andW ( 5 ) = W Y ( S ) .
GY
In applying Equation 4.4 the value of T is determined from either Figure 4-3 or 4-4.
4.2.2.2 Cyclic, Discrete Gust Amplitude
The recommended discrete gust amplitude is
WACY - - vk k k (& CY 6 7 h=10 m > *
This value of W represents the gust amplitude average over a year based on
a Rayleigh distribution of wind speed, and v is the ratio W
v is selected by the designer and effectively corresponds to the number of stand- ard deviations represented by the imposed gust amplitude W . The distribution of W is given by the probability density function
A 0
ACY 'Oeff' The value of
ACY ACY
2e-( u2/2) O* ) = 0.441 u W A ~ p ( w A a
A plot of Equation 4.6 is given in Figure 4-10.
Values of k4, , k , and k are given in Figures 4-2, 4-9, and 4-11,
respectively. The expression on the abscissa of Figure 4-11 is a dimensionless quantity. The value of a is 4.5 if CY = x and 7.5 if CY = z or y; A CY is the
distance over which the gust is 50-percent correlated, and vo, is given in
6 7
CY
17

the insert. To complete the definition, a set of discrete gusts of period T is selected according to the following criteria: Let T~ ( W ) be the most probable
period of gust with amplitude W . In Figures 4-5 through 4-8 relationships Aa a r e proposed which relate gust period and gust amplitude. Then
A 0
A T n S ~ / T s n A
0' min 0 max
where n̂ and fi are obtained from known o r assumed response character-
ist ics of the specific wind turbine. The effects of these discrete gusts on a given wind turbine are then predicted by means of a deterministic aero-structural dynamic model. In this way a statistical description of the wind turbine loads is obtained from the statistical description of the wind.
max min
4 . 2 . 2 . 3 Number of Cycles
The number of cycles in wind speed which exceed the gust amplitude,
Aa ( A a , h) , in a given year's exposure to winds having a Rayleigh distribution
is determined from Figures 4-12 and 4-13 by W (the annual mean wind speed at
height h) and Aa (the longitudinal, lateral, o r vertical spatial extent of the gust, i. e. , a gust of size large enough that it is expected to engulf a distance A a ) . Values of k are given in Figure 4-14.
A
h
100
18

1 .o
0.5
0.1
0.05
0.01 0.1 0.5 1 5 10 50 100
A - " 770,
Figure 4-1. Dimensionless turbulence kinetic energy spectra.

zo (m 1
Figure 4-2. Turbulence intensity cr /E w h=10 m (dimensionless).
CY

1000
500
100
50
10
5
1 1 5 10 50 100 300
SPATIAL DISTANCE, Aa (m)
Figure 4-3. Period of gust 50-percent coherent over the horizontal distance, ha, = Ax.
21

1 5 10 50 100 300
SPATIAL DISTANCE, Acu (m)
Figure 4-4. Period of gust 50-percent coherent over the lateral or vertical distance, Acu = A y = Az.
22

3.0
2.5
- v) v) w J z 2 .o 0
z n
v ) 2 w
- Y
Ln
1.5
1 .o
0.5
5 10 50 100
HEIGHT, h (m)
Figure 4-5. Factor for computing the discrete gust amplitude, W . = k k W where k is given in Figure 4-9
1 5 6 h=10 my 6
300
23

1.6
1.4
1.2
1 .o
0.8
0.6
0.4
!
. .! ..-. 1...J...J..:J - . - . . . ; . _ . . - . . . . I 2 1 .... I .... l....! .... !.._; . . . ,...._ * * A + - . I
10 50 100
HEIGHT, h (m)
300
Figure 4-6. Factor for computing the discrete gust amplitude, W . = k k W where k is given in Figure 4-9
1 5 6 h=10 m y 6 and w = 10 m s-l. h=10 m
24

Figure 4-7. Factor for computing the discrete gust amplitude, W . = k k F , where k is given in Figure 4-9
1 5 6 h=10 m 6 - and wh=10 m = 15 m s-*.
25

0.7
0.6
0.5
0.4
0.3
0.2
0.1 .5 10 50 100
HEIGHT, h (m)
Figure 4-8. Factor for computing the discrete gust amplitude, W . = k k W where k is given in Figure 4-9
1 5 6 h=10 m y 6 and =- 25 m s-I. h=lO m -
300
26

1 5 10 50 100 300
HEIGHT, h (m)
Figure 4-9. Factor for adjusting! -
h=10 m to Wh.

Figure 4-10. Probability density function of the discrete gust amplitude, W . AQI

h3 W

A A
WAa = klOaWAcrMlh
Figure 4-12. Factor for calculating the number of times per year the wind speed exceeds the value W . A
ACY
30

10-2
I o7
106
10-1
qox = 0.0144, a, = 4.5 ?ley = 0.0265, a = 7.5 q,, = 0.0962, a, = 7.5
Y
"
lo4 1 o5
1 I 09
108
107
106
a&a(rl,,)/h
F lgure 4-13. Zero crossing factor.
31

w tw
r
SURFACE ROUGHNESS LENGTH, zo (m)
Figure 4-14. Scaling factor.
Chapter 5.0 Wind Direction
5.1 Wind Direction Probability
The cumulative probability of the horizontal wind vector lying within an angle between 0 and e is given in Figures 5-1 through 5-5 as a function of height, h, and surface roughness length, z ( z values are given in Table 3-1). The
angle, e = 0, is the direction in which the mean horizontal wind speed is blowing. The cumulative probability curves are symmetric such that the probability of e lying within the arc 28 is twice the probability of the angle lying between 0 and e.
0 0
5.2 Wind Direction Fluctuations
The number of times per unit time the wind direction fluctuations exceed the angle, e , is given in Figures 5-6 through 5-9 as a function of height, h, L surface roughness length, z and the mean wind speed at a height of 10 m, W . That is, 0’
h=10 m
where is in meters per second and N( e ) is in seconds. Doubling the
value of N ( 0 ) provides the number of times per unit time that the horizontal wind vector fluctuates outside a given arc of 28 (i. e., the number of times per unit time the angle exceeds A€)). These results are relative to a 1-h averaging period.
h=10 m
33

1 2 5 10 20 30 40 50 60 70
PROBABILITY (%I
Figure 5-1. Cumulative probability distribution of angular displacement of mean wind, h = 10 m.
34

100
50
10
5
1 .o 1 2 5 10 20 30 40 50 60 70
PROBABILITY (%I
Figure 5-2. Cumulative probability distribution of angular displacement of mean wind, h = 30 m.
35
1 2 5 10 20 30 40 50 60 70
PROBABI LlTY 4%)
Figure 5-3. Cumulative probability distribution of angular displacement of mean wind, h = 50 m.
36

100
50
5
1 .o 1 2 5 10 20 30 40 50 60 70
PROBABILITY (%)
Figure 5-4. Cumulative probability distribution of angular displacement of mean wind, h = 100 m.
37

1 2 5 10 20 30 40 50 60 70
PROBABI LlTY (%I
Figure 5-5. Cumulative probability distribution of angular displacement of mean wind, h = 150 m.
38

10 15
0 (deg)
20 25 30
Figure 5-6. Factor for computing the number of times per unit time the wind vector fluctuation exceeds the angle e measured from the direction
of the mean wind vector, z = 0.001 m. 0
39

Figure 5-7. Factor for computing the number of times per unit time the wind vector fluctuation exceeds the angle 8 measured from the direction
of the mean wind vector, z = 0.01 m. 0
40

~ i g w e 5-8. Factor for computing the number of times per unit time the wind vector fluctuation exceeds the angle e measured from the direction
of the mean wind vector, z = 0 .1 m. 0
41

Figure 5-9. Factor for computing the number of times per unit time the wind vector fluctuation exceeds the angle 8 measured from the direction
of the mean wind vector, z = 1.0 m. 0
42

1. REPORT NO. 2. GOVERNMENT ACCESSION NO. 3. RECIPIENT'S CATALOG NO.
NASA TP-1389 4 T I T L E AND SUBTITLE 15. REPORT DATE
Summary of Atmospheric Wind Design Criteria for Wind Energy Conversion System Development
January 1979 6. PERFORMING ORGANIZATION CODE
7 . AUTHOR(S) 8. PERFORMING ORGANIZATION REPORT R Walter Frost* and Robert E. Turner
~
9. PERFORMING ORGANIZATION NAME AND ADDRESS 10. WORK UNIT NO.
George C. Marshall Space Flight Center Marshall Space Flight Center, Alabama 35812
"280 1 1. CONTRACT OR GRANT NO.
13. TYPE OF REPORT & PERIOD COVEREC ~.
12. SPONSORING AGENCY NAME AND ADDRESS
National Aeronautics and Space Administration Washington, D.C. 20546
Technical Paper
15. SUPPLEMENTARY NOTES
Prepared by Space Sciences Laboratory, Science and Engineering
* The University of Tennessee Space Institute, Tullahoma, Tennessee 37388 16. ABSTRACT
This report presents basic design values of significant wind criteria, in graphical format, for use in the design and development of wind turbine generators for energy research. It is a condensed version of portions of the "Engineering Handbook on the Atmospheric Environmental Guidelines for Use in Wind Turbine Generator Development,"
17. KEY WORDS
19. SECURITY CLASSIF. (of t h h rwartt) 20. SECURITY CLASS
Unclassified $4.50 54 Unclassified 0
MSFC - Form 3 2 9 2 (Rev December 1 9 7 2 ) For sale by National Technical Infornration Service, Springfield, Virginia 22 1 5 1
18. DISTRIBUTION STATEMENT
Category: 15 and 47
IF. (of thlm page) 121. NO. OF PAGES 122. PRICE
NASA-Langley. 1978

I l l 1 I
National Aeronautics, and THIRD-CLASS BULK RATE Space Administration
Washington, D.C. 20546
Postage and Fees Paid National Aeronautics and
NASA451 Space Administration
, - ,
, . ~
Official
Penalty
Business for Private Us 16 1 1IJ,E, 121878 S-00903I)S
DEPT OF THE AIR FORCE AF WEAPONS LABORATORY
RIRTLAND AFB NB 871 17 . a ~ m : TECHNICAL LIBRARY (SUL)
- 1
Related Documents