Summarizing Specific Profiles in Illumina Sequencing from Whole-Genome Amplified DNA ISHENG J. Tsai 1,2,† ,MARTIN Hunt 1,† ,NANCY Holroyd 1 ,THOMAS Huckvale 1 ,MATTHEW Berriman 1 , and T AISEI Kikuchi 1,2, * Parasite Genomics, Wellcome Trust Sanger Institute, Wellcome Trust Genome Campus, Cambridge CB10 1SA, UK 1 and Faculty of Medicine, Division of Parasitology, Department of Infectious Disease, University of Miyazaki, Miyazaki 889- 1692, Japan 2 *To whom correspondence should be addressed. Tel. þ81 985850990. Fax. þ81 985843887. Email: [email protected] Edited by Prof. Masahira Hattori (Received 23 August 2013; accepted 5 November 2013) Abstract Advances in both high-throughput sequencing and whole-genome amplification (WGA) protocols have allowed genomesto be sequenced from femtograms of DNA, forexample from individual cells or from precious clinical and archived samples. Using the highly curated Caenorhabditis elegans genome as a reference, we have sequenced and identified errors and biases associated with Illumina library construction, library insert size, different WGA methods and genome features such as GC bias and simple repeat content. Detailed analysis of the reads from amplified libraries revealed characteristics suggesting that majority of amplified fragment ends are identical but inverted versions of each other. Read coverage in amplified libraries is correlated with both tandem and inverted repeat content, while GC content only influences sequencing in long-insert libraries. Nevertheless, single nucleotide polymorphism (SNP) calls and assembly metrics from reads in amplified li- braries show comparable results with unamplified libraries. To utilize the full potential of WGA to reveal the real biological interest, this article highlights the importance of recognizing additional sources of errors from amplified sequence reads and discusses the potential implications in downstream analyses. Key words: whole-genome amplification; Illumina; SNPs; genome assembly; chimeric DNA 1. Introduction The use of genomic data generated by so-called ‘next generation sequencing’ (NGS) has become common- place in many fields of biological research, with sequen- cing-by-synthesis from Illumina currently the most popular. A standard Illumina paired-end (PE) library is made from DNA templates of about 500 bp in length, and a sequencing run can generate billions of paired reads of length 37–250 bp from either ends of these fragments. 1 Reads from longer fragments of DNA can also be produced to aid the deconvolution of repetitive regions and for identifying large structural variations in genomes. A specialized mate-pair (MP) library, con- structed by introducing a circularization step at the start of the library preparation, allows end sequencing from fragments of at least 2 kb. 2 – 4 This powerful tech- nology can be applied to address a wide range of bio- logical questions, such as variant calling and resolving haplotypes between individuals of a population or de novo assembly of complex genomes. Advancement in library preparation also permits their creation from just a few nanograms of DNA. 5 Nevertheless, obtaining even nanograms of starting material can be challenging in certain applications. One solution isto pool many samples to obtain sufficient † The authors wish it to be known that, in their opinion, the first two authors should be regarded as joint First Authors. # The Author 2013. Published by Oxford University Press on behalf of Kazusa DNA Research Institute. This is an Open Access article distributed under the terms of the Creative Commons Attribution License (http://creativecommons.org/licenses/by/3.0/), which permits unrestricted reuse, distribution, and reproduction in any medium, provided the original work is properly cited. DNA RESEARCH 21, 243–254, (2014) doi:10.1093/dnares/dst054 Advance Access publication on 18 December 2013

Welcome message from author
This document is posted to help you gain knowledge. Please leave a comment to let me know what you think about it! Share it to your friends and learn new things together.
Transcript

Summarizing Specific Profiles in Illumina Sequencing fromWhole-Genome Amplified DNA
ISHENG J. Tsai1,2,†, MARTIN Hunt1,†, NANCY Holroyd1, THOMAS Huckvale1, MATTHEW Berriman1,and TAISEI Kikuchi1,2,*
Parasite Genomics, Wellcome Trust Sanger Institute, Wellcome Trust Genome Campus, Cambridge CB10 1SA, UK1 andFaculty of Medicine, Division of Parasitology, Department of Infectious Disease, University of Miyazaki, Miyazaki 889-1692, Japan2
*To whom correspondence should be addressed. Tel. þ81 985850990. Fax. þ81 985843887.Email: [email protected]
Edited by Prof. Masahira Hattori(Received 23 August 2013; accepted 5 November 2013)
AbstractAdvances in both high-throughput sequencing and whole-genome amplification (WGA) protocols have
allowedgenomestobesequencedfromfemtogramsofDNA, forexamplefromindividualcellsor frompreciousclinical andarchived samples.Using thehighly curatedCaenorhabditis elegans genomeas a reference, we havesequenced and identified errors and biases associated with Illumina library construction, library insert size,different WGA methods and genome features such as GC bias and simple repeat content. Detailed analysis ofthereads fromamplified libraries revealedcharacteristics suggesting thatmajorityofamplified fragmentendsare identical but inverted versions of each other. Read coverage in amplified libraries is correlated with bothtandem and inverted repeat content, while GC content only influences sequencing in long-insert libraries.Nevertheless, single nucleotide polymorphism (SNP) calls and assembly metrics from reads in amplified li-braries show comparable results with unamplified libraries. To utilize the full potential of WGA to revealthe real biological interest, this article highlights the importance of recognizing additional sources of errorsfrom amplified sequence reads and discusses the potential implications in downstream analyses.Key words: whole-genome amplification; Illumina; SNPs; genome assembly; chimeric DNA
1. Introduction
The use of genomic data generated by so-called ‘nextgeneration sequencing’ (NGS) has become common-place in many fields of biological research, with sequen-cing-by-synthesis from Illumina currently the mostpopular. A standard Illumina paired-end (PE) library ismade from DNA templates of about 500 bp in length,and a sequencing run can generate billions of pairedreads of length 37–250 bp from either ends of thesefragments.1 Reads from longer fragments of DNA can
also be produced to aid the deconvolution of repetitiveregions and for identifying large structural variations ingenomes. A specialized mate-pair (MP) library, con-structed by introducing a circularization step at thestart of the library preparation, allows end sequencingfrom fragments of at least 2 kb.2–4 This powerful tech-nology can be applied to address a wide range of bio-logical questions, such as variant calling and resolvinghaplotypes between individuals of a population orde novo assembly of complex genomes.
Advancement in library preparation also permitstheir creation from just a few nanograms of DNA.5
Nevertheless, obtaining even nanograms of startingmaterial can be challenging in certain applications.Onesolutionistopoolmanysamplestoobtainsufficient
† The authors wish it to be known that, in theiropinion, thefirst twoauthors should be regarded as joint First Authors.
# The Author 2013. Published by Oxford University Press on behalf of Kazusa DNA Research Institute.This is an Open Access article distributed under the terms of the Creative Commons Attribution License (http://creativecommons.org/licenses/by/3.0/),which permits unrestricted reuse, distribution, and reproduction in any medium, provided the original work is properly cited.
DNA RESEARCH 21, 243–254, (2014) doi:10.1093/dnares/dst054Advance Access publication on 18 December 2013

DNA to construct one library. However, this approachis often not applicable to rare clinical or archivedsamples,6 and increases the complexity of downstreamanalysis. Within an assembly of pooled DNA samples, itcan be particularly challenging to distinguish variantsof a sequence that is repeated in the genome of oneindividual from allelic differences between multipleindividuals. This problem increases with the levels ofintraspecies variation, for instance, C. brenneri has14.1% of polymorphic synonymous sites between indi-viduals, comparable with hyperdiverse bacteria.7 A po-tential solution is to use whole-genome amplification(WGA) techniques to reduce the amount of DNArequired to make a sequencing library. Several WGA pro-tocols have been proposed8 and can be divided intothose based on polymerase change reaction (PCR) orthose involving multiple stranddisplacementamplifica-tion (MDA). PCR-based techniques such as degenerateoligonucleotide primed PCR9 and primer extensionPCR10 can produce non-specific amplification artefactsand typically short-amplification products.11 MDA usesthe strand-displacing DNA polymerase from Phi29 bac-teriophage and has several advantages over PCR-basedprotocols. For example, MDA can generate long-ampli-fied fragments up to 100 kb, which are of feasible sizeto serve as templates from which MP libraries can besynthesized.8 An alternative method of amplifica-tion called pWGA (primase-based WGA)12 is based onin vitro reconstruction of the naturally existing cellularDNA replication machinery found in bacteriophageT7, and comparable performance with MDA in termsof efficiency and unbiased amplification has beenreported.12 WGA techniques have already been regular-ly used in genotyping bacteria,13 other small organ-isms14 and human cells.15 Though still in its infancy,sequencing from single cells is now feasible using WGAand this opens up a new field of exploring heterogeneitywithin populations, or populations of cells in an organ-ism or tissue, an ultimate goal for many geneticistsand molecular biologists.
Despite the advances in WGA methods, preferentialamplification of certain DNA fragments still exists,16
resulting in uneven sequencing between differentparts of a given genome and chimera formation.17 Inthis article we describe the effect of amplifying nano-grams of genomic DNA, which is usually the availablestarting material of a de novo small eukaryote genomeproject, with three different protocols before construct-ing Illumina short- and long-insert libraries. Using thehigh quality genome sequence of C. elegans as a refer-ence, we show that GC content and composition ofinverted and tandem repeats play a major role in thevariation of read coverage. We demonstrate that readssequenced from amplified DNA can generate de novoassemblies that are of comparable quality with thosefrom unamplified DNA. In addition, we have also
examined capillary reads from libraries cloned fromamplified high molecular weight DNA of the potatocyst nematode Globodera pallida genome project. Asthe research focus is turning to more unexplored organ-isms and single cells, WGA protocols will become thestandard method of choice. Understanding thecaveats and biases generated with these protocols is aparamount requirement for interpretation of results.
2. Materials and methods
2.1. Whole-genome amplificationGenomic DNAwas extracted from �10 000 C. elegans
N2 nematodes using Genomic tip G20 (Qiagen)according to the manufacturer’s instructions. Tennanograms of template DNA was used in each of threeWGA reactions using: (i) GenomiPhi v2 (GE lifescience), hereafter termed Phi; (ii) Phi29 MDA plus tre-halose, hereafter termed Tre; and (iii) Rapisome(BioHelix), hereafter termed Rap. The Phi WGA reac-tions were carried out in the 20 ml reaction mixture at308C for 90 min followed by heat denaturation at958C for 3 min according to the manufacturer’sinstructions. For Rap, DNA was mixed directly with the25 ml reaction mixture and incubated at 378C for60 min according to the manufacturer’s instructions.For Tre, Phi29 polymerase (Qiagen), 0.7 M trehaloseand 16 h reaction time were used according to themethod described in Pan et al.18 Amplified productswere purified using a QIAAmp DNA mini kit (Qiagen)and DNA concentrations were measured using Qubit(Life technologies).
2.2. Illumina library construction and sequencingOne microgram of DNA was used to construct stand-
ard 450 bp libraries using a TruSeq DNA SamplePreparation Kit with the standard protocol (Illumina),after fragmentation on the Covaris, 3 kb mate-pairlibraries were constructed following the protocoldescribed in Park et al.19 with the following exceptions.Size selection was carried out with Agencourt AMPureXP beads (Beckman Coulter) in a buffer of 5% PEG and0.95 M NaCl, aiming to remove most fragments oflength ,1.5 kb. Nick translation was carried out for11 min (libraries in Replicate 1) or 14 min (librariesin Replicate 2). Libraries were sequenced using theTruSeq SBS Kit v3-HS kit according to the manufac-turer’s recommended protocol (https://icom.illumina.com/) in either Illumina MiSeq 150 cycles (for 3 kbMP libraries in Replicate 2) or the Illumina HiSeq 100cycles (for all other libraries). In situ, the linearization,blocking and hybridization step was repeated to regen-erate clusters, release the second strand for sequencingand to hybridize the R2 sequencing primer followed by
244 Illumina Sequencing from WGA [Vol. 21,

another 100 or 150 cycles of sequencing to produce PEreads.
2.3. Data analysisReads were trimmed based on base quality (an
average phred score of 15 for every four bases) andthe presence of adaptor sequences. For 450 bpfragment short-insert libraries Trimmomatic20 wasused with options: ‘ILLUMINACLIP 2:40:15 LEADING:3TRAILING:3 SLIDINGWINDOW:4:15 MINLEN:36’. For3 kb fragment long-insert libraries an in-house devel-oped algorithm was used to trim biotin adaptorsequence which may present at either ends of thelong-insert fragments (Supplementary Fig. S1). Threeto 15% of reads were removed in short- and long-insert libraries, respectively, before undertaking thealignment stage (Supplementary Table S1).
Illumina reads were aligned to the C. elegans refer-ence genome (WS236 from Wormbase ftp://ftp.wormbase.org/) using SMALT (http://www.sanger.ac.uk/resources/software/smalt/). Repetitive mappingswere allowed, and only alignments with at least 80%or 50% of the sequence read aligned to reference wereconsidered in the short- and long-insert libraries,respectively. Additionally, a maximum of 600 bp and100 000 bp insert sizewereconsidered forpairedmap-pings in theshort-and long-insert libraries, respectively.Duplicates were called using GATK.21 SNPs were calledusing Varscan222 with options ‘2min-coverage 5—strand-filter 1’ using alignment files (in the form ofbam format) as the input on each of the short-insertreplicates. Tandem and inverted repeat content of theC. elegans genome was calculated using program trf23
and irf24 with default parameters, respectively. GCcontent and repeat content analyses for 10 kbwindows in the C. elegans genome was calculatedusing a combination of BEDTools25 and custom Perland R26 scripts. Capillary reads from the G. pallidagenome project were first trimmed to increasebases having at least phred quality score of 40 andthe vector contamination was removed. The resultingsubset of reads was mapped against the G. pallidav1 assembly (ftp://ftp.sanger.ac.uk/pub/pathogens/Globodera/pallida/) using SSAHA2.27
Assemblies were constructed from short-insertlibraries using SGA v.0.10.928 with authors’ recom-mended parameters (https://github.com/jts/sga/blob/master/src/examples/sga-celegans.sh). Scaffolding wasperformed using SSPACE basic version 2.029 withdefault settings, with library sizes set to the medianinsert values as shown in Table 1 with a standard devi-ation of 0.5. These assemblies were then comparedwith the C. elegans genome (WS236) using GAGE.30
Because of the differences in number of reads betweenreplicates, we only presented Replicate 1, which has
more sequencing depth (Table 4). A separateSupplementary Table S2 summarizes assemblies whereevery library is normalized to the library with leastnumber of reads.
3. Results
3.1. Genome amplificationCaenorhabditis elegans genomic DNA was amplified
using three different protocols that utilized Phi29 poly-merase alone (Phi); Phi29 polymerase supplementedwith trehalose (Tre), which reportedly produces amore homogenous and unbiased amplification18; andRapisome (Rap)—a commercially available version ofpWGA, which does not utilize random primers andinitial template denaturation that are possible factorsin chimera formation in MDA reactions. Afteramplifica-tion, we observed DNA fragments of length.10 kbresulting from all amplification methods. The averageyield of amplified DNA from 10 ng template DNA was46 ng/ml of reaction mixture (Phi), 31 ng/ml (Rap)and 95 ng/ml (Tre). These fragments were further frag-mented and size selected to generate Illumina libraries(Supplementary Fig. S1).
3.2. Illumina read qualityA total of �495 million of both standard 450 bp PE
(short-insert libraries) and 3 kb MP (long-insert librar-ies) Illumina reads were generated from amplified C.elegans genomic DNA fragments. Two technical repli-cates were generated from each amplification protocoland unamplified DNA. The availability of a high qualityC. elegans reference genome allowed the quality of thelibraries to be assessed by checking various mappingmetrics such as number of reads mapped, orientationof mates in a pair. In all cases, at least 82% of the readswere aligned to the reference genome (Table 1) andthe insert size distribution, i.e. the distance betweentwo mates of a read pair (including themselves)mapped to the genome in the correct orientation, wasclose to our expectation for selecting desired size frag-ments (Supplementary Fig. S2).
Variouserrors canoccuratdifferent stagesof Illuminalibrary preparation (Supplementary Fig. S1). In bothshort- and long-insert library construction, duplicatescan arise during PCR amplification, resulting in perfectcopies of the original DNA templates being sequencedmany times.31 Of the mapped reads in short-insertlibraries, the number of PCR duplicates was �1%,except in Rap libraries, where Replicate 1 had 2.8%duplicates and Replicate 2 had 35.7% duplicates sug-gesting that the starting amplified products had lowermolecular sizes with only a fraction of DNA desirableas DNA templates. We therefore considered Replicate2 as a ‘failed’ library and excluded it from subsequent
No. 3] I.J. Tsai et al. 245

analysis. The number of PCR duplicates in long-insertlibraries was consistently higher than in short-insertlibraries, as observed by others.4 The number of PCRduplicates also appeared to be affected by individualruns; a consistently fewer duplicates were observed inthe second replicate. Again, we found that PCR dupli-cates in Rap amplified long-insert libraries were highin both replicates.
Problematic reads can arise from several stages oflong-insert library construction. First, fragments canbe produced from circularized templates where nicktranslation has occurred in a segment that does notcontain a biotinylated adaptor (Supplementary Fig. S1)presumably the selection stages are sometimes inef-fective. We found out that 0.5–4.8% of such readspresent in long-insert libraries and they appear to behigher in Replicate 2 and not influenced by WGA proto-cols (Table2). Second, templates canstill becircularizedif size selection is not efficient (Supplementary Fig. S1).Paired reads sequenced from these fragments shouldhave short-insert sizes and be aligned in the correct(outward-facing in long-insert libraries) orientation.We found these reads to be present at much higher fre-quency in Replicate 2 which were sequenced as a batch(Supplementary Fig. S2).
One of the main concerns in using amplificationmethods is their tendency to form chimeric DNA frag-ments, which seems to arise from a mechanism
involving priming from displaced 30 termini.17 Basedon this mechanism, the majority of chimeric DNA frag-ments will be sequences where a segment, which is par-tially deleted, illustrated by Segments a and b in Fig. 1A,joins to another Sequence c from the same chromo-somewhich is inverted. Thus we could measure the ten-dency of amplified libraries forming chimeras bycounting the number of read pairs that were mappedwith both mates in the wrong orientation (i.e.forward–forward or reverse–reverse). All amplifiedlibraries show an increased proportion of reads in thewrong orientation when compared with the unampli-fied counterparts (Table 2). This pattern is more preva-lent in long-insert reads, where long-insert librariesprepared using Phi and Tre show 10–12.9% of readswith the wrong orientation compared with 0.55–4.1% in short-insert libraries. The majority of thesereads are evenly distributed across the chromosomesin all amplified samples (Supplementary Fig. S3), sug-gesting that wrongly amplified fragments occur infre-quently and randomly. As mentioned before, anothercharacteristic of the chimeras is that part of thesequence will be deleted, and as a result the two seg-ments where they map in the genome will appear tohave been brought closer together as a consequenceof thedeletion(Fig.1B).Hence,wheninsert size iscalcu-lated based on the mapping positions, we expect tosee a much broader insert size distribution than of
Table 1. Mapping statistics of sequenced reads from unamplified and amplified libraries
Method Replicate Platform Librarytype
Total reads Mapped(%)
Duplicatesa
(%)Properb
(%)Bothmapped(%)
Medianinsert(bp)
Mediancoverage
Unamplified 1 HiSeq Short 41 688 676 99.7 0.8 98.1 99.5 285 38
2 HiSeq Short 16 333 732 89.4 0.6 88 89.3 357 13
Phi 1 HiSeq Short 48 501 916 99.4 0.7 98 98.8 224 46
2 HiSeq Short 20 656 296 95.2 0.8 88.6 93.7 349 18
Tre 1 HiSeq Short 44 481 270 99.3 1.1 97.6 98.7 237 40
2 HiSeq Short 25 188 788 96.2 0.7 92 95.3 328 22
Rap 1 HiSeq Short 26 277 398 89.3 2.8 71.6 80.1 248 15
2 HiSeq Short 22 278 134 82.5 35.7 60 73.7 308 3
Unamplified 1 HiSeq Long 60 856 860 99.5 9 97.2 99.1 2631 41
2 MiSeq Long 2 551 720 86.4 1 79.1 85.4 2136 2
Phi 1 HiSeq Long 61 735 210 99.5 3.5 81.5 99.2 2576 39
2 MiSeq Long 2 760 576 99.3 1.2 80.2 98.9 2025 2
Tre 1 HiSeq Long 55 842 586 99.4 3.4 82.6 99 2285 29
2 MiSeq Long 2 999 856 99.4 1 73 98.9 2094 2
Rap 1 HiSeq Long 58 443 656 99.4 7.6 92.1 99 2591 35
2 MiSeq Long 3 914 622 99 6.6 91.8 98.7 2121 2
All percentages are relative to total number of reads in each replicate.aReads that are identical copies of other reads and have exact mapped coordinates on the genome.bReads mapped in the correct orientation and at a distance corresponding to that predicted by the fragment library size.
246 Illumina Sequencing from WGA [Vol. 21,

non-chimeric reads. Indeed, this is what we observed inallWGA long-insert libraries (Replicate1ofPhi showninFig.1Candrest inSupplementaryFig. S4)withdistancesbetween mates mapped in wrong orientation some-times even .10 kb. By further looking at sequencereads that can be uniquely mapped into two differentpositions on the same chromosome, we found twocases that confirm the presence of chimeras in Phiand Tre amplified fragments (Supplementary Fig. S5).
To our surprise, the insert size distribution of thesechimeric reads all peaked close to 0 bp (Fig. 1C,Supplementary Fig. S4), suggesting that both mates inread pairs were overlapped or placed very close to eachother. This observation cannot be solely explained bythe priming mechanism where two different sequenceson the chromosome were joined, and can only beexplained if the same sequence is present on both endsof the sequenced fragment with one version inverted(Fig. 1D). To investigate this phenomenon further, welooked at Sanger sequence data that were producedfrom potato cyst nematode (Globodera pallida)genomic DNA, amplified using Genomiphi (Phi) andcloned into plasmid or fosmid vectors. Various insertsizes, from 2 kb to 40 kb (fosmid) were sequencedfrom either end with read lengths of 200–600 bp.Indeed, we also found that the majority of mates ofwrongly oriented reads overlapped with each other,
concurring that the same region was sequenced twicewith one version inverted. Interestingly, we found thatthe fraction of wrongly oriented reads was correlatedwith fragment size, and in extreme cases 85% of MPsderived from fosmids mapped in the wrong orientationand overlapped each other (Supplementary Fig. S6).
3.3. Uniform read coverage across the genomeOne of the most important criteria for accurate
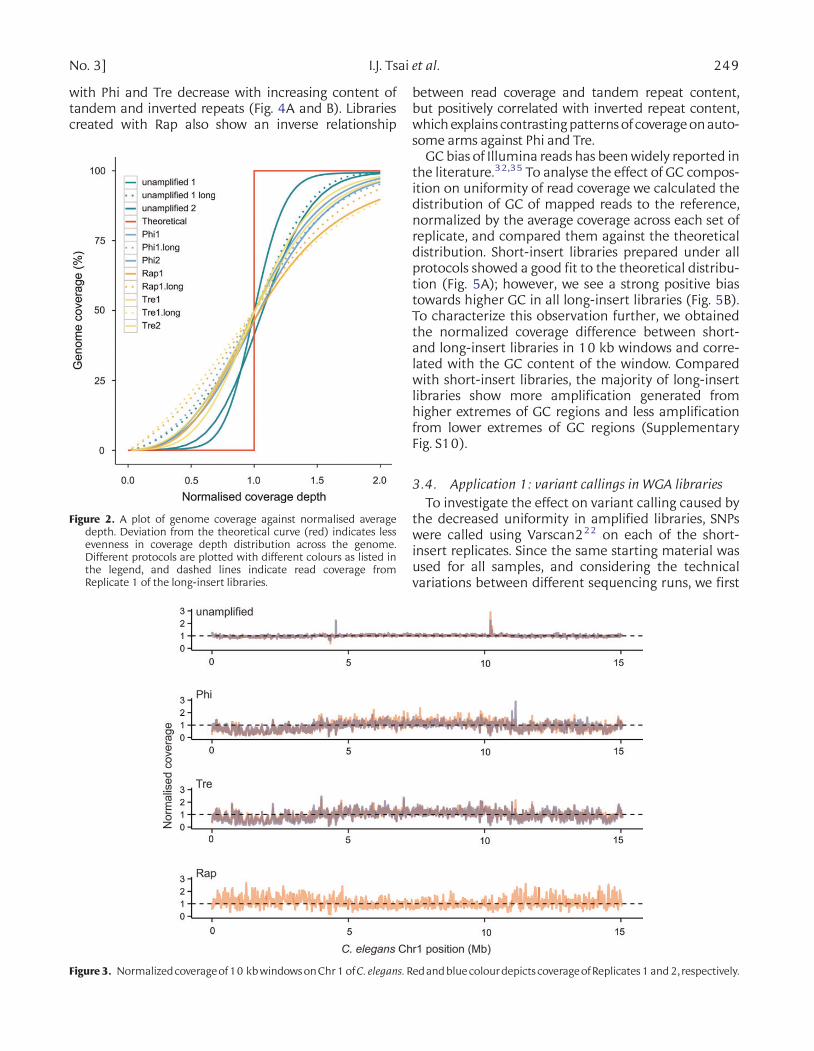
variant calling and assemblies from Illumina reads isan even coverage of sequence data genome-wide. Wefirst evaluated the variability in the depth of coverageof short-insert reads32 by plotting the cumulative frac-tion of normalized depth of correctly paired read cover-age that covers a given cumulative fraction of genome(Fig. 2). Normalization of read coverage depth allows li-braries of different coverage depths to be comparedwith each other. The theoretical line (Fig. 2) indicatesa perfectly uniform distribution of reads where 100%of the genome is covered by reads with a normalizedand consistent depth of 1. Figure 2 shows that bothreplicates of the unamplified short-insert library havethe closest fit to the theoretical line, suggesting themost uniform distribution of reads. The remainingsamples show some level of deviation, suggesting non-uniform distribution across the genome. Distribution
Table 2. Mapping statistics of improperly paired sequenced reads from unamplified and amplified libraries
Method Replicate Librarytype
Singletons(%)
Interchromosomala
(%)Outies/inniesb
(%)Wrong orientationc
(%)Incorrect insertsize (%)
Unamplified 1 Short 0.2 0.5 0.5 0.2 0.2
2 Short 0.2 0.6 0.3 0.1 0.3
Phi 1 Short 0.6 0.15 0.1 0.55 0.0
2 Short 1.5 0.4 0.3 4.1 0.3
Tre 1 Short 0.6 0.2 0.1 0.8 0.0
2 Short 1 0.4 0.3 2.5 0.1
Rap 1 Short 9.1 4.2 0.3 3.7 0.3
2 Short 8.8 0.5 1.7 3.1 8.4
Unamplified 1 Long 0.4 1 0.5 0.3 0.1
2 Long 1 3.9 1.4 0.8 0.2
Phi 1 Long 0.3 2 1.7 13.3 0.7
2 Long 0.4 5.1 3.1 10.0 0.5
Tre 1 Long 0.4 1.9 1.0 12.9 0.6
2 Long 0.4 8.1 4.8 12.4 0.6
Rap 1 Long 0.4 1.3 0.5 4.5 0.6
2 Long 0.3 3 1.3 2.2 0.4
All percentages are relative to total number of reads in each replicate shown in Table 1.aReads with mates mapped to different chromosomes.bReads with mates mapped to the same chromosome that show incorrect orientation of facing either outwards (‘ !’; outiesfor short-insert libraries) or inwards (‘! ’ innies for long-insert libraries).cReads with mates mapped to the same chromosome but shows the same orientation, i.e. ‘ ’ or ‘!!’. In the case of long-insert libraries, chimera formation is one of the causes of the formation of these reads.
No. 3] I.J. Tsai et al. 247

plots of the long-insert libraries show more deviationaway from the theoretical distribution than short-insert libraries. This effect is more evident in the lowertail of the distribution, indicating a greater proportionof the genome has lower coverage. By inspectingregions of lower coverage across all libraries, the mostevident patterns are regions enriched in G homopoly-mers tracts and GGC motifs33 ( Supplementary Fig. S7).
Next,we groupedthe Illumina short-insert read cover-age at each base into 10 kb non-overlapping windowsacross the C. elegans genome. Using Chromosome I asan example, plotting the median coverage of bases ineach window immediately revealed the difference incoverage between libraries (Fig. 3). Some differencesexist, but two technical replicates in each library showremarkably similar patterns with each other. Librarieswith unamplified DNA show more uniform coverage
acrossChromosomeIcomparedwithamplified libraries.Interestingly, we observed that read coverage onlyseemsto be more even towards the middle of Chromosome Iin all WGA protocols, but is even throughout inChromosome X (Supplementary Fig. S8). The uneven-ness incoverageofdatafromIlluminashort-insert librar-ies at C. elegans autosome arms mirrors the distributionof inverted and tandem repetitive sequences, which alsocluster more frequently at the autosome arms34
(Supplementary Fig. S9). To investigate this phenom-enon, we re-annotated the tandem and inverted repeatcontents of C. elegans genome and compared themwith read coverage in 10 kb windows. Strikingly, wefound that both tandem and inverted repeat contentare significantly correlated with read coverage across allsamples including unamplified libraries (P , 0.001,Spearman’s test). Read coverage in libraries treated
Figure1. (A,B andD)Typesof chimeric rearrangements. EachDNA sequence is representedby twoor threeadjacentsegments.Arrows indicatedirections of amplified fragments relative to the DNA sequence. (A) and (B) Segment a is copied, b is deleted and c is copied and reversecomplemented. (D) The first part of the sequence is copied twice, with unknown sequence placed between the two copies. (C) Insert sizedistribution plot of wrong-orientation reads in Phi amplified libraries.
248 Illumina Sequencing from WGA [Vol. 21,
with Phi and Tre decrease with increasing content oftandem and inverted repeats (Fig. 4A and B). Librariescreated with Rap also show an inverse relationship
between read coverage and tandem repeat content,but positively correlated with inverted repeat content,which explains contrasting patterns of coverage on auto-some arms against Phi and Tre.
GC bias of Illumina reads has been widely reported inthe literature.32,35 To analyse the effect of GC compos-ition on uniformity of read coverage we calculated thedistribution of GC of mapped reads to the reference,normalized by the average coverage across each set ofreplicate, and compared them against the theoreticaldistribution. Short-insert libraries prepared under allprotocols showed a good fit to the theoretical distribu-tion (Fig. 5A); however, we see a strong positive biastowards higher GC in all long-insert libraries (Fig. 5B).To characterize this observation further, we obtainedthe normalized coverage difference between short-and long-insert libraries in 10 kb windows and corre-lated with the GC content of the window. Comparedwith short-insert libraries, the majority of long-insertlibraries show more amplification generated fromhigher extremes of GC regions and less amplificationfrom lower extremes of GC regions (SupplementaryFig. S10).
3.4. Application 1: variant callings in WGA librariesTo investigate the effect on variant calling caused by
the decreased uniformity in amplified libraries, SNPswere called using Varscan222 on each of the short-insert replicates. Since the same starting material wasused for all samples, and considering the technicalvariations between different sequencing runs, we first
Figure 2. A plot of genome coverage against normalised averagedepth. Deviation from the theoretical curve (red) indicates lessevenness in coverage depth distribution across the genome.Different protocols are plotted with different colours as listed inthe legend, and dashed lines indicate read coverage fromReplicate 1 of the long-insert libraries.
Figure3. Normalizedcoverageof10 kbwindowsonChr1ofC. elegans.Redandbluecolourdepicts coverageofReplicates1and2, respectively.
No. 3] I.J. Tsai et al. 249

inferred 643 homozygous and 2117 heterozygousSNPs that were called in both non-amplified replicates.Only one replicate of the Rap amplification was ana-lysed, which therefore showed the least robust SNPcalling accuracy. For samples amplified with either Phior Tre, we found �80% homozygous SNP calls were
also called in at least one replicate (Table 3A). Themajority of miss calls in libraries prepared using thesetwo protocols from sites with acoveragedepth�2, con-sistent with the expectation that some regions of thegenome failed to amplify during the process. Theeffect of non-uniform read coverage of amplified
Figure 4. Scatterplots showing relationships between (A) inverted and (B) tandem repeat content and normalized read coverage in 10 kbwindows of C. elegans.
Figure 5. Distribution of GC content in sequenced reads of (A) short- and (B) long-insert libraries.
250 Illumina Sequencing from WGA [Vol. 21,

libraries is further reflected in their heterozygous calls,where only 61–65% of SNPs from the non-amplifiedlibrary were also called in at least one of the replicates
from the two amplification protocols. An exhaustive in-vestigationof themiss-calledSNPs revealed thatmostofthe missed heterozygotes were incorrectly called ashomozygous (Table 3B).
3.5. Application 2: assembly generated by WGAprepared libraries
In order to evaluate the effect that different WGA pro-tocols may have in generating a genome assembly, weused the SGA assembler28 to assemble reads fromeach of the libraries. These assemblies were thenassessed using GAGE30 and summarized in Table 4. Weonly presented Replicate 1 for this analysis because ofthe much lower coverage in Replicate 2 observed in alllibraries, with the smaller numbers of reads producingsignificantly worse assemblies (Supplementary TableS2). Having a genome reference allowed us tocompute corrected N50 where contigs were broken atmiss-assembled regions prior to the calculation ofN50. The first observation is that the Rap amplified li-braries produce the worst assembly, and as expectedthe most contiguous and accurate assembly is producedfromunamplified library. Thesecondobservation is thatthe assemblies produced from Phi and Tre amplified li-braries are almost identical to unamplified libraries,with only an additional 0–4.3% of the assemblymissing compared with the reference and similar cor-rected N50 values. The variation in assembly qualitybetween replicates was greater than between non-amplified and amplified libraries prepared by followingeither Phi or Tre protocols (Supplementary Table S2).
To assess the effect of the uneven sequencing cover-age and the presence of erroneous orientation in the
Table 4. Summary statistics of assembly and scaffolding data from different libraries
Protocol Contig assembly Scaffolding
Unamplified Phi Tre Rap Unamplified Phi Tre RapAssembly size (bp) 94 641 187 94 028 877 94 541 978 88 411 985 96 571 590 96 849 620 96 382 191 96 869 541
contig number 13 386 14 661 21 721 34 073 9415 8744 9068 9247
contig average (kb) 7.1 6.4 4.4 2.6 10.3 11.1 10.6 10.5
largest contig (kb) 167.7 147.8 116.8 41.8 167.7 187.5 167.7 167.7
N50 (kb) 16.6 15.7 10.8 4.2 17.6 24.1 20.7 18.4
N50 (number) 1525 1597 2109 5897 1533 1067 1258 1482
GAGE assessment
Corrected N50 (kb) 15.1 14.1 9.5 3.5 16.8 22.7 19.7 17.7
Corrected N50(number)
1721 1825 2431 7493 1642 1141 1354 1577
Missing reference (%) 0.09 0.09 4.43 0.14 0.09 0.09 0.09 0.09
Inversion 13 21 38 50 12 (21) 17 (þ4) 13 15 (þ2)
Relocation 7 7 11 22 17 (þ10) 13 (þ6) 19 (þ12) 11 (þ4)
Translocation 12 16 37 30 12 12 12 11 (21)
Table 3. Summary of variant calls
Protocols Phi Tre Rap(A)
Homozygous SNPs (643)
No/low coverage 105 91 192
Not called the same 28 30 28
Also called in one replicate 150 154 423
Called in both replicates 360 368 NA
Heterozygous SNPs (2117)
No/low coverage 132 85 291
Not called the same 692 650 832
Also called in one replicate 705 813 994
Called in both replicates 588 569 NA
(B)
Homozygous SNPs
Called differently in both unamplifiedreplicates
37 36 107
Called in one replicate 14 28 134
Heterozygous SNPs
Called differently in both unamplifiedreplicates
105 158 528
Called in one replicate 44 46 1465
(A) Fate of 643 homozygous and 2117 heterozygous SNPcalls from both unamplified replicates; (B) fate of additionalhomozygous and heterozygous SNP calls from amplifiedreplicates.
No. 3] I.J. Tsai et al. 251

long-insert libraries, we ran the SSPACE29 scaffolder onthe best assembly (non-amplified Replicate 1) usingreads from each long-insert library. We only usedReplicate 1 for this analysis because of the muchlower coverage in Replicate 2 observed in all samples.A total of 10 additional miss-assemblies were identifiedby GAGE after scaffolding with the unamplified long-insert library (Table 4) and, comparably, the Phiamplified library created the same number of miss-assemblies but actually had the largest corrected N50,as well as containing the largest scaffold of all theassemblies. The assembly scaffolded with the Rap amp-lified library, which contains the fewest wronglyoriented reads in among all amplified libraries but hasthe most PCR duplicates, shows the fewest additionalmiss-assemblies and with both the N50 and longestscaffold length very similar to the unamplified sample.
4. Discussion
4.1. Bias due to WGA protocols and genome featuresThereare twomain typesofbiasespresent in Illumina
read sequenced from amplified DNA: those that arisefrom the Illumina library construction and sequencingprocess, and those arising from the nature of DNA frag-ments generated from WGA. Reads of different insertsize also exert influences on the extent of these biases.First, inverted repeats are known to generate chimerasin WGA protocols,17 the extent of which we assessedby recording the number of wrongly oriented reads inthesamples. In fact, thedistributionof wronglyorientedreads reveals that previously proposed mechanism17
only constitute a part of these, and instead the majorityof these reads arise from fragments containing thesame sequence on both ends with one end being aninverted version of another. The same trend wasfound in theG.pallidacapillary reads, andapositivecor-relation was observed between numbers of chimerasand length of sequenced fragments. An explanationcould be that the duplicated sequences are morelikely to be present in larger fragments. Hence selectionof such fragments in larger insert libraries after shearingwill also result in preferentially selection for artefacts. Inshorter insert Illumina libraries, the wrongly amplifiedsequences were broken down into smaller fragmentsand hence a decreased number of wrongly orientatedreads was found. It would be interesting to sequencethe whole wrongly amplified fragment to reveal thedominant nature of chimera formation in WGA.
Secondly, we obtained the quality statistics of read li-braries such as read coverage aligned across thegenome, proportions of wrongly oriented mappedreads and searched for potential biases due to GCcontent, repeat composition of the C. elegans genomeand the different insert size libraries. Coverage biases
in regions of genomes as a result of amplificationhave been previously observed in bacteria16 and inhumans,15 and we found that the uneven coveragebetween chromosome arms and centres are correlatedwith tandem and inverted repeat content, both ofwhich have been previously described to bias the cover-age of WGA reads.16,17 We show that in repeat regionsPhi and Tre displayed lower read coverage, while Rapshowed different biases depending on the repeattype, suggesting alternative mechanisms affecting theamplification process. It also may not be the repeatsequence per se, as repetitive regions in the genomeare also associated with the global structural featuressuch as histone modifications. For example, chromo-somal arms of C. elegans show enrichment of H3K9methylation,36 which are also zones of elevatedmeiotic recombination.34
Thirdly, we found the presence of GC bias in the readsfrom long-insert libraries including thosewithout WGA,despite the C. elegans genome possessing an almostuniform GC content (36%) across all chromosomes.34
The current proposed mechanisms behind WGA donot explain a bias with GC content, and indeed wefound no obvious effect of WGA libraries against GCcontent. Hence, the overall bias is mainly causedduring the library construction process of the long-insert libraries and will be even more prevalent ingenomes that possess more extreme GC content, suchas Plasmodium falciparum (17% GC).
Finally, in this study we have analysed a total of threeWGA protocols. We found that the addition of trehalose(Tre) does not seem to improve the coverage evennessagainst the libraries amplified with Genomiphi only(Phi), as all the metrics and biases are almost identicalbetween two protocols. A possible explanation is thatGenomiphi might have already contained reagentsthat work similarly to trehalose. On the other hand,libraries amplified using Rapisome (Rap) showeddifferent patterns to Genomiphi based protocols.Constructing a good Illumina library from Rap ampli-fied products seemed to be more difficult thanGenomiphi based protocols, considering the lowernumber of mapped reads and higher number of PCRduplicates. However, Rap amplified libraries haveshown lower number of wrongly orientated reads, sug-gesting an alternative mechanism that attributes tobiases to different genome features. For instance, weshow regions associated with inverted repeat actuallyincrease read coverage in Rapisome libraries. It will beof interest to find out whether the lower percentageof wrongly orientated reads in Rapisome amplified li-braries are also noticeable in longer insert libraries. Ifthat was indeed the case, then Illumina libraries canbe constructed from much larger amplified DNA frag-ments with still lower proportions of wrongly orientedreads.
252 Illumina Sequencing from WGA [Vol. 21,

4.2. Performance of WGA readsSequence reads from amplified fragments can poten-
tially give rise to false SNP calls, particularly in genomicregions that are difficult to amplify. We found that SNPswereunder-called fromreadsgenerated fromamplifiedDNA compared with unamplified samples. When readswere sequenced at good coverage, we found that �80%of homozygous SNP candidates from unamplifiedsamples could also be identified correctly from ampli-fied samples, while the majority of miss calls were dueto insufficient read coverage. The limitation seems tobe more prevalent in heterozygous SNPs, where onlyup to 65% of candidates could be accurately identified.Most of these SNPs were called as homozygous in one ofthe alleles, and this may bedue to the fact that most SNPcallers make heterozygous calls confidently if allele fre-quencies were close to 50%, for which non-uniformcoverage results in departure from this assumption.Hence, although most of the homozygous SNPs can beaccurately identified in WGA samples, it is essential toinvestigate the allele frequencies of variant sites inorder to not miss calls that were otherwise heterozy-gous in the sample.
There have been advances in assembly algorithmsthat assemble genomes with fluctuating coverage inthe samples, but we wished to emphasize the effectthat reads sequenced from amplified fragments haveon a typical assembly process, hence we applied com-monly used methods to assemble the C. elegansgenome using short-insert reads with the SGA assem-bler,28 and scaffolded using long-insert reads with theSSPACE scaffolder.29 Contig and scaffold statistics gen-erated from amplified libraries were comparable withthose from their unamplified counterparts. In fact, wefound that variability between technical replicatesinfluenced assembly metrics more than differentWGA protocols. We also found that the wronglyoriented reads did not cause more miss-assembliesthan expected. An explanation is that our long-insert li-braries were sequenced at adequate coverageand prob-lematic reads were present in minority. Occasions canarise where correct reads suggest joining of two scaf-folds but problematic reads suggest otherwise, inwhich case the SSPACE scaffolder will scaffold correctlybecause the number of correct reads outweighs prob-lematic reads. However, we expect that reads fromlarger insert WGA libraries would result in significantlymore scaffolding errors because the majority of readsare problematic, with the error rate increasing withfragment length.
4.3. ConclusionWGAwill remain an essential method in genomics for
many years to come. The mechanisms of chimera for-mationandother sourcesofbiashavebeen investigated
and there are many new protocols that are currentlybeing developed to minimize such effects. In the mean-time, it is also important to evaluate the nature of biasesinorder tocorrectly interpretassembly results. Here,wehavepresentedtheeffectsofWGA onIlluminareads.Werecognize the biases present from the reads, and showthat the DNA amplified from all protocols investigatedin this article is able to call the majority of SNPs andproduce accurate assemblies comparable with thoseproduced from unamplified DNA. Reads sequencedfrom longer fragments are still useful in scaffoldingand problematic reads can be detected and filteredout as long as they remain a minority. We envisagealso using WGA in other eukaryotic species (includingnematodes) that possess similar GC content and basecomposition to C. elegans. Fundamentally, as biologiststurn to sequencing more unexplored species or samplesfrom which only very low amounts of starting materialareavailable,our studyprovidesafirst initial assessmenton Illumina sequencing from WGA DNA.
5. Availability
Illumina data are released to the European NucleotideArchive (http://www.ebi.ac.uk/ena/) under accessionnumber ERP000964.
Acknowledgements: We thank Anna Protasio for hercommenting on the manuscript.
Supplementary data: Supplementary data areavailable at www.dnaresearch.oxfordjournals.org.
Funding
This work was supported by JSPS KAKENHI (grantsnumbers 20353659 and 23248024) and theWellcome Trust (grant no. WT 098051). I.J.T. was sup-ported by JSPS Postdoctoral Fellowship Program forForeign Researchers.
References
1. Illumina. HiSeq Sequencing Systems. http://res.illumina.com/documents/systems/hiseq/datasheet_hiseq_systems.pdf.
2. Van Nieuwerburgh, F., Thompson, R.C., Ledesma, J.,Deforce, D., Gaasterland, T., Ordoukhanian, P. andHead, S.R. 2012, Illumina mate-paired DNA sequen-cing-library preparation using Cre-Lox recombination,Nucleic Acids Res., 40, e24.
3. Illumina. 2009, Mate Pair Library V2 Sample PreparationGuide.
4. Peng, Z., Zhao, Z., Nath, N., et al. 2012, Generation of longinsert pairs using a Cre-LoxP Inverse PCR approach, PloSOne, 7, e29437.
No. 3] I.J. Tsai et al. 253

5. Grunenwald, H., Baas, B., Caruccio, N. and Syed, F. 2010,Rapid, high-throughput library preparation for next-generation sequencing, Nat. Methods, 7, iii–iv.
6. Seth-Smith, H.M., Harris, S.R., Skilton, R.J., et al. 2013,Whole-genome sequences of Chlamydia trachomatis dir-ectly from clinical samples without culture, Genome Res.,23, 855–66.
7. Dey, A., Chan, C.K., Thomas, C.G. and Cutter, A.D. 2013,Molecular hyperdiversity defines populations of thenematode Caenorhabditis brenneri, Proc. Natl. Acad. Sci.USA, 110, 11056–60.
8. Hawkins, T.L., Detter, J.C. and Richardson, P.M. 2002,Whole genome amplification—applications andadvances, Curr. Opin. Biotechnol., 13, 65–7.
9. Telenius, H., Carter, N.P., Bebb, C.E., Nordenskjold, M.,Ponder, B.A. and Tunnacliffe, A. 1992, Degenerate oligo-nucleotide-primed PCR: general amplification of targetDNAbyasingledegenerateprimer,Genomics,13,718–25.
10. Zhang, L., Cui, X., Schmitt, K., Hubert, R., Navidi, W. andArnheim, N. 1992, Whole genome amplification from asingle cell: implications for genetic analysis, Proc. Natl.Acad. Sci. USA, 89, 5847–51.
11. Binga, E.K., Lasken,R.S. andNeufeld, J.D.2008, Somethingfrom (almost) nothing: the impact of multiple displace-ment amplification on microbial ecology, ISME J., 2,233–41.
12. Li, Y., Kim, H.-J., Zheng, C., et al. 2008, Primase-basedwhole genome amplification, Nucleic Acids Res., 36, e79.
13. Lasken, R.S. 2012, Genomic sequencing of unculturedmicroorganisms from single cells, Nat. Rev. Microbiol.,10, 631–40.
14. Dharia, N.V., Bright, a.T., Westenberger, S.J., et al. 2010,Whole-genome sequencing and microarray analysis ofex vivo Plasmodium vivax reveal selective pressure onputative drug resistance genes, Proc. Natl. Acad. Sci. USA,107, 20045–50.
15. Wang, J., Fan, H.C., Behr, B. and Quake, S.R. 2012,Genome-wide single-cell analysis of recombination ac-tivity and de novo mutation rates in human sperm, Cell,150, 402–12.
16. Pinard, R., de Winter, A., Sarkis, G.J., et al. 2006,Assessment of whole genome amplification-inducedbias through high-throughput, massively parallel wholegenome sequencing, BMC Genomics, 7, 216.
17. Lasken, R.S. and Stockwell, T.B. 2007, Mechanism ofchimera formation during the Multiple DisplacementAmplification reaction, BMC Biotechnol., 7, 19.
18. Pan, X., Urban, A.E., Palejev, D., et al. 2008, A procedure forhighly specific, sensitive, and unbiased whole-genomeamplification,Proc.Natl.Acad. Sci.USA,105, 15499–504.
19. Park, N., Shirley, L., Gu, Y., Keane, T.M., Swerdlow, H. andQuail, M.A. 2013, An improved approach to mate-paired library preparation for Illumina sequencing,Methods Next Gener. Seq., 1, 10–20.
20. Lohse, M., Bolger, A.M., Nagel, A., Fernie, A.R., Lunn, J.E.,Stitt, M. and Usadel, B. 2012, RobiNA: a user-friendly,
integrated software solution for RNA-Seq-based tran-scriptomics, Nucleic Acids Res., 40, W622–7.
21. McKenna, A., Hanna, M., Banks, E., et al. 2010, TheGenome Analysis Toolkit: a MapReduce framework foranalyzing next-generation DNA sequencing data,Genome Res., 20, 1297–303.
22. Koboldt, D.C., Zhang, Q., Larson, D.E., et al. 2012, VarScan2: somatic mutation and copy number alteration discov-ery in cancer by exome sequencing, Genome Res., 22,568–76.
23. Benson, G. 1999, Tandem repeats finder: a program toanalyze DNA sequences, Nucleic Acids Res., 27,573–80.
24. Warburton, P.E., Giordano, J., Cheung, F., Gelfand, Y. andBenson, G. 2004, Inverted repeat structure of thehuman genome: the X-chromosome contains a prepon-derance of large, highly homologous inverted repeatsthat contain testes genes, Genome Res., 14, 1861–9.
25. Quinlan, A.R. and Hall, I.M. 2010, BEDTools: a flexiblesuite of utilities for comparing genomic features,Bioinformatics (Oxford, England), 26, 841–2.
26. Team, R.C. 2013, R: A Language and Environment forStatistical Computing.
27. Ning, Z., Cox, A.J. and Mullikin, J.C. 2001, SSAHA: a fastsearch method for large DNA databases, Genome Res.,11, 1725–9.
28. Simpson, J.T. and Durbin, R. 2012, Efficient de novo as-sembly of large genomes using compressed data struc-tures, Genome Res., 22, 549–56.
29. Boetzer, M., Henkel, C.V., Jansen, H.J., Butler, D. andPirovano, W. 2011, Scaffolding pre-assembled contigsusing SSPACE, Bioinformatics (Oxford, England), 27,578–9.
30. Salzberg, S.L., Phillippy,A.M., Zimin,A., et al.2012,GAGE: acritical evaluation of genome assemblies and assemblyalgorithms, Genome Res., 22, 557–67.
31. Kozarewa, I., Ning, Z., Quail, M.A., Sanders, M.J.,Berriman, M. and Turner, D.J. 2009, Amplification-freeIllumina sequencing-library preparation facilitatesimproved mapping and assembly of (GþC)-biasedgenomes, Nat. Methods, 6, 291–5.
32. Oyola, S.O., Otto, T.D., Gu, Y., et al. 2012, OptimizingIllumina next-generation sequencing library preparationfor extremely AT-biased genomes, BMC Genomics, 13, 1.
33. Nakamura, K., Oshima, T., Morimoto, T., et al. 2011,Sequence-specific error profile of Illumina sequencers,Nucleic Acids Res., 39, e90.
34. Press, H., York, N. and Nw, A. 1998, Genome sequence ofthe nematode C. elegans: a platform for investigatingbiology, Science, 282, 2012–8.
35. Benjamini, Y. and Speed, T.P. 2012, Summarizing and cor-recting the GC content bias in high-throughput sequen-cing, Nucleic Acids Res., 40, e72.
36. Liu, T., Rechtsteiner, A., Egelhofer, T.A., et al. 2011, Broadchromosomal domains of histone modification patternsin C. elegans, Genome Res., 21, 227–36.
254 Illumina Sequencing from WGA [Vol. 21,
Related Documents