SULTAN Graphing

SULTAN Graphing. Graphing Using graphs is a way that scientists analyze their data when using the scientific method. It is important for deciding whether.
Dec 13, 2015
Welcome message from author
This document is posted to help you gain knowledge. Please leave a comment to let me know what you think about it! Share it to your friends and learn new things together.
Transcript
SULTAN Graphing
GraphingGraphingUsing graphs is a way that scientists
analyze their data when using the scientific method.
It is important for deciding whether a hypothesis can be either accepted or rejected.
What does SULTANSULTAN it mean?
SSUULLTTAANN
calecale
nitsnits
abelabel
itleitle
ccuracyccuracy
eatnesseatness
Remember:
Independent VariableIndependent Variable - the variable that - the variable that we change in the experiment we change in the experiment (what you (what you know before the experiment).know before the experiment).
Dependent VariableDependent Variable - the thing that we - the thing that we measure in the experiment measure in the experiment (what you (what you don’t know before the experiment).don’t know before the experiment).
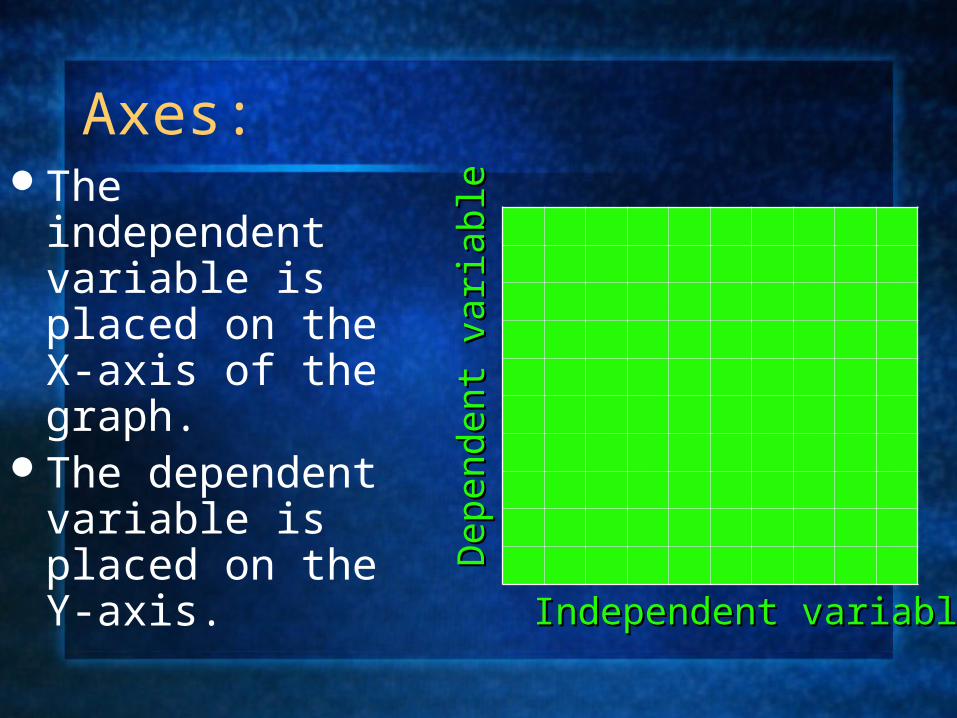
Axes:The independent
variable is placed on the X-axis of the graph.
The dependent variable is placed on the Y-axis.
Independent variableIndependent variable
Dep
ende
nt v
aria
ble
Dep
ende
nt v
aria
ble
ScaleScale
Scale is needed to make sure that the Scale is needed to make sure that the information on the graph is readable.information on the graph is readable.
Your graph must fill nearly the whole Your graph must fill nearly the whole area.area.
Numbers must be evenly spaced.Numbers must be evenly spaced.
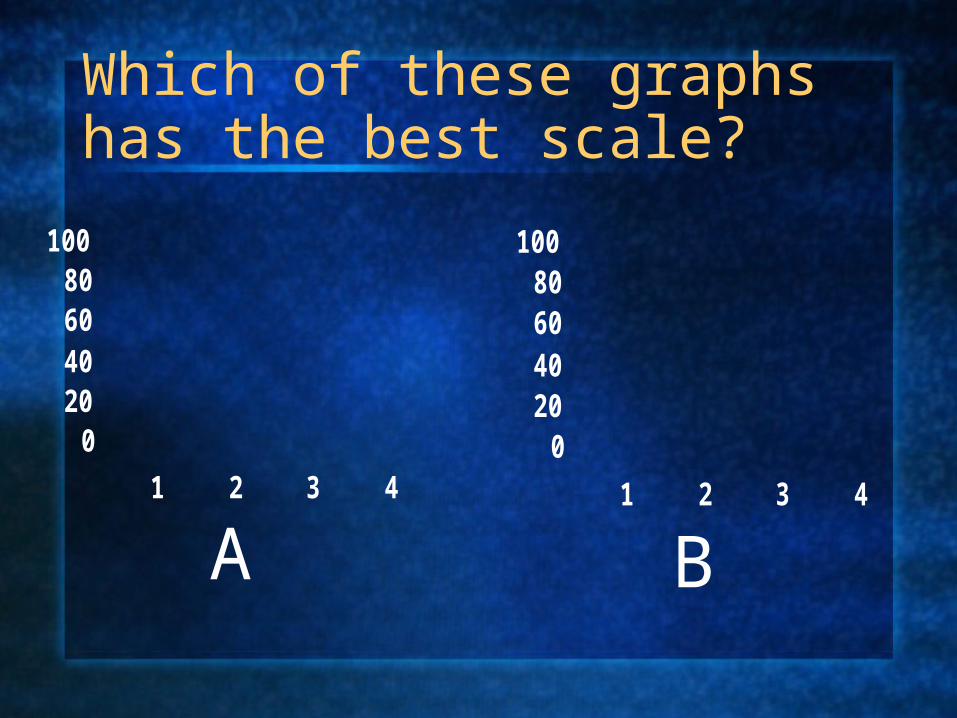
Which of these graphs has the best scale?
020406080
100
1 2 3 40
20406080
100
1 2 3 4
A B
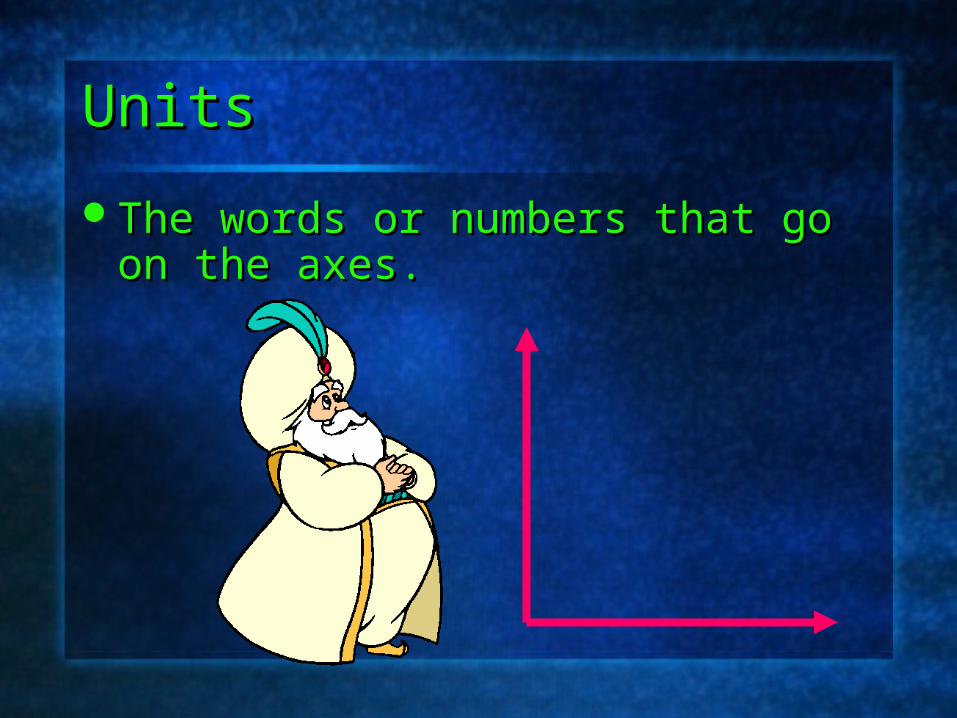
UnitsUnits
The words or numbers that go on the The words or numbers that go on the axes.axes.
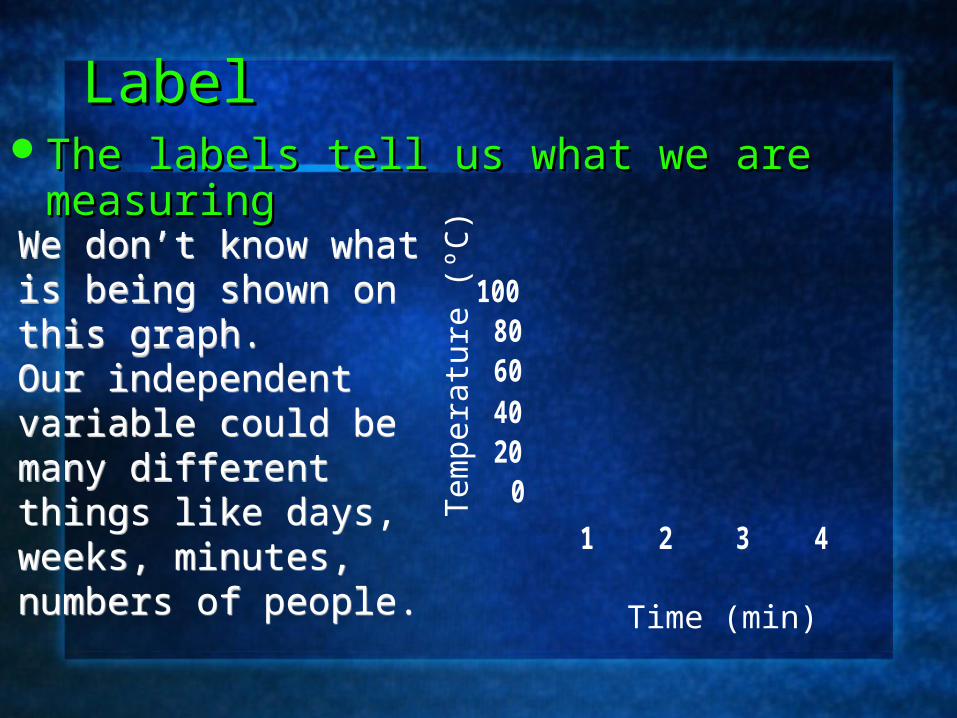
LabelLabelThe labels tell us what we are measuringThe labels tell us what we are measuring
We don’t know what is being shown on this graph.Our independent variable could be many different things like days, weeks, minutes, numbers of people.
We don’t know what is being shown on this graph.Our independent variable could be many different things like days, weeks, minutes, numbers of people.
020406080
100
1 2 3 4
Time (min)
Tem
pera
ture
(ºC
)
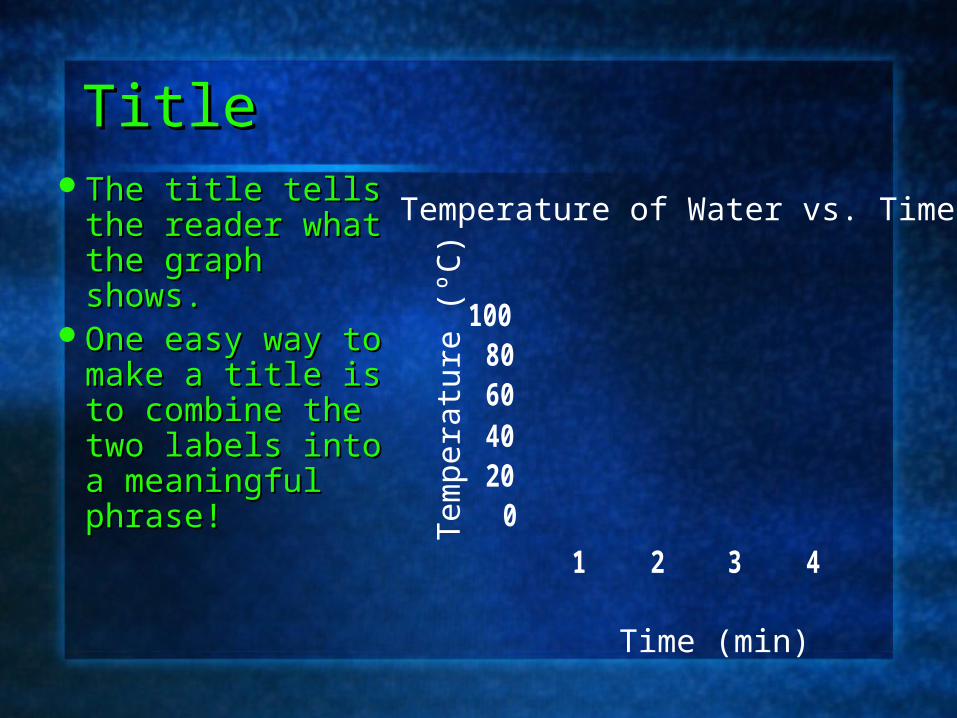
TitleTitleThe title tells the The title tells the
reader what the reader what the graph shows. graph shows.
One easy way One easy way to make a title is to make a title is to combine the to combine the two labels into a two labels into a meaningful meaningful phrase!phrase!
020406080
100
1 2 3 4
Time (min)
Tem
pera
ture
(ºC
)
Temperature of Water vs. Time
Accuracy and NeatnessAccuracy and Neatness
Check your graphs for accuracy and Check your graphs for accuracy and neatness so the reader understands neatness so the reader understands what is being shown.what is being shown.
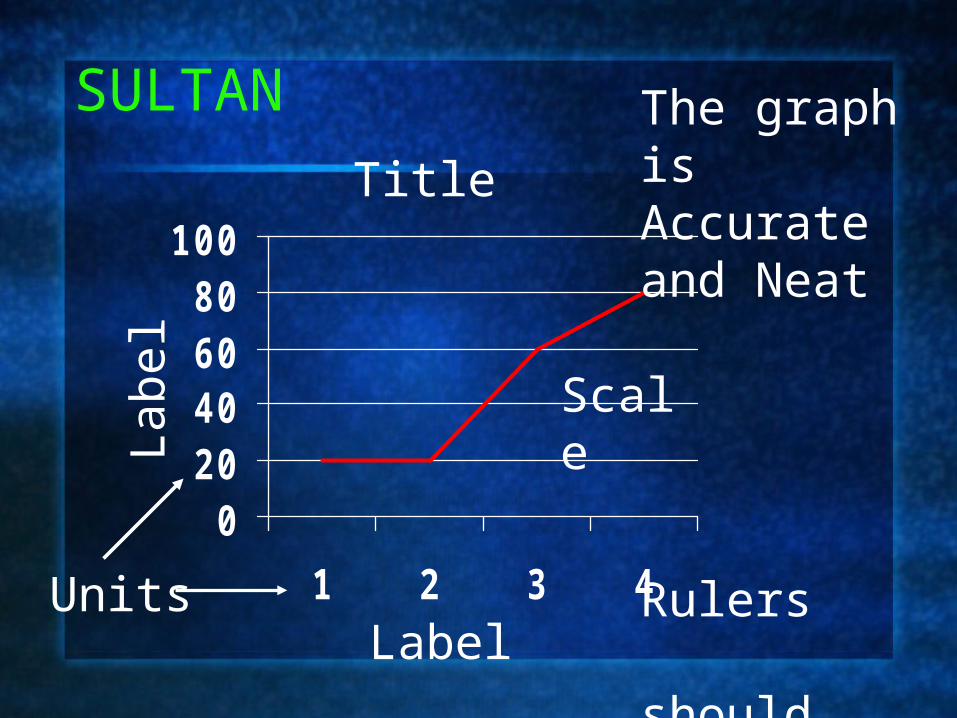
SULTAN
020406080
100
1 2 3 4
Title
Label
Labe
l
Units
Scale
The graph is Accurate and Neat
Rulers should be
used!
Legend
020406080
100
1 2 3 4
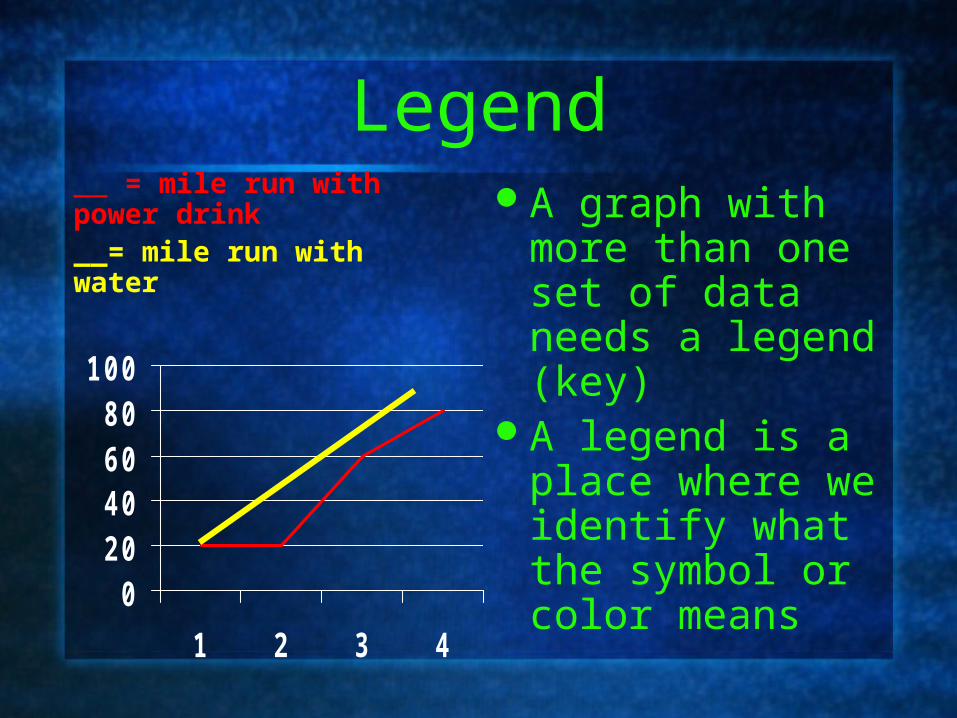
__ = mile run with power drink__= mile run with water
A graph with more than one set of data needs a legend (key)
A legend is a place where we identify what the symbol or color means
Related Documents