Sulfur annealing effect for superconductivity in iron chalcogenide compounds K. Deguchi 1,2 , A. Yamashita 1 , T. Yamaki 1,2 , H. Hara 1,2 , S. Demura 1,2 , S. J. Denholme 1 , M. Fujioka 1 , H. Okazaki 1 , H. Takeya 1 , T. Yamaguchi 1 and Y. Takano 1,2 1 National Institute for Materials Science, 1-2-1, Sengen, Tsukuba, 305-0047, Japan 2 University of Tsukuba, 1-1-1 Tennodai, Tsukuba, 305-8571, Japan E-mail: [email protected] Abstract We discovered a novel annealing method for Fe-chalcogenide superconductors. It was found that sulfur annealing deintercalated excess Fe via formation of FeS 2 . Due to its specifics, sulfur annealing is applicable when preparing Fe-chalcogenide-based wires or cables.

Welcome message from author
This document is posted to help you gain knowledge. Please leave a comment to let me know what you think about it! Share it to your friends and learn new things together.
Transcript

Sulfur annealing effect for superconductivity in iron chalcogenide
compounds
K. Deguchi1,2, A. Yamashita1, T. Yamaki1,2, H. Hara1,2, S. Demura1,2, S. J. Denholme1, M. Fujioka1,
H. Okazaki1, H. Takeya1, T. Yamaguchi1 and Y. Takano1,2
1 National Institute for Materials Science, 1-2-1, Sengen, Tsukuba, 305-0047, Japan
2 University of Tsukuba, 1-1-1 Tennodai, Tsukuba, 305-8571, Japan
E-mail: [email protected]
Abstract
We discovered a novel annealing method for Fe-chalcogenide
superconductors. It was found that sulfur annealing deintercalated excess Fe
via formation of FeS2. Due to its specifics, sulfur annealing is applicable when
preparing Fe-chalcogenide-based wires or cables.

Introduction
Fe-chalcogenide superconductors are promising materials for applications under a high magnetic
field, due to a high upper critical field Hc2 and extremely low anisotropy [1-3]. The Jc of
Fe-chalcogenides thin films exhibits a superior high field performance up to 35 T over those of low
temperature superconductors [4]. Furthermore, the simple structure which has a lower degree of
toxicity than Fe-pnictides simplifies its synthesis and handling. As a result, Fe-chalcogenide
superconductors can be considered as potential candidates for applications such as wires, tapes, and
thin films.
It is known that superconductivity in Fe-chalcogenides is strongly suppressed by the presence of
an excess Fe [5-8]. The excess Fe partially occupies internal sites between the layers and provides
electron doping to the conducting layers. This electron doping suppresses the antiferromagnetic
wave vector Qs = (0.5, 0.5), which is found to correlate with Fe-based superconductivity. This means
that electron doping caused by excess Fe does not favor superconductivity. However, the excess Fe
cannot be totally removed during the synthetic process. The post-annealing as means of suppressing
the electron doping is important in order to achieve superconductivity in Fe-chalcogenide.
So far, we have investigated the effect of the excess Fe and found several methods to suppress the
electron doping in the conducting layers. Oxidation through air exposure and oxygen annealing
compensate the electron doping resulting from the excess Fe [9-12]. These techniques show the

reversibility for appearance of superconductivity in Fe-chalcogenides: removal of oxygen by
vacuum annealing suppresses the superconductivity, while renewed oxygen-annealing results in its
reappearance. The other technique available is deintercalation of excess Fe. This can be achieved by
heating in alcoholic beverages, and in organic acid solutions [13-18]. Various other post-annealing
methods using I2, Te vapor, and acid solution are also reported [19-23].
However, these methods are not suitable for wire production. The powder-in tube is a common
technique to fabricate Fe-chalcogenide wires. It is difficult to perform post-annealing on a sample
located inside a tube via outside intervention. To improve the superconducting property of the wires,
a novel annealing method is required. Here, we propose sulfur annealing, which is a new route to
induce bulk superconductivity in Fe-chalcogenides and suitable for applications.
Experimental
Polycrystalline samples of FeTe0.9Se0.1 were prepared by a solid-state reaction using powder Fe
(99.998 %) and grains of Te (99.9999 %) and Se (99.999 %). The starting materials with a nominal
composition of FeTe0.9Se0.1 were mixed, pelletized, and put into a quartz tube. The quartz tube was
then evacuated by a rotary pump and sealed. The pellet was heated at 700 °C for 10 hours. The
obtained mixture was ground, weighed and pelletized into separate pellets with an approximate
weight of about 0.100 g each. The pellets were sealed into an evacuated quartz tube and heated at

700 °C for 10 hours. Polycrystalline samples of FeTe0.8S0.2 and FeTe were also prepared using a
solid-state reaction method as described in refs. [24] and [25]. After furnace cooling, the obtained
samples were quickly sealed into evacuated quartz tubes with 0.5 g sulfur grains and annealed at
either 100, 200 or 300 °C for 2 hours. The temperature dependence of magnetization was measured
using a Quantum Design Magnetic Property Measurement System magnetometer down to 2 K after
both zero-field-cooling and field-cooling with an applied field of 10 Oe. The electrical resistivity
measurements were performed by a standard DC four-terminal method down to 2 K with a current of
1 mA using a Quantum Design Physical Property Measurement System. Powder X-ray diffraction
(XRD) patterns were measured using the 2θ/θ method with Cu-Kα radiation by Rigaku Mini Flex II.
The polished surface of sample was observed using a scanning electron microscope (SEM). The
actual crystal composition was determined by energy dispersive X-ray spectroscopy (EDX).
Results and discussionResults and discussionResults and discussionResults and discussion
Fig. 1 shows the temperature dependence of magnetic susceptibility for the as-grown
FeTe0.9Se0.1 sample and the FeTe0.9Se0.1 samples which was sulfur-annealed at 100, 200,
and 300 °C. We found that the sulfur-annealed samples show definitive traces of
superconductivity, whereas the as-grown sample does not. A diamagnetic signal is
observed from the 100 °C annealed sample. For the sample annealed at 200 °C, the
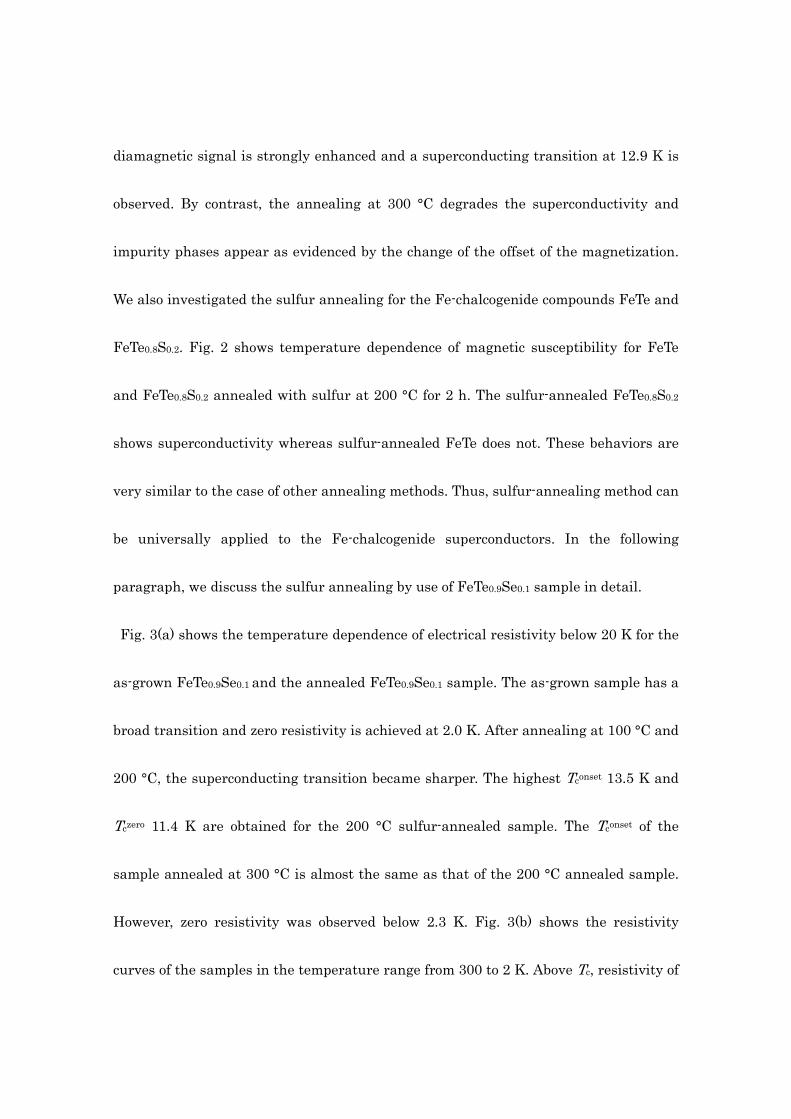
diamagnetic signal is strongly enhanced and a superconducting transition at 12.9 K is
observed. By contrast, the annealing at 300 °C degrades the superconductivity and
impurity phases appear as evidenced by the change of the offset of the magnetization.
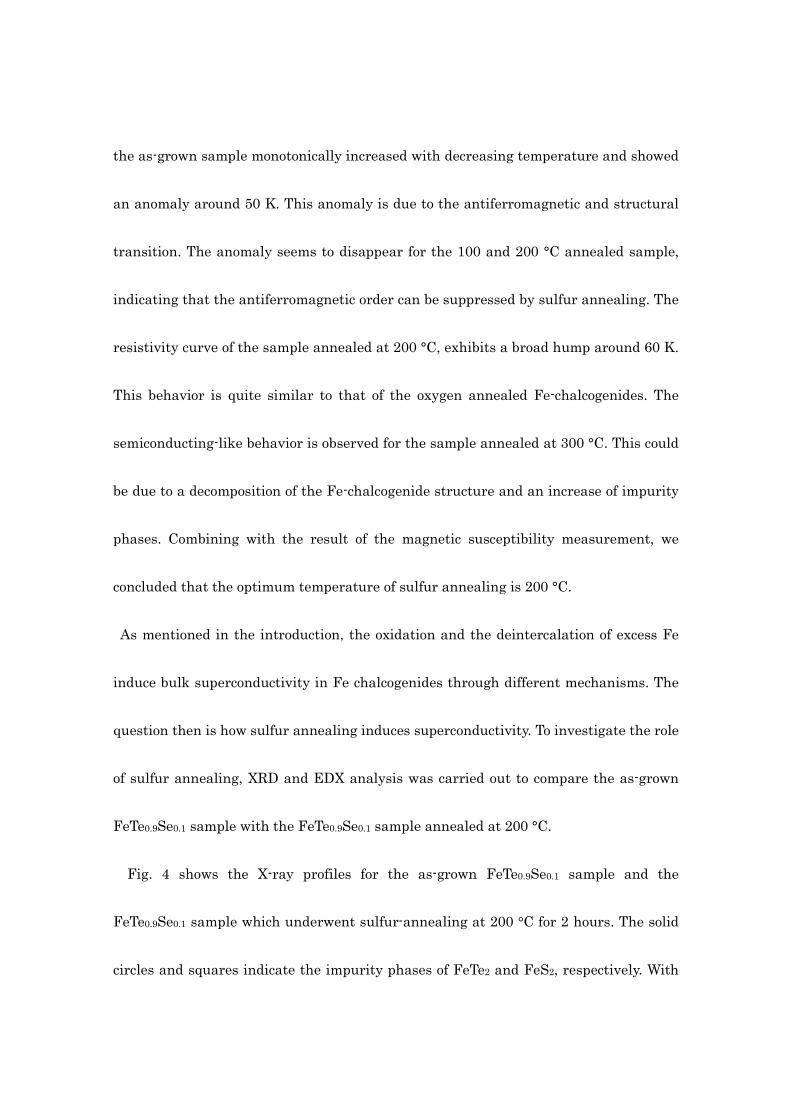
We also investigated the sulfur annealing for the Fe-chalcogenide compounds FeTe and
FeTe0.8S0.2. Fig. 2 shows temperature dependence of magnetic susceptibility for FeTe
and FeTe0.8S0.2 annealed with sulfur at 200 °C for 2 h. The sulfur-annealed FeTe0.8S0.2
shows superconductivity whereas sulfur-annealed FeTe does not. These behaviors are
very similar to the case of other annealing methods. Thus, sulfur-annealing method can
be universally applied to the Fe-chalcogenide superconductors. In the following
paragraph, we discuss the sulfur annealing by use of FeTe0.9Se0.1 sample in detail.
Fig. 3(a) shows the temperature dependence of electrical resistivity below 20 K for the
as-grown FeTe0.9Se0.1 and the annealed FeTe0.9Se0.1 sample. The as-grown sample has a
broad transition and zero resistivity is achieved at 2.0 K. After annealing at 100 °C and
200 °C, the superconducting transition became sharper. The highest Tconset 13.5 K and
Tczero 11.4 K are obtained for the 200 °C sulfur-annealed sample. The Tconset of the
sample annealed at 300 °C is almost the same as that of the 200 °C annealed sample.
However, zero resistivity was observed below 2.3 K. Fig. 3(b) shows the resistivity
curves of the samples in the temperature range from 300 to 2 K. Above Tc, resistivity of
the as-grown sample monotonically increased with decreasing temperature and showed
an anomaly around 50 K. This anomaly is due to the antiferromagnetic and structural
transition. The anomaly seems to disappear for the 100 and 200 °C annealed sample,
indicating that the antiferromagnetic order can be suppressed by sulfur annealing. The
resistivity curve of the sample annealed at 200 °C, exhibits a broad hump around 60 K.
This behavior is quite similar to that of the oxygen annealed Fe-chalcogenides. The
semiconducting-like behavior is observed for the sample annealed at 300 °C. This could
be due to a decomposition of the Fe-chalcogenide structure and an increase of impurity
phases. Combining with the result of the magnetic susceptibility measurement, we
concluded that the optimum temperature of sulfur annealing is 200 °C.
As mentioned in the introduction, the oxidation and the deintercalation of excess Fe
induce bulk superconductivity in Fe chalcogenides through different mechanisms. The
question then is how sulfur annealing induces superconductivity. To investigate the role
of sulfur annealing, XRD and EDX analysis was carried out to compare the as-grown
FeTe0.9Se0.1 sample with the FeTe0.9Se0.1 sample annealed at 200 °C.
Fig. 4 shows the X-ray profiles for the as-grown FeTe0.9Se0.1 sample and the
FeTe0.9Se0.1 sample which underwent sulfur-annealing at 200 °C for 2 hours. The solid
circles and squares indicate the impurity phases of FeTe2 and FeS2, respectively. With

the exception of these impurity phases, all the other peaks can be characterized by the
space group P4/nmm. For the as-grown sample, a peak belonging to the impurity phase
FeTe2 was observed around 32 degrees. By contrast, FeS2 peaks were observed for the
200 °C annealed sample. The calculated lattice constants a and c of the as-grown
sample are 3.8169(5) and 6.2407(9), respectively. Those of the annealed sample are
3.8184(4) and 6.2452(9), respectively, indicating that the sulfur annealing expands the
lattice.
Fig. 5 shows SEM images and EDX mappings of the as-grown sample (a) (b) and a
specific region of the sample annealed at 200 °C (c) (d). The elemental mapping analysis
showed that the as-grown sample is almost homogeneous and that the actual
composition is Fe1.08Te0.92Se0.08. After sulfur annealing, we found that there are some
sulfur-rich regions in the sample. In these regions, the elemental content of Fe and Te is
significantly changed. To investigate the change in detail, a line scan near the boundary
was carried out. The SEM image and the analyzed positions marked as No 0 to 30 are
shown in Fig. 6(a). In this image, we can see the two areas: the grayish (No 0 to 22) and
the darker area (No 22 to 30). The elemental contents of Fe, Te, Se, and S are
summarized in Fig. 6(b). In the darker area, Te content is considerably lower whereas S
content is higher. The main composition of this area is FeS2, which is observed in XRD

patterns. Interestingly, Fe content in the darker area is higher compared to the grayish
area. It indicates that Fe was deintercalated from the grayish area and moved to the
darker area. In fact, the average composition of the grayish area is Fe0.98Te0.91Se0.09. In
comparison to the as-grown sample, Fe content in the grayish area is clearly lower and
the decrement of Fe is corresponding to the amount excess Fe. Therefore, we concluded
that sulfur annealing deintercalated excess Fe from Fe-chalcogenide phase via
formation of FeS2, and hence bulk superconductivity is induced by sulfur-annealing.
ConclusionsConclusionsConclusionsConclusions
We discovered a new annealing method for Fe-chalcogenides. The sulfur annealing
deintercalated excess Fe via formation of FeS2 and induced bulk superconductivity. This
annealing method does not require a specific environment such as O2 gas, Te vapor, and
various solutions. Thus sulfur annealing is applicable for preparing Fe-chalcogenide
based wires or cables.
AcknowledgementAcknowledgementAcknowledgementAcknowledgement
This work was partly supported by a Grant-in-Aid for Scientific Research (KAKENHI).
This research was partly supported by Strategic International Collaborative Research

Program (SICORP-EU-Japan) and Advanced Low Carbon Technology Research and
Development Program (JST-ALCA), Japan Science and Technology Agency.

ReferenceReferenceReferenceReference
[1] Hunte F, Jaroszynski J, Gurevich A, Larbalestier D C, Jin R, Sefat A S, McGuire M A,
Sales B C, Christen D K and Mandrus D 2008 Nature 453453453453 903
[2] Yamamoto A, Jaroszynski J, Tarantini C, Balicas L, Jiang J, Gurevich A,
Larbalestier D C, Jin R, Sefat A S, McGuire M A,Sales B C, Christen D K and Mandrus
D 2009 Appl.Phys.Lett. 94949494 062511.
[3] Khim S, Kim J W, Choi E S, Bang Y, Nohora M, Takagi H and Kim K H 2010 Phys.
Rev. B 81818181 184511
[04] Si W, Zhou J, Jie Q, Dimitrov I, Solovyov V, Johnson P D, Jaroszynski J, Matias V,
Sheenhan C and Li Q 2011 Appl. Phys. Lett. 98989898 262509
[5] Han M J and Savrasov S Y 2009 Phys. Rev. Lett. 103103103103 067001
[6] Lumsden M D, Christiajnson A D, Goremychkin E A, Nagler S E, Mook H A, Stone M
B, Abernathy D L, Guidi T, MacDougall G J, Cruz C de la, Sefat A S, McGuire M A,
Sales B C and Mandrus D 2010 Nat. Phys. 6666 182
[7] Zhang L, Singh D J and Du M H 2009 Phys. Rev. B 79797979 012506
[8] Okazaki H et al., arXiv:1207.6578
[9] Deguchi K, Mizuguchi Y, Ogawara S, Watanabe T, Tsuda S, Yamaguchi T and
Takano Y 2010 Physica C 470470470470 S426

[10] Mizuguchi Y, Deguchi K, Tsuda S, Yamaguchi T and Takano Y 2010 Phys. Rev. B 81818181
214510.
[11] Mizuguchi Y, Deguchi K, Tsuda S, Yamaguchi T and Takano Y 2010 Europhys. Lett.
90909090 57002.
[12] Kawasaki Y, Deguchi K, Demura S, Watanabe T, Okazaki H, Ozaki T, Yamaguchi T,
Takeya H, and Takano Y 2012 Solid State Commun. 152152152152 1135
[13] Deguchi K, Mizuguchi Y, Kawasaki Y, Ozaki T, Tsuda S, Yamaguchi T and Takano Y
2011 Supercond. Sci. Technol. 24242424 055008
[14] Deguchi K, Sato D, Sugimoto M, Hara H, Kawasaki Y, Demura S, Watanabe T,
Denholme S J, Okazaki H, Ozaki T, Yamaguchi T, Takeya H, Soga T, Tomita M and
Takano Y 2012 Supercond. Sci. Technol. 25252525 084025
[15] Deguchi K, Okuda T, Kawasaki Y, Hara H, Demura S, Watanabe T, Okazaki H,
Ozaki T, Yamaguchi T, Takeya H, Saito F, Hisamoto M and Takano Y 2013 Physica C
487487487487 16
[16] Deguchi K, Demura S, Yamaki T, Hara H, Denholme S J, Fujioka M, Okazaki H,
Takeya H, Yamaguchi T and Takano Y arXiv:1210.5889
[17] Deguchi K, Takano Y and Mizuguchi Y 2012 Sci. Technol. Adv. Mater 13131313 054303

[18] Nagao M, Mizuguchi Y, Deguchi K, Watauchi S, Tanaka I and Takano Y 2012 J.
Phys. Soc. Jpn. 81818181 085005
[19] Dong C, Wang H, Li Z, Chen J, Yuan H Q and Fang M 2011 Phys. Rev. B 84 224506
[20] Han Y, Li W Y, Cao L X, Wang X Y, Xu B, Zhao B R, Guo Y Q and Yang J L 2010
Phys. Rev. Lett. 104104104104 017003.
[21] Rodriguez E E, Stock C, Hsieh P-Y, Butch N P, Paglione J, and Green M A 2011
Chem. Sci. 2222 1782
[22] Koshika Y, Usui T, Adachi S, Watanabe T, Sakano K, Simayi S and Yoshizawa M
2013 J. Phys. Soc. Jpn. 82828282 023703
[23] Sun Y, Tsuchiya Y, Yamada T, Taen T, Pyon S, Shi Z and Tamegai T 2013 J. Phys.
Soc. Jpn. 82828282 093705
[24] Mizuguchi Y, Tomioka F, Tsuda S, Yamaguch T and Takano Y 2009 Physica C 469469469469
1027.
[25] Mizuguchi Y, Tomioka F, Tsuda S, Yamaguch T and Takano Y 2009 Appl. Phys. Lett.
94949494 012503

Figure captionsFigure captionsFigure captionsFigure captions
Fig.1. Temperature dependence of the magnetic susceptibility from 15 to 2 K for the
as-grown FeTe0.9Se0.1 and the sulfur-annealed 100, 200, and 300 °C for 2 hours
FeTe0.9Se0.1.
Fig. 2. Temperature dependence of the magnetic susceptibility from 15 to 2 K for the
FeTe and the FeTe0.8S0.2 samples annealed at 200 °C for 2 hours.
Fig.3. (a) Temperature dependence of the electrical resistivity for the as-grown
FeTe0.9Se0.1 and the sulfur-annealed 100, 200, and 300 °C for 2 hours FeTe0.9Se0.1 sample.
(a) At a temperature near the superconducting transition (b) from 300 to 2 K.
Fig. 4. Powder X-ray diffraction patterns for the as-grown and the sulfur-annealed
FeTe0.9Se0.1 at 200°C. The asterisks indicate the FeTe2 and FeS2 phases.
Fig. 5. SEM image and EDX mapping of FeTe0.9Se0.1. (a)(b) as-grown sample. (c)(d)
sulfur-annealed 200°C for 2 hours sample.

Fig. 6 (a) SEM image of the sulfur-annealed sample. Positions marked No 0 to 30 are
analyzed by EDX. (b) Position dependence of elemental content of Fe, Te, Se, and S.

Fig.1

Fig. 2

Fig. 3a

Fig. 3b
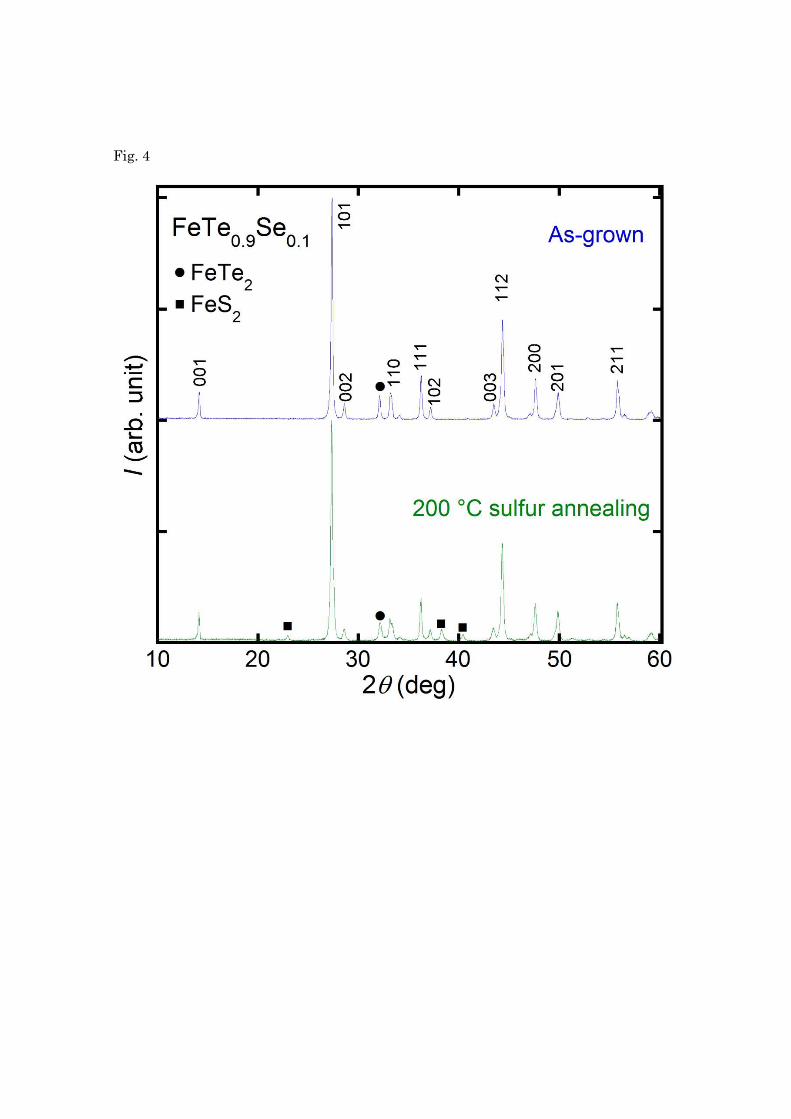
Fig. 4

Fig. 5

Fig. 6a

Fig. 6b
Related Documents