Sulfonated Surfaces by Sulfur Dioxide Plasma Surface Treatment of Plasma Polymer Films Kim S. Siow,* Leanne Britcher, Sunil Kumar, Hans J. Griesser Introduction It is well established that the surface composition of biomaterials dictates, upon contact between a material or device and a biological environment, ensuing biological processes such as competitive protein adsorption from complex media. Thus there has been a large body of literature on the fabrication of materials surfaces with various chemical compositions and the study of their bio- interfacial interactions. Early interest in sulfur containing compounds arose from the role played by the sulfate groups of heparin in anti-thrombogenicity. [1–3] Sulfate groups are also found in other glycosaminoglycans present in extra- cellular matrices, such as chondroitin sulfate, and as a charged ionic group it is likely to be an essential part in defining biological intermolecular interactions, and, hence, also some interactions between biological molecules and materials surfaces. Sulfated materials surfaces may there- fore be useful biomaterials interfaces, enabling the study of the role played by these groups in protein/surface interactions and extracellular signalling. It may, however, be easier to fabricate sulfonated surfaces, and the surface forces and effects may be very similar due to the very similar properties, such as pK, of sulfonate (CSO 3 ) and sulfate (COSO 3 ) groups on polymer surfaces. Besides biomaterials applications, sulfonate containing surfaces have been investigated as potential proton exchange membranes in fuel cell application. [4–6] SO x containing organic surfaces have been produced by bulk polymerisa- tion, [7–13] gas [14–20] or acid sulfonation, [21,22] self assembled monolayers, [23–25] and photochemical grafting. [26] These methods, however, often lead to deterioration of mechan- ical properties, [12,13] or are limited to a small number of suitable substrates. [24,25] Plasma approaches may overcome these problems, as well as providing reduced process effluent discharge. [27] Unfortunately, however, while various other biomaterials Full Paper K. S. Siow, L. Britcher, S. Kumar, H. J. Griesser Ian Wark Research Institute, University of South Australia, Mawson Lakes, SA 5095, Australia Fax: 65-68737192.; E-mail: [email protected] The preparation of thin film coatings with sulfonate and sulfate groups by plasma techniques is not straightforward due to limited volatility of suitable process vapours. We report a combination of plasma polymerisation and plasma treatment, treating heptylamine (HA-SO 2 ) and 1,7-octadiene (OD-SO 2 ) plasma polymers with sulfur dioxide plasma. HA-SO 2 and OD-SO 2 plasma polymer surfaces exhibited different com- positions with the latter showing almost twice the amount of sulfur, as well as polysulfonate. Ageing of HA-SO 2 plasma polymer surfaces in air or saline solution led to the disappearance of oligomers containing sulfonate and sulfate. Angle-dependent XPS analysis of HA-SO 2 plasma polymers suggested that sulfur containing groups reptated into the plasma polymer upon storage after preparation. Plasma Process. Polym. 2009, 6, 583–592 ß 2009 WILEY-VCH Verlag GmbH & Co. KGaA, Weinheim DOI: 10.1002/ppap.200950004 583

Welcome message from author
This document is posted to help you gain knowledge. Please leave a comment to let me know what you think about it! Share it to your friends and learn new things together.
Transcript
Full Paper
Sulfonated Surfaces by Sulfur Dioxide PlasmaSurface Treatment of Plasma Polymer Films
Kim S. Siow,* Leanne Britcher, Sunil Kumar, Hans J. Griesser
The preparation of thin film coatings with sulfonate and sulfate groups by plasma techniquesis not straightforward due to limited volatility of suitable process vapours. We report acombination of plasma polymerisation and plasma treatment, treating heptylamine (HA-SO2)and 1,7-octadiene (OD-SO2) plasma polymers withsulfur dioxide plasma. HA-SO2 and OD-SO2
plasma polymer surfaces exhibited different com-positions with the latter showing almost twicethe amount of sulfur, as well as polysulfonate.Ageing of HA-SO2 plasma polymer surfaces in airor saline solution led to the disappearance ofoligomers containing sulfonate and sulfate.Angle-dependent XPS analysis of HA-SO2 plasmapolymers suggested that sulfur containing groupsreptated into the plasma polymer upon storageafter preparation.
Introduction
It is well established that the surface composition of
biomaterials dictates, upon contact between a material or
device and a biological environment, ensuing biological
processes such as competitive protein adsorption from
complex media. Thus there has been a large body of
literature on the fabrication of materials surfaces with
various chemical compositions and the study of their bio-
interfacial interactions. Early interest in sulfur containing
compounds arose from the role played by the sulfate groups
of heparin in anti-thrombogenicity.[1–3] Sulfate groups are
also found in other glycosaminoglycans present in extra-
cellular matrices, such as chondroitin sulfate, and as a
charged ionic group it is likely to be an essential part in
defining biological intermolecular interactions, and, hence,
K. S. Siow, L. Britcher, S. Kumar, H. J. GriesserIan Wark Research Institute, University of South Australia,Mawson Lakes, SA 5095, AustraliaFax: 65-68737192.; E-mail: [email protected]
Plasma Process. Polym. 2009, 6, 583–592
� 2009 WILEY-VCH Verlag GmbH & Co. KGaA, Weinheim
also some interactions between biological molecules and
materials surfaces. Sulfated materials surfaces may there-
fore be useful biomaterials interfaces, enabling the study of
the role played by these groups in protein/surface
interactions and extracellular signalling. It may, however,
be easier to fabricate sulfonated surfaces, and the surface
forces and effects may be very similar due to the very
similar properties, such as pK, of sulfonate (C�SO3) and
sulfate (C�O�SO3) groups on polymer surfaces. Besides
biomaterials applications, sulfonate containing surfaces
have been investigated as potential proton exchange
membranes in fuel cell application.[4–6] SOx containing
organic surfaces have been produced by bulk polymerisa-
tion,[7–13] gas[14–20] or acid sulfonation,[21,22] self assembled
monolayers,[23–25] and photochemical grafting.[26] These
methods, however, often lead to deterioration of mechan-
ical properties,[12,13] or are limited to a small number of
suitable substrates.[24,25]
Plasma approaches may overcome these problems, as
well as providing reduced process effluent discharge.[27]
Unfortunately, however, while various other biomaterials
DOI: 10.1002/ppap.200950004 583
K. S. Siow, L. Britcher, S. Kumar, H. J. Griesser
584
surfaces have been produced by plasma techniques,[28] the
direct fabrication of sulfonated or sulfated plasma polymer
coatings is not straightforward, as suitable monomers have
insufficient volatility for use in conventional plasma
polymerization. Previous studies have used sulfur dioxide
(SO2)[2–4,29–33] and allyl phenyl sulfone[29] for producing
SOx-containing polymer surfaces. While allyl phenyl
sulfone has a wide process window, its low volatility is a
disadvantage.[29] There is also the question of whether
sulfones would, upon plasma processing, convert to
sulfonates and sulfates, and/or become abstracted as polar
groups often do. X-ray photoelectron spectroscopy (XPS)
analysis of the S2p signal on such surfaces showed at least
two different oxidation states, with binding energy (BE)
values centred around 163–165 and 167–169 eV, respec-
tively. The lower BE component is assignable to S in
‘‘neutral’’ environments such as S�S, S�C, S�H, and the
other component to higher oxidation states such as SO2, SO3
and SO4.[3,4,30,32] The latter three are difficult to separate and
identify with certainty, not least because of considerable
variations in reported BE values for these groups, as we
found when reviewing reports of XPS spectra recorded on
various S containing surfaces.[34]
Success of SO2 plasma treatment appears to depend on
the balance between etching and implantation of chemical
functionalities. This balance likely varies with the dis-
charge power, the pressure, the process gas flow defined by
the plasma reactor geometry, as well as the substrate.
Therefore, it is difficult to define and transfer procedures for
producing the desired surfaces. There is also the question of
changes to surface compositions upon storage (‘‘ageing’’),
which again may vary considerably with the plasma
conditions and the substrate. SO2 plasma treatments
carried out on different polymeric or carbon substrates
resulted in unstable sulfur-based functionalities that
were susceptible to post-plasma ageing.[4] Ageing can
be due to two processes: oxidation and reptation.[35,36]
The process of reptation is often small in plasma polymers
due to extensive crosslinking.[35,36] Thus, instead of SO2
plasma treating polymers, such as polyolefins and
hydrogels that undergo reptation motions, it may be
preferable to first deposit a plasma polymer coating that is
then subsequently surface-sulfonated using SO2 plasma
treatment.
We report here the SO2 plasma treatment of plasma
polymers (pps) deposited from the two monomers 1,7-
octadiene (OD) and n-heptylamine (HA). The latter was of
interest to study whether it would be possible to produce
surfaces containing different types of chemical groups.
Will the SO2 plasma treatment modify mostly the
hydrocarbon segments, or also react with amine and
hydroxyl surface groups? Comparison of these plasma
polymers might enable investigation and understanding
of how different surfaces react to SO2 plasma treatment,
Plasma Process. Polym. 2009, 6, 583–592
� 2009 WILEY-VCH Verlag GmbH & Co. KGaA, Weinheim
towards the generation of more predictable SO2 plasma
treated surfaces.
Experimental Part
Materials
MEMC prime grade silicon (100) wafers were procured from Micro
Materials and Research Consultancy, Australia. The wafers were
single-sided polished and p-type doped with boron. Silicon wafer
pieces of 1 cm2 were cut from wafers and cleaned in Piranha
solution (H2O2/H2SO4) for 10 to 15 min. CAUTION: Piranha
solution is extremely corrosive and hazardous and must only
be used by appropriately trained researchers using appropriate
safety measures. Then, the silicon pieces were washed with
copious amounts of deionized (DI) water (Millipore Milli-Q
filtration system) with a conductivity less than 0.5mS � cm�1
and a surface tension of 72.8 mN �m�1 at 20 8C. HA and OD were
obtained from Sigma-Aldrich and Fluka Australia, respectively.
Analytical grade hydrogen peroxide (30%) and sulfuric acid (98%)
were procured from Chemsupply and Southern Cross, Australia,
respectively. SO2 gas (99.98% purity) was obtained from BOC
Australia.
Plasma Deposition
Plasma processing, both polymerization and treatment, was
carried out in a custom-built reactor described elsewhere.[37] The
reactor comprised a glass cylinder of diameter 170 mm and
360 mm length, an upper electrode of two brass rods with a cross
strut and a 100 mm copper disc as the lower electrode. The plasma
chamber was pumped down to a base pressure of 0.03 Torr. Using
air as the process gas at a pressure of 0.1 Torr, the silicon
substrates were plasma cleaned for 2 min at 50 W in order to
remove residual adsorbed hydrocarbons. The residual air was then
removed and monomer vapour was fed into the chamber via
stainless steel lines with its flow controlled by a needle valve. The
reactor was powered by a commercial radiofrequency generator
(Advanced Energy RFX600) capable of delivering variable power
levels up to 600 W at 13.56 MHz via an impedance matching
network. For plasma polymerization of HA and OD, the rf power
levels used were 50 W and 10 W, respectively. The ODpp required
a deposition time of 5 min, while the HApp required only 90 s to
achieve a thickness >10 nm as assessed by absence of an XPS
signal from the Si substrate. After plasma polymerization, SO2
plasma treatment was carried out on the pp coated substrates at a
pressure of 0.3�0.1 Torr and a power level of 30 W for 3 min.
Plasma treated samples were then left in the chamber for 5–
10 min prior to venting.
Analytical Techniques
X-Ray Photoelectron Spectroscopy
XPS analysis was carried out on a Kratos AXIS Ultra DLD
spectrometer (Kratos Analytical, UK) equipped with a monochro-
DOI: 10.1002/ppap.200950004
Sulfonated Surfaces by Sulfur Dioxide Plasma Surface Treatment . . .
matic Al Ka radiation source (hv¼1486.6 eV) operating at a power
of 150 W (15 kV�10 mA). The take-off angle was 908 to the sample
surface except for the angle-dependent measurements. The
pressure in the main chamber was <10�9 mbar during analysis.
XPS survey spectra were recorded over the energy range 0–1 100 eV
at a pass energy of 160 eV with 1.0 eV resolution. High resolution
C1s, S2p and N1s signals were recorded at a pass energy of 20 eV
with 0.1 eV resolution. No changes in the spectra or other evidence
of radiation damage were observed during the analysis of the
plasma polymers.
The linearity of the XPS binding energy scale was confirmed
and calibrated periodically. This calibration is required to ensure
that the binding energy values for other elements are correct
when calculated via setting the ‘‘neutral’’ C peak (i.e. C�C and
C�H components) to 285.0 eV and thereby determining the
charge shift. S2p, C1s, O1s and N1s signals were acquired for the
quantification of elemental compositions in the survey scans.
High resolution peaks of the elements were also recorded for
component fitting. The S2p signal was used rather than S2s; the
Kratos library accounts for the different angular asymmetry
factors for s and p orbitals.
Samples were stored in tissue culture polystyrene petri dishes
(which, being free of additives, avoid contamination issues on
storage) at ambient temperature for various ageing periods, from
1 to 15 d. To avoid accumulation of radiation damage, replicate
samples not previously analyzed were used for each analysis.
Component fitting of the high resolution C1s, S2p and N1s
signals was carried out with CasaXPS software version 2.3.12. The
full width half maximum (FWHM) values used for fitting the C1s
and S2p peaks varied between 0.9 and 1.8 eV. We observe generally
for plasma polymers that the N and other heteroatom signals have
a greater FWHM than the C1s signal; this may be due to
inhomogeneous broadening arising from a larger range of bond
angles accessible to atoms that have fewer covalent bonds than C.
Within a single peak, the same FWHM was used for all components
to maintain consistency and optimization for comparisons
between different samples.[38,39] Due to the variations in the
literature, the binding energies of different oxidation states of
sulfur, to be fitted in the high resolution peaks, were calibrated from
model compounds.[34] Based on this exercise, the following
binding energies were used for the different oxidation states of
sulfur compounds: sulfate SO4 (168.8�0.2 eV), sulfonate SO3
(168.4�0.2 eV), sulfone SO2 (168.1�0.2 eV) and sulfoxide SO
(167.5�0.2 eV).[34] The line shapes of the peaks were assumed to
be Gaussian-Lorentzian with a 30% Lorentzian components and a
Shirley-type background was used throughout the analysis. Since
the S2p peak is a doublet, the following curve fitting criteria were
also applied: the area under the S2p1/2 peak was 50% of the area
under the S2p3/2 peak and the BE difference between the two peaks
was set to 1.2 eV.[40,41]
Since XPS is used here to compare different treatments
and processes, precision of the instrument is more important
than its accuracy. Systematic errors are not included in this
study. It is reasonable to assume that the systematic errors
associated with curve fitting and instrumental settings remain
constant throughout this study. The random error of the atomic
concentrations measured by XPS is assumed to obey the following
guidelines:
Plasma Process. Polym. 2009, 6, 583–592
� 2009 WILEY-VCH Verlag GmbH & Co. KGaA, Weinheim
i. I
f the atomic concentration is more than 5%, the uncertainty is5% of the value.
ii. I
f the atomic concentration is between 1% and 5%, theuncertainty is 10% of the value.
iii. I
f the atomic concentration is 1% or less, the uncertainty is 20%and increasing with decreasing absolute values.
For the calculation of the ratios O/C, O/S, and S/C, the following
formula was used. In a typical division between two parameters
(A� EA) and (B� EB), the error of the quotient is:[42]
Equotient ¼A
B
ffiffiffiffiffiffiffiffiffiffiffiffiffiffiffiffiffiffiffiffiffiffiffiffiffiffiffiffiffiffiffiffiEAA
� �2
þ EBB
� �2s
ð1Þ
‘‘A’’ and ‘‘B’’ are the variables. ‘‘EA’’ and ‘‘EB’’ are the errors of
uncertainty associated with the variables which are independent
and random. The error of uncertainty is based on the above
mentioned guidelines. In the current context, the error of
uncertainty is also known as the ‘‘standard deviation (stdev /sm)’’.
Attenuated Total Reflectance- Infra Red Spectroscopy
(ATR-FTIR)
Plasma polymers were deposited onto a 458ZnSe crystal, which was
then placed into a Harrick single internal reflectance attachment.
Infrared spectra were recorded in the range 600 to 1 500 cm�1 over
500 scans at a resolution of 5 cm�1 using a Nicolet FTIR spectro-
meter fitted with a MCT-B detector.
Results and Discussions
XPS Analysis
Visual observations indicated that both OD and HA
produced uniform plasma polymer coatings, and their
appearance did not change upon SO2 plasma treatment.
Ageing studies of HA plasma polymer have been reported
earlier by others[43–45] and serve as a baseline for our
observations. The oxidation of octadiene plasma polymer
can reasonably be expected to be analogous to that of
hexane plasma polymer, which has been reported ear-
lier.[46,47] We did not carry out ageing studies with OD pp
because the SO2 plasma treatment may alter the oxidative
processes and will mask any oxygen uptake from the OD pp
by itself.
In this current study, XPS analysis showed a higher
extent of sulfur incorporation into the OD plasma polymer
compared with the HA pp (Table 1). Oxygen is also present;
this will be discussed below in terms of post-plasma ageing.
For the HApp, the N percentage is, after accounting for the
presence of S, close to that reported in previous studies of
HApp films deposited using the same plasma equip-
ment[37,44] and to the value prior to SO2 plasma treatment,
www.plasma-polymers.org 585
K. S. Siow, L. Britcher, S. Kumar, H. J. Griesser
Table 1. Elemental compositions, in at.-%, of HA-SO2 and OD-SO2plasma polymers determined by XPS.
Sample Element
at.-%
C1s N1s O1s S2p
ODpp 98.4 0 1.6 0
OD-SO2 pp 64.2 0 27.6 8.2
HA pp 86.7 11.3 2.0 0
HA-SO2 pp 69.5 10.2 15.3 5.0
586
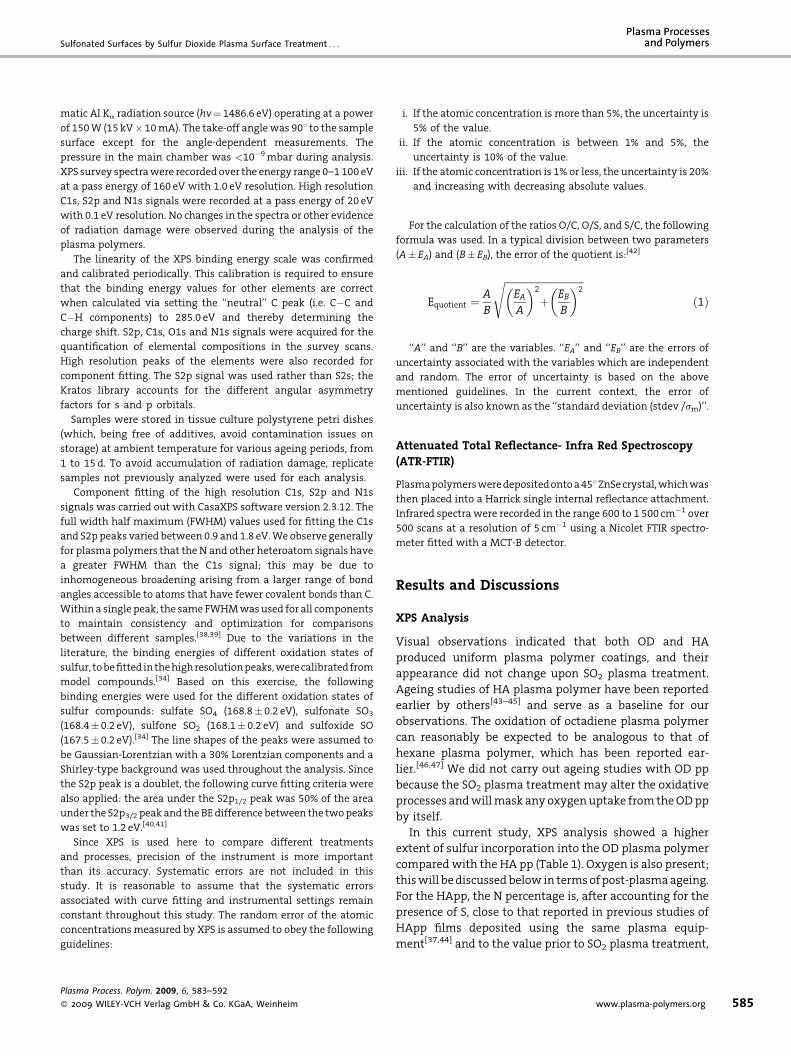
indicating that this treatment did not significantly ablate
surface amine groups. The nature of the S-containing
groups was investigated using high resolution scans of the
S2p peaks (Figure 1) and component fitting, using
constrained fitting procedures and BE reference values
obtained with model compounds.[34] Results from compo-
nent fitting of the S2p photoelectron peaks of Figure 1 are
tabulated in Table 2. Clearly, the results of SO2 plasma
treatment vary with the plasma polymer being treated. It is
evident from these results that the approach of SO2 plasma
treatment of these two plasma polymers was successful in
generating sulfur moieties with higher oxidation states.
The component fitting shows for the OD-SO2 plasma
polymer surface three types of S environments, one being
‘‘neutral’’ sulfur species (S�S, S�C and S�H) and two being
oxidized sulfur species. The observed binding energies
suggest that a significant fraction is S with four surrounding
oxygen atoms, and the signals can be assigned to both
sulfate and persulfate (C�O�O�SO3). Their respective
ranges of BE values are 164.0–1, 168.9–169.1 and 169.6–
7 eV. While the identity of S with a binding energy of 169.6–
7 eV cannot be verified independently as persulfate, as no
suitable reference data or reference compounds were
Figure 1. S2p peaks of HA-SO2 and OD-SO2 plasma polymers,recorded 1 d after fabrication.
Plasma Process. Polym. 2009, 6, 583–592
� 2009 WILEY-VCH Verlag GmbH & Co. KGaA, Weinheim
found, this putative structure appears reasonable in order
to produce such a high BE value; an alternative assignment
would be polysulfate, but it is not clear how this should be
produced. The highest oxidation state of S for which XPS
data exists is SO4, and all reported binding energies of SO4 do
not exceed 169.0 eV (all values were calibrated against
‘‘neutral’’ C at 285.0 eV).[34] In the case of HA-SO2 plasma
polymer surface, the chemical groups present are different.
Again ‘‘neutral’’ S is observed, and the oxidized S exists in a
variety of groups. Due to the small BE difference, we have
not attempted to separate SO and SO2 components. We
emphasize that there is also considerable uncertainty in the
quantitative fitting of the SO4 component due to its close
proximity of SO3 and SO4. However, it is clear that oxidised S
species are produced in substantial amounts, and that
higher oxidation states appear on the OD-SO2 surface. Based
on the data listed in Table 2, 67% of the S in the OD-SO2
plasma polymer consisted of SO3 and SO4 moieties or higher
oxidation states, while the percentage of S in the SO3 and
SO4 states in the HA-SO2 plasma polymer was 59%. The
additional presence of persulfate groups in the OD-SO2
plasma polymer increased the O/S ratios to 3.36 (�0.24)
compared with the ratio obtained for the HA-SO2 plasma
polymer of 3.07 (�0.34).
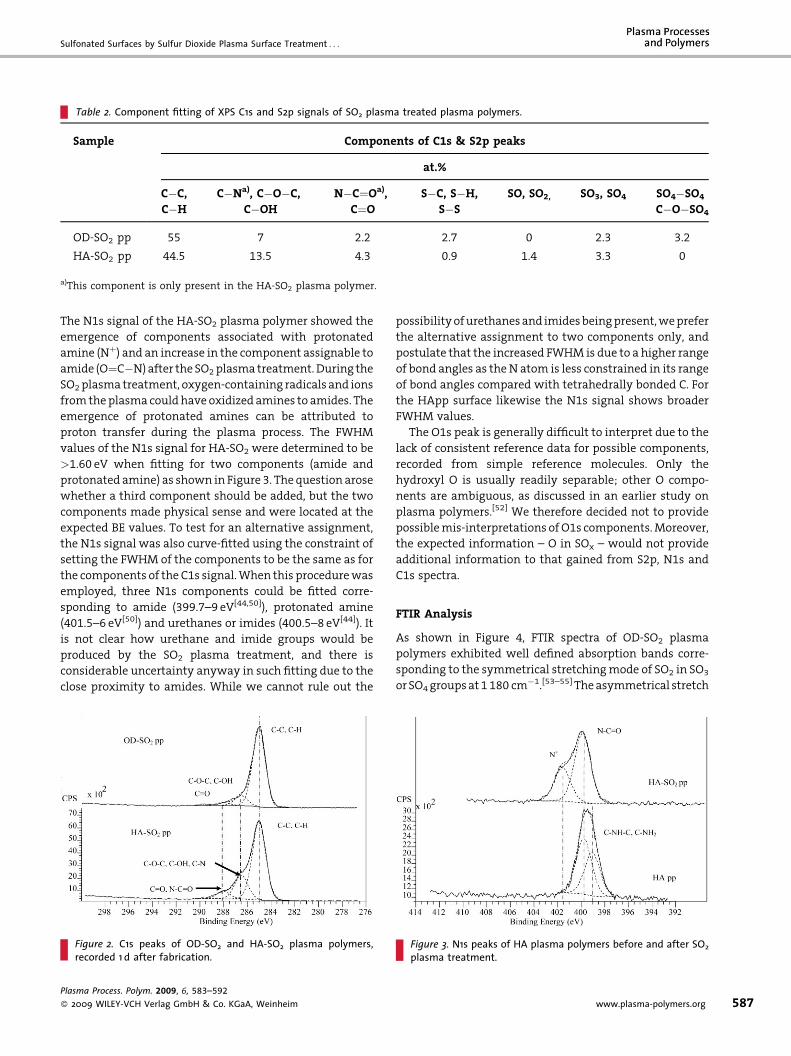
Component fitted C1s peaks for the two SO2-treated
plasma polymers are shown in Figure 2, and fit results are
listed in Table 2. C in C�S and C�O�S bonds was expected to
give rise to a component at�286.5 eV; we did not attempt to
fit them separately in the absence of reliable reference data
and in light of the finite signal-to-noise ratio of these
spectra. The HA-SO2 plasma polymer surface was found to
have a higher intensity of the component located at a BE of
286.5 eV than the OD-SO2 plasma polymer; this can be
assigned to the presence of C�N bonds in the former. Other
bonds possibly associated with this component at 286.5 eV
are C�O�C and C�OH; we will return to this in the
discussion on ageing. Again due to the close proximity of
expected BE values,[48] it is not meaningful to fit for separate
C�S/C�O�S and C�O�C/C�O�H components. The per-
centage of the C¼O component in the HA-SO2 plasma
polymer was also higher than for the OD-SO2 plasma
polymer, primarily because of an additional contribution
from amide N�C¼O C due to post-plasma oxidation of the
HA plasma polymer.[44] In the case of the HA-SO2 plasma
polymer, SO2 plasma might also react with amine groups to
form sulfonamides. However, the binding energies of
sulfonamide S2p was reported to be 168.8 eV,[49] which
overlaps with the SO3 and SO4 signals. The presence of
sulfonamide groups was, instead, probed by FTIR spectra
(below).
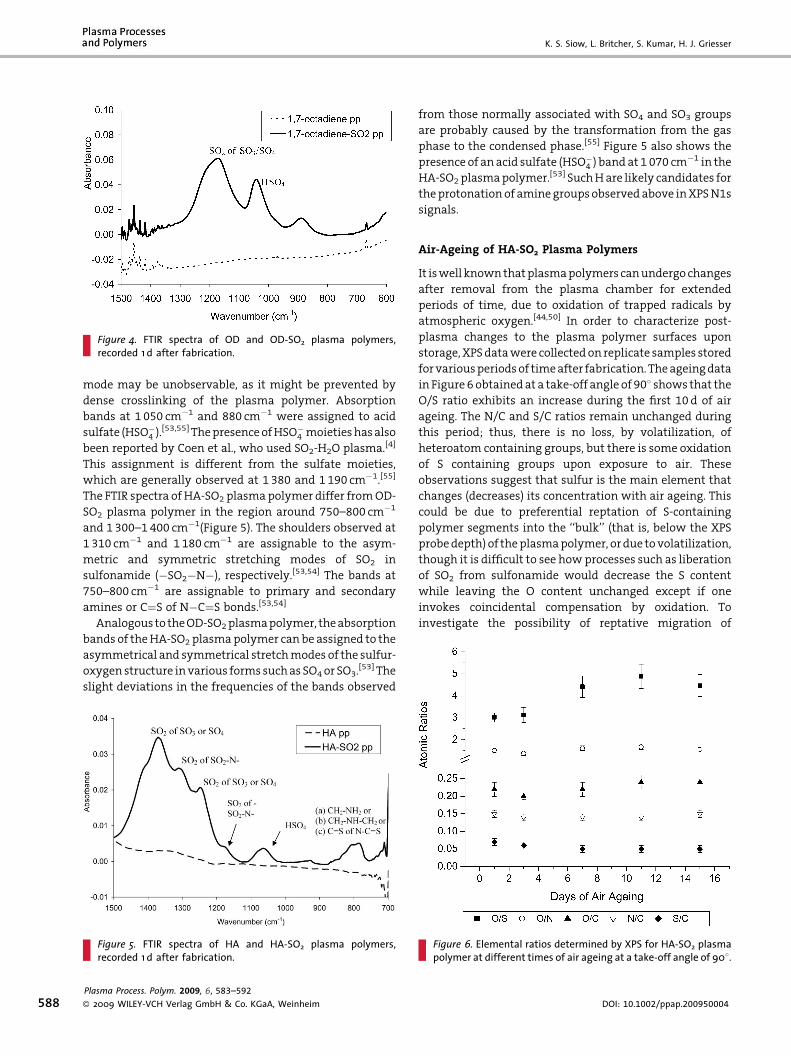
As shown in Figure 3, the N1s signal of the HApp showed
a combination of amine and amide groups, with the latter
produced by post-plasma oxidation between fabrication
and analysis as shown by earlier studies of HApp films.[50,51]
DOI: 10.1002/ppap.200950004
Sulfonated Surfaces by Sulfur Dioxide Plasma Surface Treatment . . .
Table 2. Component fitting of XPS C1s and S2p signals of SO2 plasma treated plasma polymers.
Sample Components of C1s & S2p peaks
at.%
C�C,
C�H
C�Na), C�O�C,
C�OH
N�C¼Oa),
C¼O
S�C, S�H,
S�S
SO, SO2, SO3, SO4 SO4�SO4
C�O�SO4
OD-SO2 pp 55 7 2.2 2.7 0 2.3 3.2
HA-SO2 pp 44.5 13.5 4.3 0.9 1.4 3.3 0
a)This component is only present in the HA-SO2 plasma polymer.
The N1s signal of the HA-SO2 plasma polymer showed the
emergence of components associated with protonated
amine (Nþ) and an increase in the component assignable to
amide (O¼C�N) after the SO2 plasma treatment. During the
SO2 plasma treatment, oxygen-containing radicals and ions
from the plasma could have oxidized amines to amides. The
emergence of protonated amines can be attributed to
proton transfer during the plasma process. The FWHM
values of the N1s signal for HA-SO2 were determined to be
>1.60 eV when fitting for two components (amide and
protonated amine) as shown in Figure 3. The question arose
whether a third component should be added, but the two
components made physical sense and were located at the
expected BE values. To test for an alternative assignment,
the N1s signal was also curve-fitted using the constraint of
setting the FWHM of the components to be the same as for
the components of the C1s signal. When this procedure was
employed, three N1s components could be fitted corre-
sponding to amide (399.7–9 eV[44,50]), protonated amine
(401.5–6 eV[50]) and urethanes or imides (400.5–8 eV[44]). It
is not clear how urethane and imide groups would be
produced by the SO2 plasma treatment, and there is
considerable uncertainty anyway in such fitting due to the
close proximity to amides. While we cannot rule out the
Figure 2. C1s peaks of OD-SO2 and HA-SO2 plasma polymers,recorded 1 d after fabrication.
Plasma Process. Polym. 2009, 6, 583–592
� 2009 WILEY-VCH Verlag GmbH & Co. KGaA, Weinheim
possibility of urethanes and imides being present, we prefer
the alternative assignment to two components only, and
postulate that the increased FWHM is due to a higher range
of bond angles as the N atom is less constrained in its range
of bond angles compared with tetrahedrally bonded C. For
the HApp surface likewise the N1s signal shows broader
FWHM values.
The O1s peak is generally difficult to interpret due to the
lack of consistent reference data for possible components,
recorded from simple reference molecules. Only the
hydroxyl O is usually readily separable; other O compo-
nents are ambiguous, as discussed in an earlier study on
plasma polymers.[52] We therefore decided not to provide
possible mis-interpretations of O1s components. Moreover,
the expected information – O in SOx – would not provide
additional information to that gained from S2p, N1s and
C1s spectra.
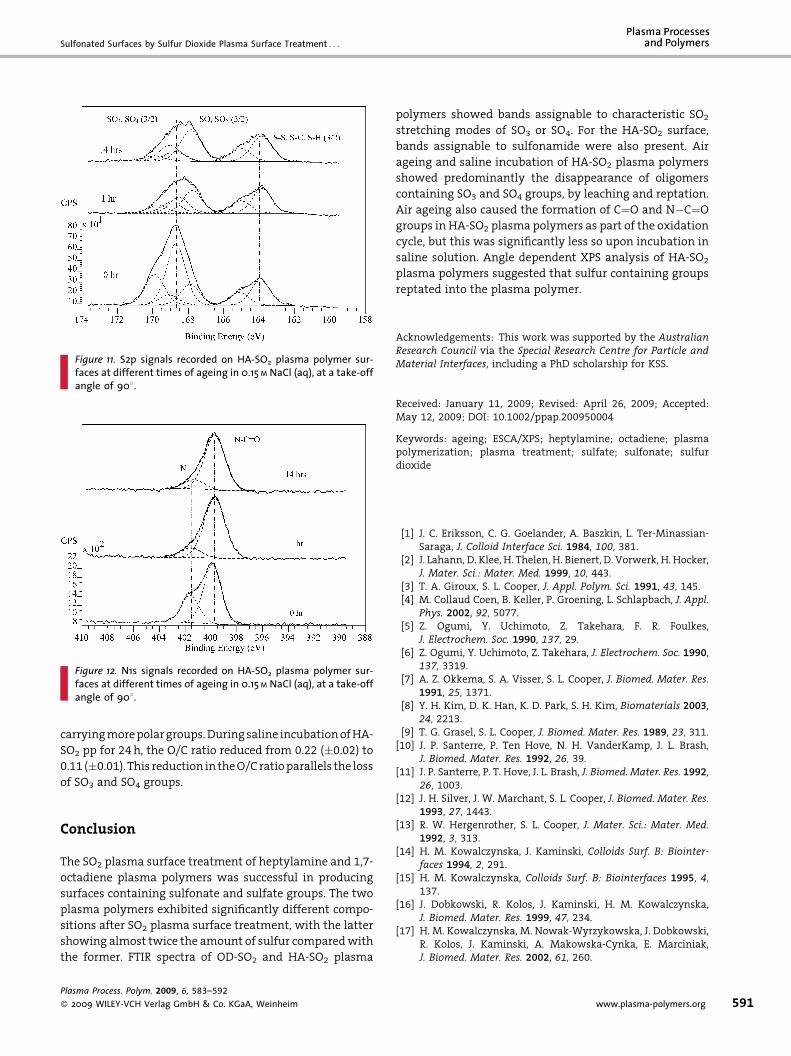
FTIR Analysis
As shown in Figure 4, FTIR spectra of OD-SO2 plasma
polymers exhibited well defined absorption bands corre-
sponding to the symmetrical stretching mode of SO2 in SO3
or SO4 groups at 1 180 cm�1.[53–55] The asymmetrical stretch
Figure 3. N1s peaks of HA plasma polymers before and after SO2plasma treatment.
www.plasma-polymers.org 587
K. S. Siow, L. Britcher, S. Kumar, H. J. Griesser
Figure 4. FTIR spectra of OD and OD-SO2 plasma polymers,recorded 1 d after fabrication.
588
mode may be unobservable, as it might be prevented by
dense crosslinking of the plasma polymer. Absorption
bands at 1 050 cm�1 and 880 cm�1 were assigned to acid
sulfate (HSO�4 ).[53,55] The presence of HSO�
4 moieties has also
been reported by Coen et al., who used SO2-H2O plasma.[4]
This assignment is different from the sulfate moieties,
which are generally observed at 1 380 and 1 190 cm�1.[55]
The FTIR spectra of HA-SO2 plasma polymer differ from OD-
SO2 plasma polymer in the region around 750–800 cm�1
and 1 300–1 400 cm�1(Figure 5). The shoulders observed at
1 310 cm�1 and 1 180 cm�1 are assignable to the asym-
metric and symmetric stretching modes of SO2 in
sulfonamide (�SO2�N�), respectively.[53,54] The bands at
750–800 cm�1 are assignable to primary and secondary
amines or C¼S of N�C¼S bonds.[53,54]
Analogous to the OD-SO2 plasma polymer, the absorption
bands of the HA-SO2 plasma polymer can be assigned to the
asymmetrical and symmetrical stretch modes of the sulfur-
oxygen structure in various forms such as SO4 or SO3.[53] The
slight deviations in the frequencies of the bands observed
Figure 5. FTIR spectra of HA and HA-SO2 plasma polymers,recorded 1 d after fabrication.
Plasma Process. Polym. 2009, 6, 583–592
� 2009 WILEY-VCH Verlag GmbH & Co. KGaA, Weinheim
from those normally associated with SO4 and SO3 groups
are probably caused by the transformation from the gas
phase to the condensed phase.[55] Figure 5 also shows the
presence of an acid sulfate (HSO�4 ) band at 1 070 cm�1 in the
HA-SO2 plasma polymer.[53] Such H are likely candidates for
the protonation of amine groups observed above in XPS N1s
signals.
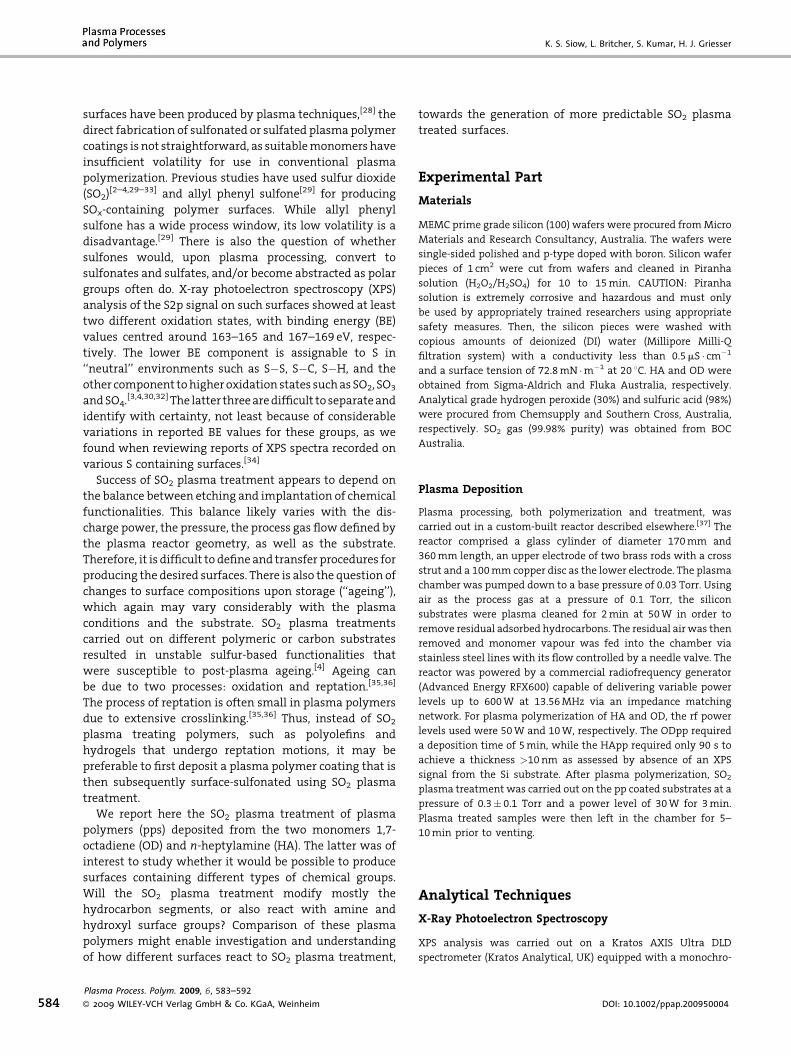
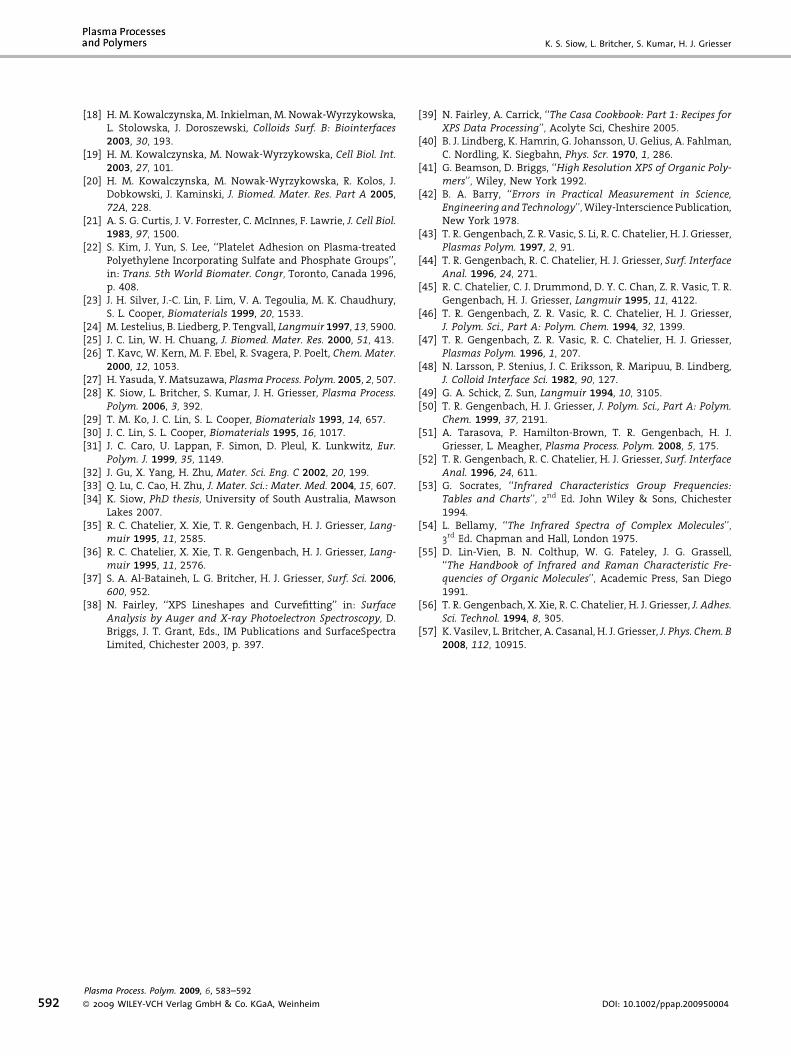
Air-Ageing of HA-SO2 Plasma Polymers
It is well known that plasma polymers can undergo changes
after removal from the plasma chamber for extended
periods of time, due to oxidation of trapped radicals by
atmospheric oxygen.[44,50] In order to characterize post-
plasma changes to the plasma polymer surfaces upon
storage, XPS data were collected on replicate samples stored
for various periods of time after fabrication. The ageing data
in Figure 6 obtained at a take-off angle of 908 shows that the
O/S ratio exhibits an increase during the first 10 d of air
ageing. The N/C and S/C ratios remain unchanged during
this period; thus, there is no loss, by volatilization, of
heteroatom containing groups, but there is some oxidation
of S containing groups upon exposure to air. These
observations suggest that sulfur is the main element that
changes (decreases) its concentration with air ageing. This
could be due to preferential reptation of S-containing
polymer segments into the ‘‘bulk’’ (that is, below the XPS
probe depth) of the plasma polymer, or due to volatilization,
though it is difficult to see how processes such as liberation
of SO2 from sulfonamide would decrease the S content
while leaving the O content unchanged except if one
invokes coincidental compensation by oxidation. To
investigate the possibility of reptative migration of
Figure 6. Elemental ratios determined by XPS for HA-SO2 plasmapolymer at different times of air ageing at a take-off angle of 908.
DOI: 10.1002/ppap.200950004

Sulfonated Surfaces by Sulfur Dioxide Plasma Surface Treatment . . .
Figure 7. S2p signals recorded on HA-SO2 plasma polymer surfacesat different times of air ageing, at a take-off angle of 908. Thepeaks are normalized to the same intensity at 164 eV.
Figure 8. Fitted percentages of components in the S2p signals ofHA-SO2 plasma polymer at different times of air ageing, at a take-off angle of 908.
polymer segments containing sulfur moieties, angle-
dependent XPS (ADXPS) was carried out at take-off angles
of 158 and 908 to compare the concentrations of sulfur
present within the top�2�3 nm and 9–10 nm, respectively.
This technique allowed us to study the possible migration of
sulfur containing groups into the plasma polymer, a
migration driven by translational entropy caused by the
high density of sulfur groups on the surface.
The S/C ratios at 908 were measured to be approximately
0.061� 0.006 independent of ageing, while the S/C ratios at
158 registered a decrease from 0.072 (�0.008) to 0.039
(�0.004) from 3 d to 15 d of ageing. The observed reduction
of the S/C ratio at a take-off angle of 158 suggests that sulfur-
containing polymer segments either reptate into the
plasma polymer ‘‘bulk’’ or volatilize into the atmosphere.
If sulfur moieties had volatilized, the S/C ratios at a take off
angle of 908 would be expected to decrease to a measurable
extent. If the reptation of sulfur moieties occurs only within
the top 10 nm, the S/C ratios recorded at 908 would
maintain similar values during the ageing period, as it is
observed. Evidently, the polar groups are driven from the
immediate air interface but end up in near-surface regions;
it appears reasonable to assume that the high crosslink
density, typical of plasma polymers, prevents long-range
migration of segments. The available results suggest that
the reptation mechanism is operational.
High resolution S2p signals were used to study whether
this putative reptation mechanism would show any
discrimination between the various S-containing species.
The S2p signals are shown in Figure 7 and the fitted
intensities of components are plotted in Figure 8 as a
function of ageing time, along with the total S %. These
results suggest that the time dependence of the S-contain-
ing groups is governed by two phenomena. One is reptation,
which seems to reduce the concentration of all S-containing
groups in the top 2–3 nm with time, but appears to do so to a
higher extent for the groups with a higher oxidation state.
This is reasonable, as more polar groups are less favoured
energetically at a polymer/air interface; thus, there is a
greater interfacial energy drive for the reptation of polymer
segments carrying SOx groups compared with those
bearing ‘‘neutral’’ S containing groups. However, the data
show that with time, the proportion of oxidized S species
increases again. This can be assigned to oxidation; its effect
becomes more evident as reptation slows down. Remaining
sulfur groups continued to be oxidized, which resulted in an
increase of the SO2/SO3/SO4 components after the first
week of air ageing (Figure 8). Thus, there is evidence of some
post-plasma oxidation, although the extent is minor
compared with the oxidation of amine plasma poly-
mers.[44,50,56]
In the case of the O/C ratios, ADXPS analysis of HA-SO2
plasma polymer samples showed an increase from 0.25
(�0.02) to 0.37 (�0.03) at a take off angle of 158, while the
Plasma Process. Polym. 2009, 6, 583–592
� 2009 WILEY-VCH Verlag GmbH & Co. KGaA, Weinheim
ratios at a take off angle of 908 are maintained at 0.27–0.28
(�0.02). This parallels the trend of the S/C ratios at these two
take off angles during the same period of ageing. These
observations suggest that the oxidation of the HA-SO2
plasma polymer was restricted to the top few nanometers
over this time period. The results from component fitting of
C1s signals of air-aged HA-SO2 plasma polymer samples
obtained at a take-off angle of 908 are shown in Figure 9.
These signals show the formation of C¼O and N�C¼O
groups in the HA-SO2 plasma polymer. Rapid oxidation
occurred within the first 7 d, but slowed down thereafter.
www.plasma-polymers.org 589

K. S. Siow, L. Britcher, S. Kumar, H. J. Griesser
Figure 9. C1s signals recorded on HA-SO2 plasma polymer surfacesat different times of air ageing, at a take-off angle of 908.
590
This ageing behaviour is similar to the oxidation of amine
plasma polymers, where the post-plasma oxidation of
radicals on the carbon atoms dominated the reaction
pathway.[50,56] Again, however, the changes are smaller in
comparison with pure amine plasma polymers. The N/C
ratios observed at take-off angles of 908 and 158 did not
show any significant variation, with values of 0.15–0.16
(�0.01). Figure 10 shows component-fitted N1s photoelec-
tron peaks for the HA-SO2 samples air-aged up to 15 d. The
atomic percentage of amide and protonated amine remains
relatively stable at 7.1 (�0.4) and 3.1 (�0.3) at.-%,
respectively, during this period. There is no evidence of
additional oxidation, to produce species such as nitroso and
nitro groups.
Saline Solution Ageing of the HA-SO2 PlasmaPolymers
For applications in the biomaterials and bio-diagnostics
fields, the behaviour of materials surfaces when exposed to
Figure 10. N1s signals recorded on HA-SO2 plasma polymer sur-faces at different times of air ageing, at a take-off angle of 908.
Plasma Process. Polym. 2009, 6, 583–592
� 2009 WILEY-VCH Verlag GmbH & Co. KGaA, Weinheim
saline aqueous solutions is an important aspect. The
presence of some low molecular weight oligomeric
components in HA plasma polymers, albeit without SO2
plasma treatment, has been demonstrated recently.[57]
Table 3 shows chemical composition data recorded on HA-
SO2 plasma polymer surfaces upon incubation in 0.15 M
NaCl for 1, 14 and 24 h. Comparison of the data in Table 3
with the data of the non-incubated plasma polymer in
Table 1 shows that within the first hour of immersion, the S
percentage drops by 50%, from 5.0 to 2.5. As shown in
Table 3, the subsequently recorded data are within
experimental uncertainty; thus, the effects caused by
immersion in saline occur predominantly within the first
hour. From the component fitted S2p signals shown in
Figure 11, we can infer that the components associated with
SO3 and SO4 groups were reduced from 2.8 (�0.3) at % to 0.6
(�0.1) at.-% within the first hour of incubation. By an
incubation time of 14 h, the percentage of the SO3 and SO4
groups reduced further to 0.4 (�0.1) at.-%. The other
components approximately maintained their composition
during the entire period of incubation. These observations
can be rationalized by postulating that lower molecular
weight fragments of the polymer bearing polar, oxidized S
species are extracted by the aqueous solution. The
attachment of SO3 and SO4 groups may be associated with
decreased local crosslinking, thus leading to preferential
extraction of material carrying such groups.
During saline incubation, the N/C ratio obtained at a take
off angle of 908 reduced from 0.15� 0.01 to 0.11 (�0.01) for
the HA-SO2 plasma polymer upon incubation for 24 h.
Results from component fitting of the N1s peaks of the HA-
SO2 plasma polymer during incubation in 0.15 M NaCl
solution are displayed in Figure 12. The protonated amine
component at 401.3–401.6 eV reduced from 3.2% (�0.2%) to
1.24% (�0.1%) after 14 h of saline incubation. At the same
time, the component associated with amide at 399.7–9 eV
remained at approximately 7.6% (�0.6%) throughout the
14 h of incubation in saline solution. Again, this preferential
loss of the more polar components could be rationalized by
higher solubility in aqueous solution of polymer molecules
Table 3. Elemental compositions (in at.-%) determined by XPS onHA-SO2 plasma polymer samples incubated for 1, 14 and 24 h in0.15 M NaCl aqueous solution.
Sample Element
at.-%
C1s N1s O1s S2p
HA-SO2 pp incubated 1 h 78.8 9.6 9.1 2.5
HA-SO2 pp incubated 14 h 79.6 8.9 9.1 2.5
HA-SO2 pp incubated 24 h 80.4 8.5 8.8 2.3
DOI: 10.1002/ppap.200950004
Sulfonated Surfaces by Sulfur Dioxide Plasma Surface Treatment . . .
Figure 11. S2p signals recorded on HA-SO2 plasma polymer sur-faces at different times of ageing in 0.15 M NaCl (aq), at a take-offangle of 908.
Figure 12. N1s signals recorded on HA-SO2 plasma polymer sur-faces at different times of ageing in 0.15 M NaCl (aq), at a take-offangle of 908.
carrying more polar groups. During saline incubation of HA-
SO2 pp for 24 h, the O/C ratio reduced from 0.22 (�0.02) to
0.11 (�0.01). This reduction in the O/C ratio parallels the loss
of SO3 and SO4 groups.
Conclusion
The SO2 plasma surface treatment of heptylamine and 1,7-
octadiene plasma polymers was successful in producing
surfaces containing sulfonate and sulfate groups. The two
plasma polymers exhibited significantly different compo-
sitions after SO2 plasma surface treatment, with the latter
showing almost twice the amount of sulfur compared with
the former. FTIR spectra of OD-SO2 and HA-SO2 plasma
Plasma Process. Polym. 2009, 6, 583–592
� 2009 WILEY-VCH Verlag GmbH & Co. KGaA, Weinheim
polymers showed bands assignable to characteristic SO2
stretching modes of SO3 or SO4. For the HA-SO2 surface,
bands assignable to sulfonamide were also present. Air
ageing and saline incubation of HA-SO2 plasma polymers
showed predominantly the disappearance of oligomers
containing SO3 and SO4 groups, by leaching and reptation.
Air ageing also caused the formation of C¼O and N�C¼O
groups in HA-SO2 plasma polymers as part of the oxidation
cycle, but this was significantly less so upon incubation in
saline solution. Angle dependent XPS analysis of HA-SO2
plasma polymers suggested that sulfur containing groups
reptated into the plasma polymer.
Acknowledgements: This work was supported by the AustralianResearch Council via the Special Research Centre for Particle andMaterial Interfaces, including a PhD scholarship for KSS.
Received: January 11, 2009; Revised: April 26, 2009; Accepted:May 12, 2009; DOI: 10.1002/ppap.200950004
Keywords: ageing; ESCA/XPS; heptylamine; octadiene; plasmapolymerization; plasma treatment; sulfate; sulfonate; sulfurdioxide
[1] J. C. Eriksson, C. G. Goelander, A. Baszkin, L. Ter-Minassian-Saraga, J. Colloid Interface Sci. 1984, 100, 381.
[2] J. Lahann, D. Klee, H. Thelen, H. Bienert, D. Vorwerk, H. Hocker,J. Mater. Sci.: Mater. Med. 1999, 10, 443.
[3] T. A. Giroux, S. L. Cooper, J. Appl. Polym. Sci. 1991, 43, 145.[4] M. Collaud Coen, B. Keller, P. Groening, L. Schlapbach, J. Appl.
Phys. 2002, 92, 5077.[5] Z. Ogumi, Y. Uchimoto, Z. Takehara, F. R. Foulkes,
J. Electrochem. Soc. 1990, 137, 29.[6] Z. Ogumi, Y. Uchimoto, Z. Takehara, J. Electrochem. Soc. 1990,
137, 3319.[7] A. Z. Okkema, S. A. Visser, S. L. Cooper, J. Biomed. Mater. Res.
1991, 25, 1371.[8] Y. H. Kim, D. K. Han, K. D. Park, S. H. Kim, Biomaterials 2003,
24, 2213.[9] T. G. Grasel, S. L. Cooper, J. Biomed. Mater. Res. 1989, 23, 311.
[10] J. P. Santerre, P. Ten Hove, N. H. VanderKamp, J. L. Brash,J. Biomed. Mater. Res. 1992, 26, 39.
[11] J. P. Santerre, P. T. Hove, J. L. Brash, J. Biomed. Mater. Res. 1992,26, 1003.
[12] J. H. Silver, J. W. Marchant, S. L. Cooper, J. Biomed. Mater. Res.1993, 27, 1443.
[13] R. W. Hergenrother, S. L. Cooper, J. Mater. Sci.: Mater. Med.1992, 3, 313.
[14] H. M. Kowalczynska, J. Kaminski, Colloids Surf. B: Biointer-faces 1994, 2, 291.
[15] H. M. Kowalczynska, Colloids Surf. B: Biointerfaces 1995, 4,137.
[16] J. Dobkowski, R. Kolos, J. Kaminski, H. M. Kowalczynska,J. Biomed. Mater. Res. 1999, 47, 234.
[17] H. M. Kowalczynska, M. Nowak-Wyrzykowska, J. Dobkowski,R. Kolos, J. Kaminski, A. Makowska-Cynka, E. Marciniak,J. Biomed. Mater. Res. 2002, 61, 260.
www.plasma-polymers.org 591
K. S. Siow, L. Britcher, S. Kumar, H. J. Griesser
592
[18] H. M. Kowalczynska, M. Inkielman, M. Nowak-Wyrzykowska,L. Stolowska, J. Doroszewski, Colloids Surf. B: Biointerfaces2003, 30, 193.
[19] H. M. Kowalczynska, M. Nowak-Wyrzykowska, Cell Biol. Int.2003, 27, 101.
[20] H. M. Kowalczynska, M. Nowak-Wyrzykowska, R. Kolos, J.Dobkowski, J. Kaminski, J. Biomed. Mater. Res. Part A 2005,72A, 228.
[21] A. S. G. Curtis, J. V. Forrester, C. McInnes, F. Lawrie, J. Cell Biol.1983, 97, 1500.
[22] S. Kim, J. Yun, S. Lee, ‘‘Platelet Adhesion on Plasma-treatedPolyethylene Incorporating Sulfate and Phosphate Groups’’,in: Trans. 5th World Biomater. Congr, Toronto, Canada 1996,p. 408.
[23] J. H. Silver, J.-C. Lin, F. Lim, V. A. Tegoulia, M. K. Chaudhury,S. L. Cooper, Biomaterials 1999, 20, 1533.
[24] M. Lestelius, B. Liedberg, P. Tengvall, Langmuir 1997, 13, 5900.[25] J. C. Lin, W. H. Chuang, J. Biomed. Mater. Res. 2000, 51, 413.[26] T. Kavc, W. Kern, M. F. Ebel, R. Svagera, P. Poelt, Chem. Mater.
2000, 12, 1053.[27] H. Yasuda, Y. Matsuzawa, Plasma Process. Polym. 2005, 2, 507.[28] K. Siow, L. Britcher, S. Kumar, J. H. Griesser, Plasma Process.
Polym. 2006, 3, 392.[29] T. M. Ko, J. C. Lin, S. L. Cooper, Biomaterials 1993, 14, 657.[30] J. C. Lin, S. L. Cooper, Biomaterials 1995, 16, 1017.[31] J. C. Caro, U. Lappan, F. Simon, D. Pleul, K. Lunkwitz, Eur.
Polym. J. 1999, 35, 1149.[32] J. Gu, X. Yang, H. Zhu, Mater. Sci. Eng. C 2002, 20, 199.[33] Q. Lu, C. Cao, H. Zhu, J. Mater. Sci.: Mater. Med. 2004, 15, 607.[34] K. Siow, PhD thesis, University of South Australia, Mawson
Lakes 2007.[35] R. C. Chatelier, X. Xie, T. R. Gengenbach, H. J. Griesser, Lang-
muir 1995, 11, 2585.[36] R. C. Chatelier, X. Xie, T. R. Gengenbach, H. J. Griesser, Lang-
muir 1995, 11, 2576.[37] S. A. Al-Bataineh, L. G. Britcher, H. J. Griesser, Surf. Sci. 2006,
600, 952.[38] N. Fairley, ‘‘XPS Lineshapes and Curvefitting’’ in: Surface
Analysis by Auger and X-ray Photoelectron Spectroscopy, D.Briggs, J. T. Grant, Eds., IM Publications and SurfaceSpectraLimited, Chichester 2003, p. 397.
Plasma Process. Polym. 2009, 6, 583–592
� 2009 WILEY-VCH Verlag GmbH & Co. KGaA, Weinheim
[39] N. Fairley, A. Carrick, ‘‘The Casa Cookbook: Part 1: Recipes forXPS Data Processing’’, Acolyte Sci, Cheshire 2005.
[40] B. J. Lindberg, K. Hamrin, G. Johansson, U. Gelius, A. Fahlman,C. Nordling, K. Siegbahn, Phys. Scr. 1970, 1, 286.
[41] G. Beamson, D. Briggs, ‘‘High Resolution XPS of Organic Poly-mers’’, Wiley, New York 1992.
[42] B. A. Barry, ‘‘Errors in Practical Measurement in Science,Engineering and Technology’’, Wiley-Interscience Publication,New York 1978.
[43] T. R. Gengenbach, Z. R. Vasic, S. Li, R. C. Chatelier, H. J. Griesser,Plasmas Polym. 1997, 2, 91.
[44] T. R. Gengenbach, R. C. Chatelier, H. J. Griesser, Surf. InterfaceAnal. 1996, 24, 271.
[45] R. C. Chatelier, C. J. Drummond, D. Y. C. Chan, Z. R. Vasic, T. R.Gengenbach, H. J. Griesser, Langmuir 1995, 11, 4122.
[46] T. R. Gengenbach, Z. R. Vasic, R. C. Chatelier, H. J. Griesser,J. Polym. Sci., Part A: Polym. Chem. 1994, 32, 1399.
[47] T. R. Gengenbach, Z. R. Vasic, R. C. Chatelier, H. J. Griesser,Plasmas Polym. 1996, 1, 207.
[48] N. Larsson, P. Stenius, J. C. Eriksson, R. Maripuu, B. Lindberg,J. Colloid Interface Sci. 1982, 90, 127.
[49] G. A. Schick, Z. Sun, Langmuir 1994, 10, 3105.[50] T. R. Gengenbach, H. J. Griesser, J. Polym. Sci., Part A: Polym.
Chem. 1999, 37, 2191.[51] A. Tarasova, P. Hamilton-Brown, T. R. Gengenbach, H. J.
Griesser, L. Meagher, Plasma Process. Polym. 2008, 5, 175.[52] T. R. Gengenbach, R. C. Chatelier, H. J. Griesser, Surf. Interface
Anal. 1996, 24, 611.[53] G. Socrates, ‘‘Infrared Characteristics Group Frequencies:
Tables and Charts’’, 2nd Ed. John Wiley & Sons, Chichester1994.
[54] L. Bellamy, ‘‘The Infrared Spectra of Complex Molecules’’,3rd Ed. Chapman and Hall, London 1975.
[55] D. Lin-Vien, B. N. Colthup, W. G. Fateley, J. G. Grassell,‘‘The Handbook of Infrared and Raman Characteristic Fre-quencies of Organic Molecules’’, Academic Press, San Diego1991.
[56] T. R. Gengenbach, X. Xie, R. C. Chatelier, H. J. Griesser, J. Adhes.Sci. Technol. 1994, 8, 305.
[57] K. Vasilev, L. Britcher, A. Casanal, H. J. Griesser, J. Phys. Chem. B2008, 112, 10915.
DOI: 10.1002/ppap.200950004
Related Documents


![Reinforced sulfonated poly(phenylene sulfone) membranes · sulfonated polysulfones and hydrophobic polymers •Hydrophilic-hydrophobic Multiblock Copolymers[3] Previous study utilizing](https://static.cupdf.com/doc/110x72/60f8ec38147b7a3a2e50e030/reinforced-sulfonated-polyphenylene-sulfone-membranes-sulfonated-polysulfones.jpg)


