ACES REPORT 14 Sulfate EQS data overview Sara Sahlin, Marlene Ågerstrand Department of Environmental Science and Analytical Chemistry (ACES)

Welcome message from author
This document is posted to help you gain knowledge. Please leave a comment to let me know what you think about it! Share it to your friends and learn new things together.
Transcript

ACES REPORT 14
SulfateEQS data overviewSara Sahlin, Marlene Ågerstrand
Department of Environmental Science and AnalyticalChemistry (ACES)

ACES report number 14
Department of Environmental Science and Analytical Chemistry, Stockholm University
2018
The report has been prepared on behalf of the Swedish Agency for Marine and Water Management and the Swedish Environmental Protection Agency. The authors are responsible for the content and conclusions of the report. The content of the report does not constitute a position from the Swedish Agency for Marine and Water Management and the Swedish Environmental Protection Agency.

2
Sulfate EQS DATA OVERVIEW
ACES report 14
Sara Sahlin, Marlene Ågerstrand
Department of Environmental Science and Analytical Chemistry (ACES) Stockholm University

3
Preface
The Department of Environmental Science and Analytical Chemistry (ACES) was commissioned, by the
Swedish Agency for Marine and Water Management and the Swedish Environmental Protection
Agency, to perform a literature overview and possible EQS derivation for the specific pollutant sulfate.
The work was performed under the Water Framework Directive (2000/60/EC) using the European
Communities’s guidance document “Technical Guidance for Deriving Environmental Quality
Standards”.
The report was prepared by Sara Sahlin and Marlene Ågerstrand. There has been a public consultation
and comments have been taken into account.
Stockholm, October 25th, 2018 The Department of Environmental Science and Analytical Chemistry (ACES)
Stockholm University
4
Svensk sammanfattning Stockholms Universitet har på uppdrag av Havs- och vattenmyndigheten och Naturvårdsverket tagit
fram denna rapport (dossier) med förslag på bedömningsgrunder för sulfat. Utifrån litteratursökning
och granskning av underlag har förslag på bedömningsgrunder beräknats utifrån de riktlinjer som ges
i CIS 27 (European Communities, 2011).
Toxiciteten hos sulfat varierar med hårdheten och i ”scenario 1” ges förslag på olika värden för olika
hårdhetsklasser. Värdena baseras på de studier som bedömts uppfylla kraven på tillförlitlighet och där
effekter av hårdheten systematiskt har studerats. Att övriga studier valdes bort beror på att värdena
för respektive hårdhetsklass annars inte genomgående hade hamnat på högre värden vid högre
hårdhet. Detta har att göra med att tester utförda vid olika hårdhet samtidigt kan ha utförts på olika
organismer, med olika känslighet och ibland har olika typer av effekter (”endpoints”) avlästs, varav
vissa är mer känsliga än andra. Eftersom hårdhetsindelade värden bygger på färre studier går det bara
att ta fram deterministiskt beräknade värden. Dessutom går det inte att ta fram något värde för den
lägsta hårdhetsklassen, vilket är det intervall som berör de flesta svenska vatten.
De flesta studier har utförts vid ungefär 100 mg CaCO3/l och dessa har legat till grund för probabilistiskt
beräknade värden i ”scenario 2”. Notera dock att data för den känsligaste organismen och vid lägre
hårdhet då saknas.
I scenarie 3 ingick alla studier som utförts vid upp till 50 mg CaCO3/l och dessa täcker in även den
känsligaste organismen vid lägst hårdhet. Ytterligare några studier (vid hårdhet 100 mg CaCO3/l)
lades till för att få tillräckligt många studier för att kunna ta fram probabilistiskt beräknade värden.
Med scenarie 3 var det inte möjligt att beräkna halter som avser maximal tillåten koncentration.
Eftersom sulfat är ett naturligt förekommande ämne har rapporten även med värden som utgör så
kallade ”added risk”-värden. De har tagits fram genom att sulfathalter i kontrollerna subtraherats
från uppmätt halt i testkoncentrationerna.

5
TABLE OF CONTENTS
1. METHOD CONSIDERATIONS ............................................................................................................ 6
2. PROPOSED ENVIRONMENTAL QUALITY STANDARDS FOR SULFATE ............................................... 9
3. MEASURED ENVIRONMENTAL CONCENTRATIONS IN SWEDEN ................................................... 10
4. AQUATIC ECOTOXICITY OF SULFATE ............................................................................................. 11
5. ACUTE FRESHWATER TOXICITY ..................................................................................................... 12
6. CHRONIC FRESHWATER TOXICITY ................................................................................................. 16
7. ADDED RISK APPROACH ................................................................................................................ 23
8. IDENTIFICATION OF ISSUES RELATING TO UNCERTAINTY IN RELATION TO THE EQSs DERIVED .. 24
9. REFERENCES .................................................................................................................................. 25
10. SUPPORTIVE INFORMATION – Ecotoxicity studies ...................................................................... 27
11. SUPPORTIVE INFORMATION – Reliability and relevance evaluations ......................................... 35
12. SUPPORTIVE INFORMATION – Added risk and SSD results ......................................................... 41

6
1. METHOD CONSIDERATIONS
Legal frameworks
The work was performed under the Water Framework Directive (2000/60/EC) using the European
Communities’s (2011) guidance document “Technical Guidance for Deriving Environmental Quality
Standards”.
Environmental Quality Standards (EQS) for pelagic communities were derived to cover long-term
(Annual Average: AA-QS) and short-term (Maximum Acceptable Concentration: MAC-QS) exposure.
Risks for benthic communities or secondary poisoning for pelagic biota or top predators were not
addressed in the QS derivation (not identified as potential receptors at risk).
EQS derivation
The EQS derivation was based on ecotoxicity data conducted with sodium sulfate (Na2SO4 CAS 7757-
82-6). Other salts of sulfate were not included due to that the cation (e.g. K+, Mg+) may contribute to
the toxicological response (Mount et al 1997). Ca2SO4 was not considered toxic, but is not as soluble
as Na2SO4 (Mount et al. 1997) and are not frequently used in ecotoxicological tests.
The following databases were used when searching for data: Scopus, Web of science, Google Scholar,
ETOX, Ekotoxzentrum, UBA, INERIS, RIVM, IRIS, UK TAG, OECD, USEPA. The following keywords were
used: sulfate, sulphate, sodium sulfate, sodium sulphate* toxicity, ecotoxicity, aquatic toxicity,
ecotoxicology, NOEC, EC10, EC50, LC50. The literature search was conducted in February 2017.
Due to time restrictions, reliability and relevance evaluation was only performed on a selected number
of the ecotoxicity studies using the CRED evaluation method. The result from the evaluations can be
found in table S4. The studies were scored as; R1 (Reliable without restrictions), R2 (Reliable with
restriction), R3 (Not Reliable), R4 (Not assignable), C1 (Relevant without restriction), C2 (Relevant with
restrictions), C3 (Not Relevant), C4 (Not assignable) (Moermond et al. 2016).
According to European Communities (2011), chronic values reported as LOEC and EC50 and acute values
reported as NOEC should not be included in the derivation of EQS. EC20 values were divided by 2 and
tabulated as NOEC. MATC values were divided by √2 and tabulated as NOEC. One value per species
(and endpoint) was used in the derivation. In case of multiple values for the same species and the same
endpoint (at approximately same water hardness and ionic composition of the test media), the values
were aggregated (geometric mean). According European Communities (2011), toxicity values higher
or lower than the range of test concentrations (e.g. LC50 > x or LC50 < x) should not be used in the
derivation. However, one EQS proposal was based on an effect data with lower toxicity value than the
tested concentration (NOEC<x), since it suggests higher toxicity at softer water compared to other
available data.
Several of the studies found in the literature investigate mortality as endpoint during long-term
exposures (see supportive information, table S3). When comparing chronic studies to the mortality
studies with long-term exposure, LC10 values for embryos of P. promelas (Wang et al. 2016a) suggest
higher toxicity (382.05 mg/L) compared to data reported for larvae of P. promelas and endpoint
growth, EC10 760 (Elphick et al. 2011) and NOEC 1397 mg/L (PESC, 2013), all studies conducted in
hardness 80-100 mg CaCO3/L with 7 days exposure. Wang et al. (2016a) reported that reduced survival
during hatching period was the primarily effect of sulfate, and no growth effect was found in their 7-
14 days study. Though, in their 34 days study they received EC20 values for the endpoint biomass of
7
185 and 106 mg/L but the authors stated that there were uncertainties in the growth response
(therefore not included in the QS derivation). The LC10 values for P. promelas (Wang et al. 2016a) were
therefore included in the derivation. The LC10 values reported by Kennedy et al. (2012) for eyed eggs
of O. mykiss was included since the data suggest evidence that early life stage were sensitive to sulfate
exposure. Kennedy et al. (2012) also investigated growth of the fry and the effect was minimal and
statistical effect values could not be calculated. Though, it is not well-defined in European
Communities (2011) if LC10 values may be used in the derivation.
When sufficient data was available both deterministic derivation (applying an assessment factor (AF)
to the lowest effect value) and probabilistic derivation (performing a species sensitivity distribution
(SSD)) were used to enable comparison between the methods. The software ETX 2.1 (provided by the
Netherlands National Institute for Public Health and the Environment (RIVM)) was used for modelling
the SSD. Normal distribution and goodness-fit of the model were calculated with three different tests:
Anderson-Darling, Kolmogorov-Smirnov, and Cramer von Mises.
Only one marine ecotoxicological study was found in the literature search (the algae Nitzschia linearis
with a LC50 of 1284 mg/L). When deriving QS values for marine ecosystems in the absence of marine
data, larger AF are necessary to take into account additional uncertainties associated with the
extrapolation (European Communities, 2011). The relative toxicity to the marine crustacean
Americamysis bahia was F- > K+ > HCO3- > Ca2+ > Mg2+ > Br- > SO42 (Unpublished data, SETAC 2004).
Elevated ion concentrations may cause toxicity to freshwater organisms due to osmotic stress.
Freshwater organisms are hyper-osmotic regulators and as the salinity increase they tend to take up
more ions, consequently, they lose water from cells causing adverse effects. However, marine species
are generally hypo-osmotic regulators and have physiological mechanisms to maintain a proper
balance of water and dissolved ions (SETAC 2004; Hart et al. 1991), for this derivation it was therefore
assumed that marine species have higher (or equal) tolerance to sulfate.

8
Hardness dependent EQS
Initially, all data were categorized based on the water hardness (mg CaCO3/L): Very soft (<36), Soft (36-
89), Moderate hard (89-178), Hard (178-374), and Very hard (>374). However, no distinct hardness-
related relationship could be established. This could be due to that the available studies include
different durations, statistical criterion, endpoints, and water chemistry (ionic composition). Since
several studies only use on level of hardness (typical 100 mg CaCO3/L), sensitive species were not
present in the lower categories of hardness, which resulted in stringent effect values at higher
hardness. When only data that investigated hardness as a modifying factor were used, it was possible
to distinguish a hardness related response. Three different scenarios for deriving QS were proposed:
(1) Derive hardness dependent QS based on studies that investigated hardness as a modifying
factor (only possible using deterministic derivation).
(2) Derive QS based on data of water hardness of approximately 100 mg CaCO3/L (possible using
both deterministic and probabilistic derivation).
(3) Derive QS based on realistic worst-case data, with data of hardness representing Swedish
water (≤ 50 mg CaCO3/L) (only possible for the AA-QS, using both deterministic and
probabilistic derivation).
The British Columbia Ministry of Environment has established water quality guidelines for sulfate at
different categories of water hardness (BC, 2013). The water quality guidelines were based on
LC20 values in a deterministic derivation using AF 2. However, the use of LC20 values and such low AF in
a deterministic derivation is not in line with European Communities (2011).

9
2. PROPOSED ENVIRONMENTAL QUALITY STANDARDS FOR SULFATE
Proposals of MAC-QS for sulfate (MAC-QSadded)
Hardness (mg CaCO3/L)
Method
Scenario 1 Scenario 2
≥25 40-50 75-100 ≥160 ≈100
Deterministic (mg/L) 59.6
(57.6) 95.7
(88.3) 158.0
(154.0) 317.8
(270.8) 65.3
(63.3)
Probabilistic (mg/L) - 73.9
(72.5)
Proposals of AA-QS for sulfate (AA-QSadded)
Hardness (mg CaCO3/L)
Method
Scenario 1 Scenario 2 Scenario 3
6-15 40-50 80-100 >160 ≈100 Realistic worst-
case
Deterministic (mg/L) - 15.0 41.9 56.0 12.9 (7.2)
12.9 (7.2)
Probabilistic (mg/L) - 35.0
(25.6) 26.2
(20.5)

10
3. MEASURED ENVIRONMENTAL CONCENTRATIONS IN SWEDEN
Freshwater monitoring data divided into number of monitoring stations with different sulfate
concentrations are presented in table 1. Table 2 and 3 presents sulfate measurements at different
water hardness. Table 2 provides measurements for recipient controls (SRK) (areas affected by human
activity), and table 3 from national and regional monitoring from 2012-2016. The data were collected
from the Swedish University of Agricultural Sciences (SLU) database of environmental monitoring data.
It was not possible to determine precise background concentrations. However, the majority (66%) of
the measurements were below 5 mg/L.
Table 1. Monitoring data for 2010-1016 from rivers and lakes in Sweden (SLU database of monitoring data).
Sulfate concentration (mg/L) Number of stations
<5 24 352
5–10 6 879
10–25 3 527
25–50 1 386
50–100 514
100–200 94
>200 81
Table 2. Measured sulfate concentrations from Swedish recipient controls (SRK) at different hardness (SLU database of monitoring data).
Hardness (mg
CaCO3/L)
SO42-
(mg/L)
<15 15-25 25-50 50-100 100-
150
150-
200
200-
250
250-
300 >300
Mean 4.8 8.7 12.6 27.4 52.2 87.4 193.5 285.1 389.9
Max 110 154 52.9 100 153.7 211.4 400 459.3 524.5
Min 0.3 2.6 3.6 6.4 14 19 29 190.3 279.7
Nr of samples 3024 578 493 361 146 85 32 27 24
Table 3. Measured sulfate concentrations from Swedish national and regional monitoring at different hardness (SLU database of monitoring data).
Hardness (mg
CaCO3/L)
SO42-
(mg/L)
<15 15-25 25-50 50-100 100-
150
150-
200
200-
250
250-
300 >300
Mean 3.0 7.3 12.0 19.4 32.0 43.6 45.8 42.8 77.8
Max 38.3 91.2 139.2 164.0 315.2 427.9 146.4 94.1 424.6
Min 0.2 0.2 0.2 1.4 1.8 2.7 6.4 9.4 27.5
Nr of samples 24861 4194 2360 986 676 459 206 91 32

11
4. AQUATIC ECOTOXICITY OF SULFATE
Mechanisms of major-ion toxicity to aquatic organisms are due to osmoregulatory stress, specific ion
toxicity (concentration exceeding toxic levels), or imbalance of the ionic composition (SETAC 2004;
Goetsch and Palmer 1997). Mount et al. (1997) investigated the toxicity of varying combinations of
major ions to P. promelas, D. magna and C. dubia. In general, the ionic toxicity was K+> HCO3- ≈ Mg2+
> Cl- > SO42-. The toxicity of SO4
2- was reduced in waters containing more than one cation when C. dubia
and D. magna were exposed. No described mode of action for sulfate has been found.
Modifying factors
Several studies have demonstrated that increased water hardness decreases the toxicity of sulfate in
both acute and chronic exposures. The exceptions of this general trend were chronic exposures to B.
calyciflorus (rotifer), P. regilla (amphibian), and H. azteca (crustacea). When very hard water was used
(e.g. 320 mg CaCO3/L) the sensitivity in some cases increases, this may be due to the overall ionic
strength in the test dilutions, which may result in osmotic stress to the organisms (Elphick et al., 2011).
Chloride has also been identified as a modifying factor. Soucek (2007b) demonstrated that increasing
chloride concentrations from 5 to 25 mg/L increased the tolerance of sulfate to H. azteca. However,
the toxicity to C. dubia was not significantly correlated within that range of chloride. Chloride
concentrations ranging between 25-500 mg/L resulted in an opposite trend for both species and
increased the mortality. The results from the study suggest evidence that chloride and sulfate toxicity
were additive at higher concentrations of chloride. Soucek (2007b) also concluded that the
conductivity was highly positive correlated with survival of H. azteca and C. dubia during sulfate
exposure. Likewise, Soucek and Kennedy (2005) observed that the toxicity to H. azteca decreased with
increasing chloride concentrations from 1.6 to 60 mg/L. Other findings suggest that increased molar
ratio of calcium and magnesium may influence the toxicity (Davies and Hall, 2007; Davies, 2002). In
exposures of similar hardness but with higher chloride concentrations and higher calcium-magnesium
ratio, the toxicity to H. azteca and C. dubia decreased (Soucek ad Kennedy, 2005). The LC50 varied from
2050 to 2526 mg/L for C. dubia, and from 512 to 2855 mg/L for H. Azteca, in diluents with Ca:Mg of
0.88 and chloride levels of 1.9 mg/L compared to Ca:Mg of 3.25 and chloride levels of 3.25 mg/L
respectively (Soucek and Kennedy, 2005; Soucek 2007a). The same trend was observed in exposures
to D. magna (Davies, 2002; Davies and Hall, 2007). Davies (2002) stated that most natural waters have
Ca:Mg ratios above 0.7 and that toxicity data based on water with low Ca:Mg ratios should be
considered conservative. However, Wang et al. (2016) concluded that the toxicity to embryos of P.
promelas did not decrease with increased Ca:Mg ratio or increased chloride concentrations (10 to 25
mg/L). Instead they suggested that the decreased toxicity could be explained by increased potassium
concentrations (from 1 to 3 mg/L).
Data used in the derivation for crustacean was conducted in molar ratio of Ca:Mg of 1.7-3.2 and
chloride concentrations below 10 mg/L. Regarding acute P. promelas (embryo) study by Wang et al.
(2016a), data conducted in potassium concentrations of 1 mg/L was used in the derivation since
concentrations of 3 mg/L was assessed as not realistic in relation to Swedish waters.
12
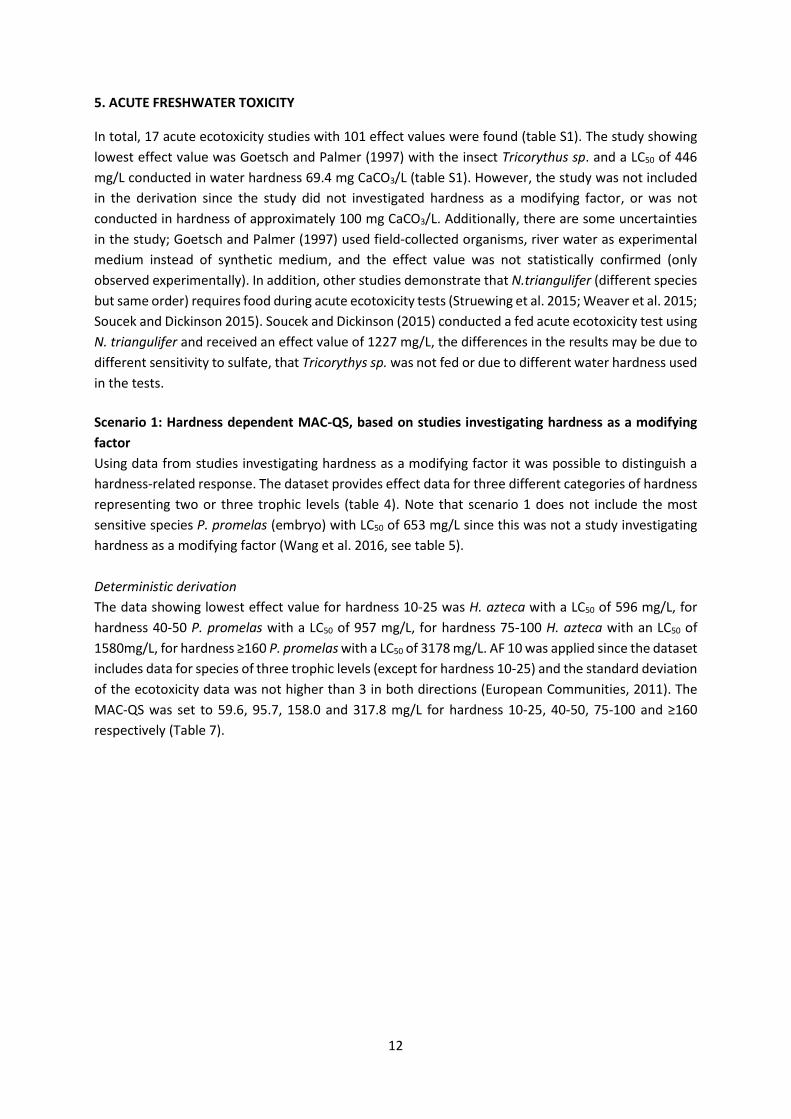
5. ACUTE FRESHWATER TOXICITY
In total, 17 acute ecotoxicity studies with 101 effect values were found (table S1). The study showing
lowest effect value was Goetsch and Palmer (1997) with the insect Tricorythus sp. and a LC50 of 446
mg/L conducted in water hardness 69.4 mg CaCO3/L (table S1). However, the study was not included
in the derivation since the study did not investigated hardness as a modifying factor, or was not
conducted in hardness of approximately 100 mg CaCO3/L. Additionally, there are some uncertainties
in the study; Goetsch and Palmer (1997) used field-collected organisms, river water as experimental
medium instead of synthetic medium, and the effect value was not statistically confirmed (only
observed experimentally). In addition, other studies demonstrate that N.triangulifer (different species
but same order) requires food during acute ecotoxicity tests (Struewing et al. 2015; Weaver et al. 2015;
Soucek and Dickinson 2015). Soucek and Dickinson (2015) conducted a fed acute ecotoxicity test using
N. triangulifer and received an effect value of 1227 mg/L, the differences in the results may be due to
different sensitivity to sulfate, that Tricorythys sp. was not fed or due to different water hardness used
in the tests.
Scenario 1: Hardness dependent MAC-QS, based on studies investigating hardness as a modifying
factor
Using data from studies investigating hardness as a modifying factor it was possible to distinguish a
hardness-related response. The dataset provides effect data for three different categories of hardness
representing two or three trophic levels (table 4). Note that scenario 1 does not include the most
sensitive species P. promelas (embryo) with LC50 of 653 mg/L since this was not a study investigating
hardness as a modifying factor (Wang et al. 2016, see table 5).
Deterministic derivation
The data showing lowest effect value for hardness 10-25 was H. azteca with a LC50 of 596 mg/L, for
hardness 40-50 P. promelas with a LC50 of 957 mg/L, for hardness 75-100 H. azteca with an LC50 of
1580mg/L, for hardness ≥160 P. promelas with a LC50 of 3178 mg/L. AF 10 was applied since the dataset
includes data for species of three trophic levels (except for hardness 10-25) and the standard deviation
of the ecotoxicity data was not higher than 3 in both directions (European Communities, 2011). The
MAC-QS was set to 59.6, 95.7, 158.0 and 317.8 mg/L for hardness 10-25, 40-50, 75-100 and ≥160
respectively (Table 7).
13
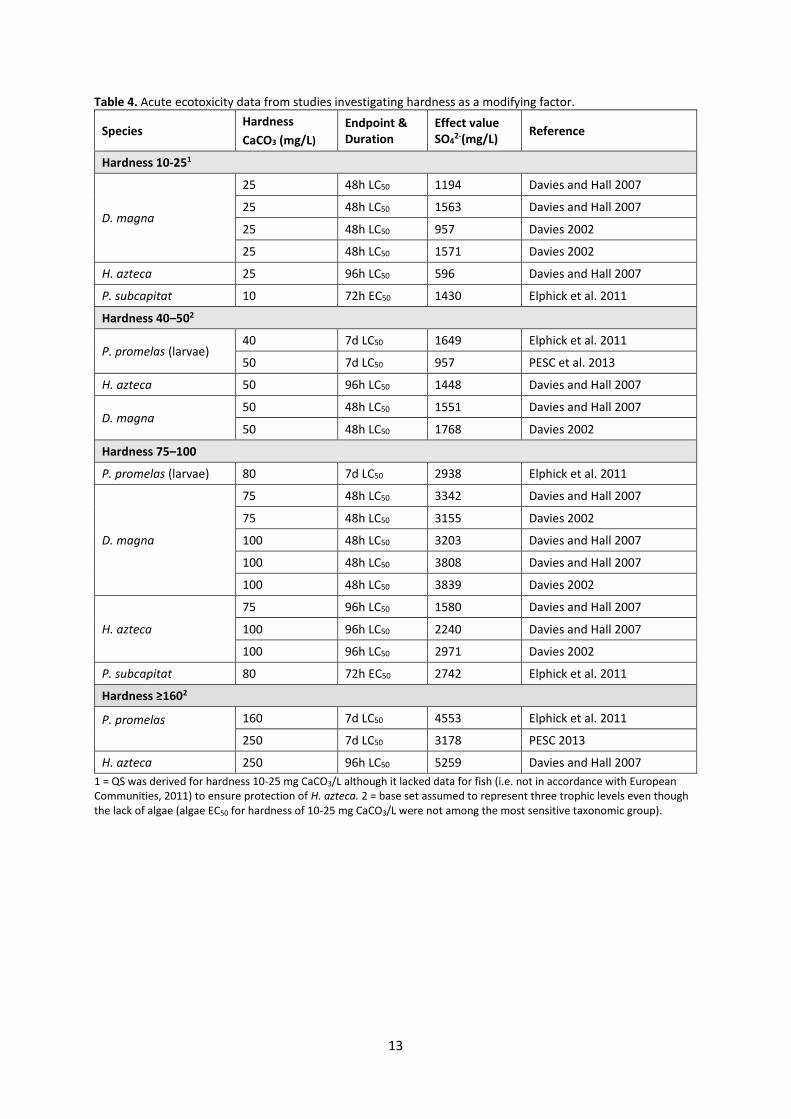
Table 4. Acute ecotoxicity data from studies investigating hardness as a modifying factor.
Species Hardness
CaCO3 (mg/L)
Endpoint & Duration
Effect value SO4
2-(mg/L) Reference
Hardness 10-251
D. magna
25 48h LC50 1194 Davies and Hall 2007
25 48h LC50 1563 Davies and Hall 2007
25 48h LC50 957 Davies 2002
25 48h LC50 1571 Davies 2002
H. azteca 25 96h LC50 596 Davies and Hall 2007
P. subcapitat 10 72h EC50 1430 Elphick et al. 2011
Hardness 40–502
P. promelas (larvae) 40 7d LC50 1649 Elphick et al. 2011
50 7d LC50 957 PESC et al. 2013
H. azteca 50 96h LC50 1448 Davies and Hall 2007
D. magna 50 48h LC50 1551 Davies and Hall 2007
50 48h LC50 1768 Davies 2002
Hardness 75–100
P. promelas (larvae) 80 7d LC50 2938 Elphick et al. 2011
D. magna
75 48h LC50 3342 Davies and Hall 2007
75 48h LC50 3155 Davies 2002
100 48h LC50 3203 Davies and Hall 2007
100 48h LC50 3808 Davies and Hall 2007
100 48h LC50 3839 Davies 2002
H. azteca
75 96h LC50 1580 Davies and Hall 2007
100 96h LC50 2240 Davies and Hall 2007
100 96h LC50 2971 Davies 2002
P. subcapitat 80 72h EC50 2742 Elphick et al. 2011
Hardness ≥1602
P. promelas
160 7d LC50 4553 Elphick et al. 2011
250 7d LC50 3178 PESC 2013
H. azteca 250 96h LC50 5259 Davies and Hall 2007
1 = QS was derived for hardness 10-25 mg CaCO3/L although it lacked data for fish (i.e. not in accordance with European Communities, 2011) to ensure protection of H. azteca. 2 = base set assumed to represent three trophic levels even though the lack of algae (algae EC50 for hardness of 10-25 mg CaCO3/L were not among the most sensitive taxonomic group).

14
Scenario 2: MAC-QS based on studies with hardness ≈ 100 mg CaCO3/L The data from studies conducted in approximately 100 (80-110) mg CaCO3 /L, is presented in table 5.
The datasets includes one order of fish and algae, two orders of crustacean and insects, and four orders
of mollusca (a total of 15 species).
Table 5. Acute ecotoxicity studies for sulfate at water hardness ≈ 100 mg CaCO3/L used in the MAC-QS derivation.
Species (life stage)
Hardness CaCO3
(mg/L)
Endpoint & Duration
Effect value SO4
2-(mg/L) Reference
Fish
Pimephales promelas (embryos) 102-110 7d LC50 6531 Wang et al. 2016a
Invertebrates
Ceriodaphnia dubia (neonates) 100 48h EC50 2441 Wang et al. 2016a
Daphnia magna (<24h) 100 48h LC50 3823 Geometric mean
Hyalella azteca (2-11d old) 80-100 96h L(E)C50 2415 Geometric mean
Insecta
Chironomus dilutus (larvae) 100 96h EC50 5992 Wang et al. 2016a
Chironomus tentans (10d old) 94 48h LC50 14134 Soucek and Kennedy 2005
Neocleon triangulifer (nymph) 99 96h LC50 1227 Soucek and Dickinson 2015
Mollusca
Lampsilis abrupta (juveniles) 100 96h EC50 2362 Wang et al. 2016a
Lampsilis siliquoidea (juvenile) 106 96h EC50 2325 Wang et al 2016b
Ligumia recta 92 96h LC50 1483 US EPA 2010
Margaritifera falcata (juvenile) 106 96h EC50 1378 Wang et al 2016b
Megalonaias nervosa (juvenile) 103 96h EC50 2279 Wang et al 2016b
Sphaerium simile (juvenile) 94 96h LC50 2078 Soucek and Kennedy 2005
Utterbackia imbecillis (juvenile) 103 96h EC50 2709 Wang et al 2016b
Algae
Pseudokirchneriella subcapitata 80 72h EC50 2742 Elphick et al. 2011
1 = Potassium concentrations of approximately 1 mg/L, this study has been evaluated to be of sufficient reliability and relevance for QS derivation (see table S4).
Deterministic derivation
The study showing lowest effect values was Wang et al. (2016a) with embryos of P. promelas and a
LC50 of 653 mg/L. AF 10 was applied since the dataset includes three trophic levels and the standard
deviation of the ecotoxicity data was not higher than 3 in both directions (European Commiunities,
2011). The MAC-QS was set to 65.3 mg/L (table 7).
Probabilistic derivation
The dataset does not fulfil the criteria to perform a SSD due to the absence of taxonomic groups for
higher aquatic plants and a second family in the phylum Chordata (European Communities, 2011)
(table 5). However, there are supportive information for higher aquatic plants (chronic), fish (acute),
and amphibians (chronic) suggesting low toxicity (table S1 and S2). Despite the lack of data, a SSD was

15
performed as a comparison to the deterministic derivation (figure 1). Normal distribution was
accepted at significance level 0.05 in the Anderson-Darling and Cramer von Mises tests, and at level
0.025 in the Kolmogorov-Smirnov test. The HC5 was 739.18 mg/L (table 6). AF 10 was applied
(European Communities 2011), resulting in a MAC-QS of 73.9 mg/L (table 7).
Table 6. The results of HC5 from the SSD of acute sulfate ecotoxicity data conducted in hardness ≈ 100 mg CaCO3/L.
Type of HC5 Value (mg/L) log10(Value)(mg/L) Description
LL HC5 396.26 2.60 Lower estimate of the HC5
HC5 739.18 2.87 Median estimate of the HC5
UL HC5 1101.89 3.04 Upper estimate of the HC5
sprHC5 2.83 0.44 Spread of the HC5 estimate
Figure 1. SSD (ETX 2.1) for acute freshwater ecotoxicity studies of sulfate conducted in hardness ≈ 100 mg CaCO3/L. The most sensitive species was the fish P. promelas (embryos). The HC5 was 739.18 mg/L. Table 7. Proposals of MAC-QS for sulfate based on different methods and/or hardness.
Hardness (mg CaCO3/L) Method
Scenario 1 Scenario 2
≥25 40-50 75-100 ≥160 Hardness ≈100
Deterministic (mg/L) 59.6 95.7 158.0 317.8 65.3
Probabilistic (mg/L) - 73.91 1 = Based on incomplete dataset (lacked data for higher aquatic plants and a second family in the phylum Chordata).

16
6. CHRONIC FRESHWATER TOXICITY
The total dataset includes two orders of fish, crustacean, insects, higher aquatic plants and one order
of amphibians, mollusca, rotifer and algae. In total, 9 chronic ecotoxicity studies with 95 effect values
were found (table S2 and S3).
Scenario 1: Hardness dependent AA-QS, based on studies investigating hardness as a modifying
factor
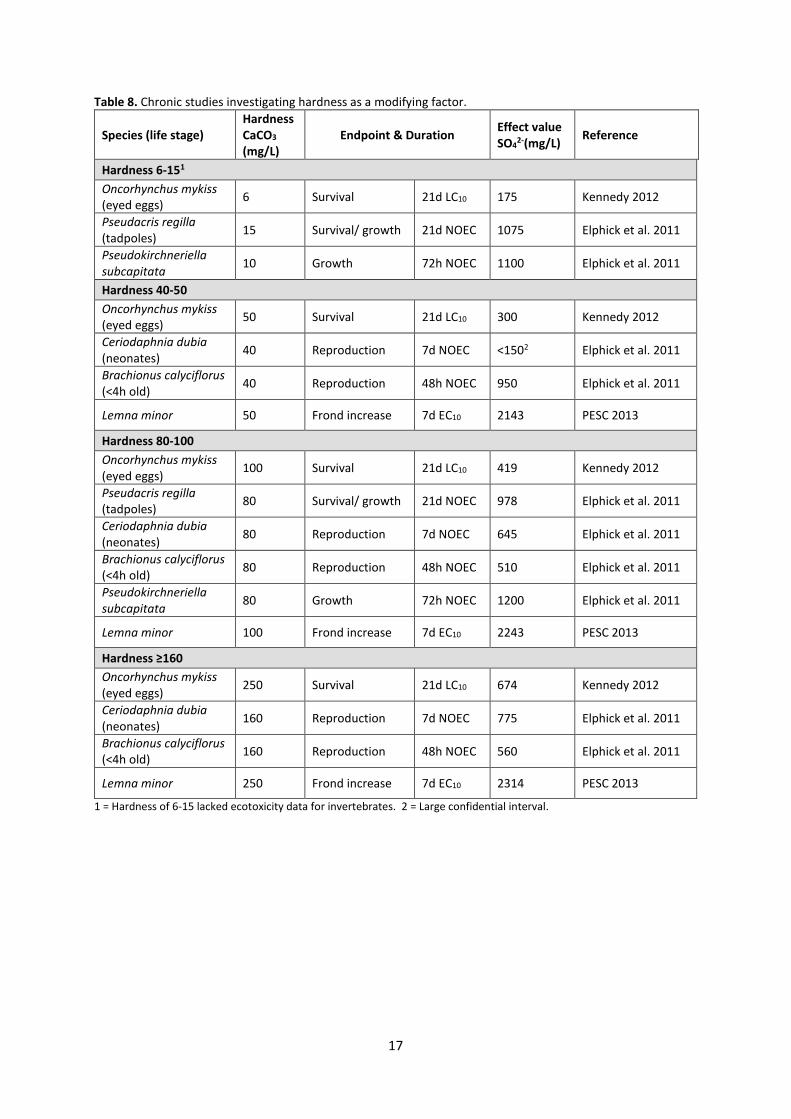
Table 8 summarizes the chronic studies investigating hardness as modifying factor. Water hardness
higher than 250 mg CaCO3/L was omitted since it have shown higher toxicity which may be a result of
the overall ionic strength (Elphick et al. 2011). Note that scenario 1 does not include the most sensitive
species N. triangulifer (mayfly) with a NOEC of 129 mg/L since this study did not investigate hardness
as a modifying factor (Soucek and Dickinson 2015, see table 9). The lack of mayflies studies has
previously been stressed when setting water quality guidelines due to preliminary work indicating
sensitivity to sulfate (BC, 2013). In addition, Vellemu et al. (2017) provide supporting information of
mayflies (Adenophlebia auriculata) being sensitive with 10 day LC10 of 129 mg/L (not considered in the
derivation due to short duration).
Deterministic derivation
The data showing lowest effect value for hardness 6-15 was O. mykiss with a LC10 of 175.4 mg/L, for
hardness 40-50 C. dubia with a NOEC of <150 mg/L, for hardness 80-100 O. mykiss with a LC10 of 419.2
mg/L and for hardness >160 B. calyciflorus with a NOEC of 560.0 mg/L. The hardness category 6-15
lacked ecotoxicity data for the trophic level crustacean (which represented the most sensitive species
for hardness 40-50), QS was therefore not derived. The AA-QS was set to 15.0, 41.9 and 56.0 mg/L at
hardness 40-50, 80-100 and >160mg CaCO3/L respectively (table 13), using AF 10 since the datasets
include chronic data for three trophic levels (European Communities, 2011). According to European
Communities (2011), QS values should not be based on effect data with higher toxicity than the tested
concentration (e.g. C. dubia, Elphick et al. 2011). An alternative was therefore to base QS for hardness
<50 on O. mykiss with a LC10 of 175.4 and AF 10 resulting in an AA-QS of 17.5 mg/L.
17
Table 8. Chronic studies investigating hardness as a modifying factor.
Species (life stage) Hardness CaCO3
(mg/L) Endpoint & Duration
Effect value SO4
2-(mg/L) Reference
Hardness 6-151
Oncorhynchus mykiss (eyed eggs)
6 Survival 21d LC10 175 Kennedy 2012
Pseudacris regilla (tadpoles)
15 Survival/ growth 21d NOEC 1075 Elphick et al. 2011
Pseudokirchneriella subcapitata
10 Growth 72h NOEC 1100 Elphick et al. 2011
Hardness 40-50
Oncorhynchus mykiss (eyed eggs)
50 Survival 21d LC10 300 Kennedy 2012
Ceriodaphnia dubia (neonates)
40 Reproduction 7d NOEC <1502 Elphick et al. 2011
Brachionus calyciflorus (<4h old)
40 Reproduction 48h NOEC 950 Elphick et al. 2011
Lemna minor 50 Frond increase 7d EC10 2143 PESC 2013
Hardness 80-100
Oncorhynchus mykiss (eyed eggs)
100 Survival 21d LC10 419 Kennedy 2012
Pseudacris regilla (tadpoles)
80 Survival/ growth 21d NOEC 978 Elphick et al. 2011
Ceriodaphnia dubia (neonates)
80 Reproduction 7d NOEC 645 Elphick et al. 2011
Brachionus calyciflorus (<4h old)
80 Reproduction 48h NOEC 510 Elphick et al. 2011
Pseudokirchneriella subcapitata
80 Growth 72h NOEC 1200 Elphick et al. 2011
Lemna minor 100 Frond increase 7d EC10 2243 PESC 2013
Hardness ≥160
Oncorhynchus mykiss (eyed eggs)
250 Survival 21d LC10 674 Kennedy 2012
Ceriodaphnia dubia (neonates)
160 Reproduction 7d NOEC 775 Elphick et al. 2011
Brachionus calyciflorus (<4h old)
160 Reproduction 48h NOEC 560 Elphick et al. 2011
Lemna minor 250 Frond increase 7d EC10 2314 PESC 2013
1 = Hardness of 6-15 lacked ecotoxicity data for invertebrates. 2 = Large confidential interval.

18
Scenario 2: AA-QS based on studies with hardness ≈ 100 mg CaCO3/L The data from studies conducted in approximately 100 (80-105) mg CaCO3 /L is presented in table 9
and includes two orders of fish, crustacean, insects and higher aquatic plants, and one order of
amphibian, mollusca, rotifer and algae (a total of 12 species).
Table 9. Chronic ecotoxicity data of sulfate conducted in hardness ≈ 100 mg CaCO3/L used in the AA-QS derivation.
Species (life stage) Hardness CaCO3 (mg/L)
Endpoint & Duration Effect value SO4
2-
(mg/L) Reference
Fish
Oncorhynchus mykiss
(eyed eggs) 100 Survival 31d LC10 419 Kennedy et al. 2012
Pimephales promelas (embryos)
100 Survival 34d LC10 430 Wang et al. 2016a1
Amphibians
Pseudacris regilla (tadpoles)
80 Survival/ growth 21d NOEC 978 Elphick et al. 2011
Invertebrates - Crustacean
Ceriodaphnia dubia (neonates)
80-100 Reproduction 7d NOEC 632 Geometric mean
Hyalella azteca 100 Growth 28d EC10 682 PESC 2013
Invertebrates -Mollusca
Lampsilis abrupta (juveniles)
100 Dry weight 28d EC10 320 Wang et al. 2016a
Invertebrates- Insecta
Chironomus dilutus (larvae)
100 Dry weight 7d EC10 489 Wang et al. 2016a
Neocleon triangulifer (nymph)
99 Development delay
36d NOEC 1292 Soucek and Dickinson 20151
Rotifers
Brachionus calyciflorus (<4h old)
80 Reproduction 48h NOEC 510 Elphick et al. 2011
Algae
Pseudokirchneriella subcapitata
80 Growth 72h NOEC 1200 Elphick et al. 2011
Higher aquatic plants
Fontinalis antipyretica 105 Shoot length 21d NOEC 1000 Davies 2007
Lemna minor 100 Frond increase 7d EC10 2243 PESC 2013
1 = The study has been evaluated to be of sufficient reliability and relevance for QS derivation (see table S4). 2 = NOEC was
not reported, the concentration below the statistically significant concentration was set as NOEC.

19
Deterministic derivation
The most sensitive species was the N. triangulifer with the endpoint “percent of pre-emergent nymph”
(i.e. developmental effects) with a NOEC of 129 mg/L (Soucek and Dickinson 2015). AF 10 was applied
since the dataset include chronic data for three trophic levels (European Communities, 2011). The AA-
QS was set to 12.9 mg/L.
Probabilistic derivation
The dataset fulfilled the criteria to perform a SSD (European Communities, 2011). Normal distribution
was accepted at all significance levels in all tests. The SSD graph is presented in figure 2. The median
estimate of the HC5 was 175.12 (table 10). AF 5 was used and this resulted in an AA-QS of 35.0 mg/L.
A lower AF was not considered appropriate since not all sensitive life stages are covered in the dataset,
no described mode of action has been found, and a comparisons with field and mesocosm studies was
not possible (European Communities 2011).
Table 10. The results of HC5 from the SSD of chronic sulfate ecotoxicity data conducted in hardness ≈ 100 mg CaCO3/L.
Type of HC5 Value (mg/L) log10(Value) (mg/L) Description
LL HC5 81.94 1.91 lower estimate of the HC5
HC5 175.12 2.24 median estimate of the HC5
UL HC5 276.47 2.44 upper estimate of the HC5
sprHC5 3.37 0.53 spread of the HC5 estimate
Figure 2. SSD (ETX 2.1) for chronic freshwater ecotoxicity studies of sulfate conducted in hardness ≈ 100 mg CaCO3/L. The most sensitive species was the insect N. triangulifer. The HC5 was set to 175.12 mg/L.
20
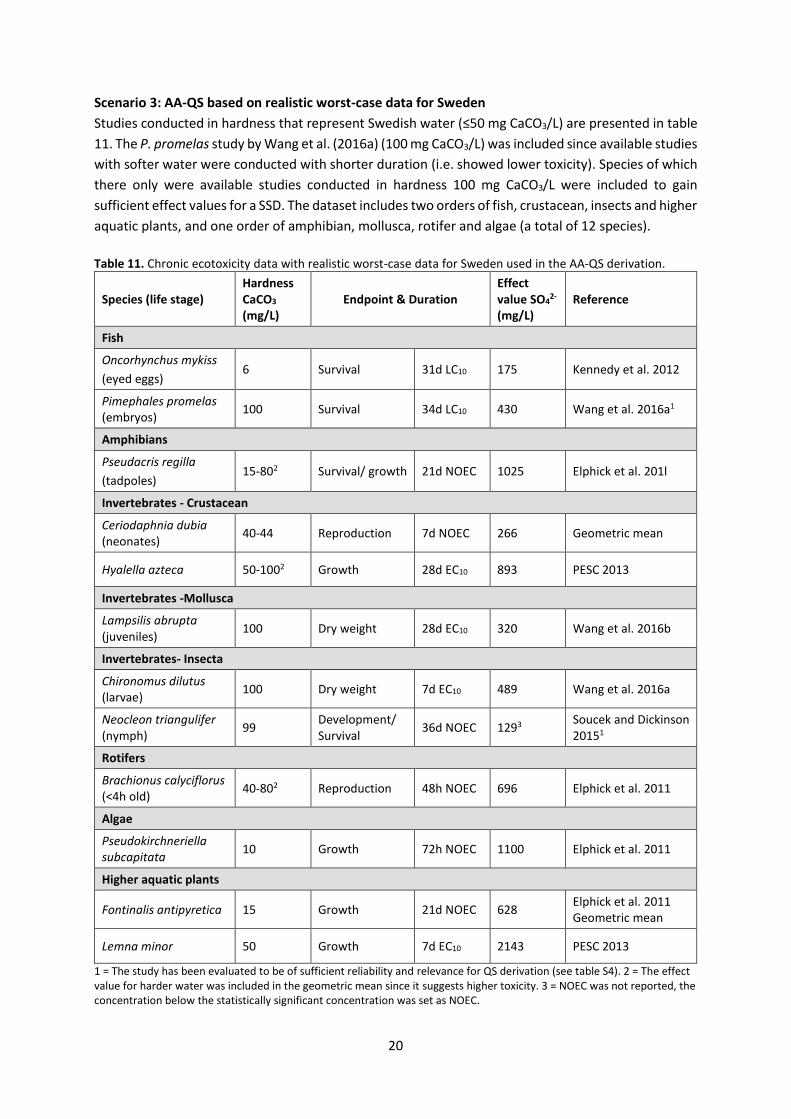
Scenario 3: AA-QS based on realistic worst-case data for Sweden
Studies conducted in hardness that represent Swedish water (≤50 mg CaCO3/L) are presented in table
11. The P. promelas study by Wang et al. (2016a) (100 mg CaCO3/L) was included since available studies
with softer water were conducted with shorter duration (i.e. showed lower toxicity). Species of which
there only were available studies conducted in hardness 100 mg CaCO3/L were included to gain
sufficient effect values for a SSD. The dataset includes two orders of fish, crustacean, insects and higher
aquatic plants, and one order of amphibian, mollusca, rotifer and algae (a total of 12 species).
Table 11. Chronic ecotoxicity data with realistic worst-case data for Sweden used in the AA-QS derivation.
Species (life stage) Hardness CaCO3 (mg/L)
Endpoint & Duration Effect value SO4
2-
(mg/L) Reference
Fish
Oncorhynchus mykiss
(eyed eggs) 6 Survival 31d LC10 175 Kennedy et al. 2012
Pimephales promelas (embryos)
100 Survival 34d LC10 430 Wang et al. 2016a1
Amphibians
Pseudacris regilla
(tadpoles) 15-802 Survival/ growth 21d NOEC 1025 Elphick et al. 201l
Invertebrates - Crustacean
Ceriodaphnia dubia (neonates)
40-44 Reproduction 7d NOEC 266 Geometric mean
Hyalella azteca 50-1002 Growth 28d EC10 893 PESC 2013
Invertebrates -Mollusca
Lampsilis abrupta (juveniles)
100 Dry weight 28d EC10 320 Wang et al. 2016b
Invertebrates- Insecta
Chironomus dilutus (larvae)
100 Dry weight 7d EC10 489 Wang et al. 2016a
Neocleon triangulifer (nymph)
99 Development/ Survival
36d NOEC 1293 Soucek and Dickinson 20151
Rotifers
Brachionus calyciflorus (<4h old)
40-802 Reproduction 48h NOEC 696 Elphick et al. 2011
Algae
Pseudokirchneriella subcapitata
10 Growth 72h NOEC 1100 Elphick et al. 2011
Higher aquatic plants
Fontinalis antipyretica 15 Growth 21d NOEC 628 Elphick et al. 2011 Geometric mean
Lemna minor 50 Growth 7d EC10 2143 PESC 2013
1 = The study has been evaluated to be of sufficient reliability and relevance for QS derivation (see table S4). 2 = The effect value for harder water was included in the geometric mean since it suggests higher toxicity. 3 = NOEC was not reported, the concentration below the statistically significant concentration was set as NOEC.

21
Deterministic derivation
The same AA-QS as in scenario 2. The most sensitive species was the N. triangulifer with the endpoint
“percent of pre-emergent nymph” (i.e. developmental effects) with a NOEC of 129 mg/L (Soucek and
Dickinson 2015). AF 10 was applied since the dataset include chronic data for three trophic levels
(European Communities, 2011). The AA-QS was set to 12.9 mg/L.
Probabilistic derivation
The dataset fulfilled the criteria to perform a SSD (European Communities, 2011). Normal distribution
was accepted at all significance levels in all tests. The median estimate of the HC5 was 130.94 mg/L
(table 12). The graph of the SSD is presented in figure 3. AF 5 was used and this resulted in an AA-QS
of 43.7 mg/L. A lower AF was not considered appropriate since not all sensitive life stages are covered
in the dataset, no described mode of action has been found, and a comparisons with field and
mesocosm studies was not possible (European Communities 2011). All AA-QS are summarized in table
13.
Table 12. The results of HC5 from the SSD of chronic sulfate ecotoxicity based on realistic worst-case data for Sweden.
Type of HC5 Value (mg/L) log10(Value) (mg/L) Description
LL HC5 55.90 1.75 lower estimate of the HC5
HC5 130.94 2.12 median estimate of the HC5
UL HC5 218.44 2.34 upper estimate of the HC5
sprHC5 3.91 0.59 spread of the HC5 estimate
Figure 3. SSD (ETX 2.1) for chronic freshwater toxicity studies with realistic worst-case data for Sweden. The most sensitive species was the insect N. triangulifer. The HC5 was set to 130.94 mg/L.

22
Table 13. Proposed AA-QS for sulfate based on different hardness scenarios and method.
Hardness (mg CaCO3/L)
Method
Scenario 1 Scenario 2 Scenario 3
6-15 40-50 80-100 >160 Hardness≈100 Realistic
worst- case
Deterministic (mg/L) - 15.01 41.9 56.0 12.9 12.9
Probabilistic (mg/L) - 35.0 26.2 1 = 17.5 mg/L if excluding NOEC of <150 mg/L for C. dubia.

23
7. ADDED RISK APPROACH
Added effect values (e.g. NOECadded) was calculated by subtracting the sulfate concentration used in
the control medium from the effect value (European Communities, 2011). Added risks (QSadded) was
calculated for all MAC-QS scenarios (table 14), and for scenario 2 (hardness ≈ 100 mg CaCO3/L) and 3
(realistic worst-case data) for the AA-QS (table 15). Effect valuesadded for MAC-QSadded can be found in
supportive information table S5 (scenario 1), S6 (scenario 2) and for AA-QSadded in table S8 (scenario 2)
and S10 (scenario 3). The MAC-QSadded did not differ considerably from MAC-QS (except for hardness
≥160 mg CaCO3/L). The AA-QSadded were approximately 6-10 mg/L lower compared to AA-QS.
Table 14. MAC-QSadded for sulfate based on different hardness scenarios and method.
Hardness (mg CaCO3/L) Method
Scenario 1 Scenario 2
≥25 40-50 75-100 ≥160 Hardness ≈100
Deterministic (mg/L) 57.6 88.3 154.0 270.8 63.3
Probabilistic (mg/L) - 72.51
1 = HC5 results in table S7, SSD graph in figure S1.
Table 15. AA-QSadded for sulfate (mg/L) based on different hardness scenarios and method.
Hardness (mg CaCO3/L) Method
Scenario 2 Scenario 3
Hardness≈100 Realistic worst- case
Deterministic (mg/L) 7.2 7.2
Probabilistic (mg/L) 25.61 20.52 1 = HC5 results in table S9, SSD graph in figure S2. 2 = HC5 results in table S11, SSD graph in figure S3.

24
8. IDENTIFICATION OF ISSUES RELATING TO UNCERTAINTY IN RELATION TO THE EQSs DERIVED
Different molar ratio of calcium, magnesium, chloride, and possibly potassium concentrations may
influence the toxicity of sulfate. The complexity of imbalance toxicity of major ion entails uncertainties
given the large numbers and combinations of ions.
The most critical studies setting the base for the deterministic derivations (scenario 2 and 3) have been
evaluated for their reliability and relevance (supportive information table S4). Due to time restrictions,
evaluations were not conducted for entire datasets used in scenario 1 or in the probabilistic
derivations.
An attempt to establish a relationship between hardness and toxicity of sulfate was made. However,
due to the large differences in the available studies in aspects such as durations, statistical criterion,
endpoints, and water chemistry it was not possible to establish such a relationship. Scenario 1
presents different standards for different categories of hardness but was not possible to establish for
water of low hardness, which reflects the main situation in Sweden.
25
9. REFERENCES BC. 2013. Ambient water quality guidelines for sulphate. British Columbia ministry of environment: Victoria, BC.
Davies TD. 2002. Sulphate toxicity to freshwater organisms and molybdenum toxicity to rainbow trout (Oncorhynchus mykiss). Master of Science Thesis, Resource Management and Environmental Studies. University of British Columbia. 119p.
Davies TD. 2007. Sulphate toxicity to the aquatic moss, Fontinalis antipyretica. Chemosphere 66: 444-451.
Davies TD, Hall KJ. 2007. Importance of calcium in modifying the acute toxicity of sodium sulphate to Hyalella azteca and Daphnia magna. Environ. Toxicol. and Chem. 26(6): 1243-1247.
Dowden BF, Bennett HJ. 1965. Toxicity of selected chemicals to certain animals. J. Water Pollut. Control Fed 37(9): 1308-1316.
Elphick J, Davies M, Gilron G, Canaria E, Lo B, Bailey H. 2011. An aquatic toxicological evaluation of sulphate: the case for considering hardness as a modifying factor in setting water quality guidelines. Environ. Toxicol. and Chem. 30:247-253.
Hart BT, Bailey P, Edwards R, Hortle K, James K, McMahon A, Meredith C, Swadling K. 1991. A review of the salt sensitivity of the Australian freshwater biota. Hydrobiologia 210: 105-144.
Goetsch PA, Palmer CG. 1997. Salinity Tolerances of Selected Macroinvertebrates of the Sabie River, Kruger National Park, South Africa. Arch. Environ. Contam. Toxicol 32: 32–41.
Kennedy CJ. 2012. Assessment of toxicological effects of sulphate under varying hardness using early life stages of Rainbow trout (Oncorhynchus mykiss). Unpublished data. Submitted from BC Ministry of Environment.
Lasier PJ, Hardin IR. 2009. Observed and predicted reproduction of Ceriodaphnia dubia exposed to chloride, sulfate, and bicarbonate. Environ. Toxicol. and Chem. 29: 347–358.
Moermond CTA, Kase R, Korkaric M, Ågerstand M. 2016. CRED: Criteria for Reporting and Evaluationg Ecotoxicity Data. Environ. Toxicol. and Chem. 25 (5): 1297-1309.
Mount DR, Gulley DD, Hockett JR., Garrison, T. D. and Evans, J. M. 1997. Statistical models to predict the toxicity of major ions to Ceriodaphnia dubia, Daphnia magna and Pimephales promelas (fathead minnows). Environ. Toxicol. and Chem 16: 2009–2019.
Patrick R, Cairns J, Scheier A. 1968. The relative sensitivity of diatoms, snails, and fish to twenty common constituents of industrial wastes. The Progressive Fish-Culturist 30(3): 137- 140.
PSEC, 2013. Ambient Water Quality Guidelines For Sulphate (appendix A). Pacific Environmental Science Center. Canada, British Columbia. Available at: http://www2.gov.bc.ca/gov/content/environment/air-land-water/water/water-quality/water-quality-guidelines/approved-water-quality-guidelines (accessed 27Jun. 17)
SETAC, 2004. Whole effluent toxicity Testing: Ion imbalance. SETAC Technical Issue Paper. Society of Environmental Toxicology and Chemistry. SETAC Press, Pensacola, FL, USA.
Simmons JA. 2012. Toxicity of major cations and anions (Na, K, Ca, Cl and SO4) to macrophyte and an alga. Environmental Toxicology and Chemistry 31: 1370–1374.
Soucek DJ, Kennedy AJ. 2005. Effects of hardness, chloride, and acclimation on the acute toxicity of sulfate to freshwater invertebrates. Environ. Toxicol. and Chem 24(5): 1204-1210.
26
Soucek DJ. 2007a. Bioenergetic effects of sodium sulfate on the freshwater crustacean, Ceriodaphnia dubia. Ecotoxicology 16: 317–325.
Soucek DJ. 2007b. Comparison of hardness and chloride-regulated acute effects of sodium sulfate on two freshwater crustaceans. Environ Toxicol Chem 26: 773–779.
Soucek DJ. 2007c. Sodium sulfate impacts feeding, specific dynamic action, and growth rate in the freshwater bivalve Corbicula fluminea. Aquat. Toxicol 83: 315-322.
Soucek DJ, Dickinson A. 2015. Full-life chronic toxicity of sodium salts to the mayfly Neocloeon triangulifer in tests with laboratory cultured food. Environm. Toxicol. and Chem 34: 2126–2137.
Soucek DJ, Mount DR, Dickinson A, Hockett JR, McEwen AR. 2015. Contrasting effects of chloride on growth, reproduction, and toxicant sensitivity in two genetically distinct strains of Hyalella azteca. Environ Toxicol Chem 34: 2354–2362 (Supplemental Data).
Struewing KA, Lazorchak JM, Weaver PC, Johnson BR, Funk DH, Buchwalter DB. 2015. Part 2: Sensitivity comparisons of the mayfly Centroptilum triangulifer to Ceriodaphnia dubia and Daphnia magna using standard reference toxicants; NaCl, KCl and CuSO4. Chemosphere 139: 597-603.
USEPA. 2010. Final Report on Acute and Chronic Toxicity of Nitrate, Nitrite, Boron, Manganese, Fluoride, Chloride and Sulfate to Several Aquatic Animal Species. EPA 905-R-10-022. United States, Environmental Protection Agency.
Vellemu EC, Mensah PK, Griffin NJ, Odume ON. 2017. Sensitivity of the mayfly Adenophlebia auriculata (Ephemeroptera: Leptophlebiidae) to MgSO4 and Na2SO4. Physics and Chemistry of the Earth 100: 81-85.
Wang N, Dorman RA, Ingersoll CR, Hardesty DK, Brumbaugh WG, Hammer EJ, Bauer CR, Mount DR. 2016a. Acute and chronic toxicity of sodium sulfate to four freshwater organisms in water-only exposures. Environmental Toxicology and Chemistry 35(1): 115–127.
Wang N, Ivey CD, Ingersoll CR, Brumbaugh WG, Alvares D, Hammer EJ, Bauer CR, Augspurger T, Raimond S, Bernhart CM. 2016b. Acute sensitivity of broad range of freshwater mussels to chemicals with different modes of toxic action. Environmental Toxicology (early view).
Warne M St J, Schifko AD. 1999. Toxicity of Laundry Detergent Components to a Freshwater Cladoceran and Their Contribution to Detergent Toxicity. Ecotoxicology and Environmental Safety 44: 196-206.
Weaver PC, Lazorchak JM, Struewing KA, DeCelles SJ, Funk DH, Buchwater DB, Johnson BR. 2015. Part 1: Laboratory culture of Centroptilum triangulifer (Ephemeroptera: Baetide) Using a defined diet of three diatoms. Chemosphere 139: 589-59.
27
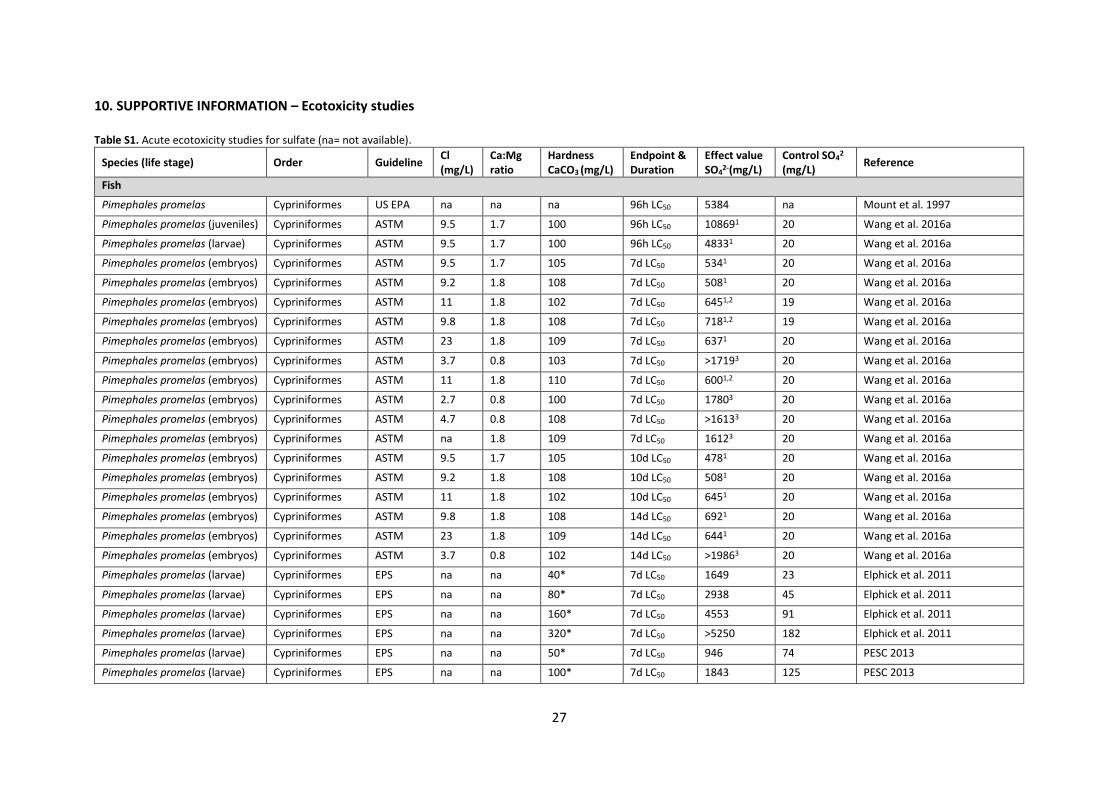
10. SUPPORTIVE INFORMATION – Ecotoxicity studies Table S1. Acute ecotoxicity studies for sulfate (na= not available).
Species (life stage) Order Guideline Cl (mg/L)
Ca:Mg ratio
Hardness CaCO3 (mg/L)
Endpoint & Duration
Effect value SO4
2-(mg/L) Control SO4
2 (mg/L)
Reference
Fish
Pimephales promelas Cypriniformes US EPA na na na 96h LC50 5384 na Mount et al. 1997
Pimephales promelas (juveniles) Cypriniformes ASTM 9.5 1.7 100 96h LC50 108691 20 Wang et al. 2016a
Pimephales promelas (larvae) Cypriniformes ASTM 9.5 1.7 100 96h LC50 48331 20 Wang et al. 2016a
Pimephales promelas (embryos) Cypriniformes ASTM 9.5 1.7 105 7d LC50 5341 20 Wang et al. 2016a
Pimephales promelas (embryos) Cypriniformes ASTM 9.2 1.8 108 7d LC50 5081 20 Wang et al. 2016a
Pimephales promelas (embryos) Cypriniformes ASTM 11 1.8 102 7d LC50 6451,2 19 Wang et al. 2016a
Pimephales promelas (embryos) Cypriniformes ASTM 9.8 1.8 108 7d LC50 7181,2 19 Wang et al. 2016a
Pimephales promelas (embryos) Cypriniformes ASTM 23 1.8 109 7d LC50 6371 20 Wang et al. 2016a
Pimephales promelas (embryos) Cypriniformes ASTM 3.7 0.8 103 7d LC50 >17193 20 Wang et al. 2016a
Pimephales promelas (embryos) Cypriniformes ASTM 11 1.8 110 7d LC50 6001,2 20 Wang et al. 2016a
Pimephales promelas (embryos) Cypriniformes ASTM 2.7 0.8 100 7d LC50 17803 20 Wang et al. 2016a
Pimephales promelas (embryos) Cypriniformes ASTM 4.7 0.8 108 7d LC50 >16133 20 Wang et al. 2016a
Pimephales promelas (embryos) Cypriniformes ASTM na 1.8 109 7d LC50 16123 20 Wang et al. 2016a
Pimephales promelas (embryos) Cypriniformes ASTM 9.5 1.7 105 10d LC50 4781 20 Wang et al. 2016a
Pimephales promelas (embryos) Cypriniformes ASTM 9.2 1.8 108 10d LC50 5081 20 Wang et al. 2016a
Pimephales promelas (embryos) Cypriniformes ASTM 11 1.8 102 10d LC50 6451 20 Wang et al. 2016a
Pimephales promelas (embryos) Cypriniformes ASTM 9.8 1.8 108 14d LC50 6921 20 Wang et al. 2016a
Pimephales promelas (embryos) Cypriniformes ASTM 23 1.8 109 14d LC50 6441 20 Wang et al. 2016a
Pimephales promelas (embryos) Cypriniformes ASTM 3.7 0.8 102 14d LC50 >19863 20 Wang et al. 2016a
Pimephales promelas (larvae) Cypriniformes EPS na na 40* 7d LC50 1649 23 Elphick et al. 2011
Pimephales promelas (larvae) Cypriniformes EPS na na 80* 7d LC50 2938 45 Elphick et al. 2011
Pimephales promelas (larvae) Cypriniformes EPS na na 160* 7d LC50 4553 91 Elphick et al. 2011
Pimephales promelas (larvae) Cypriniformes EPS na na 320* 7d LC50 >5250 182 Elphick et al. 2011
Pimephales promelas (larvae) Cypriniformes EPS na na 50* 7d LC50 946 74 PESC 2013
Pimephales promelas (larvae) Cypriniformes EPS na na 100* 7d LC50 1843 125 PESC 2013

28
Species (life stage) Order Guideline Cl (mg/L)
Ca:Mg ratio
Hardness CaCO3 (mg/L)
Endpoint & Duration
Effect value SO4
2-(mg/L) Control SO4
2 (mg/L)
Reference
Pimephales promelas (larvae) Cypriniformes EPS na na 250* 7d LC50 3178 470 PESC 2013
Lepomis macrochirus Perciformes na na na na 24h LC504 11824 na Dowden and Bennett 1965
Lepomis macrochirus Perciformes na na na 38 96h LC50 9121 na Trama 1954
Lepomis macrochirus Perciformes na na na na 96h LC504 9121 na Patrick et al. 1968
Invertebrates- Crustacean
Ceriodaphnia dubia (<24h old) Cladocera ASTM 1.9 0.88 89 48h LC50 2050 90 Soucek and Kennedy 2005
Ceriodaphnia dubia (<24h old) Cladocera ASTM 33.9 3.25 107 48h LC50 2526 59 Soucek and Kennedy 2005
Ceriodaphnia dubia (neonates) Cladocera ASTM 1.9 0.88 92 48h LC50 2500 90 Soucek 2007a
Ceriodaphnia dubia (neonates) Cladocera ASTM 33.9 3.25 92 48h LC50 3000 59 Soucek 2007a
Ceriodaphnia dubia Cladocera US EPA na na 100 48h LC50 2083 na Mount et al. 1997
Ceriodaphnia dubia (<24h old) Cladocera ASTM 1.9 0.88 194* 48h LC50 3000 na Soucek and Kennedy 2005
Ceriodaphnia dubia (<24h old) Cladocera ASTM 1.9 0.88 288* 48h LC50 2946 na Soucek and Kennedy 2005
Ceriodaphnia dubia (<24h old) Cladocera ASTM 1.9 0.88 390* 48h LC50 3174 na Soucek and Kennedy 2005
Ceriodaphnia dubia (<24h old) Cladocera ASTM 1.9 0.88 484* 48h LC50 3516 na Soucek and Kennedy 2005
Ceriodaphnia dubia (<24h old) Cladocera ASTM 1.9 0.88 578* 48h LC50 3288 na Soucek and Kennedy 2005
Ceriodaphnia dubia (neonates) Cladocera na 9.5 1.7 100 48h EC50 2441 20 Wang et al. 2016a
Ceriodaphnia dubia (neonates) Cladocera na na na na 48h EC50 3150 na Warne and Schifko 1999
Daphnia magna (<24h old) Cladocera US EPA na na 100 48h LC50 3098 na Mount et al. 1997
Daphnia magna (<24h old) Cladocera US EPA na 0.7 25* 48h LC50 1194 na Davies and Hall 2007
Daphnia magna (<24h old) Cladocera US EPA na 0.7 50* 48h LC50 1551 na Davies and Hall 2007
Daphnia magna (<24h old) Cladocera US EPA na 0.7 75* 48h LC50 3342 na Davies and Hall 2007
Daphnia magna (<24h old) Cladocera US EPA na 0.7 100* 48h LC50 3203 59 Davies and Hall 2007
Daphnia magna (<24h old) Cladocera US EPA na 0.7 25 48h LC50 1194 na Davies and Hall 2007
Daphnia magna (<24h old) Cladocera US EPA na 1.8 25 48h LC50 1563 na Davies and Hall 2007
Daphnia magna (<24h old) Cladocera US EPA na 7 25 48h LC50 1985 na Davies and Hall 2007
Daphnia magna (<24h old) Cladocera US EPA 16.8 0.7 100 48h LC50 3203 102 Davies and Hall 2007
Daphnia magna (<24h old) Cladocera US EPA 16.8 1.8 100 48h LC50 38085 102 Davies and Hall 2007
Daphnia magna (<24h old) Cladocera US EPA 16.8 7 100 48h LC50 4395 102 Davies and Hall 2007
Daphnia magna (<24h old) Cladocera na na na na 96h LC504 3072 na Dowden and Bennett 1965

29
Species (life stage) Order Guideline Cl (mg/L)
Ca:Mg ratio
Hardness CaCO3 (mg/L)
Endpoint & Duration
Effect value SO4
2-(mg/L) Control SO4
2 (mg/L)
Reference
Daphnia magna (adult) Cladocera na na na na 96h LC504 426 na Dowden and Bennett 1965
Daphnia magna (neonates) Cladocera EPS na na 25* 48h LC50 957 na Davies 2002
Daphnia magna (neonates) Cladocera EPS na na 50* 48h LC50 1768 na Davies 2002
Daphnia magna (neonates) Cladocera EPS na na 75* 48h LC50 3155 na Davies 2002
Daphnia magna (neonates) Cladocera EPS na 0.7 25 48h LC50 1285 na Davies 2002
Daphnia magna (neonates) Cladocera EPS na 3.8 25 48h LC50 1571 na Davies 2002
Daphnia magna (neonates) Cladocera EPS na 7 25 48h LC50 1993 na Davies 2002
Daphnia magna (neonates) Cladocera EPS na 0.7 100 48h LC50 3146 54 Davies 2002
Daphnia magna (neonates) Cladocera EPS na 3.8 100 48h LC50 38395 na Davies 2002
Daphnia magna (neonates) Cladocera EPS na 7 100 48h LC50 4414 115 Davies 2002
Hyalella azteca (juvenile) Amphibods EPS na na 80 96h EC50 24615 45 Elphick et al. 2011
Hyalella azteca (7-14 d old) Amphibods ASTM 25 1.41 100* 96h LC50 1900 na Soucek 2007b
Hyalella azteca (7-14 d old) Amphibods ASTM 25 1.41 500* 96h LC50 4000 na Soucek 2007b
Hyalella azteca (7-14d old) Amphibods ASTM 1.9 0.88 94 96h LC50 512 90 Soucek and Kennedy 2005
Hyalella azteca (7-14d old) Amphibods ASTM 33.9 3.25 107 96h LC50 2855 59 Soucek and Kennedy 2005
Hyalella azteca (2-9d old) Amphibods US EPA na 3 25* 96h LC50 569 na Davies and Hall 2007
Hyalella azteca (2-9d old) Amphibods US EPA na 3 50* 96h LC50 1448 na Davies and Hall 2007
Hyalella azteca (2-9d old) Amphibods US EPA na 3 75* 96h LC50 1580 na Davies and Hall 2007
Hyalella azteca (2-9d old) Amphibods US EPA na 3 123* 96h LC50 3144 na Davies and Hall 2007
Hyalella azteca (2-9d old) Amphibods US EPA na 3 250* 96h LC50 5259 na Davies and Hall 2007
Hyalella azteca (2-9d old) Amphibods US EPA 2.4 0.7 100 96h LC50 2101 58 Davies and Hall 2007
Hyalella azteca (2-9d old) Amphibods US EPA 2.4 1.8 100 96h LC50 22405 58 Davies and Hall 2007
Hyalella azteca (2-9d old) Amphibods US EPA 2.4 7 100 96h LC50 2725 58 Davies and Hall 2007
Hyalella azteca (7-11d old) Amphibods ASTM 5 3.2 84 96h LC50 20845 52 Soucek et al. 2015
Hyalella azteca (7-11d old) Amphibods ASTM 25 3.2 84 96h LC50 1882 52 Soucek et al. 2015
Hyalella azteca (7-11d old) Amphibods ASTM 50 3.2 84 96h LC50 1919 52 Soucek et al. 2015
Hyalella azteca (2-9d old) Amphibods EPS na na 100* 96h LC50 29715 43 Davies 2002
Hyalella azteca (2-9d old) Amphibods EPS na na 250* 96h LC50 4864 109 Davies 2002
30
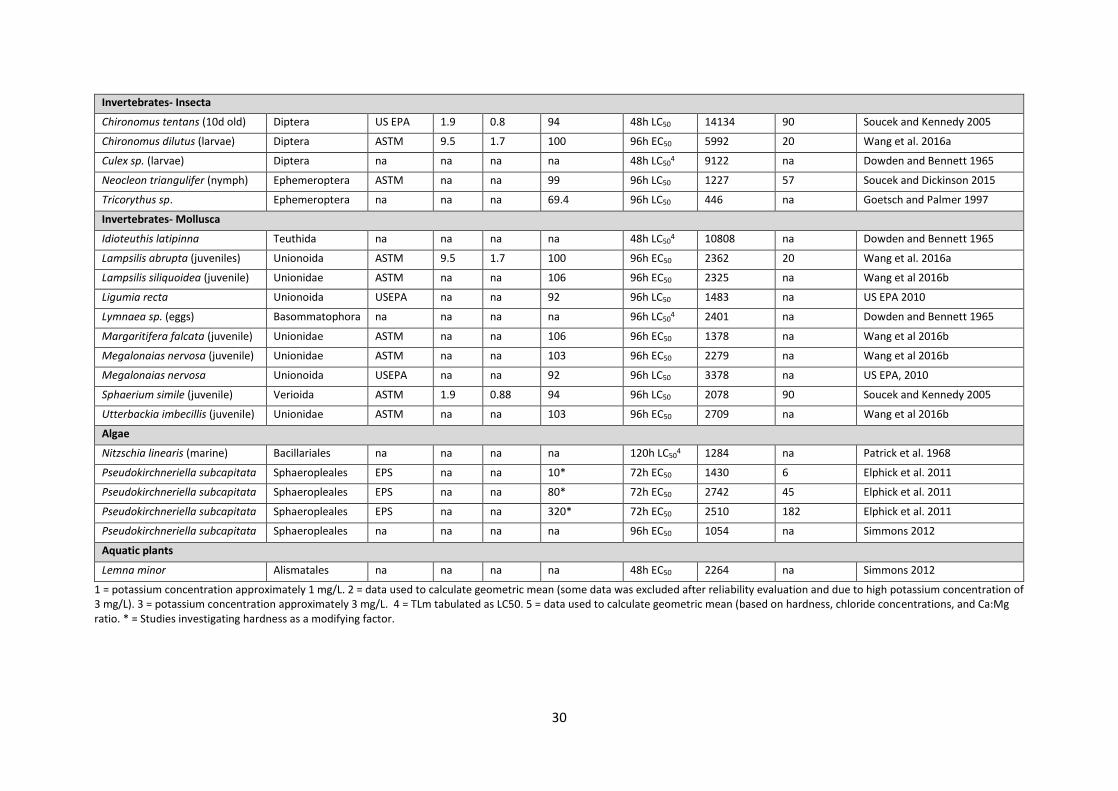
Invertebrates- Insecta
Chironomus tentans (10d old) Diptera US EPA 1.9 0.8 94 48h LC50 14134 90 Soucek and Kennedy 2005
Chironomus dilutus (larvae) Diptera ASTM 9.5 1.7 100 96h EC50 5992 20 Wang et al. 2016a
Culex sp. (larvae) Diptera na na na na 48h LC504 9122 na Dowden and Bennett 1965
Neocleon triangulifer (nymph) Ephemeroptera ASTM na na 99 96h LC50 1227 57 Soucek and Dickinson 2015
Tricorythus sp. Ephemeroptera na na na 69.4 96h LC50 446 na Goetsch and Palmer 1997
Invertebrates- Mollusca
Idioteuthis latipinna Teuthida na na na na 48h LC504 10808 na Dowden and Bennett 1965
Lampsilis abrupta (juveniles) Unionoida ASTM 9.5 1.7 100 96h EC50 2362 20 Wang et al. 2016a
Lampsilis siliquoidea (juvenile) Unionidae ASTM na na 106 96h EC50 2325 na Wang et al 2016b
Ligumia recta Unionoida USEPA na na 92 96h LC50 1483 na US EPA 2010
Lymnaea sp. (eggs) Basommatophora na na na na 96h LC504 2401 na Dowden and Bennett 1965
Margaritifera falcata (juvenile) Unionidae ASTM na na 106 96h EC50 1378 na Wang et al 2016b
Megalonaias nervosa (juvenile) Unionidae ASTM na na 103 96h EC50 2279 na Wang et al 2016b
Megalonaias nervosa Unionoida USEPA na na 92 96h LC50 3378 na US EPA, 2010
Sphaerium simile (juvenile) Verioida ASTM 1.9 0.88 94 96h LC50 2078 90 Soucek and Kennedy 2005
Utterbackia imbecillis (juvenile) Unionidae ASTM na na 103 96h EC50 2709 na Wang et al 2016b
Algae
Nitzschia linearis (marine) Bacillariales na na na na 120h LC504 1284 na Patrick et al. 1968
Pseudokirchneriella subcapitata Sphaeropleales EPS na na 10* 72h EC50 1430 6 Elphick et al. 2011
Pseudokirchneriella subcapitata Sphaeropleales EPS na na 80* 72h EC50 2742 45 Elphick et al. 2011
Pseudokirchneriella subcapitata Sphaeropleales EPS na na 320* 72h EC50 2510 182 Elphick et al. 2011
Pseudokirchneriella subcapitata Sphaeropleales na na na na 96h EC50 1054 na Simmons 2012
Aquatic plants
Lemna minor Alismatales na na na na 48h EC50 2264 na Simmons 2012
1 = potassium concentration approximately 1 mg/L. 2 = data used to calculate geometric mean (some data was excluded after reliability evaluation and due to high potassium concentration of 3 mg/L). 3 = potassium concentration approximately 3 mg/L. 4 = TLm tabulated as LC50. 5 = data used to calculate geometric mean (based on hardness, chloride concentrations, and Ca:Mg ratio. * = Studies investigating hardness as a modifying factor.

31
Table S2. Chronic ecotoxicity studies for sulfate (na= not available).
Species (life stage) Order Guideline Cl (mg/L)
Ca:Mg ratio
Hardness CaCO3
(mg/L) Endpoint & Duration
Effect value SO4
2-(mg/L)
Control SO4
2- (mg/L)
Reference
Fish
Oncorhynchus kisutch (embryos) Salmoniformes EPS na na 15 Development 10d NOEC 825 na Elphick et al. 2011
Oncorhynchus mykiss (embryos) Salmoniformes EPS na na 15 Development 21d NOEC 205 na Elphick et al. 2011
Pimephales promelas (larvae) Cypriniformes EPS na na 40* Growth 7d NOEC 595 23 Elphick et al. 2011
Pimephales promelas (larvae) Cypriniformes EPS na na 80* Growth 7d NOEC 760 45 Elphick et al. 2011
Pimephales promelas (larvae) Cypriniformes EPS na na 160* Growth 7d NOEC 1300 91 Elphick et al. 2011
Pimephales promelas (larvae) Cypriniformes EPS na na 320* Growth 7d NOEC 820 182 Elphick et al. 2011
Pimephales promelas (larvae) Cypriniformes EPS na na 50* Growth 7d EC10 931 74 PESC 2013
Pimephales promelas (larvae) Cypriniformes EPS na na 100* Growth 7d EC10 1397 125 PESC 2013
Pimephales promelas (larvae) Cypriniformes EPS na na 250* Growth 7d EC10 2969 470 PESC 2013
Pimephales promelas (embryos) Cypriniformes ASTM 9.5 1.7 100 Biomass 34d EC101 92.5 20 Wang et al. 2016a
Pimephales promelas (embryos) Cypriniformes ASTM 9.5 1.7 100 Biomass 34d EC101 53 20 Wang et al. 2016a
Amphibans
Pseudacris regilla (tadpoles) Anura OECD na na 15* Survival/ growth 21d NOEC 1075 na Elphick et al. 2011
Pseudacris regilla (tadpoles) Anura OECD na na 80* Survival/ growth 21d NOEC 978 45 Elphick et al. 2011
Invertebrates- Crustacean
Ceriodaphnia dubia (neonates) Cladocera EPS na na 40* Reproduction 7d NOEC <150 23 Elphick et al. 2011
Ceriodaphnia dubia (neonates) Cladocera EPS na na 80* Reproduction 7d NOEC 6452 45 Elphick et al. 2011
Ceriodaphnia dubia (neonates) Cladocera EPS na na 160* Reproduction 7d NOEC 775 91 Elphick et al. 2011
Ceriodaphnia dubia (neonates) Cladocera EPS na na 320* Reproduction 7d NOEC 420 182 Elphick et al. 2011
Ceriodaphnia dubia (neonates) Cladocera EPA na na 44 Reproduction 7d NOEC 500 21 Lasier and Hardin 2009
Ceriodaphnia dubia (neonates) Cladocera EPA na na 44 Reproduction 7d NOEC 250 21 Lasier and Hardin 2010
Ceriodaphnia dubia Cladocera ASTM 1.9 0.88 92 Reproduction 7d EC50 1148 90 Soucek 2007a
Ceriodaphnia dubia Cladocera ASTM 33.9 3.25 92 Reproduction 7d EC50 1458 59 Soucek 2007a
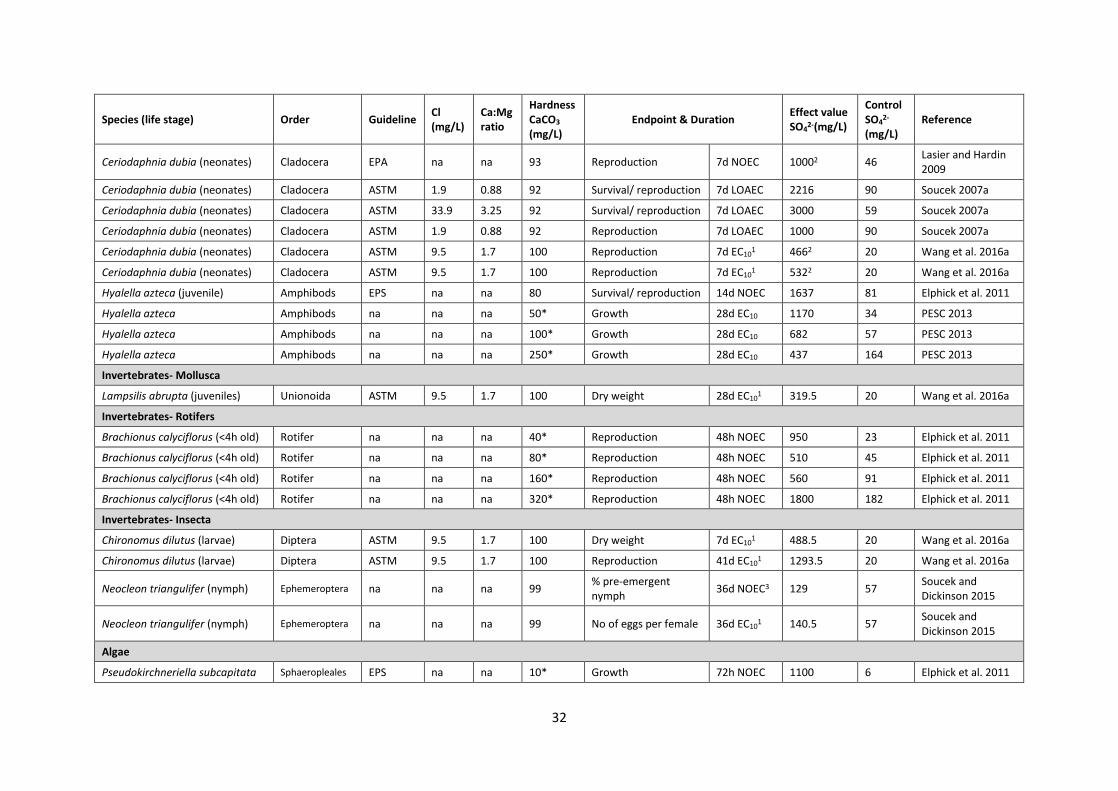
32
Species (life stage) Order Guideline Cl (mg/L)
Ca:Mg ratio
Hardness CaCO3
(mg/L) Endpoint & Duration
Effect value SO4
2-(mg/L)
Control SO4
2- (mg/L)
Reference
Ceriodaphnia dubia (neonates) Cladocera EPA na na 93 Reproduction 7d NOEC 10002 46 Lasier and Hardin 2009
Ceriodaphnia dubia (neonates) Cladocera ASTM 1.9 0.88 92 Survival/ reproduction 7d LOAEC 2216 90 Soucek 2007a
Ceriodaphnia dubia (neonates) Cladocera ASTM 33.9 3.25 92 Survival/ reproduction 7d LOAEC 3000 59 Soucek 2007a
Ceriodaphnia dubia (neonates) Cladocera ASTM 1.9 0.88 92 Reproduction 7d LOAEC 1000 90 Soucek 2007a
Ceriodaphnia dubia (neonates) Cladocera ASTM 9.5 1.7 100 Reproduction 7d EC101 4662 20 Wang et al. 2016a
Ceriodaphnia dubia (neonates) Cladocera ASTM 9.5 1.7 100 Reproduction 7d EC101 5322 20 Wang et al. 2016a
Hyalella azteca (juvenile) Amphibods EPS na na 80 Survival/ reproduction 14d NOEC 1637 81 Elphick et al. 2011
Hyalella azteca Amphibods na na na 50* Growth 28d EC10 1170 34 PESC 2013
Hyalella azteca Amphibods na na na 100* Growth 28d EC10 682 57 PESC 2013
Hyalella azteca Amphibods na na na 250* Growth 28d EC10 437 164 PESC 2013
Invertebrates- Mollusca
Lampsilis abrupta (juveniles) Unionoida ASTM 9.5 1.7 100 Dry weight 28d EC101 319.5 20 Wang et al. 2016a
Invertebrates- Rotifers
Brachionus calyciflorus (<4h old) Rotifer na na na 40* Reproduction 48h NOEC 950 23 Elphick et al. 2011
Brachionus calyciflorus (<4h old) Rotifer na na na 80* Reproduction 48h NOEC 510 45 Elphick et al. 2011
Brachionus calyciflorus (<4h old) Rotifer na na na 160* Reproduction 48h NOEC 560 91 Elphick et al. 2011
Brachionus calyciflorus (<4h old) Rotifer na na na 320* Reproduction 48h NOEC 1800 182 Elphick et al. 2011
Invertebrates- Insecta
Chironomus dilutus (larvae) Diptera ASTM 9.5 1.7 100 Dry weight 7d EC101 488.5 20 Wang et al. 2016a
Chironomus dilutus (larvae) Diptera ASTM 9.5 1.7 100 Reproduction 41d EC101 1293.5 20 Wang et al. 2016a
Neocleon triangulifer (nymph) Ephemeroptera na na na 99 % pre-emergent nymph
36d NOEC3 129 57 Soucek and Dickinson 2015
Neocleon triangulifer (nymph) Ephemeroptera na na na 99 No of eggs per female 36d EC101 140.5 57
Soucek and Dickinson 2015
Algae
Pseudokirchneriella subcapitata Sphaeropleales EPS na na 10* Growth 72h NOEC 1100 6 Elphick et al. 2011

33
Species (life stage) Order Guideline Cl (mg/L)
Ca:Mg ratio
Hardness CaCO3
(mg/L) Endpoint & Duration
Effect value SO4
2-(mg/L)
Control SO4
2- (mg/L)
Reference
Pseudokirchneriella subcapitata Sphaeropleales EPS na na 80* Growth 72h NOEC 1200 45 Elphick et al. 2011
Pseudokirchneriella subcapitata Sphaeropleales EPS na na 320* Growth 72h NOEC 1300 182 Elphick et al. 2011
Pseudokirchneriella subcapitata Sphaeropleales na na na na Flourescence 96h EC10 426 na Simmons 2012
Pseudokirchneriella subcapitata Sphaeropleales na na na na Cell density 96h EC10 810 na Simmons 2012
Higher aquatic plants
Fontinalis antipyretica Hypnales na na na 15 Growth 21d NOEC 603 na Elphick et al. 2011
Fontinalis antipyretica Hypnales na na na 15 Growth 21d NOEC 654 na Elphick et al. 2011
Fontinalis antipyretica Hypnales na na na 15 Clorofyll 21d NOEC 145 na Elphick et al. 2011
Fontinalis antipyretica Hypnales na na na 15 Clorofyll 21d NOEC 654 na Elphick et al. 2011
Fontinalis antipyretica Hypnales na na 2.4 19 Shoot length 21d NOEC 200 na Davies 2007
Fontinalis antipyretica Hypnales na na 6.7 26 Shoot length 21d NOEC 600 na Davies 2007
Fontinalis antipyretica Hypnales na na 6.7 105 Shoot length 21d NOEC 1000 na Davies 2007
Fontinalis antipyretica Hypnales na na 2.4 19 Growth 21d NOEC 400 na Davies 2007
Fontinalis antipyretica Hypnales na na 67 26 Growth 21d NOEC 1000 na Davies 2007
Fontinalis antipyretica Hypnales na na 6.7 105 Growth 21d NOEC 200 na Davies 2007
Fontinalis antipyretica Hypnales na na 2.4 19 Chlorophyll reduction 21d NOEC 200 na Davies 2007
Fontinalis antipyretica Hypnales na na 6.7 26 Chlorophyll reduction 21d NOEC 400 na Davies 2007
Fontinalis antipyretica Hypnales na na 6.7 105 Chlorophyll reduction 21d NOEC 800 na Davies 2007
Lemna minor Alismatales EPS na na 50* Frond increase 7d EC10 2143 103 PESC 2013
Lemna minor Alismatales EPS na na 100* Frond increase 7d EC10 2243 217 PESC 2013
Lemna minor Alismatales EPS na na 250* Frond increase 7d EC10 2314 248 PESC 2013
Lemna minor Alismatales na na na na No. of live thalli 7d EC10 345 na Simmons 2012
1 = EC20 divided by 2, tabulated as EC10. 2 = data used to calculate geometric mean. 3 = NOEC was not reported, the concentration below the statistically significant concentration was set as NOEC. * = Studies investigating hardness as a modifying factor.
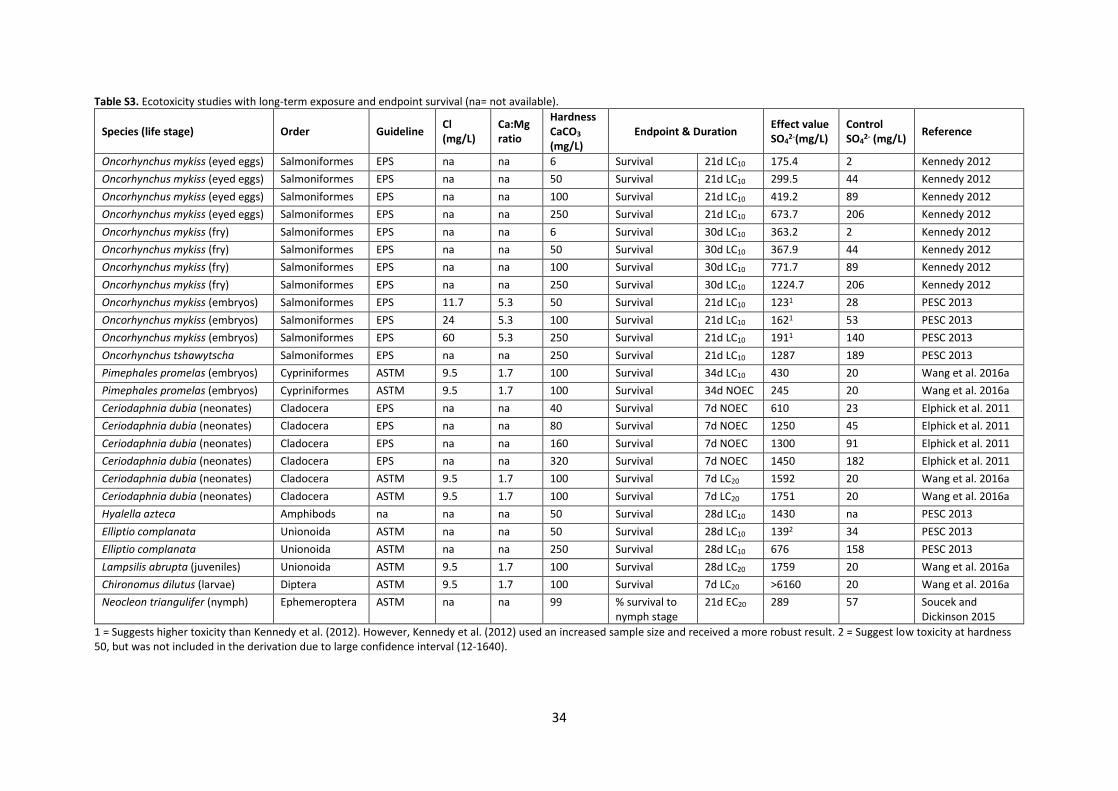
34
Table S3. Ecotoxicity studies with long-term exposure and endpoint survival (na= not available).
Species (life stage) Order Guideline Cl (mg/L)
Ca:Mg ratio
Hardness CaCO3
(mg/L) Endpoint & Duration
Effect value SO4
2-(mg/L) Control SO4
2- (mg/L) Reference
Oncorhynchus mykiss (eyed eggs) Salmoniformes EPS na na 6 Survival 21d LC10 175.4 2 Kennedy 2012
Oncorhynchus mykiss (eyed eggs) Salmoniformes EPS na na 50 Survival 21d LC10 299.5 44 Kennedy 2012
Oncorhynchus mykiss (eyed eggs) Salmoniformes EPS na na 100 Survival 21d LC10 419.2 89 Kennedy 2012
Oncorhynchus mykiss (eyed eggs) Salmoniformes EPS na na 250 Survival 21d LC10 673.7 206 Kennedy 2012
Oncorhynchus mykiss (fry) Salmoniformes EPS na na 6 Survival 30d LC10 363.2 2 Kennedy 2012
Oncorhynchus mykiss (fry) Salmoniformes EPS na na 50 Survival 30d LC10 367.9 44 Kennedy 2012
Oncorhynchus mykiss (fry) Salmoniformes EPS na na 100 Survival 30d LC10 771.7 89 Kennedy 2012
Oncorhynchus mykiss (fry) Salmoniformes EPS na na 250 Survival 30d LC10 1224.7 206 Kennedy 2012
Oncorhynchus mykiss (embryos) Salmoniformes EPS 11.7 5.3 50 Survival 21d LC10 1231 28 PESC 2013
Oncorhynchus mykiss (embryos) Salmoniformes EPS 24 5.3 100 Survival 21d LC10 1621 53 PESC 2013
Oncorhynchus mykiss (embryos) Salmoniformes EPS 60 5.3 250 Survival 21d LC10 1911 140 PESC 2013
Oncorhynchus tshawytscha Salmoniformes EPS na na 250 Survival 21d LC10 1287 189 PESC 2013
Pimephales promelas (embryos) Cypriniformes ASTM 9.5 1.7 100 Survival 34d LC10 430 20 Wang et al. 2016a
Pimephales promelas (embryos) Cypriniformes ASTM 9.5 1.7 100 Survival 34d NOEC 245 20 Wang et al. 2016a
Ceriodaphnia dubia (neonates) Cladocera EPS na na 40 Survival 7d NOEC 610 23 Elphick et al. 2011
Ceriodaphnia dubia (neonates) Cladocera EPS na na 80 Survival 7d NOEC 1250 45 Elphick et al. 2011
Ceriodaphnia dubia (neonates) Cladocera EPS na na 160 Survival 7d NOEC 1300 91 Elphick et al. 2011
Ceriodaphnia dubia (neonates) Cladocera EPS na na 320 Survival 7d NOEC 1450 182 Elphick et al. 2011
Ceriodaphnia dubia (neonates) Cladocera ASTM 9.5 1.7 100 Survival 7d LC20 1592 20 Wang et al. 2016a
Ceriodaphnia dubia (neonates) Cladocera ASTM 9.5 1.7 100 Survival 7d LC20 1751 20 Wang et al. 2016a
Hyalella azteca Amphibods na na na 50 Survival 28d LC10 1430 na PESC 2013
Elliptio complanata Unionoida ASTM na na 50 Survival 28d LC10 1392 34 PESC 2013
Elliptio complanata Unionoida ASTM na na 250 Survival 28d LC10 676 158 PESC 2013
Lampsilis abrupta (juveniles) Unionoida ASTM 9.5 1.7 100 Survival 28d LC20 1759 20 Wang et al. 2016a
Chironomus dilutus (larvae) Diptera ASTM 9.5 1.7 100 Survival 7d LC20 >6160 20 Wang et al. 2016a
Neocleon triangulifer (nymph) Ephemeroptera ASTM na na 99 % survival to nymph stage
21d EC20 289 57 Soucek and Dickinson 2015
1 = Suggests higher toxicity than Kennedy et al. (2012). However, Kennedy et al. (2012) used an increased sample size and received a more robust result. 2 = Suggest low toxicity at hardness 50, but was not included in the derivation due to large confidence interval (12-1640).

35
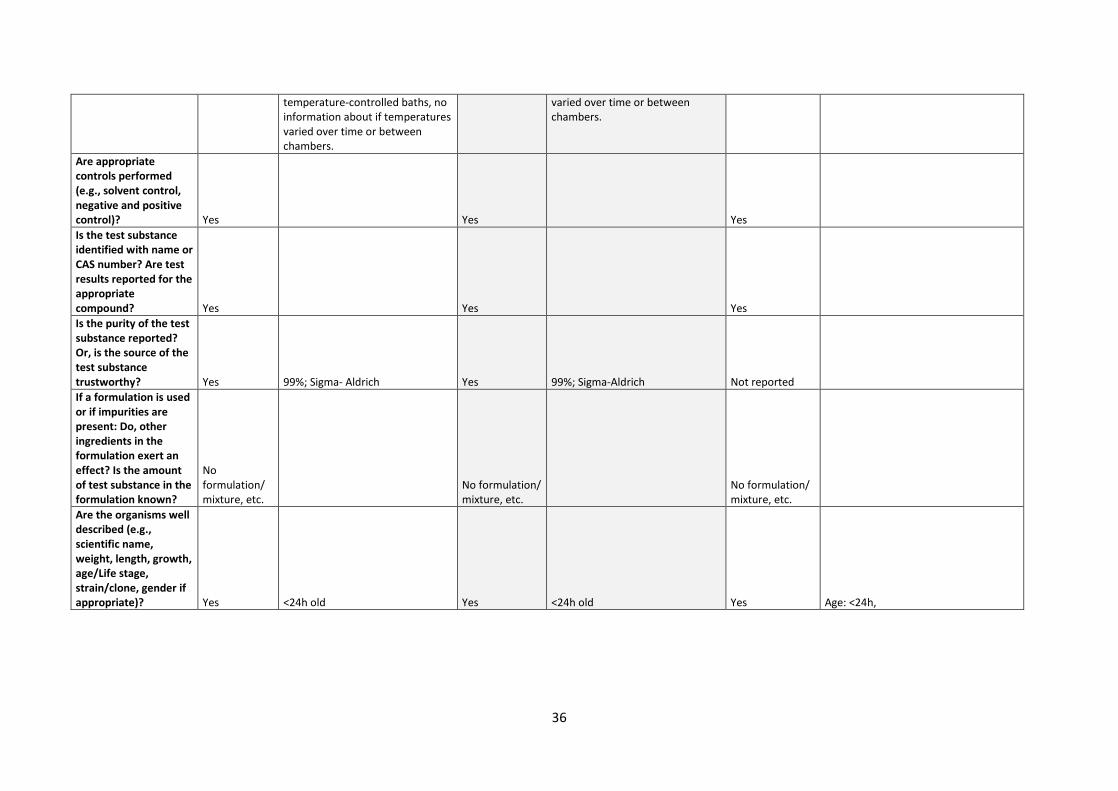
11. SUPPORTIVE INFORMATION – Reliability and relevance evaluations
The reliability and relevance of studies by Wang et al. (2016a) and Soucek and Dickinson (2015) were evaluated using the CRED evaluation method (Moermond et al. 2016) (table S4). The studies were assessed to be of sufficient reliability and relevance for use in the QS derivation, although, some of the values from Wang et al. (2016a) were eliminated (because of technical error and reduced survival in control).
Table S4. Evaluation of the reliability and relevance of Wang et al. (2016a) and Soucek and Dickinson (2015) using the CRED evaluation method (Moermond et al. 2016).
Wang et al. 2016a Soucek and Dickinson 2015
CHRONIC Comments ACUTE Comments CHRONIC Comments
Species P. promelas (embryos)
Study 2011 (test 1, 2 and 3). Data from test 1 and 2 excluded (see criteria 3).
P. promelas (embryos) Study 2012 and 2013 N. triangulifer
Endpoint Survival
Other endpoints investigated: Biomass and growth (but uncertainties in the results) Survival
(1) % of pre-emergent nymph (development delay) (2) % survival to pre-emergent nymph stage
Other endpoints investigated: No. of days to pre-emergent nymph stage (NOEC 209 mg/L); %e emergence (NOEC 209 mg/L); pre-egg laying weight (NOEC 359 mg/L); No. Of eggs per female (not significant); No of eggs per original female (EC20 281mg/L, no dose-response)
Effect value (mg/L) LC10: 430
NOEC: 245, LOEC:468, LC20:477 (This study also calculated LC50 for 7days of 645 mg/L (test 3)) LC50: 625.55
Geometric mean of 645, 718 and 600 (potassium ≈1 mg/L) NOEC: 129
MATC: 164 (LOEC= 209), EC20: 170 MATC: 164 (LOEC=209), EC20: 289
Reliability evaluation Is the guideline method (OECD/ISO) or modified guideline used? Yes ASTM E1241-05 and E729-96 Yes ASTM E1241-05 and E729-96 No
Based on DOI: 10.1016/j.chemosphere.2014.04.092, with several modifications and DOI: 10.1016/j.chemosphere.2014.04.096.
Is the test performed under GLP conditions? No No No
If applicable, are validity criteria fulfilled (e.g., control survival, growth)? Partly fulfilled.
Poor survival in test 1 (data not used); technical error in test 2 (data not used); 87% control survival in test 3; (data used); No information about temperature between chambers; DO ok; Analytic measures performed. Chambers were held in Partly fulfilled
95% control survival (2012), 98% control survival (2013); Constant conditions; DO ok; Results based on measured concentration Chambers were held in temperature-controlled baths, no information about if temperatures Yes
"Control survival was evaluated as no. of organisms surviving to pre-emergent nymph stage". "Percentage of survival to pre-emergent nymph stage was high for the controls and up to 51 mg/L". ≥80 %
36
temperature-controlled baths, no information about if temperatures varied over time or between chambers.
varied over time or between chambers.
Are appropriate controls performed (e.g., solvent control, negative and positive control)? Yes Yes Yes
Is the test substance identified with name or CAS number? Are test results reported for the appropriate compound? Yes Yes Yes
Is the purity of the test substance reported? Or, is the source of the test substance trustworthy? Yes 99%; Sigma- Aldrich Yes 99%; Sigma-Aldrich Not reported
If a formulation is used or if impurities are present: Do, other ingredients in the formulation exert an effect? Is the amount of test substance in the formulation known?
No formulation/ mixture, etc.
No formulation/ mixture, etc.
No formulation/ mixture, etc.
Are the organisms well described (e.g., scientific name, weight, length, growth, age/Life stage, strain/clone, gender if appropriate)? Yes <24h old Yes <24h old Yes Age: <24h,

37
Are the test organisms from a trustworthy source and acclimatized to test conditions? Have the organisms not been pre-exposed to test compound or other unintended stressors? Yes
Cultured in control water; US Geological survey Columbia environmental research center in Columbia, MO, USA. Yes
Cultured in control water; US Geological survey Columbia environmental research center in Columbia, MO, USA. Yes
Source: Stroud Water Research Center Clone #WCC-2; Tests were conducted in Duluth 100 hard water, this was also the mayfly culture water, and eggs were stored in this water, so no acclimation was required.
Is the experimental system appropriate for the test substance. taking into account its physicochemical characteristics? Yes
Flow-through, 250 ml/chamber/30min Yes Static-renewal Yes
Static/renewal. Renewal Days 0–4: none; day 5—end of test: three times weekly
Is the experimental system appropriate for the test organism (e.g., choice of medium or test water, feeding, water characteristics, temperature, light/dark conditions, pH, oxygen content)? Have conditions been stable during the test? Yes
Temp 25; DO 7,7-8,4; pH 8,2; Hardness 103-106; Photoperiod 16:8 Fed 3 times a day (2 times/day on weekends) Yes
Temp 25; DO 7,3 ; pH 7,9; hardness 108 (2012); DO 8,2; pH 8,2; hardness 110 (2013) Yes
Temperature, pH, dissolved oxygen, alkalinity, and hardness were 25.0±0.38C, 8.4±0.1mg/L, 7.3±0.4 (lowest value= 6.1) mg/L, 83± 3 mg/L as CaCO3, and 95± 4 mg/L as CaCO3, respectively; Diatoms used to feed mayflies included Mayamea sp. and Nitzschia sp. ; Photoperiod 16:8
Were exposure concentrations below the limit of water solubility (taking the use of a solvent into account)? If a solvent is used, is the solvent within the appropriate range and is a solvent control included? Yes Yes Yes
Is correct spacing between exposure concentrations applied? Yes
Mean concentrations: 19 (control), 74, 132, 245, 468 and 958. Yes
Mean concentrations: 19 (control), 121, 249, 476, 830 and 1580 (2012); 20 (control), 108, 242, 442, 781 and 1555 (2013) Yes
Nominal SO42– concentrations were as follows: 59 mg/L (control), 136 mg/L, 214 mg/L, 369 mg/L, 679 mg/L, and 1300 mg/L.
38
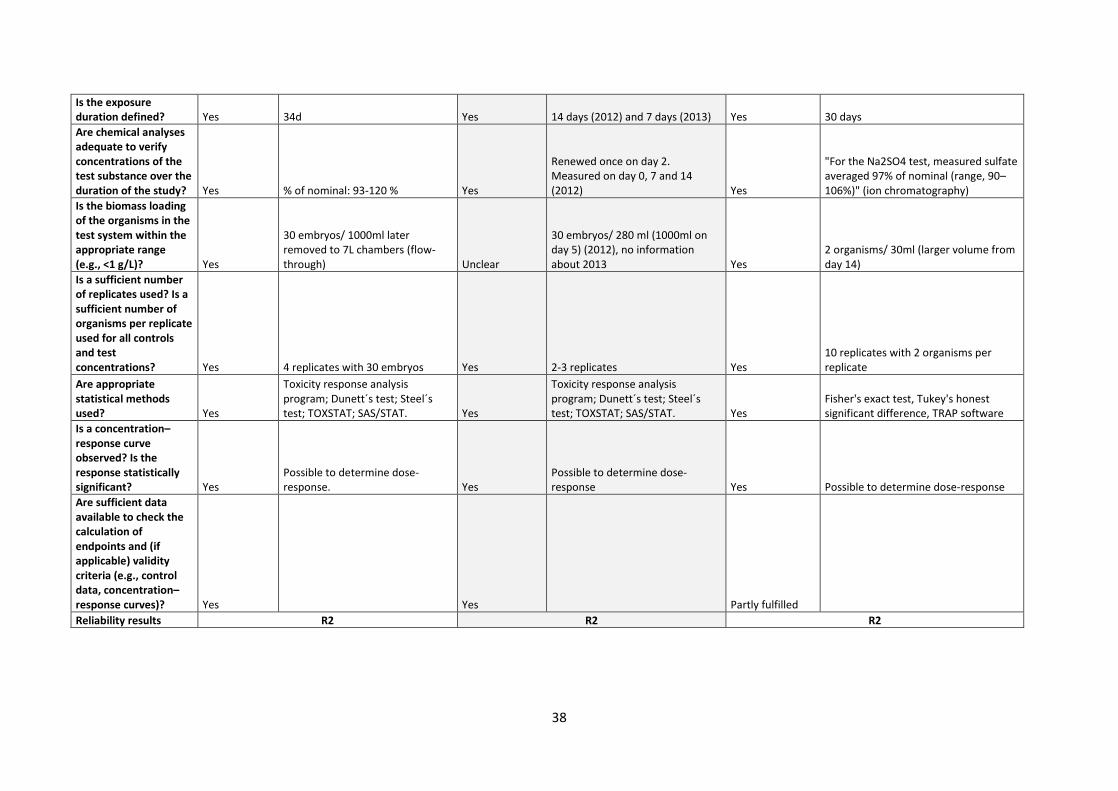
Is the exposure duration defined? Yes 34d Yes 14 days (2012) and 7 days (2013) Yes 30 days
Are chemical analyses adequate to verify concentrations of the test substance over the duration of the study? Yes % of nominal: 93-120 % Yes
Renewed once on day 2. Measured on day 0, 7 and 14 (2012) Yes
"For the Na2SO4 test, measured sulfate averaged 97% of nominal (range, 90–106%)" (ion chromatography)
Is the biomass loading of the organisms in the test system within the appropriate range (e.g., <1 g/L)? Yes
30 embryos/ 1000ml later removed to 7L chambers (flow-through) Unclear
30 embryos/ 280 ml (1000ml on day 5) (2012), no information about 2013 Yes
2 organisms/ 30ml (larger volume from day 14)
Is a sufficient number of replicates used? Is a sufficient number of organisms per replicate used for all controls and test concentrations? Yes 4 replicates with 30 embryos Yes 2-3 replicates Yes
10 replicates with 2 organisms per replicate
Are appropriate statistical methods used? Yes
Toxicity response analysis program; Dunett´s test; Steel´s test; TOXSTAT; SAS/STAT. Yes
Toxicity response analysis program; Dunett´s test; Steel´s test; TOXSTAT; SAS/STAT. Yes
Fisher's exact test, Tukey's honest significant difference, TRAP software
Is a concentration–response curve observed? Is the response statistically significant? Yes
Possible to determine dose-response. Yes
Possible to determine dose-response Yes Possible to determine dose-response
Are sufficient data available to check the calculation of endpoints and (if applicable) validity criteria (e.g., control data, concentration– response curves)? Yes Yes Partly fulfilled
Reliability results R2 R2 R2
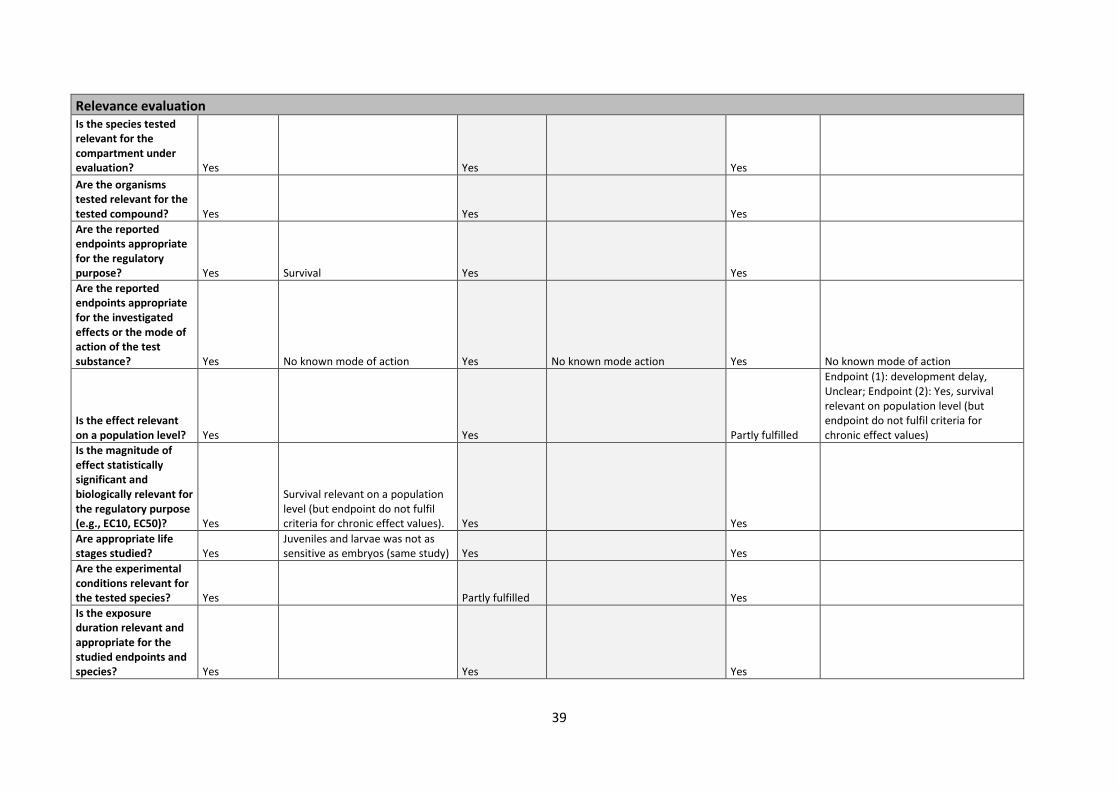
39
Relevance evaluation Is the species tested relevant for the compartment under evaluation? Yes Yes Yes
Are the organisms tested relevant for the tested compound? Yes Yes Yes
Are the reported endpoints appropriate for the regulatory purpose? Yes Survival Yes Yes
Are the reported endpoints appropriate for the investigated effects or the mode of action of the test substance? Yes No known mode of action Yes No known mode action Yes No known mode of action
Is the effect relevant on a population level? Yes Yes Partly fulfilled
Endpoint (1): development delay, Unclear; Endpoint (2): Yes, survival relevant on population level (but endpoint do not fulfil criteria for chronic effect values)
Is the magnitude of effect statistically significant and biologically relevant for the regulatory purpose (e.g., EC10, EC50)? Yes
Survival relevant on a population level (but endpoint do not fulfil criteria for chronic effect values). Yes Yes
Are appropriate life stages studied? Yes
Juveniles and larvae was not as sensitive as embryos (same study) Yes Yes
Are the experimental conditions relevant for the tested species? Yes Partly fulfilled Yes
Is the exposure duration relevant and appropriate for the studied endpoints and species? Yes Yes Yes
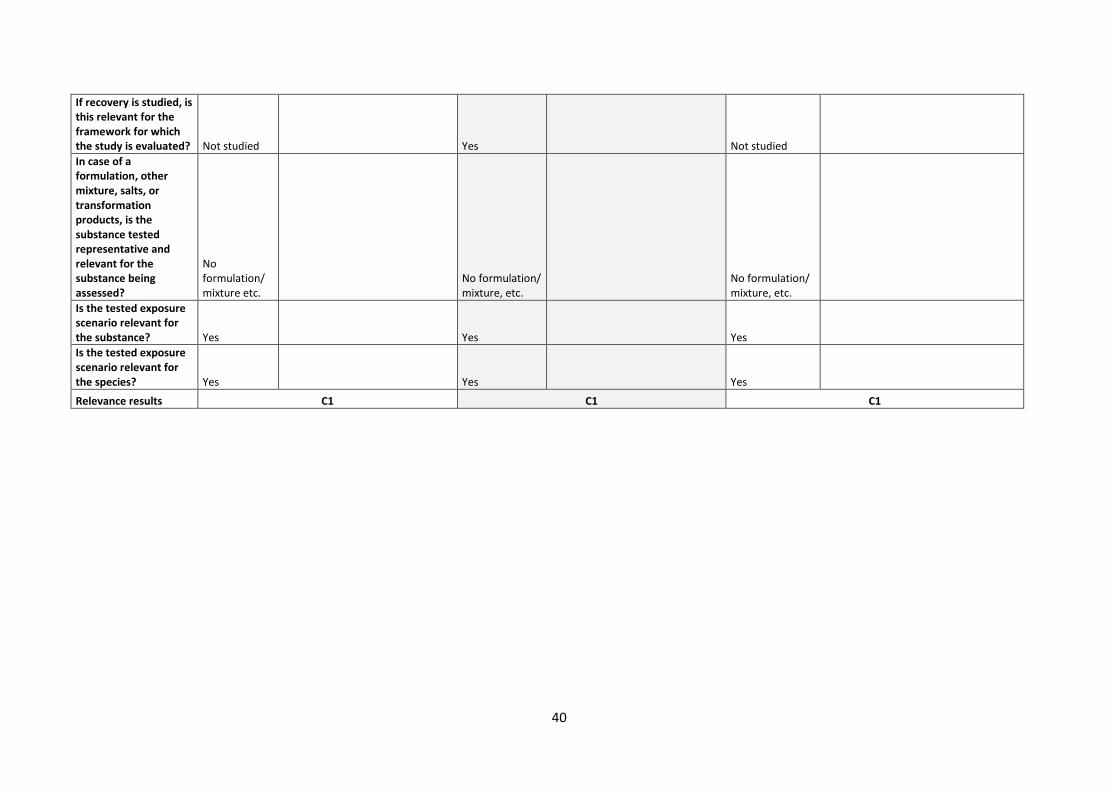
40
If recovery is studied, is this relevant for the framework for which the study is evaluated? Not studied Yes Not studied
In case of a formulation, other mixture, salts, or transformation products, is the substance tested representative and relevant for the substance being assessed?
No formulation/ mixture etc.
No formulation/ mixture, etc.
No formulation/ mixture, etc.
Is the tested exposure scenario relevant for the substance? Yes Yes Yes
Is the tested exposure scenario relevant for the species? Yes Yes Yes
Relevance results C1 C1 C1
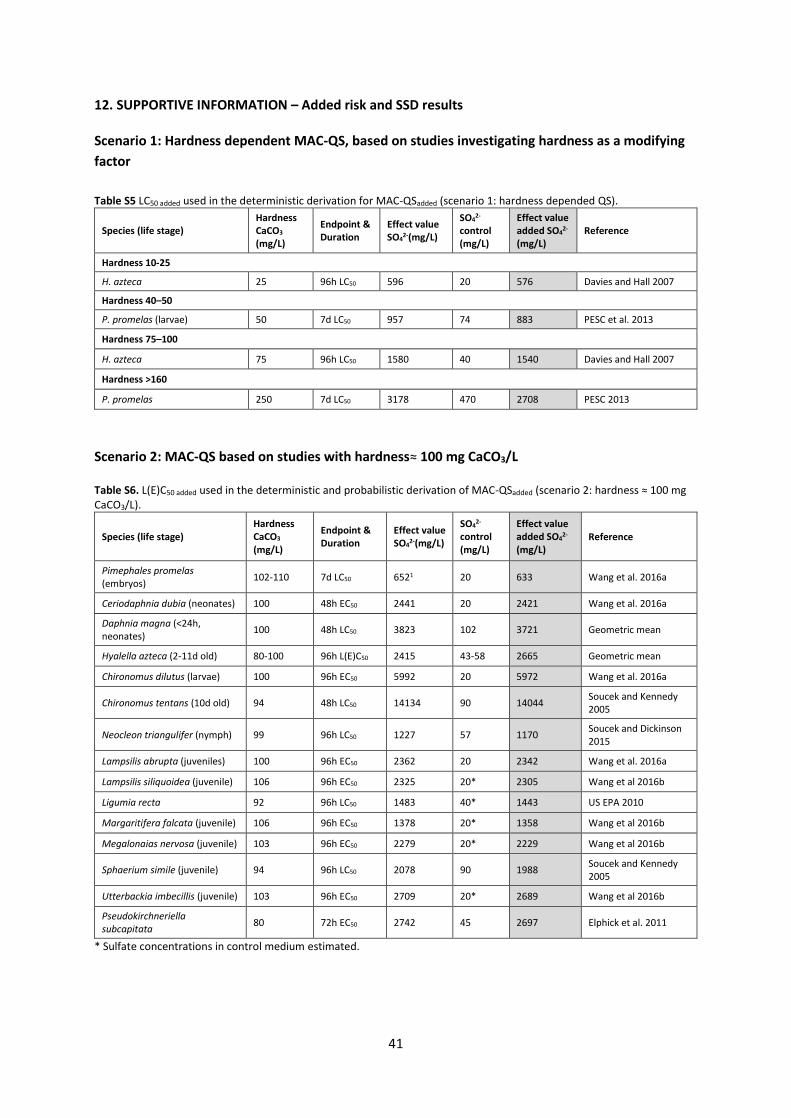
41
12. SUPPORTIVE INFORMATION – Added risk and SSD results Scenario 1: Hardness dependent MAC-QS, based on studies investigating hardness as a modifying
factor
Table S5 LC50 added used in the deterministic derivation for MAC-QSadded (scenario 1: hardness depended QS).
Species (life stage) Hardness CaCO3
(mg/L)
Endpoint & Duration
Effect value SO4
2-(mg/L)
SO42-
control (mg/L)
Effect value added SO4
2- (mg/L)
Reference
Hardness 10-25
H. azteca 25 96h LC50 596 20 576 Davies and Hall 2007
Hardness 40–50
P. promelas (larvae) 50 7d LC50 957 74 883 PESC et al. 2013
Hardness 75–100
H. azteca 75 96h LC50 1580 40 1540 Davies and Hall 2007
Hardness >160
P. promelas 250 7d LC50 3178 470 2708 PESC 2013
Scenario 2: MAC-QS based on studies with hardness≈ 100 mg CaCO3/L Table S6. L(E)C50 added used in the deterministic and probabilistic derivation of MAC-QSadded (scenario 2: hardness ≈ 100 mg CaCO3/L).
Species (life stage) Hardness CaCO3 (mg/L)
Endpoint & Duration
Effect value SO4
2-(mg/L)
SO42-
control (mg/L)
Effect value added SO4
2- (mg/L)
Reference
Pimephales promelas (embryos)
102-110 7d LC50 6521 20 633 Wang et al. 2016a
Ceriodaphnia dubia (neonates) 100 48h EC50 2441 20 2421 Wang et al. 2016a
Daphnia magna (<24h, neonates)
100 48h LC50 3823 102 3721 Geometric mean
Hyalella azteca (2-11d old) 80-100 96h L(E)C50 2415 43-58 2665 Geometric mean
Chironomus dilutus (larvae) 100 96h EC50 5992 20 5972 Wang et al. 2016a
Chironomus tentans (10d old) 94 48h LC50 14134 90 14044 Soucek and Kennedy 2005
Neocleon triangulifer (nymph) 99 96h LC50 1227 57 1170 Soucek and Dickinson 2015
Lampsilis abrupta (juveniles) 100 96h EC50 2362 20 2342 Wang et al. 2016a
Lampsilis siliquoidea (juvenile) 106 96h EC50 2325 20* 2305 Wang et al 2016b
Ligumia recta 92 96h LC50 1483 40* 1443 US EPA 2010
Margaritifera falcata (juvenile) 106 96h EC50 1378 20* 1358 Wang et al 2016b
Megalonaias nervosa (juvenile) 103 96h EC50 2279 20* 2229 Wang et al 2016b
Sphaerium simile (juvenile) 94 96h LC50 2078 90 1988 Soucek and Kennedy 2005
Utterbackia imbecillis (juvenile) 103 96h EC50 2709 20* 2689 Wang et al 2016b
Pseudokirchneriella subcapitata
80 72h EC50 2742 45 2697 Elphick et al. 2011
* Sulfate concentrations in control medium estimated.

42
Table S7. HC5 results for probabilistic derivation of MAC-QSadded (scenario 2: hardness ≈ 100 mg CaCO3/L).
Type of HC5 Value (mg/L) log10(Value) (mg/L) Description
LL HC5 386.07 2.59 lower estimate of the HC5
HC5 725.20 2.86 median estimate of the HC5
UL HC5 1085.88 3,04 upper estimate of the HC5
sprHC5 2.81 0.45 spread of the HC5 estimate
Figure S1. SSD graph for MAC-QS-added (scenario 2: hardness ≈ 100 mg CaCO3/L). P. promelas was the most sensitive species. HC5 was set to 725.20. The normality was rejected in the Kolmogorov-Smirnov test at 0.05-0.1 significance level.

43
Scenario 2: AA-QS based on studies with hardness ≈ 100 mg CaCO3/L
Table S8. NOECadded and L(E)C10 added used in the deterministic and probabilistic derivation of AA-QSadded (scenario 2: hardness ≈ 100 mg CaCO3/L).
Species (life stage) Hardness CaCO3
(mg/L) Endpoint & Duration
Effect value SO4
2-
(mg/L)
SO42-
control (mg/L)
Effect value added SO4
2-
(mg/L)
Reference
Oncorhynchus mykiss
(eyed eggs) 100 Survival 31d LC10 419 89 330 Kennedy et al. 2012
Pimephales promelas (embryos)
100 Survival 34d LC10 430 20 410 Wang et al. 2016a
Pseudacris regilla (tadpoles)
80 Survival/ growth
21d NOEC 978 45 933 Elphick et al. 2011
Ceriodaphnia dubia (neonates)
80-100 Reproduction 7d NOEC 632 20-46 589 Geometric mean
Hyalella azteca 100 Growth 28d EC10 682 57 625 PESC 2013
Lampsilis abrupta (juveniles)
100 Dry weight 28d EC10 320 20 300 Wang et al. 2016a
Chironomus dilutus (larvae)
100 Dry weight 7d EC10 489 20 469 Wang et al. 2016a
Neocleon triangulifer (nymph)
99 Development/ survival
36d NOEC 129 57 72 Soucek and Dickinson 2015
Brachionus calyciflorus (<4h old)
80 Reproduction 48h NOEC 510 45 465 Elphick et al. 2011
Pseudokirchneriella subcapitata
80 Growth 72h NOEC 1200 45 1155 Elphick et al. 2011
Fontinalis antipyretica
105 Shoot length 21d NOEC 1000 40 960 Davies 2007
Lemna minor 100 Frond increase 7d EC10 2243 217 2026 PESC 2013
Table S9. HC5 results for probabilistic derivation of AA-QSadded (scenario 2: hardness ≈ 100 mg CaCO3/L).
Type of HC5 Value (mg/L) log10(Value) (mg/L) Description
LL HC5 53.31 1.73 lower estimate of the HC5
HC5 128.20 2.11 median estimate of the HC5
UL HC5 217.26 2.34 upper estimate of the HC5
sprHC5 4.08 0.61 spread of the HC5 estimate
Figure S2. SSD graph for AA-QSadded (scenario 2: hardness ≈ 100 mg CaCO3/L). N. triangulifer was the most sensitive species. HC5 was set to 128.20. The normality was accepted at all significance levels in all tests.

44
Scenario 3: AA-QS based on realistic worst-case data for Sweden Table S10. NOECadded and L(E)C10 added used in the deterministic and probabilistic derivation of AA-QSadded (scenario 3: realistic worst-case data).
Species (life stage) Hardness CaCO3
(mg/L) Endpoint & Duration
Effect value SO4
2-
(mg/L)
SO42-
control (mg/L)
Effect value added SO4
2-
(mg/L) Reference
Oncorhynchus mykiss (eyed eggs)
6 Survival 31d LC10 175 2 173 Kennedy et al. 2012
Pimephales promelas (embryos)
100 Survival 34d LC10 430 20 410 Wang et al. 2016a
Pseudacris regilla
(tadpoles) 15-80
Survival/ growth
21d NOEC 1025 45 980 Elphick et al. 201l
Ceriodaphnia dubia (neonates)
40-44 Reproduction 7d NOEC 266 21-23 244 Geometric mean
Hyalella azteca 50-100 Growth 28d EC10 893 34-57 848 PESC 2013
Lampsilis abrupta (juveniles)
100 Dry weight 28d EC10 320 20 300 Wang et al. 2016a
Chironomus dilutus (larvae)
100 Dry weight 7d EC10 489 20 469 Wang et al. 2016a
Neocleon triangulifer (nymph)
99 Development/ Survival
36d NOEC 129 57 72 Soucek and Dickinson 2015
Brachionus calyciflorus (<4h old)
40-80 Reproduction 48h NOEC 696 23-45 662 Elphick et al. 2011
Pseudokirchneriella subcapitata
10 Growth 72h NOEC 1100 6 1094 Elphick et al. 2011
Fontinalis antipyretica
15 Growth 21d NOEC 628 6* 622 Elphick et al. 2011 Geometric mean
Lemna minor 50 Growth 7d EC10 2143 103 2040 PESC 2013
* Sulfate concentrations in control medium estimated. Table S11. HC5 results for probabilistic derivation of AA-QSadded (scenario 3: realistic worst-case data).
Type of HC5 Value (mg/L) log10(Value) (mg/L) Description
LL HC5 39,50 1,60 lower estimate of the HC5
HC5 102,31 2,01 median estimate of the HC5
UL HC5 181,31 2,26 upper estimate of the HC5
sprHC5 4,59 0,66 spread of the HC5 estimate
Figure S3. SSD graph for AA-QSadded (scenario 3: realistic worst-case data). N. triangulifer was the most sensitive species. HC5 was set to 102.31. The normality was accepted at all significance levels in all tests.

Stockholms universitet 106 91 Stockholm Tel 08-16 20 00www.su.se [email protected]
Department of Environmental Science andAnalytical Chemistry (ACES)
Related Documents