International Conference on Integrated Water, Waste Water & Isotope Hydrology, 25-27th, July 2013, Bangalore. SUITABILITY OF GROUNDWATER FOR IRRIGATION PURPOSE IN ANKASANDRA WATERSHED IN PARTS OF TIPTUR AND C.N. HALLI TALUKS OF TUMKUR DISTRICT, KARNATAKA, INDIA G.R.C.Reddy*, S.S.Vittala, Rahul Vashista and K.Md.Najeeb ABSTRACT Ground water is the major source of irrigation in drought prone Ankasandra watershed which is located in parts of Tiptur and C N Halli taluks of Tumkur district of Karnataka State. The main livelihood of the people in the watershed is agriculture. The area underlain by Archaean group of rocks and important litho units are granite, gneiss, dharwar schist and dolerite dykes. The phreatic aquifer in most of the area is desaturated and groundwater is being drawn from fractured aquifer. The major crops grown under irrigation through bore wells are coconut and areacanut. The study was carried out under pilot project on aquifer mapping. To know the groundwater quality, 52 samples collected during September 2011 and chemically analysed for Hydrogen ion concentration (pH), specific conductance, calcium, magnesium, sodium, potassium, total hardness, carbonate, bicarbonate, sulphate, chloride, nitrate and fluoride. Based on the analysis, parameters like percent sodium, sodium absorption ratio (SAR) and residual sodium carbonate (RSC) were calculated. The results revealed that, with respect to electrical conductivity, it is found that about 10% of water samples fall in good category, 86% falling under permissible limit and about only 4% fall under doubtful category. In case of percent sodium analysis, about 58% fall under permissible category, 27% is under good category, 13% fall in doubtful category and 2% fall in excellent category. The SAR values ranges from 1.82 to 9.12 and reveals that all 52 water samples (100%) fall under excellent category. The RSC values shows that about 86% of water samples fall under safe category while 8% and remaining 6% fall under marginal and unsuitable type respectively. It is concluded from various methods that the groundwater quality is mostly suitable for irrigation purposes. Key words: Groundwater quality, Ankasandra watershed, Tumkur district Materials and methods Description of the study area The Ankasandra watershed is a part of 4D3D8 watershed and falls in Tiptur and Chiknayakanhalli taluks. 1 Central Ground Water Board, SWR, 27 th Main, 7 th Cross, H.S.R.Layout, Sector – 1, Bangalore 560102. *E- mail:[email protected] The area falls in the Survey of India toposheet no. 57 C/7 and 57 C/11 and lies between north latitudes 13 15' 15" to 13 28' 30" and east longitudes 76 23' 00" to 76 39' 00". The total area of the watershed is 375 sq. km and covers about 141 villages. The location map of the study area is shown in Fig. 1. The present study has been carried out under pilot project on Micro Level Aquifer Mapping (MLAM) study. The general ground elevation is around 850 m in the southern part of the

Welcome message from author
This document is posted to help you gain knowledge. Please leave a comment to let me know what you think about it! Share it to your friends and learn new things together.
Transcript

International Conference on Integrated Water, Waste Water & Isotope Hydrology, 25-27th, July 2013, Bangalore.
SUITABILITY OF GROUNDWATER FOR IRRIGATION
PURPOSE IN ANKASANDRA WATERSHED IN PARTS OF
TIPTUR AND C.N. HALLI TALUKS OF TUMKUR DISTRICT,
KARNATAKA, INDIA
G.R.C.Reddy*, S.S.Vittala, Rahul Vashista and K.Md.Najeeb
ABSTRACT
Ground water is the major source of irrigation in drought prone Ankasandra watershed which is
located in parts of Tiptur and C N Halli taluks of Tumkur district of Karnataka State. The main
livelihood of the people in the watershed is agriculture. The area underlain by Archaean group
of rocks and important litho units are granite, gneiss, dharwar schist and dolerite dykes. The
phreatic aquifer in most of the area is desaturated and groundwater is being drawn from
fractured aquifer. The major crops grown under irrigation through bore wells are coconut and
areacanut. The study was carried out under pilot project on aquifer mapping. To know the
groundwater quality, 52 samples collected during September 2011 and chemically analysed for
Hydrogen ion concentration (pH), specific conductance, calcium, magnesium, sodium,
potassium, total hardness, carbonate, bicarbonate, sulphate, chloride, nitrate and fluoride. Based
on the analysis, parameters like percent sodium, sodium absorption ratio (SAR) and residual
sodium carbonate (RSC) were calculated. The results revealed that, with respect to electrical
conductivity, it is found that about 10% of water samples fall in good category, 86% falling
under permissible limit and about only 4% fall under doubtful category. In case of percent
sodium analysis, about 58% fall under permissible category, 27% is under good category, 13%
fall in doubtful category and 2% fall in excellent category. The SAR values ranges from 1.82
to 9.12 and reveals that all 52 water samples (100%) fall under excellent category. The RSC
values shows that about 86% of water samples fall under safe category while 8% and remaining
6% fall under marginal and unsuitable type respectively. It is concluded from various methods
that the groundwater quality is mostly suitable for irrigation purposes.
Key words: Groundwater quality, Ankasandra watershed, Tumkur district
Materials and methods
Description of the study area
The Ankasandra watershed is a part of
4D3D8 watershed and falls in Tiptur and
Chiknayakanhalli taluks.
1
Central Ground Water Board, SWR, 27
th
Main, 7th Cross, H.S.R.Layout, Sector – 1,
Bangalore 560102. *E-
mail:[email protected]
The area falls in the Survey of India
toposheet no. 57 C/7 and 57 C/11 and lies
between north latitudes 13 15' 15" to 13
28' 30" and east longitudes 76 23' 00" to
76 39' 00". The total area of the watershed
is 375 sq. km and covers about 141
villages. The location map of the study area
is shown in Fig. 1. The present study has
been carried out under pilot project on
Micro Level Aquifer Mapping (MLAM)
study. The general ground elevation is
around 850 m in the southern part of the
International Conference on Integrated Water, Waste Water & Isotope Hydrology, 25-27th, July 2013, Bangalore.
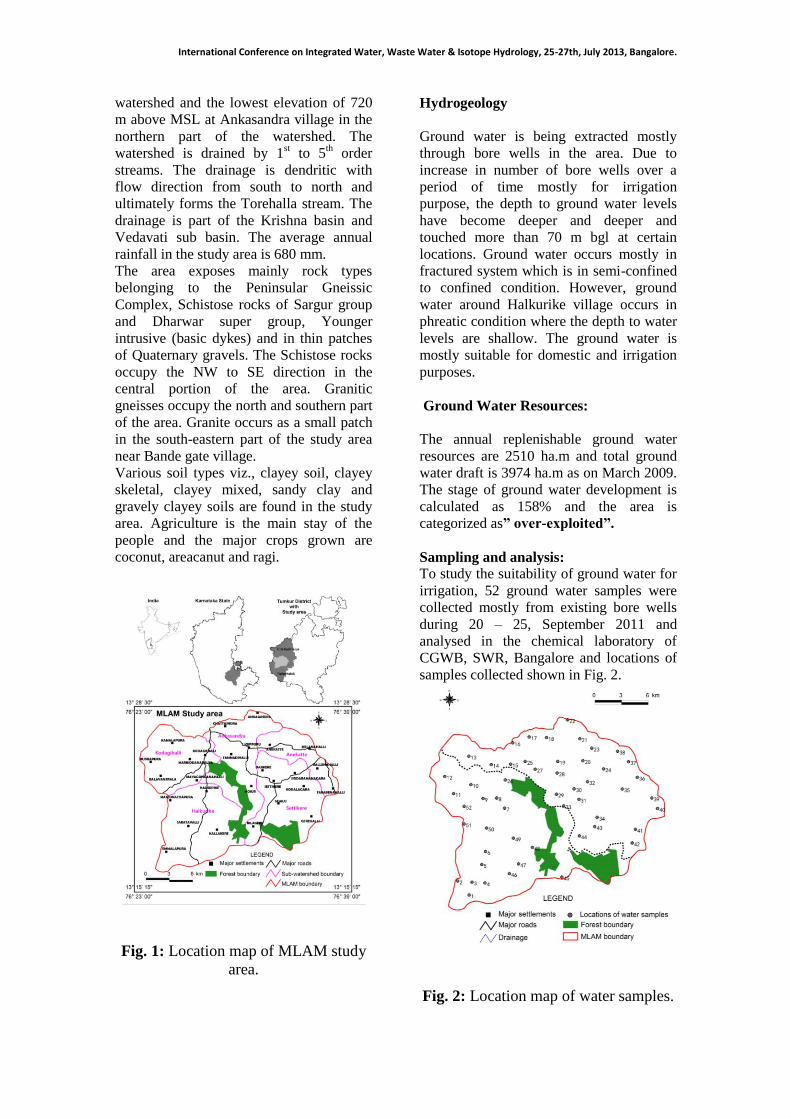
watershed and the lowest elevation of 720
m above MSL at Ankasandra village in the
northern part of the watershed. The
watershed is drained by 1st to 5
th order
streams. The drainage is dendritic with
flow direction from south to north and
ultimately forms the Torehalla stream. The
drainage is part of the Krishna basin and
Vedavati sub basin. The average annual
rainfall in the study area is 680 mm.
The area exposes mainly rock types
belonging to the Peninsular Gneissic
Complex, Schistose rocks of Sargur group
and Dharwar super group, Younger
intrusive (basic dykes) and in thin patches
of Quaternary gravels. The Schistose rocks
occupy the NW to SE direction in the
central portion of the area. Granitic
gneisses occupy the north and southern part
of the area. Granite occurs as a small patch
in the south-eastern part of the study area
near Bande gate village.
Various soil types viz., clayey soil, clayey
skeletal, clayey mixed, sandy clay and
gravely clayey soils are found in the study
area. Agriculture is the main stay of the
people and the major crops grown are
coconut, areacanut and ragi.
Fig. 1: Location map of MLAM study
area.
Hydrogeology
Ground water is being extracted mostly
through bore wells in the area. Due to
increase in number of bore wells over a
period of time mostly for irrigation
purpose, the depth to ground water levels
have become deeper and deeper and
touched more than 70 m bgl at certain
locations. Ground water occurs mostly in
fractured system which is in semi-confined
to confined condition. However, ground
water around Halkurike village occurs in
phreatic condition where the depth to water
levels are shallow. The ground water is
mostly suitable for domestic and irrigation
purposes.
Ground Water Resources:
The annual replenishable ground water
resources are 2510 ha.m and total ground
water draft is 3974 ha.m as on March 2009.
The stage of ground water development is
calculated as 158% and the area is
categorized as” over-exploited”.
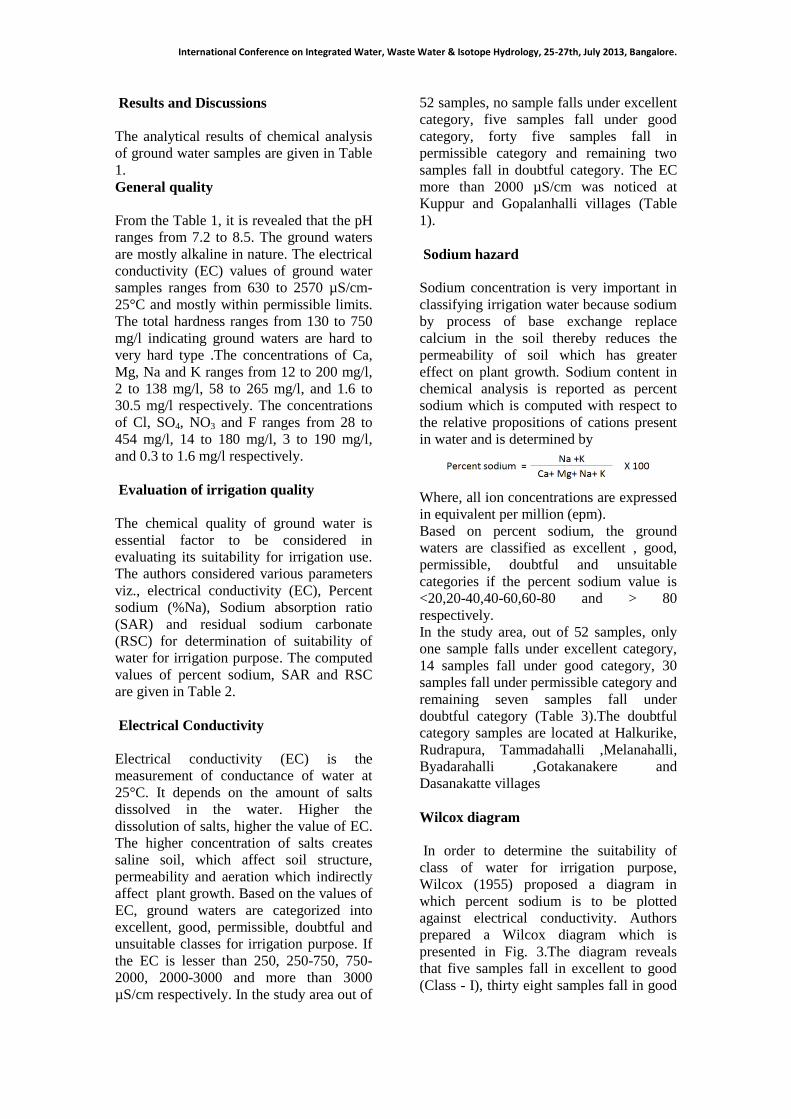
Sampling and analysis:
To study the suitability of ground water for
irrigation, 52 ground water samples were
collected mostly from existing bore wells
during 20 – 25, September 2011 and
analysed in the chemical laboratory of
CGWB, SWR, Bangalore and locations of
samples collected shown in Fig. 2.
Fig. 2: Location map of water samples.
International Conference on Integrated Water, Waste Water & Isotope Hydrology, 25-27th, July 2013, Bangalore.
Results and Discussions
The analytical results of chemical analysis
of ground water samples are given in Table
1.
General quality
From the Table 1, it is revealed that the pH
ranges from 7.2 to 8.5. The ground waters
are mostly alkaline in nature. The electrical
conductivity (EC) values of ground water
samples ranges from 630 to 2570 µS/cm-
25°C and mostly within permissible limits.
The total hardness ranges from 130 to 750
mg/l indicating ground waters are hard to
very hard type .The concentrations of Ca,
Mg, Na and K ranges from 12 to 200 mg/l,
2 to 138 mg/l, 58 to 265 mg/l, and 1.6 to
30.5 mg/l respectively. The concentrations
of Cl, SO4, NO3 and F ranges from 28 to
454 mg/l, 14 to 180 mg/l, 3 to 190 mg/l,
and 0.3 to 1.6 mg/l respectively.
Evaluation of irrigation quality
The chemical quality of ground water is
essential factor to be considered in
evaluating its suitability for irrigation use.
The authors considered various parameters
viz., electrical conductivity (EC), Percent
sodium (%Na), Sodium absorption ratio
(SAR) and residual sodium carbonate
(RSC) for determination of suitability of
water for irrigation purpose. The computed
values of percent sodium, SAR and RSC
are given in Table 2.
Electrical Conductivity
Electrical conductivity (EC) is the
measurement of conductance of water at
25°C. It depends on the amount of salts
dissolved in the water. Higher the
dissolution of salts, higher the value of EC.
The higher concentration of salts creates
saline soil, which affect soil structure,
permeability and aeration which indirectly
affect plant growth. Based on the values of
EC, ground waters are categorized into
excellent, good, permissible, doubtful and
unsuitable classes for irrigation purpose. If
the EC is lesser than 250, 250-750, 750-
2000, 2000-3000 and more than 3000
µS/cm respectively. In the study area out of
52 samples, no sample falls under excellent
category, five samples fall under good
category, forty five samples fall in
permissible category and remaining two
samples fall in doubtful category. The EC
more than 2000 µS/cm was noticed at
Kuppur and Gopalanhalli villages (Table
1).
Sodium hazard
Sodium concentration is very important in
classifying irrigation water because sodium
by process of base exchange replace
calcium in the soil thereby reduces the
permeability of soil which has greater
effect on plant growth. Sodium content in
chemical analysis is reported as percent
sodium which is computed with respect to
the relative propositions of cations present
in water and is determined by
Where, all ion concentrations are expressed
in equivalent per million (epm).
Based on percent sodium, the ground
waters are classified as excellent , good,
permissible, doubtful and unsuitable
categories if the percent sodium value is
<20,20-40,40-60,60-80 and > 80
respectively.
In the study area, out of 52 samples, only
one sample falls under excellent category,
14 samples fall under good category, 30
samples fall under permissible category and
remaining seven samples fall under
doubtful category (Table 3).The doubtful
category samples are located at Halkurike,
Rudrapura, Tammadahalli ,Melanahalli,
Byadarahalli ,Gotakanakere and
Dasanakatte villages
Wilcox diagram
In order to determine the suitability of
class of water for irrigation purpose,
Wilcox (1955) proposed a diagram in
which percent sodium is to be plotted
against electrical conductivity. Authors
prepared a Wilcox diagram which is
presented in Fig. 3.The diagram reveals
that five samples fall in excellent to good
(Class - I), thirty eight samples fall in good

International Conference on Integrated Water, Waste Water & Isotope Hydrology, 25-27th, July 2013, Bangalore.
Fig. 3: Classification of irrigation water quality, with respect to electrical conductivity
and sodium percent (Wilcox diagram).
to permissible (Class - II), seven samples
fall in permissible to doubtful (Class - III)
and only two samples fall in doubtful to
unsuitable (Class - IV) category. The
doubtful to unsuitable category samples are
located at Kuppur and Gopalanahalli
villages.
Sodium Adsorption Ratio (SAR)
The relative activity of sodium ion in the
exchange reaction with soil is expressed in
terms of a ratio known as Sodium
Adsorption Ratio (SAR) which is
determined by
Where, all ion concentrations are expressed
in epm.
Based on SAR values, the ground waters
are classified as excellent , good, fair and
poor if the SAR value is <10,10-18,18-26
and > 26 respectively. In the study area the
SAR values reveals that all 52 samples fall
in excellent category (Table 3).
US Salinity diagram
The US Salinity Laboratory staff (1954)
has constructed a diagram for classification
of irrigation water with reference to SAR as
an index for sodium hazard ‘S’ and EC as
an index of salinity hazard ‘C’. Based on
SAR values, sodium hazard is categorized
as low (S1:<10), moderate (S2:10-18),high
(S3:18-26) and very high (S4:>26). Based
on EC values, the salinity hazard is
categorized as low (C1:<250), moderate
(C2:250-750), high (C3:750-2250) and
very high (C4:>2250) .
In the US salinity diagram, the values of
SAR are plotted on arithmetic scale against
EC on log scale and different classes of
water have been marked and presented in
Fig. 4. From the figure it is concluded that
forty one samples fall in C3S1 (High
salinity-low SAR) category, five samples
each fall in C3S2 (High salinity-medium
SAR) and C2S1 (Medium salinity- low
SAR) categories and one sample fall in
C4S2 (Very high salinity- medium SAR)
category.

International Conference on Integrated Water, Waste Water & Isotope Hydrology, 25-27th, July 2013, Bangalore.
Fig. 4: Classification of irrigation water quality, with respect to salinity hazard and
sodium hazard (USSL diagram).
Bicarbonate hazard
The Bicarbonate concentration of water has
been suggested as additional criteria to
study the suitability of ground water for
irrigation purpose. If the water contains
high concentration of bicarbonate ions,
there is a tendency of calcium and
magnesium ions to precipitate as
carbonates. The convenient way of
expressing values of the water in terms of
Residual Sodium Carbonate (RSC) is as
follows.
Where all the ion concentrations are
expressed in epm
On the basis of RSC, the ground waters are
classified into safe, marginal and unsuitable
classes based on values of <1.25, 1.25-2.5
and >2.5 respectively and shown in Table
3. It shows that out of 52 samples, 45
samples fall in safe category, 4 samples in
marginal and 3 samples in unsuitable
category. The unsuitable categories of
samples are noticed at Byadarhalli,
Kallakere and Rudrapura villages.
Conclusion
Based on the attempt made to study the
quality of groundwater, it is learned that the
ground water in the study area is generally
alkaline in nature and the pH varies from
7.2 to 8.5. The concentration of EC varies
from 630 to 2570 µS/cm-25°C and mostly
suitable for irrigation purpose. According
to percent sodium, two percent samples fall
in excellent category, twenty seven percent
samples fall in good category, fifty eight
percent samples fall in permissible category
and thirteen percent samples fall in
doubtful category. The doubtful category
samples are located at Halkurike,
Rudrapura, Tammadahalli, Melanahalli,
Byadarahalli, Gotakanakere and
Dasanakatte villages. According to sodium
absorption ratio all samples fall in excellent
category. As per RSC, eighty six percent
samples fall in safe category, eight percent
in marginal category and six percent in
unsuitable category. The unsuitable
category of samples are noticed at
Byadarhalli, Kallakere and Rudrapura
villages. From the above discussion on
chemical quality of ground waters, it is
concluded that ground water in the study
area in general is suitable for irrigation
purpose. It is also revealed from the present
study that the high values of certain
International Conference on Integrated Water, Waste Water & Isotope Hydrology, 25-27th, July 2013, Bangalore.
chemical constituents at certain locations
are highly localized in nature.
Acknowledgements
The study has been carried out under pilot
project on micro level aquifer mapping
studies in parts of Tiptur and CN Halli
taluks of Tumkur district. The authors are
very much thankful to Chairman and
Members CGWB, CHQ, Faridabad for
their encouragement and permission for
publishing the paper. The authors are also
thankful to Sri. D.Subba Rao, Supt.
Hydrogeologist, Dr.K.R.Sooryanarayana,
Scientist-D and other colleagues of CGWB,
SWR, Bangalore for their encouragement.
References
1. John, D. Hem, Study and interpretation
of the chemical characteristics of
natural water.
2. Ingermer Larson, Ground water in hard
rocks.
3. Karanth, K.R. 1989. Hydrogeology,
Tata McGraw Hill, New Delhi.
4. Wilcox, L.V. 1955. Classification and
use of irrigation waters. U.S.Dept.
Argiculture Circular.
5. Reddy, G.R.C and Reddy, C.H.R.K.
1998. Hydrogeology of Sangareddy
Revenue Division, Medak district,
Andhra Pradesh, India. Technical
report of CGWB, Southern Region,
Hyderabad.

International Conference on Integrated Water, Waste Water & Isotope Hydrology, 25-27th, July 2013, Bangalore.
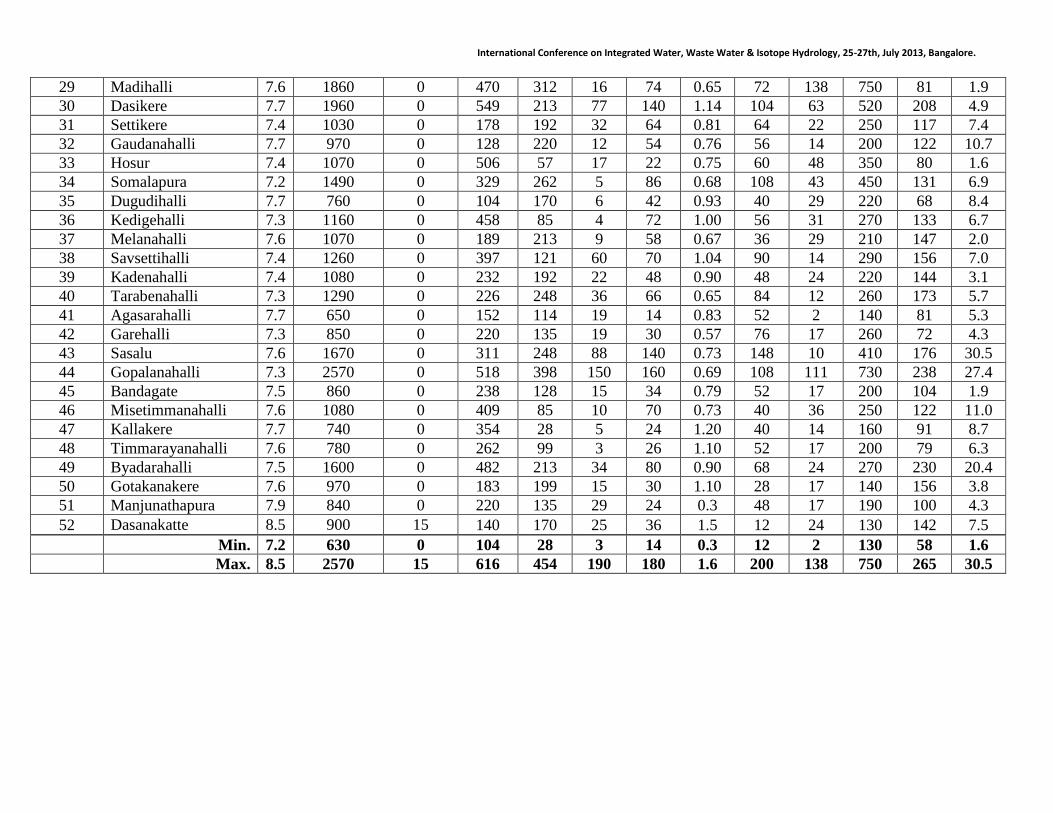
Table 1: Chemical characteristics of groundwater in MLAM study area.
Sample
Id.
Location
pH
EC
(µS/cm-
25°C)
CO3-- HCO3
- CI
- NO3 SO4 F
- Ca
++ Mg
++ TH Na
+ K
+
(mg/l)
1 Kuppuradoddahalli 7.2 1230 0 467 85 55 58 0.87 60 58 390 98 8.2
2 Timmalapura 7.3 1180 0 396 106 44 66 0.78 48 60 370 95 9.6
3 Vasudevarahalli 7.4 1050 0 384 78 10 76 0.92 36 53 310 87 18.3
4 Bhairanayakanahalli 7.2 1970 0 342 334 76 150 0.80 168 60 670 137 11.0
5 Alur 7.4 1090 0 335 114 30 70 0.70 52 41 300 100 19.7
6 Saratvalli 7.7 800 0 232 92 15 56 0.77 36 22 180 97 5.9
7 Halkurike 7.3 1860 0 390 312 12 140 0.98 120 10 340 264 11.3
8 Mayagondanahalli 7.5 850 0 281 85 20 48 1.15 52 19 210 94 7.6
9 Basavarajapura 7.3 1700 0 415 305 16 52 0.53 108 70 560 126 11.0
10 Bommanahalli 7.4 870 0 323 71 32 38 1.04 56 17 210 85 25.0
11 Balavaneralu 7.4 1430 0 445 170 36 68 1.20 116 31 420 127 12.6
12 Rudrapura 7.6 1820 0 616 206 15 94 1.50 32 58 320 265 2.3
13 Kamalapura 7.6 1020 0 396 92 34 20 1.00 60 48 350 72 2.1
14 Dugganahalli 7.5 1460 0 476 170 54 44 1.04 96 73 540 85 3.2
15 Bharanapura 7.9 1480 0 525 185 34 18 1.20 40 94 490 109 2.3
16 Khaimara Junction 7.8 830 0 354 64 10 16 0.89 72 17 250 72 5.9
17 Chattasandra 7.6 910 0 128 220 8 22 0.97 56 22 230 100 4.5
18 Banjara tanda 7.8 690 0 323 36 5 18 1.60 36 14 150 84 5.2
19 Kuppur 7.6 2070 0 238 454 28 160 0.30 112 102 700 151 2.9
20 Anekatte 7.5 1480 0 390 192 52 94 0.68 112 17 350 172 9.8
21 Aralikere 7.2 1870 0 122 341 190 180 0.70 200 29 620 136 13.0
22 Ankasandra 7.7 1320 0 213 256 58 66 0.80 108 24 370 128 7.4
23 Kallenahalli 7.7 820 0 323 57 6 48 1.10 44 27 220 82 7.9
24 Karehalli 8.2 630 0 274 28 4 38 1.20 48 14 180 58 5.5
25 Desihallipalya 7.7 690 0 274 57 5 30 0.94 52 12 180 69 6.4
26 Kodagihalli 7.7 1940 0 360 440 10 30 0.40 48 116 600 166 5.8
27 Tammadihalli 7.6 1740 0 372 348 7 50 0.61 60 46 340 237 8.3
28 Manchasandra 7.8 1030 0 140 227 18 56 0.85 56 24 240 124 2.6
International Conference on Integrated Water, Waste Water & Isotope Hydrology, 25-27th, July 2013, Bangalore.
29 Madihalli 7.6 1860 0 470 312 16 74 0.65 72 138 750 81 1.9
30 Dasikere 7.7 1960 0 549 213 77 140 1.14 104 63 520 208 4.9
31 Settikere 7.4 1030 0 178 192 32 64 0.81 64 22 250 117 7.4
32 Gaudanahalli 7.7 970 0 128 220 12 54 0.76 56 14 200 122 10.7
33 Hosur 7.4 1070 0 506 57 17 22 0.75 60 48 350 80 1.6
34 Somalapura 7.2 1490 0 329 262 5 86 0.68 108 43 450 131 6.9
35 Dugudihalli 7.7 760 0 104 170 6 42 0.93 40 29 220 68 8.4
36 Kedigehalli 7.3 1160 0 458 85 4 72 1.00 56 31 270 133 6.7
37 Melanahalli 7.6 1070 0 189 213 9 58 0.67 36 29 210 147 2.0
38 Savsettihalli 7.4 1260 0 397 121 60 70 1.04 90 14 290 156 7.0
39 Kadenahalli 7.4 1080 0 232 192 22 48 0.90 48 24 220 144 3.1
40 Tarabenahalli 7.3 1290 0 226 248 36 66 0.65 84 12 260 173 5.7
41 Agasarahalli 7.7 650 0 152 114 19 14 0.83 52 2 140 81 5.3
42 Garehalli 7.3 850 0 220 135 19 30 0.57 76 17 260 72 4.3
43 Sasalu 7.6 1670 0 311 248 88 140 0.73 148 10 410 176 30.5
44 Gopalanahalli 7.3 2570 0 518 398 150 160 0.69 108 111 730 238 27.4
45 Bandagate 7.5 860 0 238 128 15 34 0.79 52 17 200 104 1.9
46 Misetimmanahalli 7.6 1080 0 409 85 10 70 0.73 40 36 250 122 11.0
47 Kallakere 7.7 740 0 354 28 5 24 1.20 40 14 160 91 8.7
48 Timmarayanahalli 7.6 780 0 262 99 3 26 1.10 52 17 200 79 6.3
49 Byadarahalli 7.5 1600 0 482 213 34 80 0.90 68 24 270 230 20.4
50 Gotakanakere 7.6 970 0 183 199 15 30 1.10 28 17 140 156 3.8
51 Manjunathapura 7.9 840 0 220 135 29 24 0.3 48 17 190 100 4.3
52 Dasanakatte 8.5 900 15 140 170 25 36 1.5 12 24 130 142 7.5
Min. 7.2 630 0 104 28 3 14 0.3 12 2 130 58 1.6
Max. 8.5 2570 15 616 454 190 180 1.6 200 138 750 265 30.5

International Conference on Integrated Water, Waste Water & Isotope Hydrology, 25-27th, July 2013, Bangalore.
Table 2: Computed values of Percent sodium, SAR, and RSC in MLAM study area.
Sample Location
EC Percent SAR RSC
Id. (µS/cm-25°C) Sodium
1 Kuppuradoddahalli 1230 36 3.05 -0.13
2 Timmalapura 1180 37 3.05 -0.86
3 Vasudevarahalli 1050 41 3.04 0.12
4 Bhairanayakanahalli 1970 32 3.26 -7.74
5 Alur 1090 45 3.56 -0.49
6 Saratvalli 800 55 4.44 0.19
7 Halkurike 1860 63 8.79 -0.43
8 Mayagondanahalli 850 51 4.00 0.44
9 Basavarajapura 1700 34 3.28 -4.37
10 Bommanahalli 870 51 3.61 1.09
11 Balavaneralu 1430 41 3.82 -1.06
12 Rudrapura 1820 64 9.12 3.71
13 Kamalapura 1020 31 2.37 -0.47
14 Dugganahalli 1460 26 2.25 -3.02
15 Bharanapura 1480 33 3.03 -1.15
16 Khaimara Junction 830 40 2.80 0.80
17 Chattasandra 910 49 4.05 -2.52
18 Banjara tanda 690 56 4.25 2.34
19 Kuppur 2070 32 3.51 -10.11
20 Anekatte 1480 52 5.65 -0.61
21 Aralikere 1870 34 3.36 -10.39
22 Ankasandra 1320 44 4.10 -3.89
23 Kallenahalli 820 46 3.39 0.87
24 Karehalli 630 43 2.67 0.94
25 Desihallipalya 690 47 3.17 0.90
26 Kodagihalli 1940 38 4.17 -6.07
27 Tammadihalli 1740 61 7.91 -0.70
28 Manchasandra 1030 53 4.93 -2.49
29 Madihalli 1860 19 1.82 -7.28
30 Dasikere 1960 47 5.61 -1.40
31 Settikere 1030 51 4.54 -2.10
32 Gaudanahalli 970 59 5.33 -1.86
33 Hosur 1070 34 2.64 1.33
34 Somalapura 1490 40 3.81 -3.55
35 Dugudihalli 760 42 2.82 -2.69
36 Kedigehalli 1160 53 5.00 2.15
37 Melanahalli 1070 61 6.24 -1.09
38 Savsettihalli 1260 55 5.70 0.85
39 Kadenahalli 1080 59 5.98 -0.58
40 Tarabenahalli 1290 60 6.60 -1.49
41 Agasarahalli 650 57 4.24 -0.27
42 Garehalli 850 38 2.74 -1.60
43 Sasalu 1670 51 5.34 -3.13

International Conference on Integrated Water, Waste Water & Isotope Hydrology, 25-27th, July 2013, Bangalore.
44 Gopalanahalli 2570 43 5.42 -6.07
45 Bandagate 860 53 4.52 -0.10
46 Misetimmanahalli 1080 53 4.76 1.73
47 Kallakere 740 57 4.45 2.65
48 Timmarayanahalli 780 47 3.43 0.29
49 Byadarahalli 1600 66 8.62 2.52
50 Gotakanakere 970 71 8.10 0.20
51 Manjunathapura 840 54 4.46 -0.20
52 Dasanakatte 900 71 7.69 0.21
Table 3: Classification of Irrigation water
Parameter Min. Max. Category No. of No. of Water Class
Samples Samples (%)
EC 630 2570 < 250 - Nil - - Nil - Excellent
(µS/cm-25°C)
250 - 750 5 10 Good
750 - 2000 45 86 Permissible
2000 - 3000 2 4 Doubtful
> 3000 - Nil - - Nil - Unsuitable
Percent Sodium 19 71 < 20 1 2 Excellent
20 - 40 14 27 Good
40 - 60 30 58 Permissible
60 - 80 7 13 Doubtful
> 80 - Nil - - Nil - Unsuitable
SAR 1.82 9.12 < 10 52 100 Excellent
10 - 18 - Nil - - Nil - Good
18 - 26 - Nil - - Nil - Fair
> 26 - Nil - - Nil - Poor
RSC -10.39 3.71 < 1.25 45 86 Safe
1.25 - 2.5 4 8 Marginal
> 2.5 3 6 Unsuitable
Related Documents