TIPS RESEARCH REPORT FOR DEPARTMENT OF TRADE AND INDUSTRY SUGAR INDUSTRY DIVERSIFICATION STUDY Wolfe Braude Gaylor Montmasson-Clair September 2019 TIPS is a research organisation that facilitates policy development and dialogue across three focus areas: Trade and Industrial Policy, Inequality and Economic Inclusion, and Sustainable Growth [email protected] +27 12 433 9340 www.tips.org.za Author Wolfe Braude Emet Consulting Co-author Gaylor Montmasson-Clair TIPS Senior Economist DEPARTMENT OF TRADE AND INDUSTRY

Welcome message from author
This document is posted to help you gain knowledge. Please leave a comment to let me know what you think about it! Share it to your friends and learn new things together.
Transcript
TIPS RESEARCH REPORT FOR
DEPARTMENT OF TRADE AND INDUSTRY
SUGAR INDUSTRY DIVERSIFICATION STUDY
Wolfe Braude
Gaylor Montmasson-Clair
September 2019
TIPS is a research
organisation that
facilitates policy
development and
dialogue across three
focus areas: Trade
and Industrial Policy,
Inequality and
Economic Inclusion, and
Sustainable Growth
+27 12 433 9340
www.tips.org.za
Author
Wolfe Braude
Emet Consulting
Co-author
Gaylor
Montmasson-Clair
TIPS Senior Economist
DEPARTMENT OF
TRADE AND
INDUSTRY

2
CONTENTS ABBREVIATIONS…………………………………………………………………………………………………………………………….4
1. INTRODUCTION .................................................................................................................... 5
2. PROFILE OF THE GLOBAL SUGAR INDUSTRY ........................................................................... 6
2.1 Production ............................................................................................................................... 6
2.2 Prices ....................................................................................................................................... 9
2.3 Consumption and stocks ....................................................................................................... 10
2.4 Trade ..................................................................................................................................... 12
3. SOUTH AFRICAN SUGAR INDUSTRY VALUE CHAIN ............................................................... 14
3.1 Key players ............................................................................................................................ 14
3.3.1. Growers ............................................................................................................................... 14
3.1.2. Millers ................................................................................................................................. 15
3.2 Products ................................................................................................................................ 16
3.3 Production and consumption ............................................................................................... 21
3.4 Trade ..................................................................................................................................... 23
3.5 Marketing arrangements ...................................................................................................... 25
3.6 Overview of applicable legislation and policies .................................................................... 27
3.6.1 Agro-processing ............................................................................................................ 27
3.6.2 Sugar sector-specific legislation .................................................................................... 28
3.6.3 Tariff legislation............................................................................................................. 29
4. SOUTH AFRICAN SUGAR INDUSTRY DRIVERS AND CHALLENGES ........................................... 30
4.1 Key drivers ............................................................................................................................. 30
4.1.1 Research and development .......................................................................................... 30
4.1.2 Institutional cohesion ................................................................................................... 30
4.1.3 Logistics ......................................................................................................................... 31
4.1.4 Regional footprint ......................................................................................................... 31
4.2 Key challenges ....................................................................................................................... 31
4.2.1 Single stream revenue model ....................................................................................... 31
4.2.2 Distorted markets and trade ......................................................................................... 33
4.2.3 Health-related legislation .............................................................................................. 36
4.2.4 Land reform ................................................................................................................... 39
4.2.5 Drought ......................................................................................................................... 39
4.2.6 Growing costs ................................................................................................................ 39
5. APPROACHES TO THE SUSTAINABILITY OF THE INDUSTRY .................................................... 40
5.1 Power co-generation from bagasse ...................................................................................... 40
5.2 Biofuel production ................................................................................................................ 43
5.3 Biochemicals ......................................................................................................................... 50
5.4 Biogas .................................................................................................................................... 53
6. CASE STUDIES IN DIVERSIFICATION BEST PRACTICE .............................................................. 56
6.1 Southern African Development Community ......................................................................... 56
6.2 Thailand ................................................................................................................................. 57
6.3 Mauritius ............................................................................................................................... 58
6.4 Brazil ...................................................................................................................................... 62
6.5 Lessons for South African diversification .............................................................................. 63
3
7. CONCLUSION AND WAY FORWARD ..................................................................................... 64
RFERENCES ................................................................................................................................ 66
ANNEX 1: SUGAR MILL OWNERSHIP IN SADC……………………………………………………………………………….70
TABLES
Table 1: Ten largest sugar producers, plus South Africa 2017/18………………………………………………………..7 Table 2: Ten largest cane and beet producers, 2016…………………………………………………………………………..7 Table 3: World cane and beet production………………………………………………………………………………..………. 8 Table 4: South African millers ..................................................................................................... ………. 16
Table 5: Components and chemical composition of bagasse and filter cake (wet)………………………….. 20 Table 6: Sugarcane and sugar production, 2005/2006-2018/2019………………………………………………….. 21
Table 7: Sugarcane and sugar production, 2014/15-2018/19………………………………………………………….. 22 Table 8: Sales of white and brown sugar, direct and industrial, 2002/03-2015/16……………………………22 Table 9: Dollar-based reference price tariff revisions, 2008-2018……………………………………………………. 29 Table 10: World sugar consumption, 2012/13-2017/18………………………………………………………………….. 38
Table 11: Cost benefit analysis for industry cogeneration……………………………………………………………….. 42
Table 12: Comparison of bio-fuel yield……………………………………………………………………………………………. 43
Table 13: Ethanol's capital competitiveness……………………………………………………………………………………. 44 Table 14: Cost benefit analysis for the alternative use for sugar add source……………………………………. 47
FIGURES
Figure 1: Beet and cane growing regions……………………………………………………………………………………………6
Figure 2: Top 10 sugarbeet producers, 201……………………………………………………………………………..…………8 Figure 3: Top 10 sugarcane producers, 2017……………………………………………………………………………………...8
Figure 4: World sugar prices, 2009-2018…………………………………………………………………………………………...9
Figure 5: World stocks, consumption and production, 2009/10-2018/19 ………………………………..………10 Figure 6: Top 10 consumers and South Africa 2017/182018/1………………………………………………………….11 Figure 7: Per capita sugar demand major regions…………………………………………………………………………….11
Figure 8: 2018/19 Expansion in Thailand, India exports………………………………………………………..………….13 Figure 9: South African sugar value chain……………………………………………………………………………….………..14 Figure 10: Sugarcane growing areas and mill locations…………………………………………………………………….15
Figure 11: Duty paid imports, January to December, 2013-2018………………………………………….…………. 23 Figure 12: South African sugar product trade balance, 2001-2018……………………………………….…………. 23 Figure 13: Imports of raw and refined sugar, 2001-2018……………………………………………………..…………. 24 Figure 14: Exports of raw and refined sugar, 2001-2018…………………………………………………………………. 24 Figure 15: Division of proceeds…………………………………………………………………………………………….…………. 27
Figure 16: Ethanol production (in million barrels per day……………………………………………………..………….32
Figure 17: Illustration of distortions, OECD sample ……………………………………………………………..............34 Figure 18: Sugarcane biorefinery, biochemical products and extraction technologies…………..………….51
Figure 19: Typical biogas plant……………………………………………………………………………………………..………….54 Figure 19: SADC diversification……………………………………………………………………………………………..………….56 Figure 21: Timeline of policies and measures influencing bagasse electricity generation in Mauritius.…………………………………………………………………….………………………………………………………………60
Figure 22: Electricity exported to national grid from bagasse and coal in Mauritius for the period1990 to 2015 …………………………………………………………………………………………………………………………61 Figure 23: Brazilian sugar sector power consumption vs power exports to grid ………………………………62

4
ABBREVIATIONS
AEDP Alternative Energy Development Plan (Thailand)
ASEAN Association of Southeast Asian Nations
CBA Cost Benefit Analysis
CEB Central Electricity Board (Mauritius)
CFTA Continental Free Trade Area
COMESA Common Market for Eastern and Southern Africa
DBRP Dollar-Based Reference Price
EU European Union
EAC East African Community
EPA Economic Partnership Agreement (EU)
FC Filter Cake
FiT Feed in Tariff
GDP Gross Domestic Product
GHG Greenhouse Gas
HDPE High Density Polyethylene
DAFF Department of Agriculture, Forestry and Fisheries
DBRP Dollar-Based Reference Price
ICUMSA International Commission for Uniform Methods of Sugar Analysis
ITAC International Trade Administration Commission
IPAP Industrial Policy Action Plan
IPPs Independent Power Producers
ISO International Sugar Organization
KTIS Thai International Sugar Corporation
NAMC National Agricultural Marketing Council
NDP National Development Plan
PET Polyethylene Terephthalate
PLA Polylactic Acid
QTA Qwabe Trust Authority
REIPPP Renewable Energy Independent Power Producer Procurement (Programme)
SACU Southern African Customs Union
SADC Southern African Development Community
SAFDA South African Farmers Development Association
SASA South African Sugar Association
SASRI South African Sugarcane Research Institute
SIA Sugar Industry Agreement
SMRI Sugar Milling Research Institute
SSAP Sugar Sector Action Plan (Mauritius)
TT Tops and Trash
US United States
VHP Very High Polarity (sugar)
WTO World Trade Organization

5
1. INTRODUCTION
Sugar is a key agricultural industry for South Africa, with sugarcane being the second largest South
African field crop by gross value, surpassed only by maize. The industry generates R14 billion in
revenues, with sugarcane farming contributing around 64% of this figure, employing up to 85 000
people across the growing and milling subsectors, and providing indirect employment to possibly up
to 350 000 workers within the value chain (SASA, n.d-a).
The industry contributes around 10% to 11% of the country’s total agricultural employment of about
850 000 (Statistics South Africa, 2018) and may, through the families of those directly and indirectly
employed, impact the livelihoods of close to one million people or close to 2% of the South African
population. It is one of the more labour-intensive sectors within agriculture, compared to other large
agricultural crops such as maize or wheat, or in the livestock production sectors, beef and mutton. It
has, however, been heavily affected over the past decade by rising input costs, drought and imports,
shedding thousands of jobs as growers go out of business and mills become unviable.
The industry remains mainly a single income stream industry, however, reliant almost entirely on
sugar sales for revenue. Yet globally, the sugar industry is experiencing a drive for commercial
sustainability focused on the diversification of income streams, with sugar industries expanding their
focus to include the production of renewable energy and biochemicals. This move to diversify is a
commercial imperative. The returns from sugar sales globally have been decreasing over the past few
decades, while production costs have risen and domestic and export prices have decreased due to
sporadic liberalisation in domestic and export markets, oversupply and the world sugar market’s
notorious market volatility.

6
2. PROFILE OF THE GLOBAL SUGAR INDUSTRY
2.1 Production
More than 120 countries produce either sugarcane or sugar beet, with 10 producing sugar from both
cane and beet (see Figure 1).
Figure 1: Beet and cane growing regions
Source: ISO, 2018
Sugarcane is the largest crop, accounting on average for about 80% of global sugar production. Refined
sugar produced from beet or cane is chemically and functionally the same (AB Sugar, n.d.). Sugar is
sold to either industrial users (food and beverage producers) or retail users.
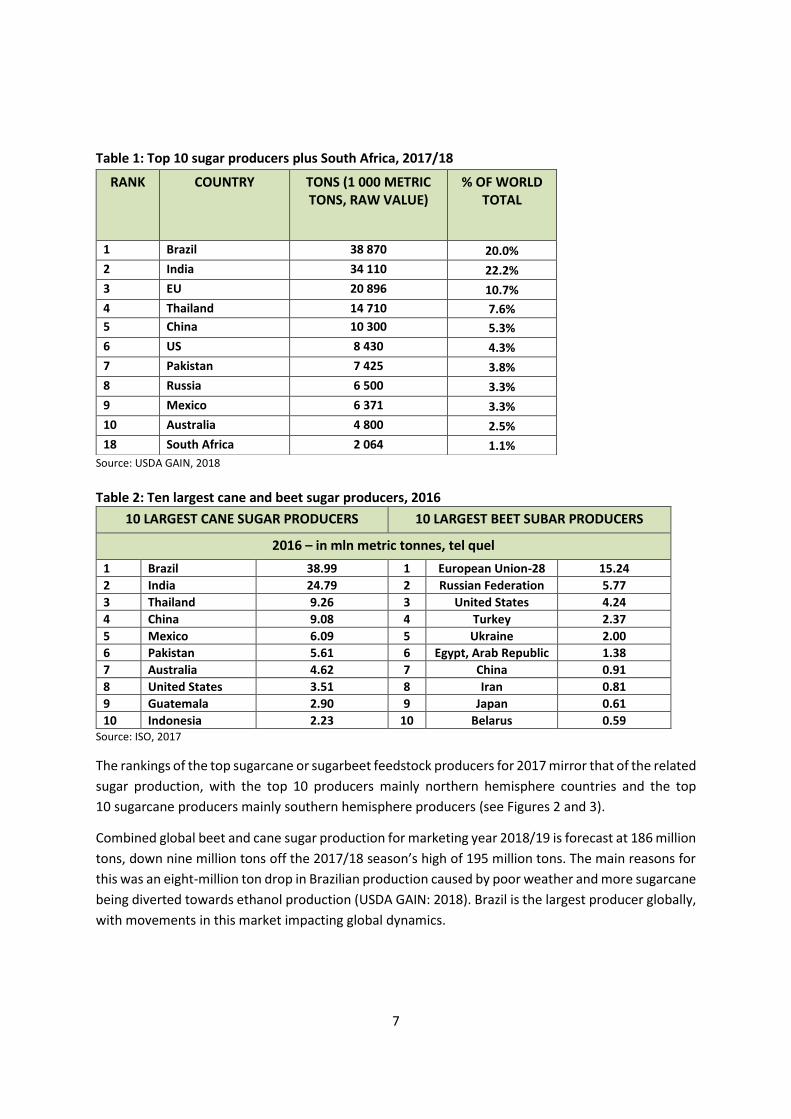
Although over 120 producers exist globally, production has become increasingly concentrated in the
top 10 producers, namely Australia, Brazil, China, the European Union (EU), India, Mexico, Pakistan,
Russia, Thailand, and the United States (US). In 1980, the top 10 producing countries accounted for
56% of global production, whereas by 2016 the top 10 accounted for 76% (ISO, 2018). South Africa’s
average annual production of two million tons, accounted for just over 1% of global production
in 2017/18.
7
Table 1: Top 10 sugar producers plus South Africa, 2017/18
Source: USDA GAIN, 2018
Table 2: Ten largest cane and beet sugar producers, 2016
Source: ISO, 2017
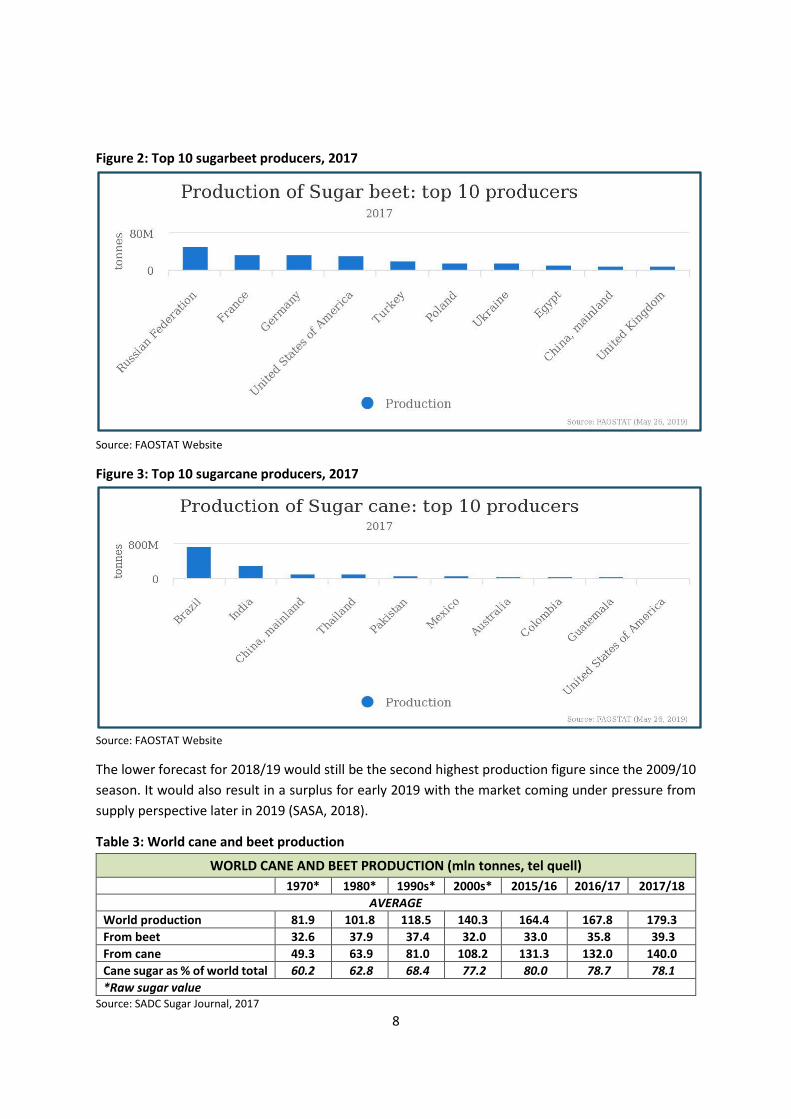
The rankings of the top sugarcane or sugarbeet feedstock producers for 2017 mirror that of the related
sugar production, with the top 10 producers mainly northern hemisphere countries and the top
10 sugarcane producers mainly southern hemisphere producers (see Figures 2 and 3).
Combined global beet and cane sugar production for marketing year 2018/19 is forecast at 186 million
tons, down nine million tons off the 2017/18 season’s high of 195 million tons. The main reasons for
this was an eight-million ton drop in Brazilian production caused by poor weather and more sugarcane
being diverted towards ethanol production (USDA GAIN: 2018). Brazil is the largest producer globally,
with movements in this market impacting global dynamics.
RANK COUNTRY TONS (1 000 METRIC TONS, RAW VALUE)
% OF WORLD TOTAL
1 Brazil 38 870 20.0%
2 India 34 110 22.2%
3 EU 20 896 10.7%
4 Thailand 14 710 7.6%
5 China 10 300 5.3%
6 US 8 430 4.3%
7 Pakistan 7 425 3.8%
8 Russia 6 500 3.3%
9 Mexico 6 371 3.3%
10 Australia 4 800 2.5%
18 South Africa 2 064 1.1%
10 LARGEST CANE SUGAR PRODUCERS 10 LARGEST BEET SUBAR PRODUCERS
2016 – in mln metric tonnes, tel quel
1 Brazil 38.99 1 European Union-28 15.24
2 India 24.79 2 Russian Federation 5.77
3 Thailand 9.26 3 United States 4.24
4 China 9.08 4 Turkey 2.37
5 Mexico 6.09 5 Ukraine 2.00
6 Pakistan 5.61 6 Egypt, Arab Republic 1.38
7 Australia 4.62 7 China 0.91
8 United States 3.51 8 Iran 0.81
9 Guatemala 2.90 9 Japan 0.61
10 Indonesia 2.23 10 Belarus 0.59
8
Figure 2: Top 10 sugarbeet producers, 2017
Source: FAOSTAT Website
Figure 3: Top 10 sugarcane producers, 2017
Source: FAOSTAT Website
The lower forecast for 2018/19 would still be the second highest production figure since the 2009/10
season. It would also result in a surplus for early 2019 with the market coming under pressure from
supply perspective later in 2019 (SASA, 2018).
Table 3: World cane and beet production
Source: SADC Sugar Journal, 2017
WORLD CANE AND BEET PRODUCTION (mln tonnes, tel quell)
1970* 1980* 1990s* 2000s* 2015/16 2016/17 2017/18
AVERAGE
World production 81.9 101.8 118.5 140.3 164.4 167.8 179.3
From beet 32.6 37.9 37.4 32.0 33.0 35.8 39.3
From cane 49.3 63.9 81.0 108.2 131.3 132.0 140.0
Cane sugar as % of world total 60.2 62.8 68.4 77.2 80.0 78.7 78.1
*Raw sugar value
9
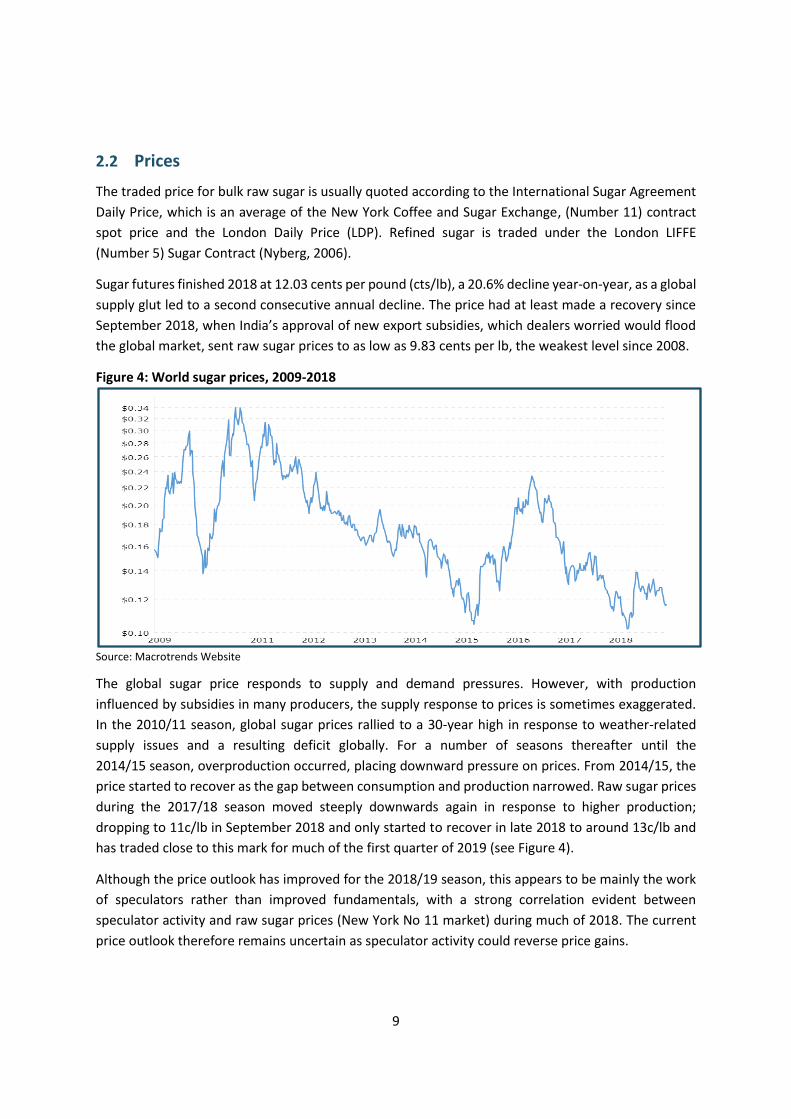
2.2 Prices
The traded price for bulk raw sugar is usually quoted according to the International Sugar Agreement
Daily Price, which is an average of the New York Coffee and Sugar Exchange, (Number 11) contract
spot price and the London Daily Price (LDP). Refined sugar is traded under the London LIFFE
(Number 5) Sugar Contract (Nyberg, 2006).
Sugar futures finished 2018 at 12.03 cents per pound (cts/lb), a 20.6% decline year-on-year, as a global
supply glut led to a second consecutive annual decline. The price had at least made a recovery since
September 2018, when India’s approval of new export subsidies, which dealers worried would flood
the global market, sent raw sugar prices to as low as 9.83 cents per lb, the weakest level since 2008.
Figure 4: World sugar prices, 2009-2018
Source: Macrotrends Website
The global sugar price responds to supply and demand pressures. However, with production
influenced by subsidies in many producers, the supply response to prices is sometimes exaggerated.
In the 2010/11 season, global sugar prices rallied to a 30-year high in response to weather-related
supply issues and a resulting deficit globally. For a number of seasons thereafter until the
2014/15 season, overproduction occurred, placing downward pressure on prices. From 2014/15, the
price started to recover as the gap between consumption and production narrowed. Raw sugar prices
during the 2017/18 season moved steeply downwards again in response to higher production;
dropping to 11c/lb in September 2018 and only started to recover in late 2018 to around 13c/lb and
has traded close to this mark for much of the first quarter of 2019 (see Figure 4).
Although the price outlook has improved for the 2018/19 season, this appears to be mainly the work
of speculators rather than improved fundamentals, with a strong correlation evident between
speculator activity and raw sugar prices (New York No 11 market) during much of 2018. The current
price outlook therefore remains uncertain as speculator activity could reverse price gains.

10
2.3 Consumption and stocks
Developing countries accounted for 77% of global sugar consumption in 2016 and are expected to
comprise the primary sources of future demand growth, particularly in Asia.
Global consumption continues to expand, averaging 1.8% over the past 10 years (ISO, 2017) driven
largely by population growth, rising incomes and shifting dietary patterns as consumers adopt diets
containing more processed and sugar containing foodstuffs. Record consumption is expected in the
2018/19 season due to growth in key developing markets, specifically India and Indonesia.
Figure 5: World stocks, consumption and production, 2009/10-2018/19
Source: USDA GAIN, 2018
Consumption and stock trends have climbed globally since 2009/10, except for the 2014/15 and
2015/16 seasons when production and therefore stock levels decreased while consumption continued
to rise, as evidenced in Figure 5. Although the annual consumption growth rates have fluctuated, the
long-term trend expected for consumption is that of steady growth of around 2%.
Consumption rankings among the top 10 consumers have remained unchanged over the past
four seasons from 2014/15 to 2017/18. South Africa moved from 17th to 19th largest consumer during
this period.

11
Figure 6: Top 10 consumers and South Africa, 2017/18
Source: USDA GAIN, 2018
Consumption trends within developed markets reveal saturated and, in some cases, declining
markets. For example, the US reported declining consumption in 2017 for the third consecutive year.
The EU figures show average per capita consumption static, at 36.1kg in 2016 (ISO, 2017). These
per capita differences are replicated when comparing South Africa to other African consumers, with
2016 per capita consumption much higher in South Africa (34.7kg) than the average for Africa (16.1kg).
The difference is equally stark when other populous nations, such as Nigeria (8.4kg), Ethiopia (5.2kg)
and Kenya (21.4kg), are considered. North African countries display higher average consumption on a
par with South Africa. See Section 4.2.3 on health-related legislation for further details.
Looking further ahead, increases in consumption are mainly to come from developing countries who
should be responsible for 94% of additional demand (OECD/FAO, 2018), with Asia and Africa
accounting for 60% and 25% respectively, both sugar deficit regions.
Figure 7: Per capita sugar demand, major regions
Source: OECD/FAO, 2018
0
5000
10000
15000
20000
25000
30000
Ton
s, '0
00
raw
val
ue
Top 10 consumers + South Africa (19th), 2017/18

12
2.4 Trade
The global sugar market is notoriously volatile, mainly due to the thin volumes traded, with only
approximately 20% of exported sugar being sold on the world or free market and the remainder traded
under more lucrative regional trade agreements or preferential trade agreements. Volatility further
arises from unpredictable production conditions due to weather, where unexpected deficits lead to
subsequent overproduction, as happened following the deficit of 2010/11.
Regardless of weather variables, the world market is invariably a low-value market, due to price
distortions caused by subsidy-induced overproduction, which distorts price signals and creates surplus
production. The distortions persist, linked to delays in the conclusion of multilateral agriculture
liberalisation negotiations under the Doha Development Round.
World sugar trade averages about 60 million tons per year, with raw sugar accounting for more than
60% of internationally-traded volumes. Refined sugar contributes the bulk of the remainder. Raw
sugar is sold at a lower price but requires refining at destination.
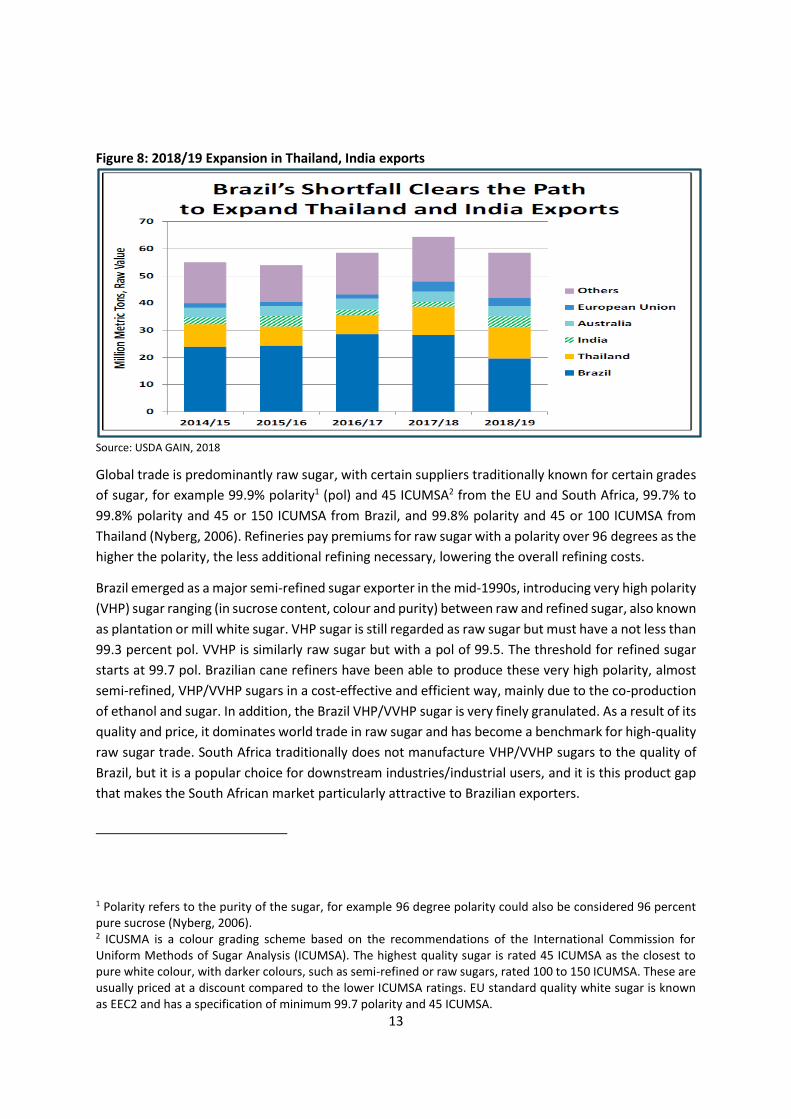
Ten countries dominate global raw sugar exports, with Brazil, Thailand, Australia, Guatemala, Mexico,
India, Cuba, eSwatini, Argentina and El Salvador accounting for 92% of the trade in 2016. Brazil, as the
largest producing and exporting country in the world, dominates, accounting for 45% of global export
trade in 2016, up from 21% in 2000. China, Indonesia, the US and the EU-28 were the world’s largest
importing nations in 2016. These are also major destinations for raw sugar. Key destinations for white
sugar include China, Sudan, the USA and Sri Lanka (ISO 2017).
Total global exports were higher at 63.9 million tons during the 2017/18 season. Export rankings
among the top exporters are expected to fluctuate in the 2018/19 season, with Brazil’s production
estimated to be down by 8.3 million tons to 30.1 million tons due to lower sugarcane yields and more
sugarcane being diverted towards ethanol production.
The larger switch to ethanol came in response to global sugar prices weakening by record global sugar
supplies. Brazilian exports are therefore projected to drop to 19.6 million tons, lowering Brazil’s
market share of global exports to 34%. For the previous five years, it averaged 45% (USDA GAIN 2018).
This drop will allow India and Thailand to expand their share of exports, as visible in Figure 8.
13
Figure 8: 2018/19 Expansion in Thailand, India exports
Source: USDA GAIN, 2018
Global trade is predominantly raw sugar, with certain suppliers traditionally known for certain grades
of sugar, for example 99.9% polarity1 (pol) and 45 ICUMSA2 from the EU and South Africa, 99.7% to
99.8% polarity and 45 or 150 ICUMSA from Brazil, and 99.8% polarity and 45 or 100 ICUMSA from
Thailand (Nyberg, 2006). Refineries pay premiums for raw sugar with a polarity over 96 degrees as the
higher the polarity, the less additional refining necessary, lowering the overall refining costs.
Brazil emerged as a major semi-refined sugar exporter in the mid-1990s, introducing very high polarity
(VHP) sugar ranging (in sucrose content, colour and purity) between raw and refined sugar, also known
as plantation or mill white sugar. VHP sugar is still regarded as raw sugar but must have a not less than
99.3 percent pol. VVHP is similarly raw sugar but with a pol of 99.5. The threshold for refined sugar
starts at 99.7 pol. Brazilian cane refiners have been able to produce these very high polarity, almost
semi-refined, VHP/VVHP sugars in a cost-effective and efficient way, mainly due to the co-production
of ethanol and sugar. In addition, the Brazil VHP/VVHP sugar is very finely granulated. As a result of its
quality and price, it dominates world trade in raw sugar and has become a benchmark for high-quality
raw sugar trade. South Africa traditionally does not manufacture VHP/VVHP sugars to the quality of
Brazil, but it is a popular choice for downstream industries/industrial users, and it is this product gap
that makes the South African market particularly attractive to Brazilian exporters.
1 Polarity refers to the purity of the sugar, for example 96 degree polarity could also be considered 96 percent pure sucrose (Nyberg, 2006). 2 ICUSMA is a colour grading scheme based on the recommendations of the International Commission for Uniform Methods of Sugar Analysis (ICUMSA). The highest quality sugar is rated 45 ICUMSA as the closest to pure white colour, with darker colours, such as semi-refined or raw sugars, rated 100 to 150 ICUMSA. These are usually priced at a discount compared to the lower ICUMSA ratings. EU standard quality white sugar is known as EEC2 and has a specification of minimum 99.7 polarity and 45 ICUMSA.
14
3. SOUTH AFRICAN SUGAR INDUSTRY VALUE CHAIN
3.1 Key players
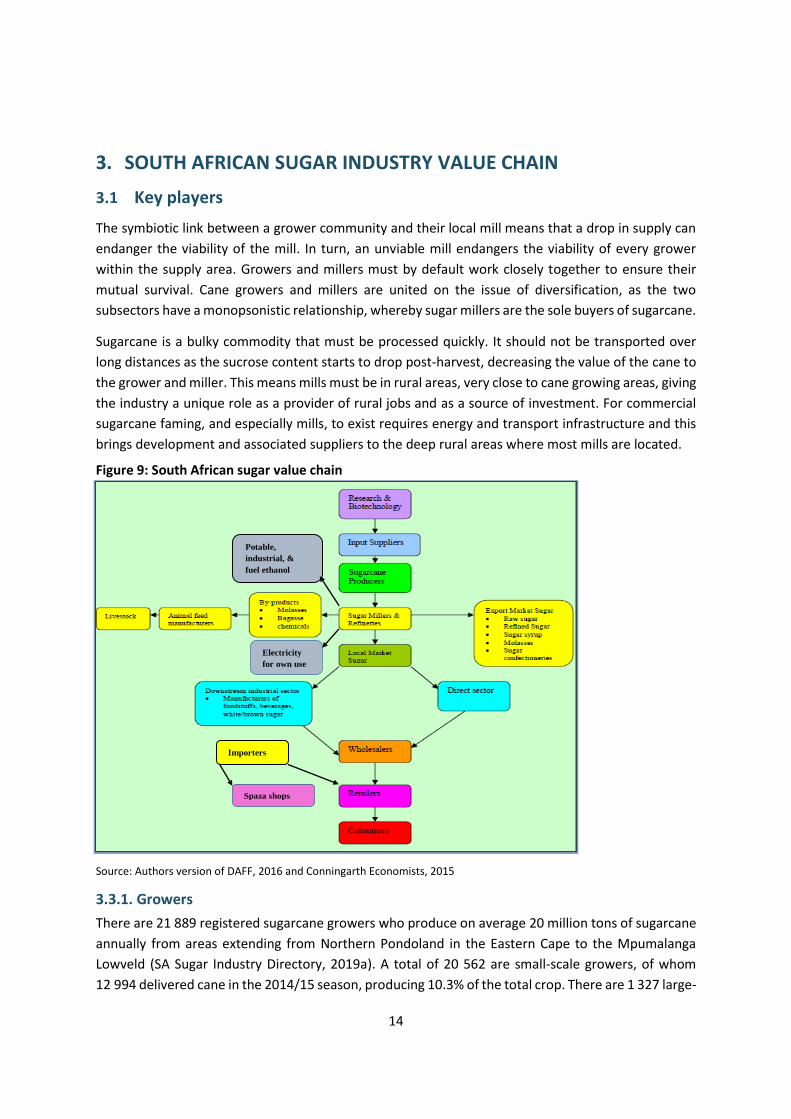
The symbiotic link between a grower community and their local mill means that a drop in supply can
endanger the viability of the mill. In turn, an unviable mill endangers the viability of every grower
within the supply area. Growers and millers must by default work closely together to ensure their
mutual survival. Cane growers and millers are united on the issue of diversification, as the two
subsectors have a monopsonistic relationship, whereby sugar millers are the sole buyers of sugarcane.
Sugarcane is a bulky commodity that must be processed quickly. It should not be transported over
long distances as the sucrose content starts to drop post-harvest, decreasing the value of the cane to
the grower and miller. This means mills must be in rural areas, very close to cane growing areas, giving
the industry a unique role as a provider of rural jobs and as a source of investment. For commercial
sugarcane faming, and especially mills, to exist requires energy and transport infrastructure and this
brings development and associated suppliers to the deep rural areas where most mills are located.
Figure 9: South African sugar value chain
Source: Authors version of DAFF, 2016 and Conningarth Economists, 2015
3.3.1. Growers
There are 21 889 registered sugarcane growers who produce on average 20 million tons of sugarcane
annually from areas extending from Northern Pondoland in the Eastern Cape to the Mpumalanga
Lowveld (SA Sugar Industry Directory, 2019a). A total of 20 562 are small-scale growers, of whom
12 994 delivered cane in the 2014/15 season, producing 10.3% of the total crop. There are 1 327 large-
Potable,
industrial, &
fuel ethanol
Electricity
for own use
Spaza shops
Importers

15
scale growers (inclusive of 323 black emerging farmers) who produced 81.5% of total sugarcane
production. Milling companies with their own sugar estates produced 8.2% of the crop (SA Sugar
Industry Directory, 2019a). Employment in the growing sector is estimated at around 78 000. Growers
are grouped under the SA Cane Growers Association with many small growers under the new South
African Farmers Development Association (SAFDA3).
3.1.2. Millers
The milling sector employs close to 7 000 people at 14 sugar mills across the two sugar-producing
provinces of KwaZulu-Natal and Mpumalanga, although only two mills are in Mpumalanga province
with the remainder of the industry’s mills in the KwaZulu-Natal province (SASA, n.d.-b).
Millers are represented by the SA Sugar Millers Association. Illovo Sugar Ltd and Tongaat Hulett Sugar
Ltd own four mills each while Tsb Sugar RSA Ltd owns three mills. The three smaller millers, Gledhow
Sugar Company (Pty) Ltd, UCL Company Ltd and Umfolozi Sugar Mill (Pty) Ltd, own one mill each.
Sugarcane growing areas and mill locations are shown in Figure 10.
Figure 10: Sugarcane growing areas and mill locations
Source: SASA Website. The Sugar Industry at a Glance.
3 SAFDA was officially recognised as a grower representative organisation in the last quarter of 2018.

16
Four of the mills are “white end” mills, i.e. mills with refineries that can produce their own refined
sugar. Tongaat Hulettet also operates a large central stand-alone refinery in Durban. Part of the raw
sugar produced by Tsb Sugar RSA Ltd is refined at the Malelane white end mill, and the balance is
exported via the sugar terminal in Maputo, Mozambique. The bulk of sugar exported is done via the
Durban port. The raw sugar produced at the remaining mills (that is not used by the milling companies
for exports of bagged refined sugar or direct consumption raw sugar) is sent to Durban. Here it is
either refined at the central THS refinery or stored at the South African Sugar Association (SASA) Sugar
Terminal prior to export. Miller ownership and operations are listed in Table 4.
Table 4: South African millers
Company Ownership Operations and products Estimated market %
Illovo Sugar Ltd
Associated British Foods PLC
Four sugar mills in South Africa, one of which has a refinery and two which have packaging plants. Three cane growing estates Produces speciality sugars, syrup, and a variety of high-value downstream products.
30
Tsb Sugar RCL Foods Three sugar mills, two of which have refineries, a packaging plant, sugar estates, and an animal feed division.
29
Tongaat Hulett
Tongaat Hulett Four sugar mills, two of which have packaging plants, one central refinery with its own packaging plant, various sugar estates and an animal feed operation.
24
Gledhow Four major shareholders – (Sokhela Family Trust, Illovo Sugar, Gledhow Growers and Sappi)
One mill producing refined sugar supplied to food and beverage industries in Southern Africa.
6
Umfolozi Sugar
Two shareholders – a farmers’ co-operative and NCP Alcohols
One sugar mill bags high-quality VHP brown sugar for sale into the industrial and retail markets.
6
UCL Company
A grouping of sugar cane growing co-operatives mainly in the Midlands
One sugar mill, a wattle extract factory, two sawmills, a number of mixed farms, and a trading division.
5
Source: SA sugar Industry Directory, 2019a, SASA Website; Conningarth Economists, 2015
3.2 Products
The industry produces raw and refined sugar, as well as syrups and by-products, such as molasses,
bagasse and chemicals, such as furfural. The value and tonnage of by-products is, however, a minority
of overall product production.

17
Sugars
Raw sugar is what consumers call brown sugar, and refined is what would be referred to as white
sugar. Depending on how it is handled and packaged at the mill, it will either be for direct consumption
(retail market) or indirect consumption as part of a product such as jam (industrial market). As noted,
raw and refined/white sugar can comprise different grades, and each grade has a defined quality
starting point. The South African industry also produces a range of speciality sugars for direct
consumption. Organic sugar is rarely produced, as the cost implications of cleaning the milling areas
to prevent mixing of organic and non-organic sugar renders the process unviable.
By-products
Molasses
Molasses mainly consists of water, sugar, glucose, fructose and some ash. It comprises the syrup from
the final stage of crystallisation, during the sugar production process and is the residue left over after
sugar crystals have been extracted from the sugar syrup. The syrup after the first crystallisation or
“strike” is normally referred as type A molasses. If the evaporation process and centrifuging is
repeated to recover more sugar, the resulting syrup residues are referred as type B molasses. In
general, 100 tons of sugar cane will yield 10-11 tonnes of sugar and 3-4 tons of molasses. Although it
is a residue, molasses still contains sugar, chemical elements, highly digestible fibre and energy which,
for example, makes it good product for animal feeding. As it contains around 50% sugars, it can also
be fermented by yeast to create ethanol. However, the industry sells the bulk of its molasses to
downstream users (e.g. as a fertiliser input). As a result, South Africa does not have large quantities of
spare molasses and diversion to ethanol may impact animal feed and other user value chains.
The dark coloured residue left over after alcohol is extracted is called molasses spentwash. It is still
organically rich, but very acidic and exudes an unpleasant odour. It is possible to harvest methane
gas from spentwash through biomethanation in biodigesters/biomethanation reactors
(Dotaniya et al, 2016). Biomethanated spentwash is still rich in plant nutrients, containing plant
extracts and microbial residue and can be used in agriculture as liquid manure.
Bagasse
Bagasse is produced as a natural by-product of cane growing. It is the dry fibrous pulp residue left
after the sugarcane stalks have been crushed to extract cane juice. It is essentially bio-waste. It has
real value for the industry because it is used as a substitute for coal or oil in the mill boilers. This
represents an important environmental benefit, as bagasse originates from a renewable source and
its combustion is in principle CO2 neutral. In industries where co-generation for sale is practiced,
“green harvesting” is often used, where the cane is not burnt, to maximise bagasse. Even the boiler
ashes from combusted bagasse can be used as fertiliser or in the production of construction materials.
18
Bagasse can also be used to manufacture chemicals, such as furfural (from which furfuryl alcohol,
resins,4 and tetrahydrofuran may be extracted), xylitol, as well as activated carbon
(George et al, 2010). It can also be the primary input into biodegradable containers.5
Tops and trash
During harvesting, the tops of the cane are usually lopped off and the leaves stripped. This residue is
separate to bagasse and is referred to as “tops and leaves”, “tops and trash” (TT) or just “trash”. TT is
usually composed of roughly 50/50 dry leaves and tops. It is estimated that around 140kg of TT is left
in the field per ton of sugarcane harvested. It is removed for a number of reasons – first, the logistical
and mechanical challenges involved in harvesting and transporting it.6 Second, if left on the stalk, it
can lower cane throughput at the mill by 25% and reduce sucrose throughput by about 45% compared
to cleaned (and burnt) cane. It is also less valued as a boiler fuel as it does not burn as well as bagasse,
which has a more uniform consistency and issues with dirt in the furnace are easier to resolve.
It also results in reduced earnings for the farmer. This is because the cane payment formula used in
South Africa corrects the sucrose content (recoverable value) of the delivered cane by a negative
factor linked to the amount of fibre in the cane (Pierossi et al, 2017). South African cane is therefore
traditionally topped and stripped of leaves during harvesting so that only stalks are processed by the
mill. However, the three main components extracted from cane, namely juice (which is then processed
into sugar or ethanol), fibres (bagasse), and TT have the same level of energy content, so effectively
only one third of the total energy potential is utilised currently by South African mills (in the form of
half utilisation of juice for sugar only and half utilisation of the bagasse for internal mill power only.
In South Africa, the cane is usually burnt before any harvesting to make both the cane cutting and
removal of tops and leaves easier. Burning can destroy up to two-thirds of the trash, which can save
growers transportation costs as well. The cane cutters are reluctant to support green (no burning)
harvesting as they are paid per ton of cane cut and stacked, with the average rate being around
3.48 tons a day. When green cane is harvested, their productivity is reduced significantly by up to 50%.
In addition, the workers appreciate the fact that burning kills insects and snakes in the cane. Using
“green harvesting”, i.e. with no burning, would mean larger quantities of tops and trash to “harvest”.
Yet this biomass residue has the same energy content as a similar amount of dry bagasse from the
same ton of cane (Bernhardt, 2016). In turn, dry leaf leaves/trash has about double the net heat
energy of bagasse and about three times that of green leaves and tops (Biomas Producer, n.d.).
4 The Belgian company Roltex (www.roltex.be) produced an ecotray (the “earth-tray”) made from recycled paper and thermoset resin obtained from bagasse with comparable properties to melamine trays, but not containing toxic products. After use, the trays can be incinerated, and the energy recovered. 5 https://greensafeproducts.com/faq/. 6 The Australian industry has reported success with “chopped cane” harvesters. Using such machines, growers can harvest cane and collect remaining leaf and trash at the same time. This machinery may only be suitable for Mpumalanga canefields though as KwaZulu-Natal is very hilly.
19
A possible further use for tops and trash is producing charcoal briquettes. A study conducted for the
Mpumalanga Cane Growers Association looked at ways to supplement the income of small-scale
growers in the Nkomazi area established that slow pyrolysis to convert sugarcane residues to “green”
charcoal briquettes is feasible commercially and technically.
The pilot study, done by Aurecon, indicated that a small second MW generation pyrolysis plant has
the potential to generate more than 100 permanent jobs sustained by the sales of charcoal briquettes
into the leisure charcoal market (Mpumalanga Province , 2016). The plant was designed to support
small-scale growers but is scalable so that large-scale growers can participate. An integrated biomass
transport and logistics model was developed to ensure sufficient quantities of biomass within a cost-
effective distance of the processing plant to ensure that energy production could sustain a community
all year. The feasibility study estimated an average annual biomass yield of 18 000 tons of “wet” TT
feedstock can produce 2 228 tons of charcoal briquettes.
Press mud – filter cake
Sugarcane filter cake (FC) or press mud is the residue eliminated during the cane juice filtration
process. After the juice extraction stage, the resulting slurry is sent for filtration and the residual sugar
is removed, resulting in FC. In many sugar industries, it is one of the largest waste products,7 and is
seen as harmful and polluting, posing problems of management and final disposal. During its
decomposition, it generates acid leachate and emits significant amounts of greenhouse gases (GHG)
(George et al, 2010) and odour, and attracts insects. It can also occasionally spontaneously combust.
FC can be integrated with nitrogen and other inorganic fertilisers to enhance cane and sugar yield
(Dotaniya et al, 2016). Its composition makes it suitable as fertiliser in sugarcane fields and for growing
fruits and vegetables (including Southern African crops like manioc and sweet potato) and even maize
(Prado et al, 2013), because of the significant amounts of nitrogen, phosphorus, calcium and organic
matter. Crop yields appear comparable to chemical fertilisers resulting in cost savings.
It is also used in many industries as a soil conditioner. FC prevents soil erosion, crusting and cracking,
it allows for adjusting the pH, improves drainage and promotes the natural growth of bacteria and
microorganisms (George et al, 2010). It has further uses as a composting agent and a substrate for
seedling production, especially when mixed with bagasse. However, its long-term effects on
groundwater remain uncertain, and the cost of transporting it means it may be overused in farms
closer to the mill.8
7 Cuban estimates for every ton of sugarcane harvested: 176kg trash and 824kg cane stalks, yielding 104kg sugar, 231kg bagasse, 26kg molasses, and as waste – 430kg liquid effluents and 33kg filter cake (George et al, 2010). Prado (2013) estimated 30-40kg/ton of crushed cane on average. 8 Cuban and Brazilian research indicated that it is not economically efficient to transport filter cake to fields more than 12km away from the sugar factory.

20
Table 5: Components and chemical composition of bagasse and filter cake (wet)
Source: George et al, 2010
FC is even a source of wax production (sugarcane wax is the general term used when referring to the
lipids found in sugarcane. These lipids represent, approximately, 0.18% of plant weight
(Rabelo et al, 2015). As a natural wax, cane wax can be used as an alternative for vegetable, animal,
and synthetic waxes as an input for the food, pharmaceutical, chemical, cosmetic, and cleaning and
polishing product industries). Other industrial applications are reportedly cement and paint
manufacturing, as a foaming agent, and as a composting aid for bagasse. Methane harvesting through
anaerobic facilities is a further option, with the gas being naturally produced during the decomposition
process. Methane production of 120m3 per ton of filter cake processed has been recorded
(George et al, 2010). However, this practice is rare globally and the possible leaching effect from the
storage process once again highlights the risk of groundwater contamination.
One of the most promising alternative uses is boiler fuel. Bends of FC with bagasse can be combusted
in sugar mill boilers, and that loose, non-vitrified ashes with a similar appearance as bagasse ash are
obtained. This would reduce FC transportation, management and disposal costs. Apparently 1.2 ton
of filter cake is equivalent in energy terms to one ton of bagasse. A 10% filter cake/90% bagasse blend
has been demonstrated to not exceed environmental standards usually applied to bagasse ash
residue, allowing the blended boiler ash to still be used for soil treatment. The proportion of filter
cake/bagasse is usually about 1-10, meaning that in principle all produced filter cake could be used as
fuel. It also frees up 10% of the mill’s bagasse for alternative uses.
Vinasse
Vinasse is the remaining residue from distillation of the fermentation process used to obtain ethanol.
It has value as a soil treatment due to its high potassium levels. Brazilian studies have shown that the
application of vinasse increases productivity by 5% to 10% (Rabelo et al, 2015) as well as soil quality
(Prado et al, 2013) across a range of crops and it is used widely in the Brazilian sugar industry. It has
a high oxygen content, a low pH and is high in mineral salts. Unless treated correctly it has the potential
to contaminate ground water if used in high concentrations through, for example, the presence of zinc
and manganese. If correctly used it does not appear to result in environmental risk and it is a viable
alternative for mineral fertilisers. Technologies commonly used for treating vinasse are
fertigation (drip irrigation plus fertiliser) in the field, thermal concentration and biodigestion.
Treatment cost does reduce the viability of using vinasse, but its bulk production by the sugar industry
as a waste product means that it is available as a low cost feedstock.
COMPONENTS BARGASSE (%) FILTER CAKE (%) Cellulose 23 8.9 Hemicellulose 12.3 2.4 Legin 9.9 1.2 Fat and wax 1.8 9.5
Elements
Carbon 48.7 32.5 Hydrogen 4.9 2.2 Nitrogen 1.3 2.2 Phosphorus 1.1 2.4 Ash content 1.8 14.5

21
Chemical by-products
Chemical by-products are not widely produced across the industry at present. However, most mills
have the potential to manufacture such products if the mill is adapted for bio-refining. The small range
of products (e.g. potable and industrial alcohols and furfural and its derivatives, and animal feeds) that
are currently produced, are for own account and fall outside of the current industry partnership.
3.3 Production and consumption
Production
The industry produces on average of around 2.1 million tons of sugar from an average of around
20 million tons of sugarcane. The sucrose/cane percentage indicates the percentage of sucrose in the
cane. The higher the figure, the more sugar can be potentially extracted during processing. Yields per
hectare reflect the amount of cane that was harvested per unit area of land cultivated.
Table 6: Sugarcane and sugar production, 2005/2006-2018/2019
CROP DATA: 2005/2006 TO 2018/2019* RECOVERABLE VALUE AND CANE PRICES 2005/2006 TO
2018/2019* Yields Yields
per hectare
of harvested cane (tons)
Rainfall June to
May (mm)
Season Recover-able
value**
Cane (Rand
per ton)
Season Sucrose %
Cane
Tons cane to 1 ton
sugar
Tons cane crushed
Tons sugar made
2005/2006 13.74 8.40 21 052 266 2 507 203 66.02 921 2005/2006 1 389.80 173.59
2006/2007 12.92 9.07 20 278 603 2 235 287 66.36 982 2006/2007 1 701.86 198.78
2007/2008 13.47 8.64 19 723 916 2 281 765 64.17 1 026 2007/2008 1 701.90 208.82
2008/2009 13.69 8.49 19 255 404 2 269 087 67.00 941 2008/2009 2 011.18 251.00
2009/2010 13.68 8.53 18 655 089 2 187 542 67.07 832 2009/2010 2 284.20 284.15
2010/2011 14.14 8.35 16 015 649 1 919 116 59.08 883 2010/2011 2 572.14 331.55
2011/2012 12.94 9.17 16 800 277 1 832 438 66.46 992,00 2011/2012 3 017.51 352.38
2012/2013 13.46 8.81 17 278 020 1 961 031 67.20 1 224,00 2012/2013 3 197.87 389.08
2013/2014 13.83 8.51 20 032 969 2 352 878 75.33 807,00 2013/2014 3 137.87 394.63
2014/2015 14.25 8,38 17 755 504 2 118 232 65.06 598,00 2014/2015 3 437.97 443.50
2015/2016 13.41 9.12 14 861 401 1 627 395 60.57 655,00 2015/2016 3 979.22 475.89
2016/2017 12.97 9.65 15 074 610 1 553 229 58.94 1 081,00 2016/2017 4 931.91 564.39
2017/2018 13.82 8.72 17 388 177 2 169 660 68.48 912,00 2017/2018 4 187.11 522.46
2018/2019*
13.86 8.67 19 031 688 2 190 661 74.94 2018/2019*
3 701.61 466.36
*estimates **The recoverable value is a measure of
the rand value of the sugar and molasses that will be recovered from the sugar
cane delivered by the individual grower.
Source: SASA Website. Facts and Figures.
22
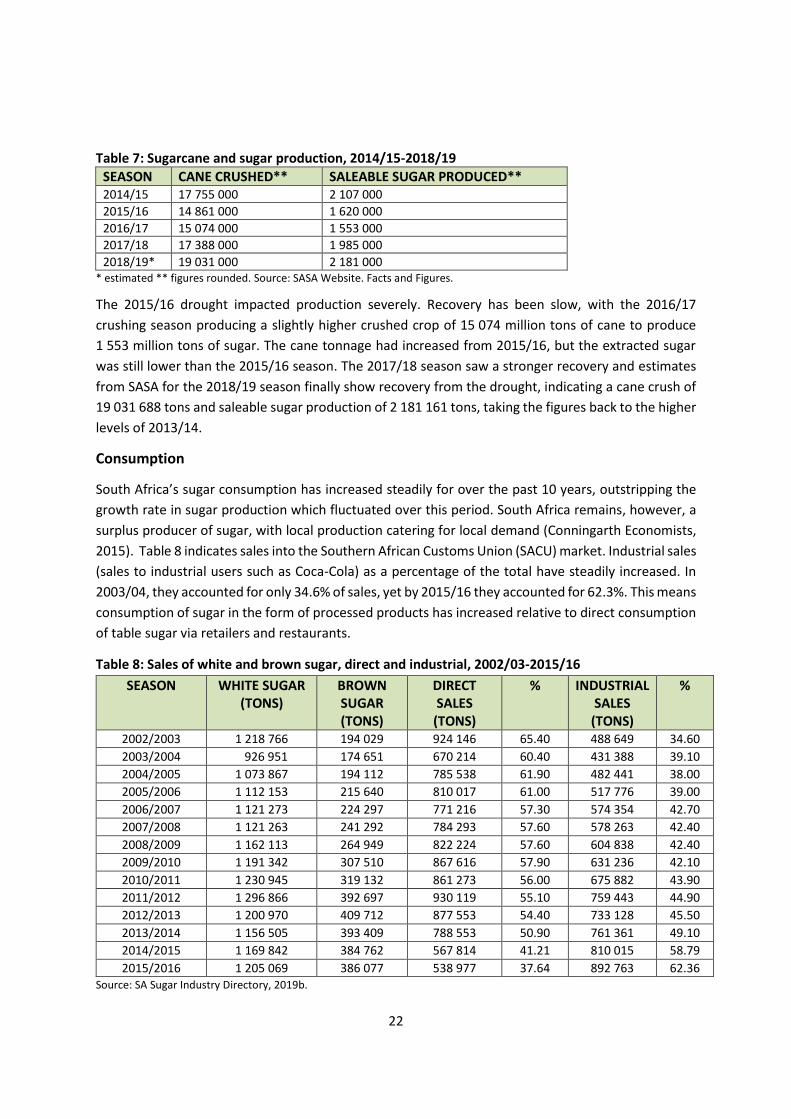
Table 7: Sugarcane and sugar production, 2014/15-2018/19
SEASON CANE CRUSHED** SALEABLE SUGAR PRODUCED** 2014/15 17 755 000 2 107 000
2015/16 14 861 000 1 620 000
2016/17 15 074 000 1 553 000
2017/18 17 388 000 1 985 000
2018/19* 19 031 000 2 181 000 * estimated ** figures rounded. Source: SASA Website. Facts and Figures.
The 2015/16 drought impacted production severely. Recovery has been slow, with the 2016/17
crushing season producing a slightly higher crushed crop of 15 074 million tons of cane to produce
1 553 million tons of sugar. The cane tonnage had increased from 2015/16, but the extracted sugar
was still lower than the 2015/16 season. The 2017/18 season saw a stronger recovery and estimates
from SASA for the 2018/19 season finally show recovery from the drought, indicating a cane crush of
19 031 688 tons and saleable sugar production of 2 181 161 tons, taking the figures back to the higher
levels of 2013/14.
Consumption
South Africa’s sugar consumption has increased steadily for over the past 10 years, outstripping the
growth rate in sugar production which fluctuated over this period. South Africa remains, however, a
surplus producer of sugar, with local production catering for local demand (Conningarth Economists,
2015). Table 8 indicates sales into the Southern African Customs Union (SACU) market. Industrial sales
(sales to industrial users such as Coca-Cola) as a percentage of the total have steadily increased. In
2003/04, they accounted for only 34.6% of sales, yet by 2015/16 they accounted for 62.3%. This means
consumption of sugar in the form of processed products has increased relative to direct consumption
of table sugar via retailers and restaurants.
Table 8: Sales of white and brown sugar, direct and industrial, 2002/03-2015/16
SEASON WHITE SUGAR (TONS)
BROWN SUGAR (TONS)
DIRECT SALES
(TONS)
% INDUSTRIAL SALES
(TONS)
%
2002/2003 1 218 766 194 029 924 146 65.40 488 649 34.60
2003/2004 926 951 174 651 670 214 60.40 431 388 39.10
2004/2005 1 073 867 194 112 785 538 61.90 482 441 38.00
2005/2006 1 112 153 215 640 810 017 61.00 517 776 39.00
2006/2007 1 121 273 224 297 771 216 57.30 574 354 42.70
2007/2008 1 121 263 241 292 784 293 57.60 578 263 42.40
2008/2009 1 162 113 264 949 822 224 57.60 604 838 42.40
2009/2010 1 191 342 307 510 867 616 57.90 631 236 42.10
2010/2011 1 230 945 319 132 861 273 56.00 675 882 43.90
2011/2012 1 296 866 392 697 930 119 55.10 759 443 44.90
2012/2013 1 200 970 409 712 877 553 54.40 733 128 45.50
2013/2014 1 156 505 393 409 788 553 50.90 761 361 49.10
2014/2015 1 169 842 384 762 567 814 41.21 810 015 58.79
2015/2016 1 205 069 386 077 538 977 37.64 892 763 62.36 Source: SA Sugar Industry Directory, 2019b.

23
3.4 Trade
The industry exports around 25% of production to the world market. The remainder is sold within
what is called the local market, which comprises the SACU area. Sugar which is not sold by milling
companies in the local/domestic market is delivered to SASA for export.
Imports are a significant factor, as they emanate from the subsidised world market and trigger
displacement within the SACU market. The displaced South African sugar is then sold on the open
world market. Because world market prices have historically trended below the average global cost of
production, these distortions would be transmitted to the local market if exports to this market were
not regulated, i.e. allowing inequitable exposure to the world market while regulating other aspects
of the industry. As a result, the Sugar Act and associated Sugar Industry Agreement provide for the
equitable distribution of exposure to the world market among growers and millers. Imports surged in
2015 as a result of tariff issues and low world market prices.
Figure 11: Duty paid imports, January to December, 2013-2018
Source: SASA, 2019
These imports reversed the trade surplus that South Africa traditionally enjoys with sugar. As can be
seen from Figure 12, the balance only returned to positive in 2018, which aligns with the imposition
of the new tariff.
Figure 12: South African sugar product trade balance, 2001-2018
Source: Trade Map Website
-600 000
-100 000
400 000
900 000
20
01
20
02
20
03
20
04
20
05
20
06
20
07
20
08
20
09
20
10
20
11
20
12
20
13
20
14
20
15
20
16
20
17
20
18
Combined SA imports (USD) Combined SA exports (USD)
Combined Trade balance

24
The figure provides combined data for raw and refined sugar (Tariff code 1701), syrups and glucose
sugars (1702), and molasses (1703). South Africa usually runs a trade surplus for the raw and refined
sugar category and a deficit for the syrups, glucose and molasses categories. However, the dollar value
of the trade deficit for 1702 and 1703 is consistently in the minority.
The bulk of South Africa’s imports have traditionally come from eSwatini, although technically with
both countries as member states of SACU the imports comprise intra-Customs Union market sales, i.e.
not subject to the Common External Tariff administered by the International Trade Administration
Commission (ITAC). Brazil is the next largest source of imports.
Figure 13: Imports of raw and refined sugar, 2001-2018
Source: Trade Map, 2019
Exports by South Africa of raw and refined sugar were severely impacted by the drought, recovering
only in 2018. Intra-SACU trade is a consistent feature, with exports to Botswana and Namibia.
Mozambique also features as an attractive market.
Figure 14: Exports of raw and refined sugar, 2001-2018
Source: Trade Map, 2019
25
Regional trade
Within the immediate SACU region, South Africa and eSwatini are the only sugar producers. Namibia,
Lesotho and Botswana do not have the right agronomic conditions for cane growing bar a few isolated
areas, and so maintain packing industries instead. eSwatini has duty free access to the SACU market
and imports on average comprise the largest source of non-South African sugar in the SACU market.
South African sales to eSwatini are minimal due to import controls. This has led to friction between
the two industries.
Within the broader Southern African Development Community (SADC) region, the South African
government supports the trade of sugar under the SADC Trade Protocol’s Annex VII which deals with
trade in sugar. South Africa’s regional trade is managed in turn through the Department of Trade and
Industry’s Strategy for the Optimal Development of the Sugar Industry within the context of SACU and
SADC. The main objectives of Annex VII include promoting, within the region, production and
consumption of sugar and sugar-containing products according to fair trading conditions and an
orderly regional market in sugar for the survival of the sugar industries in all sugar producing member
states, in anticipation of freer global trade. The Annex was necessitated by the presence of 11 sugar
industries in the 15 SADC member states (South Africa has the largest industry). Under the Annex,
non-SACU SADC sugar producers are granted quota access to the SACU market.
3.5 Marketing arrangements
The grower-miller relationship in its current form originated with the passing of the Sugar Act 9 of
1978. South Africa’s industry is by no means unique in this regard. The two sides to a sugar industry,
growers and millers, are permanently joined within the value chain – neither can exist without the
other. Globally, the solution to foster and manage the partnership has been for governments to
legislate and regulate the functioning of the partnership. The co-operation mechanisms and sanctions
for non-compliance are contained in an associated Sugar Industry Agreement (SIA), created in 2000.
Such regulated co-operation is a common aspect of sugar sectors globally. The Sugar Act regulates and
thereby harmonises the miller-grower relationship (Conningarth Economists, 2015). It provides for
equitable exposure to the subsidised world market, i.e. ensuring any losses from sales to the lower-
priced world market are equitably distributed among millers and growers. It also provides for a
common export mechanism which reduces export costs. The SIA is the regulation which informs the
actual management of the industry partnerships between growers and millers and between members
of these two groups. The most obvious component is the regulatory intervention to create a
differential pricing regime between the domestic and export markets and to ensure an equitable
exposure amongst producers to the world market.
Further key elements of the SIA include:
• Chapter 2 – The Sugar Industry Administration Board, the Sugar Industry Appeals Tribunal and Mill
Group Boards. The SIA (1994) established the Sugar Industry Administration Board, the Sugar
Industry Appeals Tribunal and the Mill Group Board, all of which continued to exist under the SIA
(2000). These are constituted of representatives from SASA, the Millers’ Association and the
Growers’ Association.
26
• Chapter 3 – Production of Cane: This chapter covers the growers’ register and right to deliver cane;
closure and re-siting of mills; pest and disease control and cane varieties; and compensation in
the event of eradication of cane.
• Chapter 4 – Supply of Cane: This chapter provides for cane delivery estimates; cane supply
agreements (between mills and growers); delivery to mills (times, modes); conditions and varieties
of cane and cane diversions.
• Chapter 5 – Payment for Cane: Provisions in this chapter cover cane testing; price based on
Relative Recoverable Value Percent); retention interest values per ton recoverable value, used to
calculate retention interest payment; retention interest payment (which is the tonnage of
recoverable value multiplied by retention interest value).
• Chapter 6 – Determination and Distribution of Proceeds and Cane Prices: This chapter empowers
SASA to determine sugar price, and gross proceeds. This is explained further below.
• Chapter 7 – SASA and Disposal of Crop: This chapter enables SASA to determine the local market
and export crop (with no obligation to provide for export); redistribute local market proceeds;
regulate sugar transport; and impose levies.
The division of proceeds
The partnership agreement between growers and millers provides agreed marketing arrangements
for the revenue from domestic and local market sugar sales as well as sales of molasses, to be allocated
to millers and growers via a division of proceeds formula, administered by SASA.
The agreement results in a split of the benefits derived from sales of sugar, with growers receiving
64.3675% of the proceeds and millers receiving the remaining 35.6325%. The arrangement can be
seen as largely aiming to protect growers, given their position of relative weakness due to the
monopsonistic nature of the relationship between millers and growers, i.e. millers comprise the only
buyers in the country for cane.
The total industrial proceeds, as shown in Figure 15, are a sum of the proceeds from the local sugar
sales, export sugar sales and molasses. Thereafter, industrial costs, which are the costs of
administering the sugar association, including all specialist services provided by SASA, such as
agricultural research, marketing and exports, are deducted from the total notional industrial proceeds
to determine the net divisible proceeds which are then split between millers and growers. Total
deliveries to mills during a season are then divided into the growers’ share which then establishes the
price per ton for the growers’ deliveries (Conningarth Economists, 2015).

27
Figure 15: Division of proceeds
Source: DAFF, 2017
A further component of the formula is the notional price. The division of proceeds formula is based
on a notional price for sugar, rather than the actual domestic market price, to ensure a consistent
allocation of proceeds. However, there is no year-end reconciliation between the two prices (the
market price is higher). There are concerns that this allocation is not equitable, and millers potentially
benefit at the expense of growers. This has been the subject of many discussions over the years as the
two parties have sought agreement on amendments to the Sugar Act as part of a review of the Act.
Diversification proceeds
A long-standing debate in the industry is how the possible additional revenue from any diversification
should be accounted for. Both growers and millers are part of the value chain that would generate the
additional income and therefore believe they have a claim on it. Therefore, the most equitable
solution would be to agree on an additional formula for a specific division of diversification proceeds,
to be included in the SIA. The industry has already engaged in a number of rounds of discussion over
the last decade as to how this could be done. As with sugar production, perceptions differ on value
add, with each party convinced their contribution is “more” invaluable. An equitable and workable
outcome would likely follow a similar format to the formula used to divide sugar revenue proceeds. It
is not yet clear whether separate formulas would be used for each diversified product category and
how this would incorporate the fact that not all millers may choose to diversify at first.
3.6 Overview of applicable legislation and policies
3.6.1 Agro-processing
Sugar milling and refining is regarded as a subsector of agro-processing. The agro-processing sector as
a whole has been identified in multiple policy initiatives as having the potential to contribute towards
the fulfilment of South Africa’s macroeconomic objectives as set out in the National Development
Plan (NDP). It is a key sector due to its strong up and downstream linkages as well as outcomes such

28
as job creation and retention, investment, labour-intensive growth and rural development multipliers.
The NDP sees agro-processing as a significant source of potential employment and postulates a related
900 000 possible new job opportunities in agriculture overall. The commitment to agro-processing has
been repeatedly highlighted in the NDP; New Growth Path, successive iterations of the Industrial
Policy Action Plans (IPAPs); the Agricultural Policy Action Plan; Operation Phakisa (2016); and a
Presidential Nine-Point Plan (Revitalisation of the Agriculture and Agro-processing Value Chains).
Since 2009, the Department of Trade and Industry has supported agro-processing industries with
R1.2 billion through various incentive schemes. As a direct response to the Nine-Point Plan, in 2017, a
R1 billion Agro-Processing Support Scheme was launched, aimed at further ramping up investment
and value-addition across the sector (AgriBook, n.d.). The 2018/19 -2020/21 IPAP identifies agro-
processing once again as a sectoral focus area worthy of support. It looks at investment needs,
constraints and opportunities in agro-processing. Key Action Programmes are identified for a range of
sectors, including ‘sugar industry development’. The sugar sector will benefit in respect of supply chain
product specifications for ethanol, and the development of a Sugar Industry Transformation Plan.
In addition to the Sugar Act (1978) and the SIA (2000), the following legislation is applicable to the
sugar industry:
• Subdivision of Agricultural Land Act 70 of 1970 as amended
• The Competition Act 89 of 1998
• The Consumer Protection Act 68 of 2008
• The International Trade Administration Act 71 of 2002
• The Marketing of Agricultural Products Act 47 of 1996 as amended
3.6.2 Sugar sector-specific legislation
Sugar Act and Sugar Industry Agreement
The South African sugar sector is unique among other agro-processing sectors in two ways. First,
although it encompasses primary agricultural activity, it falls under the Department of Trade and
Industry rather than the department overseeing agriculture. The foundation for locating it here is the
sector’s monopsonistic nature, comprising an interdependent primary agricultural component and an
industrial component. A sugar mill is in many respects an industrial facility, in operation and value.
Second, as noted, it is uniquely administered via a dedicated Sugar Act, the associated sugar industry
agreement, and the statutory association. To manage the miller-grower relationship, sugar industries
globally are invariably highly regulated. It is therefore not accurate to portray the sector’s legislation
within the South African context as simply a holdover of a highly regulated agricultural past.
The SASA Constitution and SIA constitute subordinate legislation to the Act and all millers, refiners
and growers in South Africa must comply with the Act and the related legislation. For most of the past
decade though, the Sugar Act has been the subject of internal discussions within the industry and
between the industry and government, with revisions proposed to improve the functioning of the
miller-grower and industry-government relationships. For example, the administration of rebates,
29
determination of domestic market requirements, and domestic price guideline setting (the notional
price) have been flagged as proposed areas for review (Conningarth Economists, 2015).
In terms of the Sugar Act and Sugar Industry Agreement, statutory powers of self-governance are
granted to the sugar industry. The affairs of SASA are administered by a council comprising a
Chairman, Vice Chairman and Councillors, nominated equally by millers and growers. The
Chairmanship and Vice-Chairmanship of Council usually alternates every two years between a grower
and a miller. Although the independence of SASA is enshrined in the Act, calls have been made for the
Act to be amended to create an oversight body or regulator. Even though SASA is a statutory body,
there is no government presence in the Council of SASA, or through any other dedicated oversight
mechanism other than the Department of Trade and Industry’s normal structures, which have to deal
with a range of agro-processing industries, not just sugar.
Given the interplay between the Sugar Act, the Competition Act and the statutory nature of SASA,
coherent policy formation would be strengthened by government representation in industry
structures. The absence of participation creates an artificial distinction whereby the industry must
present its case on policy each time in the same way as deregulated industries, even though it is
administered via a statutory entity. Essentially, SASA does not appear to offer significantly enhanced
or more interactive policy formulation processes compared to unregulated sectors. For example, the
key concerns of the industry around imports and diversification remain mainly unresolved and, in
2018, there were public marches by this highly regulated sector. Government does not appear to enjoy
sufficient policy formulation value from the extensive powers and legitimacy granted to SASA by the
Act. This places both industry and government under unnecessary pressure, given that the Act often
attracts criticism as an anomaly within South Africa’s deregulated landscape while at the same time
the industry competes against higher levels of sugar sector regulation regionally and globally (Braude,
2015). The ongoing review of the Sugar Act may offer an opportunity to devise a solution.
3.6.3 Tariff legislation
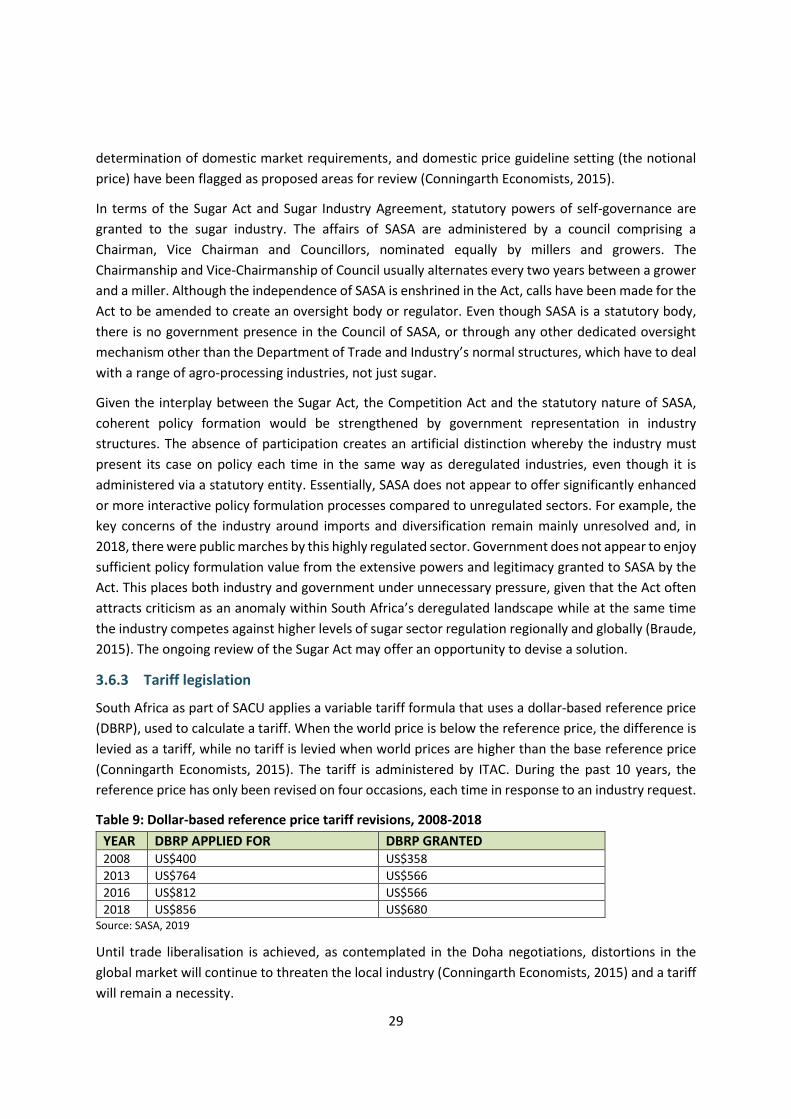
South Africa as part of SACU applies a variable tariff formula that uses a dollar-based reference price
(DBRP), used to calculate a tariff. When the world price is below the reference price, the difference is
levied as a tariff, while no tariff is levied when world prices are higher than the base reference price
(Conningarth Economists, 2015). The tariff is administered by ITAC. During the past 10 years, the
reference price has only been revised on four occasions, each time in response to an industry request.
Table 9: Dollar-based reference price tariff revisions, 2008-2018
YEAR DBRP APPLIED FOR DBRP GRANTED 2008 US$400 US$358
2013 US$764 US$566
2016 US$812 US$566
2018 US$856 US$680 Source: SASA, 2019
Until trade liberalisation is achieved, as contemplated in the Doha negotiations, distortions in the
global market will continue to threaten the local industry (Conningarth Economists, 2015) and a tariff
will remain a necessity.

30
4. SOUTH AFRICAN SUGAR INDUSTRY DRIVERS AND CHALLENGES
4.1 Key drivers
The South African sugar industry is consistently ranked in the top 15 most competitive sugar industries
globally, out of a list of over 120 countries (SASA, 2018). This is a testimony to the efforts of the
industry and government.
4.1.1 Research and development
South Africa is classified as a semi-arid country. This means growing conditions for sugarcane are not
optimal. Where irrigation is possible it is used, mainly in Mpumalanga. The industry has therefore
done well in maintaining its level of production and competitiveness. This has been achieved by
investing consistently for decades in research and development (SASA, 2016), for example in the plant
breeding programmes of the South African Sugar Research Institute (SASRI), which have produced
hardy varieties of cane. Such investment has been by the industry itself, enabling it to retain capacity
regardless of government funding. The continued existence of regulation such the Sugar Act and Sugar
Industry Agreement, even after other industries were deregulated, was crucial in facilitating and
enabling intra-industry agreement and co-ordination (Braude, 2015).
The three main institutional players are SASRI, the Sugar Milling Research Institute (SMRI) and the
Shukela Training Centre (STC). SASRI and SMRI consistently produce internationally respected
research and innovations in mill design, plant breeding, pest and disease control, and farm
management that allow the industry’s growers and millers to maintain their competitiveness while
enhancing sustainability and profitability. The industry’s research capacity has been consistently
maintained over time, allowing the industry to produce tailored varieties for each growing region and
ward off pests and diseases which can devastate cane production.
4.1.2 Institutional cohesion
A further advantage is the existence of the SASA itself. Provision for SASA is made in the Sugar Act.
SASRI and STC fall under SASA. Over the years, SASA has grown into an institution with almost 900
staff, making it the largest dedicated agricultural organisation in the country and continent. The Act
has not only regulated the miller-grower relationship, it has allowed the industry to maintain
institutional cohesion and capacity. SASA deals with research, training, administration, finance,
national and international marketing, cane testing, and management of external affairs. Some
additional services provided by SASA include growers’ estimates and allocations; provision of source
data for determining payments for grower sugar deliveries such as cane testing; milling production
tracking; technical audits; and savings facilities and loans for small-scale growers. SASA and its
activities are entirely financed by the industry from local and export sugar revenue. This industry
financing is one of the reasons for the continued strength of SASA. The industry has benefitted from
this institutional strength in terms of the sector’s size, capacity, developmental focus and ability to
weather crises (Conningarth Economists, 2013a).

31
4.1.3 Logistics
The industry location in two of South Africa’s eastern provinces facilitates access to the nearby ports
of eThekwini, Richards Bay and the Mozambique port of Maputo. The sugar storage and loading
terminals infrastructure in eThekwini and Maputo, funded by the industry, and South Africa’s
extensive road network and port infrastructure together with the storage facilities the industry has
built allow the industry to benefit from competitive export logistics. The industry’s cost profile
including logistics and port charges place it consistently in the top 15 sugar producers globally,
although the industry has flagged rising port charges as problematic. The storage facility in eThekwini
is one of the largest in the southern hemisphere.
4.1.4 Regional footprint
South African sugar companies, such as Illovo and Tongaat Hulett, own subsidiaries across the
Southern African region from eSwatini to Zimbabwe, Malawi, Zambia, Mozambique and Tanzania,
comprising around 60% of regional mill ownership in SADC. The region has provided the South African
firms with investment opportunities and returns that outperform their operations back home.
Investment in new mills or mill expansions in the South African operations has remained static in
comparison. Returns from the region have compensated for lower margins in the increasingly
saturated South African market.
Before the advent of the Tripartite Free Trade Agreement – made up of the East African Community
(EAC), SADC and COMESA (Common Market for Eastern and Southern Africa – the SADC region also
provided the South African industry with entry points into preferential regional economic community
markets such as COMESA and the EAC. South Africa is not a member of either arrangement, so these
subsidiaries played a key role in access to these faster growing, less saturated markets.
Similarly, prior to South Africa’s inclusion in the SADC Economic Partnership Agreement (EPA) with the
EU, the industry’s regional subsidiaries allowed it to access the then lucrative EU market. The advent
of the Continental Free Trade Area (CFTA) will allow the South African industry to now leverage the
geographical location of its subsidiaries and their additional arable land and mill production capacity.
There is a strong likelihood that the overall African sugar sector will trade under a dedicated sugar
annex to the CFTA, similar to that in SADC, which will seek to maximise the potential offered by the
fact that the African market overall has an annual deficit of more than seven million tons (SADC Sugar
Digest, 2017). SADC industries are therefore well placed to take advantage of any favourable sugar
annex to the CFTA, if access to non-SADC markets is negotiated. Annex 1 illustrates the regional
ownership by South African sugar multinationals (SADC Sugar Digest 2017).
4.2 Key challenges
4.2.1 Single stream revenue model
The industry globally has embraced the concept of multiple revenue streams in recent decades.
Although many producers still rely heavily on sugar sales alone, industries that have embraced
diversification have experienced increased revenue stability and revenue growth, with Brazil and
Mauritius among the more successful examples.
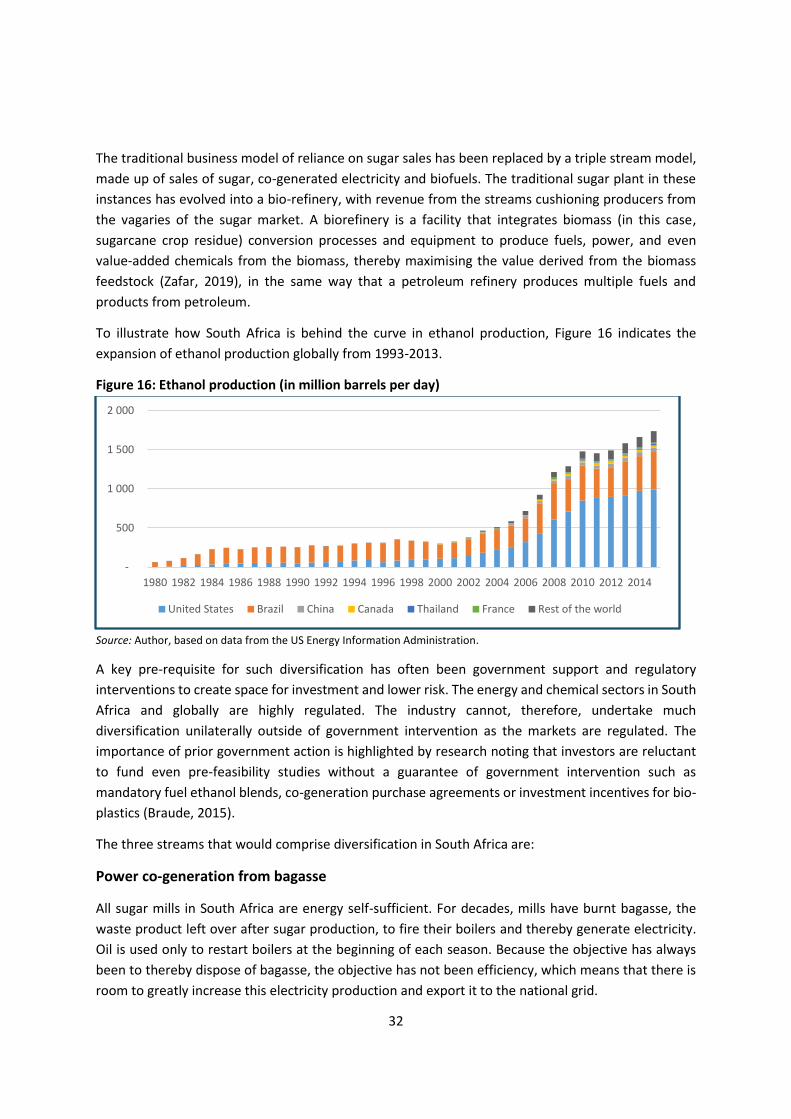
32
The traditional business model of reliance on sugar sales has been replaced by a triple stream model,
made up of sales of sugar, co-generated electricity and biofuels. The traditional sugar plant in these
instances has evolved into a bio-refinery, with revenue from the streams cushioning producers from
the vagaries of the sugar market. A biorefinery is a facility that integrates biomass (in this case,
sugarcane crop residue) conversion processes and equipment to produce fuels, power, and even
value-added chemicals from the biomass, thereby maximising the value derived from the biomass
feedstock (Zafar, 2019), in the same way that a petroleum refinery produces multiple fuels and
products from petroleum.
To illustrate how South Africa is behind the curve in ethanol production, Figure 16 indicates the
expansion of ethanol production globally from 1993-2013.
Figure 16: Ethanol production (in million barrels per day)
Source: Author, based on data from the US Energy Information Administration.
A key pre-requisite for such diversification has often been government support and regulatory
interventions to create space for investment and lower risk. The energy and chemical sectors in South
Africa and globally are highly regulated. The industry cannot, therefore, undertake much
diversification unilaterally outside of government intervention as the markets are regulated. The
importance of prior government action is highlighted by research noting that investors are reluctant
to fund even pre-feasibility studies without a guarantee of government intervention such as
mandatory fuel ethanol blends, co-generation purchase agreements or investment incentives for bio-
plastics (Braude, 2015).
The three streams that would comprise diversification in South Africa are:
Power co-generation from bagasse
All sugar mills in South Africa are energy self-sufficient. For decades, mills have burnt bagasse, the
waste product left over after sugar production, to fire their boilers and thereby generate electricity.
Oil is used only to restart boilers at the beginning of each season. Because the objective has always
been to thereby dispose of bagasse, the objective has not been efficiency, which means that there is
room to greatly increase this electricity production and export it to the national grid.
-
500
1 000
1 500
2 000
1980 1982 1984 1986 1988 1990 1992 1994 1996 1998 2000 2002 2004 2006 2008 2010 2012 2014
United States Brazil China Canada Thailand France Rest of the world

33
Biofuel production
During the sugar production process, it is possible to divert a portion of production to manufacture
ethanol, for use as a bio-fuel. It is even possible to construct a plant that converts all sugars directly to
ethanol. The South African industry has estimated that it can supply between 5%-8% of the domestic
fuel pool if a mandatory blend ratio is implemented.
Biochemical feedstock/inputs to the chemical sector
The sugarcane plant can be used to create a surprising number of chemical sector inputs or feedstocks.
Some of these have been produced for a number of years, such as fertiliser inputs, potable alcohol
(for human consumption) and industrial alcohols. Ethanol can be produced from sugar or it can be
derived directly from bagasse (second-generation fuel). Once a mill starts producing ethanol, it opens
up chemical feedstock possibilities as ethanol is a versatile and dynamic base product. It can be used
as a base to produce a broader set of products than are currently produced, such as ethanol gel for
household cooking, and biochemicals, including for bio-plastics (bio-degradable, plant-based/non-
petroleum plastic for packaging, bottles and bags), vehicle components, cutlery and smaller retail
plastic items.
4.2.2 Distorted markets and trade
World market imports
The world or “free market” is a residual market. It is used to export sugar that remains after domestic
needs have been fulfilled. However, with the majority of global production still occurring under trade
distorting conditions, the world market price has the dubious distinction of being effectively a
“distorted” market. The levels of distortion vary between sugar producing states, with South Africa
regarded as one of the most deregulated markets in the global sugar community (see Figure 17). All
of the top five producers, which collectively produce over 50% of sugar globally, maintain extensive
programmes of support for their industries. In practice, the cumulative effect of global distortions has
often led to an average world market price that is lower even than the cost of production in many
producer states, including South Africa. This is in spite of the fact that South Africa is often ranked in
the top 15 most competitive out of 120 sugar producers globally. This means in practice that very few
producers can withstand such low prices, even those that can maintain tariffs to protect their
industries. Support may be World Trade Organization (WTO) notifiable or not. WTO notifiable policies
and subsidies usually include quota systems, export subsidies, sugar and cane price setting, and direct
aid for farmers or processors. In terms of the world’s largest producers, these are commonly used in
Thailand, India and the US (AB Sugar, 2017). Not WTO notifiable measures include general (decoupled)
agricultural support, loans, debt write-off, taxation schemes, differential import duties, market
intervention tools and cross-subsidies. Top producers which more commonly use these are Brazil, the
EU and Australia.

34
Figure 17: Illustration of distortions, OECD sample
Source: OECD, 2018
The SACU tariff
As a result of the distorted world market for sugar, South Africa as part of SACU uses a dollar-
based variable tariff to deter imports.9 During the 2017/18 season, the industry maintained
that issues with the implementation of the tariff on a number of occasions from April to August
2017 inadvertently allowed a huge surge in dumped imports, mainly from Brazil, Thailand, Indonesia
and the United Arab Emirates, of more than 500 000 tons, massively increasing pressure on the sector
as it recovered from a multi-year drought. Even once the tariff triggered, this was followed by further
imports in early 2018 allegedly due to the tariff level being too low. The Sugar Industry Act obliges the
9 ITAC has noted previously that the world market price for sugar on average trades around 60% lower than it would trade in a liberalised global market. Even the most competitive producers globally maintain some form of tariff protection against this.
35
industry to export any sugar deemed surplus to local market needs, so the imports therefore caused
additional displacement to the lower-priced world market, adding to the impact. The surge declined
with an urgent application by the industry for government to trigger the existing tariff. In mid-2018,
the tariff was raised from US$566 to US$680, further decreasing imports. This new tariff will apply for
three years.
SASA had applied for an increase in the DBRP from the US$566 to US$856 though, which the industry
states to be the cost of production. But ITAC granted the industry the reference price of US$680. The
industry expressed its dissatisfaction with what it viewed as an insufficient increase to the tariff. It
views the level of duty secured as below what is necessary for longer-term sustainability, estimating
that it could still lead in the short term to negative margins, mills running at under-capacity and lower
planting rates and sugarcane yields.
The industry raised concerns that over 2019/20 the two mills would potentially close with the loss of
9 500 direct and 39 000 indirect jobs. The area under cane would potentially shrink by 40 000ha, sugar
production by 240 000 tons and 5 000 small-scale farmers could go under (SASA, 2018). The industry
believes 240 000 tons will need to be taken from the lower-priced world market exports/sales to
minimise this ongoing revenue loss. Any pronounced reduction in world marker tonnages is of
relevance to this report as world market tonnages have been earmarked by the industry as the primary
feedstock pool for ethanol and thereby biofuel and biochemical production.
Requests by the industry for adjustments to the tariff triggering mechanism itself (aside from the tariff)
to make it more responsive have also been unsuccessful. A more responsive tariff mechanism would
entail faster triggering and a revised exchange rate calculation, thus rendering the import window less
viable for importers.10 In the case of the sugar industry, government has greater leeway to legitimately
intervene both in terms of tariffs and diversification, given world market distortions and the adoption
of diversification globally.
The industry expects the 2017/18 imported sugar surge to work itself out of the domestic market only
towards the end of 2019. To partially reduce the impact of imports in recent years, the industry has
paid hundreds of millions of rand a year in rebates to sugar users to encourage the continued use of
domestic sugar, in order to minimise displacement of sugar to the lower priced world market.
The attractiveness of the local (SACU) market has risen for exporters like Brazil and other developing
states due to recent surpluses on the world market and reforms to the EU’s Common Agricultural
Policy, which have decreased the profitability of the EU market considerably for developing country
exporters. Ironically, these EU changes came at the same time as South African producers had finally
secured access to the EU market in 2017 through the SADC-EPA process. The EU market reforms thus
removed this market as a potential alternative source of demand. Tongaat Hulett has responded by
targeting higher-value speciality sugar sales to the EU (and brown sugar sales to less well supplied
10 Proposals include shortening the number of days needed to trigger the tariff from 20 to 10.
36
sub-regions of the EU) while Illovo has deployed an alternative strategy by refocusing on sales to
African markets, decreasing its EU exports from 23% of total sales in 2013 to 9% in 2017.
As equitable multilateral agricultural liberalisation under the Doha Round still appears to be a distant
outcome,11 diversification could be valuable in accommodating the needs of industry and government
with surplus displacement and the perennial problem of lower-priced exports, in that the introduction
of diversification options for the industry would create new sources of demand, which should
dramatically reduce the need for the industry to export sugar to the world market. For example, if
sugar is diverted to ethanol production, less sugar will enter the market and industry production size
can be maintained while minimising exposure to the world market.
eSwatini sales on the SACU market
The matter of eSwatini imports has a bearing on the industry’s sustainability. For decades, the South
African and Swazi sugar industries have been locked in dispute over the unequal treatment of sugar
within the Customs Union. This has long been a source of contention between the two producers,
because South African sugar does not allegedly enjoy the same access to the eSwatini market, even
though the SACU agreement as a Customs Union agreement provides for the unhindered tariff free
movement of domestic products (Conningarth Economists, 2013b). However, the South African sugar
industry argues that there is a lack of sugar policy harmonisation between South Africa and eSwatini
in three key areas: eSwatini applies import and export controls to sugar; its marketing arrangements
are not subject to competition laws; and that the country enjoys non-reciprocal access to the SACU
sugar market.
Swazi sugar therefore enjoys unequal access within SACU and, at fractious times in the relationship
between the industries, the Swazi industry has threatened to significantly increase the tonnage it
exports to the SACU market. If implemented within one season, this would in effect be almost as
damaging as the recent 2017/18 world market import surge. This means the sustainability of the South
African industry in respect of Swazi sales rests on goodwill rather than a binding agreement. Various
efforts to secure agreement between the two industries and governments have been unsuccessful.
The average tonnages of Swazi sugar are substantial, averaging 400 000 tons a year.
4.2.3 Health-related legislation
In April 2018, the South African government introduced a Health Promotion Levy or “sugar tax” aimed
at reducing sugar consumption, so as to address health concerns around linkages between the
11 There is a school of thought which feels that when South Africa reintegrated into the world economy in the 1990s it deregulated its economy too quickly and with too much emphasis on good faith and unilateral action. Related to this, it acceded to pressure to self-identify as a developed country under the then newly established WTO. When the Doha Round did not conclude the country was then left more deregulated than many of its peers and limited by its WTO commitments.

37
consumption of sugar and various lifestyle diseases lifestyle diseases.12 South Africa has the highest
level of obesity in Sub-Saharan Africa.
A tax on sweetened beverage is a key entry point, given that in many countries these beverages, on
their own, account for sizeable percentage of daily sugar intake. South Africa’s figure is 28 kilocalories
(kcal) sold per capita per day from sweetened beverages. In comparison, the US with its obesity
problem is on 38kcal/day and Australia with a similar obesity problem is on 32kcal/day. In Australia,
sweetened beverages comprise 45% of free sugar annually consumed from various products.
By end 2018, the tax, fixed at 2.1c/g of sugar content exceeding 4g/100ml contributed R2.3 billion in
revenue for the fiscus. The tax was increased by 10% in the February 2019 Budget. South Africa is not
unique in this regard. Globally, similar initiatives to reduce sugar consumption are spreading (more
than 30 countries have enacted them), with the sugar sector under increasing pressure. For example,
Thailand is one of the world’s largest sugar producers but introduced a similar sugar tax in 2016. The
research has been vigorously debated by health advocates and the sugar industry,13 but a growing
body of evidence is emerging that emphasises responsible consumption of sugar as part of a healthy
diet.14 The World Health Organization accordingly set guidelines in 2015 for maximum proposed
consumption of sugar.
This has impacted sugar markets in Europe and other high-income countries, but it is clear that
consumption trends in low- and middle-income countries are mimicking the history of the developed
world, i.e. as incomes rise, so diets change and consumption of sugar and processed products
containing sugar increases. However, with the increasing evidence of the public health costs of
neglecting lifestyle diseases, sugar and related downstream industries globally are coming under
increasing pressure as governments move to regulate sugar consumption as part of public health cost
containment. The International Sugar Organization (ISO) now alerts members to developments in this
regard annually, as it exists to administer the 1992 International Sugar Agreement, one of the
objectives of which is to encourage increased demand for sugar (ISO, n.d.).
Given the variances in per capita consumption between the developed and developing worlds, and
the spread of developed country dietary choices, this trend may not have a significant impact on global
sugar exports in the near future. However, domestic sales in maturing markets such as South Africa
may experience a softening in demand. It can be expected therefore that South African sugar
exporters will increasingly target developing, and specifically African markets, to secure growth for
shareholders, especially in the absence of diversification options.
12 Sugar has been linked to further health problems such as auto-immune disease. 13 Multiple studies conducted in Mexico conclude that sales are going down. It is estimated that the tax will prevent at least 189 300 cases of type 2 diabetes and 20 400 cases of stroke and heart attacks, as well as 18 900 premature deaths over a decade. Health campaigners in Mexico are now working to double the 10 percent tax (Sydney Herald, 2018). 14 The industry through SASA maintains an active nutrition awareness programme and supports nutrition research through an independent panel of scientists that considers research project proposals from local institutions. The selected projects
are then 100% industry funded.

38
Table 10: World sugar consumption, 2012/13-2017/18
GEOGRAPHICAL DISTRIBUTION OF WORLD SUGAR CONSUMPTION Total consumption (in 1 000 tonnes, tel quel)
2017/18 2016/17 2015/16 2014/15 2013/14 2012/13
Western and Central Europe 17,874 18,044 18,955 18,146 20,444 18,678
Eastern Europe and CIS 10,328 10,252 10,198 10,142 10,091 10,255
North America 16,185 16,02 15,674 15,579 14,989 14,999
Central America and Caribbean 3,6413 0,569 3,4913 0,406 3,3623 0,298
South America 18,937 18,836 18,631 18,542 19,106 19,601
Middle East and North Africa 19,221 18,760 18,083 17,762 17,366 17,508
Far East and Oceania 39,495 38,450 37,501 36,896 35,933 34,849
Indian Subcontinent 34,190 33,360 32,648 33,243 31,593 30,031
Equatorial and southern Africa 10,952 10,544 10,201 9,8369 0,282 9,532
WORLD 174,664 171,633 169,223 165,938 165,491 163,708
5-year
Annual growth rate in % Average
Western and Central Europe -0.94 4.81 4.46 -11.24 9.45 -0.71
Eastern Europe and CIS 0.74 0.53 0.55 0.51 -1.60 0.03
North America 1.03 2.21 0.61 3.94 -0.07 1.35
Central America and Caribbean 2.02 2.23 2.50 1.31 1.94 2.11
South America 0.54 1.10 0.48 -2.95 2.53 -0.54
Middle East and North Africa 2.46 3.74 1.81 2.28 -0.81 2.03
Far East and Oceania 2.72 2.53 1.64 2.68 3.11 2.67
Indian Subcontinent 2.49 2.18 -1.795 .225 .20 2.50
Equatorial and southern Africa 3.87 3.36 3.71 2.97 -2.62 4.39
WORLD 1.77 1.42 1.98 0.27 1.09 1.68 Source: SADC Sugar Digest, 2017
The South African industry has pushed back, claiming in early 2019 that the impact of the sugar tax
has been severe, with losses estimated by SASA at R925-million for the 2018/19 season since the tax
was implemented in April 2018, and warning of the loss of 6 500 cane growing jobs if it is not
rescinded. In response, National Treasury noted the tax had just been introduced and would not be
shelved. The industry maintains that the tax’s positive impact on obesity is questionable. It notes that
soft-drink manufacturers’ reduction in bottle sizes and the sugar content of their products has led to
a drop in the demand for sugar. Coca-Cola, for example, cut the sugar content in its beverages by 20%
across all brands apparently as a result of the tax. The industry maintains the tax has led to demand
drop of around 200 000 tons a year or 9% of production. The introduction of the tax, however, came
during a period when demand for domestically produced sugar was being simultaneously impacted
by a surge in imported sugar. Thus, it is not a drop in production, but a drop in domestic market sales.
The tonnages may have been redirected to exports, as exports increased by just over 140 000 tons
during the same period. It is not clear if the diversion was a result of imported sugar or the tax. With
imports now lower due to the increased tariff, data for the 2019/2020 season should provide clarity.
Diversification could accommodate the needs of industry and government for the health tax, in that
introducing diversification options for the industry would create new sources of demand which could
offset any drop in demand resulting from the health tax. For example, if sugar is diverted to ethanol
production, this will absorb any unsold sugar tonnages that may potentially be linked to the imposition
of the tax. To support the rollout of diversification and reduce the burden on the fiscus of such

39
support, it has been suggested that the roughly R1.5 billion, which could be raised annually through
the tax, could be diverted to implementing diversification.
4.2.4 Land reform
The subject of land reform in this industry touches on sustainability because of the interdependence
of growing and milling operations. Land reform itself is not disputed by the industry. Since 1996, it has
been at the forefront of proactive land reform within South African agriculture. The total hectares of
freehold land under commercial sugar cane production transferred from white growers to black
growers now stands at 22%, or more than 74 600 hectares. A further almost 39% of area under cane
is the subject of land claims, meaning that 61% of cane farms would eventually have changed hands.
What has been flagged is the need to ensure consistent cane supply within mill areas so the capacity
utilisation of mills does not fall below viable levels. As in other agricultural sectors, support for
emerging farmers is key to the success of land reform. This industry has perhaps the greatest likelihood
of successfully implementing land reform of any sector due to its institutional strength and the
experience gained from years of extensive small-scale grower support. The largely self-funded nature
of the industry’s grower support initiatives is a further source of strength. It is possible the industry
can provide a workable model for land reform that does not yet fully exist in other agricultural sectors.
Most emerging farmers nationally enter their respective agricultural sectors with high levels of debt
or gearing. In the sugar sector, this provides an incentive for creating additional revenue streams
through diversification. At the same time, emerging sugar farmers are often the first casualties when
returns are affected by import surges and subsequent tonnage displacement to the lower-priced
world market. The industry is partnering with government to minimise risk to sustainability from land
reform. SASA entered into a MoU with the Regional Land Claims Commission in 2015 to confirm Joint
Annual Plans and processes for the sustainable transfer of land (Sugar Industry Directory, 2019b).
4.2.5 Drought
The recent multi-year drought was the worst in 100 years and largely responsible for the decrease in
production from 2.3 million tons of sugar in the 2013/14 season to 1.5 million tons in the 2016/17
season. The drought continued for the most of 2016, ending with even the irrigated regions coming
under pressure due to water restrictions affecting final production. By the end of 2016, the dry land
production areas benefitted from summer rains, leading to an overall improvement in conditions
(SA Canegrowers, 2017). Although the drought has ended, the industry has been left more vulnerable
to other shocks as mill viability was negatively impacted by the drought.
4.2.6 Growing costs
Sugarcane growers are price takers. The only variable they can partially influence is crop quality.
Payment is made in the basis of recoverable value. Crop choices are inflexible and sugar cane ratoons
must mature for up to seven years before they produce an effective harvest. They therefore have very
low ability to absorb price shocks. Resources cannot be easily switched either as all (labour, energy,
chemicals) are part of the growth and harvesting of the crop (CaneGrowers, 2017). The largest input
costs (energy, fertiliser, labour, fuel) are also those which are prone to regular increases. These four
items alone accounted for 61% of irrigated farming costs in 2017. Cost escalations, revenue pressure
from subsidised imports, and inflexible mill supply contracts have been blamed for the ongoing
decreases in grower numbers over the last past decades.
40
5. APPROACHES TO THE SUSTAINABILITY OF THE INDUSTRY
This study proposes that the full use of the sugarcane stalk, through an integrated sugarcane value
chain that incorporates cogenerated electricity and fuel ethanol, is the most likely path to increased
long-term sustainability of the industry. Although the key challenges to the industry outlined in the
previous section are impacting its sustainability and need to be addressed or taken into account, it is
the absence of a diversified business model that is the greatest threat to the survival of the industry
as a key industrial and agro-processing asset. The three broad approaches to diversification that are
in evidence globally are outlined in the following subsectors together with estimates of their impact.
In essence, co-generation, bio-fuels and chemical by-products are value addition approaches, with
cogeneration adding value to bagasse, and ethanol and biochemicals adding value to export sugar
(Sugar Industry Directory, 2019b). Government support for such diversification is evident in the
mandate of the recently appointed Sugar Industry Task Team and the statements made by ITAC as
part of its 2018 increase to the tariff for sugar (ITAC, 2018).
5.1 Power co-generation from bagasse
All sugar mills in South Africa are energy self-sufficient. For decades, the mills have burnt bagasse, the
waste product left over after sugar production, to fire their boilers. This arose ironically from the need
to dispose of mountains of bagasse. Oil is used only to restart boilers at the beginning of each season.
Because the objective has always been to dispose of bagasse, the objective has not been efficiency,
which means there is room to greatly increase this electricity production and export it to the national
grid. The industry estimates it can contribute approximately 700-800 MW of electricity capacity to the
national grid through co-generation projects, with a suitable tariff and policy framework in place.
Plant investment
Most sugarcane mills around the globe have similarly achieved energy self-sufficiency for their sugar
manufacturing requirements and can also generate a small amount of exportable electricity. But
regulatory or grid connection constraints are not the only ones that must be overcome. In most cases,
the existing equipment, such as low-pressure boilers and alternators, will not provide sufficient and/or
reliable enough electricity production for export to the grid (Zafar, 2020a).
Revamping the mill boiler house by investing in higher pressure boilers and more advanced turbines,
such as condensing extraction steam turbines, is usually necessary to substantially increase the level
of exportable electricity. This is evident in Mauritius where, following major investment in processing
configurations, the exportable electricity from relevant sugar factories increased from around 30-
40 kWh to around 100-140 kWh per ton cane crushed. In Brazil, many of the sugar mills are upgrading
their boiler configurations to 42 bars or even up to 67 bars.
A few co-generation technology options are available. The most common technology for sugar mill
cogeneration is a conventional steam-Rankine cycle design for conversion of fuel (in this case bagasse)
into electricity. A combination of stored and fresh bagasse is fed to a specially-designed furnace to
generate steam in a boiler at typical pressures and temperatures of usually more than 40 bars and
440°C respectively (Zafar, 2018). The excess power generated in the turbine generator is then stepped

41
up to extra high voltage of 66/110/220 kV, depending on the nearby substation configuration and fed
into the power grid. With the sugar industry operating seasonally, such boilers are further normally
designed for multi-fuel operations (mill bagasse, purchased bagasse/biomass, coal and fossil fuel, to
ensure an uninterrupted year-round operation of the power plant for export to the grid.
Modern boilers use much higher pressures, up to 87 bars or more. Higher pressure usually generates
more power with the same quantity of bagasse or similar biomass fuel. These boilers are less common,
even in countries with established sugar sector diversification. For example, sugar mill cogeneration
plants in India commonly function at 67 bars pressure and 495°C configuration. Extra high pressure at
87 bars and 510°C, as found in Mauritius, is now the trend and several projects are operating in India
and Brazil. The average increase of exportable power from 40 bars to 60 bars to 80 bars stages is
usually in the range of 7% to 10% per stage.
Cogeneration was not historically pursued in South Africa because of surplus capacity from Eskom
before 2008 as well as the relatively low cost of coal. However, the electricity shortage from 2008 and
the 2015 load shedding reignited interest in alternative energy sources. The Renewable Energy
Independent Power Producer Procurement (REIPPP) Programme, introduced in 2011, aimed to
incentivise private entities to invest in renewable energy projects that would sell electricity to Eskom
(Montmasson-Clair, 2017).
The third bid window of the REIPPP led to the first sugar biomass project in South Africa, called Mkuze.
The project, located in Mkuze in northeast KwaZulu-Natal, will generate power by burning bagasse as
well as the sugarcane tops and trash. It should generate 118 GWh a year (enough to serve an
estimated 40 000 households).
The South African industry estimated in 2013 that an amount of R20 billion would be required to
upgrade its plants to produce 800 MW. In addition, the 14 sugar mills would potentially require at
least R2.47-a-kilowatt hour as a minimum feed-in tariff to offset the needed capital investment to
upgrade their operations (SADC Sugar Digest, 2018). At present, Eskom is offering less than R1 for a
kilowatt hour.
Impacts
Electricity sales would support the financial sustainability of the industry but also support
transformation and black economic empowerment in the value chain, through for example
construction and operation of the cogeneration power station, ownership in the new cogeneration
power station business entity/special purpose vehicle, procurement of additional sugarcane leaves
and residues from (mainly female) black growers, logistics for the transport of sugarcane leaves,
and additional jobs in sugarcane agriculture if green cane harvesting is adopted to boost the new
revenue stream.
Existing bagasse-based cogeneration already provides benefits to the industry and country – the mills
are energy self-sufficient; it removes the need for transporting and disposing of the bagasse; boiler
energy from bagasse generates less greenhouse gas emissions than conventional fossil-fuel
generation; and if bagasse was left to rot, it would break down and release greenhouse gases,
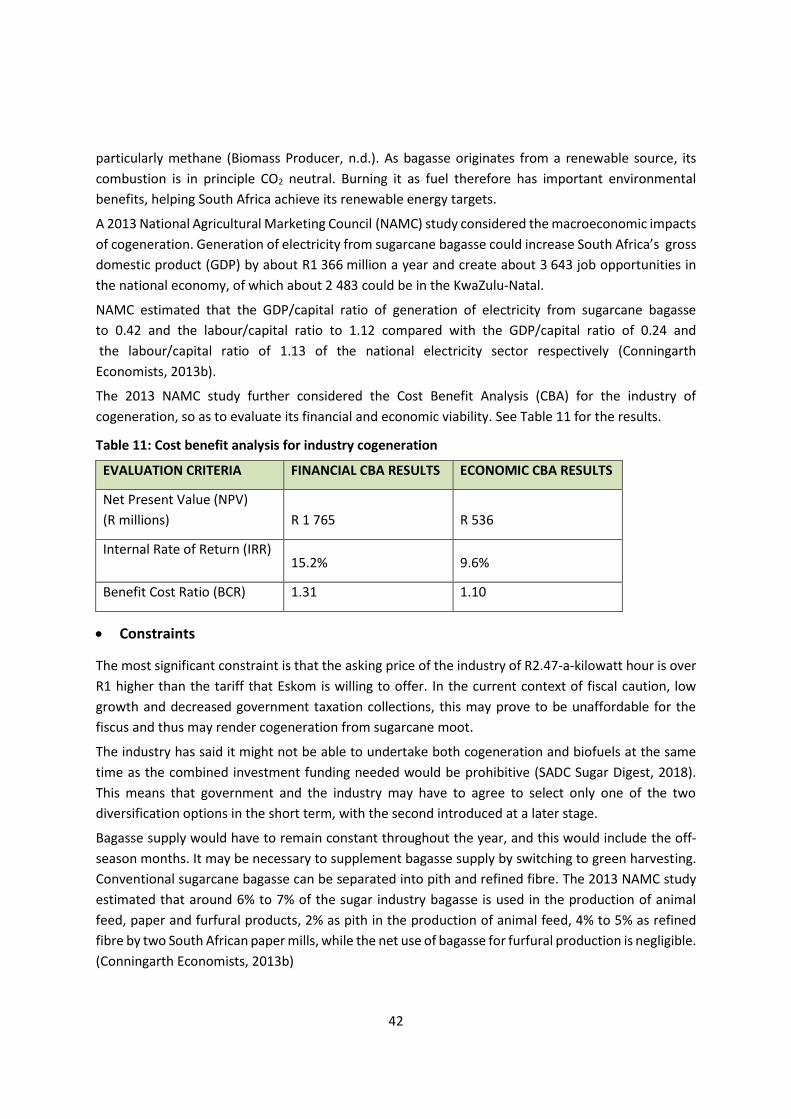
42
particularly methane (Biomass Producer, n.d.). As bagasse originates from a renewable source, its
combustion is in principle CO2 neutral. Burning it as fuel therefore has important environmental
benefits, helping South Africa achieve its renewable energy targets.
A 2013 National Agricultural Marketing Council (NAMC) study considered the macroeconomic impacts
of cogeneration. Generation of electricity from sugarcane bagasse could increase South Africa’s gross
domestic product (GDP) by about R1 366 million a year and create about 3 643 job opportunities in
the national economy, of which about 2 483 could be in the KwaZulu-Natal.
NAMC estimated that the GDP/capital ratio of generation of electricity from sugarcane bagasse
to 0.42 and the labour/capital ratio to 1.12 compared with the GDP/capital ratio of 0.24 and
the labour/capital ratio of 1.13 of the national electricity sector respectively (Conningarth
Economists, 2013b).
The 2013 NAMC study further considered the Cost Benefit Analysis (CBA) for the industry of
cogeneration, so as to evaluate its financial and economic viability. See Table 11 for the results.
Table 11: Cost benefit analysis for industry cogeneration
EVALUATION CRITERIA FINANCIAL CBA RESULTS ECONOMIC CBA RESULTS
Net Present Value (NPV)
(R millions) R 1 765 R 536
Internal Rate of Return (IRR) 15.2% 9.6%
Benefit Cost Ratio (BCR) 1.31 1.10
• Constraints
The most significant constraint is that the asking price of the industry of R2.47-a-kilowatt hour is over
R1 higher than the tariff that Eskom is willing to offer. In the current context of fiscal caution, low
growth and decreased government taxation collections, this may prove to be unaffordable for the
fiscus and thus may render cogeneration from sugarcane moot.
The industry has said it might not be able to undertake both cogeneration and biofuels at the same
time as the combined investment funding needed would be prohibitive (SADC Sugar Digest, 2018).
This means that government and the industry may have to agree to select only one of the two
diversification options in the short term, with the second introduced at a later stage.
Bagasse supply would have to remain constant throughout the year, and this would include the off-
season months. It may be necessary to supplement bagasse supply by switching to green harvesting.
Conventional sugarcane bagasse can be separated into pith and refined fibre. The 2013 NAMC study
estimated that around 6% to 7% of the sugar industry bagasse is used in the production of animal
feed, paper and furfural products, 2% as pith in the production of animal feed, 4% to 5% as refined
fibre by two South African paper mills, while the net use of bagasse for furfural production is negligible.
(Conningarth Economists, 2013b)

43
In terms of cost to fiscus, if the industry were to follow the path successfully used by South Africa’s
renewable procurement programme, cogeneration would need to be supported by an initial feed in
tariff. This cost could theoretically be calculated by taking the difference per kWh between the
industry’s expectation and Eskom’s offers and multiplying that by the estimated total average
constant grid supply of the industry.
5.2 Biofuel production
The International Sugar Organisation, which remains the largest commodity-based organisation in the
world, representing the great majority of global producers, estimates that world consumption of
petrol for fuel should rise from the current 1.3 trillion litres to 1.4 trillion litres by 2020, and ethanol
for fuel use in 2020 would reach an estimated worldwide average blending rate of 10 percent to
11 percent, almost doubling from 2013’s level (Braude, 2015). The number of countries engaged in
commercial ethanol production jumped from 10 in 2002 to just over 60 in 2013. In terms of feedstock
use for fuel ethanol, sugarcane comprised 59% of total global feedstock use in 2012. The remainder
came from grains, sugar beet, whey, raw alcohol and cassava chips. Fuel ethanol from sugar is a first-
generation biofuel. It can be used in low-percentage blends with conventional fuels in most vehicles
and can be distributed through existing infrastructure. “Flex-fuel” vehicles which can handle a blend
of petrol and ethanol or petrol alone are also available, like in Brazil’s biofuels fleet.
Why sugarcane as a feedstock? Sugarcane is one of the most energy efficient biofuel crops known,
exceeding the yield of palm oil, sorghum and jatropha. One ton of sugarcane produces 80 litres of
ethanol, equivalent to 1.2 barrels of oil. Sucrose extracted from sugarcane accounts for little more
than 30% of the chemical energy stored in the mature plant, while 35% resides in the leaves and stem
tips, which are left in the fields during harvest, and 35% in the fibrous material (bagasse).
Table 12: Comparison of bio-fuel yields
CROP SEED YIELD
(T/HA)
CROP YIELD
(T/HA)
BIOFUEL YIELD
(LITRE/HA)
ENERGY YIELD
(GJ/HA)
Sugarcane (juice) 100 7500 157.5
Palm oil 9800 70 3000 105.0
Sweet sorghum 60 4200 88.2
Maize 7 2500 52.5
Jatropha 740 700 24.5
Soybean 480 500 17.5
Source: Johnson, 2007
Ethanol from cane also has a lower capital cost requirement than fuel from an oil refinery or even a
gas-to-liquids plant. See Table 13.

44
Table 13: Ethanol’s capital competitiveness
OIL REFINERY GTL ETHANOL PLANT
CAPITAL COSTS IN RAND PER LITRE
Plant and equipment costs 15 40 10
Infrastructure costs 4 4 5
Exploration 15 10 0
Agriculture 0 0 5
Total costs 34 54 20
Source: Fechter, 2012
Ethanol is created during the sugar production process when a portion of the sugar is diverted to
manufacture ethanol, although ethanol can also be produced from molasses. Fuel ethanol production
is based on three process steps: fermentation, distillation and dehydration. First, fermentable sugars
are converted into ethanol and CO2, resulting in an impure solution that has an ethanol concentration
of about 10%. Second, the ethanol solution is purified and concentrated by distillation to produce a
96% ethanol-water mixture. The last step in the fuel ethanol production is removing the water from
the ethanol-water mixture, producing a 99.9% dehydrated alcohol product (SADC Sugar Digest, 2018).
South Africa has already established technical quality standards for bioethanol and biodiesel, based
on international standards.
An equipped mill can even switch production to a limited extent between sugar and ethanol output,
within a single season. For example, most of Brazil’s mills have the capacity to switch between 5% and
10% of their milling capacity between sugar and ethanol production in response to market prices
within the year. It would allow South African millers to make seasonal decisions on product mix to
maximise profitability. This flexibility could be key to a marginal mill’s viability.
South Africa has the largest domestic fuel market in SADC. Crude oil is the largest import item for the
country at R27 billion for the first quarter of 2019. South Africa has significant refining capacity but
still imports refined petrol and diesel. The recent electricity problems saw the import bill of diesel rise
to R11.5 billion in the first quarter of 2019.
Total market demand is estimated to be between 10 and 11 billion litres per annum. The South African
industry estimates its mills are capable of supplying between 5%-8% of the domestic fuel pool. That
means South Africa’s sugar industry believes it can supply sufficient ethanol to support a blend of
between E5 and at maximum E8, from existing surplus sugars alone, if a mandatory blend ratio is
implemented. Primary feedstock for this would be the export sugar which is currently sent to the
world market. This has the added benefits of neatly eliminating exposure to the distorted world
market while not undermining food security nationally. This would imply an equivalent supply of
between 720 to 960 million litres of fuel from ethanol. Allowing for expansion of the domestic industry
through new estates and dedicated ethanol, mills could boost this to 9% of domestic fuel demand
(Fechter, 2012).

45
Second-generation fuels
The much-hyped second-generation or cellulosic biofuels (derived from grasses and non-traditional
feedstocks or crop residues such as bagasse) are still, however, unable to achieve economies of scale15
even after years of research, but could play a significant role in future. If the technology matures, it
could prove to be a boon for the biofuel sector, and the experience and investments undertaken for
first-generation fuels could be leveraged to reduce production costs.16 Second-generation fuels have
the further advantage of reducing the impact of biofuels on food production and decreasing
greenhouse gas emissions, although because bagasse is an existing by-product of sugarcane
production its use in biofuel production has less impact on food production when it is utilised from
existing sugarcane crops.
The contribution of second-generation fuels could be substantial. For example, it is estimated that
20% of national crop residues17 could offset between 25% of Thai petrol consumption and 6%-15% of
the country’s diesel consumption (Kumar et al, 2013), and in the case of Kenya, 13%-35% of petrol and
6%-15% of diesel. Second-generation fuels can also utilise tops and trash. Research undertaken in
South Africa supports this and investigates efficient and cheaper pre-treatment methods of
lignocellulosic sugarcane leaves and tops for the extraction of biofuels (Dodo et al, 2017).
A SADC ethanol market
Within the SADC region, an integrated bio-fuel market is further possible, with significant regional
employment, import savings and industrial localisation multipliers. The key South African sugar
multinationals are therefore considering additional investment to support diversification in their
regional operations. It is calculated that between 50% and 60% of new SADC petrol requirements over
the next 18-20 years, including growth, could be met using only between 3% and 6% of the available
cropland and 8 000-10 000 MW electricity could be generated, equivalent to 16%-20% of 2011
required capacity. This would require 120 sugar mills with a production capacity of 320 000 tons each
per year. It is estimated that a remarkable three million direct jobs (1.8 million permanent) and four
to six million indirect jobs could be created in SADC through the expansions in sugar production and
diversification. Further benefits for SADC include that it would address the regional power deficit,
retain and generate jobs, and could be brought online relatively quickly. Around R70 billion a year
15 The major cost components in bioethanol production from lignocellulosic biomass are the pre-treatment and the enzymatic hydrolysis steps. Optimising these two important steps, which comprise about 70% of the total processing cost, are the major challenges in the commercialisation of bioethanol from second-generation feedstock (Zafar, 2019) 16 Interestingly, a 2008 Australian study found that biodiesel production from hydrothermal liquefaction of bagasse and production of pulp and lignin in a biorefinery using bagasse were also financially viable products, with internal rates of return in the order of 13%-35%. Supplementation of the feedstock with trash improved the expected returns (Biomass Producer, n.a.). 17 Limiting it to 20% takes into account competing uses of crop residues including as animal fodder, soil nutrient and integrity and cooking fuel.
46
would be added to the rural economy of SADC. This would have positive implications for regional
migration and consumer markets, both of which are of importance to South Africa. Development of
renewable energy on a regional scale would also spur large-scale industrialisation, beneficiation and
component fabrication in SADC and related large-scale training in farming and management skills.
If such regional investments prove viable, the percentage of domestic South African fuel substitution
could be boosted, with South Africa forming the anchor market, importing ethanol from SADC
countries that have large cane supplies but small fuel markets. South Africa would obtain additional
benefit from such a model, as much of the investment in regional ethanol production would come
from South African multinationals, aiming to supply ethanol back to South Africa. Under this scenario,
some production would be for local markets in the rest of SADC and some for export to South Africa.
The fuel market size in South Africa would leave more than sufficient space for such market access by
regional fuel ethanol suppliers and other regulated local feedstocks, especially if the state increases
the mandatory blending rate to a higher number, e.g. E25 or even E50. The price of imported ethanol
would, of course, have to be competitive with imported refined fuels and, at higher levels of blending,
it is possible that refinery and pipeline infrastructure might need adjusting, although independent
research would be needed to establish this.
Bio jetfuel
South African mills could also produce aviation biofuel or bio jetfuel. The aviation industry is under
significant pressure to reduce its carbon footprint, as the industry accounts for around 2% of all GHG
emissions (2016 figures) and this has doubled over the past 20 years. The overall market for aviation
fuel is expected to grow by between 1.5%-3% every year over the next decade. Sugarcane’s suitability
as a vehicle biofuel feedstock makes it similarly viable as a feedstock for the production of bio aviation
fuel. Bio-butanol is another potential product for the bio-refinery. It is an alcohol which has potential
as a biofuel and at the same time as a bio-chemical in making paints, coatings and solvents. Ethanol is
already in use as cooking gel in many developing countries. The potential demand is equivalent to the
current use of wood for fuel.
The 2007, the Department of Minerals and Energy proposed a 2% penetration level of biofuels in the
national liquid fuel supply, or 400 million litres per annum. The strategy proposed the use of sugar
cane and sugar beet for production of bioethanol, and sunflower, canola and soya beans for the
production of biodiesel. In 2014, the Department of Energy confirmed this by indicating that it would
require that all liquid fuel include 2% biofuels and impose a levy to help fund the biofuels industry.
Regulations to activate this are currently before cabinet.
However, relevant regulations have been delayed, although they were scheduled to go to Cabinet by
mid-2019. SASA has said that it will wait for the government to commit to subsidies before it promotes
bioethanol production. In addition to the exemption from fuel taxes, sugar cane producers have noted
that they would require funding support to add distilleries to existing sugar mills. The industry would
like a guaranteed minimum selling price for bioethanol of 95% of the basic fuel price. It can be noted
that the low blend ratio and nature of the bioethanol to be produced should not impose significant
re-tooling costs on petroleum refineries and petrol stations.

47
Impacts
In a 2013 study on the possible impact of producing ethanol by the industry, NAMC estimated that
ethanol production would increase the South African GDP by about R1.2 billion per annum and create
about 8 884 job opportunities in the national economy, of which 7 655 would be in the KwaZulu-Natal
economy. More than 4 000 jobs of the total number of jobs would be from cane growing. If it is only
a diversion from the production of sugar to ethanol, these 4 000 jobs would not count as they exist
already. The figures for macroeconomic impacts reflect the ultimate or total outcome, i.e. through the
direct, indirect and induced linkages of the project (Conningarth Economists, 2013b).
Electricity generation will strengthen the sustainability of the overall industry and in particular the
most vulnerable stakeholders of the industry – small-scale and emerging black farmers – through
improving returns to the industry.
With the efficient use of scarce capital, the production of ethanol from sugarcane was estimated at
slightly less efficient than the average for the total economy, as far as GDP and labour are concerned,
but much higher in terms of household income. The GDP/capital ratio of such an ethanol plant was
estimated at 0.31 compared to 0.45 of the total for South Africa (2012 data). The labour/capital ratio
for the ethanol plant was 2.21 and that of the national economy 2.94. For low-income households, it
was calculated to provide 18.6% of total household income in the production of ethanol from sugar
cane compared to 16.2% for the entire South African economy.
The study further considered the Cost Benefit Analysis (CBA) for the industry of the alternative use for
sugar to evaluate the financial and economic viability of a project to produce ethanol. (See Table 14).
Table 14: Cost benefit analysis for the alternative use for sugar
Evaluation Criteria Financial CBA Results Economic CBA Results
Net Present Value (NPV) (R millions) -R435 -R569
Internal Rate of Return (IRR) 8,34% 4,1%
Benefit Cost Ratio (BCR) 0.94 0.90
In South Africa, it is estimated that manufacturing and services worth between R20 and R30 billion
would be procured by the industry to support the building of ethanol plants, with the bulk of it ordered
from domestic suppliers (Braude, 2015).
Using ethanol also contributes to lower carbon emissions. Estimates from 2015 were that between
15% and 35% of South Africa’s climate change commitments could be met just through renewable
energy derived from sugarcane production. Ethanol projects may also be eligible under global carbon
offset schemes.
Most states that import refined transport fuels would want increased domestic fuel refining but
cannot afford it. South Africa is no exception. Biofuel plants together may approximate some of the
output of a refinery, but at a potentially lower capex cost and with a renewable resource.
The cogenerated electricity from the mills would further be well suited to South Africa and regional
electricity demand because the sugarcane season matches peak winter demand in the region, and
power would be available during the dry season when hydro power can be unreliable.

48
Constraints
A major variable in cost calculations for investment in equipping mills to produce ethanol is the price
of oil. The difference at the pump between ethanol and petrol cannot be substantial as subsidies
would not be able to close this gap and, in South Africa’s case, the country is faced with a range of
pressing demands on the government fiscus already. Any volatility in the global oil price would
therefore be a cause for concern during the implementation of a biofuels programme. In addition,
the recent discovery of deep water gas condensate off the east coast of the country could impact fuel
prices, although the product is not traditional crude oil.18
The concern with petrol price weakness is that it could limit periods within which ethanol would be
reasonably competitive at current imported oil prices. Sugar industries are traditionally reluctant to
commit funding to large-scale energy investments without a guaranteed price for an extended period
of time. This could expose government to additional subsidy costs.
The 2013 study by NAMC estimated that at a fixed world sugar price of US$ 2.5 cents per pound (July
2012 prices) and a world crude oil price of US$120, the production of ethanol from sugar could become
a profitable venture. However, below that it was uncertain, and at any world market or export sugar
price that was below the operating cost of growers, a new greenfields mill would not be viable enough
to establish the sugarcane supply. A 2017 study by the Kohler, however, estimated that South African
bioethanol production is financially viable at US$102 per barrel. This is based on estimates
that producers typically pay the equivalent of US$67 per barrel for sugar cane feedstock, incur
approximately US$20 per barrel on operating and maintenance costs and require the equivalent of
US$15 per barrel to recoup capital investments and secure a sustainable level of retained earnings
(Kohler, 2017).
A physical constraint on production volumes would be the industry’s desire to meet the local market
sugar demand requirements. The industry would be loath to divert sugar meant for local market
consumption as this would create space for increased imports and, if the ethanol prices were to fall,
the switch back to sugar would not be as straightforward as it is in Brazil, as market share would have
been lost. Even currently, the industry has to provide incentives to local industrial users to retain
market share against lower-priced subsidised imports. This means that the industry’s available
opportunity cost sugar may be limited to only its world market export tonnages plus any gained from
expansion in the area under cane.
Second-generation biofuel production, e.g. from bagasse, faces its own physical constraint, as it would
compete with existing bagasse use as boiler fuel and so feedstock quantities may be constrained.
Similarly, it should be borne in mind that if bagasse consumption is to be maximised for the purposes
of cogeneration, then the bagasse quantities available for second generation use may be limited,
18 The Brulpadda find, estimated at about one billion barrels, could be enough to supply South Africa’s refineries for almost four years. It is not oil but a gas condensate which is essentially a liquid form of natural gas.

49
although using the tops and trash/leaves of the cane may extend the feedstock available for second-
generation use, as existing boiler technology often cannot efficiently burn this residue.
Crucially, the industry has also noted that it might not in practice be able to undertake cogeneration
and biofuels initiatives simultaneously as the combined investment funding needed would be
prohibitive (SADC Sugar Digest, 2018). This means that government and the industry may have to
agree to select one of the two diversification options in the short term, with the second introduced at
a later stage once the first is bedded down.
A further constraint is cost to fiscus. If the industry is to follow the path successfully trod by Brazil and
others, biofuel would need to be supported at the pump until it is able to compete cost effectively
with fossil fuels. This support may be necessary for an extended period of time and would be impacted
by movements in the oil price which in turn impact petrol prices. A rough calculation of the support
needed can be made by estimating the discount at the pump. That is if ethanol is to be given a 5%
price advantage, then at a minimum government support would comprise the supplied fuel
production of the industry multiplied by 5% of the prevailing pump price. However, this need not
necessarily be direct fiscal support. It could be reductions in taxes and levies instead. Tanzania,
Mozambique and Zambia, for example, have prepared such incentives. Direct support in the form of
subsidies for plant capital expenditure may, however, be required. These costs would be offset by the
reduced oil import bill as the biofuel would have been made without oil. However, longer term, once
a market is established and matures, it should be possible to deregulate the ethanol market, through
progressively deregulating price and aspects of ethanol production to the point when ethanol must
retain price competitiveness against petrol to ensure demand.
The largest constraint to the development of a fuel-ethanol market outside of fiscal support remains
regulation. Tax incentives are not enough, as proven by the lack of response to the South African
government’s previous efforts. The existence of a regulatory framework for renewable fuel is all about
risk reduction and is an investment prerequisite for three key reasons.
• First, the boards of corporations would not approve the commitment of such resources without
the certainty provided by a regulatory framework. This is often perceived by national governments
as reluctance by the private sector to invest due to the lack of understanding of investment
processes. That is, in most cases, the boards would not even approve the pre-feasibility studies
without the regulatory certainty provided by regulation due to the cost of studies for such capital
intensive projects. This is because a project worth R2 billion could typically require a pre-feasibility
study costing between R50 to R80 million (Braude, 2015).
• Second, the existence of entrenched interests in domestic fuel markets often necessitates
negotiation and then regulation to make space for a market. Negotiation between established
fossil fuel producers, fuel distributors and renewable fuel producers, mediated by government, is
necessary to prepare for the entrance of such fuels into the market. This is followed by regulated
(mandatory) blending to ensure that the fuel companies proceed to blend such fuels
(Braude 2015).
• Third, it reduces volatility and price shocks to suppliers as they establish production. The local
market is a price taker for imported oil and related products and any regulation recognises the

50
fact that oil is traded in dollars, and that exchange rates play a role. In addition, the world sugar
price is itself volatile. Extending a pricing mechanism to biofuels would allow the state to control
these variables to a greater degree during the development of a national market and reduce risk,
thereby unlocking investment.
Investment financing for the establishment of ethanol production has been flagged as a potential
constraint, especially if the industry wishes to purse cogeneration at the same time. The cost of
establishing an ethanol plant is high, and overall cost would be higher if the plant is a greenfield plant
and not just a converted industrial alcohol facility. The cost would be higher still if supporting
greenfield sugarcane plantations must also be established (initial South African government
regulatory efforts stipulated that only greenfield production would be supported).
5.3 Biochemicals
Local bio-chemical production is a necessary pre-cursor to a bio-economy. Sugarcane is an eminently
suitable feedstock for producing polymers for so-called green plastics (SADC Sugar Digest, 2017). Such
production is already under way globally in some of the larger sugarcane growing industries like Brazil
and India, where production of partially bio-based polyethylene terephthalate (PET) is expected to
increase. Bio-plastics production capacity is growing. In 2016, it was estimated at 4.15 million tons.
World production capacity is expected to increase to 6.1 million tons by 2021. The dominant product
is packaging at 40%, with the remainder comprising consumer goods, construction, transportation and
the automotive sector products (SADC Sugar Digest, 2017).
A sugarcane plant can be used to create a surprising number of chemical sector inputs or feedstocks.
Once a mill starts producing ethanol, it opens up chemical feedstock possibilities, essentially creating
the foundation for the mill to transform into a bio-refinery. Some of these have been produced for a
number of years, such as fertiliser inputs, potable alcohol and industrial alcohols but the suite of
potential products is much larger. With such diverse potential, the SMRI has undertaken research into
the most economically attractive products or processes for bio-refining, so as to identify them at a
preliminary design stage.19 It is recommended that collaborative initial modelling be done to inform
specific bio-chemical policy choices.
The versatility of sugarcane as a bio-chemical feedstock is evidenced by the fact that bagasse itself can
be used as a feedstock. For example, it can be turned into a number of industrially-useful products by
19 See the SMRI’s Sugarcane Biorefinery Economic Analysis Toolbox (S-BEAT) and New Product Greenhouse toolbox. These fall broadly within the SMRI’s Sugarcane Technology Enabling Programme for Bioenergy (STEP-Bio), a public-private partnership between the South African sugarcane processing industry and the national Department of Science and Technology’s Sector Innovation Fund (SADC Sugar Digest, 2018).

51
separating the biomass into lignin, hemicellulose and cellulose, which can then be transformed into
various products by either chemical reactions or fermentations.20
Ethanol is the more well-known sugarcane derived base product. It is versatile and can be used to
produce ethanol gel for household cooking;21 bio-plastics (bio-degradable, plant based/non-
petroleum plastic for cutlery, packaging22, bottles23 and bags and even vehicle components); industrial
alcohol (for solvents); and potable alcohol (for human consumption).
Furfural is yet another potential bio-chemical output from the bio-refinery. It can be a biofuel or a
biochemical. It is an organic compound used widely as a solvent in petroleum refining, in the
production of phenolic resins, and in a variety of other applications. It can form a diesel substitute
produced from bagasse by steam distillation, water separation, and purification.
The astonishing variety of sugarcane biorefinery, biochemical products and extraction technologies is
further illustrated in Figure 18.
Figure 18: Sugarcane biorefinery, biochemical products and extraction technologies
20 A Brazilian study found that multi-walled carbon nanotubes were successfully generated by pyrolysis (process of chemically decomposing organic materials at high temperatures) of sugarcane bagasse. The pyrolysis process also demonstrated that small amounts of light hydrocarbons could be produced, including methane, acetylene, benzene, and ethylene (Alves et al, 2012). 21 One litre of ethanol can replace 2kg of charcoal. 22 In South Africa, Woolworths and Coca-Cola have started using a bio-based polymer packaging produced from Brazilian sugarcane. 23 Coca Cola International as part of product differentiation offers a 30% bio-based PET bottle.
52
Bioplastics
South Africa is a significant net importer of the type of polymers and monomers which could be
potentially produced from sugarcane, such as ethylene, which is a monomer used to produce
polyethylene. Sugarcane-derived ethanol is a suitable feedstock for the production of ethylene and
the resulting bio-polyethylene, specifically High Density Polyethylene (HDPE), is identical to that
produced from petrochemicals. This means current downstream production facilities could use it as a
replacement to petroleum-derived HDPE. Another potential bio-feedstock is polylactic acid (PLA), a
biodegradable polymer produced from lactic acid obtained through fermentation of carbohydrates
such as sucrose. PLA is a fairly new product in the South African market and is mainly used for the
production of packaging items and bottles.24 It is, however, not a drop-in but a competitor substitute
and would also require adjustments to downstream production facilities. Given the demand for plastic
polymers in Africa and globally, the potential exists for export as well.
Constraints
To function as an effective feedstock, sugarcane derived supply would need to be constant – across
and between seasons so that raw materials extracted from the cane allow for uninterrupted and cost-
effective production of bio-plastics (SADC Sugar Digest, 2017). This is further of importance because
the bio-plastics will be competing against a constant supply of petro-chemical based plastics. If local
market penetration cannot be easily achieved, there is the possibility of producing for export. In terms
of bagasse-derived products, this would mean sufficient quantities would need to be available, given
that bagasse is currently used as mill boiler fuel. Similarly, if bagasse consumption is to be maximised
for the purposes of cogeneration, then the bagasse quantities available for bio-chemical use may be
limited, although using the tops and trash/leaves of the cane may be possible as existing boiler
technology often cannot efficiently handle this residue.
Capital start-up costs would also impact the pricing of such bio-plastic products, perhaps placing them
at a disadvantage compared to petro-chemical plastic products. It is uncertain whether environmental
considerations or the labels of Proudly SA and “bio-plastic” will be sufficient to offset such pricing
differentials. It may be necessary to use import tariffs to incentivise and nurture production to reduce
risk as market share is established. In addition, as sugarcane based bio-plastics feedstock results from
both cane growing and sugar milling processes, both the growing and milling stages must be efficient
to contain the overall cost of the final feedstock.
24 A local firm, AirWater, announced in December 2018 that it will be manufacturing a 100% biodegradable bottle made from sugar cane. The manufacturing process involves sugarcane fibre and a polylactic acid, which guarantees the entire bottle, from the lid to the label, is biodegradable.

53
5.4 Biogas
Biogas is essentially renewable natural gas. It is produced through anaerobic digestion, which is a
natural biological process that stabilises biomass in the absence of air and transforms it into biogas,
leaving a nitrogen rich slurry that can be further sold for income as a biofertiliser. Biogas is typically
composed of 60% methane and 40% CO2. Each cubic meter (m3) of biogas contains the equivalent of
six kWh of calorific energy. Converting this biogas to electricity in a biopowered electric generator,
results in about two kWh of useable electricity, the rest turns into heat which can also be used for
heating applications. Two kWh is enough energy to power a 100W light bulb for 20 hours or a 2000W
hair dryer for one hour (Electrigaz, 2019).
Biogas production is a tried and tested process, with household level plants in Asia and Africa and a
focus in China and India on installing larger plants for electricity and heat applications. In Europe and
the Americas, biogas installations are mainly large-scale plants, providing heat and electricity to
municipal or national grids, with MW scale installations. In Europe, some of the biogas produced is
upgraded and fed into the natural gas grid or used as transport fuel (Kemausuor et al, 2018).
Biogas can be also sold for use in fuel cells. In a traditional fuel cell, pure hydrogen (H2) reacts with
oxygen (O2) from the air to create water (H2O), heat and electricity. Solid oxide or direct methane fuel
cells, however, can convert cleaned up biogas directly into electricity. This provides another way to
use biogas to generate electricity. The standard process is for generators to convert bio-methane into
heat and electricity through combustion with a typical 25% to 40 % efficiency range. Biogas fuel cells
should be able to achieve conversion efficiency in the 50% to 60% range (Kemausuor et al, 2018).
Sugarcane bagasse as an organic material is a suitable biogas feedstock. Even the tops and trash
components of the cane can be used, as well as the “kahle” cane stalks that the mill rejects
(Sucropower, n.d.). Biogas can be produced for direct sale or it can be produced for use in gas turbines
for the mill as an alternative to traditional steam turbines for co-generation of power.
Biogas can also be obtained from the molasses residue, spentwash. Spentwash produces methane,
and the technique is already in use in for example India, where industry has previously extracted 1100
million cubic feet of methane gas per annum (Dotaniya et al, 2016). Spentwash from the production
of ethanol from cane juice can also be treated to extract biogas during remediation of the spentwash.
This is important because increased ethanol production by the SA industry will lead to increased
spentwash biowaste and a process that both remediates the spentwash and extracts biogas could be
very beneficial. For example, Indian research shows that an ethanol distillation plant producing 32700
m3 of spent wash annually can also produce around 450-500 m3 of biogas per day. The biogas was
composed of 50-60% methane, 1-3% hydrogen sulphide and 31- 49% of carbon dioxide. (Kumar, 2016).
And the remaining slurry can still be utilised as soil nutrient, giving the distillery three products.
The exhaust is used to create steam in heat recovery systems either in a steam-injected gas turbine
cycle or through a steam turbine to boost power output and efficiency in a gas turbine/steam turbine
combined cycle. Gas turbines usually have lower unit capital costs than steam turbines, and the most
efficient ones are viewed as more efficient than comparably sized steam turbines which mean this

54
could be a valid pathway for a mill wishing to switch to invest in new boiler technology. The diagram
below illustrates the processes of a typical biogas plant.
Figure 19: Typical biogas plant
Source: Sucropower Website. Biogas Technology. www.sucropower.co.za/technology.
The biogas-for-cogeneration pathway would only make commercial sense if the capital expenditure
outlay to equip mills with gas turbines for cogeneration would be less than that envisaged under a
conventional cogeneration boiler upgrade. The cogenerated output of the biogas turbines would also
have to at least match that of upgraded conventional boilers. If the value proposition does not favour
biogas for cogeneration, then the economics of biogas production simply for sale as a mill product
together with the attendant slurry as biofertiliser could be investigated, although feedstock availability
might be constraint as it would mainly be consumed as standard boiler fuel for cogeneration.
In the absence of cogeneration, the economics of diverting bagasse for biogas production purely for
gas sales only makes commercial sense if the replacement cost of using oil to fire the boiler is less than
the returns earned on biogas sales, after factoring in the investment cost of biogas processing. This is
because sufficient bagasse may not be available as it is already used as a direct boiler fuel, and
bagasse-based cogeneration for electricity sale would continue this consumption. However, using tops
and trash together with mill-reject stalk cane for biogas production may be sufficient to produce
limited quantities of biogas for a mill that wishes to continue cogenerating using its bagasse.
Demonstration biogas plants for the industry have been considered, both for small-scale and
commercial growers. A demonstration biogas plant for cane growers of the Qwabe Trust Authority
(QTA) in the Glendale Valley, Northern KwaZulu-Natal was envisaged in 2014 but funding constraints
meant it was moved in 2016 to Thorny Park, Tugela River Valley, KwaZulu-Natal. The QTA plant was

55
to utilise cane residue, but the 50 KW Thorny Park uses dedicated Napier grass as a feedstock, a fast-
growing crop that can also be used as cattle fodder. In 2018, work commenced on a 1 MW plant in
the same Tugela Valley.
It is envisaged that these plants would earn revenue from the following:
• Sales of biogas to the local community (for heating and cooking) and to local cane transport
operators);
• Sale of electricity to the local community and for farm use including irrigation;
• Sale of carbon credits (dependent on carbon price);
• Fuel in the form of Concentrated Natural Gas;
• Sale of NPK (nitrogen, phosphorus, and potassium) fertiliser; and
• Sale of carbon dioxide.
Benefits
Biogas capital expenditure might be one of the lowest across the diversification options as the systems
are low-tech, low-maintenance and safe (Zafar, 2019).
• Biogas plants are scalable and can be installed at farm level. They can also use food and livestock
waste as supplementary feedstock.
• Biogas would assist South Africa in meeting its climate change commitments as it is a renewable
fuel source, while natural gas remains a fossil fuel.
• Biogas can be stored and used on demand, providing an opportunity for use as baseload power
(Kemausuor et al, 2018)
• As it is produced using waste products, biogas does not compete with food crops for land, water
and fertilisers, and can help improve sanitation and organic waste management at the household,
community and industrial level in the mill area.
• Collection and utilisation of waste as feedstock is labour-intensive and the use of selected hardy
grasses as additional feedstock can take place on less productive areas of the farm and can further
increase employment on the farm.
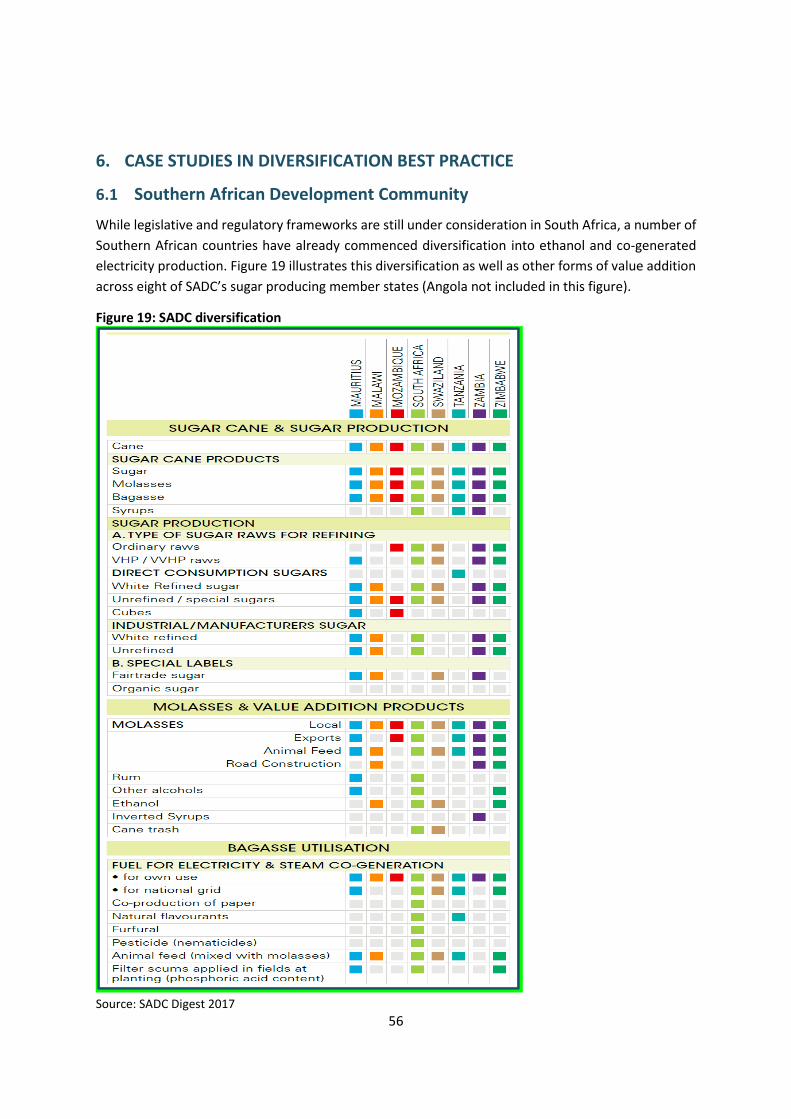
56
6. CASE STUDIES IN DIVERSIFICATION BEST PRACTICE
6.1 Southern African Development Community
While legislative and regulatory frameworks are still under consideration in South Africa, a number of
Southern African countries have already commenced diversification into ethanol and co-generated
electricity production. Figure 19 illustrates this diversification as well as other forms of value addition
across eight of SADC’s sugar producing member states (Angola not included in this figure).
Figure 19: SADC diversification
Source: SADC Digest 2017
57
6.2 Thailand
Thailand is one of the world’s top sugar producers and exporters, ranking in the Top 5 in both
categories. The industry comprises 300 000 growers, with 1.5 million workers in related industries,
and generates around US$6 billion in local sales and exports. During the 2015/16 season, the industry
grew 94 million tons of cane and produced 9.8 million tons of sugar from 52 mills, seven million tons
of which were exported. Cane production has more than doubled in the last 20 years. Revenue is split
between growers and millers on a 70%-30% basis.
Diversification as a commercial imperative is not limited to smaller national industries or industries
that have been under sustained pressure. The Thai International Sugar Corporation (KTIS), one of the
world’s largest sugar-cane producers, believes Thai sugar companies must diversify into by-products
to sustain profitability. KTIS’s three factories together have a total capacity of 88 000 tonnes of
sugarcane a day. The largest factory, Kaset Thai, could crush the entire South African industry’s cane
supply on its own annually, yet the firm sees value in diversification to offset the impact of lower world
prices and to manage costs (Pinijparakarn, 2016). Ethanol, fertiliser, biogas, electricity and bagasse
pulp already accounted for 20% of KTIS’s revenue in 2016, and it wants to boost this proportion to
50%. It even sees potential for a bagasse-ware plant to make products from sugarcane fibres.
Molasses is also used as a feedstock for Thai bioethanol. Before being used as a bioethanol feedstock,
approximately one third of all the molasses produced in Thailand was exported with the other two-
thirds being used primarily as an additive in animal feed or simply disposed of on-site.
Cogenerated electricity from sugarcane is seen as important for national development. Thailand’s
annual energy consumption has risen quite steadily during the past decade and barring a recession,
demand will likely continue its upward trend. Domestic sources of supply are limited, forcing a
significant reliance on imports (Zafar, 2020b).
The need for alternative fuels has a long history in Thailand, dating back to the 1970s oil price shocks.
Thailand decided to explore the potential of biofuel production to increase energy security, as the
country is highly dependent on external oil. In 1979, the Thai Government created the Oil Fund. This
government programme generates tax revenue off the import and domestic production of oil and uses
this money to subsidise the price of fuel in the country (Russell and Frymier, 2012).
In 2001, a National Ethanol Committee was established under the Ministry of Science and Technology
and then transferred to the Ministry of Industry, now known as the National Biofuels Committee under
the Ministry of Energy. This ensured that ethanol production was regulated separately to sugar
regulation. Bioethanol was targeted for use as a substitute to conventional gasoline, in passenger
vehicles, most commonly as an additive with gasoline in a mixture called gasohol which can come as
E10 (10% ethanol with gasoline), E20 (20% ethanol with gasoline), or E85 (85% ethanol with gasoline).
Ethanol producers were given excise tax exemptions on ethanol and gasohol refineries were
subsidised using the Oil Fund. The effect was to make E85 retail prices 52%-56% lower than
conventional petrol, and E10 prices 22%-26% lower than conventional petrol. The Thai Government
also lowered excise taxes on manufacturers of E10 and E85 vehicles and lowered import duties for

58
Flex Fuel vehicles, cars capable of running on E85 and E10 (Russell and Frymier, 2012). The number of
gasoline stations that could accommodate gasohol were also increased steadily.
The National Ethanol Programme and Gasohol Strategic Plan launched in December 2003 with an
ethanol production target of one million litres/day by the end of 2006 and of three million litres/day
by the end of 2011. Unlike biodiesel, the government did not regulate compulsory use or sale of
gasohol to substitute regular gasoline/petrol. Instead, gasohol prices remained 10%-15% below
regular gasoline prices due to the waived excise tax, plus the price subsidy for E20 and E85 gasohol
derived from the State Oil Fund.
Principal policy initiatives used in recent years to support ethanol production are the 15-Year Ethanol
Development Plan: 2008-2022 which was based on an Alternative Energy Development Plan (AEDP)
(2008-2012). These resulted in a Cane and Sugar Industry Roadmap 2014-2026. The Roadmap focuses
on productivity, efficiency and diversification. It sets out the following targets: 60% increase in area
under cane, 80% increase in cane tonnage, doubling in ethanol production from 2.5 ML/D to 5 ML/D,
and electricity production form 1 542 MW to 4 000 MW. These were followed in 2011 by a new version
of the AEDP (2012-2021), which targets using renewable energy at 25% of total energy consumption
by 2021, with biofuels replacing 44% of oil consumption in the transport sector by 2021. The AEDP has
a broad focus of reducing oil imports, strengthening energy security, enhancing the development of
alternative energy industries and conducting research and develop renewable energy technologies
(Kumar et al, 2013). The most recent iteration of the plan runs from 2015-2036. It includes ambitious
steps such as conversion kits for any old cars, motorcycles and buses to run on E20 or E85, and was
preceded in 2013 by a ban on unleaded gasoline.
The AEDP is part of a set of master plans, under the Ministry of Energy and the Department of
Renewable Energy Development and Energy Efficiency: the Power Development Plan, the Energy
Efficiency Development Plan, the AEDP, the Oil Development Plan and the Gas Development Plan.
Thailand was the first country to establish a Feed-in-Tariff (FiT) programme in the Association of
Southeast Asian Nations (ASEAN) region. FiTs were introduced for wind, solar, hydro, biomass
and biogas.
Biochemicals are seen as useful way to further diversify and to reduce reliance on exporting sugar.
With the government apparently planning to introduce and support the roll-out of electric vehicles,
bio-chemical manufacture may prove even more useful as a way to offset any reduction in ethanol
use in this regard as well.
6.3 Mauritius
The sugar industry in Mauritius has played a pivotal role in the country’s economy since the advent of
sugarcane growing around three centuries ago. Sugar has been the main source of income for the
industry, with factories producing approximately 600 000 tons of sugar from 5.8 million tons of cane
cultivated on 72 000 hectares of agricultural land. There are about 13 000 small-scale sugarcane
growers contributing 35% to local production, with 11 sugar factories in operation to date (AFP 2018;

59
Zafar 2018). In 2017/2018, sugar exports accounted for 16% of overall exports from Mauritius
(Mauritius Sugar Syndicate 2018).
Since 1975, Mauritius benefited from preferential export prices to the EU, which the EU Sugar Protocol
enabled the island to sell sugar at suitable price and fixed quantity. However, increased production in
Brazil, India and Thailand, in combination with the liberalisation of EU’s quotas in 2017, culminated in
decreasing sugar prices. As a result, exports of refined white sugar to the EU fell from 316 423 tons
in 2016 to 110 258 tons in 2017, and this severely impacted the Mauritian sugar industry, mainly small-
scale farmers where nearly 26 000 farmers were operational in 2010 compared to 13 000 in 2018
(AFP, 2018; Mauritius Sugar Syndicate 2018; To, Seebaluck, and Leach 2017).
In 2017, financial strain on the sugar industry due to unfavourable market conditions resulted in the
Mauritian government requesting that the Sugar Insurance Fund Board) provide MUR 1 250 (ZAR 514)
per tonne of sugar to producers in the country along with measures that waived global cess fees that
would be paid to the Mauritius Cane Industry Authority. Due to dwindling export markets, notably the
EU, Mauritius is looking towards expanding sugar exports to Africa, leveraging the African Continental
Free Trade Agreement and SADC. However, to protect the domestic market in South Africa, sugar
supply from Mauritius into SACU has been restricted (Mauritius Sugar Syndicate, 2018)
In attempts to further diversify export markets, in January 2018, the Mauritian government began
talks with rapidly growing developing countries such as China and India on duty and quota free market
access, along with trade pricing that would not be negatively impacted by global price instability
(Mauritius Sugar Syndicate 2018).
While sugar production has been the backbone of the cane economy for many years, declines in the
pricing of sugar spurred the country to adopt diversifying measures to remain competitive. As such,
Mauritius is among the world leaders in using waste products of sugarcane processing by establishing
bagasse for energy generation integrated into the public grid (To, Seebaluck, and Leach 2017). In 2016,
the sugar industry contributed 22% of all electricity generation to the Mauritian national grid
(Mauritius Sugar Syndicate 2016 Annual Report).
Additional diversification initiatives include the Omnicane biogas energy project, which aims at
generating additional electricity from methane produced in the vinasse treatment process, and the
Alteo high-efficiency thermal power plant project, which plans to double its energy production from
biomass based on a new power purchase agreement.
Prior to the 1990s, Mauritius relied on the import of fossil fuels for electricity generation, however,
due to unstable oil markets and price volatility, the government searched for locally-based sustainable
options to improve security of electricity supply. As such, the national Central Electricity Board (CEB)
was established in 1952, as the country’s sole utility responsible for the transmission and distribution
of electricity.
The CEB facilitated the sugar industry’s integration into grid electricity supply, with St Antoine being
the first sugar factory/independent power producer selling surplus electricity to the grid in 1957, once
factory consumption was accounted for. Due to the socioeconomic importance of the sugar industry

60
in Mauritius, policy consideration was given to the sector as a means of preservation as well as
diversification of energy sources in the country (To, Seebaluck, and Leach 2017).
Figure 21 portrays the development of the sugar industry in relation to bagasse for electricity
generation.
Figure 21: Timeline of policies and measures influencing bagasse electricity generation in Mauritius
Source: Author, compilation based on To, Seebaluck, and Leach 2017.
Numerous policy measures have influenced and assisted the sugar industry with entry into electricity
generation. In the early 1970s, 21 factories were producing approximately 25 GWh of electricity for
the grid, albeit at an inconsistent rate, as companies could not invest significantly in cogeneration
technology development at the time. As such, in 1982, with assistance from international
cogeneration companies, Mauritius launched the first factory based power plant supplying 21.7 MW
of electricity via bagasse during crop season and coal for off-season. To assist firms with technological
innovation in bagasse cogeneration, the Mauritian government implemented two enabling policies,
the 1985 Sugar Sector Action Plan (SSAP) and the Sugar Industry Efficiency Act of 1988. The SSAP was
developed in collaboration with the private sector to foster improved energy efficiencies and
productivity of bagasse to ensure grid supply of electricity, with incentives for the creation of
Independent Power Producers (IPPs) and bagasse storage facilities.
Fiscal incentives emanating from the Sugar Industry Efficiency Act of 2001 supported the development
of cogeneration operations, with sugar factories benefiting from 75% income tax exemption for selling
bagasse between factories producing electricity. The cogeneration plant also received tax exemptions,
amounting to 60%, on income generated via the sale of electricity to the national grid. To improve
efficiencies and reduce impacts on the environment, a tax exemption of 80% was given to companies
1952
Creation of the Central Electricity Board (CEB)
national electricity utility
1957
St Antoine becomes first sugar factory
selling electricity to the grid
1970s-1980s
Government seeks measures to diversify and ensure security of
electricity supply
1970s
21 sugar factories selling 16% of total electricity
demand (25 GWH) at 0.6 US cents per kWh
1980
Sugar mill signs power purchase agreement
(PPA) supplying 6MW of electricity during season
1982
Installation of first cogeneration firm plant based on bagasse during
season and coal off-season
1985
Establishment of the Sugar Sector Action Plan
to promote development of bagasse
electricity
1988
Sugar Industry Efficiency Act providedd fiscal
incentives for cogeneration
1991
Creation of the Bagasse Energy Development
Programme
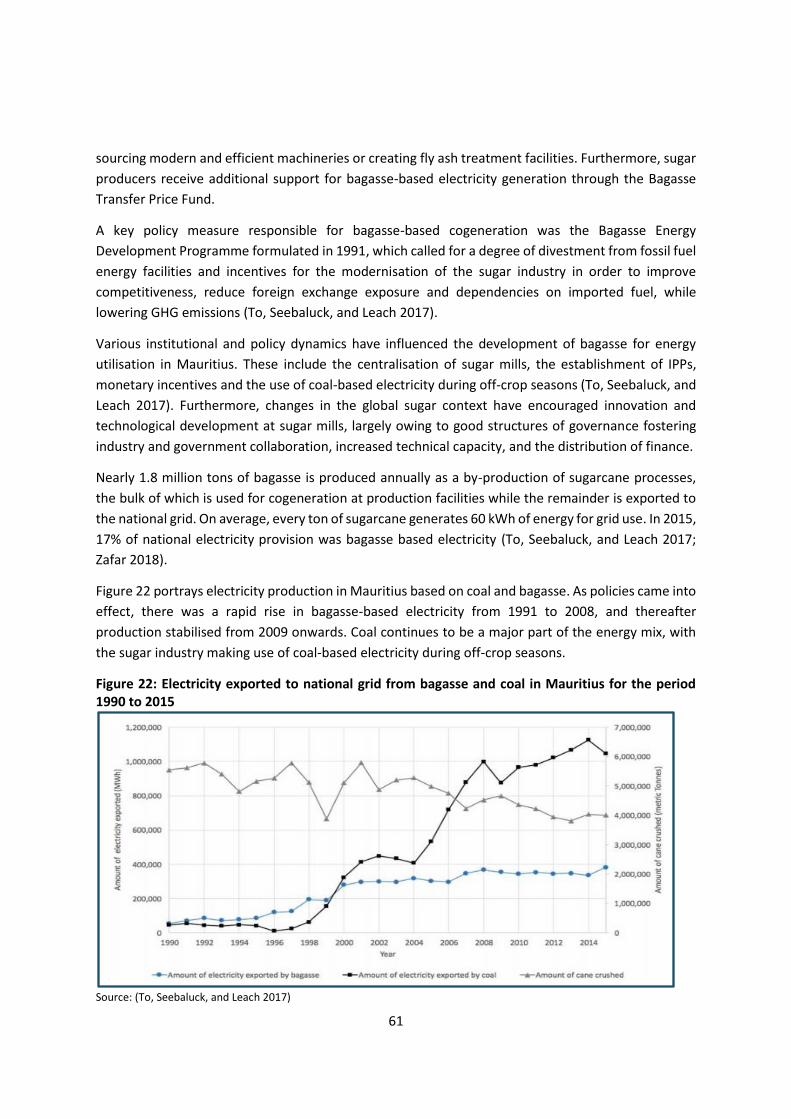
61
sourcing modern and efficient machineries or creating fly ash treatment facilities. Furthermore, sugar
producers receive additional support for bagasse-based electricity generation through the Bagasse
Transfer Price Fund.
A key policy measure responsible for bagasse-based cogeneration was the Bagasse Energy
Development Programme formulated in 1991, which called for a degree of divestment from fossil fuel
energy facilities and incentives for the modernisation of the sugar industry in order to improve
competitiveness, reduce foreign exchange exposure and dependencies on imported fuel, while
lowering GHG emissions (To, Seebaluck, and Leach 2017).
Various institutional and policy dynamics have influenced the development of bagasse for energy
utilisation in Mauritius. These include the centralisation of sugar mills, the establishment of IPPs,
monetary incentives and the use of coal-based electricity during off-crop seasons (To, Seebaluck, and
Leach 2017). Furthermore, changes in the global sugar context have encouraged innovation and
technological development at sugar mills, largely owing to good structures of governance fostering
industry and government collaboration, increased technical capacity, and the distribution of finance.
Nearly 1.8 million tons of bagasse is produced annually as a by-production of sugarcane processes,
the bulk of which is used for cogeneration at production facilities while the remainder is exported to
the national grid. On average, every ton of sugarcane generates 60 kWh of energy for grid use. In 2015,
17% of national electricity provision was bagasse based electricity (To, Seebaluck, and Leach 2017;
Zafar 2018).
Figure 22 portrays electricity production in Mauritius based on coal and bagasse. As policies came into
effect, there was a rapid rise in bagasse-based electricity from 1991 to 2008, and thereafter
production stabilised from 2009 onwards. Coal continues to be a major part of the energy mix, with
the sugar industry making use of coal-based electricity during off-crop seasons.
Figure 22: Electricity exported to national grid from bagasse and coal in Mauritius for the period 1990 to 2015
Source: (To, Seebaluck, and Leach 2017)
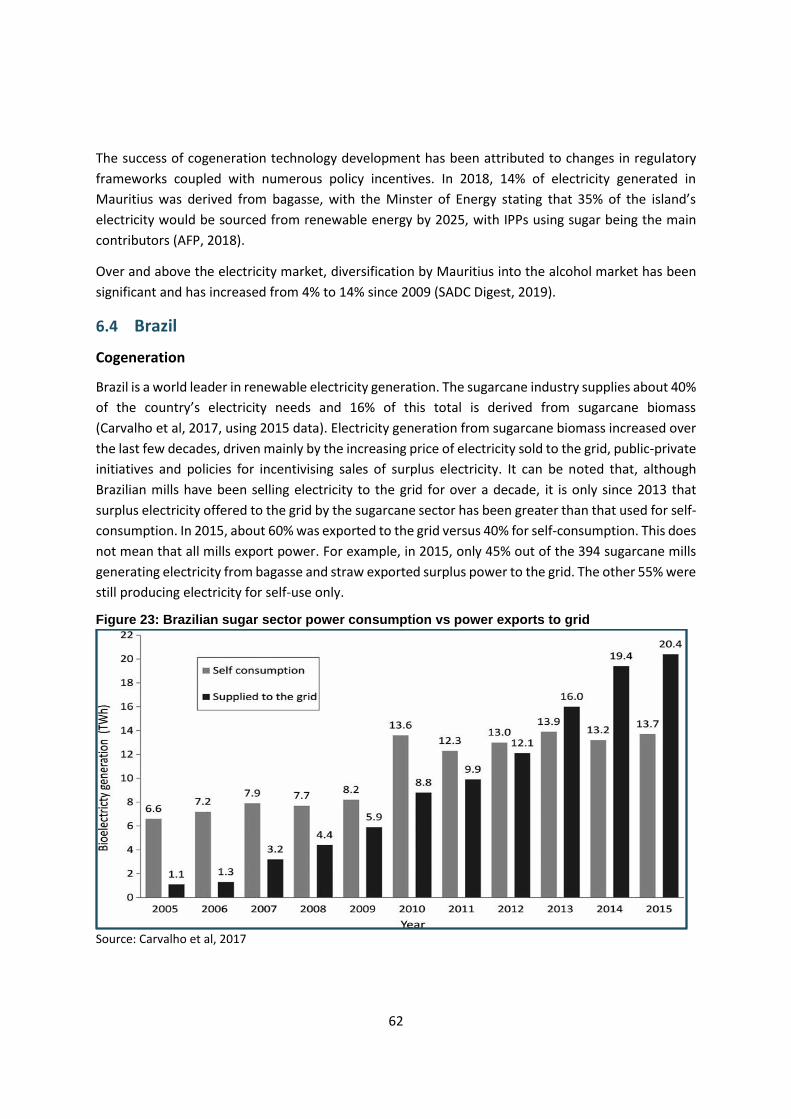
62
The success of cogeneration technology development has been attributed to changes in regulatory
frameworks coupled with numerous policy incentives. In 2018, 14% of electricity generated in
Mauritius was derived from bagasse, with the Minster of Energy stating that 35% of the island’s
electricity would be sourced from renewable energy by 2025, with IPPs using sugar being the main
contributors (AFP, 2018).
Over and above the electricity market, diversification by Mauritius into the alcohol market has been
significant and has increased from 4% to 14% since 2009 (SADC Digest, 2019).
6.4 Brazil
Cogeneration
Brazil is a world leader in renewable electricity generation. The sugarcane industry supplies about 40%
of the country’s electricity needs and 16% of this total is derived from sugarcane biomass
(Carvalho et al, 2017, using 2015 data). Electricity generation from sugarcane biomass increased over
the last few decades, driven mainly by the increasing price of electricity sold to the grid, public-private
initiatives and policies for incentivising sales of surplus electricity. It can be noted that, although
Brazilian mills have been selling electricity to the grid for over a decade, it is only since 2013 that
surplus electricity offered to the grid by the sugarcane sector has been greater than that used for self-
consumption. In 2015, about 60% was exported to the grid versus 40% for self-consumption. This does
not mean that all mills export power. For example, in 2015, only 45% out of the 394 sugarcane mills
generating electricity from bagasse and straw exported surplus power to the grid. The other 55% were
still producing electricity for self-use only.
Figure 23: Brazilian sugar sector power consumption vs power exports to grid
Source: Carvalho et al, 2017
63
TT usage
Brazil has largely shifted to green harvesting, with for example Sao Paulo state setting 2021 as the
date for 100% green harvesting. Green harvesting has been accompanied by an increase in
mechanisation. This has generated a much larger amount of TT for bioenergy production. This has led
to debate on the recommended amount of straw to be maintained on the field to take advantage of
the agronomic, environmental, and industrial benefits25 (Carvalho et al, 2017). Even in an industry as
large as Brazil, there is a lack of data informing the recommendable amount of straw that should be
removed from the fields.
Brazil has an extensive ethanol market which contributes towards utilisation of sugarcane and is a
leading exporter of sugar.
6.5 Lessons for South African diversification
• Subsidies, as well as nuanced reductions in tax and tariffs, were needed to encourage private
sector participation
• Molasses in Thailand was utilised as an additional feedstock.
• In Thailand, the sectors were overseen by a dedicated government committee and government
department, with dedicated regulation that was tailored to the needs of biofuels and renewable
energies.
• The development of a biofuels and co-generated electricity sector are undertaken through
dedicated, long-term policy plans, with specific targets. These plans are constantly revised.
• Soft and extensive loans were used to support diversification innovation.
• Not all the Brazilian mills export power to the grid.
• Even though second-generation biofuels production is still in its infancy, even in Brazil, pilot plants
would allow the South African industry to deploy its research assets to mature the technology.
25 TT removal has implications for nutrient recycling, soil erosion losses, soil biology attributes, soil GHG emissions, rates of pest infestation, weed control, and sugarcane development and yields (Carvalho et al, 2017).
64
7. CONCLUSION AND WAY FORWARD
The approaches listed above overlap sectors with significant regulatory and legislative oversight, e.g.
energy, fuels specifically, and chemicals. The private sector cannot unilaterally implement these
approaches and requires a common vision to be developed with government intervention, with
regulatory and legislative implications.
In turn, the industry needs to commit to investing in these agreed areas. It is clear from the successes
enjoyed by major diversified industries that a dedicated partnership between government and the
industry is needed to successfully plan for and nurture the emergence of a diversified industry.
Government has the scope to drive much of this diversification through the legislative and sectoral
development authority it wields, and industry through changes to its business model in line with a
new vision for the industry.
Three elements stand out from the case studies. First, resources were allocated to support the
development of the new sector through lower taxes and tariffs, soft loans and new planning
structures. Second, the interventions were nuanced, not blunt instruments. Third, the development
of a biofuels and cogenerated electricity sector (and emerging biochemicals sectors) was undertaken
through dedicated, long-term policy plans, with specific targets. These plans were constantly revised.
The creation and management of such plans and the growth of the subsectors were further overseen
by a dedicated government committee and government department, with dedicated regulation that
was tailored to the needs of biofuels and renewable energies.
Specific interventions required for biofuels: Finalisation of the biofuels regulatory framework; and
implementation of the mandatory 2-10% blend ratio. It has to be mandatory as existing fuel suppliers
will not easily surrender market share. For example, in Zimbabwe, local ethanol producer Green Fuels
notes that fuel wholesalers resisted blending. Strong government support was necessary to
implement and drive the mandatory process. Possible subsidisation of blending for an initial period
may be needed, similar to interventions used by governments globally to build successful ethanol
production and to provide stability in the event of sudden decreases in the price of oil which could
render ethanol uncompetitive. Ethanol production from existing brownfield plants would need to be
allowed, so as to lower start-up costs for the industry and maximise the ethanol volumes which could
be produced.
Specific interventions required for co-generated electricity: Government, via Eskom, would need to
negotiate feed in tariff with the industry. Cogeneration must be included in the definition of
cogeneration in relevant renewable energy legislation and IPP agreements would then need to be
negotiated with the milling companies. The Sugar Act and SIA would have to be adjusted to
accommodate a fair revenue sharing model for growers and millers.
Specific interventions required for biochemicals: In most cases, the production of chemical sector
inputs would be governed by existing legislation and regulation; however, some nuanced tariff
protection might be needed to allow for economies of scale to be established. The bulk of the chemical
products to be manufactured would flow from ethanol and therefore would simply be an expansion
65
of similar chemical production, which would require engagement and possible partnerships with Sasol
and the value chain at large. Similar to cogeneration proceeds, government intervention would be
required to facilitate the inclusion of such proceeds in the industry partnership via the Sugar Act and
SIA.
Specific interventions regarding imports: Tariff applications are complex processes, and with South
Africa’s position as a deregulated, liberalised economy, tariffs cannot be relied on as a panacea for
broader sectoral issues. In the absence of another tariff reference price increase, adjustments could
be made to the tariff triggering mechanism to make it more responsive, within the existing policy
position. For example, the triggering windows of 20 days could be reduced, and the industry has
recently proposed that the exchange rate calculation mechanism could be adjusted. With reference
to intra-SACU sugar sales, it may be time to push for a derogation to the SACU Agreement, based on
an equitable formula for access to the customs union by South Africa and eSwatini. The tariff schedule
for SACU could be adjusted to better capture information on categories of sugar imports. With this
information, a nuanced tariff could be created to ensure that tariffs are accurately impacting the
largest imports.
66
RFERENCES
AFP, 2018. In Mauritius, Sugar Cane Means Money, Renewable Energy. Fin24. 9 December 2018. https://m.fin24.com/Economy/in-mauritius-sugar-cane-means-money-renewable-energy-20181209.
Agribook, n.d. The Agri Handbook. Agro-processing, https://agribook.co.za/adding-value/agro-processing/.
AB Sugar, n.d. Sugar Markets: World sugar demand and supply, https://www.absugar.com/sugar-markets/world-sugar-demand-and-supply.
Alves, J.O., Tenorio, J.A.S., Zhuo, C. and Levendis, Y.A., 2012. Characterization of Nanomaterials Produced from Sugarcane Bagasse. Journal of Materials Research and Technology. https://www.researchgate.net/publication/275550854_Characterization_of_Nanomaterials_Produc ed_from_Sugarcane_Bagasse.
Bernhardt, H.W., 2016 Development of a prototype cane-trash burner, . International Society of Sugar Cane Technologists. Volume 29, 1649-1654, 2016. https://www.researchgate.net/ publication/320755948_Development_of_a_prototype_cane-trash_burner.
Biomas Producer, n.d. Producing Biomass. Bagasse and Cane Trash. http://biomassproducer.com.au/ producing-biomass/biomass-types/crop-residue/bagasse/#.XmnkG6gzY2w.
Braude, W., 2015. Towards a SADC Fuel Ethanol Market from Sugarcane: Regulatory Constraints and a Model for Regional Sectoral Integration. Emet Consulting/ACCORD Development Consult. Presentation at TIPS Annual Forum 2015. https://www.tips.org.za/research-archive/annual-forum-papers/2015/item/2936-towards-a-sadc-feul-ethanol-market-from-sugarcane-regulatory-constraints-and-a-model-for-regional-sectoral-integration.
Carvalho J.L.N., Nogueirol R.C., Menandro L.M.S., Bordonal R.D.O., Borges CD., Cantarella H. and Franco H.C.J., 2017. Agronomic and Environmental Implications of Sugarcane Straw Removal: A major Review. Global Change Biology Bioenergy 9(7): 1181-1195.
Conningarth Economists, 2015. Economic Impact Assessment of the revision of the South African Sugar Act. B&M Analysts.
Conningarth Economists, 2013a. Overview of the Sugar Industry in South Africa - Contribution to Social and Economic Development and Contentious Issues. Pretoria, South Africa. Document I of Growing the Sugar Industry in South Africa study.
Conningarth Economists, 2013b. Investigation and Evaluation of Alternative Uses and Products from Sugar Cane: A Cost Benefit and Macroeconomic Impact Analysis. Document 5 of Growing the Sugar Industry in South Africa study.
DAFF, 2017. A Profile of the South African Sugar Market Value Chain 2017. Department of Agriculture, Forestry and Fisheries. Pretoria, South Africa. https://www.nda.agric.za/doaDev/sideMenu/Marketing/Annual%20Publications/Commodity%20Pr ofiles/field%20crops/Sugar%20Market%20Value%20Chain%20Profile%202017.pdf.
DAFF, 2016. A Profile of the South African Sugar Market Value Chain 2016. Department of Agriculture, Forestry and Fisheries. Pretoria, South Africa. https://www.nda.agric.za/doaDev/sideMenu/ Marketing/Annual%20Publications/Commodity%20Profiles/field%20crops/Sugar%20Market%20Valu e%20Chain%20Profile%202016.pdf.

67
Dodo, C.M., Mamphweli, S., Okoh, 0, 2017. Bioethanol Production from Lignocellulosic Sugarcane Leaves and Tops. Journal of Energy in Southern Africa. Vol.28. August 2018. Cape Town, South Africa.
Dotaniya, M.L, Datta, S.C., Biswas, D.R. Dotaniya, C.K., Meena, B.L, Rajendiran, S., Regar, K.L and Lata, M., 2016. Use of Sugarcane Industrial By-products for Improving Sugarcane Productivity and Soil Health. Internotionol Journal of Recycling of Organic Waste in Agriculture Vol 5: 185-194. https://doi.org/10.1007/s40093-016-0132-8.
Electrigaz, 2017. Biogas FQA. http://www.electrigaz.com/faq_en.htm.
FAOSTAT, n.d. Food and Agriculture Data. Food and Agriculture Organization. http://www.fao.org/faostat/en/#home
Fechter, W., 2012. Diversifying the Sugar Industry. Presentation to 8th KwaZulu-Natal Sustainable Energy Forum (KSEF), July 2012.
George, P., Juan, C.E., Sagastume, A., Hens, L. and Vandecasteele, C, 2010. Residue from Sugarcane Juice Filtration (Filter Cake): Energy Use at the Sugar Factory. Waste and Biomass Valorization 1: 407-413.
Johnson, F.X., 2007. Global and Regional Bioethanol Markets. Cane Resources Network for Southern Africa Presentation at AU/UNIDO/Brazil Seminar: Sustainable Biofuels Development in Africa: Opportunities and Challenges. 31 July 2007.
ISO, 2018. Sugar Yearbook 2018, London: International Sugar Organization.
ISO, 2017. Sugar Yearbook 2017, London: International Sugar Organization
ISO, n.d. International Sugar Organization. Our role, https://www.isosugar.org/aboutus/role-of-the-international-sugar-organization.
ITAC, 2018. Report No. 588. Increase in the Dollar-Based Reference Price of Sugar from US$566/ton to US$680/ton. International Trade Administration Commission. Republic of South Africa, Pretoria, South Africa.
Kemausuor, F., Adaramola, M. and Morken, J., 2018. A Review of Commercial Biogas Systems and Lessons for Africa. Energies.
Kohler, M., 2017. An Economic Assessment of Bioethanol Production from Sugar Cane: The Case of South Africa. Economic Research Southern Africa (ERSA) Working Paper 630. Cape Town, South Africa.
Kumar, S., P. Abdul Salam, P, Shrestha P. and Ackom, E., 2013. An assessment of Thailand's biofuel development. Sustainability 5: 1577-1597. April 2013.
Macrotrends, n.d. Research Platform for Long Term Investors. https://www.macrotrends.net.
Mauritius Sugar Syndicate. 2018. Mauritius Sugar Syndicate Report and Statement of Account 2017-2018. Mauritius: Mauritius Sugar Syndicate. http://www.mauritiussugar.mu/index.php/en/annual-report.html.
Mpumalanga Province, 2016. Nkomazi SEZ designation application. Provincial Department of Finance, Economic Development and Tourism. http://www.dti.gov.za/invitations/Nkomazi_SEZ.pdf.
Nyberg, J., 2006. Sugar International Market Profile. Background paper for the Competitive Commercial Agriculture in Sub-Saharan Africa (CCAA) Study, World Bank, Washington, D.C. https://siteresources.worldbank.org/INTAFRICA/Resources/257994-1215457178567/Sugar_Profile.pdf.
68
OECD, 2018. Agricultural Policy Monitoring and Evaluation 2018. OECD Publishing. https://doi.org/10.1787/agr_pol-2018-en.
OECD/FAO, 2018. OECD-FAO Agricultural Outlook 2018-2027. OECD Publishing, Paris and Food and Agriculture Organization, Rome, https://doi.org/10.1787/agr_outlook-2018-en.
Pierossi M.A, Bernhardt, H.W. and Funke T., 2016. Sugarcane leaves and tops: Their current use for energy and hurdles to be overcome, particularly in South Africa, for greater utilisation. SASTA Congress 2016. Durban, South Africa. https://www.researchgate.net/publication/320755956.
Pinijparakarn, S., 2016. Sugar producers must diversity to ensure profitability. The Nation. Thailand. https://www.nationthailand.com/noname/30281477?utm_source=category&utm_medium= internal_referral
Prado, R.M., Caione, G., and Campos C.N.S., 2013. Filter Cake and Vinasse as Fertilizers Contributing to Conservation Agriculture. Applied and Environmental Soil Science Volume 2013, Article ID 581984. Hindawi Publishing Corporation http://dx.doi.org/10.1155/2013/581984.
Rabelo, S., Costa, A., and Rossel, C. 2015. Industrial Waste Recovery. Sugarcane: Agricultural Production, Bioenergy and Ethanol. Chapter 17: 365-381. https://doi.org/10.1016/B978-0-12-802239-9.00017-7.
Russell, T.H. and Frymier, P. 2012. Bioethanol production in Thailand: A teaching case study comparing cassava and sugar cane molasses. The Journal of Sustain ability Education.
SADC Sugar Digest, 2019. Shukela South Africa, https://shukela.co.za/sadc-sugar-digest.
SADC Sugar Digest, 2018. Shulela South Africa, https://shukela.co.za/sadc-sugar-digest.
SADC Sugar Digest, 2017. Shukela South Africa, https://shukela.co.za/sadc-sugar-digest.
SA Canegrowers, 2017. Annual Review 2017. South African Cane Growers' Association. www.sacanegrowers.co.za.
SASA, 2019. South African Sugar Journal. South African Sugar Association. January 2019. http://www.sasugar.co.za/jan-march-2019.
SASA, 2018. South African Sugar Journal. South African Sugar Association. October 2018. http://www.sasugar.co.za/oct-dec-2018.
SASA, n.d.-a The Sugar Industry at a Glance, https://sasa.org.za/the-sugar-industry-at-a-glance.
SASA, n.d.-b. Sugar Milling and Refining, https://sasa.org.za/sugar-milling-and-refining/.
SASA, n.d.-c. Facts and figures. Sugar Industry Statistical Information. https://sasa.org.za/facts- and-figures/.
South African Sugar Industry Directory, 2019a. Cane Growing in South Africa. South African Sugar Industry Directory. https://www.sasugarindustrydirectory.co.za/growers/overview/.
South African Sugar Industry Directory, 2019b. Facts and Figures. South African Sugar Industry Directory. https://www.sasugarindustrydirectory.co.za/factsandfigures.
Statistics South Africa, 2018. Quarterly Labour Force Survey. Q4 2017. http://www.statssa.gov.za/publications/P0211/P02114thQuarter2017.pdf.
Sucropower, n.d. Empowering people and the planet, naturally. Biogas Technology. http://www.sucropower.co.za/technology/.
69
Montmasson-Clair, G., 2017. Electricity supply in South Africa: Path dependency or decarbonisation? TIPS Policy Brief 2/2017. Trade & Industrial Policy Strategies. Pretoria, South Africa. https://www.tips.org.za/policy-briefs/item/download/1350_a698ceb76e4c60eea22c36a1af47ded6.
Trade Map, n.d. Trade Statistics for International Business Development. www.trademap,org.
To, L.S., Seebaluck, V. and Leach, M. 2017. Future Energy Transitions for Bagasse Cogeneration: Lessons from Multi-Level and Policy Innovations in Mauritius. Energy Research & Social Science, October.https://www.researchgate.net/publication/321247376_Future_energy_transitions_for_ bagasse_cogeneration_Lessons_from_multi-level_and_policy_innovations_in_Mauritius.
United States Department of Agriculture (USDA GAIN). 2018. Sugar: World Markets and Trade. November 2018. https://downloads.usda.library.cornell.edu/usda-esmis/files/z029p472x/r781wk715/nc580r03d/Sugar.pdf
Zafar, S. 2020a. Summary of Biomass Combustion Technologies. BioEnergy Consult. 2 February 2020. https://www.bioenergyconsult.com/tag/boilers/.
Zafar, S. 2020b. Biomass Energy in Thailand. BioEnergy Consult. January 2020, https://www.bioenergyconsult.com/biomass-thailand/.
Zafar, S. 2019. The Concept of Biorefinery. BioEnergy Consult. June 2019. https://www.bioenergyconsult.com/biorefinery/.
Zafar, S. 2018. Salient Features of Sugar Industry in Mauritius. BioEnergy Counsultant. September 24, 2018. https://www.bioenergyconsult.com/sugar-industry-mauritius/.
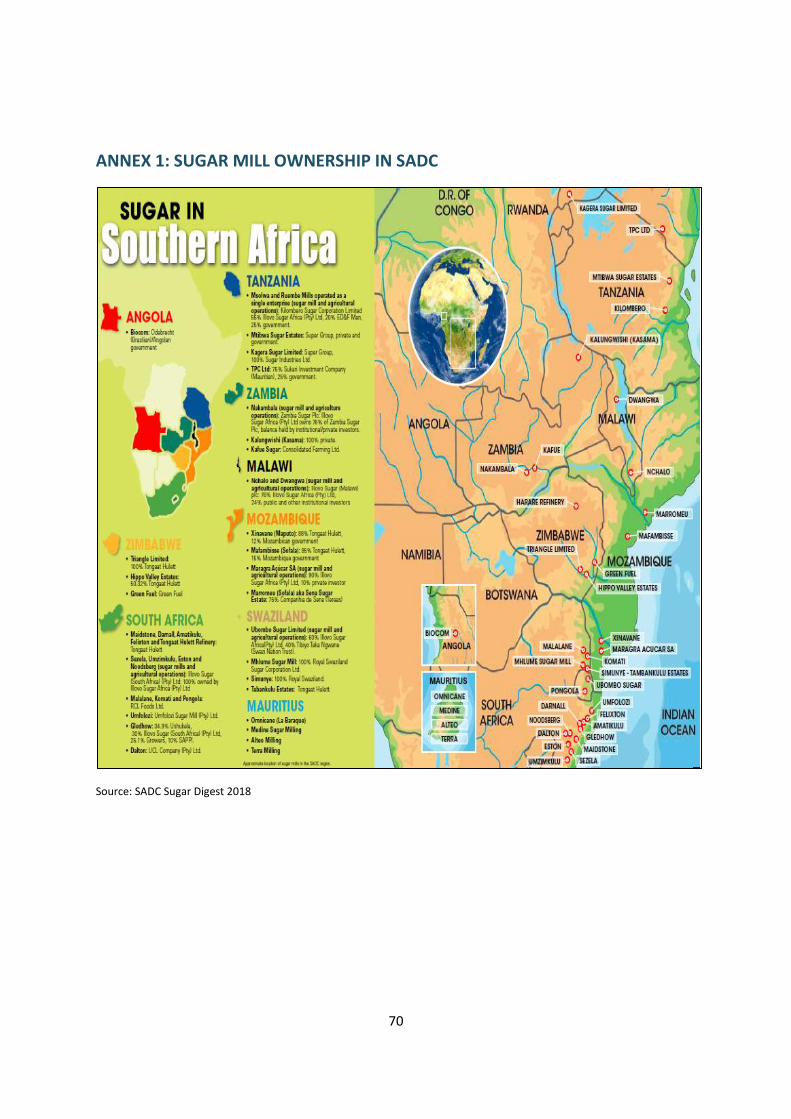
70
ANNEX 1: SUGAR MILL OWNERSHIP IN SADC
Source: SADC Sugar Digest 2018
Related Documents