M.Tech Project Third Review On Design and Implementation of Intelligent Energy Monitoring System For Industrial Machines YARRAGOLLA SUDHAKAR ROLL NO. 12691D3826 M.TECH (DECS) UNDER THE ESTEEMED GUIDANCE OF Ms. G. NAGA SWETHA, M.Tech, Asst. Professor, Dept. of ECE BY MADANAPALLE INSTITUTE OF TECHNOLOFY & SCIENCE (Approved by AICTE, New Delhi and Affiliated to JNTUA, Anantapur) Madanapalle, Chittoor (Dist.), A.P. UGC-ATONOMOUS An ISO 9001:2008 Certified Institute 2012-2014

Welcome message from author
This document is posted to help you gain knowledge. Please leave a comment to let me know what you think about it! Share it to your friends and learn new things together.
Transcript
M.Tech Project Third ReviewOn
Design and Implementation of Intelligent Energy Monitoring System
For Industrial Machines
YARRAGOLLA SUDHAKAR
ROLL NO. 12691D3826
M.TECH (DECS)
UNDER THE ESTEEMED GUIDANCE OF
Ms. G. NAGA SWETHA, M.Tech,
Asst. Professor, Dept. of ECE
BY
MADANAPALLE INSTITUTE OF TECHNOLOFY & SCIENCE(Approved by AICTE, New Delhi and Affiliated to JNTUA, Anantapur)
Madanapalle, Chittoor (Dist.), A.P.UGC-ATONOMOUS
An ISO 9001:2008 Certified Institute2012-2014
INTRODUCTION
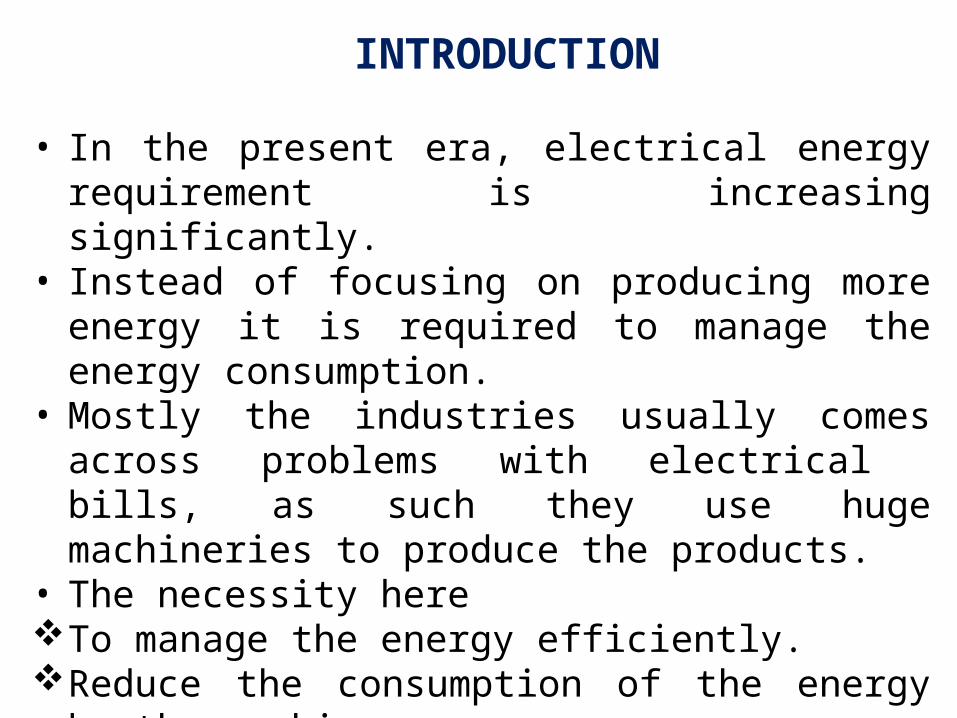
• In the present era, electrical energy requirement is increasing significantly.
• Instead of focusing on producing more energy it is required to manage the energy consumption.
• Mostly the industries usually comes across problems with electrical bills, as such they use huge machineries to produce the products.
• The necessity hereTo manage the energy efficiently. Reduce the consumption of the energy by the machines.
To know the details of energy consumed for machines.
when they are in working state.
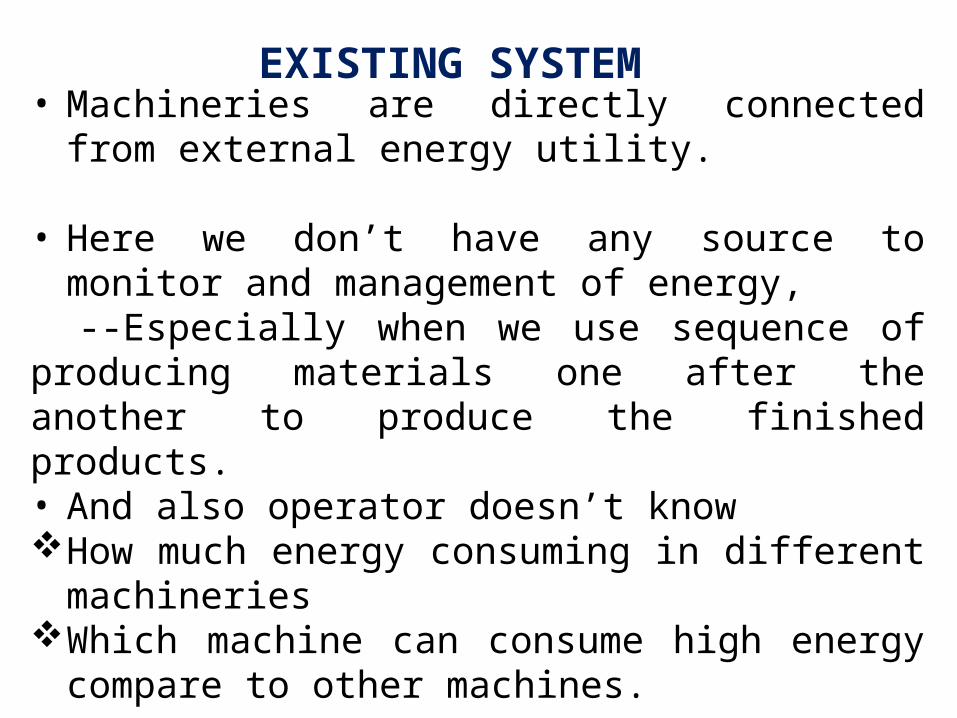
EXISTING SYSTEM• Machineries are directly connected from external energy utility.
• Here we don’t have any source to monitor and management of energy, --Especially when we use sequence of
producing materials one after the another to produce the finished products.• And also operator doesn’t know How much energy consuming in different machineries
Which machine can consume high energy compare to other machines.
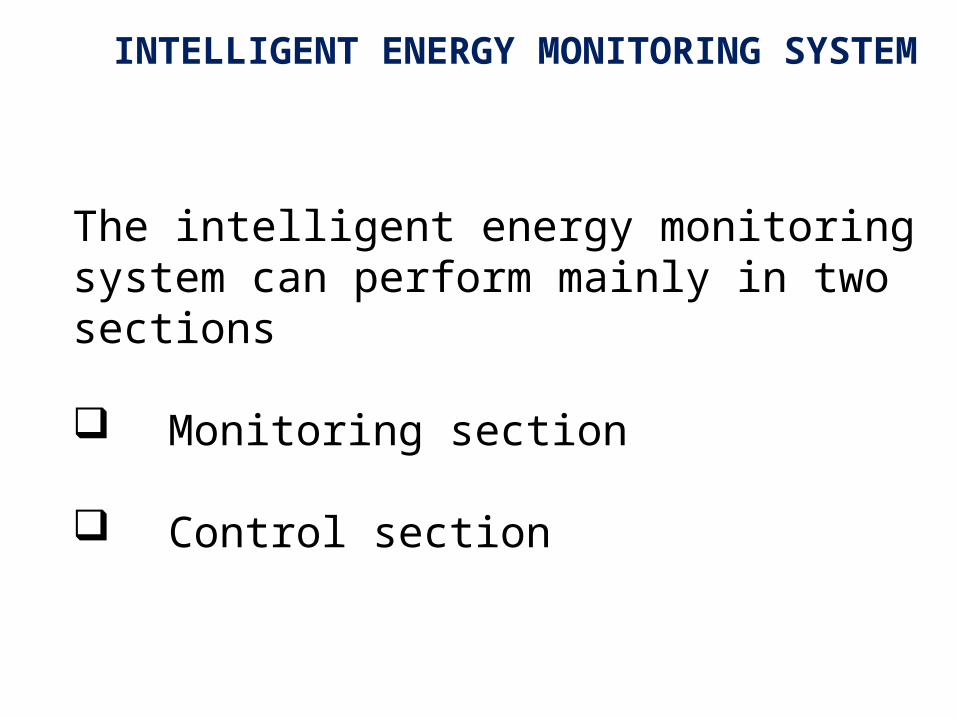
The intelligent energy monitoring system can perform mainly in two sections
Monitoring section
Control section
INTELLIGENT ENERGY MONITORING SYSTEM
MONITORING SECTION
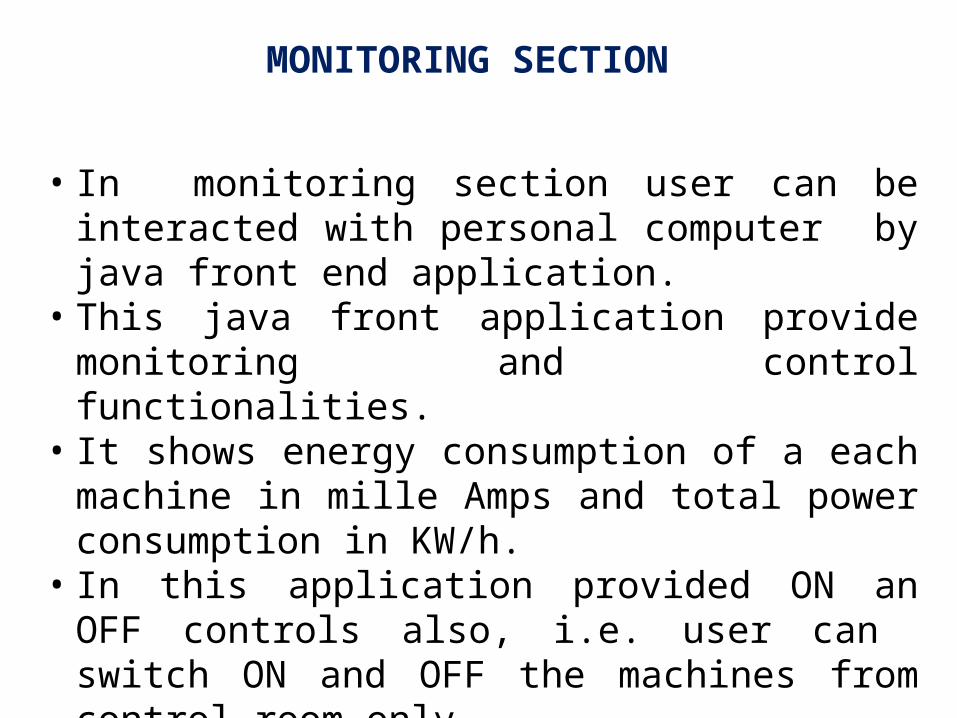
• In monitoring section user can be interacted with personal computer by java front end application.
• This java front application provide monitoring and control functionalities.
• It shows energy consumption of a each machine in mille Amps and total power consumption in KW/h.
• In this application provided ON an OFF controls also, i.e. user can switch ON and OFF the machines from control room only.
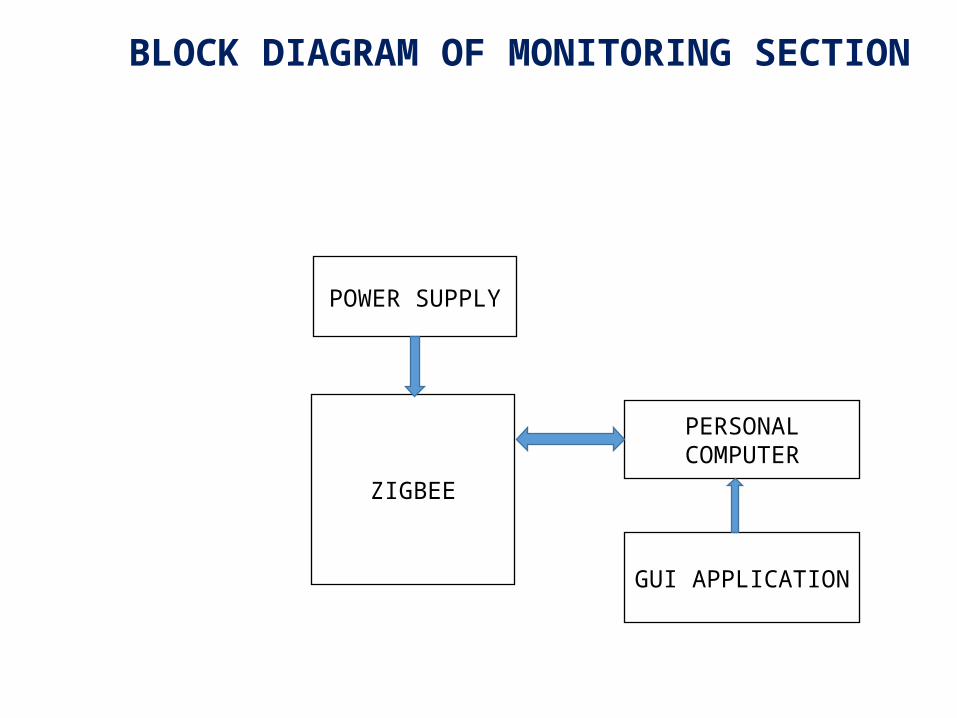
ZIGBEE
PERSONAL COMPUTER
GUI APPLICATION
POWER SUPPLY
BLOCK DIAGRAM OF MONITORING SECTION
•Data Collecting and Processing
•Controlling machines•Communication processing
CONTROL SECTION
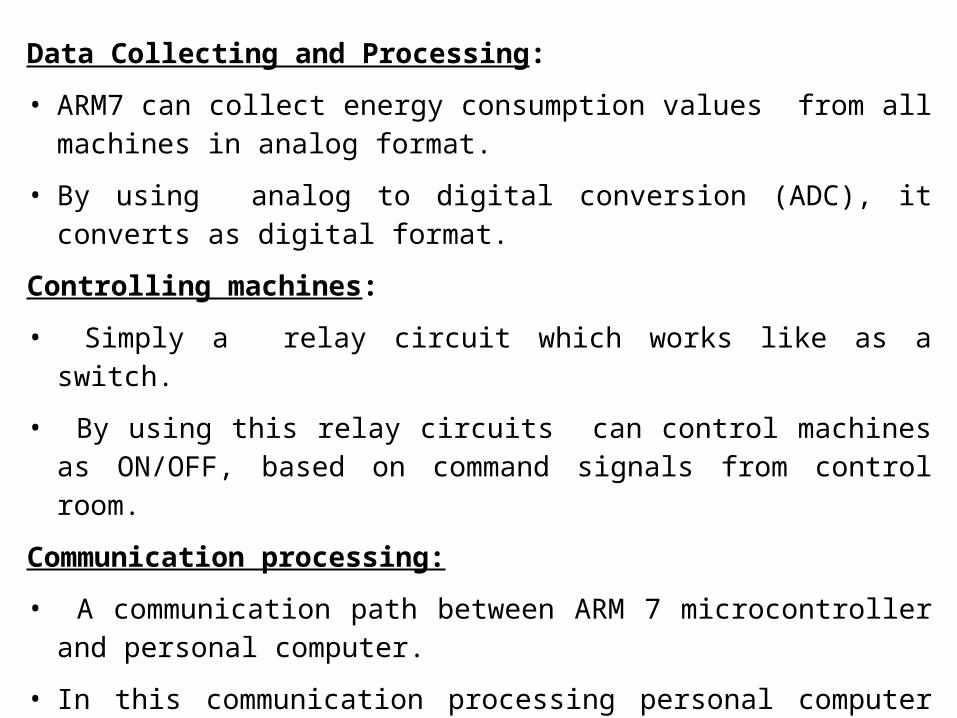
Data Collecting and Processing: • ARM7 can collect energy consumption values from all machines in analog format.
• By using analog to digital conversion (ADC), it converts as digital format.
Controlling machines:• Simply a relay circuit which works like as a switch.
• By using this relay circuits can control machines as ON/OFF, based on command signals from control room.
Communication processing:• A communication path between ARM 7 microcontroller and personal computer.
• In this communication processing personal computer will sends a command signals to ARM 7 and Personal Computer receives a response signals from (ARM 7).
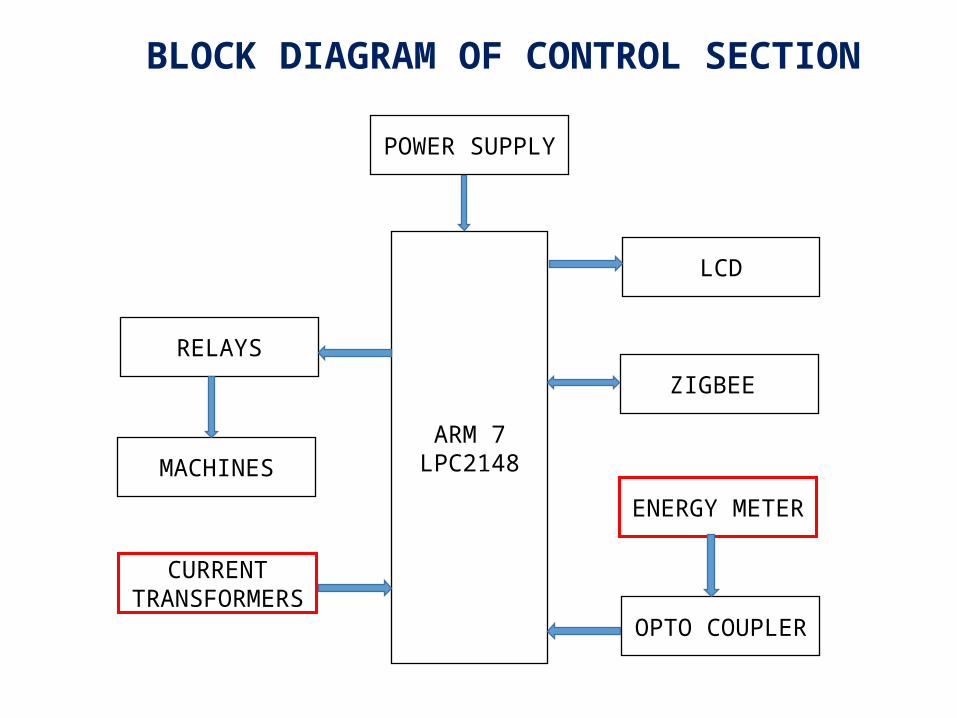
ARM 7LPC2148
POWER SUPPLY
CURRENT TRANSFORMERS
ENERGY METER
LCD
RELAYS
OPTO COUPLER
MACHINES
BLOCK DIAGRAM OF CONTROL SECTION
ZIGBEE
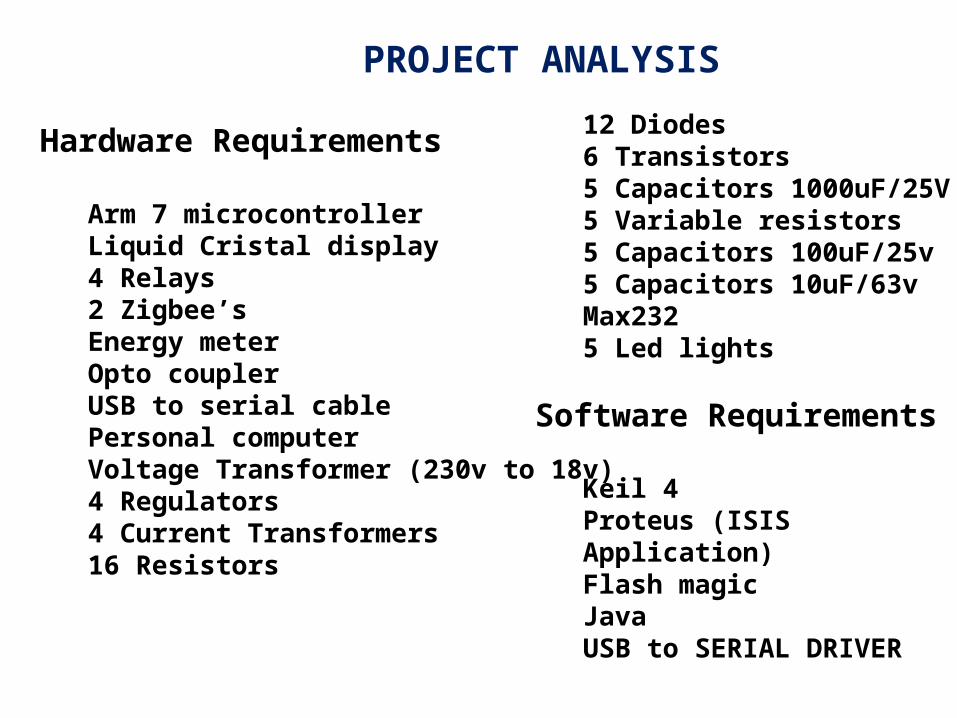
PROJECT ANALYSISHardware Requirements
Arm 7 microcontrollerLiquid Cristal display4 Relays 2 Zigbee’sEnergy meterOpto couplerUSB to serial cablePersonal computerVoltage Transformer (230v to 18v)4 Regulators4 Current Transformers16 Resistors
12 Diodes6 Transistors5 Capacitors 1000uF/25V5 Variable resistors5 Capacitors 100uF/25v5 Capacitors 10uF/63vMax2325 Led lights
Software Requirements
Keil 4Proteus (ISIS Application)Flash magicJavaUSB to SERIAL DRIVER
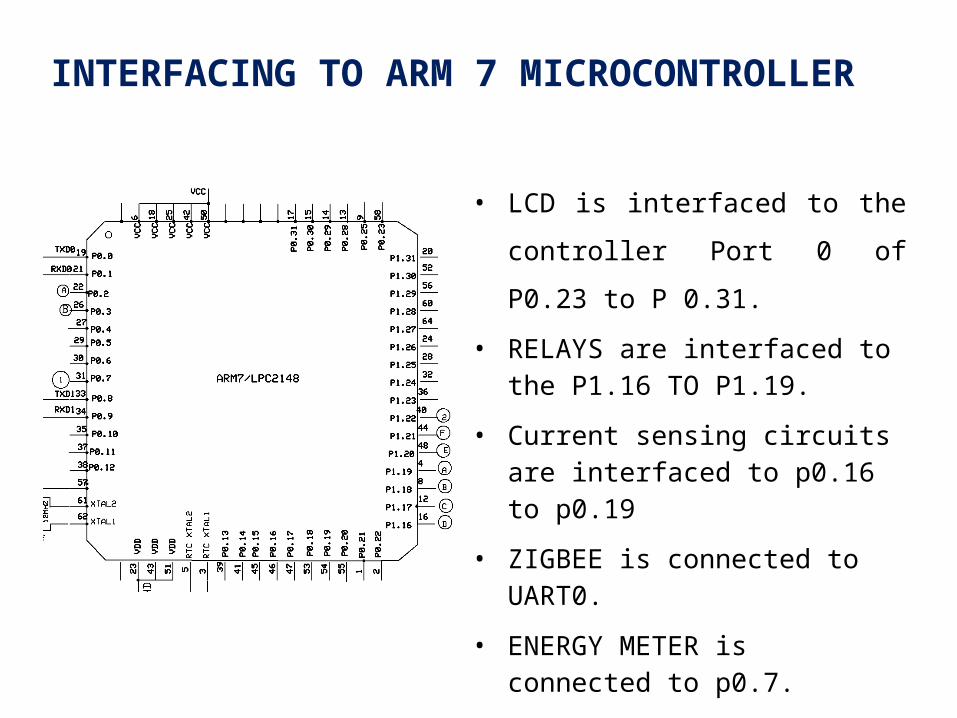
• LCD is interfaced to the controller Port 0 of P0.23 to P 0.31.
• RELAYS are interfaced to the P1.16 TO P1.19.
• Current sensing circuits are interfaced to p0.16 to p0.19
• ZIGBEE is connected to UART0.
• ENERGY METER is connected to p0.7.
INTERFACING TO ARM 7 MICROCONTROLLER
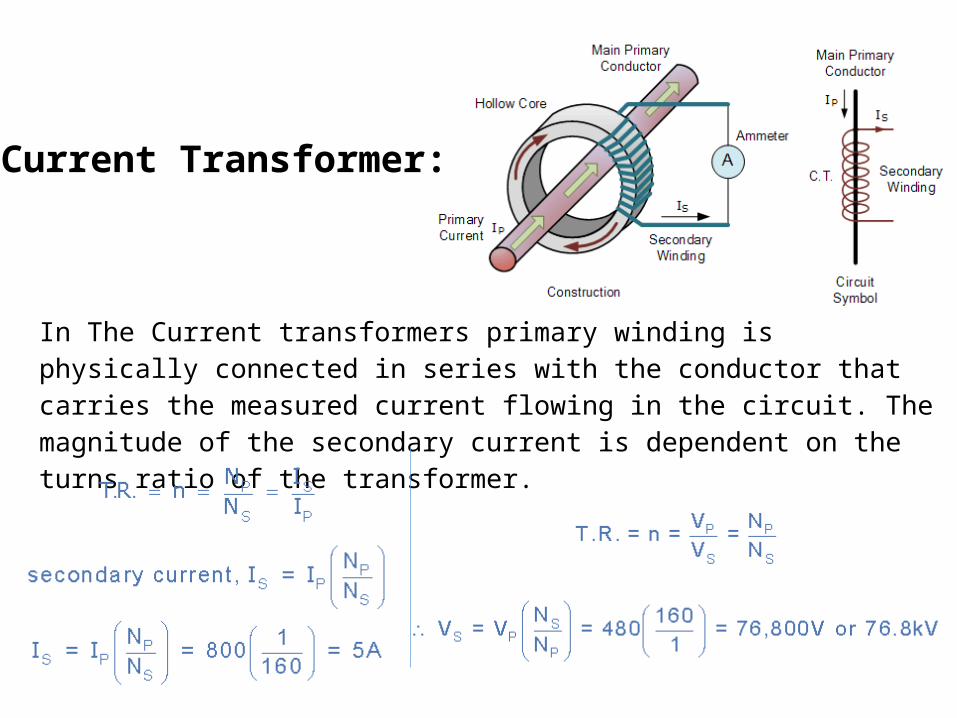
In The Current transformers primary winding is physically connected in series with the conductor that carries the measured current flowing in the circuit. The magnitude of the secondary current is dependent on the turns ratio of the transformer.
Current Transformer:
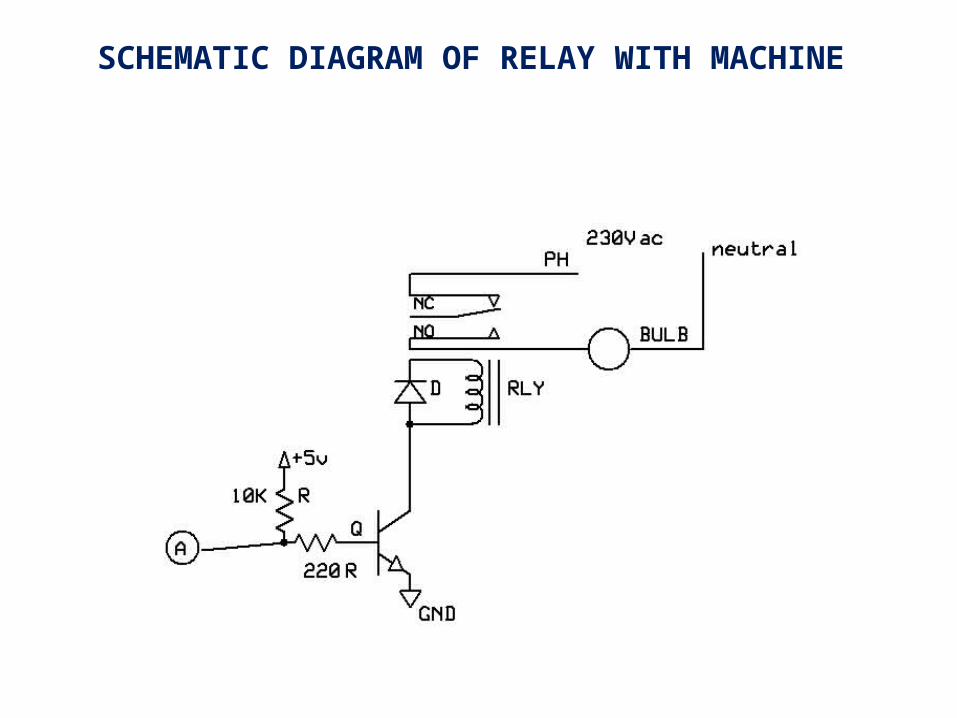
SCHEMATIC DIAGRAM OF RELAY WITH MACHINE
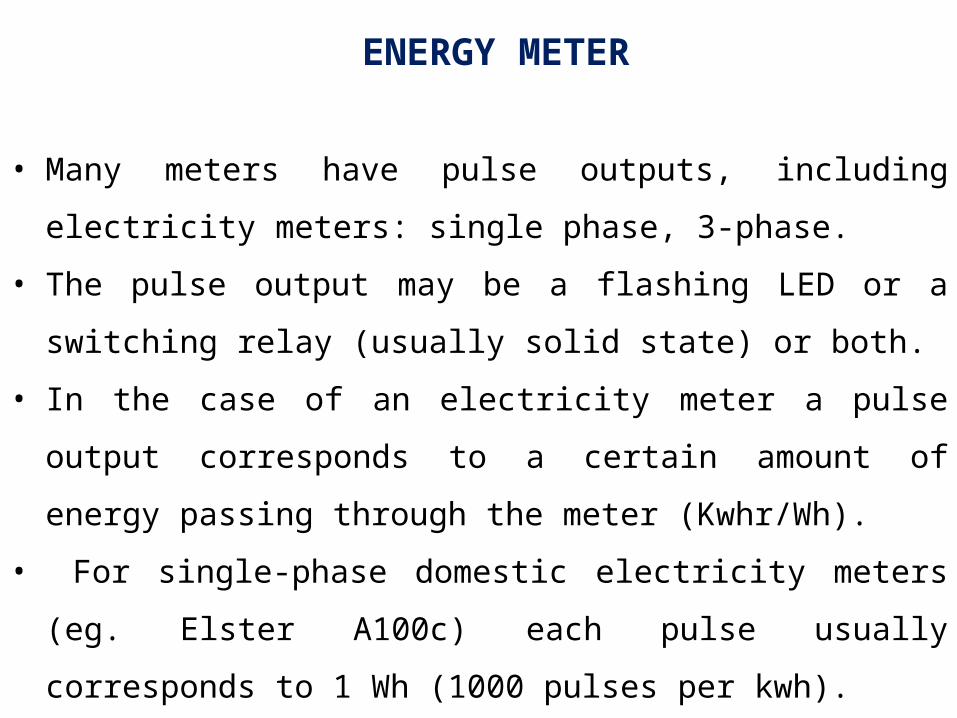
• Many meters have pulse outputs, including electricity meters: single phase, 3-phase.
• The pulse output may be a flashing LED or a switching relay (usually solid state) or both.
• In the case of an electricity meter a pulse output corresponds to a certain amount of energy passing through the meter (Kwhr/Wh).
• For single-phase domestic electricity meters (eg. Elster A100c) each pulse usually corresponds to 1 Wh (1000 pulses per kwh).
ENERGY METER
Wired / Switched output pulse detection
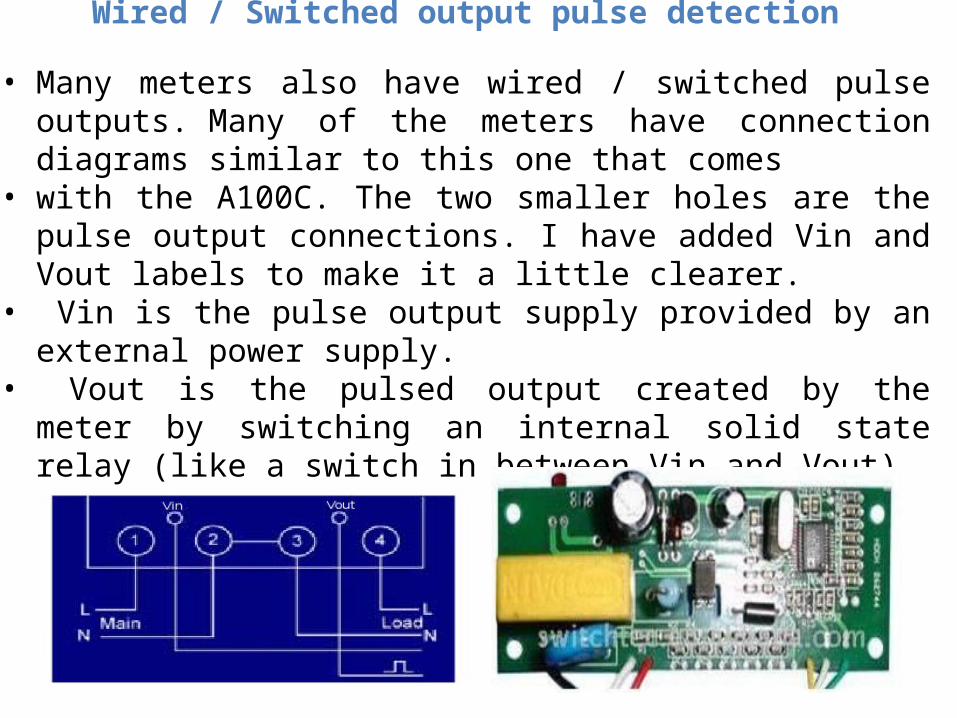
• Many meters also have wired / switched pulse outputs. Many of the meters have connection diagrams similar to this one that comes
• with the A100C. The two smaller holes are the pulse output connections. I have added Vin and Vout labels to make it a little clearer.
• Vin is the pulse output supply provided by an external power supply.
• Vout is the pulsed output created by the meter by switching an internal solid state relay (like a switch in between Vin and Vout)
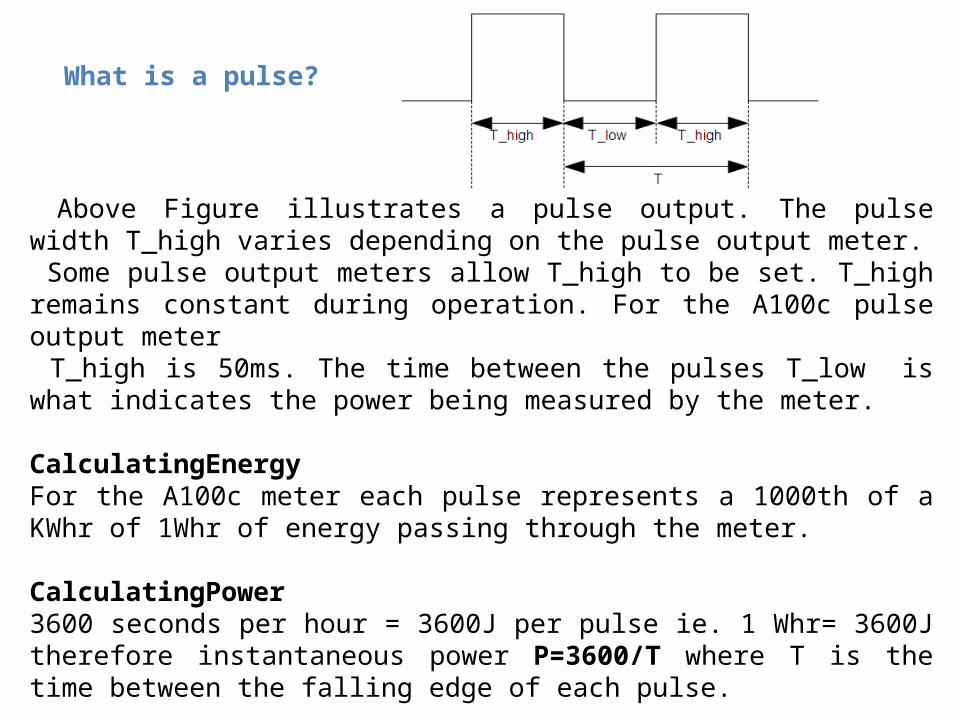
What is a pulse?
Above Figure illustrates a pulse output. The pulse width T_high varies depending on the pulse output meter. Some pulse output meters allow T_high to be set. T_high remains constant during operation. For the A100c pulse output meter T_high is 50ms. The time between the pulses T_low is what indicates the power being measured by the meter.
CalculatingEnergyFor the A100c meter each pulse represents a 1000th of a KWhr of 1Whr of energy passing through the meter.
CalculatingPower3600 seconds per hour = 3600J per pulse ie. 1 Whr= 3600Jtherefore instantaneous power P=3600/T where T is the time between the falling edge of each pulse.
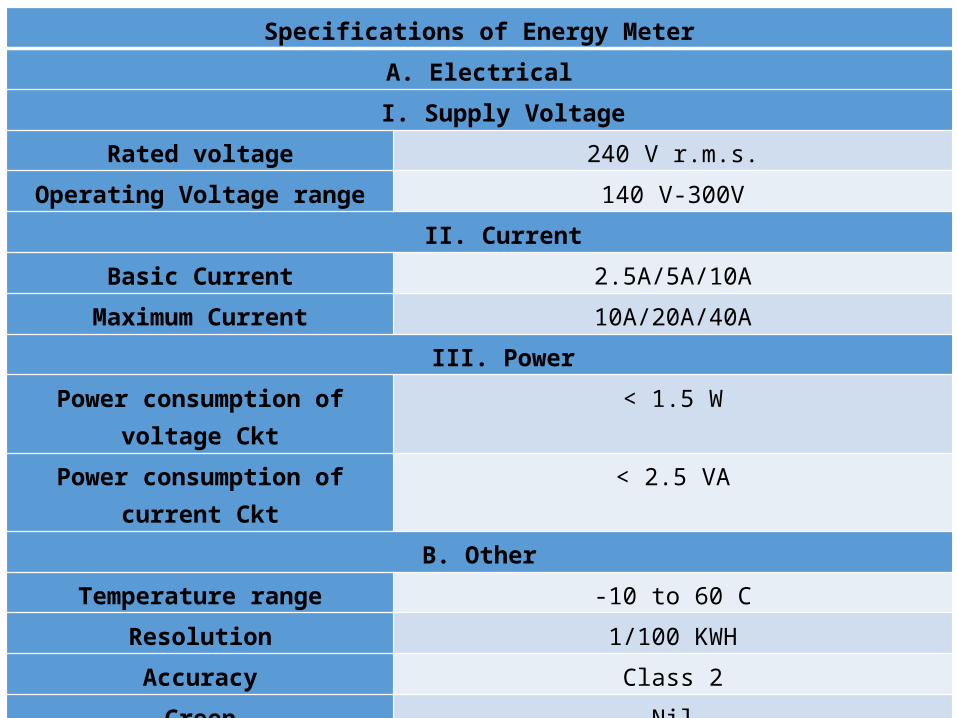
Specifications of Energy MeterA. ElectricalI. Supply Voltage
Rated voltage 240 V r.m.s.Operating Voltage range 140 V-300V
II. CurrentBasic Current 2.5A/5A/10A
Maximum Current 10A/20A/40AIII. Power
Power consumption of voltage Ckt
< 1.5 W
Power consumption of current Ckt
< 2.5 VA
B. OtherTemperature range -10 to 60 C
Resolution 1/100 KWHAccuracy Class 2Creep Nil
Starting current 0.4% of basic current
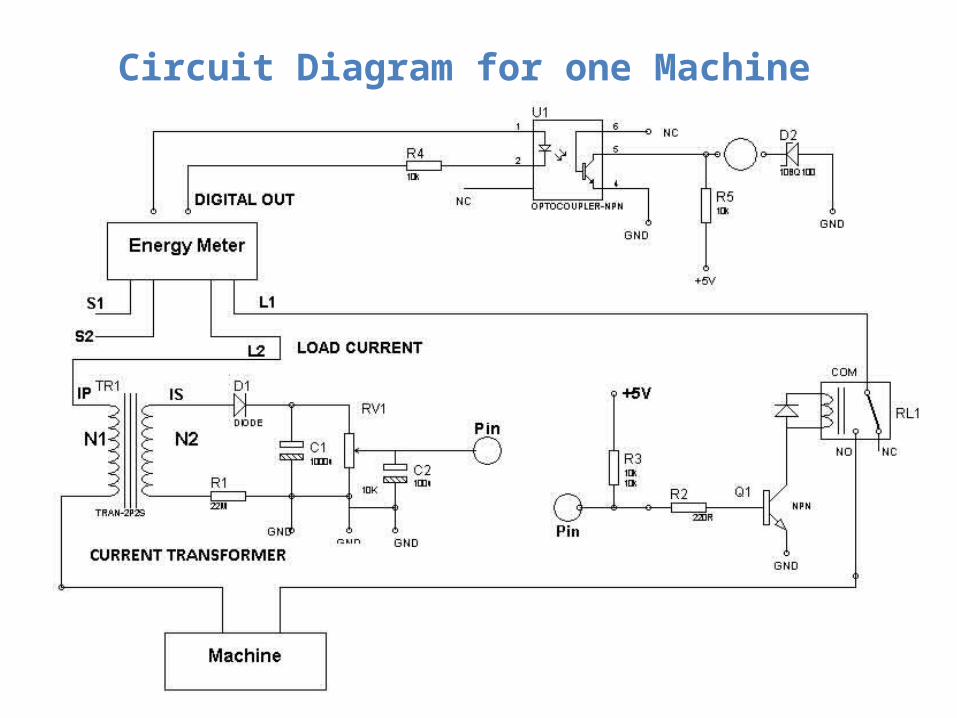
Circuit Diagram for one Machine
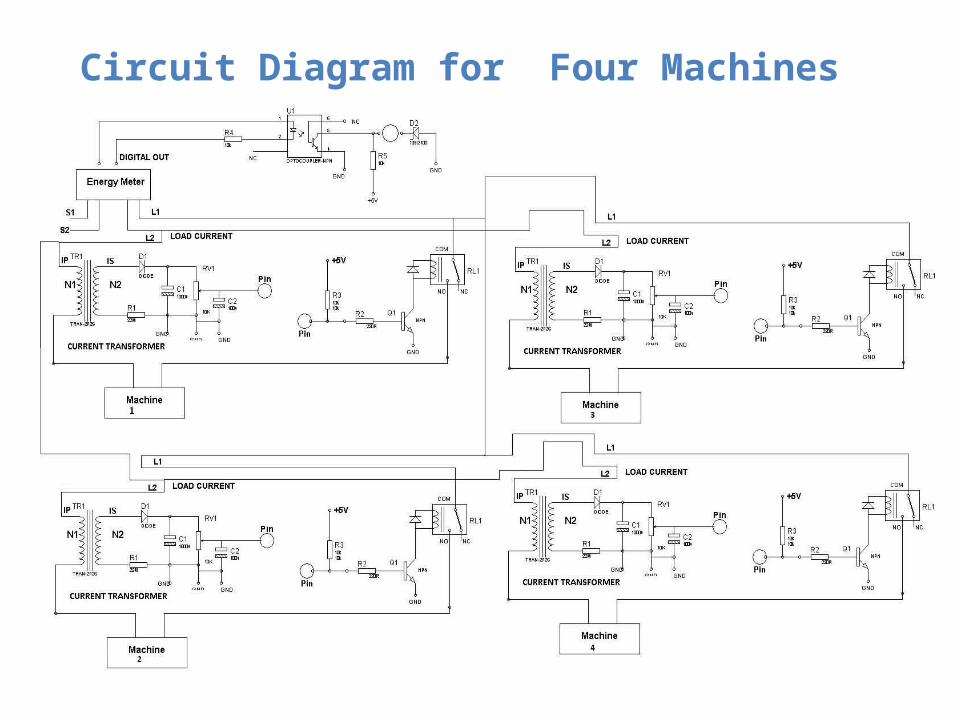
Circuit Diagram for Four Machines

JAVA FRONTEND APPLICATION DESIGN • In java frontend application can provide two panels, i.e. sender and receiver panel.
• In sender panel providing total power consumption value in units and each and every machine of current consumption values individually. This current consumption values will be updated every five seconds.
• In receiver panel is providing total units and individual current consumption values. This values also will update every five seconds. But user will see previous consumption values also.
• Here we designed two buttons for the purpose of power ON and OFF to each machine.
• Machine status also displayed that when machine is currently ON in frontend application shows machine is ON or when machine is currently OFF then in frontend application shows that machine is OFF.
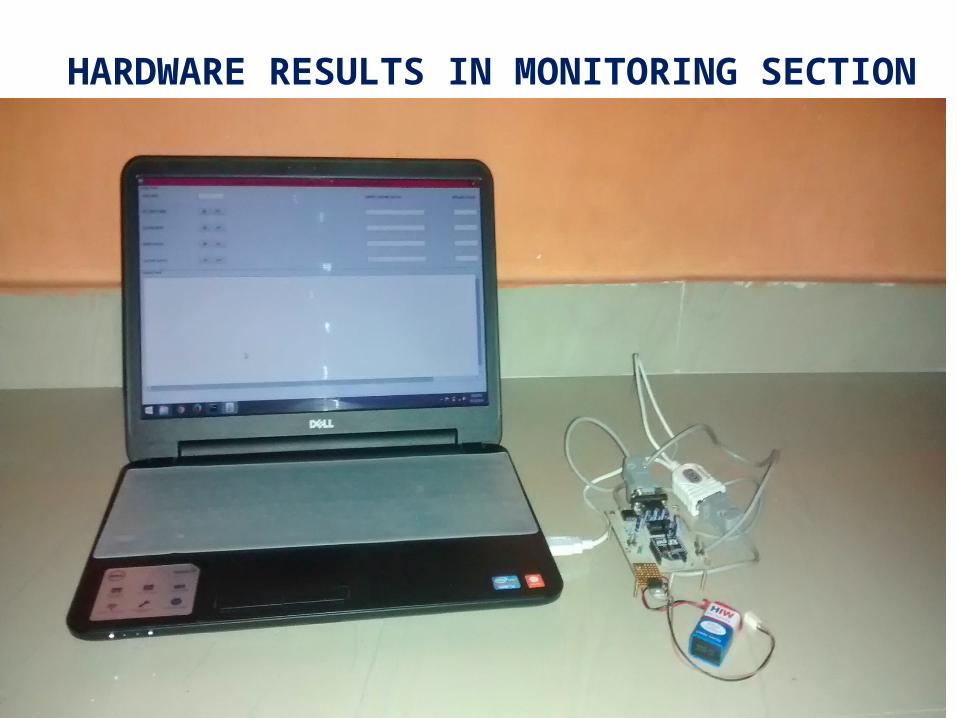
HARDWARE RESULTS IN MONITORING SECTION
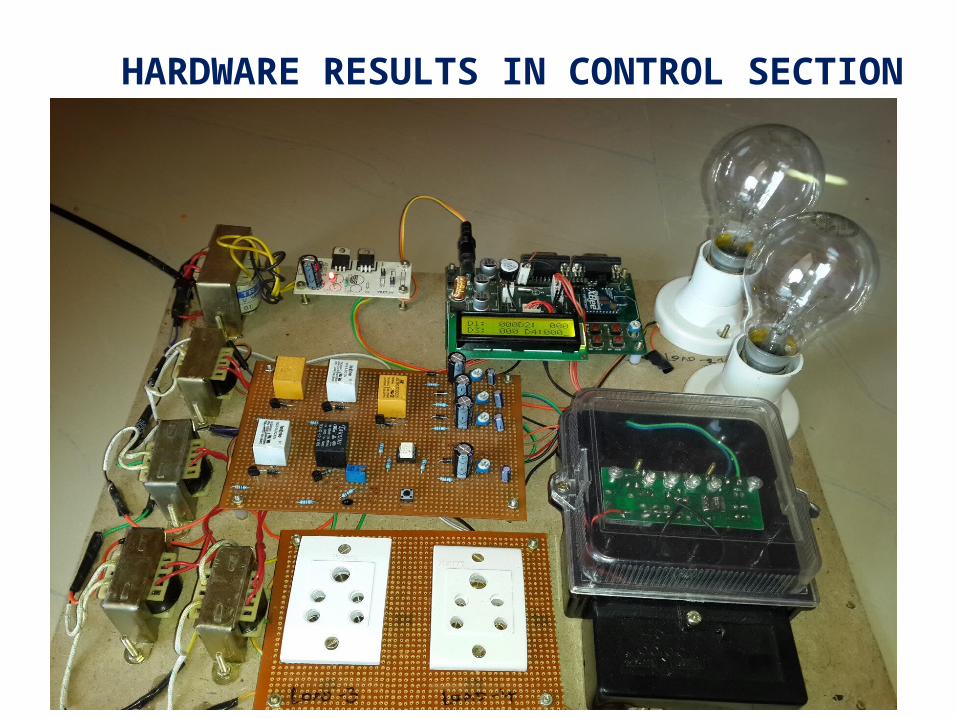
HARDWARE RESULTS IN CONTROL SECTION
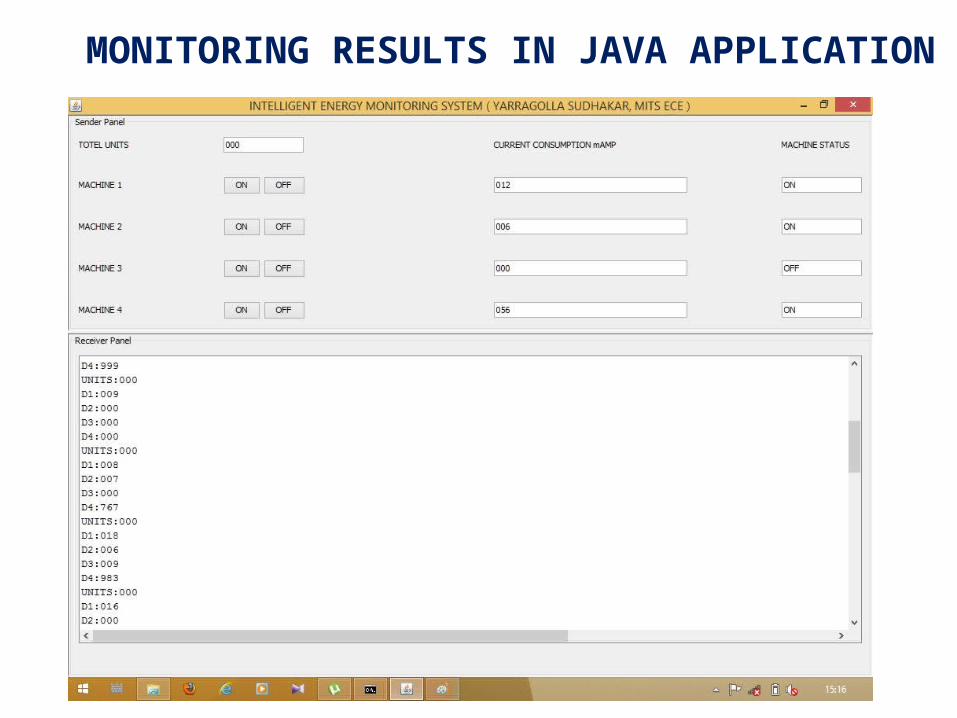
MONITORING RESULTS IN JAVA APPLICATION
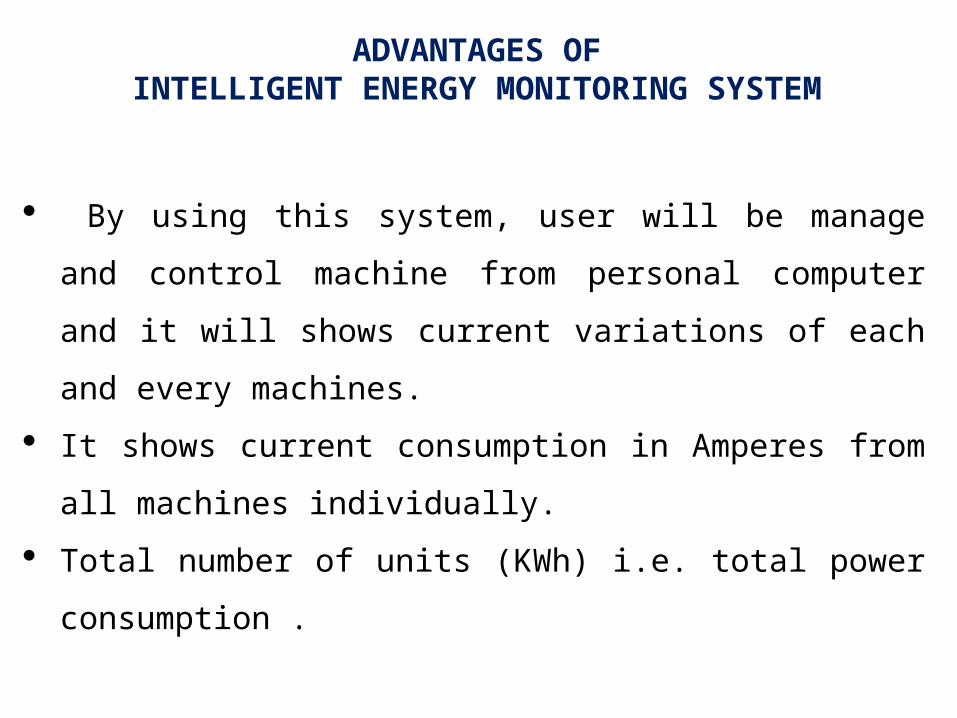
ADVANTAGES OFINTELLIGENT ENERGY MONITORING SYSTEM
By using this system, user will be manage and control machine from personal computer and it will shows current variations of each and every machines.
It shows current consumption in Amperes from all machines individually.
Total number of units (KWh) i.e. total power consumption .
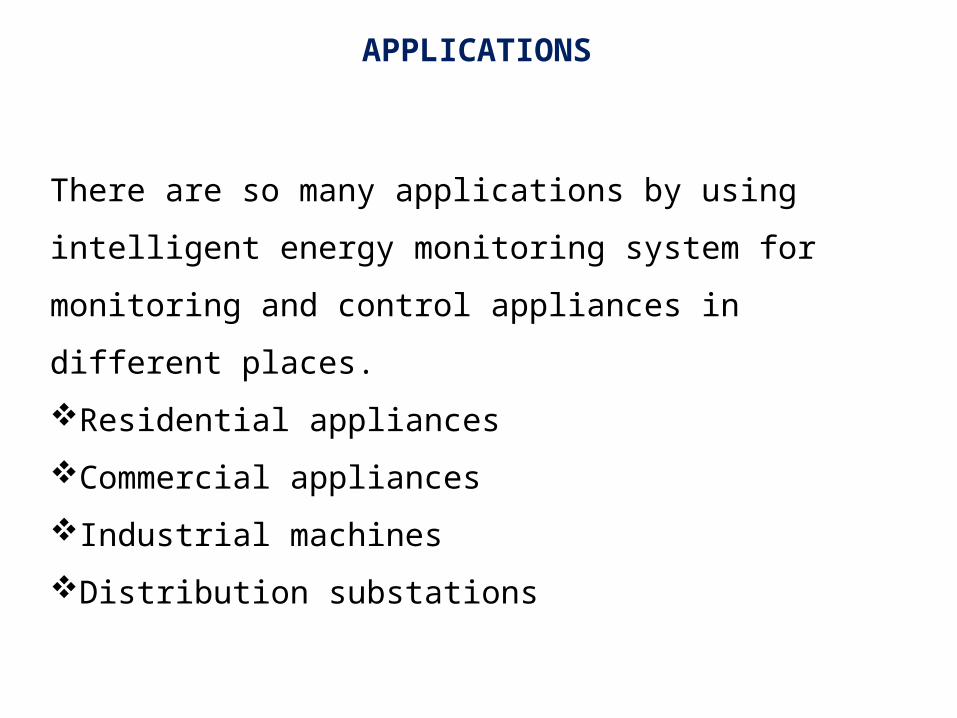
APPLICATIONS
There are so many applications by using intelligent energy monitoring system for monitoring and control appliances in different places.Residential appliancesCommercial appliancesIndustrial machinesDistribution substations
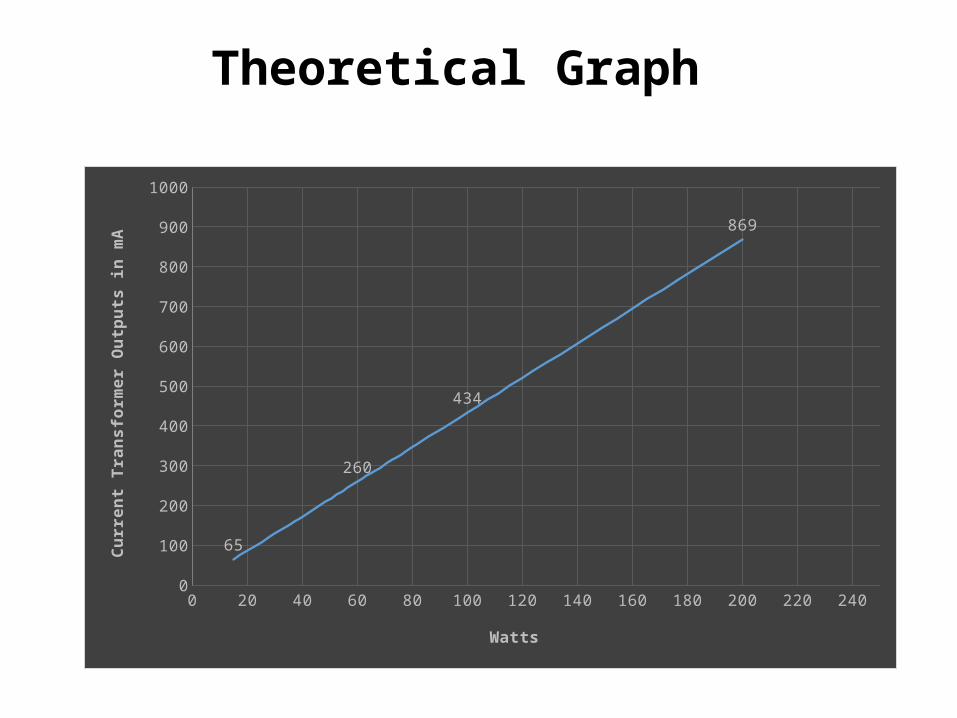
0 20 40 60 80 100 120 140 160 180 200 220 2400
100
200
300
400
500
600
700
800
900
1000
65
260
434
869
Watts
Curr
ent
Tran
sfor
mer
Outp
uts
in m
A
Theoretical Graph
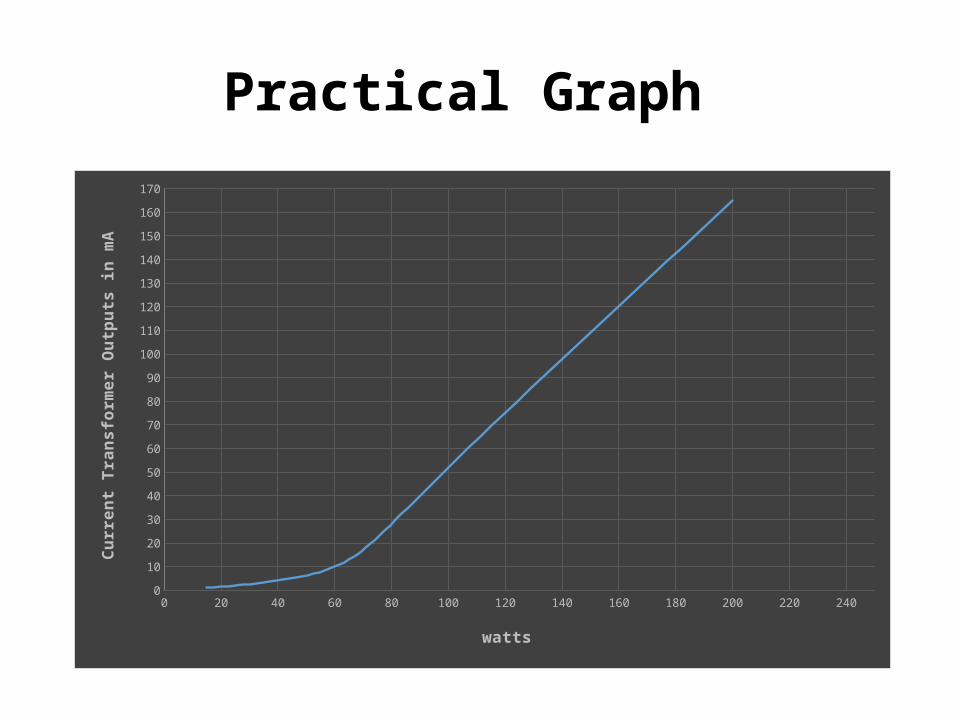
0 20 40 60 80 100 120 140 160 180 200 220 2400102030405060708090100110120130140150160170
watts
Curr
ent
Tran
sfor
mer
Outp
uts
in m
APractical Graph
CONCLUSION
• The controlling and monitoring of the machines’ is performed from remote location with GUI as a frontend application in PC.
• This measured electrical estimation provides the analytical analysis to manage the industry and also reduce the machines of maintenance on organization.
• We believe in reduction in consumption of power rather than concentrating on production of energy by spoiling the natural resources, this project implementation is done by considering this concept as motive.
To this system we can develop and adding some useful applications in future.
• GSM or smart card reader for prepaid energy metering.
• Developing more settings and options in GUI application
• Android application for smart phone users.
• Interface Smoke, fire detecting sensors and automatic alarms.
FUTURE SCOPE

THANK YOU
Related Documents


