Subsurface Flows from ring-diagram analysis Irene González Hernández National Solar Observatory Tucson, Arizona

Subsurface Flows from ring-diagram analysis Irene González Hernández National Solar Observatory Tucson, Arizona.
Dec 17, 2015
Welcome message from author
This document is posted to help you gain knowledge. Please leave a comment to let me know what you think about it! Share it to your friends and learn new things together.
Transcript
Subsurface Flows from ring-diagram analysis
Irene González Hernández
National Solar ObservatoryTucson, Arizona

Subsurface flows from ring-diagram analysis
Ring-diagrams technique
Differential rotation
Meridional circulation
Dynamics of active regions and
filaments
Results at different heights
Future work and conclusions

Ring-diagrams technique
Hill, F; 1988, ApJ,333,996
Patrón, J.; Hill, F.;Rhodes, E.J.,Jr.;Korzennik,S. G. and Cacciani,A., 1995, ApJ, 455,746
16o16
64 m
in
González Hernández, I.; 1998 PhD tesis, University of La Laguna
González Hernández, I.; Patrón,J.; Roca Cortés, T.; Bogart, R.S.; Hill, F.; Rhodes,E.J.,Jr.,2000, ApJ
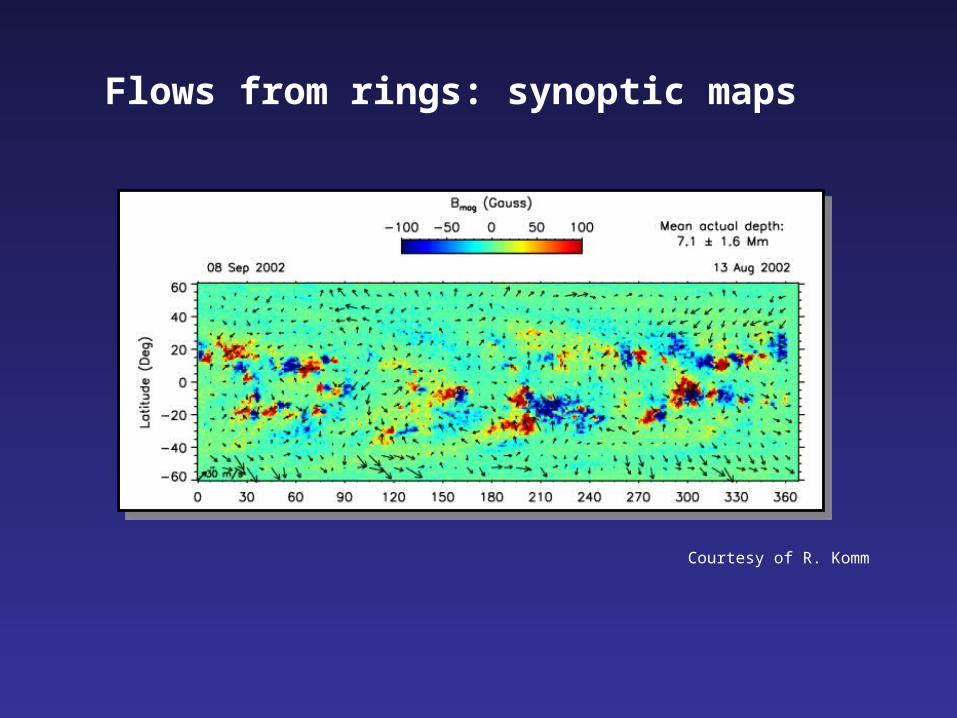
Flows from rings: synoptic maps
Courtesy of R. Komm
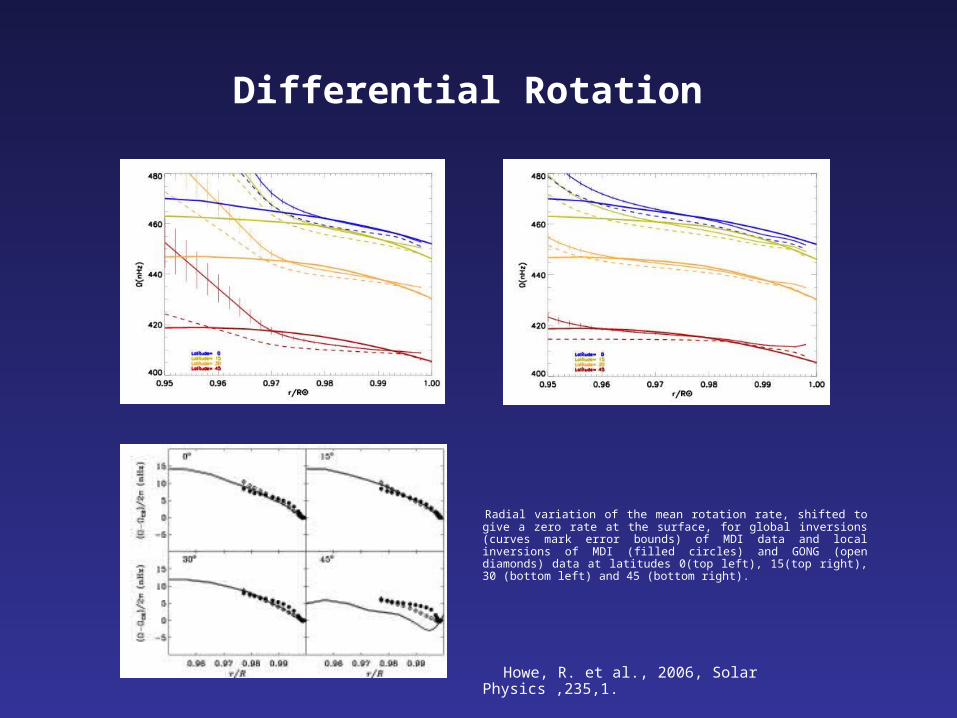
Differential Rotation
Radial variation of the mean rotation rate, shifted to give a zero rate at the surface, for global inversions (curves mark error bounds) of MDI data and local inversions of MDI (filled circles) and GONG (open diamonds) data at latitudes 0(top left), 15(top right), 30 (bottom left) and 45 (bottom right).
Howe, R. et al., 2006, Solar Physics ,235,1.
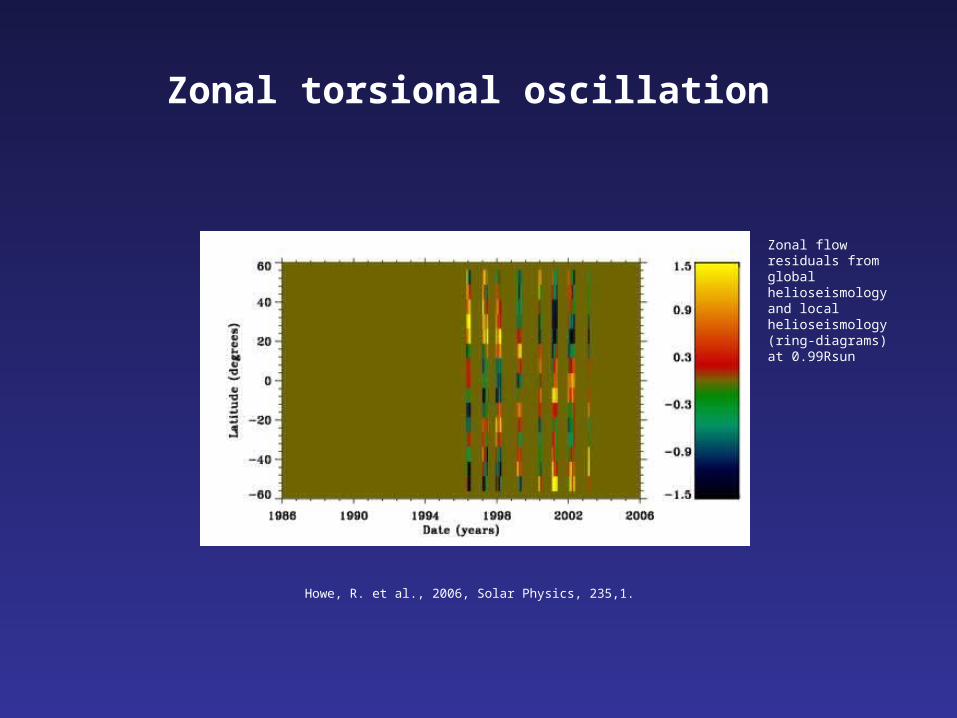
Zonal torsional oscillation
Howe, R. et al., 2006, Solar Physics, 235,1.
Zonal flow residuals from global helioseismology and local helioseismology (ring-diagrams) at 0.99Rsun
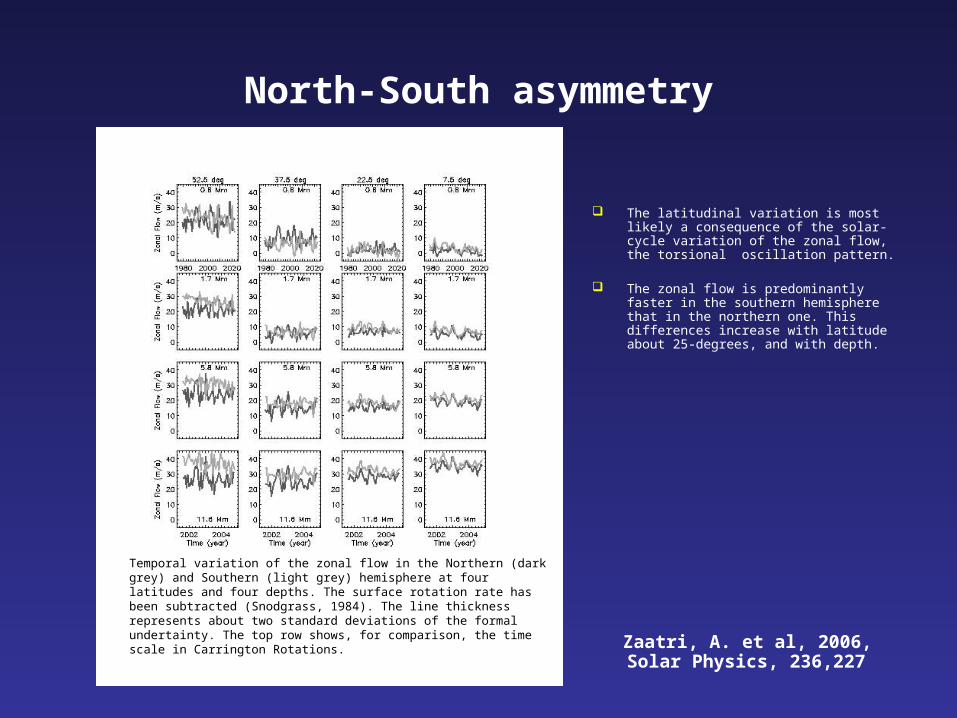
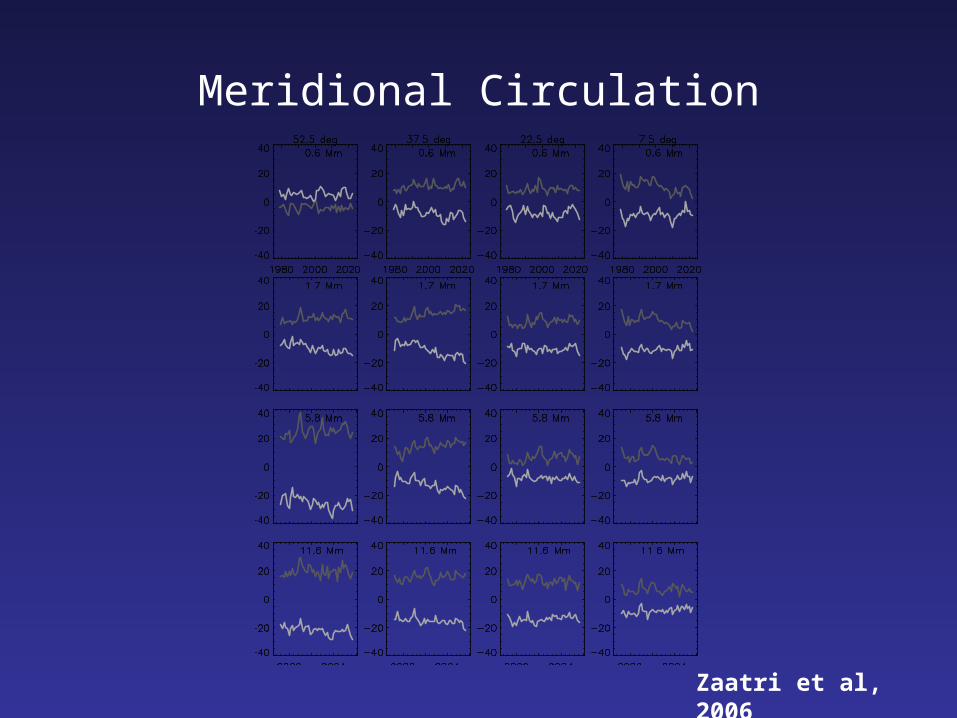
North-South asymmetry
The latitudinal variation is most likely a consequence of the solar-cycle variation of the zonal flow, the torsional oscillation pattern.
The zonal flow is predominantly faster in the southern hemisphere that in the northern one. This differences increase with latitude about 25-degrees, and with depth.
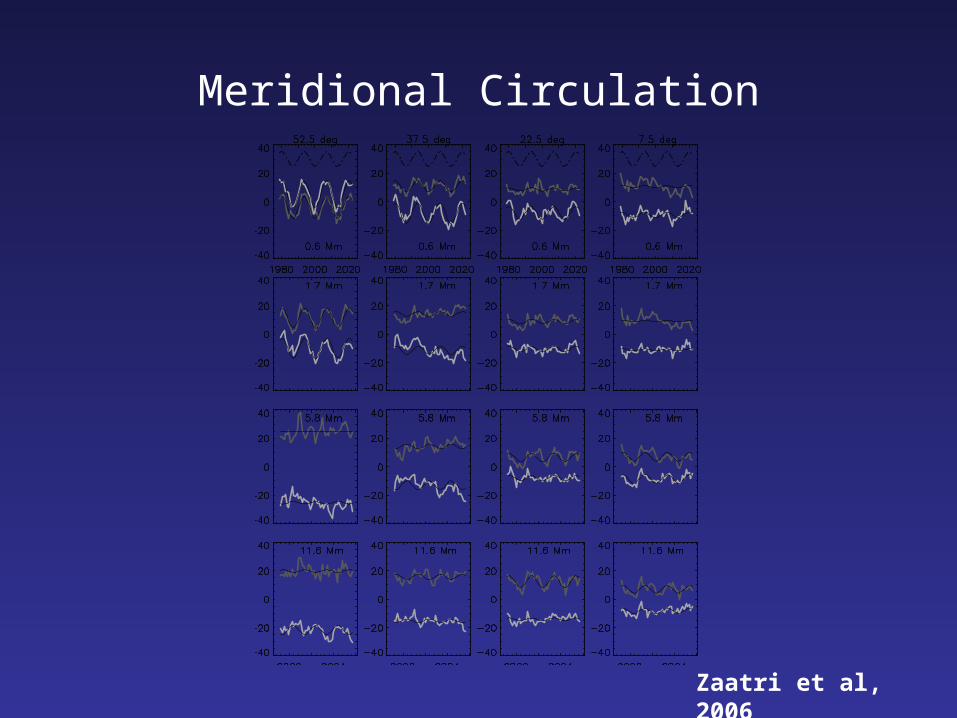
Zaatri, A. et al, 2006, Solar Physics, 236,227
Temporal variation of the zonal flow in the Northern (dark grey) and Southern (light grey) hemisphere at four latitudes and four depths. The surface rotation rate has been subtracted (Snodgrass, 1984). The line thickness represents about two standard deviations of the formal undertainty. The top row shows, for comparison, the time scale in Carrington Rotations.
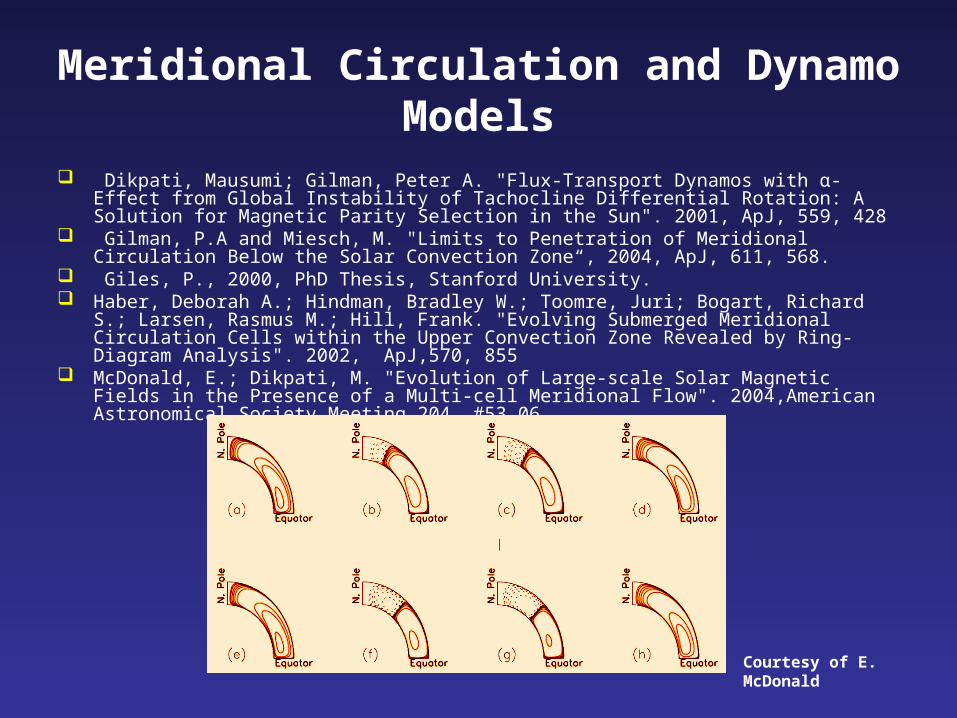
Meridional Circulation and Dynamo Models
Dikpati, Mausumi; Gilman, Peter A. "Flux-Transport Dynamos with α-Effect from Global Instability of Tachocline Differential Rotation: A Solution for Magnetic Parity Selection in the Sun". 2001, ApJ, 559, 428
Gilman, P.A and Miesch, M. "Limits to Penetration of Meridional Circulation Below the Solar Convection Zone“, 2004, ApJ, 611, 568.
Giles, P., 2000, PhD Thesis, Stanford University. Haber, Deborah A.; Hindman, Bradley W.; Toomre, Juri; Bogart, Richard S.; Larsen,
Rasmus M.; Hill, Frank. "Evolving Submerged Meridional Circulation Cells within the Upper Convection Zone Revealed by Ring-Diagram Analysis". 2002, ApJ,570, 855
McDonald, E.; Dikpati, M. "Evolution of Large-scale Solar Magnetic Fields in the Presence of a Multi-cell Meridional Flow". 2004,American Astronomical Society Meeting 204, #53.06
Courtesy of E. McDonald

A quick history of Meridional Circulation from rings
González Hernández, I, Patrόn, J, Bogart, R. S. and the SOI Ring Diagram Team, 1999, ApJ 510, L153
Basu, S. and Antia, H.M, 2002 Proceedings of the SOHO 11 Symposium 2003, ApJ 585, 553
Haber, D.A., Hindman, B. W.,Toomre, J., Bogart, R.S., Larsen, R.M., Hill, F.,2002, ApJ 570, 855.
González Hernández, I., Komm, R.,Hill,F.,Howe,R., Corbard, T. and Haber, D.A., 2006, ApJ 638, 576
Zaatri, A., Komm,R., Gonzalez Hernandez, I., Howe, R. and Corbard, T., 2006, SoPh 236, 227

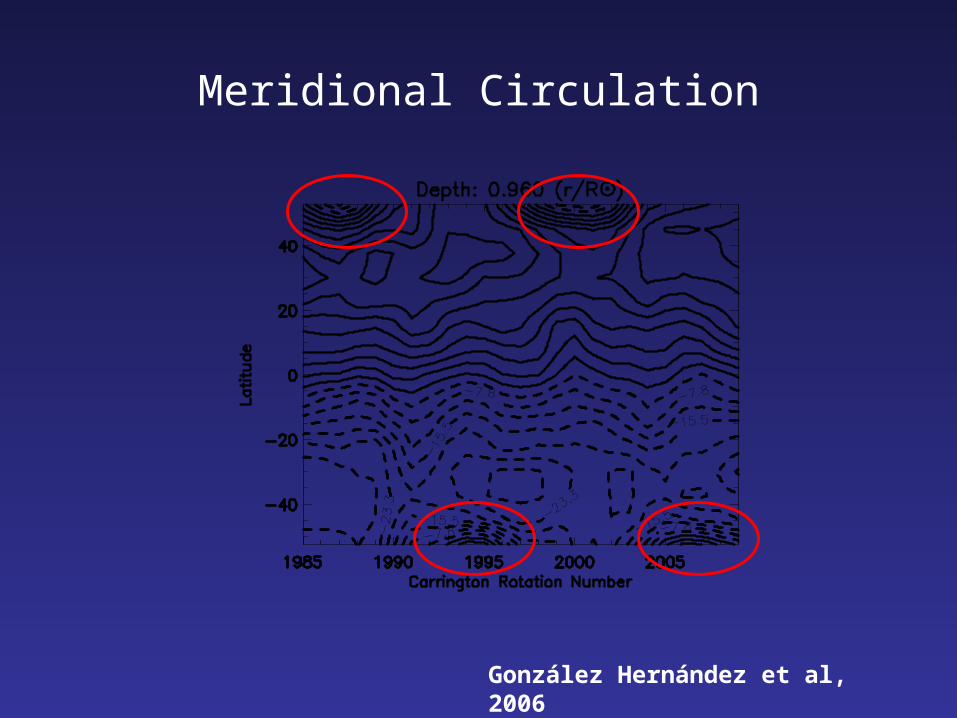
Meridional Circulation
Basu & Antia, 2003

Meridional Circulation
Haber et al, 2002
Meridional Circulation
González Hernández et al, 2006
Meridional Circulation
González Hernández et al, 2006
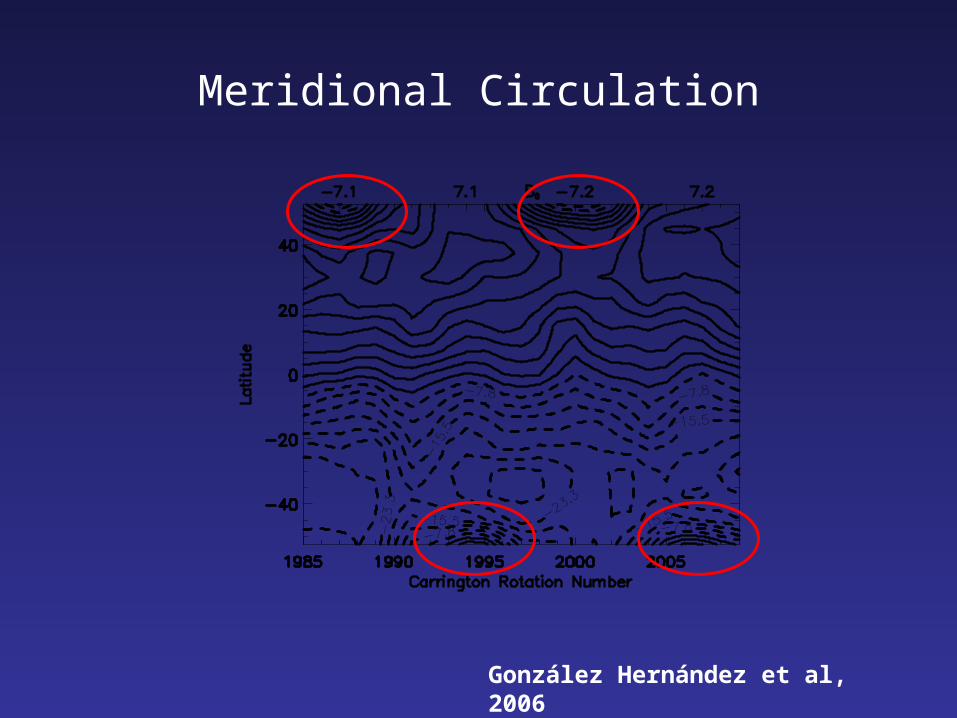
Meridional Circulation
Zaatri et al, 2006
Meridional Circulation
Zaatri et al, 2006

Recent results from MDI
Haber, D. et al., 2006

Recent results from GONG++

Recent results from GONG++
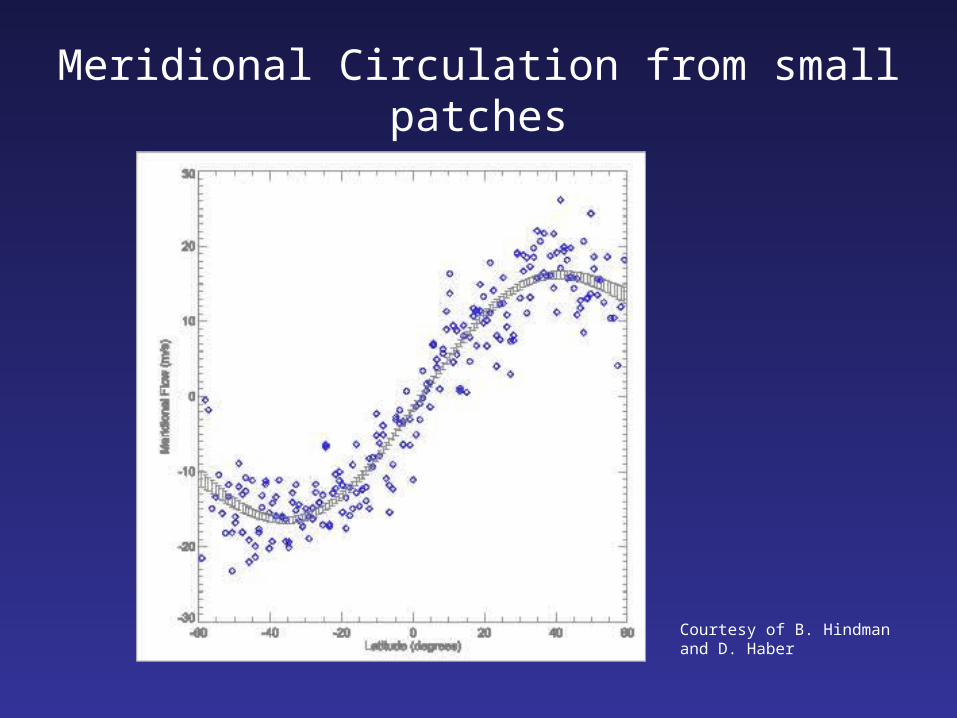
Meridional Circulation from small patches
Courtesy of B. Hindman and D. Haber
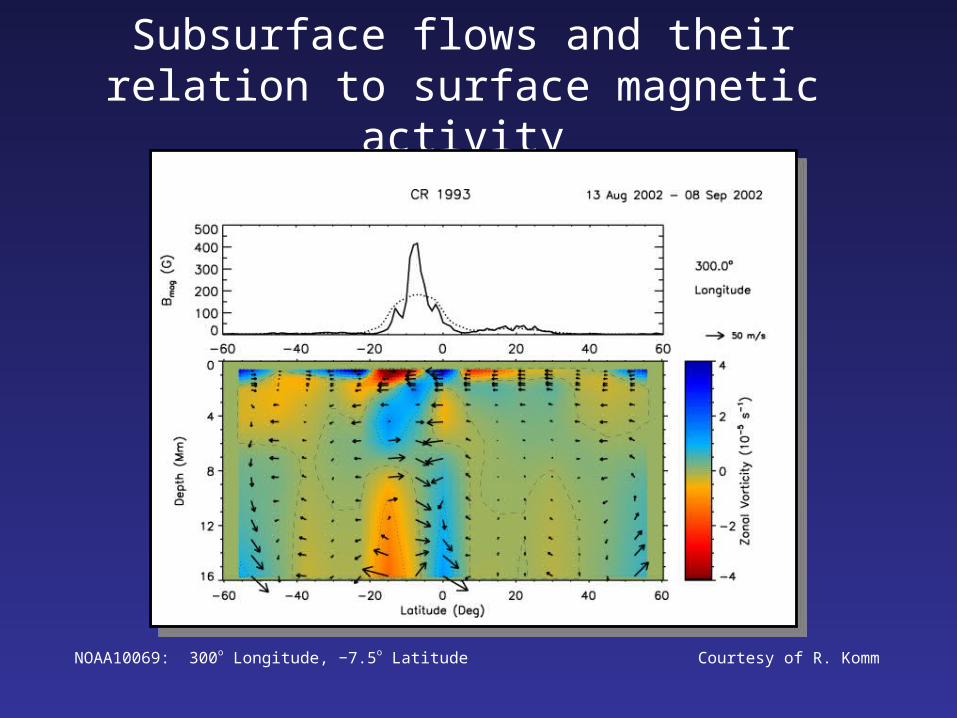
Subsurface flows and their relation to surface magnetic activity
NOAA10069: 300o Longitude, −7.5o Latitude Courtesy of R. Komm
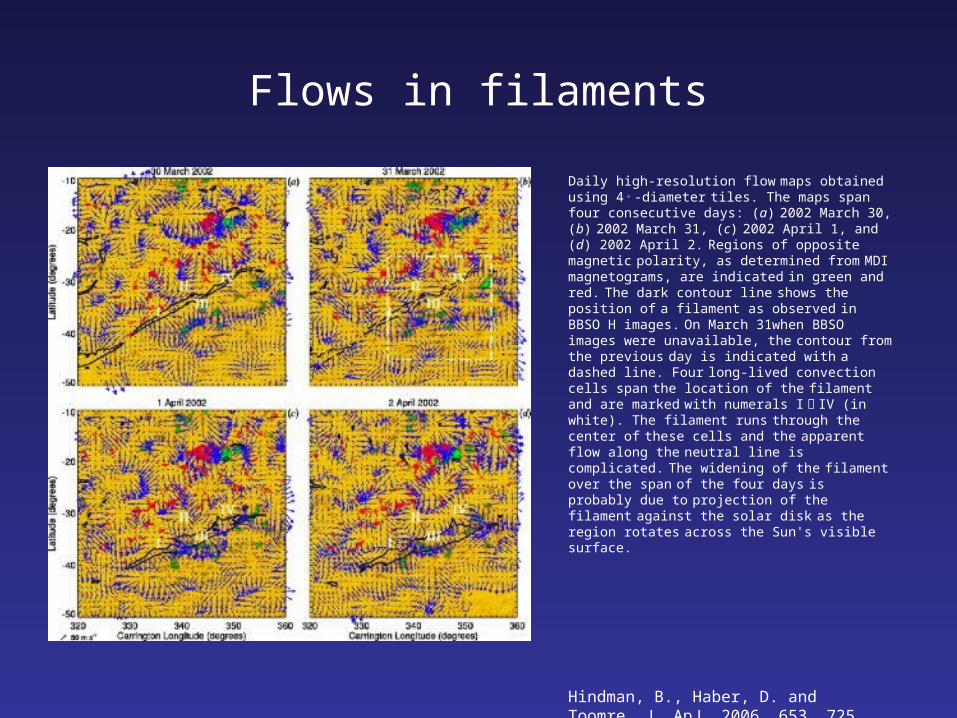
Flows in filaments
Daily high-resolution flow maps obtained using 4 。 -diameter tiles. The maps span four consecutive days: (a) 2002 March 30, (b) 2002 March 31, (c) 2002 April 1, and (d) 2002 April 2.
Regions of opposite magnetic polarity, as determined from MDI magnetograms, are indicated in green and red. The dark contour line
shows the position of a filament as observed in BBSO H images. On March 31when BBSO images were unavailable, the contour from the previous
day is indicated with a dashed line. Four long-lived convection cells span the location of the
filament and are marked with numerals I ミ IV (in
white). The filament runs through the center of
these cells and the apparent flow along the
neutral line is complicated. The widening of the
filament over the span of the four days is probably due to projection of the filament
against the solar disk as the region rotates
across the Sun's visible surface.
Hindman, B., Haber, D. and Toomre, J. ApJ, 2006, 653, 725

Flows in filaments
Daily high-resolution flow maps obtained using 2 。 -diameter tiles, zoomed in to cover the region outlined with the white dashed box in previous fig. The maps span the same four days displayed in the previous fig: (a) 2002 March 30, (b) 2002 March 31, (c) 2002 April 1, and (d) 2002 April 2. The finer resolution available in these maps
indicate that there is a complex interaction between the flow cells and photospheric magnetism.
Hindman, B., Haber, D. and Toomre, J. ApJ, 2006, 653, 725

Flows at different heights
Subsurface flow maps for Jan 18, 2003(left) and Jan 19, 2003 (right). Blue arrows show flows obtained from the Ni line and red from the K line.
Differences
Jain, K. et al, 2006
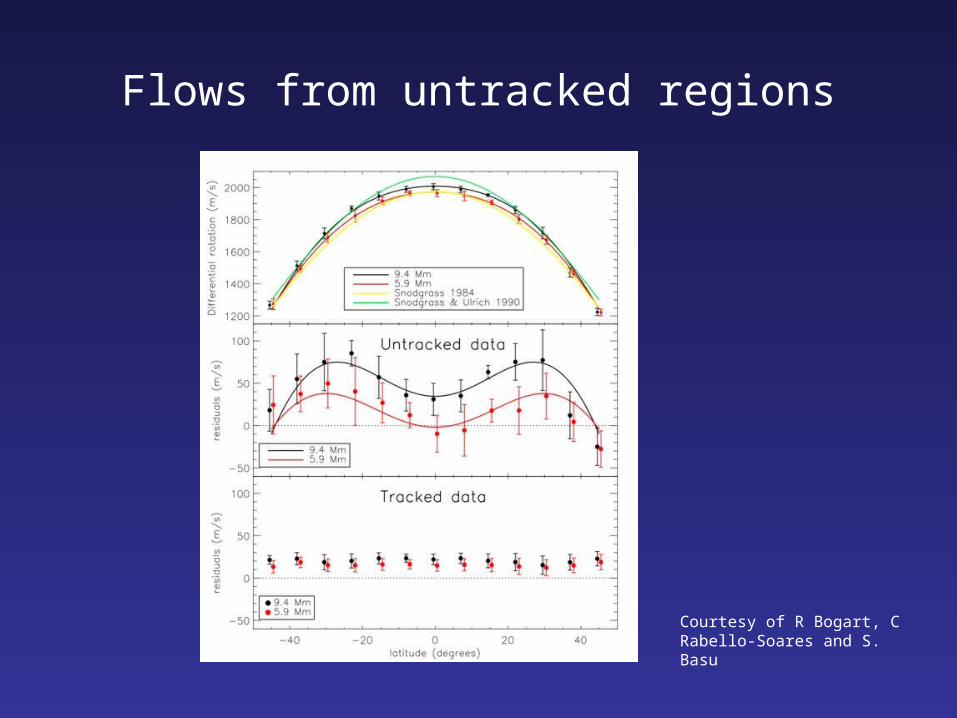
Flows from untracked regions
Courtesy of R Bogart, C Rabello-Soares and S. Basu
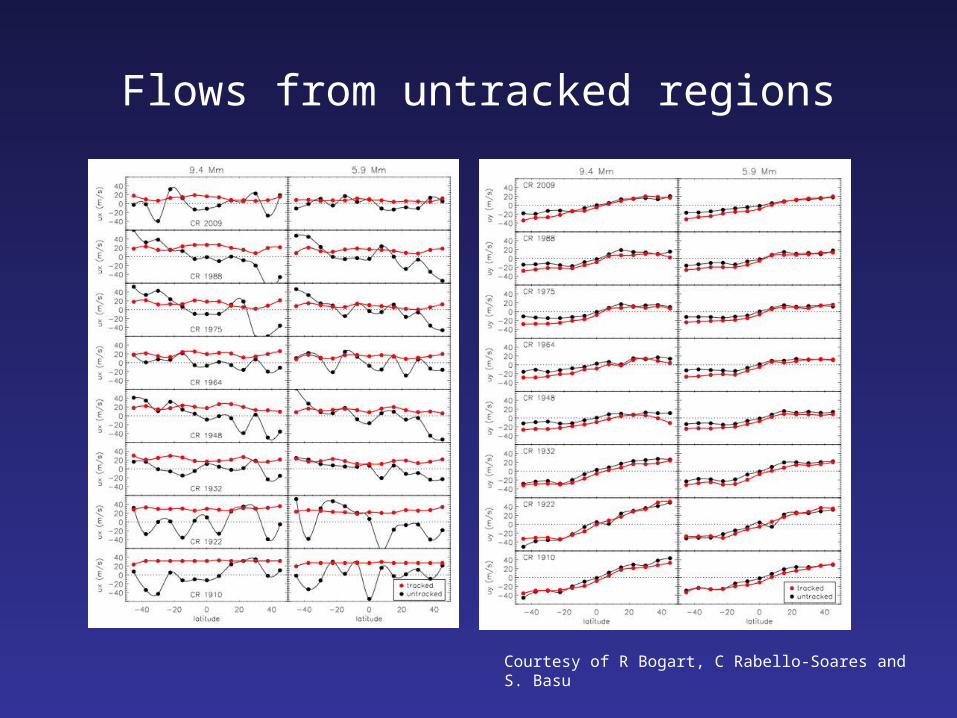
Flows from untracked regions
Courtesy of R Bogart, C Rabello-Soares and S. Basu

The future
GONG/MDI
3-Dimensional inversions
Large scale flows:
Foreshortening / Projection
Other high latitude effects
Flows in active areas
Effect of magnetic activity fitting method
More analysis
HMI (Solar Dynamics Observatory)
VIM (Solar Orbiter)

Ring analysis has made a significant contribution to the study of large scale flows from the surface to approx. 30Mm.
New results confirm the solar cycle dependence of meridional circulation close to the surface found by previous works, but show almost no dependence at deeper layers. Surface activity effect is being investigated.
Multi-cell circulation needs to be confirmed
HRRA: Flows in active regions and filaments
Several problems of the technique need to be addressed
We are limited in latitude to +/- 50 degrees Higher resolution observations (HMI) Observations off the ecliptic (Solar Orbiter mission)
The stellar connection: “Try to use dynamo models that do “well” in the solar case” (M.
Rempel)
Conclusions
Related Documents