Technical Paper No. 354 Subsistence Harvests in Northwest Alaska, Kivalina and Noatak, 2007 by James S. Magdanz, Nicole S. Braem, Brad C. Robbins, and David S. Koster August 2010 Alaska Department of Fish and Game Division of Subsistence

Welcome message from author
This document is posted to help you gain knowledge. Please leave a comment to let me know what you think about it! Share it to your friends and learn new things together.
Transcript
Technical Paper No. 354
Subsistence Harvests in Northwest Alaska, Kivalina and Noatak, 2007
by
James S. Magdanz,
Nicole S. Braem,
Brad C. Robbins,
and
David S. Koster
August 2010
Alaska Department of Fish and Game Division of Subsistence
Symbols and Abbreviations The following symbols and abbreviations, and others approved for the Système International d'Unités (SI), are used without definition in the reports by the Division of Subsistence. All others, including deviations from definitions listed below, are noted in the text at first mention, as well as in the titles or footnotes of tables, and in figure or figure captions. Weights and measures (metric) centimeter cm deciliter dL gram g hectare ha kilogram kg kilometer km liter L meter m milliliter mL millimeter mm Weights and measures (English) cubic feet per second ft3/s foot ft gallon gal inch in mile mi nautical mile nmi ounce oz pound lb quart qt yard yd Time and temperature day d degrees Celsius °C degrees Fahrenheit °F degrees kelvin K hour h minute min second s Physics and chemistry all atomic symbols alternating current AC ampere A calorie cal direct current DC hertz Hz horsepower hp hydrogen ion activity (negative log of) pH parts per million ppm parts per thousand ppt, ‰ volts V watts W
General all commonly-accepted abbreviations
e.g., Mr., Mrs., AM, PM, etc. all commonly-accepted professional
titles e.g., Dr., Ph.D., R.N., etc. Alaska Administrative Code AAC at @ compass directions: east E north N south S west W copyright © corporate suffixes: Company Co. Corporation Corp. Incorporated Inc. Limited Ltd. District of Columbia D.C. et alii (and others) et al. et cetera (and so forth) etc. exempli gratia (for example) e.g. Federal Information Code FIC id est (that is) i.e. latitude or longitude lat. or long. monetary symbols (U.S.) $, ¢ months (tables and figures): first three
letters (Jan,...,Dec) registered trademark ® trademark ™ United States (adjective) U.S. United States of America (noun) USA U.S.C. United States Code U.S. state use two-letter abbreviations (e.g., AK, WA)
Measures (fisheries) fork length FL mideye-to-fork MEF mideye-to-tail-fork METF standard length SL total length TL Mathematics, statistics all standard mathematical signs, symbols
and abbreviations alternate hypothesis HA base of natural logarithm e catch per unit effort CPUE coefficient of variation CV common test statistics (F, t, χ2, etc.) confidence interval CI correlation coefficient (multiple) R correlation coefficient (simple) r covariance cov degree (angular ) ° degrees of freedom df expected value E greater than > greater than or equal to ≥ harvest per unit effort HPUE less than < less than or equal to ≤ logarithm (natural) ln logarithm (base 10) log logarithm (specify base) log2, etc. minute (angular) ' not significant NS null hypothesis HO percent % probability P probability of a type I error (rejection of the
null hypothesis when true) α probability of a type II error (acceptance of
the null hypothesis when false) β second (angular) " standard deviation SD standard error SE variance population Var sample var
TECHNICAL PAPER NO. 354
SUBSISTENCE HARVESTS IN NORTHWEST ALASKA, KIVALINA AND NOATAK, 2007
by
James S. Magdanz, Division of Subsistence, Kotzebue
Nicole M. Braem,
Division of Subsistence, Fairbanks,
Brad C. Robbins, Division of Subsistence, Anchorage
and
David S. Koster
Division of Subsistence, Anchorage
Development and publication of this manuscript were partially financed by Stephen R. Braund & Associates (SRB&A), which was funded by Teck Alaska Inc. through Tetra Tech. SRB&A also provided funds to the Native Village of Noatak and the City of Kivalina to help conduct the surveys and review results.
Alaska Department of Fish and Game Division of Subsistence
P.O. Box 689 Kotzebue, AK, 99752-0689
August 2010
The Division of Subsistence Technical Paper series was established in 1979 and represents the most complete collection of information about customary and traditional uses of fish and wildlife resources in Alaska. The papers cover all regions of the state. Some papers were written in response to specific fish and game management issues. Others provide detailed, basic information on the subsistence uses of particular communities which pertain to a large number of scientific and policy questions.
Technical Paper series reports are available through the Alaska State Library and on the Internet: http://www.subsistence.adfg.state.ak.us. This publication has undergone editorial and professional review.
James S. Magdanz, Alaska Department of Fish and Game, Division of Subsistence,
P.O. Box 689, Kotzebue, AK, 99752-0689, USA
Nicole S. Braem, Alaska Department of Fish and Game, Division of Subsistence,
1300 College Rd., Fairbanks, AK, 99701-1551, USA
and
Brad C. Robbins and David S. Koster, Alaska Department of Fish and Game, Division of Subsistence
333 Raspberry Rd., Anchorage, AK, 99518-1565, USA This document should be cited as: Magdanz, J.S., N.S. Braem, B.C. Robbins, and D.S. Koster. 2010. Subsistence harvests in Northwest Alaska,
Kivalina and Noatak, 2007. Alaska Department of Fish and Game Division of Subsistence Technical Paper No. 354, Kotzebue.
The Alaska Department of Fish and Game (ADF&G) administers all programs and activities free from discrimination based on race, color, national origin, age, sex, religion, marital status, pregnancy, parenthood, or
disability. The department administers all programs and activities in compliance with Title VI of the Civil Rights Act of 1964, Section 504 of the Rehabilitation Act of 1973, Title II of the Americans with Disabilities Act (ADA) of
1990, the Age Discrimination Act of 1975, and Title IX of the Education Amendments of 1972. If you believe you have been discriminated against in any program, activity, or facility please write:
ADF&G ADA Coordinator, P.O. Box 115526, Juneau AK 99811-5526 U.S. Fish and Wildlife Service, 4040 N. Fairfax Drive, Suite 300 Webb, Arlington VA 22203
Office of Equal Opportunity, U.S. Department of the Interior, Washington DC 20240 The department’s ADA Coordinator can be reached via phone at the following numbers:
(VOICE) 907-465-6077, (Statewide Telecommunication Device for the Deaf) 1-800-478-3648, (Juneau TDD) 907-465-3646, or (FAX) 907-465-6078
For information on alternative formats and questions on this publication, please contact: ADF&G Division of Subsistence at www.subsistence.state.ak.us.
i
TABLE OF CONTENTS Page
LIST OF TABLES ......................................................................................................................................................... ii
LIST OF FIGURES ....................................................................................................................................................... ii
LIST OF APPENDICES ............................................................................................................................................. iii
ABSTRACT .................................................................................................................................................................. 1
INTRODUCTION ......................................................................................................................................................... 1
Background .................................................................................................................................................................... 1 Research Questions ........................................................................................................................................................ 4 General Study Objectives .............................................................................................................................................. 5 Rationale and Literature Review ................................................................................................................................... 5 Relationships with Alaska Native Communities ........................................................................................................... 7 METHODS .................................................................................................................................................................... 7
General Research Design ............................................................................................................................................... 8 Data Needs in 2008 ........................................................................................................................................................ 8 Variables ........................................................................................................................................................................ 9 Survey Instrument.......................................................................................................................................................... 9 Limitations and Assumptions ........................................................................................................................................ 9 Procedures ................................................................................................................................................................... 10 Data Analysis ............................................................................................................................................................... 14 COMPREHENSIVE SURVEY RESULTS–KIVALINA 2007 .................................................................................. 16
About Kivalina ............................................................................................................................................................ 17 Demographics .............................................................................................................................................................. 19 Wild Food Use and Harvests ....................................................................................................................................... 20 Harvest Areas .............................................................................................................................................................. 27 Harvest Assessments ................................................................................................................................................... 29 Jobs and Income .......................................................................................................................................................... 30 Food Security ............................................................................................................................................................... 34 Comparisons with Prior Results .................................................................................................................................. 35 COMPREHENSIVE SURVEY RESULTS–NOATAK 2007 ..................................................................................... 39
About Noatak ............................................................................................................................................................... 40 Demographics .............................................................................................................................................................. 41 Wild Food Use and Harvests ....................................................................................................................................... 41 Harvest Areas .............................................................................................................................................................. 49 Harvest Assessments ................................................................................................................................................... 51 Jobs and Income .......................................................................................................................................................... 53 Food Security ............................................................................................................................................................... 56 Comparisons with Prior Results .................................................................................................................................. 58 SUMMARY AND DISCUSSION .............................................................................................................................. 61
A Review of Subsistence Harvest Estimates ............................................................................................................... 61 Discussion .................................................................................................................................................................... 69
ii
Table of Contents, continued Page
ACKNOWLEDGEMENTS ......................................................................................................................................... 73
REFERENCES CITED ............................................................................................................................................... 74
APPENDIX A: LIST OF SPECIES HARVESTED IN NORTHWEST ALASKA FOR SUBSISTENCE USES ...... 78
APPENDIX B: FACTORS USED TO CONVERT INDIVIDUAL RESOURCES AND GALLONS TO POUNDS EDIBLE WEIGHT ............................................................................................................ 84
APPENDIX C: KIVALINA MAPS, 2007 .................................................................................................................. 88
APPENDIX D: NOATAK MAPS, 2007 ................................................................................................................... 103
APPENDIX E: KIVALINA SURVEY, 2007 ............................................................................................................ 120
LIST OF TABLES
Table Page 1. Research teams, Noatak and Kivalina, 2007. ................................................................................................ 10 2. Comprehensive survey samples, 1964–2007. ................................................................................................ 14 3. Estimated harvests of fish, game, and plant resources, Kivalina, 2007. ........................................................ 22 4. Estimated earned and other income, Kivalina, 2007. .................................................................................... 31 5. Employment, Kivalina, 2007. ........................................................................................................................ 33 6. Estimated harvests of fish, game, and plant resources, Noatak, 2007. .......................................................... 43 7. Estimated earned and other income, Noatak, 2007. ...................................................................................... 53 8. Employment, Noatak, 2007. .......................................................................................................................... 55
LIST OF FIGURES Figure Page 1. Northwest Alaska and the study communities for 2007. ................................................................................. 3 2. Salmon harvest page from comprehensive survey, Noatak, 2008. ................................................................ 11 3. Survey orientation session, Noatak, February 2008. ..................................................................................... 12 4. Survey orientation session, Kivalina, February 2008. ................................................................................... 13 5. Top 10 species ranked by estimated edible weight, Kivalina, 2007. ............................................................. 16 6. Kivalina in October 2007, looking northwest towards Point Hope. .............................................................. 18 7. Population profile, Kivalina, 2007. ............................................................................................................... 19 8. Percentages of households using or harvesting by species category, Kivalina, 2007. ................................... 20 9. Estimated pounds harvested by category, Kivalina, 2007. ............................................................................ 21 10. Fish harvest by gear type, Kivalina, 2007. .................................................................................................... 26 11. Harvest locations and search areas, all resources, Kivalina, 2007. ................................................................ 28 12. Harvest assessments, Kivalina, 2007. ............................................................................................................ 30 13. Top 10 income sources ranked by estimated amount, Kivalina, 2007. ......................................................... 32 14. Food security responses, Kivalina, 2007. ...................................................................................................... 34 15. Food security categories, Kivalina, 2007. ..................................................................................................... 35 16. Estimated total subsistence harvests and community populations, Kivalina, 1964–2007. ............................ 36 17. Estimated per capita subsistence harvests and community population, Kivalina, 1960–2007. ..................... 36 18. Estimated subsistence harvests of top 5 species, Kivalina, 1964–2007. ....................................................... 37 19. Estimated total subsistence harvests by category, Kivalina, 1964–2007. ...................................................... 38 20. Top 10 species ranked by estimated edible weight, Noatak, 2007. ............................................................... 39 21. Noatak in September 2009, looking northeast towards the Maiyumerak Mountains. ................................... 41 22. Population profile, Noatak. 2007. .................................................................................................................. 42
iii
List of Figures, continued Figure Page 23. Estimated pounds harvested by category, Noatak, 2007. .............................................................................. 42 24. Percentages of households using or harvesting by species category, Noatak, 2007. ..................................... 47 25. Fish harvests by gear type, Noatak, 2007. ..................................................................................................... 48 26. Harvest locations and search areas, all resources, Noatak, 2007. .................................................................. 50 27. Harvest assessments, Noatak, 2007. .............................................................................................................. 52 28. Top 10 income sources ranked by estimated amount, Noatak, 2007. ............................................................ 54 29. Food security responses, Noatak, 2007. ........................................................................................................ 57 30. Food security categories, Noatak, 2007. ....................................................................................................... 57 31. Estimated total subsistence harvests and community populations, Noatak, 1994–2007. .............................. 59 32. Estimated per capita subsistence harvests and community populations, Noatak, 1990–2007. ...................... 59 33. Estimated total subsistence harvests by category, Noatak, 1994–2007. ........................................................ 60 34. Community populations, Northwest Alaska, 1980–2007. ............................................................................. 62 35. Top 20 subsistence foods, by average edible weight, 1964–2007. ................................................................ 63 36. Subsistence harvest estimates for 6 small communities, Northwest Alaska, 1964–2007. ............................. 64 37. Subsistence harvest estimates, Kotzebue, 1986–2004. .................................................................................. 65 38. Estimated harvests per person in Northwest Alaska communities, 1964–2007. ........................................... 67 39. Estimated harvests per person in Northwest Alaska communities, 1980–2007. ........................................... 68 40. Associations between community populations and total subsistence harvests, 1982–2007. ......................... 69 41. Search areas and harvest locations, Kivalina and Noatak, 2007. .................................................................. 71
LIST OF APPENDICES Appendix Page A. List of species harvested in northwest Alaska for subsistence uses, and their English, Latin, and
Iñupiaq names. .............................................................................................................................................. 79 B. Factors used to convert individual resources and gallons to pounds edible weight. ..................................... 85 C. Kivalina maps, 2007. ..................................................................................................................................... 89 D. Noatak maps, 2007. ..................................................................................................................................... 104 E. Kivalina survey, 2007. ................................................................................................................................ 121
1
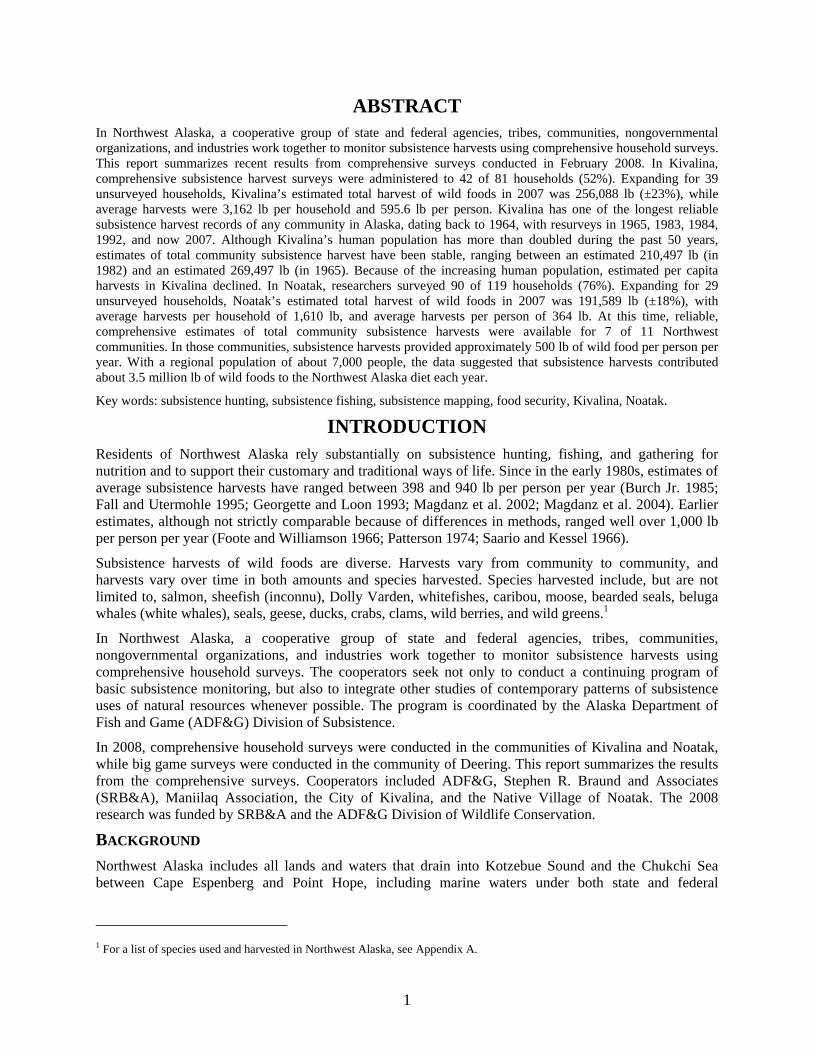
ABSTRACT In Northwest Alaska, a cooperative group of state and federal agencies, tribes, communities, nongovernmental organizations, and industries work together to monitor subsistence harvests using comprehensive household surveys. This report summarizes recent results from comprehensive surveys conducted in February 2008. In Kivalina, comprehensive subsistence harvest surveys were administered to 42 of 81 households (52%). Expanding for 39 unsurveyed households, Kivalina’s estimated total harvest of wild foods in 2007 was 256,088 lb (±23%), while average harvests were 3,162 lb per household and 595.6 lb per person. Kivalina has one of the longest reliable subsistence harvest records of any community in Alaska, dating back to 1964, with resurveys in 1965, 1983, 1984, 1992, and now 2007. Although Kivalina’s human population has more than doubled during the past 50 years, estimates of total community subsistence harvest have been stable, ranging between an estimated 210,497 lb (in 1982) and an estimated 269,497 lb (in 1965). Because of the increasing human population, estimated per capita harvests in Kivalina declined. In Noatak, researchers surveyed 90 of 119 households (76%). Expanding for 29 unsurveyed households, Noatak’s estimated total harvest of wild foods in 2007 was 191,589 lb (±18%), with average harvests per household of 1,610 lb, and average harvests per person of 364 lb. At this time, reliable, comprehensive estimates of total community subsistence harvests were available for 7 of 11 Northwest communities. In those communities, subsistence harvests provided approximately 500 lb of wild food per person per year. With a regional population of about 7,000 people, the data suggested that subsistence harvests contributed about 3.5 million lb of wild foods to the Northwest Alaska diet each year.
Key words: subsistence hunting, subsistence fishing, subsistence mapping, food security, Kivalina, Noatak.
INTRODUCTION Residents of Northwest Alaska rely substantially on subsistence hunting, fishing, and gathering for nutrition and to support their customary and traditional ways of life. Since in the early 1980s, estimates of average subsistence harvests have ranged between 398 and 940 lb per person per year (Burch Jr. 1985; Fall and Utermohle 1995; Georgette and Loon 1993; Magdanz et al. 2002; Magdanz et al. 2004). Earlier estimates, although not strictly comparable because of differences in methods, ranged well over 1,000 lb per person per year (Foote and Williamson 1966; Patterson 1974; Saario and Kessel 1966).
Subsistence harvests of wild foods are diverse. Harvests vary from community to community, and harvests vary over time in both amounts and species harvested. Species harvested include, but are not limited to, salmon, sheefish (inconnu), Dolly Varden, whitefishes, caribou, moose, bearded seals, beluga whales (white whales), seals, geese, ducks, crabs, clams, wild berries, and wild greens.1
In Northwest Alaska, a cooperative group of state and federal agencies, tribes, communities, nongovernmental organizations, and industries work together to monitor subsistence harvests using comprehensive household surveys. The cooperators seek not only to conduct a continuing program of basic subsistence monitoring, but also to integrate other studies of contemporary patterns of subsistence uses of natural resources whenever possible. The program is coordinated by the Alaska Department of Fish and Game (ADF&G) Division of Subsistence.
In 2008, comprehensive household surveys were conducted in the communities of Kivalina and Noatak, while big game surveys were conducted in the community of Deering. This report summarizes the results from the comprehensive surveys. Cooperators included ADF&G, Stephen R. Braund and Associates (SRB&A), Maniilaq Association, the City of Kivalina, and the Native Village of Noatak. The 2008 research was funded by SRB&A and the ADF&G Division of Wildlife Conservation.
BACKGROUND Northwest Alaska includes all lands and waters that drain into Kotzebue Sound and the Chukchi Sea between Cape Espenberg and Point Hope, including marine waters under both state and federal
1 For a list of species used and harvested in Northwest Alaska, see Appendix A.
2
jurisdictions. A variety of similar, but not always identical, political boundaries encompassed Northwest Alaska, including:
• The Northwest Arctic Borough (a political subset of the State of Alaska).
• The NANA Region (an Alaska Native corporation).
• The Northwest Arctic Region (a federal subsistence management area).
• The Kotzebue Area (a fishing regulatory area that extends south to Cape Prince of Wales).
• ADF&G Game Management Unit 23 (a hunting regulatory area that extends north to Cape Lisburne).
Northwest Alaska encompasses about 100,000 km2 of land, about the same size as the state of Ohio. The project area includes both state and federal waters used for subsistence fishing, such as the Noatak River, Kobuk River, Selawik River, Buckland River, Goodhope River, Kotzebue Sound, near shore waters of the Chukchi Sea, and numerous coastal lagoons. The area includes portions of the Bering Land Bridge National Preserve and Gates of the Arctic National Park. It also includes the entire Kobuk Valley National Park, Cape Krusenstern National Monument, Noatak National Preserve, and Selawik National Wildlife Refuge.
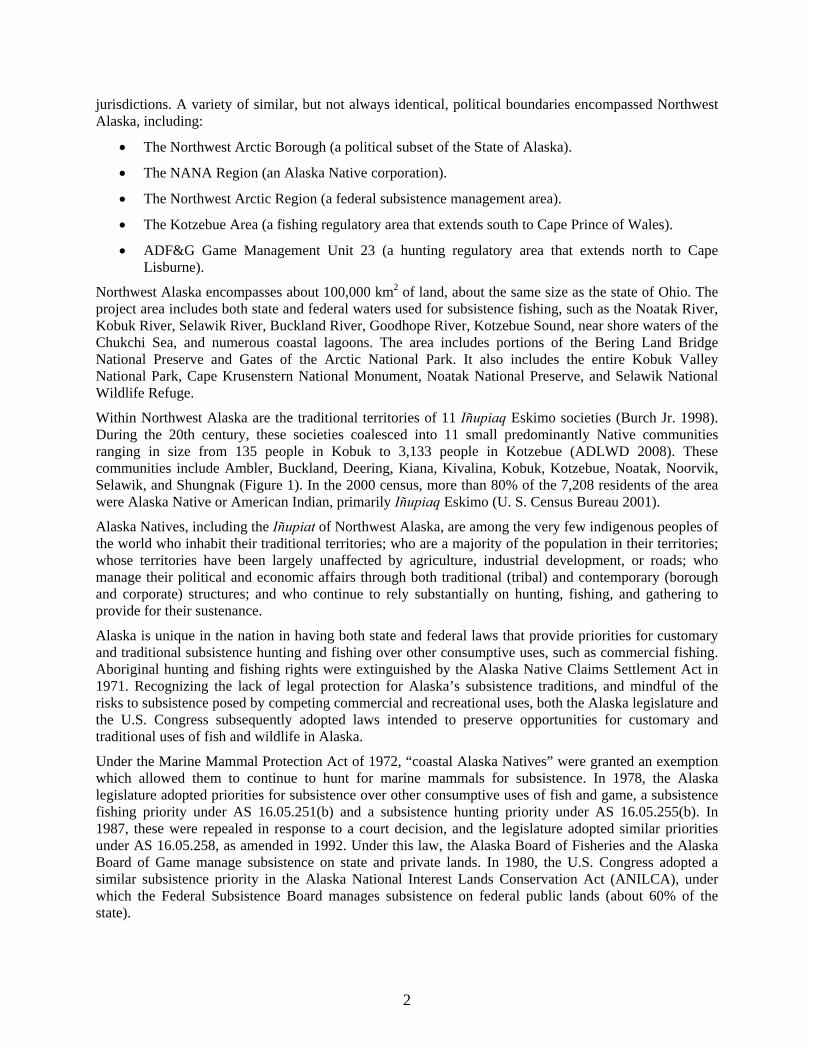
Within Northwest Alaska are the traditional territories of 11 Iñupiaq Eskimo societies (Burch Jr. 1998). During the 20th century, these societies coalesced into 11 small predominantly Native communities ranging in size from 135 people in Kobuk to 3,133 people in Kotzebue (ADLWD 2008). These communities include Ambler, Buckland, Deering, Kiana, Kivalina, Kobuk, Kotzebue, Noatak, Noorvik, Selawik, and Shungnak (Figure 1). In the 2000 census, more than 80% of the 7,208 residents of the area were Alaska Native or American Indian, primarily Iñupiaq Eskimo (U. S. Census Bureau 2001).
Alaska Natives, including the Iñupiat of Northwest Alaska, are among the very few indigenous peoples of the world who inhabit their traditional territories; who are a majority of the population in their territories; whose territories have been largely unaffected by agriculture, industrial development, or roads; who manage their political and economic affairs through both traditional (tribal) and contemporary (borough and corporate) structures; and who continue to rely substantially on hunting, fishing, and gathering to provide for their sustenance.
Alaska is unique in the nation in having both state and federal laws that provide priorities for customary and traditional subsistence hunting and fishing over other consumptive uses, such as commercial fishing. Aboriginal hunting and fishing rights were extinguished by the Alaska Native Claims Settlement Act in 1971. Recognizing the lack of legal protection for Alaska’s subsistence traditions, and mindful of the risks to subsistence posed by competing commercial and recreational uses, both the Alaska legislature and the U.S. Congress subsequently adopted laws intended to preserve opportunities for customary and traditional uses of fish and wildlife in Alaska.
Under the Marine Mammal Protection Act of 1972, “coastal Alaska Natives” were granted an exemption which allowed them to continue to hunt for marine mammals for subsistence. In 1978, the Alaska legislature adopted priorities for subsistence over other consumptive uses of fish and game, a subsistence fishing priority under AS 16.05.251(b) and a subsistence hunting priority under AS 16.05.255(b). In 1987, these were repealed in response to a court decision, and the legislature adopted similar priorities under AS 16.05.258, as amended in 1992. Under this law, the Alaska Board of Fisheries and the Alaska Board of Game manage subsistence on state and private lands. In 1980, the U.S. Congress adopted a similar subsistence priority in the Alaska National Interest Lands Conservation Act (ANILCA), under which the Federal Subsistence Board manages subsistence on federal public lands (about 60% of the state).
3
Figure 1.–Northwest Alaska and the study communities for 2007.
In 2003, the Alaska Migratory Bird Co-Management Council adopted regulations establishing spring and summer subsistence hunts for migratory birds by permanent residents of villages within eligible subsistence harvest areas. Also in 2003, the North Pacific Fisheries Management Council adopted regulations recognizing subsistence harvests of Pacific halibut Hippoglossus stenolepis by eligible members of Alaska Native tribes and eligible residents of rural Alaska communities.
Alaska also is unique in the nation in having an applied anthropological research group established by statute to conduct “policy research” (sensu Trotter II. and Schensul 1998:692) regarding customary and traditional uses of fish and wildlife resources. The ADF&G Division of Subsistence conducted systematic social science research “on all aspects of the role of subsistence hunting and fishing in the lives of the residents of the state” (AS 16.05.094).
The duties of the division, as an agency of state government, included assisting the department and regulatory bodies “in determining what uses of fish and game, as well as which users and what methods, should be termed subsistence uses, users, and methods” (AS 16.05.094). The division also conducted research and applied the results of previous research to “evaluate the impact of state and federal laws and regulations on subsistence hunting and fishing,” as well as to the development of “statewide and regional management plans so that those plans recognized and incorporated the needs of subsistence users of fish and game” (AS 16.05.094).
4
Support for a harvest monitoring program in Northwest Alaska was strong. A planning effort by the Division of Subsistence, Maniilaq Association, and the Northwest Arctic Borough (Magdanz et al. 2010) found widespread support for harvest survey research during meetings in the 11 Northwest Arctic communities in 2006 and 2007 (Magdanz et al. 2010). Of the 146 meeting participants, 94% thought harvest surveys should be conducted in their communities, and 74% favored a cooperative approach involving tribes and 1 or more regional organizations, usually including a resource management agency. This harvest monitoring program relied on the continued public support of the residents of Northwest Alaska and on the continued financial support of the cooperating organizations.
RESEARCH QUESTIONS The principal questions addressed by the harvest monitoring program in Northwest Alaska were the amounts of wild foods harvested for subsistence and whether those harvests exceeded the harvestable surpluses of fish stocks and wildlife populations. Related questions involved the role of wild foods in Northwest Alaska’s economy, the impacts of economic development on subsistence activities, the lands and waters used for subsistence, the impacts of competing, nonsubsistence uses of fish and wildlife, and the impacts of climate changes.
Most fish stocks and wildlife populations, although variable over time, were in natural and healthy conditions in Northwest Alaska. As of 2007, both the Alaska Board of Fisheries and the Alaska Board Game had found that harvestable surpluses of all fish and wildlife species were sufficient to provide the amounts necessary for subsistence uses, and to provide for other nonsubsistence uses, except for muskoxen, which were managed for limited subsistence uses only.
Neither the environment nor the economy of Northwest Alaska were static. Supplies of and demand for fish and wildlife changed over time, sometimes dramatically and rapidly. Climate-related changes have occurred and were expected to continue to occur in Northwest Alaska (Grebmeier et al. 2006; Hinzman et al. 2005; Overland and Stabeno 2004). In addition, proposed industrial developments potentially will impact not only renewable natural resources through habitat alteration, but also social and economic systems by providing increased employment and dividend income to residents of the region (Fried and Robinson 2008). Specific examples included proposed expansion of the Red Dog Mine (Tetra Tech Inc. 2008), proposed offshore oil development in the Chukchi Basin, and ongoing mineral exploration in the Ambler and Candle mining districts.
The dynamic environment and economy of Northwest Alaska created a need for frequently updated information about subsistence harvests, demographics, employment, and income for the region as a whole, and especially for communities adjacent to proposed developments. In order of increasing scope, research problems included:
• Managing species where demand exceeds supply.
• Sustainably allocating species among competing uses.
• Documenting subsistence economies.
• Assessing and mitigating impacts from development.
• Monitoring long term ecological conditions.
To manage species where demand may exceed supply, managers needed timely harvest data for selected species, in some cases on a yearly basis. Fortunately, this involved only a handful of fish and big game species in Northwest Alaska at this time. To sustainably allocate fish and wildlife, regulatory bodies needed periodic harvest data over time that accounts for normal variations in harvests, which for some species can mean decades.
To better document Alaska’s subsistence economy, policymakers needed substantially complete estimates of harvests and better descriptions of subsistence systems. To assess impacts or to monitor long term
5
changes, investigators needed an initial comprehensive survey to collect baseline subsistence harvest, social, and economic data; they also needed postimpact surveys to measure changes and assess impacts.
Impact assessment and ecological monitoring were more complex than harvest monitoring, because the nature and scope of potential impacts and the course of human adaptations were not known in advance. For example, residents of Northwest Alaska might adapt to persistent and adverse changes in caribou migration patterns by increasing subsistence moose or salmon harvests or by purchasing imported foods. The latter adaptation would imply increased reliance on wage labor or on transfer payments. Fully evaluating the impact of changes in caribou migrations would require information on caribou movements, caribou harvests, caribou harvest locations, other species’ harvests, employment, wages, other types of income, and perhaps household spending patterns. Thus, impact assessment and ecological monitoring required a greater range of data than basic harvest monitoring.
GENERAL STUDY OBJECTIVES The objectives of the continuing harvest monitoring program are to:
• Develop a sampling strategy to coordinate data collection in each of the 11 communities in Northwest Alaska on a rotating basis.
• Design a household survey instrument to collect current data about subsistence hunting, fishing, gathering, and other topics that are compatible with information collected in previous rounds of household surveys.
• Identify, obtain, and coordinate funds to conduct the surveys from ADF&G, other State of Alaska agencies, federal agencies, nongovernmental organizations, industry, and other sources.
• Obtain approvals from study communities to conduct comprehensive surveys.
• Maintain lists of all occupied households in each Northwest Arctic Borough community, updated for each community just prior to each administration of the survey.
Within this continuing harvest monitoring program, the Division of Subsistence and cooperating agencies conduct an annual harvest monitoring project. Each year, they select study communities, train community residents in administration of the survey instruments, and attempt to administer surveys to occupied households in each study community. They collaboratively review and interpret survey findings, periodically publish reports of survey findings, and communicate study findings to the communities. Summary results are published online at the Community Subsistence Information System website2 maintained by the ADF&G Division of Subsistence.
RATIONALE AND LITERATURE REVIEW During the past 50 years, 2 different methods have been used to collect subsistence data in Northwest Alaska. Both methods–mandatory reporting and voluntary surveys–have had substantial limitations.
For big game species like moose, ADF&G has relied on a system of mandatory harvest reports and permits since statehood. Before hunting, individual hunters must purchase a hunting license and, for selected species, obtain a report or permit that indicates their intent to hunt that species. After hunting or at the end of the season, hunters are supposed to mail a postage paid postcard reporting their efforts and harvest, if any. Unfortunately, only about 20% of the moose harvested by residents of the Northwest Arctic Borough were being reported, and reporting rates were variable and unpredictable.
For comprehensive estimates of subsistence harvests, ADF&G and other researchers have relied on household surveys. Most early survey efforts were not systematic, population sizes were unknown, sampling rates were not recorded, and data analysis methods were not published. As a result, most early 2 http://www.subsistence.adfg.state.ak.us/CSIS/; hereinafter cited as CSIS.
6
survey results cannot be reliably compared with more recent survey results. Important exceptions were a U.S. Fish and Wildlife Service salmon survey (Raleigh 1958), Project Chariot related research (Saario and Kessel 1966; Foote and Williamson 1966), surveys of Kivalina in the early 1980s (Burch Jr. 1985), and a 1986 survey of Kotzebue (Georgette and Loon 1993). These efforts were more systematic, better documented, and provided more reliable estimates.
Beginning in the 1990s, the quality and quantity of survey data increased dramatically, as a result of a series of unrelated circumstances. In 1991 and 1992, the Division of Subsistence conducted comprehensive harvest surveys in Kotzebue and Kivalina, which were control communities for Exxon Valdez oil spill impact assessment studies. A series of waterfowl harvest surveys were conducted from 1993 through 1997, to support waterfowl treaty negotiations between the United States, Japan, Mexico, Canada, and the former Soviet Union. The Northwest salmon harvest survey project began in 1994, prompted by crashing chum salmon stocks in western Alaska, and continued through 2004. The National Park Service funded comprehensive harvest surveys in Deering and Noatak for 1994, in Shungnak for 2002, in Buckland for 2004 and in Kiana for 2006, to provide information for management of Western Arctic Parklands. In 1998, the Western Arctic caribou herd harvest survey program began in selected communities, and contributed big game harvest data for 1 or 2 communities in most subsequent years. The Native Village of Kotzebue conducted comprehensive surveys of tribal households in 2002, 2003, and 2004.
As of 2007, comprehensive subsistence harvest data had been collected 5 times for Kivalina, 5 times for Kotzebue, and 1 time for 6 other communities in the Northwest Arctic Borough. Comprehensive data have never been collected for Noorvik, Ambler, and Kobuk. In other words, for a majority of the communities in the Northwest Arctic Borough, comprehensive estimates of subsistence harvests existed for only a single year.
Harvest data for a limited range of species have been collected more often. Salmon harvests were the most thoroughly documented, with annual estimates of harvests for 6 communities (Ambler, Kiana, Kobuk, Noatak, Noorvik, and Shungnak) from 1994 through 2004. Large land mammals (“big game”) surveys were conducted at least once in every NWAB community except Kotzebue since 1998. Waterfowl surveys were conducted at least once in every NWAB community during the 1990s. Of those projects, only the big game surveys were continuing in 2007 (as part of this effort).
Over the last 50 years, substantial funds have been invested in harvest reporting and survey research in Northwest Alaska. Whether harvest data were collected in comprehensive or limited surveys, subsistence harvest monitoring in Northwest Alaska region usually has been driven by the data needs and funding situation of individual agencies and not by a coordinated strategy. Neither mandatory harvest reporting systems nor voluntary community household surveys provided sufficient data to estimate regionwide subsistence harvest of fish and wildlife with reasonable confidence, nor to monitor trends in subsistence harvests and use patterns.
Although mandatory harvest reporting appears to be improving for some big game species, the harvest reporting system does not collect comprehensive harvest data, nor does it collect socioeconomic data. Household surveys do collect a wide range of data, and are best suited to fulfill the multiple data needs of resource management agencies, user communities, and industry. Consequently, this program uses survey methods.
One of the policy objectives in Alaska subsistence management is determining the amounts reasonably necessary for subsistence uses. This is achieved primarily through reviews of historical harvests, the assumption being that people were able to harvest what they needed. But historical data are not always available and sometimes harvests are limited by factors other than subsistence demand, so subsistence surveys have long included a series of harvest assessment questions (e.g. “Did your household get enough salmon last year for your needs?”).
7
More recently, some subsistence surveys adopted a food security protocol to assess whether households were able to obtain the food they needed. The protocol used in this survey was a modified version of the 12 month food security scale questionnaire developed by the U.S. Department of Agriculture (USDA). This questionnaire is administered nationwide each year as part of the annual Current Population Survey (CPS). In 2007, approximately 125,000 U.S. households were interviewed, including 1,653 in Alaska (e.g., Nord et al. 2008:20). From CPS data, the USDA prepares an annual report on food security in the United States.
Food security protocols have been extensively reviewed (Coates 2004; Webb et al. 2006; Wunderlich and Norwood 2006) and have been used around the world including northern Burkina Faso (Frongillo and Nanama 2007), Bangladesh (Coates et al. 2006), Bolivia and the Philippines (Melgar-Quinonez et al. 2006), and Brazil (Peréz-Escamilla et al. 2004). Although there have been efforts to develop a universal food security measurement protocol (Swindale and Bilinsky 2006), researchers often modify the protocol slightly to respond to community social, cultural, and economic circumstances.
For the Northwest Harvest Monitoring Program, the food security protocol was modified with the addition of several subquestions designed to determine whether food insecurities, if any, were related to subsistence foods or store-bought foods. The wording of some questions was changed slightly. As in Brazil (Peréz-Escamilla et al. 2004:1928), the USDA term “balanced meals” was difficult to interpret for indigenous Alaska populations, and was replaced with the term “healthy meals” to reflect unique dietary and cultural circumstances in rural Alaska.
Extensive, comprehensive survey efforts are possible, as demonstrated in 2007 when Kawerak Inc. successfully conducted comprehensive surveys in 12 Norton Sound–Bering Strait communities. The Kotzebue IRA also successfully conducted comprehensive surveys of tribal member households in 3 successive years, 2002–2004. The keys are well designed survey instruments, efficient data entry, and standard approaches over time.
RELATIONSHIPS WITH ALASKA NATIVE COMMUNITIES A majority of the residents of Northwest Alaska are Alaska Native or American Indian, who have maintained their subsistence customs and traditions throughout their history. The project is intended to encourage a collaborative, working relationship among state and federal agencies, tribes, communities, nongovernmental organizations, and industries. The ethical conduct of all researchers will meet or exceed the principles of conduct adopted by the Alaska Federation of Natives in 1993 and the Interagency Arctic Research Policy Committee on June 28, 1990. All personnel are to work in a manner that develops, rather than jeopardizes, relations among the cooperators, and between the cooperators and the public.
METHODS Each year, the Northwest Alaska Harvest Monitoring Program administers harvest monitoring surveys to households in 2 or 3 of the 11 Northwest communities. Communities are surveyed on a flexible schedule, in which each community is surveyed at least once every 5 years, depending on available funding. Ideally, each year provides a geographically diverse sample of communities. Both the surveyed species and the surveyed communities are adjusted as necessary to meet changing data needs.
The program evolved from, and builds on, earlier efforts in Northwest Alaska, such as the Northwest salmon surveys and the Western Arctic caribou herd (WACH) surveys. The program coordinates efforts of different organizations to maximize efficiency and reduce costs, and relies on a standard survey instrument instead of several instruments. The instrument is based on a series of surveys conducted by the Division of Subsistence for similar studies in Alaska in the 1980s and 1990s. Many survey questions are the same as, or similar to, questions in prior harvest assessment tools, so recent results are comparable with past results.
8
GENERAL RESEARCH DESIGN The ADF&G Division of Subsistence utilizes a number of social science research methods to fulfill its mission, including both quantitative and qualitative methods. As characterized by Trotter and Schensul:
Applied projects must be designed to create the highest level of confidence in the research results. To provide this confidence, quantitative social sciences have most commonly favored probabilistic (random) sampling techniques that allow for statistical analysis of the data collected. These techniques work well when the universe from which the sample is to be drawn can be identified and where everyone in a population…has an equal chance of being chosen to express their viewpoint. It does not work for qualitative approaches, where other conditions apply. Trotter II. and Schensul 1998:702–703
Much of the research conducted by the Division of Subsistence is quantitative in nature and involves documenting the amount of fish and wildlife resources harvested by a community of users with the principal unit of analysis being the household. In these cases, probabilistic sampling or census approaches are used to develop estimates of harvests for an entire community or series of communities.
In small communities, sampling designs often strive for a complete census to survey each household regarding subsistence resource harvest and use activities. In larger communities, simple random samples or more commonly stratified random samples are used to estimate a community’s harvest and use patterns. Survey results are expanded to the whole community based upon the patterns identified in the sample of surveyed households. It is essential that sampled households be representative of the study population.
Confidentiality is maintained through the use of identification codes. Households and individuals are assigned numerical codes before surveys begin. The household code sheet is maintained by the principal investigators during survey administration, and remains in their custody after the survey is complete. Except for the principal investigators, surveyors have codes only for the households they are assigned to survey. Household code sheets do not accompany surveys when surveys are submitted for data entry and analysis.
DATA NEEDS IN 2008 There is a continuing need for harvest estimates for high demand, big game species, particularly caribou and moose. The caribou population has been at historical high levels for 15 years, and is expected to decline. Moose populations in Northwest Alaska have declined since the mid 1980s. Increasing numbers of nonlocal hunters are competing for caribou and moose. These factors argued for continued or expanded monitoring of caribou and moose harvests. For the 2008 program, ADF&G planned to conduct WACH harvest surveys planned in Noatak, Kivalina, and Deering.
In October 2007, ADF&G learned of a specific need for subsistence information to assist in the preparation of a supplemental environmental impact statement (SEIS) for a proposed expansion of the Red Dog Mine (Tetra Tech Inc. 2008). For the 2 communities closest to Red Dog Mine, Kivalina and Noatak, systematic, comprehensive, subsistence surveys had not been conducted since 1992 (Kivalina) and 1994 (Noatak).
To prepare the SEIS, the U.S. Environmental Protection Agency (EPA) selected Tetra Tech Inc. Tetra Tech selected SRB&A to prepare the subsistence sections of the SEIS. SRB&A asked the Division of Subsistence to expand its planned WACH survey efforts in Kivalina and Noatak to include harvests of all subsistence resources, maps of search areas and harvest locations, demographic information, and income. SRB&A, funded by Teck Alaska Inc. through Tetra Tech, provided funds to ADF&G to administer surveys, analyze data, and prepare a summary report. SRB&A also provided funds to the Native Village of Noatak and City of Kivalina to help conduct the surveys and review results.
9
VARIABLES From each household, researchers collected information about permanent household residents, amounts of wild food harvested, wages earned, and other income received by household members. Researchers also asked questions to assess household food security and to determine whether households were able to harvest sufficient wild foods.
The demography section included questions about the gender, kin relationships, age, birthplace, education, and ethnicity of each household member. The harvest section asked which wild foods were used and harvested, and how much was harvested by the household. The employment section asked respondents to list each job held by each member of the household and, for each job, the months employed, the schedule worked, and the amount earned in the study year. Respondents were asked to estimate household income from other, nonemployment sources, such as the Alaska permanent fund dividend, social security, and public assistance programs.
A “food security” section used a standard national questionnaire to assess whether or not the household had enough food to eat, whether from subsistence sources or from market sources. A subsistence assessments section asked whether households harvested less, more or the same amount of particular subsistence foods, and whether they got enough of that food. In the event harvests changed or were insufficient, respondents were asked why this occurred.
To document the areas used for subsistence, the survey asked households to locate on a map of the area where they searched for and where they actually harvested selected subsistence resources. Maps were available at 3 different scales, to accommodate both local and distant searches and harvests. Search area and harvest location maps in this report were produced by SRB&A.
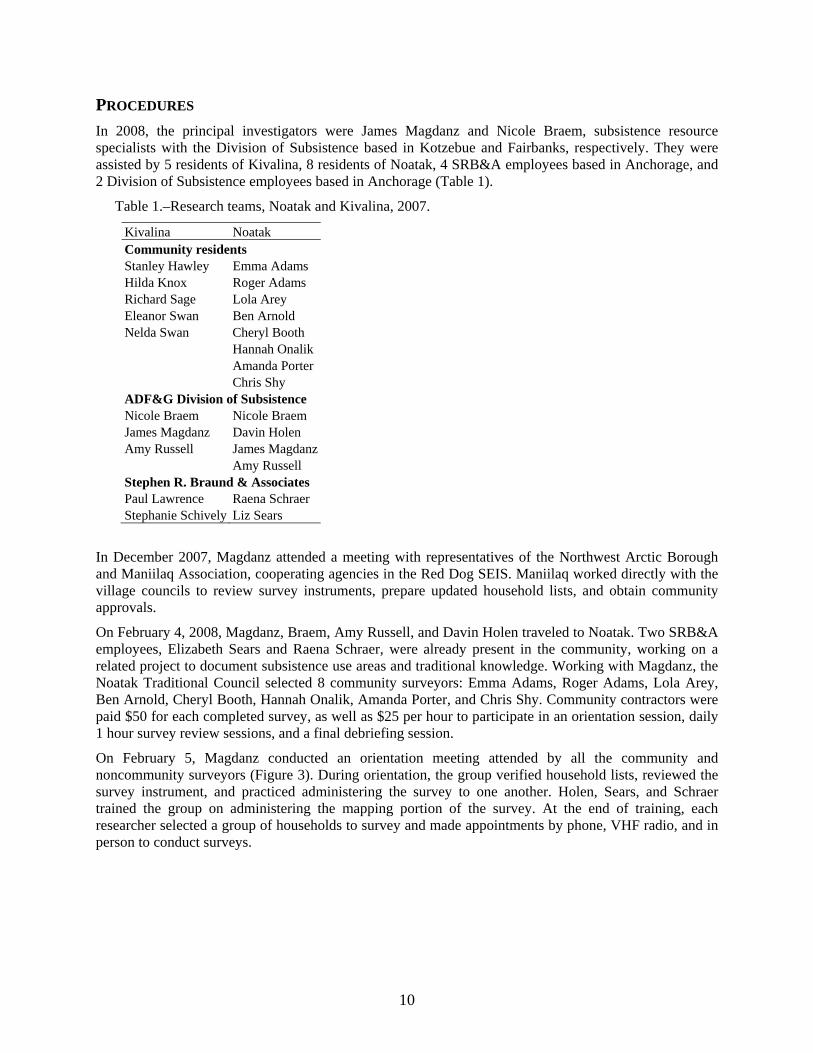
SURVEY INSTRUMENT The primary purpose of the household survey was to collect information about the harvest and use of edible wild foods. In its simplest form, the survey included a core harvest module that collected, for example, caribou or salmon harvest reports on a single sheet (Figure 2). By adding more core harvest modules, a single-species survey can evolve into a comprehensive survey, while maintaining comparability with single-species efforts. Additional modules can be added to collect demographic, economic, spatial, assessment, or social network data as needed.
LIMITATIONS AND ASSUMPTIONS The harvest survey collected information on subsistence activities during a single year. This assumed that respondents can remember their important activities during the past year. To minimize recall problems, surveys were conducted with household heads on the assumption that household heads were most likely to be aware of all household members’ activities. Respondent recall bias was not expected to change significantly over time or from community to community. It was not expected to affect comparisons of data from this study with other studies employing similar methods.
Some respondents were reluctant to provide information about personal and household incomes, especially earned income. Some community researchers were personally reluctant to ask respondents about income. As a consequence, employment and income data often were missing. For Noatak and Kivalina for 2007, earned income data were missing for 42% of the individuals in the sample.
Standardization in data collection procedures was important because many different people gather data. One or more principal investigators were present throughout the administration of the surveys and administered some surveys themselves. Standardization and quality control were accomplished through an initial orientation process, daily reviews of surveys as completed, and post-administration review of all surveys. The principal investigators code most of the surveys and review all coded surveys before data entry.
10
PROCEDURES In 2008, the principal investigators were James Magdanz and Nicole Braem, subsistence resource specialists with the Division of Subsistence based in Kotzebue and Fairbanks, respectively. They were assisted by 5 residents of Kivalina, 8 residents of Noatak, 4 SRB&A employees based in Anchorage, and 2 Division of Subsistence employees based in Anchorage (Table 1).
Table 1.–Research teams, Noatak and Kivalina, 2007.
Kivalina Noatak Community residents Stanley Hawley Emma Adams Hilda Knox Roger Adams Richard Sage Lola Arey Eleanor Swan Ben Arnold Nelda Swan Cheryl Booth Hannah Onalik Amanda Porter Chris Shy ADF&G Division of Subsistence Nicole Braem Nicole Braem James Magdanz Davin Holen Amy Russell James Magdanz Amy Russell Stephen R. Braund & Associates Paul Lawrence Raena Schraer Stephanie Schively Liz Sears
In December 2007, Magdanz attended a meeting with representatives of the Northwest Arctic Borough and Maniilaq Association, cooperating agencies in the Red Dog SEIS. Maniilaq worked directly with the village councils to review survey instruments, prepare updated household lists, and obtain community approvals.
On February 4, 2008, Magdanz, Braem, Amy Russell, and Davin Holen traveled to Noatak. Two SRB&A employees, Elizabeth Sears and Raena Schraer, were already present in the community, working on a related project to document subsistence use areas and traditional knowledge. Working with Magdanz, the Noatak Traditional Council selected 8 community surveyors: Emma Adams, Roger Adams, Lola Arey, Ben Arnold, Cheryl Booth, Hannah Onalik, Amanda Porter, and Chris Shy. Community contractors were paid $50 for each completed survey, as well as $25 per hour to participate in an orientation session, daily 1 hour survey review sessions, and a final debriefing session.
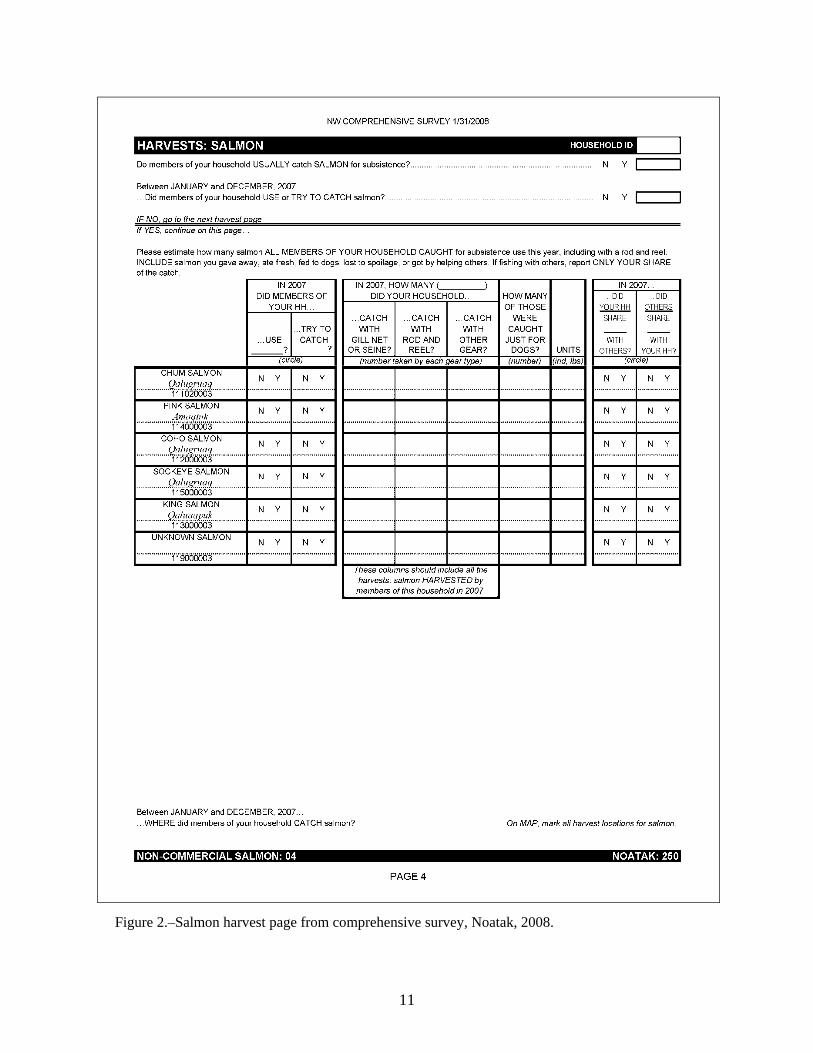
On February 5, Magdanz conducted an orientation meeting attended by all the community and noncommunity surveyors (Figure 3). During orientation, the group verified household lists, reviewed the survey instrument, and practiced administering the survey to one another. Holen, Sears, and Schraer trained the group on administering the mapping portion of the survey. At the end of training, each researcher selected a group of households to survey and made appointments by phone, VHF radio, and in person to conduct surveys.
11
Figure 2.–Salmon harvest page from comprehensive survey, Noatak, 2008.
12
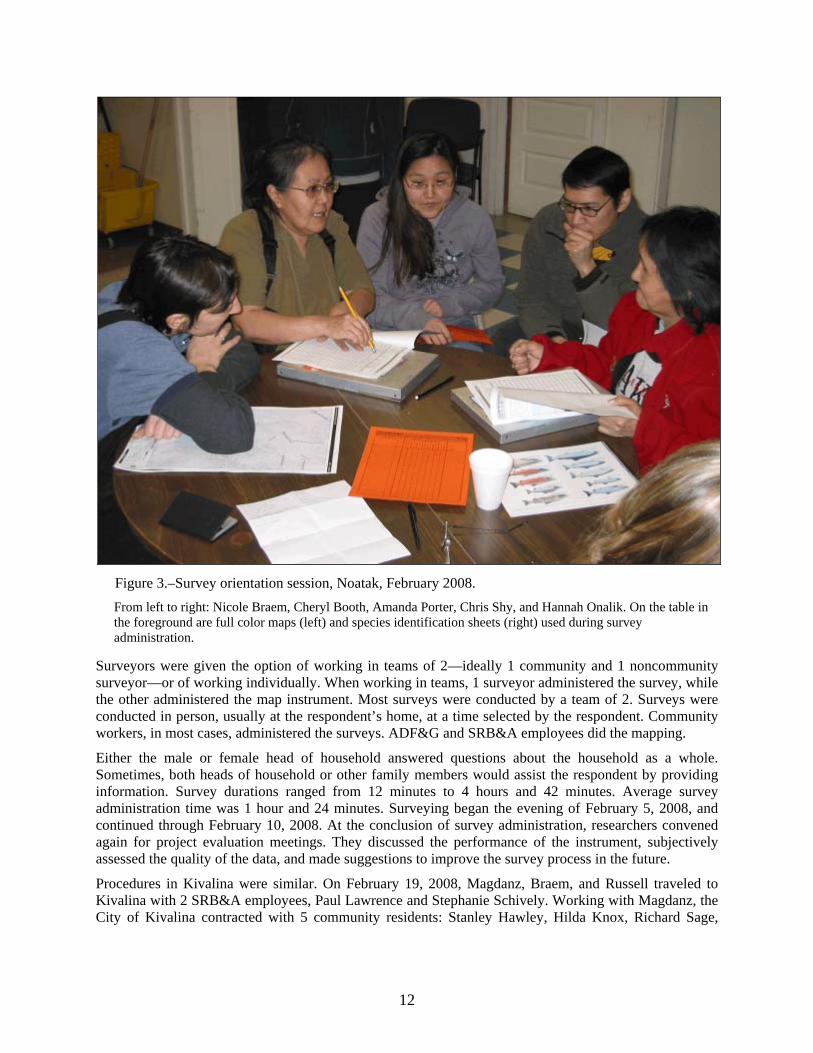
Figure 3.–Survey orientation session, Noatak, February 2008. From left to right: Nicole Braem, Cheryl Booth, Amanda Porter, Chris Shy, and Hannah Onalik. On the table in the foreground are full color maps (left) and species identification sheets (right) used during survey administration.
Surveyors were given the option of working in teams of 2—ideally 1 community and 1 noncommunity surveyor—or of working individually. When working in teams, 1 surveyor administered the survey, while the other administered the map instrument. Most surveys were conducted by a team of 2. Surveys were conducted in person, usually at the respondent’s home, at a time selected by the respondent. Community workers, in most cases, administered the surveys. ADF&G and SRB&A employees did the mapping.
Either the male or female head of household answered questions about the household as a whole. Sometimes, both heads of household or other family members would assist the respondent by providing information. Survey durations ranged from 12 minutes to 4 hours and 42 minutes. Average survey administration time was 1 hour and 24 minutes. Surveying began the evening of February 5, 2008, and continued through February 10, 2008. At the conclusion of survey administration, researchers convened again for project evaluation meetings. They discussed the performance of the instrument, subjectively assessed the quality of the data, and made suggestions to improve the survey process in the future.
Procedures in Kivalina were similar. On February 19, 2008, Magdanz, Braem, and Russell traveled to Kivalina with 2 SRB&A employees, Paul Lawrence and Stephanie Schively. Working with Magdanz, the City of Kivalina contracted with 5 community residents: Stanley Hawley, Hilda Knox, Richard Sage,
13
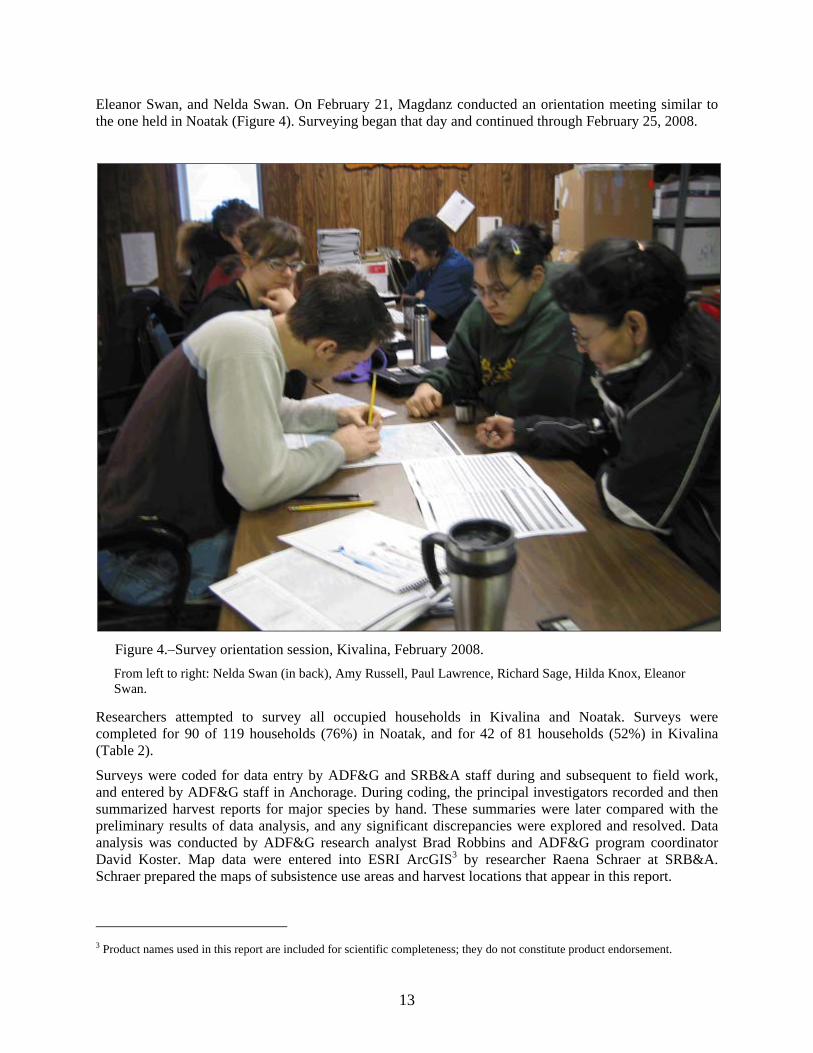
Eleanor Swan, and Nelda Swan. On February 21, Magdanz conducted an orientation meeting similar to the one held in Noatak (Figure 4). Surveying began that day and continued through February 25, 2008.
Figure 4.–Survey orientation session, Kivalina, February 2008. From left to right: Nelda Swan (in back), Amy Russell, Paul Lawrence, Richard Sage, Hilda Knox, Eleanor Swan.
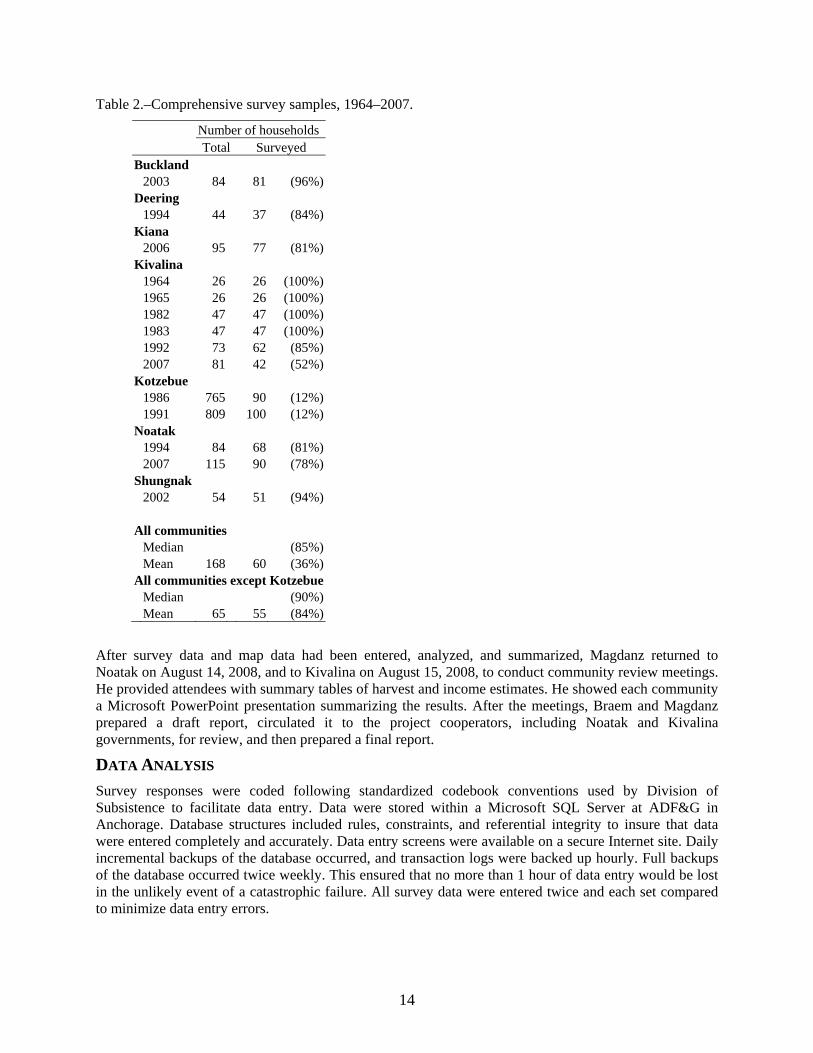
Researchers attempted to survey all occupied households in Kivalina and Noatak. Surveys were completed for 90 of 119 households (76%) in Noatak, and for 42 of 81 households (52%) in Kivalina (Table 2).
Surveys were coded for data entry by ADF&G and SRB&A staff during and subsequent to field work, and entered by ADF&G staff in Anchorage. During coding, the principal investigators recorded and then summarized harvest reports for major species by hand. These summaries were later compared with the preliminary results of data analysis, and any significant discrepancies were explored and resolved. Data analysis was conducted by ADF&G research analyst Brad Robbins and ADF&G program coordinator David Koster. Map data were entered into ESRI ArcGIS3 by researcher Raena Schraer at SRB&A. Schraer prepared the maps of subsistence use areas and harvest locations that appear in this report.
3 Product names used in this report are included for scientific completeness; they do not constitute product endorsement.
14
Table 2.–Comprehensive survey samples, 1964–2007.
Number of households Total Surveyed
Buckland 2003 84 81 (96%) Deering 1994 44 37 (84%) Kiana 2006 95 77 (81%) Kivalina 1964 26 26 (100%) 1965 26 26 (100%) 1982 47 47 (100%) 1983 47 47 (100%) 1992 73 62 (85%) 2007 81 42 (52%) Kotzebue 1986 765 90 (12%) 1991 809 100 (12%) Noatak 1994 84 68 (81%) 2007 115 90 (78%) Shungnak 2002 54 51 (94%) All communities Median (85%) Mean 168 60 (36%) All communities except Kotzebue Median (90%) Mean 65 55 (84%)
After survey data and map data had been entered, analyzed, and summarized, Magdanz returned to Noatak on August 14, 2008, and to Kivalina on August 15, 2008, to conduct community review meetings. He provided attendees with summary tables of harvest and income estimates. He showed each community a Microsoft PowerPoint presentation summarizing the results. After the meetings, Braem and Magdanz prepared a draft report, circulated it to the project cooperators, including Noatak and Kivalina governments, for review, and then prepared a final report.
DATA ANALYSIS Survey responses were coded following standardized codebook conventions used by Division of Subsistence to facilitate data entry. Data were stored within a Microsoft SQL Server at ADF&G in Anchorage. Database structures included rules, constraints, and referential integrity to insure that data were entered completely and accurately. Data entry screens were available on a secure Internet site. Daily incremental backups of the database occurred, and transaction logs were backed up hourly. Full backups of the database occurred twice weekly. This ensured that no more than 1 hour of data entry would be lost in the unlikely event of a catastrophic failure. All survey data were entered twice and each set compared to minimize data entry errors.
15
Once data were entered and confirmed, information was processed with the use of the Statistical Package for the Social Sciences (SPSS) Version 16. Initial processing included the performance of standardized logic checks of the data. Logic checks are often needed in complex data sets where rules, constraints, and referential integrity do not capture all of the possible inconsistencies that may appear. Harvest data collected in numbers or animals, gallons, or buckets were converted to pounds usable weight using standard factors (Appendix B).
SPSS was also used for analyzing the survey information. Analysis included review of raw data frequencies, cross tabulations, table generation, estimation of population parameters, and calculation of confidence intervals for the estimates. Missing information was dealt with situationally. The Division of Subsistence has standardized practices for dealing with missing information, such as minimal value substitution or use of an average response for similarly characterized households. Typically, missing data are an uncommon, randomly occurring phenomenon in household surveys conducted by the division. In unusual cases where a substantial amount of survey information is missing, the household survey is treated as a “nonresponse” and not included in community estimates.
When reliable harvest reports for a survey period were available from other sources, those reports were used in this report rather than survey estimates. For 2007, reliable harvest data for Noatak and Kivalina were available for beluga whales (Kathy Frost, Alaska Beluga Whale Commission, personal communication, March 21, 2008) and for polar bears (U.S. Fish and Wildlife Service, personal communication, 2008), and were used in this report.
Harvest estimates, and responses to all questions, were calculated based upon the application of weighted means (Cochran 1977). These calculations are standard methods for extrapolating sampled data. As an example, the formula for harvest expansion is
(1)where:
(mean harvest per returned survey), (2)
Hi = the total harvest (numbers of resource or pounds) for the community i, hi = the total harvest reported in returned surveys, ni = the number of returned surveys, and Si = the number of households in a community.
As an interim step, the standard deviation (SD) (or variance [V], which is the SD squared) was also calculated with the raw, unexpanded data. The standard error (SE), or SD of the mean was also calculated for each community. This was used to estimate the relative precision of the mean, or the likelihood an unknown value falls within a certain distance from the mean. In this study, the relative precision of the mean is shown in the tables as a confidence limit (CL), expressed as a percentage. Once the standard error was calculated, the CL was determined by multiplying the SE by a constant that reflected the level of significance desired, based on a normal distribution. The constant for 95% confidence limits is 1.96. Though there are numerous ways to express the formula below, it contains the components of a SD, V, and SE:
%/ √ 1
(3)
where: S = sample standard deviation, n = sample size, N = population size, and
/ = student’s t statistic for alpha level (α=0.95) with n–1 degrees of freedom.
16
Small CL percentages indicate that an estimate is likely to be very close to the actual mean of the sample. Larger percentages mean that estimates could be further away from the sampled mean.
Summaries of results for each community surveyed were added to the Division of Subsistence CSIS. This publicly accessible database included community-level findings only, not household-level information.
Food security responses were analyzed following USDA procedures (Bickel et al. 2000), to provide comparability between the Northwest Harvest Monitoring Program results and USDA results for Alaska and the nation.
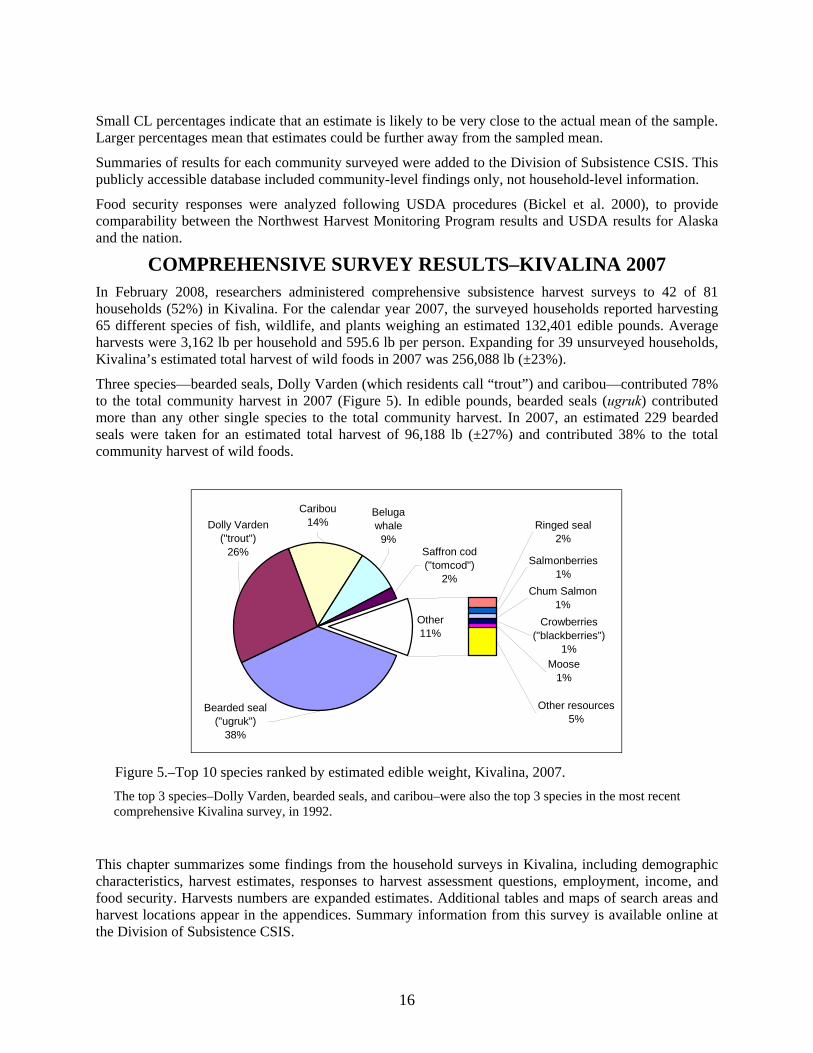
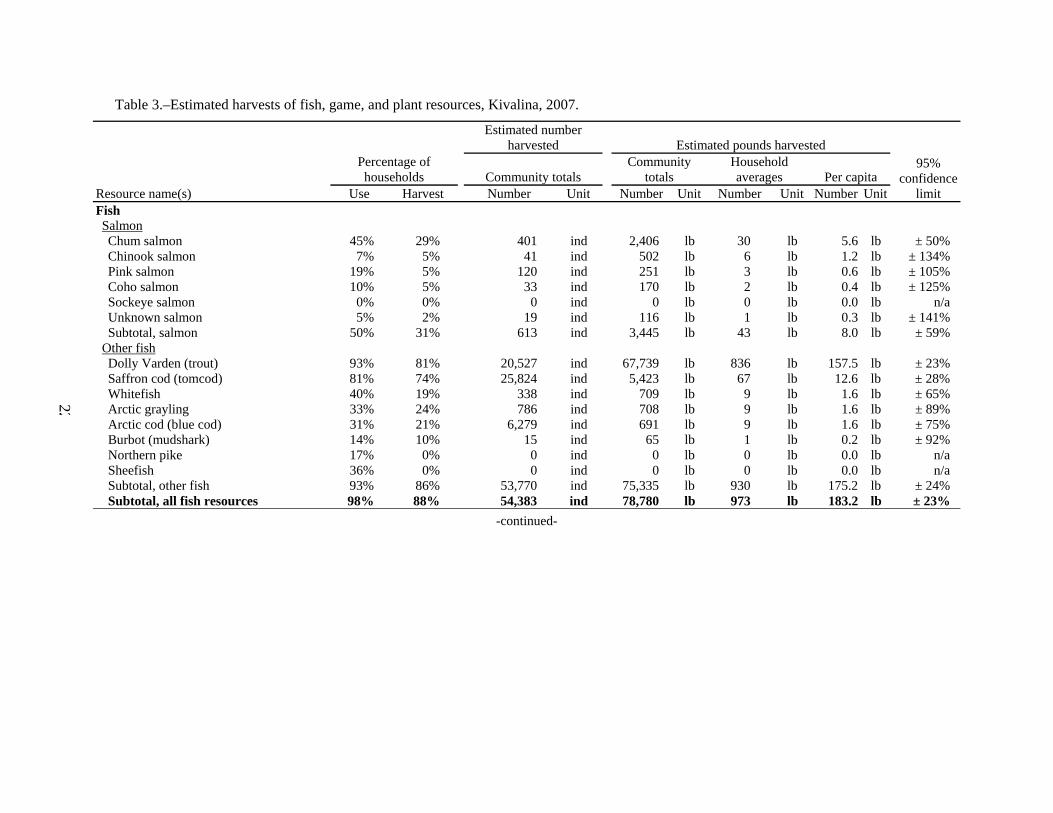
COMPREHENSIVE SURVEY RESULTS–KIVALINA 2007 In February 2008, researchers administered comprehensive subsistence harvest surveys to 42 of 81 households (52%) in Kivalina. For the calendar year 2007, the surveyed households reported harvesting 65 different species of fish, wildlife, and plants weighing an estimated 132,401 edible pounds. Average harvests were 3,162 lb per household and 595.6 lb per person. Expanding for 39 unsurveyed households, Kivalina’s estimated total harvest of wild foods in 2007 was 256,088 lb (±23%).
Three species—bearded seals, Dolly Varden (which residents call “trout”) and caribou—contributed 78% to the total community harvest in 2007 (Figure 5). In edible pounds, bearded seals (ugruk) contributed more than any other single species to the total community harvest. In 2007, an estimated 229 bearded seals were taken for an estimated total harvest of 96,188 lb (±27%) and contributed 38% to the total community harvest of wild foods.
Figure 5.–Top 10 species ranked by estimated edible weight, Kivalina, 2007. The top 3 species–Dolly Varden, bearded seals, and caribou–were also the top 3 species in the most recent comprehensive Kivalina survey, in 1992.
This chapter summarizes some findings from the household surveys in Kivalina, including demographic characteristics, harvest estimates, responses to harvest assessment questions, employment, income, and food security. Harvests numbers are expanded estimates. Additional tables and maps of search areas and harvest locations appear in the appendices. Summary information from this survey is available online at the Division of Subsistence CSIS.
Other11%
Bearded seal("ugruk")
38%
Caribou14%
Saffron cod("tomcod")
2%
Belugawhale
9%Dolly Varden
("trout")26%
Chum Salmon1%
Salmonberries1%
Ringed seal2%
Crowberries("blackberries")
1%Moose
1%
Other resources5%
17
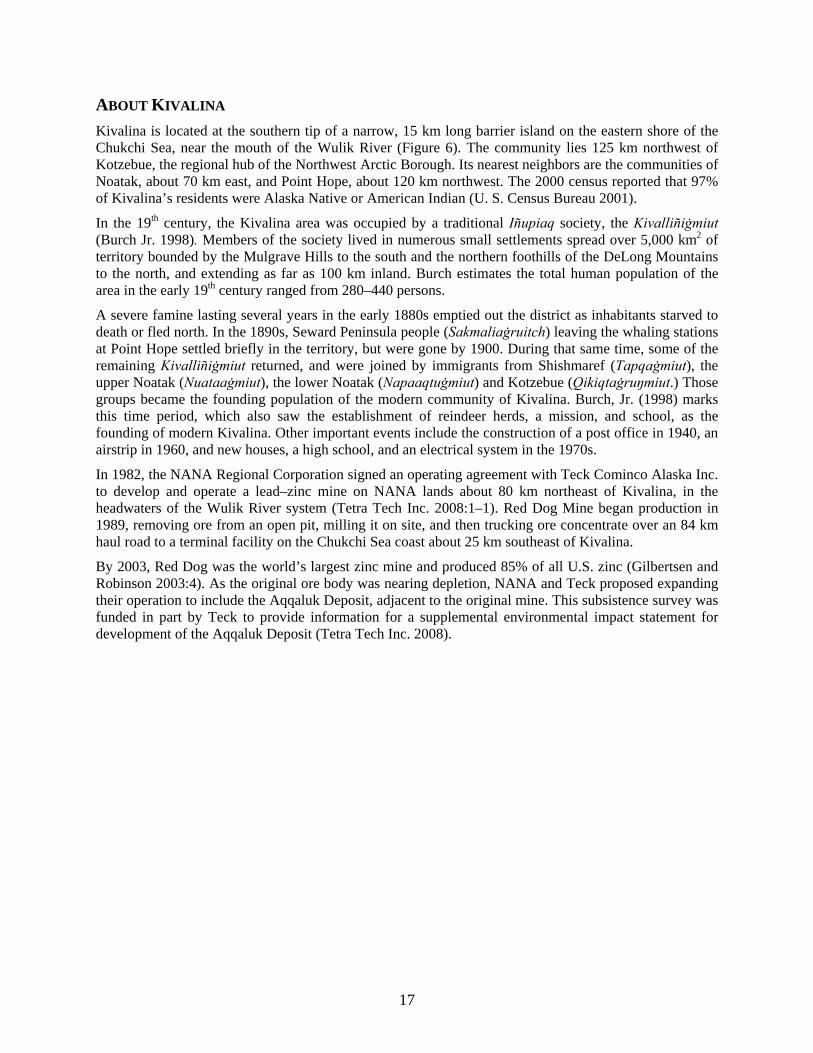
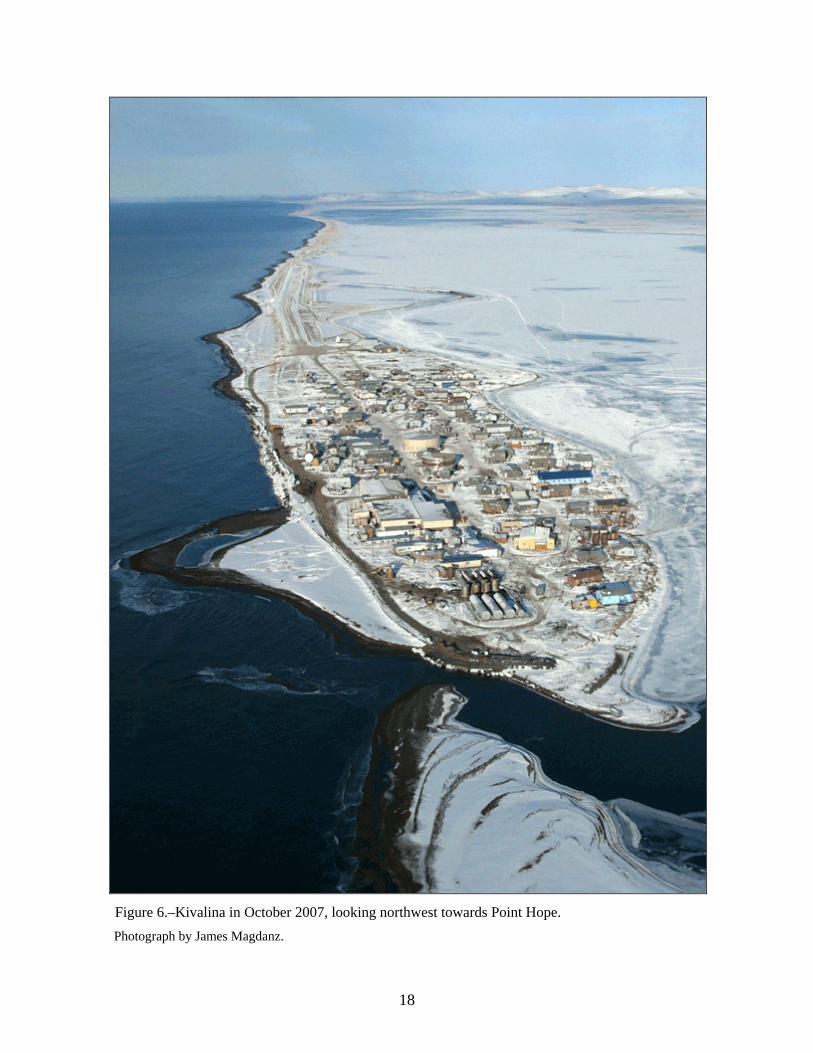
ABOUT KIVALINA Kivalina is located at the southern tip of a narrow, 15 km long barrier island on the eastern shore of the Chukchi Sea, near the mouth of the Wulik River (Figure 6). The community lies 125 km northwest of Kotzebue, the regional hub of the Northwest Arctic Borough. Its nearest neighbors are the communities of Noatak, about 70 km east, and Point Hope, about 120 km northwest. The 2000 census reported that 97% of Kivalina’s residents were Alaska Native or American Indian (U. S. Census Bureau 2001).
In the 19th century, the Kivalina area was occupied by a traditional Iñupiaq society, the Kivalliñiġmiut (Burch Jr. 1998). Members of the society lived in numerous small settlements spread over 5,000 km2 of territory bounded by the Mulgrave Hills to the south and the northern foothills of the DeLong Mountains to the north, and extending as far as 100 km inland. Burch estimates the total human population of the area in the early 19th century ranged from 280–440 persons.
A severe famine lasting several years in the early 1880s emptied out the district as inhabitants starved to death or fled north. In the 1890s, Seward Peninsula people (Sakmaliaġruitch) leaving the whaling stations at Point Hope settled briefly in the territory, but were gone by 1900. During that same time, some of the remaining Kivalliñiġmiut returned, and were joined by immigrants from Shishmaref (Tapqaġmiut), the upper Noatak (Nuataaġmiut), the lower Noatak (Napaaqtuġmiut) and Kotzebue (Qikiqtaġruŋmiut.) Those groups became the founding population of the modern community of Kivalina. Burch, Jr. (1998) marks this time period, which also saw the establishment of reindeer herds, a mission, and school, as the founding of modern Kivalina. Other important events include the construction of a post office in 1940, an airstrip in 1960, and new houses, a high school, and an electrical system in the 1970s.
In 1982, the NANA Regional Corporation signed an operating agreement with Teck Cominco Alaska Inc. to develop and operate a lead–zinc mine on NANA lands about 80 km northeast of Kivalina, in the headwaters of the Wulik River system (Tetra Tech Inc. 2008:1–1). Red Dog Mine began production in 1989, removing ore from an open pit, milling it on site, and then trucking ore concentrate over an 84 km haul road to a terminal facility on the Chukchi Sea coast about 25 km southeast of Kivalina.
By 2003, Red Dog was the world’s largest zinc mine and produced 85% of all U.S. zinc (Gilbertsen and Robinson 2003:4). As the original ore body was nearing depletion, NANA and Teck proposed expanding their operation to include the Aqqaluk Deposit, adjacent to the original mine. This subsistence survey was funded in part by Teck to provide information for a supplemental environmental impact statement for development of the Aqqaluk Deposit (Tetra Tech Inc. 2008).
18
Figure 6.–Kivalina in October 2007, looking northwest towards Point Hope. Photograph by James Magdanz.
19
Kivalina’s water supply comes from the Wulik River via a 5 km long transmission line to a raw water storage tank. Water is then treated and stored in a 500,000 gal storage tank. About one-third of homes are plumbed for water; other residents must haul their water from the storage tank. The school and health clinic have sewer systems; most homes do not. Kivalina households without water and sewer service use 5 gal buckets as toilets (“honey buckets”), and haul human waste to a disposal site. In 2007, several respondents reported hauling water from the Kivalina River due to concerns about the quality of the water in the Wulik River.
Like several other coastal western Alaskan communities, Kivalina is threatened by erosion and climate change. Already vulnerable because of its location, recent warm falls have increased the community’s exposure to fall storms (in the past, shore ice limited such damage). In September 2007, a storm prompted the emergency evacuation of the community after a recently completed seawall began to fail. In 2007, plans for an evacuation road were underway, as well as a replacement seawall. Future relocation of the entire community to one of several sites across the lagoon also was being discussed.
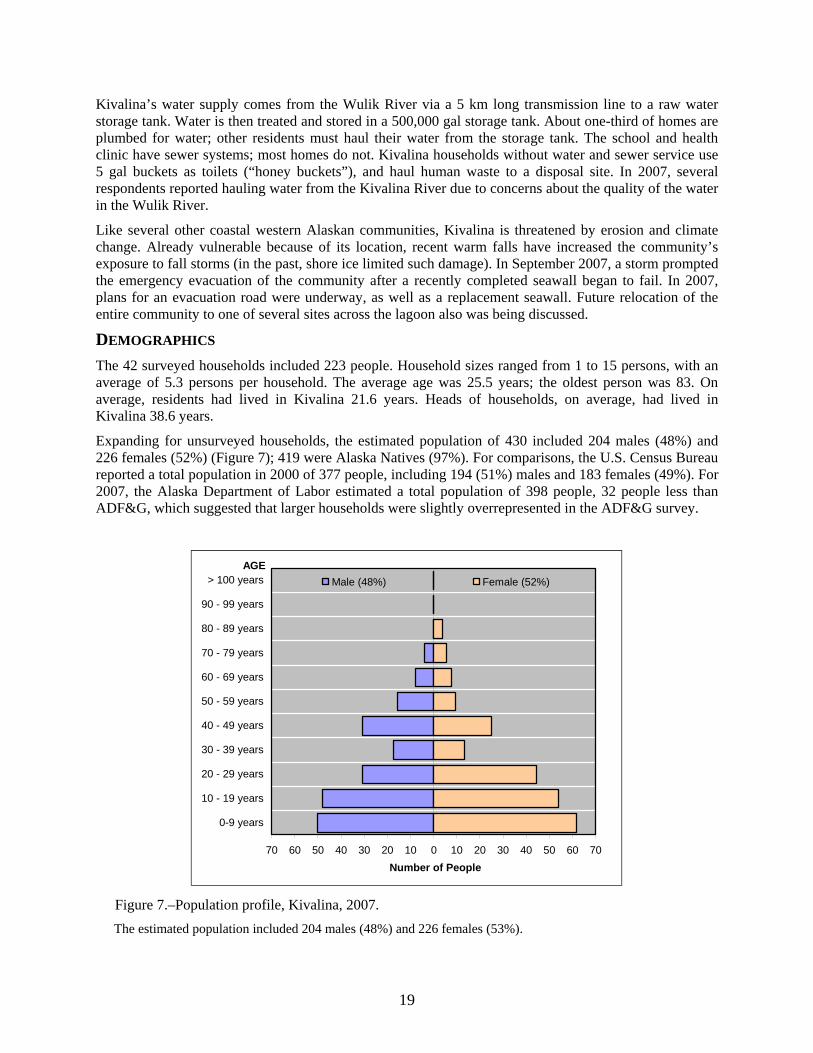
DEMOGRAPHICS The 42 surveyed households included 223 people. Household sizes ranged from 1 to 15 persons, with an average of 5.3 persons per household. The average age was 25.5 years; the oldest person was 83. On average, residents had lived in Kivalina 21.6 years. Heads of households, on average, had lived in Kivalina 38.6 years.
Expanding for unsurveyed households, the estimated population of 430 included 204 males (48%) and 226 females (52%) (Figure 7); 419 were Alaska Natives (97%). For comparisons, the U.S. Census Bureau reported a total population in 2000 of 377 people, including 194 (51%) males and 183 females (49%). For 2007, the Alaska Department of Labor estimated a total population of 398 people, 32 people less than ADF&G, which suggested that larger households were slightly overrepresented in the ADF&G survey.
Figure 7.–Population profile, Kivalina, 2007. The estimated population included 204 males (48%) and 226 females (53%).
Number of People70 60 50 40 30 20 10 0 10 20 30 40 50 60 70
0-9 years
10 - 19 years
20 - 29 years
30 - 39 years
40 - 49 years
50 - 59 years
60 - 69 years
70 - 79 years
80 - 89 years
90 - 99 years
> 100 yearsAGE
Male (48%) Female (52%)
20
WILD FOOD USE AND HARVESTS The primary purpose of the household survey was to collect information about the harvest and use of edible wild foods. Respondents were asked whether their household used or tried to harvest each resource during the study year. If they tried to harvest a resource, they were asked how much they caught and for other details of the harvest such as gear type, sex of the animal, or month of harvest.
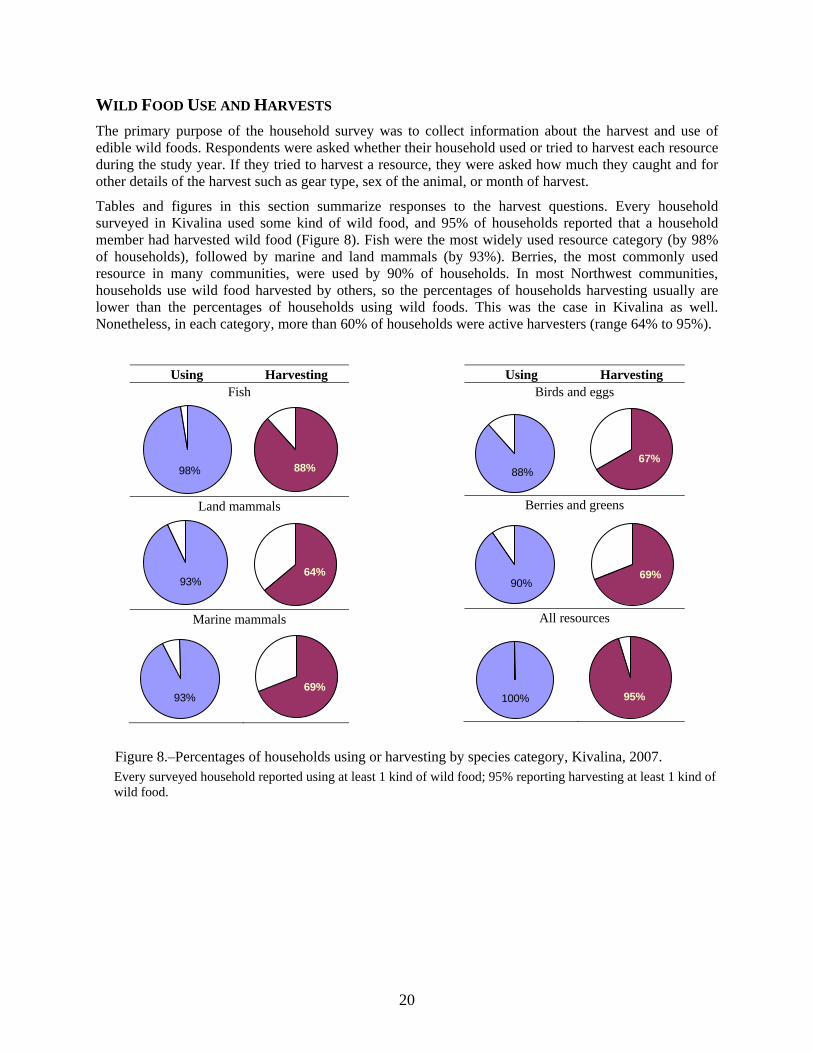
Tables and figures in this section summarize responses to the harvest questions. Every household surveyed in Kivalina used some kind of wild food, and 95% of households reported that a household member had harvested wild food (Figure 8). Fish were the most widely used resource category (by 98% of households), followed by marine and land mammals (by 93%). Berries, the most commonly used resource in many communities, were used by 90% of households. In most Northwest communities, households use wild food harvested by others, so the percentages of households harvesting usually are lower than the percentages of households using wild foods. This was the case in Kivalina as well. Nonetheless, in each category, more than 60% of households were active harvesters (range 64% to 95%).
Using Harvesting Fish
Land mammals
Marine mammals
Using Harvesting Birds and eggs
Berries and greens
All resources
Figure 8.–Percentages of households using or harvesting by species category, Kivalina, 2007. Every surveyed household reported using at least 1 kind of wild food; 95% reporting harvesting at least 1 kind of wild food.
98% 88%
93%64%
93%69%
88%67%
90%69%
100% 95%
21
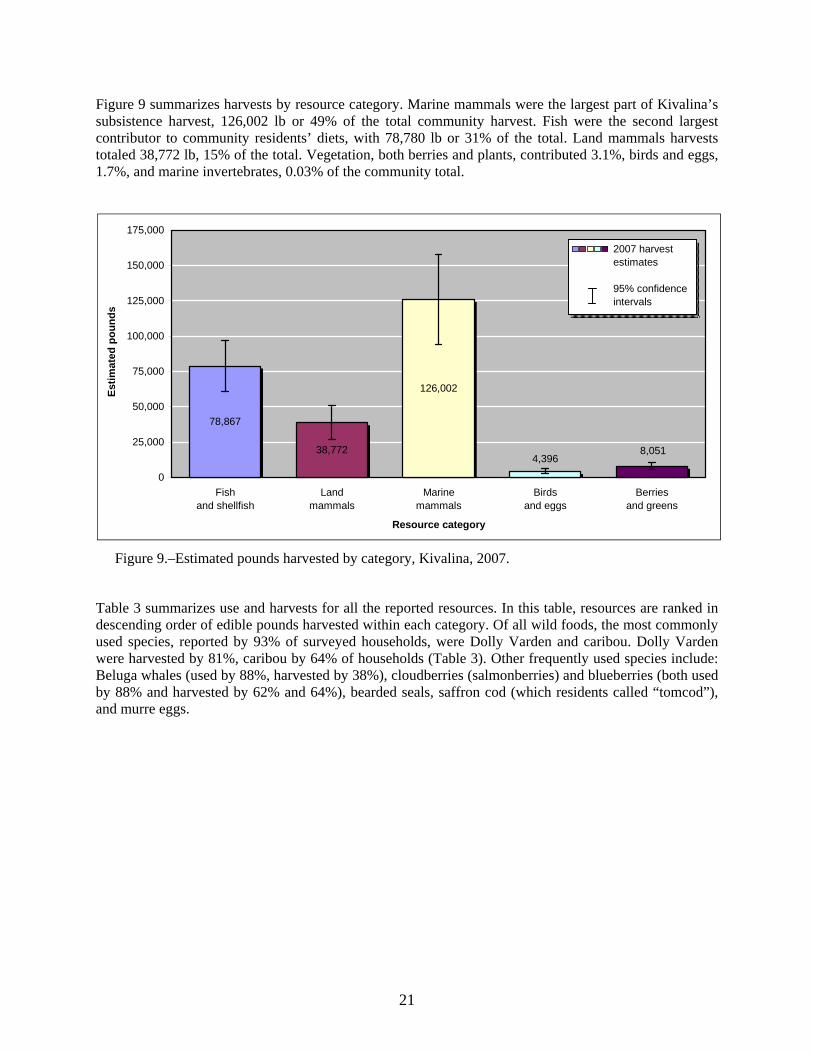
Figure 9 summarizes harvests by resource category. Marine mammals were the largest part of Kivalina’s subsistence harvest, 126,002 lb or 49% of the total community harvest. Fish were the second largest contributor to community residents’ diets, with 78,780 lb or 31% of the total. Land mammals harvests totaled 38,772 lb, 15% of the total. Vegetation, both berries and plants, contributed 3.1%, birds and eggs, 1.7%, and marine invertebrates, 0.03% of the community total.
Figure 9.–Estimated pounds harvested by category, Kivalina, 2007.
Table 3 summarizes use and harvests for all the reported resources. In this table, resources are ranked in descending order of edible pounds harvested within each category. Of all wild foods, the most commonly used species, reported by 93% of surveyed households, were Dolly Varden and caribou. Dolly Varden were harvested by 81%, caribou by 64% of households (Table 3). Other frequently used species include: Beluga whales (used by 88%, harvested by 38%), cloudberries (salmonberries) and blueberries (both used by 88% and harvested by 62% and 64%), bearded seals, saffron cod (which residents called “tomcod”), and murre eggs.
78,867
38,772 8,0514,396
126,002
0
25,000
50,000
75,000
100,000
125,000
150,000
175,000
Fishand shellfish
Landmammals
Marinemammals
Birdsand eggs
Berriesand greens
Resource category
Estim
ated
pou
nds
2007 harvest estimates
95% confidence intervals
22
Table 3.–Estimated harvests of fish, game, and plant resources, Kivalina, 2007.
Resource name(s)
Percentage of households
Estimated number harvested Estimated pounds harvested
95% confidence
limit Community totals
Community totals
Household averages Per capita
Use Harvest Number Unit Number Unit Number Unit Number UnitFish Salmon Chum salmon 45% 29% 401 ind 2,406 lb 30 lb 5.6 lb ± 50% Chinook salmon 7% 5% 41 ind 502 lb 6 lb 1.2 lb ± 134% Pink salmon 19% 5% 120 ind 251 lb 3 lb 0.6 lb ± 105% Coho salmon 10% 5% 33 ind 170 lb 2 lb 0.4 lb ± 125% Sockeye salmon 0% 0% 0 ind 0 lb 0 lb 0.0 lb n/a Unknown salmon 5% 2% 19 ind 116 lb 1 lb 0.3 lb ± 141% Subtotal, salmon 50% 31% 613 ind 3,445 lb 43 lb 8.0 lb ± 59% Other fish Dolly Varden (trout) 93% 81% 20,527 ind 67,739 lb 836 lb 157.5 lb ± 23% Saffron cod (tomcod) 81% 74% 25,824 ind 5,423 lb 67 lb 12.6 lb ± 28% Whitefish 40% 19% 338 ind 709 lb 9 lb 1.6 lb ± 65% Arctic grayling 33% 24% 786 ind 708 lb 9 lb 1.6 lb ± 89% Arctic cod (blue cod) 31% 21% 6,279 ind 691 lb 9 lb 1.6 lb ± 75% Burbot (mudshark) 14% 10% 15 ind 65 lb 1 lb 0.2 lb ± 92% Northern pike 17% 0% 0 ind 0 lb 0 lb 0.0 lb n/a Sheefish 36% 0% 0 ind 0 lb 0 lb 0.0 lb n/a Subtotal, other fish 93% 86% 53,770 ind 75,335 lb 930 lb 175.2 lb ± 24% Subtotal, all fish resources 98% 88% 54,383 ind 78,780 lb 973 lb 183.2 lb ± 23%
-continued-
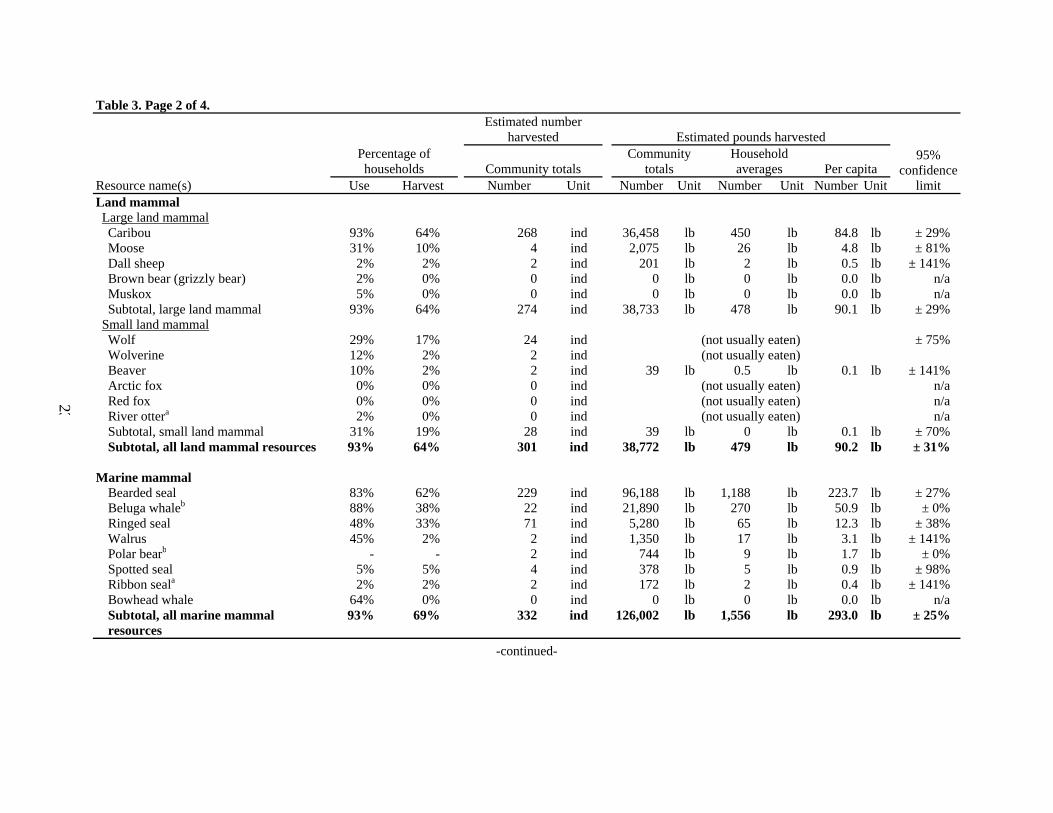
23
Table 3. Page 2 of 4.
Resource name(s)
Percentage of households
Estimated number harvested Estimated pounds harvested
95% confidence
limit Community totals
Community totals
Household averages Per capita
Use Harvest Number Unit Number Unit Number Unit Number UnitLand mammal Large land mammal Caribou 93% 64% 268 ind 36,458 lb 450 lb 84.8 lb ± 29% Moose 31% 10% 4 ind 2,075 lb 26 lb 4.8 lb ± 81% Dall sheep 2% 2% 2 ind 201 lb 2 lb 0.5 lb ± 141% Brown bear (grizzly bear) 2% 0% 0 ind 0 lb 0 lb 0.0 lb n/a Muskox 5% 0% 0 ind 0 lb 0 lb 0.0 lb n/a Subtotal, large land mammal 93% 64% 274 ind 38,733 lb 478 lb 90.1 lb ± 29% Small land mammal Wolf 29% 17% 24 ind (not usually eaten) ± 75% Wolverine 12% 2% 2 ind (not usually eaten) Beaver 10% 2% 2 ind 39 lb 0.5 lb 0.1 lb ± 141% Arctic fox 0% 0% 0 ind (not usually eaten) n/a Red fox 0% 0% 0 ind (not usually eaten) n/a River ottera 2% 0% 0 ind (not usually eaten) n/a Subtotal, small land mammal 31% 19% 28 ind 39 lb 0 lb 0.1 lb ± 70% Subtotal, all land mammal resources 93% 64% 301 ind 38,772 lb 479 lb 90.2 lb ± 31% Marine mammal Bearded seal 83% 62% 229 ind 96,188 lb 1,188 lb 223.7 lb ± 27% Beluga whaleb 88% 38% 22 ind 21,890 lb 270 lb 50.9 lb ± 0% Ringed seal 48% 33% 71 ind 5,280 lb 65 lb 12.3 lb ± 38% Walrus 45% 2% 2 ind 1,350 lb 17 lb 3.1 lb ± 141% Polar bearb - - 2 ind 744 lb 9 lb 1.7 lb ± 0% Spotted seal 5% 5% 4 ind 378 lb 5 lb 0.9 lb ± 98% Ribbon seala 2% 2% 2 ind 172 lb 2 lb 0.4 lb ± 141% Bowhead whale 64% 0% 0 ind 0 lb 0 lb 0.0 lb n/a Subtotal, all marine mammal
resources 93% 69% 332 ind
126,002 lb 1,556 lb 293.0 lb ± 25%
-continued-
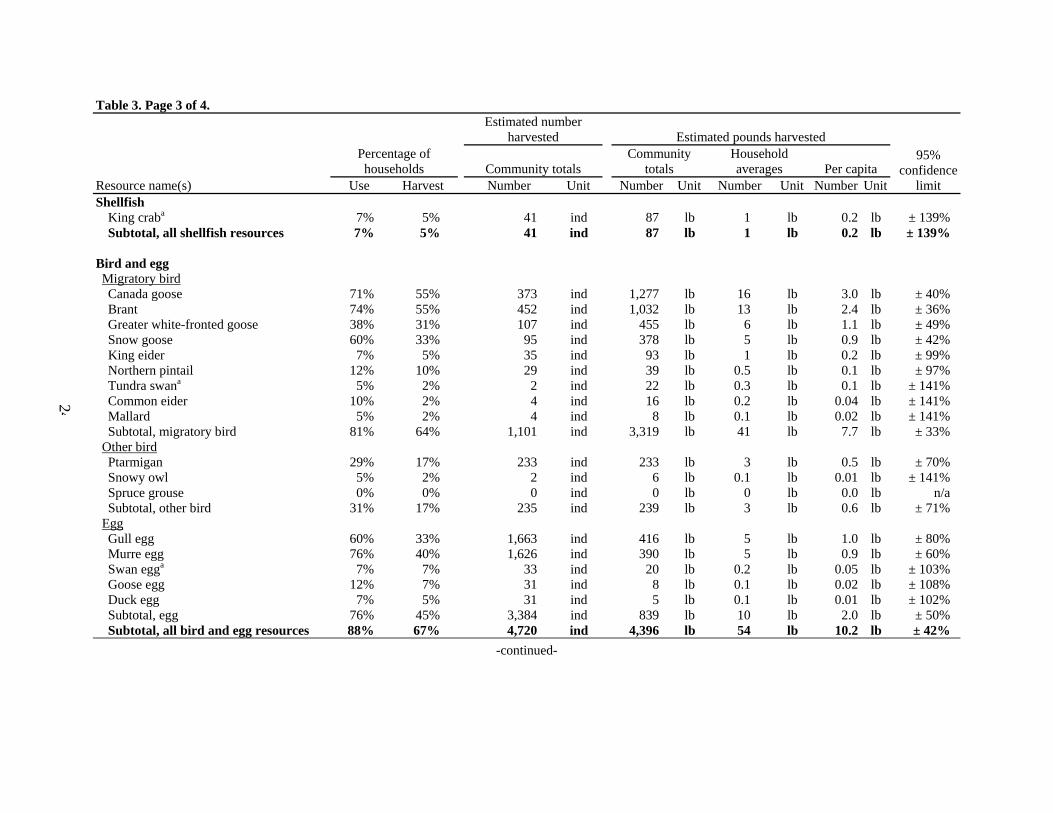
24
Table 3. Page 3 of 4.
Resource name(s)
Percentage of households
Estimated number harvested Estimated pounds harvested
95% confidence
limit Community totals
Community totals
Household averages Per capita
Use Harvest Number Unit Number Unit Number Unit Number UnitShellfish King craba 7% 5% 41 ind 87 lb 1 lb 0.2 lb ± 139% Subtotal, all shellfish resources 7% 5% 41 ind 87 lb 1 lb 0.2 lb ± 139% Bird and egg Migratory bird Canada goose 71% 55% 373 ind 1,277 lb 16 lb 3.0 lb ± 40% Brant 74% 55% 452 ind 1,032 lb 13 lb 2.4 lb ± 36% Greater white-fronted goose 38% 31% 107 ind 455 lb 6 lb 1.1 lb ± 49% Snow goose 60% 33% 95 ind 378 lb 5 lb 0.9 lb ± 42% King eider 7% 5% 35 ind 93 lb 1 lb 0.2 lb ± 99% Northern pintail 12% 10% 29 ind 39 lb 0.5 lb 0.1 lb ± 97% Tundra swana 5% 2% 2 ind 22 lb 0.3 lb 0.1 lb ± 141% Common eider 10% 2% 4 ind 16 lb 0.2 lb 0.04 lb ± 141% Mallard 5% 2% 4 ind 8 lb 0.1 lb 0.02 lb ± 141% Subtotal, migratory bird 81% 64% 1,101 ind 3,319 lb 41 lb 7.7 lb ± 33% Other bird Ptarmigan 29% 17% 233 ind 233 lb 3 lb 0.5 lb ± 70% Snowy owl 5% 2% 2 ind 6 lb 0.1 lb 0.01 lb ± 141% Spruce grouse 0% 0% 0 ind 0 lb 0 lb 0.0 lb n/a Subtotal, other bird 31% 17% 235 ind 239 lb 3 lb 0.6 lb ± 71% Egg Gull egg 60% 33% 1,663 ind 416 lb 5 lb 1.0 lb ± 80% Murre egg 76% 40% 1,626 ind 390 lb 5 lb 0.9 lb ± 60% Swan egga 7% 7% 33 ind 20 lb 0.2 lb 0.05 lb ± 103% Goose egg 12% 7% 31 ind 8 lb 0.1 lb 0.02 lb ± 108% Duck egg 7% 5% 31 ind 5 lb 0.1 lb 0.01 lb ± 102% Subtotal, egg 76% 45% 3,384 ind 839 lb 10 lb 2.0 lb ± 50% Subtotal, all bird and egg resources 88% 67% 4,720 ind 4,396 lb 54 lb 10.2 lb ± 42%
-continued-
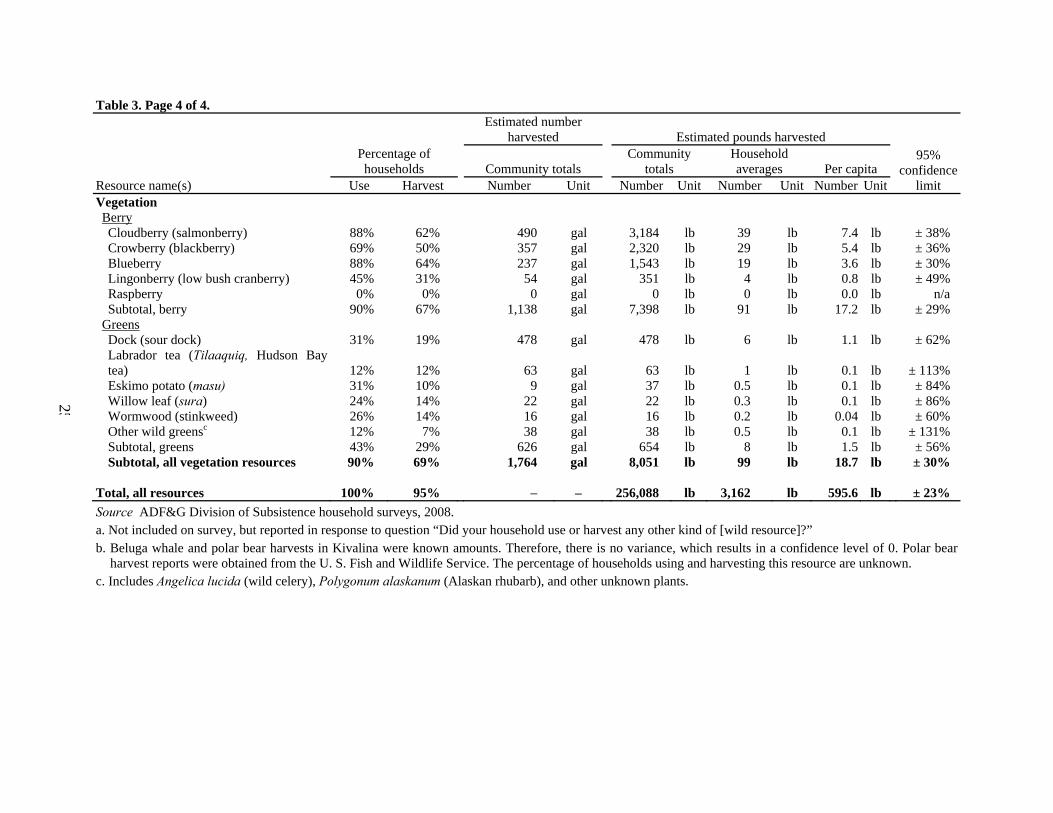
25
Table 3. Page 4 of 4.
Resource name(s)
Percentage of households
Estimated number harvested Estimated pounds harvested
95% confidence
limit Community totals
Community totals
Household averages Per capita
Use Harvest Number Unit Number Unit Number Unit Number UnitVegetation Berry Cloudberry (salmonberry) 88% 62% 490 gal 3,184 lb 39 lb 7.4 lb ± 38% Crowberry (blackberry) 69% 50% 357 gal 2,320 lb 29 lb 5.4 lb ± 36% Blueberry 88% 64% 237 gal 1,543 lb 19 lb 3.6 lb ± 30% Lingonberry (low bush cranberry) 45% 31% 54 gal 351 lb 4 lb 0.8 lb ± 49% Raspberry 0% 0% 0 gal 0 lb 0 lb 0.0 lb n/a Subtotal, berry 90% 67% 1,138 gal 7,398 lb 91 lb 17.2 lb ± 29% Greens Dock (sour dock) 31% 19% 478 gal 478 lb 6 lb 1.1 lb ± 62% Labrador tea (Tilaaquiq, Hudson Bay
tea) 12% 12% 63 gal 63 lb 1 lb 0.1 lb ± 113% Eskimo potato (masu) 31% 10% 9 gal 37 lb 0.5 lb 0.1 lb ± 84% Willow leaf (sura) 24% 14% 22 gal 22 lb 0.3 lb 0.1 lb ± 86% Wormwood (stinkweed) 26% 14% 16 gal 16 lb 0.2 lb 0.04 lb ± 60% Other wild greensc 12% 7% 38 gal 38 lb 0.5 lb 0.1 lb ± 131% Subtotal, greens 43% 29% 626 gal 654 lb 8 lb 1.5 lb ± 56% Subtotal, all vegetation resources 90% 69% 1,764 gal 8,051 lb 99 lb 18.7 lb ± 30% Total, all resources 100% 95% – – 256,088 lb 3,162 lb 595.6 lb ± 23% Source ADF&G Division of Subsistence household surveys, 2008. a. Not included on survey, but reported in response to question “Did your household use or harvest any other kind of [wild resource]?” b. Beluga whale and polar bear harvests in Kivalina were known amounts. Therefore, there is no variance, which results in a confidence level of 0. Polar bear
harvest reports were obtained from the U. S. Fish and Wildlife Service. The percentage of households using and harvesting this resource are unknown. c. Includes Angelica lucida (wild celery), Polygonum alaskanum (Alaskan rhubarb), and other unknown plants.
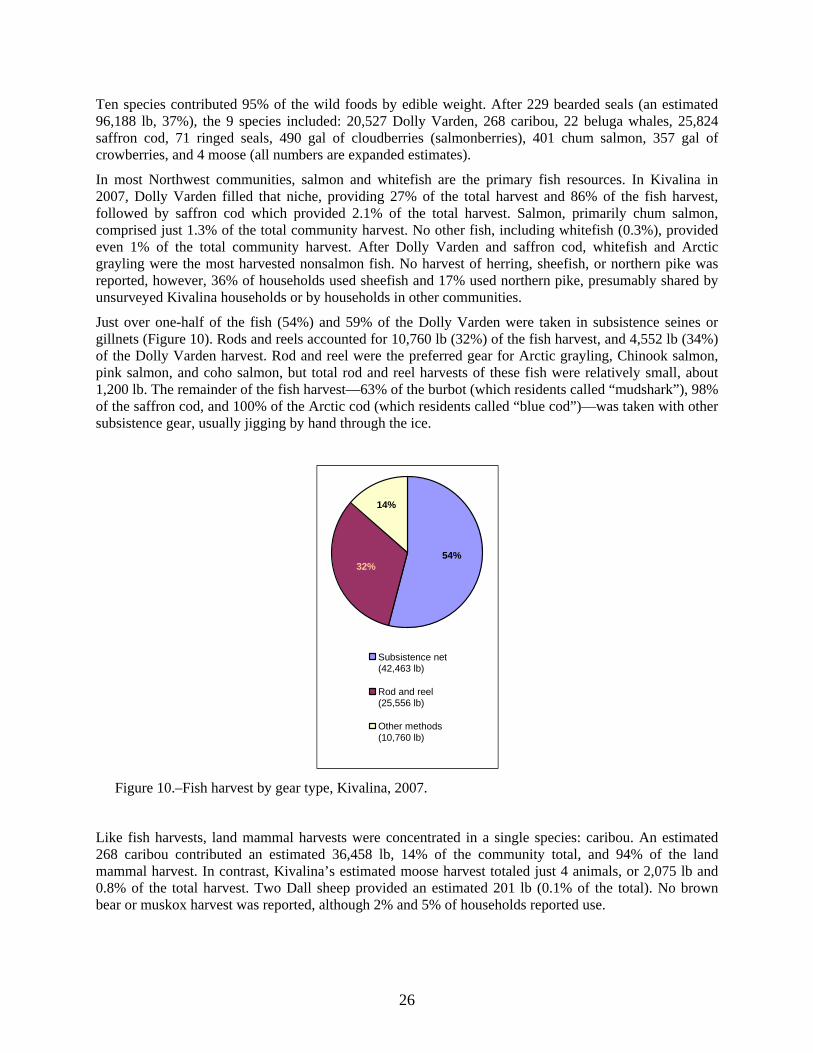
26
Ten species contributed 95% of the wild foods by edible weight. After 229 bearded seals (an estimated 96,188 lb, 37%), the 9 species included: 20,527 Dolly Varden, 268 caribou, 22 beluga whales, 25,824 saffron cod, 71 ringed seals, 490 gal of cloudberries (salmonberries), 401 chum salmon, 357 gal of crowberries, and 4 moose (all numbers are expanded estimates).
In most Northwest communities, salmon and whitefish are the primary fish resources. In Kivalina in 2007, Dolly Varden filled that niche, providing 27% of the total harvest and 86% of the fish harvest, followed by saffron cod which provided 2.1% of the total harvest. Salmon, primarily chum salmon, comprised just 1.3% of the total community harvest. No other fish, including whitefish (0.3%), provided even 1% of the total community harvest. After Dolly Varden and saffron cod, whitefish and Arctic grayling were the most harvested nonsalmon fish. No harvest of herring, sheefish, or northern pike was reported, however, 36% of households used sheefish and 17% used northern pike, presumably shared by unsurveyed Kivalina households or by households in other communities.
Just over one-half of the fish (54%) and 59% of the Dolly Varden were taken in subsistence seines or gillnets (Figure 10). Rods and reels accounted for 10,760 lb (32%) of the fish harvest, and 4,552 lb (34%) of the Dolly Varden harvest. Rod and reel were the preferred gear for Arctic grayling, Chinook salmon, pink salmon, and coho salmon, but total rod and reel harvests of these fish were relatively small, about 1,200 lb. The remainder of the fish harvest—63% of the burbot (which residents called “mudshark”), 98% of the saffron cod, and 100% of the Arctic cod (which residents called “blue cod”)—was taken with other subsistence gear, usually jigging by hand through the ice.
Figure 10.–Fish harvest by gear type, Kivalina, 2007.
Like fish harvests, land mammal harvests were concentrated in a single species: caribou. An estimated 268 caribou contributed an estimated 36,458 lb, 14% of the community total, and 94% of the land mammal harvest. In contrast, Kivalina’s estimated moose harvest totaled just 4 animals, or 2,075 lb and 0.8% of the total harvest. Two Dall sheep provided an estimated 201 lb (0.1% of the total). No brown bear or muskox harvest was reported, although 2% and 5% of households reported use.
14%
54%32%
Subsistence net(42,463 lb)
Rod and reel(25,556 lb)
Other methods(10,760 lb)
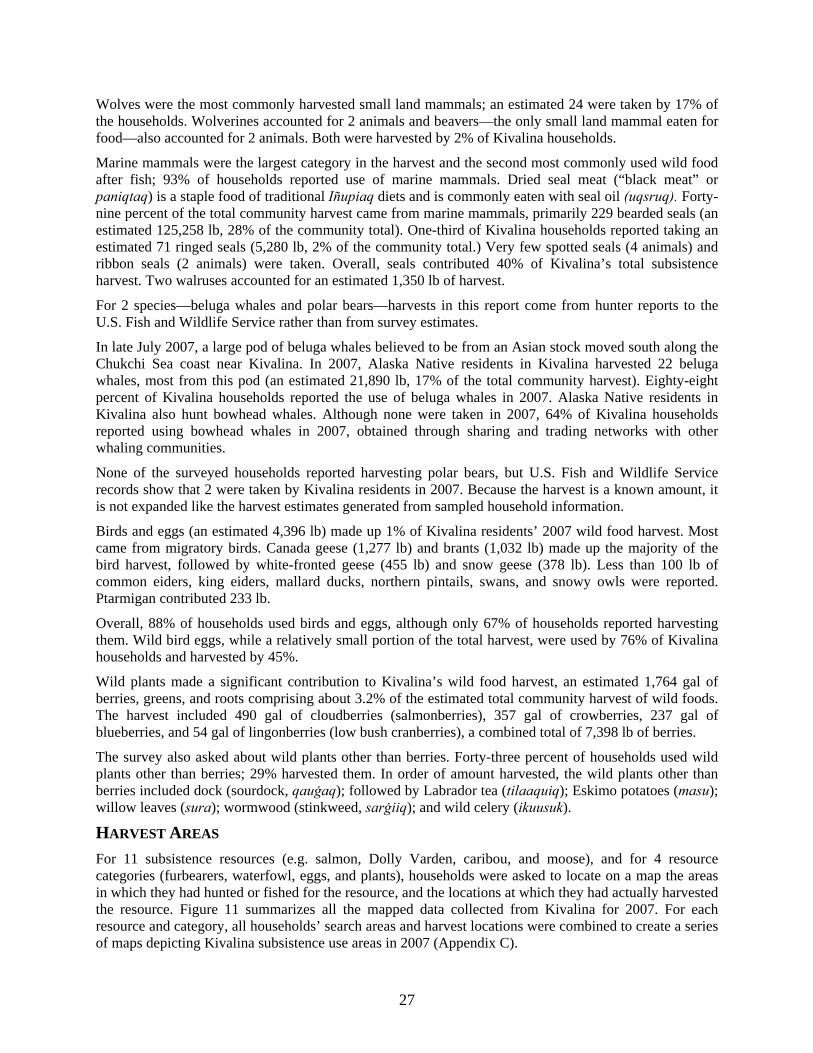
27
Wolves were the most commonly harvested small land mammals; an estimated 24 were taken by 17% of the households. Wolverines accounted for 2 animals and beavers—the only small land mammal eaten for food—also accounted for 2 animals. Both were harvested by 2% of Kivalina households.
Marine mammals were the largest category in the harvest and the second most commonly used wild food after fish; 93% of households reported use of marine mammals. Dried seal meat (“black meat” or paniqtaq) is a staple food of traditional Iñupiaq diets and is commonly eaten with seal oil (uqsruq). Forty-nine percent of the total community harvest came from marine mammals, primarily 229 bearded seals (an estimated 125,258 lb, 28% of the community total). One-third of Kivalina households reported taking an estimated 71 ringed seals (5,280 lb, 2% of the community total.) Very few spotted seals (4 animals) and ribbon seals (2 animals) were taken. Overall, seals contributed 40% of Kivalina’s total subsistence harvest. Two walruses accounted for an estimated 1,350 lb of harvest.
For 2 species—beluga whales and polar bears—harvests in this report come from hunter reports to the U.S. Fish and Wildlife Service rather than from survey estimates.
In late July 2007, a large pod of beluga whales believed to be from an Asian stock moved south along the Chukchi Sea coast near Kivalina. In 2007, Alaska Native residents in Kivalina harvested 22 beluga whales, most from this pod (an estimated 21,890 lb, 17% of the total community harvest). Eighty-eight percent of Kivalina households reported the use of beluga whales in 2007. Alaska Native residents in Kivalina also hunt bowhead whales. Although none were taken in 2007, 64% of Kivalina households reported using bowhead whales in 2007, obtained through sharing and trading networks with other whaling communities.
None of the surveyed households reported harvesting polar bears, but U.S. Fish and Wildlife Service records show that 2 were taken by Kivalina residents in 2007. Because the harvest is a known amount, it is not expanded like the harvest estimates generated from sampled household information.
Birds and eggs (an estimated 4,396 lb) made up 1% of Kivalina residents’ 2007 wild food harvest. Most came from migratory birds. Canada geese (1,277 lb) and brants (1,032 lb) made up the majority of the bird harvest, followed by white-fronted geese (455 lb) and snow geese (378 lb). Less than 100 lb of common eiders, king eiders, mallard ducks, northern pintails, swans, and snowy owls were reported. Ptarmigan contributed 233 lb.
Overall, 88% of households used birds and eggs, although only 67% of households reported harvesting them. Wild bird eggs, while a relatively small portion of the total harvest, were used by 76% of Kivalina households and harvested by 45%.
Wild plants made a significant contribution to Kivalina’s wild food harvest, an estimated 1,764 gal of berries, greens, and roots comprising about 3.2% of the estimated total community harvest of wild foods. The harvest included 490 gal of cloudberries (salmonberries), 357 gal of crowberries, 237 gal of blueberries, and 54 gal of lingonberries (low bush cranberries), a combined total of 7,398 lb of berries.
The survey also asked about wild plants other than berries. Forty-three percent of households used wild plants other than berries; 29% harvested them. In order of amount harvested, the wild plants other than berries included dock (sourdock, qauġaq); followed by Labrador tea (tilaaquiq); Eskimo potatoes (masu); willow leaves (sura); wormwood (stinkweed, sarġiiq); and wild celery (ikuusuk).
HARVEST AREAS For 11 subsistence resources (e.g. salmon, Dolly Varden, caribou, and moose), and for 4 resource categories (furbearers, waterfowl, eggs, and plants), households were asked to locate on a map the areas in which they had hunted or fished for the resource, and the locations at which they had actually harvested the resource. Figure 11 summarizes all the mapped data collected from Kivalina for 2007. For each resource and category, all households’ search areas and harvest locations were combined to create a series of maps depicting Kivalina subsistence use areas in 2007 (Appendix C).
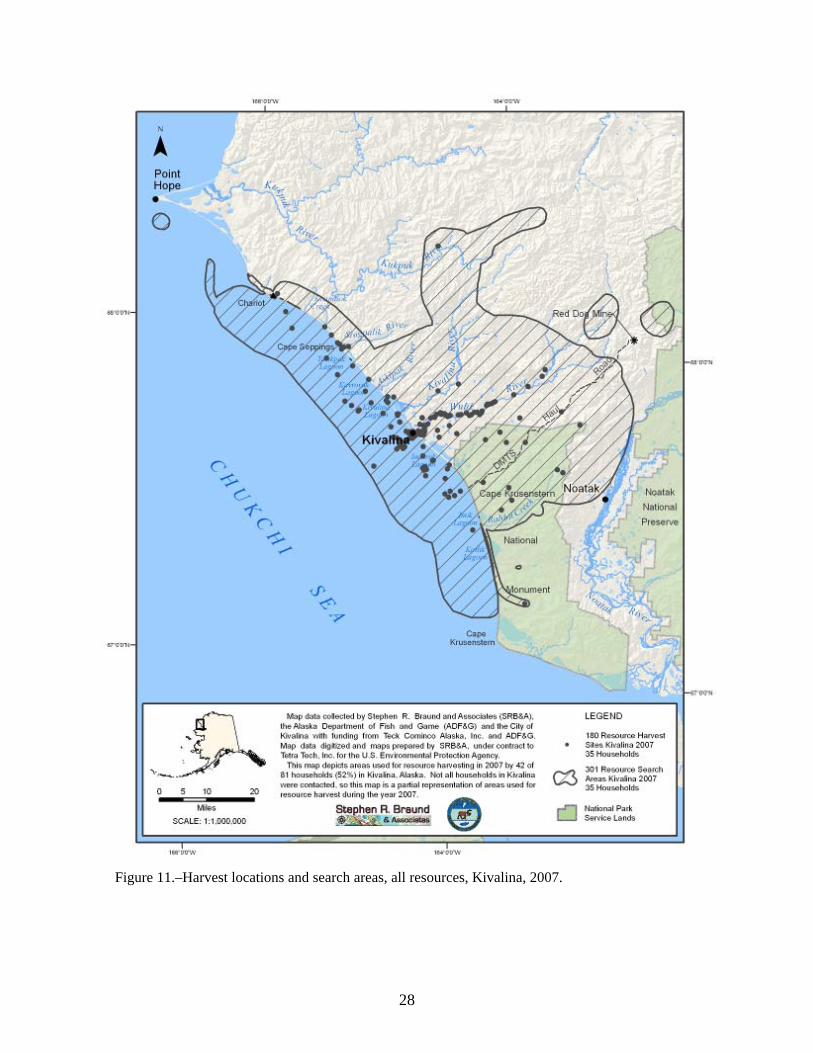
28
Figure 11.–Harvest locations and search areas, all resources, Kivalina, 2007.
29
For 2007, Kivalina respondents reported using 8,568 km2 for subsistence harvesting activities, including most of the Kivalina River and Wulik River watersheds, as well as coastal waters of the Chukchi Sea in both directions from Kivalina, 70 km northwest to Cape Thompson and 70 km southeast to Cape Krusenstern. For the 14 resources mapped in this study, lands used for subsistence totaled 5,488 km2 while marine waters totaled 2,820 km2.
The land areas used by respondents in 2007 closely mirrored traditional Kivalliñiġmiut territory (Burch Jr. 1998), including forays for sheep and furbearers in the upper Kukpuk River valley, with 1 exception. The major exception to the traditional pattern was that 2007 harvest areas extended about 25 km further south than the traditional southern boundary, to include the Rabbit Creek watershed. Traditionally, this area was occupied (especially in spring) by the lower Noatak River society, the Napaaqtuġmiut. Kivalina’s use of this area in 2007 was limited to caribou and furbearer hunting, which occur primarily in winter. In other words, they would have been in the area at a different time than Noatak residents. Further, mapping of Noatak respondents’ search areas and harvest locations showed no use of the lower Rabbit Creek area in 2007 (Figure 26).
The importance of the Wulik River was evident in the mapped data. Almost 90% of the Dolly Varden harvest sites reported by surveyed households were in the Wulik River watershed. The Wulik was also a primary source of salmon, whitefishes, caribou, moose, waterfowl, berries, and plants.
No search areas encompassed Red Dog Mine, but caribou and furbearer search areas did include lands on either side of the DeLong Mountains Transportation System (DMTS) road from the mine to the port site. One respondent reported hunting Dall sheep northeast and northwest of the mine site.
HARVEST ASSESSMENTS The survey asked respondents to assess their own harvests in 2 ways: whether they got more, less, or about the same amount of 6 resource categories in 2007 as in past years, and whether they got “enough” of each of the 6 resource categories. This section discusses responses to those questions. Percentages do not include households that did not respond to the question or reported that they never harvested the resource. Subsistence harvest success also can be assessed by comparing current harvest estimates with past harvest estimates; that will be discussed in a later section.
In every resource category, at least 2 out of 3 Kivalina respondents said they harvested the same amount or more in 2007 as they had in past years (Figure 12). For fish, 79% of respondents reported the same or more. For birds, eggs, berries, and greens, 74% reported the same or more, and for land and marine mammals, 68% of respondents reported harvesting the same amount or more in 2007. Responses were consistent across categories, except that 18% of respondents reported harvesting more berries and greens in 2007, more than twice the proportion that reported harvesting more in other categories. This was related to berry abundance; in 2007 Northwest Alaska had one of the best wild berry crops of recent years.
Responses to the “did your household get enough” question were consistent with the less–same–more responses (Figure 12). On the average, 77% of respondents reported that they “got enough” wild foods in 2007.
Respondents most frequently reported shortages of land mammals; 31% of households reported not getting “enough.” All respondents who said their household did not get enough large land mammals said, specifically, they did not get enough caribou. One household also identified moose. When asked why they did not get enough, most respondents cited changes in caribou migration routes. Other responses, by 1 person each, included: lack of transportation, high fuel prices, work, and predation.
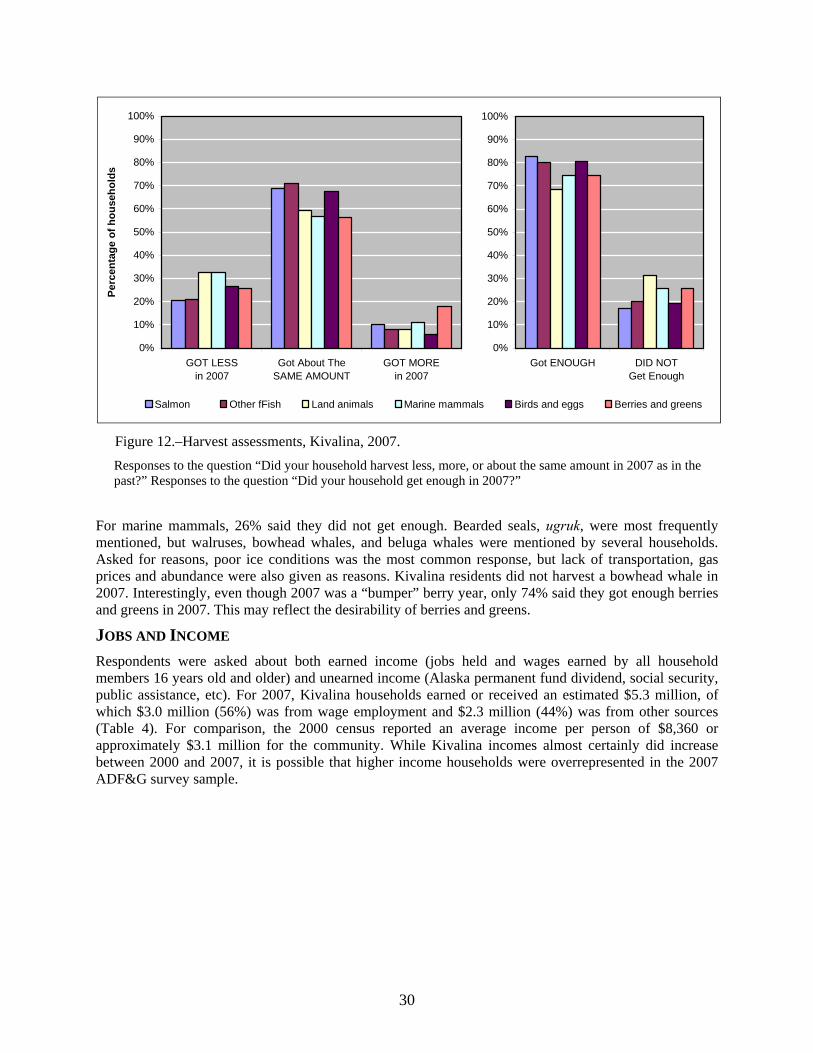
30
Figure 12.–Harvest assessments, Kivalina, 2007. Responses to the question “Did your household harvest less, more, or about the same amount in 2007 as in the past?” Responses to the question “Did your household get enough in 2007?”
For marine mammals, 26% said they did not get enough. Bearded seals, ugruk, were most frequently mentioned, but walruses, bowhead whales, and beluga whales were mentioned by several households. Asked for reasons, poor ice conditions was the most common response, but lack of transportation, gas prices and abundance were also given as reasons. Kivalina residents did not harvest a bowhead whale in 2007. Interestingly, even though 2007 was a “bumper” berry year, only 74% said they got enough berries and greens in 2007. This may reflect the desirability of berries and greens.
JOBS AND INCOME Respondents were asked about both earned income (jobs held and wages earned by all household members 16 years old and older) and unearned income (Alaska permanent fund dividend, social security, public assistance, etc). For 2007, Kivalina households earned or received an estimated $5.3 million, of which $3.0 million (56%) was from wage employment and $2.3 million (44%) was from other sources (Table 4). For comparison, the 2000 census reported an average income per person of $8,360 or approximately $3.1 million for the community. While Kivalina incomes almost certainly did increase between 2000 and 2007, it is possible that higher income households were overrepresented in the 2007 ADF&G survey sample.
0%
10%
20%
30%
40%
50%
60%
70%
80%
90%
100%
GOT LESSin 2007
Got About TheSAME AMOUNT
GOT MOREin 2007
Perc
enta
ge o
f hou
seho
lds
Salmon Other fFish Land animals Marine mammals Birds and eggs Berries and greens
0%
10%
20%
30%
40%
50%
60%
70%
80%
90%
100%
Got ENOUGH DID NOTGet Enough
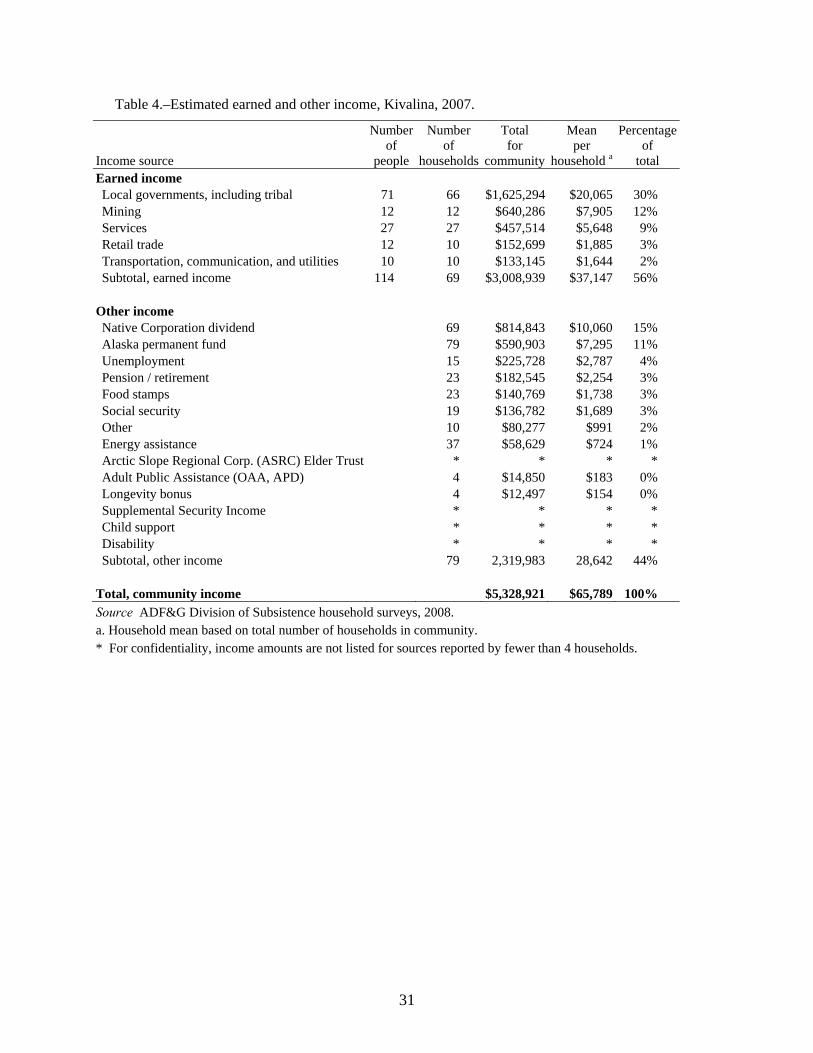
31
Table 4.–Estimated earned and other income, Kivalina, 2007.
Income source
Numberof
people
Numberof
households
Total for
community
Mean per
household a
Percentageof
total Earned income Local governments, including tribal 71 66 $1,625,294 $20,065 30% Mining 12 12 $640,286 $7,905 12% Services 27 27 $457,514 $5,648 9% Retail trade 12 10 $152,699 $1,885 3% Transportation, communication, and utilities 10 10 $133,145 $1,644 2% Subtotal, earned income 114 69 $3,008,939 $37,147 56% Other income Native Corporation dividend 69 $814,843 $10,060 15% Alaska permanent fund 79 $590,903 $7,295 11% Unemployment 15 $225,728 $2,787 4% Pension / retirement 23 $182,545 $2,254 3% Food stamps 23 $140,769 $1,738 3% Social security 19 $136,782 $1,689 3% Other 10 $80,277 $991 2% Energy assistance 37 $58,629 $724 1% Arctic Slope Regional Corp. (ASRC) Elder Trust * * * * Adult Public Assistance (OAA, APD) 4 $14,850 $183 0% Longevity bonus 4 $12,497 $154 0% Supplemental Security Income * * * * Child support * * * * Disability * * * * Subtotal, other income 79 2,319,983 28,642 44% Total, community income $5,328,921 $65,789 100% Source ADF&G Division of Subsistence household surveys, 2008. a. Household mean based on total number of households in community. * For confidentiality, income amounts are not listed for sources reported by fewer than 4 households.
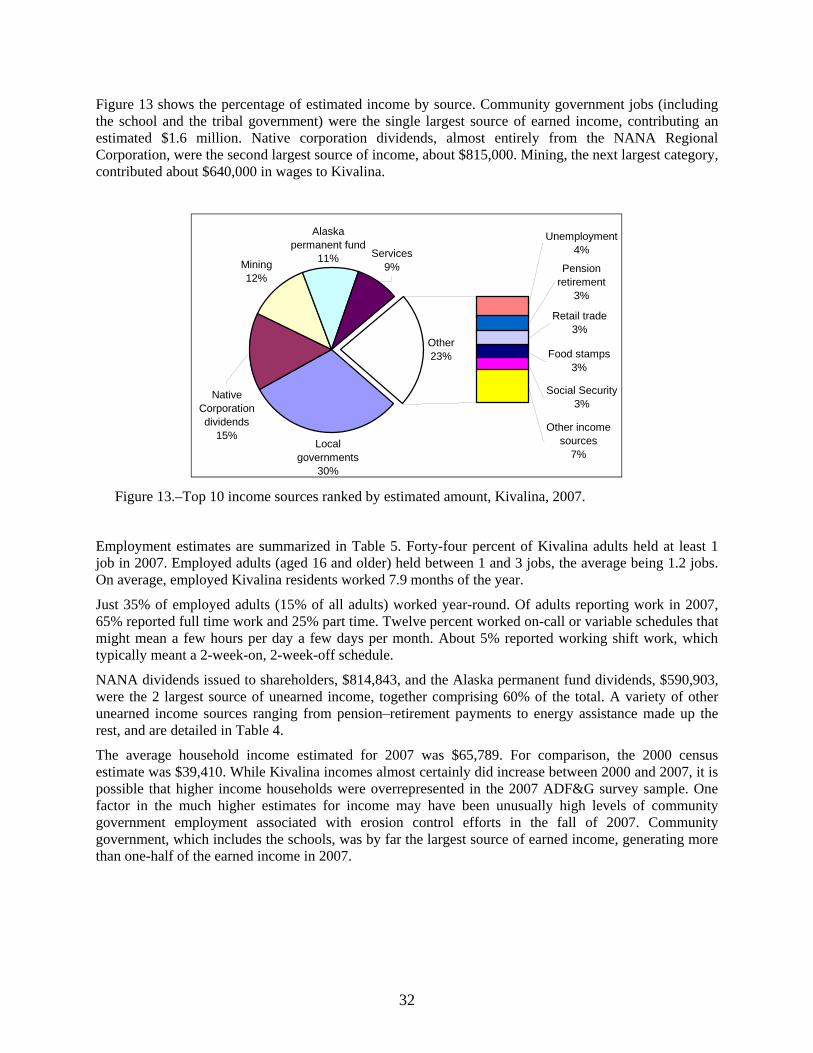
32
Figure 13 shows the percentage of estimated income by source. Community government jobs (including the school and the tribal government) were the single largest source of earned income, contributing an estimated $1.6 million. Native corporation dividends, almost entirely from the NANA Regional Corporation, were the second largest source of income, about $815,000. Mining, the next largest category, contributed about $640,000 in wages to Kivalina.
Figure 13.–Top 10 income sources ranked by estimated amount, Kivalina, 2007.
Employment estimates are summarized in Table 5. Forty-four percent of Kivalina adults held at least 1 job in 2007. Employed adults (aged 16 and older) held between 1 and 3 jobs, the average being 1.2 jobs. On average, employed Kivalina residents worked 7.9 months of the year.
Just 35% of employed adults (15% of all adults) worked year-round. Of adults reporting work in 2007, 65% reported full time work and 25% part time. Twelve percent worked on-call or variable schedules that might mean a few hours per day a few days per month. About 5% reported working shift work, which typically meant a 2-week-on, 2-week-off schedule.
NANA dividends issued to shareholders, $814,843, and the Alaska permanent fund dividends, $590,903, were the 2 largest source of unearned income, together comprising 60% of the total. A variety of other unearned income sources ranging from pension–retirement payments to energy assistance made up the rest, and are detailed in Table 4.
The average household income estimated for 2007 was $65,789. For comparison, the 2000 census estimate was $39,410. While Kivalina incomes almost certainly did increase between 2000 and 2007, it is possible that higher income households were overrepresented in the 2007 ADF&G survey sample. One factor in the much higher estimates for income may have been unusually high levels of community government employment associated with erosion control efforts in the fall of 2007. Community government, which includes the schools, was by far the largest source of earned income, generating more than one-half of the earned income in 2007.
Mining12%
Other23%
Native Corporation dividends
15%Local
governments30%
Unemployment4%
Other income sources
7%
Social Security3%
Food stamps3%
Pension retirement
3%
Retail trade3%
Services9%
Alaska permanent fund
11%
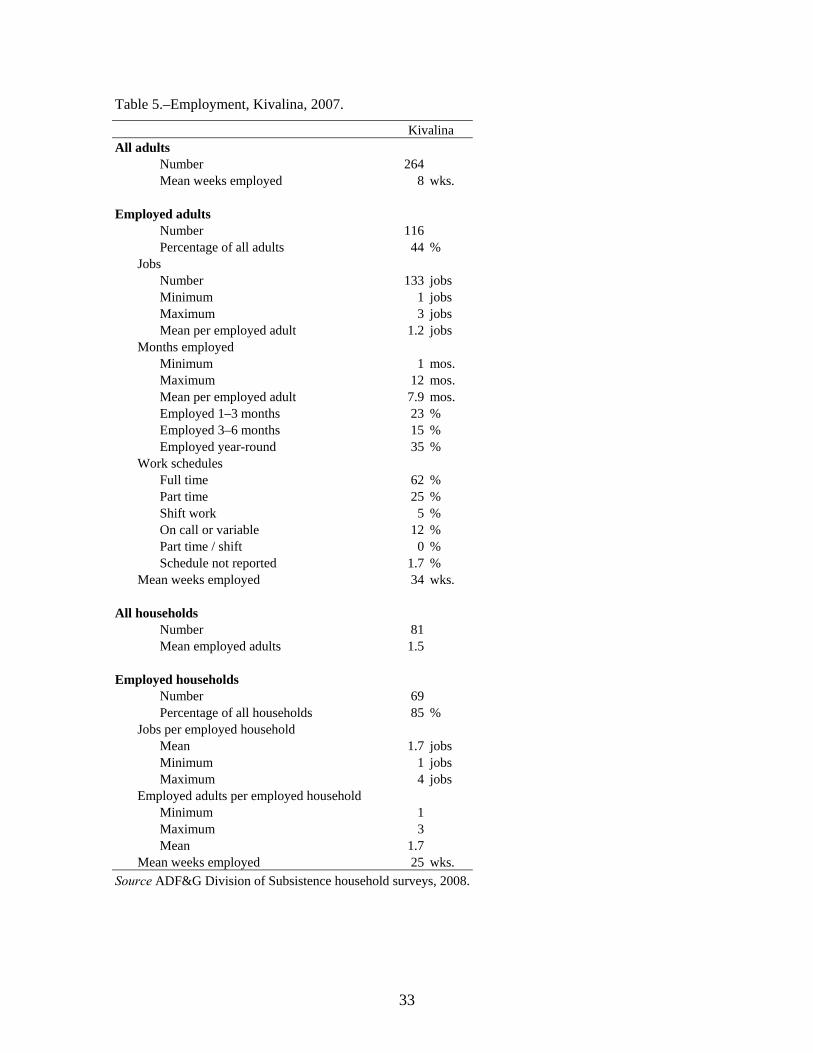
33
Table 5.–Employment, Kivalina, 2007.
Kivalina All adults Number 264 Mean weeks employed 8 wks. Employed adults Number 116 Percentage of all adults 44 % Jobs Number 133 jobs Minimum 1 jobs Maximum 3 jobs Mean per employed adult 1.2 jobs Months employed Minimum 1 mos. Maximum 12 mos. Mean per employed adult 7.9 mos. Employed 1–3 months 23 % Employed 3–6 months 15 % Employed year-round 35 % Work schedules Full time 62 % Part time 25 % Shift work 5 % On call or variable 12 % Part time / shift 0 % Schedule not reported 1.7 % Mean weeks employed 34 wks. All households Number 81 Mean employed adults 1.5 Employed households Number 69 Percentage of all households 85 % Jobs per employed household Mean 1.7 jobs Minimum 1 jobs Maximum 4 jobs Employed adults per employed household Minimum 1 Maximum 3 Mean 1.7 Mean weeks employed 25 wks. Source ADF&G Division of Subsistence household surveys, 2008.
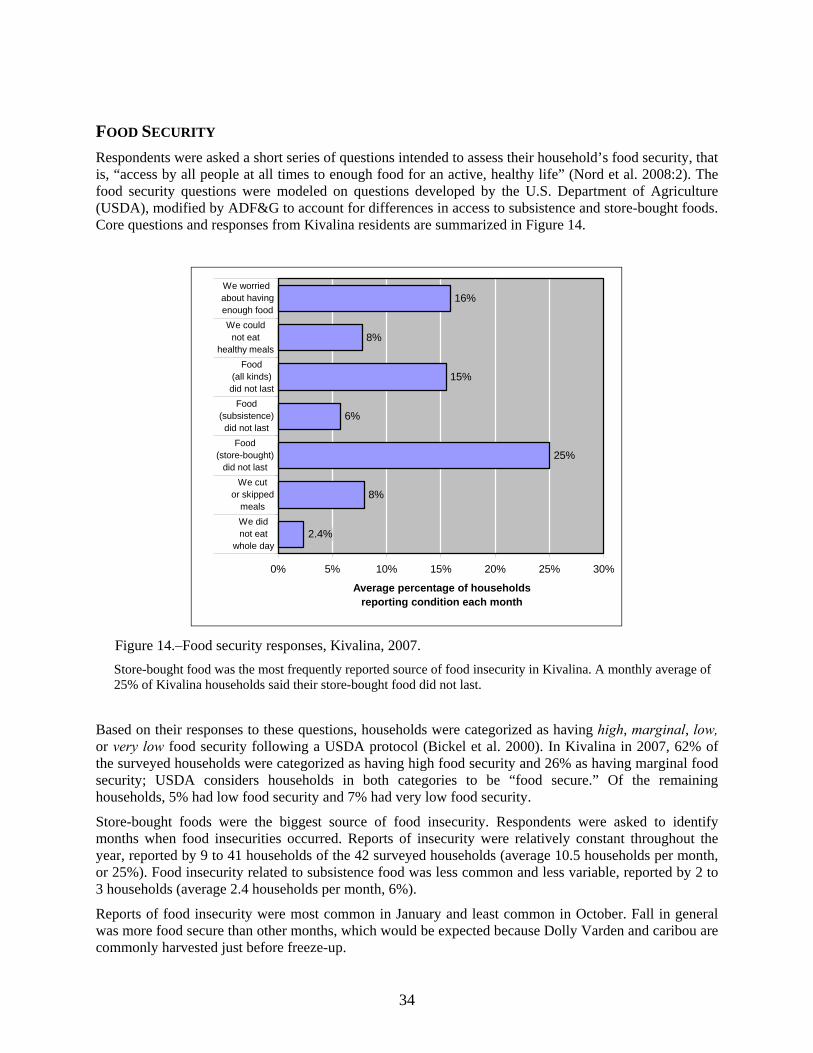
34
FOOD SECURITY Respondents were asked a short series of questions intended to assess their household’s food security, that is, “access by all people at all times to enough food for an active, healthy life” (Nord et al. 2008:2). The food security questions were modeled on questions developed by the U.S. Department of Agriculture (USDA), modified by ADF&G to account for differences in access to subsistence and store-bought foods. Core questions and responses from Kivalina residents are summarized in Figure 14.
Figure 14.–Food security responses, Kivalina, 2007. Store-bought food was the most frequently reported source of food insecurity in Kivalina. A monthly average of 25% of Kivalina households said their store-bought food did not last.
Based on their responses to these questions, households were categorized as having high, marginal, low, or very low food security following a USDA protocol (Bickel et al. 2000). In Kivalina in 2007, 62% of the surveyed households were categorized as having high food security and 26% as having marginal food security; USDA considers households in both categories to be “food secure.” Of the remaining households, 5% had low food security and 7% had very low food security.
Store-bought foods were the biggest source of food insecurity. Respondents were asked to identify months when food insecurities occurred. Reports of insecurity were relatively constant throughout the year, reported by 9 to 41 households of the 42 surveyed households (average 10.5 households per month, or 25%). Food insecurity related to subsistence food was less common and less variable, reported by 2 to 3 households (average 2.4 households per month, 6%).
Reports of food insecurity were most common in January and least common in October. Fall in general was more food secure than other months, which would be expected because Dolly Varden and caribou are commonly harvested just before freeze-up.
8%
15%
6%
25%
16%
8%
2.4%
0% 5% 10% 15% 20% 25% 30%
We worried about havingenough foodWe could
not eathealthy meals
Food(all kinds)did not last
Food(subsistence)did not last
Food(store-bought)
did not lastWe cut
or skippedmealsWe didnot eat
whole day
76
54
32
1
Average percentage of householdsreporting condition each month
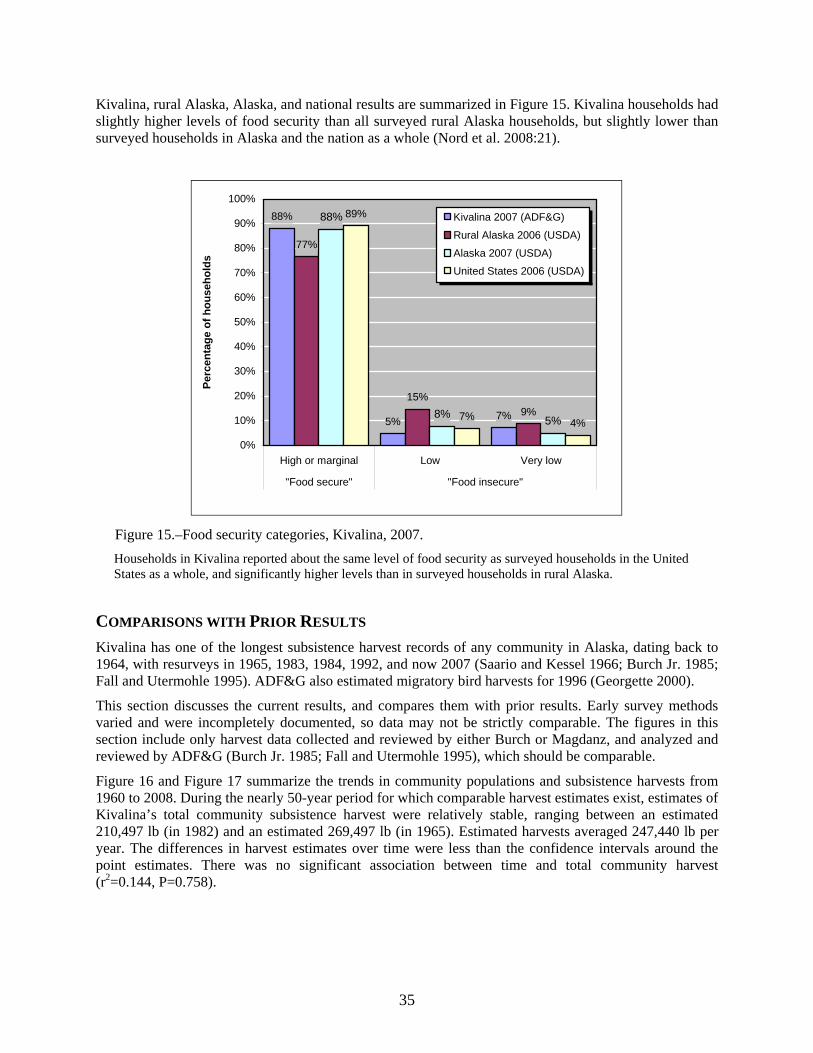
35
Kivalina, rural Alaska, Alaska, and national results are summarized in Figure 15. Kivalina households had slightly higher levels of food security than all surveyed rural Alaska households, but slightly lower than surveyed households in Alaska and the nation as a whole (Nord et al. 2008:21).
Figure 15.–Food security categories, Kivalina, 2007. Households in Kivalina reported about the same level of food security as surveyed households in the United States as a whole, and significantly higher levels than in surveyed households in rural Alaska.
COMPARISONS WITH PRIOR RESULTS Kivalina has one of the longest subsistence harvest records of any community in Alaska, dating back to 1964, with resurveys in 1965, 1983, 1984, 1992, and now 2007 (Saario and Kessel 1966; Burch Jr. 1985; Fall and Utermohle 1995). ADF&G also estimated migratory bird harvests for 1996 (Georgette 2000).
This section discusses the current results, and compares them with prior results. Early survey methods varied and were incompletely documented, so data may not be strictly comparable. The figures in this section include only harvest data collected and reviewed by either Burch or Magdanz, and analyzed and reviewed by ADF&G (Burch Jr. 1985; Fall and Utermohle 1995), which should be comparable.
Figure 16 and Figure 17 summarize the trends in community populations and subsistence harvests from 1960 to 2008. During the nearly 50-year period for which comparable harvest estimates exist, estimates of Kivalina’s total community subsistence harvest were relatively stable, ranging between an estimated 210,497 lb (in 1982) and an estimated 269,497 lb (in 1965). Estimated harvests averaged 247,440 lb per year. The differences in harvest estimates over time were less than the confidence intervals around the point estimates. There was no significant association between time and total community harvest (r2=0.144, P=0.758).
88%
5% 7%
77%
15%9%
88%
8% 5%
89%
7% 4%
0%
10%
20%
30%
40%
50%
60%
70%
80%
90%
100%
High or marginal Low Very low
"Food secure" "Food insecure"
Perc
enta
ge o
f hou
seho
lds
Kivalina 2007 (ADF&G)
Rural Alaska 2006 (USDA)
Alaska 2007 (USDA)
United States 2006 (USDA)
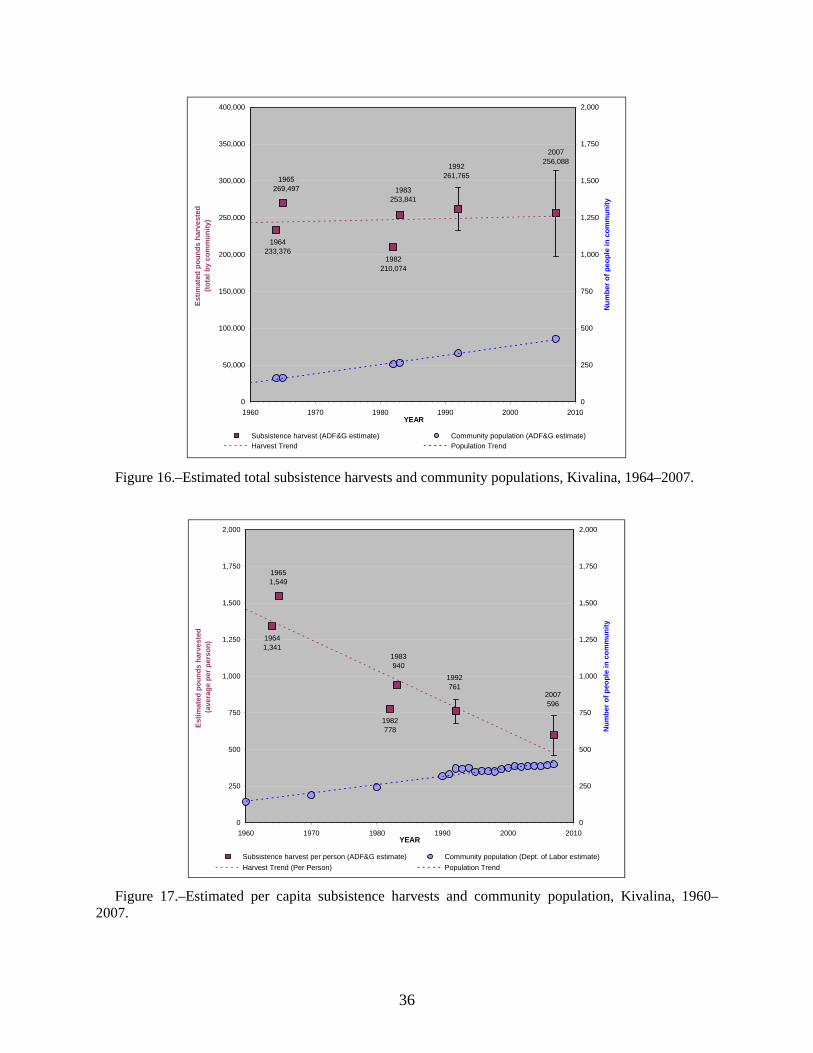
36
Figure 16.–Estimated total subsistence harvests and community populations, Kivalina, 1964–2007.
Figure 17.–Estimated per capita subsistence harvests and community population, Kivalina, 1960–
2007.
2007256,088
1992261,765
1983253,841
1964233,376
1982210,074
1965269,497
0
50,000
100,000
150,000
200,000
250,000
300,000
350,000
400,000
1960 1970 1980 1990 2000 2010YEAR
Estim
ated
pou
nds
harv
este
d(to
tal b
y co
mm
unity
)
0
250
500
750
1,000
1,250
1,500
1,750
2,000
Num
ber o
f peo
ple
in c
omm
unity
Subsistence harvest (ADF&G estimate) Community population (ADF&G estimate)Harvest Trend Population Trend
2007596
1992761
19651,549
1982778
19641,341
1983940
0
250
500
750
1,000
1,250
1,500
1,750
2,000
1960 1970 1980 1990 2000 2010YEAR
Estim
ated
pou
nds
harv
este
d (a
vera
ge p
er p
erso
n)
0
250
500
750
1,000
1,250
1,500
1,750
2,000
Num
ber o
f peo
ple
in c
omm
unity
Subsistence harvest per person (ADF&G estimate) Community population (Dept. of Labor estimate)Harvest Trend (Per Person) Population Trend
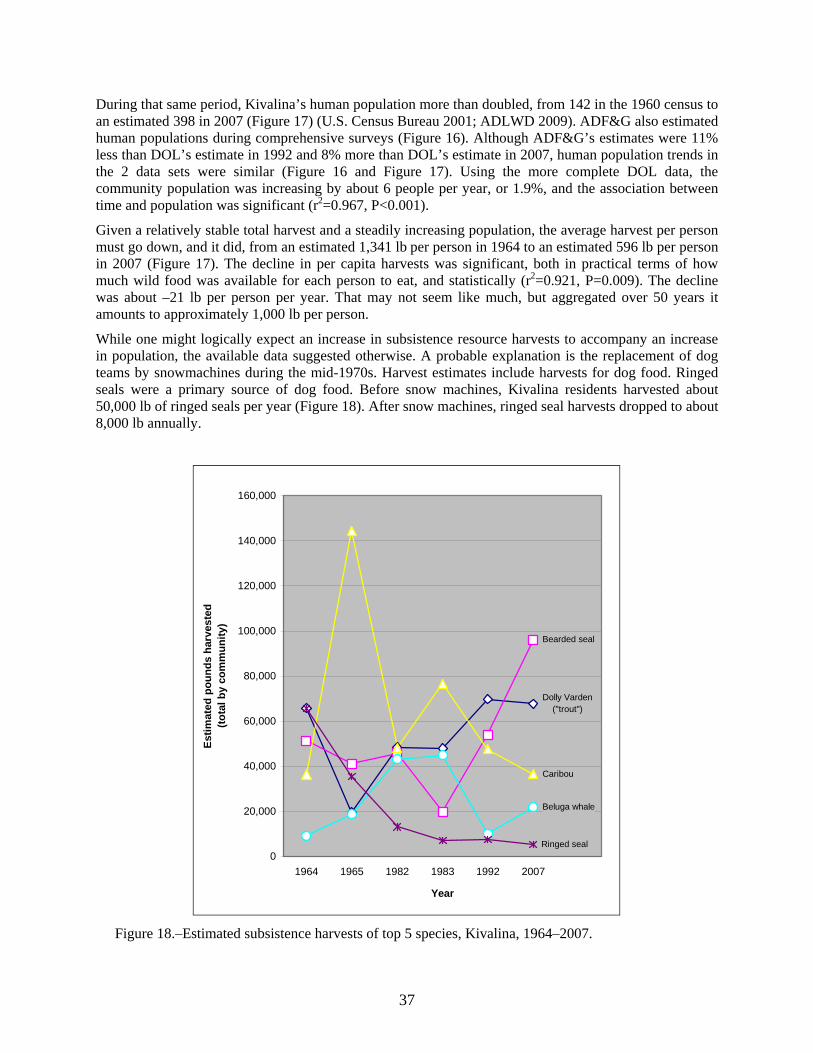
37
During that same period, Kivalina’s human population more than doubled, from 142 in the 1960 census to an estimated 398 in 2007 (Figure 17) (U.S. Census Bureau 2001; ADLWD 2009). ADF&G also estimated human populations during comprehensive surveys (Figure 16). Although ADF&G’s estimates were 11% less than DOL’s estimate in 1992 and 8% more than DOL’s estimate in 2007, human population trends in the 2 data sets were similar (Figure 16 and Figure 17). Using the more complete DOL data, the community population was increasing by about 6 people per year, or 1.9%, and the association between time and population was significant (r2=0.967, P<0.001).
Given a relatively stable total harvest and a steadily increasing population, the average harvest per person must go down, and it did, from an estimated 1,341 lb per person in 1964 to an estimated 596 lb per person in 2007 (Figure 17). The decline in per capita harvests was significant, both in practical terms of how much wild food was available for each person to eat, and statistically (r2=0.921, P=0.009). The decline was about –21 lb per person per year. That may not seem like much, but aggregated over 50 years it amounts to approximately 1,000 lb per person.
While one might logically expect an increase in subsistence resource harvests to accompany an increase in population, the available data suggested otherwise. A probable explanation is the replacement of dog teams by snowmachines during the mid-1970s. Harvest estimates include harvests for dog food. Ringed seals were a primary source of dog food. Before snow machines, Kivalina residents harvested about 50,000 lb of ringed seals per year (Figure 18). After snow machines, ringed seal harvests dropped to about 8,000 lb annually.
Figure 18.–Estimated subsistence harvests of top 5 species, Kivalina, 1964–2007.
Dolly Varden ("trout")
Bearded seal
Caribou
Beluga whale
Ringed seal0
20,000
40,000
60,000
80,000
100,000
120,000
140,000
160,000
1964 1965 1982 1983 1992 2007
Year
Estim
ated
pou
nds
harv
este
d(to
tal b
y co
mm
unity
)
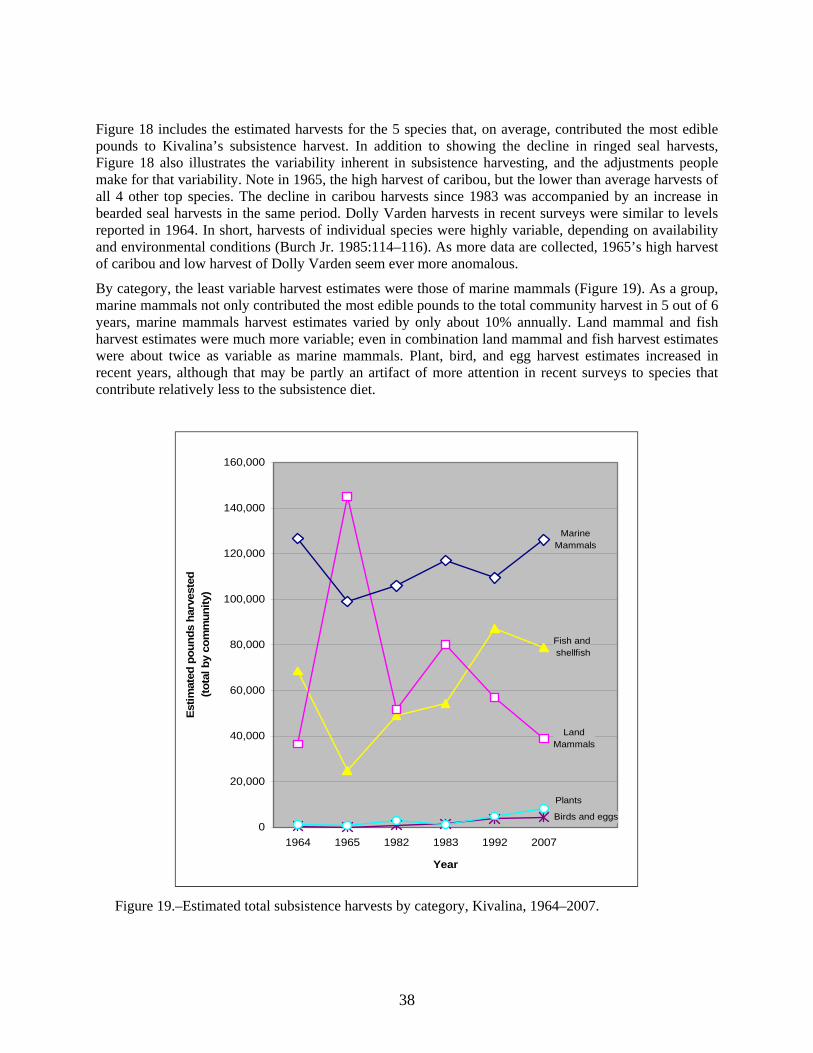
38
Figure 18 includes the estimated harvests for the 5 species that, on average, contributed the most edible pounds to Kivalina’s subsistence harvest. In addition to showing the decline in ringed seal harvests, Figure 18 also illustrates the variability inherent in subsistence harvesting, and the adjustments people make for that variability. Note in 1965, the high harvest of caribou, but the lower than average harvests of all 4 other top species. The decline in caribou harvests since 1983 was accompanied by an increase in bearded seal harvests in the same period. Dolly Varden harvests in recent surveys were similar to levels reported in 1964. In short, harvests of individual species were highly variable, depending on availability and environmental conditions (Burch Jr. 1985:114–116). As more data are collected, 1965’s high harvest of caribou and low harvest of Dolly Varden seem ever more anomalous.
By category, the least variable harvest estimates were those of marine mammals (Figure 19). As a group, marine mammals not only contributed the most edible pounds to the total community harvest in 5 out of 6 years, marine mammals harvest estimates varied by only about 10% annually. Land mammal and fish harvest estimates were much more variable; even in combination land mammal and fish harvest estimates were about twice as variable as marine mammals. Plant, bird, and egg harvest estimates increased in recent years, although that may be partly an artifact of more attention in recent surveys to species that contribute relatively less to the subsistence diet.
Figure 19.–Estimated total subsistence harvests by category, Kivalina, 1964–2007.
Fish and shellfish
LandMammals
MarineMammals
Birds and eggs
Plants
0
20,000
40,000
60,000
80,000
100,000
120,000
140,000
160,000
1964 1965 1982 1983 1992 2007
Year
Estim
ated
pou
nds
harv
este
d(to
tal b
y co
mm
unity
)
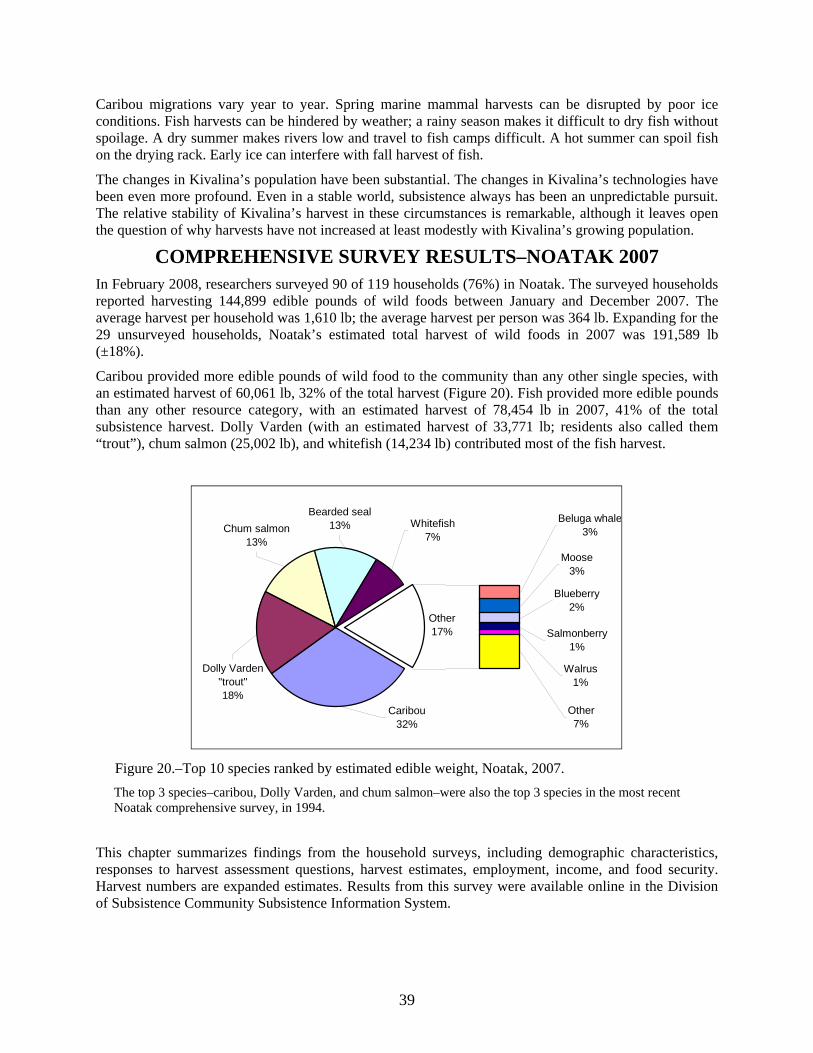
39
Caribou migrations vary year to year. Spring marine mammal harvests can be disrupted by poor ice conditions. Fish harvests can be hindered by weather; a rainy season makes it difficult to dry fish without spoilage. A dry summer makes rivers low and travel to fish camps difficult. A hot summer can spoil fish on the drying rack. Early ice can interfere with fall harvest of fish.
The changes in Kivalina’s population have been substantial. The changes in Kivalina’s technologies have been even more profound. Even in a stable world, subsistence always has been an unpredictable pursuit. The relative stability of Kivalina’s harvest in these circumstances is remarkable, although it leaves open the question of why harvests have not increased at least modestly with Kivalina’s growing population.
COMPREHENSIVE SURVEY RESULTS–NOATAK 2007 In February 2008, researchers surveyed 90 of 119 households (76%) in Noatak. The surveyed households reported harvesting 144,899 edible pounds of wild foods between January and December 2007. The average harvest per household was 1,610 lb; the average harvest per person was 364 lb. Expanding for the 29 unsurveyed households, Noatak’s estimated total harvest of wild foods in 2007 was 191,589 lb (±18%).
Caribou provided more edible pounds of wild food to the community than any other single species, with an estimated harvest of 60,061 lb, 32% of the total harvest (Figure 20). Fish provided more edible pounds than any other resource category, with an estimated harvest of 78,454 lb in 2007, 41% of the total subsistence harvest. Dolly Varden (with an estimated harvest of 33,771 lb; residents also called them “trout”), chum salmon (25,002 lb), and whitefish (14,234 lb) contributed most of the fish harvest.
Figure 20.–Top 10 species ranked by estimated edible weight, Noatak, 2007. The top 3 species–caribou, Dolly Varden, and chum salmon–were also the top 3 species in the most recent Noatak comprehensive survey, in 1994.
This chapter summarizes findings from the household surveys, including demographic characteristics, responses to harvest assessment questions, harvest estimates, employment, income, and food security. Harvest numbers are expanded estimates. Results from this survey were available online in the Division of Subsistence Community Subsistence Information System.
Other17%
Caribou32%
Chum salmon13%
Whitefish7%
Bearded seal13%
Dolly Varden "trout"18%
Blueberry2%
Moose3%
Beluga whale3%
Salmonberry1%
Walrus1%
Other7%
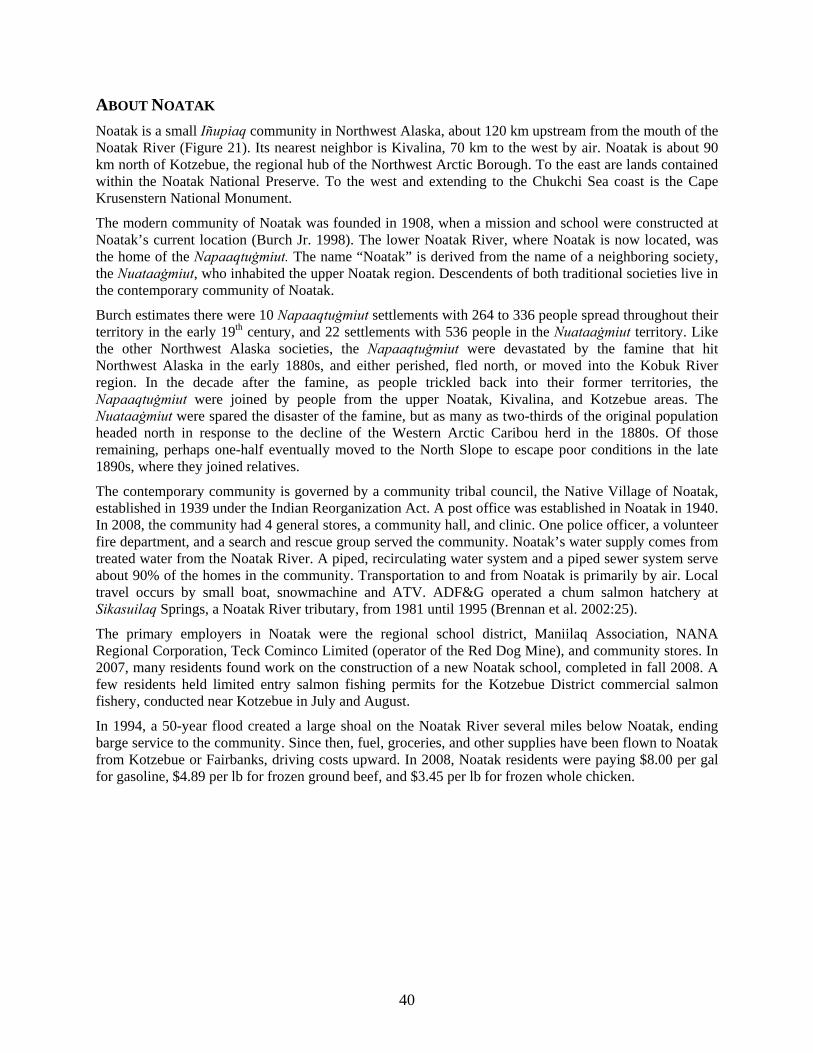
40
ABOUT NOATAK Noatak is a small Iñupiaq community in Northwest Alaska, about 120 km upstream from the mouth of the Noatak River (Figure 21). Its nearest neighbor is Kivalina, 70 km to the west by air. Noatak is about 90 km north of Kotzebue, the regional hub of the Northwest Arctic Borough. To the east are lands contained within the Noatak National Preserve. To the west and extending to the Chukchi Sea coast is the Cape Krusenstern National Monument.
The modern community of Noatak was founded in 1908, when a mission and school were constructed at Noatak’s current location (Burch Jr. 1998). The lower Noatak River, where Noatak is now located, was the home of the Napaaqtuġmiut. The name “Noatak” is derived from the name of a neighboring society, the Nuataaġmiut, who inhabited the upper Noatak region. Descendents of both traditional societies live in the contemporary community of Noatak.
Burch estimates there were 10 Napaaqtuġmiut settlements with 264 to 336 people spread throughout their territory in the early 19th century, and 22 settlements with 536 people in the Nuataaġmiut territory. Like the other Northwest Alaska societies, the Napaaqtuġmiut were devastated by the famine that hit Northwest Alaska in the early 1880s, and either perished, fled north, or moved into the Kobuk River region. In the decade after the famine, as people trickled back into their former territories, the Napaaqtuġmiut were joined by people from the upper Noatak, Kivalina, and Kotzebue areas. The Nuataaġmiut were spared the disaster of the famine, but as many as two-thirds of the original population headed north in response to the decline of the Western Arctic Caribou herd in the 1880s. Of those remaining, perhaps one-half eventually moved to the North Slope to escape poor conditions in the late 1890s, where they joined relatives.
The contemporary community is governed by a community tribal council, the Native Village of Noatak, established in 1939 under the Indian Reorganization Act. A post office was established in Noatak in 1940. In 2008, the community had 4 general stores, a community hall, and clinic. One police officer, a volunteer fire department, and a search and rescue group served the community. Noatak’s water supply comes from treated water from the Noatak River. A piped, recirculating water system and a piped sewer system serve about 90% of the homes in the community. Transportation to and from Noatak is primarily by air. Local travel occurs by small boat, snowmachine and ATV. ADF&G operated a chum salmon hatchery at Sikasuilaq Springs, a Noatak River tributary, from 1981 until 1995 (Brennan et al. 2002:25).
The primary employers in Noatak were the regional school district, Maniilaq Association, NANA Regional Corporation, Teck Cominco Limited (operator of the Red Dog Mine), and community stores. In 2007, many residents found work on the construction of a new Noatak school, completed in fall 2008. A few residents held limited entry salmon fishing permits for the Kotzebue District commercial salmon fishery, conducted near Kotzebue in July and August.
In 1994, a 50-year flood created a large shoal on the Noatak River several miles below Noatak, ending barge service to the community. Since then, fuel, groceries, and other supplies have been flown to Noatak from Kotzebue or Fairbanks, driving costs upward. In 2008, Noatak residents were paying $8.00 per gal for gasoline, $4.89 per lb for frozen ground beef, and $3.45 per lb for frozen whole chicken.
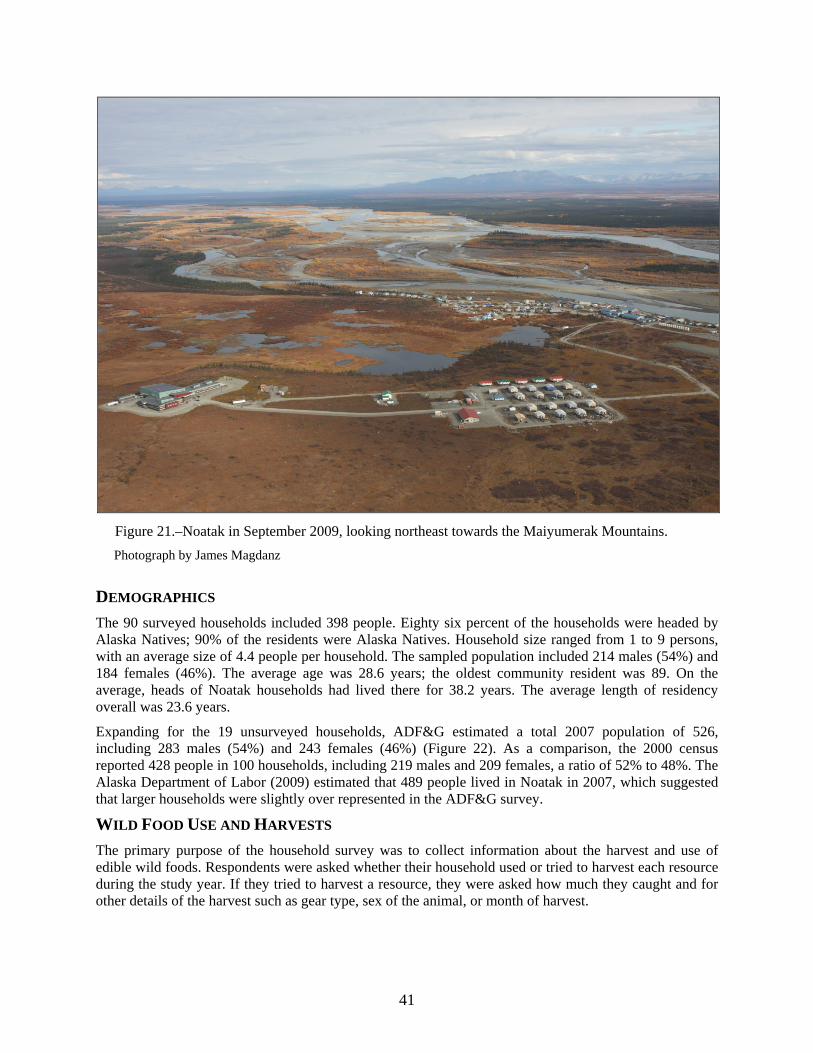
41
Figure 21.–Noatak in September 2009, looking northeast towards the Maiyumerak Mountains. Photograph by James Magdanz
DEMOGRAPHICS The 90 surveyed households included 398 people. Eighty six percent of the households were headed by Alaska Natives; 90% of the residents were Alaska Natives. Household size ranged from 1 to 9 persons, with an average size of 4.4 people per household. The sampled population included 214 males (54%) and 184 females (46%). The average age was 28.6 years; the oldest community resident was 89. On the average, heads of Noatak households had lived there for 38.2 years. The average length of residency overall was 23.6 years.
Expanding for the 19 unsurveyed households, ADF&G estimated a total 2007 population of 526, including 283 males (54%) and 243 females (46%) (Figure 22). As a comparison, the 2000 census reported 428 people in 100 households, including 219 males and 209 females, a ratio of 52% to 48%. The Alaska Department of Labor (2009) estimated that 489 people lived in Noatak in 2007, which suggested that larger households were slightly over represented in the ADF&G survey.
WILD FOOD USE AND HARVESTS The primary purpose of the household survey was to collect information about the harvest and use of edible wild foods. Respondents were asked whether their household used or tried to harvest each resource during the study year. If they tried to harvest a resource, they were asked how much they caught and for other details of the harvest such as gear type, sex of the animal, or month of harvest.
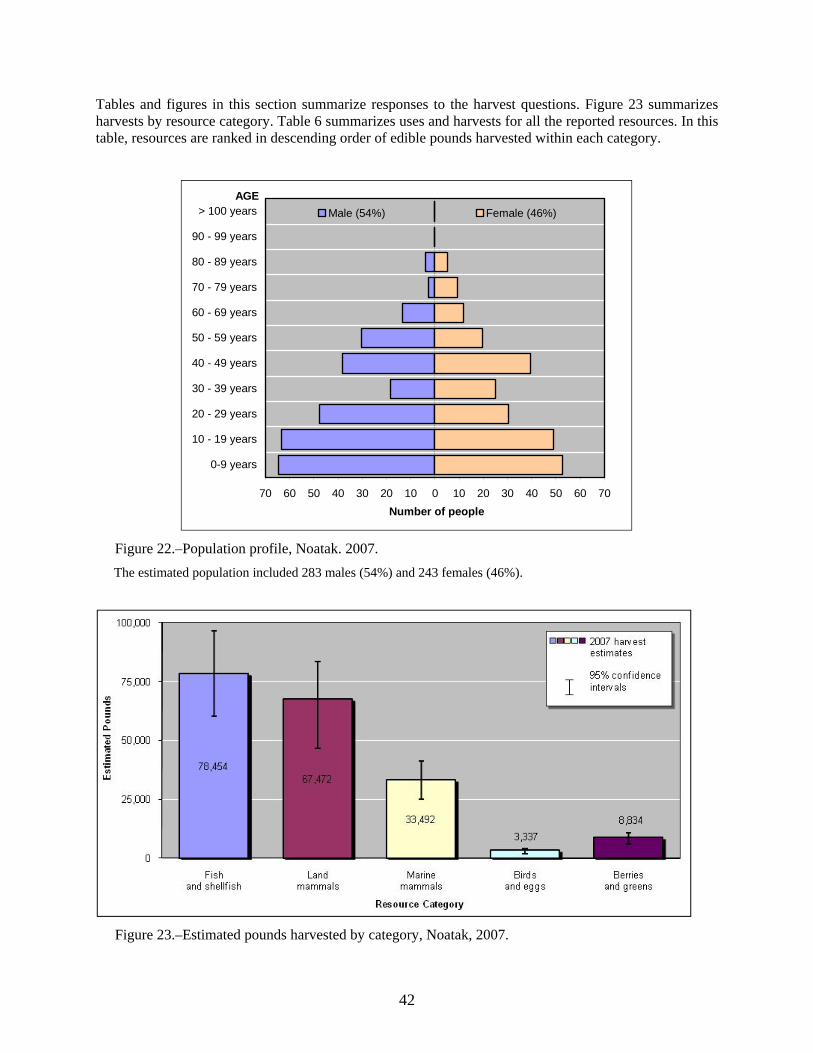
42
Tables and figures in this section summarize responses to the harvest questions. Figure 23 summarizes harvests by resource category. Table 6 summarizes uses and harvests for all the reported resources. In this table, resources are ranked in descending order of edible pounds harvested within each category.
Figure 22.–Population profile, Noatak. 2007. The estimated population included 283 males (54%) and 243 females (46%).
Figure 23.–Estimated pounds harvested by category, Noatak, 2007.
Number of people70 60 50 40 30 20 10 0 10 20 30 40 50 60 70
0-9 years
10 - 19 years
20 - 29 years
30 - 39 years
40 - 49 years
50 - 59 years
60 - 69 years
70 - 79 years
80 - 89 years
90 - 99 years
> 100 yearsAGE
Male (54%) Female (46%)
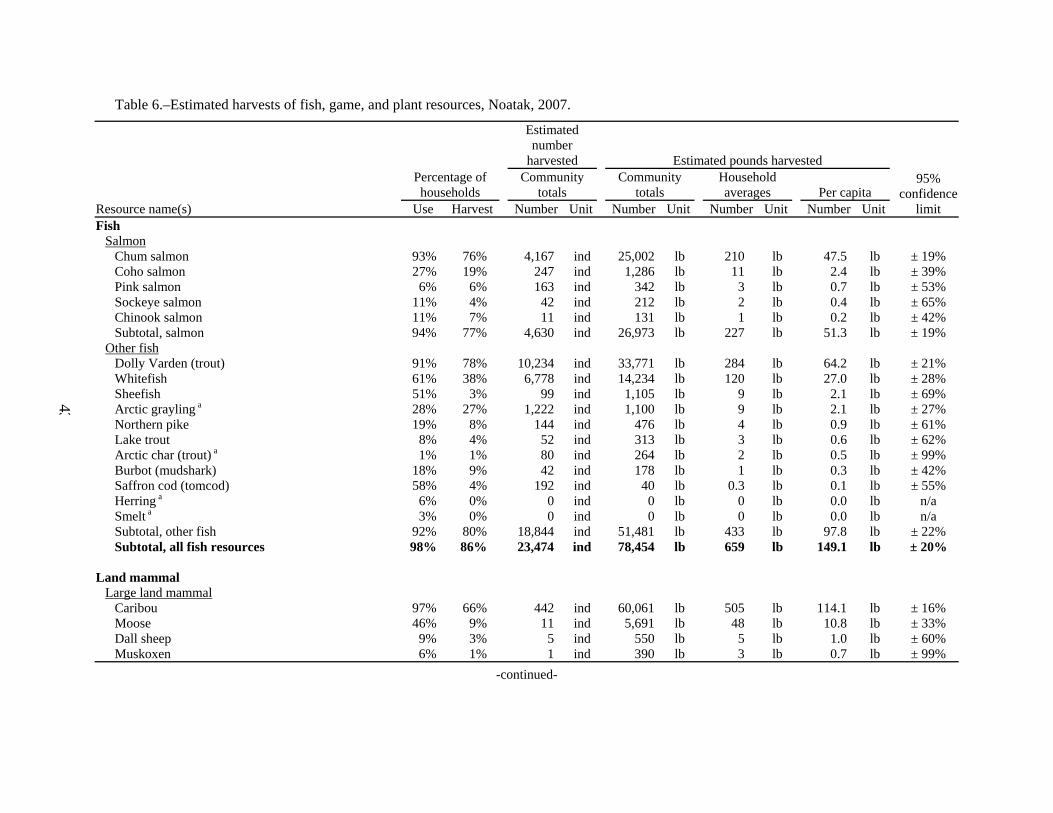
43
Table 6.–Estimated harvests of fish, game, and plant resources, Noatak, 2007.
Resource name(s)
Percentage of households
Estimated number
harvested Estimated pounds harvested 95%
confidence limit
Community totals
Community totals
Household averages Per capita
Use Harvest Number Unit Number Unit Number Unit Number UnitFish
Salmon Chum salmon 93% 76% 4,167 ind 25,002 lb 210 lb 47.5 lb ± 19% Coho salmon 27% 19% 247 ind 1,286 lb 11 lb 2.4 lb ± 39% Pink salmon 6% 6% 163 ind 342 lb 3 lb 0.7 lb ± 53% Sockeye salmon 11% 4% 42 ind 212 lb 2 lb 0.4 lb ± 65% Chinook salmon 11% 7% 11 ind 131 lb 1 lb 0.2 lb ± 42% Subtotal, salmon 94% 77% 4,630 ind 26,973 lb 227 lb 51.3 lb ± 19%
Other fish Dolly Varden (trout) 91% 78% 10,234 ind 33,771 lb 284 lb 64.2 lb ± 21% Whitefish 61% 38% 6,778 ind 14,234 lb 120 lb 27.0 lb ± 28% Sheefish 51% 3% 99 ind 1,105 lb 9 lb 2.1 lb ± 69% Arctic grayling a 28% 27% 1,222 ind 1,100 lb 9 lb 2.1 lb ± 27% Northern pike 19% 8% 144 ind 476 lb 4 lb 0.9 lb ± 61% Lake trout 8% 4% 52 ind 313 lb 3 lb 0.6 lb ± 62% Arctic char (trout) a 1% 1% 80 ind 264 lb 2 lb 0.5 lb ± 99% Burbot (mudshark) 18% 9% 42 ind 178 lb 1 lb 0.3 lb ± 42% Saffron cod (tomcod) 58% 4% 192 ind 40 lb 0.3 lb 0.1 lb ± 55% Herring a 6% 0% 0 ind 0 lb 0 lb 0.0 lb n/a Smelt a 3% 0% 0 ind 0 lb 0 lb 0.0 lb n/a Subtotal, other fish 92% 80% 18,844 ind 51,481 lb 433 lb 97.8 lb ± 22% Subtotal, all fish resources 98% 86% 23,474 ind 78,454 lb 659 lb 149.1 lb ± 20%
Land mammal Large land mammal
Caribou 97% 66% 442 ind 60,061 lb 505 lb 114.1 lb ± 16% Moose 46% 9% 11 ind 5,691 lb 48 lb 10.8 lb ± 33% Dall sheep 9% 3% 5 ind 550 lb 5 lb 1.0 lb ± 60% Muskoxen 6% 1% 1 ind 390 lb 3 lb 0.7 lb ± 99%
-continued-
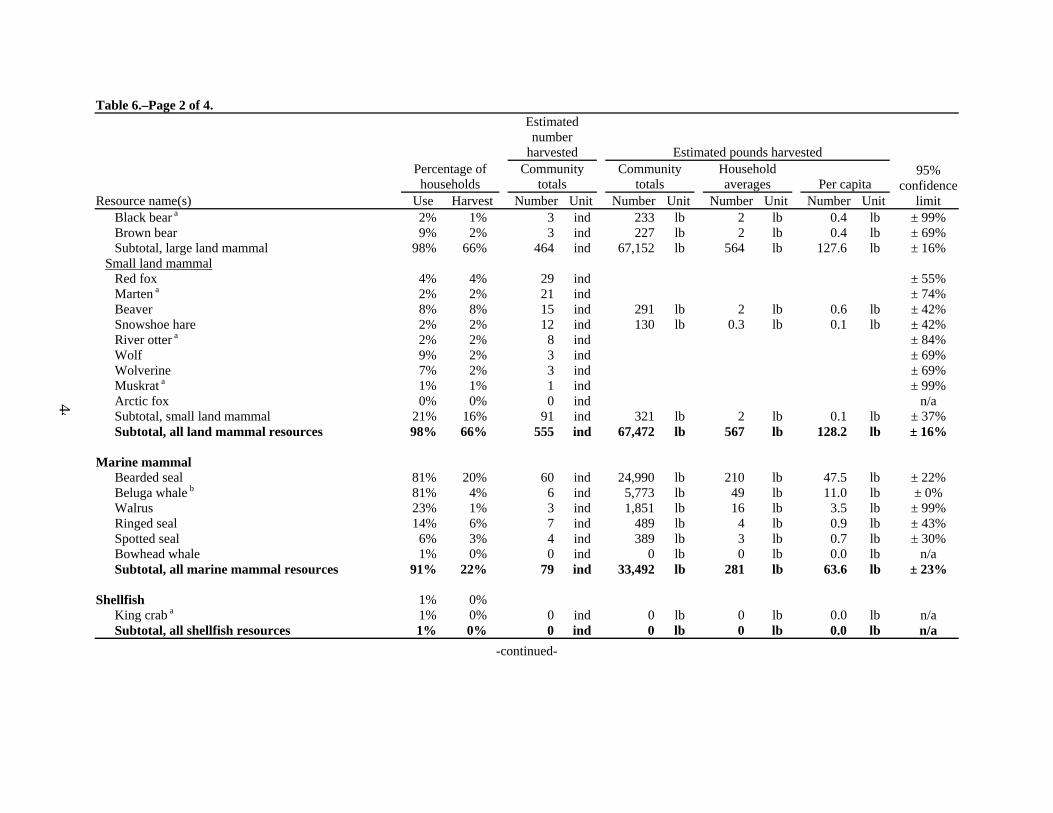
44
Table 6.–Page 2 of 4.
Resource name(s)
Percentage of households
Estimated number
harvested Estimated pounds harvested 95%
confidence limit
Community totals
Community totals
Household averages Per capita
Use Harvest Number Unit Number Unit Number Unit Number UnitBlack bear a 2% 1% 3 ind 233 lb 2 lb 0.4 lb ± 99% Brown bear 9% 2% 3 ind 227 lb 2 lb 0.4 lb ± 69% Subtotal, large land mammal 98% 66% 464 ind 67,152 lb 564 lb 127.6 lb ± 16%
Small land mammal Red fox 4% 4% 29 ind ± 55% Marten a 2% 2% 21 ind ± 74% Beaver 8% 8% 15 ind 291 lb 2 lb 0.6 lb ± 42% Snowshoe hare 2% 2% 12 ind 130 lb 0.3 lb 0.1 lb ± 42% River otter a 2% 2% 8 ind ± 84% Wolf 9% 2% 3 ind ± 69% Wolverine 7% 2% 3 ind ± 69% Muskrat a 1% 1% 1 ind ± 99% Arctic fox 0% 0% 0 ind n/a Subtotal, small land mammal 21% 16% 91 ind 321 lb 2 lb 0.1 lb ± 37% Subtotal, all land mammal resources 98% 66% 555 ind 67,472 lb 567 lb 128.2 lb ± 16%
Marine mammal
Bearded seal 81% 20% 60 ind 24,990 lb 210 lb 47.5 lb ± 22% Beluga whale b 81% 4% 6 ind 5,773 lb 49 lb 11.0 lb ± 0% Walrus 23% 1% 3 ind 1,851 lb 16 lb 3.5 lb ± 99% Ringed seal 14% 6% 7 ind 489 lb 4 lb 0.9 lb ± 43% Spotted seal 6% 3% 4 ind 389 lb 3 lb 0.7 lb ± 30% Bowhead whale 1% 0% 0 ind 0 lb 0 lb 0.0 lb n/a Subtotal, all marine mammal resources 91% 22% 79 ind 33,492 lb 281 lb 63.6 lb ± 23%
Shellfish 1% 0%
King crab a 1% 0% 0 ind 0 lb 0 lb 0.0 lb n/a Subtotal, all shellfish resources 1% 0% 0 ind 0 lb 0 lb 0.0 lb n/a
-continued-
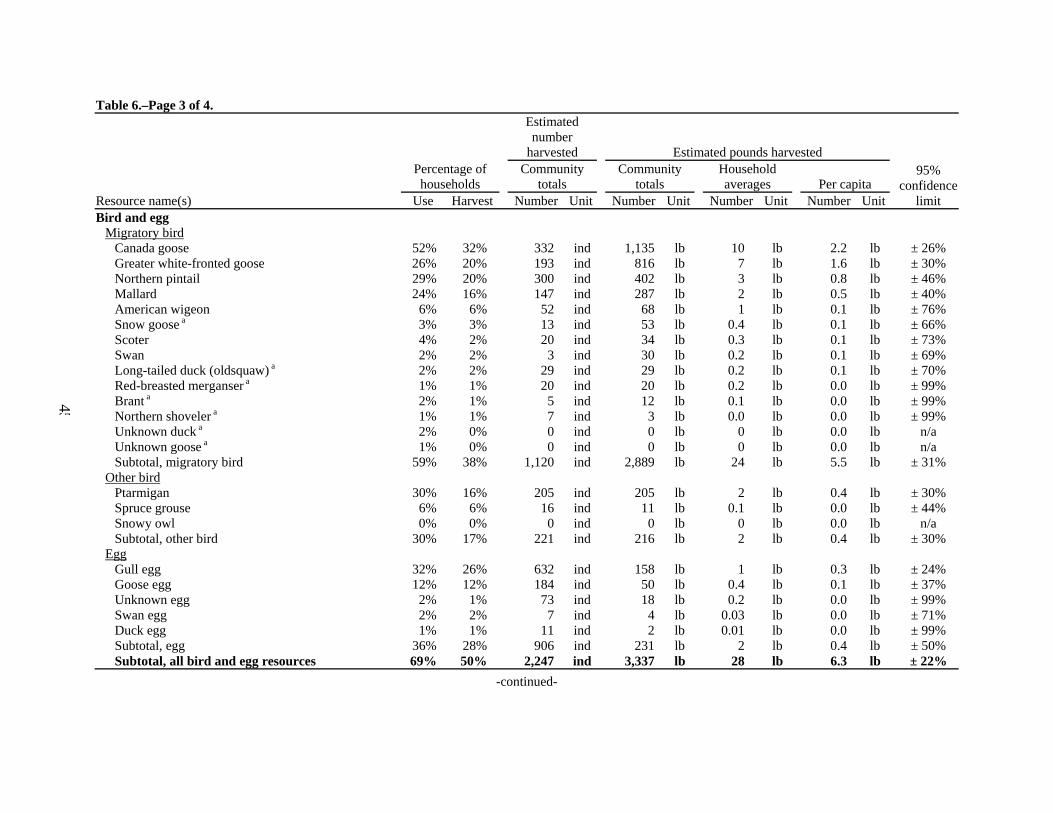
45
Table 6.–Page 3 of 4.
Resource name(s)
Percentage of households
Estimated number
harvested Estimated pounds harvested 95%
confidence limit
Community totals
Community totals
Household averages Per capita
Use Harvest Number Unit Number Unit Number Unit Number UnitBird and egg
Migratory bird Canada goose 52% 32% 332 ind 1,135 lb 10 lb 2.2 lb ± 26% Greater white-fronted goose 26% 20% 193 ind 816 lb 7 lb 1.6 lb ± 30% Northern pintail 29% 20% 300 ind 402 lb 3 lb 0.8 lb ± 46% Mallard 24% 16% 147 ind 287 lb 2 lb 0.5 lb ± 40% American wigeon 6% 6% 52 ind 68 lb 1 lb 0.1 lb ± 76% Snow goose a 3% 3% 13 ind 53 lb 0.4 lb 0.1 lb ± 66% Scoter 4% 2% 20 ind 34 lb 0.3 lb 0.1 lb ± 73% Swan 2% 2% 3 ind 30 lb 0.2 lb 0.1 lb ± 69% Long-tailed duck (oldsquaw) a 2% 2% 29 ind 29 lb 0.2 lb 0.1 lb ± 70% Red-breasted merganser a 1% 1% 20 ind 20 lb 0.2 lb 0.0 lb ± 99% Brant a 2% 1% 5 ind 12 lb 0.1 lb 0.0 lb ± 99% Northern shoveler a 1% 1% 7 ind 3 lb 0.0 lb 0.0 lb ± 99% Unknown duck a 2% 0% 0 ind 0 lb 0 lb 0.0 lb n/a Unknown goose a 1% 0% 0 ind 0 lb 0 lb 0.0 lb n/a Subtotal, migratory bird 59% 38% 1,120 ind 2,889 lb 24 lb 5.5 lb ± 31%
Other bird Ptarmigan 30% 16% 205 ind 205 lb 2 lb 0.4 lb ± 30% Spruce grouse 6% 6% 16 ind 11 lb 0.1 lb 0.0 lb ± 44% Snowy owl 0% 0% 0 ind 0 lb 0 lb 0.0 lb n/a Subtotal, other bird 30% 17% 221 ind 216 lb 2 lb 0.4 lb ± 30%
Egg Gull egg 32% 26% 632 ind 158 lb 1 lb 0.3 lb ± 24% Goose egg 12% 12% 184 ind 50 lb 0.4 lb 0.1 lb ± 37% Unknown egg 2% 1% 73 ind 18 lb 0.2 lb 0.0 lb ± 99% Swan egg 2% 2% 7 ind 4 lb 0.03 lb 0.0 lb ± 71% Duck egg 1% 1% 11 ind 2 lb 0.01 lb 0.0 lb ± 99% Subtotal, egg 36% 28% 906 ind 231 lb 2 lb 0.4 lb ± 50% Subtotal, all bird and egg resources 69% 50% 2,247 ind 3,337 lb 28 lb 6.3 lb ± 22%
-continued-
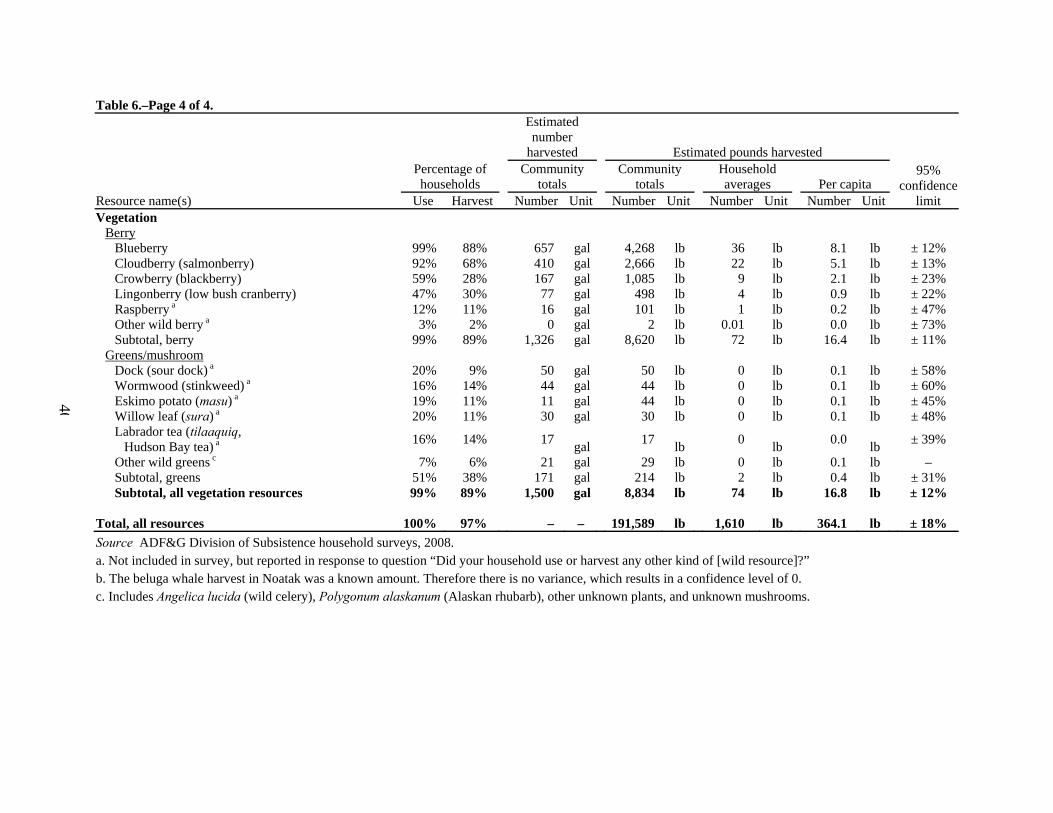
46
Table 6.–Page 4 of 4.
Resource name(s)
Percentage of households
Estimated number
harvested Estimated pounds harvested 95%
confidence limit
Community totals
Community totals
Household averages Per capita
Use Harvest Number Unit Number Unit Number Unit Number UnitVegetation
Berry Blueberry 99% 88% 657 gal 4,268 lb 36 lb 8.1 lb ± 12% Cloudberry (salmonberry) 92% 68% 410 gal 2,666 lb 22 lb 5.1 lb ± 13% Crowberry (blackberry) 59% 28% 167 gal 1,085 lb 9 lb 2.1 lb ± 23% Lingonberry (low bush cranberry) 47% 30% 77 gal 498 lb 4 lb 0.9 lb ± 22% Raspberry a 12% 11% 16 gal 101 lb 1 lb 0.2 lb ± 47% Other wild berry a 3% 2% 0 gal 2 lb 0.01 lb 0.0 lb ± 73% Subtotal, berry 99% 89% 1,326 gal 8,620 lb 72 lb 16.4 lb ± 11%
Greens/mushroom Dock (sour dock) a 20% 9% 50 gal 50 lb 0 lb 0.1 lb ± 58% Wormwood (stinkweed) a 16% 14% 44 gal 44 lb 0 lb 0.1 lb ± 60% Eskimo potato (masu) a 19% 11% 11 gal 44 lb 0 lb 0.1 lb ± 45% Willow leaf (sura) a 20% 11% 30 gal 30 lb 0 lb 0.1 lb ± 48% Labrador tea (tilaaquiq,
Hudson Bay tea) a 16% 14% 17 gal 17 lb 0 lb 0.0 lb ± 39%
Other wild greens c 7% 6% 21 gal 29 lb 0 lb 0.1 lb – Subtotal, greens 51% 38% 171 gal 214 lb 2 lb 0.4 lb ± 31% Subtotal, all vegetation resources 99% 89% 1,500 gal 8,834 lb 74 lb 16.8 lb ± 12%
Total, all resources 100% 97% – – 191,589 lb 1,610 lb 364.1 lb ± 18% Source ADF&G Division of Subsistence household surveys, 2008. a. Not included in survey, but reported in response to question “Did your household use or harvest any other kind of [wild resource]?” b. The beluga whale harvest in Noatak was a known amount. Therefore there is no variance, which results in a confidence level of 0. c. Includes Angelica lucida (wild celery), Polygonum alaskanum (Alaskan rhubarb), other unknown plants, and unknown mushrooms.
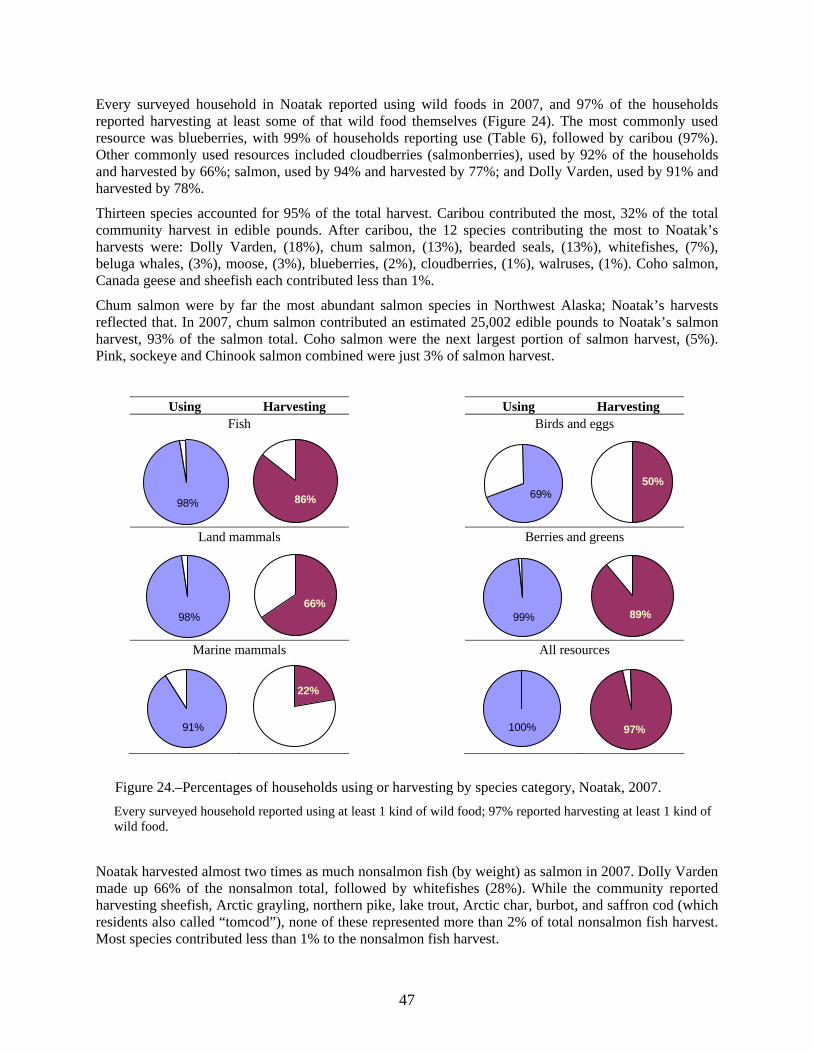
47
Every surveyed household in Noatak reported using wild foods in 2007, and 97% of the households reported harvesting at least some of that wild food themselves (Figure 24). The most commonly used resource was blueberries, with 99% of households reporting use (Table 6), followed by caribou (97%). Other commonly used resources included cloudberries (salmonberries), used by 92% of the households and harvested by 66%; salmon, used by 94% and harvested by 77%; and Dolly Varden, used by 91% and harvested by 78%.
Thirteen species accounted for 95% of the total harvest. Caribou contributed the most, 32% of the total community harvest in edible pounds. After caribou, the 12 species contributing the most to Noatak’s harvests were: Dolly Varden, (18%), chum salmon, (13%), bearded seals, (13%), whitefishes, (7%), beluga whales, (3%), moose, (3%), blueberries, (2%), cloudberries, (1%), walruses, (1%). Coho salmon, Canada geese and sheefish each contributed less than 1%.
Chum salmon were by far the most abundant salmon species in Northwest Alaska; Noatak’s harvests reflected that. In 2007, chum salmon contributed an estimated 25,002 edible pounds to Noatak’s salmon harvest, 93% of the salmon total. Coho salmon were the next largest portion of salmon harvest, (5%). Pink, sockeye and Chinook salmon combined were just 3% of salmon harvest.
Using Harvesting Fish
Land mammals
Marine mammals
Using Harvesting Birds and eggs
Berries and greens
All resources
Figure 24.–Percentages of households using or harvesting by species category, Noatak, 2007. Every surveyed household reported using at least 1 kind of wild food; 97% reported harvesting at least 1 kind of wild food.
Noatak harvested almost two times as much nonsalmon fish (by weight) as salmon in 2007. Dolly Varden made up 66% of the nonsalmon total, followed by whitefishes (28%). While the community reported harvesting sheefish, Arctic grayling, northern pike, lake trout, Arctic char, burbot, and saffron cod (which residents also called “tomcod”), none of these represented more than 2% of total nonsalmon fish harvest. Most species contributed less than 1% to the nonsalmon fish harvest.
98% 86%
98%66%
91%
22%
69%50%
99% 89%
100% 97%
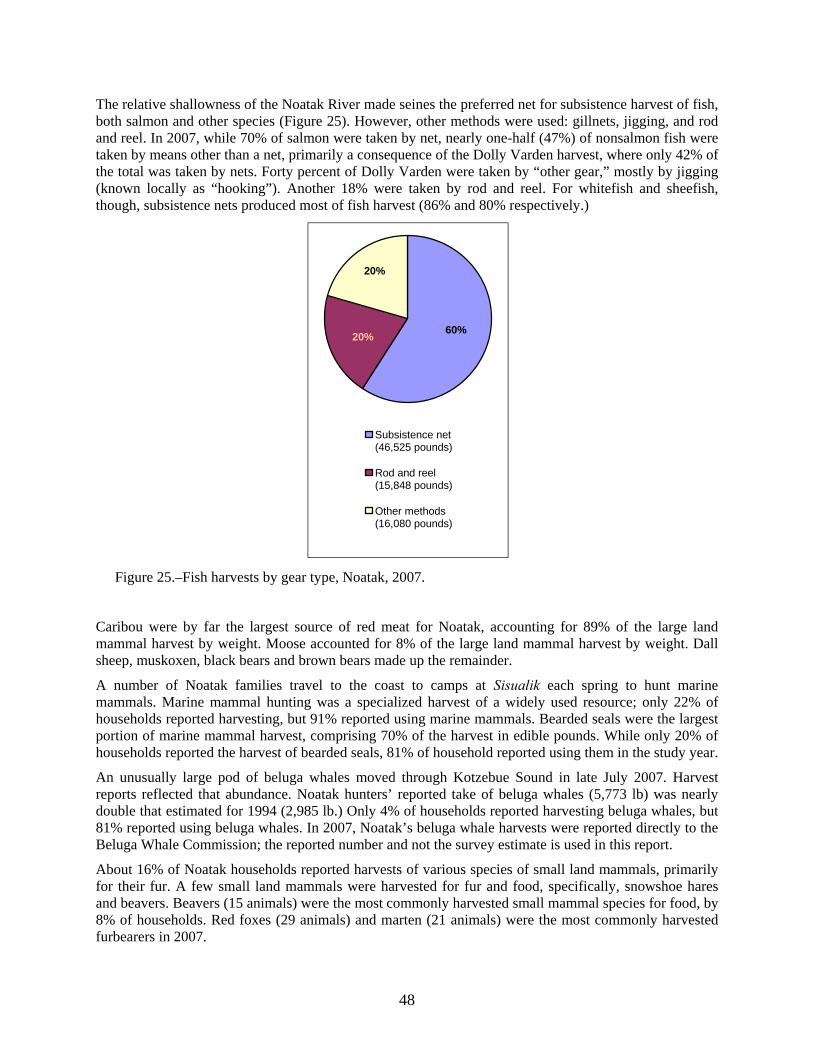
48
The relative shallowness of the Noatak River made seines the preferred net for subsistence harvest of fish, both salmon and other species (Figure 25). However, other methods were used: gillnets, jigging, and rod and reel. In 2007, while 70% of salmon were taken by net, nearly one-half (47%) of nonsalmon fish were taken by means other than a net, primarily a consequence of the Dolly Varden harvest, where only 42% of the total was taken by nets. Forty percent of Dolly Varden were taken by “other gear,” mostly by jigging (known locally as “hooking”). Another 18% were taken by rod and reel. For whitefish and sheefish, though, subsistence nets produced most of fish harvest (86% and 80% respectively.)
Figure 25.–Fish harvests by gear type, Noatak, 2007.
Caribou were by far the largest source of red meat for Noatak, accounting for 89% of the large land mammal harvest by weight. Moose accounted for 8% of the large land mammal harvest by weight. Dall sheep, muskoxen, black bears and brown bears made up the remainder.
A number of Noatak families travel to the coast to camps at Sisualik each spring to hunt marine mammals. Marine mammal hunting was a specialized harvest of a widely used resource; only 22% of households reported harvesting, but 91% reported using marine mammals. Bearded seals were the largest portion of marine mammal harvest, comprising 70% of the harvest in edible pounds. While only 20% of households reported the harvest of bearded seals, 81% of household reported using them in the study year.
An unusually large pod of beluga whales moved through Kotzebue Sound in late July 2007. Harvest reports reflected that abundance. Noatak hunters’ reported take of beluga whales (5,773 lb) was nearly double that estimated for 1994 (2,985 lb.) Only 4% of households reported harvesting beluga whales, but 81% reported using beluga whales. In 2007, Noatak’s beluga whale harvests were reported directly to the Beluga Whale Commission; the reported number and not the survey estimate is used in this report.
About 16% of Noatak households reported harvests of various species of small land mammals, primarily for their fur. A few small land mammals were harvested for fur and food, specifically, snowshoe hares and beavers. Beavers (15 animals) were the most commonly harvested small mammal species for food, by 8% of households. Red foxes (29 animals) and marten (21 animals) were the most commonly harvested furbearers in 2007.
20%
60%20%
Subsistence net(46,525 pounds)
Rod and reel(15,848 pounds)
Other methods(16,080 pounds)
49
Harvests of migratory birds were nearly double that reported in 1994, perhaps a consequence of the legalization of spring and summer subsistence harvests of certain species of migratory birds in 2004 by the Alaska Migratory Bird Co-management Council. Thirty-eight percent of households reported harvesting migratory birds, and 59% reported using migratory birds. Noatak households took 2,889 lb of waterfowl, the majority of which (70%) were geese, including Canada geese, white-fronted geese, snow geese, and brants. Seven species of duck were harvested, more than one-half of which were mallards and northern pintails. Just 2% of households reported the harvest and use of tundra swans. The harvest of upland game birds, 221 birds, 205 of which were ptarmigan, was similar to 1994. Six percent of households reported taking spruce grouse.
The survey asked about berries by species, as well as a variety of edible plants including willow leaves (sura), Eskimo potatoes (masu), wormwood (stinkweed, sarġiiq), Labrador tea (tilaaquiq) and others. The most commonly used berries were blueberries and cloudberries (salmonberries); an estimated 1,067 gal were harvested in 2007. Households also reported harvest of crowberries (which residents called “blackberries”), lingonberries (low bush cranberries), and raspberries. Twenty percent of households reported use of dock (sourdock, qauġaq) and willow leaves; 9% and 11% of households, respectively, harvested the plants. Although a relatively small percentage of households reported harvest and use of edible plants, Noatak residents did harvest a wide variety of plant species.
The survey asked about wild foods that were not available locally, but that would likely be received from other communities or through barter and trade. These included bowhead whales, a few marine fish, and shellfish. Four species not harvested locally were used in Noatak in 2007: herring, smelt, bowhead whales (mostly the skin, muktuk), and king crabs. Of the species locally available for harvest and included on the survey, only 2 were not reported as harvested or used: Arctic foxes and snowy owls.
HARVEST AREAS For 11 subsistence resources (e.g. salmon, Dolly Varden, caribou, and moose), and for 4 resource categories (furbearers, waterfowl, eggs, and plants), households were asked to locate on a map the areas in which they had hunted or fished for the resource, and the locations at which they had actually harvested the resource. For each resource and category, all households’ search areas and harvest locations were combined to create a series of maps depicting Noatak’s subsistence use areas in 2007 (Appendix D). Figure 26 summarizes all the mapped data collected from Noatak for 2007.
For 2007, Noatak residents reported using a total of 20,272 km2 for subsistence, including the entire Noatak River from the Noatak delta to the mouth of Anisak River, normally beyond the limits of navigability for propeller-driven boats. For the 16 resources mapped in this survey, the lands used for subsistence encompassed 12,624 km2; marine waters totaled 7,379 km2.
Search areas and harvest locations were concentrated along the Noatak River, reflecting its importance both as a transportation corridor and as fish and wildlife habitat. Noatak residents ranged widely away from the river as well, more than 150 km east, south, and west, and about 75 km north to the spine of the Brooks Range. Search areas extended east beyond Selawik (for waterfowl and eggs), across Kotzebue Sound from Sisualik to the northern Seward Peninsula (for marine mammals), and north to the Kivalina River (for caribou, marine mammals, and plants).
Noatak residents’ spring and summer camps at Sisualik, 65 km south of Noatak and 15 km northwest of Kotzebue, were evident in search areas and harvest locations for salmon, whitefish, marine mammals, eggs, and plants.
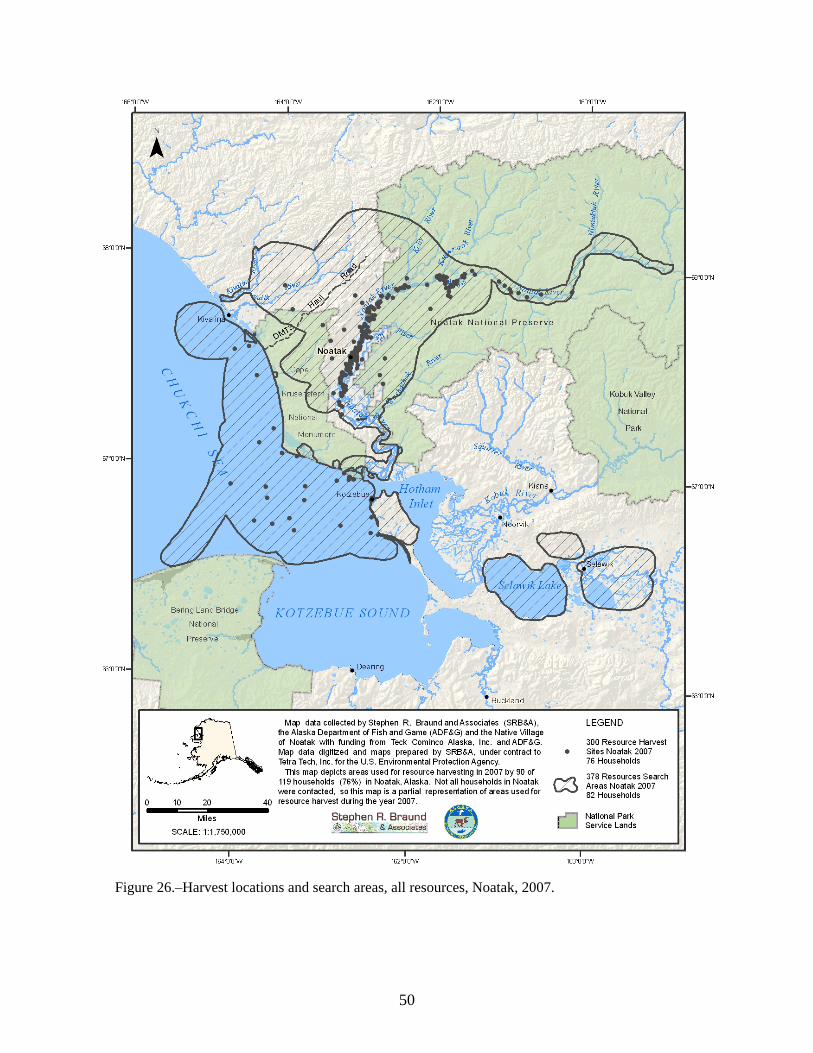
50
Figure 26.–Harvest locations and search areas, all resources, Noatak, 2007.
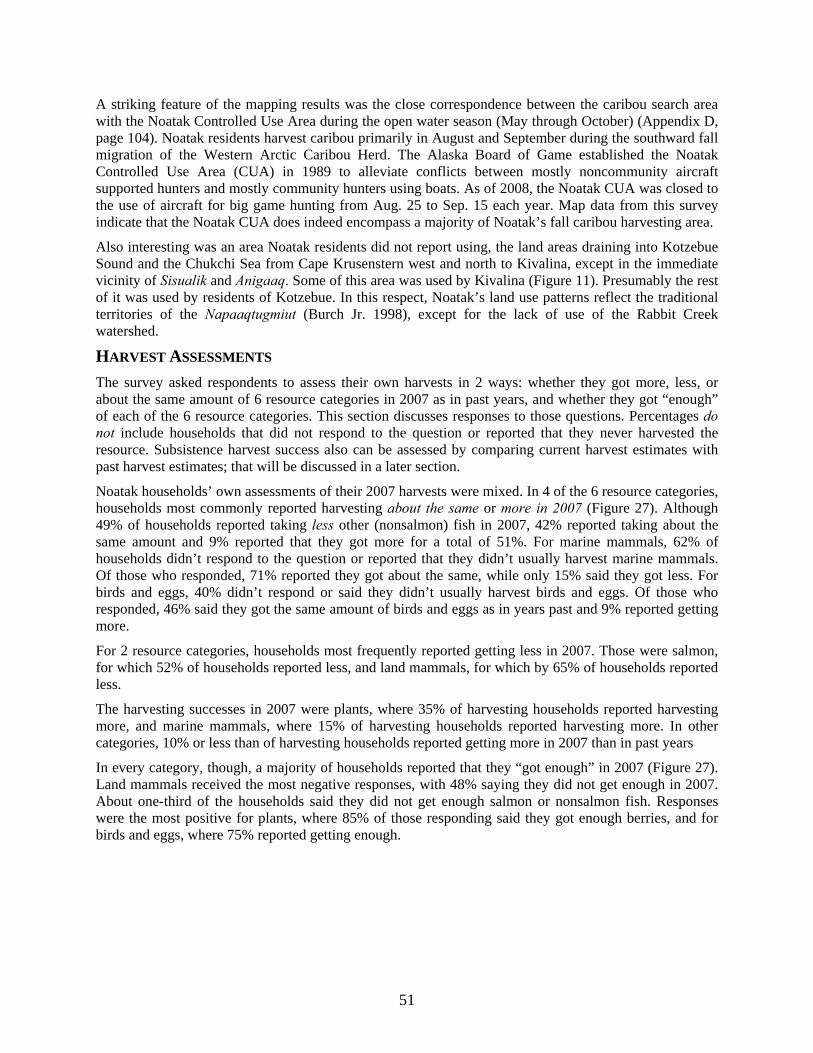
51
A striking feature of the mapping results was the close correspondence between the caribou search area with the Noatak Controlled Use Area during the open water season (May through October) (Appendix D, page 104). Noatak residents harvest caribou primarily in August and September during the southward fall migration of the Western Arctic Caribou Herd. The Alaska Board of Game established the Noatak Controlled Use Area (CUA) in 1989 to alleviate conflicts between mostly noncommunity aircraft supported hunters and mostly community hunters using boats. As of 2008, the Noatak CUA was closed to the use of aircraft for big game hunting from Aug. 25 to Sep. 15 each year. Map data from this survey indicate that the Noatak CUA does indeed encompass a majority of Noatak’s fall caribou harvesting area.
Also interesting was an area Noatak residents did not report using, the land areas draining into Kotzebue Sound and the Chukchi Sea from Cape Krusenstern west and north to Kivalina, except in the immediate vicinity of Sisualik and Anigaaq. Some of this area was used by Kivalina (Figure 11). Presumably the rest of it was used by residents of Kotzebue. In this respect, Noatak’s land use patterns reflect the traditional territories of the Napaaqtugmiut (Burch Jr. 1998), except for the lack of use of the Rabbit Creek watershed.
HARVEST ASSESSMENTS The survey asked respondents to assess their own harvests in 2 ways: whether they got more, less, or about the same amount of 6 resource categories in 2007 as in past years, and whether they got “enough” of each of the 6 resource categories. This section discusses responses to those questions. Percentages do not include households that did not respond to the question or reported that they never harvested the resource. Subsistence harvest success also can be assessed by comparing current harvest estimates with past harvest estimates; that will be discussed in a later section.
Noatak households’ own assessments of their 2007 harvests were mixed. In 4 of the 6 resource categories, households most commonly reported harvesting about the same or more in 2007 (Figure 27). Although 49% of households reported taking less other (nonsalmon) fish in 2007, 42% reported taking about the same amount and 9% reported that they got more for a total of 51%. For marine mammals, 62% of households didn’t respond to the question or reported that they didn’t usually harvest marine mammals. Of those who responded, 71% reported they got about the same, while only 15% said they got less. For birds and eggs, 40% didn’t respond or said they didn’t usually harvest birds and eggs. Of those who responded, 46% said they got the same amount of birds and eggs as in years past and 9% reported getting more.
For 2 resource categories, households most frequently reported getting less in 2007. Those were salmon, for which 52% of households reported less, and land mammals, for which by 65% of households reported less.
The harvesting successes in 2007 were plants, where 35% of harvesting households reported harvesting more, and marine mammals, where 15% of harvesting households reported harvesting more. In other categories, 10% or less than of harvesting households reported getting more in 2007 than in past years
In every category, though, a majority of households reported that they “got enough” in 2007 (Figure 27). Land mammals received the most negative responses, with 48% saying they did not get enough in 2007. About one-third of the households said they did not get enough salmon or nonsalmon fish. Responses were the most positive for plants, where 85% of those responding said they got enough berries, and for birds and eggs, where 75% reported getting enough.
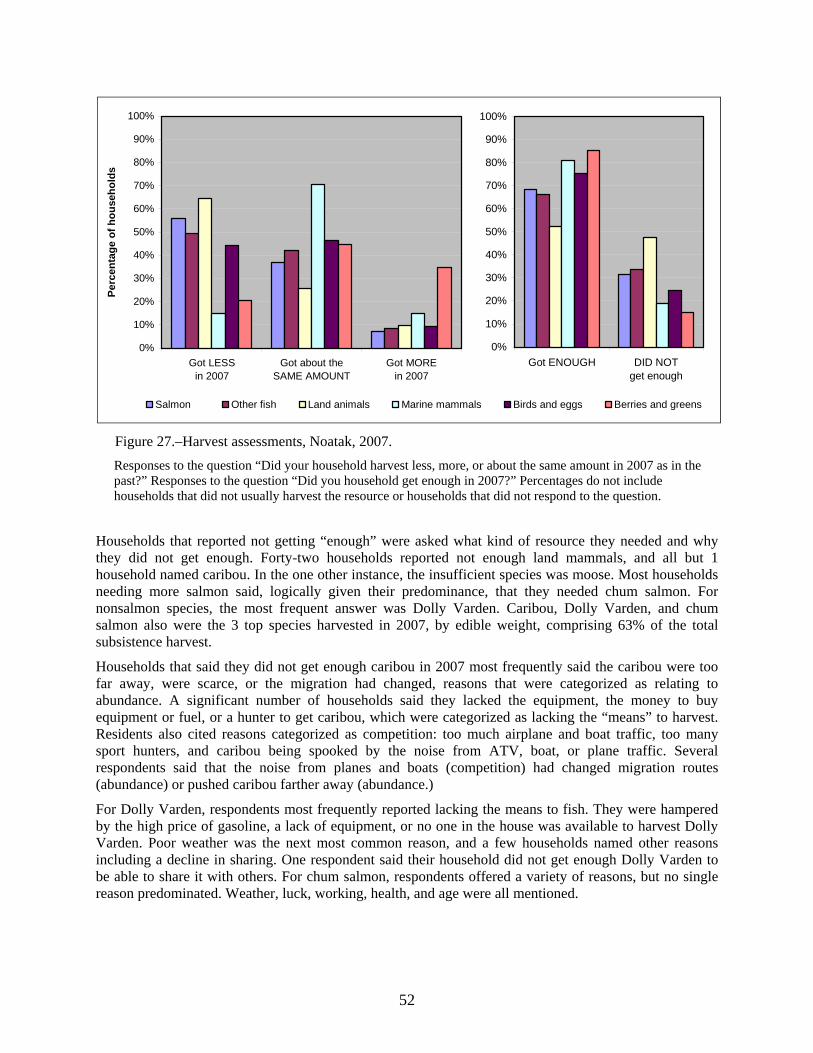
52
Figure 27.–Harvest assessments, Noatak, 2007. Responses to the question “Did your household harvest less, more, or about the same amount in 2007 as in the past?” Responses to the question “Did you household get enough in 2007?” Percentages do not include households that did not usually harvest the resource or households that did not respond to the question.
Households that reported not getting “enough” were asked what kind of resource they needed and why they did not get enough. Forty-two households reported not enough land mammals, and all but 1 household named caribou. In the one other instance, the insufficient species was moose. Most households needing more salmon said, logically given their predominance, that they needed chum salmon. For nonsalmon species, the most frequent answer was Dolly Varden. Caribou, Dolly Varden, and chum salmon also were the 3 top species harvested in 2007, by edible weight, comprising 63% of the total subsistence harvest.
Households that said they did not get enough caribou in 2007 most frequently said the caribou were too far away, were scarce, or the migration had changed, reasons that were categorized as relating to abundance. A significant number of households said they lacked the equipment, the money to buy equipment or fuel, or a hunter to get caribou, which were categorized as lacking the “means” to harvest. Residents also cited reasons categorized as competition: too much airplane and boat traffic, too many sport hunters, and caribou being spooked by the noise from ATV, boat, or plane traffic. Several respondents said that the noise from planes and boats (competition) had changed migration routes (abundance) or pushed caribou farther away (abundance.)
For Dolly Varden, respondents most frequently reported lacking the means to fish. They were hampered by the high price of gasoline, a lack of equipment, or no one in the house was available to harvest Dolly Varden. Poor weather was the next most common reason, and a few households named other reasons including a decline in sharing. One respondent said their household did not get enough Dolly Varden to be able to share it with others. For chum salmon, respondents offered a variety of reasons, but no single reason predominated. Weather, luck, working, health, and age were all mentioned.
0%
10%
20%
30%
40%
50%
60%
70%
80%
90%
100%
Got LESSin 2007
Got about theSAME AMOUNT
Got MOREin 2007
Perc
enta
ge o
f hou
seho
lds
Salmon Other fish Land animals Marine mammals Birds and eggs Berries and greens
0%
10%
20%
30%
40%
50%
60%
70%
80%
90%
100%
Got ENOUGH DID NOTget enough
53
JOBS AND INCOME Respondents were asked about both earned income (jobs held and wages earned by all household members 16 years old and older) and unearned income (Alaska permanent fund dividend, social security, public assistance, etc). For 2007, Noatak households earned or received an estimated $8.2 million, of which $5.3 million (65%) was from wage employment and $2.9 million (35%) was from other sources (Table 7). For comparison, the 2000 census reported an average income per person of $9,659 or approximately $4.1 million for the community. While Noatak incomes almost certainly did increase between 2000 and 2007, it also was possible that higher income households were overrepresented in the 2007 ADF&G survey sample.
Table 7.–Estimated earned and other income, Noatak, 2007.
Income source
Number of
people
Numberof
households
Total for
community
Mean per
household a
Percentage of
total Earned income Local governments, including tribal 103 87 $2,091,480 $17,575 25% Mining 25 24 $1,075,665 $9,039 13% Services 69 57 $868,646 $7,300 11% Construction 24 24 $525,370 $4,415 6% Transportation, communication and utilities 15 15 $283,282 $2,381 3% Other industries – – $493,180 $4,144 6% Subtotal, earned income 153 111 $5,337,624 $44,854 65% Other income Native corporation dividend 100 1,004,866 $8,444 12% Alaska Permanent Fund 110 728,256 $6,120 9% Pension–retirement 22 364,561 $3,064 4% Social Security 30 311,964 $2,622 4% Food stamps 37 182,567 $1,534 2% Energy assistance 46 79,829 $671 1% Unemployment 25 63,468 $533 1% Adult Public Assistance (OAA, APD) 12 49,985 $420 1% Child support 4 37,226 $313 0% Longevity bonus 13 22,499 $189 0% Workman's comp–insurance * * * * Supplemental Security Income * * * * Other * * * * Subtotal, other income 112 $2,867,128 $24,094 35% Total, community income 119 $8,204,752 $68,947 100% Source ADF&G Division of Subsistence household surveys, 2008. a. Household mean based on total number of households in community. * For confidentiality, income amounts are not listed for sources reported by fewer than 4 households.
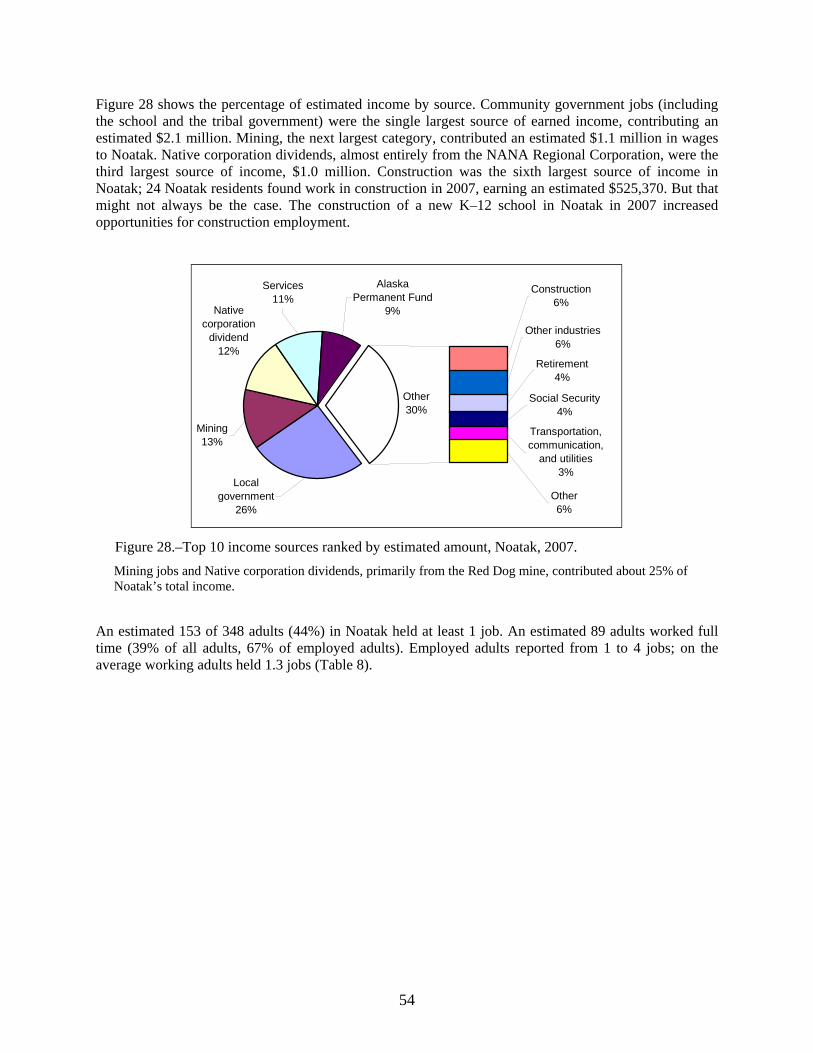
54
Figure 28 shows the percentage of estimated income by source. Community government jobs (including the school and the tribal government) were the single largest source of earned income, contributing an estimated $2.1 million. Mining, the next largest category, contributed an estimated $1.1 million in wages to Noatak. Native corporation dividends, almost entirely from the NANA Regional Corporation, were the third largest source of income, $1.0 million. Construction was the sixth largest source of income in Noatak; 24 Noatak residents found work in construction in 2007, earning an estimated $525,370. But that might not always be the case. The construction of a new K–12 school in Noatak in 2007 increased opportunities for construction employment.
Figure 28.–Top 10 income sources ranked by estimated amount, Noatak, 2007. Mining jobs and Native corporation dividends, primarily from the Red Dog mine, contributed about 25% of Noatak’s total income.
An estimated 153 of 348 adults (44%) in Noatak held at least 1 job. An estimated 89 adults worked full time (39% of all adults, 67% of employed adults). Employed adults reported from 1 to 4 jobs; on the average working adults held 1.3 jobs (Table 8).
Other30%
Local government
26%
Native corporation
dividend12%
Alaska Permanent Fund
9%
Services11%
Mining13%
Retirement4%
Other industries6%
Construction6%
Social Security4%
Transportation, communication,
and utilities3%
Other6%
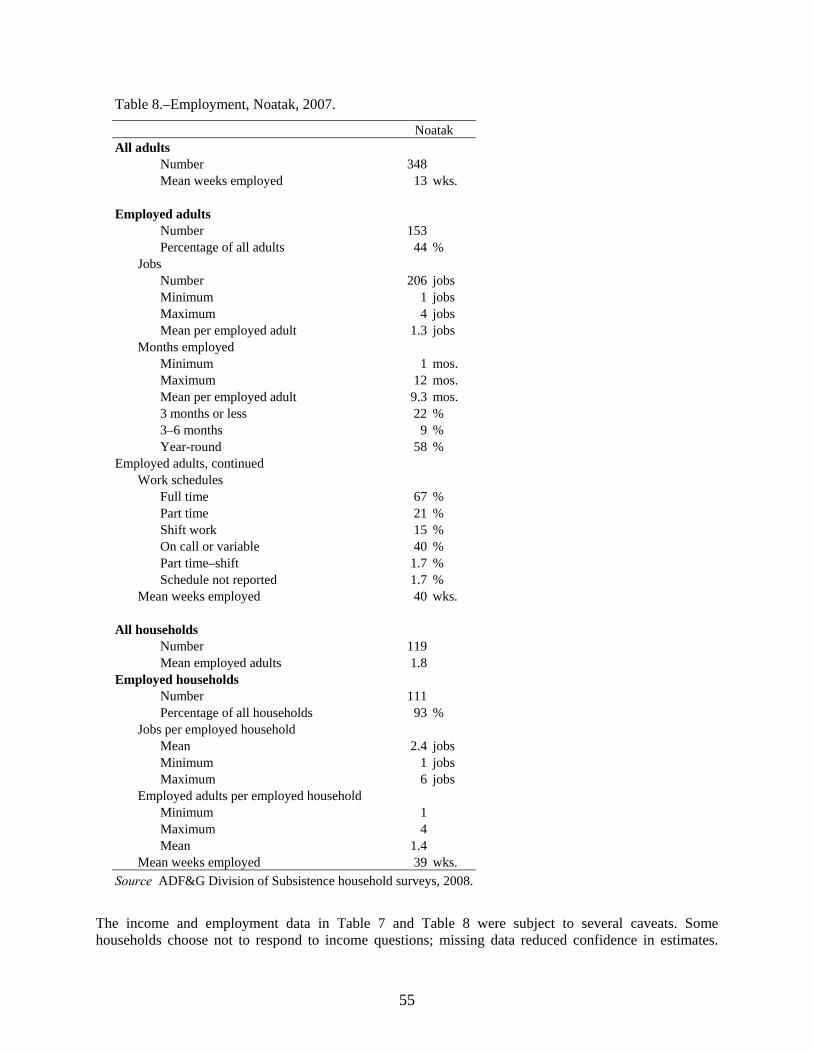
55
Table 8.–Employment, Noatak, 2007.
Noatak All adults Number 348 Mean weeks employed 13 wks. Employed adults Number 153 Percentage of all adults 44 % Jobs Number 206 jobs Minimum 1 jobs Maximum 4 jobs Mean per employed adult 1.3 jobs Months employed Minimum 1 mos. Maximum 12 mos. Mean per employed adult 9.3 mos. 3 months or less 22 % 3–6 months 9 % Year-round 58 % Employed adults, continued Work schedules Full time 67 % Part time 21 % Shift work 15 % On call or variable 40 % Part time–shift 1.7 % Schedule not reported 1.7 % Mean weeks employed 40 wks. All households Number 119 Mean employed adults 1.8 Employed households Number 111 Percentage of all households 93 % Jobs per employed household Mean 2.4 jobs Minimum 1 jobs Maximum 6 jobs Employed adults per employed household Minimum 1 Maximum 4 Mean 1.4 Mean weeks employed 39 wks. Source ADF&G Division of Subsistence household surveys, 2008.
The income and employment data in Table 7 and Table 8 were subject to several caveats. Some households choose not to respond to income questions; missing data reduced confidence in estimates.
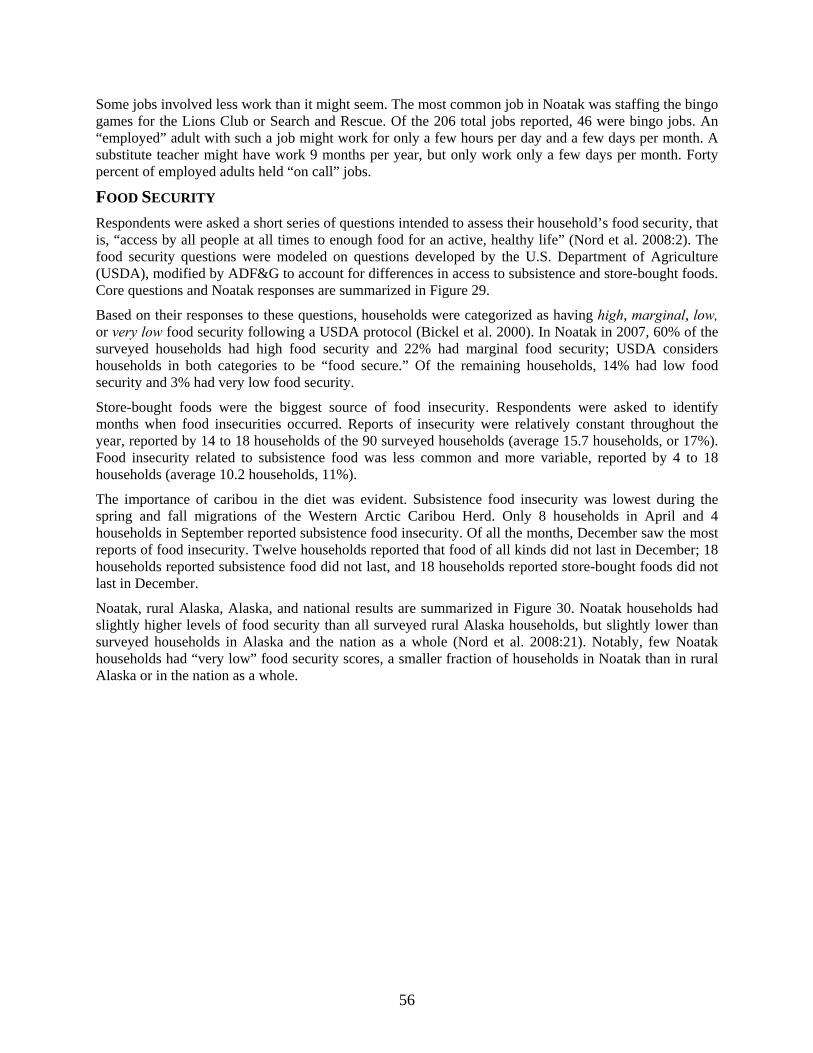
56
Some jobs involved less work than it might seem. The most common job in Noatak was staffing the bingo games for the Lions Club or Search and Rescue. Of the 206 total jobs reported, 46 were bingo jobs. An “employed” adult with such a job might work for only a few hours per day and a few days per month. A substitute teacher might have work 9 months per year, but only work only a few days per month. Forty percent of employed adults held “on call” jobs.
FOOD SECURITY Respondents were asked a short series of questions intended to assess their household’s food security, that is, “access by all people at all times to enough food for an active, healthy life” (Nord et al. 2008:2). The food security questions were modeled on questions developed by the U.S. Department of Agriculture (USDA), modified by ADF&G to account for differences in access to subsistence and store-bought foods. Core questions and Noatak responses are summarized in Figure 29.
Based on their responses to these questions, households were categorized as having high, marginal, low, or very low food security following a USDA protocol (Bickel et al. 2000). In Noatak in 2007, 60% of the surveyed households had high food security and 22% had marginal food security; USDA considers households in both categories to be “food secure.” Of the remaining households, 14% had low food security and 3% had very low food security.
Store-bought foods were the biggest source of food insecurity. Respondents were asked to identify months when food insecurities occurred. Reports of insecurity were relatively constant throughout the year, reported by 14 to 18 households of the 90 surveyed households (average 15.7 households, or 17%). Food insecurity related to subsistence food was less common and more variable, reported by 4 to 18 households (average 10.2 households, 11%).
The importance of caribou in the diet was evident. Subsistence food insecurity was lowest during the spring and fall migrations of the Western Arctic Caribou Herd. Only 8 households in April and 4 households in September reported subsistence food insecurity. Of all the months, December saw the most reports of food insecurity. Twelve households reported that food of all kinds did not last in December; 18 households reported subsistence food did not last, and 18 households reported store-bought foods did not last in December.
Noatak, rural Alaska, Alaska, and national results are summarized in Figure 30. Noatak households had slightly higher levels of food security than all surveyed rural Alaska households, but slightly lower than surveyed households in Alaska and the nation as a whole (Nord et al. 2008:21). Notably, few Noatak households had “very low” food security scores, a smaller fraction of households in Noatak than in rural Alaska or in the nation as a whole.
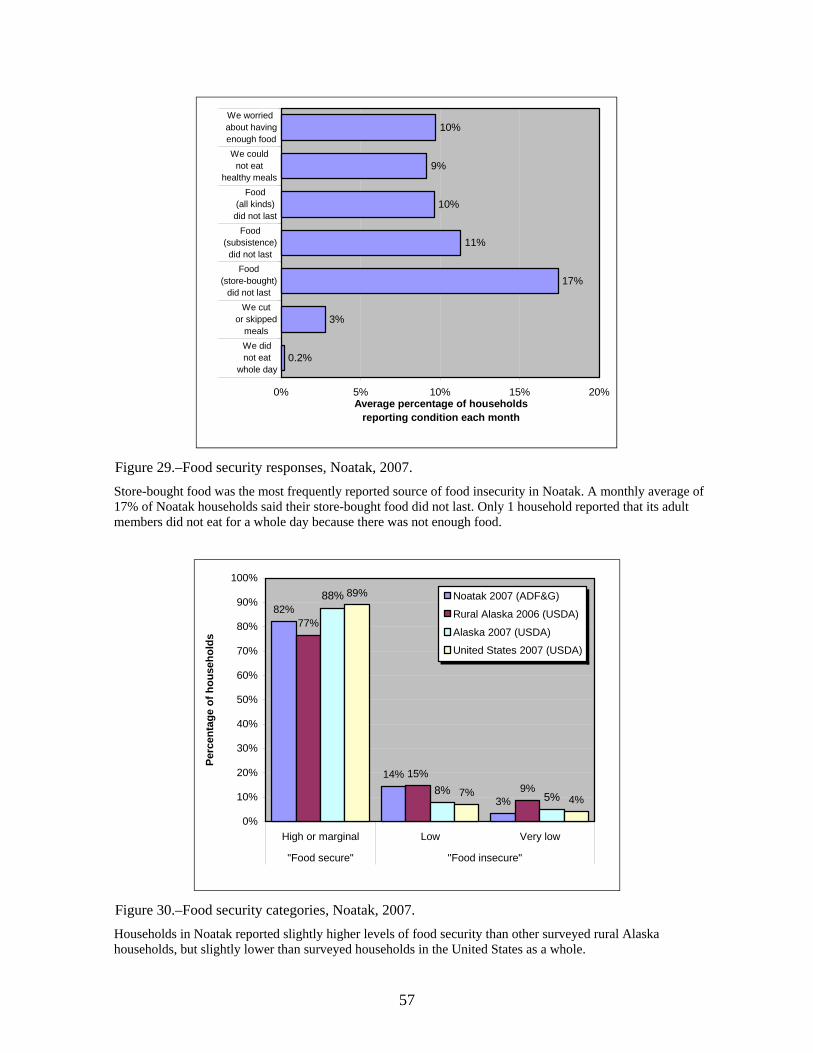
57
Figure 29.–Food security responses, Noatak, 2007. Store-bought food was the most frequently reported source of food insecurity in Noatak. A monthly average of 17% of Noatak households said their store-bought food did not last. Only 1 household reported that its adult members did not eat for a whole day because there was not enough food.
Figure 30.–Food security categories, Noatak, 2007. Households in Noatak reported slightly higher levels of food security than other surveyed rural Alaska households, but slightly lower than surveyed households in the United States as a whole.
9%
10%
11%
17%
10%
3%
0.2%
0% 5% 10% 15% 20%
We worried about havingenough foodWe could
not eathealthy meals
Food(all kinds)did not last
Food(subsistence)did not last
Food(store-bought)
did not lastWe cut
or skippedmealsWe didnot eat
whole day
76
54
32
1
Average percentage of householdsreporting condition each month
82%
14%
3%
77%
15%9%
88%
8% 5%
89%
7%4%
0%
10%
20%
30%
40%
50%
60%
70%
80%
90%
100%
High or marginal Low Very low
"Food secure" "Food insecure"
Perc
enta
ge o
f hou
seho
lds
Noatak 2007 (ADF&G)
Rural Alaska 2006 (USDA)
Alaska 2007 (USDA)
United States 2007 (USDA)
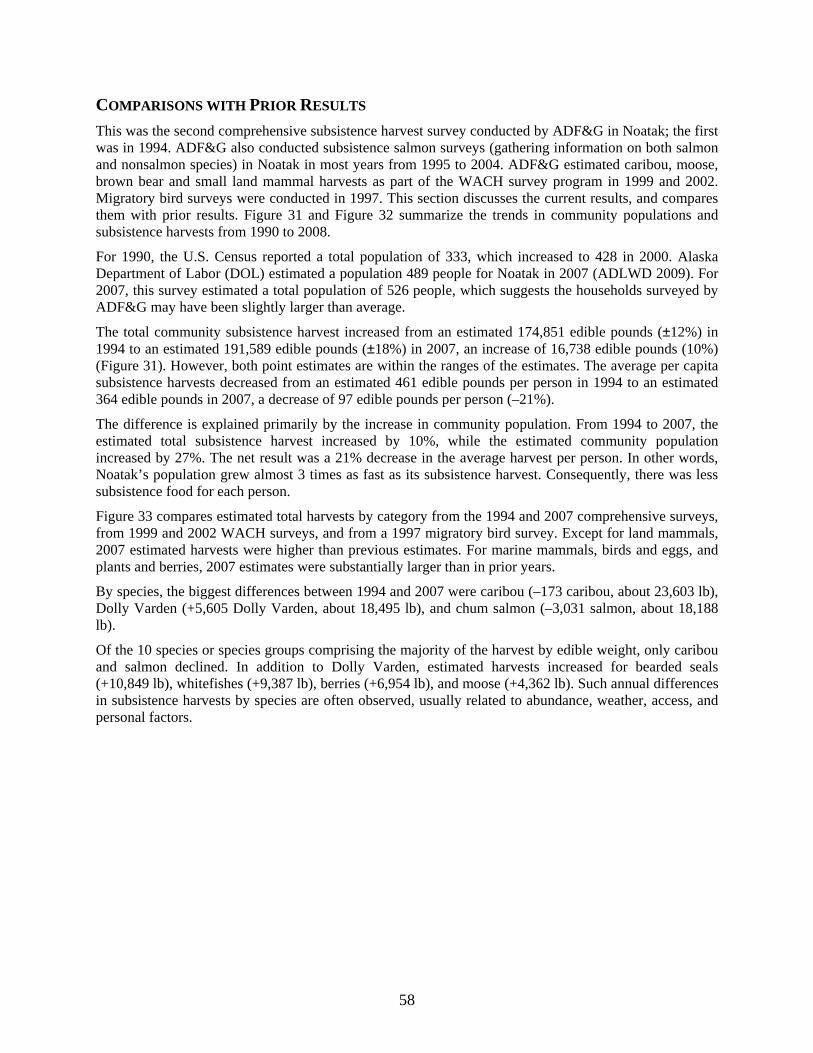
58
COMPARISONS WITH PRIOR RESULTS This was the second comprehensive subsistence harvest survey conducted by ADF&G in Noatak; the first was in 1994. ADF&G also conducted subsistence salmon surveys (gathering information on both salmon and nonsalmon species) in Noatak in most years from 1995 to 2004. ADF&G estimated caribou, moose, brown bear and small land mammal harvests as part of the WACH survey program in 1999 and 2002. Migratory bird surveys were conducted in 1997. This section discusses the current results, and compares them with prior results. Figure 31 and Figure 32 summarize the trends in community populations and subsistence harvests from 1990 to 2008.
For 1990, the U.S. Census reported a total population of 333, which increased to 428 in 2000. Alaska Department of Labor (DOL) estimated a population 489 people for Noatak in 2007 (ADLWD 2009). For 2007, this survey estimated a total population of 526 people, which suggests the households surveyed by ADF&G may have been slightly larger than average.
The total community subsistence harvest increased from an estimated 174,851 edible pounds (±12%) in 1994 to an estimated 191,589 edible pounds (±18%) in 2007, an increase of 16,738 edible pounds (10%) (Figure 31). However, both point estimates are within the ranges of the estimates. The average per capita subsistence harvests decreased from an estimated 461 edible pounds per person in 1994 to an estimated 364 edible pounds in 2007, a decrease of 97 edible pounds per person (–21%).
The difference is explained primarily by the increase in community population. From 1994 to 2007, the estimated total subsistence harvest increased by 10%, while the estimated community population increased by 27%. The net result was a 21% decrease in the average harvest per person. In other words, Noatak’s population grew almost 3 times as fast as its subsistence harvest. Consequently, there was less subsistence food for each person.
Figure 33 compares estimated total harvests by category from the 1994 and 2007 comprehensive surveys, from 1999 and 2002 WACH surveys, and from a 1997 migratory bird survey. Except for land mammals, 2007 estimated harvests were higher than previous estimates. For marine mammals, birds and eggs, and plants and berries, 2007 estimates were substantially larger than in prior years.
By species, the biggest differences between 1994 and 2007 were caribou (–173 caribou, about 23,603 lb), Dolly Varden (+5,605 Dolly Varden, about 18,495 lb), and chum salmon (–3,031 salmon, about 18,188 lb).
Of the 10 species or species groups comprising the majority of the harvest by edible weight, only caribou and salmon declined. In addition to Dolly Varden, estimated harvests increased for bearded seals (+10,849 lb), whitefishes (+9,387 lb), berries (+6,954 lb), and moose (+4,362 lb). Such annual differences in subsistence harvests by species are often observed, usually related to abundance, weather, access, and personal factors.
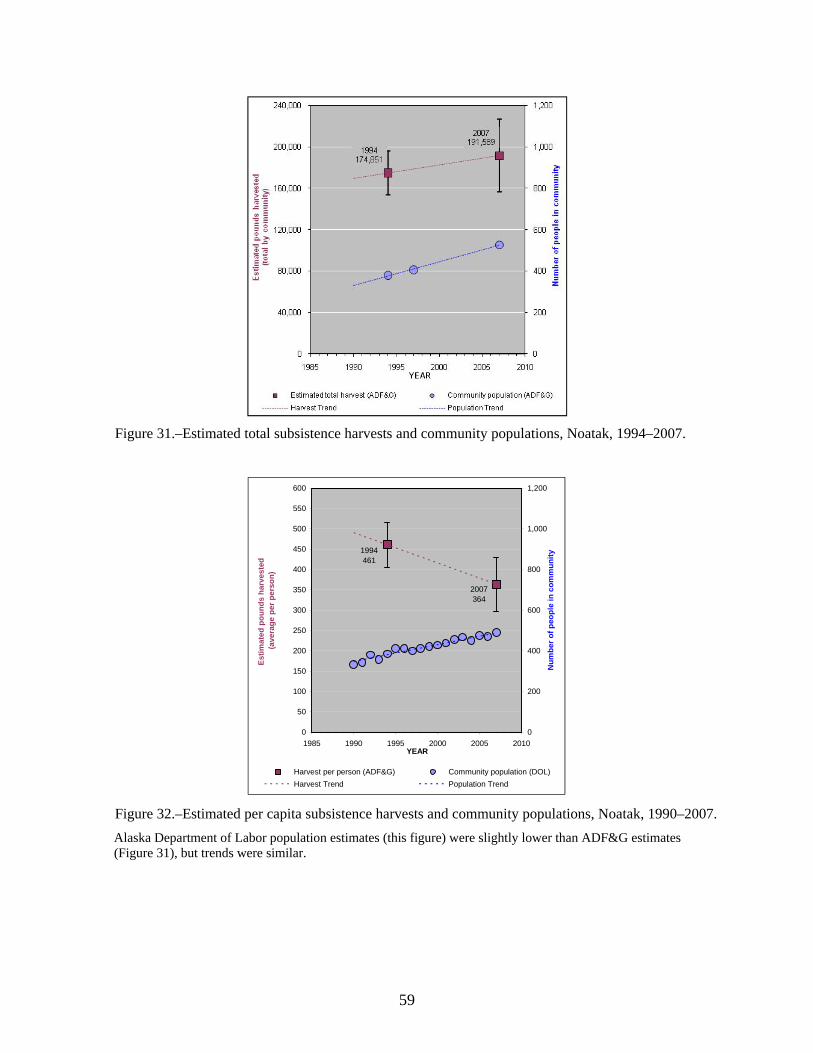
59
Figure 31.–Estimated total subsistence harvests and community populations, Noatak, 1994–2007.
Figure 32.–Estimated per capita subsistence harvests and community populations, Noatak, 1990–2007. Alaska Department of Labor population estimates (this figure) were slightly lower than ADF&G estimates (Figure 31), but trends were similar.
2007364
1994461
0
50
100
150
200
250
300
350
400
450
500
550
600
1985 1990 1995 2000 2005 2010YEAR
Estim
ated
pou
nds
harv
este
d (a
vera
ge p
er p
erso
n)
0
200
400
600
800
1,000
1,200
Num
ber o
f peo
ple
in c
omm
unity
Harvest per person (ADF&G) Community population (DOL)Harvest Trend Population Trend
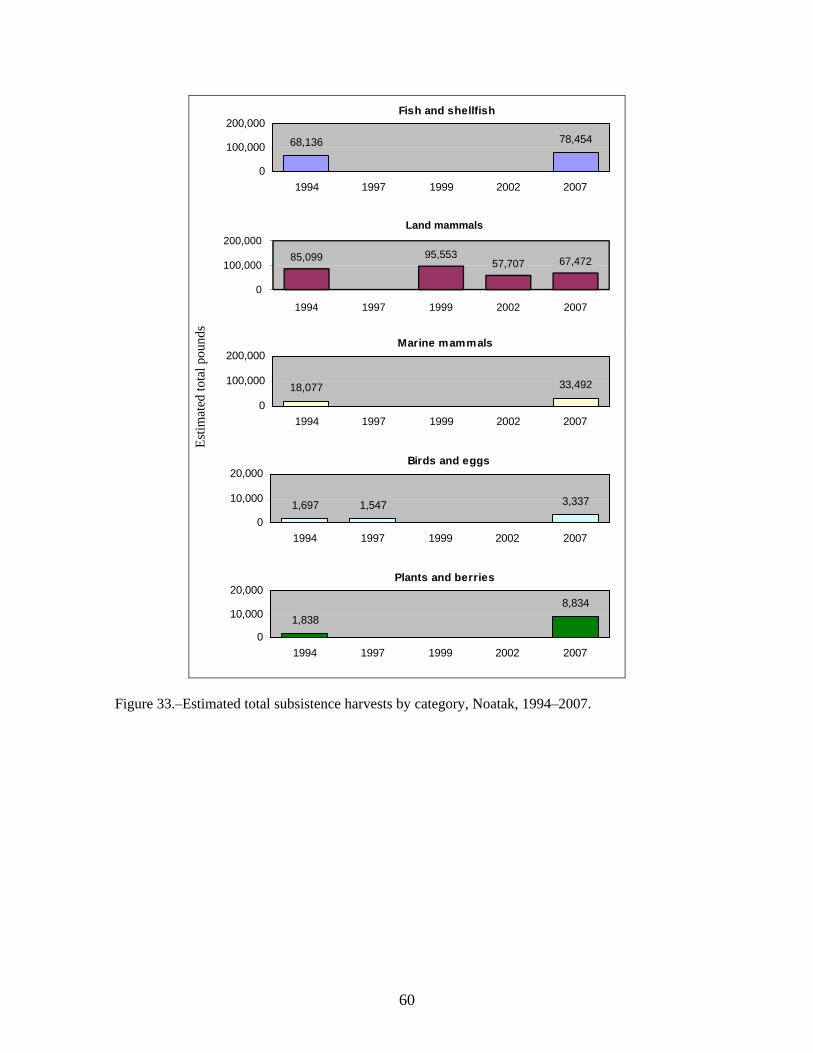
60
Estim
ated
tota
l pou
nds
Figure 33.–Estimated total subsistence harvests by category, Noatak, 1994–2007.
Fish and shellfish
68,136 78,454
0
100,000
200,000
1994 1997 1999 2002 2007
85,099 95,55357,707 67,472
0
100,000
200,000
1994 1997 1999 2002 2007
Land mammals
Marine mammals
18,077 33,492
0
100,000
200,000
1994 1997 1999 2002 2007
Birds and eggs
1,697 1,547 3,337
0
10,000
20,000
1994 1997 1999 2002 2007
Plants and berries
1,8388,834
0
10,000
20,000
1994 1997 1999 2002 2007
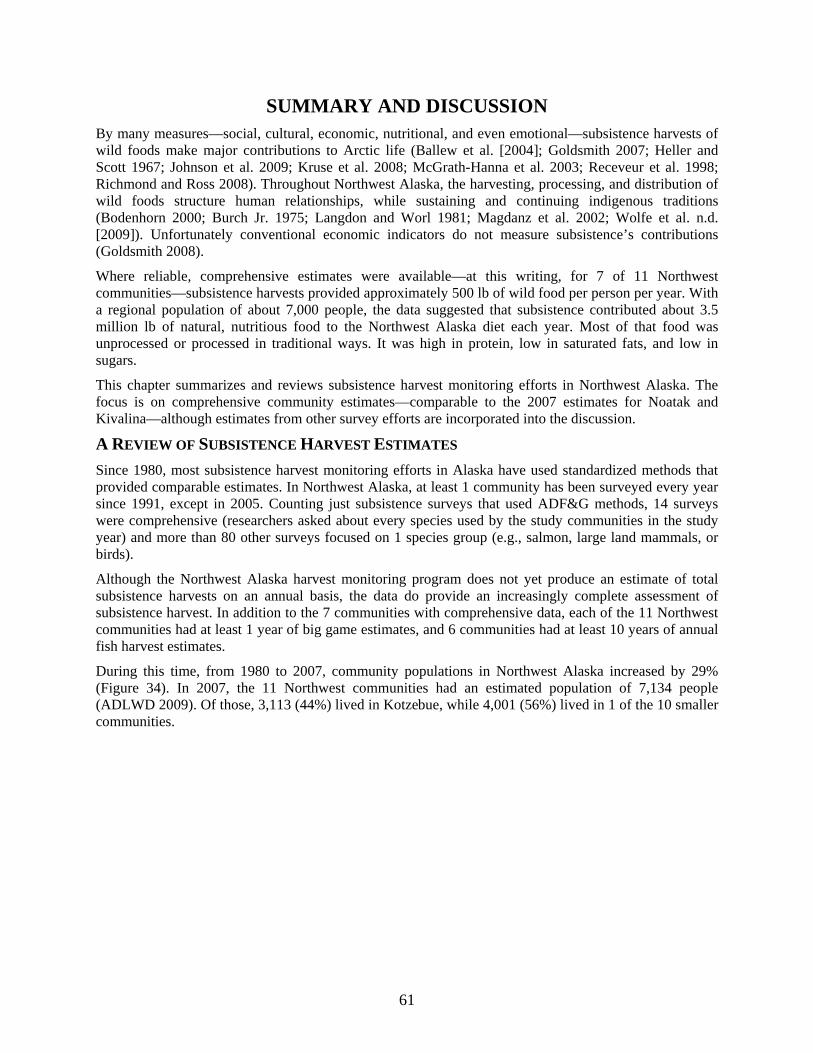
61
SUMMARY AND DISCUSSION By many measures—social, cultural, economic, nutritional, and even emotional—subsistence harvests of wild foods make major contributions to Arctic life (Ballew et al. [2004]; Goldsmith 2007; Heller and Scott 1967; Johnson et al. 2009; Kruse et al. 2008; McGrath-Hanna et al. 2003; Receveur et al. 1998; Richmond and Ross 2008). Throughout Northwest Alaska, the harvesting, processing, and distribution of wild foods structure human relationships, while sustaining and continuing indigenous traditions (Bodenhorn 2000; Burch Jr. 1975; Langdon and Worl 1981; Magdanz et al. 2002; Wolfe et al. n.d. [2009]). Unfortunately conventional economic indicators do not measure subsistence’s contributions (Goldsmith 2008).
Where reliable, comprehensive estimates were available—at this writing, for 7 of 11 Northwest communities—subsistence harvests provided approximately 500 lb of wild food per person per year. With a regional population of about 7,000 people, the data suggested that subsistence contributed about 3.5 million lb of natural, nutritious food to the Northwest Alaska diet each year. Most of that food was unprocessed or processed in traditional ways. It was high in protein, low in saturated fats, and low in sugars.
This chapter summarizes and reviews subsistence harvest monitoring efforts in Northwest Alaska. The focus is on comprehensive community estimates—comparable to the 2007 estimates for Noatak and Kivalina—although estimates from other survey efforts are incorporated into the discussion.
A REVIEW OF SUBSISTENCE HARVEST ESTIMATES Since 1980, most subsistence harvest monitoring efforts in Alaska have used standardized methods that provided comparable estimates. In Northwest Alaska, at least 1 community has been surveyed every year since 1991, except in 2005. Counting just subsistence surveys that used ADF&G methods, 14 surveys were comprehensive (researchers asked about every species used by the study communities in the study year) and more than 80 other surveys focused on 1 species group (e.g., salmon, large land mammals, or birds).
Although the Northwest Alaska harvest monitoring program does not yet produce an estimate of total subsistence harvests on an annual basis, the data do provide an increasingly complete assessment of subsistence harvest. In addition to the 7 communities with comprehensive data, each of the 11 Northwest communities had at least 1 year of big game estimates, and 6 communities had at least 10 years of annual fish harvest estimates.
During this time, from 1980 to 2007, community populations in Northwest Alaska increased by 29% (Figure 34). In 2007, the 11 Northwest communities had an estimated population of 7,134 people (ADLWD 2009). Of those, 3,113 (44%) lived in Kotzebue, while 4,001 (56%) lived in 1 of the 10 smaller communities.
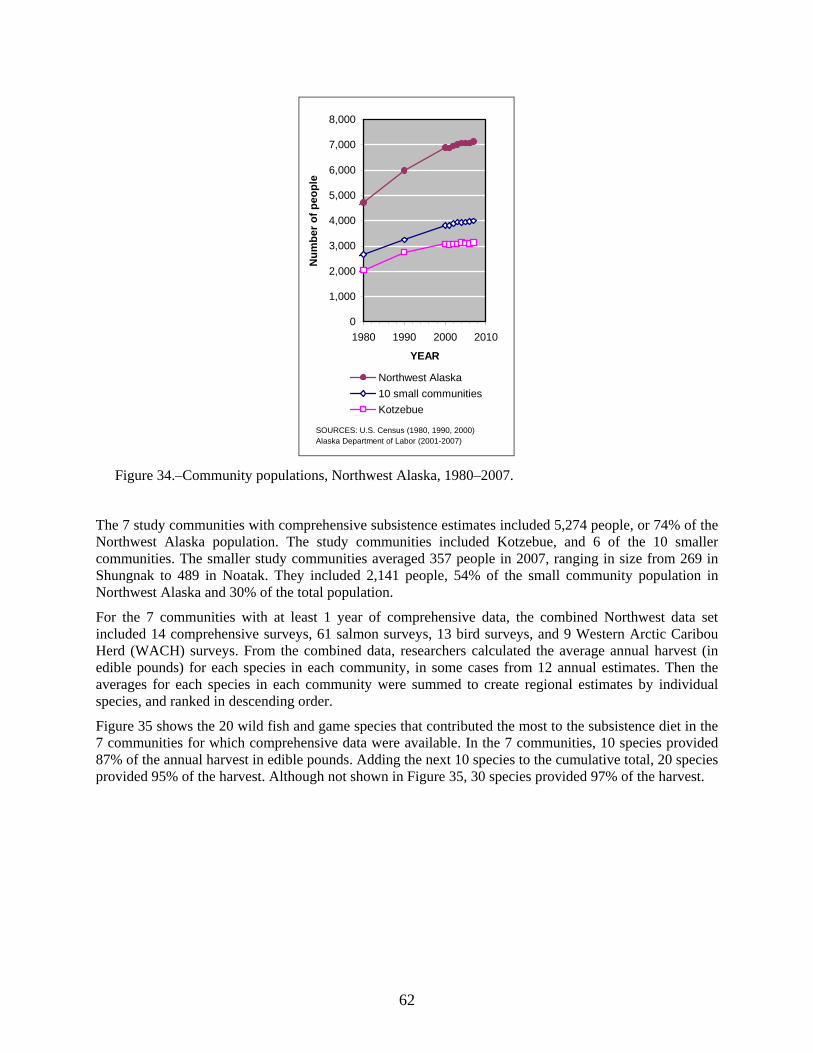
62
Figure 34.–Community populations, Northwest Alaska, 1980–2007.
The 7 study communities with comprehensive subsistence estimates included 5,274 people, or 74% of the Northwest Alaska population. The study communities included Kotzebue, and 6 of the 10 smaller communities. The smaller study communities averaged 357 people in 2007, ranging in size from 269 in Shungnak to 489 in Noatak. They included 2,141 people, 54% of the small community population in Northwest Alaska and 30% of the total population.
For the 7 communities with at least 1 year of comprehensive data, the combined Northwest data set included 14 comprehensive surveys, 61 salmon surveys, 13 bird surveys, and 9 Western Arctic Caribou Herd (WACH) surveys. From the combined data, researchers calculated the average annual harvest (in edible pounds) for each species in each community, in some cases from 12 annual estimates. Then the averages for each species in each community were summed to create regional estimates by individual species, and ranked in descending order.
Figure 35 shows the 20 wild fish and game species that contributed the most to the subsistence diet in the 7 communities for which comprehensive data were available. In the 7 communities, 10 species provided 87% of the annual harvest in edible pounds. Adding the next 10 species to the cumulative total, 20 species provided 95% of the harvest. Although not shown in Figure 35, 30 species provided 97% of the harvest.
0
1,000
2,000
3,000
4,000
5,000
6,000
7,000
8,000
1980 1990 2000 2010
YEAR
Num
ber o
f peo
ple
Northwest Alaska10 small communitiesKotzebue
SOURCES: U.S. Census (1980, 1990, 2000)Alaska Department of Labor (2001-2007)
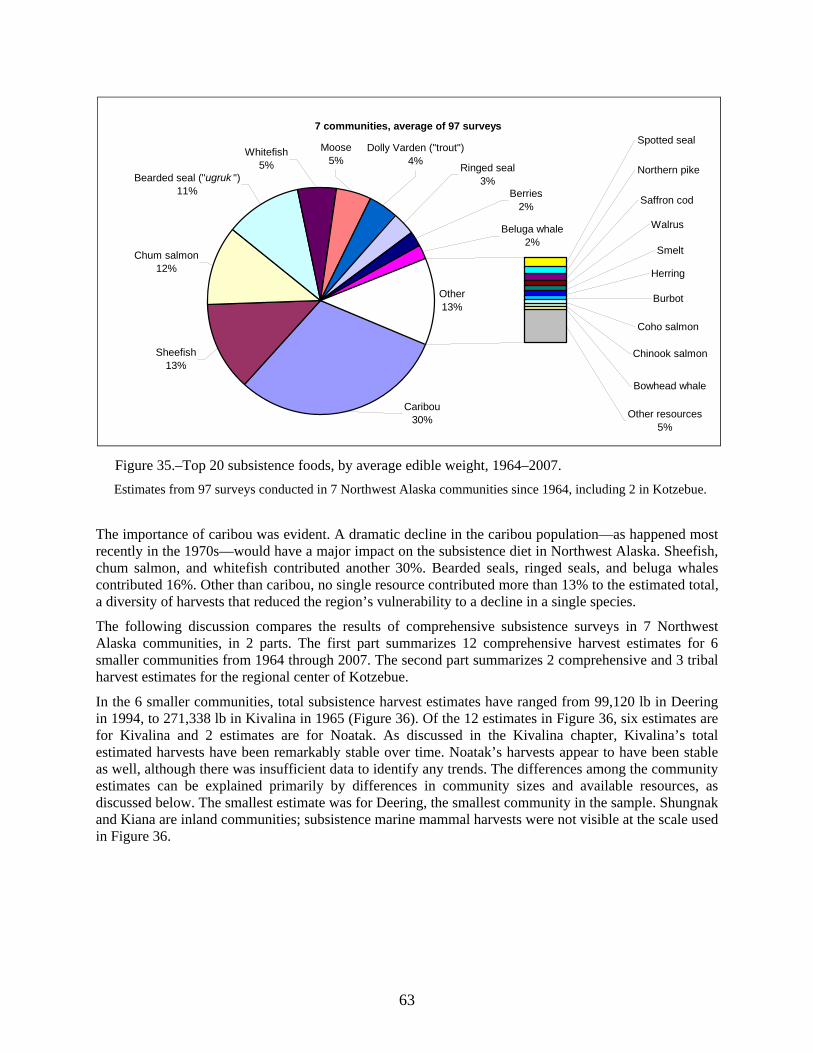
63
Figure 35.–Top 20 subsistence foods, by average edible weight, 1964–2007. Estimates from 97 surveys conducted in 7 Northwest Alaska communities since 1964, including 2 in Kotzebue.
The importance of caribou was evident. A dramatic decline in the caribou population—as happened most recently in the 1970s—would have a major impact on the subsistence diet in Northwest Alaska. Sheefish, chum salmon, and whitefish contributed another 30%. Bearded seals, ringed seals, and beluga whales contributed 16%. Other than caribou, no single resource contributed more than 13% to the estimated total, a diversity of harvests that reduced the region’s vulnerability to a decline in a single species.
The following discussion compares the results of comprehensive subsistence surveys in 7 Northwest Alaska communities, in 2 parts. The first part summarizes 12 comprehensive harvest estimates for 6 smaller communities from 1964 through 2007. The second part summarizes 2 comprehensive and 3 tribal harvest estimates for the regional center of Kotzebue.
In the 6 smaller communities, total subsistence harvest estimates have ranged from 99,120 lb in Deering in 1994, to 271,338 lb in Kivalina in 1965 (Figure 36). Of the 12 estimates in Figure 36, six estimates are for Kivalina and 2 estimates are for Noatak. As discussed in the Kivalina chapter, Kivalina’s total estimated harvests have been remarkably stable over time. Noatak’s harvests appear to have been stable as well, although there was insufficient data to identify any trends. The differences among the community estimates can be explained primarily by differences in community sizes and available resources, as discussed below. The smallest estimate was for Deering, the smallest community in the sample. Shungnak and Kiana are inland communities; subsistence marine mammal harvests were not visible at the scale used in Figure 36.
7 communities, average of 97 surveys
Other13%
Caribou30%
Sheefish13%
Chum salmon12%
Bearded seal ("ugruk ")11%
Whitefish5%
Spotted seal
Other resources5%
Saffron cod
Bowhead whale
Chinook salmon
Coho salmon
Burbot
Northern pike
Walrus
Smelt
Herring
Dolly Varden ("trout")4%
Ringed seal3%
Moose5%
Berries2%
Beluga whale2%
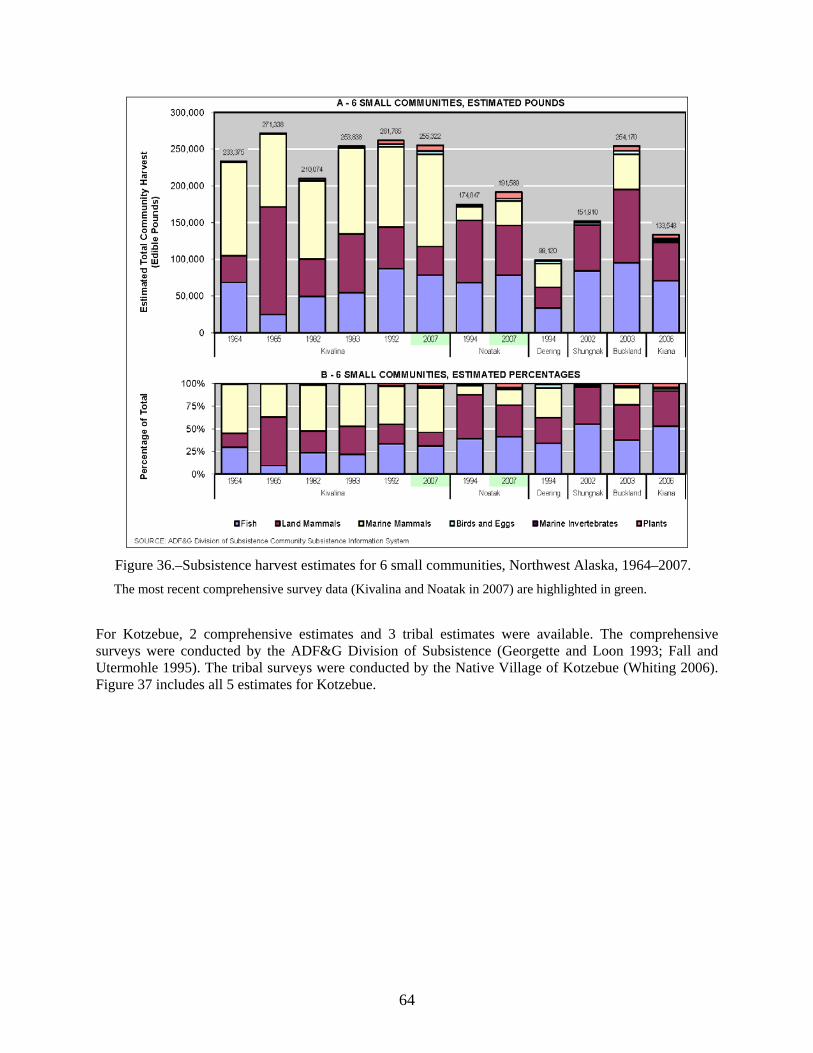
64
Figure 36.–Subsistence harvest estimates for 6 small communities, Northwest Alaska, 1964–2007. The most recent comprehensive survey data (Kivalina and Noatak in 2007) are highlighted in green.
For Kotzebue, 2 comprehensive estimates and 3 tribal estimates were available. The comprehensive surveys were conducted by the ADF&G Division of Subsistence (Georgette and Loon 1993; Fall and Utermohle 1995). The tribal surveys were conducted by the Native Village of Kotzebue (Whiting 2006). Figure 37 includes all 5 estimates for Kotzebue.
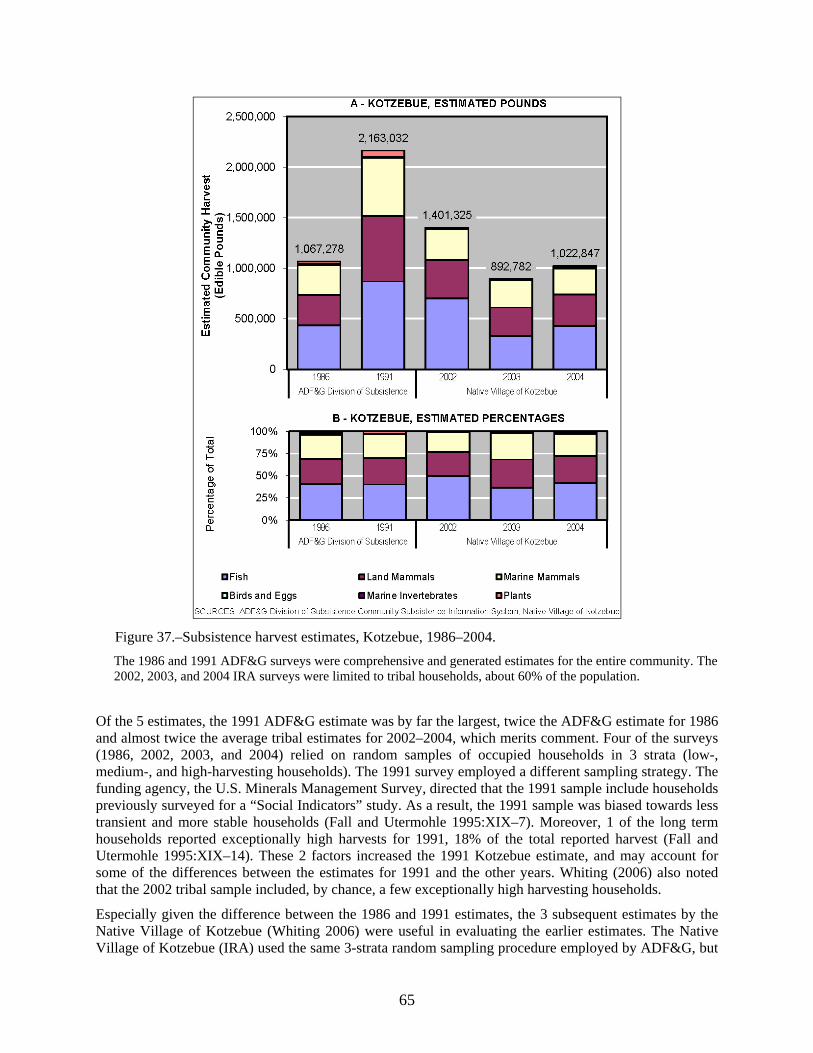
65
Figure 37.–Subsistence harvest estimates, Kotzebue, 1986–2004. The 1986 and 1991 ADF&G surveys were comprehensive and generated estimates for the entire community. The 2002, 2003, and 2004 IRA surveys were limited to tribal households, about 60% of the population.
Of the 5 estimates, the 1991 ADF&G estimate was by far the largest, twice the ADF&G estimate for 1986 and almost twice the average tribal estimates for 2002–2004, which merits comment. Four of the surveys (1986, 2002, 2003, and 2004) relied on random samples of occupied households in 3 strata (low-, medium-, and high-harvesting households). The 1991 survey employed a different sampling strategy. The funding agency, the U.S. Minerals Management Survey, directed that the 1991 sample include households previously surveyed for a “Social Indicators” study. As a result, the 1991 sample was biased towards less transient and more stable households (Fall and Utermohle 1995:XIX–7). Moreover, 1 of the long term households reported exceptionally high harvests for 1991, 18% of the total reported harvest (Fall and Utermohle 1995:XIX–14). These 2 factors increased the 1991 Kotzebue estimate, and may account for some of the differences between the estimates for 1991 and the other years. Whiting (2006) also noted that the 2002 tribal sample included, by chance, a few exceptionally high harvesting households.
Especially given the difference between the 1986 and 1991 estimates, the 3 subsequent estimates by the Native Village of Kotzebue (Whiting 2006) were useful in evaluating the earlier estimates. The Native Village of Kotzebue (IRA) used the same 3-strata random sampling procedure employed by ADF&G, but
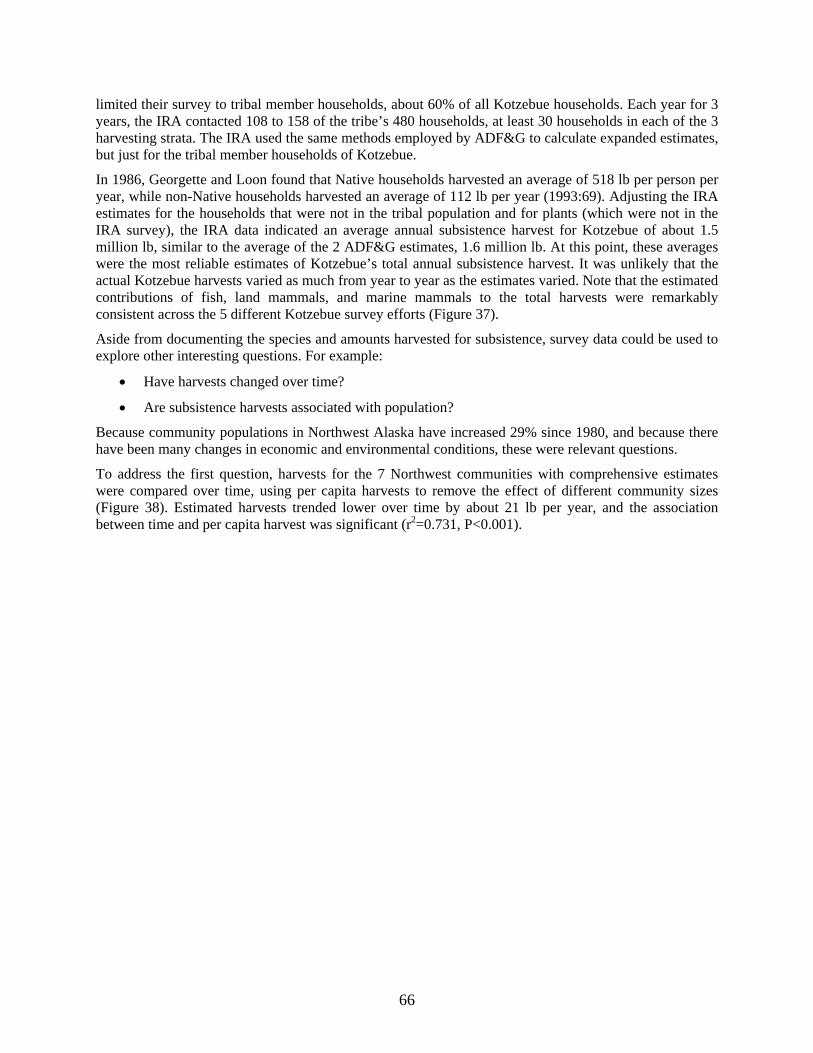
66
limited their survey to tribal member households, about 60% of all Kotzebue households. Each year for 3 years, the IRA contacted 108 to 158 of the tribe’s 480 households, at least 30 households in each of the 3 harvesting strata. The IRA used the same methods employed by ADF&G to calculate expanded estimates, but just for the tribal member households of Kotzebue.
In 1986, Georgette and Loon found that Native households harvested an average of 518 lb per person per year, while non-Native households harvested an average of 112 lb per year (1993:69). Adjusting the IRA estimates for the households that were not in the tribal population and for plants (which were not in the IRA survey), the IRA data indicated an average annual subsistence harvest for Kotzebue of about 1.5 million lb, similar to the average of the 2 ADF&G estimates, 1.6 million lb. At this point, these averages were the most reliable estimates of Kotzebue’s total annual subsistence harvest. It was unlikely that the actual Kotzebue harvests varied as much from year to year as the estimates varied. Note that the estimated contributions of fish, land mammals, and marine mammals to the total harvests were remarkably consistent across the 5 different Kotzebue survey efforts (Figure 37).
Aside from documenting the species and amounts harvested for subsistence, survey data could be used to explore other interesting questions. For example:
• Have harvests changed over time?
• Are subsistence harvests associated with population?
Because community populations in Northwest Alaska have increased 29% since 1980, and because there have been many changes in economic and environmental conditions, these were relevant questions.
To address the first question, harvests for the 7 Northwest communities with comprehensive estimates were compared over time, using per capita harvests to remove the effect of different community sizes (Figure 38). Estimated harvests trended lower over time by about 21 lb per year, and the association between time and per capita harvest was significant (r2=0.731, P<0.001).
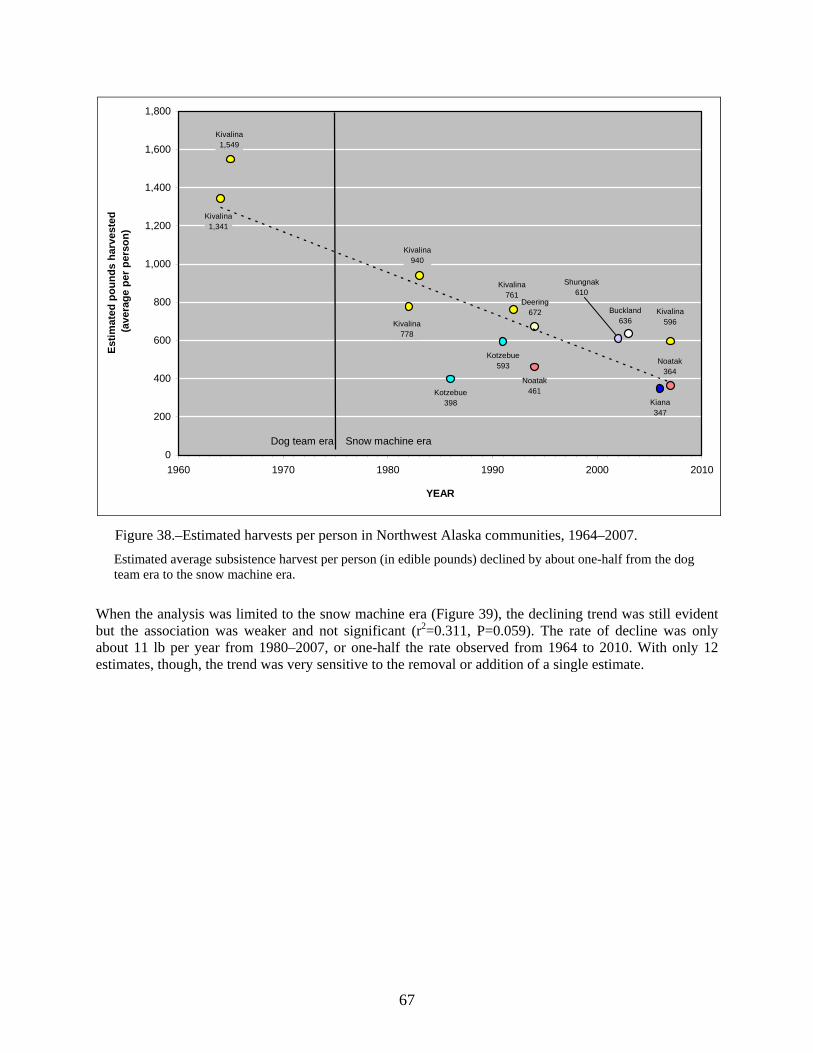
67
Figure 38.–Estimated harvests per person in Northwest Alaska communities, 1964–2007. Estimated average subsistence harvest per person (in edible pounds) declined by about one-half from the dog team era to the snow machine era.
When the analysis was limited to the snow machine era (Figure 39), the declining trend was still evident but the association was weaker and not significant (r2=0.311, P=0.059). The rate of decline was only about 11 lb per year from 1980–2007, or one-half the rate observed from 1964 to 2010. With only 12 estimates, though, the trend was very sensitive to the removal or addition of a single estimate.
Kiana347
Kotzebue398
Kotzebue593
Noatak461
Buckland636
Deering672
Kivalina1,549
Kivalina1,341
Kivalina778
Kivalina940
Kivalina761
Kivalina596
Noatak364
Shungnak610
0
200
400
600
800
1,000
1,200
1,400
1,600
1,800
1960 1970 1980 1990 2000 2010
YEAR
Estim
ated
pou
nds
harv
este
d (a
vera
ge p
er p
erso
n)
Dog team era Snow machine era
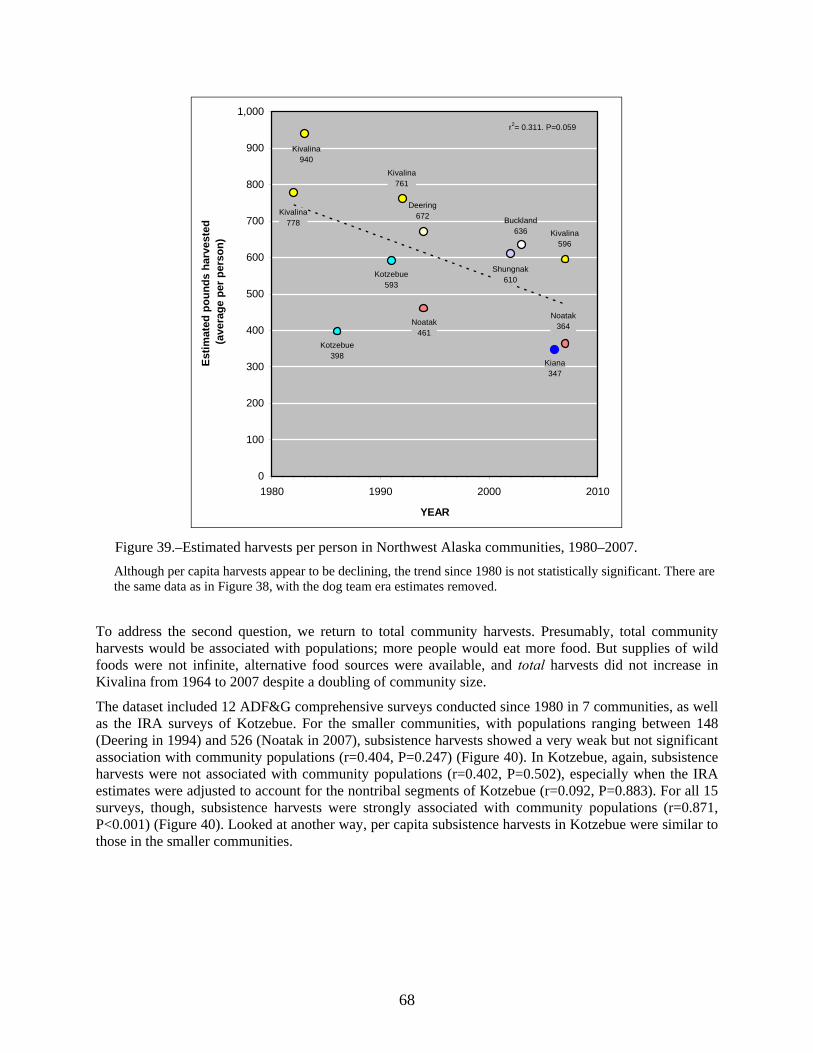
68
Figure 39.–Estimated harvests per person in Northwest Alaska communities, 1980–2007. Although per capita harvests appear to be declining, the trend since 1980 is not statistically significant. There are the same data as in Figure 38, with the dog team era estimates removed.
To address the second question, we return to total community harvests. Presumably, total community harvests would be associated with populations; more people would eat more food. But supplies of wild foods were not infinite, alternative food sources were available, and total harvests did not increase in Kivalina from 1964 to 2007 despite a doubling of community size.
The dataset included 12 ADF&G comprehensive surveys conducted since 1980 in 7 communities, as well as the IRA surveys of Kotzebue. For the smaller communities, with populations ranging between 148 (Deering in 1994) and 526 (Noatak in 2007), subsistence harvests showed a very weak but not significant association with community populations (r=0.404, P=0.247) (Figure 40). In Kotzebue, again, subsistence harvests were not associated with community populations (r=0.402, P=0.502), especially when the IRA estimates were adjusted to account for the nontribal segments of Kotzebue (r=0.092, P=0.883). For all 15 surveys, though, subsistence harvests were strongly associated with community populations (r=0.871, P<0.001) (Figure 40). Looked at another way, per capita subsistence harvests in Kotzebue were similar to those in the smaller communities.
Kotzebue398
Kotzebue593
Noatak461
Deering672
Kivalina940
Kivalina778
Kivalina596
Kivalina761
Noatak364
Shungnak610
Buckland636
Kiana347
0
100
200
300
400
500
600
700
800
900
1,000
1980 1990 2000 2010
YEAR
Estim
ated
pou
nds
harv
este
d (a
vera
ge p
er p
erso
n)
r2= 0.311, P=0.059
69
A–Northwest communities (except Kotzebue) B–7 Northwest communities
Figure 40.–Associations between community populations and total subsistence harvests, 1982–2007. (A) Subsistence harvests increased with community size in the smaller communities, but the association was not significant. (B) When Kotzebue was included with the smaller communities, however, subsistence harvests were significantly associated with community size.
DISCUSSION The results from subsistence harvest surveys provided a unique perspective on the Northwest Alaska economy. In every community, subsistence harvests made a substantial contribution to the diet. Indeed, the differences between the smallest and largest communities were modest. In the 1994 survey in Deering, 148 people harvested an average of 672 lb each. In 2 surveys in Kotzebue, an average of 3,165 people harvested an average of 495 lb each. In the most recent surveys for 2007, every household surveyed reported using at least 1 kind of subsistence-caught food, while 95% (Kivalina) and 97% (Noatak) reported harvesting subsistence food.
The wide range of Kotzebue results illustrated the challenge of estimating subsistence harvests in a large, culturally and economically diverse regional center. Surveying every household would be inordinately expensive. Estimates from a simple random sample were very sensitive to the inclusion, or exclusion, of high harvesting households. Stratified random samples were a better approach, especially if most high harvesting households could be surveyed. But stratified samples required accurate prior knowledge of the population for stratification and estimation. These issues were not a problem in the 10 smaller Northwest communities, where researchers attempted to contact every household and samples typically included 90% of all occupied households.
Where food security data were available, 88% (Kivalina) and 82% (Noatak) of the surveyed households reported high or marginal levels of food security, compared with 89% in the United States as a whole. Subsistence harvests clearly contributed to that food security, and when food insecurities were reported they were twice as likely to be related to store-bought foods as to subsistence foods. Similar
0
50,000
100,000
150,000
200,000
250,000
300,000
0 100 200 300 400 500 600
Community Population
Estim
ated
Com
mun
ity H
arve
st (P
ound
s)
r = 0.404, p.=0.247r = 0.871, p.<0.001
0
500,000
1,000,000
1,500,000
2,000,000
2,500,000
0 1,000 2,000 3,000 4,000Community Population
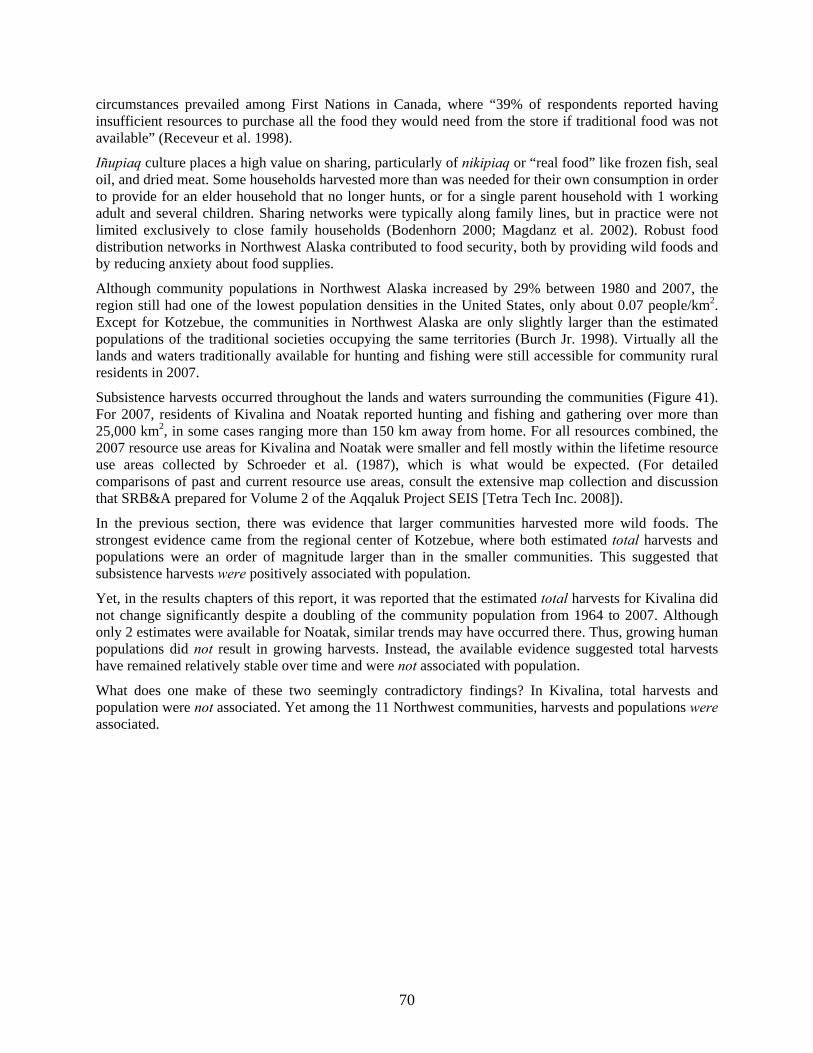
70
circumstances prevailed among First Nations in Canada, where “39% of respondents reported having insufficient resources to purchase all the food they would need from the store if traditional food was not available” (Receveur et al. 1998).
Iñupiaq culture places a high value on sharing, particularly of nikipiaq or “real food” like frozen fish, seal oil, and dried meat. Some households harvested more than was needed for their own consumption in order to provide for an elder household that no longer hunts, or for a single parent household with 1 working adult and several children. Sharing networks were typically along family lines, but in practice were not limited exclusively to close family households (Bodenhorn 2000; Magdanz et al. 2002). Robust food distribution networks in Northwest Alaska contributed to food security, both by providing wild foods and by reducing anxiety about food supplies.
Although community populations in Northwest Alaska increased by 29% between 1980 and 2007, the region still had one of the lowest population densities in the United States, only about 0.07 people/km2. Except for Kotzebue, the communities in Northwest Alaska are only slightly larger than the estimated populations of the traditional societies occupying the same territories (Burch Jr. 1998). Virtually all the lands and waters traditionally available for hunting and fishing were still accessible for community rural residents in 2007.
Subsistence harvests occurred throughout the lands and waters surrounding the communities (Figure 41). For 2007, residents of Kivalina and Noatak reported hunting and fishing and gathering over more than 25,000 km2, in some cases ranging more than 150 km away from home. For all resources combined, the 2007 resource use areas for Kivalina and Noatak were smaller and fell mostly within the lifetime resource use areas collected by Schroeder et al. (1987), which is what would be expected. (For detailed comparisons of past and current resource use areas, consult the extensive map collection and discussion that SRB&A prepared for Volume 2 of the Aqqaluk Project SEIS [Tetra Tech Inc. 2008]).
In the previous section, there was evidence that larger communities harvested more wild foods. The strongest evidence came from the regional center of Kotzebue, where both estimated total harvests and populations were an order of magnitude larger than in the smaller communities. This suggested that subsistence harvests were positively associated with population.
Yet, in the results chapters of this report, it was reported that the estimated total harvests for Kivalina did not change significantly despite a doubling of the community population from 1964 to 2007. Although only 2 estimates were available for Noatak, similar trends may have occurred there. Thus, growing human populations did not result in growing harvests. Instead, the available evidence suggested total harvests have remained relatively stable over time and were not associated with population.
What does one make of these two seemingly contradictory findings? In Kivalina, total harvests and population were not associated. Yet among the 11 Northwest communities, harvests and populations were associated.
71
Figure 41.–Search areas and harvest locations, Kivalina and Noatak, 2007.
72
A possible explanation for stable harvests in Kivalina and Noatak was that residents were harvesting key community resources at or near maximum sustained yield, and couldn’t harvest more. But that was not a plausible explanation. The only resource in Northwest Alaska consistently harvested at or near maximum sustained yield—harvested under Tier II regulations—was muskoxen. Moose and Dall sheep were somewhat limited by seasons and bag limits, though still liberal compared to roaded areas of the state. Harvestable surpluses of other subsistence resources in the region were well above amounts necessary for subsistence. Subsistence caribou hunting was open year round and the bag limits were 5 caribou per day (state) and 15 caribou per day (federal). Subsistence fishing was open for all species year round, with no bag limits.
Access may help explain both Kotzebue’s larger population and high harvests. Kotzebue is located on the coast near the termination of the 3 largest watersheds in the region: the Noatak River, the Kobuk River, and the Selawik River. In addition to the marine resources like bearded seals, Kotzebue residents can harvest salmon bound for either the Noatak or Kobuk, harvest sheefish that spawn in either the Kobuk or the Selawik, and can choose to hunt caribou in 3 different, major watersheds depending on the annual course of the caribou migration. Kotzebue’s prime location for subsistence harvesting may have favored its growth over the smaller communities in the region. Immigrants from the smaller Northwest communities to Kotzebue could continue their subsistence activities and work at wage labor in Kotzebue.
In the end, the most important explanation for the declines from the 1960s to the 1980s was obvious: the replacement of dog teams with snowmachines. Other factors may include: increased availability of store-bought foods, increased opportunity for wage work accompanied by less time for subsistence activities, changing food preferences, interannual variability of resource abundance (caribou in particular), and environmental change. So even though populations grew and average per capita harvests declined over time, that does not mean that growing populations caused declining per capita harvests. Most likely, declines in per capita harvests were the result of other factors which, coincidentally, matched the increases in community populations.
Those other factors, however, were still poorly understood. On the one hand, higher fuel prices made it more expensive to travel by boat or snowmachine, suggesting that subsistence harvests might decrease. On the other hand, higher fuel prices were factored into freight charges making imported foods more expensive, suggesting that subsistence harvests might increase. As yet, there are insufficient data to draw any conclusions, not only about the impacts of fuel costs and harvest, but about many facets of rural Alaska’s economy. Only recently has it become possible to compare subsistence harvests over time.
In short, the economy of remote rural Alaska is poorly described by existing economic indicators. As Goldsmith commented:
Even with consistency in definitions and improvements in the quality of data currently collected, the standard indicators would not provide a complete or balanced picture of the complexity of the economy. This is because the subsistence and informal sectors are nowhere captured by the indicators which are designed only to measure activity in the cash economy. Because these non-market activities consume a considerable amount of the time and effort of rural residents and contribute significantly to the economic well-being of the region, they should be included for several reasons. Without them the well-being of residents is undervalued, comparisons with urban areas are misleading, and economic development strategies are not grounded in reality. (Goldsmith 2007)
While they are not conventional economic indicators, data from comprehensive socioeconomic surveys can contribute to a better understanding of Alaska’s rural economy. At this writing, survey research was the only reliable source of long term, consistent information about households’ subsistence harvests, expenses, equipment ownership, and food distribution systems.
73
ACKNOWLEDGEMENTS This report was made possible by residents of Kivalina and Noatak, who graciously answered hundreds of survey questions, and by the survey crews who interviewed them. In Kivalina, the community survey crew included: Stanley Hawley, Hilda Knox, Richard Sage, Eleanor Swan, and Nelda Swan. In Noatak, the community survey crew included: Emma Adams, Roger Adams, Lola Arey, Ben Arnold, Cheryl Booth, Hannah Onalik, Amanda Porter, and Chris Shy. The community crews were supported by Amy Russell and Davin Holen of the ADF&G Division of Subsistence, and by Paul Lawrence, Raena Schraer, Stephanie Schively, and Liz Sears of Stephen R. Braund and Associates. To all our respondents and surveyors, we appreciate your patience and good humor during surveys that lasted, on average, more than an hour.
In Kivalina, the project would not have been possible without the support of the City of Kivalina administrator Janet Mitchell, Native Village of Kivalina administrator Coleen Swan, Northwest Arctic Borough’s Kivalina project coordinator Enoch Adams, and Kivalina High School principal Pauline Harvey. In Noatak, the project would not have been possible without the support of Native Village of Noatak administrator Carol Wesley, and was greatly facilitated by Noatak high school teachers Stan VanAmburg and Suzette Carol.
The mapping portion of the project was spearheaded by Stephen Braund. ADF&G’s Davin Holen developed the data collection maps, while Raena Schraer entered the map data into a GIS database and developed the report and appendix maps. The authors are indebted to each of them for the excellent maps from the project.
Mark Nord, who coordinates national food security research for the U.S. Department of Agricultural, commented on our food security module, and responded promptly to our food security inquiries from the field. His generous assistance over several projects has been invaluable. The food security module also benefited from comments by cooperating agency representatives during the Red Dog Supplemental Environmental Impact Statement (SEIS) weekly meetings, especially Rosie Barr at NANA Regional Corporation, Dr. Aaron Wernham with the Alaska Inter-Tribal Council, and Robert Tsigonis and Rick Fredericksen with the Alaska Department of Natural Resources. Barbara Atoruk, originally from Shungnak and now with U.S. Fish and Wildlife Service in Anchorage, reviewed the Kobuk and Selawik Iñupiaq species names.
The authors appreciate support from Patty McGrath, Red Dog Mine SEIS project manager for the U.S. Environmental Protection Agency in Seattle, and Gene Weglinski, Senior Environmental Scientist for TetraTech Inc. in Denver.
Jackie Hill, Hazel Smith, and Attamuk Shiedt of Maniilaq Association supported this project from beginning to end. We especially appreciate their facilitation of community approvals, logistics, and reviews. Our discussions with them, and with Willie Goodwin of the National Park Service, about the need for accessible and comprehensive information about subsistence activities are largely responsible for the comprehensive format of this report.
Finally, we acknowledge the unflagging support of our coworkers at ADF&G. Pam Amundson, Ana Lewis, and James Simon handled the administrative details of the project. Lisa Olson and Garrett Zimpelman edited and formatted the draft and final reports.
74
REFERENCES CITED ADF&G (Alaska Department of Fish and Game). 1999. ADF&G writer's guide. Second edition. Alaska
Department of Fish and Game, Juneau. ADLWD (Alaska Department of Labor and Workforce Development). 2008. Research and analysis homepage:
population. State of Alaska Department of Labor and Workforce Development, Juneau. http://almis.labor.state.ak.us/?PAGEID=67&SUBID=115, February 21.
ADLWD (Alaska Department of Labor and Workforce Development). 2009. Research and Analysis Section Workforce Info home page; demographic profiles. Alaska Department of Labor and Workforce Development, Juneau. http://laborstats.alaska.gov/?PAGEID=67&SUBID=269
Armstrong, R.H. 1995. Guide to the birds of Alaska, 4th Edition. Alaska Northwest Books, Anchorage. Ballew, C., K.J. Hamrick, and E.D. Nobmann. [2004]. Final report on the Alaska traditional diet survey. Alaska
Native Epidemiology Center and the Alaska Native Health Board, Anchorage. Bellrose, F.C. 1976. Ducks, geese & swans of North America: a completely new and expanded version of the
classic work by F. H. Kortright. Stackpole Books, Harrisburg, PA. Bickel, G., M. Nord, C. Price, W. Hamilton, and J. Cook. 2000. Guide to measuring household food security. U.S.
Department of Agriculture, Food and Nutrition Service, Office of Analysis, Nutrition, and Evaluation, Alexandria, VA.
Bodenhorn, B. 2000. It's good to know who your relatives are but we were taught to share with everybody: shares and sharing among Inupiaq households. The Social Economy of Sharing: Resource Allocation and Modern Hunter-Gatherers, Senri Ethnological Studies 53:27-60.
Brennan, E.L., F.J. Bue, J. Menard, and T. Kohler. 2002. Annual management report, 2002, Norton Sound - Port Clarence - Kotzebue. Alaska Department of Fish and Game Division of Commercial Fisheries Regional Information Report No. 3A02-02, Anchorage.
http://www.sf.adfg.state.ak.us/FedAidPDFs/RIR.3A.2002.02.pdf Burch Jr., E.S. 1975. Eskimo kinsmen: changing family relationships in Northwest Alaska. West Publishing Co.,
St. Paul, MN. Burch Jr., E.S. 1985. Subsistence production in Kivalina, Alaska: a twenty-year perspective. Alaska Department of
Fish and Game Division of Subsistence Technical Paper No. 128, Juneau. http://www.subsistence.adfg.state.ak.us/TechPap/tp128.pdf Burch Jr., E.S. 1998. The Iñupiaq Eskimo nations of Northwest Alaska. University of Alaska Press, Fairbanks. Coates, J. 2004. Experience and expression of food insecurity across cultures: practical implications for valid
measurement. Academy for Educational Development, Food and Nutrition Technical Assistance Project, Washington, D.C. http://www.fantaproject.org
Coates, J., E.A. Frongillo, B.L. Rogers, P. Webb, P.E. Wilde, and R. Houser. 2006. Commonalities in the experience of household food insecurity across cultures: what are measures missing? Journal of Nutrition Supplement(136):1438S-1448S.
Cochran, W.G. 1977. Sampling techniques. 3rd edition. John Wiley & Sons, New York. Fall, J.A. and C.J. Utermohle, editors. 1995. An investigation of the sociocultural consequences of outer
continental shelf development in Alaska. Volume 5: Alaska Peninsula and Arctic. Volume 5 MMS 95-014. Alaska Department of Fish and Game Division of Subsistence and the U.S. Department of the Interior, Minerals Management Service, Alaska Outer Continental Shelf Region, Anchorage.
Foote, D.C. and H.A. Williamson. 1966. A human geographical study. Pages 1041–1111 in N. Wilimovsky and J. Wolfe, editors. Environment of Cape Thompson Region, Alaska. U.S. Atomic Energy Commission, Washington, D.C.
Fried, N. and D. Robinson. 2008. Alaska's economy since 2000; the top 10 developments. Alaska Economic Trends 28(4):4–13.
http://www.doleta.gov/Programs/2007ReportsAndPlans/Economic_Analysis_Reports/AK-2.pdf Frongillo, E.A. and S. Nanama. 2007. Development and validation of an experience-based measure of household
food insecurity within and across seasons in northern Burkina Faso. Journal of Nutrition 136(Supplement):1409S-1419S.
Georgette, S. 2000. Subsistence use of birds in the Northwest Arctic Region, Alaska. Alaska Department of Fish and Game Division of Subsistence Technical Paper No. 260, Juneau.
http://www.subsistence.adfg.state.ak.us/techpap/tp260.pdf
75
References Cited, continued Georgette, S. and H. Loon. 1993. Subsistence use of fish and wildlife in Kotzebue, a Northwest Alaska regional
center. Alaska Department of Fish and Game Division of Subsistence, Technical Paper No. 167, Juneau. http://www.subsistence.adfg.state.ak.us/TechPap/tp167.pdf
Georgette, S. and A. Shiedt. 2005. Whitefish: traditional ecological knowledge and subsistence fishing in the Kotzebue Sound region, Alaska. Alaska Department of Fish and Game Division of Subsistence and Maniilaq Association, Technical Paper No. 290, Juneau.
http://www.subsistence.adfg.state.ak.us/techpap/tp290.pdf Gilbertsen, N. and D. Robinson. 2003. Natural resources: mining and timber. Alaska Economic Trends 23(12):3–
14. http://www.labor.state.ak.us/trends/dec03.pdf Goldsmith, S. 2007. The remote rural economy of Alaska. University of Alaska Anchorage Institute of Social and
Economic Research, Anchorage. Goldsmith, S. 2008. Structural analysis of the Alaska economy: what are the drivers? University of Alaska
Anchorage Institute of Social and Economic Research, Anchorage. http://www.iser.uaa.alaska.edu/Publications/structureAKeconomy.pdf Grebmeier, J.M., J.E. Overland, S.E. Moore, E.V. Farley, E.C. Carmack, L.W. Cooper, K.E. Frey, J.H. Helle, F.A.
McLaughlin, and S.L. McNutt. 2006. A major ecosystem shift in the Northern Bering Sea. Science 311:1461–1464.
Heller, C.A. and E.M. Scott. 1967. The Alaska dietary survey, 1956-1961. U.S. Department of Health, Education, and Welfare Nutrition and Metabolic Disease Section, Arctic Health Research Center, Anchorage.
Hinzman, L.D., N.D. Bettez, W.R. Bolton, F.S. Chapin, M.B. Dyurgerov, C.L. Fastie, B. Griffith, R.D. Hollister, A. Hope, H.P. Huntington, A.M. Jensen, G.J. Jia, T. Jorgenson, D. Kane, D.R. Klein, G. Kofinas, A.H. Lynch, A.H. Lloyd, A.D. McGuire, F.E. Nelson, W.C. Oechel, T.E. Osterkamp, C.H. Racine, V.E. Romanovsky, R.S. Stone, D.S. Stow, M. Sturm, C.E. Tweedie, G.L. Vourlitis, M.D. Walker, D.A. Walker, P.J. Webber, J.M. Welker, K.S. Winker, and K. Yoshikawa. 2005. Evidence and implications of recent climate change in Northern Alaska and other Arctic regions. Climatic Change 72(3):251–298.
http://www.springerlink.com/content/k0210u2j37r43060/ Hultèn, E. 1968. Flora of Alaska and neighboring territories: a manual of the vascular plants. Standford University
Press, Stanford, CA. Johnson, J.S., E.D. Nobmann, E. Asay, and A.P. Lanier. 2009. Dietary intake of Alaska Native people in two
regions and implications for health: the Alaska Native dietary and subsistence food assessment project. International Journal of Circumpolar Health 68(2):109–122.
Jones, A. 1983. Nauriat niġiñaqtuat = plants that we eat. A. Jones, Alaska. Jones, A. 2006. Iqaluich niġiñaqtuat = fish that we eat. Final edition. U.S. Fish and Wildlife Service Office of
Subsistence Management Fisheries Resource Monitoring Program, Anchorage. Kessel, B. 1989. Birds of the Seward Peninsula, Alaska: their biogeography, seasonality, and natural history.
University of Alaska Press, Fairbanks. Kruse, J., B. Poppel, L. Abryutina, G. Duhaime, S. Martin, M. Poppel, M. Kruse, E. Ward, P. Cochran, and V.
Hanna. 2008. Survey of living conditions in the Arctic (SLiCA). Pages 107–134 in V. Møller, D. Huschka, and A.C. Michalos, editors. Barometers of quality of life around the globe: how are we doing? Springer Science+Business Media B.V., Berlin, Germany.
Langdon, S. and R. Worl. 1981. Distribution and exchange of subsistence resources in Alaska. Prepared for the U.S. Department of Fish and Game. University of Alaska Arctic Environmental Information and Data Center and the Alaska Department of Fish and Game Division of Subsistence, Technical Paper No. 55, Anchorage. http://www.subsistence.adfg.state.ak.us/techpap/tp055.pdf
Lentfer, J.W. 1988. Selected marine mammals of Alaska: species accounts with research and management recommendations. Marine Mammal Commission, Washington, D.C. and Springfield, VA.
Magdanz, J.S., S. Georgette, C. Pungowiyi, H. Smith, and E. Shiedt. 2010. Exploring approaches to sustainable fisheries harvest assessment in Northwest Alaska. Alaska Department of Fish and Game Division of Subsistence, Technical Paper No. 341, Kotzebue.
http://www.subsistence.adfg.state.ak.us/TechPap/TP%20341.pdf
76
References Cited, continued Magdanz, J.S., C.J. Utermohle, and R.J. Wolfe. 2002. The production and distribution of wild food in Wales and
Deering, Alaska. Funded by Western Arctic National Parklands, National Park Service through the University of Washington Cooperative Park Studies Unit. Alaska Department of Fish and Game Division of Subsistence, Technical Paper No. 259, Juneau.
http://www.subsistence.adfg.state.ak.us/techpap/tp259.pdf Magdanz, J.S., R.J. Walker, and R.R. Paciorek. 2004. The subsistence harvests of wild foods by residents of
Shungnak, Alaska, 2002 Alaska Department of Fish and Game Division of Subsistence Technical Paper No. 279, Juneau. http://www.subsistence.adfg.state.ak.us/TechPap/tp279.pdf
McGrath-Hanna, N.K., D.M. Greene, R.J. Tavernier, and A. Bult-Ito. 2003. Diet and mental health in the Arctic: is diet an important risk factor for mental health in circulpolar peoples? - A review. International Journal of Circumpolar Health 62(3):228–241.
Mecklenburg, C.W., T.A. Mecklenburg, and L.K. Thorsteinson. 2002. Fishes of Alaska. American Fisheries Society, Bethesda, MD.
Melgar-Quinonez, H.R., A.C. Zubieta, B. MkNelly, A. Nteziyaremye, M.F.D. Gerardo, and C. Dunford. 2006. Household food insecurity and food expenditure in Bolivia, Burkina Faso, and the Philippines. Journal of Nutrition 136(Supplement):1431S–1437S.
Morrow, J.E. 1980. The freshwater fishes of Alaska. Alaska Northwest Publishing Company, Anchorage. Nelson, J.S., E.J. Crossman, H. Espinosa-Pérez, L.T. Findley, C.R. Gilbert, R.N. Lea, and J.D. Williams. 2004.
Common and scientific names of fishes from the United States, Canada, and Mexico, Sixth Edition. American Fisheries Society Special Publication 29, Bethesda, MD.
Nord, M., M. Andrews, and S. Carlson. 2008. Household food security in the United States, 2007. U.S. Department of Agriculture Economic Research Service, ERR-66, Washington, D.C.
http://www.ers.usda.gov/Publications/ERR66/ERR66.pdf Overland, J.E. and P.J. Stabeno. 2004. Is the climate of the Bering Sea warming and affecting the ecosystem? Eos
85(33):309–316. Patterson, A. 1974. Subsistence harvests in five native regions: for the Joint Federal-State Land Use Planning
Commission for Alaska. Resource Planning Team, Anchorage. Peréz-Escamilla, R., A.M. Segall-Corrêa, L.K. Maranha, M.d.F.A. Sampaio, L. Marín-León, and G. Panigassi.
2004. An adapted version of the U.S. Department of Agriculture food insecurity module is a valid tool for assessing household food insecurity in Campinas, Brazil. Journal of Nutrition 134:1923–1928.
Raleigh, R.F. 1958. Western Alaska salmon investigations operation report - 1957: reconnaissance of salmon fisheries between Cape Newenham and Point Hope, Alaska, 1957. Department of the Interior, U.S. Fish and Wildlife Service, Bureau of Commercial Fisheries, Alaska Region, Juneau.
Receveur, O., N. Kassi, H.M. Chan, P.R. Berti, and H.V. Kuhnlein. 1998. Yukon first nations' assessment of dietary benefit/risk. McGill University, Centre for Indigenous Peoples' Nutrition and Environment, Ste-Anne-de-Bellvue, Quebec.
Richmond, C.A.M. and N.A. Ross. 2008. The determinants of First Nation and Inuit health: a critical population health approach. Health & Place 15:403–411.
Saario, D.J. and B. Kessel. 1966. Human ecological investigations at Kivalina. Pages 969–1039 in N.J. Wilimovsky, and J.N. Wolfe, editors. Environment of the Cape Thompson region, Alaska. U.S. Atomic Energy Commission Division of Technical Information, Oak Ridge, TN.
Schofield, J.J. 1989. Discovering wild plants: Alaska, Western Canada, the Northwest. Alaska Northwest Books, Anchorage.
Schroeder, R., D.B. Andersen, and G. Hildreth. 1987. Subsistence use area mapping in ten Kotzebue Sound communities. Maniilaq Association and Alaska Department of Fish and Game Division of Subsistence, Technical Paper No. 130, Juneau and Kotzebue. http://www.subsistence.adfg.state.ak.us/techpap/tp130.pdf
Swindale, A. and P. Bilinsky. 2006. Development of a universally applicable household food insecurity measurement tool: process, current status, and outstanding issues. Journal of Nutrition Supplement(136):1449S–1452S.
Tetra Tech Inc. 2008. Red Dog mine extension - Aqqaluk Project draft supplemental environmental impact statement submitted to U.S. Environmental Protection Agency. Tetra Tech, Inc., Anchorage. http://www.reddogseis.com/DraftSEIS.asp
Trotter II., R.T. and J.J. Schensul. 1998. Methods in applied anthropology. Pages 691–735 in H.R. Bernard, editor. Handbook of methods in cultural anthropology. AltaMira Press, Walnut Creek, CA.
77
References Cited, continued U.S. Census Bureau. 2001. Profiles of general demographic characteristics, Alaska: 2000. U.S. Department of
Commerce Washington, D.C. Webb, P., J. Coates, E.A. Frongillo, B.L. Rogers, A. Swindale, and P. Bilinsky. 2006. Measuring household food
insecurity: why it's so important and yet so difficult to do. Journal of Nutrition 136(Supplement):1404S–1408S.
Whiting, A. 2006. Native Village of Kotzebue harvest survey program 2002 - 2003 - 2004: results of three consecutive years cooperating with Qikiqtagrugmiut to understand their annual catch of selected fish and wildlife. The Native Village of Kotzebue, Kotzebue, Alaska.
Wolfe, R.J., C.L. Scott, W.E. Simeone, C.J. Utermohle, M.C. Pete, and National Science Foundation. n.d. [2009]. The "super-household" in Alaska Native subsistence economies. Draft manuscript.
Wunderlich, G.S., and J.L. Norwood, editors. 2006. Food insecurity and hunger in the United States: an assessment of the measure. Panel to review the U.S. Department of Agriculture's measurement of food insecurity and hunger. Committee on National Statistics, Division of Behavioral and Social Sciences and Education, the National Academies Press, Washington, D.C.
78
APPENDIX A: LIST OF SPECIES HARVESTED IN NORTHWEST ALASKA FOR SUBSISTENCE USES
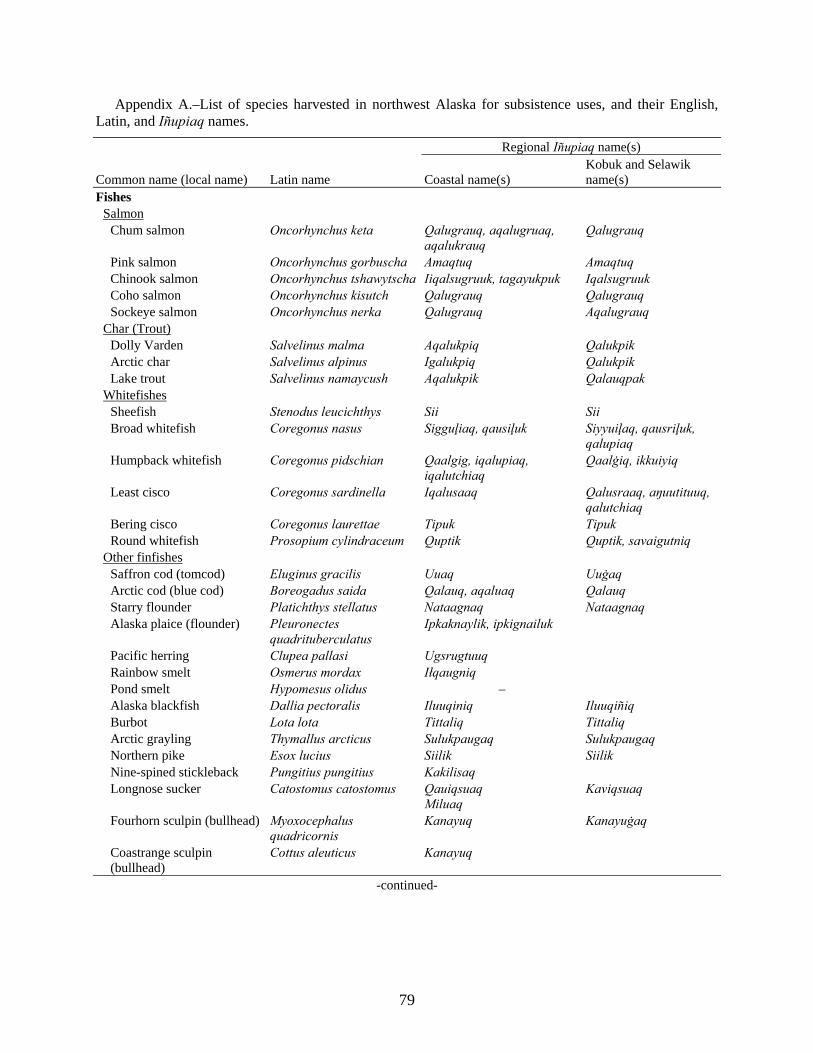
79
Appendix A.–List of species harvested in northwest Alaska for subsistence uses, and their English, Latin, and Iñupiaq names.
Common name (local name) Latin name
Regional Iñupiaq name(s)
Coastal name(s) Kobuk and Selawik name(s)
Fishes Salmon Chum salmon Oncorhynchus keta Qalugrauq, aqalugruaq,
aqalukrauq Qalugrauq
Pink salmon Oncorhynchus gorbuscha Amaqtuq Amaqtuq Chinook salmon Oncorhynchus tshawytscha Iiqalsugruuk, tagayukpuk Iqalsugruuk Coho salmon Oncorhynchus kisutch Qalugrauq Qalugrauq Sockeye salmon Oncorhynchus nerka Qalugrauq Aqalugrauq Char (Trout) Dolly Varden Salvelinus malma Aqalukpiq Qalukpik Arctic char Salvelinus alpinus Igalukpiq Qalukpik Lake trout Salvelinus namaycush Aqalukpik Qalauqpak Whitefishes Sheefish Stenodus leucichthys Sii Sii Broad whitefish Coregonus nasus Sigguļiaq, qausiļuk Siyyuiļaq, qausriļuk,
qalupiaq Humpback whitefish Coregonus pidschian Qaalgig, iqalupiaq,
iqalutchiaq Qaalġiq, ikkuiyiq
Least cisco Coregonus sardinella Iqalusaaq Qalusraaq, aŋuutituuq, qalutchiaq
Bering cisco Coregonus laurettae Tipuk Tipuk Round whitefish Prosopium cylindraceum Quptik Quptik, savaigutniq Other finfishes Saffron cod (tomcod) Eluginus gracilis Uuaq Uuġaq Arctic cod (blue cod) Boreogadus saida Qalauq, aqaluaq Qalauq Starry flounder Platichthys stellatus Nataagnaq Nataagnaq Alaska plaice (flounder) Pleuronectes
quadrituberculatus Ipkaknaylik, ipkignailuk
Pacific herring Clupea pallasi Ugsrugtuuq Rainbow smelt Osmerus mordax Iłqaugniq Pond smelt Hypomesus olidus – Alaska blackfish Dallia pectoralis Iluuqiniq Iluuqiñiq Burbot Lota lota Tittaliq Tittaliq Arctic grayling Thymallus arcticus Sulukpaugaq Sulukpaugaq Northern pike Esox lucius Siilik Siilik Nine-spined stickleback Pungitius pungitius Kakilisaq Longnose sucker Catostomus catostomus Qauiqsuaq
Miluaq Kaviqsuaq
Fourhorn sculpin (bullhead) Myoxocephalus quadricornis
Kanayuq Kanayuġaq
Coastrange sculpin (bullhead)
Cottus aleuticus Kanayuq
-continued-
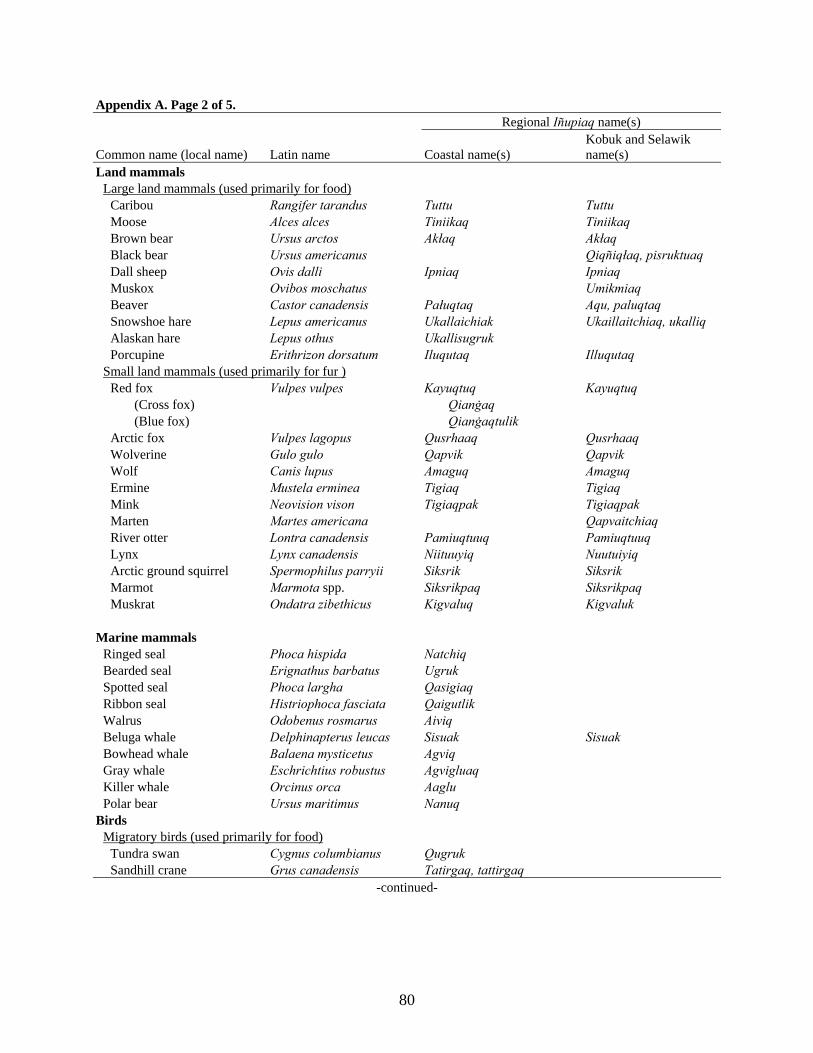
80
Appendix A. Page 2 of 5.
Common name (local name) Latin name
Regional Iñupiaq name(s)
Coastal name(s) Kobuk and Selawik name(s)
Land mammals Large land mammals (used primarily for food) Caribou Rangifer tarandus Tuttu Tuttu Moose Alces alces Tiniikaq Tiniikaq Brown bear Ursus arctos Akłaq Akłaq Black bear Ursus americanus Qiqñiqłaq, pisruktuaq Dall sheep Ovis dalli Ipniaq Ipniaq Muskox Ovibos moschatus Umikmiaq Beaver Castor canadensis Pałuqtaq Aqu, paluqtaq Snowshoe hare Lepus americanus Ukallaichiak Ukaillaitchiaq, ukalliq Alaskan hare Lepus othus Ukallisugruk Porcupine Erithrizon dorsatum Iluqutaq Illuqutaq Small land mammals (used primarily for fur ) Red fox Vulpes vulpes Kayuqtuq Kayuqtuq (Cross fox) Qianġaq (Blue fox) Qianġaqtulik Arctic fox Vulpes lagopus Qusrhaaq Qusrhaaq Wolverine Gulo gulo Qapvik Qapvik Wolf Canis lupus Amaguq Amaguq Ermine Mustela erminea Tigiaq Tigiaq Mink Neovision vison Tigiaqpak Tigiaqpak Marten Martes americana Qapvaitchiaq River otter Lontra canadensis Pamiuqtuuq Pamiuqtuuq Lynx Lynx canadensis Niituuyiq Nuutuiyiq Arctic ground squirrel Spermophilus parryii Siksrik Siksrik Marmot Marmota spp. Siksrikpaq Siksrikpaq Muskrat Ondatra zibethicus Kigvaluq Kigvaluk Marine mammals Ringed seal Phoca hispida Natchiq Bearded seal Erignathus barbatus Ugruk Spotted seal Phoca largha Qasigiaq Ribbon seal Histriophoca fasciata Qaigutlik Walrus Odobenus rosmarus Aiviq Beluga whale Delphinapterus leucas Sisuak Sisuak Bowhead whale Balaena mysticetus Agviq Gray whale Eschrichtius robustus Agvigluaq Killer whale Orcinus orca Aaglu Polar bear Ursus maritimus Nanuq Birds Migratory birds (used primarily for food) Tundra swan Cygnus columbianus Qugruk Sandhill crane Grus canadensis Tatirgaq, tattirgaq
-continued-
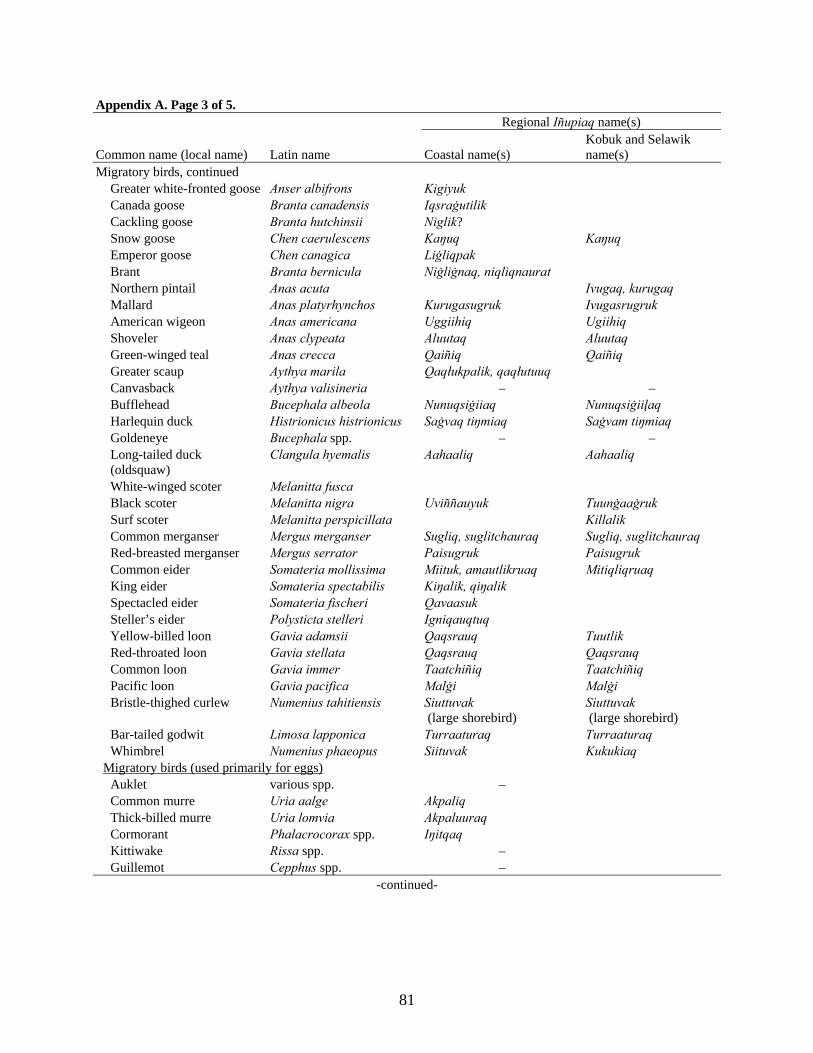
81
Appendix A. Page 3 of 5.
Common name (local name) Latin name
Regional Iñupiaq name(s)
Coastal name(s) Kobuk and Selawik name(s)
Migratory birds, continued Greater white-fronted goose Anser albifrons Kigiyuk Canada goose Branta canadensis Iqsraġutilik Cackling goose Branta hutchinsii Niglik? Snow goose Chen caerulescens Kaŋuq Kaŋuq Emperor goose Chen canagica Liġliqpak Brant Branta bernicula Niġliġnaq, niqliqnaurat Northern pintail Anas acuta Ivugaq, kurugaq Mallard Anas platyrhynchos Kurugasugruk Ivugasrugruk American wigeon Anas americana Uggiihiq Ugiihiq Shoveler Anas clypeata Aluutaq Aluutaq Green-winged teal Anas crecca Qaiñiq Qaiñiq Greater scaup Aythya marila Qaqłukpalik, qaqłutuuq Canvasback Aythya valisineria – – Bufflehead Bucephala albeola Nunuqsiġiiaq Nunuqsiġiiļaq Harlequin duck Histrionicus histrionicus Saġvaq tiŋmiaq Saġvam tiŋmiaq Goldeneye Bucephala spp. – – Long-tailed duck
(oldsquaw) Clangula hyemalis Aahaaliq Aahaaliq
White-winged scoter Melanitta fusca Black scoter Melanitta nigra Uviññauyuk Tuunġaaġruk Surf scoter Melanitta perspicillata Killalik Common merganser Mergus merganser Sugliq, suglitchauraq Sugliq, suglitchauraq Red-breasted merganser Mergus serrator Paisugruk Paisugruk Common eider Somateria mollissima Miituk, amautlikruaq Mitiqliqruaq King eider Somateria spectabilis Kiŋalik, qiŋalik Spectacled eider Somateria fischeri Qavaasuk Steller’s eider Polysticta stelleri Igniqauqtuq Yellow-billed loon Gavia adamsii Qaqsrauq Tuutlik Red-throated loon Gavia stellata Qaqsrauq Qaqsrauq Common loon Gavia immer Taatchiñiq Taatchiñiq Pacific loon Gavia pacifica Malġi Malġi Bristle-thighed curlew Numenius tahitiensis Siuttuvak
(large shorebird) Siuttuvak (large shorebird)
Bar-tailed godwit Limosa lapponica Turraaturaq Turraaturaq Whimbrel Numenius phaeopus Siituvak Kukukiaq Migratory birds (used primarily for eggs) Auklet various spp. – Common murre Uria aalge Akpaliq Thick-billed murre Uria lomvia Akpaluuraq Cormorant Phalacrocorax spp. Iŋitqaq Kittiwake Rissa spp. – Guillemot Cepphus spp. –
-continued-
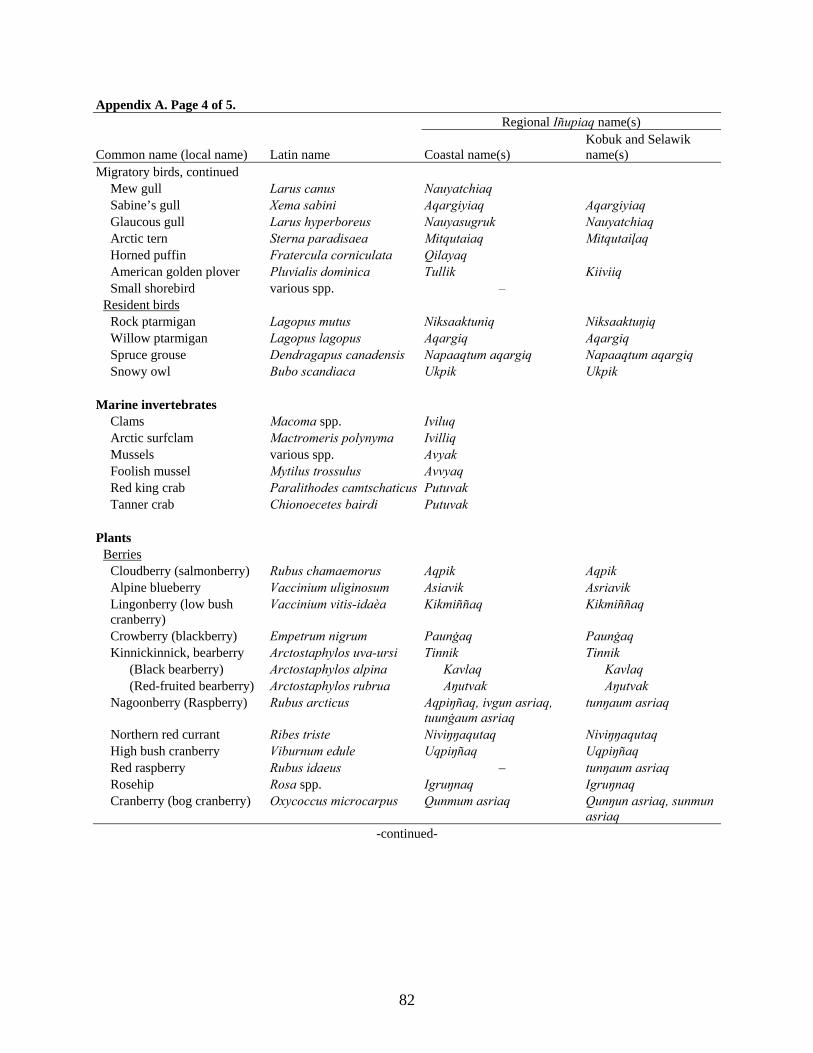
82
Appendix A. Page 4 of 5.
Common name (local name) Latin name
Regional Iñupiaq name(s)
Coastal name(s) Kobuk and Selawik name(s)
Migratory birds, continued Mew gull Larus canus Nauyatchiaq Sabine’s gull Xema sabini Aqargiyiaq Aqargiyiaq Glaucous gull Larus hyperboreus Nauyasugruk Nauyatchiaq Arctic tern Sterna paradisaea Mitqutaiaq Mitqutaiļaq Horned puffin Fratercula corniculata Qilayaq American golden plover Pluvialis dominica Tullik Kiiviiq Small shorebird various spp. – Resident birds Rock ptarmigan Lagopus mutus Niksaaktuniq Niksaaktuŋiq Willow ptarmigan Lagopus lagopus Aqargiq Aqargiq Spruce grouse Dendragapus canadensis Napaaqtum aqargiq Napaaqtum aqargiq Snowy owl Bubo scandiaca Ukpik Ukpik Marine invertebrates Clams Macoma spp. Iviluq Arctic surfclam Mactromeris polynyma Ivilliq Mussels various spp. Avyak Foolish mussel Mytilus trossulus Avvyaq Red king crab Paralithodes camtschaticus Putuvak Tanner crab Chionoecetes bairdi Putuvak Plants Berries Cloudberry (salmonberry) Rubus chamaemorus Aqpik Aqpik Alpine blueberry Vaccinium uliginosum Asiavik Asriavik Lingonberry (low bush
cranberry) Vaccinium vitis-idaèa Kikmiññaq Kikmiññaq
Crowberry (blackberry) Empetrum nigrum Paunġaq Paunġaq Kinnickinnick, bearberry Arctostaphylos uva-ursi Tinnik Tinnik (Black bearberry) Arctostaphylos alpina Kavlaq Kavlaq (Red-fruited bearberry) Arctostaphylos rubrua Aŋutvak Aŋutvak Nagoonberry (Raspberry) Rubus arcticus Aqpiŋñaq, ivgun asriaq,
tuunġaum asriaq tunŋaum asriaq
Northern red currant Ribes triste Niviŋŋaqutaq Niviŋŋaqutaq High bush cranberry Viburnum edule Uqpiŋñaq Uqpiŋñaq Red raspberry Rubus idaeus – tunŋaum asriaq Rosehip Rosa spp. Igruŋnaq Igruŋnaq Cranberry (bog cranberry) Oxycoccus microcarpus Qunmum asriaq Qunŋun asriaq, sunmun
asriaq -continued-
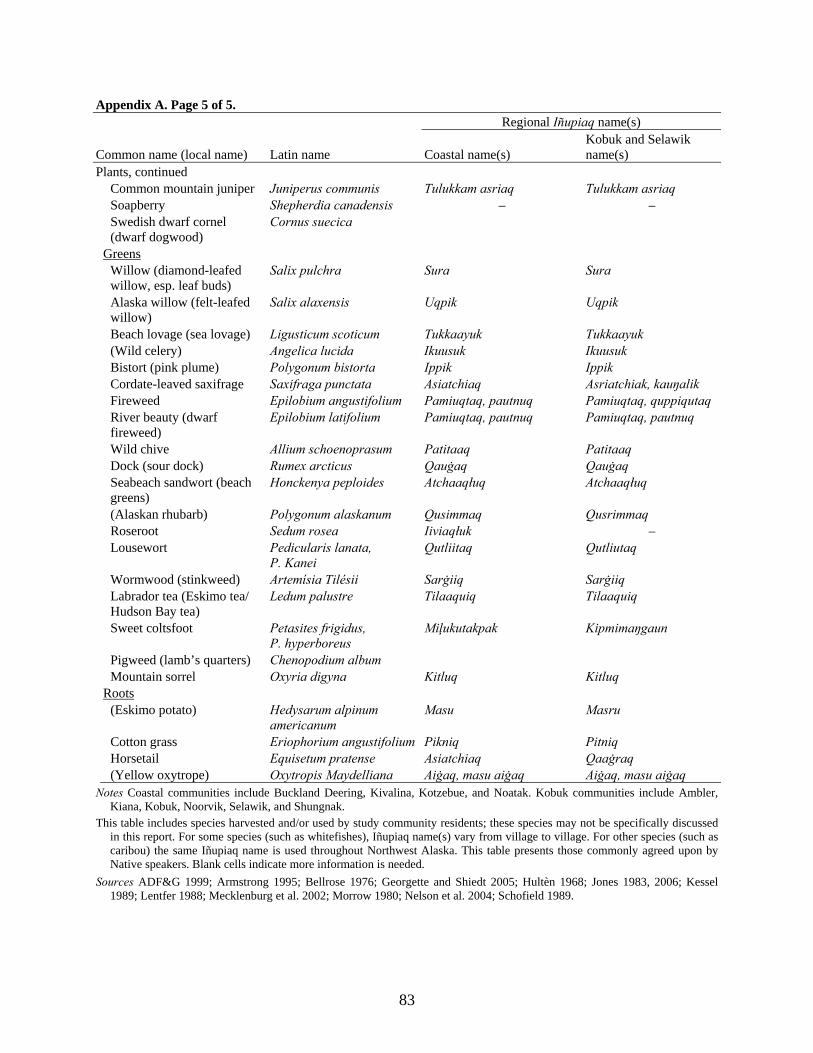
83
Appendix A. Page 5 of 5.
Common name (local name) Latin name
Regional Iñupiaq name(s)
Coastal name(s) Kobuk and Selawik name(s)
Plants, continued Common mountain juniper Juniperus communis Tulukkam asriaq Tulukkam asriaq Soapberry Shepherdia canadensis – – Swedish dwarf cornel
(dwarf dogwood) Cornus suecica
Greens Willow (diamond-leafed
willow, esp. leaf buds) Salix pulchra Sura Sura
Alaska willow (felt-leafed willow)
Salix alaxensis Uqpik Uqpik
Beach lovage (sea lovage) Ligusticum scoticum Tukkaayuk Tukkaayuk (Wild celery) Angelica lucida Ikuusuk Ikuusuk Bistort (pink plume) Polygonum bistorta Ippik Ippik Cordate-leaved saxifrage Saxifraga punctata Asiatchiaq Asriatchiak, kauŋalik Fireweed Epilobium angustifolium Pamiuqtaq, pautnuq Pamiuqtaq, quppiqutaq River beauty (dwarf
fireweed) Epilobium latifolium Pamiuqtaq, pautnuq Pamiuqtaq, pautnuq
Wild chive Allium schoenoprasum Patitaaq Patitaaq Dock (sour dock) Rumex arcticus Qauġaq Qauġaq Seabeach sandwort (beach
greens) Honckenya peploides Atchaaqłuq Atchaaqłuq
(Alaskan rhubarb) Polygonum alaskanum Qusimmaq Qusrimmaq Roseroot Sedum rosea Iiviaqłuk – Lousewort Pedicularis lanata,
P. Kanei Qutliitaq Qutliutaq
Wormwood (stinkweed) Artemísia Tilésii Sarġiiq Sarġiiq Labrador tea (Eskimo tea/
Hudson Bay tea) Ledum palustre Tilaaquiq Tilaaquiq
Sweet coltsfoot Petasites frigidus, P. hyperboreus
Miļukutakpak Kipmimaŋgaun
Pigweed (lamb’s quarters) Chenopodium album Mountain sorrel Oxyria digyna Kitluq Kitluq Roots (Eskimo potato) Hedysarum alpinum
americanum Masu Masru
Cotton grass Eriophorium angustifolium Pikniq Pitniq Horsetail Equisetum pratense Asiatchiaq Qaaġraq (Yellow oxytrope) Oxytropis Maydelliana Aiġaq, masu aiġaq Aiġaq, masu aiġaq Notes Coastal communities include Buckland Deering, Kivalina, Kotzebue, and Noatak. Kobuk communities include Ambler,
Kiana, Kobuk, Noorvik, Selawik, and Shungnak. This table includes species harvested and/or used by study community residents; these species may not be specifically discussed
in this report. For some species (such as whitefishes), Iñupiaq name(s) vary from village to village. For other species (such as caribou) the same Iñupiaq name is used throughout Northwest Alaska. This table presents those commonly agreed upon by Native speakers. Blank cells indicate more information is needed.
Sources ADF&G 1999; Armstrong 1995; Bellrose 1976; Georgette and Shiedt 2005; Hultèn 1968; Jones 1983, 2006; Kessel 1989; Lentfer 1988; Mecklenburg et al. 2002; Morrow 1980; Nelson et al. 2004; Schofield 1989.

84
APPENDIX B: FACTORS USED TO CONVERT INDIVIDUAL RESOURCES AND GALLONS TO POUNDS EDIBLE WEIGHT
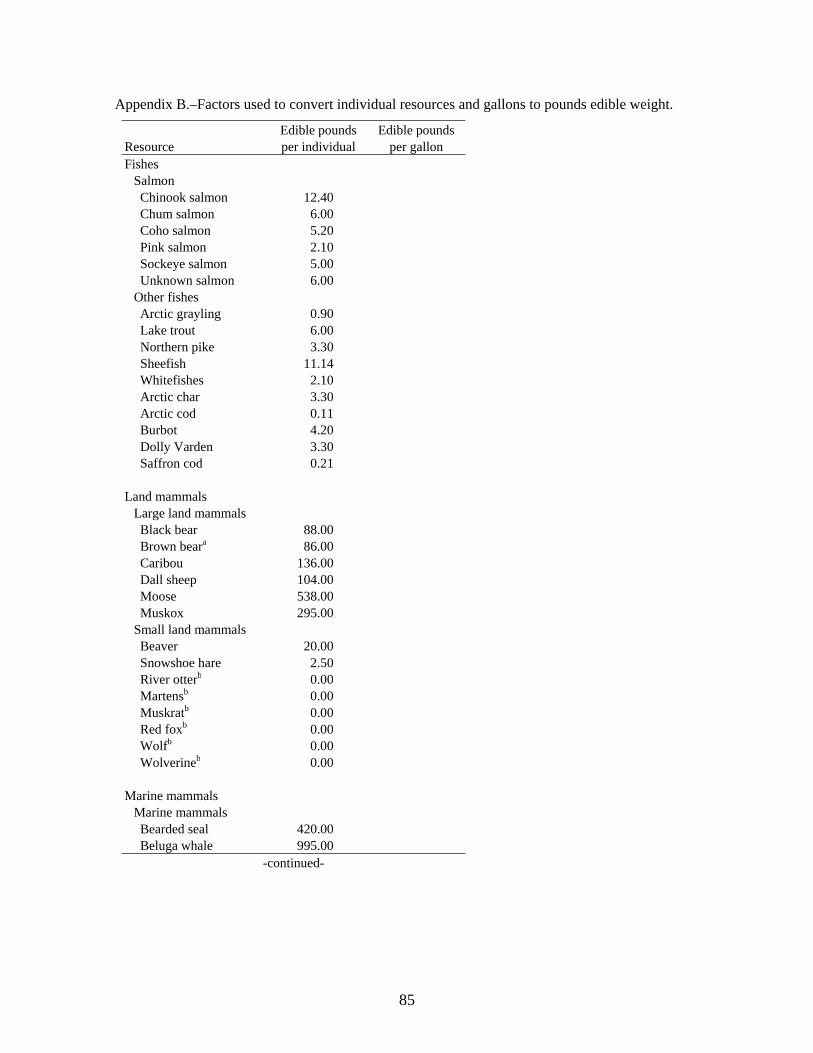
85
Appendix B.–Factors used to convert individual resources and gallons to pounds edible weight.
Resource Edible poundsper individual
Edible pounds per gallon
Fishes Salmon Chinook salmon 12.40 Chum salmon 6.00 Coho salmon 5.20 Pink salmon 2.10 Sockeye salmon 5.00 Unknown salmon 6.00 Other fishes Arctic grayling 0.90 Lake trout 6.00 Northern pike 3.30 Sheefish 11.14 Whitefishes 2.10 Arctic char 3.30 Arctic cod 0.11 Burbot 4.20 Dolly Varden 3.30 Saffron cod 0.21 Land mammals Large land mammals Black bear 88.00 Brown beara 86.00 Caribou 136.00 Dall sheep 104.00 Moose 538.00 Muskox 295.00 Small land mammals Beaver 20.00 Snowshoe hare 2.50 River otterb 0.00 Martensb 0.00 Muskratb 0.00 Red foxb 0.00 Wolfb 0.00 Wolverineb 0.00 Marine mammals Marine mammals Bearded seal 420.00 Beluga whale 995.00
-continued-
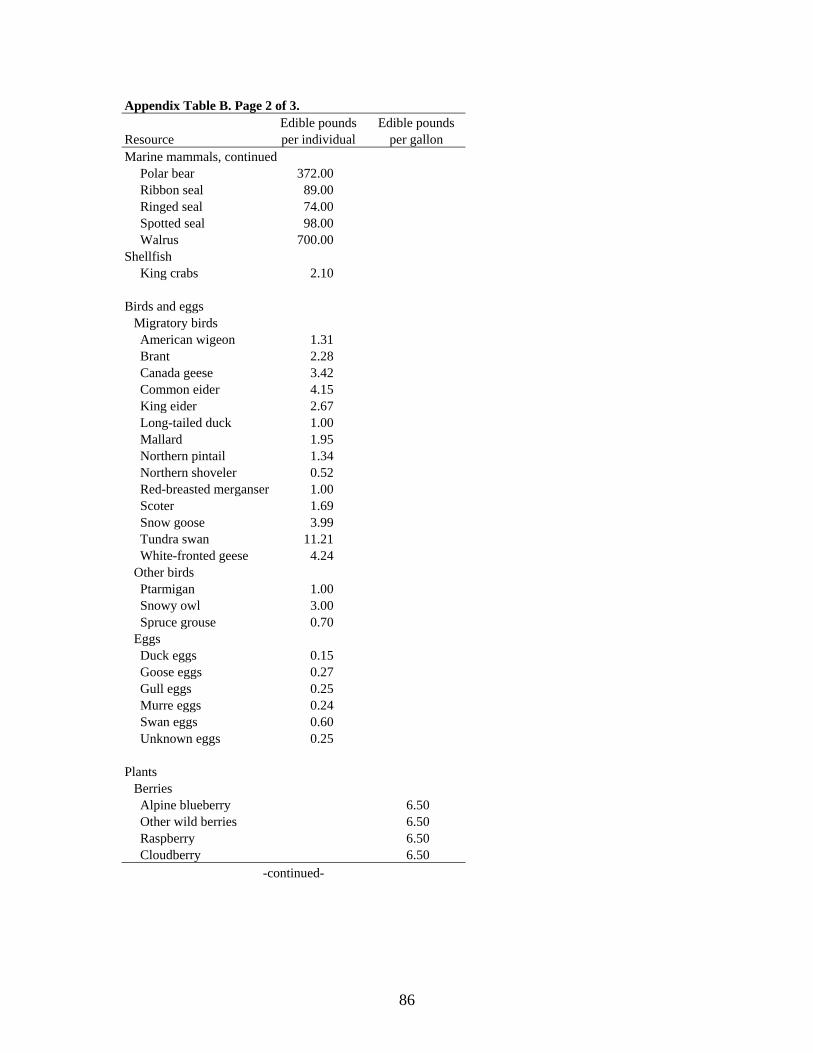
86
Appendix Table B. Page 2 of 3.
Resource Edible poundsper individual
Edible pounds per gallon
Marine mammals, continued Polar bear 372.00 Ribbon seal 89.00 Ringed seal 74.00 Spotted seal 98.00 Walrus 700.00 Shellfish King crabs 2.10 Birds and eggs Migratory birds American wigeon 1.31 Brant 2.28 Canada geese 3.42 Common eider 4.15 King eider 2.67 Long-tailed duck 1.00 Mallard 1.95 Northern pintail 1.34 Northern shoveler 0.52 Red-breasted merganser 1.00 Scoter 1.69 Snow goose 3.99 Tundra swan 11.21 White-fronted geese 4.24 Other birds Ptarmigan 1.00 Snowy owl 3.00 Spruce grouse 0.70 Eggs Duck eggs 0.15 Goose eggs 0.27 Gull eggs 0.25 Murre eggs 0.24 Swan eggs 0.60 Unknown eggs 0.25 Plants Berries Alpine blueberry 6.50 Other wild berries 6.50 Raspberry 6.50 Cloudberry 6.50
-continued-
87
Appendix Table B. Page 3 of 3.
Resource Edible poundsper individual
Edible pounds per gallon
Plants, continued Lingonberry 6.50 Crowberry 6.50 Greens “Eskimo potato” 4.00 Labrador tea 1.00 Other wild greens 1.00 Unknown vegetation 4.00 “Wild celery” 1.00 Willow leaf 1.00 Wormwood 1.00 Unknown mushroom 1.00 Docks 1.00 a. Brown bears may be harvested for their meat, their hides, or
both. This conversion factor assumes a live weight of 286 pounds and a conversion factor of 30%, to take into account different levels of use (Georgette and Loon 1993:203)
b. This species is not usually eaten, so the conversion factor is 0.
88
APPENDIX C: KIVALINA MAPS, 2007
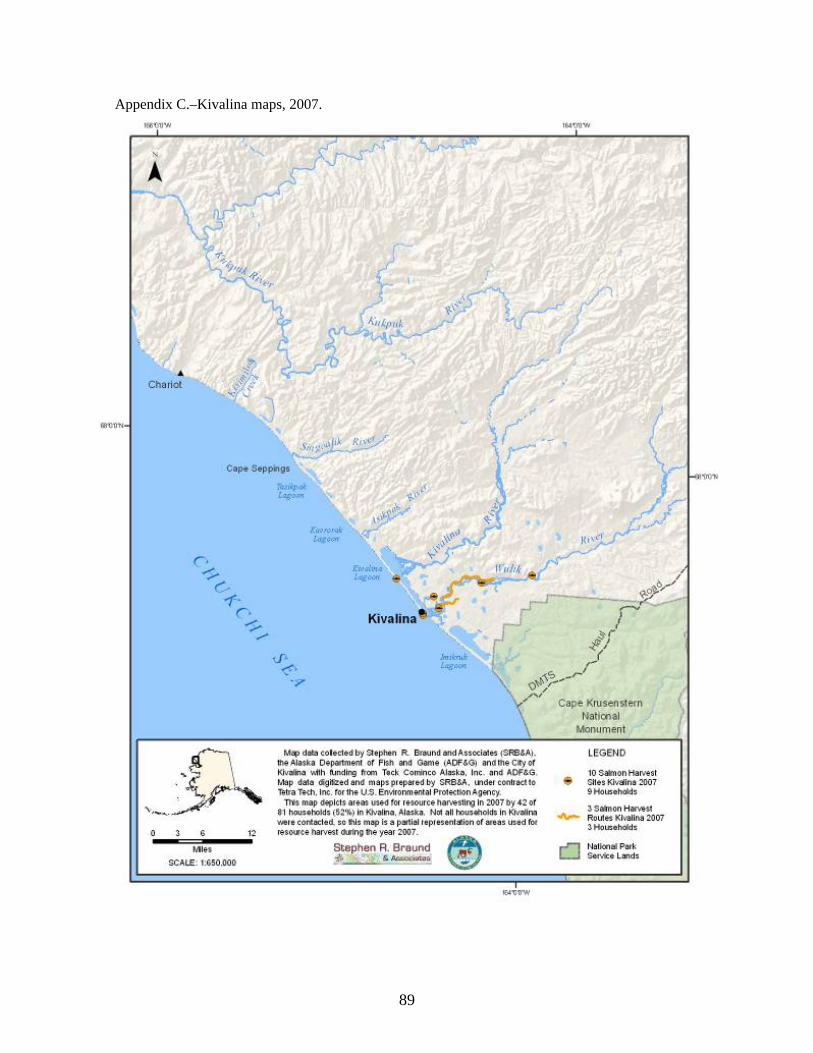
89
Appendix C.–Kivalina maps, 2007.
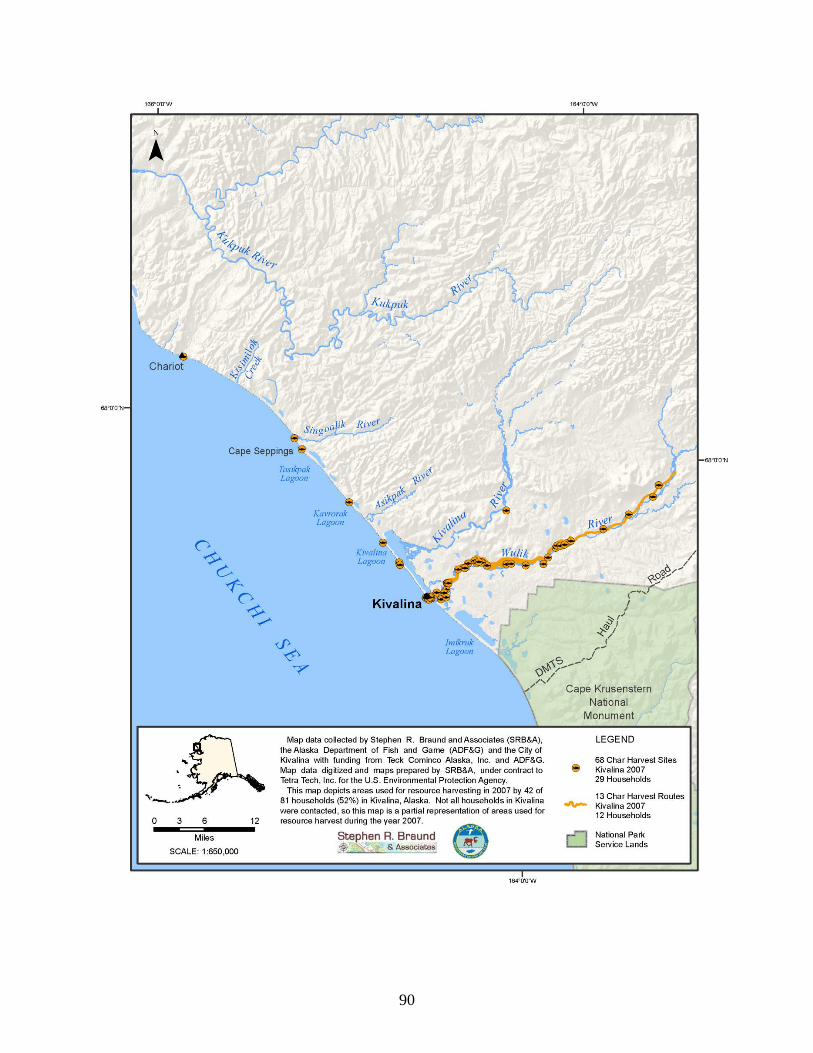
90
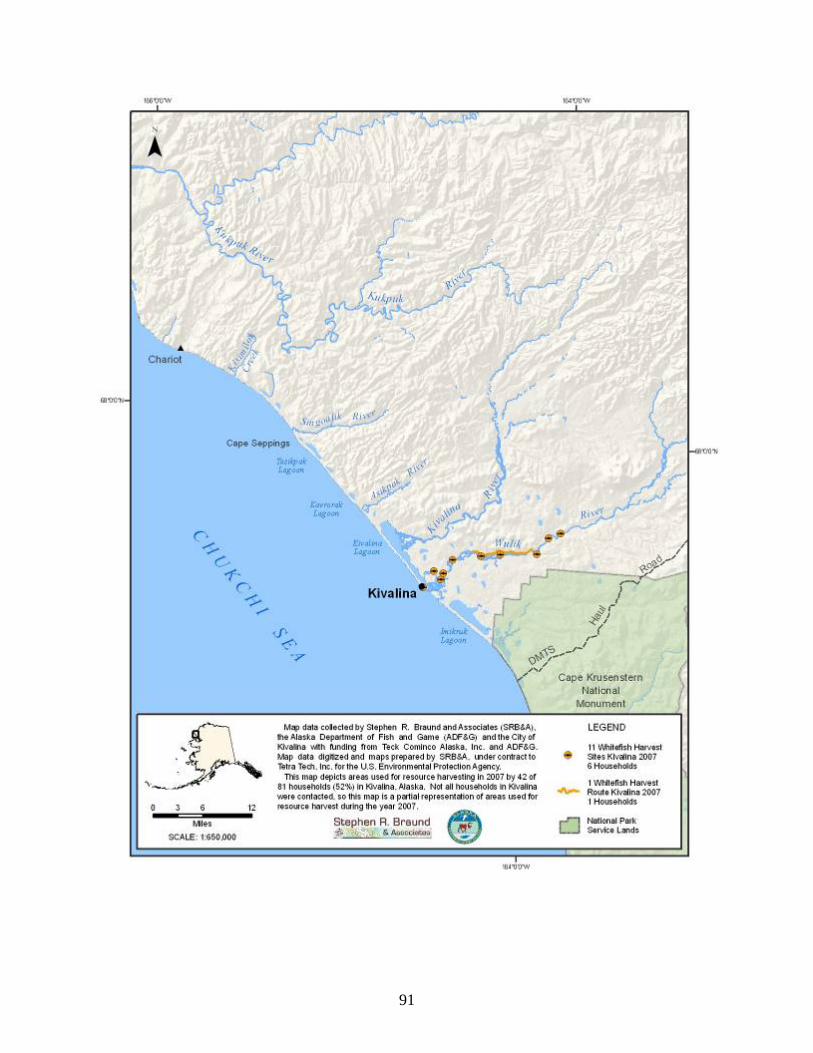
91
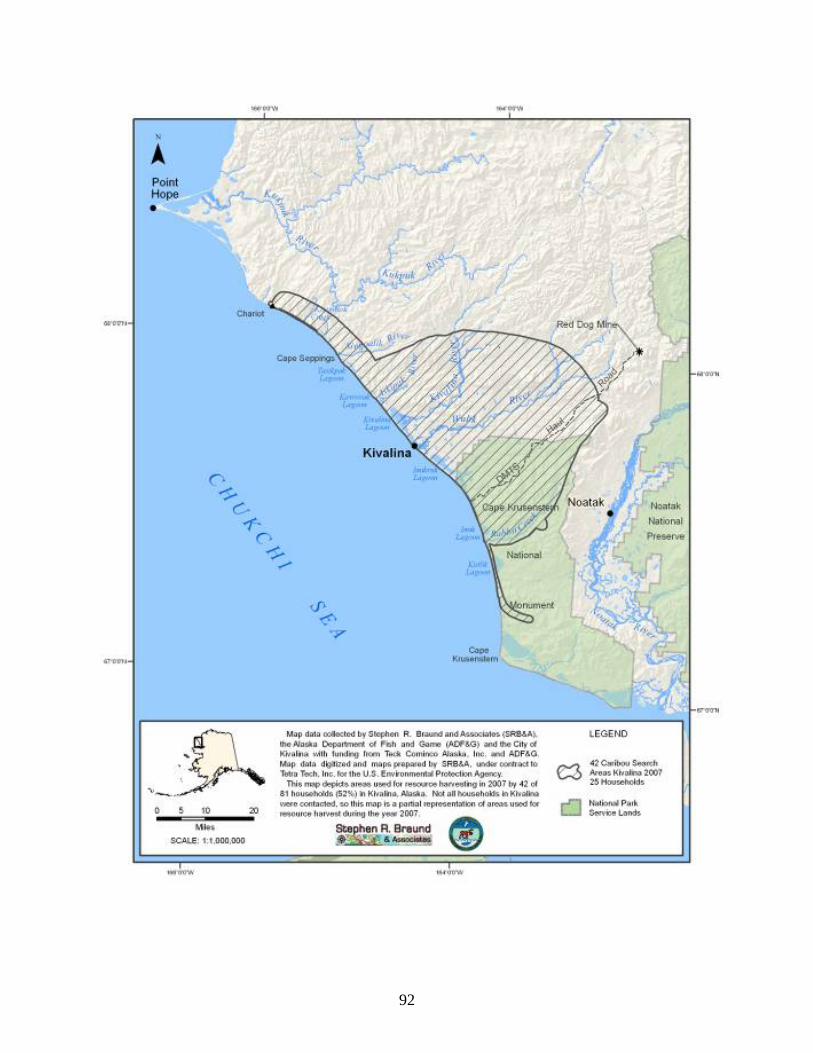
92
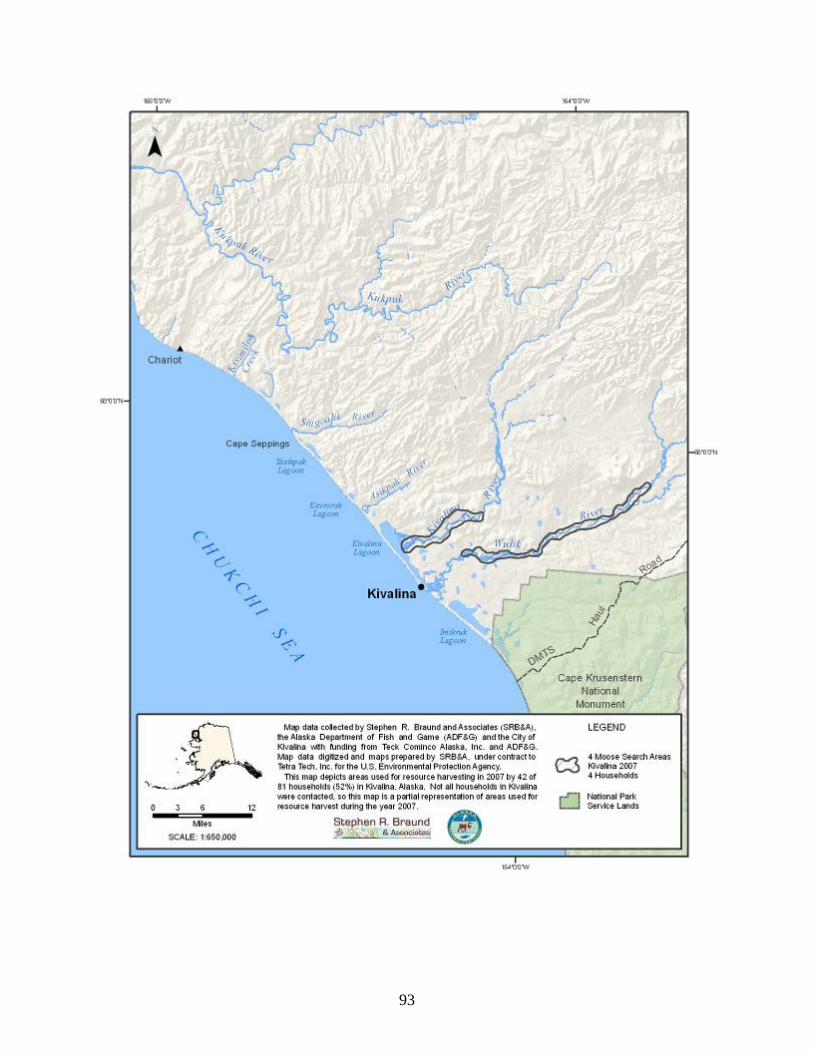
93
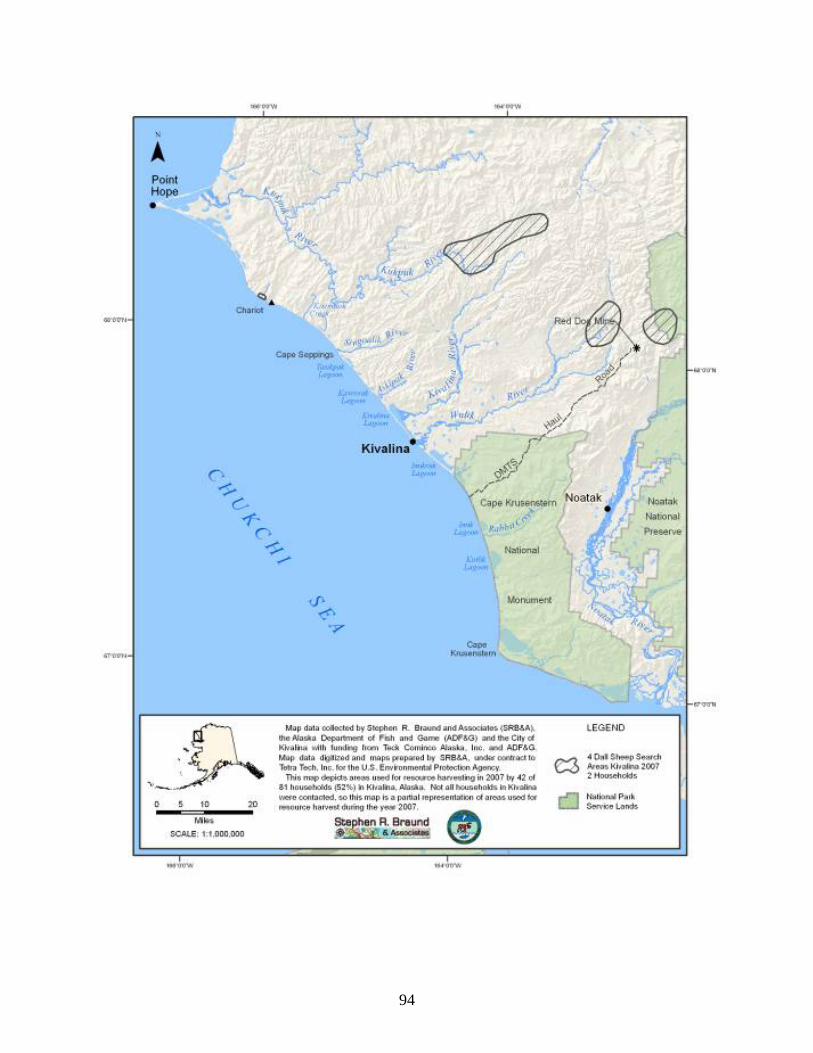
94
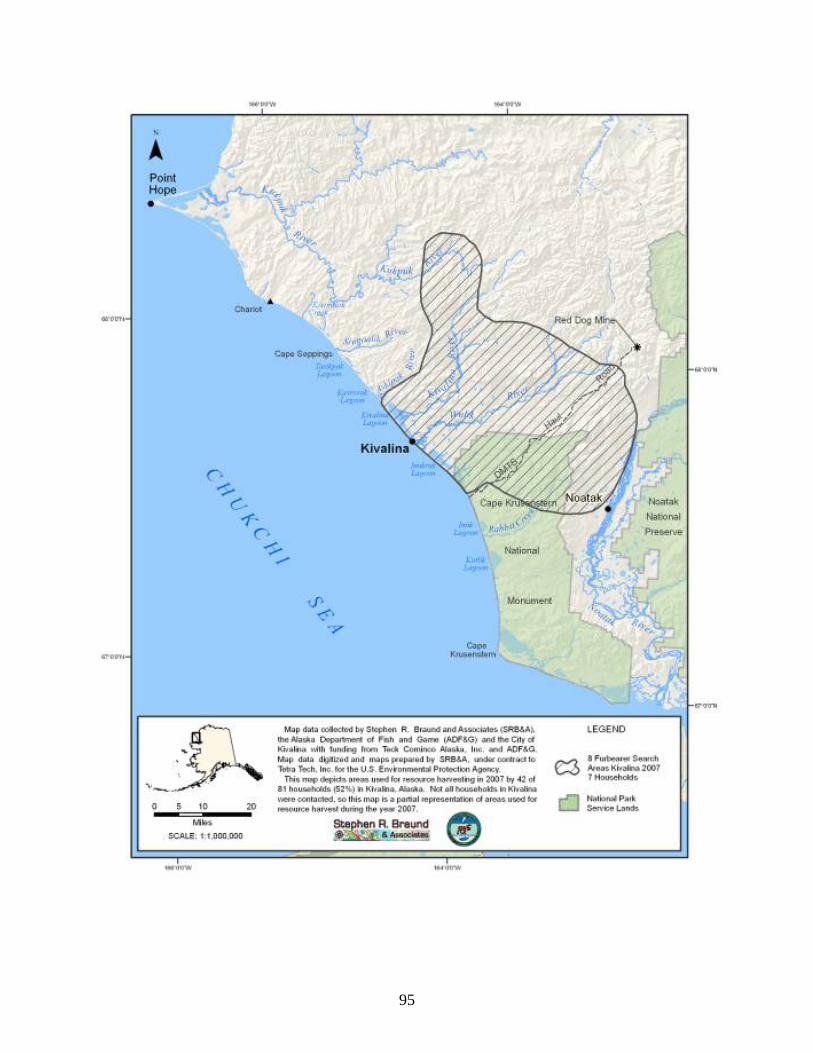
95
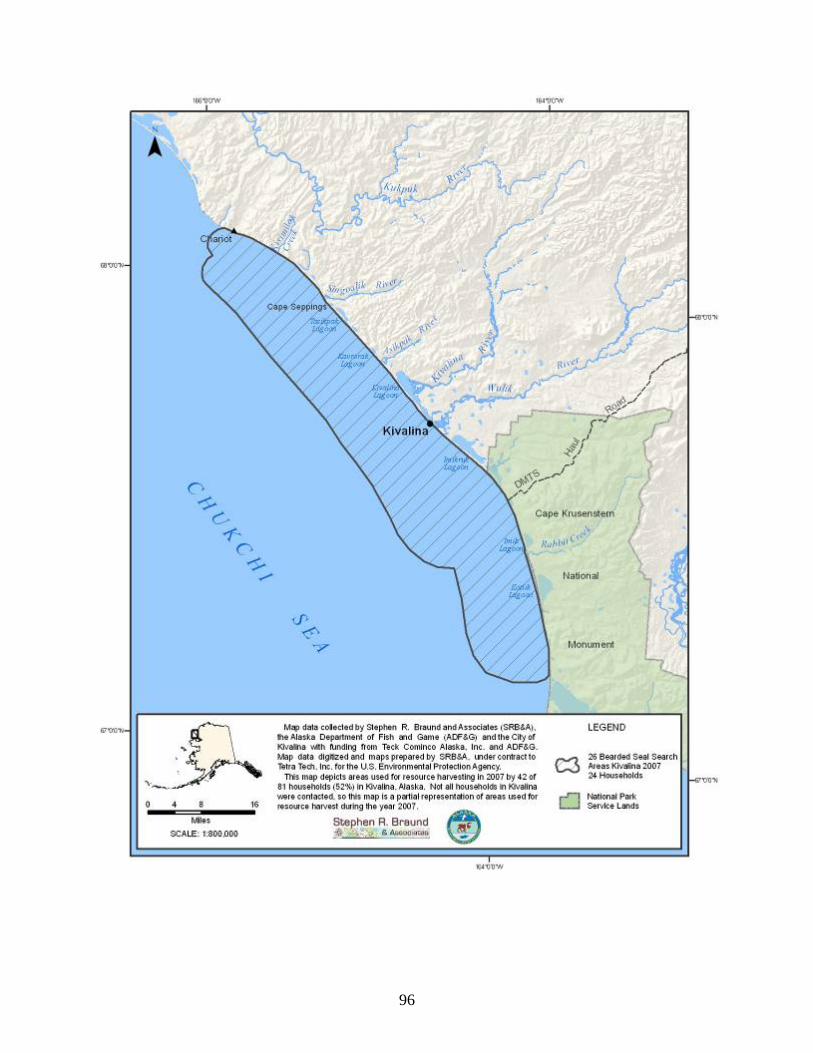
96
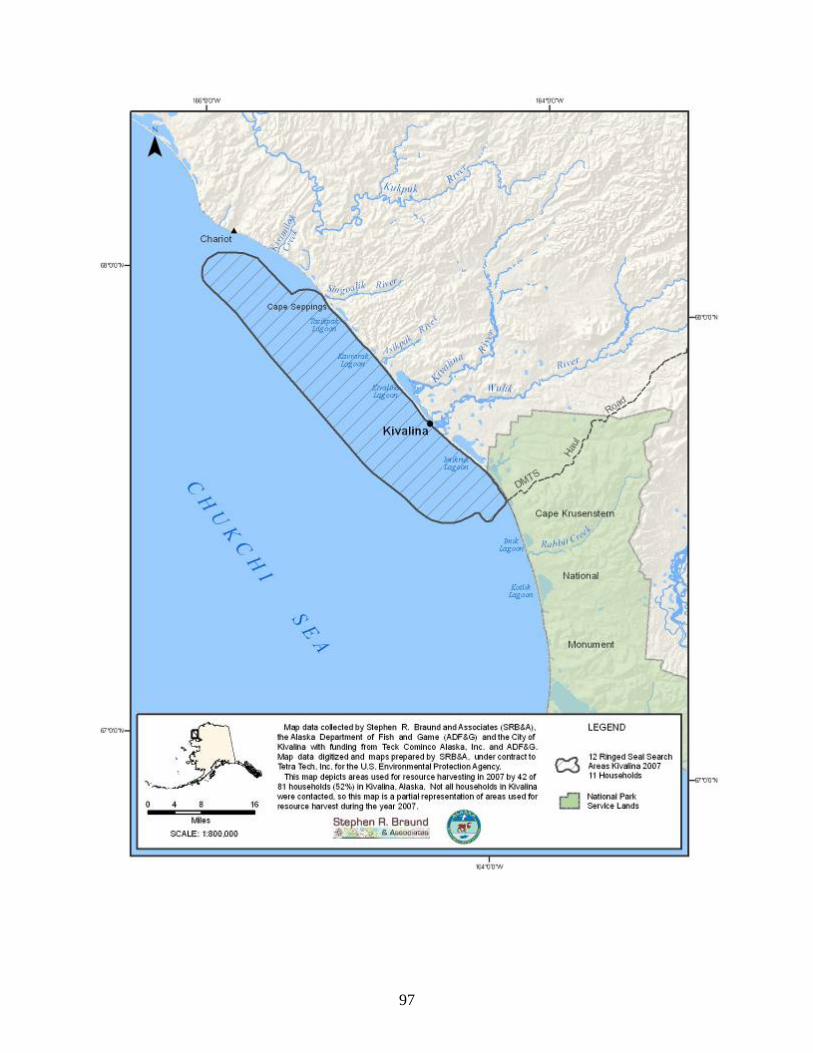
97

98
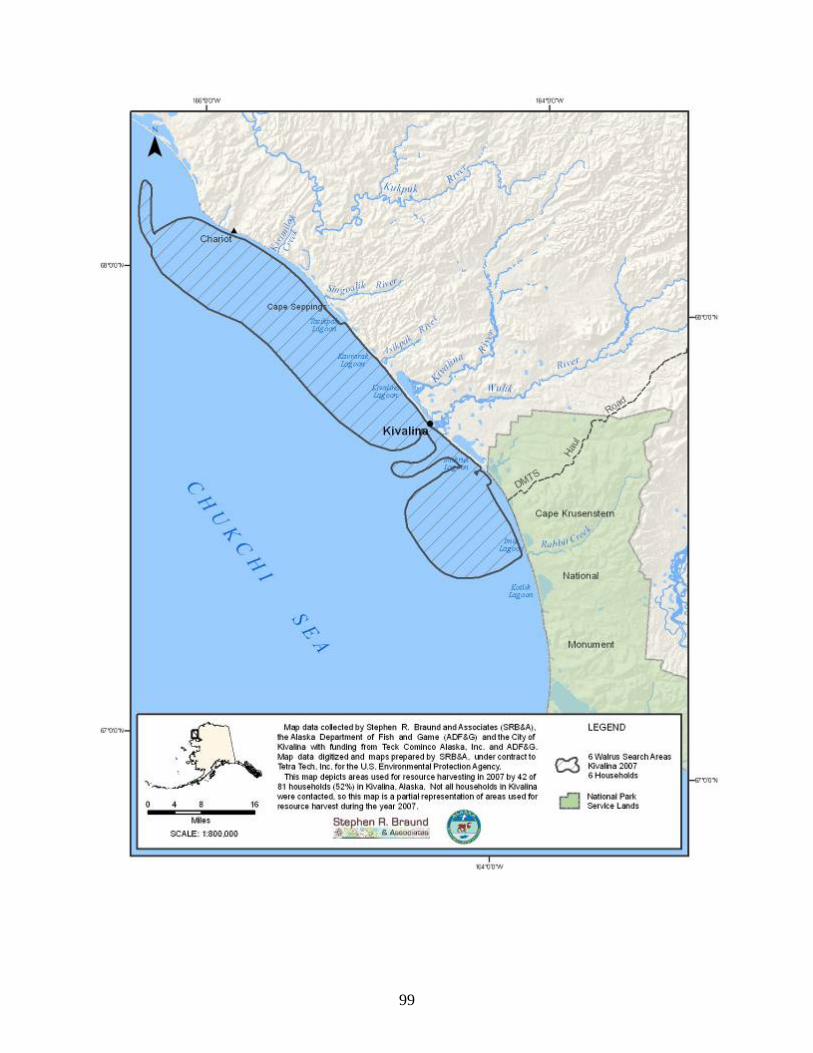
99
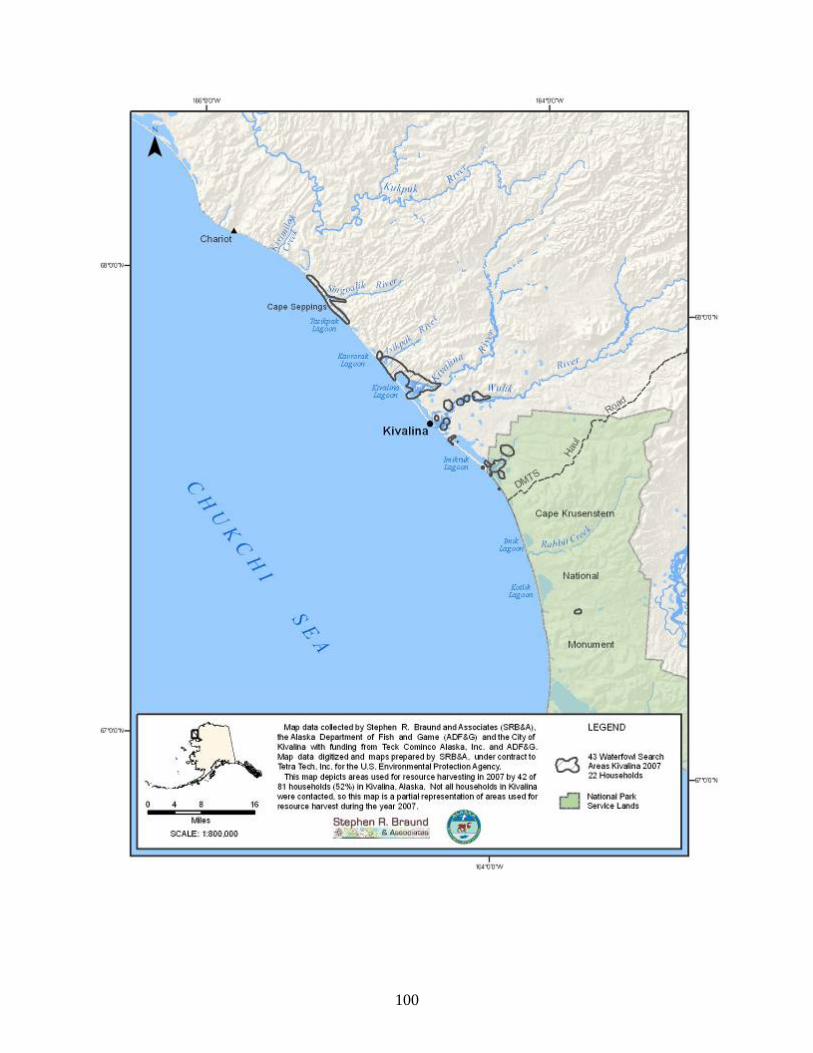
100
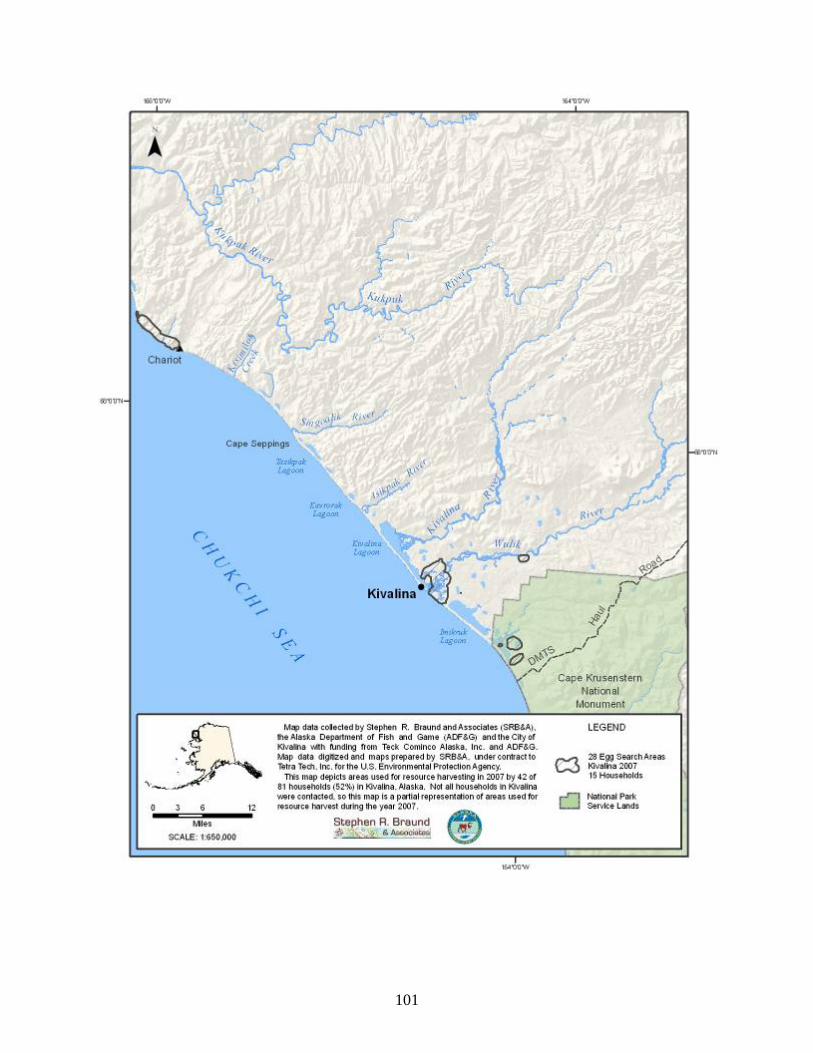
101
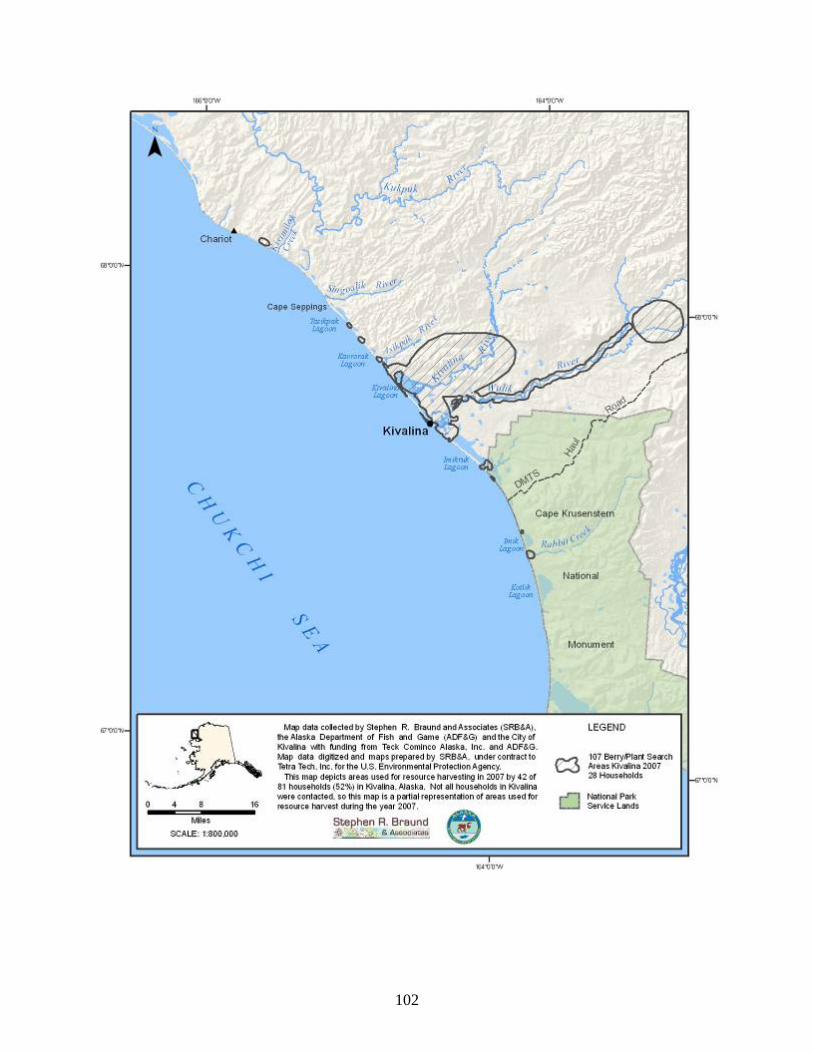
102
103
APPENDIX D: NOATAK MAPS, 2007
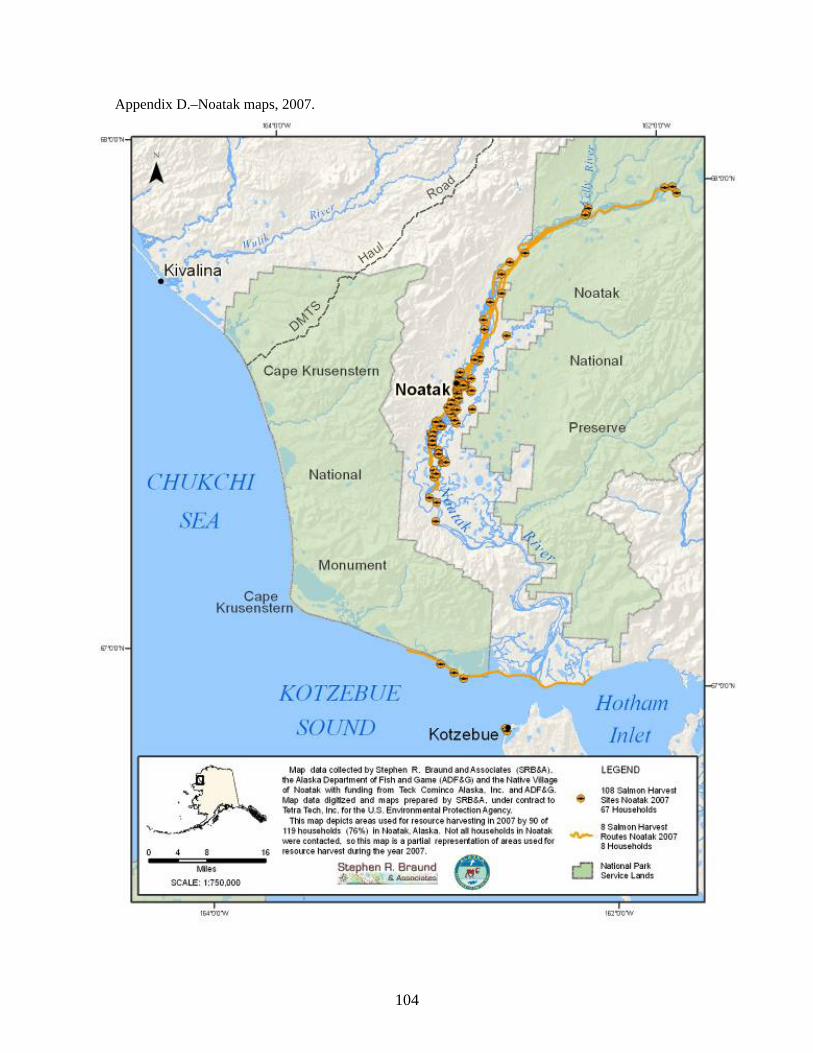
104
Appendix D.–Noatak maps, 2007.
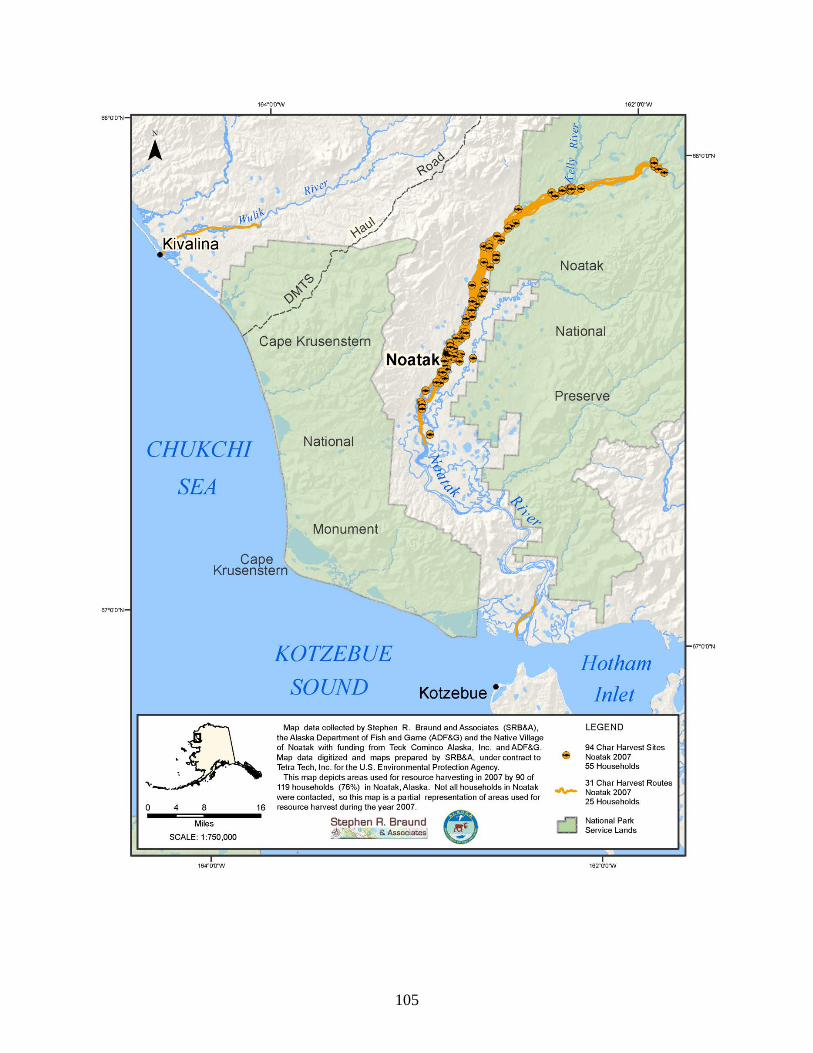
105
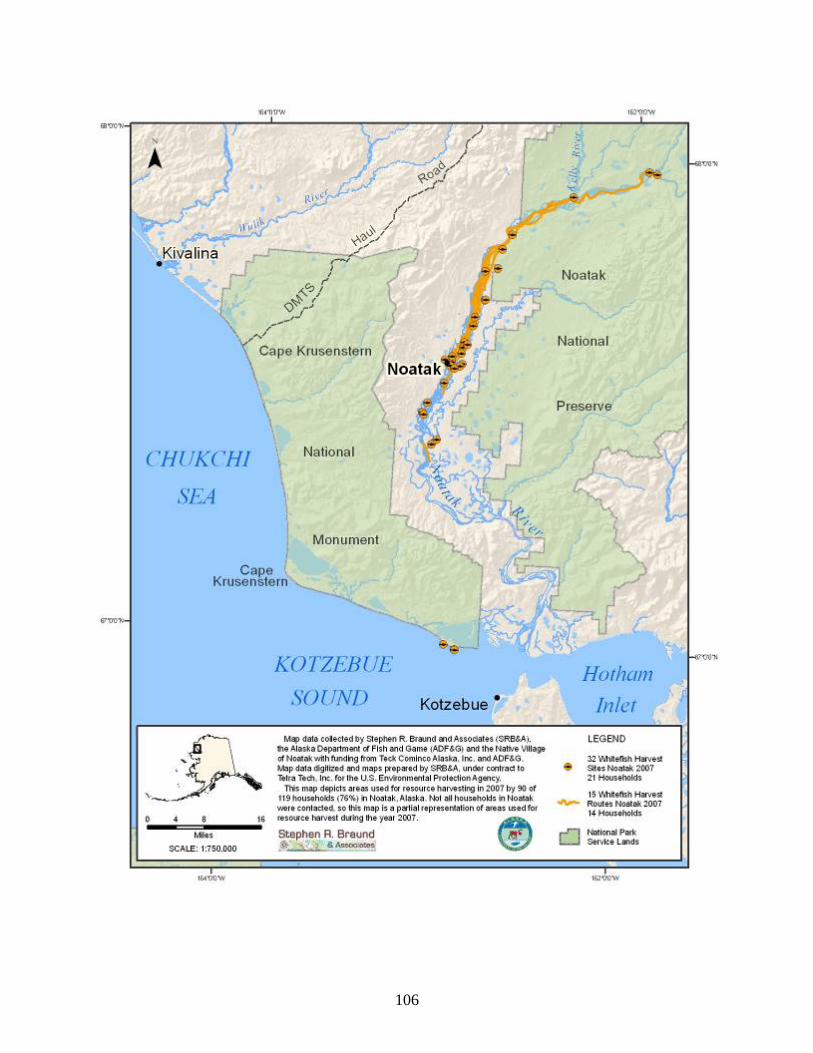
106
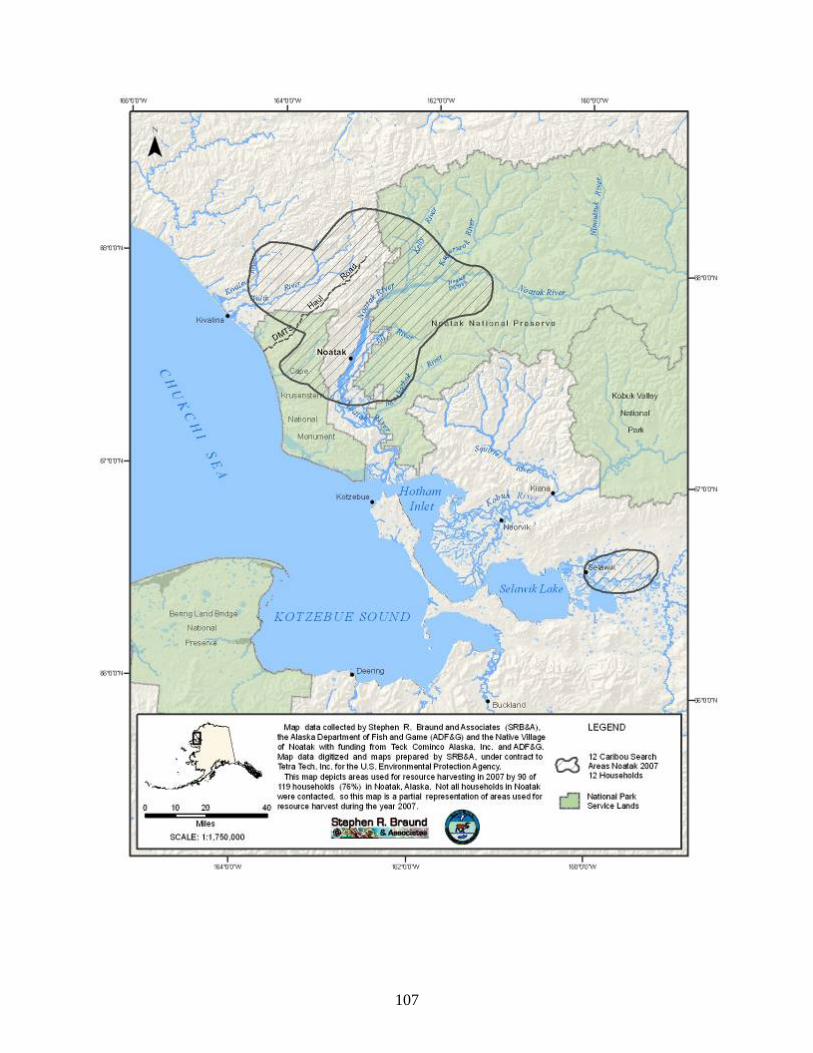
107
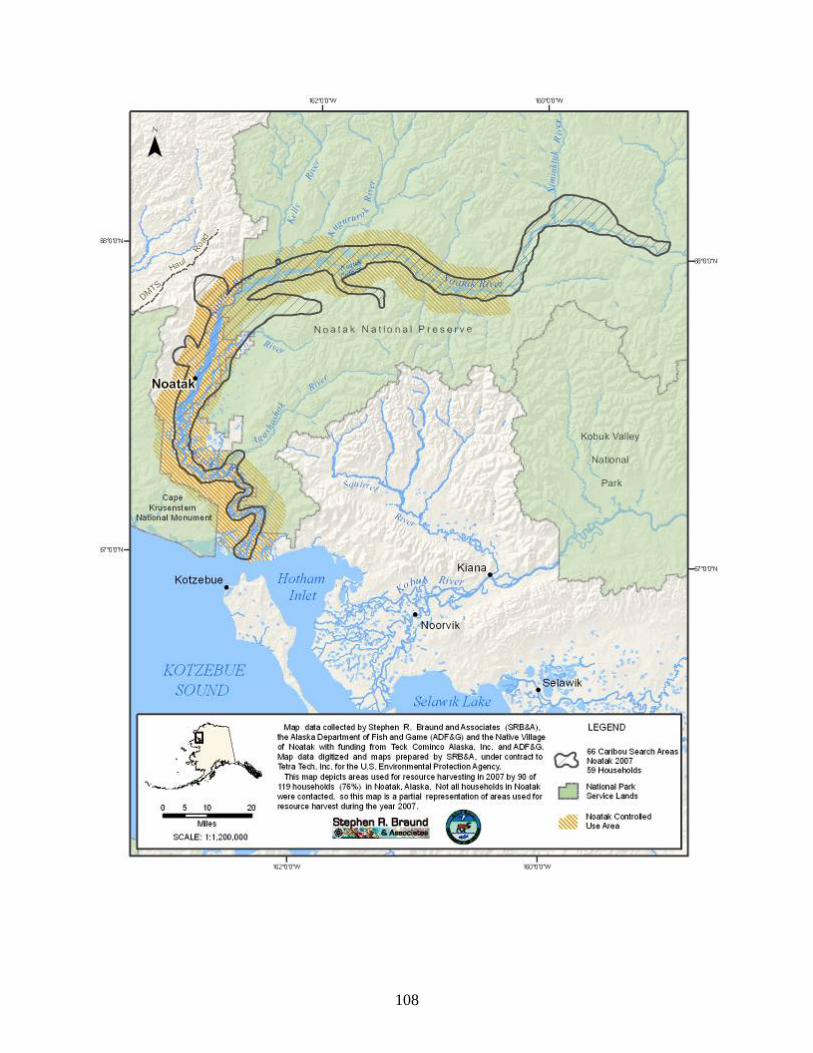
108
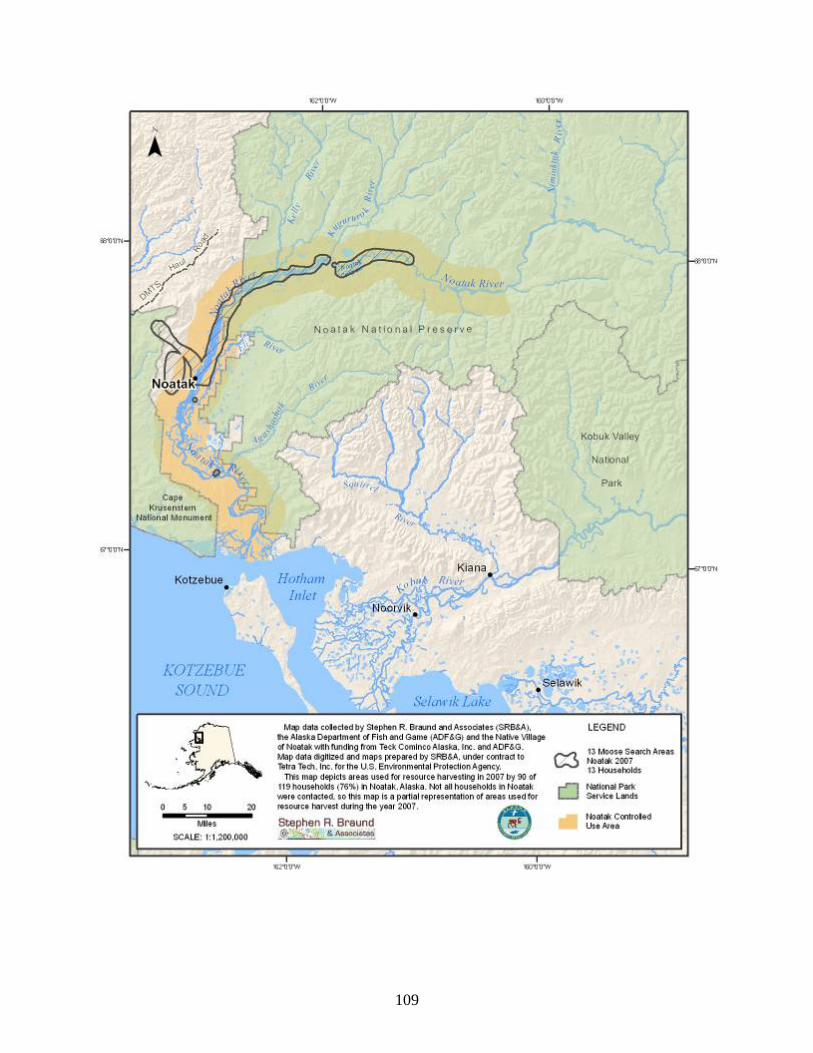
109
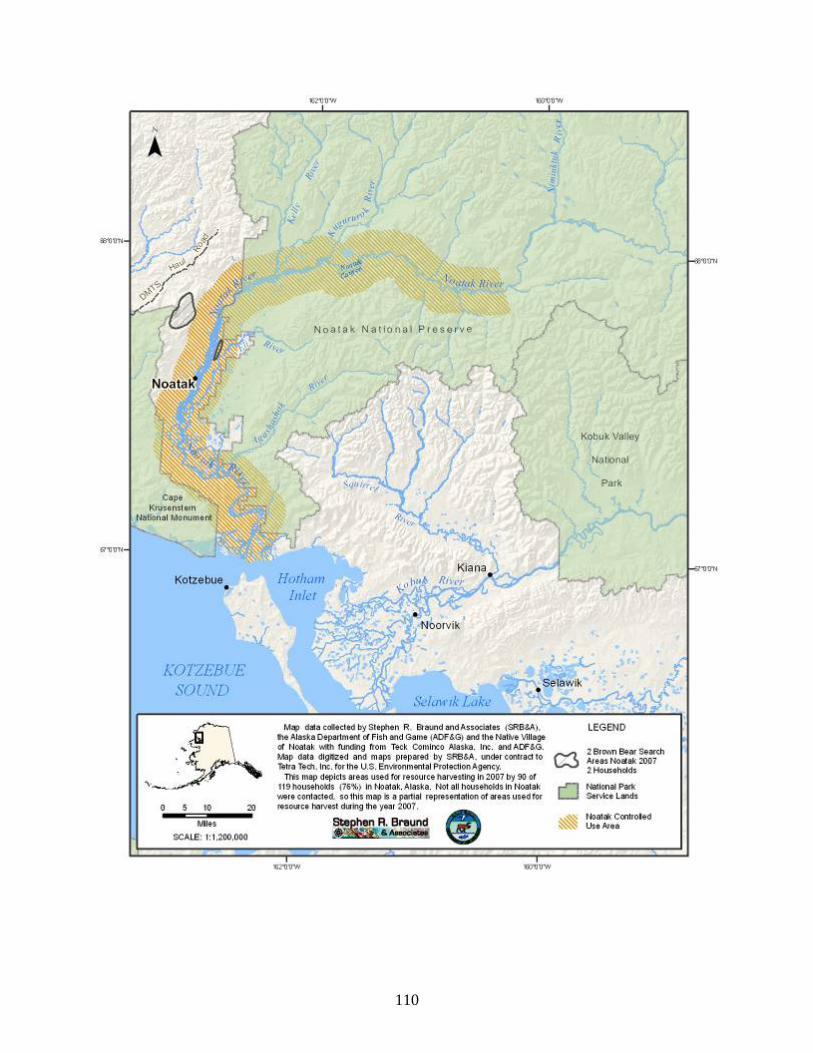
110
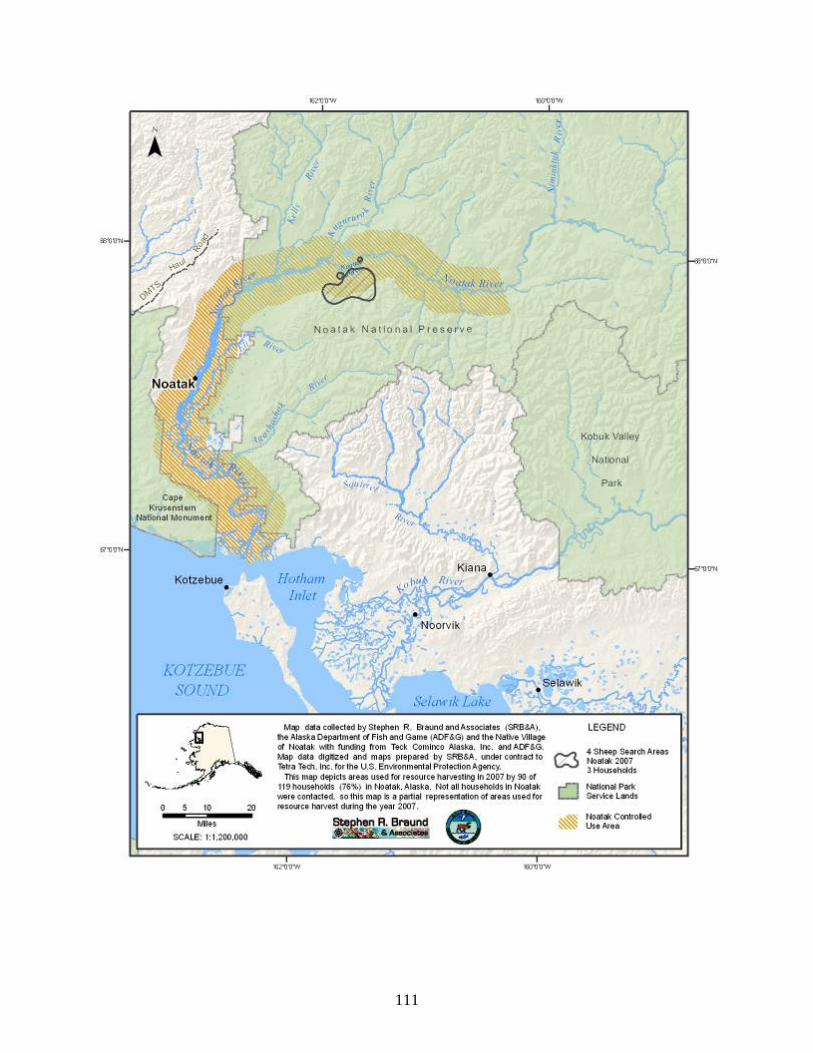
111
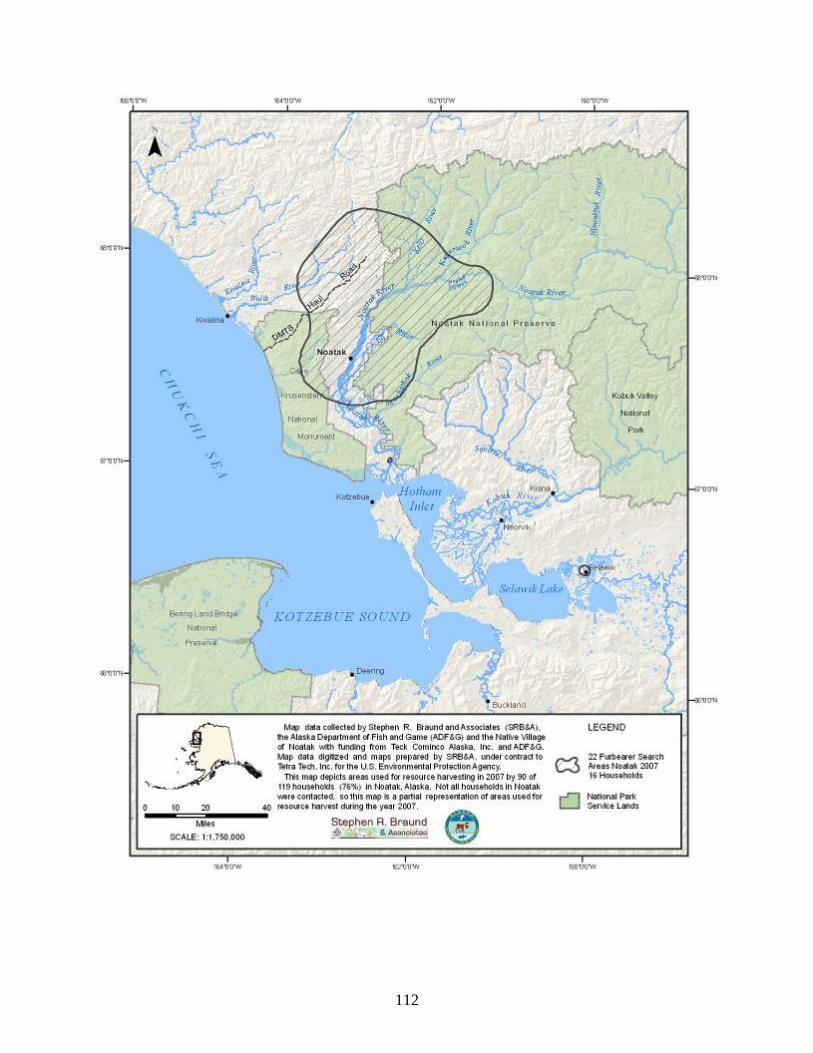
112
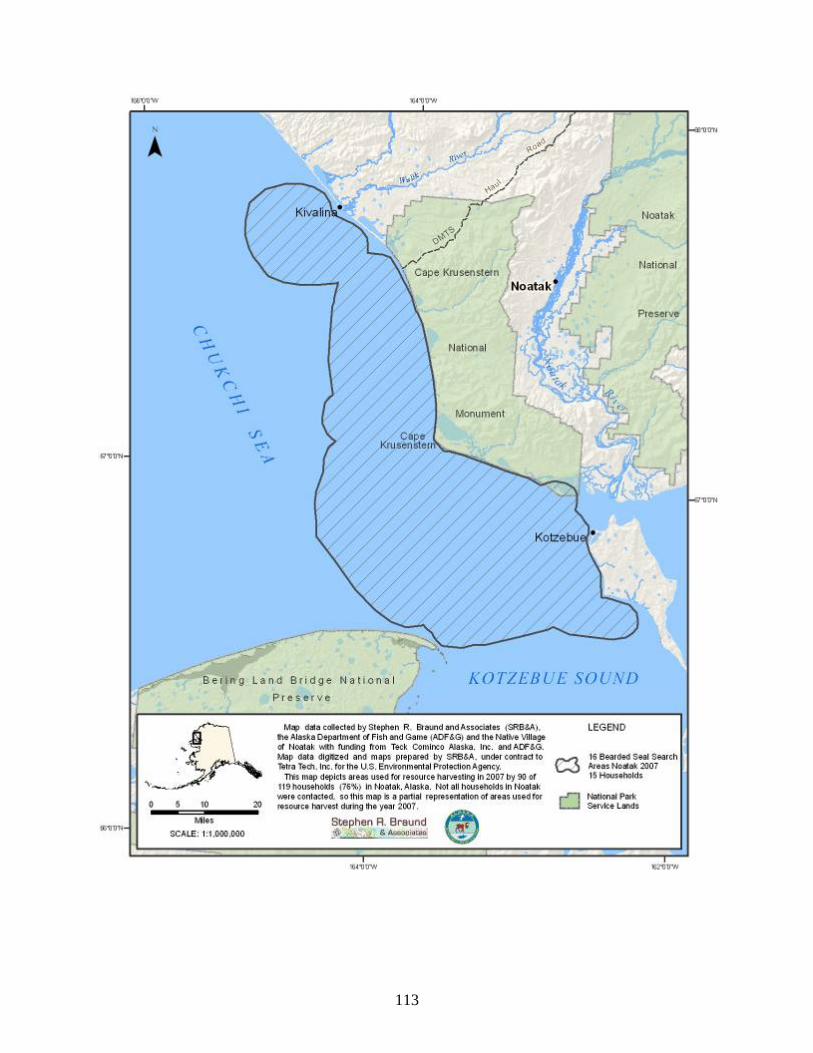
113
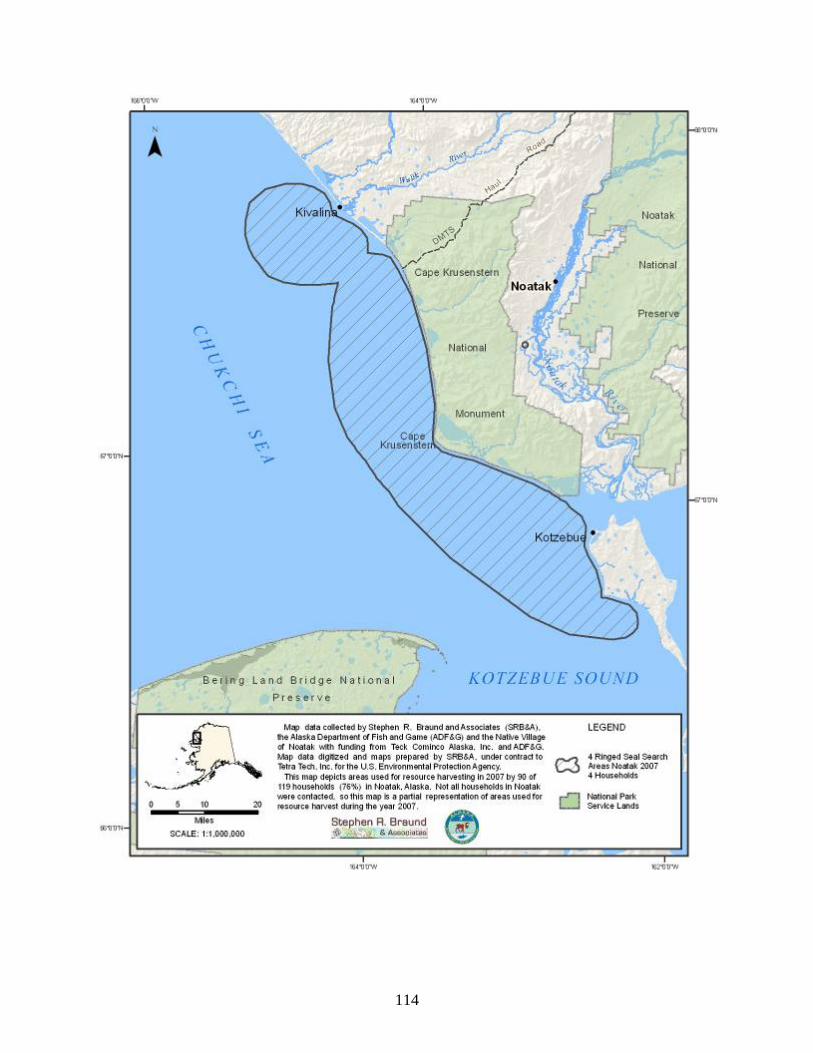
114
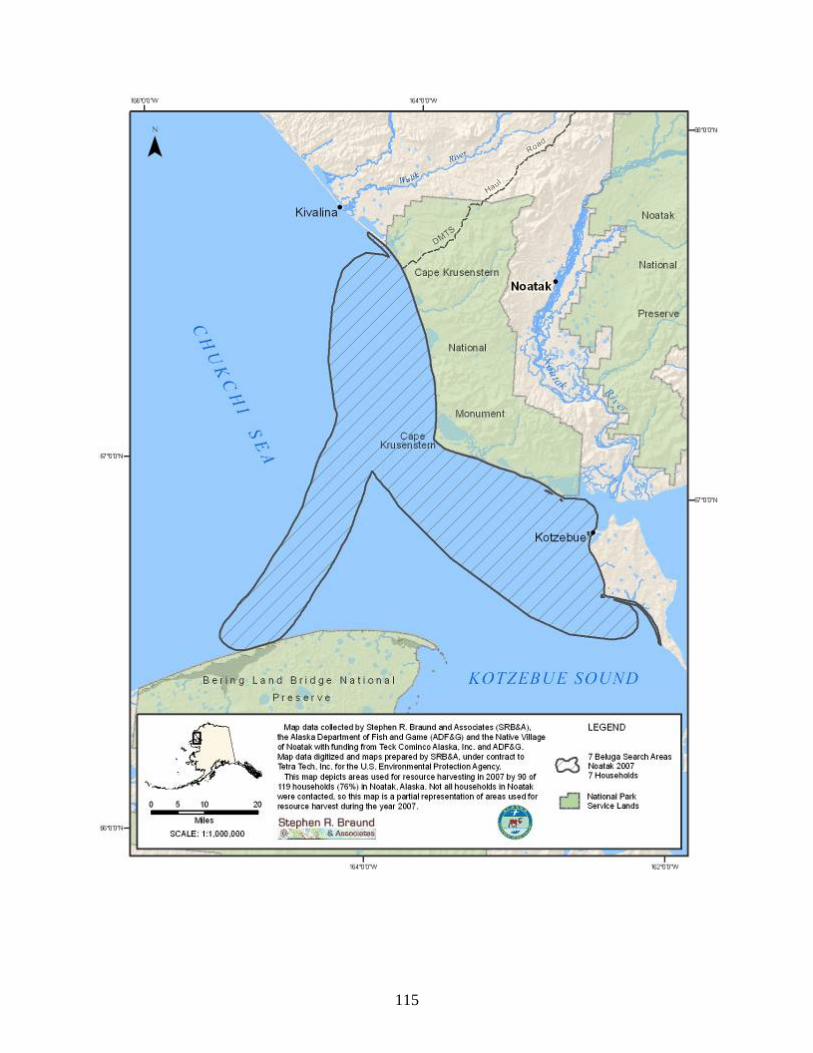
115
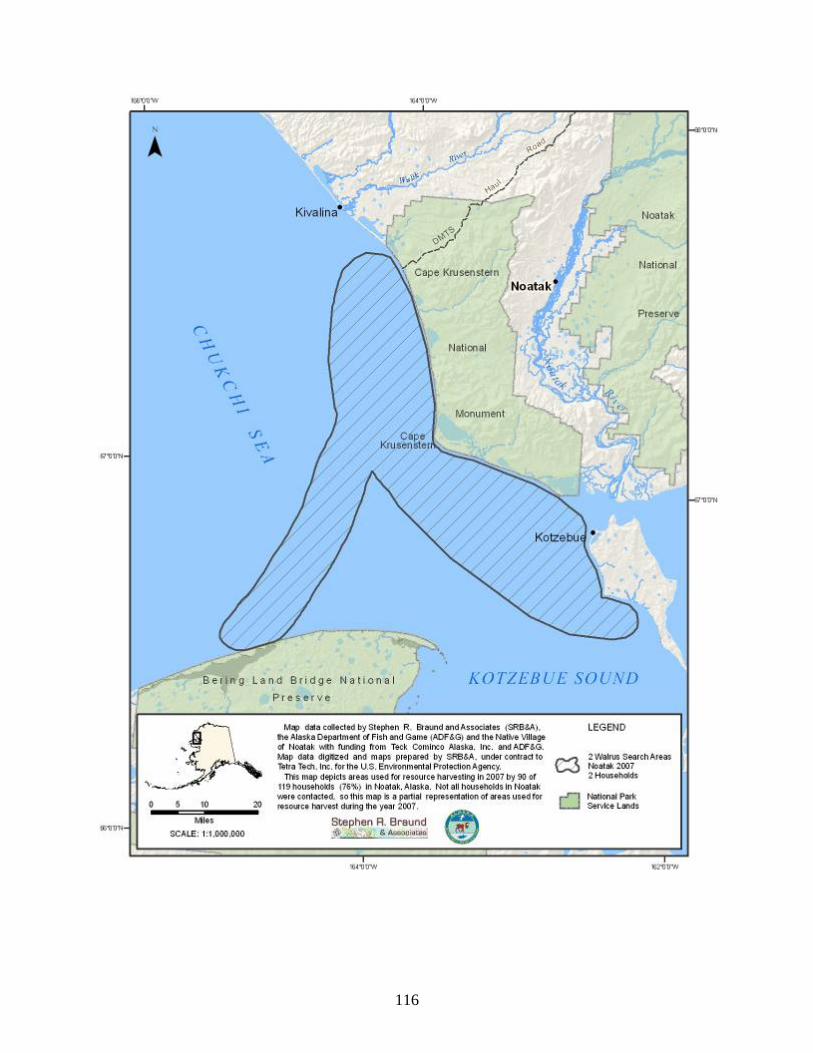
116
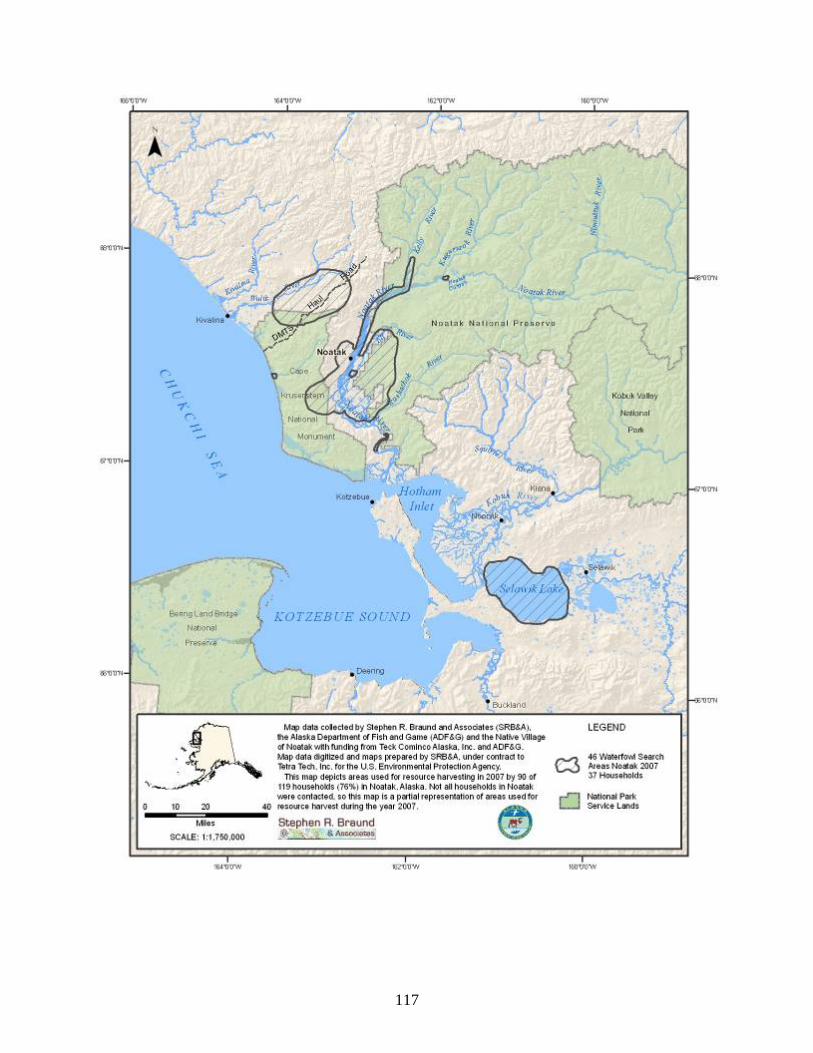
117
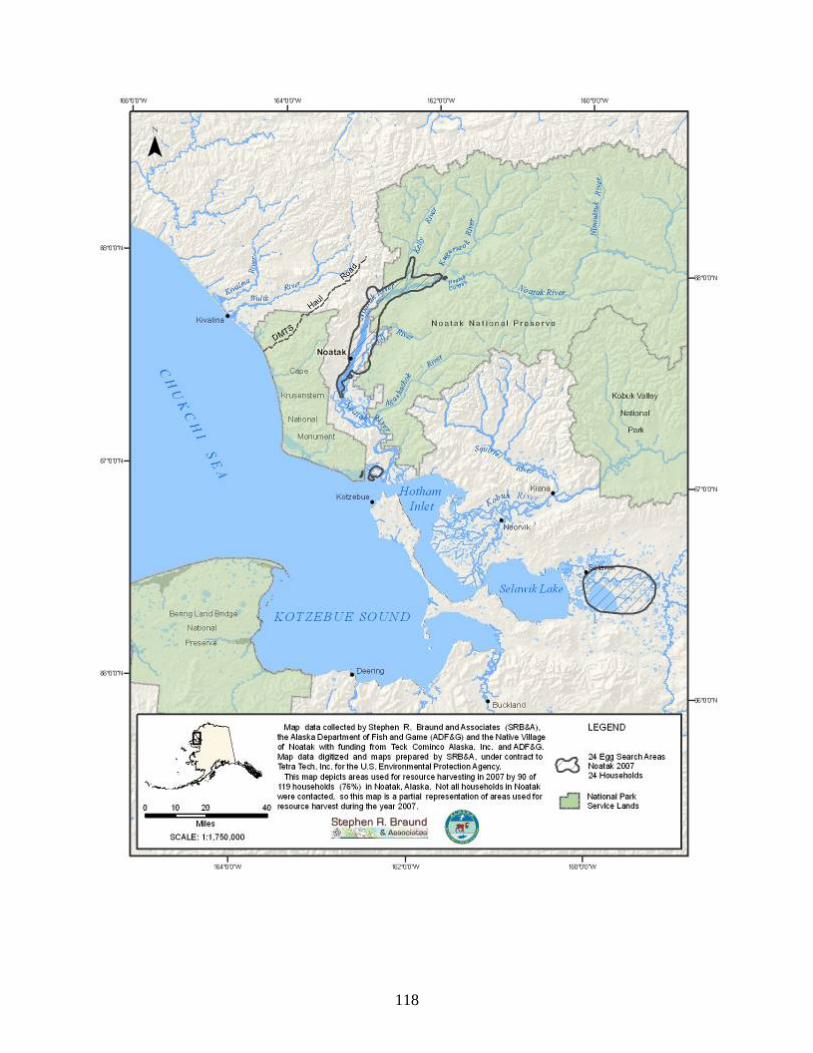
118
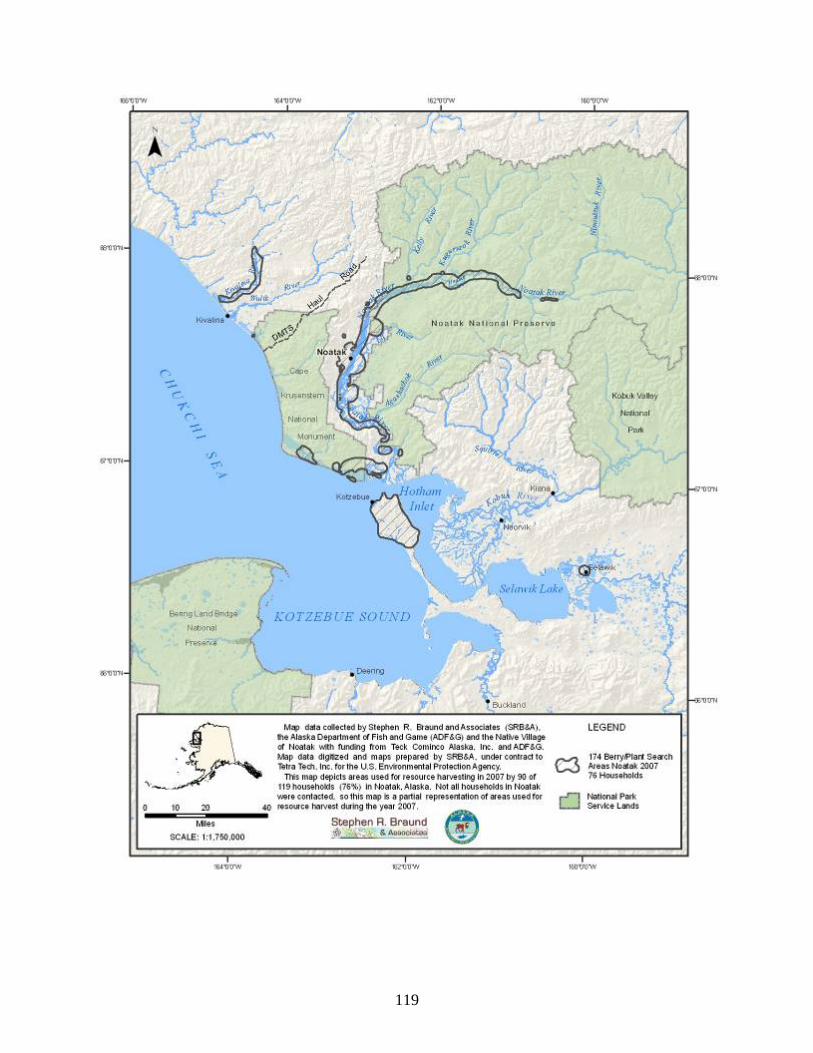
119
120
APPENDIX E: KIVALINA SURVEY, 2007
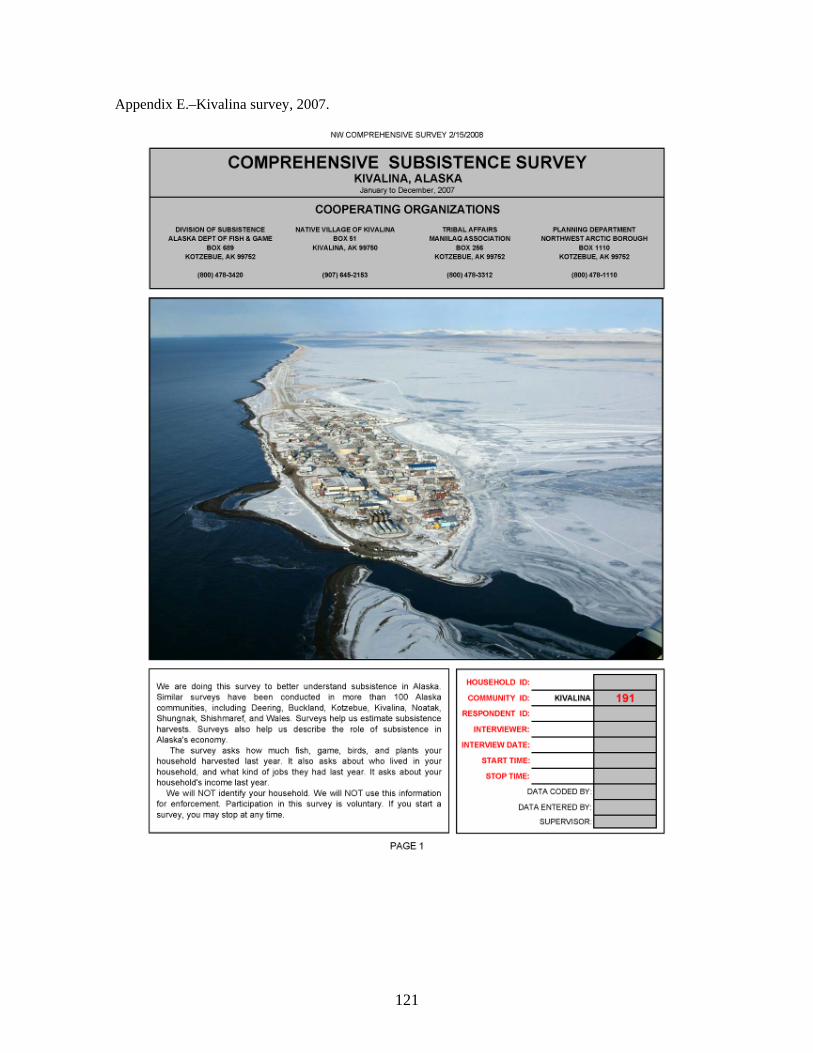
121
Appendix E.–Kivalina survey, 2007.
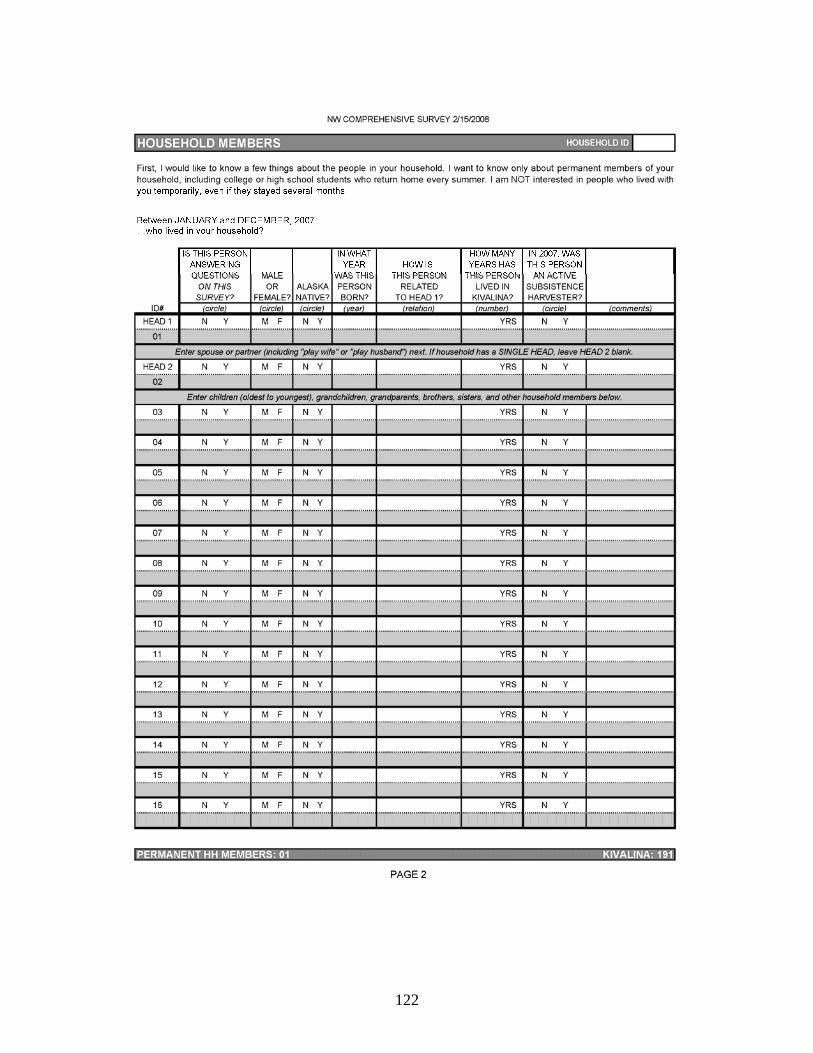
122
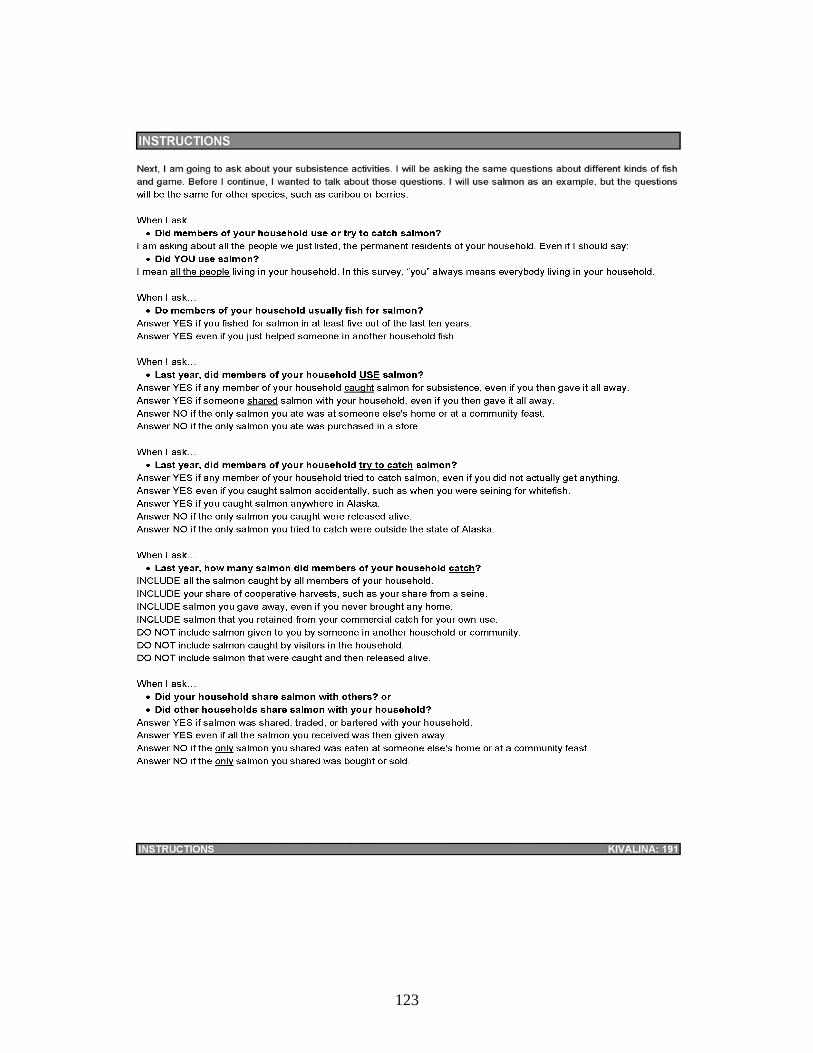
123
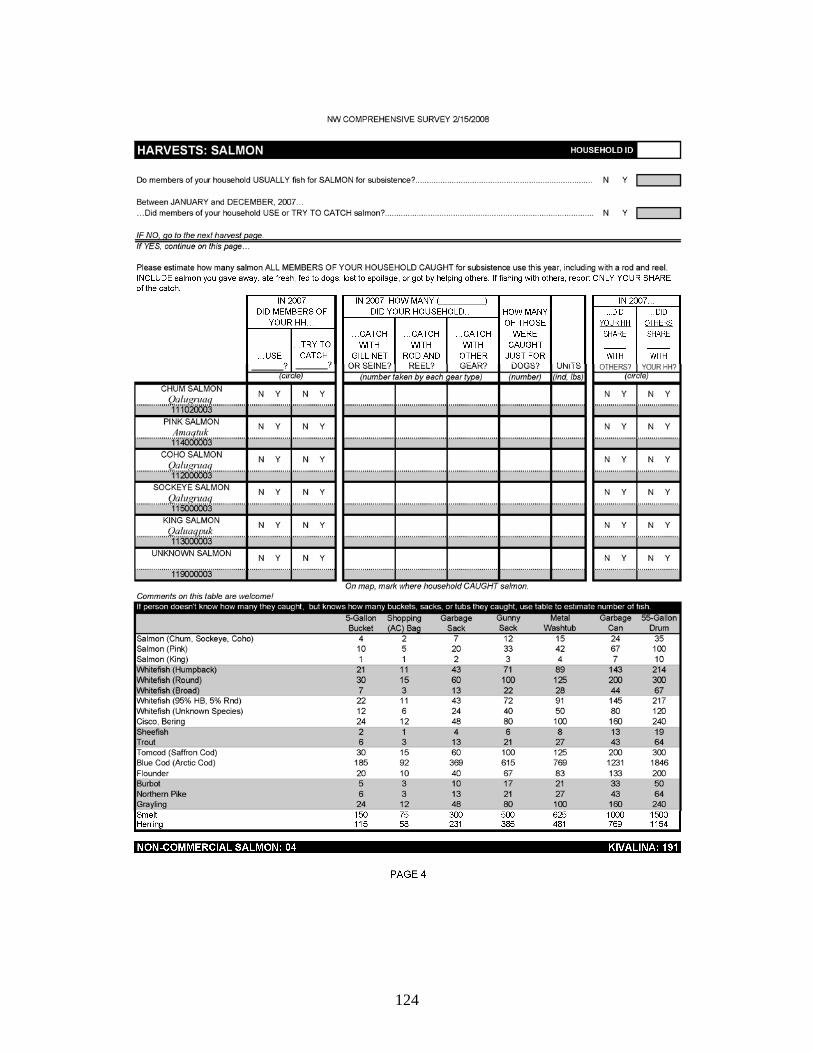
124
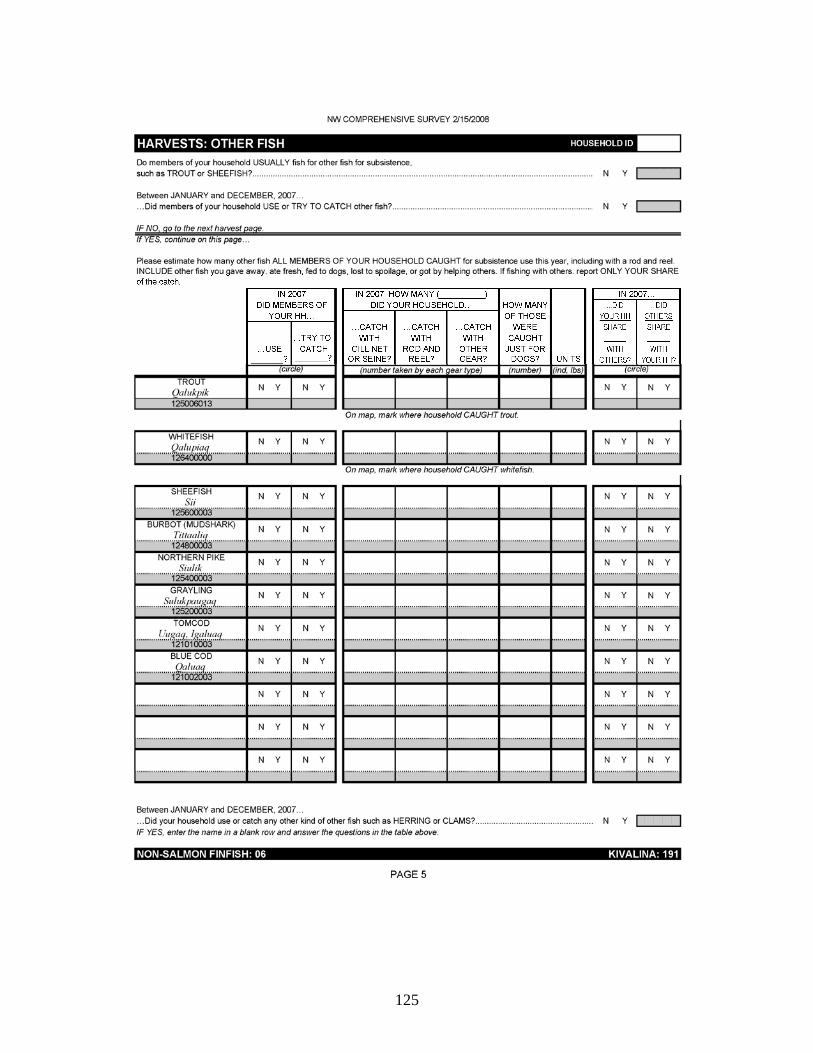
125
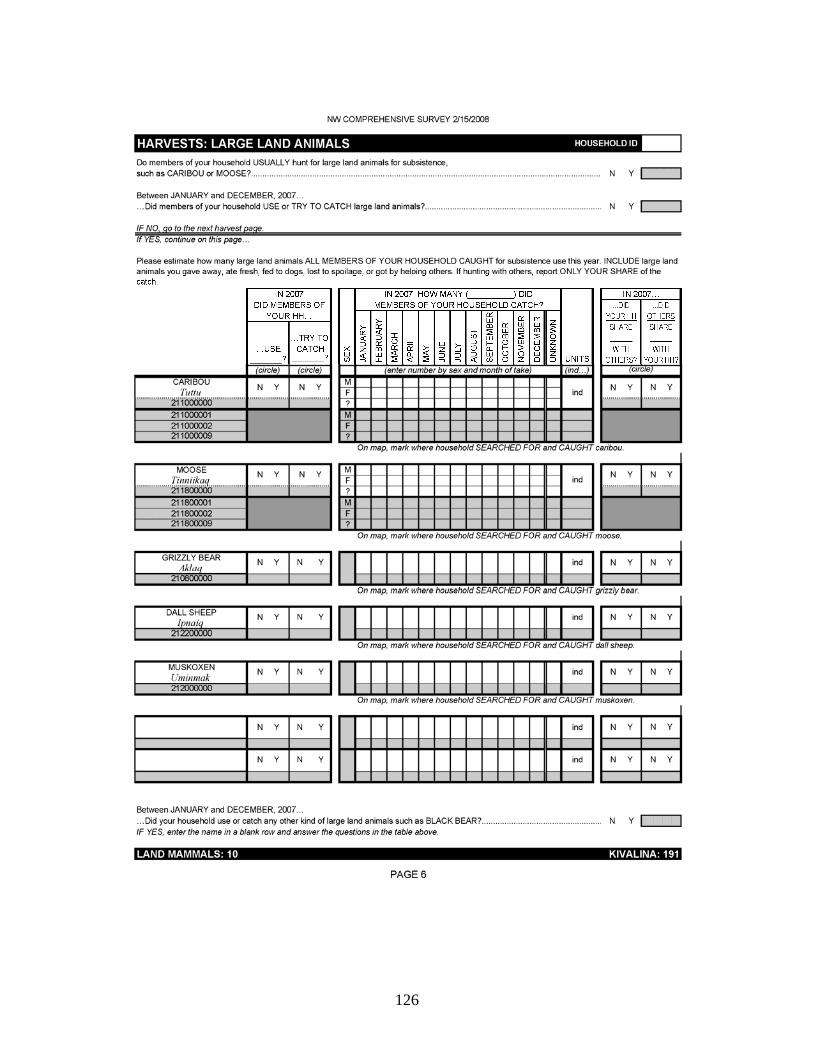
126
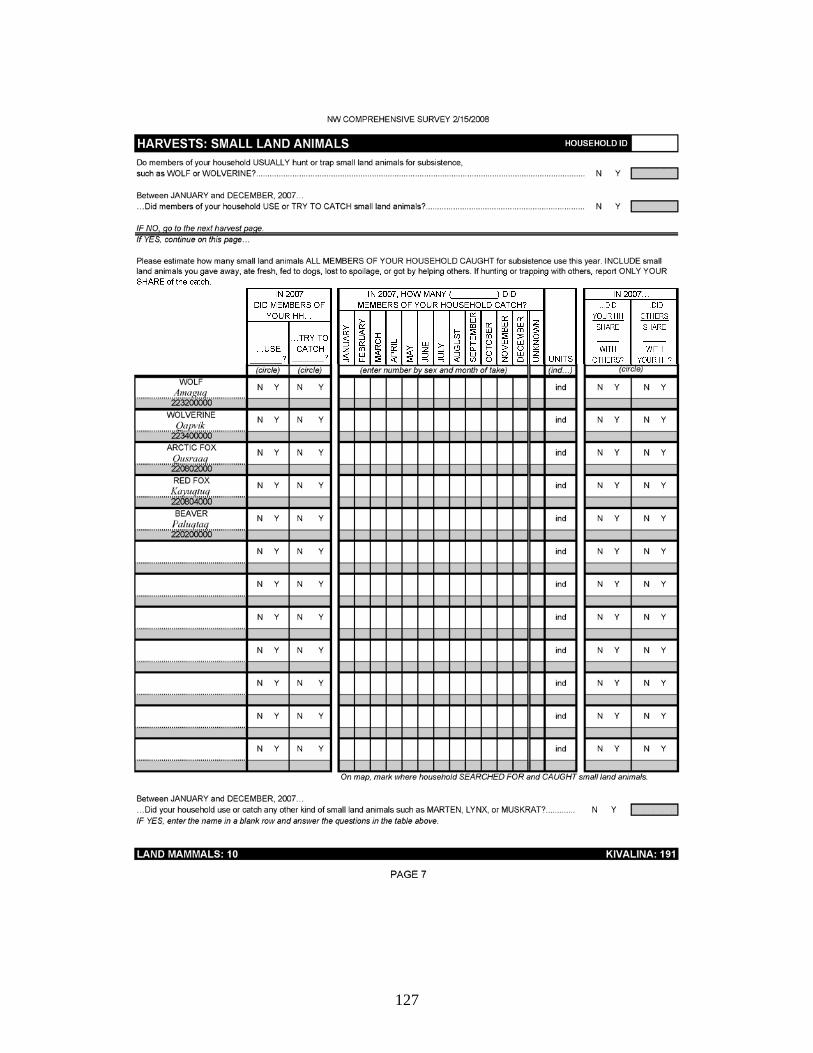
127
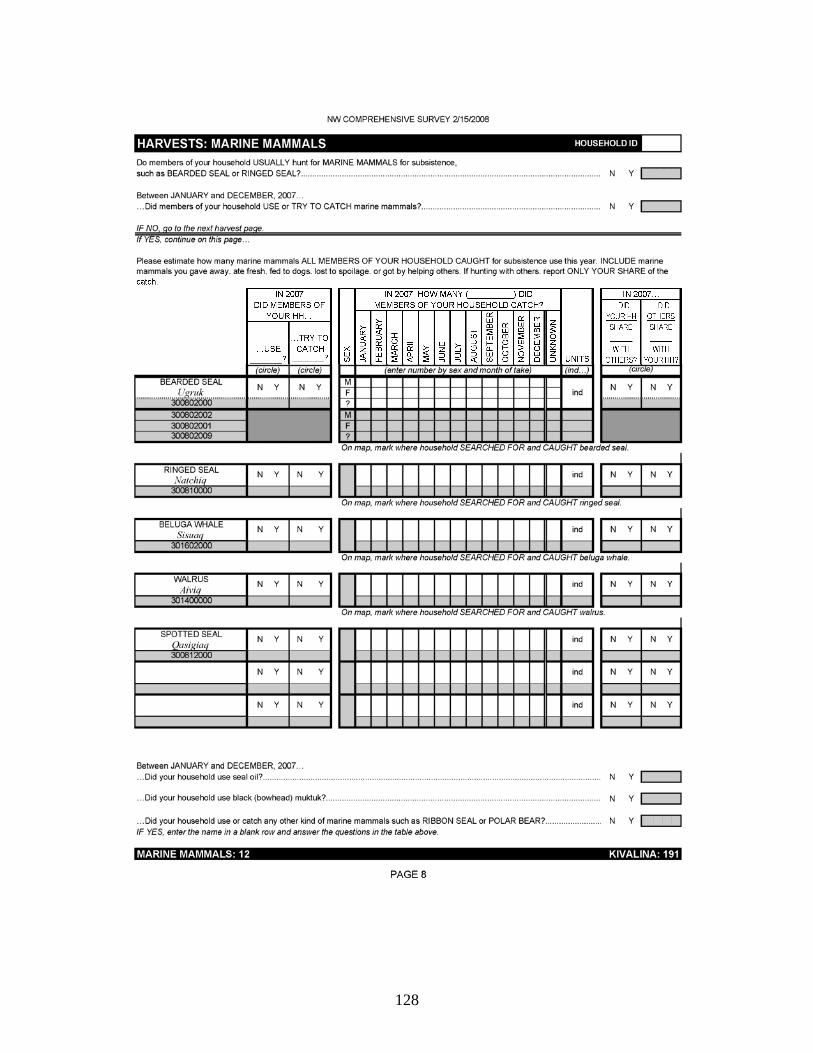
128
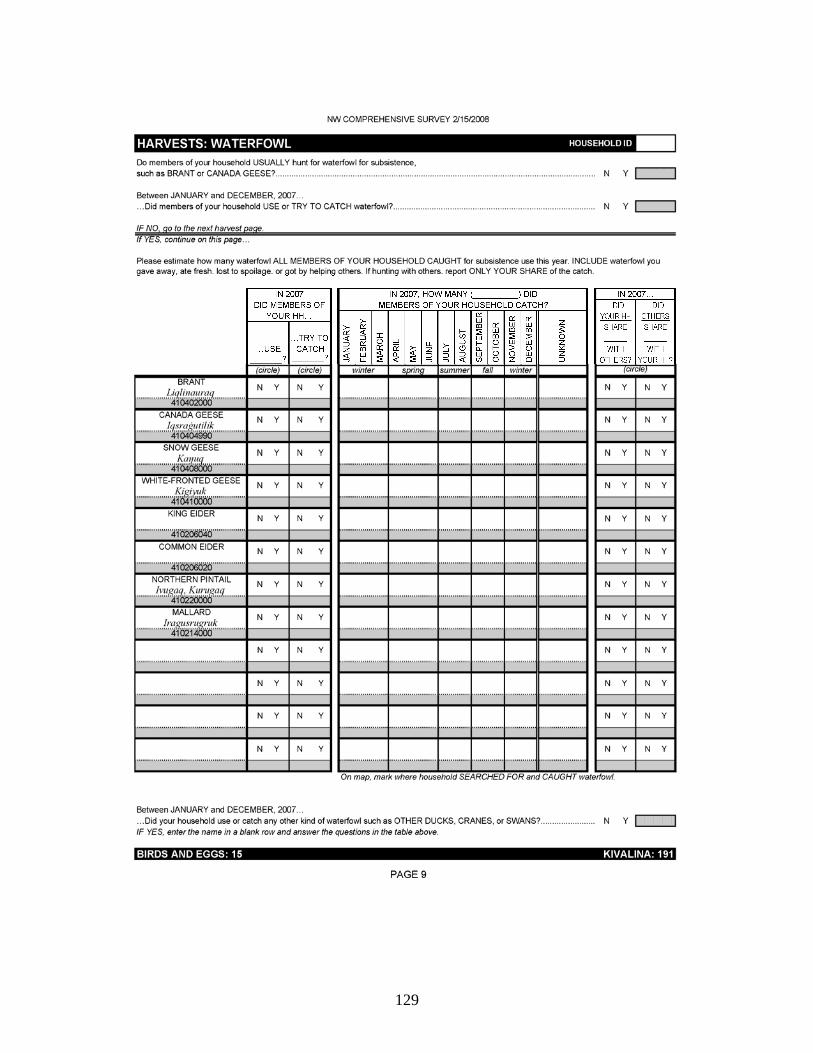
129
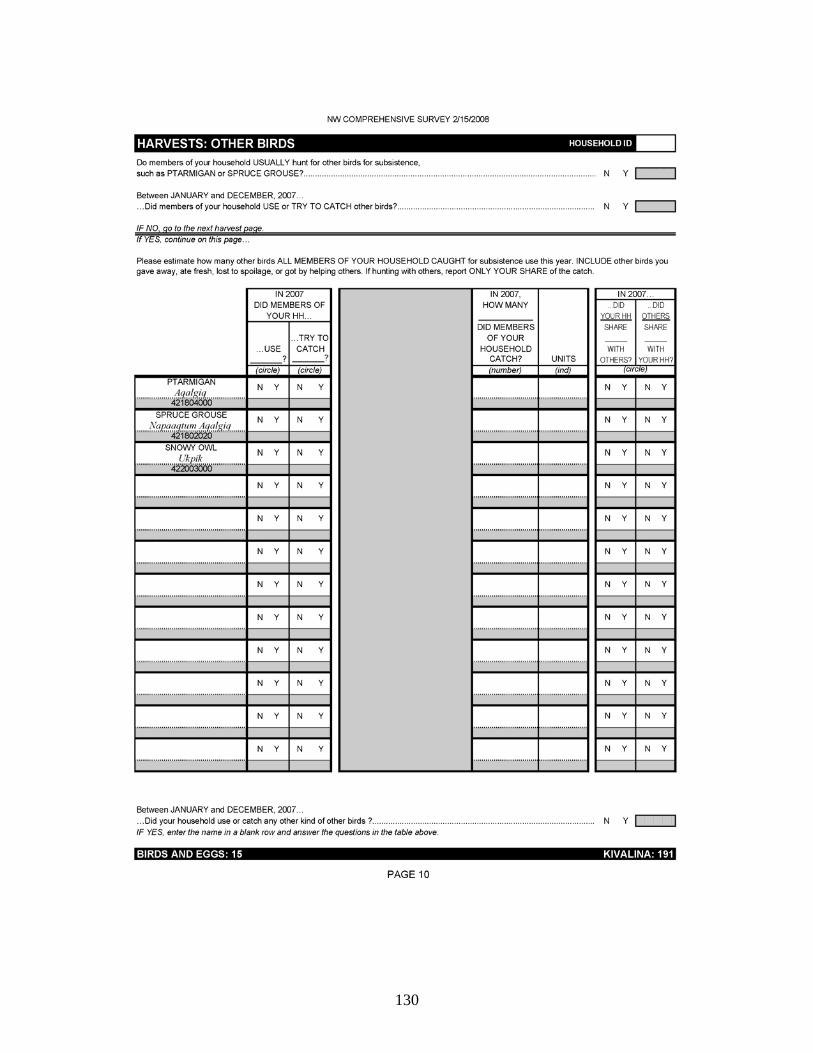
130
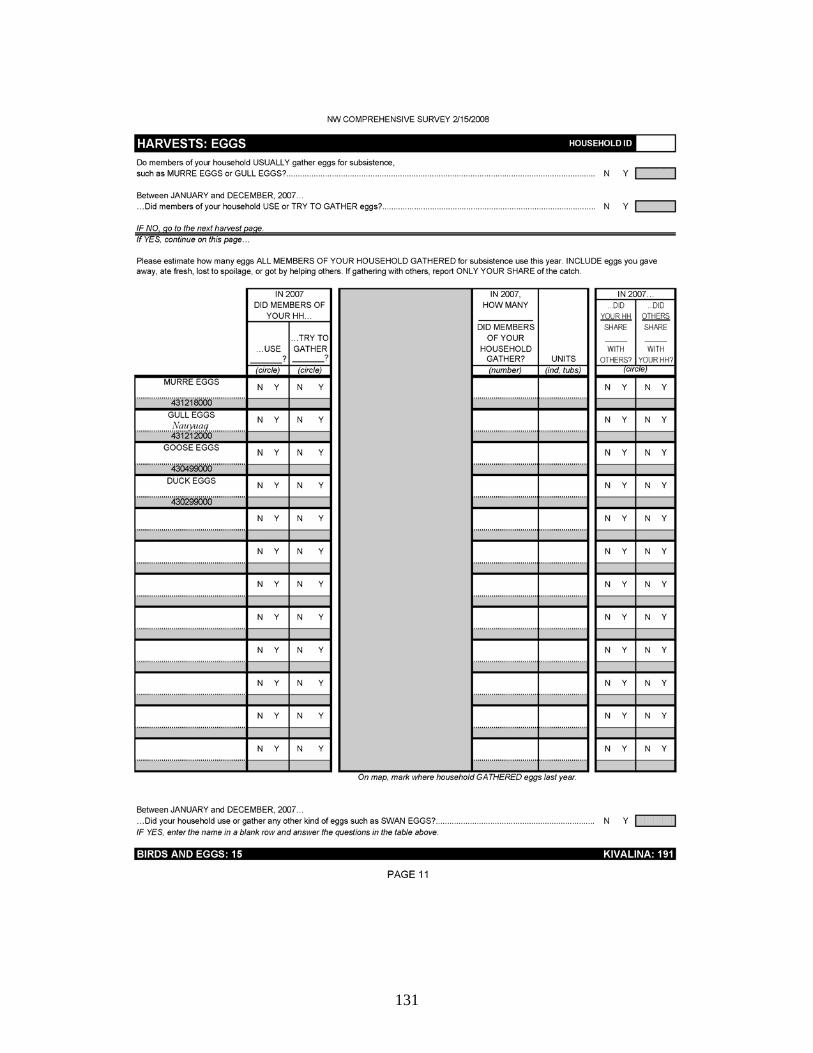
131
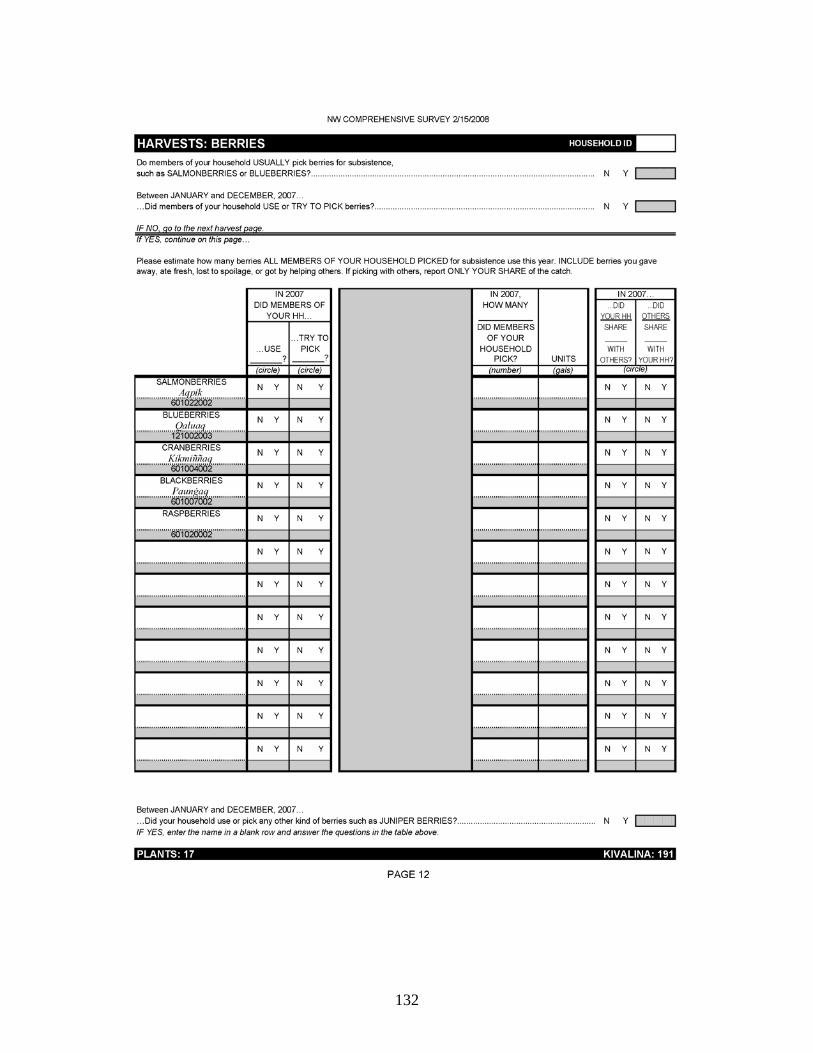
132
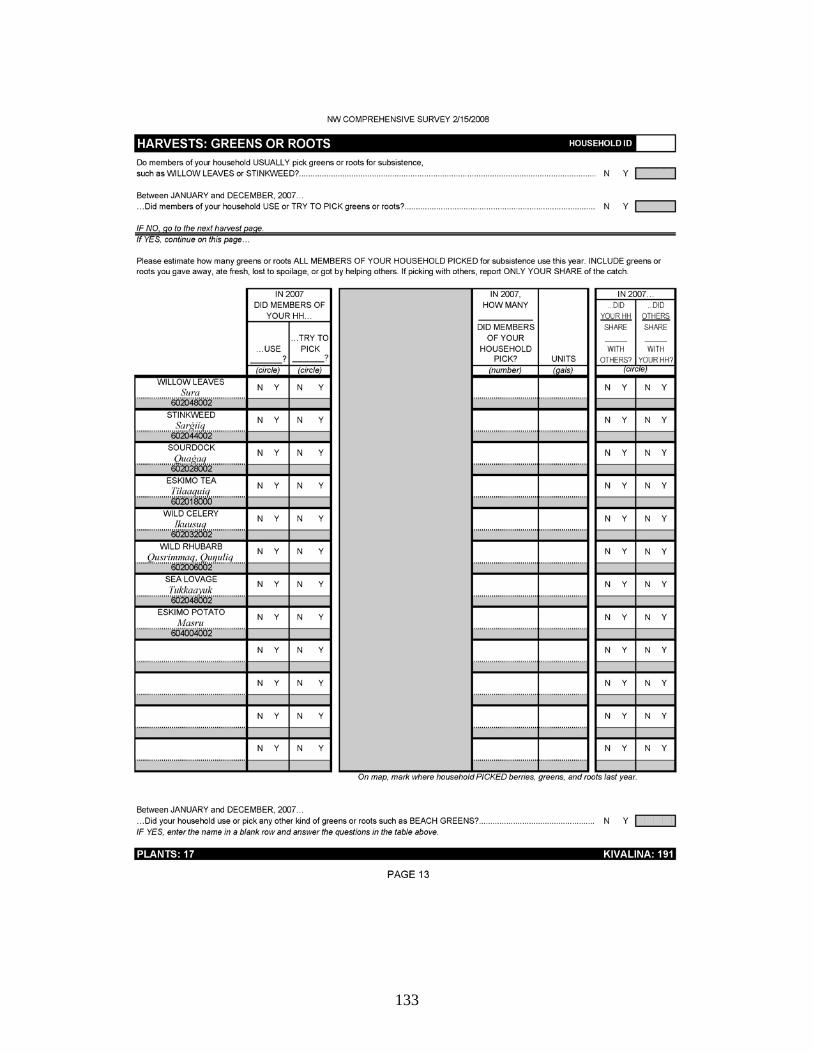
133
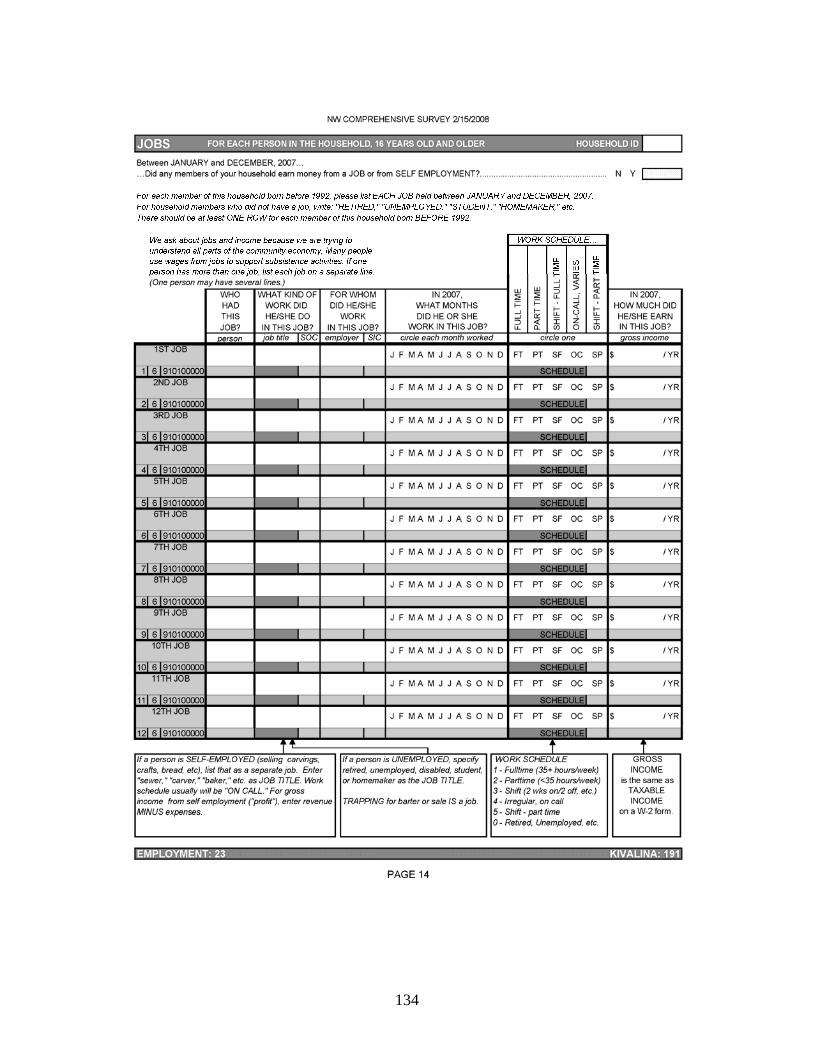
134
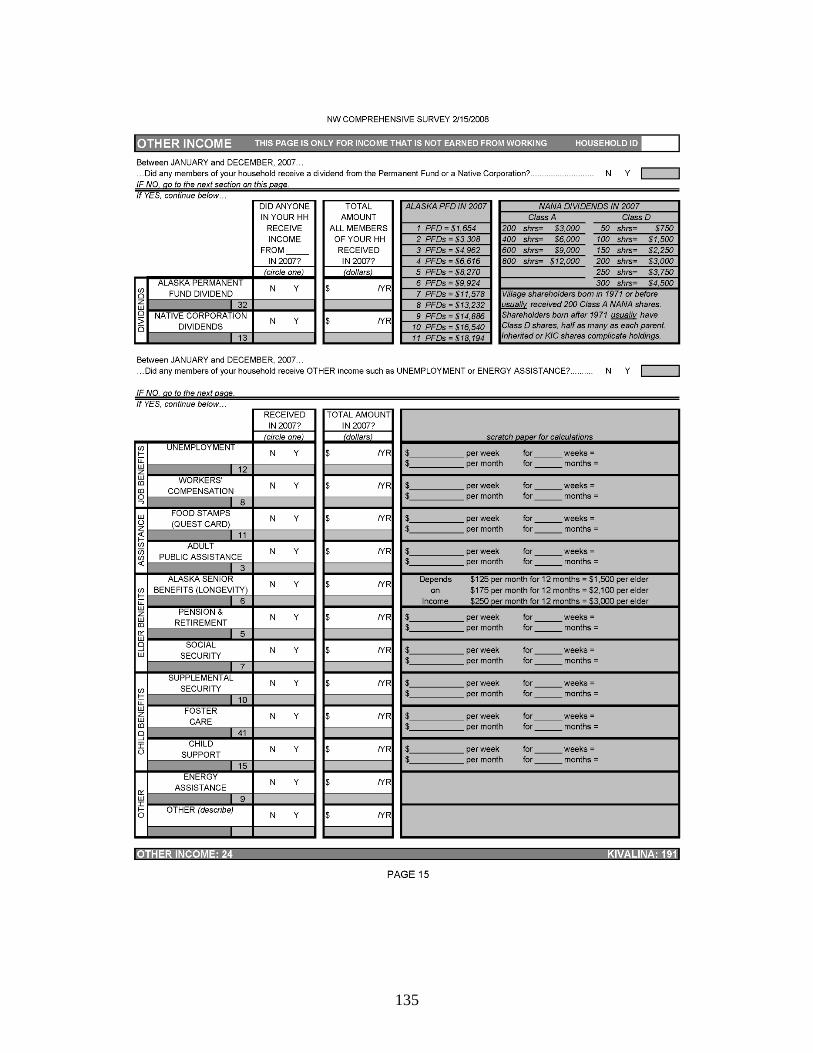
135
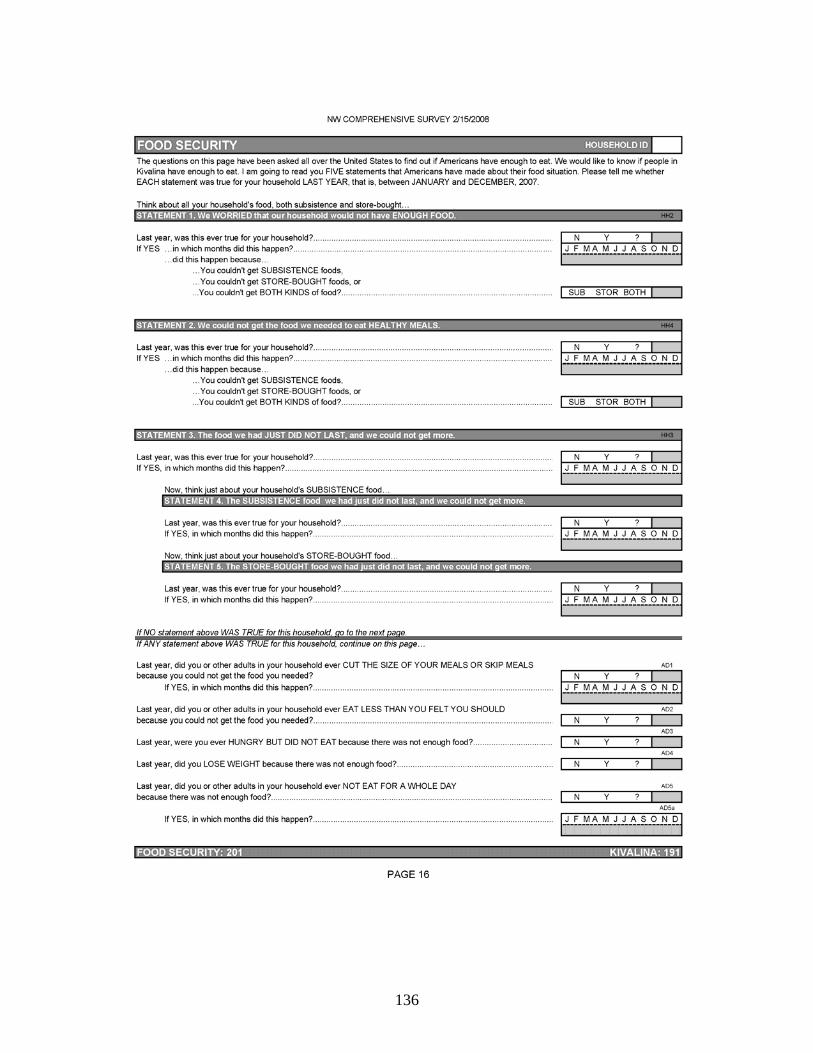
136
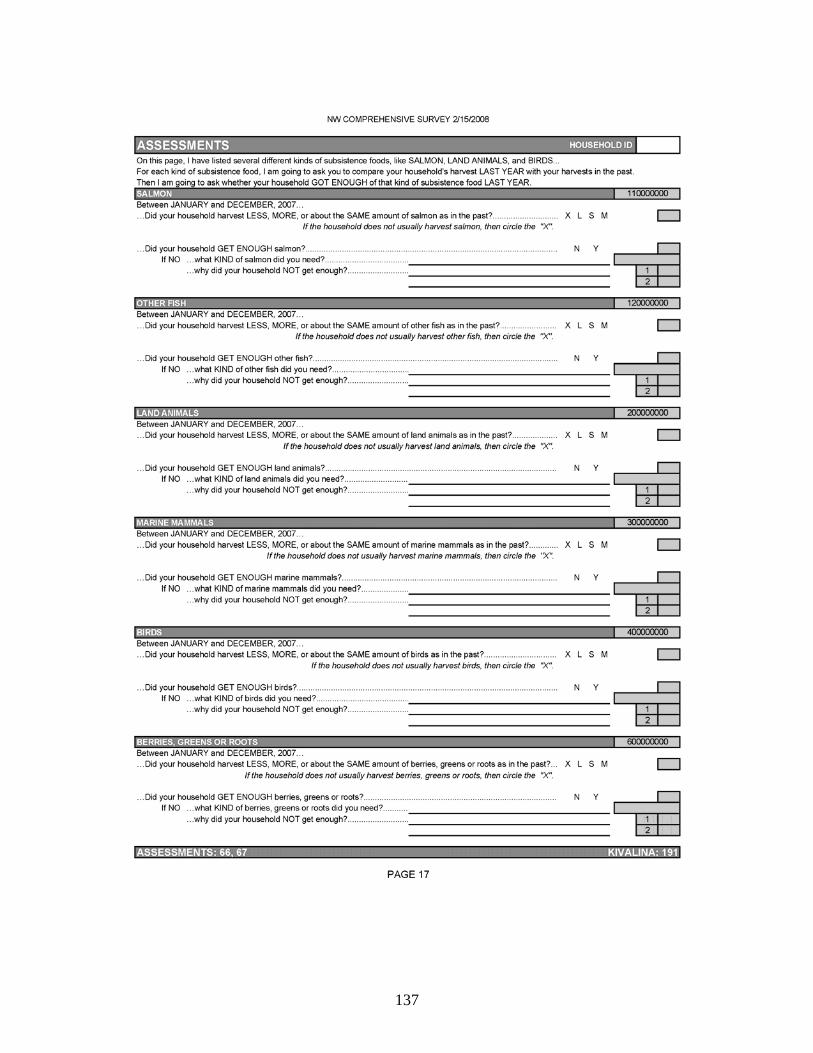
137
138
Related Documents