SUBSISTENCE HARVEST OF PACIFIC SALMON IN THE YUKON RIVER DRAINAGE, ALASKA, 1977-88 By Robert J. Walker Elizabeth F. Andrews David B. Andersen and Neil Shi shido Regional Information Report' Alaska Department of Fish and Game Division of Commercial Fisheries, AYK Region 333 Raspberry Road Anchorage, Alaska 99581 October 1989 1 The Regional Information Report Series was established in 1987 to provide an information access system for all unpublished divisional reports. These reports frequently serve diverse ad hoc informational purposes or archive basic uninterpreted data. To accommodate timely reporting of recently collected information, reports in this series undergo only limited internal review and may contain preliminary data; this information may be subsequently finalized and published in the formal literature. Consequently, these reports should not be cited without prior approval of the author or the Division of Commercial Fisheries.

Welcome message from author
This document is posted to help you gain knowledge. Please leave a comment to let me know what you think about it! Share it to your friends and learn new things together.
Transcript
SUBSISTENCE HARVEST OF PACIFIC SALMON IN THE YUKON
RIVER DRAINAGE, ALASKA, 1977-88
By
Robert J. WalkerElizabeth F. Andrews
David B. Andersenand
Neil Shi shido
Regional Information Report' No.~,
Alaska Department of Fish and GameDivision of Commercial Fisheries, AYK Region
333 Raspberry RoadAnchorage, Alaska 99581
October 1989
1 The Regional Information Report Series was established in 1987 to provide aninformation access system for all unpublished divisional reports. These reportsfrequently serve diverse ad hoc informational purposes or archive basicuninterpreted data. To accommodate timely reporting of recently collectedinformation, reports in this series undergo only limited internal review and maycontain preliminary data; this information may be subsequently finalized andpublished in the formal literature. Consequently, these reports should not becited without prior approval of the author or the Division of CommercialFisheries.
AUTHORS
Robert J. Walker is Biometrician for the Division of Subsistence, Alaska Department of FlSh and Game, 333Raspberry Road, Anchorage, Alaska, 99518.
Elizabeth F. Andrews is RegioDal Supervisor for Interior and Western Regions, Division of Subsistence,Alaska Department of FlSh and Game, 1300 College Road, Fairbanks, Alaska, 9970L
David B. Andersen is Subsistence Resource Specialist IT for Statewide Projects, Division of Subsistence,Alaska Department of FISh and Game, 1300 College Road, Fairbanks, Alaska, 99701.
Neil Shishido is FISh and Wildlife Technician m for Interior and Arctic Regions, Division of Subsistence,Alaska Department of FISh and Game, 1300 College Road, Fairbanks, Alaska, 99701.
ACKNOWLEDGEMENTS
The collection and compilation of data for this report was made possible through. the work of several otherindividuals. Vicky Lef6ngwcll provided admiDistrat:Ne support throughout. Field workers spent many hourstraveling to and working in villages throughout the drainage contacting members of over 1,300 householdsduring a two-month period. They included Jim AndersoD;-W'Jl1iam Busher, Matt Keith, Suzi Lozo, and NeilShishido. Their efforts in collecting harvest calendars and interviewing fishing households are gratefullyacknowledged. In addition, Dawn Bundick, and Heather Stillwell were instrumental in entering all data ontocomputer files in an expeditious manner. Cheryl Scott assisted with the timely production of graphs andtables. The voluntary contributions of Daniel Mardeusz deserve special recognition. His work trackingharvest calendar and reminder letter returns greatly aided the progress of the harvest data compilation.FmaIly, we would like to thank Richard Randall for providing us with the opportunity to develop and test anew methodology for recording and estimating the harvest of salmon for subsistence in Yukon River drainagecommunities.
PROJEer SPONSORSHIP
This study was financed under Cooperative Agreement No. NA-88-ABH-Q0045 related to UnitedStates/Canada negotiations pertaining to Yukon River transboundary salmon.
ii
TABLE OF CONTENTS
List of Tables _ •••_,_._. ..__ •.•••_ _ vList of F"IgUrCS. ..•_ _ ••_ _ _ _ •••_ _ viiAbstract .•__•__ . ".. .. .. .. .._ _ ..•.•...._ .•_ xi
INTRODUCrION _ _ _ _ _ _ .. .._ .. _ _ _ ,__ ._••.._ .•.•_ 1
Desaiption of the Study Area .. II •••••••••••••••••••••••••• ••_. •••••••••••••• ••••••••••••2
Description of the Subsistence F"lShcry .. . __ ..•__ _._ 2
Objectives-_.__ _ _._._._._.._ _ _ _ _.___ _ ..__ .._ _.__ _ _ _.4
lUstorial Survey and Estimation Methods.... ..._ _ ••••_ _ _ ..•__ 5
Recording Subsistence Salmon Harvests, 1988 •• _. •••••••• 5
Estimating Subsistence Salmon Harvests, 1988 ..............__ ._ _ 9
RESULTS AND DISCUSSION_.._ .._ .._ ..•_ .._. _ _._ _ _ _ _ _._••_._ _ 12
Household and FIShing Inventory••__ __ __ •__ ._•..._ 12
Sampling Results_.................. . __ _ _ _ _ 13
1988 Village, District:, and Draioage Harvest and Gear Totals. . .•••_ .. ••••_._••••_ ••••••••••••••__ 14
Comparison of 1988 and Previous Harvest Estimation Methods ....__ ......._ .••.•..•.•.•.•.•.••.........•.17
1988 Frequency of Harvests for F"1Shing Households••_ _._•••_ ...••••_ •..•._.__ _ 18
Subsistencc Harvest Levels, 1917-88 .••_ ••_ •• _ •••••...••..•••._ ........•...........•................•......19Chinook Salmon __ ••__ •••••_ •••__ ..__ __ _._ _._ _ •.•••....••.•..•...............................................19Summer Chum Salmon... __ _ _ _ _._ _ _ ••_ 20Fall Chum SalmOD. ._.__ • • .•_ •••••.__ .••.•.._ •.•.....•.•.......•..........•.........•..................21Coho Salmon._••.•••_ .•_._ _.__ ._ ••••_ _ _ ....•.............................21
District and Drainage Harvest in Pounds, 1917-88 ...._._._.•.•••.•...•• •••••.•..........................••...•............................22
Discussion and Conclusions .. _ ......•__ .__ _ _ •._ _ 23
REFERENCES CITED _ _ 25
TABLES AND FIGURES 26
111
_ .._ _ _
" _ __ _ _
_
APPENDIX L YUKON RIVER DRAINAGE SUBSISTENCE SALMON HARVESTCALENDARS,l988 . •• ._.._._•••••__ _ 112
APPENDIX 2. YUKON RIVER DRAINAGE POSTSEASON SUBSISTENCESALMON HARVES1' IN'I'ER.VIEW FORMS, 1988._ ••__ 118
APPENDIX 3. YUKON RIVER DRAINAGE SUBSISTENCE SALMON HARVEST .REMINDER. LEIIER, 1988_ _ _ _ _ 133
APPENDIX 4. YUKON MANAGEMENT AREA SUBSISTENCE SALMONFISlDN'GP~, 1988 . _._ ; 134
APPENDIX S. YUKON MANAGEMENT AREA SUBSISTENCE SALMONFISlDN'GP~ REMlNDER. LEIIER, 1988.. .. . _ _ 136
iv
_
LIST OF TABLES
Table L Yukon Area CommUDities and Dates of Community VISits forSubsistence Salmon Surveys, 1988 .. . . 26
Table 2. 1988 Yukon River SobsistcDce Salmon Project ~ampling Summary __ _ 27
Table 3. 1988 Yukon River Subsistence Salmon Project Sampling Summaryfor Those Households Identified as ·Usually Yuh" ._._.. . 28
Table 4. 1988 Yukon River Subsistence Salmon Project Sampling Summaryfor Those Households Identified as "Usually Did Not FtSh: .__ __ 29
Table 5. 1988 Yukon River Subsistcncc Harves.ut"im- ._.._ _ _ _ ••••_ _ 30
Table 6. 1988 Yukon River Chinook Salmon Subsistcncc Harvests . _ .._ _ 31
Table 7. 1988 Yukon River Summer Chum Salmon Subsistence Harvests__ _ 32
Table 8. R.eported Quantities of Salmon Removed from Commercial Catchesfor Home Uses, Selected Yukon River Communities, 1988_.. .. 33
Table 9. 1988 Yukon River Fall Chum Salmon Subsistcncc Harvests_ __ __ ._ 34
Table 10. 1988 Yukon River Coho Salmon Subsistence Harvestsi_._._..__ ._ 35
Table II Number of Households Receiving Salmon and Quantities Rec:civedfrom ADF&G Test FJShing Projects, 1988 . . _ _ 36
Table 12. Reported Use of FJShing Gear by Subsistcncc Salmon F1Shers,Yukon River Area. 1988 . ..._ .._ __ 37
Table 13. Number of People and Dogs in Surveyed Communities which ReportedInfo.rmation....... 1.1 •••• 1' It Til ••••• 38
Table 14. Sampling Statistics and Estimated Harvests for 1987 FJShingFamilies ..r.... ..._ "..,.. ,111.11... • ••••••••__ •__ •••••••••••••_ ••••••_ 39
Table 15. Harvest Estimates from 1987 F1Shing Family Methodology as aPercentage of the Estimates Using the 1988 Methodology_._ 40
Table 16. Yukon River FJShing Families by District, 1917-88. 41
Table 17. Estimated Yukon River Chinook Salmon Subsistence Harvestby Vtllage and District, 1917-88 _._ __ __ 42
Table 18. Average Number of Chinook Salmon Harvested per FIShingFamily by District, 1917-88 ••_..... . 46
Table 19. Estimated Yukon River Summer Chum Salmon Subsistence Harvestby Vtllage and District, 1917-88 ,,,,,,,_,_,,_,,, 47
·v
_
_
_
•
_
_
Table 20. Average Number of Summer Chum Salmon Harvested per FIShingFamily by District, 1977-88 .. . . 51
Table 21. Estimated Yukon River Fall Chum Salmon Subsistence Harvestby Vtllagc and District, 1977-88 _ __ _ _ 52
Table 22. Average Number of Fall Chum Salmon Harvested per FlShingFamily by District, 1977-88... _ , __ _ 56
Table 23. Estimated Yukon River Coho Salmon Subsistence Harvestby Village and District, 1977-88 . __ _ 57
Table 24. Average Number of Coho Salmon Harvested per FlShing Familyby District, 1977-88...... .. _ .._ _ 61
Table 25. Estimated Yukon River Subsistence Salmon Harvest in PoundsRound Weight of Chinook, Summer Chum, Fall Chum, and Coho SalmonCombined by Vtllagc and District, 1977-88 _._ _ _ 62
Table 26. Estimated Yukon River Subsistence Salmon Harvest in PoundsRound Weight of Chinook, Fall Chum, and Coho Salmon Combinedby Vtllagc and District, 1977-88 66
vi
UST OF FIGURES
FIg. 1. The Yukon River drainage .•__ _._ .._.__ • 70
FIg. 2. Communities and fishing districts in Alaska in the Yukon Riverdrainage .. _._ 71
FIg. 3. Frequcnc:y ofYukon River c:binook salmon subsistence catch for fishinghouseholds reporting in Alaska, districts 2, and 3, 1988._ 72
FIg. 4. Frequency of Yukon River c:binook salmon subsistence catch for fishinghouseholds reporting in Alaska, districts 4, 5, and 6, 1988__ 75
FIg. S. Frequcnc:y of Yukon River summer chum salmon subsistence catch forfishing households reporting in Alaska, districts 2, and 3, 1988••••••.•• 78
Fig. 6. Frequcnc:y of Yukon River summer chum salmon subsistence catch forfishing households reporting in Alaska, districts 4, 5, and 6, 1988.._._._.•••_ _ 81
Fig. 7. Frequency of Yukon River fall chum salmon subsistence catch forfishing households reporting in Alaska, districts 2, and 3, 1988•• 84
Fig 8. Frequcnc:y of Yukon River fall chum salmon subsistence catch forfishing households reporting in Alaska, districts 4, 5, and 6, 1988._ 87
FIg. 9. Frequency of Yukon River coho salmon subsistence catch for fishinghouseholds reporting in Alaska, districts 2, and 3, 1988 90
FIg. 10. Frequency of Yukon River coho salmon subsistence catch for fishinghouseholds reporting in Alaska, districts 4, 5, and 6, 1988 ..._••. 93
Fig. 11. Yukon River chinook salmon subsistence harvest in Alaska,by district, 1977-88__ •...•.• . ..__ 96
Fig. 12 Percentage of total Yukon River chinook salmon subsistence harvestin Alaska, by district, 1977-88 _. .. __ ._ _ 97
Fig. 13. Average Yukon River chinook salmon subsistence harvest per fishingfamily in Alaska, by district, 1977-88 __ .._.__•__ _ 98
Fig. 14. Yukon River summer chum salmon subsistence harvest in Alaska,by district, 1977-88 __•__ _._ _ _ __ 99
Fig. 15. Percentage of total Yukon River summer chum salmon subsistenceharvest in Alaska, by district, 1977-88 100
Fig. 16. Average Yukon River summer chum salmon subsistence harvest perfishing family in Alaska, by district, 1977-88 101
Fig. 17. Yukon River fall chum salmon subsistence harvest in Alaska,by district, 1977-88 102
vii
_
~ _ _
~ _ _
~ _ _
~ _
FIg. 18. Percentage of total YukoD River fall chum. subsistence harvestin Alaska, by district, 1977-88 . _.__ _ 103
FIg. 19. Average Yukon River fall chum. subsistence harvest perfisbiDg family in Alaska, by district, 1977-88 104
FIg. 20. YukoD River coho sa1moD subsisteDce harvest in Alaska,by district, 1977-88 . .. 105
FIg. 2l. Percentage of total Yukon River coho salmon subsistence harvestin Alaska, by district, 1977-88 .. . ..._ i06
Fig. 22. Average Yukon River coho salmon subsistence harvest per fisbiDgfamily in Alaska, by distrid, 1977-88 . _ _ 107
FIg. 23. Yukon River chiDook, summer chum, fall chum, and coho salmoDcombined subsistence harvest in pounds round weight in Alaska,by distrid, 1977-88 , , __ _ 108
FIg. 24. PerCCDtagC of total Yukon River cbiDook, summer chum, fall chum,and coho salmon c:ombincd subsistence harvest in pounds round weightin Alaska, by district, 1977-88 . . .••••_ _ 109
FIg. 25. Yukon River chiDook, fall chum, and coho salmoD combined subsistenceharvest in pounds round weight in Alaska, by distrid, 1977-88 • ,.. , .._ _ 110
Fig. 26. Percentage of total Yukon River cbiDook, fall chum, and coho salmoDcombined subsistence harvest in pounds round weight in Alaska,by district, 1977-88 _ _ 111
viii
_ ~ _
_
LIST OF APPENDICES
APPENDIX L YUKON RIVER DRAINAGE SUBSISTENCE SALMON HARVESTCALENDARS, 1988.
U Example of lower Yukon River (fishing districts 1, 2, and 3)harvest calendar (reduced from original 11 x 17-inch size) . •.•__ .._ ...__ .•__ •.•..•.•...•........112
1.2 Example of middle Yukon River (fishing district 4, KoyukukRiver) harvest calendar (reduced from original 11 x 17-inchsize) .. .._ _ _ 114
1.3 Example of upper Yukon River (fishing distric:ts S, 6 [TananaRiver], Clumda1ar River, and Black River) harvest calendar(reduced from original 11 x17-inch size) ._ 116
APPENDIX 2. YUKON RIVER DRAINAGE POSTSEASON SUBSISTENCESALMON HARVEST INTERVIEW FORMS, 1988
2.1 Example of lower Yukon River (fishing districts 1, 2, andRussian Mission) postseason interview form _ .._ .._ _ _ _ _.118
2.2 Example of Holy Cross postseason interview form._ . . __ ._._._ _ _ _ _ 120
2.3 Example of fishing subdistrict Y4A (Grayling, Anvik,Shageluk, Kaltag, Nulato, and Koyukuk) postse3llOD interviewform_......... .. . .. u............ .. _ _ _.__ _.._ 122
2.4 Example of middle Yukon (Y4B, Y4C) (Galena. Ruby) and Koyukuk(Huslia, Hughes, AIJakalcet, A1atDa, and BettlesjEvausville) riverspostscasoD interview form........ _ _ l2S
2.S Example of upper Yukon (YS) (Tanana, Rampart, Stevens Village,Beaver) and Tanana (Y6) (Healy, Kanrisbna River, Manley, Minto, Nenana)rivers postseason interview form _ _._ _ _ 127
2.6 Example ofupper Yukou River (YS) (Birch Creek, Veuetie, FortYukon, Circle, Central, Eagle) postseasou interview form 129
2.7 Example of Chalkyitsik postseason interview form _._ 131
APPENDIX 3. YUKON RIVER DRAINAGE SUBSISTENCE SALMON HARVESTREMINDER LETIER, 1988 133
ix
_
_
APPENDIX 4. YUKON MANAGEMENT AREA SUBSISTENCE SALMONFISliIN'G PERMIT, 1988. .. _ , .• _ _ 134
APPENDIX S. YUKON MANAGEMENT AREA SUBSISTENCE SALMONFISliIN'G PERMIT REMINDER. LETl'ER, 1988. 136
x
ABSTRACf
Salmon fishing for subsistence in the Yukon River drainage in Alaska has a long history. The harvest hasbeen documented CODSistcntly since 1961, however, survey methods and harvest reporting have varied.Successful management of the fishery and allocation among the various uses hinge on precise estimates ofsubsistence harvests. A new methodology developed for improving the estimate was used to estimate the1988 harvest.
In 1988, a comprehensive survey was implemented to create a complete list of all households in Yukon Riverdrainage communities in Alaska. Households were stratified in order to produce an estimate of salmonharvest with less variance than by using previous methods. Stratification was based on a household's regularparticipation in the subsistence salmon fishery. A total of 2,700 households were identified, 1,462 of whichwere identified as usually fishing for salmon for subsistence. Most (72.5%) of these households wereinterviewed personally in their home community. Harvests of salmon by other fishing households werereported on returned harvest calendars, survey instruments or returned reminder letters, as were harvests forhouseholds which usually do not fish for salmon. The estimated Alaska Yukon River drainage subsistenceharvest with approximate 95% confidence intervals were 44,564 +1- 3,546 chinook salmon (Oncorhynchustshawytscha); 226,754 +1- 19,835 summer chum salmon (0. 1cda); 153,809 +I· 17,665 fall chum salmon; and67,852 +1- 10,034 coho salmon (0. kisutch). The revised methodology showed a 30 percent improvementoverall in harvest estimation. That is, the previous methodology would have accounted for only 70 percent ofthe estimated 1988 harvest, although difference varied by species and fishing district. Updating of householdand fishing household lists, and intCDSive effort to contad: most fishing households were also consideredimportant factors in an improved estimate.
Keywords: salmon, chinook salmon, chum salmon, coho salmon, subsistencefishing, Yukon River, Alaska, harvests
xi
INTRODUCTION
The Yukon River drainage is the largest in Alaska (Ftg. 1) and has provided in recent years the largest
production of salmon for subsistence use of any area in the state, nearly four million pounds in 1988. The
earliest historic accounts of exploratioDs in the area attested to the harvest of salmon and its importance for
subsistence use (Zagoskin [1847] 1967; Schwatka 1893; Allen 1887) to people inhabiting the drainage. The
importance of salmon for subsistence was underscored after the onset of commercial fishing operations at the
mouth of the Yukon River in 1918. This caused grave concern among area residents over the continued
availability of salmon for subsistence, and prompted a special investigation by the federal government
(Gilbert and O'Malley 1921). From that time until about 1959 when Alaska became a state, commercial
fishing was intermittent (Wolfe 1984). Since 1959, both domestic and foreign salmon fisheries increased in
production and conccm for the Yukon River subsistence fishery persisted.
The Alaska fish and game law (Title 16) requires that fishery resources be •conserved in a manner
consistent with the sustained-yield principle" (AS. 16) State law also requires that the highest priority be
given to subsistence uses as long as sustained yield of the resource is provided (ch. 52, SLA 1986). In addition
to mandating the conservation of fisheries, the state is also charged with their commercial development.
These legal measures provide the framework for the allocation of fishery resources, such as Yukon River
salmon, among subsistence and commercial uses. An additional consideration in the allocation of Yukon
River salmon arc treaty negotiations with the Canadian government that have been conducted since 1985.
Management of the Yukon River salmon fisheries requires a determination of the allowable harvest
consistent with maintaining sustained-yield of the salmon stocks. After determining the necessary
escapement levels, surplus salmon may be allocated among different uses. The number of salmon necessary
for subsistence are considered first among these uses. As subsistence use of Yukon River drainage salmon
stocks is significant, conserving, managing, and allocating salmon in the Yukon River drainage rests on having
reliable data on subsistence salmon harvests.
Since 1958, the state of Alaska has collected data on subsistence salmon harvests of Yukon River salmon.
Although information is available for 1958-1960, the methodologies used in these years have not been
1
documented. From 1961 to 1987, methods used for data collection have varied. In 1988, a new method was
developed and subsequently used to achieve the objective of improving harvest reporting and the estimation
of the total harvest.
This report desaibes the methodologies used for dOQJDlenting subsistence salmon harvests and estimating
the total harvest within the Alaska portion of the drainage. It concludes with an evaluation of the
methodologies based on the results of the 1988 study. in addition, harvest levels of salmon used for
subsistence for each year since 1m arc reported in order to provide a context within which to eDIDine the
1988 estimated harvest.
Description ofthtl Study Area
The Yukon River drainage in Alaska is the largest in the state and drains approximately 35 percent of
Alaska's land mass. Although the river originates in the province of British Columbia in Canada, it flows
approximately 1,200 miles from the United States/Canada border, 7 miles upriver from the village of Eagle,
downstream to the its mouth where it empties into the Bering Sea (Fig. 1). Major tributaries of the Yukon
River in Alaska include the Porcupine, Tanana, Koyukuk. and Innako rivers. Some 40 communities which
fish for Yukon River stocks of Pacific salmon are located within the area (FIg. 2). The population of these
communities was approximately 11,000 people of primarily Yup'ik Eskimo and Athabaskan Indian descent in
1985 (Alaska Department of Labor 1987). These include two communities along the eastern Bering Sea
coast which harvest salmon bound for the Yukon River drainage.
Descripdon ofthe Subsistence. Salmon Fishery
All five species of Pacific salmon occur within the Yukon River drainage in Alaska. However, their
distribution and abundance varies throughout. These species are chinook salmon (Oncorhynchus
tshawytscha), chum salmon (0. /ceta), coho salmon (0. kisutch), pink salmon (0. gorbuscha), and sockeye (0.
2
nerlca). All five species have been harvested for subsistence use by community residents in the drainage,
although sockeye salmon occur in insignificant numbers and are only rarely caught1.
Salmon fishing oa:urs from late May through October, although this varies throughout the drainage.
FlShing activities are based either from a fish camp or the home village, however, the degree to which one or
the other is more prevalent has varied from commUDity to commUDity. Some people from communities not
situated along the Yukon River operated fish camps along it, and these have included Birch Creek, Venetie,
and some residents of Chalkyitsik. Subsistence salmon fishing was often undertaken by extended family
groups representing two or several households in a commUDity. These groups, as well as members of
individual households, cooperated to harvest, cut, dry, smoke, and store salmon for subsistence use. Many
people who fished for subsistence also operated as commercial fishermen in districts where commercial
fishing has been allowed and families had a member with a Commercial FISheries Entry Commission (CFEC)
permit.
Drift gill nets, set gill nets, beach seines, and fish whccJs have been used for taking salmon in recent years,
although weirs, fish traps, and dip nets were used historically. Allowable fishing gear has not included the use
of weirs and fish traps for over 20 years. In more recent years the usc of drift nets for subsistence fishing has
been limited by regulation to areas in the lower portions of the Yukon River drainage, although the use of set
nets has also occurred. In the middle and upper portions of the Yukon River drainage, subsistence salmon
fishing has occ:urrcd with the use of fish wheels and set nets, depending upon the area where fishing occurred
and the species targeted.
In Alaska, the Yukon River drainage was divided into six commercial fISheries management districtS (Fig.
2). Since 1974, there have been five districts along the main stem of the Yukon River three in the lower
river region (Yl, Y2, Y3), one in the middle river region (Y4), and one in the upper region (Y5) _. and a sixth
lIn the state of Alaska, subsistence fishing is defined as "the taking of, fishing for, or possession of fishmby aresident domiciled in a rural area of the state for subsistence uses...;" subsistence uses "means thenoncommercial, customary and traditional uses in Alaska of wild, renewable resources by a residentdomiciled in a rural area of the state for direct personal or family consumption as food, shelter, fuel, clothing.tools, or transportation.••;" and rural area "means a community or area of the state in which thenoncommercial, customary, and traditional use of fish or game for personal or family consumption is aprincipal characteristic of the economy of the community or area" (Sec. 16.05.940). The greater Fairbanksarea of the Yukon River drainage has been designated as nonrural, and, therefore, the harvest of salmon byresidents in that area were not included in this study.
3
-
district (Y6) in the lower and middle Tanana River area. Subsistence salmon harvests from the Koyukuk
River drainage have been included with District 4, and harvests from the Chandalar and Porcupine River
drainages with District 5 (Fig. 2).
In general, since the early 196Os, subsistence fishing has been managed and regulated to coincide with
the commercial salmon fishing periods. The time allowed for subsistence fishing has, therefore,
corresponded to fishing time restrictions in the commercial salmon fishery. Between 1961 and 1980,
commercial fishing time throughout the drainage has been progressively reduced. By the mid 1970s,
subsistence salmon fishing time had been reduced to two days per week in the lower Yukon River districts
during the chinook and early chum salmon runs, and to five days per week in the middle and upper Yukon
River districts for all species. Since then, subsistence and commercial fishing time has been further reduced
to four days per week in the middle and upper river districts, and beginning in 1988 to 84 hours per week in
the Tanana River district. In some areas, additional time has been added to provide for subsistence salmon
fishing (a 24-hour period every other weekend in the lower Yukon districts and five days per week in a
portion of the Tanana River district). Along the Koyukuk, Chandalar, and Porcupine rivers, including Black
River, and in Hooper and Scammon bays, subsistence salmon fishing time has not been restricted.
Objectives
The primary objective of the 1988 subsistence salmon harvest survey was to develop and implement a
revised harvest reporting and estimation procedure for determining harvest levels by species for each
community in Alaska harvesting Yukon River stocks for subsistence. Secondarily, the 1988 study had
additional objective to: (1) update community household lists and identify salmon fishing households in each
community; (2) evaluate the precision and accuracy of the estimated harvest using the new methodology and
compared to the previously used methodology; (3) compile information on fIShing effort (number of
households participating), gear types, and timing of the subsistence harvest; (4) identify subsistence salmon
harvest issues; and (5) summarize and interpret subsistence salmon harvest data since 1m.
4
METHODS
lilStOricai Survey and Estimation Methods
Since 1958, the state of Alaska has collected data on subsistence harvcsts of Yukon River salmon.
Although information is available for 1958-60, the methodologies used in those years have not been
documented. From 1961 to 1987 methods used for data collection have varied. Thcse methods have included
traveling to each fish camp to count salmon as they were being preserved in smokehouses; sending calendars
to known fishing familics to record their harvest on a daily basis; traveling to villagcs and interviewing.fishing
families after the fishing season to record their harvest; contacting people by mail or telephone after the
season to record their harvest; issuing subsistence salmon harvest permits for certain areas; and using a
combination of these meth~ (Alaska Department of FISh and Game 1962; Alaska Department of FISh and
Game 1987; Brannian et ai. 1987). An extrapolation method has been used to estimate total harvest of all
known fishing families.
Recording Subsistence Salmon Harvests, 1988
In 1988, a new method was developed and subsequendy used"to achieve the objective of improving harvest
reporting and the estimation of the total subsistence salmon harvest. The fIrst step toward improving the
accuracy of harvest estimatcs was to improve existing information on the number of households engaged in
salmon fishing. That is, the total harvcst estimate could be improved by having a more accurate count of the
number of households participating in the IlShery. The 1988 study had the objective of censusing subsistence
salmon harvests of all Yukon River drainage households, excluding the non-rural areas including Fairbanks.
Household members lived in 40 communities situated along 1,200 miles of the Yukon River in addition to its
tributarics (Fig. 2). The total population was about 11,300 people in 1985 (Alaska Department of Labor
1987). Total number of households was previously undocumented. In 1987, there were an estimated 1,097
"fIShing familics' living within this area. A fIShing family represented at least one household unit, but more in
5
some cases. Residents of these communities were predominantly Alaskan Native representing Yup'ik
Eskimo near the mouth of the river and several Athabaskan Indian groups elsewhere in the drainage.
Community populations ranged from 20 to 98 percent Native with only four communities having a population
which was less than 50 percent Alaska Native. Existing studies had shown that in some Yukon River drainage
communities, up to 78 petcent of the households participated in salmon fishing in the upper reaches of the
drainage (Andrews 1988a; Sumida 1988) and'even a larger proportion near the mouth of the Yukon River
(Wolfe 1981). Thus, the number of"fishiDg households" in the Yukon River drainage may far exceed the
number of "fishing families."
The goal of recording harvests of all households whether or not they were included on previous lists of
fishing families was a departure from the methodology used in previous surveys (since 1961). Prior to 1988,
subsistence salmon harvest studies had attempted to sample community households by recording harvests
only of families identified as fishing families. This measure attempted to include the harvests of all
households within the fishing family group. Other studies in the.l98Os had shown that there were families in
some communities that fished for salmon for subsistence, but were not included on Department "fishing
family" lists. These studies revealed the discrepancy between estimates based on censusing all households
and those based on a sample of fishing families (Andrews 1988a; Sumida 1988). In addition, the dynamics of
participation in salmon fishing indicated that often there were households in a community that did not fish for
one or several seasons, but subsequently began to fish; whereas other households no longer fished. This was
often a result of changes in household composition, such as the household becoming smaller when younger
members marry and form new households.
In spring 1988, an inventory was made of all households in Yukon River drainage communities in Alaska
that fIshed for salmon for subsistence. In addition, each household was identifIed as one that "usually fIshed"
or "did not usually flsh." Although the 1987 "fishing family" lists and village household lists previously
compiled by the Division of Subsistence were used, the inventory and classifIcation were made primarily
during fIeld visits to almost all communities (34 of 40 communities were visited). Within these communities
researchers worked with key respondents to list all community households and classifIed them according to
participation in subsistence salmon flShing. For communities where household and flShing household lists
6
were available from previous subsistence studies in the 198Os, these were updated. In six cases (Alatna,
Allakaket, Beaver, Circle, Hughes, and Huslia), key respondents from villages were interviewed while in
Fairbanks on other business. Information for four communities (Hooper Bay, Scammon Bay, Central and
Birch Creek) and one area peripheral to the fishing areas of the drainage (Kantishna River) was not collected
during the preseason inventory due to time and budget constraints.
Several changes were also made in the methods for recording subsistence salmon harvests. F'11"St, it was
determined the study should seek data on salmon harvests from each household rather than a sample of
fishing families. The household unit was selected for the purpose of systematically updating the list of
participants in salmon fishing and to help reduce duplicate counts of salmon harvests or omissions. This
approach also aided in maintaining a more accurate list of current fishing households given the dynamism of
participation in salmon fishing. Each household identified was assigned a unique number in order to track
information related to the household. Households that may not usually fish, but periodically chose to do so
would not be omitted. Furthermore, this helped reduce the number of households that may have been
incorrectly classified in the preseason inventory. By stratifying all households into two strata, "usually fIShed"
and "usually did not fish," an estimate could be made of the number of fish taken by those classified as not
usually fishing and included in the total estimate for the drainage. In 1988, for the first time, harvest
calendars were sent to all households (2,700+) identified in the preseason inventory for collecting harvest
data from all households.
A second change in data collection was made to the harvest calendar itself. Three similar, but different
calendars were used for different segments of the drainage (lower, middle, and upper)2 (Appendix 1). Each
calendar, as in the past, was designed for recording the harvest of each species on a daily basis. However, the
calendar was modified in three major ways. F'U'St, it indicated only those species which occurred in each of
the three segments of the drainage. Second, species were identified by both their common name and the
term used by local residents as these varied within the drainage. For example, along the lower Yukon River
fall chum salmon3 were generally referred to as "fall chum," but along the middle and upper portions of the
zrhe lower Yukon River includes commercial fisheries management Districts 1, 2, and 3; the middle riverincludes fishing District 4 and the Koyukuk River, and the upper river includes fIshing Districts 5 and 6, aswell as the Chandalar and Black rivers.
7
river, they were called "silvers." "Silvers," in tum, were distinguished from coho salmon which in some areas
were referred to as "chinook." Third, the revised calendar included only those months during which people
fished for salmon in each section of the drainage. For example, May through August along the lower river
and July through October along the upper river. These changes were not only intended to improve accuracy
of reporting, but also to facilitate the entry of data into computer files. Data entry was also facilitated by
printing calendars for each of the three sections on different colored paper. The harvest. calendar was the
only instrument used capable of recording timing of harvest by species on a daily and monthly basis.
A third component in data collection was the postseason field survey. Following the fishing season, field
workers were sent to each of the communities to pick up harvest calendars and administer a short
questioDDaire to each household. Table 1 identifies the dates of community visits. The questionnaire
(Appendix 2) served to collect harvest information if the salmon harvest calendar had not been used or was
partially used, and also to record information on fishing gear used, household size, number of dogs fed
salmon, and number of salmon fed to dogs4. Questions regarding fishing with other households were
specifically designed to avoid duplicate counting of fish caught cooperatively and shared between households.
Comments on salmon runs, fishing conditions, and regulations were also requested. In addition to this core
set of questions which were asked in all locations, other questions suggested by fishery managers were asked
in certain communities. For example, the questioDDaire used in Holy Cross and Shageluk contained
questions to determine if subsistence salmon were caught in the Innoko River or the Yukon River.
Postseason work was staggered to coincide with the close of the salmon fishing season in each section.
Lower Yukon River communities were surveyed in September, the middle river section in late September and
early October, and the upper river section in October (Table 1). Field researchers attempted to contact all
3 Summer and fall chum salmon are two distinct runs of chum salmon which enter the Yukon River.Summer chum salmon are chiefly characterized by earlier run timing (early June mid-July), rapidmaturation in freshwater, smaller size (average 6-7 pounds) and larger population. Summer chum salmonspawn primarily in run-off streams in the lower 500 miles of the drainage and in the Tanana River system.Fall chum salmon are mainly distinguished by later run timing (mid-July early September), robust bodyshape and bright silvery appearance, larger size (average 7-8 pounds) and smaller population. Fall chumsalmon spawn in the upper portion of the drainage in streams which are spring fed, usually remaining ice-freeduring the winter.
4As subsistence uses of wild resources includes uses for "transportation," salmon taken and used for feedingdogs which are used for other subsistence activities are included in the salmon harvest estimates. Salmonspecies used for feeding dogs included chum and coho.
8
-
-
households identified as "usually fished- first. If time permitted, other households were contacted about their
salmon fishing activities, if any. During these village visits, the preseason inventory of households was
updated also. In 1988, questionnaires were administered to households in all communities except Hooper
Bay, Scammon Bay, and Birch Creek. Harvests of households in these communities were determined by mail
from the return of harvest calendars or -reminder letters- described below (Appendix 3).
The fourth important and additional source of harvest data for the 1988 fishing season was from the return
of reminder letters. In November and December, these letters (Appendix 3) were mailed to approximately
l.S00 households that had not reported a harvest by means of returning a harvest calendar, through a
postseason personal interview, or a 1988 Yukon River subsistence salmon fishing permit (required for fishing
households in subdistricts 6A and 6B and certain areas in District 5 [Appendix 4], but similar to the voluntary
harvest calendar). The letter (with a prepaid preaddressed envelope enclosed) simply requested information
as to whether or not a household member fished for salmon for subsistence, and, if so, the number caught of
each species. Similarly, a reminder letter was sent to permit holders for recording harvests (Appendix 5).
Estimating Subsistence Salmon Harvests
Ideally, salmon harvest information from every household in a community would be collected. However,
dUe to manpower and fiscal constraints, this was not possible and information from a subset of households
must be used. If the information from the subset of households can be considered to be a representative
sample of the population, inferences about the larger defined population can be made from the information
gathered.
However, this use of "random" information is often very inefficient. For a heterogeneous population
statistical estimates for characteristics (means, totals, percentages) of the population provided by the "random
sample" may be very imprecise. Perhaps only a few households are involved in a certain harvest activity, or a
few households harvest the majority of salmon within a community. Under these conditions it would take a
large sample fraction to guarantee that these households would be included in the sample, and care must be
9
taken that an overemphasis on sampling these households not be made so that the "random sample"
assumption not be violated.
One relatively straightforward sampling alternative to the random sample approach is the stratified
sample. Under this design households within the community are precategorized into groups, or strata. For
the Yukon River drainage subsistence salmon projCct, households were identified preseason as "usually
fished" or "usually did not fish". Information was gathered from households in each of the groups, but an
emphasis was made on contacting households in the "usually fished" group during village surveys. In order to
calculate community level statistics, strata level statistics are calculated and combined after adjusting for
disproportionate sampling intensity within each stratum.. In effect, an overemphasis on contacting households
more likely to participate in subsistence salmon harvesting can be made and information thus gathered can be
used in the correct perspective in order to calculate community level statistics.
A further refinement to previously used methodologies is the use of a "finite population correction factor"
in the calculation of variances associated with sample statistics. Variance is a measure of the imprecision of a
statistical estimate (i.e., the reliability of the estimate). The effect of the finite population correction factor is
to reduce the variance of an estimate as the relative sample size inc::reases. As the sample size approaches the
size of the population, the variance approaches zero, which is intuitively correct as there is no variation
associated with a statistic calculated from a censused population. Cochran (1977) suggests this adjustment
factor be used when 10 percent or more of the population is sampled. For the Yukon River drainage
subsistence salmon project, information was collected from 74 percent of the households defmed within the
drainage, and between 2S and 100 percent of the households within individual communities.
Data from the four information sources (subsistence salmon harvest calendars, community surveys,
reminder letters and subsistence salmon permits) were entered into a microcomputer database. Data were
verified against source documents, and several logic checks of the data were made. The master list of names
and addresses of resident households was updated to reflect changes in household composition and number
10
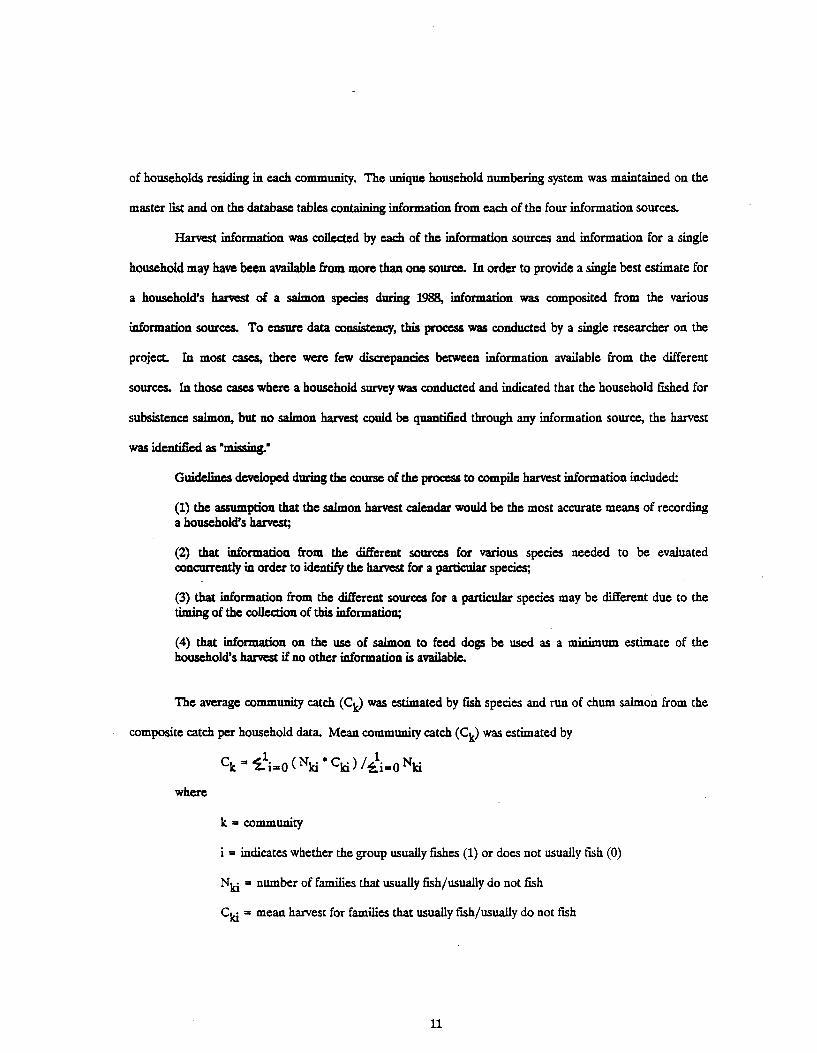
of households residing in each community. The unique household numbering system was maintained on the
master list and on the database tables containing information from each of the four information sources.
Harvest information was collected by each of the information sources and information for a single
household may have been available from more than one source. In order to provide a single best estimate for
a household's harvest of a salmon species during 1988, information was composited from the various
information sources. To ensure data consistency, this process was conducted by a single researcher on the
project. In most cases, there were few discrepancies between information available from the different
sources. In those cases where a household survey was conducted and indicated that the household fished for
subsistence salmon, but no salmon harvest could be quantified through any information source, the harvest
was identified as "missing."
Guidelines developed during the course of the process to compile harvest information included:
(1) the assumption that the salmon harvest calendar would be the most accurate means of recordinga household's harvest;
(2) that information from the different sources for various species needed to be evaluatedconcurrently in order to identify the harvest for a particular species;
(3) that information from the different sources for a particular species may be different due to thetiming of the collection of this information;
(4) that information on the use of salmon to feed dogs be used as a minimum estimate of thehousehold's harvest if no other information is available.
The average community catch (Ck) was estimated by fish species and run of chum salmon from the
composite catch per household data. Mean community catch (Ck) was estimated by
Ck ,. "Z.\=O (Nki • Cki ) / li=O Nki
where
k ,. community
i = indicates whether the group usually ftshes (1) or does not usually ftsh (0)
Nki number of families that usually fISh/usually do not fISh
Cki =mean harvest for families that usually fish/usually do not fISh
11
=

The total community catch (Tk) was estimated by
Tk .. t. \=0 (Nki • Cn )
and its variance (Vk) includes a finite population correction factor
Vk .. £\"0 «Nki2) (1- (nki / Nki » (s,~l / nki»
where
.. number of families for which information is available that usually fish/usually do not
ski2 .. variance for the amount harvested for the usually fish/usually do not fish groups.
CommUDity catch estimates and their variances were summed aaoss commUDities for district or
fishing area subtotals and aaoss all districts and fishing areas for drainage totals. CommUDity catches were
considered strata and the drainage wide variance was the sum of the variances of community catches.
Calculated variances do not account for any form. of measurement error.
Total estimates for community, district, fishing area and total drainage harvests are reported with
approximate 95 percent confidence intervals (two standard errors of the totals).
RESULTS AND DISCUSSION
Household and FIShing Inventory
The preseason inventory identified a total of 2,536 households in 40 Yukon River drainage commUDities.
Of these, 1,495 households, or 59 percent of the tota.!. usually fished for salmon for subsistence purposes
(Andrews 1988b). The inventory indicated that up to 398 (36 percent) additional households fIShed for
salmon for subsistence than previous records indicated. In addition, 170 households were identified in
commUDities peripheral to the Yukon River drainage (Centra.!. Healy, Hooper Bay, Kantishna River,
Scammon Bay) which subsistence fish Yukon River salmon stocks. Since some households worked together
to harvest and process salmon for subsistence use, there was not a direct correlation between fIShing
households and fishing families. Identifying all households in the community not only served to determine
12
~
the percentage of fishing households per community and drainage-wide, but also was deemed necessary for
implementing a new methodology for estimating total harvest as described in the section below. Postseason
survey work included updating household and fishing household lists that had been compiled prior to the
season. The total number of Yukon River drainage households (excluding peripheral communities)
remained nearly the same (2,S21 households), as did the number of identified fishing households (1,451),
between preseason and postseason surveys.
Sampling Results
Surveys were conducted with 1,328 households. Households that were surveyed included 73 percent of
households that usually fished and 49 percent of all households in the drainage (Tables 2 and 3). Previous
records of the Division of Commercial FISheries indicated there were 162 fishing households in the three
communities (Hooper Bay. Scammon Bay. and Birch Creek) not.visited of which 29 percent (48 households)
contributed 1988 harvest data by return maiL Approximately 33 percent of thC6C fishing households to whom
reminder letters;(eturned them with the requested information (529 of approximately 15(0). This data
collection method was an important source of harvest information for households in the stratum 'usually did
not fish.' Flfty-eight percent of the households in this group for which there is postseason information were
contacted by mail (Table 4). Among households contacted, fewer households (38 percent) in this category
than those that usually fish (86 percent) were contacted during field visits. The data from the field visits and
reminder letters contnbuted to estimating harvests of households that usually do not fish as described in the
following section. It was also an important source of harvest data for households in the three communities
not visited by field workers.
Of the 1,929 households for which there is any harvest information, 950 (49 percent) fIShed for salmon for
subsistence purposes in 1988. This included 63 percent of those households that usually fISh for salmon.
13
~~
1988 Village, District, and Drainage Harvest and GetlT Totals
The 1988 harvest estimates for the Yukon River area were 44,564 chinook salmon; 226,754 summer
chum; 153,809 fall chum; and 67,852 coho (Table 5). The harvest estimate for each species is discussed
separately below.
Sample information, harvest estimates and confidenc:c intervals by community and fishing area for
chinook salmon are presented in Table 6. The 1988 harvest estimate was 44,564 chinook with an approximate
95 percent confidence interval of + j- 3,546 fish (or + j- 8 percent of the estimated total). Harvest estimates
for 5 of the 6 fishing districts had levels of precision within 15 percent of the estimated totals. The reported
harvest was 75 percent of the expanded estimated total. Over one-third of the chinook harvest was made by
households residing in fishing District 5, and one-fifth by households residing in fishing District 4. These
districts contained 43 percent of the defined households in the study area. Tanana (3,232 fish), Rampart
(3,145), Stevens Village (2,845), and Nenana (3,841) were the main chinook salmon harvesting communities.
Households that usually fish accounted for 90 percent of the reported chinook salmon harvest and 84
percent of the expanded estimated total. About one-half of the households that usually fish and for which
there was harvest information harvested chinook salmon, while only seven percent of the households that
usually do not fish and for which there was harvest information harvested this species.
Sample information, harvest estimates and confidence intervals by community and fIShing area for
summer chum salmon are presented in Table 7. The 1988 harvest estimate was 226,754 summer chum with
an approximate 95 percent confidence interval of + j- 19,835 fish (or + j- 9 percent of the estimated total).
Harvest estimates for fishing Districts 1, 2, and 3 had levels of precision within 15 percent of the estimated
totals. The reported harvest was 71 percent of the expanded estimated total. Households residing in fIShing
District 4 accounted for 31 percent of the estimated total summer chum harvest. Harvests in fishing Districts
1 (24,731 fISh) 2 (27,122), and 5 (26,796), the Hooper and Scammon Bay areas (31,230), and in the Koyukuk
River area (25,883)~'~\'M\\'\~ er;c\.,. o~ \V\ M":'~l"+V~'
Households that usually fISh accounted for 89 percent of the reported summer chum salmon harvest
and 79 percent of the expanded estimated total About one-half of the households that usually fish and for
14
~
which there was harvest information harvested summer chum salmon, but only 5 percent of the households
that usually do not fish and for which there was harvest information harvested this species.
In addition to the summer chum salmon harvests noted above, survey questionnaires were used to·
collect information on salmon removed from commercial catches by residents of selected communities in
District 4. These salmon were thought to be predominantly summer chum, and are primarily the result of
commercial roe sales. Thirty-four households in Anvik, Grayling, Kaltag, Koyukuk, and Nulato were
identified to have used salmon from their commercial catches. These households used over 100,000 salmon
for dog food, and an additional 3,260 were used for human consumption (Table 8).
Sample information, harvest estimates and confidence intervals by community and fIShing area for
fall chum salmon are presented in Table 9. The 1988 harvest estimate was 153,809 fall chum with an
approximate 9S percent confidence interval of + j- 17,665 fish (or + j- 12 percent of the estimated total).
Harvest estimates for fishing Districts 2, 3, and 4 had levels of precision within approximately 15 percent of
the estimated totals. The reported harvest was 71 percent of the expanded estimated total. Over one-half of
the fall chum was harvested by households residing in fishing District 5, while only one-fifth of the defined
households resided in this area. Residents of Tanana harvested over one-third of the total estimated fall
chum salmon harvest.
Households that usually fish accounted for 90 percent of the reported fall chum salmon harvest and
80 percent of the expanded estimated total. About one-third of the households that usually fISh and for which
there was harvest information harvested fall chum salmon, but only 6 percent of the households that usually
do not fish and for which there was harvest information harvested this species.
Sample information, harvest estimates and confidence intervals by community and fIShing area for
coho salmon are presented in Table 10. The 1988 harvest estimate was 67,852 coho with an approximate 95
percent confidence interval of +/- 10,034 fish (or +/- 15 percent of the estimated total). Harvest estimates
for only one fIShing district (District 2, 16 percent) had a level of precision within approximately 15 percent of
the estimated totals. The reported harvest was 72 percent of the expanded estimated total. Households
residing in fishing District 6 harvested 45 percent of the estimated total coho harvest. The combined harvests
15
of residents of two communities, Tanana and Nenana, account for over 50 percent of the total estimated
harvesL
Households that usually fish accounted for TT percent of the reported coho salmon harvest and 69
percent of the expanded estimated total. One-fifth of the households that usually fish and for which there was
harvest information harvested coho salmon while only 6 percent of the households that usually do not fish and
for which there was harvest information harvested coho salmon.
In addition to salmon harvested with their own nets, residents of certain lower river communities
benefitted from fish received from Department ofFa and Game test fishing projects. These fish were made
available to households as by-products of Division of Commercial FISheries test fIShing projects which
monitored salmon run strength in those areas. Households in Emmonak, Kotlik, and Pilot Station which
were surveyed and could recall amounts of salmon received, reported that over SOO chinook salmon; 3,800
summer chum; 400 fall chum; and 150 coho were received from test fishing projects (Table 11). These fISh
were not included in the community harvest estimates for salmon.
Table 12 presents information on the gear used to harvest subsistence salmon. This information was
collected only during community surveys and was not available for all fishing households. The majority of
households that fished for subsistence salmon ('0/ percent, or 605 of 695 households that "fished and for which
gear information was known) used gill nets, while nearly one-fifth used fish wheels. Over one-half of the
fishing households used set gill nets, while over one-third used drift gill nets. Individual households may have
fished both set and drift gill nets. The majority of gill nets used had mesh sizes of 6 inches or smaller.
The postseason interviews also yielded information on household size and number of dogs per household
(Table 13). This information was recorded for 1,051 households. Overall, these households included 4,616
people and 4,803 dogs, approximately 4.4 people and 4.6 dogs per household. Largest household sizes were in
Districts 1 and 2 (greater than 5 per household) and smallest were in District 6 (3.2 per household). The
fewest number of dogs (2.1) per household was in District 1 and the largest (10.9 per household) in District 6.
Communities along the Koyukuk. Chandalar, and Black rivers had about 7 dogs per household.
16
Comparison of1988 and Previous Harvest Estimation Methods
The estimation procedure resulted in an improvement in subsistence harvest estimates compared to the
methodology used in previous years. This was deterinined by using the earlier methodology and applying it to
the 1988 data (Table 14). This test showed, overall, that the previous method would have accounted for 70
percent of the estimated 1988 subsistence harvest. However, the results varied by species and by fishing
district (Table 15). For eDJI1Ple, the former method would have accounted for 33 to 89 percent of the
chinook salmon harvest estimates; 51 to 92 percent of summer chum harvested; and 29 to 92 percent of fall
chum harvested depending upon the fishing district in which the fish were taken. Overall, 74 percent of the
chinook harvest would have been estimated using the previous method, 82 percent of the summer chum
harvest, and 62 percent of the fall chum harvest.
The methodologies used in 1988 led to relatively precise harvest estimates. The one-sided approximate 95
percent confidence interval (2 standard errors) for chinook salmon was 8 percent of the estimated total
harvest. For other species comparable levels of precision were observed. For summer chum it was 8.7
percent of the estimated total harvest, 11.5 percent for fall chum, and 14.8 percent for coho. These levels of
precision are possible through the use of the variety of information sources, the intensity of sampling, and the
use of the stratified sampling design.
Results also indicated the dynamics of participation in subsistence salmon fishing. Thirty-five percent of
all households for which there was information harvested salmon in 1988. Among households that usually
fISh for salmon, 53 percent harvested these fish in 1988. Households in this group that did not fish in 1988
indicated that illness or cash-earning opportunities precluded their fishing for salmon. Nevertheless,
households in this group that did fish accounted for significant amounts of the salmon harvest. They
accounted for 90 percent of the reported chinook salmon harvest, 89 percent of the summer chum harvest, 90
percent of the fall chum harvest, and n percent of the coho harvest.
Fmally, 14 percent of households that usually do not fish for salmon, or whose fIShing status could not be
determined prior to the fishing season, harvested salmon in 1988. In 1989, field workers will attempt to
contact these households during community visits.
17
1988 Frequency ofHarvests for Fishing Households
Harvest levels for fishing households were grouped into ranges for each species. Data are presented only
for households that actually reported fishing. In 1988, chinook salmon harvests ranged from 0 to over 380,
although this varied by district. In District 1 fishing households reported harvesting up to 139 chinook
salmon, up to 119 in District 2, up to 259 in District 3, and over 380 in some cases in Districts 4, 5, and 6
(FIgS. 3 and 4). In Districts 1 and 2, most fishing households harvested up to 19 chinook salmon; in District 3
up to 59; up to 20 in Districts 4 and 5; and none in District 6.
In 1988, summer chum harvests ranged from 0 to over 950 (Figs. 5 and 6). The most cases of fIshing
households harvesting more thaD 950 summer chum for subsistence use were in District 4 (Fig. 6). In
contrast to chinook harvests, a larger number of fishing households in Districts 4, 5, and 6 reported that they
did not fish for summer chum in 1988. However, a number of fishing households did remove summer chum
salmon for subsistence from their commercial catch (Table 8). Secondarily, households in these districts
harvested up to 49 summer chum. In Districts 1, 2, and 3, the largest number of households, as in the upriver
districts, harvested up to 49 summer chum. Summer chum do not occur in most portions of District 5.
Fall chum harvests by fIshing households extended up to 349 in DiStricts 1 and 2, up to 299 in District 3,
and greater thaD 950 in Districts 4, 5, and 6 (Figs. 7 and 8). In 1988, a minority of ftshing households in all
districts, except 6, fished for fall chum salmon. In District 6, most fIshing households harvested up to 49 or
greater thaD 950 fall chum salmon (Fig. 8). Similarly, in District 5, ftshing households harvested up to 49 or
greater thaD 950 fall chum. In Districts 1, 2, 3, and 4 most households harvested up to 19 fall chum.
The harvest of coho by fIshing households showed a similar pattern as fall chum. With the exception of
District 6, a minority of households in each district harvested coho (Figs. 9 and 10). Harvests ranged from 0
to greater than 380. In District 6, most households harvested more than 380 coho. In all other districts, most
ftshing households harvested up to 49 coho salmon.
18
Subsistence Harvest Levels. lWT-88
Subsistence salmon harvests for Yukon River drainage commUDities have been estimated since 1961 by the
state of Alaska. Through 1976, harvests were reported for chinook salmon and ·other· or "small" salmon. In
1971, harvest data for chinook as well as both runs of chum salmon (termed ·summer" and "fall" chum) and
coho have been separately rec:orded and estimated for each community. Iil1988, as noted earlier, the harvest
recording calendar and postseason interviews sought to further improve on the accuracy of reporting by
species by using terms used by local residents when referring to each species or run of salmon.
In general, harvest levels of all species ina-eased from 1971 through 1988 compared to harvest estimations
for the 1963-76 period (BraDDian et ai.). However, it is unclear what the actual harvest levels were prior to
the 1960s when dog team transportation and the sale, trade, and barter of dried salmon were common. In
addition, changes in subsistence activities which have come about primarily since the 1950s due to factors
associated with centralization of the Native population, probably contributed to some level of harvest
reduction observed in the 1960s (Andrews 1989). Therefore, the inaeasing trend in harvests beginning in the
late 1970s may, in part, reflect a return to earlier harvest levels.
Since 1971, the number of fishing families has only slightly inaeased, with the exception of those in
District 3 (Table 16). Increases since 1986 are viewed primarily as reflecting a change in recording harvest
information by household rather than "fishing family" which sometimes included several households.
Estimating future subsistence harvest levels has become particularly important in management and
allocation decisions in order to provide for adequate escapement and to comply with state law providing for
subsistence uses. Annual harvest estimates are necessary to provide for future uses which must be estimated
based on past harvest levels, as it is very difficult to collect accurate harvest information in season.
Chinook Salmon
Since 1m, subsistence harvest of chinook salmon has ranged from 17,033 in 1m to high of 48,722 in 1987
(Table 17). However, harvests have fluctuated by as much as 26,000 fish from one year to the next. Only
19
since 1986 has the harvest level drainage wide remained above 40,000 chinook. Similarly, chinook harvests
show an overall increase in each fishing district since lSTT, however, the harvest has fluctuated from year to
year (Table 17, FIg. 11). Harvests have fluctuated most in Districts 1, 2, and 4, whereas Districts 3,5, and 6
show considerably less fluctuation. District 5 has consistently accounted for the largest percentage of the
chinook harvest accounting for about 30 to 40 percent of the total (Fig. 12). Secondarily, District 4 has
accounted for about 20 to 30 percent of the total harvest. These two districts, therefore, have generally
accounted for 50 to 70 percent of the total chinook harvest for subsistence.
Average harvest per fishing family for each district shows a different pattern. Since lSTT, average family
harvests have generally been highest in District 3 (Table 18, Fig. 13). District 3 harvest has ranged from 75 to
108 chinook per family. Secondarily, District 5 average family harvests have ranged from about 41 to 98.
Average family harvests in the other districts generally has been between 20 and 50 chinook.
Summer Chum Salmon
Summer chum harvests have ranged from a low of 157,791 in lSTT to 276,485 in 1986 (Table 19). In most
years, the harvest has exceeded 200,000 fIsh. With the exception of District 4, summer chum harvests have
been less than 42,000 fish in each district since lSTT and show little variability from year to year (Table 19,
Fig. 14). Summer chum harvests in District 4 have ranged between about 70,000 and 220,000 fish and showed
the most fluctuation from year to year between 1979 and 1984. District 4 harvests have accounted for about
50 to 80 percent of the total harvest (Fig. 15).
As noted earlier, the large summer chum harvest in District 4 has been largely attributed to the
commercial salmon roe fishery in the district. Carcasses cut for roe and hung to dry have typically been
counted in the subsistence catch. In 1988, fishing households in District 4 were explicitly asked to indicate the
number of such salmon that were to be used for subsistence purposes (Appendix 2). The 1988 reported
harvest for these fish in selected communities appears in Table 8. As a result, the subsistence harvest was the
lowest of any year since 1978, and is likely a more accurate reflection of the actual subsistence harvest in that
district.
20
Average fishing family harvests, with the exception of District 4, have generally been less than 200 summer
chum (Table 20, rtg. 16). In District 6, average family harvests since 1983, have ranged between about 100
and 400. Although District 4 average family harvests have ranged between about 400 and 1,100 fish since
1m, the 1988 average family· harvest was about 400. This apparent reduction, again, is attnbuted to
recording the harvest used for subsistence in District 4 communities. Overall, with the exception of District 6,
there has been no definite trend toward increasing average family harvests of summer chum (Ftg. 16).
Fall Chum Salmon
The harvest of fall chum salmon for subsistence has ranged from 81,256 in lm to 222,835 in 1979 (Table
21). Similar to chinook harvests, there has been a relatively large fluctuation from year to year, on a drainage
wide basis. Most fluctuation in harvest has been in District 5 where harvests have ranged between about
30,000 and 110,000 fish (Table 21, Fig. 17). Fall chum harvests in Districts 4 and 6 have generally been
between 20,000 and 40,000. Districts 1, 2, and 3 have had relatively consistent harvests of fall chum since
lm, all less than about 20,000 in each year. Districts 5 and 6 combined have accounted for about 65 to 90
percent of the total fall chum harvests since lm (Fig. 18).
Correspondingly, average fishing family harvests have been greatest in Districts 5 and 6. Since 1981,
family harvests in both districts have ranged between about 300 and 800, whereas in District 4 average family
harvests have been between about 100 and 200, and in Districts 1, 2, and 3, average family harvests have been
less than 100 (Table 22, Fig. 19). In all districts since 1981, there has been no definite trend in the average
family harvest of fall chum.
Coho Salmon
The harvest of coho salmon for subsistence has ranged from 6,984 in 1978 to 66,003 in 1988 (Table 23).
Since 1980, coho harvests have steadily increased, although these have fluctuated. Some of the increase in the
1980s is attributed to improved reporting of coho salmon, which often have been reported by local residents
21
with fall chum harvests. As noted earlier, in 1988, the harvest calendar and survey questioonaires were
designed to employ local terms for this species and to distinguish them from fall chum, as the two species
tend to run concurrently. This probably accounts, in large part, for the increased reported harvest from about
46,000 in 1987 to 66,000 in 1988 (Table 23). In addition, improved run strength may be another factor.
Since 1980, coho harvests have been slightly increasing in all districts except Districts 3 and 4. Harvests in
those districts and District 1 have generally been less than 5,000 fish (Fig. 20). District 5 and 6 harvests have
ranged between about 5,000 and 30,000 during the same period. Since 1984, Districts 5 and 6 have accounted
for at least 50 percent of the total harvest (FIg. 21).
Average family harvests have been greatest in District 6 in all years, ranging between about 100 and 300
since 1m (Table 24, Fig. 22). In most years, District 5 average family harvests have been less than 100 coho,
and generally less than 50 in the remainder of the districts. As with other species, the variability of the
subsistence harvest among districts is related to several factors, such as abundance, distribution of the species,
fishing methods, and subsistence fishing patterns.
. District and Drainage Harvest in Pounds. 1977-88
This is the first report which has converted into pounds round weight the total number of salmon
harvested for subsistence use in the Yukon River drainage. Harvest information was converted into pounds
round weight by multiplying the total number of each salmon species harvested by the average weight of
salmon caught in the commercial fishery reported in each annual management report for each fishing season
since 1m (Alaska Department of F"JSh and Game lm-88). Conversion factor differences between salmon
.caught in the lower and upper sections of the river were maintained.
Total pounds harvested has ranged from about 2 million pounds in 1m to nearly 5 millions pounds in
1987 (Table 25, Fig. 23). Harvests have been highest in Districts 4 and 5 where more than 1 million pounds
has been harvested in each district in most of the past 12 years. These two districts combined have accounted
for 60 to 70 percent of the total pounds harvested during the past 12 years (Fig. 24).
22

Because of the preponderance of summer chum harvested in the commercial salmon roe fishery in
subdistrict 4A, harvest was also computed less summer chum. This was deemed appropriate given that the
cut and dried carcasses of fish caught in the commercial roe fishery have typically been attributed to the
subsistence fishery when, in fact, they were not caught or processed for subsistence use. Pounds of salmon
harvested for subsistence, less summer chum, was nearly one-half of total pounds for all species combined. It
has ranged from about 1 milUon pouu,ds in 1971 to about 2.75 milUon pounds in 1987 (Table 26, FIg. 25). The
largest percentage has occurred in District 5, which has accounted for 35 to 55 percent of the harvest since
1971 (Fig. 26). District 5 nearly coasistently accounted from about 46 percent of the total pounds harvested
(less summer chum). Districts 4 and 6 have accounted for the second largest percentage of salmon harvested
in pounds round weight (FIg. 26).
Discussion and Conclusions
Salmon harvest statistics are essential for fisheries management purposes and are of ever-increasing
importance in the applied social and biological sciences (d. Usher and WeDZe11987). The harvest of salmon
in the Yukon River drainage in Alaska has been and continues to be important both in the subsistence
economy and also in the market economy. Subsistence and commercial fishermen, often the same
individuals, have a real interest in the maintenance of the sustained yield of salmon stocks in the Yukon River
drainage. This can be accomplished best when there is reliable data on the biological status of salmon stocks,
including accurate information on the level of subsistence harvests.
The Yukon River drainage is large and communities which depend upon the harvest of salmon for
subsistence are situated throughout 1,200 river miles and associated tributaries. In 1988, there were over
2,700 households in these communities, most of which use salmon for subsistence. Not all households
actually fished for salmon as the harvest was shared among community households. However, it was
important to identify all fishing households in order to be able to record their harvests.
Overall, the methodology developed and used in 1988 provided a 30 percent improvement in the harvest
estimate compared to the method previously used. The estimated 1988 subsistence harvest was 44,564
23
chinook; 226,754 summer chum; 153,809 fall chum; and 67,852 coho. The degree of improvement was greater
for some salmon species harvested and for certain fishing districts than for others. Levels of confidence for
estimated total salmon harvest were within 15 percent of the estimated totals.
The application of a refined methodology in 1988 demonstrated the importance of having a current list of
fishing households and the need to contact households during commUDity visits after the fishing season.
Because the estimate was derived from a sample of households, it was critical to be able to accurately
describe both the population from which the sample was selected and the sample itself. Secondly, the best
means for recording harvests came from field work in communities, rather than the return from fishermen of
harvest calendars or reminder letters requesting harvest information. However, the postseason reminder
letter was an efficient and cost-effective method of contacting households that were not likely to have fished
for salmon for subsistence.
In our opinion, the success of the revised methodology resulted from the derivation of a statistically-valid
sample and the emphasis on the field work component for collecting harvest data. The broad-based approach
of personally contacting most households which fished for salmon also contributed to the reliability of the
data. FIShermen voluntarily answered a series of questions about their fishing activities and were also
interested to learn of the effort to improve subsistence harvest. estimates. In addition, using a sampling
method which can accommodate the dynamism in fishing participation by maintaining current household lists
helps to insure that all fishing households will be contacted for harvest information. Fmally, the improved
accuracy of the subsistence harvest estimate can go a long way toward bringing together fishermen and
managers through a mutual appreciation of the relevance of accurate subsistence harvest data in managing
and allocating the salmon resource.
24
REFERENCES CITED
Alaska Department ofFISh and Game. 1963. 1963 Annual Report Arctic-Yukon-Kuskokwim Area. Divisionof Commercial FISheries, Anchorage.
__ . 1m through 1988. Annual Management Report, Yukon Area. Division of Commercial FISheries,Anchorage.
_. 1987. Annual Management Report, 1986, Yukon Area. Division of Commercial FISheries,Anchorage.
Alaska Department of Labor. 1987. Alaska Population Overview 1985. Juneau.
Allen, Henry T. 1887. Report of an Expedition to the Copper, Tanana. and Koyukuk Rivers, in the Territoryof Alaska, in the Year 1885. Washington: Government Printing Office.
Andrews, Elizabeth F. 1988a. The Harvest of FISh and Wddlife for Subsistence by Residents of Minto,Alaska. Division of Subsistence, Alaska Department of FISh and Game, Juneau, Technical Paper No. 137.
__ . 1988b. Yukon River Subsistence Salmon Catch Documentation. Part I: Pre-Season FIShing FamilyInventory, Spring 1988. Division of Subsistence, Alaska Department of FlSh and Game, Fairbanks.
Brannian, Linda K., Dennis G. Gnath, and Jim Swingle. 1987. Subsistence Harvest of Pacific Salmon in theYukon River Drainage, Alaska, 1986. Division of Commercial FISheries, Alaska Department of FlSh andGame, Anchorage.
Cochran, William G. 1m. Sampling Techniques. New York: John Wdey & SODS.
Gilbert, Charles H. and Henry O'Malley. 1921. Investigation of the Salmon FISheries of the Yukon River. InAlaska FlShery and Fur-Sea1 Industries in 1920. Ward T. Bower, Agent. Bureau of FlSheries DocumentNo.909. Washington: Government Printing Office.
Schwatka, Frederick. 1893. A Summer in Alaska. St. Louis: J.W. Henry.
Sumida, Valerie A. 1988. Land and Resource Use Patterns in Stevens Village, Alaska. Division ofSubsistence, Alaska Department of FISh and Game, Juneau, Technical Paper No. 129.
Usher, Peter J. and George Wenzel. 1987. Native Harvest Surveys and Statistics: A Critique of TheirConstruction and Use. Arctic 40(2):145-160.
Wolfe, Robert J. 1981. Norton Sound/Yukon Delta Sociocultural Systems Baseline Analysis. Alaska OuterContinental Shelf Socioeconomic Studies Program, Anchorage, Technical Paper No. 72.
1984. Commercial FIShing in the Hunting-Gathering Economy of a Yukon River Yup'ik Society.Etudes/Inuit/ Studies 8 (Supplementary Issue):159-183.
Zagoskin, Lavrentiy A. [1847) 1967. Lieutenant Zagoskin's Travels in Russian America, 1842-44. ArcticInstitute of North America, Anthropology of the North: Translations from Russian Sources, No.7.Edited by Henry N. MichaeL Toronto: University of Toronto Press.
25
__'
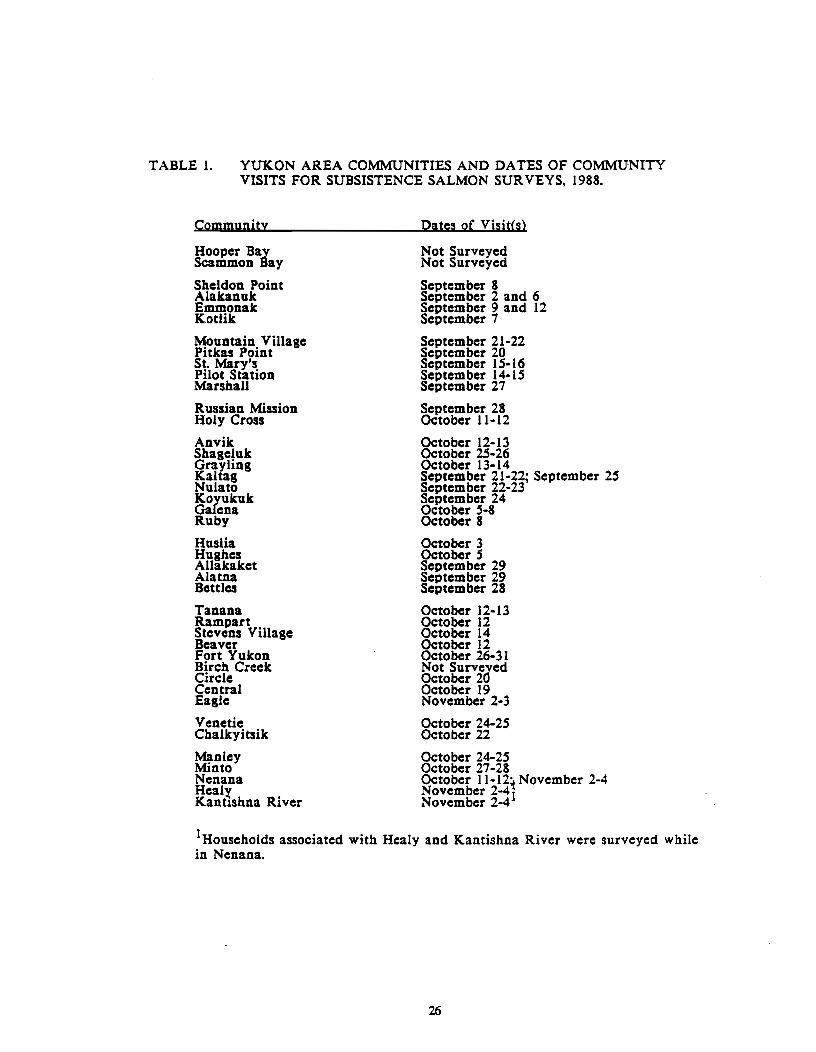
TABLE 1. YUKON AREA COMMUNITIES AND DATES OF COMMUNITYVISITS FOR SUBSISTENCE SALMON SURVEYS, 1988.
Community
Hooper BayScammon Bay
Sheldon PointAlakanukEmmonakKotlik
Mountain VillagePitkas PointSt. Mary'sPilot StationMarshall
Russian MissionHoly Cross
AnvikShagelukGraylingKaltagNulatoKoyukukGalenaRuby
HusliaHughesAllakaketAlatnaBettles
TananaRampartStevens VillageBeaverFort YukonBirch CreekCircleCentralEagle
VenetieChalkyitsik
ManleyMintoNenanaHealxKanttshna River
pates of Visit(s)
Not SurveyedNot Surveyed
September 8September 2 and 6September 9 and 12September 7
September 21-22September 20September 15-16September 14-15September 27
September 28October 11-12
October 12-13October 25-26October 13-14September 21-22; September 25September 22-23September 24October 5-8October 8
October 3October 5September 29September 29September 28
October 12-13October 12October 14October 12October 26-31Not SurveyedOctober 20October 19November 2-3
October 24-25October 22
October 24-25October 27-28October 11-12i November 2-4November 2-41November 2-4
IHouseholds associated with Healy and Kantishna River were surveyed whilein Nenana.
26
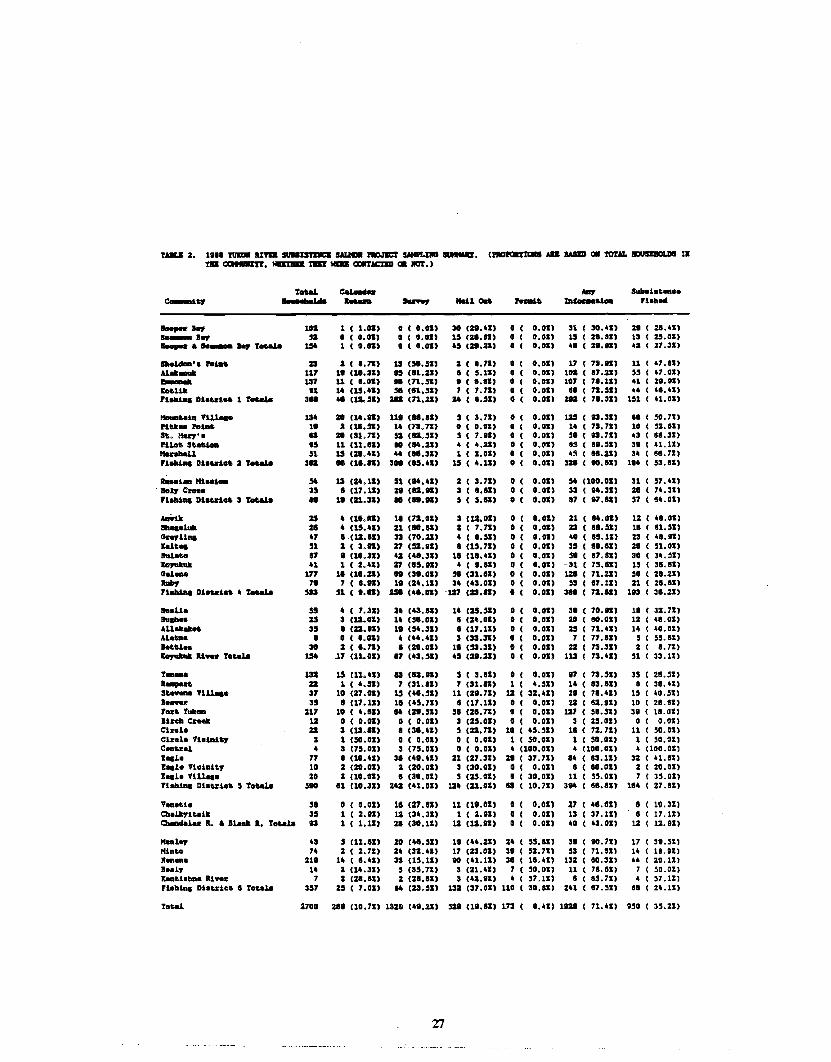
UIL& 2. 111II 'lIIIl* ana SUIIlIIS1'IIICIl s.wa J'IOJIIC! SMIILIlIlI 11MIAIII. UiCllQtil\Ml AD IIAlIID 01 mTAL lIDUSIIIOLDS IItill CXIIIlUft. lIIIDD tift lIID CIOIfACDD 01. 1IlI!.)
tOUl ,., Sullai.t......e-it.y I .......W. --- Suftr 1fU10ft ....t. ~U_ Fl.h_
...... Ioy 101 1 ( 1.DS) o ( 0.011 30 (18.U) 0.01) 31( 30.U) 2. ( U.U)SO_ loy 52 a ( 0.01) a ( 0.011 15 (z•• n) 0.011 15( 28"11 13 ( ~.Ol)
__ • SO_ loy tOUla 154 1 ( o.n) a ( 0.011 U (21.21) 0.011 4' ( 2••nl 41 ( 27.31)
_~'. "&11& 23 2 ( •• 71) 13 (H.521 2 ( •• 711 0.01) 17 ( 73.nl 11 '1.111Alall.... 117 1. (1••211 15 ('1.21) I ( 5.11) 0.011 lDS ( 17.21) " '1.011_all 137 11 ( I.DS) .. (71.52) • ( 1.111 0.011 107 ( 7'.111 41 28.'1)ItDt.l~ 11 14 (15.'" H ('1.511 7 ( 7.71) 0.01) "( 71.511 " ... '11rlalWl& Dl.ul_ 1 1'ot.aU 3.. (12.521 2U (71.21) 2' ( ••511 0.011 211 ( 71.311 lSI 41.01)
_t..la'l11.1••• 134 21 (1'.111 11. (••••11 5 ( 3.711 0.011 W ( 13.311 .. ( '0.71)ftt.ll_ Pe&ll& 18 2 (10.511 l' (73.711 a ( 0.011 0.011 14 ( 73.7S1 10 ( '2. allSt.. !tu7'. 15 20 (31.7S1 52 (12.511 5 ( 7.'11 0.011 H( n.71) 43 ( ... 31)rl1ot.s~ .5 11 (11.111 50 (".211 4 ( 4.211 0.011 as( ".52) 31 ( 41.111IIonIIall U IS (21.'" .. (11.31) 1 ( 1.01) 0.011 U( ".21) 34 ( ••• 71)rlalWl& Dl.t.II1ot. 2 tOUla 311 .. (11.'11 300 (.S.Ul 15( 4.111 O.OSl 311 ( ...all 1.4 ( '3.111
.....i_ Mi..i_ 54 13 (24.11) 51 (".Ul 2 ( 3.71) 0.01) '4 (1DO.DSl 31 ".Ul'- 1101.7 <:zoo. 35 • (17.11) 21 (12.11) 3 ( 1.111 0.011 33 ( ".311 I' ".31)
rlalWl& Dl.ul.t. 3 tot.oJ.8 I. 1. (21.311 .. ('••n) 5 ( 5.11) 0.011 17 ( '7.'11 " ".01)
25 4 (1•• 01) 1. (71.011 3 (12.01) a ( 0.011 21 ".01) 12 ( ".01)Sh...1.uIt II 4 (15.411 21 (10.'1) I ( 7.71) a ( 0.01) Z3 81.51) 1. ( '1.511<In.,U... " 1-(11.11) 33 (70.2S) 4 ( 1.52) a ( 0.01) 40 ( as. 111 23 ( ....11!Colt... 51 2 ( 3.n) 27 (52.n) I (15.71) a ( 0.011 35 ( ....1) I' ( '1.011lloal.t.o 17 • (10.31) 41 (".31) 1. (lI.Ul o ( 0.01) 5. ( 87.11) 30 ( 34.511Ioyuk1IIl 41 1 ( 2.Ul Z7 (lS.n) 4 ( '.111 o ( O.OSl -31 ( 75.111 1S( 3'.11)<Ial_ 177 1. (10.21) I. (3'.011 H (31.11) o ( 0.011 121 ( 71.21) 50 ( 21.111...., 71 7 ( 1.111 1. (24.111 34 (43.011 o ( 0.011 33 ( 87.11) 11 ( 2'.111rialWl& Dl.ui.t. 4 TOUla su U ( •• 111 251 (4•• 01) -127 (23.'11 o ( 0.011 311 ( 71.'11 113 ( 3'.21)
1a.11. " 4 ( 7.311 Z4 (43.'11 14 (25.521 o ( 0.01) 38 ( 70.nl II ( 32.71)!Ilqb.. 25 3 (12.011 14 (".011 • (24.011 o ( O.OSl 2O( 10.011 12 ( ".01)Alla1lall_ 35 I (ZI.nl 1. CS4.311 I (17.111 a ( 0.011 25( 71.Ul 14 ( 40.011Al.t.a. • o ( D.DSl 4 (U.Ul 3 (33.311 o ( 0.011 7 ( 77.11) 5 ( 55. IIIIot.U.. 31 2 ( •• 71) I (20.011 1. (sa.311 a ( O.OS) ZI( 73.31) I ( •• 711Ioyuk1IIl Ill_ tot.o1o 154 .17 (11.011 87 (43.511 U (21.211 o ( 0.011 113 ( 73.411 31 ( 33.11)
t_. 131 15 (11.'11 IS (u.nl 5 ( 3.n) o ( 0.011 t7( 73.5S1 35 ( 21.51)
'-"" II 1 ( 4.SS) 7 (31.11) 7 (31.11) 1 ( 4.311 14 ( 13.'Sl I ( 31.'11St._VIUq. 37 10 (27.DSl 15 (40.511 11 (2•• 711 11 ( 32.411 I. ( 71.'1) 15 ( 40.5111_1' 35 I (17.111 11 (U.711 I (17.111 o ( 0.011 II( 'I.n) 10 ( 28.11)'oct. f __
217 10 ( 4.IS) 1M (2•• 511 51 (2'.nl o ( 0.01) 117 ( 51.52) 3. ( 1'.01)Unit c:n.- 12 o ( D.DS) a ( 0.01) 3 (25.OS) o ( 0.011 3 ( 13.01) °( 0.011<:lcal. II 3 (13.11) • (31.U) 5 (11.71) 10 ( U.521 1. ( 72.71) 11( 30.01)<:ln1o '11.la1t.., I 1 CSO.OI) o ( 0.011 o ( 0.01) 1 ( 30.01) 1 ( 30.01) 1 ( '0.01)<:...t.cal 4 3 (75.011 3 (75.011 o ( 0.01) 4 (100.011 4 (100.0:n 4 (100.0111..18 77 I (10.'1) 3. (".Ul 21 (27.3S1 I. ( 37.71) .. ( .3.U) 32 ( 41.'1)1..1. n.lalt.., 10 2 (20.DS) 2 (IO.OS) 3 (30.01) a ( 0.01) I ( '0.01) I ( 20.01)1'11' '11U... 2D I (10.0S) • (30.01) 5 (25.01) • ( 30.01) 11 ( 55.01) 7 ( 35.01)Flolllal Dl.ui.t. 5 tot.oJ.8 5to 11 (10.31) 242 (41.01) 114 (21.01) n ( lD.7S) 3.. ( ••••., 114 ( 27.11)
'1....t.l. ,. a ( 0.011 II (27.11) 11 (1•• 011 a ( 0.011 17 ( 41.11) ( 10.31)a..~1t..1k 35 1 ( I.n) 11 (34.31) 1 ( 1.11) a ( 0.01) 13 ( 37.11) • ( 17.11)Chedtllu I. • 110... I. tOUla 13 1 ( 1.11) 21 (30.11) 11 (12.n) a ( 0.0" 40 ( 43. 01) 11 ( 11.11)
_loy 43 5 (11.111 20 (41.51) 1. (U.2S) 14 ( 55.11) 3. ( to.71) 17 ( 3•• 511MlotoD ,. I ( 2.71) 24 (31.U) 17 (23.01) 3. ( 31.7S) 53 ( 71.81) H( 11.11)21..._. 11. 14 ( '.41) 33 (15.11) .. (41.11) 3. ( 11.41) 132 ( '0.31) ,,( 20.111B.al7 14 2 (14.31) 5 (35.71) 3 (11.41) 7 ( 50.01) 11( 78.81) 7 ( 30.0111taIIt.1."". Ii...., 7 I (1'.11) I (11.81) 3 (41.11) 4 ( 57.11) .( as.71) 4 ( 57.111Fl.ltlDa Dl.ui.t. • tot.o1o 357 25 ( 7.0S) .. (23.3s) 131 (37.01) 110 ( 30.811 IU ( 17.3S) SI( 24.11)
Tot.o1 2700 ZI. (10.7S) 1311 (41.21) S2I (1'.11) 173 I.U) In. ( 71.41) 15O 35.211
~
"
~
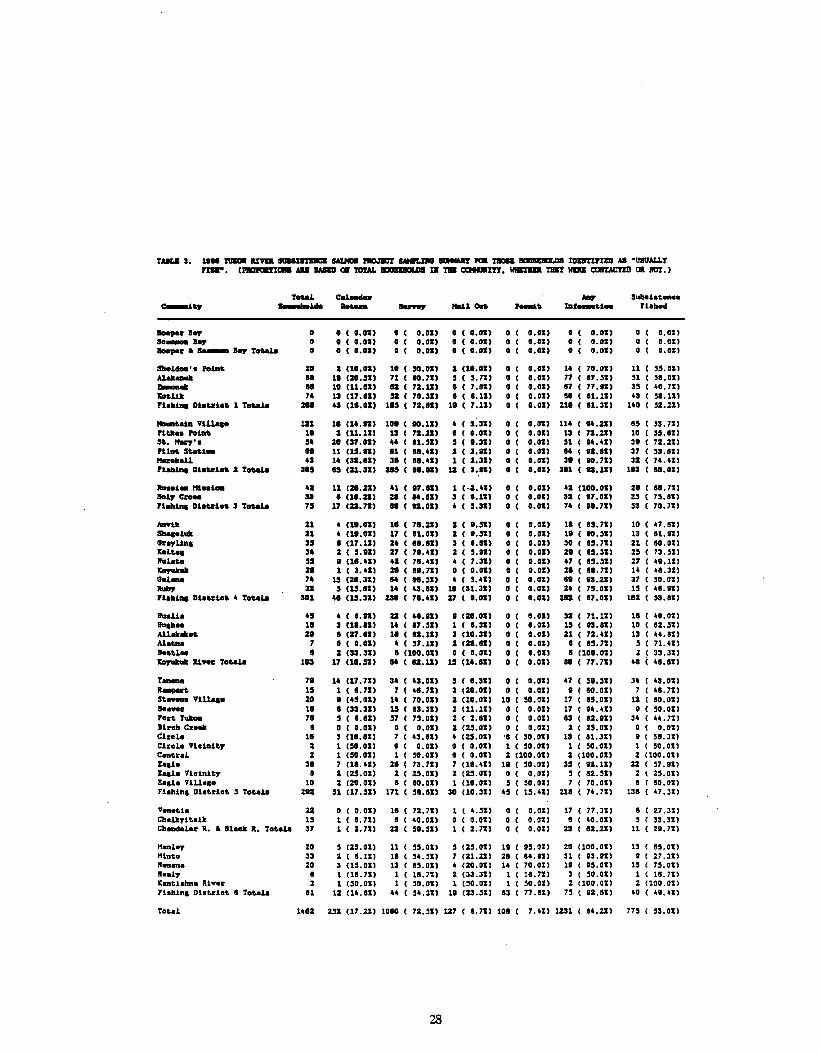
TAILI 3. 111. JtnIIl SUlllIIUIICZ IlAUa l'm.l1IICT -e Pta r-. -.os IIlIIIn'tID AS "USUALLYrtIII" • (~c. AlII IAIIlI mrAL os III TIll ClHIIIIm. WIII!IIIlIl TIIIf WIllI CllIlTJC1'IIl OIl !lor.)
ToUl Cal_a ,.., S""o18&_.-- ...._.Lda - Mall__II
1JICa_i_ Flob_
~"Ioy a a 0.01) 0 0.01) 0 0.01) 0 0.01) 0 0.01) 0 0.01)So_ loy 0 0 0.01) 0 0.01) 0 0.01) 0 0.01) 0 0.01) a 0.01)~,. • So_ ley ToUle 0 0 0.01) 0 0.01) 0 0.01) 0 0.01) 0 0.01) 0 0.01)
Sb.l_·o hill& ZIt 2 (10.01) 10 ( 50.01) 2 (10.01) 0 ( 0.01) 14 70.01) 11 35.01)A1AIl__ .. 1. (20.31) 71 ( 10.71) 3 ( 3.71) 0 ( 0.01) 77 87.31) 51 ".01)_... .. 10 (11.11) III 72.11) a ( 7.01) 0 ( 0.01) 87 77.11) 33 40.71)~t.1n 74 13 (17.al) 32 ( 70.31) a ( a.lI) o ( 0.01) 10 ( 81.11) 43 ".11)'leb1lll 01.&210" 1 To&a1o :au 43 (11.01) lIS ( 72.11) 11 ( 7.11) a ( 0.01) 211 ( 81.31) 1'0 52.21)
_&ola ViUqo 1:&1 11 (l'.aI) 11111 ( 00.11) .( 1.31) a ( 0.01) 114 ( 14.21) 55( 55.71)Pit.... hia" 11 2 (11.11) 13 ( 72.21) o ( 0.01) o ( 0.01) 13 ( 72.21) 10 ( ".81)S&. !fo&'7'. 54 20 (37.01) .. ( 81.31) 5 ( 1.31) a ( 0.01) 51( 14.41) 31 ( 72.21)P11o& S&o&i_ a. 11 (15.aI) 11 ( 1'.41) 2 ( 2.11) o ( 0.01) e4 ( aI.lI) 37 ( 55.el)IlonII.U 43 1. ('2.11) SI( ... 41) 1 ( 2.31) o ( 0.011 SI( 10.71) 32 ( 7'.41)Flebi... Di.&do& 2 ToUle 305 es (21.31) Z85 ( 01.11) 1:& ( 3.aI) o ( 0.01) 211 ( 82.11) 113 ( 10.01)
h ..i. Hi••l_ 41 11 (21.21) 41( 87.el) 1 (·~.41) o ( 0.011 4Z (100.01) 2. 11.71)8017' eno. '3 a (11.21) 21 ( 04.11) 3 ( 1.11) a ( 0.01) 32 ( 17.01) 25 73.11)Flebilll 01.&210" , To&a1o 7S 17 (21.711 II ( 82.01) • ( 3.311 o ( 0.011 7. ( ".71) 53 70.71)
"""ill n (1'.01) 11 ( 71.21) 2 ( 1.311 a ( 0.01) 11 ( 85.711 10 ( 47.81)SII...1ull n (1'.01) 17 ( 81.01) 2 ( 1.311 a ( 0.01) 11 ( 10.51) l' ( 11.11)G,..,.Uq 35 e (17.11) 2. ( el.811 , ( 1.111 a ( 0.01) 30 ( 15.71) 21 ( 10.01)ICa1tae 34 2 ( 5.11) 27 ( 71.'1) 2 ( 5.11) a ( 0.01) 21 ( 15.31) 25 ( 73.511ltalo&O 55 I (11.41) 4Z ( 78.41) 4 ( 7.'1) o ( 0.01) 47 ( 15.31) 27 ( 41.111ItoJukaIl 21 1 ( 3.41) 21 ( 11.711 o ( 0.011 o ( 0.01) 21 ( 11.711 1'( 41.311G.l_ 7. 15 (20.31) 04 ( 18.311 4 ( 5.41) o ( 0.01) II ( 83.211 37 ( ".01)Ilubp '2 5 (15.81) 1. ( 43.111 10 (31.'11 o ( 0.01) 2. ( 75.011 15( 41.11)Flobi... Dio&210& • ToUle '01 41 (15.'1) 230 ( 78.411 27 ( 1.01) o ( 0.011 :au ( 17.01) 112 ( 55.111
h.U. 45 4 ( e.lIl 21 ( 4'.111 I (20.01) 0 ( 0.011 32 ( 71.11) 11 ( 40.011h ..... 11 3 (11.111 14 ( e7.31) 1 ( 1.31) 0 ( 0.01) 15 ( 83.111 10 ( 12.511A1.loII....& 2. I (27.11) 1. ( 12.11l , (10.31) 0 ( 0.011 21( 72.411 l' ( 44.51)Al._ 7 o ( 0.011 • ( 57.11l 2 (11.11) 0 ( 0.011 I ( 15.711 5 ( 71.41)10&&1. I 2 (33.'11 a ClOO.OI) o ( 0.01) o ( 0.011 I (lOO.OII 2 ( 3'.311
Ill_ To&a1o 103 17 (11.31) 04 ( 11.11) 15 (14.11) o ( 0.01) 50 ( 77.711 41 ( 48.ell
f_•• 7. 14 (17.71) 34( 4'.01) 5 ( e.'1l 0 0.01) 47( ".511 '4 ( 43.011R-" 15 1 ( e.711 7 ( 41.711 , (20.01) 0 0.01) I ( 10.011 7 ( 4a.71)St._. V1Uoa. 20 I ('5.011 1. ( 70.01) 2 (10.01l 10 50.01) 17 ( 55.01) 12 ( 80.01)I .....,. 11 8 (33.31) 15 ( 83.'1) 2 (11.11) 0 0.01) 17 ( 14.41) I ( ".011rOd YuII_ 71 5 ( 1.111 57( 75.01) 2 ( 2.111 0 0.01) 83( 52.11) 34 ( 44.711Ibeb Cn.. I o ( 0.011 o ( 0.01) 2 (25.01) 0 0.01) 2 ( 25.011 o ( 0.011CllrOl. 18 , (11.811 7 ( 4'.11) 4 (25.01) '1 50.01) 13 ( 51.311 I ( ".311Cbol. Violalt.? 2 1 (50.01) a ( 0.01l o ( 0.01) 1 ( 50.01) 1 ( ".01) 1 ( 50.011Cn&,..l 2 1 (50.01) 1 ( ".01) o ( 0.011 2 (100.01) 2 (100.01) 2 (100.011Zo,l. SI 7 (11.41) 21 ( 73.71) 7 (11.41) 1. ( ".011 35 ( 12.111 22 ( 57.111Z..l. Violnlt.? 5 2 (%5.01) 2 ( 25.011 2 (25.011 a ( 0.011 3 ( e%.311 % ( 25.011!ael. V11lo,. 10 2 (20. all e ( eo. all 1 (10.011 5 ( 50.011 7 ( 70.01) I ( .0.011Flobin, Dlot,.lot 5 Totalo 211 51 (17.51) 171 ( ".111 30 (10.'11 45 ( 13.411 211 ( 74.71) 1'8 ( 47.311
Veneto1. 21 o ( 0.011 11 ( 72.711 1 ( 4.511 o ( 0.011 17 77.311 I 27.31)Chalkyltaill 15 1 ( 1.711 I ( 40.011 o ( 0.01) o ( 0.011 e 40.011 5 3'.'11Ch_ala R. • at.ell R. fo&olo '7 1 ( 2.711 22( ".511 1 ( %.71) o ( 0.01) 23 e2.%I) 11 21.71)
H..l.,. %0 5 (25.011 11 ".01) 5 (%3.01) 11 ( 15.011 20 (100.01) l' ( .5. allHln&o 3' 2 ( 1.11) 18 5'.511 7 (%1.21) 28 ( .'.111 31 ( 83.11) I ( 27.311Iten.... 20 , (13.011 13 55.011 4 (20.011 14 ( 70.011 11 ( 15.011 13 ( 75.01111.81,. I 1 (18.711 1 11.711 2 (3'.31) 1 ( 18.71) 3 ( ".01) 1 ( le.711K..t1ollna Rl".,. 2 1 (50.011 1 SO.OI) 1 (SO. all 1 ( 50.011 2 (100.01) 2 (100.011Flobln, D1o&2ie& I fotalo 11 12 (14.81) •• 54.311 11 (23.31) e, ( 77.11) 75 ( 12.11) 40 ( 41.411
fo&81 1'12 252 (17.21) 1080 72.31) 1:&7 ( 1.711 108 7.41) 1231 ( 14.21) 775 ( 55.011
28
~ ~
~ "'""'"
~
~
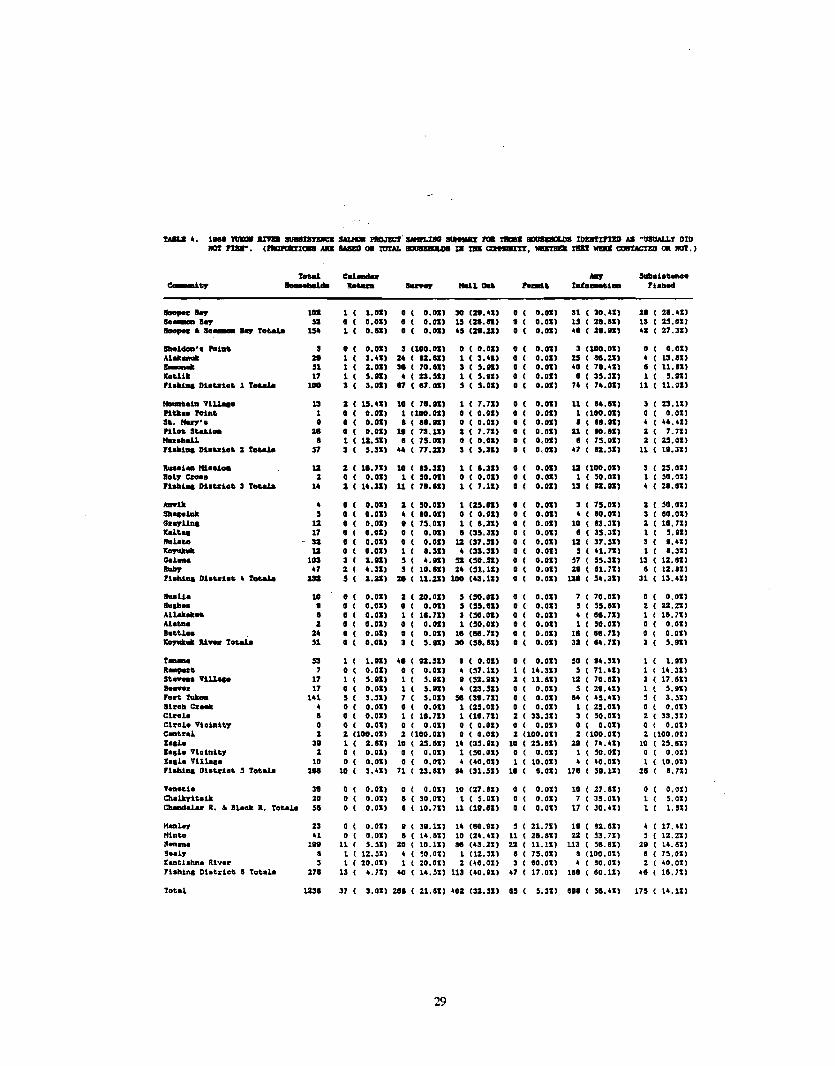
TAILa •• 1_ lIJIlIlIr anllII llIIIIIlll!ZIIa SAUICIII no.m:r. SMlrLIIlJ lI1MtAU rI:a TaIII IIllUUIIOLDS IDEllTlnlD AS "USUAL1.T DIDIIll! nar. (1'II)ftIIr1~ AD IIAlIID a. toTAL ....... II" III tIIII CtIHIIIIn, lIIIBTIIIIl tIIU lIIU CClItrM:%ID OIl 1Ill!.)
Total C.l.... ., SuII.ioll_•e-tll,. ........u. ..- SoInwr _lOU re_u Iato_lli. Flobad
lIoapua.,. 101 1 ( 1.01) o ( 0.01) 30 (D.'I) 0 0.01) 31 ( 30.'1) 21 ( 21.U)50_ lay 51 o ( 0.01) o ( 0.01) 13 (21.11) 0 0.01) 13 ( 21.11) 13 ( 23.011IIoapu • 50_ I.,. Totoa18 1:54 1 ( 0.111) o ( 0.01) (2'.211 0 0.01) •• ( 21.11) '2 ( 27.31)
_~'. "lll. 3 o ( 0.01) 3 (100.011 o ( 0.011 o ( 0.011 3 (100.01) o ( 0.01)Al...... 21 1 ( 3.'1) 24 ( 12.11) 1 ( 3.'1) o ( 0.01) 23 ( ".21) ·(
13.11)_..31 1 ( 2.01) 3. ( 70.1111 3 ( 3.11) o ( 0.01) '0 ( 71.U) II ( 11.11)
Ito"UIl 17 1 ( 3.11) 4 ( 23.31) 1 ( 3.11) o ( 0.01) I ( 3'.31) 1 ( '.111FlalWle Oloulo" 1 Totoa18 100 3 ( 3.01) 17 ( 17.01) , ( 3.01) o ( 0.01) 74 ( 74.01) 11( 11.01)
_ll.iII VU~. 13 2 ( 13.U) 10 ( 711.11) 1 ( 7.711 o ( 0.011 11 ( 14.111) 3 ( 23.11)Plt.ll.. ,.111. 1 o ( 0.01) 1 (100.01) o ( 0.01) o ( 0.01) 1 (100.01) o ( 0.01)s•• Mu7'o I o ( 0.01) I ( 11.11) o ( 0.01) o ( 0.01) I ( 11.11) ·(
".U)PUo" S"."l. %I o ( 0.01) 11 ( 73.11) 2 ( 7.71) o ( 0.01) 21 ( 10.81) 2 ( 7.71)KanbaU I 1 ( 12.31) I ( 75.011 o ( 0.011 o ( 0.01) II ( 15.01) 2 ( 23.011FlalWle Olouioll 2 Totoa18 " 3 ( 3.31) •• ( 77.21) 3 ( 3.31) o ( 0.01) U ( 12.31) 11( 11.311
_.l_ Mio.i. 12 2 ( 111.71) 10 ( 13.31) 1 ( 11.31) o ( 0.01) 12 (100.01) 3 ( 23.01)Bol,. CZOII. 2 o ( 0.01) 1 ( 50.011 o ( 0.01) o ( 0.01) 1 ( 50.01) 1 ( 50.01)FlobiaC Oloulo" 3 Totoa18 14 2 ( 14.31) Il( 711.1111 1 ( 7.11) o ( 0.01) 13 ( n.lI) ·(
21.11I)
_111 • 0 ( 0.01) 2 ( 50.01) 1 (25.01) a ( 0.011 3 ( 75.01) 2 ( 50.01)SII...1uIl , 0 ( 0.01) .( 10.01) a ( 0.011 o ( 0.01) • ( 10.01) 3 ( eo.OI)13".,.U... 12 0 ( 0.01) I ( 75.011 1 ( 1.31) a ( 0.01) 10 ( 13.31) 2 ( 111.71)Ita1ll.. 17 0 ( 0.0:l) a ( 0.01) II (35.311 o ( 0.01) II ( 35.31) 1 ( '.91)IhIlno 31 a ( 0.01) o ( 0.01) 12 (37.31) o ( 0.01) 12 ( 37.31) 3 ( 9.U)
12 0 ( 0.011 1 ( 1.311 • (35.31) ( 0.011 , ( '1.71) 1 ( 1.31)Galoll. 103 3 ( 2.11) 3 ( '.11) '2 (30.31) ( 0.011 '7 ( '5.31) 13 ( 12.11)1luII? U 2 ( '.31) , ( 10.1111 24 (31.11) ( 0.01) 21 ( 11.71) I ( 12.11)FlobiaC 01oulo" • Totoa18 231 3 ( 2.2%) %I( 11.2%) 100 (43.11) ( 0.01) 121 ( 54.31) 31( 13.U)_U. 10 o ( 0.01) 2 ( 20.01) , (30.01) 0.01) 7 ( 70.01) 0 0.01)Bulb.o I o ( 0.01) o ( 0.011 , (33.1111 0.01) , ( '5.111) 2 22.21)O\U....... II o ( 0.01) 1 ( 1'.71) 3 (30.01) 0.01) ·(
".71) 1 111.71)0\1.&11. 2 o ( 0.01) o ( 0.011 1 (50.01) 0.011 1 ( 50.01) 0 0.01)a.""l.. 24 o ( 0.01) o ( 0.01) 111 (11I.71) 0.01) 111 ( 81.71) 0 0.011
Rl_IrTot.ala 31 o ( 0.01) 3 ( '.11) 30 (SI.II) 0.011 33 ( 14.71) 3 '.9U
T_. 51 1 ( 1.11) .. ( n.31) a ( 0.01) ( 0.01) '1( 94.31) 1 1.91)R_" 7 o ( 0.01) o ( O.OU • (37.11) ( 14.31) , ( 71.U) 1 14.311Sll_'Il~ 17 1 ( '.91) 1 ( 3.91) 9 ('2.911 2 ( 11.111 12 ( 70.81) 3 17.81)a..-" 17 o ( 0.01) 1 ( '.91) • (23.'1) o ( 0.01) , ( 21.U) 1 '.911Fon Tull. 141 , ( 3.31) 7 ( '.01) SlI (31.71) o ( 0.01) 14( ".U) , 3.'UIl"ob C,,_ • a ( 0.01) o ( 0.01) 1 (25.01) o ( 0.01) 1 ( 2'.01) 0 0.01)Clul. I o ( 0.01) 1 ( 111.71) 1 (11.71) 2 ( 33.311 3 ( 50.01) 2 33.311Clul. Vldal",. 0 o ( 0.01) 0 ( 0.01) o ( 0.011 o ( 0.011 o ( 0.01) 0 ( 0.01)C..uol 2 2 (100.01) 2 (100.01) o ( 0.01) 2 (100.011 2 (100.01) 2 (100.011Z..l. 31 1 ( 2.81) 10 ( 25.81) 14 (35.91) 10 ( 23.81) 21 ( 74.U) 10 ( 23.81)lad. Vlolnit-? 2 o ( 0.01) 0 ( 0.01) 1 (50.01) o ( 0.01) 1 ( 50.01) 0 ( O.OUZ..lo ViUa•• 10 a ( 0.01) a ( 0.01) • (40.011 1 ( 10.01) • ( '0.01) 1 ( 10.01)Flabilll Dlndo" , Totoa18 2.. 10 ( 3.U) 71 ( 25.11) 94 (31.31) 11 ( 11.011 171 ( ".11) 211 ( 1.11)
Venetol. 31 0 0.011 o ( 0.01) 10 (27.11) 0 0.01) 10 27.811 ( 0.01)Cbo1lTlt.olll 20 0 0.01) I ( 30.01) 1 ( '.01) 0 0.01) 7 35.011 1 ( 5.0UCb_al.., R. • 81_ R. To".la 311 0 0.01) I ( 10.711 11 (11.111) 0 0.01) 17 30.Ul 1 ( 1. 81)
HaIl1.,. 23 a 0.01) 9 ( 31.11) 14 (10.91) , ( 21.711 11 ( 12.11) ·(17.U)
Hlnllo '1 0 0.01) I ( 14.81) 10 (2•. 'U 11( 211.111 22( ".71) , ( 12.211Men... 1.. 11 '.'U 20 ( 10.11) 81 ('3.21) 22( 11.11) 113 ( ".81) 20 ( 14.81)Baaly 8 1 12.51) .( 50.01) 1 (12.51) 8 ( 75.01) 8 (100.011 8 ( 75.01)lConttahna Rlve" 5 1 20.01) 1 ( 20.01) 2 (40.01) 3 ( 80. 01) 4 ( 80.01) 2 ( ".01)Flabllll Dtat-"lo" I Tot-ala 271 13 •. 11) 40( 14.31) 113 (40.911 U( 17.011 181 ( 10.111 .. ( 11.711
To&o1 1231 37 ( 3.01) 2118 21.81) 401 (32.31) 83 '.31) 808 ( 511.U) 175 14.111
29
"
-~
~
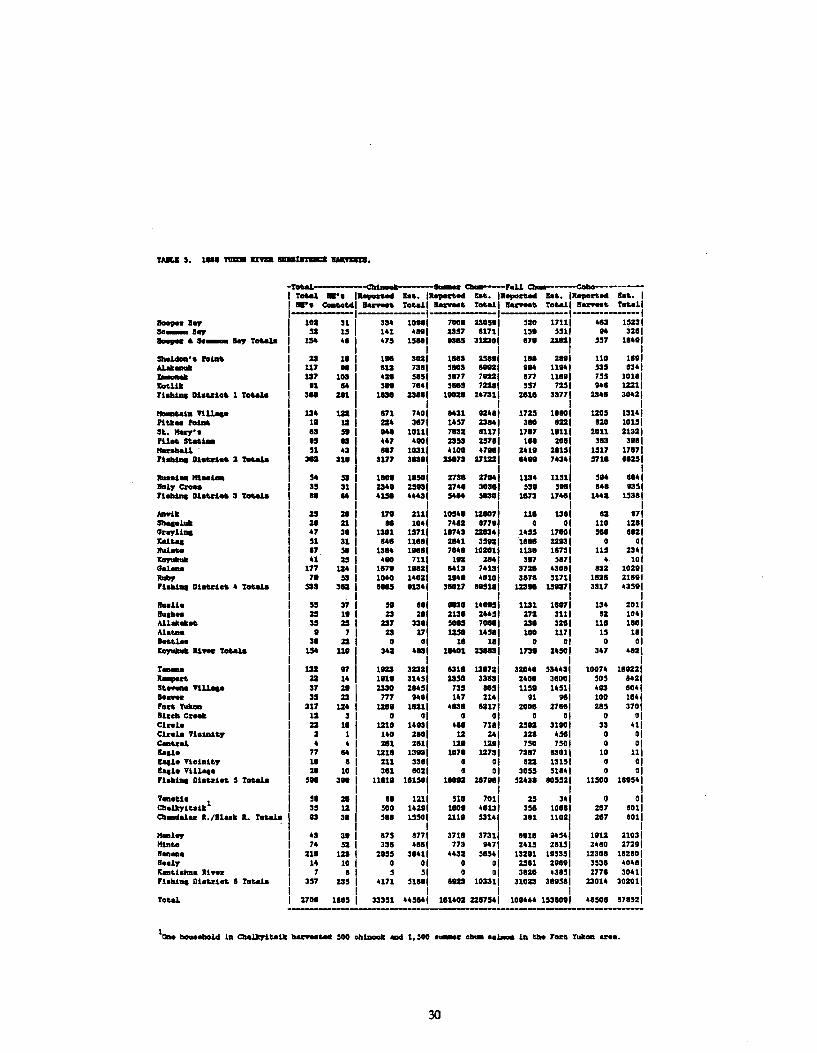
TML& 3. 1... una 1AImlftII.
-!oM1 CIl1aouk --_ a..---r.u a.---~------I ToMl .... I___ H b •• I___ H b'.IIl_,H I ••• I......"'H b'.1
I.... ~t.d' a-. T0'-11 a-, ToMllll........ To'allll....... ToullI------I------I------f---------I-.." 1.,- I 102 31 I 334 10"1 7001 230,., 5ZO 17111 415 1322150_1.,- 'I 15 In 48.' 2337 8171' 13. 5511 .. 3211-.... • 50_ ..,. ToMlo I 1S- 41 473 15111 ." 31230' 17. 2212
1557 11'"
1 1 1 ISbeldoll'. PoUlt> 1 22 11 lOll 3021 1113 15'" 111 28.' 110 11.'.u.a..... I 117 .. 112 7311 5103 lonl I" 11'" 515 1341- I 137 103 42. 5131 5177 7022' 177 11101 735 lOll'Xdl~ 11 14 5" 7141 58" 7UII 357 7221 "I 12211Flllllt... Ot.ut•• 1 ToUb I 3. Zll lUll 22'" 1"21 247311 Dl1 33771 22.. 30UI
I I I I_.,lllq. I 134 122 171 740' 1431 12481 1725 11101 1203 131411'lu.. PoUlt> I 11 12 224 3171 1437 2384' 310 1221 120 10151St.. Morr'. I a ,.
"I 10111 7132 11171 1717 11111 2011 21321PUn ,taU- I IS a 447 4101 2333 2571' 111 201' 315 3.11MuIIIIa11 . I 51 43 117 10311 noD 47'" 2411 21151 1517 17171'1l1li1.. Dl.Uln 2 roM1o 3U 311 3177 3131' 23.73 271221 14" 7434' 3711 1125'
I I I I 1....t. Mi..l. 54 53 110• 1150' 2731 2714' 1134 11511 5.. 1041lIel,. Cnoo I 15 31 234. 2503
12741 3031' 531 5"' 141 1351
FlUl-. Ol.Ul.. 3 ToMlo II 14 4151 4443 5414 5130' 1173 17411 1442 15311
I 12111
I I I-- 25 ZOI 171 1054. 121071 111 131' 12 171Sh...luIl I ZI 21 I II 1041 7412 177'1 0 01 110 luiG".,-u... 47 SI 1301 15711 11743 22154' 1435 17101 510 1121£111'01 I 51 311 141 11101 21n 35121 1..1 22131 0 01!Ialou I 17 501 1314 1111' 704. 102011 1131 11731 115 234'
I n 251 4" 7111 112 2141 3.7 '171 4· 101Gal_ 177 124 I 117. 10121 1413 74131 3721 4301' 132 10211
I 7. 53 I 1040 14021 214. 40101 3171 51711 1121 21101Fllllli.. ObUl•• 4 ToMlo 333 312 I 1115 1134' 51017 115111 123.. 151271 3317 43,.,
I . I I I 1 I_u. t 35 37 1 51 "' 1130 14115' 1131 11171 134 2011!IIqII.. 25 11 1 23 2" 2131 2445' 272 311' 12 1041All_H 15 251 227 331' 5013 7_, 221 321' 111 1101Al._ I 7 1 23 271 1250 14,., 100 1171 15 11'IHU" 30 221 0 01 11 111 0 01 0 01~1l_ToMlo 154 110 I 342 413' 18401 151131 1751 2450' 347 4121
I 1 1 IT... 132
~I1122 32221 lUI 13.721 32041 53~43' 10074 111221
K--' 22 1.11 3143' 2350 33131 2400 31001 505 aulSt._ "lllq. 37 21 2330 21451 735 8151 1151 14511 403 1041Ie_" 35 22 777 ..01 147 2141 01 III 100 1841'on 'tun. 217 124 1211 11211 4131 12171 2001 27181 215 3701Ill..... ClI_ 12 3 0 01 0 01 0 01 0 01Cl...l. 21 11 1210 14131 411 nil 2312 31001 33 411Cl...l. '1101111',. 2 1 140 2101 12 241 221 45111 0 01C_al 4 4 211 21111 121 12" 750 7501 a at1.,1. 77 14 1211 13031 107. 12731 7U7 a3011 10 111Ioel• .,ldnl',. 10 I 211 3381 0 01 121 13151 0 011..1. '1111... 20 10 Sll 1021 0 a, 3035 51141 0 01PllIIIl... Dl.Ulo' 3 ToMlo 5" 3. 1111. 111501 11012 D7"' 52UI 103521 11500 111541
I I I I'_t.io 51 21 al 1211 510 7011 25 3~1 0 010l.~lt.8lIl1 35 12 500 14211 1101 4113' 351 10111 217 1011Ol_alu 1./11_ I. TcRa1a 13 SI 511 15501 211. 3314' 311 11021 217 aOll
1 I I I_1.,- 43 U 175 1771 3nl 37311 a.ll 0~541 11112 21031Hlnt>o 74 52 331 4111 773 1471 2415 211151 2410 272111"_.- 211 121 2155 31411 4432 58541 13211 185351 12301 182101B.o1,. 14 10 D 01 D 01 25111 20111 3538 4048111:.'11l1li.11... 7 I 5 51 a 01 Sl20 4385t 2771 30411'blli.. OioUt., a To'-la 357 235 4171 51..1 8122 103311 31022 SllI3I1 23014 302011
I I I ITo'al 2700 1115 33351 44514' 111402 2211754 I 10..44 153101' 41501 171521
----------
len. bouo_U 111 OlaJJr:7lt.8~ b__ 500 ah__ 1.500 _ ._ ••_ 111 til. 'on YuIl_ ......
30
_ ~
'
~
~
"
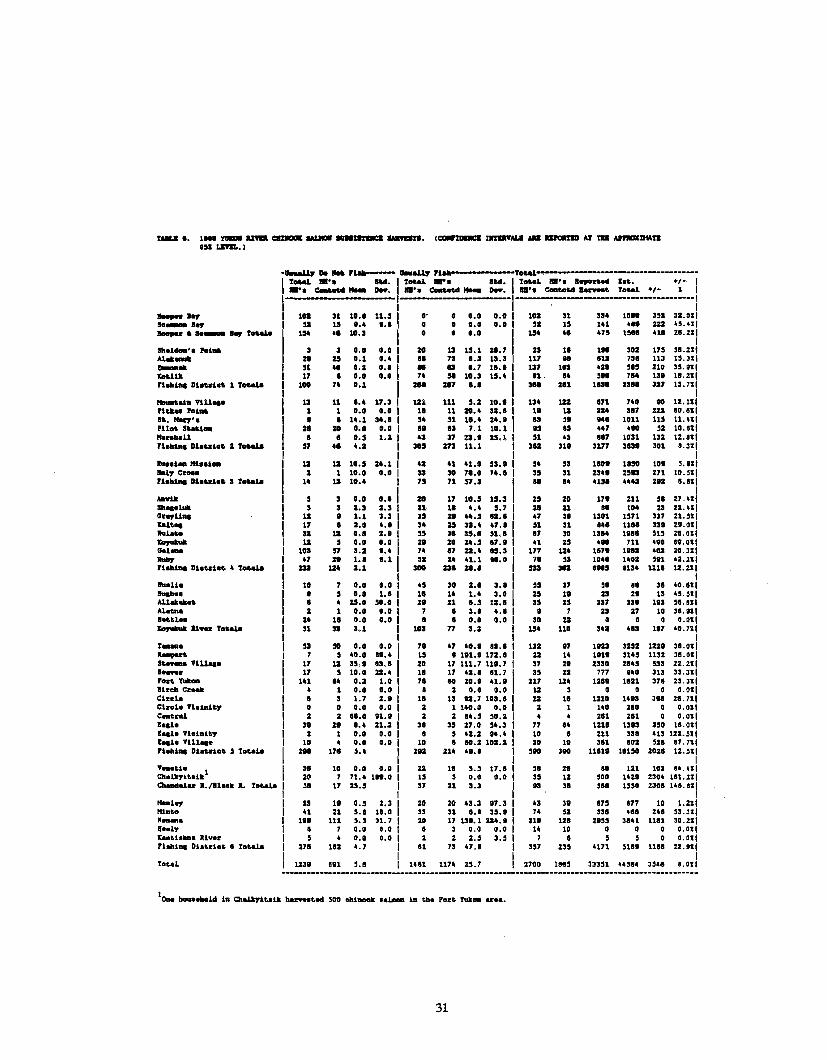
fAlLa ••1.' _ IIPD CIDlIIlIt IIAUa___ • ICX*l'lD&iC& IftIIl'IAL8 0\11& Ar fBI _ntAft
"I LftIL.l
-u-1b' a. .. ri____ O....u,. '1"" •••..feul..• ... ------------------If_ .". Ad'lf- .'. IW. I feul .'. lI...,ewot I ••• +1- I.". -...- ow.•'.-..._ ow. .'. eoa..W 1Iufta. fa.ol +1- I I
I I ----·----------------1I
-"'I~ I 1ft 31 10•• 11.' I o· 0 0.0 0.0 10:& 31 3U 10n 35:& 3:&.011sa_l~ 5:& l' '.4 •• 1 0 0 0.0 0.0 'I U 141 ••1 2:a:& .'.411-... • sa_ .., fllU1a I 154 •• 10.3 I 0 0 0.0 U' •• 47' 1'" u. 1'.211
ISlI."-'. roln I 3 3 0.0 0.0 I 20 13 U.l %1.7 U II III 30:& 175 '1.111Al...
%I U 0.1 0.4 I I' 73 1.3 13.3 117 II 111 731 113 1'.311-- I n .. 0.2 0.' I II 13 1.7 II.' 137 103 UI '" 210 ".911JaUllt I 17 • 0.0 0.0 I 1. 51 10.3 U.4 91. .. ,n 1.. u. 1'.211nallial DloUl.. 1 fllU1a I 100 14 0.1 I :&II 207 '.1 ,. all 1131 1311 327 13.711
I I_'.ta Vlllqe I 13 11 '.4 17.3 I tal 111 '.2 10.' 13. lD .n 140 90 1Z.1I1•1&It.. rota' 1 1 0.0 0.0 I II 11 20.4 31.' 1• ta ZZ. 317 zu 10.111,t.. MuJ'. I • • 14.1 34.' I '4 31 11.4 Z4.1 II " '41 1011 lU 11.411'11at. SUU.. ZI 20 0.0 0.0 I 88 II 7.1 10.1 " II 447 .10 'z 10.111"-_11 , • I 0.' 1.2 41 37 U.' U.l '1 .. 117 1031 13Z 11.811nallial D.....t.t. 2 fat.a1ll I J7 4. 4.2 30' Z71 11.1 3ft 311 3177 3... 301 1.311
I I.....t_III••t .. I ta 12 10.' 14.1 4:& 41 41.0 'I.' 54 ,. 1101 1"0 10. ,. IIIIIel,. C%Oa. I 2 1 10.0 0.0 13 30 11.0 14.' 35 31 U4. z,n 171 10.'11.lallial Dl.U1.a 3 fat.a1ll 14 13 10.4 75 71 '7.3 II 14 4UI U41 In 1.511
I I........ 3 S 0.0 0.0 20 17 10.' 15.3 I' ZO 171 III 'I 11.n!D ...luIl I
, I Z.3 I.' ll- l. 4.4 '.7 aI n I' 104 U IZ.411C1e~uaa 13 I 1.1 1.3 15 aI ..., 1:&.1 47 31 1301 1511 337 n.'llblt... I 17 I Z.O 4.1 sa U 13.4 47.1 '1 31 141 1111 331 11I.Oll....... 3:& 12 0.1 Z•• " 3. 35.1 '1.1 17 '0 1314 1'" '1' 11.011... I 12 , 0.0 0.0 ZI ZO 14.' 17.' 41 Z, .90 711 ... Ill. 011C101_ 101 '7 3.2 ••• 14 17 D •• ".3 177 11' 1111 18n .02 10.311
I 47 11 1.1 1.1 3:& Z4 41.1 90.0 71 33 10.0 1402 511 .z.nln_.. Dl.ut••• foUla I 213 114 2.1 300 ZH aI.1 ,ss 3n I'" 113' 1111 12.211
I IIluaU. I 10 7 0.0 0.0 ., 30 2.0 I.' " 37 " .. 31 .0.511IIqbq I I , 0.1 1.1 II 14 1•• 3.0 U II U ZlI 13 .'.'11All.......a • • U.O 30.0 21 21 .., 12.1 35 Z, U7 331 111 51.nlAlotll. I 1 0.0 0.0 1 I 1.1 4.' I 1 13 Z7 10 31.911I.'U_ 24 II 0.0 0.0 I • 0.0 0.0 30 z:a 0 0 0 O.Olt
... Ill...... fat.a1ll n 13 3.1 103 17 3.2 154 110 34:& .13 117 .0.711I
f... ,. 30 0.0 0.0 11 47 .0.1 13.1 132 1I7 llZ1 3U2 lUI 31.011~, 1 , •0.0 I'•• 15 I 111.0 171.1 z:a 1. 1.11 3145 1132 31.011St._ V1Uqo 17 12 35•• as.1 10 17 111.1 111.7 37 I' 1330 1145 133 IZ.lllI ...... 17 , 10.0 12•• 11 17 .2.1 11.7 35 12 717 ..0 313 33.311rol't. Yut_ 141 .. 0.2 1.0 11 10 ZO.I 41.1 117 12. la11 1121 311 13.311lb... CJ:_ • 1 0.0 0.0 I Z 0.0 0.0 12 3 0 0 0 0.011Cb.ta • 3 1.7 Z.I II 13 n.7 103.1 12 11 1210 un 311 11.711Cbot. '11.talt.,. 0 0 0.0 0.0 Z 1 140.0 0.0 Z 1 140 ZIO 0 0.011Con'eal Z Z 11.0 11.1I 1 Z ..., 5O.Z • • ZII III 0 o. OIl1..1. 31 21 ••• 11.2 31 ., 17.0 '4.3 17 14 lZ11 1313 Z'O 11.0111..1. '11liaU,. 1 1 0.0 0.0 I 5 .Z.2 .... 10 I 111 331 413 l1Z.5111..1. VlU••• 10 • 0.0 0.0 10 I 10.2 10:&.2 10 10 311 102 511 81.711.lalll.. Olaut., , faUla ZM 171 5•• ZIZ 21' •••• 590 390 11111 11150 2011 lZ.'11
I~":~=t.Ukl
31 10 0.0 0.0 12 II ,., 17.1 51 21 II 1Z1 101 1•. 411ZO 7 11.4 111.0 l' 5 0.0 0.0 35 11 500 lUI 130. 111.111
CIa_olu •• /ll_k II. faUla 51 17 15.' 37 11 3.3 13 31 5" 1'50 2301 1••. n!I
_1.,. IS 11 0.' 1.3 10 ZD 43.3 17.3 .. 31 51' 177 10 1.111!Ii.... 41 11 5.1 11.0 33 31 I.' 35.1 1. 52 331 'II 1'1 53.311If..... 1.. 111 5.3 31.7 20 17 131.1 D'.I Zl. 111 Z." 3141 1111 30.2111I.01y I 7 0.0 0.0 I 3 0.0 0.0 14 10 0 0 0 0.011I:_tot.hn. Rlvel' 5 • 0.0 0.0 Z I Z., 3.' 7 I 5 , 0 0.011Pl...t.,. DlaUi... faUla 271 112 •• 7 S1 13 .7.1 357 Z35 4171 51111 1111 2Z·1l1
IfOUl 1131 111 '.1 1411 117. 25.7 2700 111' 33351 ..". ".1 5. OIl--------------------------------------_.._----------------------_.._-.---_..._-------..----_.......-1eno _._U I" Claaaytullt h_t.ocI 300 0..1_ IU- ia til. 'aet. fulr:aa •.,.••
31
_
-
_
~
~
~
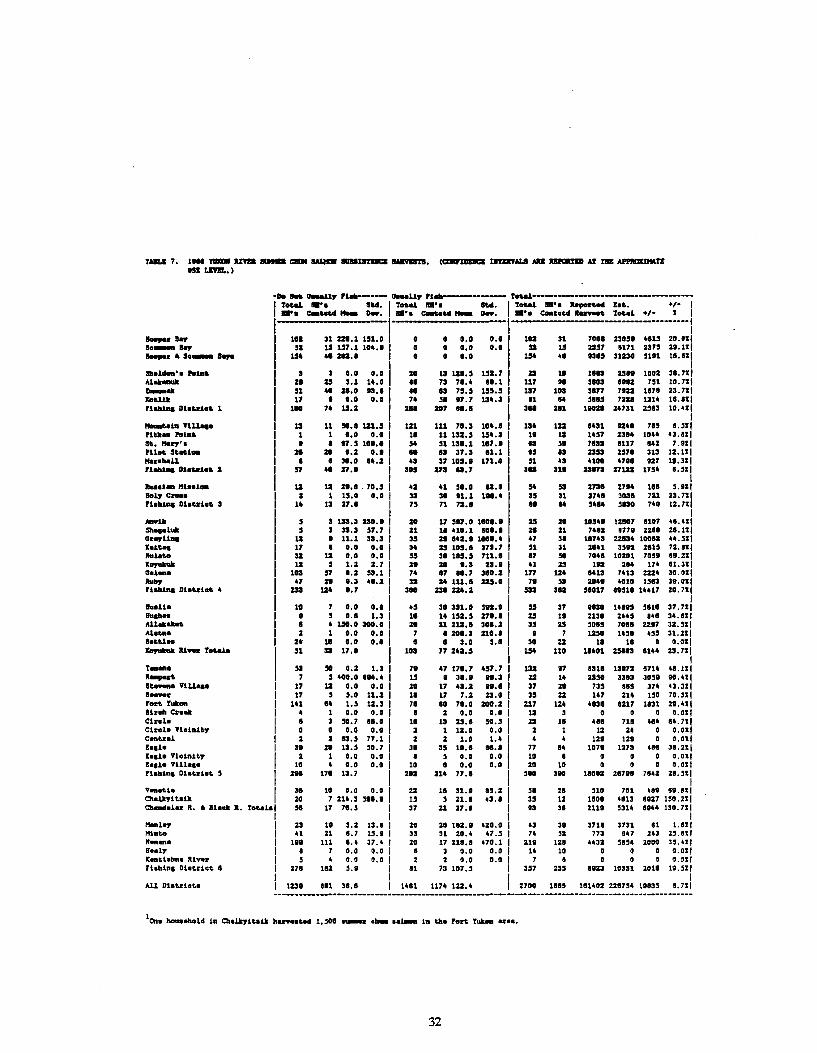
rAILI 7. It" Ilrn:It CIIII _IftIII:I 1Wl9IIItI. (QMi1DiKi IftIIl'IALlI AU RIItmIII A'l till AI'l'IIDllDIAU151 LI9IlL.)
-Dol 1I~ n_--- _u" rloll • rct&a1------------------------I r.&a1 a'. s.... I ro&a1 a'. Sad. I ro&a1 a'. .--- Z••• +'- Ia'. ca.__ _ . a'. _ ... _ _.a'. ca...... a-. Toul +'- I I
I -1-- ----t------------------·_··---II I-.-,.., I 102 31 238.1 1"'.0 I 0 0 0.0 0.0 I 101 31 7008 13051 ••15 20.011
So_ •.., 33 15 157.1 10•• I 0 0 0.0 0.0 I 33 15 1357 5171 1375 z•. l1l-.-.Sa_ ...... I 1,. .8 1ft.' I 0 0 0.0 I m .8 1315 31130 '1'1 11.511
I ISIIe1daa'. Poin I 3 3 0.0 0.0 I 10 13111.5 151.7 I 13 18 1113 1511 1001 38.71141._ D 13 3.1 H.O .. 73 78•• .8.1 117 .. 5103 5tt1 751 10.71\_.
I 51 .0 D.O 13.' I .. a 75.5 155.5 I 137 103 5177 7t21 187. 23.71\17 • 0.0 0.0 7' 51 17.7 13•• 3 I .1 •• 3115 7228 lIH 18.111
nolll... Dla..,i... 1 I 100 7. 15.1 I Ilol 107 .... I 3.. 211 11028 IU31 2513 10.HII I
_tala VU1lIp 13 11 51.' 111.5 1 111 111 7D.3 10•• I 1,. 121 ••31 ftU 7.5 5.311ru... Pol... 1 1 0.0 0.0 I 18 11 131.5 15•• 3 I It 11 H57 I". 10•• .3.511St........,.'. • • t7.5 108•• I 3. 51 131.1 117.' I a 51 7131 5117 IU 7.911'U.. Sta.i_ D 10 0.1 0.8 I 18 a 37.3 11.1 I 15 13 1353 1571 313 11.111__ u
• I 31.0 M.I I •• 37 lOS.8 171.0 I '1 •• UOO UII 127 1'.311nolltae Dl....i ... 2 57 .. 27.' I 30S 271 13.7 ,ea 31. 1317. 27121 1754 5.311
I I I_at_ Hl••i_11 11 D.' 70.5 I .. U 51.0 52.0 I 5. 53 2711 27•• 11' '.111
801" c:zn. 2 1 15.0 0.0 I 33 30 11.1 1.... I 35 31 27•• 3011 711 13.711fl.lIi... Dla..,la. 3 1. I' 17.1 I 7S 71 71.8 I " M '.M 51.0 7.0 12.711
I I I-- 5 3 13'.3 230.' I 20 17'17.01_.' 25 10 105•• 121lO7 .107 .,.ulSII_l.... 5 3 31.3 37.7 I 11 II .1D.l 511.1 I 18 11 7.82 577. 1158 21.111Oe..,Uae 12 • 11.1 33.3 I 35 D'''.' 1..... I U 3. 18n3 1113. 10012 u.'ll1.1'.. 17 I 0.0 0.0 I 3. 25 lOS.1 373.7 I 31 31 21U 35ft 1115 71.511
""1." 31 11 0.0 0.0 35 31 1'5.5 711.1 I 17 30 70.1 10201 7051 51.221107at.... 11 , 1.1 1.7 I' 10 t.3 23.t I U 15 1ft 2•• 17. 51.311Gal__
lOS 57 •• 2 53.1 7. .7 ".7 31D.1 177 11. M13 7U3 Z22. 30.011Ru..,. &7 It '.3 '8.2 32 I. 111.1 125.0 1 7t 51 2..t '010 1513 3t.01lflolliq Dlaazi.. • 131 11. '.7 300 :1M 22••1 I 53J 3ea '1lO17 5151. lUl7 20.711
I I_u. 10 7 0.0 0.0 .5 3D 311.0 5n.0 35 37 tnD Hlt5 5111 37.7111Iqh.. • 5 0.1 1.3 18 1. 152.5 27t.1 25 l' 1131 2U5 5.1 3•. 511411•••• I • 150.0 300.0 2. 21 112.1 308.1 35 25 '015 7018 IIt7 31.'11Ala._ I 1 0.0 0.0 7 1108.3 110.' t 7 1250 H5I ." 31.211I.atl.. I' 18 0.0 0.0 I I 3.0 '.1 30 ZI II II a 0.011Io7at'* Ill.... To&a1o 51 33 17.1 103 771".5 15. 110 1••01 25113 IH. 23.711
1r__
53 50 0.1 1.3 7. &7 178.7 .57.7 131 17 5311 13172 571' .'.12111_. 7 , .00.0 ..... 15 • 31.' ".3 ZI 1. 1350 3313 3051 10.HI10_. VlU_ 17 11 0.0 0.0 20 17 .3.1 ...1 37 2. 735 585 37. 43.311.- 17 , 5.0 11.1 18 17 7.1 13.0 35 ZI U7 21. 1'0 70.31\r.n r ....... lU M 1.3 12.3 78 50 7'.0 100.2 217 12. ."1 5217 1831 2t.ulIbell Cn. • 1 0.0 0.0 5 I 0.0 0.0 12 3 a a 0 0.011Cleel. I 3 51.7 ".0 18 13 25.5 '0.5 II 18 '51 718 .8. 5•• 711Cleel. Vhilllt" 0 0 0.0 0.0 2 1 12.0 0.0 2 1 12 2. 0 0.011Con.eel I I 2 5'.3 77.1 2 I 1.0 1•• • • 12• 1211 0 0.011bd· I 38 18 13.5 '0.7 38 !5 1••• .... n M 107t 1173 .88 3•• 211Z.d. VhlaU" I I 1 0.0 0.0 • , 0.0 0.0 10 5 0 0 a 0.011£OIl. VUba. 10 • 0.0 0.0 10 I 0.0 0.0 10 10 0 a 0 0.011nolll.. Ol• ..,let , I In 178 13.7 2n 11. n.' 3to 3to 180t2 28718 7142 28.311
I IV••t.l. I 38 10 0.0 0.0 II 18 31.' 85.1 " 21 310 701 .all all.nlCh.Uyltait I 20 7 21'.3 381.' 15 , 21.5 .3.' !5 12 15011 0513 51127 130.211eII_1..... • n •••. r.talal 51 17 71.3 37 11 27.5 II 3. 211' 531' 511U 130.711
I IH_1.,. I 13 III 3.2 13.5 20 20 112.' 420.0 U 311 3718 3731 51 1. 511Miate H 21 5.7 1'. I 33 31 20.' .7.3 7. 52 773 947 241 23.511,,_.- I Itt 111 5•• 37 .• 20 17 211.8 410.1 2111 12. U32 555. 2000 ".ula••l,. I 5 7 0.0 0.0 8 3 0.0 0.0 14 10 0 0 0 0.011lanei.tIn. RiV_I' I , • 0.0 0.0 2 2 0.0 0.0 7 5 0 a a 0.01(rhlllaa Ohtrlat 5 I 271 152 '.11 11 73 107.3 357 %33 5123 10331 2011 11.51(
I IAU Dhteleto I 1138 5.1 38.5 1411 117. 121•• 2700 1185 18H02 211734 11153' 5.71t-----------------------------------------------------------------------------_.._----_.........
Ion.......oII.1e1 la eII.1kylUi.. hone.oocl 1.300 ._e .- ••J.M la .... r.eO r .... ......
32
_ _ ~
_
'
~
'
_
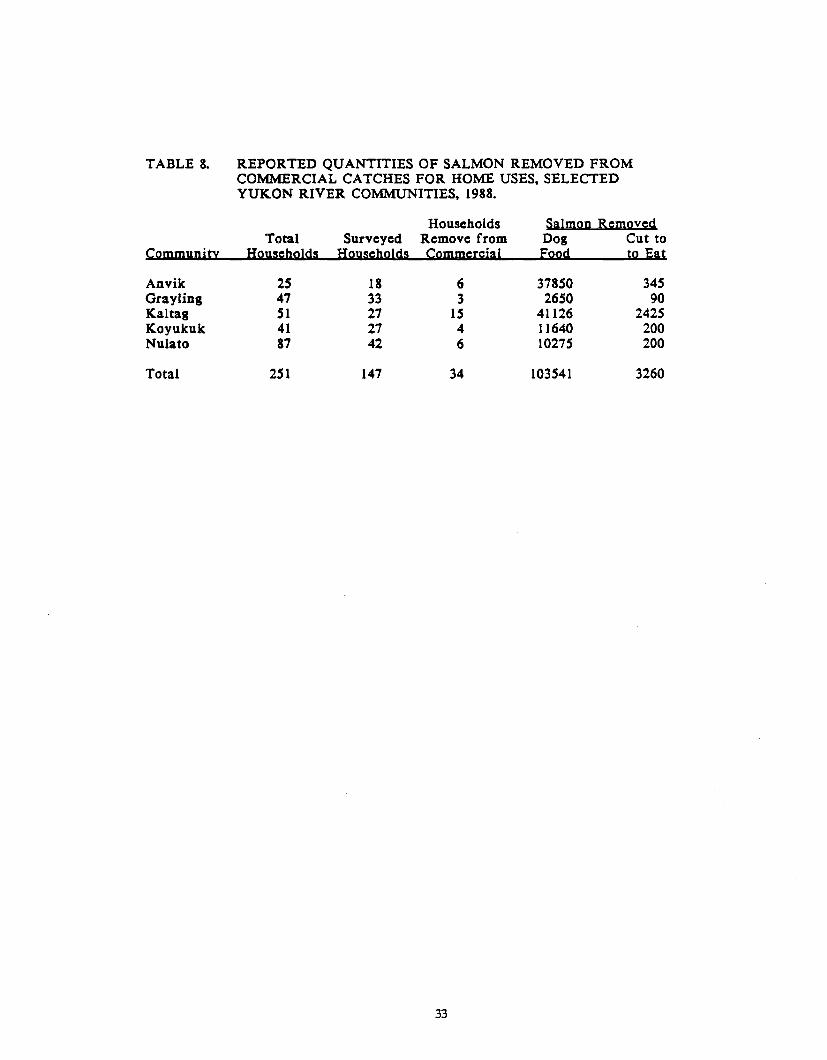
TABLE 8. REPORTED QUANTITIES OF SALMON REMOVED FROMCOMMERCIAL CATCHES FOR HOME USES, SELECTEDYUKON RIVER COMMUNITIES, 1988.
Households Salmon RemovedTotal Surveyed Remove from Dog Cut to
Community Households Households Commercial Food to Eat
Anvik 25 18 6 37850 345Grayling 47 33 3 2650 90Kaltag 51 27 15 41126 2425Koyukuk 41 27 4 11640 200Nulato 87 42 6 10275 200
Total 251 147 34 103541 3260
33
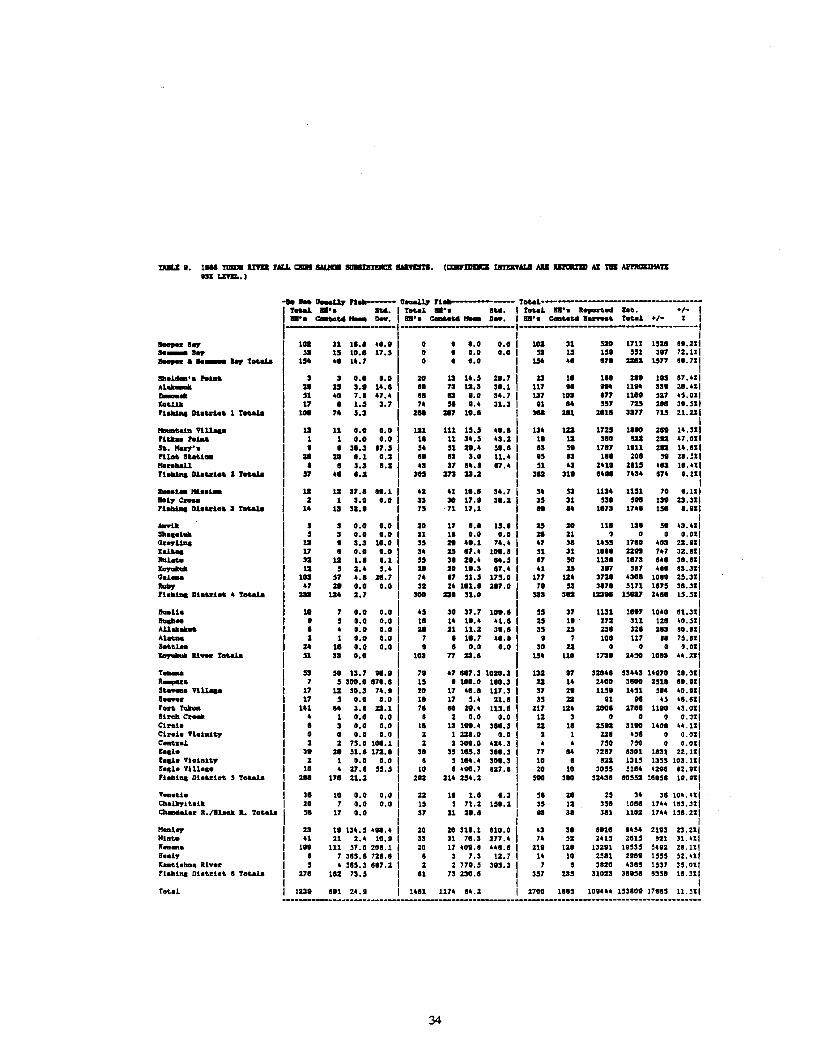
TAILI •• 1... !111m ana ,ALL CIlIlI lIAI.Im lIUIIUtIIICI 1IAIl9IlITI. IQiil1DB&i III'fIIl'IAIolI All IlI1'lmIII Il'l tD Al'I'Illll1Ho\tIlSI LI9IL.1
... U-.\17 '1_ U..aU7 n_ Y...ol-----------------··---·-
11'KU D'oIW. I Toul D'o IW. I THOI. D'o II_nod b&. ./. I
D'o e-&ow_ 00.. I D'a e-MW_ 00.. I D'. e-&oWB...... Youl. ./. I I1-- --t·--------------·····------II I
-...~ IDa 31 1'.' ····1 0 0 0.0 0.0 I 101 31 ,ao 1711 1'21 0'.211SO_.ap sa l' 10.' 17.5 0 0 0.0 0.0 '2 l' 151 551 317 72.nl-.. • 10_ .~ TKalo 156 •• 1'.7 I 0 0 0.' I 156 .1 17. 2211 U77 ".711
I_1_'0 hla& 3 3 '.0 0.' I 211 13 1'.' 28.7 I 21 11 1.. ZII 115 07.011A1aIl_ D 25 3.' 1'.1 II 73 11.3 3•• 1 117 II OM 1114 311 ZI.ul_...
51 '0 7.' 47•• I 81 0 I.' 34.7 I 137 113 177 1111 '17 ".011bUlk 17 I 1.5 3.7 ,. 51 I.' 31.3 11 I. "7 715 ZSI 31.'11'lMial Dl.Ulo. 1 TKalo 100 7. ,.. I III 117 111.1 3.. 211 1111 3377 713 21.211
I_hi. VI11ato 11 11 '.11 0.0 I 111 111 U.5 '"., 13. III 1715 I." 211 1'.311PIUl_ hi•• 1 1 '.0 0.0 I 1. 11 3••5 '1.1 II 11 310 Oil ZDa 47.0115•• Marr'. I I 31.' 17.5 I ,. '1 D.' 51.1 13 " 1717 1111 211 1'.811PlIn 3u&1_ II II 0.1 0.2 I O' 0 3•• 11.' IS IS 111 zal " 21.'11Ilanllall • I 3.' '.2 I 'I 37 •••• '7.' '1 •• 241. 211' 'IZ 10.011FlMial Dl.Ulo. 2 TKalo 57 •• '.2 305 m 23.2 31Z 31. .... 741. 0,. '.111
I....t._ Mi••i_ 11 11 37•• 81.1 4Z 41 11.1 3•• 7 ,. " 1134 1151 70 1.11111017 C_o 2 1 3.0 0.0 33 30 17.' 31.2 3' 31 '" '" III Z3.311PlMial DlaUlo. 3 TKalo 1. 1:1 31.' 7' 71 17.1 II •• 1173 17.1 lSI • ••11
I-.lit 5 3 0.0 0.' 10 17 ••• 15.' 15 2. UI III 51 '3.011:lb...l_ 5 3 ••• ••• 11 1. ••• ••• 21 11 0 0 • 0.011Oeapll", 11 I 3.3 Ill.' 3' 2. ".1 ,... 47 31 I'" 1710 .03 22.nl
Eel"" 17 I 0.0 0.0 34 IS 17•• 101.' '1 31 1181 Zln 747 32.811hlaM 31 11 1•• •• 1 " 31 II.' ".5 17 sa 1131 1173 "I 31.811Ito7'*'* 11 3 I.' ,.. II 20 1'.3 17.' 41 25 317 '.7 UI 03.311001_ IDS 57 '.1 21.7 7. 17 '1.5 17'.' 177 12. 3721 ••01 I'" 2'.311..., 47 2. 0.0 0.0 31 24 111.1 217.' 7t " 3171 '171 1173 31.311'lablat Dlovlo•• TKalo 2Ia 114 2.7 .oa 251 '1.'
,,, 311 123" 15117 Z.II 15.311I
BuUo 10 7 '.0 ••• • S 3• 37.7 101.1 'S 37 1131 1117 lOla 01.311hili- • s '.0 0.' 11 1. l'.l 41.1 2' l' . Z71 311 121 '0.311All....... I l .:0 ••• 2. 11 11.1 3'.1 35 25 231 321 213 00.811Abbo 2 1 '.0 ••• 7 • 11.7 lO.' • 7 lao 117 " 73.811.0Ula. 2. 11 ••• ••• • • 0.' ••• 30 22 0 0 0 '.011Ito7'*'* Ill... To&o1o 51 33 0.0 I'. 77 25.' U' 110 1738 2.,0 lOIS ".211
IT.... S, sa 13.7 II.' 71 47 117.3 1011.3 111 t7 320•• '344' 1'170 21.011R__
7 S 3oa.0 170.' 11 • lao.' 110.3 22 II Zlao 3100 Z'l. 81.1111&_ Vl11ato 17 11 30.' 7'.1 20 17 lI.' U7.3 37 ZI USI 1"1 "l ".nlI_e 17 S ••• ••• 11 17 ,.. 11.1 35 22 11 III u ".811'o"T_ 141 14 3.' 22.1 71 80 21.' llS.1 217 12. zaal 2711 11" '3.011Ileab Ce_ • 1 0.0 0.0 I 2 0.' 0.0 12 3 0 0 0 0.011Cleal0 • 3 0.0 0.0 II 13 1.... 311.3 22 11 2'0 31" 1'0' ".111Chal. 9'10la1&7 a a 0.0 0.0 2 1 221.0 0.0 2 1 Zli .,1 0 0.011C...~al 2 2 75.0 101.1 2 2 300.0 l".3 l • 730 7'1 0 0.011Ea... 31 2. 31.' 172.' 31 35 115.3 381.3 77 .. 7217 8301 1131 22.111Eo.l0 Vl.in1&,. 2 1 0.0 0.0 0 , 11•• 301.3 10 I III 1313 1355 IDS. 111E.,l. V1Uo,. 10 • 27.1 55.' 10 1.".7 111.1 ZO 10 3035 'U• '211 12.911Flalll.. D1a&~l.& 3 To"" 2.. 171 %1.2 211 11. 154.2 ," 310 '2'31 10352 llD3I 1'.911
I.....~1. 31 10 0.0 0.0 22 11 1.1 '.3 51 21 23 34 31 lDl.UlCIIolltyUait 20 7 0.0 0.0 13 , 71.2 1'8.% 3' 11 331 IDes 17" 1'3.311CII_o1u R.I.l00t It. Toula " 17 0.0 37 %1 21.' n 31 311 1101 17.. 131.%%1
I11..1., 21 11 134.3 .tI•• 20 20 311.1 010.0 U 31 1111 .... 2113 23.%%1111nM U 21 2.' 10.' 33 31 71.3 277.' 14 '2 2413 2113 021 31.011If...a lt1 111 37.0 201.1 ZO 17 401.1 "I.' 211 12' 132.1 1933' ,..2 ZI.lIl8••1,. I 7 385.1 721. I I 3 7.3 12.7 14 10 2311 2111 1335 52.011X...~hbn. 11.,.2' , • 585.3 '17.2 2 2 771.3 313.3 7 I 3120 .315 1337 3'.011nlhl.. Dl.t~l.t I Yo_ola 271 111 73.3 51 73 230.1 357 23' 31023 3I1S1 "31 11.311
ITotal 1231 0.1 2'.' I'll 1174 84.2 2700 1185 lOll.. 133101 17815 11.511
..._-------------------------------------_.._---------_..----------------------------------------
34
_ -
'
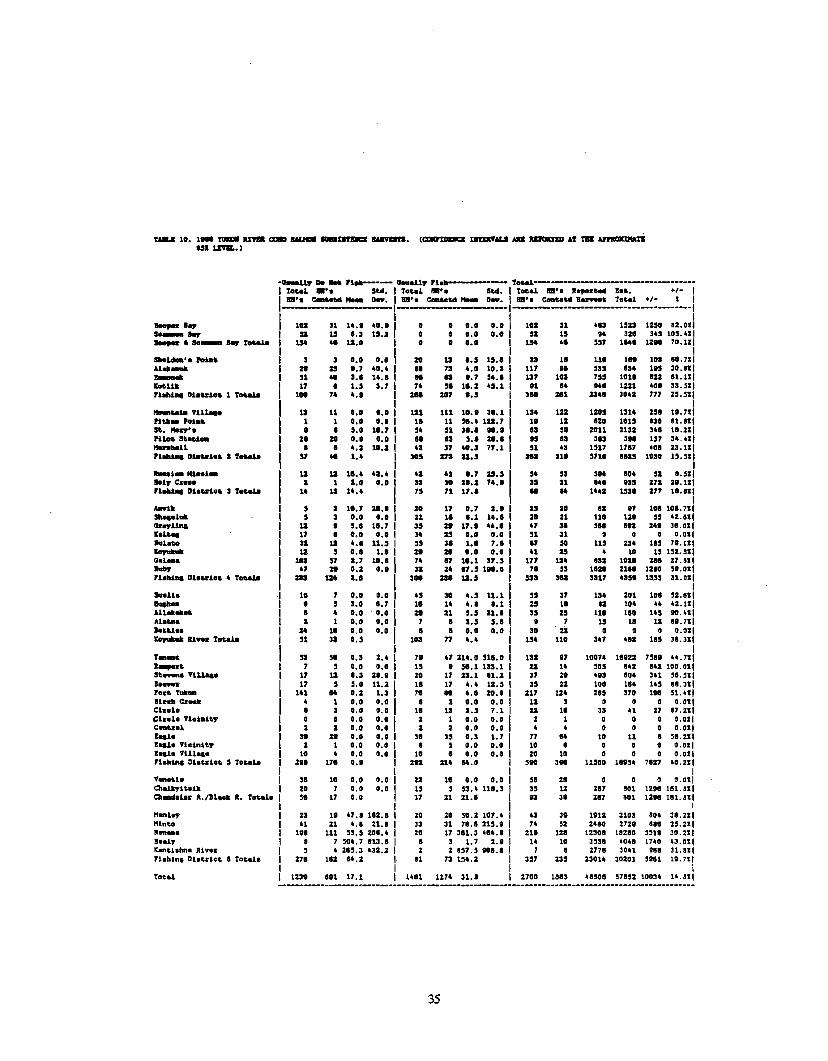
fAIU 10. 1_ 'lUa. ana aBI aM.- 1IAIIftSft. (CtMi1DiM:i IIIIIIWALS AD IIDl:aDD At TB~DlSI 1.1911I.. )
'-.L17 De r~- 11_11,. rl_-- fo&u-------------·.·-·-··-······I fO&eJ. D'. SU. 1 fo&1IL D'. SU. I fo&eJ. D'. II....~&... !'&. +/- I
I·D" _U_ _., D'. e-toaU_ _.1 D'. e-toaU B_& fo&.i +1· 1 II -- .__..-._-_........ ..__.......,
I I I~I~ 102 31 14.' .... I 0 0 0.0 0.0 102 31 ••3 IS23 1250 82.011SO_~ I S2 IS '.3 lS.2 I 0 0 0.0 0.0 S2 15 •• 32. 3U los.nl-.... .. so_ fo&o1l m •• 12.0 a a 0.0 15' •• SSf 1••• 12" 7a.nt,
I I_w.'. h_ I 3 3 0.0 0.0 20 13 ••S 15.' 23 1. 110 1•• 103 .0.111,\101l_ I 2. :15 '.7 .0•• , " 73 •• 0 10.3 117 118 S35 .3. 115 30.811_Ill I 51 .0 3.' 14.' I II 13 '.7 S•• 137 103 135 1011 '22 n.nl_Ult I 17 • 1.S 3.7 I 7. SI 1'.2 .5.1 .1 s. ••• 1221 ... 33.311rllbu.. Dl.Ul._ 1 fo&eJ.i 1" 7. ..' I 2.. 207 ••5 3.. 211 23•• 3041 777 2S.311
I I ,_&.111 91Uoee l' 11 0.0 0.0 I 121 111 10.' 3'.1 13. 122 1205 1314 :15. 1•. 111'UJI. Pold I 1 1 0.0 0.0 I 1. 11 so•• 122.7 I 1. 12 820 lOIS no 81.811.-.....,... • • 5.0 10.7 1 S. 51 3'.' .... 13 " 2011 2132 3•• 1•. 211'11" n.&i_ I 2. ZlI 0.0 0.0 , .. 13 S.' 2"'1 IS 83 313 311 137 3•. ul"'"bill • • ••2 10.2 I .3 37 .0.3 77.1 51 U 1517 17.7 ... 23.nlfllbl-. Oi.Vlo& 2 fo&o1l I Sf •• 1•• , 305 2n 21.5 I 311 31. 571. 8825 1030 15.51!, ,_.i_ mui_ I 12 12 1••• .2•• I .2 .1 '.7 :15.5 I 5' 53 SI. ... 52 •. sllIoi,. C_ a 1 a.o 0.0 I 33 30 21.2 ,... 35 31 ... 135 272 2•• 111fllbl-. lli.Ul._ 3 fo&o1l I 1. 13 1••• I 13 71 17.' I u .. 1.41 153. a77 1•• 011,-II I 5 3 1'.7 2"'1 20 17 0.7 a.' I :15 20 sa 07 1.. 10'.111~1"" 5 3 0.0 0.0 21 1. •• 1 1•• 0 I a. 11 110 12. 55 .2.811lIe~Uq I 12 • 5.' 1'.7 , 35 ZlI 17.' •••• I
.7 3' ". sn a•• 3'.011lut.. 17 • 0.0 0.0 I 3. :15 0.0 0.0 51 31 a a 0 0.011!la1l" I 32 I' ••• 11.5 I " 31 1.' 7.' I 87 50 115 23. 115 '1.111IayWNIl 12 S 0.' 1.' I 2. 20 0.0 0.0 I u :15 • 10 15 1S2.nl1101•• I 101 57 2.7 10.' I 7. 87 10.1 37.S I 177 12. a32 1020 211 27.811IttIW 47 2. 0.2 0.' 32 2. 87.S 1".0 I 70 31 1.2. 11.. 1210 51.011n.bu.. Dl.Ul._ • fo&o1l I 231 124 2.' I 300 22. 12.S I S33 311 3317 un 1351 31.011
I_u. , 10 7 0.0 0.0 I .5 30 •• 5 11.1 " 37 13. 201 101 32.5111IaIbII I • 5 3.0 '.7 , 1. 14 ••• '.1 :15 1. IZ 10. •• .2.111All...lIl.. I • • 0.0 . 0.0 I 21 21 S.5 21.' 35 :15 11. 110 145 ...•slAloU. I 2 1 0.0 0.0 7 • 2.5 S•• • 7 15 1. 12 ".111antl•• I 2. 1. 0.0 0.0 I • s 0.0 0.0 30 n 0 0 0 o.oSIIGraIlIIIl Iliwe fo&o1l I Sl 31 O.S 103 77 ••• 15' 110 347 ..2 115 31.311
I, I
f__
53 50 0.3 2•• , 70 47 214.0 51'.0 132 07 10074 11122 7Sa. u.7slII__
I 7 S 0.0 0.0 I 15 • SI.1133.1 22 1. 50S "2 8.2 100.oslSt_ Vl1lop I 17 12 '.3 2'.' , 20 17 23.1 '1.2 37 2. .83 ao. 3.1 38.S11I_e I 17 S S.O 11.21 II 17 ••• 12.S 35 22 100 I'. US ".311rOdY_ lU .. 0.2 1.3 711 110 •• 8 20.' 117 12. 2as 370 1.. 51.ulIle.b CZ_ I • 1 0.0 0.0 I • 2 0.0 0.0 12 3 0 0 0 o.oslClull II 3 0.0 0.0 111 13 2.S 7.1 22 1. 33 U 27 87.211j;leel. 91010it,. I 0 a 0.0 0.0 I 2 1 0.0 0.0 2 1 0 0 a 0.011C_U.l 2 2 0.0 0.0 2 2 0.0 0.0 • • 0 a a 0.011!qt. , ,. 21 0.0 0.0 , 311 35 0.3 1.7 17 8. 10 11 8 38.uI! ..1o '1lalon,. I Z 1 0.0 0.0 I 8 S 0.0 0.0 10 8 0 a 0 o.atl1..10 '1111... I 10 • 0.0 0.0 I 10 • 0.0 0.0 20 10 0 0 a o.otlrllbi.. DilUi•• S To&_ta , 2" 1711 a •• I 2ft 214 ".0 300 3" 11SDO 18I1S. 7827 .a.2tl
I I I'I_i. , 311 10 0.0 0.0 I Z2 111 0.0 0.0 sa 211 a a a a.atlCIt.ayltUJl I 20 7 0.0 0.0 I l' 5 S3 •• 1111.3 " 12 2117 sal 1211I 181.nlCIt__ lec 11.111... Il. fouta I " 17 0.0 37 21 21.' 83 31 2117 sal 1211I 181.511
I, I
H_l.,. 23 1. U.s 1'2.11 I 20 20 50.2 107•• ., 30 1'12 2103 sa• 38.ulHtnt.o I .1 11 •. 8 21.' I 33 31 711.' IlS.11 7. 32 2... 27211 SS8 23.2tl"...... I I" 111 1S.5 2011 •• I 20 17 3111.3 .11•. 11 21. 128 123011 182.0 53111 30.211a••l" I • 7 50•. 7 S13.' I 8 3 1.7 2.0 14 10 333. .o.a IHO .3.011ranti.hlla JUv.~ I 3 • 2SS.3 .32.2 I 2 2 837.S 0011.8 7 8 27711 30U 90s 31.111rbhlna Db&det 8 Totalo I 2711 1112 8••2 I S1 73 1S•• 2 337 23' 23014 30201 31181 10.711
I I Ifat.l I 123. 8111 17.1 I 14111 117. 31.' 2700 18SS .SSOI S7as2 1003. 1'.111._----_...--------------.. .._--- .. ..---------------
35
~
_
_
~
'
_ -------------------------------------------
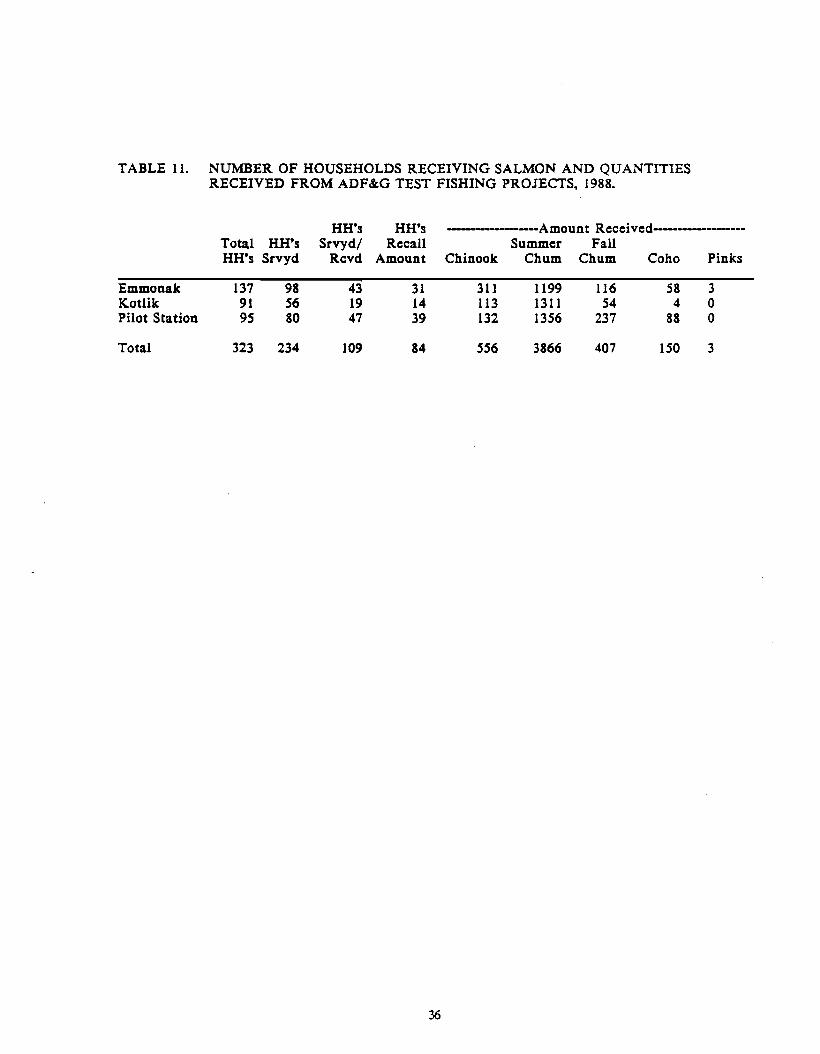
TABLE II. NUMBER OF HOUSEHOLDS RECEIVING SALMON AND QUANTITIESRECEIVED FROM ADF&G TEST FISHING PROJECTS. 1988.
HH's HH's .............. -Amount Received---------···--Total HH's Srvyd/ Recall Summer FallHH's Srvyd Rcvd Amount Chinook Chum Chum Coho Pinks
Emmonak 137 98 43 31 311 1199 116 58 3Kotlik 91 56 19 14 113 1311 54 4 0Pilot Station 95 80 47 39 132 1356 237 88 0
Total 323 234 109 84 556 3866 407 150 3
36
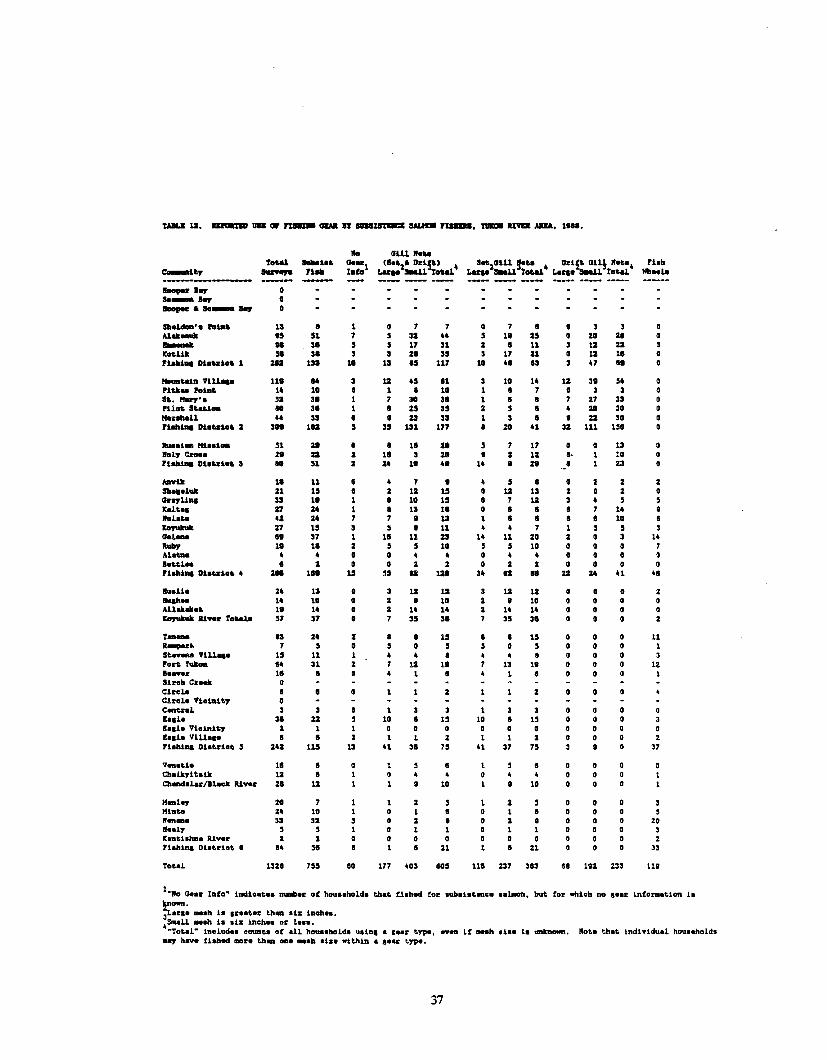
TAILI 12. IlDClaDII lID ct' n lIUI8lftDC1 fl_, m- IlI'fIJl AIIIEA, 1118.
Ie <1111 II...ToUJ. _18& Go-I (IIo.Z D"l~) 4 '--Z<ll11 g... 4 Dd~~~~ II••• , rlob
e-l.y .....,. Plu Iato Lu•• !IKU ToUl Laq. !IKU ToUl La.... To.at lIb..l.---_.---- ---- --- --- -- ---....."I~ 0se_l~ 0.....".se_l~ 0
Sll.1daa· a "la, 13 • 1 0 7 7 0 7 • 0 3 3 0.u...... " 51 7 5 sa 44 5 1. 25 0 ZO Z. 0!lIooaDM H 31 5 5 17 31 2 • 11 3 11 U BItR11It 51 31 3 3 Z. 35 3 17 21 0 12 11 0Plall1aC Dlo"'ld 1 za 133 1. 13 as 117 10 4. 13 3 47 •• 0
_.ua Vlu... 11. 14 3 12 45 11 3 10 14 11 31 54PltJc.. "la' 14 10 0 1 • 10 1 • 7 0 3 3st.. May'o '1 31 1 7 3D 31 1 • • 7 27 33Pilo. ,t.au. II 31 1 • 25 35 2 5 • 4 2D 3DltaobaLl .. 33 0 • U 33 1 3 • • U 3DPlall1aC Dlo"'la' 2 301 lIZ 5 35 131 177 • 10 41 sa 111 15D
.....1_ mool_ 51 ZI 0 • 11 21 5 7 17 0 0 13 01Io1y C..... 21 U 2 11 3 20 • 2 12 •• 1 10 0FlU1al 01."'10' 3 II '1 2 Z4 II 41 14 • 21 ..• 1 :as 0
_ill I' 11 0 4 7 • 4 5 • 0 2 :I 2Sh...ll11t 21 15 0 2 12 15 0 12 13 2 0 2 0<I,,~Uq 3S II 1 • ID 15 • 7 12 3 4 5 ,1taL••• Z7 24 1 • IS II 0 I • • 7 14 I"low U 24 7 7 • 13 1 • • • • 10 •IaylIItuk 27 15 3 , • 11 4 4 7 1 , 5 3<1.1_ .1 37 1 11 11 U 14 11 2D 2 0 3 14au, II II 2 5 5 10 5 5 10 0 0 0 1.u.._ 4 4 0 D 4 4 0 4 4 0 0 0 0InU.. • :I 0 0 2 2 B 2 2 B 0 0 0flablq 01."'1.' 4 211 III 15 55 IZ 1:10 34 IZ II U 24 U "lIua1lo 24 IS 0 3 12 12 3 12 11 0 0 2Ihqb•• 14 ID 0 2 • 1<1 2 • 10 0 0 0.u.l.aIld II 14 0 2 14 14 2 14 14 0 0 0Ita7lIItlllt IU._" TRolo 57 37 0 1 35 31 7 35 31 B 2
Ta_ IS 24 2 I I 15 I I 15 0 11R_". 7 5 0 5 0 , , 0 , 0 1't._ V1Uq. 15 11 1 4 4 • 4 4 • 0 3fo"- fuIloa ., 31 2 1 11 1. 1 13 1. 0 12, ......1' 11 I 0 4 1 I 4 1 • 0 1Il""b C".... 0Cl"c1. • • 0 2 2 0Clnl. VlelaU,. 0C."'ol 3 3 0 1 3 3 1 3 3 0 0I.d. 3. u , ID • 15 10 • 15 0 3I••la VieinUy 2 1 1 0 0 0 0 0 0 0 01••1. Villa•• • I 2 1 1 2 1 1 2 0 0 2n.blq Dl.t."la. 5 2U 115 13 41 31 15 U 37 15 3 0 37
V••ti. 1. • 0 1 , • 5 • 0 0 0Cll.a,.ltaill 13 • 1 0 4 4 4 4 B 0 0Cll_al.lllack IU._" 2. 12 1 1 • 10 • 10 B B B
Hal.,. 2D 7 1 1 2 , 1 :I , B 0 0 3Hlnw 24 10 1 B 1 • B 1 • B 0 0 ,In.- 33 3Z , 0 a I 0 a • 0 0 0 2011••1,. , 5 1 0 1 1 0 1 1 0 0 0 3Itant.l...... Rlva" a a 0 0 0 0 0 0 0 0 0 0 2rlabl". Dlat."lat. I I' " 1 1 • 21 1 • U 0 0 0 33
Tot..l 13:1. 735 10 111 403 .0' 111 237 383 •• 1.a 233 111
l·Wo Ga. In'o· ladle.t.•• ..-." 0' h......bold. th•• !l.bed '0" .ub.lot...a•••~. but. fo" ....lcb no ••• Informat.lon 10~_.
3 arle ...tt 11 Ir••tel' thm .iz inch••.4_11 ....b la 01" Incb.. 0" L....
"Total" includ•• count.1 af all hoa••hold. ulin, a seu t".pe, I' ....b d •• la _a_• 1I0to. th.to ladlvldu.l hou••hoLd...,. hav. U.hed _". t.ha on.....b .1.. withln • , •• ~ypa.
37
~ _ ~
'
_ "
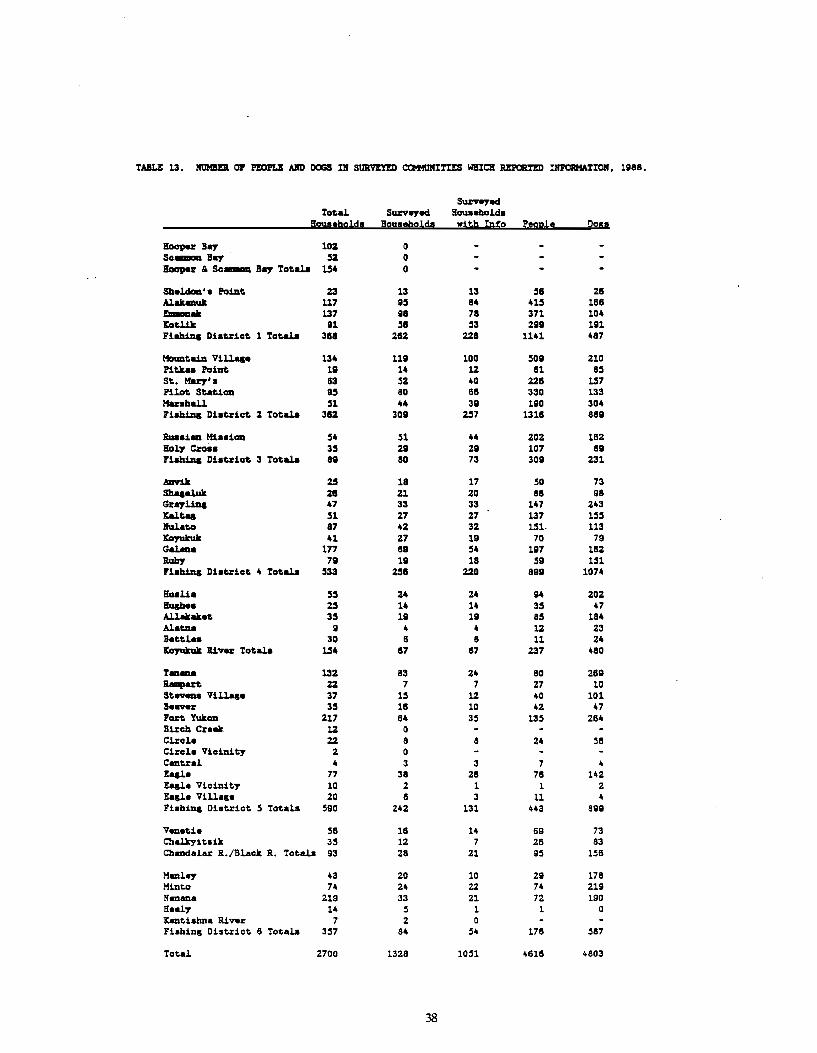
TABLE 13. NllMBE1l aP PEOPLE ABD DOGS IH SURVIYED CCfMllfIl'IES WHICH REPORTED IllFORHATIOlf. 1988.
Sw:v.,.edTot.al Sw:v.,.ed Bou..hold.
lJou"hold' Bou"hold, with Into P,ople Don
a-p-Brr 102 0Sc_ Brr .52 01IoapeJ: & Sc_ Brr Tot.ala 1.54 0
Sb.ldoa'. Poat. 23 13 13 .58 28Alail:muk 117 95 84 41.5 188~lIIc 137 98 78 371 104lCat.llk 91 .58 .53 299 191Fl!biDa Dl.tzlct. 1 Tot.ala 388 282 228 1141 487
MoImt.aiD Villaa. 134 119 100 .509 210Plt.k.. Point. 19 14 U 81 85St.. HeI:7', 83 .52 40 228 1.57Pilot. St.t.1on 95 80 88 330 133Mu'hall .51 44 39 190 304Fi!biDa Dl.tzict. 2 Tot.ala 382 309 2.57 1318 889
Rua.i_ Hi..:l.on .54 .51 44 202 1821101,. CJ:O•• 3.5 29 29 107 89Fi!biDa Di.tzict. 3 Tot.ala 89 80 73 309 231
ADv1k 2.5 18 17 .50 73Sb...luk 28 21 20 88 98GJ:rrl1Da 47 33 33 147 243lCalt.. .51 27 27 137 1.5.5lIula~ 87 42 32 1.51. 113lCa7ukuk 41 27 19 70 79Galllll. 177 89 .54 191 182Ruby 19 19 18 .59 1.51Fl'b1D& D:I..tzict 4 Totala .533 2.58 220 899 1014
BUIU. .55 24 24 94 202!!uP" 2.5 14 14 35 41Allail:lIIc.t 35 19 19 8.5 184AlatD. 9 4 4 U 23B.t.t.l.. 30 8 8 11 24lCa7ukuk lUveJ: Tot.ala 1.54 81 81 231 480
T_ 132 83 24 80 26gR.Iput. 22 1 7 21 10St-. Vlllq. 37 1.5 U 40 101B._J: 3.5 18 10 42 47Fan Yukon 211 84 3.5 13.5 284B1J:ch Creek U aC1J:cl. 22 8 8 24 ,58C1J:cl. Vlc:l.nit,. 2 0Centz.l 4 3 3 7 41..1. 77 38 28 76 1421..1. Vlcinit.,. 10 2 1 1 2R..l. Vlll.S' 20 8 3 11 4Fl'hiDS Dl,tJ::l.ct .5 Tot..l. ,590 242 131 443 899
Ven.ti. .58 18 14 69 73Chalkyit,:ilt 3.5 12 7 28 83Chaad.laJ: R./Bl.ck R. Total. 93 28 21 9.5 1,56
M_l.,- 43 20 10 29 178Minto 74 24 22 74 219Nmana 219 33 21 72 190B.al,. 14 .5 1 1 0Xaati.hna Riv'J: 7 2 0Fishlns Oistrict 8 Totals 3.57 84 .54 176 ,581
Total 2700 1328 1051 4618 4803
38
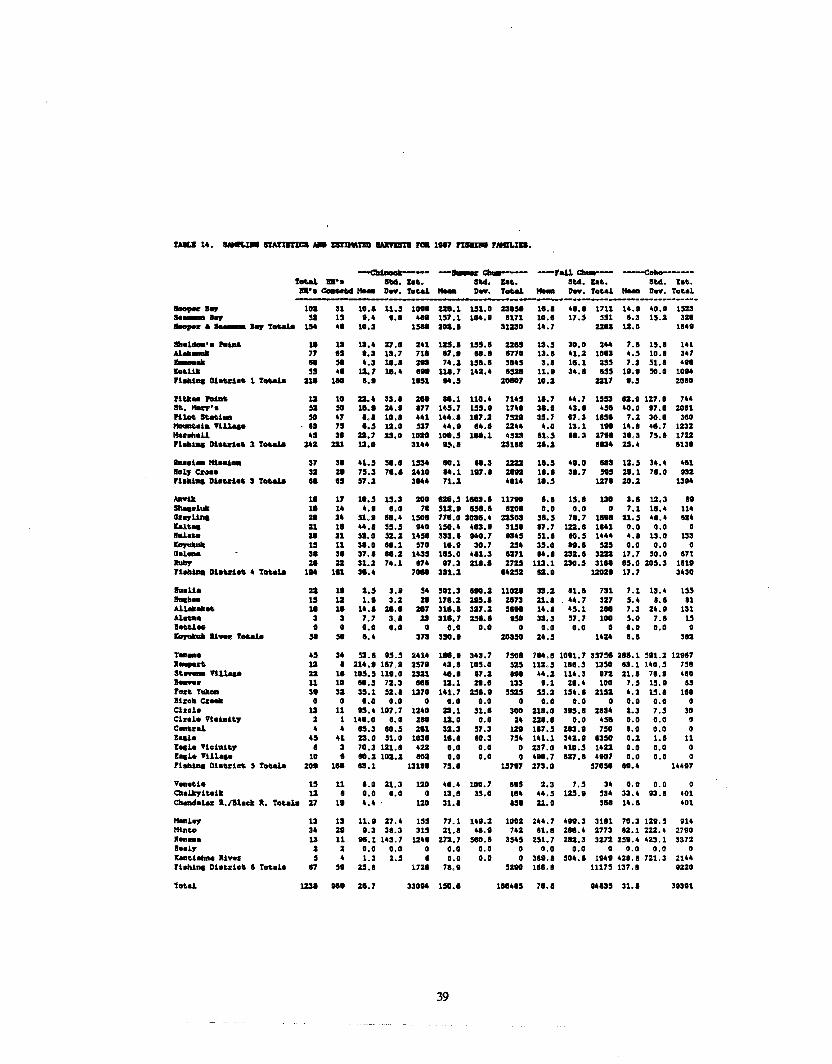
rAILI 1•• lIMlILIM ftAnIUCl ". IftIMltID IWl9IlIU rca 1..7 rMGUII.
--eII1IIoU-- -a-c CIII8 . -r.ua.--- ---eoha_------rot.U. .'. Std. I ... Std. In. Std. Z.&. Std. b&.
.'. CaeWtd_ D.... raUl - D.... roul - D.... raUL - D.... ro&o1------....----------------.---...~.., 1ft 31 10.' 11.S 1... ut.l lS1.0 230.- 1'.' •••• 1711 1•• .0.' lS23SO_I~ 32 l' ••• ••• ••• 157.1 10•• 8171 10•• 17.S 351 '.3 13.2 3ZlI-.... • SO_ .., tot.a1o U- •• 10.3 15.. za.• 31230 i •. 7 Z2U 12.0 11••
_1....•....taa 1. 13 13•• Z7.O ZU 125•• 155.' ut, 13.S sa.o Z•• 7.' 15.' 141Al...77 II' '.3 13.7 71. '7.' .... 1778 13.' .1.2 10113 •• S 10.' 347........ .. SI ••S 10.' za 7••2 151.' so., 3.' 111.1 21' 7.3 31.' •••
Xo&1Ut 55 •• 12.7 111•• lin 11•• 7 ua•• .sae 11.' U •• 85' 1'.' SO.O 10..flul... Dl.ul•• 1 to&ll1o 21. 1. ••• 11S1 ".S :&0e07 10.2 2317 '.S 2011
'ltll.....taa 12 10 23•• 33.' Z•• ".1 110•• 71.' 1'.7 ••• 7 lS53 .a.o 127.' 7••S•• May'. sa SlI 1'.' Z••• .77 1.'.7 155.' 17•• 3'.0 .3.' .SI .0.0 97.' 2011'u'n SU"_ SlI 47 ••• 10.' • 41 u ••• 1'7.2 7'" ".7 17.3 1'" 7.2 30.' 3110_.Vlu.p .3 75 '.S 12.0 3n ...' 11•• 11 23•• ••0 13.1 1" 1•• .0.7 lZ32Hu.h.a ., 3. 23.7 21.0 lOU l00.S 1".1 .'23 81.S ".3 2711 31.3 73.' 1723fluu.. Dl.u1•• 2 to&ll1o 2U 231 13.0 31.. IS.' 23111 U.2 •a. 21•• .13._.1_ Ml..1oa 37 31 U.S SI.' 153. ".1 ".3 2221 1I.S ••• 0 .a 12.3 3••• .811101,. c:zoo. 32 Z. 75.3 7••• 2410 •• 1 1'7.' ZIIft 1'.' 31.7 'IS 2'.1 7'.0 132rlo~ Dl.U1•• 3 to&ll1o II " 57.2 3... 71.2 ••1. 1••S 1271 20.2 13..
_Ut 11 17 10.S 15.3 zoo ".S leos.' 117. ••• 1'.' 130 3.' 12.3 ••a ...lu1l 11 1. ••• '.0 7• SU•• '51.' .200 0.0 0.0 0 7.1 1••• n.112~~ ZI 2. 31.' '1•• lSOI 770.0 2011•• ZZSOS ".S 71.7 1... 21.S •••• .2.lal'" 21 11 •••• 55.S 9.0 lSO•• •03.' 3151 87.7 123.' 1.41 0.0 0.0 a1tUJ.•• D 21 '2.0 '2.2 1.51 333.' 140.7 13.' 31.' II.S 1". ••• 13.0 133
l' 11 31.0 ".1 570 1'.' 30.7 u. 35.0 .... S2S 0.0 0.0 011.1_ 31 31 37.' ".2 1.15 105.0 .11.3 1271 •••• 232.' 3223 17.7 SO.O .71IluIIf U 23 31.2 7•• 1 .7. 17.3 211.' 2721 113.1 ZSo.S 3111. 85.0 205.3 181.fl~ Dl.u1... to&ll1o 1.. 111 31•• 70. 331.2 '.252 12.0 1202. 17.7 3430
....u. 23 11 2.S 3.' ,. SOl.3 ••2 110Zl 33.2 81.' 731 7.1 13•• 155
....b_ l' 12 1.' 3.2 ZI 171.2 US•• Z1173 21.' ••• 7 327 ,.. ••• 51Al1*..... 11 11 1•• D.' D7 311.' 327.2 ,.. 1•• .'.1 211 7.3 2'.' 131Al_. 3 3 7.7 3.' 23 311.7 251.1 'SO 33.3 57.7 100 '.0 7.' lS••&&1_ a a 0.0 0.0 0 0.0 0.0 a 0.0 0.0 0 0.0 0.0 0
11_ to&ll1o 51 so I •• 373 3SO•• Z03SO 2•• S U2. ••• 312
t ••• ., 3. 53.' IS.S 241. 1.... 3.3.7 7S0. 70•• 1011.7 "7" 2".1 511.2 12917IlIIIpU. U • 21•• 1'7.' 2'" 43.' 10'.0 szs 112.S 111.S 13SO 83.1 140.5 151St_ Vlu... 23 1. 10'.S 11'.0 2321 .0.' '7.2 ... •••2 11•. 3 .72 21.' 7'.' '10......2 11 10 ".S 72.3 .11 U.l 2'.' 133 '.1 2••• 100 7.S lS.' 13rOR rull_ 31 32 35.1 '2.' 1370 141.7 U •.• '5Z5 55.2 lS•• 21sa •• 3 1'.' 111.1120" C2_ 0 0 0.0 0.0 a 0.0 0.0 a 0.0 0.0 a 0.0 0.0 aCbo1. 13 11 IS•• 107.7 la.o 23.1 Sl.1 300 21'.0 315.' 213. 2.3 1.S 30Cbo1. na1a1&,. 2 1 140.0 0.0 211 U.O 0.0 2. 23'.0 0.0 .51 0.0 0.0 aC_nl • • 85.3 II.S ztl 32.3 57.3 12• 1.7.S 283.' "0 0.0 0.0 0Z..l. ., 41 23.0 Sl.0 1031 11.' ".3 ".141.1 3U.' I3SO 0.2 1.' 11Z..lo Vlo1nU,. • 3 70.3 121.' .23 0.0 0.0 a 237.0 410.S 1423 0.0 0.0 0Z..l. V111... 10 • ".2102.2 .02 0.0 0.0 0 .110.7 .ar.' .107 0.0 0.0 0rl...l ... Dl.Ula& S rna1a 20. 111 a.l 13111 15.1 157.7 273.0 S70SO .... lU.7
V_tol. lS 11 '.0 21.3 120 •••• 100.7 .., 2.3 7.S 3. 0.0 0.0 0Cba1ltyltaUt 12 I 0.0 0.0 a 13.' 35.0 1•• ••• 3 125.' ". 33 •• 13.' .01CbancI.102 a./Ilaak a. rot.a1o 27 11 .... 120 31.' .SI 21.0 '" 14 •• .01
H.l~ 13 13 11.' 27•• 155 77.1 1...2 1002 2••• 7 .n.3 3111 70.3 12'.' 9UHill. 3. 21 '.3 31.3 31S 21.' •••• Ha 81•• 2.... 2773 '2.1 222•• 2190If_._ 13 11 llI.l 143.7 12.. 213.7 ,.... "" 2S1.7 212.3 3272 2st.. 423. 1 337211.01,. 2 2 0.0 0.0 a 0.0 0.0 a 0.0 0.0 0 0.0 0.0 0laII&lablla Ilvu S • 1.3 2.S • 0.0 0.0 0 3.... SO••• 1'" 421.' 121.3 2144rlahl... DlaUlo& • To&ala 117 51 23.' 1721 71•• '2. 1111.1 11175 137. I ~220
Tot.al WI HI D.7 330.. lSO.1 1.... 71.' ••035 31.' 31391
39
~
' '
_
'
'
~
'
' '
~
' '
'
'
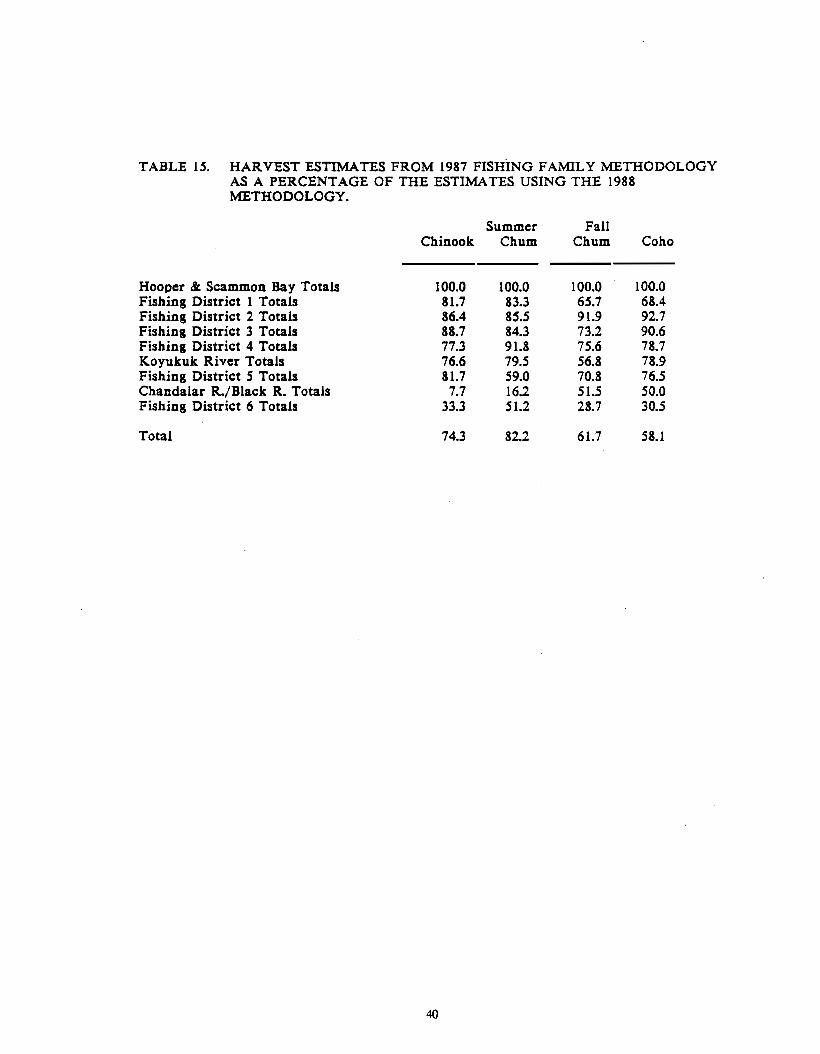
TABLE 15. HARVEST ESTIMATES FROM 1987 FISHING FAMILY METHODOLOGYAS A PERCENTAGE OF THE ESTIMATES USING THE 1988METHODOLOGY.
Summer FallChinook Chum Chum Coho
Hooper '" Scammon Bay Totals 100.0 100.0 100.0 100.0Fishing District 1 Totals 81.7 83.3 65.7 68.4Fishing District 2 Totals 86.4 85.5 91.9 92.7Fishing District 3 Totals 88.7 84.3 73.2 90.6Fishing District 4 Totals 77.3 91.8 75.6 78.7Koyukuk River Totals 76.6 79.5 56.8 78.9Fishing District 5 Totals 81.7 59.0 70.8 76.5Chandalar R./Black R. Totals 7.7 16.2 51.5 50.0Fishing District 6 Totals 33.3 51.2 28.7 30.5
Total 74.3 82.2 61.7 58.1
40
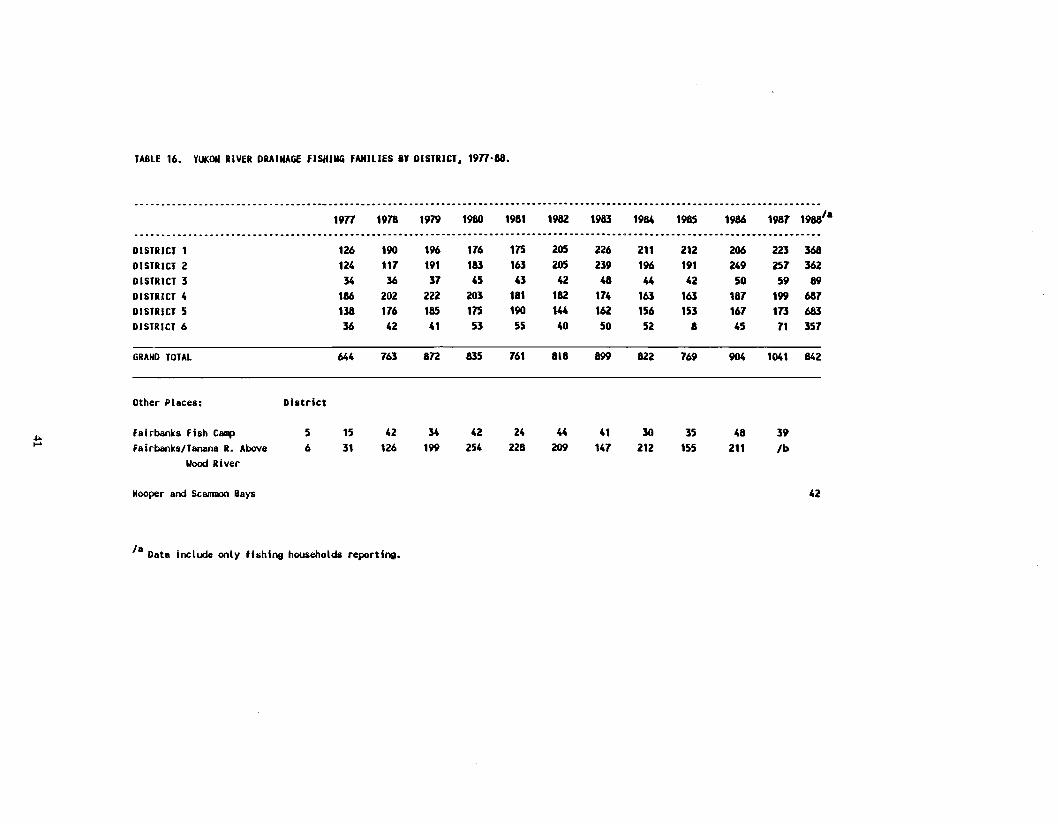
TABLE 16• YUKON RIVER DRAINAGE fiSHING fAMILIES BY DISTRICT, 1971-88.
...... --_ .. _-.----_ ... _---._-_ ....._ .... ----_ ..•••....••.•. __ ...........................•... -_ .................. -...............1977 1978 1979 1980 1981 1982 1983 1984 1985 1986 1987 1988/·
-_ .. _-_ ...... __ ....... ----- ............... __ .... _ ........-.-_ .................. -----_ .................................•..... -- ..DISTRICT 1 126 190 196 176 175 205 226 211 212 206 223 368DISTRICT 2 124 117 191 183 163 205 239 196 191 249 257 362DISTRICT 3 34 36 37 45 43 42 48 44 42 50 59 89DISTRICT 4 186 202 222 203 181 182 174 163 163 187 199 687DISTRICT 5 138 176 185 175 190 144 162 156 153 167 173 683DISTRICT 6 36 42 41 53 55 40 50 52 a 45 71 357
GRAND TOTAL 644 763 8n 835 761 ala a99 822 769 904 1041 842
Other PIeces: District
.j:. feirbanks fish ClImp 5 15 42 34 42 24 44 41 30 35 48 391-4 Feirbanks/Tenane R. AbovlI 6 31 126 199 254 228 209 147 212 155 211 /b
loIood River
Hooper end SClllllllOll Beys 42
/e Dete include only fishing households reportillll.
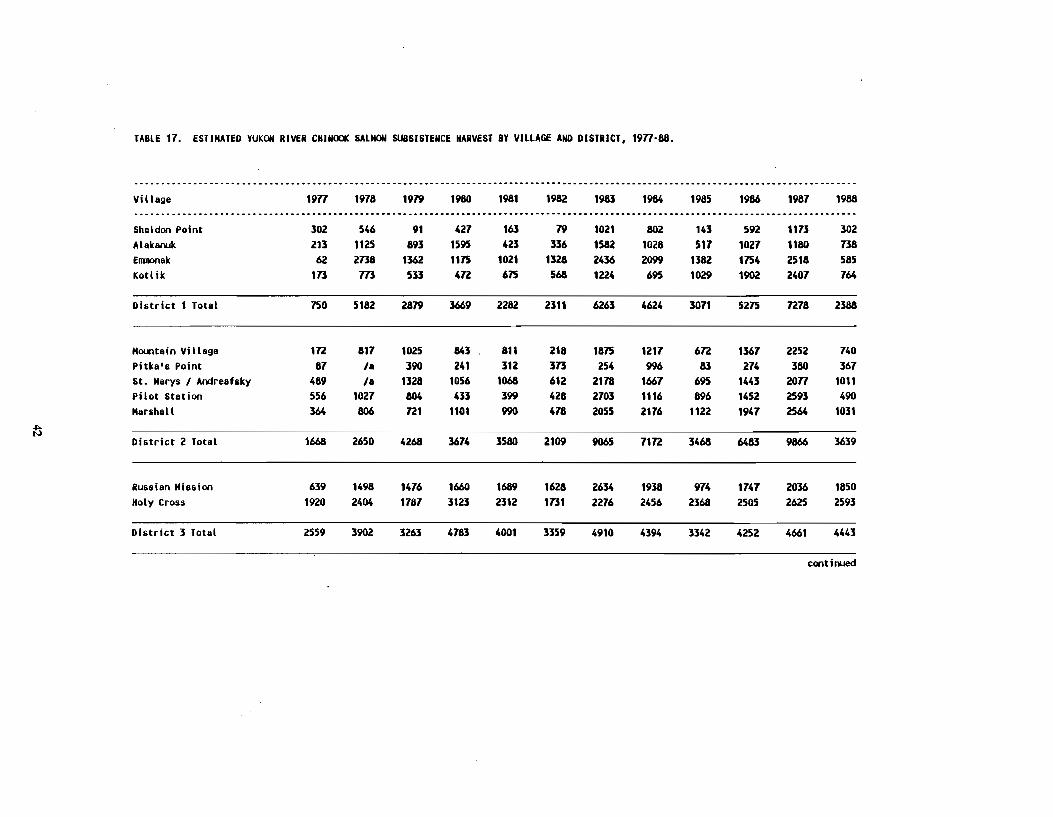
TABLE 17. ESTIMATED YUKON RIVER CHINOOK SALMON SUBSISTENCE HARVEST BY VILLAGE AND DISTRICT, 1971·88.
..... _----- .. ---------_. __ .....•.•.•••••.••......... _-.-----------_ ••........••••. __ ... __ .... __ .. _ ... __ .........•••••• ---_ ...... -------Village 1971 1978 1919 1980 1981 1982 1983 1984 1985 1986 1987 1988._ ... _------------- ... _._ ........... _._._ .... _ .._-_._ .. __ ............................. --- ....................... -_ .. __ .-------_ .. __ ....Sheldon Point 302 546 91 427 163 19 1021 802 143 592 1113 302Alakanuk 213 1125 893 1595 423 336 1582 1028 517 1027 1180 138ElIIIIOllak 62 2738 1362 1115 1021 1328 2436 2099 1382 1154 2518 585Kotlik 113 m 533 4n 615 568 1224 695 1029 1902 2407 164
District 1 Total 150 5182 2819 3669 2282 2311 6263 4624 3071 5215 n18 2388
Mountain Village 1n 817 1025 843 811 218 1815 1211 6n 1361 2252 140Pitka's Point 87 'a 390 241 312 313 254 996 83 274 380 361St. Marys I Andreafsky 489 'a 1328 1056 1068 612 2178 1667 695 1443 2017 1011Pilot Station 556 1027 804 433 399 428 2103 1116 896 1452 2593 490Marshall 364 806 n1 1101 990 478 2055 2176 1122 1947 2564 1031
District 2 Total 1668 2650 4268 3674 3580 2109 9065 71n 3468 6483 9866 3639
Russian Mission 639 1498 1476 1660 1689 1628 2634 1938 974 1147 2036 1850Holy Cross 1920 2404 1187 3123 2312 1131 2276 2456 2368 2505 2625 2593
District 3 Total 2559 3902 3263 4783 4001 3359 4910 4394 3342 4252 4661 4443
continued
~
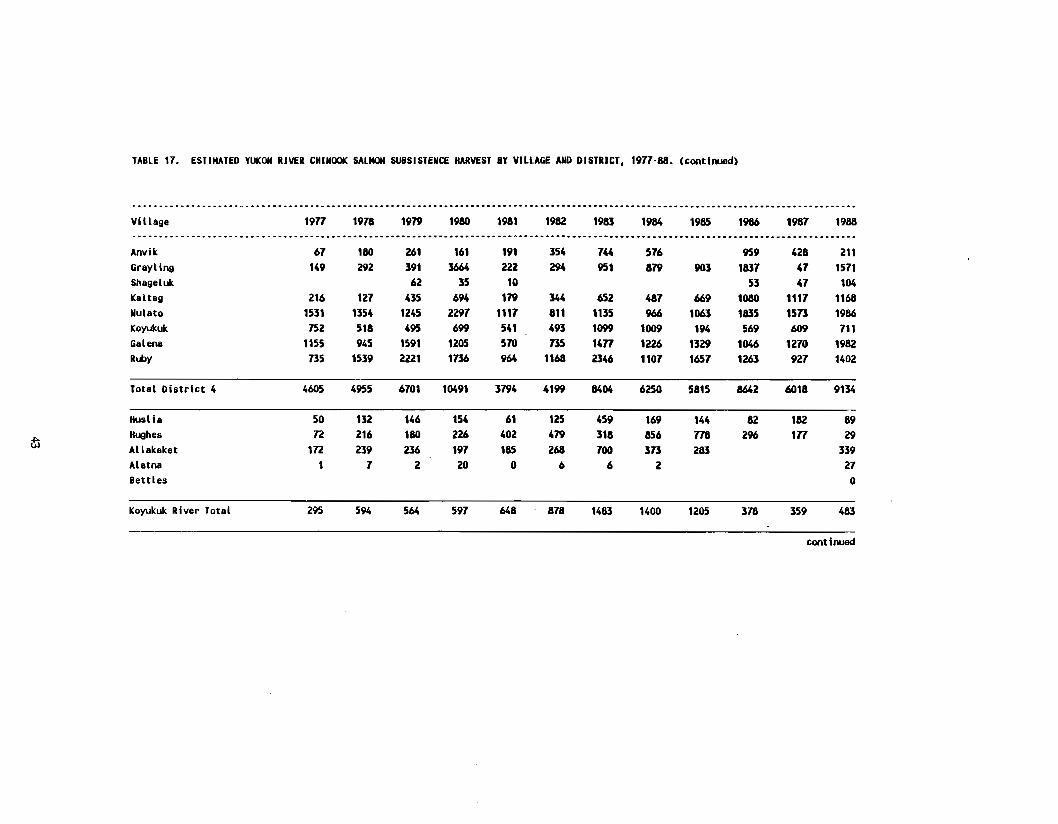
TABLE 17• ESTIMATED YUKON RIVER CHINOOK SALMON SUBSISTENCE HARVEST BY VILLAGE AND DISTRICT, 1977-88. (continued)
............. _-_ ...........•..... -................-............ _ ... -_ .. -_ .................... --.- ....................... __ .. --- .... _ ...Vi llage 1977 1978 1979 1980 1981 1982 1983 1984 1985 1986 1987 1988-_ ...... -_._--_.-.- ...... -_._-_.-_ ........... ---_ ........-......... -_ ....-..........-............... ............... --- .. -_ ... -.-_ .....Anvik 67 180 261 161 191 354 744 576 959 428 211Grayling 149 292 391 3664 222 294 951 879 903 1837 47 1571Shageluk 62 35 10 53 47 104Kaltag 216 127 435 694 179 344 652 487 669 1080 1117 1168Nulato 1531 1354 1245 2297 1117 811 1135 966 1063 1835 1573 1986Koyukuk 752 518 495 699 541 493 1099 1009 194 569 609 711Galena 1155 945 1591 1205 570 735 1477 1226 1329 1046 1270 1982Rlby 735 1539 2221 1736 964 1168 2346 1107 1657 1263 927 1402
Total District 4 4605 4955 6701 10491 3794 4199 8404 6250 5815 8642 6018 9134
Huslia 50 132 146 154 61 125 459 169 144 82 182 89
tiHughes n 216 180 226 402 479 318 856 778 296 177 29Allakaket 1n 239 236 197 185 268 700 373 283 339Alatna 1 7 2 20 0 6 6 2 27Bettles 0
Koyukuk River Total 295 594 564 597 648 878 1483 1400 1205 378 359 483
continued
_
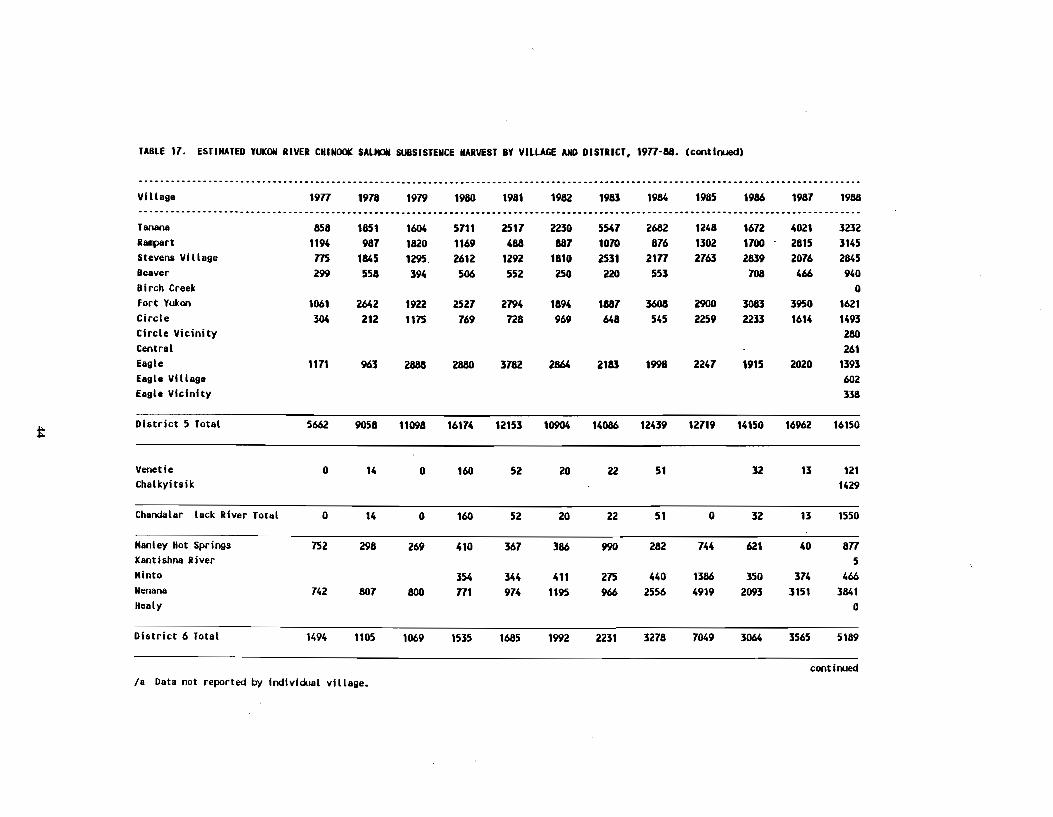
TABLE 17. ESTIMATED YUKON RIVER CHINOOK SALMON SUBSISTENCE HARVEST BY VILLAGE AND DiSTRICT, 1911·88. (continued)
......... --_ .. __ ....... __ ... _- ... _-_ .... _- ..... _- ......••••.••......•......•.••••...••••••.•...... ----_ .. __ ...... -.----_ ....... -.- ... --Village 1911 1978 1979 1980 1981 1982 1983 1984 1985 1986 1981 1988
•••• •• ••• ••••••••••••••••••• •• _e •• •••••••• ••••• ••••••••• •••••• ··········.- •••••••••••••• •••• _-_ ••
Tanana 858 1851 1604 5111 2511 2230 5541 2682 1248 1612 4021 3232R8IIpIlrt 1194 981 1820 1169 488 881 1010 816 1302 1100 2815 3145Stevens Village 115 1845 1295. 2612 1292 1810 2531 2111 2163 2839 2016 2845Beaver 299 558 394 506 552 250 220 553 108 466 940Birch Creek 0Fort Yukon 1061 2M2 1922 2521 2794 1894 1881 3608 Z900 3083 3950 1621Circle 304 212 1115 169 128 969 648 545 2259 2233 1614 1493Circle Vicinity 280Central 261Eagle 1111 963 2888 2880 3182 2864 2183 1998 2241 1915 2020 1393Eagle Village 602Eagle Vicinity 338
tDistrict 5 Total 5662 9058 11098 16114 12153 10904 14086 12439 12119 14150 16962 16150
Venetie 0 14 0 160 52 20 22 51 32 13 121Chalkyitsik 1429
Chandalar lack River Total 0 14 0 160 52 20 22 51 0 32 13 1550
Manley Hot springs 152 298 269 410 367 386 990 282 144 621 40 811Kantishna River 5Minto 354 344 411 215 440 1386 350 314 466Nenana 142 801 800 111 914 1195 966 2556 4919 2093 3151 3841Healy 0
District 6 Total 1494 1105 1069 1535 1685 1992 2231 3218 7049 3064 3565 5189
continued/a Data not reported by individual village.
-- ------------- ________ ____ __ _ __ __ __ -
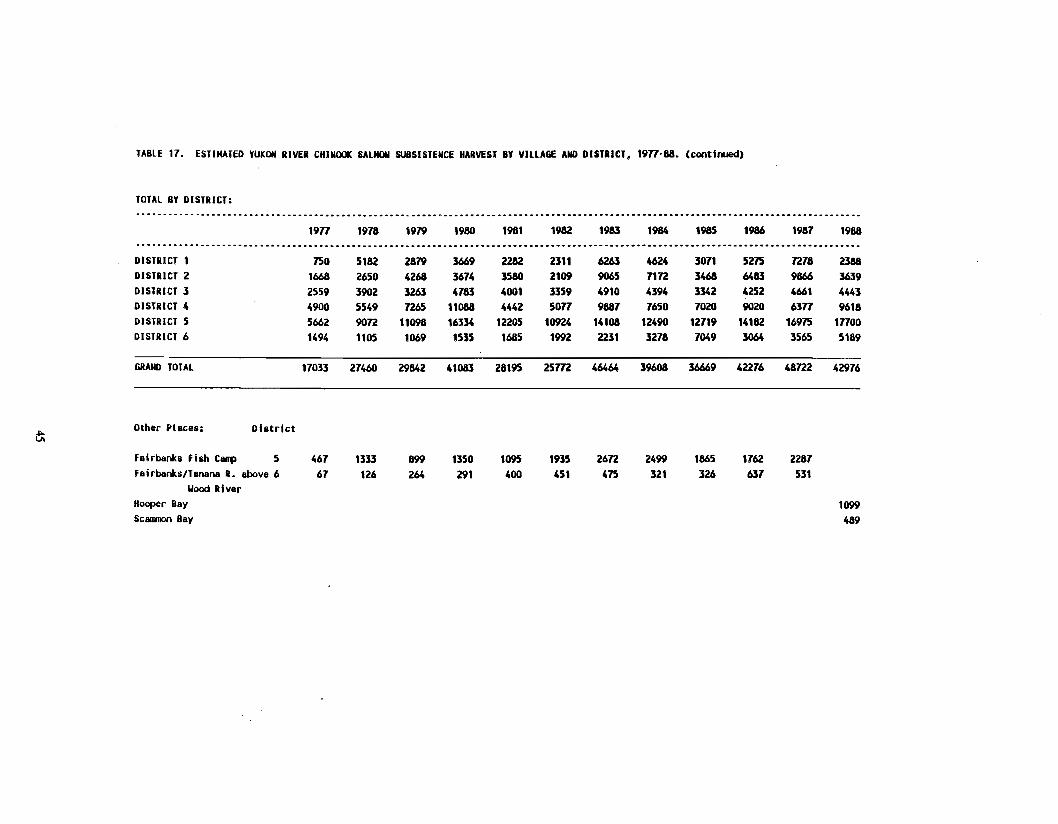
TABLE 17. ESTIMATED YUKON RIVER CHINOOK SALMON SUBSISTENCE HARVEST BY VILLAGE AND DISTRICT, 1977-88. (continued)
TOTAL BY DISTRICT:
1977 1978 1979 1980 1981 1982 1983 1984 1985 1986 1987 1988............................. __ ............................................•................••...............•.......•..••..•..........DISTRICT 1 750 5182 2879 3669 2282 2311 6263 4624 3011 5275 1278 2388DISTRICT 2 1668 2650 4268 3674 3580 2109 9065 71n 3468 6483 9866 3639DISTRICT 3 2559 3902 3263 4783 4001 3359 4910 4394 3342 4252 4661 4443DISTRICT 4 4900 5549 1265 11088 4442 5077 9887 1650 1020 9020 6377 9618DISTRICT 5 5662 9012 11098 16334 12205 10924 14108 12490 12119 14182 16975 17700DISTRICT 6 1494 1105 1069 1535 1685 1992 2231 3218 7049 3064 3565 5189
GRAND TOTAL 17033 21460 29842 41083 28195 25m 46464 39608 36669 42276 48122 42976
Other Places: District
Fairbanks Fish Camp 5Fairbanks/Tanana R. above 6
lload RiverHooper Bay
SCIllllllOl"l Bay
46767
1333126
899264
1350291
1095400
1935451
2612475
2499321
1865326
1762637
2287531
1099489
~
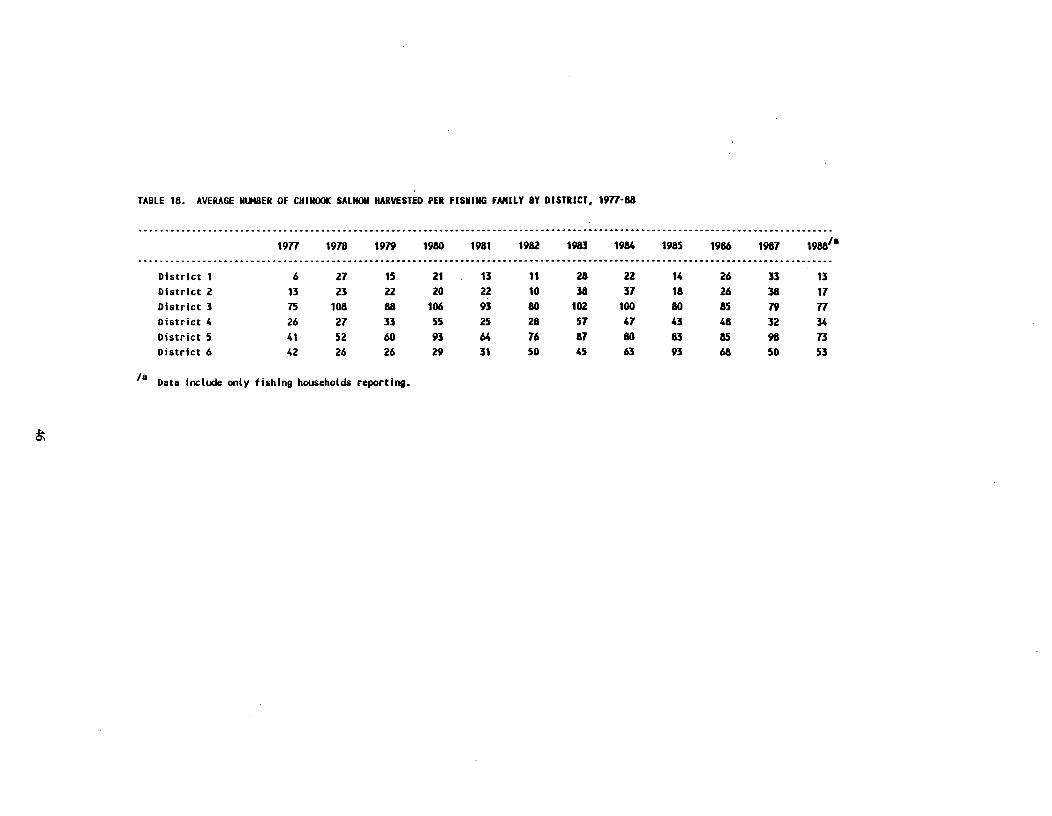
TABLE 18. AVERAGE NUMBER OF CHINOOK SALMON HARVESTED PER FISHING FAMilY BY DISTRICT. 1977-88
1977 1978 1919 1980 1981 1982 1983 1984 1985 1986 1987 1988'0
District 1 6 27 15 21 13 11 28 22 14 26 3J 13District 2 13 21 22 20 22 10 38 37 18 26 38 17District 3 75 108 88 106 93 80 102 100 80 85 19 77District 4 26 27 33 55 25 28 57 47 43 48 32 34
District 5 41 52 60 93 64 76 87 80 83 85 98 73District 6 42 26 26 29 31 50 45 63 93 68 50 53
'A Data include only fishing households reporting.
[;.
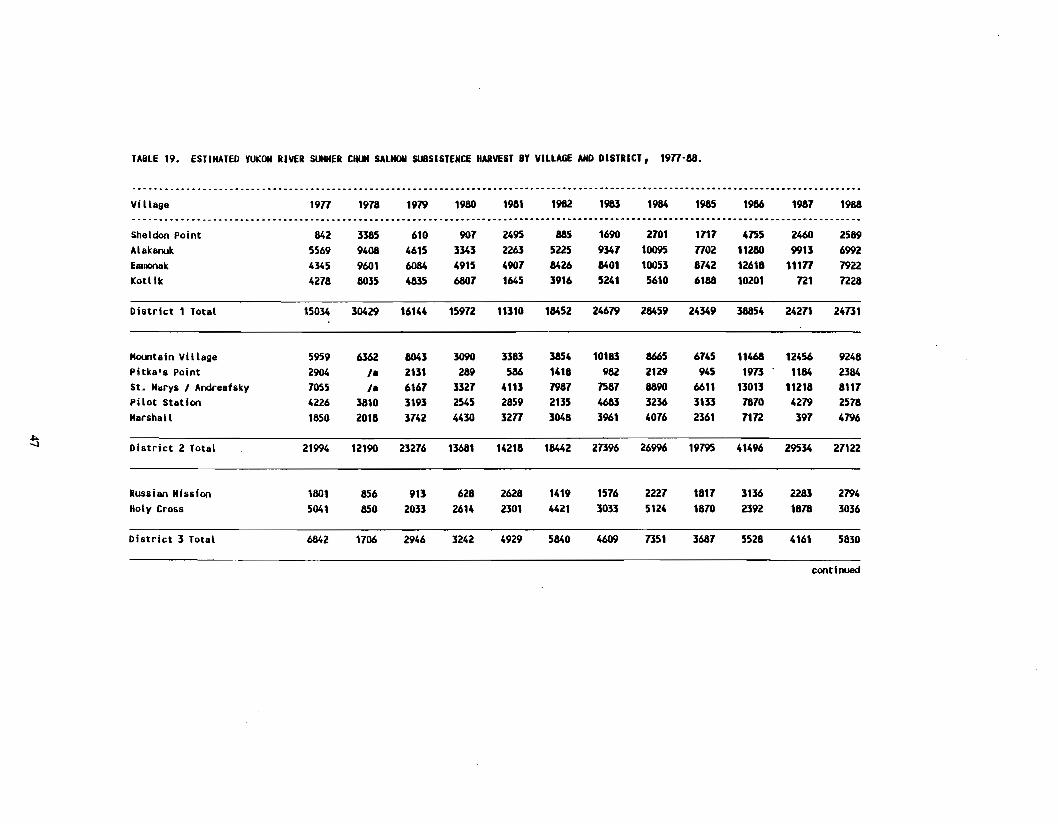
TABLE 19. ESTIMATED YUKON RIVER SUHHER CHUM SALMON SUBSISTENCE HARVEST BY VILLAGE AND DISTRICT, 1971-88.
_._ ••••• __ •••• __ m •••••••••••• ____ •• ___ ••••••• _ •• _ •• _ ••••••••••••••••••••• __ •••••••••••••••••••• _ •••••••••••••••••••••••••••••• ___ •••••
Village 1971 1978 1979 1980 1981 1982 1983 1984 1985 1986 1981 1988...... _---_ ... --.- ......•.•...... -- ... ..................-...................•........................................-......-.. ---_ ....Sheldon Point 842 3385 610 901 2495 885 1690 2101 1111 4155 2460 2589Alakanuk 5569 9408 4615 3343 2263 5225 9341 10095 7102 11280 9913 6992ElIIJlOOllk 4345 9601 6084 4915 4901 8426 8401 10053 8142 12618 11171 7922Kott ik 4218 8035 4835 6801 1645 3916 5241 5610 6188 10201 121 1228
District 1 Total 15034 30429 16144 15912 11310 18452 24679 28459 24349 38854 24211 24131
Mountain Village 5959 6362 8043 3090 3383 3854 10183 8665 6145 11468 12456 9248Pitka's Point 2904 'a 2131 289 586 1418 982 2129 945 1913 1184 2384St. Marys' Andreafsky 7055 'a 6161 3321 4113 7981 1581 8890 6611 13013 11218 8111Pilot Station 4226 3810 3193 2545 2859 2135 468J 3236 3133 1870 4279 2578Marshall 1850 2018 3742 4430 3271 3048 3961 4076 2361 1112 397 4796
District 2 Total 21994 12190 23276 13681 14218 18442 21396 26996 19795 41496 29534 27122
Russian Mission 1801 856 913 628 2628 1419 1576 2227 1811 3136 2283 2794Holy Cross 5041 850 2033 2614 2301 4421 3033 5124 1870 2392 1878 3036
District 3 Total 6842 1106 2946 3242 4929 5840 4609 1351 3687 5528 4161 5830
--continued
~.
_
~
-
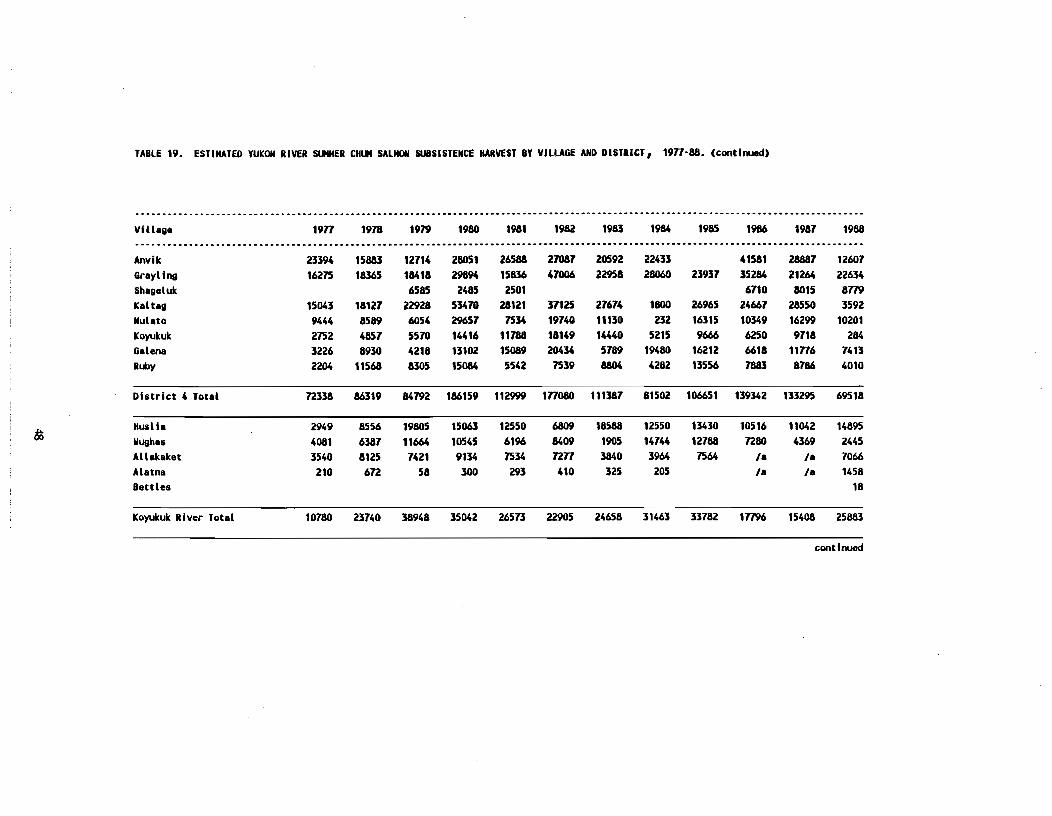
TABLE 19. ESTIMATED YUKON RIVER SUHHfR CHUM SALMON SUBSISTENCE HARVEST BY VILLAGE AND DiSTRICT, 1971-88. (continued)
........ _-. __ ........................................................................... __ •.•••..•..•.... __ ... _- ........................Villase 1971 1918 1979 1980 1981 1982 1983 1984 1985 1986 1981 1988...............................................•..•..................•..•..............••.•.........•.............. _- ...................Anvik 23394 15883 12114 28051 26588 21087 20592 22433 41581 28881 12601Grayl ins 16215 18365 18418 29894 15836 47006 22958 28060 23931 35284 21264 22634Shaseluk 6585 2485 2501 6710 8015 8179Kal tas 15043 18127 22928 53410 28121 37125 21614 1800 26965 24661 28550 3592Nulato 9444 8589 6054 29651 1534 19740 11130 232 16315 10349 16299 10201Koyukuk 2152 4851 5510 14416 11188 18149 14440 5215 9666 6250 9718 284Galena 3226 8930 4218 13102 15089 20434 5189 19480 16212 6618 11716 1413RWy 2204 11568 8305 15084 5542 1539 8804 4282 13556 7883 8186 4010
District 4 Total 12338 86319 84792 186159 112999 171080 111387 81502 106651 139342 133295 69518
&Husl ia 2949 8556 19805 15063 12550 6809 18588 12550 13430 10516 11042 14895Hushes 4081 6381 11664 10545 6196 8409 1905 14144 12188 1280 4369 2445Allakaket 3540 8125 7421 9134 1534 1271 3840 3964 1564 'a 'a 1066Alatna 210 612 58 300 293 410 325 205 ,. ,. 1458Bettles 18
Koyukuk River Total 10180 23740 38948 35042 26573 22905 24658 31463 33182 11796 15408 25883
continued
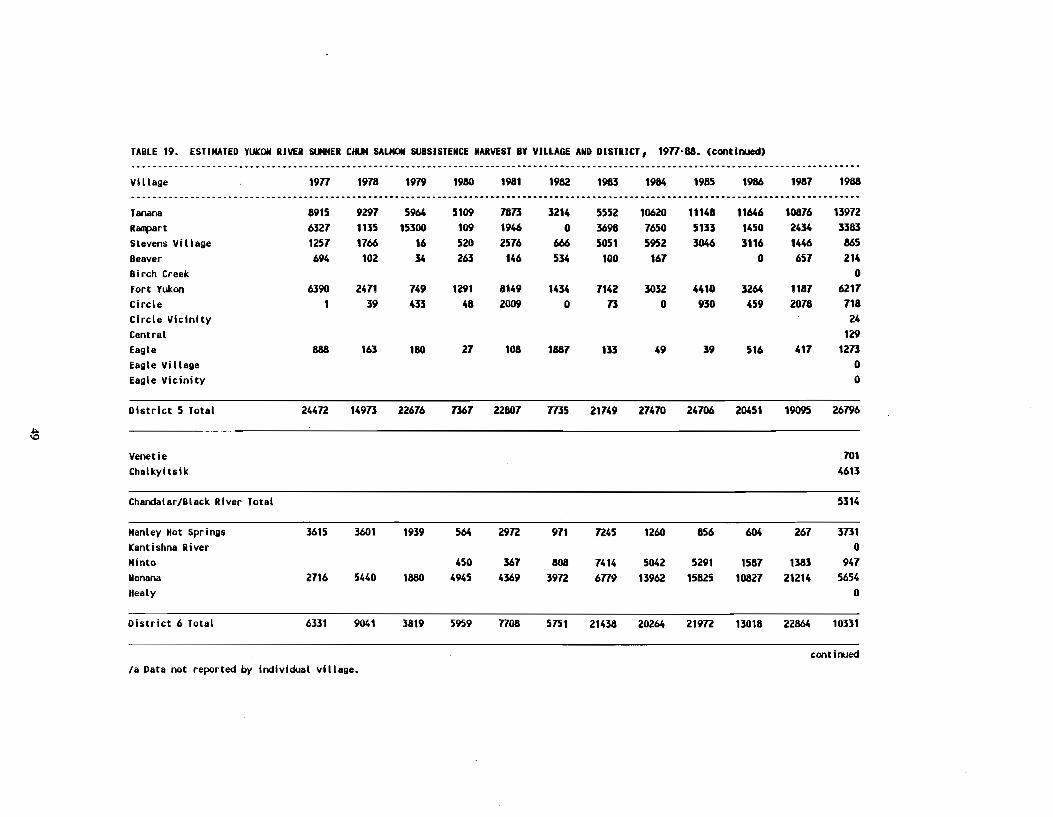
TABLE 19• ESTIMATED YUKON RIVER SUHHER CHUM SALMON SUBSISTENCE HARVEST BY VILLAGE AND DISTRICT, 1971-88. (continued)... ---_.-.-----------_. __ ._--_.--_. __ .......-... _- .. _- .._-_.---_ .. __ ....... -.-_ ... -- ....-....... _--_ .......-...... -.. --------_ ••......• -Village 1971 1978 1979 1980 1981 1982 1983 1984 1985 1986 1987 1988-_ .. __ ... _---------- ..... __ .. -.-------_ ........ ---- ........------_ ........................... --.-_ ............. __ ..... -- ........ _-_ .....Tanana 8915 9297 5964 5109 7873 3214 5552 10620 11148 11646 10876 139nRanpart 6327 1135 15300 109 1946 0 3698 7650 5133 1450 2434 3383Stevens Village 1257 1766 16 520 2576 666 5051 5952 3046 3116 1446 865Beaver 694 102 34 263 146 534 100 161 0 657 214Birch Creek 0fort Yukon 6390 2471 749 1291 8149 1434 1142 3032 4410 3264 1187 6211Circle 1 39 433 48 2009 0 73 0 930 459 2078 118Circle Vicinity 24Central 129Eagle 888 163 180 27 108 1887 133 49 39 516 411 1273Eagle Village 0Eagle Vicinity 0
District 5 Total 244n 14973 22676 7367 22801 ID5 21749 21470 24706 20451 19095 26796
;!Q
Venetie 701Chalkyitsik 4613
Chandalar/Black River Total 5314
Manley Hot Springs 3615 3601 1939 564 29n 971 n45 1260 856 604 267 3731Kanti shna River 0Minto 450 367 808 7414 5042 5291 1587 1383 947Nenana 2716 5440 1880 4945 4369 39n 6179 13962 15825 10827 21214 5654Healy 0
District 6 Total 6331 9041 3819 5959 7108 5751 21438 20264 219n 13018 22864 10331
continuedla Data not reported by individual village.
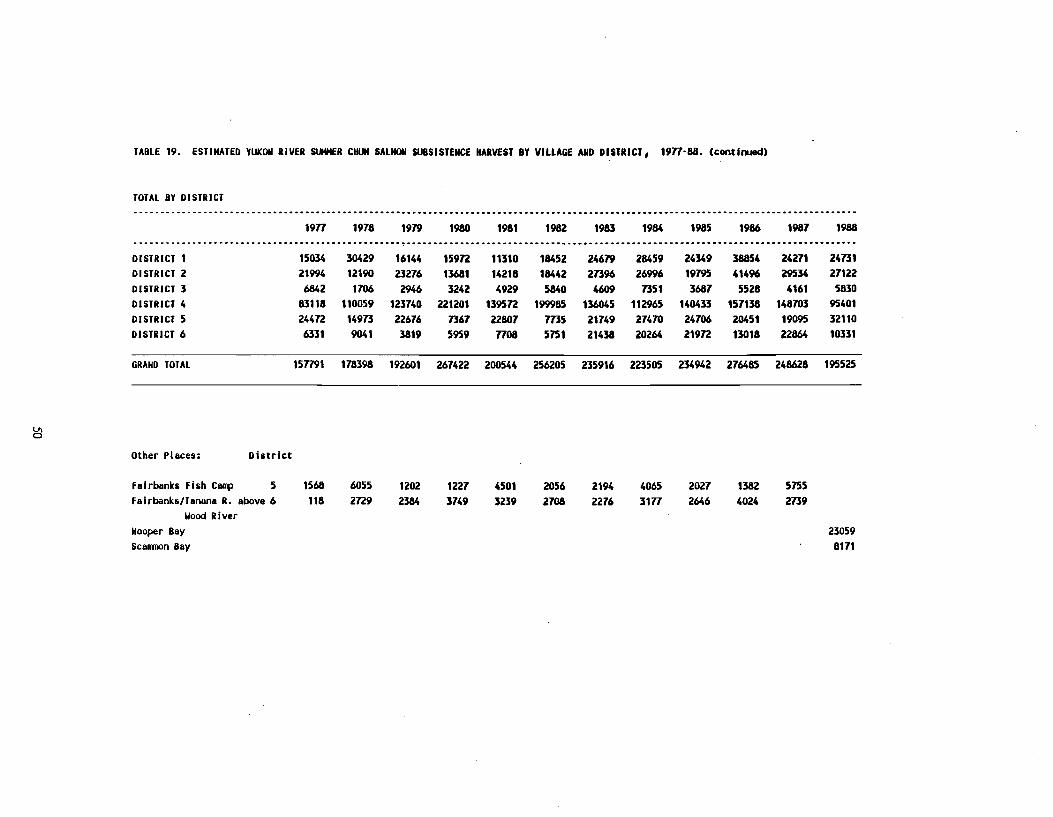
TABLE 19. ESTIMATED YUKOII RIVER StHtER CHlII SALMOM SUBSISTENCE HARVEST BY VILLAGE AND DISTRICT, 1971-88. (continued)
TOTAL BY DISTRICT........... ---_._---_ ............-...........•........................................ -.............. -- ......•.... -_ .....••... -_ .......
1971 1978 1919 1980 1981 1982 1983 1984 1985 1986 1987 1988---_._-----_ ... _-_ ................ _-- ..... _- .... -- .................................••................•........•.....•.......•..........DISTRICT 1 15034 30429 16144 159n 11310 18452 24619 28459 24349 38854 24271 24731DISTRICT 2 21994 12190 23276 13681 14218 18442 27396 26996 19795 41496 29534 27122DISTRICT 3 6842 1706 2946 3242 4929 5840 4609 7351 3687 5528 4161 5830DISTRICT 4 83118 110059 123740 221201 1395n 199985 136045 112965 140433 157138 148703 95401DISTRICT 5 244n 14973 22676 7367 22807 m5 21749 27470 24706 20451 19095 32110DISTRICT 6 6331 9041 3819 5959 7108 5751 21438 20264 219n 13018 22864 10331
GRAND TOTAL 157791 178398 192601 267422 200544 256205 235916 223505 234942 276485 248628 195525
Other Places: District
Fairbanks Fish Camp 5 1568 6055 1202 1227 4501 2056 2194 4065 2027 1382 5755Fairbanks/Tanana R. above 6 118 2m 2384 3749 3239 2708 2276 3171 2646 4024 2739
1l00d RiverHooper Bay 23059Scanmon Bay 8171
~
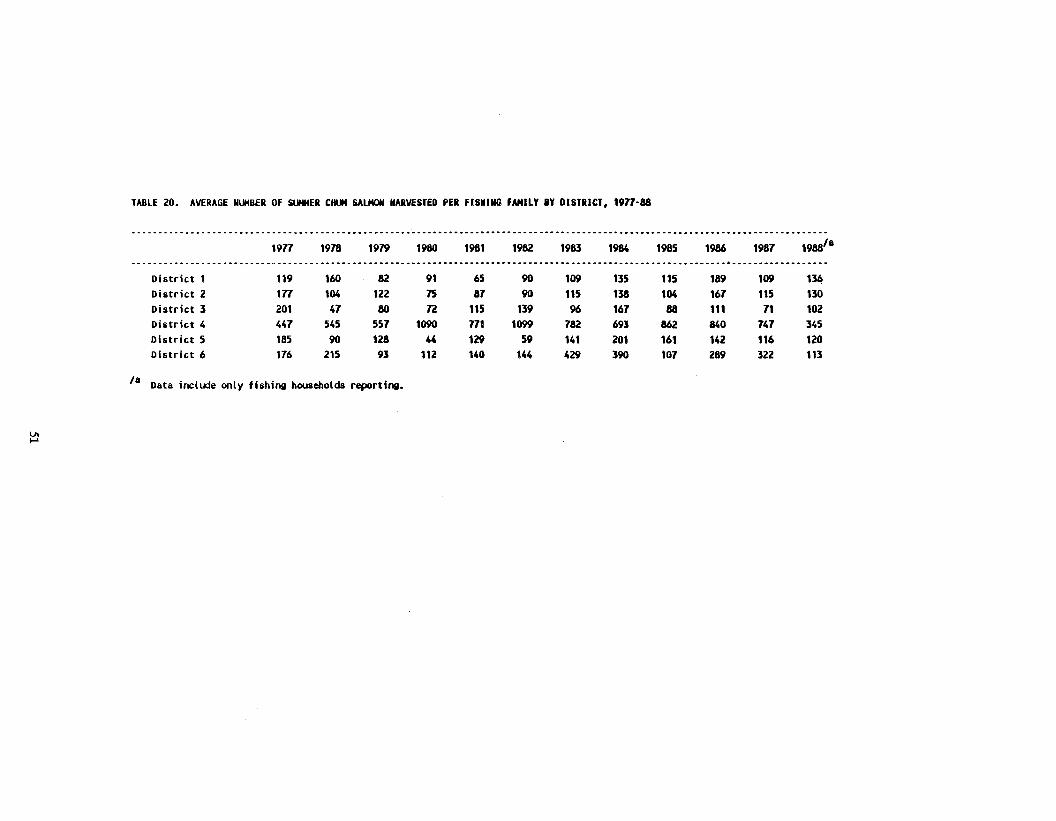
TABLE 20. AVERAGE NUMBER OF SUMMER CHUM SALMON HARVESTED PER FISHING FAMILY 8Y DISTRICT, 1977-88
1977 1978 1979 1980 1981 1982 1983 1984 1985 1986 1987 1988/a
District 1 119 160 82 91 65 90 109 135 115 189 109 134District 2 177 104 122 75 87 90 115 138 104 167 115 130District 3 201 47 80 n 115 139 96 167 88 111 71 102District 4 447 545 557 1090 771 1099 782 693 862 840 747 345District 5 185 90 128 44 129 59 141 201 161 142 116 120District 6 176 215 93 112 140 144 429 390 107 289 322 113
/a Data include only fishing households reporting.
u.....
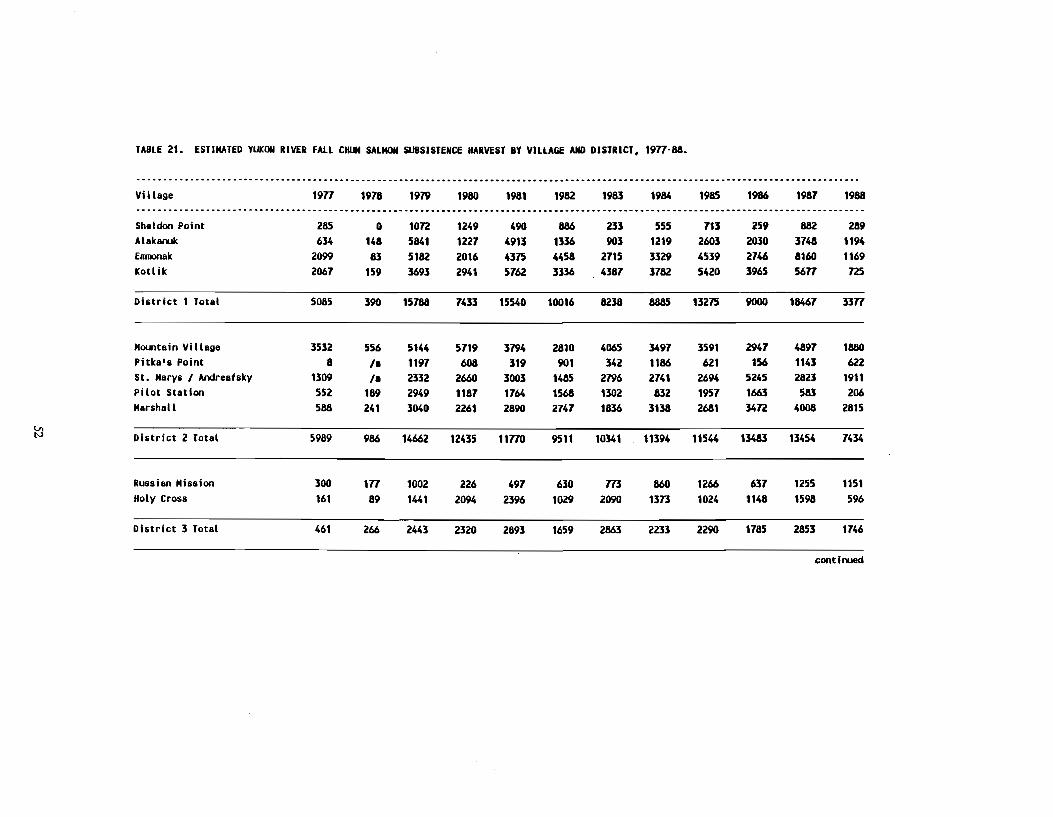
TABLE 21. ESTIMATED YUKON RIVER fALL CHUM SALMON SUBSISTENCE HARVEST BY VILLAGE AND DISTRICT, 1971-88•
...••....•.... _ .....•...........•• _---_._------_ ................................................ _--.- ....... -_ .••.•..•.... _-_. __ ...... -Village 1971 1978 1979 1980 1981 1982 1983 1984 1985 1986 1981 1988----.--._-------.---.---_ ......_-----------_._-- ... _-----_ .._--_._-------_ .... _-_ ...........-..... -------_ .. -_._-_ ...-......_--------_ ..Sheldon Point 285 0 10n 1249 490 886 233 555 113 259 882 289Alakanuk 634 148 5841 1221 4913 1336 903 1219 2603 2030 3148 1194Enmonak 2099 83 5182 2016 4315 4458 2115 3329 4539 2146 8160 1169Kotlik 2061 159 3693 2941 5162 3336 4381 3782 5420 3965 5671 n5
Di&trict 1 Total 5085 390 15788 1433 15540 10016 8238 8885 13215 9000 18461 3371
Mountain Village 3532 556 5144 5119 3794 2810 4065 3491 3591 2941 4891 1880Pitka'a Point 8 ,- 1191 608 319 901 342 1186 621 156 1143 622St. Mary& , Andreaf&ky 1309 ,- 2332 2660 3003 1485 2796 2141 2694 5245 2823 1911Pilot Station 552 189 2949 1181 1164 1568 1302 832 1951 1663 583 206Marshall 588 241 3040 2261 2890 2141 1836 3138 2681 34n 4008 2815
lJlIV Di&trict 2 Total 5989 986 14662 12435 11710 9511 10341 11394 11544 13483 13454 1434
RUSiian Mi&&lon 300 171 1002 226 491 630 m 860 1266 631 1255 1151Holy Cros& 161 89 1441 2094 2396 1029 2090 1373 1024 1148 1598 596
Di&trict 3 Total 461 266 2443 2320 2893 1659 2863 2233 2290 1785 2853 1146
continued
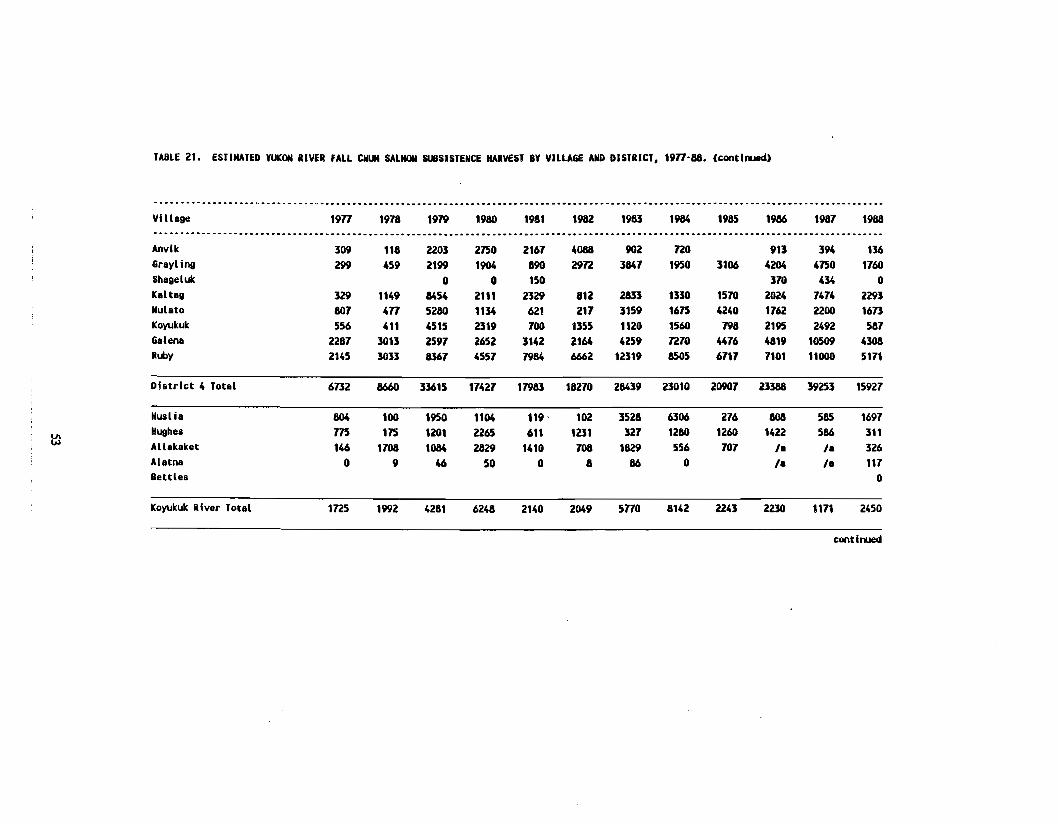
TABLE 21. ESTIMATED YUKON RIVER fALL CIUI SALMON SUBSISTENCE IlARVES' BY VILLAGE AND DISTRICT, 1917-88. (contlooed)
D ••••••• _ •••••••••••••• _ ••••••••••••••••••••••••••••••••••••••••••••••••••••••••••••••••••••••••••••••••••••••• __ •••••• _ ••••••••••••••••
Village 1917 1978 1979 1980 1981 1982 1983 1984 1985 1986 1987 1988....... _- ..... _- ..... __ .................. -_ .......................•...........•....••.......... -_ ................... -_ .... --_ ......... _-
Anvik 309 118 2203 2750 2167 4088 902 no 913 394 136Grayling 299 459 2199 1904 890 29n 3847 1950 3106 4204 4750 1760Shageluk 0 0 150 370 434 0Kaltall 329 1149 8454 2111 2329 812 2833 1330 1570 2024 7474 2293Nulato 807 417 5280 1134 621 217 3159 1675 4240 1762 2200 1673Koyukuk 556 411 4515 2319 700 1355 1120 1560 798 2195 2492 587Galena 2287 3013 2597 2652 3142 2164 4259 n70 4476 4819 10509 4308RLby 2145 3033 8367 4557 7984 6662 12319 8505 6711 7101 11000 5171
--District 4 Total 6732 8660 33615 17427 17983 18270 28439 23010 20907 23388 39253 15927
Huslia 804 100 1950 1104 119 ' 102 3528 6306 276 808 585 1697
l1JHughes 175 175 1201 2265 611 1231 327 1280 1260 1422 586 311Allakaket 146 1708 1084 2829 1410 708 1829 556 707 /. /. 326Alatna 0 9 46 50 0 8 86 0 /. /. 117Bettles 0
Koyukuk River Total ln5 1992 4281 6248 2140 2049 5170 8142 2243 2230 1171 2450
contiooed
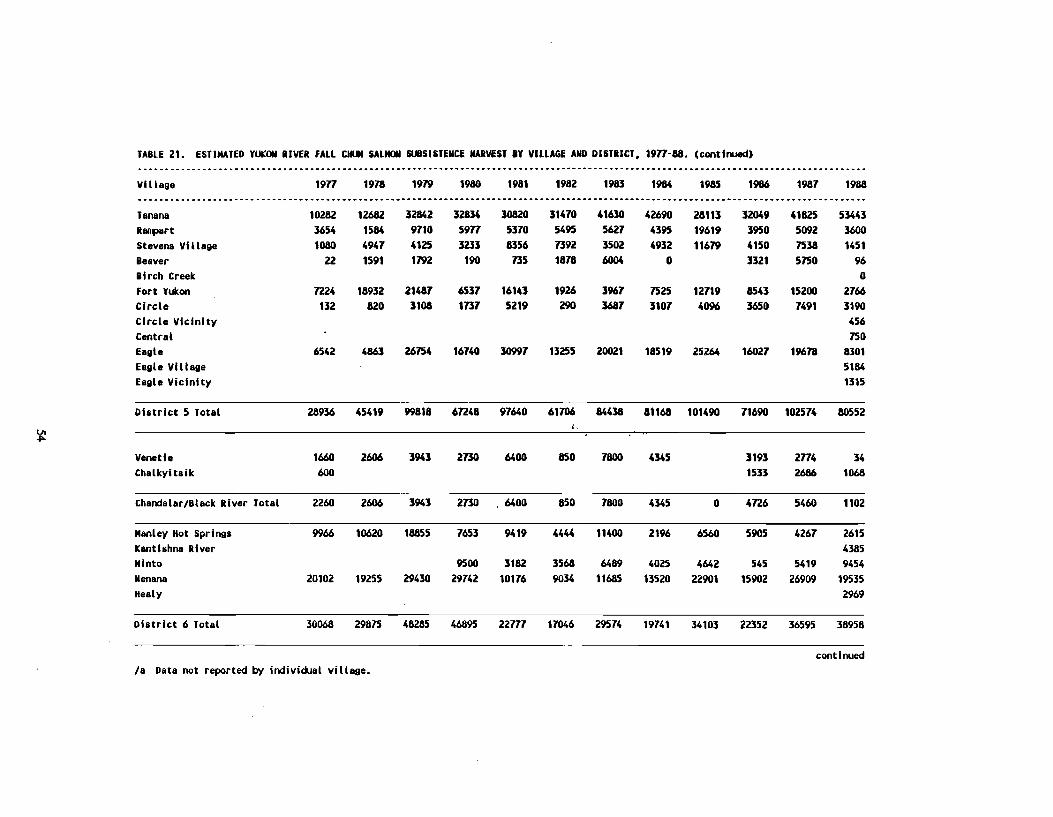
TABLE 21. ESTIMATED YUKON RIVER fALL CIIlJI SAUDI SUBSISTENCE HARVEST IY VillAGE AND DISTRICT. 1911-88. (contiooed)........................................................................................................... -_ ..........................
Village 1911 1978 1979 1980 1981 1982 1983 1984 1985 1986 1987 1988-_ ..............................................•..•.................•........................................... -- .....................Tanana 10282 12682 32842 32834 30820 31470 41630 42690 28113 32049 41825 53443Reopert 3654 1584 9710 5911 5370 5495 5627 4395 19619 3950 5092 3600Stevens Village 1080 4947 4125 3233 8356 7392 3502 4932 11679 4150 7538 1451Beaver 22 1591 1792 190 735 181a 6004 0 3321 5750 96Birch Creek 0fort Yukon 7224 18932 21487 6537 16143 1926 3967 7525 12719 8543 15200 2766Circle 132 820 3108 1737 5219 290 3687 3107 4096 3650 7491 3190Circle Vicinity 456Central 750Eagle 6542 4863 26754 16140 30997 13255 20021 18519 25264 16027 19678 8301Eagle Village 5184Eagle Vicinity 1315
District 5 Total 28936 45419 99818 6n41 97640 61706 84438 11168 101490 71690 102574 80552i-,
Venetie 1660 2606 3943 2730 6400 850 7800 4345 3193 2114 34Chalkyitsik 600 1533 2686 1068
Chandalar/Black River Total 2260 2606 3943 2730 , 6400 150 7800 4345 0 4n6 5460 1102
Manley Hot Springs 9966 10620 18855 7653 9419 4444 11400 2196 6560 5905 4267 2615Kantlshna River 4385Minto 9500 3182 3568 6489 4025 4642 545 5419 9454Nenana 20102 19255 29430 29742 10116 9034 11685 13520 22901 15902 26909 19535Healy 2969
District 6 Total 30068 29875 48285 46895 22m 11046 29514 19141 34103 22352 36595 38958
continued/a Data not reported by individual village.
~
~
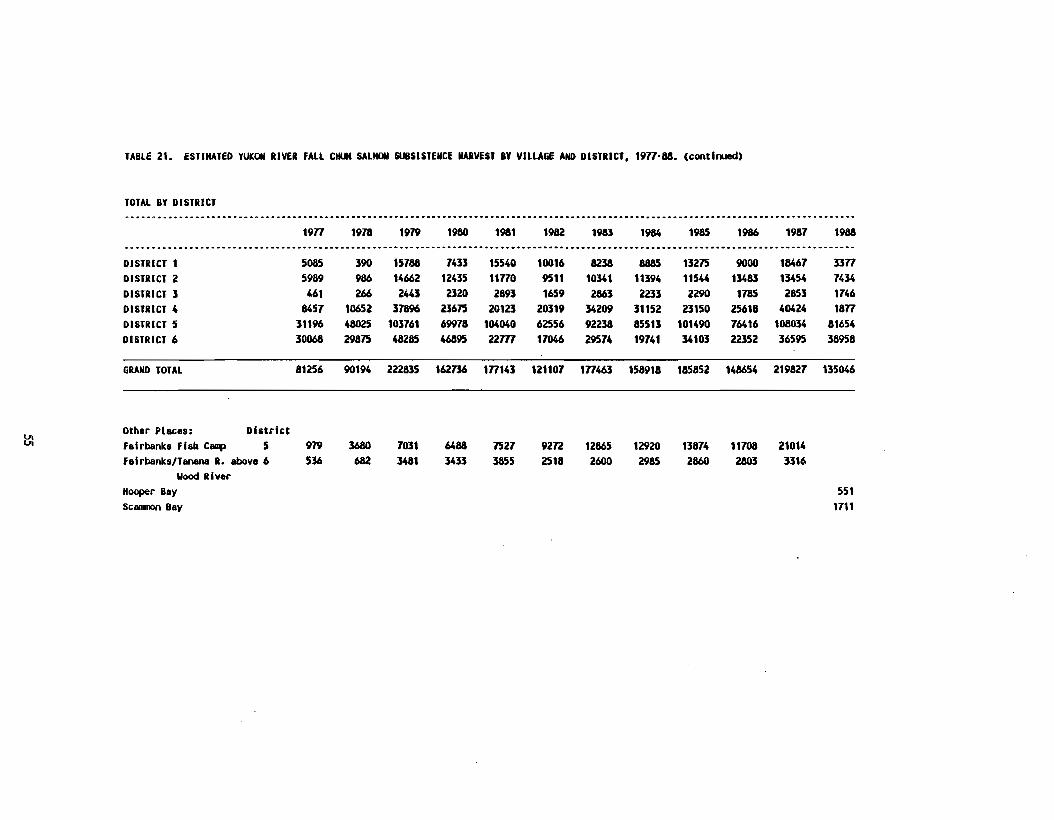
TABLE 21. ESTIMATED YUKON RIVER FALL CHUM SALMON SUBSISTENCE HARVEST BY VILLAGE AND DISTRICT, 1977-88. (continued)
TOTAL BY DISTRICT--.--- .................................. -_ ........•......••.............•....••..• ........................•................ .. ......
1977 1918 1979 1980 1981 1982 1983 1984 1985 1986 1987 1988..•.••.•.. ............................•........•......• -- •.......••..•.••.••....................... .......................... _- ........DISTRICT 1 5085 390 15788 7433 15540 10016 8238 8885 13275 9000 18467 3377DISTRICT 2 5989 986 14662 12435 11770 9511 10341 11394 11544 13483 13454 7434DISTRICT 3 461 266 2443 2320 2893 1659 2863 2233 2290 1785 2853 1746DISTRICT 4 8457 10652 37896 23675 20123 20319 34209 31152 23150 25618 40424 1877DISTRICT 5 31196 48025 103761 69978 104040 62556 92238 85513 101490 76416 108034 81654DISTRICT 6 30068 29875 48285 46895 22m 17046 29574 19741 34103 22352 36595 38958
GRAND TOTAL 81256 90194 222835 162736 177141 121107 177463 158918 185852 148654 219827 135046
e: Other Places: Districtfairbanks Fish clIIIp 5 979Fairbanks/Tanana R. above 6 536
\lood RiverHooper BavScanmon Bav
3680
68270313481
64883433
75273855
92n2518
128652600
129202985
138742860
117082803
210143316
5511711
__ __
_ '
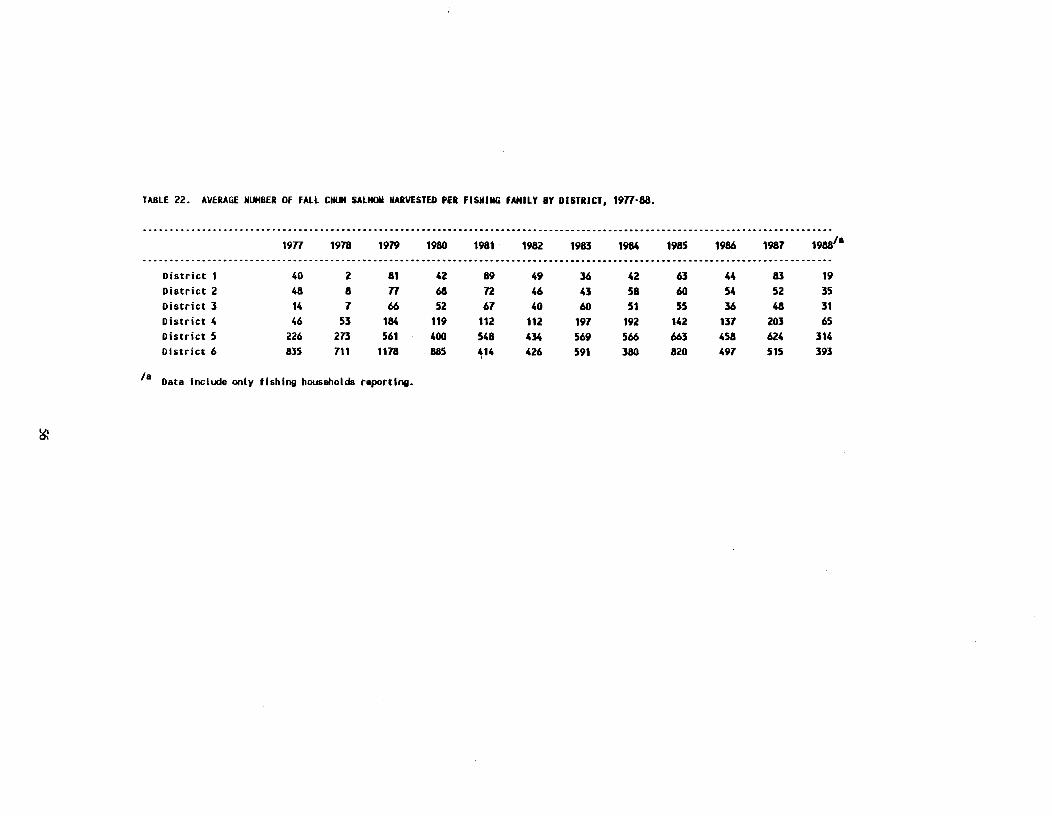
TABLE 22. AVERAGE NUMBER Of fALL CHUM SALMON HARVESTED PER fiSHING fAMILY BY DISTRICT, 1977-88.
1977 1978 1979 1980 1981 1982 1983 1984 1985 1986 1981 1988/a
District 1 40 2 81 42 89 49 36 42 63 44 83 19District 2 48 8 77 68 n 46 43 58 60 54 52 35District 3 14 1 66 52 61 40 60 51 55 36 48 31District 4 46 53 184 119 112 112 191 192 142 131 203 65District 5 226 213 561 400 548 434 569 566 663 458 624 314District 6 835 111 1178 885 414 426 591 380 820 491 515 393
/a Data include only fishing households reportlna.
'
~
I
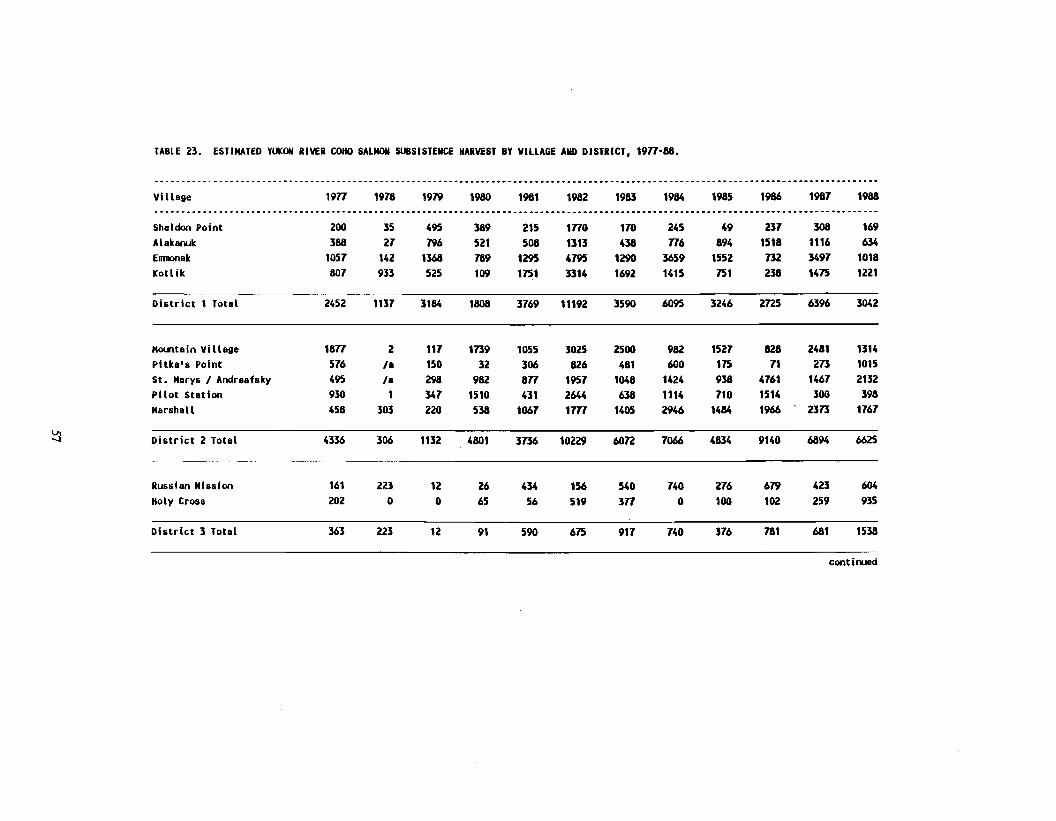
TABLE 23 . ESTIMATED YUKON ilVEi COHO SALMON SUBSISTENCE NAiVEST BY VILLAGE AND DISTiICT. 1977-88.
. -.--------------_ ....... -.. _-- .. ---------_ .. ----.-_ ................... __ ._--.----_ ...-......-.. _-----_ ..... -_ ............... -- ...... --Village 1977 1918 1979 1980 1981 1982 1983 1984 1985 1986 1981 1988-------_ ... ---_ ....-.... _-.-----_ .......... --- ............. -----_ .......----- ...... -_ .....-.... -- ............... -.......... --_ .... -----Sheldon Point 200 35 495 389 215 1770 110 245 49 231 308 169Alakanuk 388 21 796 521 508 1313 438 776 894 1518 1116 634Enmonak 1051 142 1368 189 1295 4195 1290 3659 1552 732 3491 1018Kotlik 801 933 525 109 115.1 3314 1692 1415 151 238 1415 1221
District 1 Total 2452 1131 3184 1808 3169 11192 3590 6095 3246 2n5 6396 3042
Mountain Village 1877 2 111 1739 1055 3025 2500 982 1521 828 2481 1314Pitka's Point 516 ,- 150 32 306 826 481 600 115 71 273 1015St. Marya' Andre_faky 495 ,- 298 982 877 1957 1048 1424 938 4161 1461 2132Pilot Station 930 1 347 1510 431 2644 638 1114 710 1514 300 398Marshall 458 303 220 538 1067 1m 1405 2946 1484 1966 2313 1767
IJI6625'-J District 2 Total 4336 306 1132 4801 3136 10229 60n 7066 4834 9140 6894
iussian Mission 161 223 12 26 434 156 540 740 216 679 423 604Holy Cross 202 0 0 65 56 519 377 0 100 102 259 935
Diatrict 3 Total 363 223 12 91 590 615 917 740 316 781 681 1538
continued
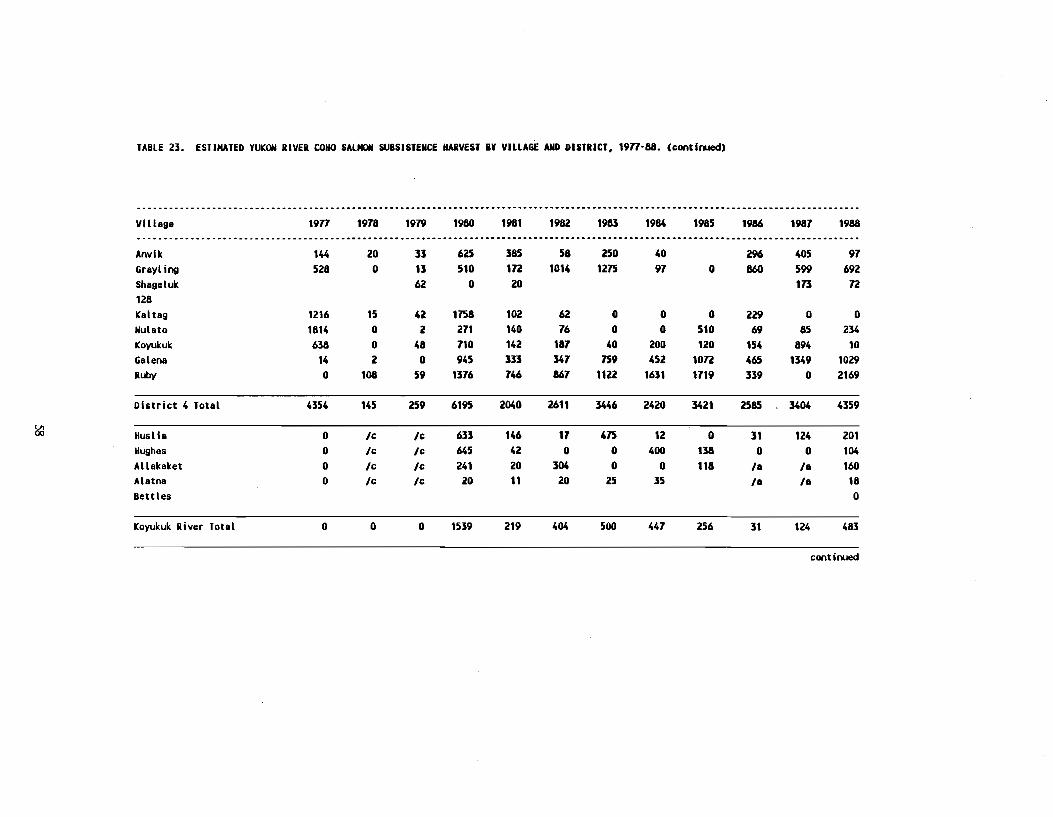
TABLE 23. ESTIMATED YUKON RIVER COHO SALMON SUBSISTENCE HARVEST BY VILLAGE AND DISTRICT, 1977-88. (continued)
--.------------------_ .. _----_ ... _---- ...... --_ .......................-........... ---_ ...... __ .._-.-- ....... _ .. ------_._-----_._-------Village 1977 1978 1919 1980 1981 1982 1983 1984 1985 1986 1987 1988.. -... ----_._-- ... ---.-------.------_ ............. -_ .•......•..................••.. __ ...•.....••.•.................•.......... _ ........Anvik 144 20 35 625 385 58 250 40 296 405 97Grayling 528 0 13 510 172 1014 1275 97 0 860 599 692Shageluk 62 0 20 173 72128Kaltag 1216 15 42 1758 102 62 0 0 0 229 0 0Nulato 1814 0 2 271 140 76 0 0 510 69 85 234Koyukuk 638 0 48 710 142 187 40 200 120 154 894 10Galena 14 2 0 945 335 347 759 452 1072 465 1349 1029RLby 0 108 59 1376 746 867 1122 1631 1719 339 0 2169
District 4 Total 4354 145 259 6195 2040 2611 3446 2420 3421 2585 3404 4359
Huslia 0 Ie Ie 633 146 17 475 12 0 31 124 201Hughes 0 /c /e 645 42 0 0 400 138 0 0 104Allakaket 0 Ie Ie 241 20 304 0 0 118 II II 160Alatna 0 Ie /c 20 11 20 25 35 /1 /1 18Bettles 0
Koyukuk River Total 0 0 0 1539 219 404 500 447 256 31 124 483
eontinued
~
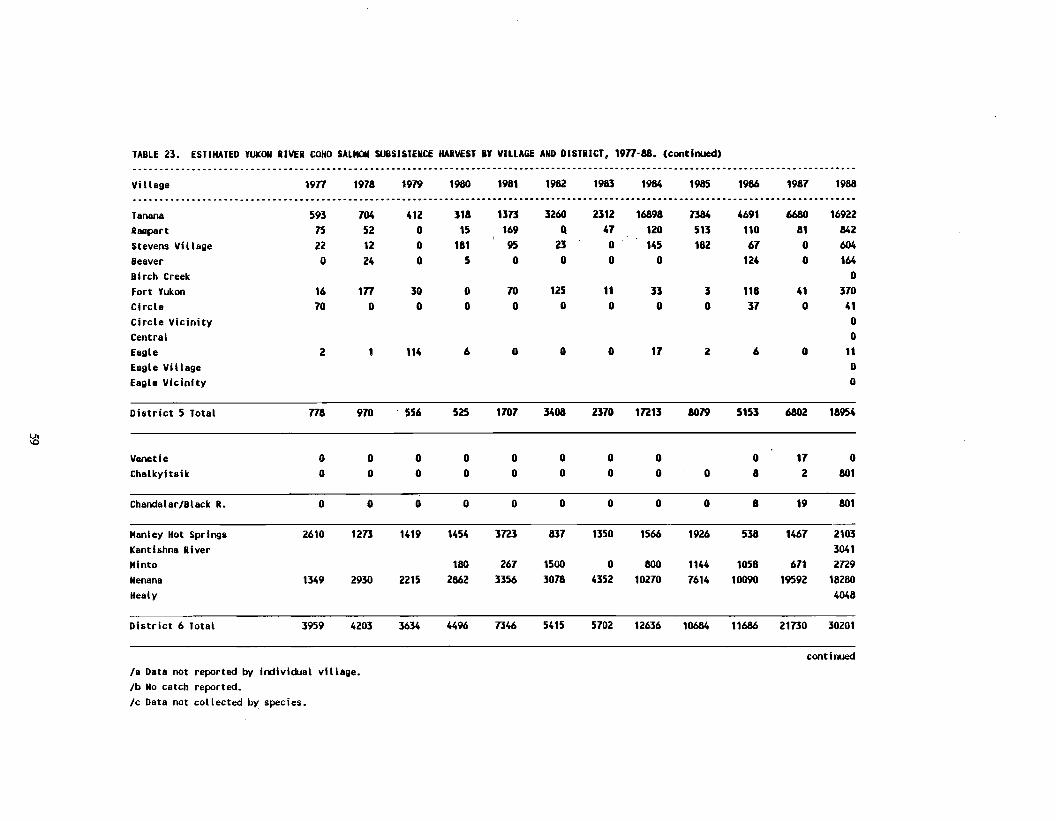
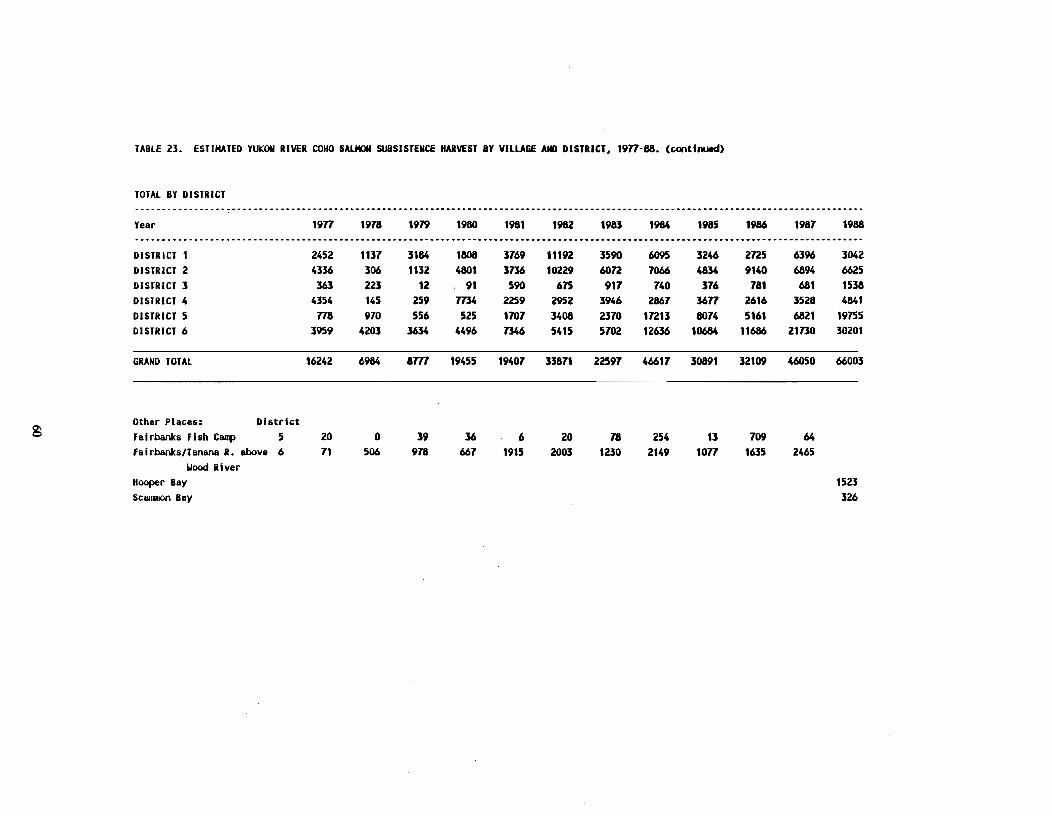
TABLE 23. ESTIMATED YUKON RIVER COHO SALMON SUBSISTENCE HARVEST BY VILLAGE AND DISTRICT, 1977-88. (continued>
TOTAL BY DISTRICT•••••••• ••••••••••••••• ••••••••••••••••• ••••••• _._ ••• •• _. •••••••••••• •• e
Year 1977 1978 1979 1980 1981 1982 1983 1984 1985 1986 1981 1988--------------_ .... _------ ..... _----_ .. __ ..................... -- ........................................ -.... _-_ ..... __ .- ..... _--_ ......DISTRICT 1 2452 1131 3184 1808 3169 11192 3590 6095 3246 2n5 6396 3042DISTRICT 2 4336 306 1132 4801 3136 10229 60n 1066 4834 9140 6894 6625DISTRICT 3 363 223 12 91 590 615 911 140 316 181 681 1538DISTRICT 4 4354 145 259 7734 2259 2952 3946 2861 3677 2616 3528 4841DISTRICT 5 778 910 556 525 1101 3408 2310 1n13 8014 5161 6821 19155DISTRICT 6 3959 4203 3634 4496 1346 5415 5102 12636 1D684 11686 21130 30201
GRAND TOTAL 16242 6984 am 19455 19407 33811 22597 46617 30891 32109 46050 66003
1523326
642465
1091635
131077
2542149
781230
202003
61915
36661
39978
o506
2011
District56
Other Places:fairbanks fish Campfairbanks/Tanana R. above
Wood RiverHooper BayScanmon Bay
g
__________________________ _ __ ____ ___ • __ ___ __ ____________________
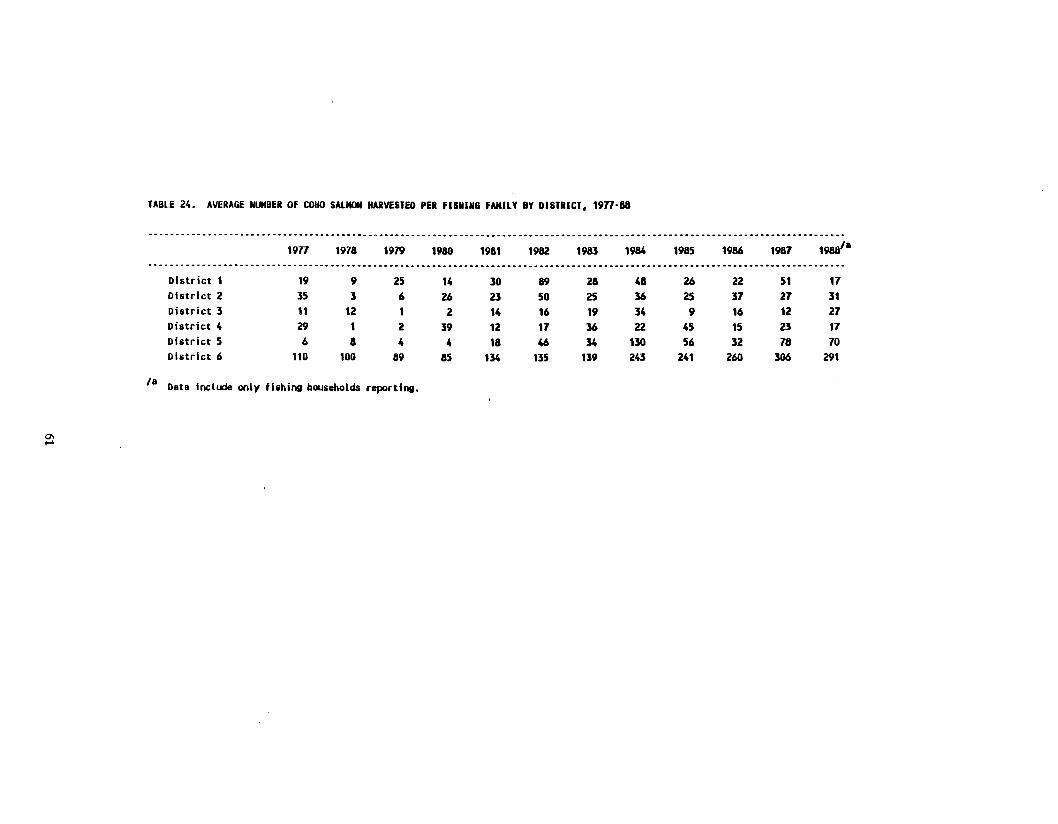
TABLE 24. AVERAGE NUMBER Of COHO SALMON HARVESTED PER fiSHING FAMilY BY DISTRICT, 1917-88
1917 1978 1979 1980 1981 1982 1983 1984 1985 1986 1981 1988'8
District 1 19 9 25 14 30 89 28 48 26 22 51 17District 2 35 3 6 26 23 50 25 36 25 37 21 31District 3 11 12 1 2 14 16 19 34 9 16 12 27District 4 29 1 2 39 12 17 36 22 45 15 23 17District 5 6 8 4 4 18 46 34 130 56 32 78 70District 6 110 100 89 85 134 135 139 243 241 260 306 291
'8 Data include only fishing households reporting.
0\....
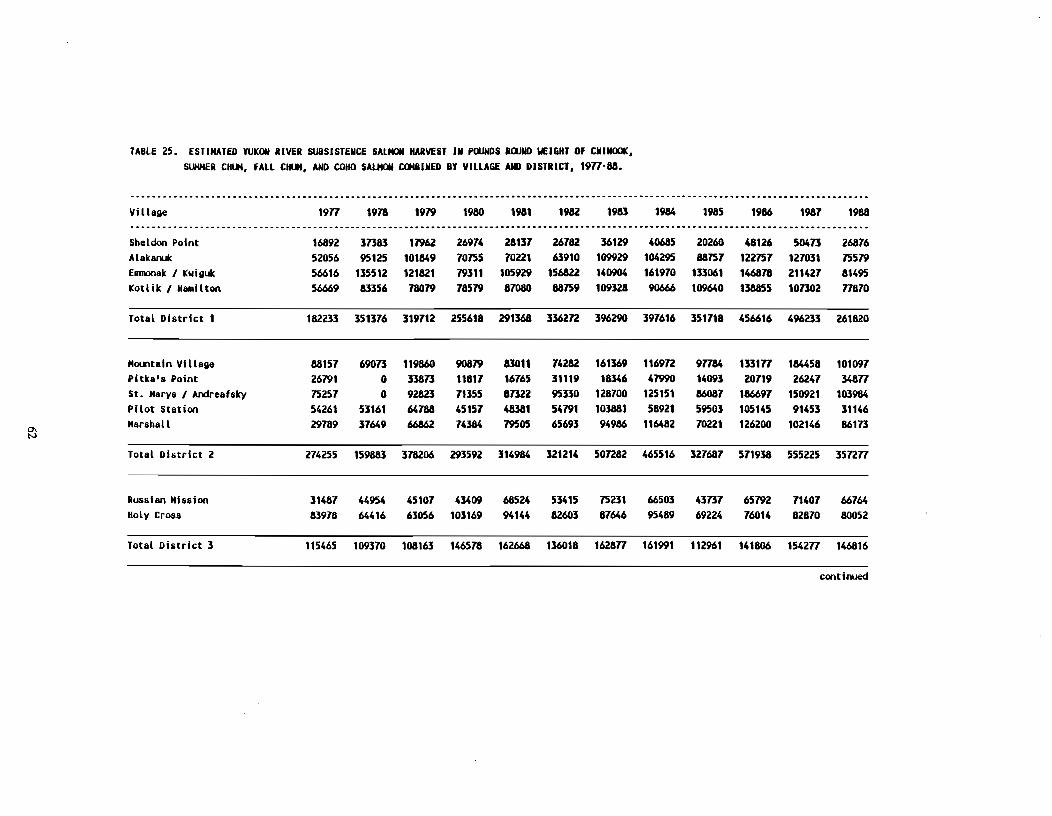
TABLE 25. ESTIMATED YUKON RIVER SUBSISTENCE SALMON HARVEST IN PWNDS ROOND 'lEIGHT Of CHINOOK,SUHHER CHUM, fALL CHUM, AND COHO SALMON COH8INED BY VILLAGE AND DISTRICT, 1971-88•
..... _-_ .. _--- .. -- .. __ ..... ---_ ... _-_ .. -._--_ ....................-..................... ------_ .. _-_ .. __ .__ ..-.............. _---_ ....... _ ..Village 1971 1918 1979 1980 1981 1982 1983 1984 1985 1986 1981 1988.. _-_ .... _- ...... __ .......... _---_._-_ .. _-_ .............. -----_ .......-.... -_._---_ .. -... --------_._----.-.--_ ............................Sheldon Point 16892 31383 11962 26914 28131 26182 36129 40685 20260 48126 50413 26816Alakanuk 52056 95125 101849 70155 70221 63910 109929 104295 88157 122157 127031 15579Enmonak I Kwlgulc 56616 135512 121821 79311 105929 156822 140904 161910 133061 146818 211427 81495Kotlik I Hamilton 56669 83356 18079 78579 87080 88159 109328 90666 109640 138855 101302 71810
Total District 1 182233 351376 319112 255618 291368 3362n 396290 397616 351718 456616 496233 261820
Mountain Village 88157 69013 119860 90879 83011 14282 161369 1169n 97184 133171 184458 101091Pitka's Point 26791 0 33813 11817 16165 31119 18346 47990 14093 20119 26247 34871St. Marys I Andreafsky 15251 0 92823 71355 81322 95330 128700 125151 86087 186697 150921 103984Pilot Station 54261 53161 64188 45157 48381 54791 103881 58921 59503 105145 91453 31146
0-Marshall 29189 31649 66862 14384 79505 65693 94986 116482 70221 126200 102146 86113
N
Total District 2 214255 159883 318206 293592 314984 321214 50n82 465516 321681 511938 555225 35n71
Russian Mission 31481 44954 45107 43409 68524 53415 15231 66503 43131 65792 71401 66164Holy Cross 83978 64416 63056 103169 94144 82603 81646 95489 69224 16014 82870 80052
Total District 3 115465 109310 108163 146518 162668 136018 162871 161991 112961 141806 154271 146816
continued
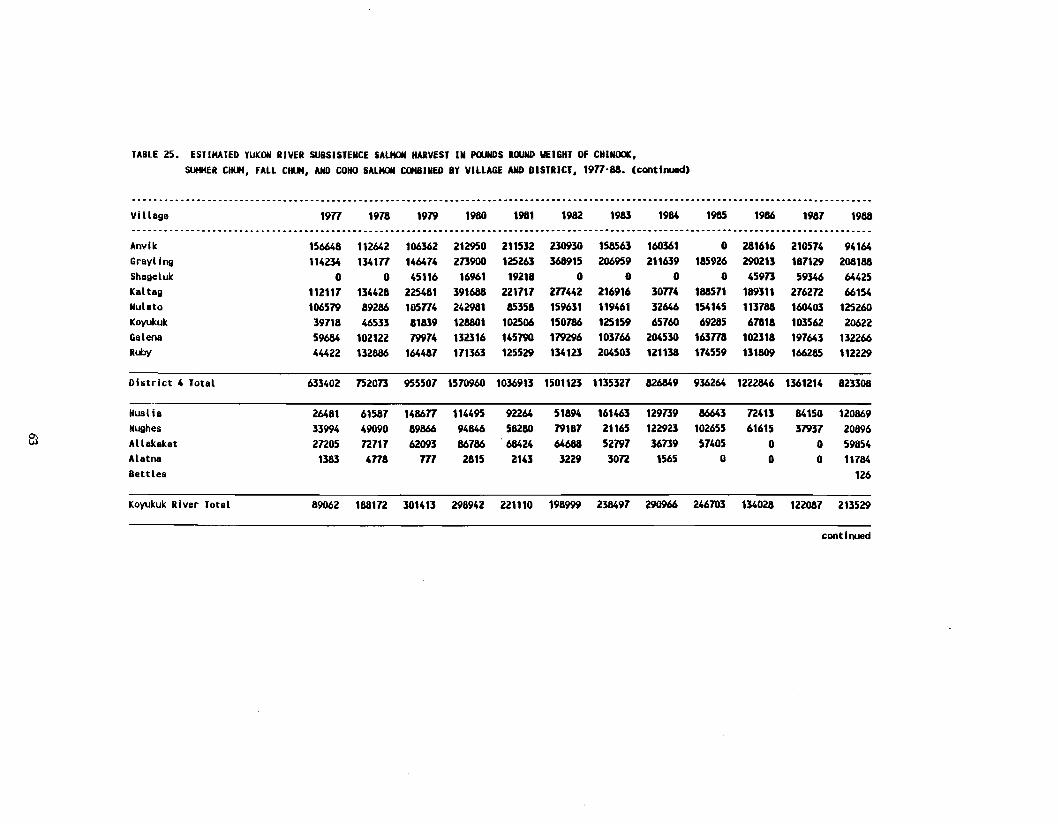
TABLE 25. ESTIMATED YUKON RIVER SUBSISTENCE SALMON HARVEST IN POUNDS ROUND WEIGHT Of CHINOOK,SUHHER CHUM, fALL CHUM, AND COHO SALMON COMBINED BY VILLAGE AND DISTRICT, 1977-88. (continued)
.... _---_ ... _-----._---------_ .. -----_ ...... --_ .. ---_ ......... -.......•.......•................................................... _-.- .. --Village 1917 1978 1979 1980 1981 1982 1983 1984 1985 1986 1987 1988.-----.-------------------_ .. __ . __ .•••.•... _--_ .............. _---- ..................-..................... -- ....................... _-- .. _-
Anvik 156648 112642 106362 212950 211532 230930 158563 160361 0 281616 210574 94164Grayl iog 114234 134117 146474 273900 125263 368915 206959 211639 185926 290213 187129 208188Shageluk 0 0 45116 16961 19218 0 0 0 0 45973 59346 64425KaltaQ 112117 134428 225481 391688 221717 217442 216916 30174 188571 189311 2762n 66154Nulato 106579 89286 105174 242981 85358 159631 119461 32646 154145 113788 160403 125260Koyukuk 39718 46533 81839 128801 102506 150786 125159 65760 69285 67818 103562 20622Galena 59684 102122 79974 132316 145790 179296 103766 204530 163778 102318 197643 132266Ruby 44422 132886 164487 171363 125529 134123 204503 121138 174559 131809 166285 112229
Dilitrict 4 Total 633402 752073 955507 1570960 1036913 1501123 1135327 826849 936264 1222846 1361214 823308
Huslia 26481 61587 148617 114495 92264 51894 161463 129739 86643 n413 84150 120869Hughes 33994 49090 89866 94846 58280 79187 21165 122923 102655 61615 37937 20896Allakaket 2n05 n717 62093 86786 ·68424 64688 52797 36739 57405 0 0 59854Alatna 1383 4178 m 2815 2143 3229 30n 1565 0 0 0 11784Bettles 126
Koyukuk River Total 89062 1881n 301413 298942 221110 198999 238497 290966 246703 134028 122087 213529
continued
~
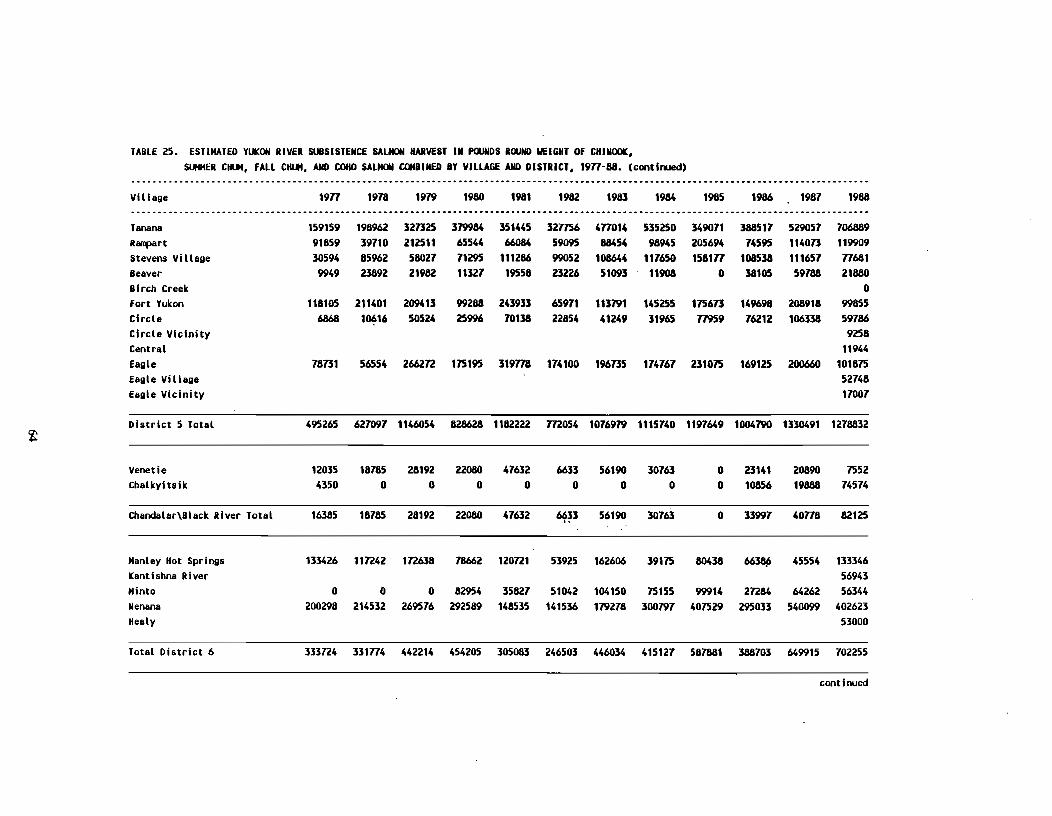
TABLE 25. ESTIMATED YUKON RIVER SUBSISTENCE SALMON HARVEST IN PWNOS RWNO WEIGHT Of CHINOOK,SUHHER CHUH, FALL CHUM, AND COHO SALMON COMBINED 8Y VILLAGE AND DISTRICT, 1977-88. (continued)
---------------.---.-------.-------.-----_._.---.-.----_ ............... _----- ....._------.-_ .. ---- .......... -- ............... --.--_. __ ....Village 1917 1918 1979 1980 1981 1982 1983 1984 1985 1986 1987 1988._------------_._--_ .. _-_._---_ ..•.••..• __ .... _ ..............••.....•.......... _-_._-_ .......... _----- .... _- .... _--- .. _._._ ...._----------Tanana 159159 198962 327325 379984 351445 321756 477014 535250 349071 388511 529057 706889Ranpart 91859 39710 212511 65544 66084 59095 88454 98945 205694 14595 114073 119909Stevens Village 30594 85962 58021 71295 111286 99052 108644 117650 158177 108538 111651 77681Beaver 9949 23892 21982 11321 19558 23226 51093 11908 0 38105 59788 21880Birch Creek 0Fort Yukon 118105 211401 209413 99288 243933 65971 113791 145255 115613 149698 208918 99855Circle 6868 UI~16 50524 25996 70138 22854 41249 31965 17959 16212 106338 59786Circle Vicinity 9258Central 11944Eagle 18731 56554 266272 115195 319118 114100 196135 114161 231015 169125 200660 101815Eagle Villagll 52748Eagle Vicinity 17007
District 5 Total 495265 627097 1146054 828628 1182222 m054 1016979 1115140 1197649 1004790 1330491 1278832
Venetie 12035 18185 28192 22080 47632 6633 56190 30163 0 23141 20890 1552Chalkyitsik 4350 0 0 0 0 0 0 0 0 10856 19888 14514
Chandalar\Black River Total 16385 18785 28192 22080 41632 6633 56190 30763 0 33997 40778 82125"
Manley Hot Springs 133426 117242 172638 78662 120721 53925 162606 39115 80438 6638{l 45554 133346Kantishna River 56943Minto 0 0 0 82954 35827 51042 104150 15155 99914 27284 64262 56344Nenana 200298 214532 269576 292589 148535 141536 179218 300791 401529 295033 540099 402623Healy 53000
Total District 6 333724 331774 442214 454205 305083 246503 446034 415121 587881 388703 649915 702255
continued
~
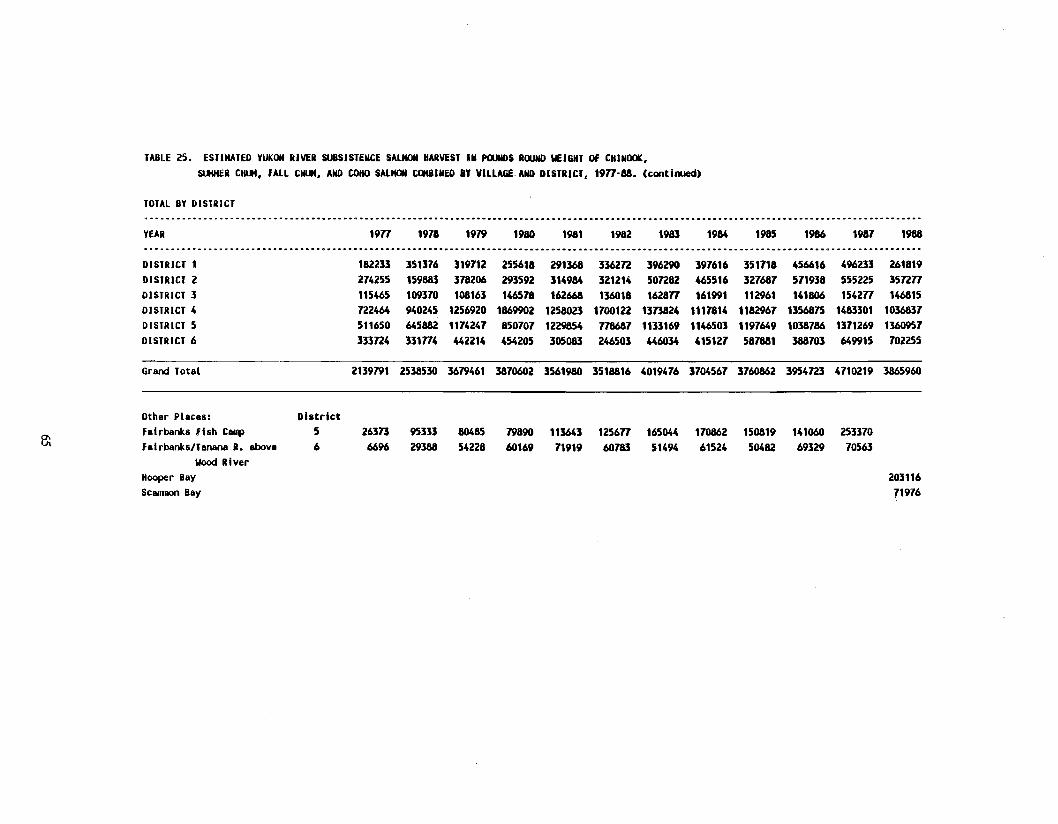
TABLE 25. ESTIMATED YUKOH RIVER SUBSISTENCE SAUIOH HARVEST III POJNDS ROOND WEIGHT OF CHINOOIC,SUHKER CIIlJt, FALL CIIlJt, AND COHO SALMOH COI8II1ED 8Y VILLAGE AMD DISTRICT, 1971-88. (continued)
TOTAL BY DISTRICT•........••......•...•..•.. __ .......................................•............... -_ ...... _- ...................................................YEAR 1971 1918 1979 1980 1981 1982 1983 1984 1985 1986 1981 1988........•.... -_ ..........•.••••• -••..............................................•..... __ .......................... -- ..............-.............DISTRICT 1 182233 351316 319112 255618 291368 336Zn 396290 391616 351118 456616 496233 261819DISTRICT 2 214255 159883 318206 293592 314984 321214 50n82 465516 321681 511938 555225 35n71DISTRICT 3 115465 109310 108163 146518 162668 136018 162871 161991 112961 141806 154271 146815DISTRICT 4 n2464 940245 1256920 1869902 1258023 1100122 1313824 1111814 1182961 1356815 1483301 1036831DISTRICT 5 511650 645882 1114241 850101 1229854 718681 1133169 1146503 1191649 1038186 1311269 1360951OISTRICT 6 333n4 331714 442214 454205 305083 246503 446034 415121 581881 388103 649915 702255
Grand Total 2139791 2538530 3679461 3810602 3561980 3518816 4019476 3104567 3160862 3954723 4710219 3865960
Other Places: DistrictFairbanks fish Camp 5 26313 95333 80485 79890 113643 125671 165044 170862 150819 141060 253370FairbankslTanana R. above 6 6696 29388 54228 60169 11919 60783 51494 61524 50482 69329 70563
"ood RiverHooper Bay 203116Scanmon Bay 71916
~
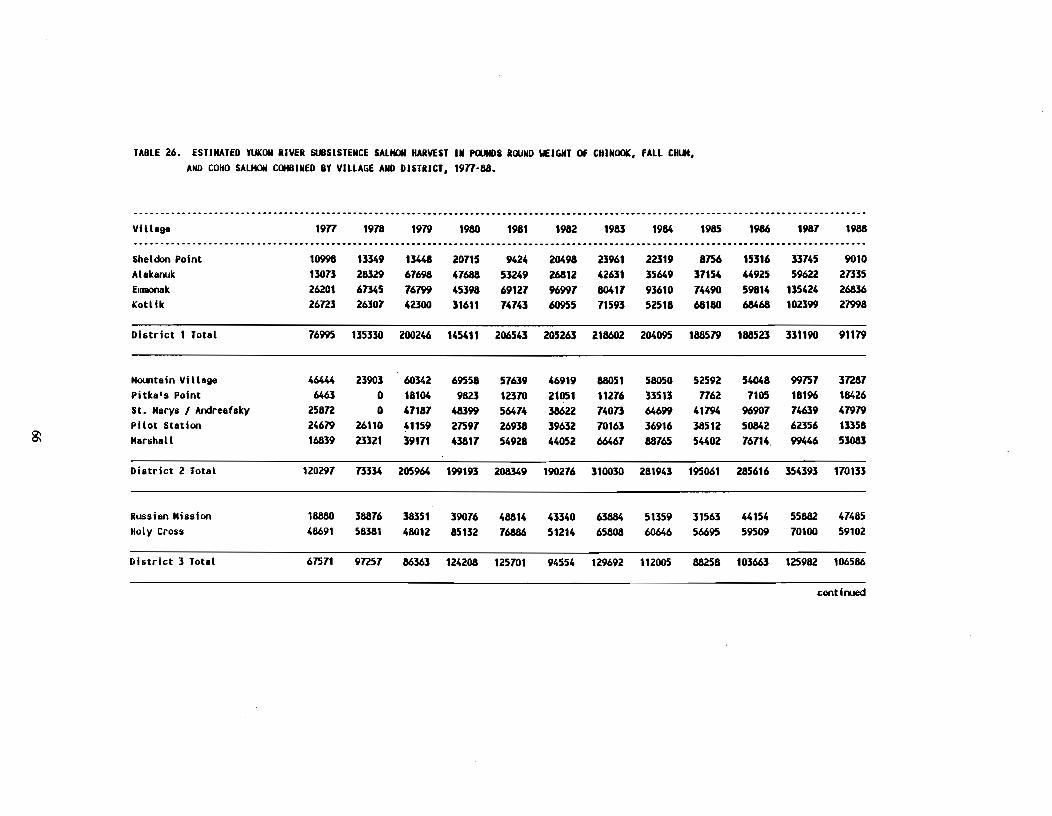
TABLE 26. ESTIMATED YUlCOH RIVER SUBSISTENCE SALMON HARVEST IN POONDS ROOND '-'EIGHT OF CHINOOlC, FALL CHlJt,AND COHO SALMON COHBINED BY VILLAGE AND DiSTRICT, 1917-88.
--_ .. _-------_ ... _------- .. --- .... _-_ .. --- ..-........-...........................•. .......... --_ .... _-_ .. -- ............... -_ ............Village 1917 1978 1979 1980 1981 1982 1983 1984 1985 1986 1987 1988.. _---.-.-_ ... __ .... _-_ .............................. --_._- .. _-_ .... _- ..... -_ ............... _ ......... _--_ .......................... _ .. --Sheldon Point 10998 13349 13448 20715 9424 20498 23961 22319 8756 15316 33745 9010Alakanuk 13073 28329 67698 47688 53249 26812 42631 35649 37154 44925 59622 27335
EllIIlOn8k 26201 67345 76799 45398 69127 96997 80417 93610 74490 59814 135424 26836Kotlik 26723 26307 42300 31611 74743 60955 71593 52518 68180 68468 102399 27998
District 1 Total 76995 135330 200246 145411 206543 205263 218602 204095 188579 188523 331190 91179
Mountain Village 46444 23903 60342 69558 57639 46919 88051 58050 52592 54048 99757 3n87Pitka's Point 6463 0 18104 9823 12370 21051 11276 33513 7762 7105 18196 18426St. Marys I Andreafsky 258n 0 47187 48399 56474 38622 74073 64699 41794 96907 74639 47979Pilot Station 24679 26110 41159 27597 26938 39632 70163 36916 38512 50842 62356 13358Harshall 16839 23321 39171 43817 54928 44052 66467 88765 54402 76714. 99446 53083
District 2 Total 120297 73334 205964 199193 208349 190276 310030 281943 195061 285616 354393 170133
Russian Mission 18880 38876 38351 39076 48814 43340 63884 51359 31563 44154 55882 47485Holy Cross 48691 58381 48012 85132 76886 51214 65808 60646 56695 59509 70100 59102
District 3 Total 67571 9n57 86363 124208 125701 94554 129692 112005 88258 103663 125982 106586
continued
_
~
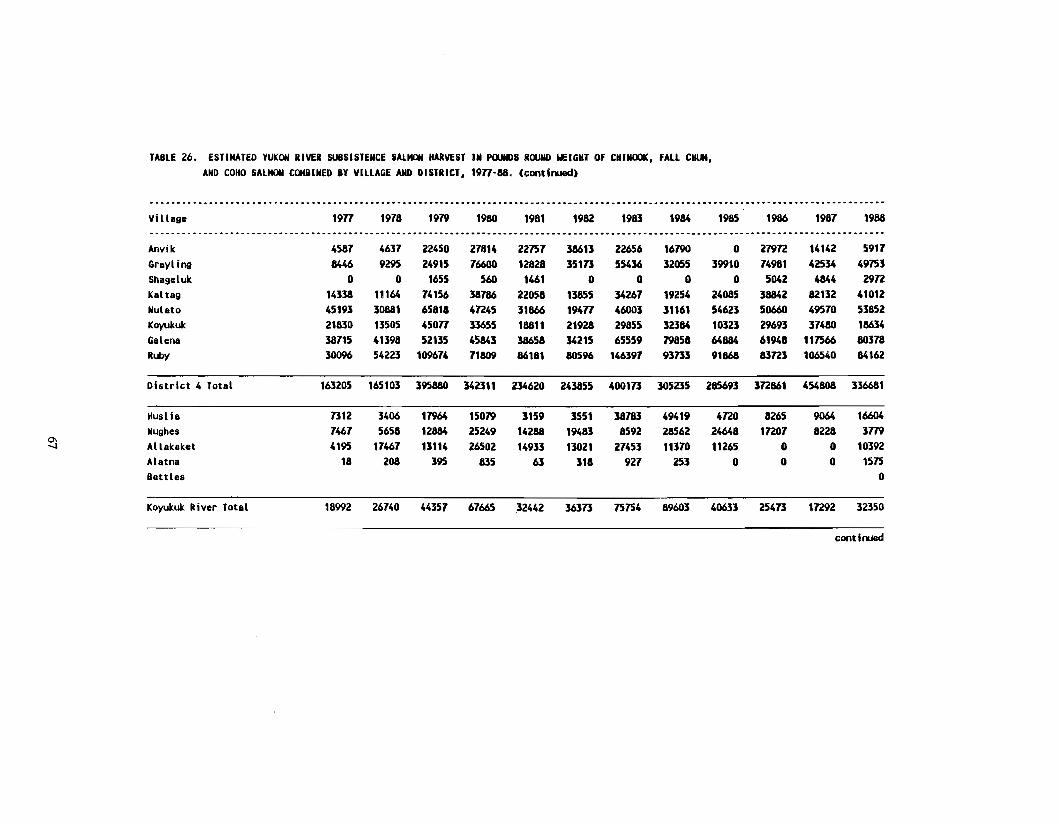
TABLE 26. ESTIMATED YUKON RIVER SUBSISTENCE SALMON HARVEST IN POUNDS ROUND WEIGHT Of CHINOOK, fALL CHUM,AND COHO SALMON COMBINED BY VILLAGE AND DISTRICT, 1917-88. (continued)
... ------ .. -_ ..... -.... _--_. __ .- .... --_ ... ------_ ....... _-_ ....... ---- .. _-------_ .. --- ...._--.---_ ... __ ....... ---_.- ....... --_ ....... __ ..Village 1971 1978 1979 1980 1981 1982 1983 1984 1985 1986 1981 1988.-----_.---_ .... -.. --------_.---_ ........ _-_._- ......-.......... -------------- .. --_ .... -_ ... ---_ ....-.....--.--_ ......... --- ... _----_ ....Anvik 4581 4631 22450 27814 22751 38613 22656 16790 0 219n 14142 5911Grayl ins 8446 9295 24915 16600 12828 35113 55436 32055 39910 14981 42534 49753Shageluk 0 0 1655 560 1461 0 0 0 0 5042 4844 29nKaltag 14338 11164 14156 38786 22058 13855 34261 19254 24085 38842 82132 41012Nulato 45193 30881 65818 4n45 31866 19417 46003 31161 54623 50660 49510 53852Koyukuk 21830 13505 45071 33655 18811 21928 29855 32384 10323 29693 37480 18634Galena 38115 41398 52135 45843 38658 34215 65559 79858 64884 61948 117566 80318RLby 30096 54223 109614 11809 86181 80596 146391 93133 91868 83123 106540 84162
District 4 Total 163205 165103 395880 342311 234620 243855 400113 305235 285693 3n861 454808 336681
Huslia 1312 3406 17964 15079 3159 3551 38783 49419 4nO 8265 9064 16604Hughes 1461 5658 12884 25249 14288 19483 8592 28562 24648 1nOl 8228 3179Allakaket 4195 11461 13114 26502 14933 13021 21453 11370 11265 0 0 10392Alatna 18 208 395 835 63 318 921 253 0 0 0 1575Bettles 0
Koyukuk River Total 18992 26740 44351 67665 32442 36313 75754 89603 40633 25413 1n92 32350
continued
~
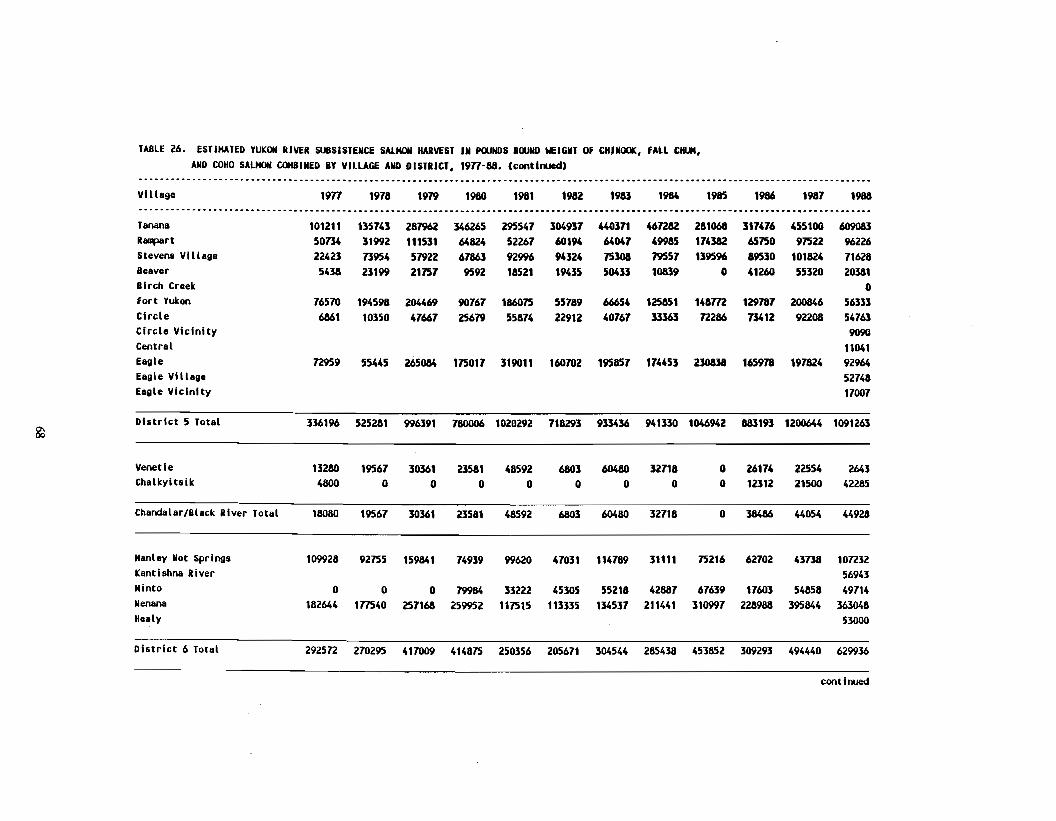
TABLE 26. ESTIMATED YUKON RIVER SUBSISTENCE SALMON HARVEST IN POUNDS ROUND WEIGHT Of CHINOOK. fALL CHUM.AND COHO SALMON COHBINED BY VILLAGE AND DISTRICT. 1971-88. (continued)
•••• -.-.-._- •• _---------_ •• _-_._--. •• ••• •• •••• •• e •••••• •••••• ••••• ••• •••••••• ••
Village 1971 1918 1979 1980 1981 1982 1983 1984 1985 1986 1981 1988................ _----- ..... _-._---- ...-........--._---.--_ ................. __ ... _-_ ........ _ ......-... __ ..... _---_ ....... _.~ .. -.- .... -._-Tanana 101211 135143 287962 346265 295541 304931 440311 46n82 281068 311416 455100 609083Raq:Nlrt 50134 31992 111531 64824 52261 60194 64041 49985 114382 65750 97522 96226Stevens Vi llage 22423 13954 51922 61863 92996 94324 75308 19551 139596 89530 101824 11628Beaver 5438 23199 21751 9592 18521 19435 50433 10839 0 41260 55320 20381Birch Creek 0fort Yukon 16510 194598 204469 90161 186075 55189 66654 125851 148m 129181 200846 56333Circle 6861 10350 41667 25679 55814 22912 40767 33363 n286 13412 92208 54763Circle Vicinity 9090Central 11041Eagle 72959 55445 265084 175011 319011 160102 195857 174453 230838 165978 191824 92964Eagle Village 52148Eagle Vicinity 11007
District 5 Total 336196 525281 996391 180006 1020292 118293 933436 941330 1046942 883193 1200644 1091263
--Venetie 13280 19567 30361 23581 48592 6803 60480 32718 0 26174 22554 2643Chalkyitsik 4800 0 0 0 0 0 0 0 0 12312 21500 42285
Chandalar/Black River Total 18080 19567 30361 23581 48592 6803 60480 32718 0 38486 44054 44928
Manley Hot Springs 109928 92755 159841 74939 99620 47031 114789 31111 75216 62102 43138 10n32Kantlshna River 56943Minto 0 0 0 79984 33222 45305 55218 42887 67639 17603 54858 49714Nenana 182644 117540 257168 259952 117515 113335 134537 211441 310997 228988 395844 363048Healy 53000
District 6 Total 2925n 270295 411009 414875 250356 205611 304544 285438 453852 309293 494440 629936
continued
~~. __ __ ___ _ _ __ __ ____ • __ • ____ • __ _ __________ • _______________
~
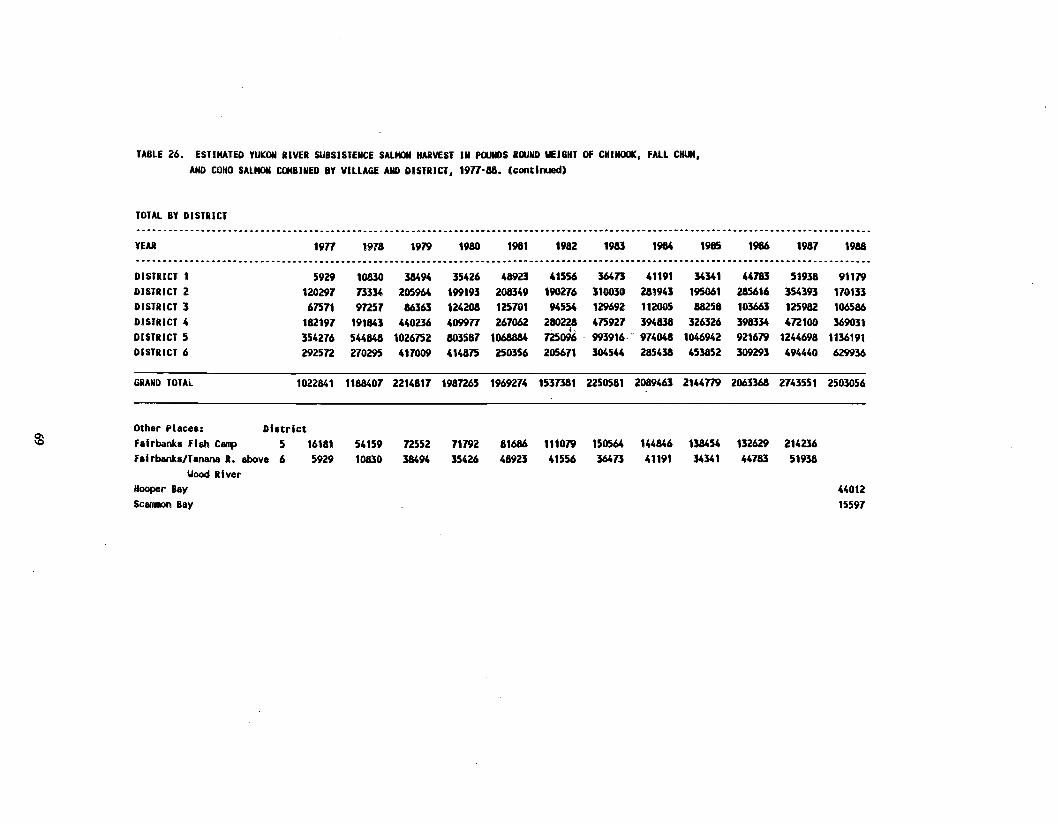
TABLE 26. ESTIMATED YUKON RIVER SUBSISTENCE SALMON HARVEST IN POUNDS ROUND WEIGHT Of CHINOOK, fALL CHUM,AND COHO SALMON COMBINED BY VILLAGE AND DISTRICT, 1971·88. (continued)
TOTAL BY DISTRICT.....................•..•..••.....•.••••••• --_ ...................•...•••...............•.•................................... -.._----- ...YEAR 1971 1978 1979 1980 1981 1982 1983 1984 1985 1986 1987 1988........................... __ ................•......••..............•..............••.•..................................................DISTRICT 1 5929 10830 38494 35426 48923 41556 36473 41191 34341 44783 51938 91179DISTRICT 2 120297 13334 205964 199193 208349 190216 310030 281943 195061 285616 354393 170133DISTRICT 3 61571 97251 86363 124208 125701 94554 129692 112005 88258 103663 125982 106586DISTRICT 4 182197 191843 440236 409971 267062 2802~8 415927 394838 326326 398334 472100 369031DISTRICT 5 354276 544848 1026152 803587 1068884 725096 - 993916- - 974048 1046942 921679 1244698 1136191DISTRICT 6 292572 210295 417009 414815 250356 205611 304544 285438 453852 309293 494440 629936
GRAND TOTAL 1022841 1188407 2214817 1987265 1969274 1531381 2250581 2089463 2144779 2063368 2143551 2503056
Other Places: District$ fairbanks fish Camp 5 16181 54159 72552 11792 81686 111079 150564 144846 138454 132629 214236
fairbankslTanana R. above 6 5929 10830 38494 35426 48923 41556 36413 41191 34341 44783 51938"'ood River
Hooper Bay 44012SC8IIIIIOfl Bay 15597
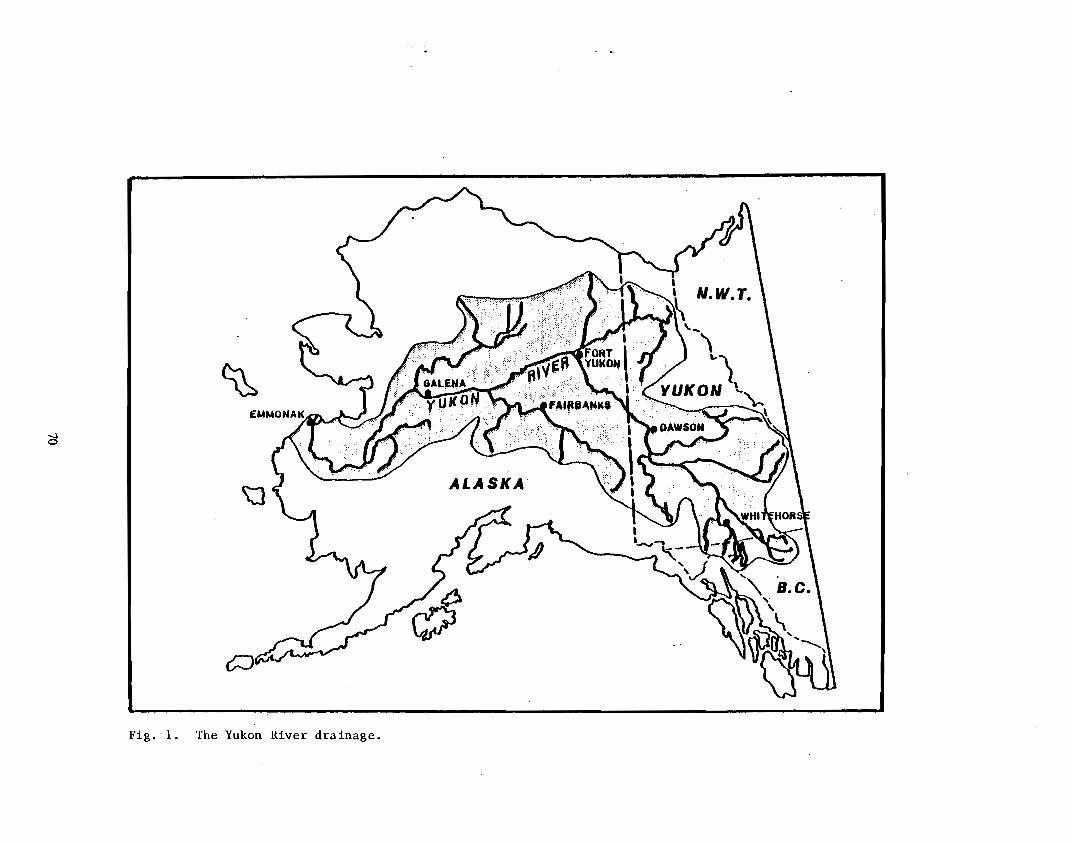
~
t::J
Fig. 1. The Yukon River drainage.
cJ
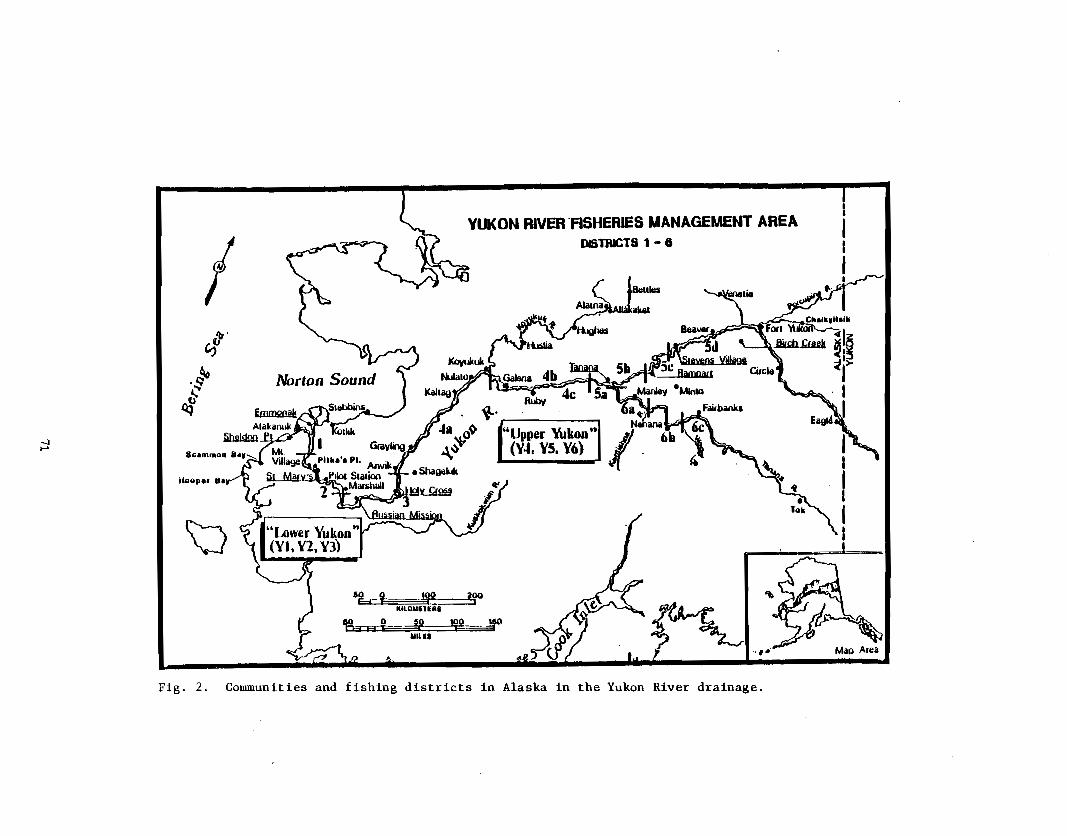
-.lI-'
I~.
"U.Q~
~
H....p.r II.
\:)
YUKON RIVER "fiSHERIES MANAGEMENT AREADtiTRICTS 1 8
lib ? ,~ iYOIlll0MiliRi
li9w H 0 , 190 'fOMILEI
"Fig. 2. Communities and fishing districts in Alaska in the Yukon River drainage.
-
~
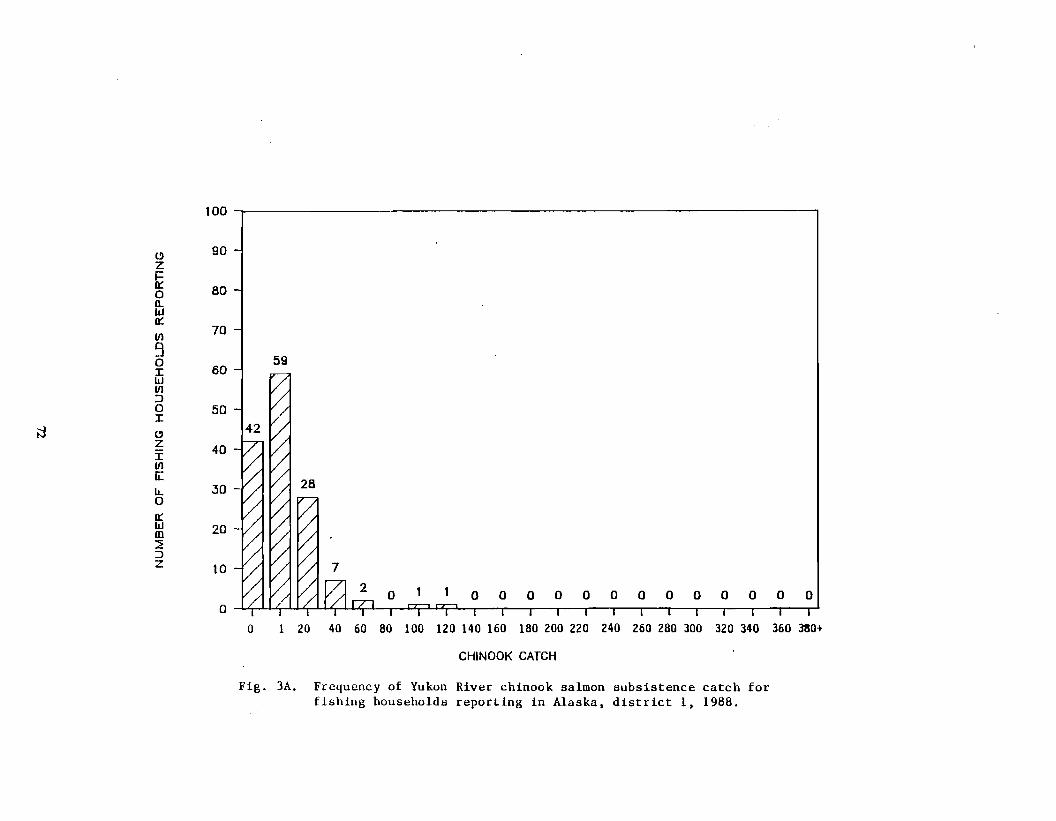
a Ifill/I'I/IIIL."?' i iii iii iii Iii .'
100
(!j 90zi=It:0 80ll..UJIt:
III70
:10 II 60
59
UJIII:>0 50I(!jZI
40IIIii:LL 300It:UJm 20
:>z to
t:j
o 1 20 40 60 80 100 120 140 160 180 200 220 240 260 280 300 320 340 360 380+
CHINOOK CATCH
Fig. 3A. Frequency of Yukon River chinook salmon subsistence catch forfishing households reporting in Alaska. district 1. 1988.
~
~~
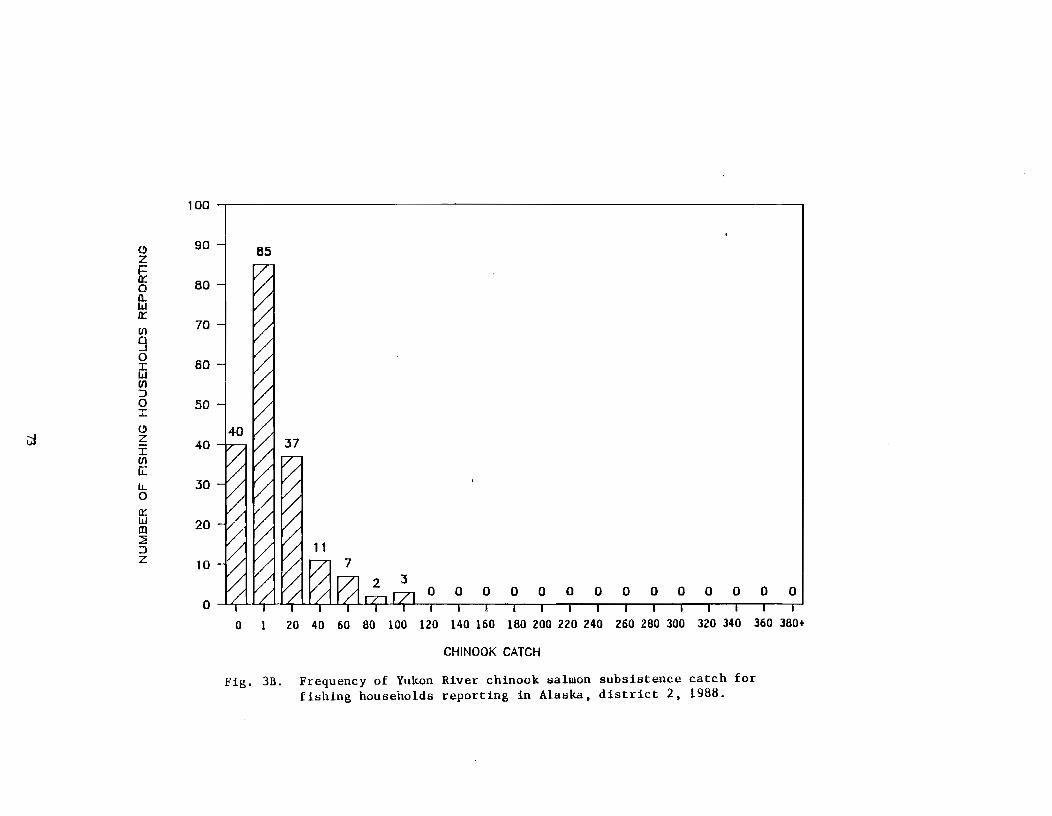
100
G 90 IZ
85
i=n::0 80ll.Wn::Ul
70a.J0I 60wUl::>0 50I
(;jGZI 40Ulr;:I.L. .300n::w 20m::E::>z 10
0
0 1 20 40 60 80 100 120 140 160 180 200 220 240 260 280 300 320 340 360 380+
CHINOOK CATCH
Fig. 3B. Frequency of Yukon River chinook salmon subsistence catch forfishing households reporting in Alaska. district 2. 1988.
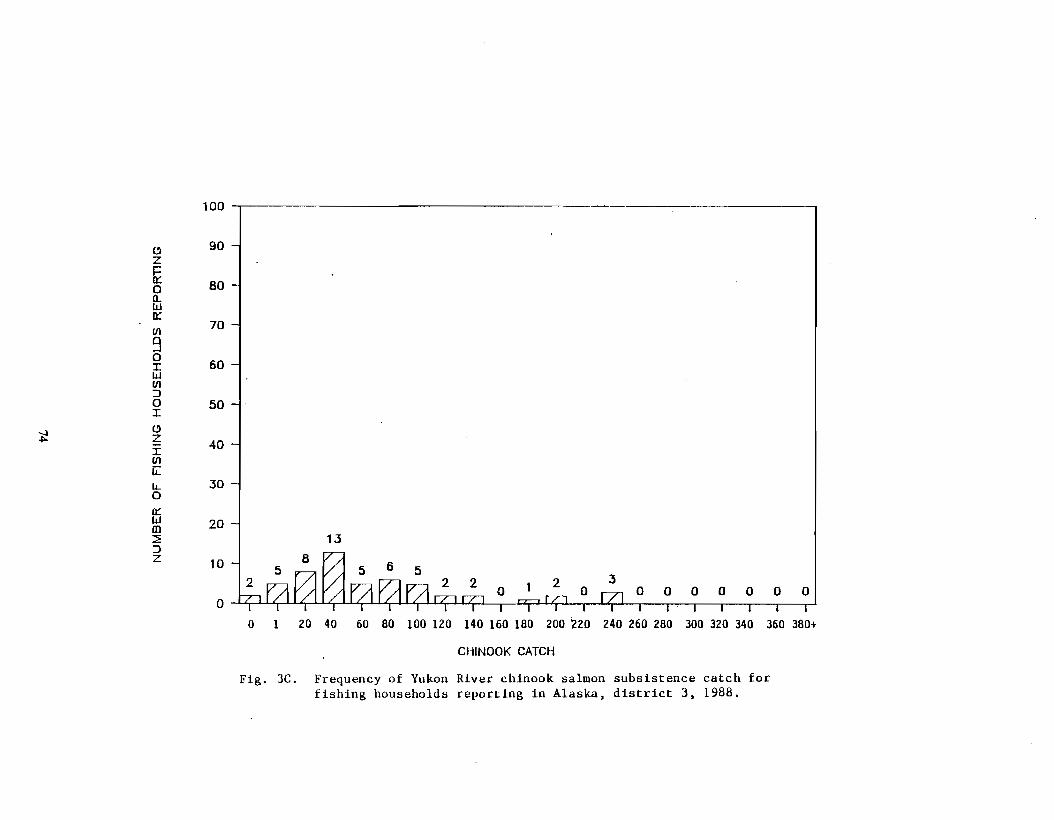
100
90Clzi=
80It:00-WIt:
70VI
90
60IWVI:J
500I
Cl
40zIVIiL
30IJ...0
It:20
13
wm
I:E:J
10Z
O '4"4"4"4"4"4"4"4"41 ....,...,'4 1 14' II Iii I I I I I
o 1 20 40 60 80 100 120 140 160 180 200 220 240260 280 300 320 340 360 380+
CHINOOK CATCH
Fig. 3C. Frequency of Yukon River chinook salmon subsistence catch forfishing households reporting in Alaska, district 3, 1988.
~
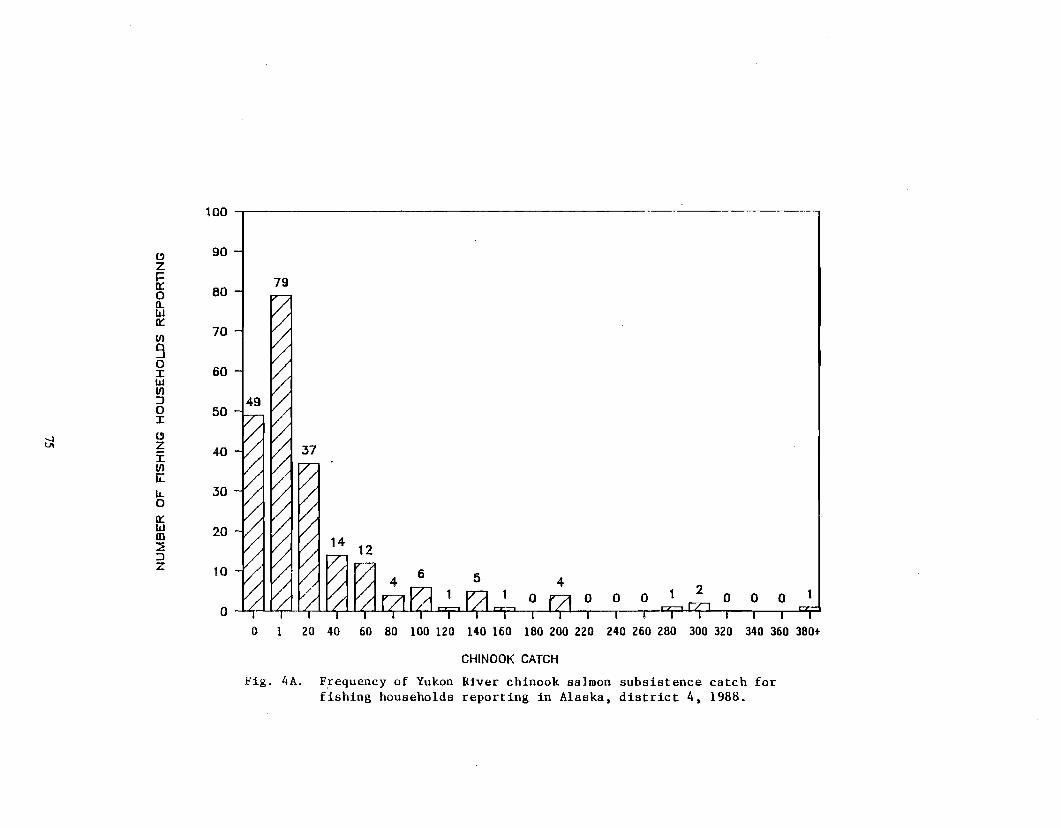
100
"90
zl=n:: I0 80
79
n..wn::Ul
70
901: 60wUl::J0 501:
"zI 40Ul[L
IL 300n::wm 20
::JZ 10
o IL."tjll/.II<iII<iIIL.IIL.'CZj::tIL.'CZj::t I '''I'i i i CZj::t't.' iii r:r;:'
o 1 20 40 60 80 100 120 140 160 180 200 220 240 260 280 300 320 340 360 380+
CHINOOK CATCH
Fig. 4A. Frequency of Yukon River chinook salmon subsistence catch forfishing households reporting in Alaska, district 4, 1988.
~
~
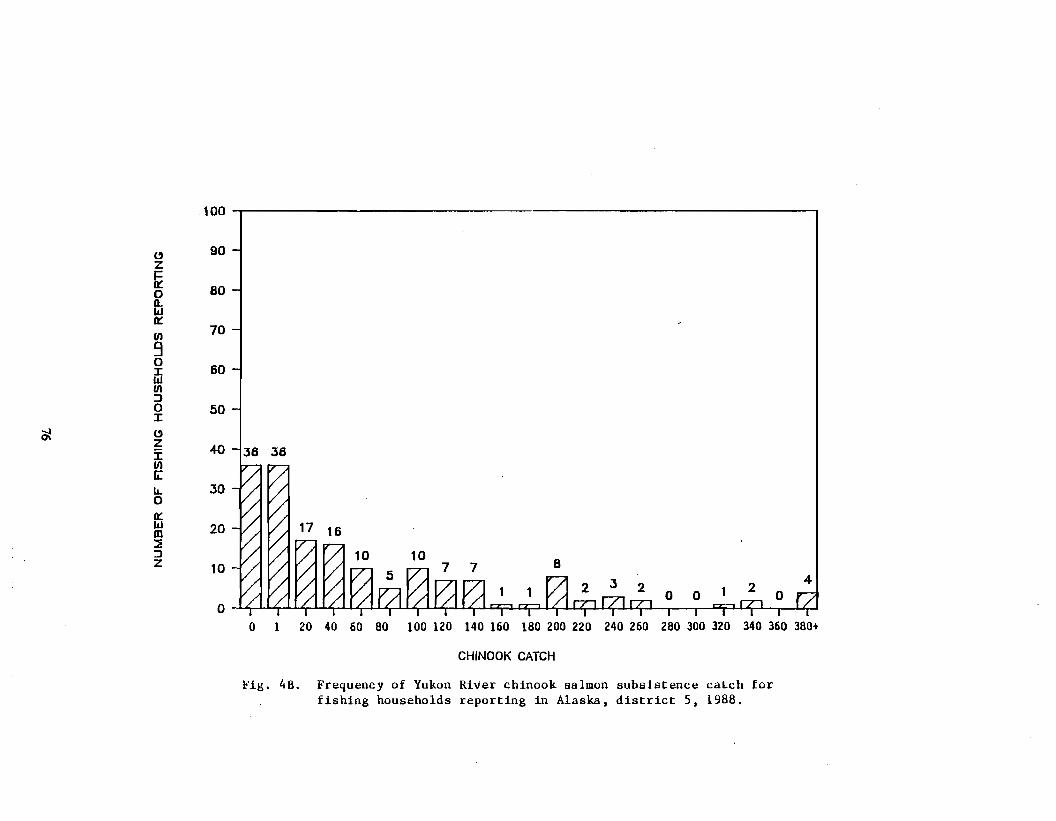
"z~oQ.W0::(/)
9o1:W(/):Jo1:
"zi:(/)[L
lLo0::wm::::E:JZ
100
90
80
70
60
50
40 t 6 36
30
20
10
o ''1 "'1 "'1 "'l "'1 "", "'1", "'I 'ry'ry"'l I''l "'l "'l , •• ry"'l' I'"o 1 20 40 60 80 100 120 140 160 180 200 220 240 260 280 300 320 340 360 380+
CHINOOK CATCH
Fig. 4B. Frequency of Yukon River chinook salmon subsistence catch forfishing households reporting in Alaska. district 5. 1988.
~
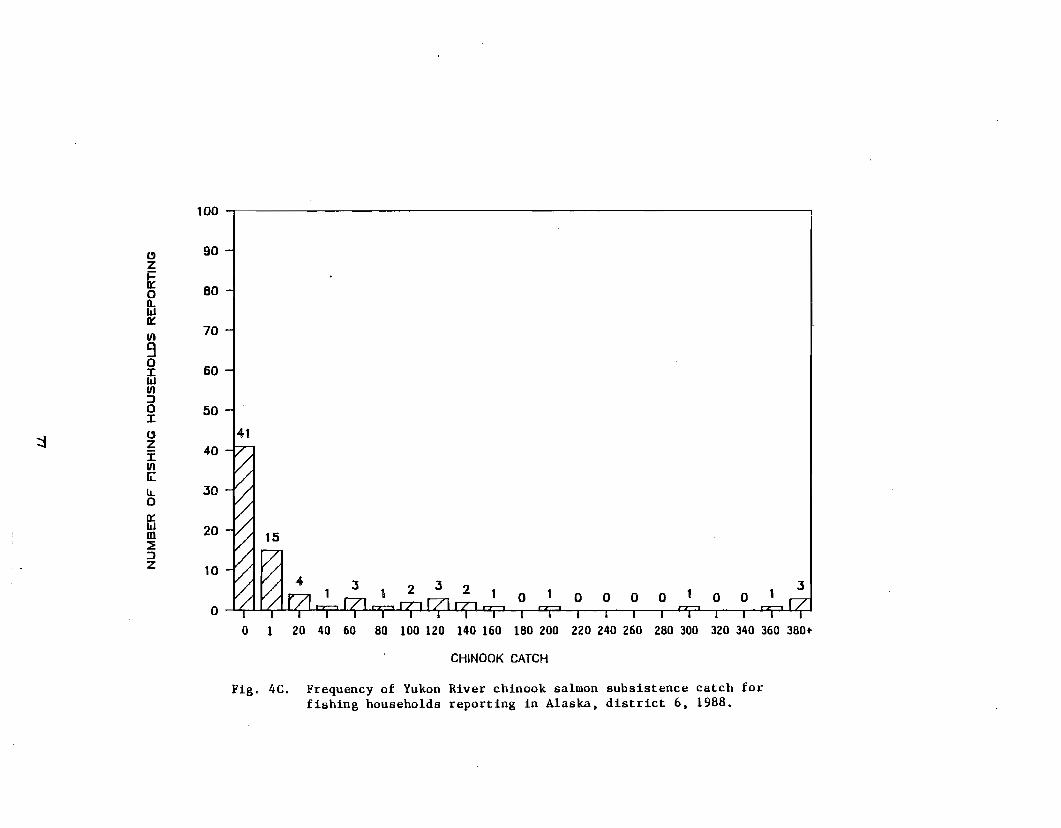
100 1.------------------------~'
41
o ',",I,'ap','o;pl<j"<j"<j11""Zj"? I rzp I I I I czr I I l""Zj"?'tfl
40
20
10
90
70
50
30
80
60
CJZ
~on.wIt:II)
9oI:WII):>oI:CJziII)
G:IJ..o0:wm:>z
::J
o 1 20 40 60 80 100 120 140 160 180 200 220 240 260 280 300 320 340 360 380+
CHINOOK CATCH
Fig. 4C. Frequency of Yukon River chinook salmon subsistence catch forfishing households reporting in Alaska. district 6. 1988.
~
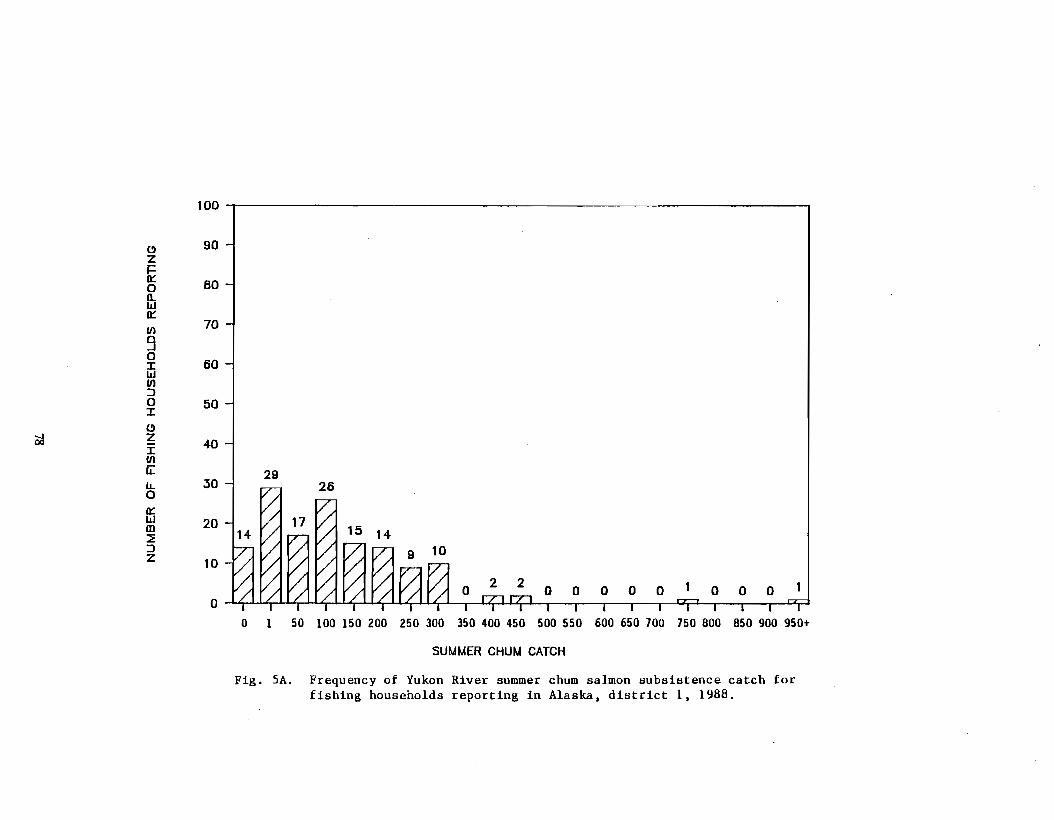
100
u 90zJ=It:0 800-WIt:I/) 70
90:I: 60wI/):>0 50:I:
cdUZ:r 40I/)
fi:IJ.. 30
I 29
0It:Wm 20::E:>z 10
0
0 1 50 100 150 200 250 300 350 400 450 500 550 600 650 100 150 800 850 900 950+
SUMMER CHUM CATCH
Fig. SA. Frequency of Yukon River summer chum salmon subsistence catch forfishing households reporting in Alaska. district 1. 1988.
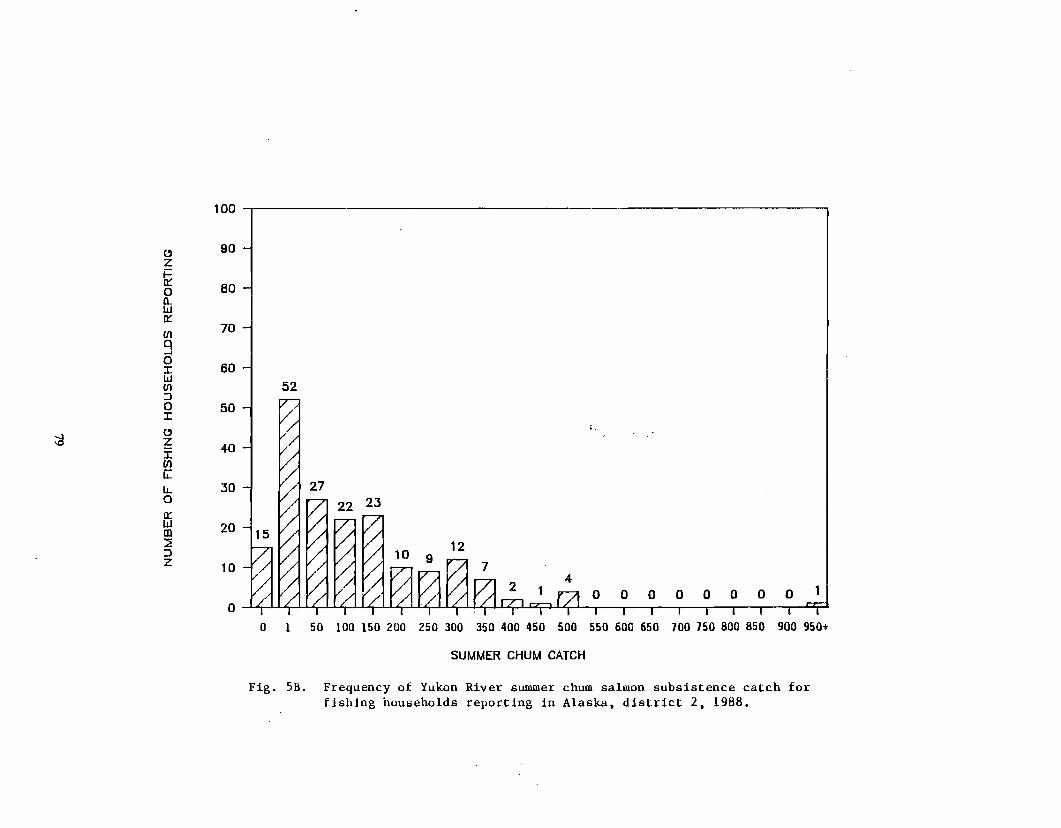
\i3
CIZ
~o0..W0:::
Ul
9oIWUl:JoI
CIZIUliLu..o0::Wm:::E:JZ
100 , I
90
80
70
6052
50
40
30
20
10
a '"'''1''','''.''',''<)''<)'''1''<;''','0:;=''''' I iii I I I I CZj"""l
o 1 50 100 150 200 250 300 350 400 450 500 550 600 650 700 750 800 850 900 950+
SUMMER CHUM CATCH
Fig. SB. Frequency of Yukon River summer chum salmon subsistence catch forfishing households reporting in Alaska. district 2. 1988.
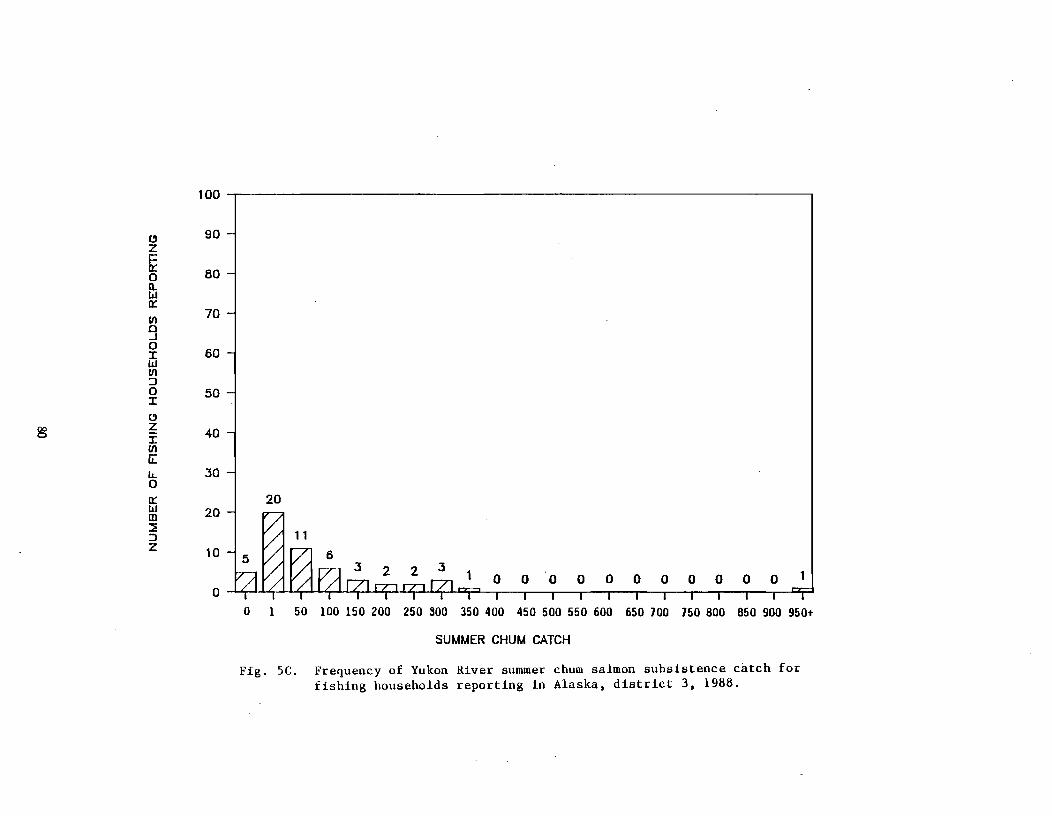
ClZ
~on.w0::
Ulo..JoIWUl:JoI
ClZIUlILILo0::Wm::E:JZ
100 I I
90
80
70
60
50
40
30
2020
10
O 1)14If"'f"fIUP~141r-zr rzpi I I I I I I I I I I
o 1 50 100 150 200 250 SOO 350 400 450 500 550 600 650 700 750 800 850 900 950+
SUMMER CHUM CATCH
Fig. Sc. Frequency of Yukon River summer chum salmon subsistence catch forfishing households reporting in Alaska, district 3, 1988.
~
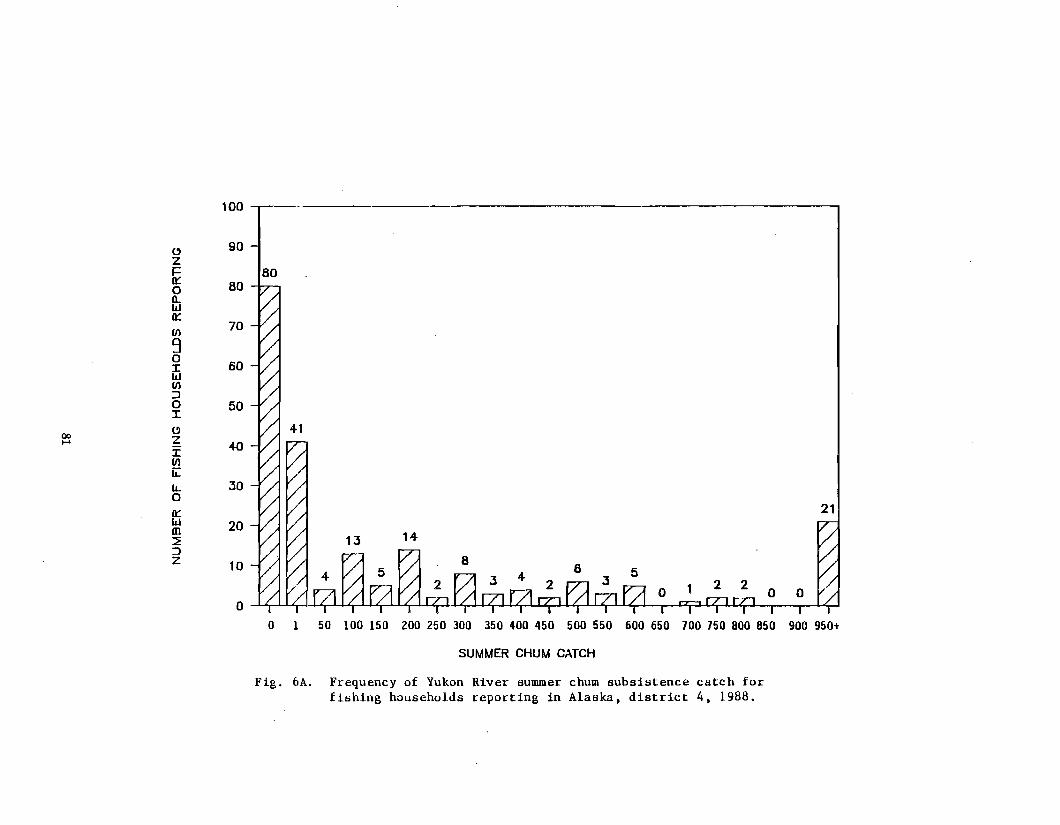
100
(} 90Z1= 1800 8011.W
Ul70
90I 60wUl:J0 50I
00(}
.... zI 40Ulii.:lL. 300
wm 20
:JZ 10
00 1 50 100 150 200 250 300 350 400 450 500 550 600 650 700 750 800 850 900 950+
SUMMER CHUM CATCH
Fig. 6A. Frequency of Yukon River summer chum subsistence catch forfishing households reporting in Alaska. district 4. 1988.
~
~
~
~
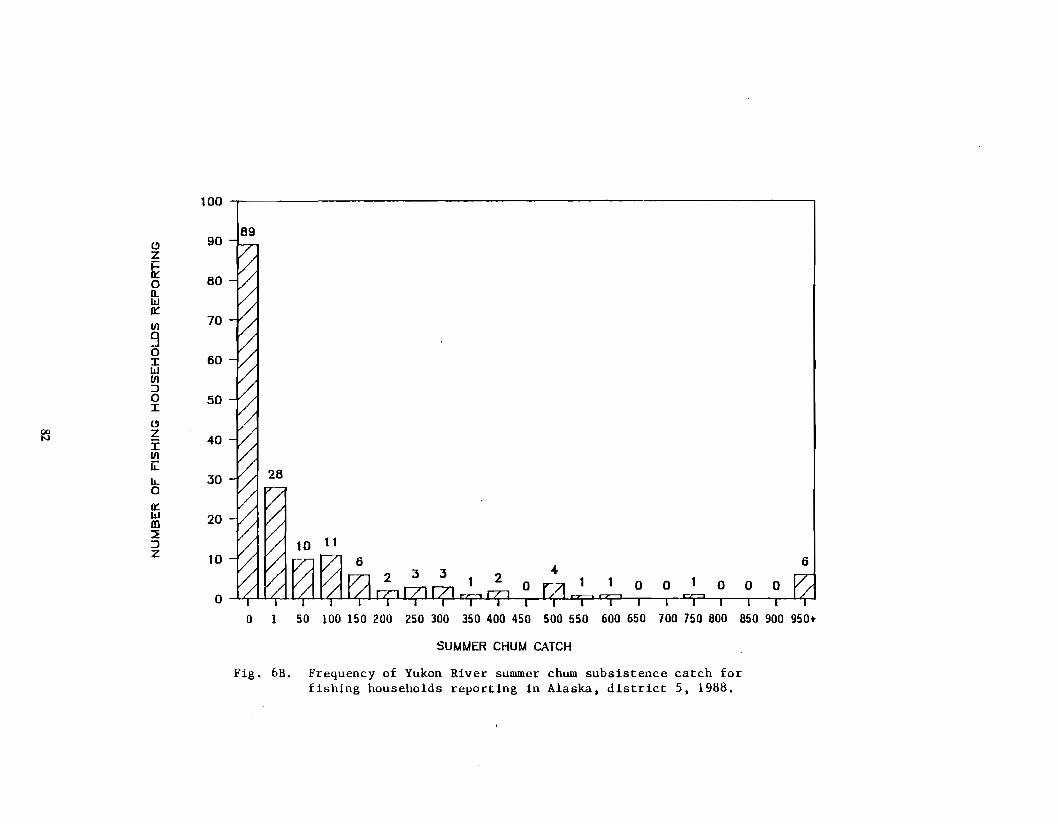
100
Cl 90189
Zi=0::0 80n.w0::
Ul 70
90I 60wUl:J0 50I
gsClzI 40II)
fi:11- 3000::Wm 20:::E:JZ 10
0
0 1 50 100 150 200 250 300 350 400 450 500 550 600 650 700 750 800 850 900 950+
SUMMER CHUM CATCH
Fig. 6B. Frequency of Yukon River summer chum subsistence catch forfishing households reporting in Alaska. district 5. 1988.
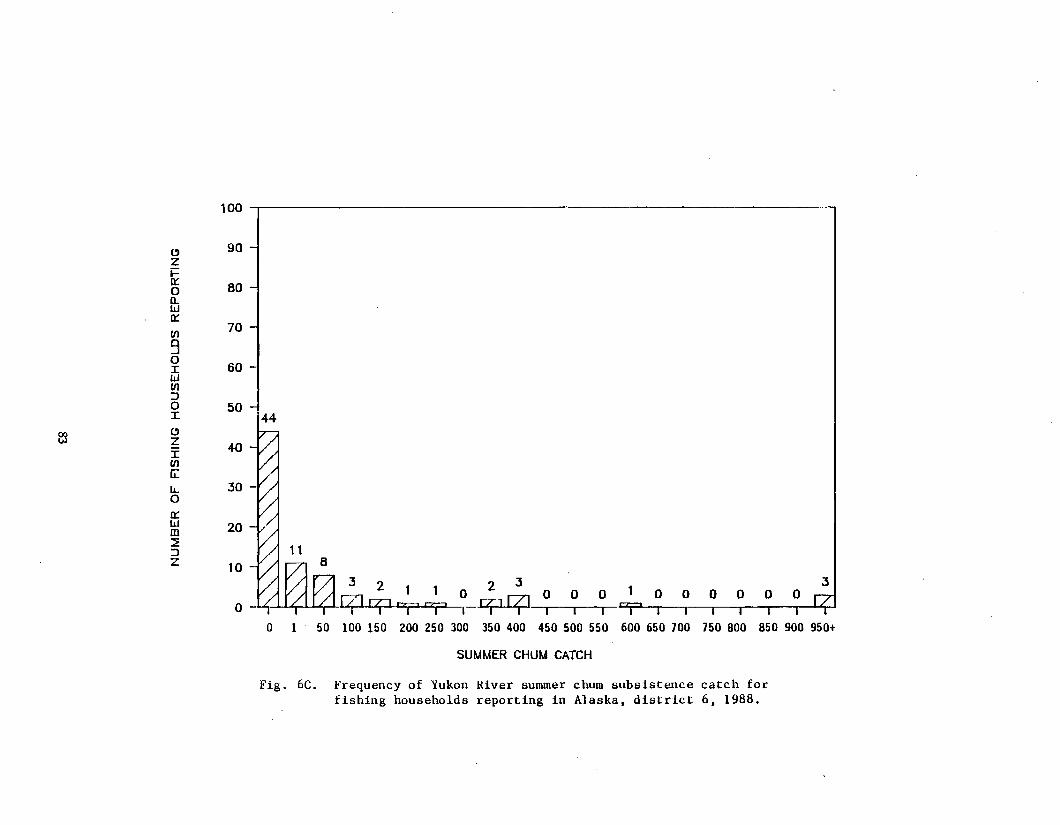
o lL.IILj""'a II 4)II"'r:z;='cz:;:' ilL."".' i • I cz:;:' iii I i i'E.'
100
90
80
70
60
50
~40
30
20
10
C)zIt:on.wIt:
Ul
9oIWUl:JoIC)ZIUl[i:
lLoIt:Wm:JZ
es
o 1 50 100 150 200 250 300 350 400 450 500 550 600 650 700 750 800 850 900 950+
SUMMER CHUM CATCH
Fig. 6e. Frequency of Yukon River summer chum subsistence catch forfishing households reporting in Alaska, district 6, 1988.
~
~
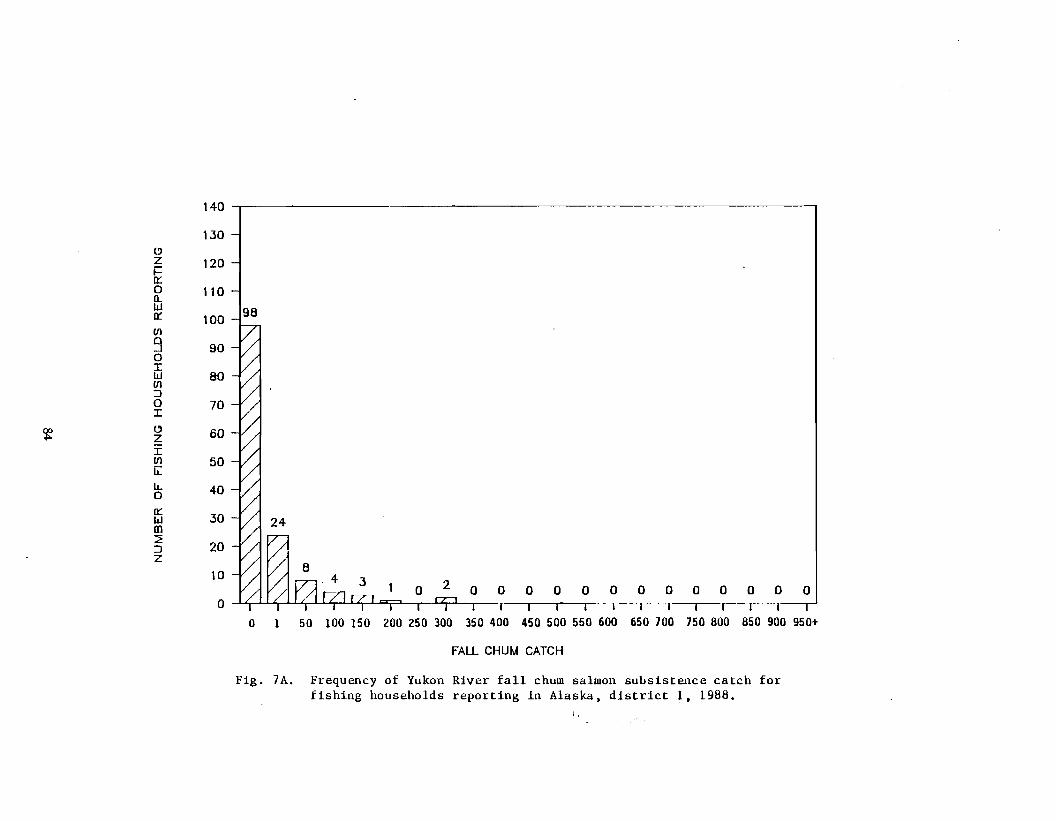
Clzi=n::oll..Wn::VI
9oIWVI::JoI
ClZIVIit::lLon::wm::JZ
140
1.30
120
110
100 19B
90
80
70
60
50
40
.30
20
10
0
0 1 50 100 150 200 250 300 350 400 450 500 550 600 650 700 750 800 850 900 950+
FALL CHUM CATCH
Fig. lA. Frequency of Yukon River fall chum salmon subsistence catch forfishing households reporting in Alaska, district I, 1988.
i.
~
~
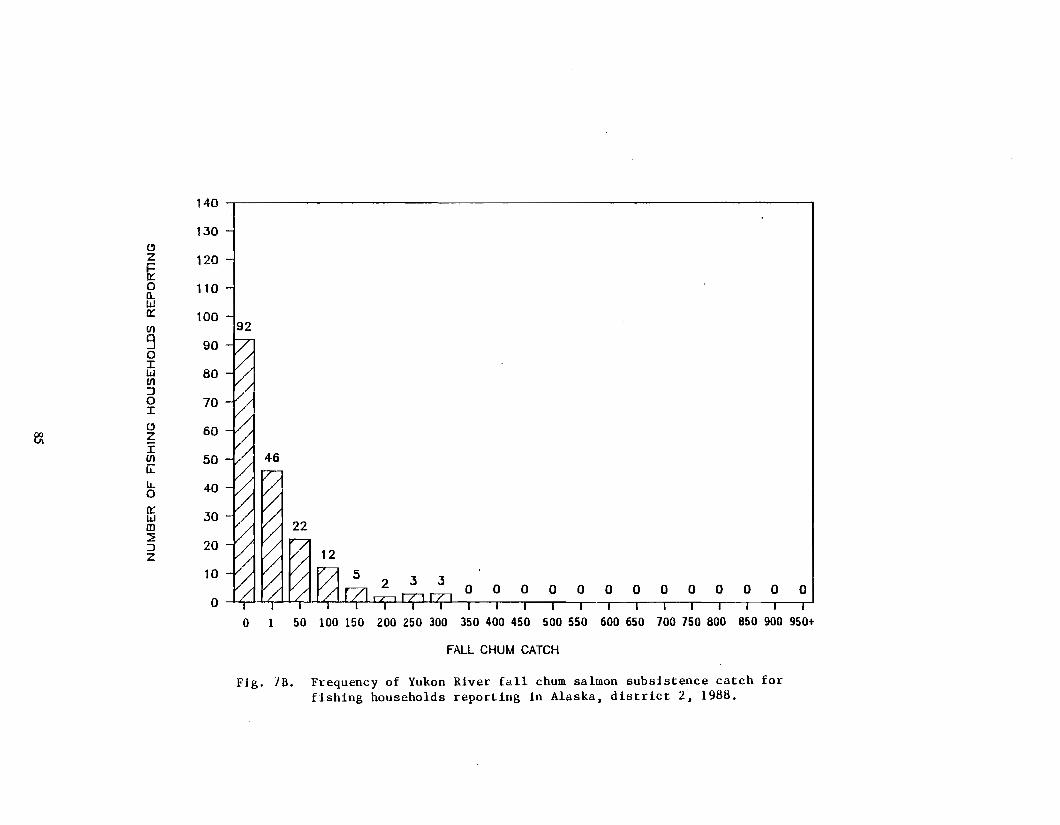
eJZ
~on.w
VI
9oIWVI:JoI
eJZIVIiLlL.o
wm
:JZ
140
130
120
110
100192
90
80
70
60
50
40
30
20
10
0
0 1 50 100 150 200 250 300 350 400 450 500 550 600 650 700 750 800 850 900 950+
fALL CHUM CATCH
Fig. 7B. Frequency of Yukon River fall chum salmon subsistence catch forfishing households reporting in Alaska. district 2. 1988.
~
~
~
~
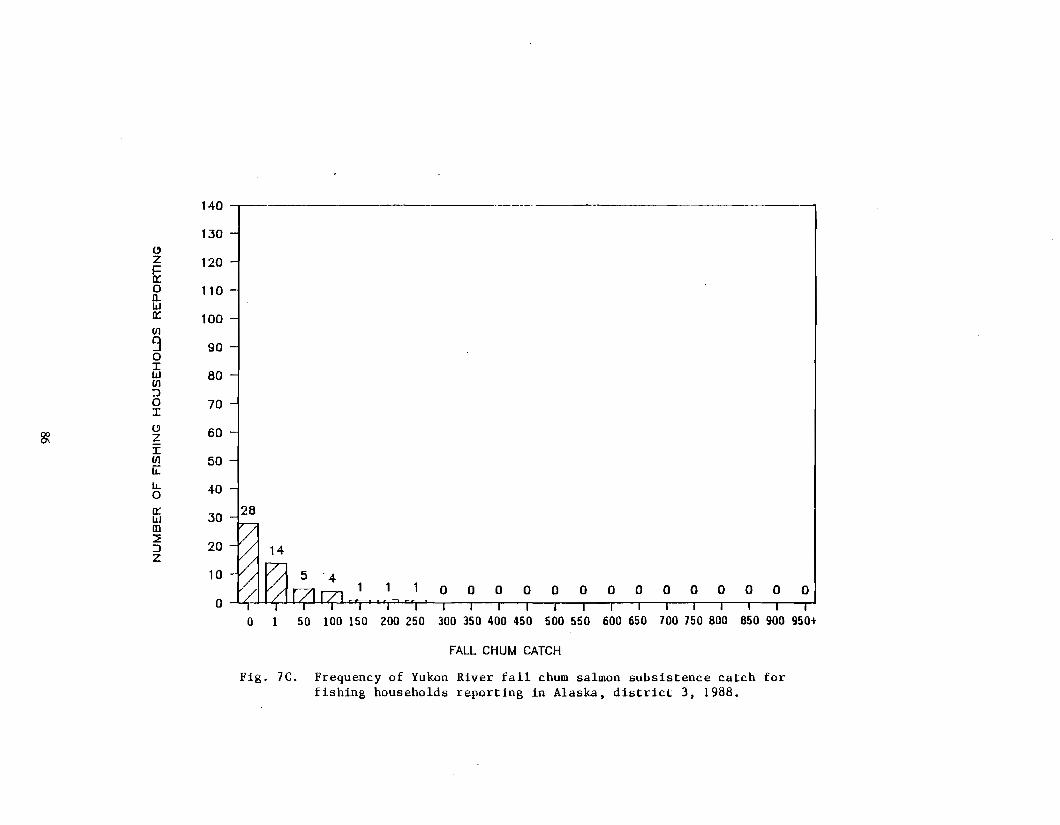
"z~on.wIt:
VI
9oIWVI::JoI
"ZIVIii:IJ..oIt:Wm::::E::JZ
140
130
120
110
100
90
80
70
60
50
40
30 b8
20
10
0
0 1 50 100 150 200 250 300 350 400 450 500 550 600 650 700 750 800 850 900 950+
FALL CHUM CATCH
Fig. 7e. Frequency of Yukon River fall chum salmon subsistence catch forfishing households reporting in Alaska. district 3. 1988.
~
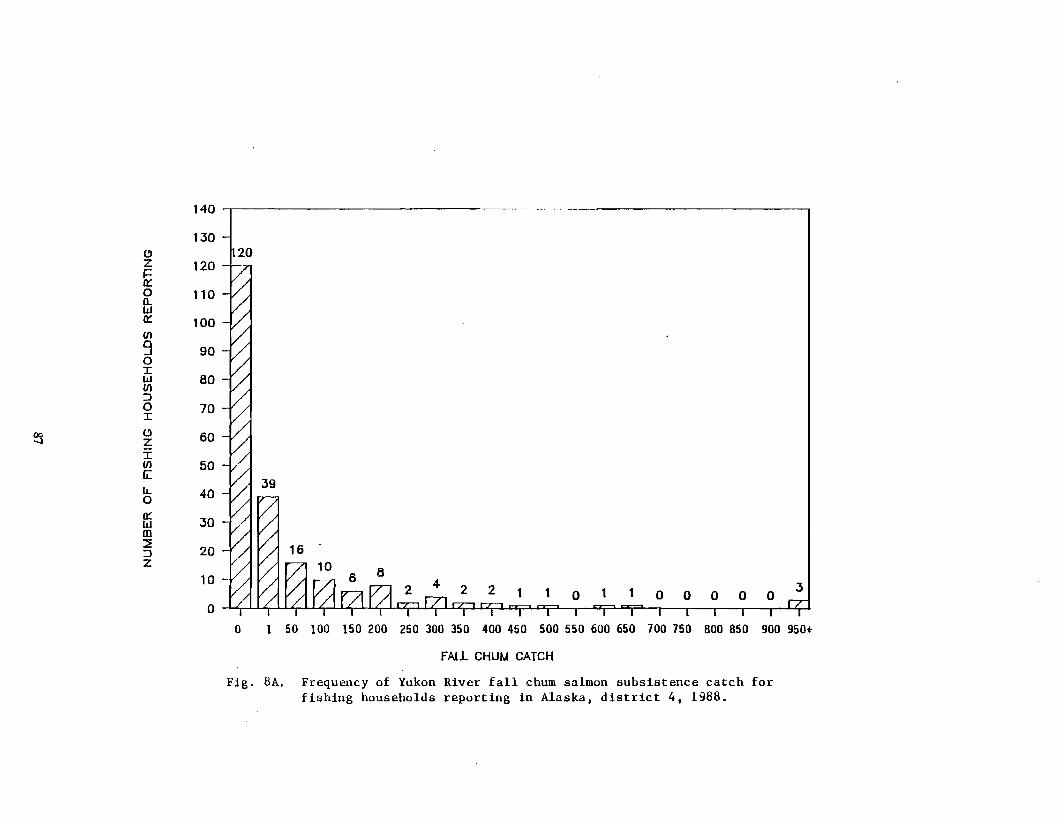
140
130Cl h20Z 120i=It:0 11011.wIt: 100U'I
9 900IW 80Ul:J0 70I
Cl 60zIUl 50G:IL 400It: 30wm:=E
20:JZ
10
0
0 1 50 100 150 200 250 300 350 400 450 500 550 600 650 700 750 800 850 900 950+
FALL CHUM CATCH
Fig. 8A. Frequency of Yukon River fall chum salmon subsistence catch forfishing households reporting in Alaska, district 4, 1988.
~
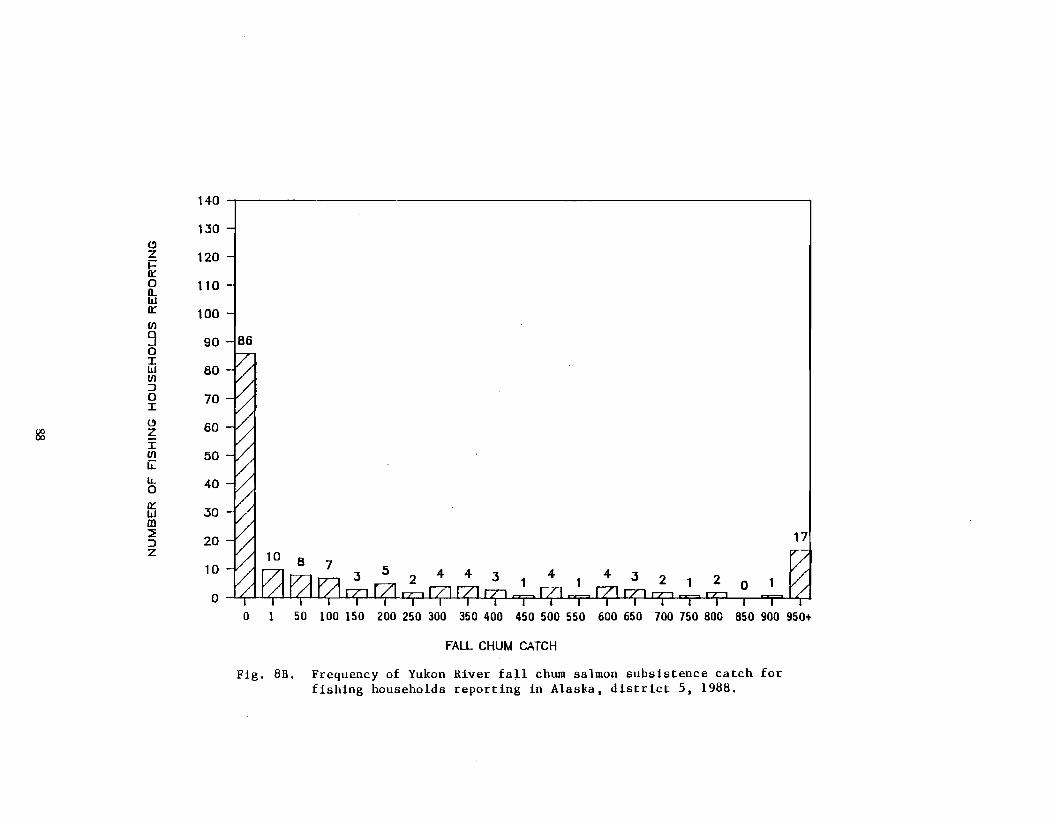
&l
"z~on.wn::Ul
9oIWUl:JoI
"ZIUlii:IL.on::wm::!::::lZ
140
130
120
110
100
90 JB6
BO
70
60
50
40
30
20
10
00 1 50 100 150 200 250 300 350 400 450 500 550 600 650 700 750 800 850 900 950+
FALL CHUM CATCH
Fig. 8B. Frequency of Yukon River fa~l chum salmon subsistence catch forfishing households reporting in Alaska, district 5, 1988.
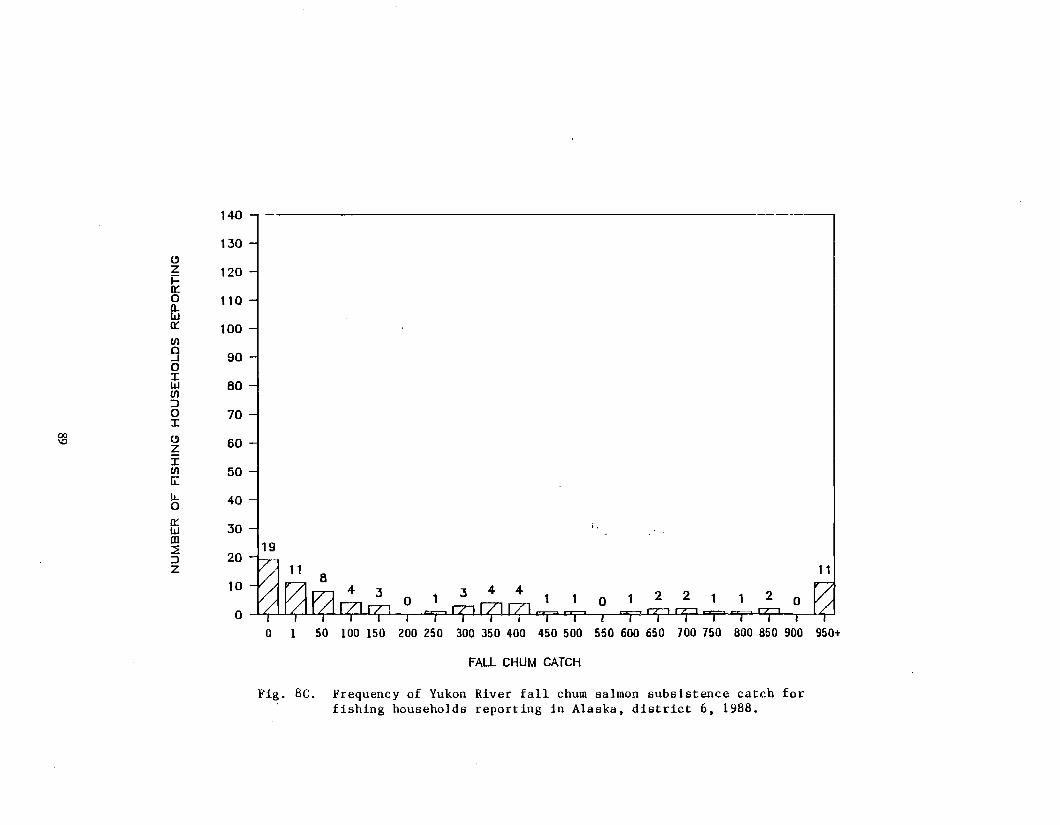
140
130
"z 120n::0 1100-Wn:: 100(/)0 90..J0I
80w(/):J0 70I
00
" 60IQ
ZI
50(/)
G:IL 400n:: 30wm
119:=E:J 20z
10
00
;,
50 100 150 200 250 300 350 400 450 500 550 600 650 700 750 800 850 900 950+
FALL CHUM CATCH
Fig. Be. Frequency of Yukon River fall chum salmon subsistence catch forfishing households reporting in Alaska. district 6. 19BB.
~
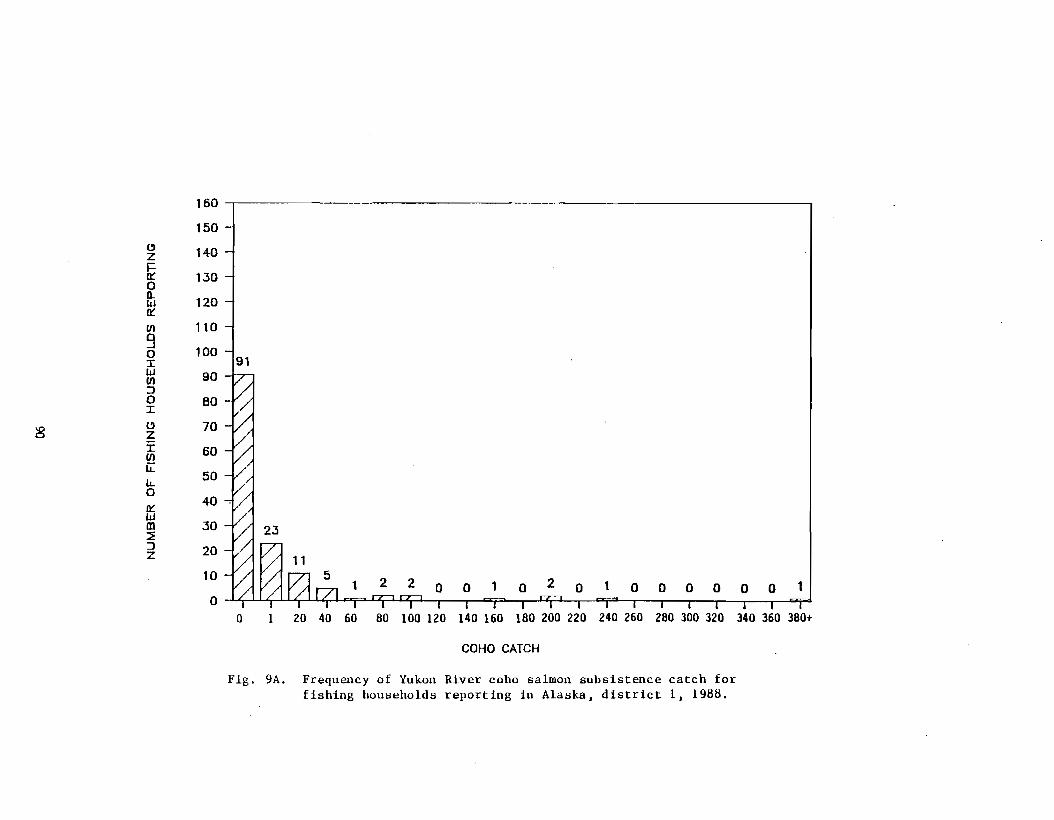
8
ClZ
~o0...W0::
Ul
9oIWUl:>oI
ClzIUlii:lL.o0::wm::JZ
160
150
140
130
120
110
100191
90
80
70
60
50
40
30
20
10
00 1 20 40 60 80 100 120 140 160 180 200 220 240 260 280 300 320 340 360 380+
COHO CATCH
Fig. 9A. Frequency of Yukon River coho salmon subsistence catch forfishing households reporting in Alaska, district I, 1988.
~
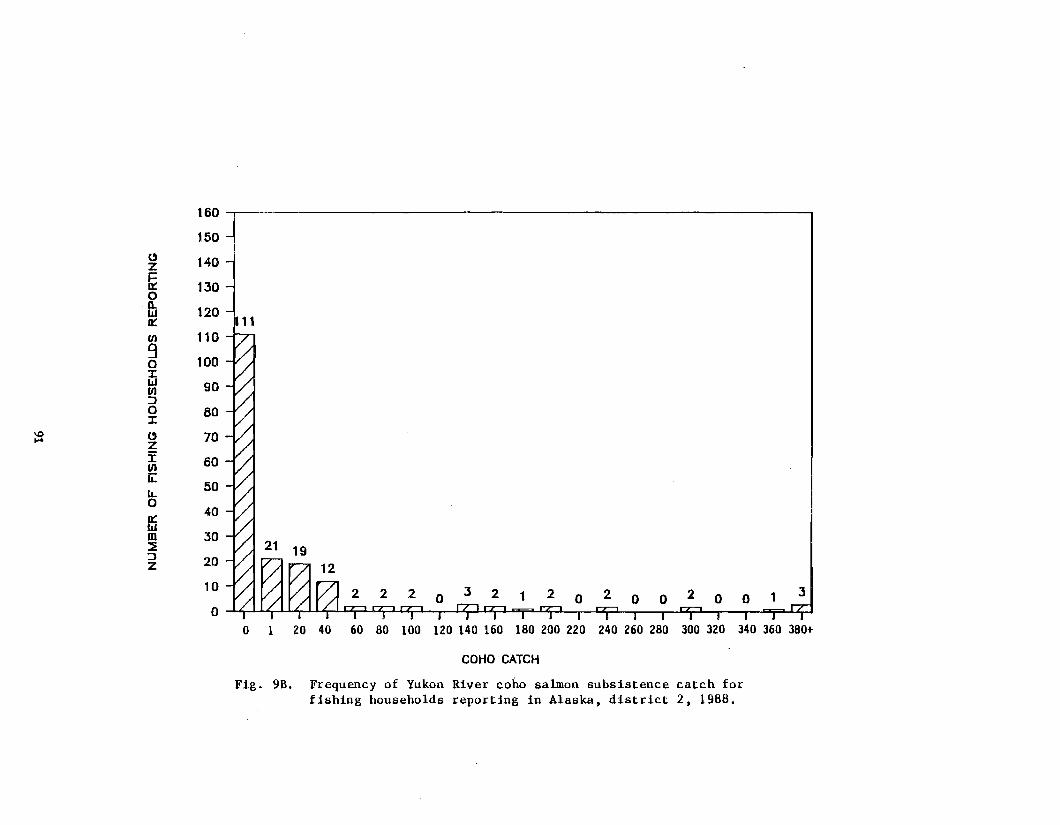
:g
t'Z
~o0..WIt:Ul
9o:z:wUl::Jo:z:t'z:EUlIi:l1.offim::i:::JZ
160
150
140
130
120 p11110
100
90
80
70
60
50
40
30
20
10
0o 1 20 40 60 80 100 120 140 160 180 200 220 240 260 280 300 320 340 360 380+
COHO CATCH
Fig. 98. Frequency of Yukon River coho salmon subsistence catch forfishing households reporting in Alaska. district 2. 1988.
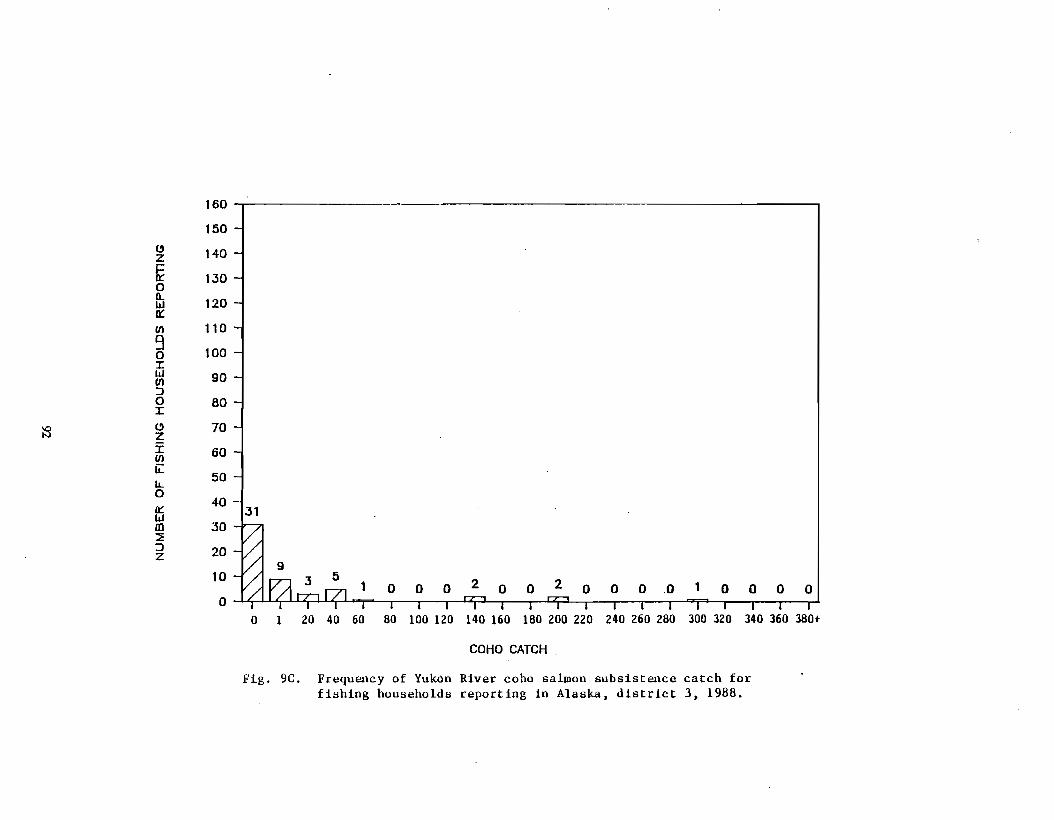
is
uz~on..w0::VI
9o1:WVI:Jo1:
UzIVIii:ILoIt:wm:JZ
160
150
140
130
120
110
100
90
60
70
60
50
40131
30
20
10
0a 1 20 40 60 80 100 120 140 160 180 200 220 240 260 280 300 320 340 360 380+
COHO CATCH
Fig. 9C. Frequency of Yukon River coho salmon subsistence catch forfishing households reporting in Alaska, district 3, 1988.
~
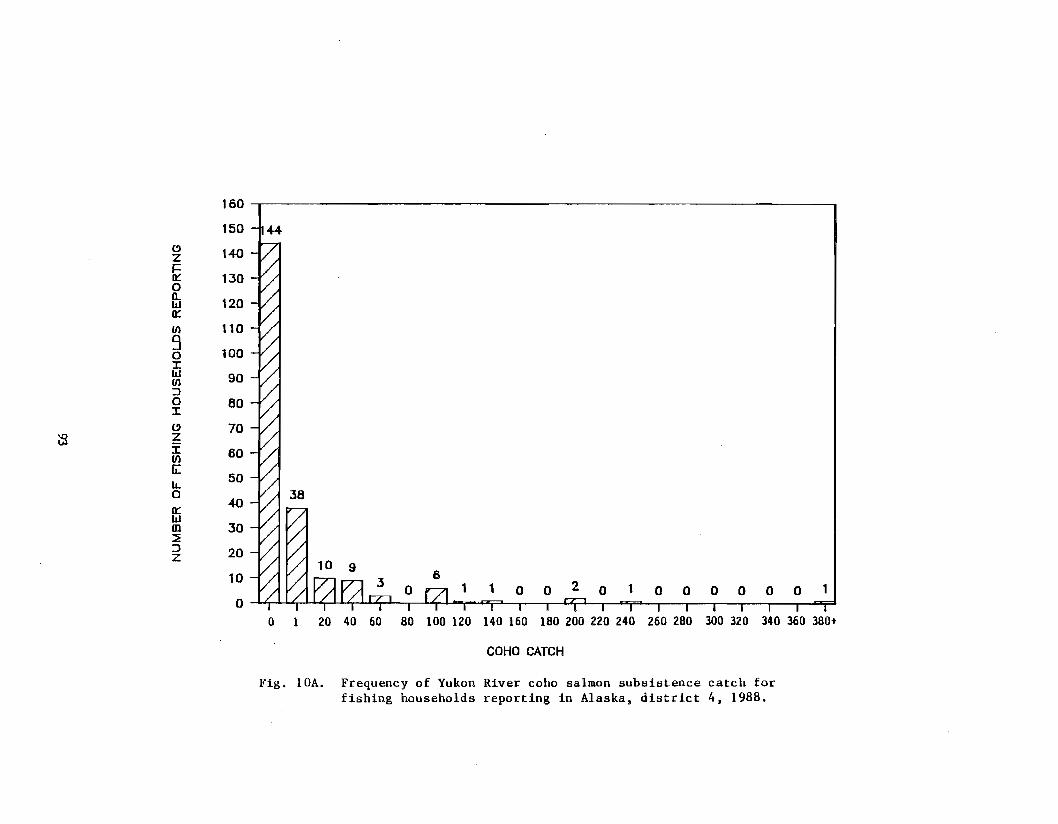
:::s
zfioa.w0::U)
9oIWU):JoI
zIU)
Ii:11.o0::wm:iE:JZ
160
150
140
130
120
110
100
90
80
70
60
50
40
30
20
10
0o 1 20 40 60 80 100 120 140 160 180 200 220 240 260 280 300 320 340 360 380+
COHO CATCH
Fig. IDA. Frequency of Yukon River coho salmon subsistence catch forfishing households reporting in Alaska, district 4, 1988.
~ ~
~
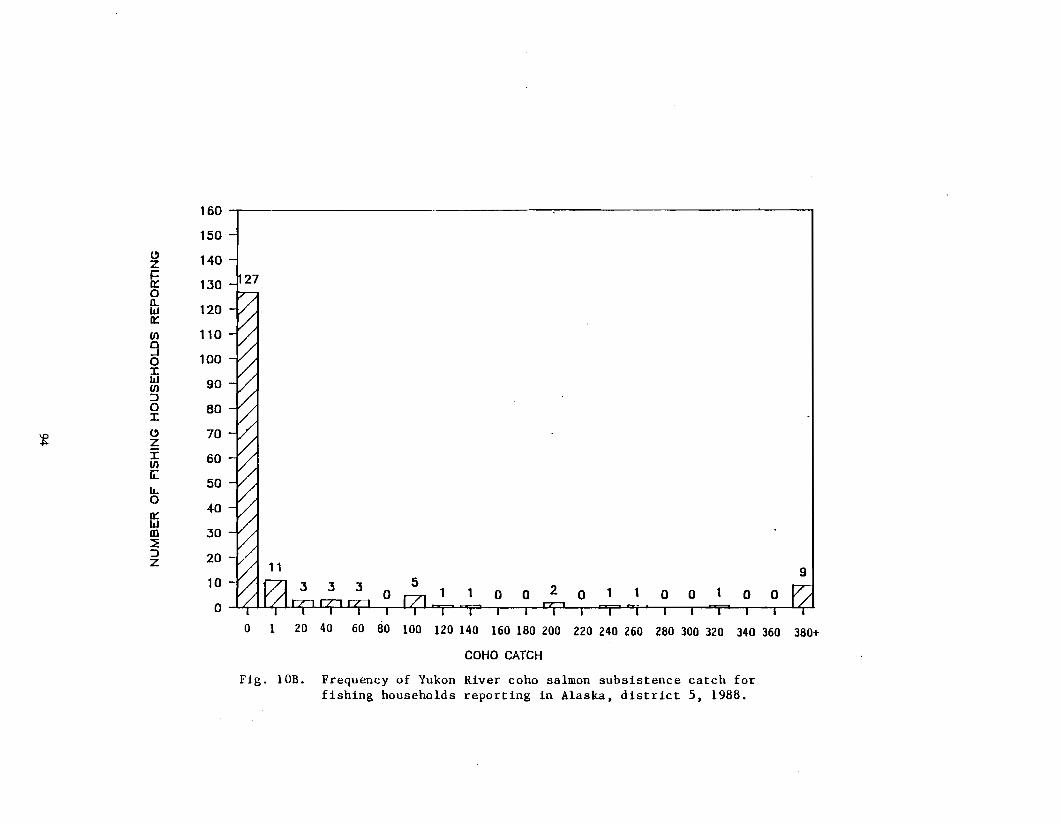
"z~oQ.WIt:If)
9oIWIf):loI
"zIIf)
Ii:ILoIt:wm:lZ
160
150
140
130 J27
120
110
100
90
80
70
60
50
40
30
20
10
0
o 1 20 40 60 80 100 120 140 160 180 200 220 240 260 280 300 320 340 360 380+
COHO CATCH
Fig. lOB. Frequency of Yukon River coho salmon subsistence catch forfishing households reporting in Alaska. district 5. 1988.
~
~
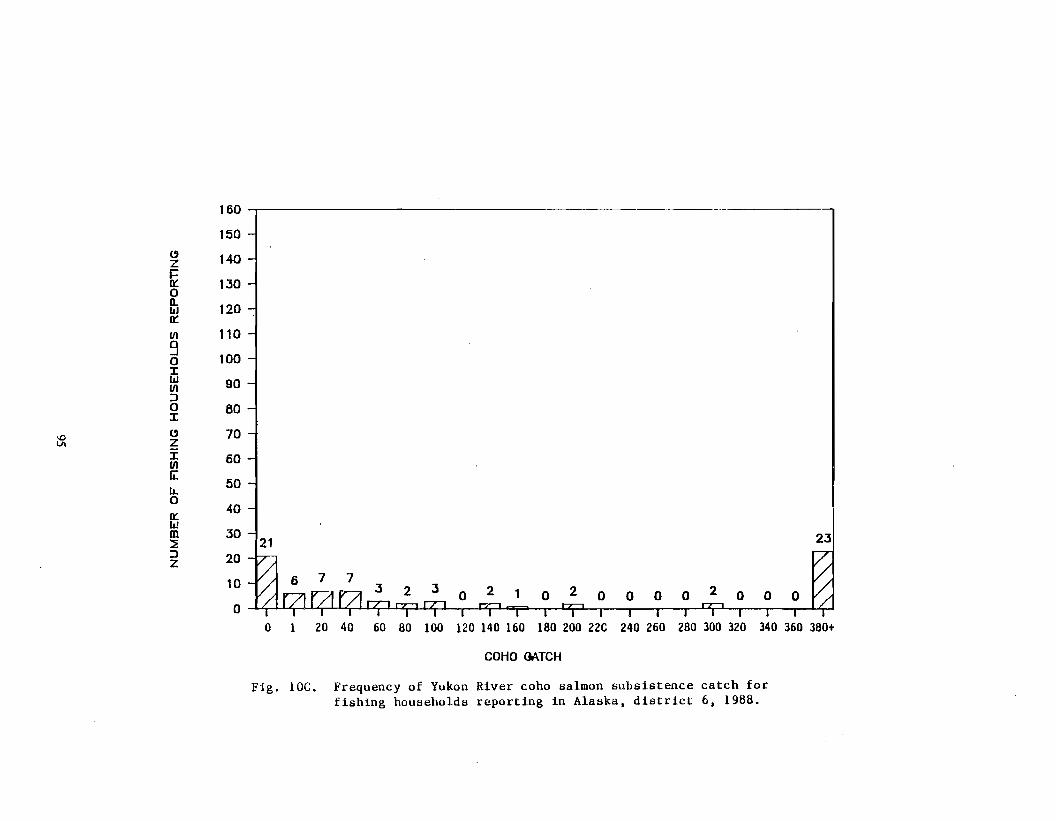
160
150(}
140zJ=
130an.
120w
I/) 1109
100aIw 90I/)
:>a 80I
ID(} 70
UI zi: 60(/)
ii:l1.
50a
40wm 30:::E 121::> 20z
10
0
0 1
23
20 40 60 80 100 120 140 160 180 200 22C 240 260 280 300 320 340 360 380+
COHO <lATCH
Fig. lOCo Frequency of Yukon River coho salmon subsistence catch forfishing households reporting in Alaska, district 6, 1988.
~
~
~
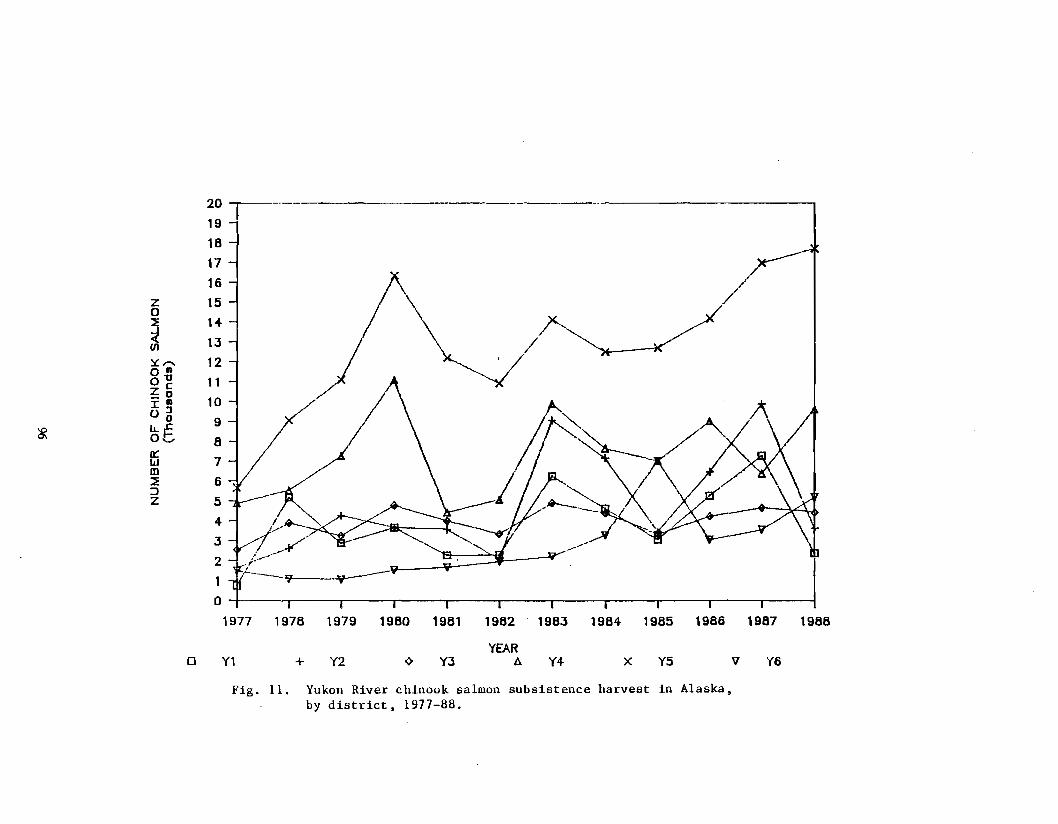
YBv
7l//
Y5xY4
J'./
/
YEARA
1982 1983 1984 1985 1986 1987 1988
20 -,19
18
17
16z 15a
~14
13UI
~'"' 12a 11a"O 11ZC_010J: I)
0::J0 9LL..c
at 80:::
7wm::E B:JZ 5
4
3
2
1
0
1977 1978 1979 1980 1981
0 Y1 + Y2 Y3
Fig. 11. Yukon River chinook salmon subsistence harvest in Alaska,by district, 1977-88.
~
~
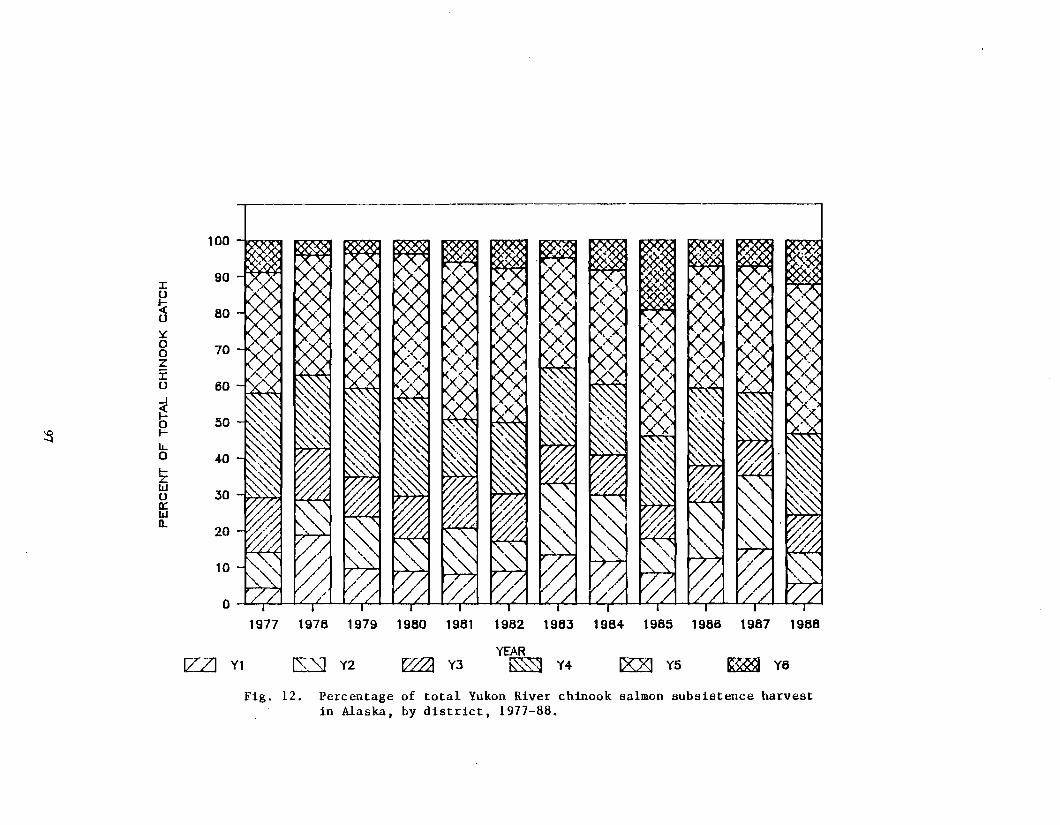
J:U
U
oozIu-I
~gIL..ozwUIt:W0..
100~
90
80
10
60
50
40
30~
20
10
o I L if I 'C if , I { II I I < I' I I,' ,< I ,< ,£ I I < Ie J I < if I I ( if I '< Ie I I < If I I < IE I
1911 1918 1919 1980 1981 1982 1983 1984 1985 1986 1981 1988
IZZJ Y1 lSSJ Y2 Y3YEAR
Y4 Y5 Y6
Fig. 12. Percentage of total Yukon River chinook salmon subsistence harvestin Alaska) by district) 1977-88.
~
~
~
~
~ ~ ~ ~
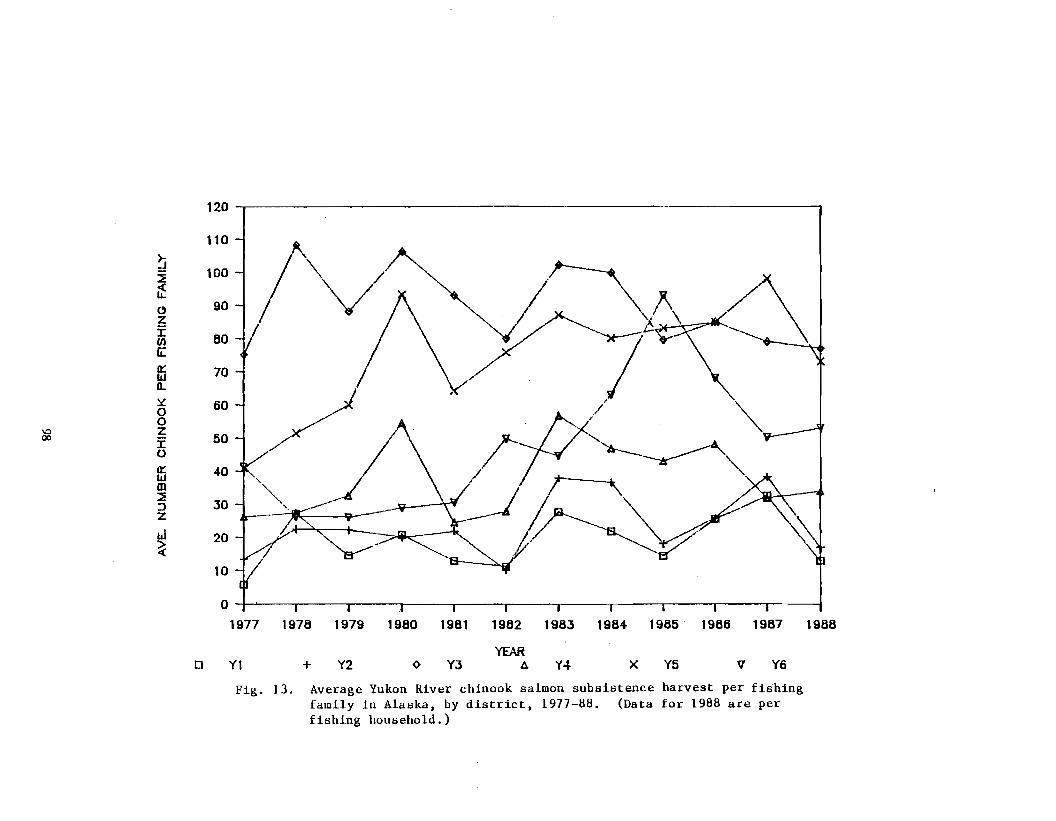
120
110~
100
//VI\~~~6it90
zi 80(J)
rL0::: 70wQ.
6000
'D Z50(Xl i
0
0::: 40wm
:30::>zaJ~
1977 1978 1979 1980 1981 1982 1983 1984 1985 1986 1987 1988
YEAR0 Yl + Y2 Y3 A Y4 X Y5 V Y6
Fig. 13. Average Yukon River chinook salmon subsistence harvest per fishingfamily in Alaska. by district. 1977-88. (Data for 1988 are perfishing household.)
~ ~
~
~
~
~
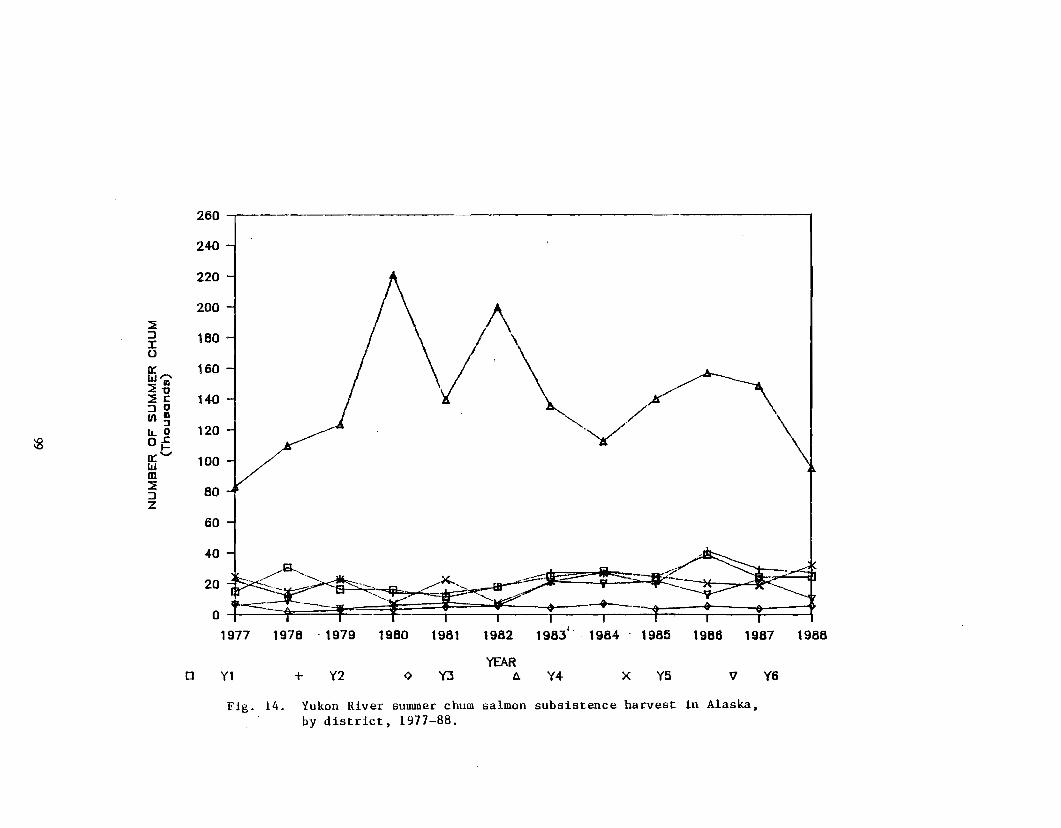
Y6vY5xY4
/\/.\ //\
. "-.·V
Y3¢
1980 1981 1982 1983'"· 1984 1985 1986 1987 1988
YEARDo
260
240
220
200
:::l 180J:0
0: 160W""'::E DI
::E-g 140:::l 0Ul":J
12011..0Of:0:'"" 100wm::E 80:::lZ
60
40
20
0 .1977 1978 . 1979
0 Y1 + Y2
Fig. 14. Yukon River summer chum salmon subsistence harvest in Alaska.by district. 1977-88.
~
~
-
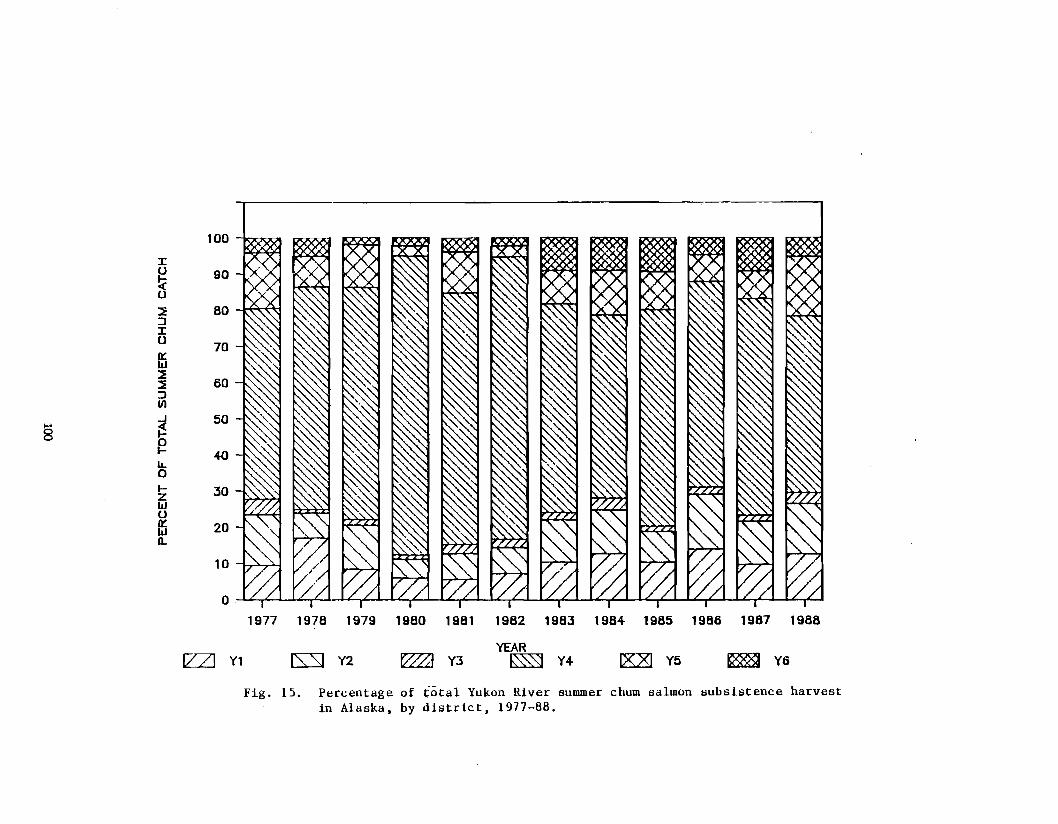
100
J:0
~90
0
::t 80::lJ:0
ffi70
::t::t 60::lfI)
§...J 50
~11.
4()
0
30w0Ir:W 20n.
10
1977 1978 1979 1980 1981 1982 1983 1984- 1985 1986 1987 1988
YEARlZ.Zl Yl rs=sJ Y2 Y3 Y4 LKZl Y5 Y6
Fig. 15. Percentage of ~otal Yukon River summer chum salmon subsistence harvestin Alaska. by district. 1977-88.
~
~
~ ~ ~
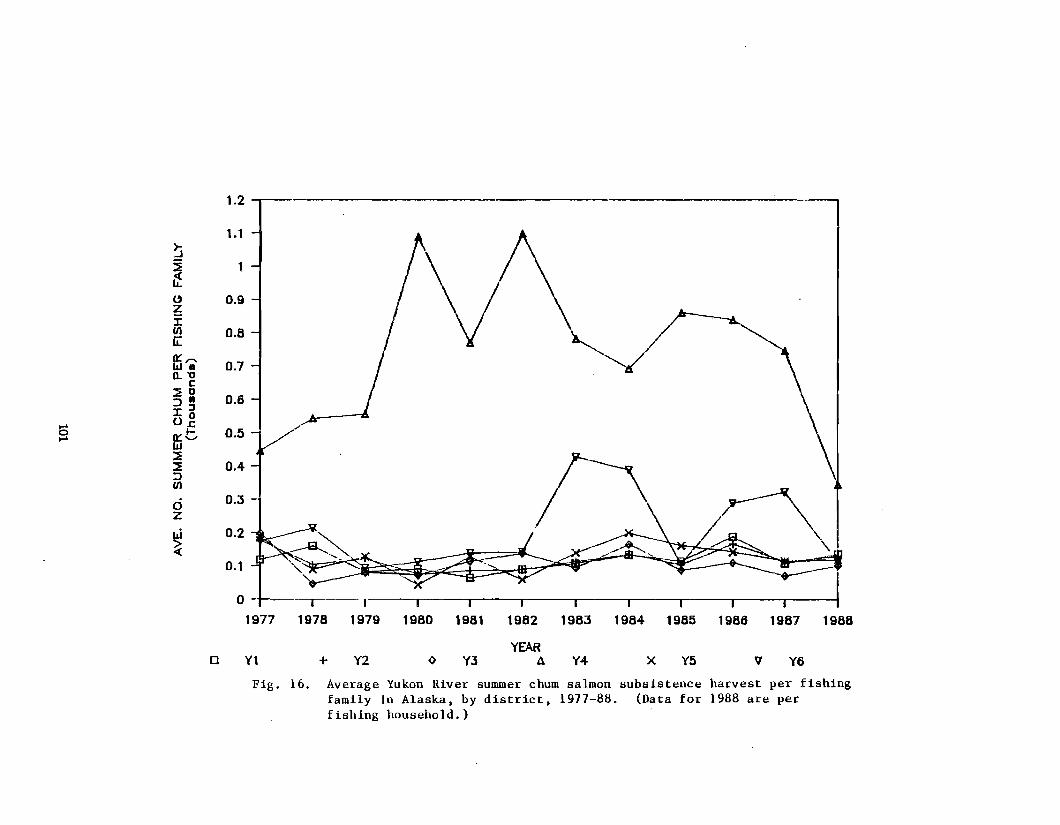
I
1988
Y6v
~
Y5x
1984 1985 1986 1987
Y4
~
19831982
YEARAY3Y2+
?/~
Y1o
1.2
1.1
1itC) 0.9zJ:Ul 0.8Ii:0::,....
0.7WI!0.-0
C~D
0.6::J-I:J
bO~
.... o::t 0.5W::'l::'l 0.4::JUl
a 0.3zW 0.2
~0.1
0 .1977 1978 1979 1980 1981
Fig. 16. Average Yukon River summer chum salmon subsistence harvest per fishingfamily in Alaska. by district. 1977-88. (Data for 1988 are perfishing household.)
~ ~
~
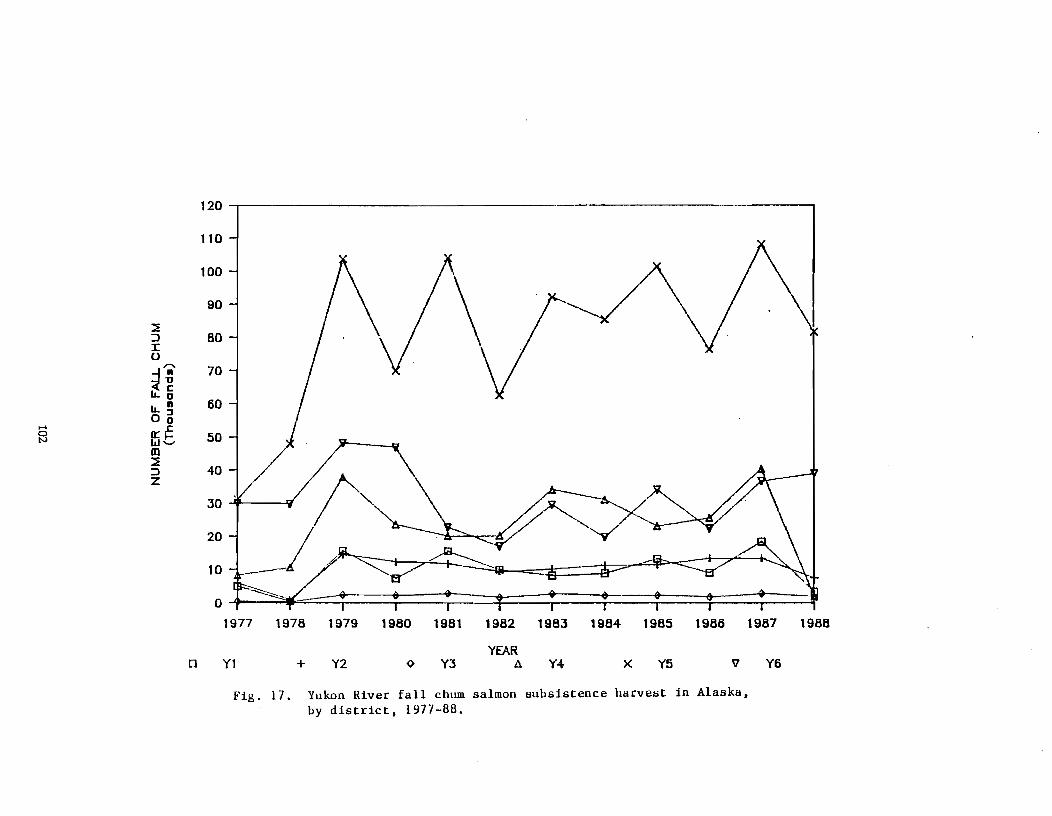
Y6vY5xY4
1982 1983 1984 1985 1986 1987 1988
Y~R
AY3<>Y2+
1978 1979 1980 1981
i i120
110
100
90
:J 80::r:u
gI 70
60IJ...IIO~.... n:.LS we 50m::!:
40:JZ
30
20
10
0
1977
0 Yl
Fig. 17. Yukon River fall chum salmon subsistence harvest in Alaska.by district. 1977-88.
~
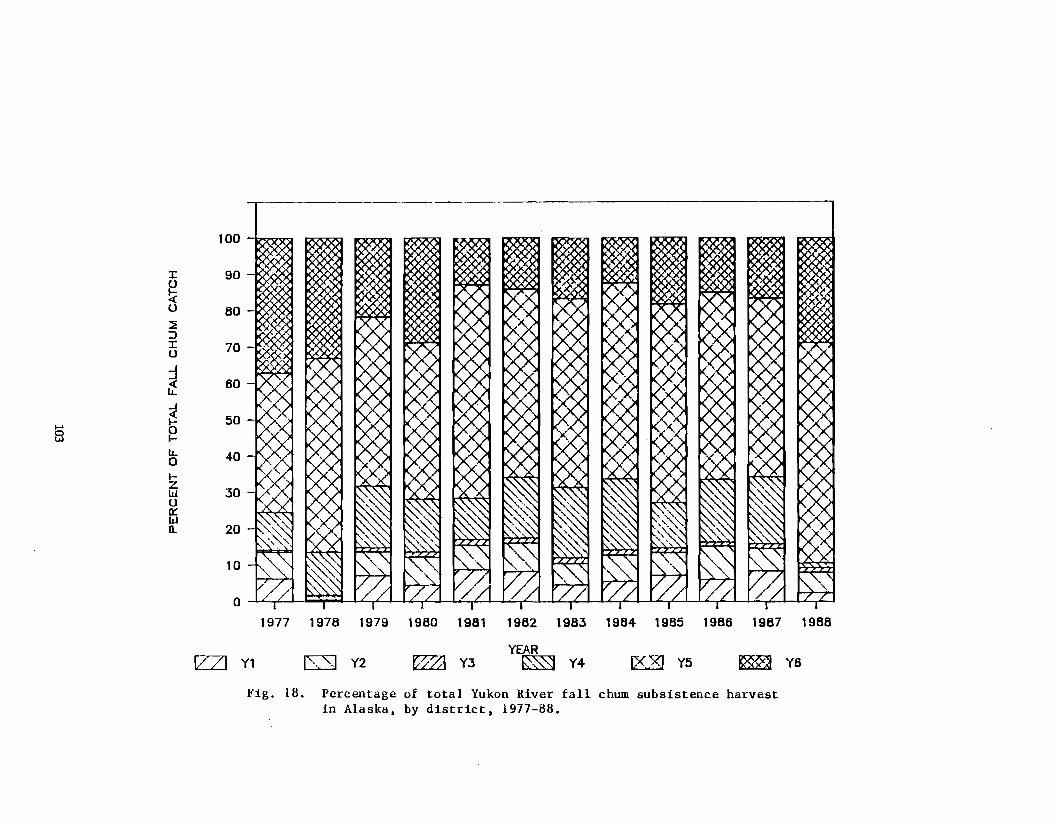
·~.;l';.x..<
a 1/ ,/ I C3("TI 1/ / I 1/ L I I" / I / I ILL I 1/ L I I L / I 1/ L I / I 1/ / Ia I iii i I I I I
40
10
60
90 --KXiVQ(
50
20
70
80 -Q",,)QOO
30
100 b.,o.,..
IU
U
:::i:::>IU
::1if....J
glL.oIZWUQ:Wn.
53
Y6IZ:3l Y5Y3ts=Sl Y2
1977 1978 1979 1980 1981 1982 1983 198419851986 1987 1988
YEARY4IZZI Y1
Fig. 18. Percentage of total Yukon River fall chum subsistence harvestin Alaska, by district, 1977-88.
~
~
'" '"
~ ~ ~
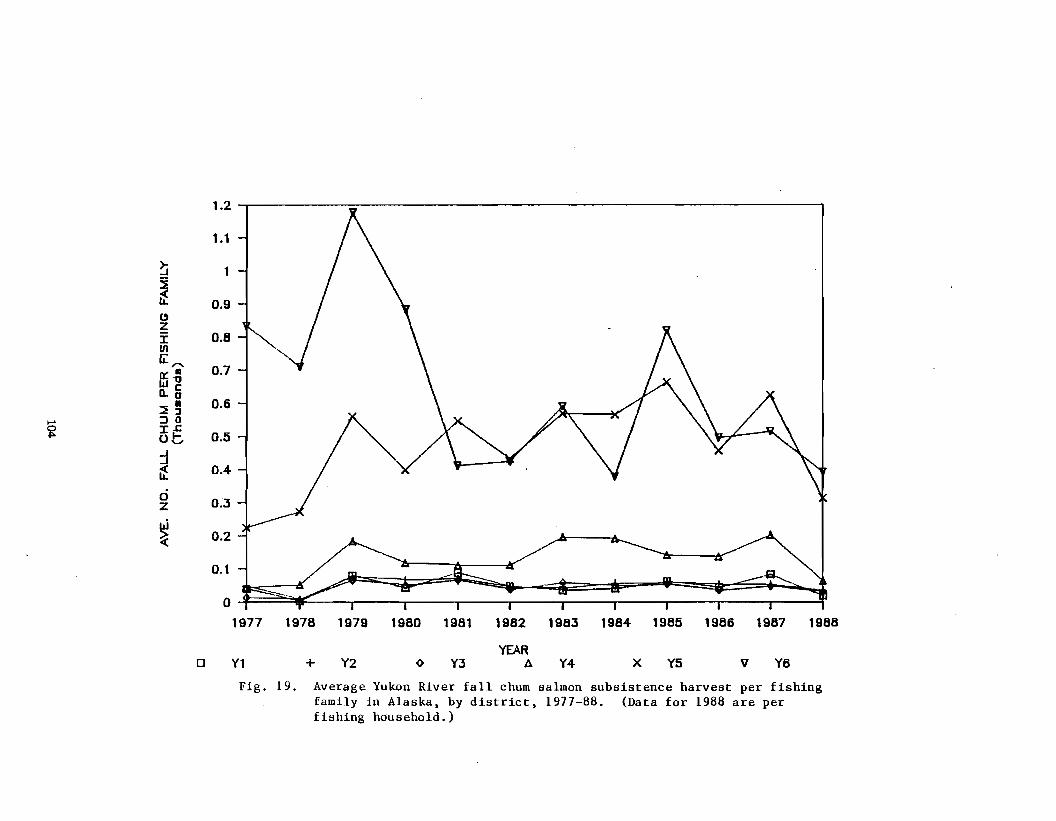
Y6vY5xY4
1982 1963 1964 1965 1986 1987 1966
YEARAY3Y2+Y1o
1.2
1.1
1
~ 0.9()zI 0.8Ulfi:,...
0.7It: IIw"O1L.5
0.6:::E~...... ::>0
I.e0.5Ot,
:Iit OA-
e 0.3z
~ 0.2
0.1
0
1977 1978 1979 1980 1981
Fig. 19. Average Yukon River fall chum salmon subsistence harvest per fishingfamily in Alaska. by district. 1977-88. (Data for 1988 are perfishing household.)
~
~
~
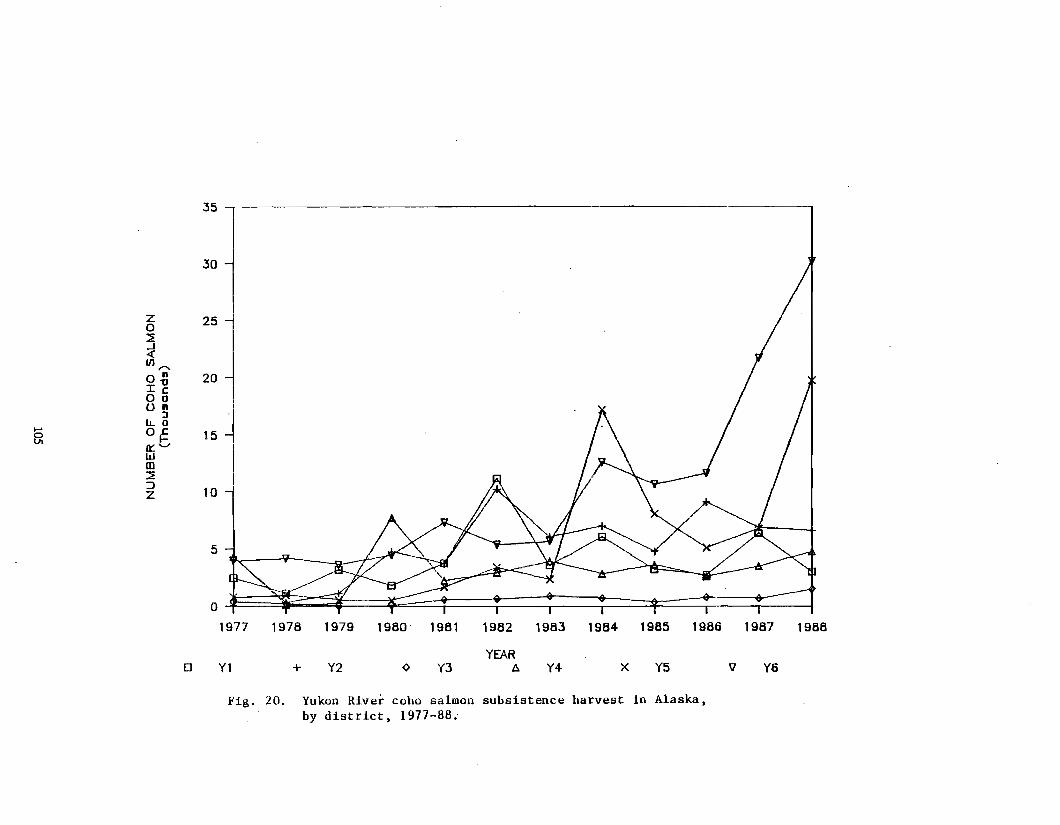
35 ~i-------------------li
30
z 250
..J«Ul",OUI 20I-go 0011
:JlLO...... o.c 15I-n::'-"wm:J
10Z
5
0 .1977 1976 1979 1960 1961 1962 1963 1964 1965 1966 1967 1966
YEAR0 Yl + Y2 '(3 A Y4 X Y5 'il Y6
Fig. 20. Yukon River coho salmon subsistence harvest in Alaska,by district, 1977-88;
~
~
~
~
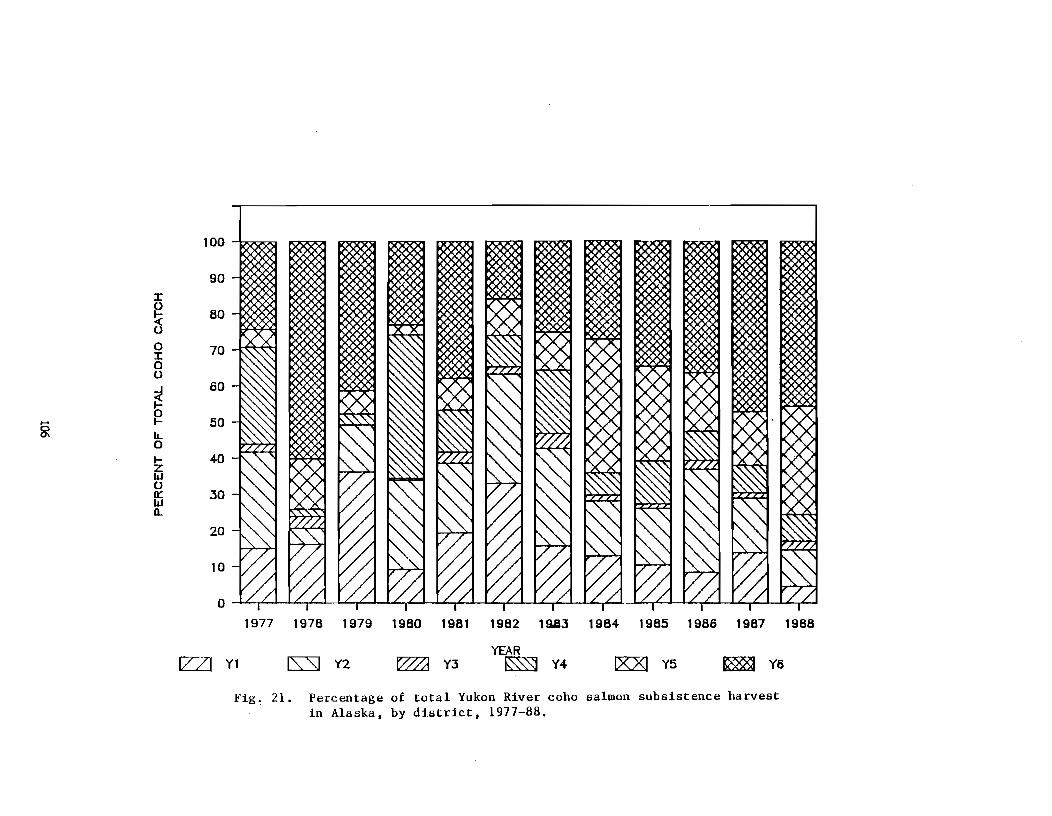
Y6IXZl Y5
1982 19.B3 1984 1985 1986 1987 1988
YEARY4
100
90:r0
80~0
0 70:r00
~60
0I- 50IL0I- 40zw00: 30wa.
20
10
01977 1978 1979 1980 1981
IZZl Yl IS::SJ Y2 Y3
~
Fig~ 21. Percentage of total Yukon River coho salmon subsistence harvestin Alaska. by district. 1977-88.
~ ~~
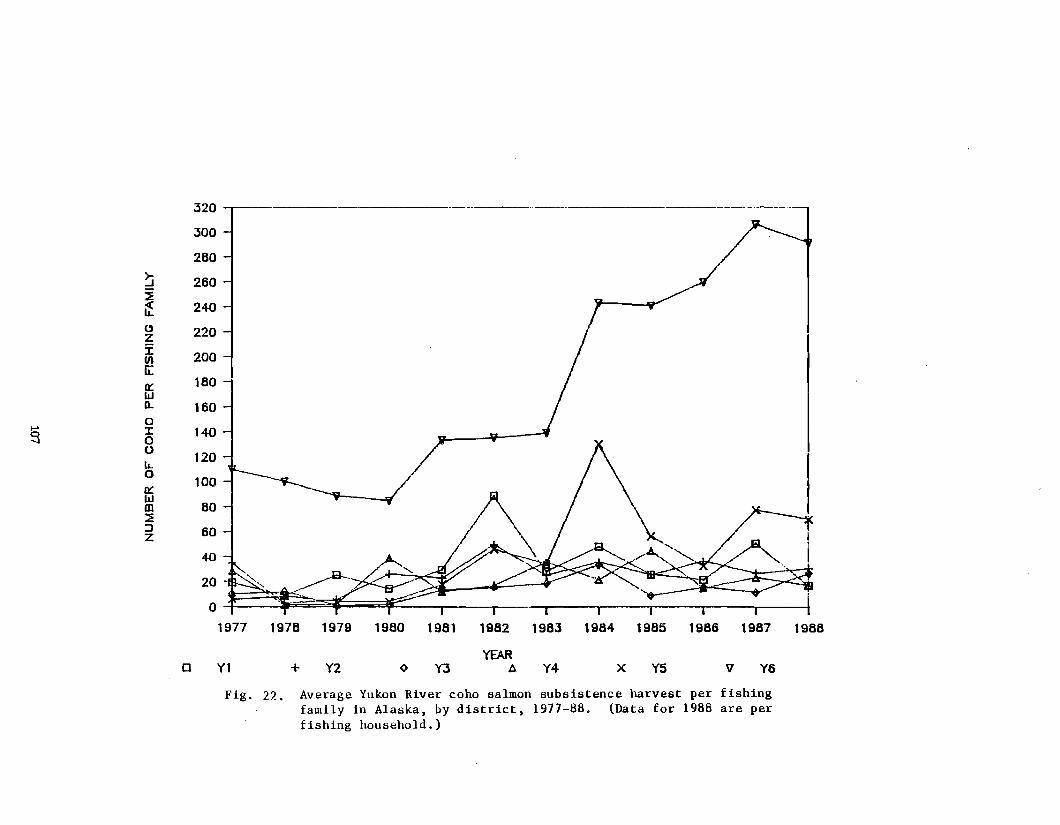
320
300
280
260j~ 240
Cl 220zI 200Ul[L
0:: 180wn. 160a
§ :r: 14000
120lL0
1000::W
80m:::E:J 60Z
40
20
0 .1977 1978 1979 1980 1981 1982 1983 1984 1985 1986 1987 1988
D Yl + Y2 <> Y3YEAR
A Y4 x Y5 v Y6
Fig. 2?. Average Yukon River coho salmon subsistence harvest per fishingfamily in Alaska, by district, 1977-88. (Data for 1988 are perfishing household.)
~
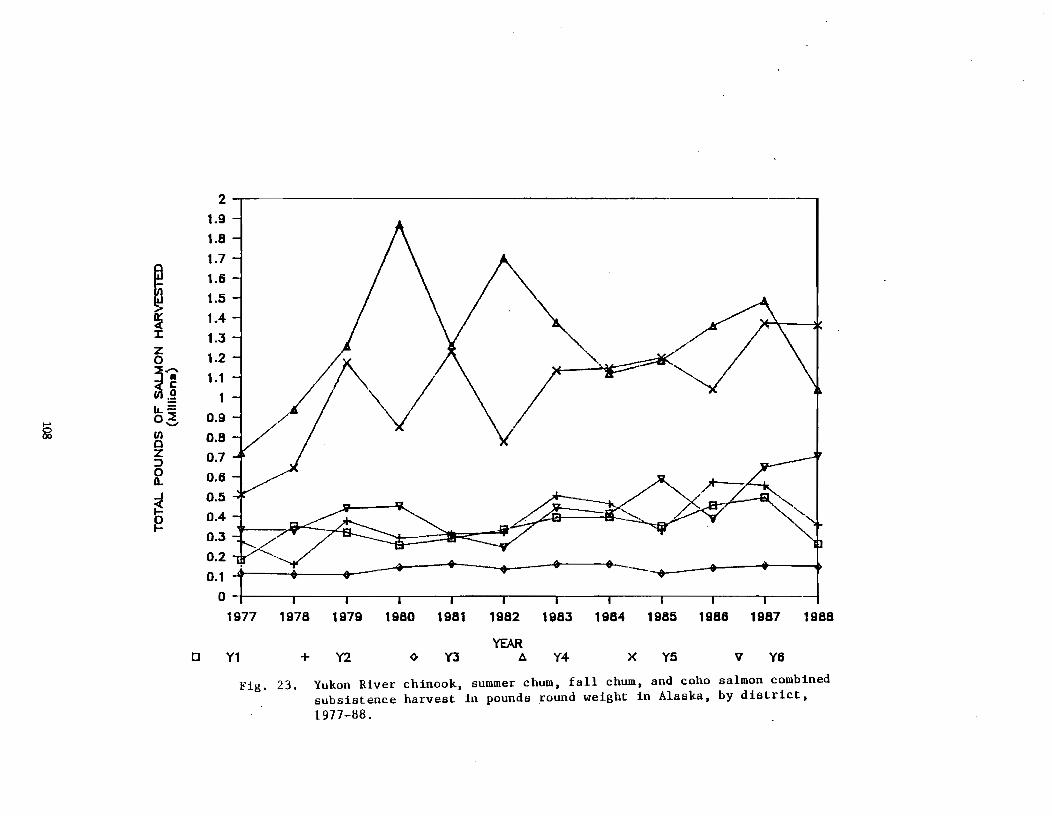
Y6vY5xY4
1982 1983 1984 1985 1986 1987 1988
A
21.91.81.7
I1.61.51.4-
1.3z 1.20
~1 1.11LL=0::;: 0.9......,
II) 0.8az 0.7:l0 0.6Q.
~0.5
~OA0.3
0.20.1
0 . . . .1977 1978 1979 1980 1981
0 Yl + Y2 Y3
@
Fig. 23. Yukon River chinook, summer chum, fall chum, and coho salmon combinedsubsistence harvest in pounds round weight in Alaska, by district,1977-88.
~ ~
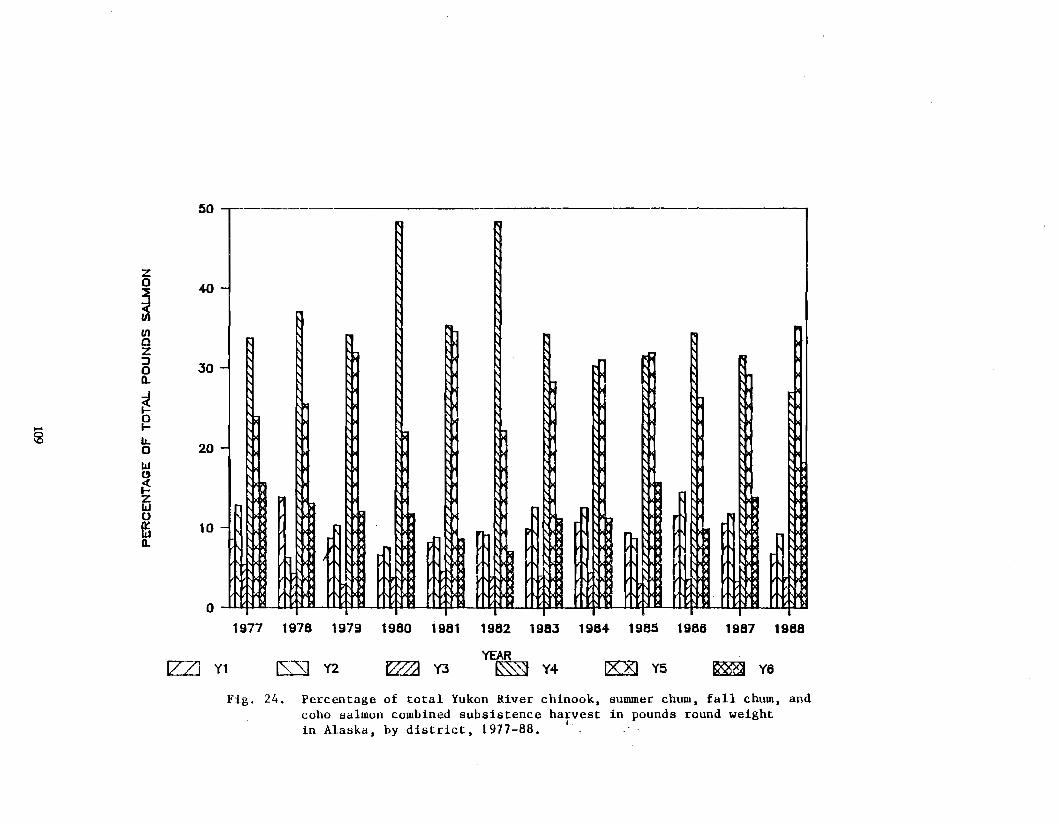
50
za 40
~I/)ClZ:J
30an.
~~
~ I.L20a
w
~zw0
10wn.
o
-
-
-
-
I
r1977 1978 1979 1980 1981 1982 1983 1984 1985 1986 1987 1988
[ZZJ Y1 rs:sI Y2 IZZ) Y3YEAR
Y4 IX21 Y5 Y6
Fig. 24. Percentage of total Yukon River chinook. summer chum. fall chum. andcoho salmon combined subsistence ha~vest in pounds round weightin Alaska. by district. 1977-88. .
~
~
~ ~
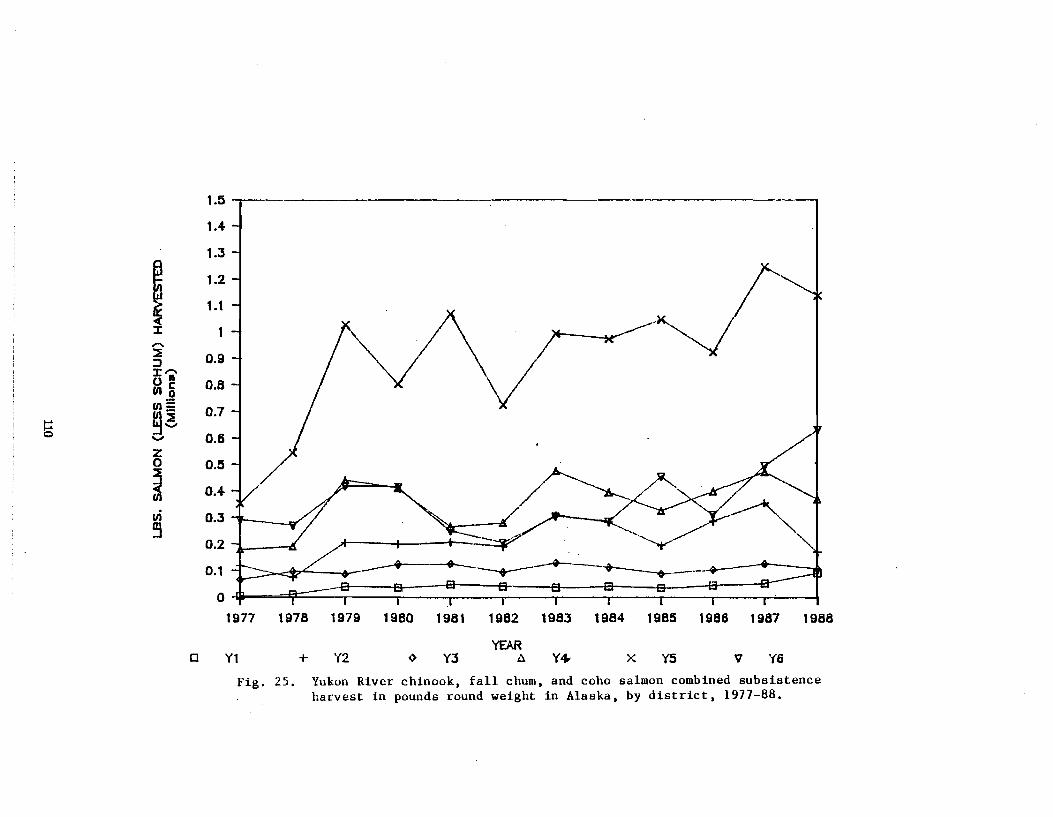
Y6vY5xY4-
1982 1983 1984 1985 1986 1987 1988
A
~,/V "-.j
Y3
1980 1981
----+---+----.---. --+-----...---~
'(2+Yl
1.5 ,'-------------:-----
1.4-
1.3
1.2
1.1
0.9
0.8
0.7
0.6
0.5
0.4-
0.3
0.2
0.1
0 .1977 1978 1979
o
I,...:JJ: .......o·Ul e
0UI=.... ~!
'"'z0
~vi
Fig. 25. Yukon River chinook, fall chum, and coho salmon combined subsistenceharvest in pounds round weight in Alaska, by district, 1977-88.
~
~
~
~ ~
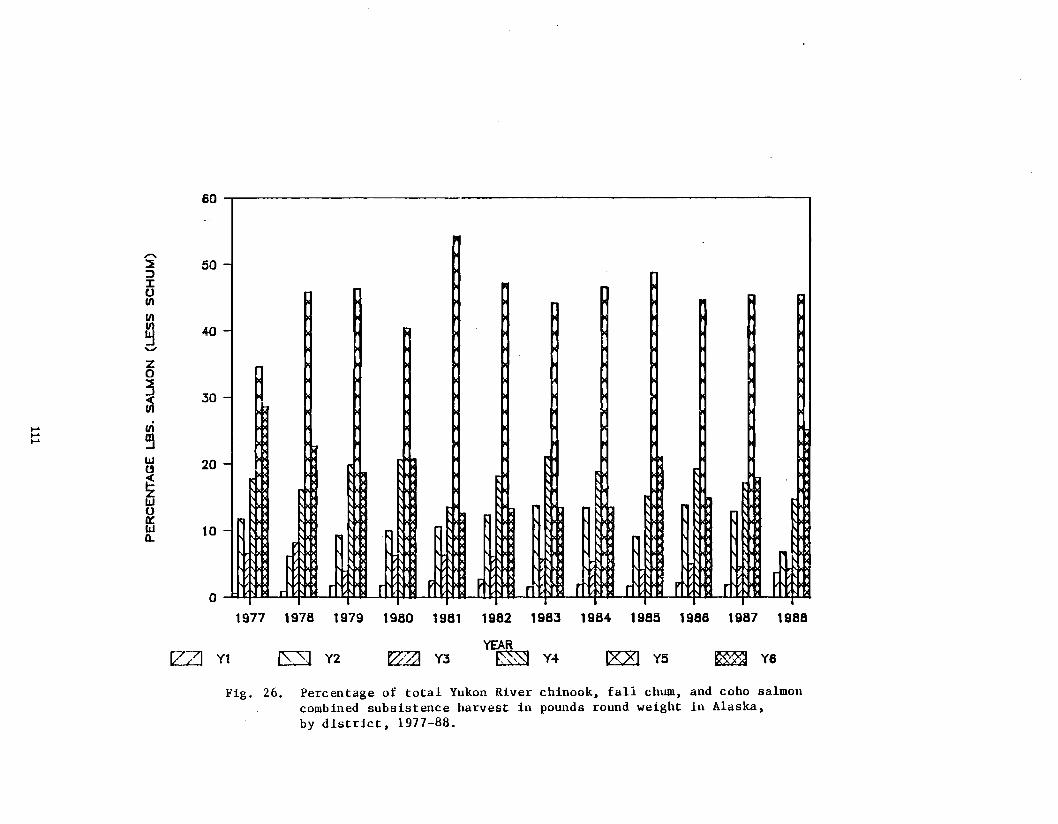
60
,......50
::>1:0enenen 40-Z0
3 :50~
l-' enl-'
~l-'
W 20l'
~W0It:W 10n.
o
-
-
-
-
-
.. r r f f r r r f r f
YB[Z.:81 Y5Y3Y2
1977 1978 1979 1980 1981 1982 1983 1984 1985 1986 1987 1988
YEARY4lZZl Yl
Fig. 26. Percentage of total Yukon River chinook. fall chum. and coho salmoncombined subsistence harvest in pounds round weight in Alaska.by district. 1977-88.
~
~
~ ~ ~ ~
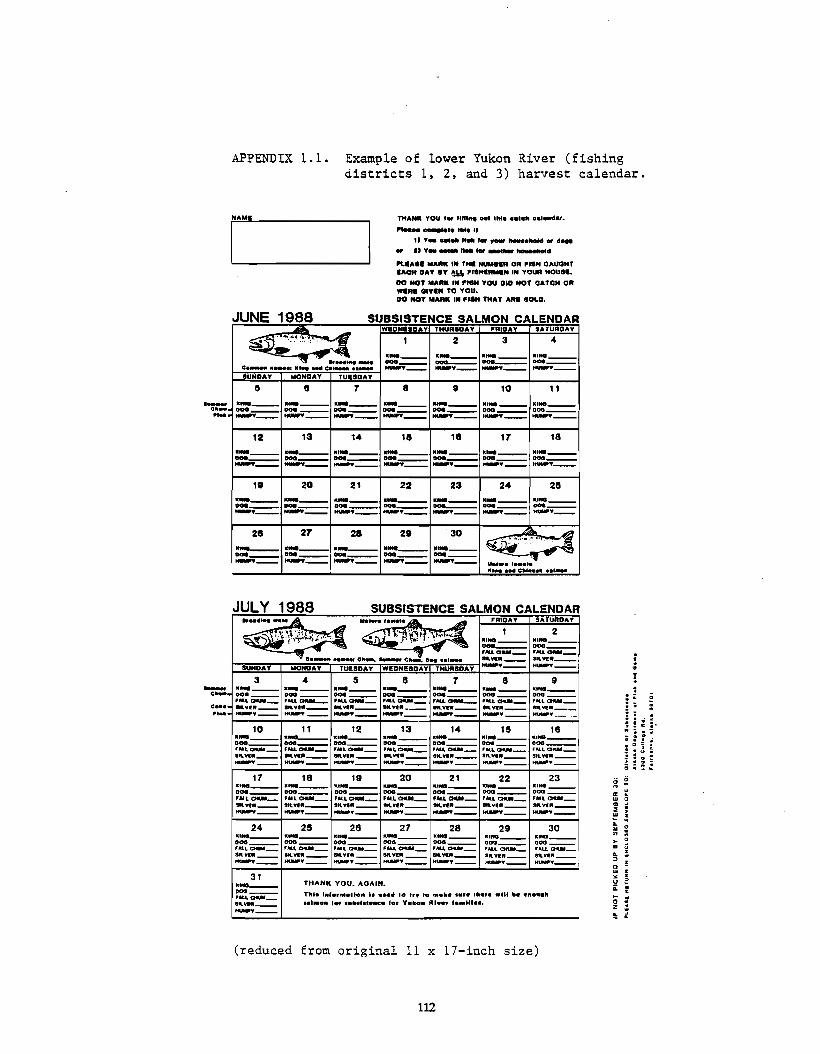
APPENDIX 1.1.
JUNE 1988
Example of lower Yukon River (fishingdistricts 1, 2, and 3) harvest calendar.
1MANIC YOU r. fin ..... 0..... ca'endar•
....._01. ,,_ , ,., d...
., I)Y_ d
"'-UI. "A"K IN T'" _It 0lIl P1IH CAUQHTIACH DAY.Y FI.... ...N IH YOU" HQUS••
DO NOT "A"" IN P1SH YOU DID NOT CATCH 0"WIlli GIYIN TO you.DO NOT "A"" III FISH THAT AIlI SOLD.
SUBSISTENCE SALMON CALENDARWIlDN_SDAY THURSDAY FRIDAY SATURDAY
234~r"'~" AIl. "';'=:m.""\'\!!I '::P
0...........1 .'" .... e __ SUNDAY MONDAY TUISDAY
._-------- ._--- ._--- .,..._--____ 000 DOCI _
NUIIPV ~" ~"
15 II T 8 a 10 11
t_ ._--- ._--- ._--- ._--- ....._-- ._--- .,...._--c_ ....._-- ---- ---- ---- ---- DOCI ___ DOG ___
.,".--- --------- --- -y-- ---12 13 14 15 15 17 18
----.-- ._--- ._--- ._--- ......_-- .,..._------ ------ DOCI___ ---- ---- ------- --- _._- --------- _._-111 20 21 22 23 24 25._--- ....._-- ....._-- ._--- ....._-- ._--- .,..._--....._-- ---- ---- ---- ---- ---- ------- -y-- _._- --- --- _._-211 27 28 211 30 -<ill Ill. Ll1
~.,... "", ...-- ._--- ---- ._--- ._-----:~
DOCI___ ---- ---- ---- ------- ------ --- _._-...... f •••••1II1....... e...........__
JULY 1988 SUBSISTENCE SALMON CALENDAR
._--- .,...._---------"'u. a .. , ...... a«M_
SM..,." _""lit~. ........
FRIDAY SATURDAY
2
3 4 5 8 7 8 9- ....._-- ._--- ._--- ._--- ._--- ._--- .,..._--c_. 0"' ___ ---- ---- ---- ---- ---- DOG ___
c••••.....lD4Wl_ ...... ClMI-- '''1.0-._ 'AlLc::HM_ 'AU.0tIM_ "M.La--_ 'ill" 0tUlt_.....,.,,-- ......,,-- ......R__ .....,,--- """R__ ......R__ l!Itl'l1!"__ ... -y-- -y-- .....y-- -y-- -y-- -y-- ~"'-_....
,;
10 11 12 13 14 15 18.._---.-.,..._-- .,..._-- .,..._-- .,..._-- IU____ 0
D....___ DOG___ ---- D....___ ---- D....___ DOG ___ ., .... 0-..._ , ..... 0tIM_ F'N.LOtIM_ 'MLow.._ 'Al.La«M_ ..... 0IlaI_ .....LCHUY_ uStt.w:"__ .....R__ ......R __ """R__ ......R__ sn...,,__ stl••,,__
0--- --- _._- _._- H....__ ......_- ......_- 0
17 18 19 20 21 22 23 g 2.,...._-- .,...._-- ....._-- .,...._-- .,...._-- .,..._-- .,..._--...._-- D...___ DOG ___ DOG___ ---- ---- DOG ___ 0:
uL
,U\ c:HtM_ f"'.I.OUI_ '_LOUII_ 'AI..L~_ 'AU. a«.M_ 'M..La«M_ f,tIllQUI_ W.....R__ ."'''-- S","""__ 8,,""11__ ......R__ _ '11"__ !It.Y'I"__ <II_._- ......_- ......_- --- --- --- _._- ::Iw .:...
24 25 28 27 28 29 30..
=w.,..._-- .,..._-- ._--- ....._-- ......_-- .,...._-- ._--- '"DOG ___ DOG ___ ---- Doo ___ ---- DOG___ DOG ___ > i, ..... oa.N_ 'M.\O«M_ ...... CHlM_ ,au04dll_ 'AlL04lM_ "AlL CHtM_ '",u, a«N_ <II
-"'''-- ......R__ ....,.._- .....R __ ......R__ '11."1"__ S1t.V'I!" __ ..-._- ......_- ......_- _._- -._- ......_- ......_- ":; ·31 '" ~._--- THANK you. AGAIN• uii:OOG ___
Thl. Inlor••• f... I•••• to tr, to ............. there .... b.......hP'M.LQiUM_ ... ·..._-- ••1.... IOf ....., •••ac. 'Ot' V.k... RI.... f_.tn••. 0 ·Z ·--- ··(reduced from original 11 x 17-inch size)
112
~ _ ~ .
-~--
~
'
~
"'
'
' '
~ "
' ~
_
-
''
~
~ "
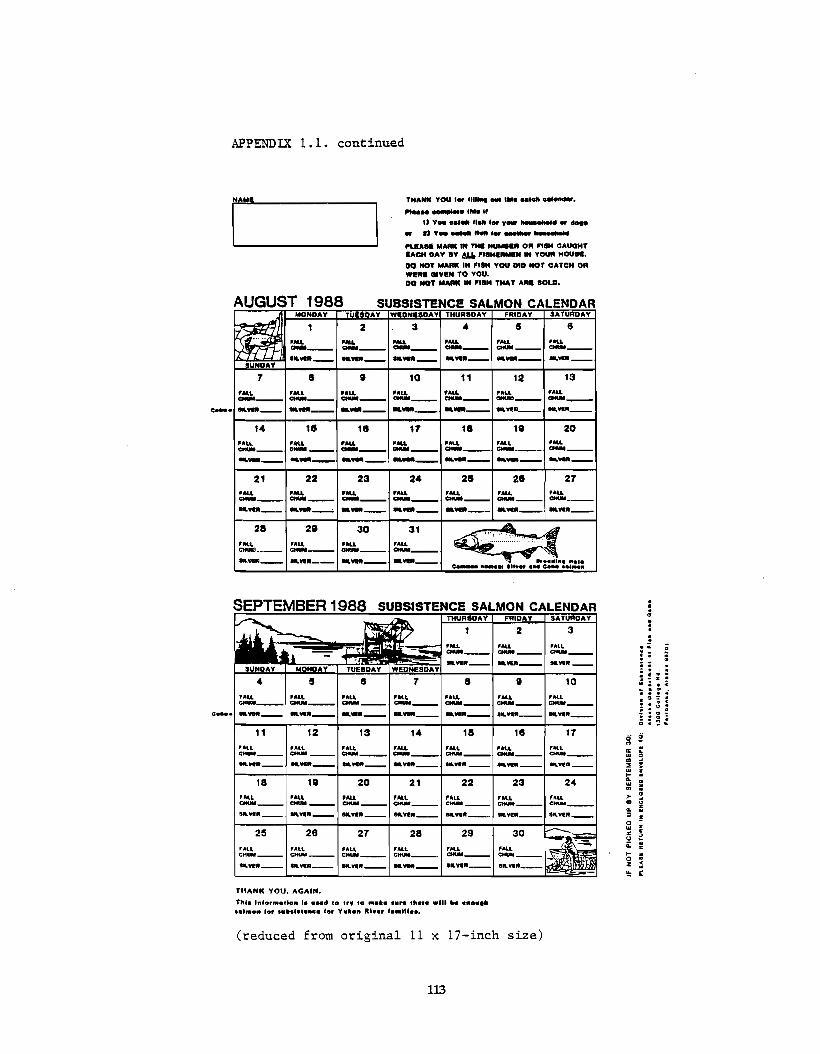
APPENDIX 1.1. continued
['"THANK YOU f.. ttl _ .1Ila _all ...._ ..."..... ,
v alI flu f.. ., ......'Y__ f•• ..
"-SA..... IN _.E" 0" ~'SH CAUGHT'ACH DAY .Y &&. I'lIH'"'''''' IN YOUR HOUlE.00 NOT ...AIIt( IN ~ISH YOU DID NOT CATCH 0"nM ClIVEN TO YOU.DO NOT MAIIt( IN 'IIIM TMAT AM IOLD.
AUGUST 1988 SUBSISTENCE SALMON CALENDAR_MOlloY TUESDAY WEDN.IDAY THURIDAY F"'DAY SATURDAY
1 2 3 4 5 8
~ .- .- .- ...... ...... 'AU....._-- ....._-- ---- ---- CIMI ___ ---T"fi7J, ......._- ......._- ---- ---- ---- ----SUNDAY
7 8 a 10 11 12 13..... 'ALL ,ALI. ...... ...... 'AU 'AU---- ---- ---- ---- CIMI___ ---- ---..._- ---- ---- ---- ---- ...._-- ......,,--
14 18 18 17 18 18 20'AU ...... ..... ..... 'AU ..... '.....---- --- ---- ---- CIMI___ ---- -------- ---- --- -- ---- ---- ----
21 22 23 24 28 28 27..... ..... ...... ...... 'AU ..... ......---- ---- ---- ---- ---- ---- -------- -"'--' ---- _..._- ---- -""-- -""--28 29 30 31
~.... .... ...... ..... ..........•........ •.•••••••• "AI•---- ---- ---- ----...._-- "ftW__ _..._- _..._-0.......... .......... C.........
UU 'ALL 'ALL "AU. 'ALL PAl,L , .....___________________ C _
......,, ......,, """,, ......,, M,.I"
;
·:":···· .·.ifa: u• a• a-·-
3
17
10
24
'ALL
"""'"-...._--
2
9
18
23
30
18
22
29,....----8"YlII__
7
14
28
21
~---' 'M.&. 'Al..---- """'"--......,,-- ...._--
SUBSISTENCE SALMON CALENDARTMU"IDAY F"IDAY SATURDAY
13
20
21
5
18
12
28
18
11
25
'ALL 'ALL 'ALI. 'AU. "u. lAt... 'AUCIMI
""""-- -""-- -""-- ---- ---- ......,,-- ......,,--
'All "'U. 'All. 'AU___ C""" C C _
......,,-- ......,,-- ........_- ......,,--
, AU ,...... nu. 'ALI. 'ALL 'AU 'AlLC""" C"",, C
......,,-- """"-- """"-- """"-- """"-- ......,,-- ......,,--
c.....
TtfANK YOU. AGAIN.
Tht. Infa tlo .. I. .... to ." to ",.k•••r. there .'11 It•••0 ........0. fol' IIC. fo, v Rh,•• f .
(reduced from original 11 x 17-inch size)
113
" ~
' __
_ ~
~
'
= ~
=~~~
"""'" """'" _ =
~
__ __ """" __ __ __
_
"
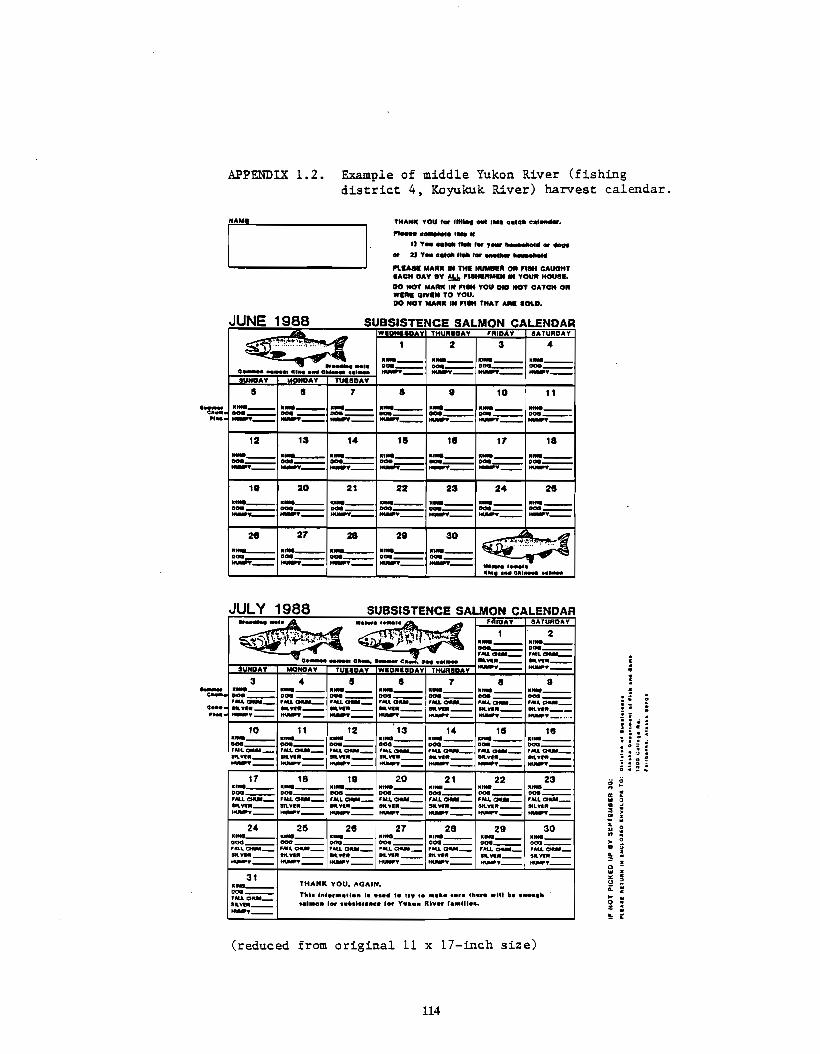
APPENDIX 1.2. Example of middle Yukon River (fishingdistrict 4, Koyukuk River) harvest calendar.
[,---AM'_I THAHll YOU ,. lin........111. 0.1"" oal_.__ ••111."uV....... f.... '.'_ ................• •'Y__II.'.__•
PlIAR MARII IN THI -.. 011 'IIM CAUGHTUGH DAY 'Y !!o!. '._N 1M YOUI' MOUSI.
DO ItOT MAAIl.N "'1M YOU 010 NOT OATOH ORWlR' ClIY,N TO YOU.DO MOT M""" 1M "IM THAT A'" '''''D.
32._--- ._--- ._---DOO .00 '00
NUIIM' ........ .......,._---'00-
SUBSISTENCE SALMON CALENDARW,oH'SoAY THURaoAY 'R.OAY SATURDAY
~:_~\#!;''':::1".... .
0 0
AY HOAY TUnoAY
JUNE 1988
II 8 7 8 10 11
1- ._--- ._- ---- ._--- ---- ._--- ._---c_DOO ___ DOO ___ DOO ___ DOO___ DOO___ DOO ___ DOO ____ .... --- ------------ --- -y--
12 13 14 111 HI 17 18
----.-- ._--- ....._-- ._--- ._--- ._---DOO___ DOO___ DOO___ DOO___ DOO___ DOO___ '00___ --- --- -y-- ------ --- -y--1. 20 21 22 23 24 25._--- ---- ._--- ._--- ._--- ._--- ._---000 ----- DOO ___
000DOO___ DOO___ DOO___ - --- --- ------ -y-- -y--
28 27 25 2. 30 ...A:i!IiL A.-- ._--- ._--- ._--- ._--- ~'''~:':~DOO___ DOO___ DOO___ '00___ DOO___
....-=::' ----- -y-- --- ------ 111...... 0..........
._--- ._---- ...._-'au. CIttIM_ ,It,a.at_......._- _-....., .2
SATUROA'tFRIDAYJULY 1988 SUBSISTENCE SALMON CALENDAR
........ -...:.:A, ...... f.......A., --A~.\\;'" .A ..-:C}1\:'~ ...il~~';:,..~..,~·'f,·· ....;i~~ ~PY~'J,~
~-,,-.. -- :~ "c.- ...... a..... a- c..... D.....__
S HOAY IolOHOAY T W,oHSSoAY THURSDAY
3 4 II 5 7 8 a- ._--- ._--- ._--- ._--- ._--- ._--- ._---c_. ---- '00 ___ ---- DOO ___ DOO ___ DOO ___ '00___
..... CHIM_ ,......-- ''''''0.-_ Fau.a.-_ ,......-- .... OUI_ FM.LCHIM_0••• ......_- ......_- ..._-- ......_- ..._-- ......._- ....._-".... -y-- --------- --- -y-- HUIMP._.....
10 11 12 13 14 15 HI:.._---.-- ....._-- .,..._-- ._--- ._--- ...._--DOO___ '00___ ...._-- ---- 000
DOO___ DOO___ .'''''0-._ 'AlLDIIM_ , ..... 0-._ ,....-- ..... 0IIaI_ 'MA.o.-_ 'MJ.0«8I_ <>....w..__ ......_- ......._- ......._- ......._- ......._- lIft.'fI"__ a--- --- -y-- -y-- --- -y-- -y-- a
17 18 1a 20 21 22 23._--- ._--- ....._-- ._--- ._--- ._--- ._---''''''--- ...._-- ---- ''''''---DOO___ DOO___ DOO___
'" ··'ILlCMWt_ J&U.GtI.M_ r-'U.CIIIM_ '&l.LCI'UI_ , ...... tHIII_ 'M.L 0tlM_ , ..... 0.-_ IU
~......._- ......._- ......._- ......._- ......._- ......._- SIl.vt."__ <D-y-- -y-- --- --- --- --_. -y-- ::I!
24 25 28 27 28 29 30.. ::IU._--- ._--- .,.._-- ._--- .,.._-- ._--- ._--- ..
'00___ DOO ___ DOO___ '00 ___ '00 ___ .00___ ,0<1 ___ >-'''UCHtaI_ 'MLOUlI_ 'AlLOtlM_ 'IIU.CHdI_ 'AlLO«M_ "AU. CH\M_ 'AU, Q4tM_ <D......._- 111...,...__ ""'''-- ......._- ......_- ......._- ...--- ..-'-- --- -y-- ...-y-- -y-- .....y-- -y-- "0
IU ·31 " ~._--- THAN" YOU. AGAIN• uDOa ___ 0:'IU. 04IAI_
Thl. I"'o,•••ta. I...... ta t~y to ......~. th.r••111 til••"_1" .. ·• I.W"__ ••••• '01' ••••'•••H. 'ot' V.k•• Riv., , ...UI••• 0 ·Z ·-y-- ·!!< 0:
(reduced from original 11 x 17-inch size)
114
~
__
'
~
t
~
_
_
__
·
'
__
'
"'
_
_
" ~ ~
~ ~
~ ~
~
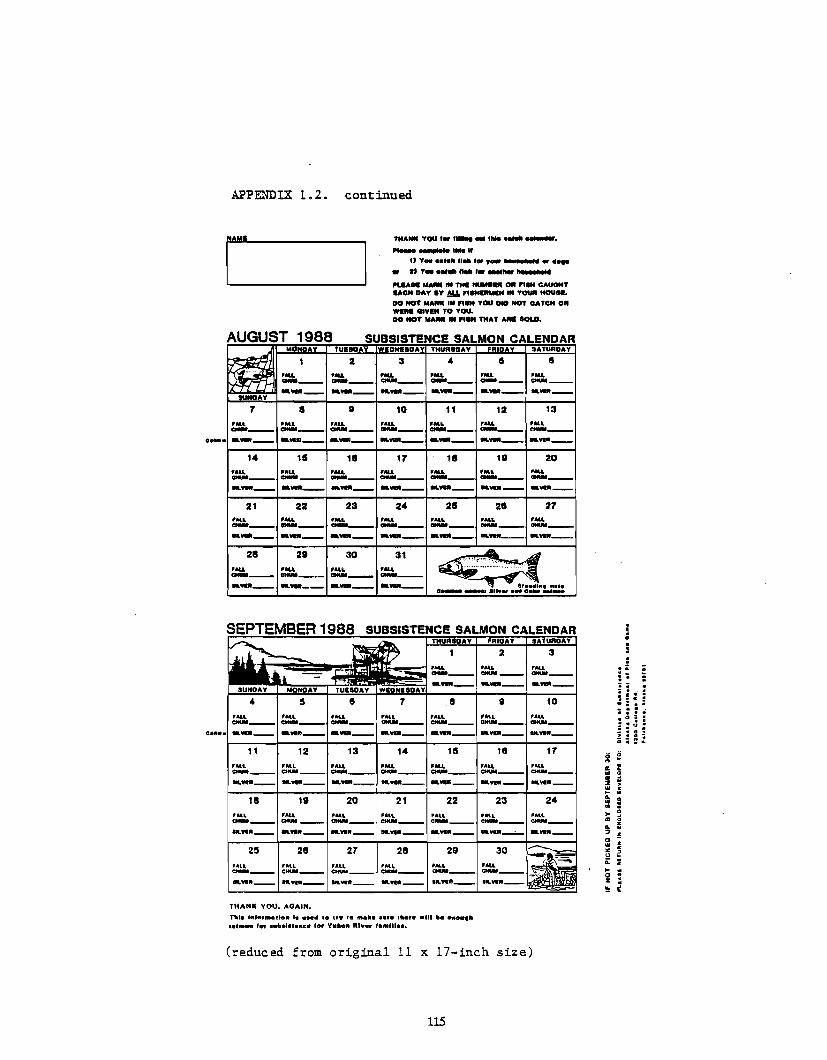
APPENDIX 1.2.
AUGUST 1988
continued
THAIlK YOU ,. .... ..... •
__ e''''''lJY••_'''''.",,__ .~
• ,)Y••_"..... ...."-0__ .. .,... "'-.11 011 ...... CAUGHT
DOH DAY IY au.~._ IN YOIIII HOV...
DO NOT MAlIlIIIN,.... YOU DlD NOT CATCH 011MM OlVIN TO you.DO NOT lie ,... THAT AM 'OI.D.
SUBSISTENCE SALMON CALENDAR
._.
NDA TUU AY W.D....DAY THUR'DAY FRIDAY SATURDAY
1 2 3 4 5 5~:.-'D5i '.... ,.... ,.... ,.... '.... ,....
rt''1fl ...._-- ---- ---- ---- --- ----- ..- -- ..- ..- ..-UNDAY
1 8 a 10 11 12 13,... ,... ,... '... ,... ,... ,...---- ---- -- --- ---- ---- --..--- ---- .._-- .._-- ---- .._-- .._--
14 15 lIS 11 lS 111 20
"\1. '... ,.... ,.... ,.... ,.... '...---- --- ---- ---- ---- ---- ---.._-- .._-- ---- .._-- .._-- ....._- .._--21 22 23 24 25 2S 21
'.... ..... 'AlL ,.... ,.... 'AlL ,....---- ---- ---- ---- ---- ---- ----.._-- .._-- ..--- .._-- .._-- .._-- ----2S 29 30 31
~:~~._,.'.... ,.... ,... ,....--- ---- --- ----.._-- ..,.-- .._-- ---- a.................. c..........
SUBSISTENCE SALMON CALENDARTHUR.DAY FRIDAY SATURDAY
1 2 3,.... ,.... ,...---- --- ------- .._-- .._--
4 5 5 1 8 a 10 :··,... 'au ,... ,... ,... '."L '.l.. ·---- ---- --- --- ---- ---- ---- ·...c.... .._-- ---- .._--- .._-- .._-- ....._- ......_- aa
11 12 13 14 15 15 11 ;;..."''''" ,... ,... '.... .... 'AU 'AL. eE I---- --- ---- ---- ---- ---- ---- ......--- ....._- _..._- .._-- .._-- -..._- ....--- CD
:II!! :
18 la 20 21 22 23 24 .. ·.. :..'AL. 'au 'UL ,alL ,... 'At... 'AU--- --- --- ---- --- --- --- CD ..... :......._- ....._- ....._- .._-- ..--- .......__.- ........_- " !
0.. •25 26 21 28 29 30 ,. cu i
'""" FlU 'AU. ,AL. ,... i:---c___
CMUOI__ ---- ---- .. ·0 ·....._- ......._- ......_- ......_- ......._- z ·!!: 2THANK YOU. AGAIN.
Thl. 11"0.....,10. I...... '0 tl"f Ie ",.k•••f. Iha..a .t.. III•• ......... for .........c. fol' Y.tt._ RI.... f••m•••
(reduced from original 11 x 17-inch size)
115
' _ __
_
_
~
"
~ ~
_
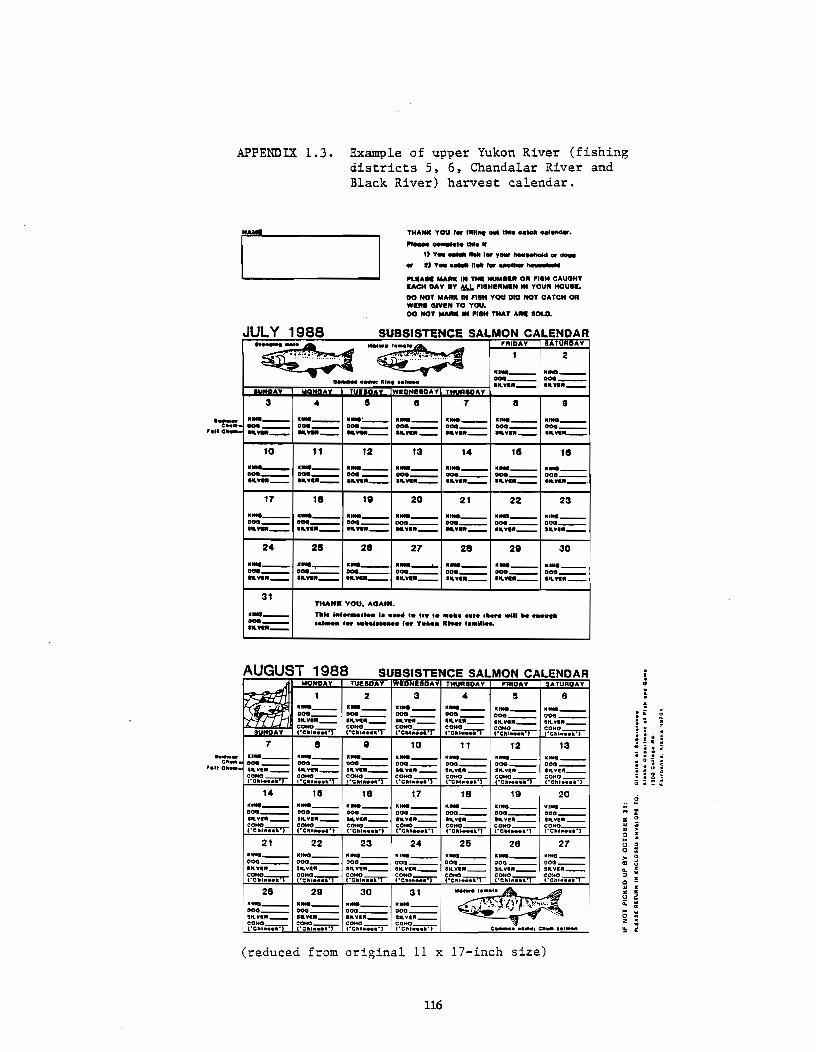
APPENDIX 1.3. Example of upper Yukon River (fishingdistricts 5. 6. Chandalar River andBlack River) harvest calendar.
THANIC YOU ,. IIIn... "". 0.'''' __ •__ ".'111.1'
,) v_ f. yow ........... or ...• I)y n '.
~A" 111 THlI 1lU.... 0" FIIH CAUCItlT'ACH DAY'" MIo I'1I1H,,,,,,".11 YOU" HOUII••
DO NOT "AAlC .11 I'1l1H YOU DlD NOT CATCH 0"w.... _1111 TO you.DO NOT .11 F.lIM THAT AM IOLO.
2----- -----____ '00
I"'Y'. '11..1"
SUBSISTENCE SALMON CALENDARFAIDAY SATUROA Y
.~~~c ...
JULY 1988
IIDNIIIIDAY THU"IIDAY
:I 4 15 15 7 II 9.- ----- ----- --'--- ----- ----- ----- -----c.... ---- ---- 0"'___ ---- ---- OOG ___ OOG ___
, ... c..... '''""- ...._-- ,,,""_- u.••,,__ "'Y."-- .""VCII__ .....,.._-10 11 12 13 14 1IS 18--- ----- ----- ----- ----- ----- --------- OOG___ ---- ---- ---- ...._-- '0.___ ......._- ......_- ......._- ...."tI__ ........._- ....""_- ...v••__ .
17 18 18 20 21 22 23----- ----- ----- ----- ----- ----- -----...._-- ---- OOG___ ---- ...._-- ...._-- OOG___ ......_- ......._- ......_- '''.'''-- ..._-- ."""-- s......__
24 25 28 27 28 29 30
-.._-- ---- ----- ----'- ----- ----- -,..._----- ...._-- ...._-- ...._-- ...._-- 000 '00___
'''YlII__ ...--- ......_- ...vt,,__ ....,.11_- .....qll_- .......tt__
31THAIIK YOU. AGA'".----- nl. J"'en-.d_ II ..... to tr. te ........r••hue ••11 .,. .......---- M'__ f., ........... 1M v... a,... f•• .........._-
AUGUST 1988 SUBSISTENCE SALMON CALENDARMOIID Y TUIIIDAY weDNESDAY THU"IIDAY F"IDAY SATURDAY
2 3 4 15 8
~ ---- ---- ---- ---- ----- ...._--...._-- ---- 000_- 000_-'00___ 000 ___
't""fi / .....,.,,-- 1"'\1""__ .......,,-- ,M.Y'''__ ItU'.IIt__ 'II.'I!,,__
~.="..') ~.~~~•••"jCOHO
~.=....') ~.~~.QiiTrCOHO__
SUNDAY (·c.......') ·ell.. ....·)
7 8 9 10 11 12 13..- -,.._-- ----- ----- ----- ----- ----- -----C__
0"' ___ 000___ 0",, ___ 0",,___ 000___ 000 ___ 000 ___
, ... c.... 'ilYll"__ ''''.'''-- '''''1'''__ 'tl.e"__ 811.•• • .... yll!ft __ '",'1."__ ....,,- <:.=......, c.c:::•••••, ....."... f·~'::.-;;i7) c~•••••)COHO__
C·CIII"••• ')
14 15 18 1.7 18 19 20ICI____ ----- ----- ----- ----- ----- .,..._-- .. ·000___ 000___ 0",, ___ 00o ___ '00___ '0o___ 000 ___ ·.... '11"_- ,......"-- ",".1"__ ..... '11"__ ....va,,__ 'H.vI"__ 8IlVI" __ '" ~f·=Hii'J f~..
COHO__ <:OHO__ COI4O__ COHO__ COHO__ '"c·c... ••• ·) c·c.......·) (·c••••••·) (·c•• •••·) (·Cftl"•••·' ..a..
21 22 23 24 25 28 27 ua-,..._-- ...._-- ----- -,..._-- ----- ----- ----- ,.
000___ 000___ 000 ___ 000___ 00o ___ 000 ___ 000 ___ ...tt.VI"__ 3.... '11"__ IllvI"__ '",,'11"_- .... '11"__ 81",'11"__ 'IlV(R__ ......., C.~;;;rr f·~':t~,';;i"'- ~.~~"...') f~••••ii ~.~~;;;arr ~Pc~~~
:>!0
M1.t•• ,....... '" ·28 29 30 31 ,.~u----- ----- ----- ...._-- ~~'Jl\t~ 0:
000 000 '00___ 000___ J ,;.J .. ·.... '11"_-'1.'11111__ ,.....,,,-- 'IlVIR__ a ·COHO__
r~~c,,"o__ COHO__
c ••;.::!"•••:Cft_ ••1...Z
C·C.. I••••• c·c"••••• ·, e·cltlftOo"'} !!o
(reduced from original 11 x 17-inch size)
116
~~
~~
__
'
~~
_
__
"
_
_
_
~~
'
_
_
_
"
__
"
" __
"
~
_
_
'
~
=~ ~
~
~
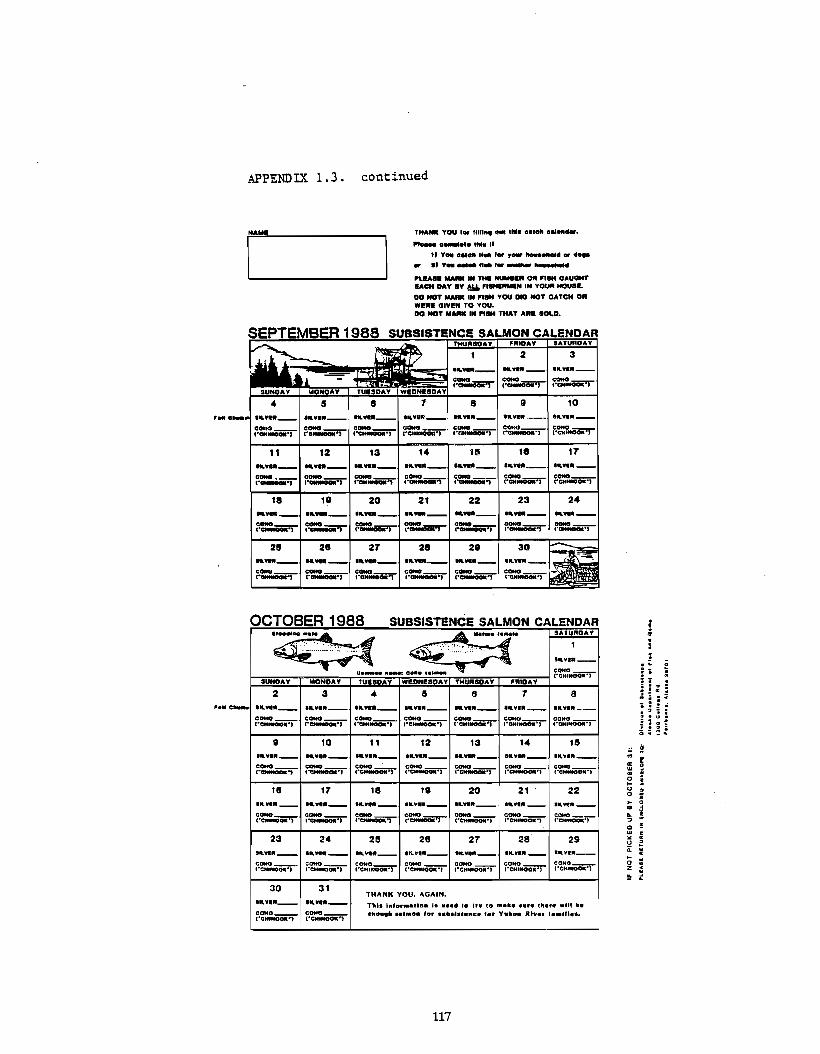
APPENDIX 1.3. continued
THANK YOU for till a••ett .
.... 0 1 1'
tJ V UM ,. 'ow 11 or ....• •,y- ".. ,-"-lEA" IN THlI ...-." 0" "'8M (lAUQMTIAClH DAY IY & _N INYOUIt HOUSI.
DO NOT MAIlIC IN F1SN YOU DID NOT ClATeN ORwe,.. CIIveN TO you.DO NOT M_ IN FI8M TNAT A'" SOI.D.
..._-- ..._-- ......,,--f·=.oo.-j f·::"_,,,'j f·'::'_·j
32
8 .. 10
... e .... ......._- ....ft.__ ,,,"IIV__ '''"It ...valt __ 1",,,,,,__ C___
~::.oorr
C___
~o~
C___
COHO __
c·_" C"CHIIIOOR") C"CNIIIOCMo, '"CMtfitOOIl")
11 12 13 14 18 18 17......_- ......_- ......._- ....,.a__ ..._-- ..._-- .....,..._-c____ ---- ~:a...oiiM ~::"_'l ~'aal .. ~:a....;) COHO
("--, ,-', C"CMHIOOtlI·,
18 18 20 21 22 . 23 24
..._-- ......_- ..._-- ..._-- ---- ...--- ,,,""_-~~al :, f·~ •• 'I ~raal I, m,••,,'l ~aa·, ~.:oo.., ---C"CMWIDGl")
28 28 27 28 28 30
....--- ..._-- ..._-- ......_- ......_-~.=--=r
C___
f·~
C___
f·:a...",C"a-aa.·) I ..e........,
OCTOBER 1988 SUBSISTENCE SALMON CALENDAR
~ ~~. :::_D_AY_
t--::::::':"::-'I"""1===--r-'::••~-=.=.~.;;.-==T.',;.:"=.=••::'=-~r-:==="...,-==,."..-l f·=NOOinSUNGAY MONDAY TUeSDAY WI!DNIlIDAY TNURSDAY FRIDAY
2 3 5 7 8,.nca- ''''.'''-- '''.111__ ..._-- ''''''''-- '''YI!It__ .... .,...._- I"'VI" __
COMO __
C___
~=:.oo.~COHO __
~=,...oii=)CQHO
."eM"",,",,, (.~., C"CHtlitOOlr°) C·CHIIIIOCNIi")
.. 10 11 12 13 14 182....,.._- ..._-- ''''.,.11_- ....".,,-- ..._-- 1..,,1"_- ''''1'''-- .. rCOHO __ COHO __
~~.)COHO __
~.~ ~::atMOo..;)COHO__ I< 0...
I·~·' c·CMtIIOOII·) C·CMtMOQll·) (·CNI"O_") ..a0-
18 17 18 19 20 21 22 " ::a1",,,,,__ I"V."__ I"'VI!"__ .........._- ......._- 1",",,__ ......._- ,. 0..COHO COHO __
~"~ ~·=.aCMJlCOHO COHO__ CONO ..
C"CttttIOOII") C"C..-ooIIi·} C"CNtfiIOOIl·) C·CNtfifOOfC·) (.~., ::l
0 !
23... z
24 25 28 27 28 29 " ~"!I"w,,__ 1",",,__ .....,.,,-- 1",\,1"__ .....R__ ....ft,, __ .... \'1"__ ii:0- ·COHO __ COHO __ COHO__ COHO __ COHO __ COMO __ COMO__ a ·C"CMNfOOIr'" C"CMItIOOII·) C"CHUOOQtC'" ("CHttfOOIl·) C·CNIttOO.... C"eMIHOO..", C·CHIHOOIt·' z <·!!:
30.....,..._COMO__
("CNI~·)
31
'11.""--f·:'~
THANK YOU. AGAIN•
T"I. l.forlllstiD. I, .,.,. t. try 10 m•••••r. ther••m "'................. 'or c. for V Rlv•• f ••UI•••
117
"'
~
_
' __
' __
~=~ __
~ ~
__ __ __ ~ ~
'
~
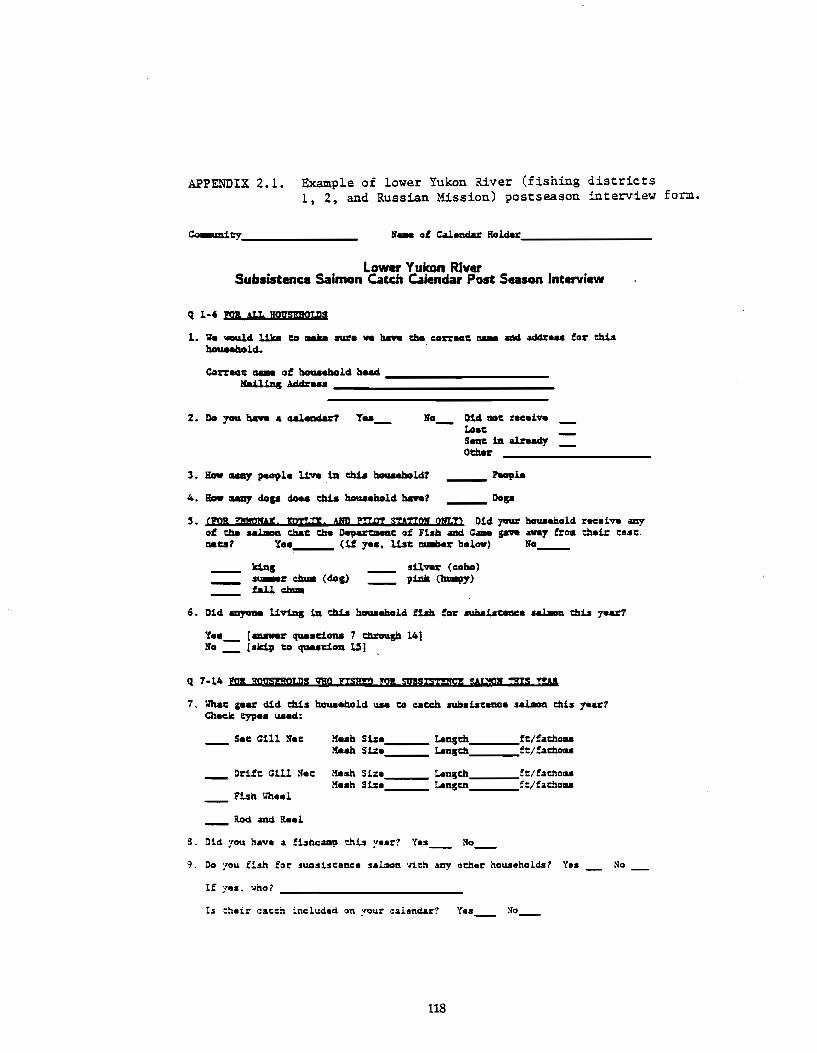
APPENDIX 2.1. Example of lower Yukon River (fishing districts1, 2, and Russian Mission) postseason interview form.
Co-m1cy 1'_ of C&l.nciar IIaldar
Lower Yukon RiverSubsistence Salmon Catch Ca~endar Post Season Interview
q 1-6 lQI ALI. IIQllSDQLps
1. 1le -w.cl lJ.ke co auab sure _ lwft d1e corrac: _ mil Midr••• for eh1abauaeholcl.
Corrac: _ of hauaeholcl huG _ lfa1l1D& ;\dAr...
lfo_ Dlcl"llO: receiveLa.:Sac in alreadyOeber
3. lfow JUDY peQltle 11've i.D th:I.a houaeholel1 People
4. lfow JUDY dop doe. th:I.a houaeholel lwftt Dogs
5. em QMQR.y::, mn.n;, Alp nIm S'rA1±OJ OJLD Diel 1fIVZ houaeholci receive arryof d1e s&lmoa dlac the Oet!U1:IMIle of F1.sh alA a- gave -'1 frOll ch.ir eesc.neest Ye. (if ye., lUe lIIIIIber bel_) 1'0_
s:l.lver (coho)p:l.Dk (huIIpy)
6. Dlcl m,aae UviDs i.D eh1a bauaeholel fUh for sub.:l.auace salaoll ch:l.a year?
Y•• [_r qu..c:I._ 7 chroqh 14)No [slc1p :0 qu..c1_ 1.5]
q 7-14 lQI JmllmIQLpS DQ "SUP l2J. mSxsmg: !!W1QJ m:i IU&
7. Inlac gear d1el ch:I.a houaeholcl un CO caech subdauace salaoll ch:I.a y.ar?Check type. uaecl:
Sec Gl11 Nee !fesh SU. IAngdl fe/facho..!feeh Sue I.ellgdl fe/fachou
Drife Gill Nec Mesh Si:. I.ellgdl fe/facho..!fesh SU. I.ellgdl fe/facho..
Fbh lJh.el
Rod and Il.el
a. Old 1011 have a f1shc~ chis year? Yes__ 110__
9. Do you fish for subsiseence salmon ~ieh any adler hOllSeholds? Yes ~o
If yes. ..no?
Is :heir caecn included on your calendar? Ye5__ ~o____
118
_
_
_
_
_ _
_ _
· _
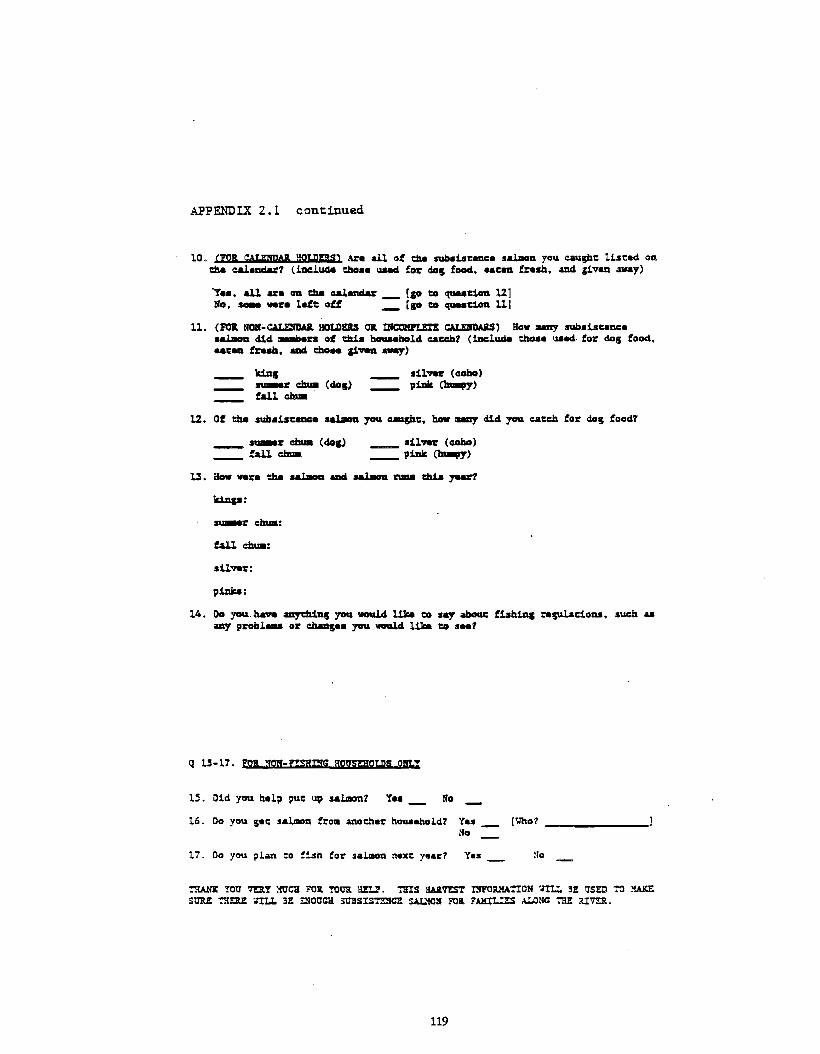
APPENDIX 2.1 continued
10. eEl CAImAi !IOLPQS) Are all of the subaisc8IICe sa~n you caughc u.sceel onthe ca.l.nclU? (iDcludAI cho•• UNCi for do, fooci••acell fre.h. mel giv.n away)
'Ye•• all are em t:ha calanclU [10 co quad.em 121No. s__ re l.tt: oU _ [10 1:0 quad.em 11]
11. (li'OI. NOlI~CALEmWL HOLl)!IS 01. IBCCKl'InI c.u.EIIIDARS) How uny sub.iac.nc:._~ cI.1cl ...1:5 ot eMa hcN.Mholcl cacch? (1nc:luda t:ho•• uaecl for dog fooel •..Cell frea. aDcl t:ho•• &1_ awcy)
sU.,. (coho)piDk o-t!Y)
sil.,. (coila)piDk (m-py)
13 • How _re the saI..oa am saI..oa ruaa cbia yau1
kinp:
fall em.:
p1Dka:
14. lJo you. ha'ft aayt:h1ng you would llD 1:0 ..., abcNc fishiD, replac1oDS. such ..my probl... or chaD,•• you -u.cl llD 1:0 __ 1
Q lJ-17. rna W!-uSBm; HOVSgHQLpS gm.x
lS. Did you balp puc up sallllon1 Ye. No
16. 00 you gee sa~n fro. anocher !toua.hold? Ya./fo
17. 00 you plan co fish for salmon naxc year? Yes
[1Jh07
'!'RANI: YOO 7'E1l.X ~C3 'OR. YOUB. !IEU', 'I'lIIS!WI.V!ST !NFOlUfA'1'ION nI.I. 3! l1SEIl 1'0SUR!: ':'HEIlE :nu. 3! ENOOC3 SOliSISn3CZ SAL.'iON FOR. P'~ ALONG 7ll! UVDl..
119
_
_ _
_ _
_
~
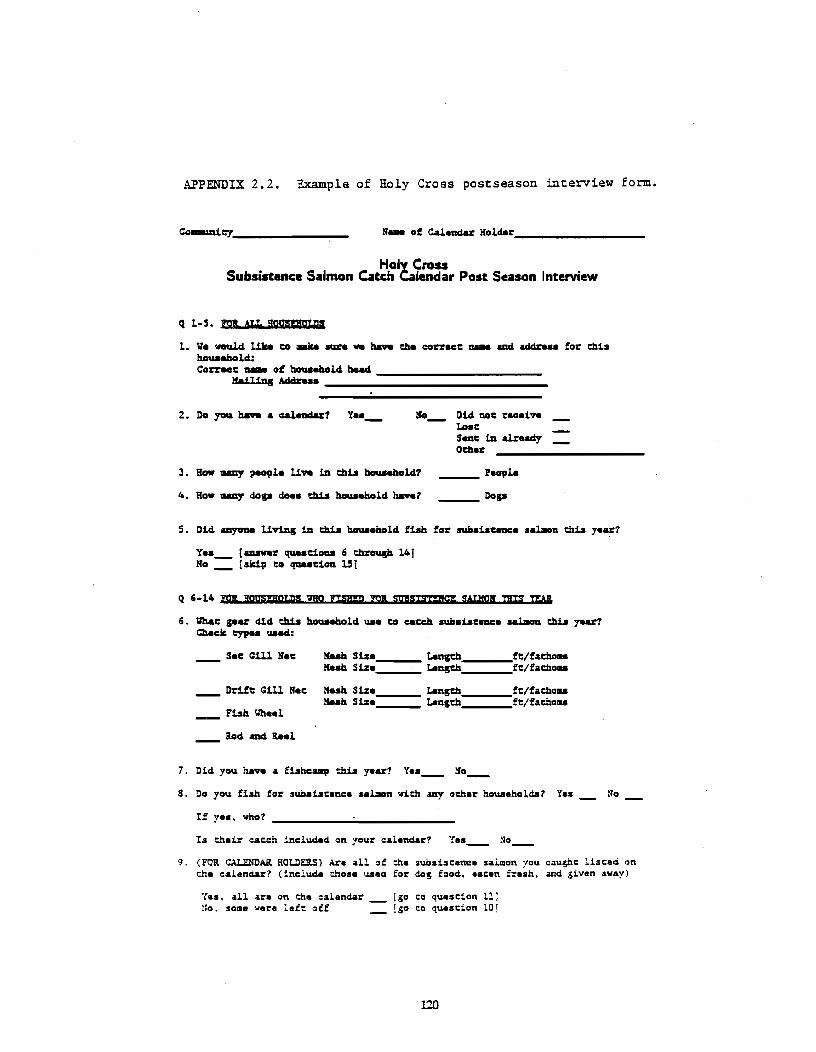
APPENDIX 2.2. Example of Holy Cross postseason interview form.
Co-mit:y N_ of c.alendar Holdar
Holy CrossSubsistence Salmon utch uiendar Post Season Interview
q 1.5. rna ALI. JJgmiIHQtPII
1. tie waulci 11. CO ... .are _ aa- ehe correc: _ GIG addrll.. for d:l1ahouaeholci:Correc: _ of houaeholci heaci _
lfa1l1D1 Addrll••
10_ Dlci no: rllcelveLo.:Sene 1D alrlladyOCher
3. How IIIIZlY plt01l1e 11ve 1D Chu houaeholcl1
4. How IIIIZlY dop doe. ChU houaeholci aa-?
___ rllOllle
___ Dop
5. Dlcl aayone 11vtns 1D d:I1a houaeholci fub for sub.u:ance sallacm d:IU year?
Ye. ( r quu:10aa Ii through 14]No (skip co quuC101l lS]
Ii. lJh&: gllar cl1cl ChU houaeholci _e CO c.accb sub.1aencll sallacm ch1a year?Check cyp•• 1IMd:
S.e Gill N.e IIaah S1:. Laagcb. ft/faChCllUIIaah S1:. Langcb. f:/facl1ou
DrUt Gill N.e If••b S1:e LangCh ft/faCho...lfeab S1:. LangCh ft/fad1o...
rub Int••l
loci GIG b.l
7. Dici yOIl have & fuhclillp chis year? Yes_ No__
a. 00 yOIl fisb for subslscllncll salmon viCh art ochllr hOllSeholels? Ye. No
If y.. , who?
Is cheir cacch included on your calendar? Ye.____ No__
9, (FOR CAU:NDAR BOLllERS) Arll all of ebe subsisCllnCII salmon JOU C:1U¢C liscad onche calendar? (include Chos. used for doS food. e.cen fresh. and givlln away)
YIIS. all arll on ebe calendarNo. sOlie 'Jere lllfc off
[go co quescion l11[go co quescion lOJ
120
_
_
-
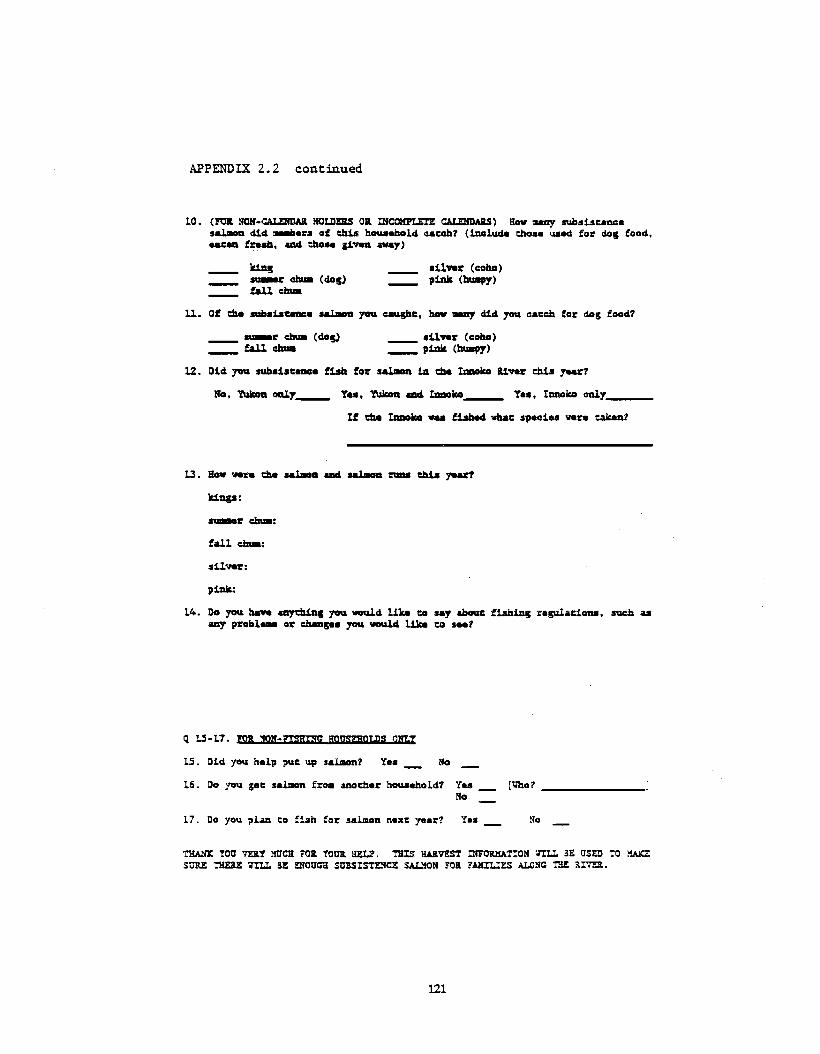
APPENDIX 2.2 continued
10. (FOIL NQH.CALEHDAR. !IOIJ)E!lS OIL INCOKl'I.ET! CALENDAaS) How any sub.1searu::a_almoa ci1cl "a&'11 of cbill hauaeholci caceh7 (l=lude cho.a uaad fo&' dog food._cell !rella. aDd cboH &1- av~)
silftJ: (coho)piDk (m-py)
__ =u.(dog}
_fall =u.silftJ: (coho)piDk (m-py)
13. How _n cbe salmoa aDd _almoa :uDII cbilI year!
ld.up:
fall =u.:
piDk:
14. Do you. 11-. myctWlg you. voulci like to _., &beNe f1slUng ragulaci_. such asury probl_ oJ: c:haug•• you. voulcl 11ke co __ 7
Q U·l7. rna p-n:mm; mmrgus ONLY
15. Dlci 10'1 hall' pile sa1lllon7 Y.. !fo
16. Do 10'1 g.e salmon fro. anocb.r hOllSahold7 Y••No
17. Do yOIl pl.n eo flsh for salmon naxe year? Y••
[T.Jh07
1'!iANX YOU VE1l.Y lroC3 FOB. YOUI. liELl'. 1'BIS llA1l.V!S'l' INFOlU!ATION 1l!I.I. 3t as£!) '1'0 !!AXESURE nIDZ 'nLI. 3Z !NOUGlI SU!SIS'l'DC! SAL.'iOH FOB. YAHIUts ALONG 'l'liIt lrra.
121
_ _
~
_
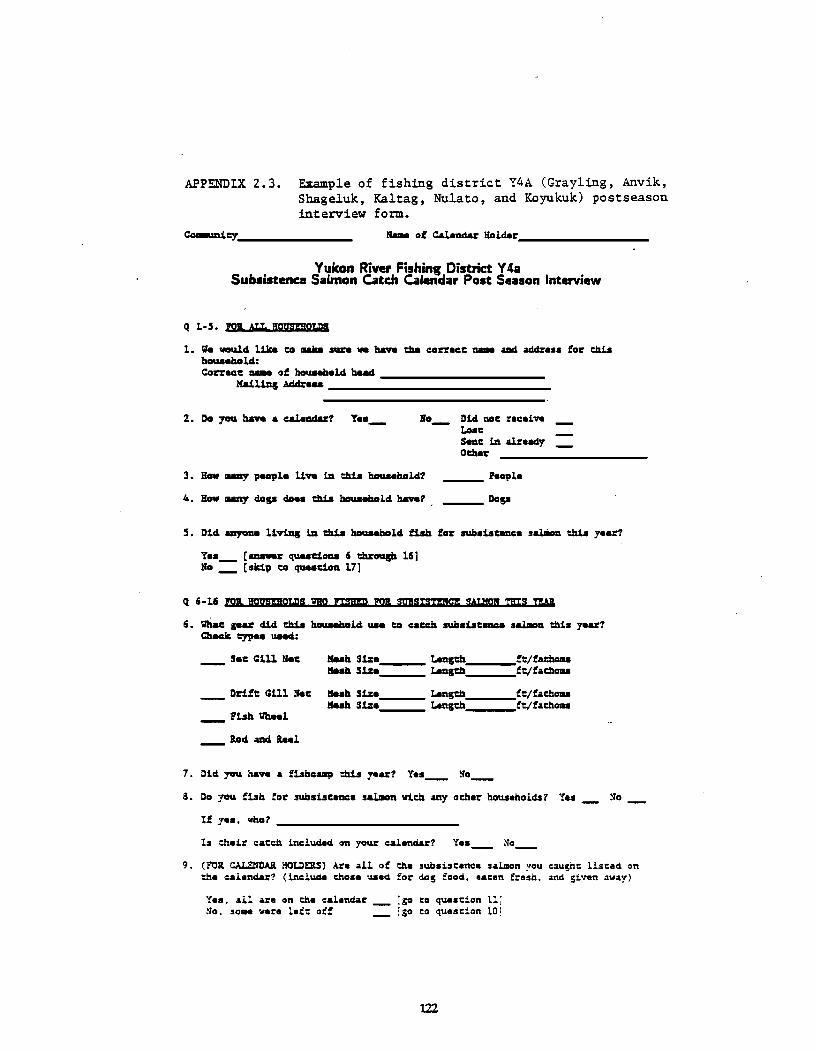
APPENDIX 2.3. Example of fishing district Y4A (Grayling, Anvik,Shageluk, Kaltag, Nulato, and Koyukuk) postseasoninterview form.
Co~CY. N_ of c.leDdu Holdar
Yulcan River Fishinw District Y4aSubsistence Sajmon Catch Calenaa, Post Season Interview
q 1-S. lpJ. ALI. !JQJlSPQJJlS
1. llo woulcl 1J.ka co __ sue _ b.- the coceell:: _ aIIli addre.. for th1shouaeholcl:Coceel1:: _ of ~.aolcl ba4I4 _
!fa1l1Dg AdAr...
No_ Dlel 1101:: receiftLoseSec 1D aLreadyOther
3. How UDY p-t'lo Uft 1D th1a haua.aolcl?
t.. H_ UDY dop does th1a hauaeholcl b.-1
___ l..,le
___ Dop
5. Dlel myoa. 11v1D& 1D th1a hauaeholel fish for subsLaCeDCe salJilon thi. yead
Yes_ r_r quaad.oaa 6 e!Iraqll 16]No r.ld.p co quaad.OIl 17]
q 6-16 lpJ. ggvmrgx.ps DP nmmp rna. mSIsmICI WJSgt! ms ma.
6. lnlae par cUel th1a hauaeholcl lUG co cac= subsLae-. salJilon thi. year?Chock cypos 1UOcl:
Soc Gl11 Nee IfuQ S1:., LaDsm, ,ft/facholuIfuQ S1:. LaDSch f1::/fad1au
DrUt: GUi N.e !fesh S1:. LaDsm ft/fachou!feah S1:.'--- LaDsch~---f1::/fachou
Fuh lJheol
7. Dlel yau h.- a f1.sh«:all1t th:i.s year1 Ye._ No_
S. Do yau fbn for: sub.LaceDCe sa1.llcm vich my ocher: households? Ye. No
If y••• vho?
Is cheir: cacc:h inclwUici aD your calenciu'? Ye.__ No__
9. (FOR CALENtlAR. !iOtJ)E:1lS) Are all of ene sub.i.cence sa1.lllon ~ou caughc lisced onche calendar:? (inclwUi chose usad for do! food. saeen fresh. and given away)
Y•• , all are on ene calendar __ [go co qua. cion t11No. so•• vare tef: off __ [go co que.cion 101
122
_
_
_
_
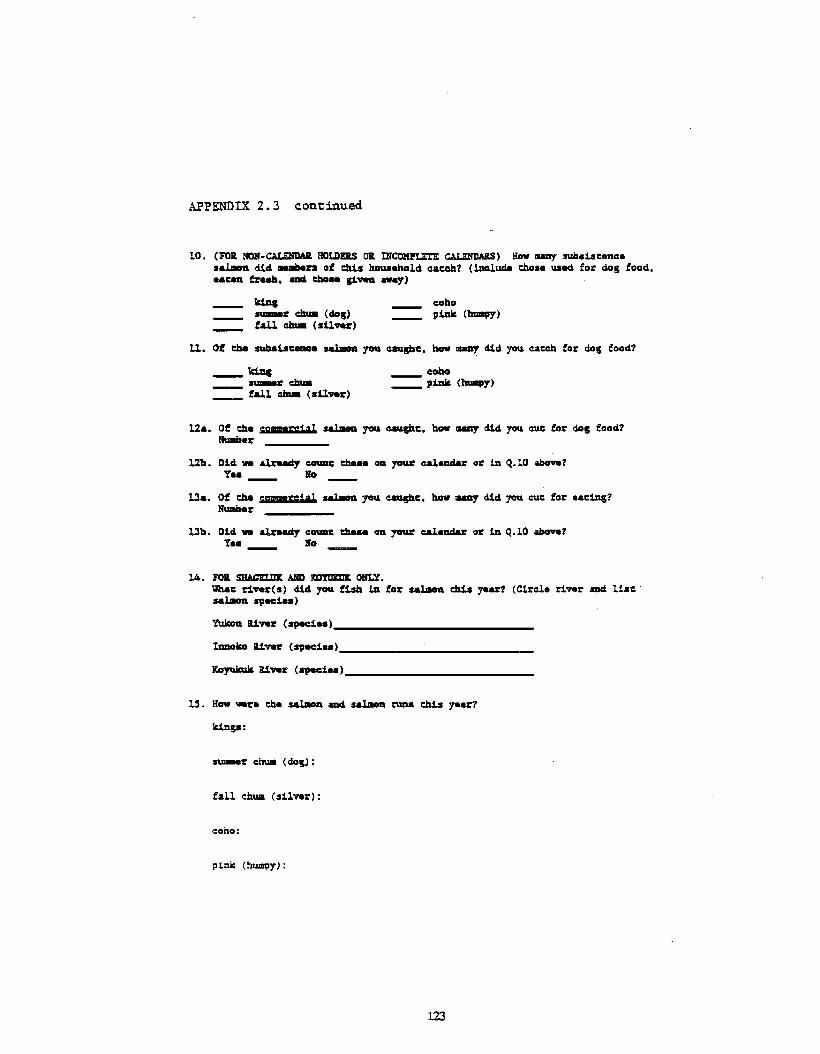
APPENDIX 2.3 continued
10. (FOI. NOH-c.\LEIfDAI. IIOIJ)EIS 01. mCOMl'LET!: CAI.ENllAiS) How IlIlIIIY subsi.scencesalalo1l did. "'1'3 at dlu howI.hold. cacch? (1ZIclude chos. used. for dog food.._Cell freah... c:bose &1"'" _ay)
k1DI_r cm.. (clog)fall cm.. (s11'.,.r)
cohop1Dk (~)
ll. aE che sub.:Lsceac:. 10'& caustu:. bav UD1 did. you cacch for clog food?
_coho_p1Dk (~)
12a. OE che 9P_rsial sa1llDD 10'& caughc. haw DI&II1 did. you cue for clog food.?NulliMr
121:1. Dlcl .... al:rudy c_c ch... OQ yoq:r caleada:r or in Q.l0 above?Y.. No
13&. at che 9Pl!!!!Nlrsial you caughC. bav DI&II1 dicl you cuc for .aciDg?NUllber
131:1. Dlcl .... alrud:y c_c ch... OQ yoq:r c:aleada:r or in Q.l0 above?Ye. lfo
14. FOI. ABO ONLY.',;h.c :i_res) dicl 10'& fish in for s&~ ch:Ls yur? (Clrcl. 1'1-r ami Uscsalalo1l SlJ-1..)
Yukoa ti_r (SlMC1..)
ImIoko ti-r (Sll-l..)
!CGyuII:uk U_r (Sll_le.)
k1np:
s~r chua (clog):
fall chua (sl1ver):
coho:
pink (hUlllllY):
123
~
~
~ ~
_
-
_
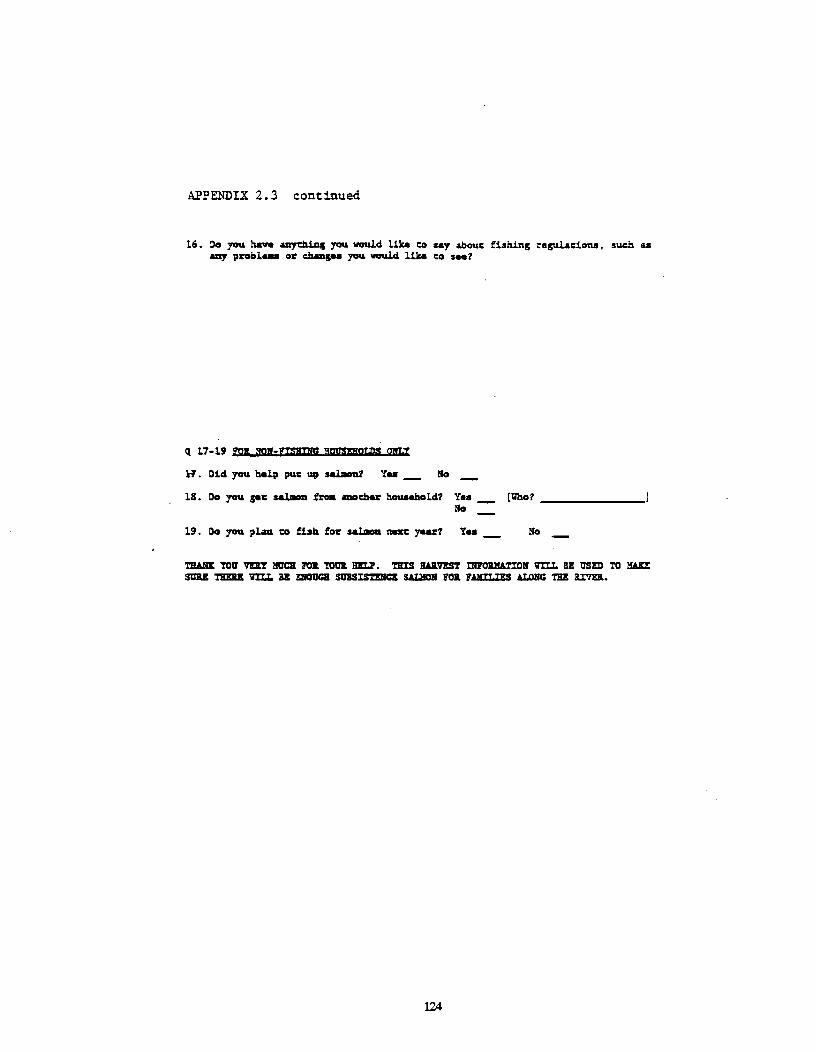
APPENDIX 2.3 continued
16. Do you b.- aaydliDs you would Uka co say abouc: fi:lhinS resuJ,aC:ians, such uU'l'f prob1_ OX' chul&- you vauld like co s•• l
q 17-19 lQI g-ymmrq lJgmrggt,pS Ol!Ly
H. D1d you help pu1: IZl' ~1 Y.. No
18. Do you g.1: salmoa froa au;:u:nu household? Y••No
19. Do you plaD co full foX' salmoa MZ1: ya&7:1 Y..
(lnl07
No
'r!IANE YOU va:! mca JOI. YOUI. H!Ll. 'l:IIIS 1WlV!S'r IlIFOIUfATIOII .1lII.I. BE USED TO lfAaStIU 'I'!IIU 1lIU. U !IIOucm S1JBSISTDCZ SAIJfOII FOI. F.ua:LIES ALONG 'rBE llIVEIl.
124
_
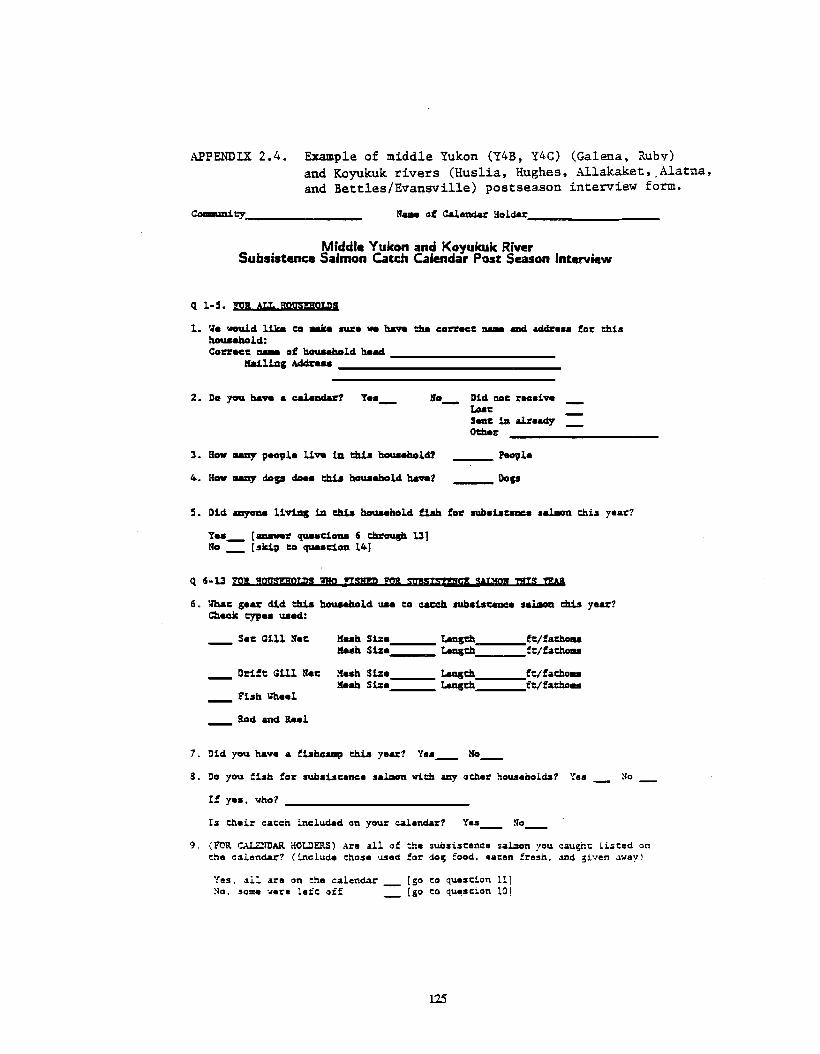
APPENDIX 2.4. Example of middle Yukon (Y4B, Y4C) (Galena, Ruby)and Koyukuk rivers (Huslia, Hughes, Allakaket •. Alatna.and Bettles/Evansville) postseason interview form.
Co-m.cy N_ of C&letldar I:Ioldar
Middle Yukon and Koyukuk RiverSubsistence Saimon eaten eaiendar Post Season Interview
q 1-5. rnB ALI. BQVSPOL!ls
1. 11. -w.ci like eo __ sure _ ha'ft the COn'lICe _ aDd. addr..a for chisl1cNaeholci:COn'lICe of l1cNaebolcl he.
Ka1llnS Ad4J:ua
No_ Dicl _e rllCeiveLoaeSelle 111 alreadyOt:bor
3. !low III&IlY people live 111 thU houaebolci? P",le
4. !low III&IlY dop do4Y thU hlNlleholci ha'ft1 Dogs
5. Dici auyoft8 liviDs 111 thU houaebolci fish for subaisceuce sallllon chis year?
Ye._ [__ r qlWad.oaa 6 chroush 131No [sld.\, co qlWaei01l 14)
q 6-13 yoB !JQgspgt.ps gp nsm :pi. muxsmc: W::mJ :mys DAI.
6. ~e gear d1ci thU houaobolci IJ80 co c:ace:h subaisee1lCe salIIIon chis year?Check eype. ua04:
See Gill Nee Kull 51:e LellsQ, ,ft/facbo..Kuil S1:e Lensa ft/fachomll
Drift Glll Ree Keah S1:e Lellsa ft/facho..Keall S1:e LeIlsa ft/faao..
Fish 1Jheel
!loci anci Reel
7. Di<1 you have a f1sh~ chis year? Yea_ No__
a. 00 you flsh for sub_iseence sallllon vich ocher households? Yes ~o
If yes, whol
Is cheir caecn inclucieci on your calenciar? Yes____ ~o__
9. (FOR ~roAR aOLDERS) Are all of che subsiseence salmon you cau;hc Li5ced onene calendar? (include chose used for do~ fooci. eacen Eresn. and given 3way)
Yes, all are on ehe calendar __ [go co queseion L11~o, some ~ere lefe off __ [go co quescion La!
125
_
~ _ _
_
_
_
_
~
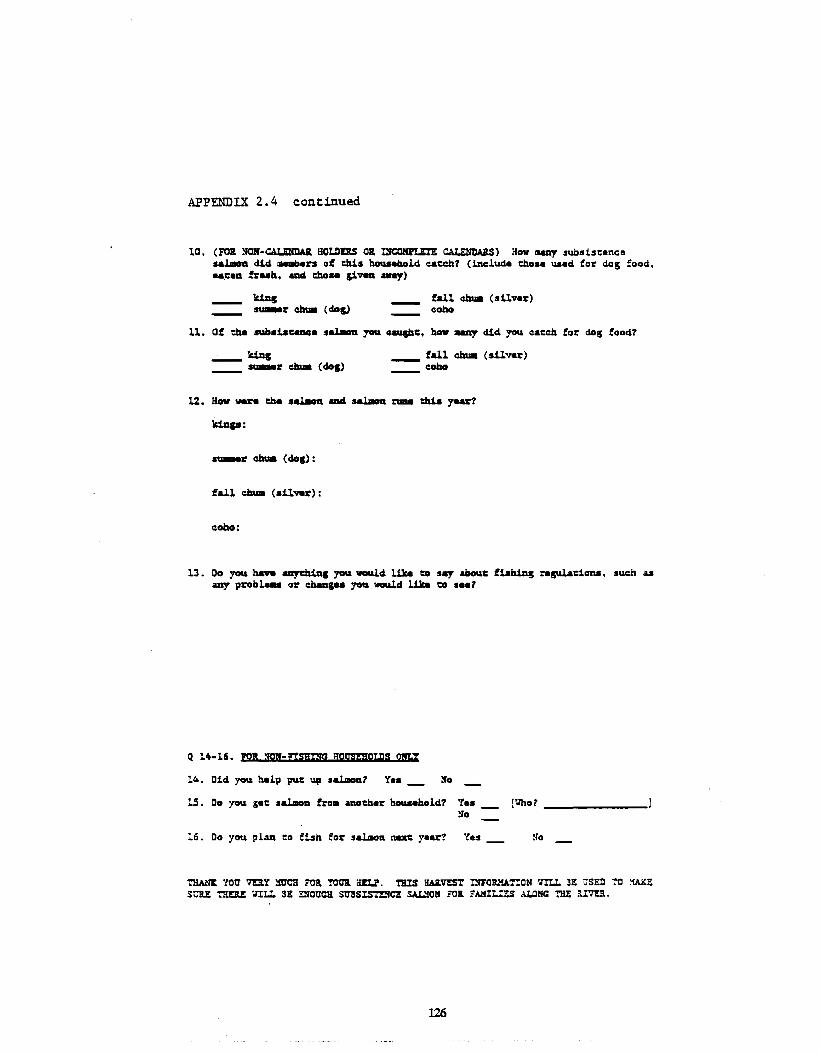
APPENDIX 2.4 continued
lO. (FOil NOB-CALENDAR. HOLDERS Oil mCCKl'LE'r! CALENIlARS) How uny subaiacaneesaJ.Dm did lMIIi:I.ra of c:hia JuN.eilald caceh1 (inclwMi chos. uaeci for dDg food,_~eQ fr••h. alA cheI.. p.v.a away)
fall em. (sl1ver)coho
11. Of che sub.i.aceac. salaDa 1'* ~c. haw 1UIlY did you eaceh for clog food?
fall chuII (al1ver)coho
k1Dp:
fall em. (al1_r):
coho:
l3. Do 1'* have aaych1ag 1'*~d UD to say aOouc fbilins ragul&c:l.on.s, such aaany probl_ or chaag.. 1'* -U UD to s_1
Q l4-16. roB. 30'-ngmm HQqmmx.ps gm.x
l4. Did you help pw: \Ill su-n1 Ye. !fa
l.5. Do you gec salmoa fro. _cher houehold? Yes [TJho1!fo
l6. Do you plan co fish for salman neaC year? Yea ~o
T1iANE '!OU VUY :mea FOil YOt71l aEU. nus lL\I.VEST INFOlUfAT:ON 'l!U 3! O'SED :'0 ~ESUU ':BEll!: 'l!U 3! ::NOUC1I SUBSIS'r!:fCZ SAUfON FOI. FAHIU!S A.t.ONC rHE UVtt.
126
_
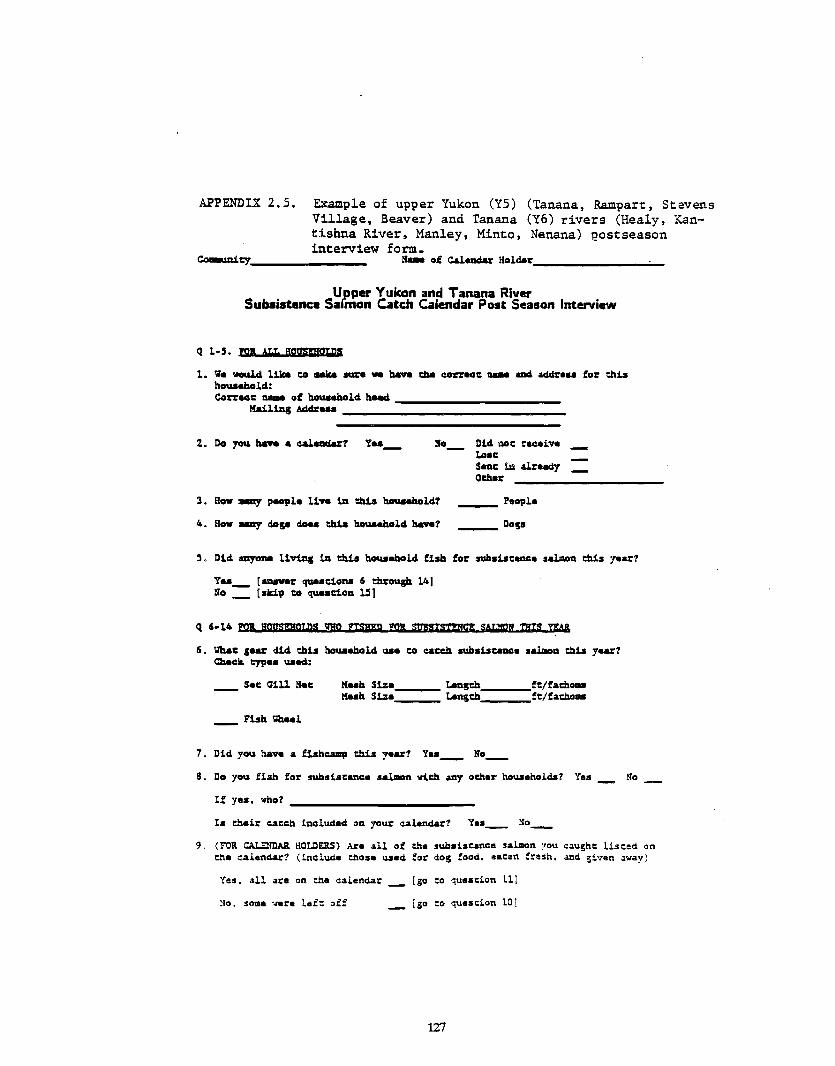
APPENDIX 2.5. Example of upper Yukon (Y5) (Tanana, Rampart, StevensVillage, Beaver) and Tanana (Y6) rivers (Healy, Kantishna River, Manley, Minto, Nenana) Eostseasoninterview form.
Co-.i.:y, If_ of ~endu Hol~I: ............
Upper Yukon and Tanana RiverSubsistence Safman Catch Ca'endar Post Season Interview
Q 1-5. lQI ALI. lJogmror,ps
1. ll. 'hNlci 11ka co ..u _e _ a- eta. coceen: _ UIA add1:e.. fOI: chLshCNhholci:CoceCl: _ of houaeholci hMd _
!fai.liDg .we...
2. Do you 1wft & callUldar1 Y.. 110_ Did MC receiveLo.cS_c: 1D alruciyOther
3. H_ IIIIIl1 PeGlIle Uve 111 tb1s houaehold1 l'eotJle
4. H_ IIIIIl1 dop doe. dWI houaeholci a-1 Dogs
5. Did aaycme Uving 111 tb1s houaeholci fiah fOI: suiI.Lsc_e sa.lmlm chis yeu1
Yea_ t_r qu8aCiona 6 through 14)Ifo tsld.p co qu8Sl:1on l.5]
Q 6-14 101. lJovmJQIJ)S EO n:nmp lOB, SVlSISmCJ gwml! mrs n:A&
6. lJb&e geu did ehLs houaeholci lISe co cacch suiI.1seeace salmon chis yeu?Chec:k cyp.a lU.d:
S.e Gill If.e
11m lObe.l
Kuh S1:e, Langen fc/facholU
Keah S1:e Langen fc/facholU
7. Did you have a f1sh~ ehLs yeu? 'I.. Ifo_
S. Do you fbh fOI: sub.iaeanee sallllon vich MI'f ocher households? 'Ie. !fo
If ye., who?
Is cheir caech ineluded on your calenciaJ:? Ye._ lIo_
9, (FOR. CALENDAll HOLDERS) Are all of che sub.bunce salmon :,ou c~u!;he liseed oncbe calendar? (include chose used for dog food, ••een fresh. and given away)
Yes. all are on ehe calendar
1I0, some ~ere leic oi!
(go co que.cian III
(go co que.cian lOl
1Z7
_
_
_
_
_
_
_
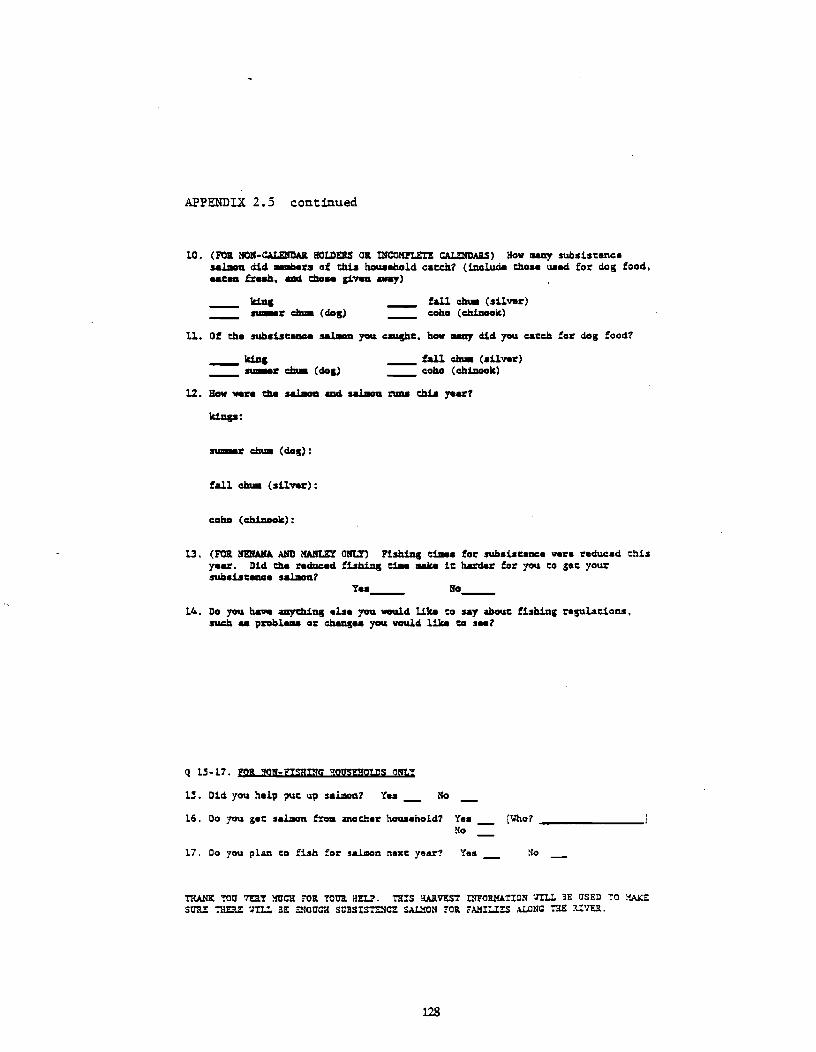
APPENDIX 2.5 continued
10. (FOil NOlf·CALE1'JDAll HOIJ)EII.S Oil INCOHPIZl:! CAIJ:NDAIlS) How IlIaIlY subsiscanc:a..1IIoa d.1d "'rs of chU houaebold ca1:Chl (lncl~ Waa used for dog food._ceafruh. aDIi cbo.. p.'ftIl gay)
1c1q_r chua (dog)fall chua (silver)~oho (c:hiDook)
11. ot eha suba:Lscaaca sa1lloD you ~aughc. how IlIaIlY did you ~ac= for dog foodl
fall chua (aUftr)~obo (c:hiDook)
-r chua (dog):
~obo (ch1zIook):
13. (FOil NERa\NA AND lfANLEY OBLY) Fishing eimea for subaisc.nc.....r. reducad !:hisyear. Diel ehe redw:eci f1ahing eime lII&Ice 1e hardar for you eo gee yoursuDa:Lscence sa1IIoDl
y.. tro_
14. Do you ha'ft aay1:hiDg alae you -.lei like eo .., abouc fuhing ragulaeions,sw:11 .. probl_ or cheDg.. "jOlA -.lei like 1:0 ..al
Q 1.5-17. rnB. ,OJ-nSBw lJOl1S1JJQUS gm,'x
l~. D1el you halp INc ~p salmon? Yaa No
16. 00 you gac salmon fro. U10char householdl YaaNo
17. 00 you plan co fish for salmon naxc year? Yes
(1Jhol
eto
'!'KAN1t !017 7D.Y :roCR :OB. !Olm liEU. Tl!IS:wI.vtS'1' nrFORHA1'ION nLI. 3£ USED :'0 ~ESmu: :'HEU: nLI. BE: ~OtrG'd Sl1!SIS':!:lCZ SAUiON :OR. : AliILIES ALONG ':'liE U'lEll..
128
-_
_ _
-
_
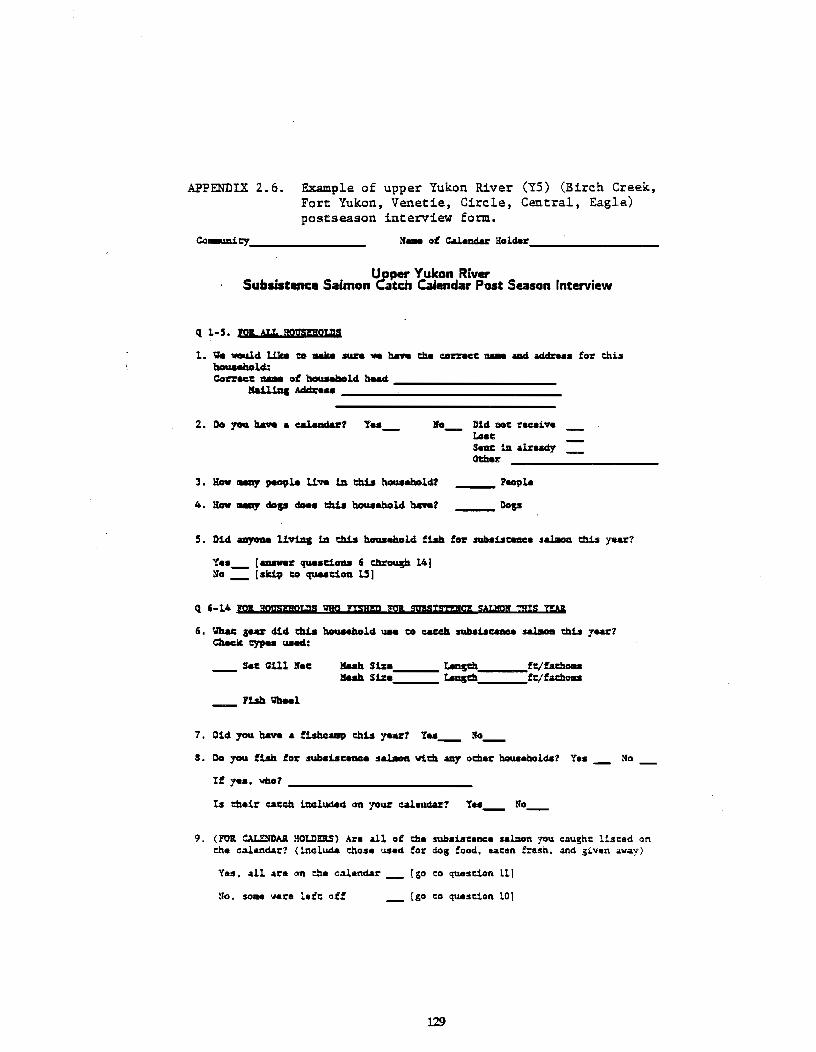
APPENDIX 2.6. Example of upper Yukon River (Y5) (Birch Creek,Fort Yukon, Venetie, Circle, Central, Eagle)postseason interview form.
Co-m.r:y lJ_ of Calalldar lIolclar
UJ'per Yukon RiverSubsistlt$lce Salmon Caten Calendar Post Season Interview
1. -.&lei Uka co ... sura h.- the COft'aCC mel addre.. for thuhouaaholei:ConKc _ of houaaholei huG _
If.a1J.1DI ••
110_ D1cl DOC raeeiveLoacSeIlC 1Jl alrud.yOl:har
3. How -r pacIltla U_ 1A thia houaaholei7 PHlIle
4. How -r dop cioa. thia houaaholei 1uwe7 Dop
5. Did. aayou UviDS 1Jl thia houaaholei tUb fR suUuclIIICe salmou thb y••r?
Y•• [_r qua.ciou 6 =oup 14)lJo [sld.i» co quaad.oa 1.5 J
Q 6-14 lQIlIQVSPQLps Do rum 'f9' msl$'l'PCI wp! MS 'Wi
6. tal&c gau d.1ei ch1a houaaholei 1188 co caecb sub.i.ae-a salmou thi.a yaar?Chac:lc r:yp.. 1I88cl:
S. Do you tUb for subsi.ac_a s~ rich aD'! ochar hauaailolcls? Ye. lJo
If y•• , ...no7
9. (FOil. c.u.ENDAJl HOIJ)E:!lS) Ar. all of the subs1seence s.lIIon you caughe liseed oneh. cal.endar? (include those used for dog fooci, ••een frash, and given away)
Yes, all are on cbe calendar
~o. so•• ware leic off
[go CD quese10n 111
[go co quese10n 101
129
_ _
~ _ _
~a _
_
_
_ _
_
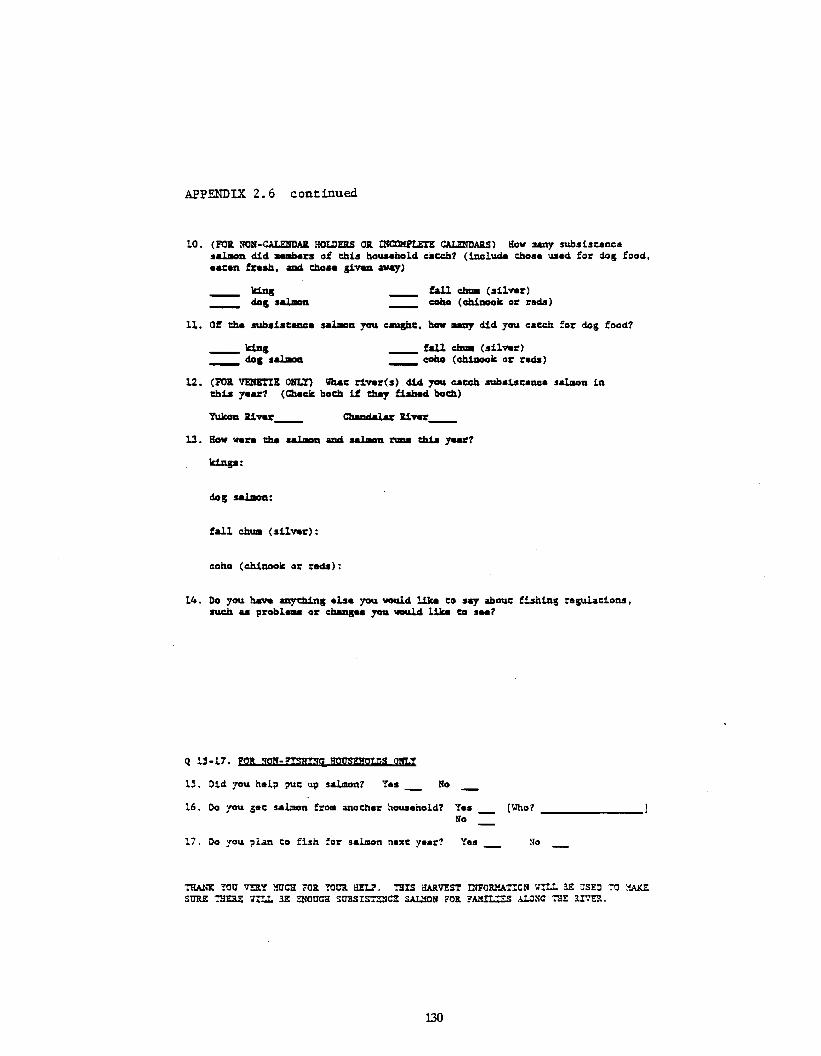
APPENDIX 2. 6 continued
10~ (FOR. mlN-CAI.ZNDAR. ROLDERS OR. INCOKl'L!T! CALENDAaS) Row uny subaiseancasalmon did -.bers of chis bouaehald caceh? (include chose usad for dog food,aacan fra.l1. aIIIi cho•• p,ven away)
. fall chua (sUver)coho (ch1noak OJ: recia )
n. Of ch. sub.iscanca salmon you cau&ilc. how uny did you cacch for dog food?
fall chua (sUveJ:)== coGa (ch1noak or racia)
12. (FOR. VENETIE ONLY) lihac r1veJ:(s) did you caceh sub.iscanca salmon inchis yau? (ebaelc bach if d1ey fisheci bach)
1d.ngs:
fall chula (sUvar):
coho (chinook or recia):
14. 00 you have anyr:bing els. you WIlMlld like eo say abouc fulling ragulacions.sw:h as probl_ OJ: chaDg.. you -JA like eo s..7
Q 1.:1-17. rnB. :roN lISRnJG HQvsmLps OM.I
1.:1. Did you helll puc UlJ salmon? Ye. !fa
16. Do you gac salmon from anocher bousehold? Yes!fa
17. 00 you plan co fish for salmon nexc ye.r? Yes
("'hot
No
!HANlC YOU 'lUI ~C1I :Oll YOUR !iEI.l'. !IllS ilARV!ST niF01U!A1"!ON 'JILL 3E tISED :'0Stm.E :'HERE "JILL 3l!: ::NOUGR SU1lSIS~Cl!: SAUfON .011. FAMII.:ZS ALOllG :'HE U'lEIt.
130
-
_
~
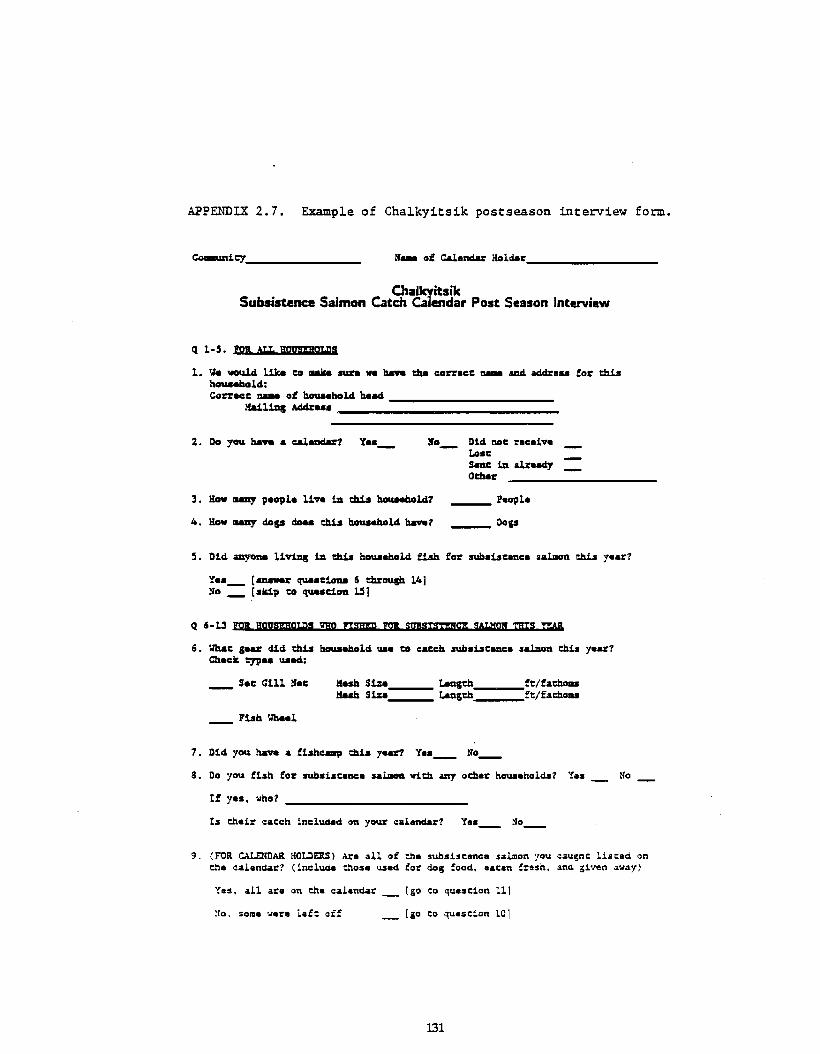
APPENDIX 2.7. Example of Chalkyitsik postseason interview form.
Co-m.cy 11_ of c.J.endar Holdel:
ChalkyitsikSubsistence Salmon Catch Calendar Post Season Interview
q 1-5. lpI ALI. lIovmmpS
1. TJe woulci like co aU sue we have aonac: ami acIl:b:e.. fOl: chuhouIIaholci:Canace _ of bouaeholci haaA _
1fa111q Addr...
110_ Dlci noe racaLvaLo.eSell: 1D alraady0=-1'
3. How IIAIlY people Uva 1D ehU houeholci7 laOtlla
4. Hov IIAIlY dop doe. ehU houaehold. haver Dogs
Ye._ [_1' que.clODS Ii ehrough 141No [.k1}» eo queac10a 131
Ii. !Jhae gear d1d. ehU tuNaeholci use co c&:ch suba1s:aDCa Sa1llloll chla year?Check CYP" used.:
Sec Glll Nee
Flsh lJhael
Ke.h S1:e, Lellgch, fe/facho...
!luh S1:e Lallgch fe/facho...
7. Old. yeN !lava a flshc.., chu year? y.._ No__
8. Do you flsh fOl: sub.lacanea sallloll vich any ochel: households? Ye. No
If ya•• who?
Is chair caech inclwieG on your calend&J:? Ye.__ 110__
9. (rOR CALENDAR HOlJ)!RS) Are all of che subsiscence salmon you cau~hc lisced onche calendar? (inalwie chose used for dog food. e.cen fresh. and given away)
Yes. all are on che calendar
~ro. some ·"'.re lef: off
[go co quescion 11]
(go co que.cion 101
131
_
=- _
_
_
_
_
_
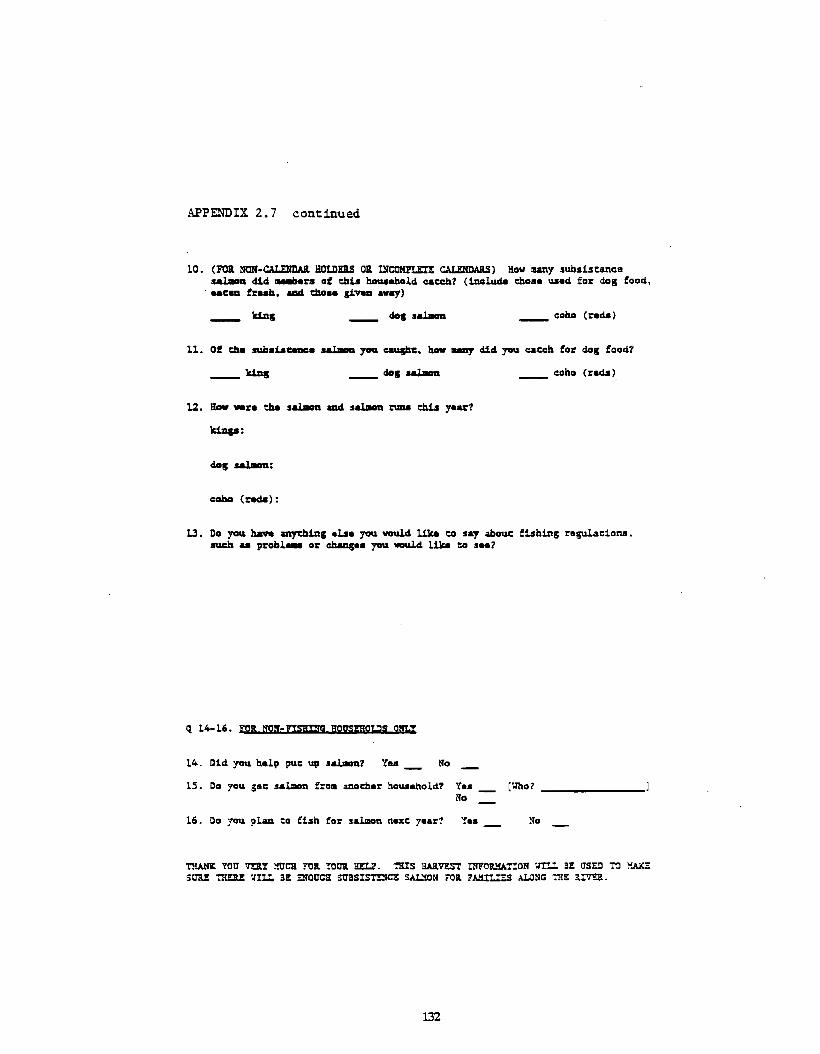
APPENDIX 2.7 continued
lO. (FOB. NQH-CAI.ENDA& HQIJ)!IlS 0& INCOHPLET! CALENDAlLS) How lU1\y subsiseancesallllm did "'rs of diu hauaehold caceh7 (lnclucia chose used for doll' food •
. ..em fre.b. aDd dIo•• p,'VeD away)
doll' sallllm coho (recia)
ll. Of dI.a sub.ue-e saI..na 10'1 e&U&be. how -ay did 10'1 cacch for doll' food?
_k1D& doll' salIIIm coho (recia)
Ic1np:
coho (recia):
13. Do you 1ulve my1:h1n5 else 10'1 vauld like to say aboue fishin5 regulaeions.such .. probleM or chaDg•• you vauld like to se.7
Q l4-16. m :ml!-nSlmllj lJOtrmlQUS anI
It.. Did you help pue Ul' salmou7 Ye. No
lS. Do you gee sa~n fro.. anocher hou...hold? Ye.No
l6. Do you plan eo fish for salman nexe y.ar? Y••
(13ho?
No
'l'HANX YOO' 7E1l.Y lmCll FOI. YOtl1. lIEU'. TBIS lL\a.'nS'l' INFOllHATION 'JII.I. 8! as!]) TOSURE 'nlElU!: 'lIIJ. 8! ENOO'ClI S'D'BSIS'l'!NCZ SAI."iON FOa. FAHIU!S ALONG TIl! lIVt1l.
132
__
_
_
~
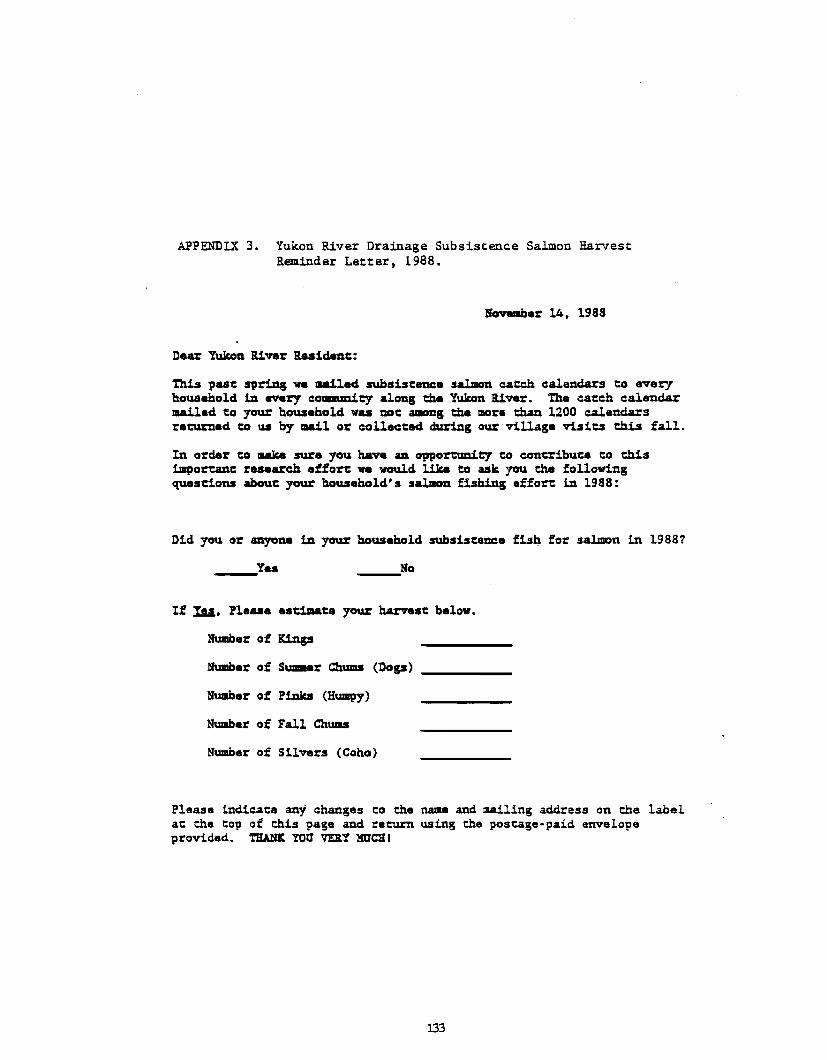
APPENDU 3. Yukon River Drainage Subsistenc.e Salmon HarvestReminder Letter, 1988.
November 14, 1988
Dear Yukon River Resident:
This past Sl'ring we Dl&iled subsisc81ICe salmou catch calendars Co everyhousehold in rrery cOlaUDiey along the Yukon River. The cacch calendarmailed Co your household was DOC amaag the IIIOre than 1200 calendarsrecurned to us by Dl&il or collected during our village visits this fall.
In order to IIAke sure you have an Ol'Por1:UDiey co concri.buce Co thisimportanC re.earch effo1:'1: we would like Co asIe you the followi.ngquestions about your household's sa1.lllon fishing .f£o1:'1: in 1988:
Did you or anyone in your household subsi.cenee fish for salmon in 1988?
--_Yes __ ....;No
If IAa. Please .scimaca your harvesc belovo
Number of lUngs
Number of Sumaaer ChUIIIS (Dogs)
Number of P1nJcs (Humpy)
Number of Fall ChUIIIS
Number of Silvers (Coho)
Please indicaee any changes to the name and mailing address on the labelae the top of this page and r.turn using th. poseage-paid envelopeprovided. 'rH.U« YOU VD.Y WC1l1
133
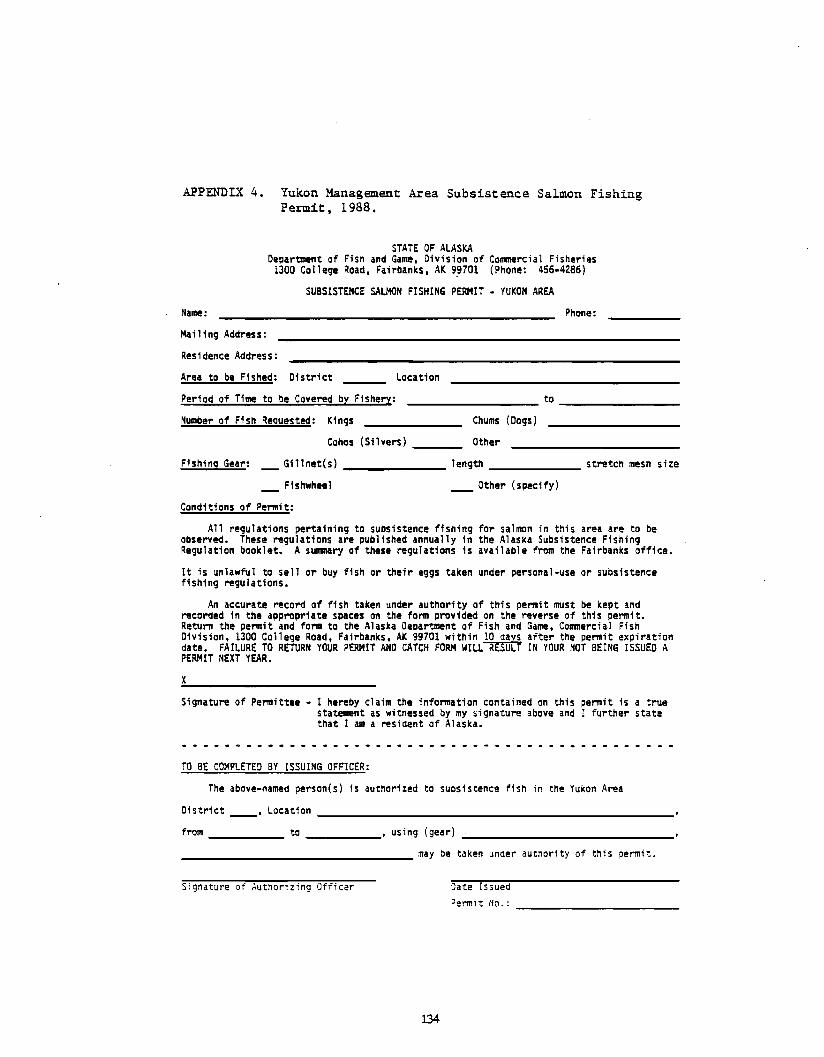
APPENDIX 4. Yukon Management Area Subsistence Salmon FishingPermit, 1988.
STATE OF ALASKADepartment of Fish and Game. Division of Commercial Fisheries
1300 College Road. Fairbanks. AK 9~701 (Phone: 456-4(86)
SUBSISTENCE SALMON FISHING PERMIT YUKON AREA
Name: Phone:
Ma i 11 ng Address:
Residence Address:
Area to be Fished: District Location_________ to _ Period of Time to be Covered by Fishery:
Number of Fish Reguested: Kings Chums (Dogs)
Cohos (Silvers) Other
Fishing Gear: Gfllnet(s) length stretch mesh size
Fishwhee1 Other (specify)
Conditions of Permit:
All regulations pertaining to subsistence fishing for salmon in this area are to beobserved. These regulations are published annually in the Alaska Subsistence FishingRegulation booklet. A summary of these regulations is available from the Fairbanks office.
It is ~nlawfu1 to sellar buy fish or their eggs taken ~nder personal-use or subsistencefishing regulations.
An accurate record of fish taken under authority of this permit must be kept andrecorded in the appropriate spaces on the form provided on the reverse of this permit.Return the permit and form to the Alaska Department of Fish and Game. Commercial FishDivision. 1300 College Road. Fairbanks. AK 99701 within 10E~aYf after the permit expirationdate. FAILURE TO RETURN YOUR PERMIT ANO CATCH FORM WILL R UL IN YOUR NOT BEING ISSUED APERMIT NEXT YEAR.
X
Signature of Permittee I hereby claim the information contained on this permit is a truestatement as witnessed by my signature above and I further statethat I am a resident of Alaska.
TO BE COMPLETED BY ISSUING OFFICER:
The above-named person(s) is authorized to subsistence fish in the Yukon AreaDistrict __ ' Location _
from to , ~sing (gear)
___________________ may be taken under authority of this permit.
Signature of Authorizing Officer
134
Date IssuedPermit No.:
-
_
-
_
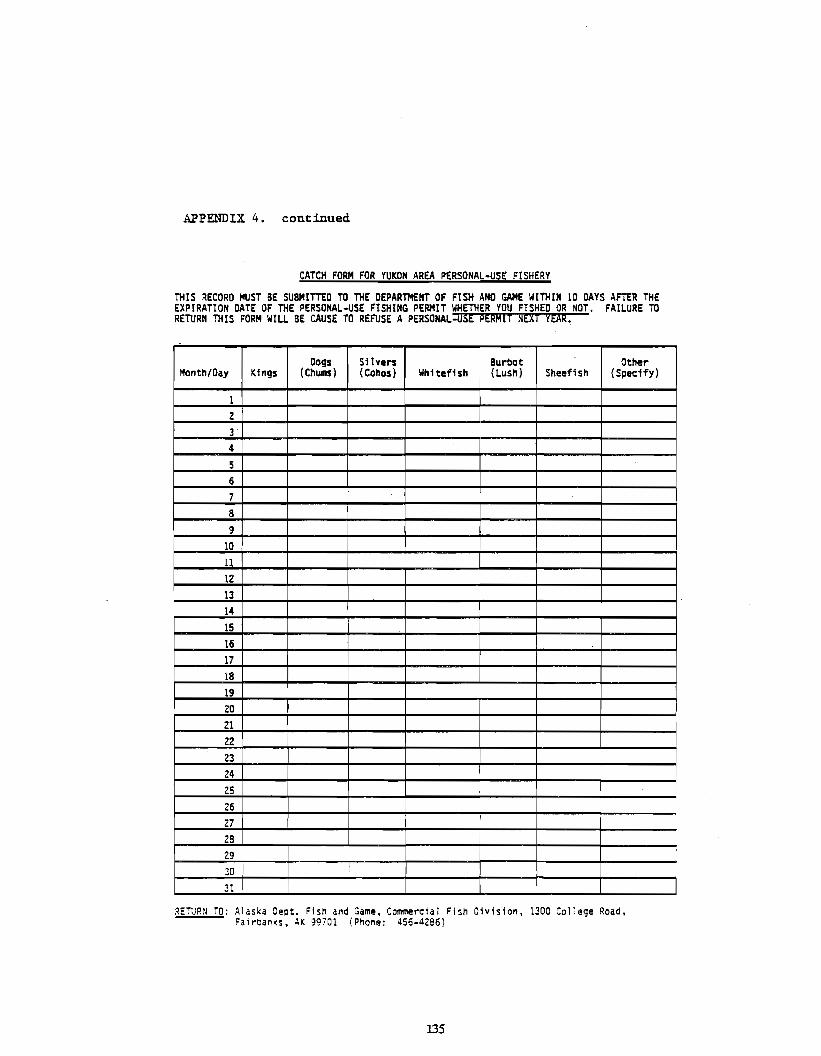
APPENDIX 4. continued
CATCH FORM FOR YUKON AREA PERSONAL-USE FISHERY
THIS RECORD MUST BE SUBMITTED TO THE DEPARTMENT OF FISH AND GAME WITHIN 10 DAYS AFTER THEEXPIRATION DATE OF THE PERSONAL-USE FISHING PERMIT WHETHER YOU FISHED OR ~OT. FAILURE TORETURN THIS FORM WILL BE CAUSE TO REFUSE A PERSONAL-USE PERMIT NEXt YEAR.
Dogs Silvers Burbot OtherMonth/Day Kings (Chums) (Callos) Wllitefish (Lush) Sheefish (Specify)
12
34
56789
1011
1213141516171819202122232425262728293031
RETURN TO: Alaska Dept. Fish and Game, Commercial Fish Division, 1300 College Road,Fairbanks, AK 99701 (Phone: 456-4286)
135
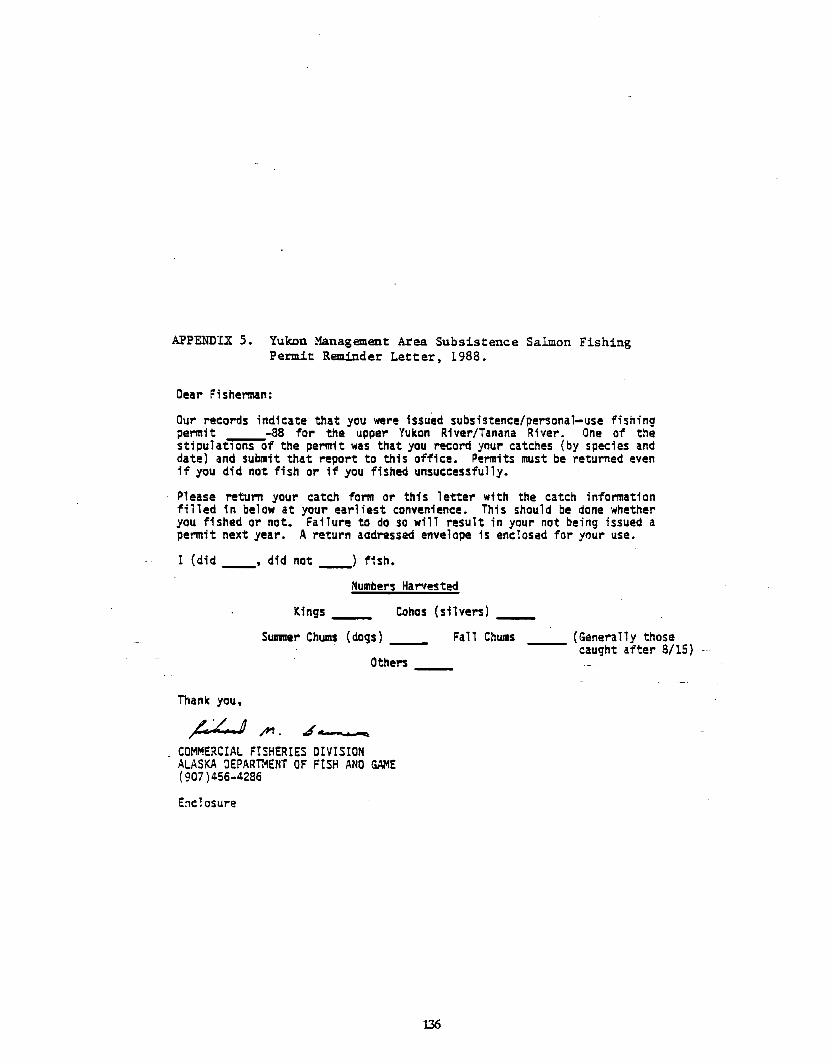
APPENDIX 5. Yukon Management Area Subsistence Salmon FishingPermit Reminder Letter, 1988.
Dear Fisherman:
Our records indicate that you were issued subsistence/personal-use fishinqpermit -88 for the upper Yukon River/Tanana River. One of thestipulat10ns of the permit was that you record your catches (by species anddate) and submit that report to this office. Permits must be returned evenif you did not fish or if you fished unsuccessfully.
Please return your catch form or this letter with the catch informationfilled in below at your earliest convenience. This should be done whetheryou fished or not. Failure to do so will result in your not being issued apermit next year. A return addressed envelope is enclosed for your use.
I (did , did not ) fish.
Numbers Harvested
Kings Cohos (silvers)
Summer Chums (dogs) Fall Chums
Others
Thank you,
~z .d;4'T. .4« __
COMMERCIAL FISHERIES DIVISIONALASKA DEPARTMENT OF FISH ANO GAME(907)456-4286
Enclosure
136
(Genera11 y those------ caught after 8/15)

Related Documents