Early Childhood Research Quarterly 20 (2005) 373–392 Subsidizing child care: How child care subsidies affect the child care used by low-income African American families Marsha Weinraub ∗ , Anne B. Shlay, Michelle Harmon, Henry Tran Temple University, Psychology Department, Weiss Hall, 1701 N. 13th St., Philadelphia, PA 19122, USA Abstract To evaluate the type and quality of child care used by low-income families who were either receiving or not receiving subsidized child care, we interviewed 111 African American parents from a randomly selected sample of low-income families. We inquired about their child-care use, satisfaction with care, work stress, and employment history. Using standardized assessment instruments, independent observers in the children’s child-care setting evaluated the quality of the care and characteristics of the providers. We found that families using subsidized child care were more likely to use center care and other more formal types of care, while families not using subsidized child care were more likely to use a relative in the relative’s home. Families using subsidized care tended to use licensed and registered child-care arrangements more than non-subsidized families. Also, subsidized families spent approximately half as much out-of-pocket money for child care. However, we found no evidence that the care used by families using subsidized care was of any higher quality than that used by non-subsidized families. We examine the possibility that child-care subsidy programs may not be adequately designed or funded to increase the availability of quality child care to low-income families. Educators and policy makers may want to consider additional means of increasing access to quality care in low-income families. © 2005 Elsevier Inc. All rights reserved. Keywords: Child care; Subsidy; Poverty; Low-income families 1. Introduction The Personal Responsibility and Work Opportunity Reconciliation Act of 1996 (PRWORA) dramatically changed federal welfare and child care policies (Schumacher & Greenberg, 1999). By replacing Aid to Families with Dependent Children (AFDC) with Temporary Assistance to Needy Families (TANF), federal entitlements to cash and child-care assistance were terminated, and states were given additional child-care funding to distribute to parents on assistance and to low-income families. Families could now receive funding for child-care subsidies though the federal Child Care Development Fund (CCDF), state funds for CCDF, and funds allocated to child care from TANF. Although child-care funding programs were primarily designed to support parental employment, enhancing parental choice was a clearly stated goal of the new child-care subsidy system (Adams & Rohacek, 2002). Subsidies were designed to enable parents to have more child-care options, thereby increasing parental choice and parent child-care satisfaction, and to facilitate low-income parents’ access to higher quality, more expensive care (Adams & Rohacek, 2002). Access to higher quality care, it was hoped, would foster child development in low-income families, since higher quality care has been linked to enhanced cognitive and language development, pro-social behavior and skills, academic achievement, and socio-emotional development (Barnett, 1995; Burchinal et al., 2000b; Feagans, Fendt, & Farran, 1995; ∗ Corresponding author. Tel.: +1 215 204 7183. E-mail address: [email protected] (M. Weinraub). 0885-2006/$ – see front matter © 2005 Elsevier Inc. All rights reserved. doi:10.1016/j.ecresq.2005.10.001

Welcome message from author
This document is posted to help you gain knowledge. Please leave a comment to let me know what you think about it! Share it to your friends and learn new things together.
Transcript
Early Childhood Research Quarterly 20 (2005) 373–392
Subsidizing child care: How child care subsidies affect thechild care used by low-income African American families
Marsha Weinraub∗, Anne B. Shlay, Michelle Harmon, Henry Tran
Temple University, Psychology Department, Weiss Hall, 1701 N. 13th St., Philadelphia, PA 19122, USA
Abstract
To evaluate the type and quality of child care used by low-income families who were either receiving or not receiving subsidizedchild care, we interviewed 111 African American parents from a randomly selected sample of low-income families. We inquiredabout their child-care use, satisfaction with care, work stress, and employment history. Using standardized assessment instruments,independent observers in the children’s child-care setting evaluated the quality of the care and characteristics of the providers. Wefound that families using subsidized child care were more likely to use center care and other more formal types of care, whilefamilies not using subsidized child care were more likely to use a relative in the relative’s home. Families using subsidized caretended to use licensed and registered child-care arrangements more than non-subsidized families. Also, subsidized families spentapproximately half as much out-of-pocket money for child care. However, we found no evidence that the care used by families usingsubsidized care was of any higher quality than that used by non-subsidized families. We examine the possibility that child-caresubsidy programs may not be adequately designed or funded to increase the availability of quality child care to low-income families.Educators and policy makers may want to consider additional means of increasing access to quality care in low-income families.© 2005 Elsevier Inc. All rights reserved.
Keywords: Child care; Subsidy; Poverty; Low-income families
1. Introduction
The Personal Responsibility and Work Opportunity Reconciliation Act of 1996 (PRWORA) dramatically changedfederal welfare and child care policies (Schumacher & Greenberg, 1999). By replacing Aid to Families with DependentChildren (AFDC) with Temporary Assistance to Needy Families (TANF), federal entitlements to cash and child-careassistance were terminated, and states were given additional child-care funding to distribute to parents on assistanceand to low-income families. Families could now receive funding for child-care subsidies though the federal Child CareDevelopment Fund (CCDF), state funds for CCDF, and funds allocated to child care from TANF.
Although child-care funding programs were primarily designed to support parental employment, enhancing parentalchoice was a clearly stated goal of the new child-care subsidy system (Adams & Rohacek, 2002). Subsidies weredesigned to enable parents to have more child-care options, thereby increasing parental choice and parent child-caresatisfaction, and to facilitate low-income parents’ access to higher quality, more expensive care (Adams & Rohacek,2002). Access to higher quality care, it was hoped, would foster child development in low-income families, since higherquality care has been linked to enhanced cognitive and language development, pro-social behavior and skills, academicachievement, and socio-emotional development (Barnett, 1995; Burchinal et al., 2000b; Feagans, Fendt, & Farran, 1995;
∗ Corresponding author. Tel.: +1 215 204 7183.E-mail address: [email protected] (M. Weinraub).
0885-2006/$ – see front matter © 2005 Elsevier Inc. All rights reserved.doi:10.1016/j.ecresq.2005.10.001

374 M. Weinraub et al. / Early Childhood Research Quarterly 20 (2005) 373–392
Loeb, Fuller, Kagan, & Carrol, 2004; NICHD Early Child Care Research Network, 1999; Peisner-Feinberg et al., 2001;Ramey & Campbell, 1992).
Child-care quality is a critical issue for all children, but it matters even more for low-income children (Duncan &Brooks-Gunn, 2000; McLoyd, 1998). Low-income children, who may be less likely to have compensatory advantagesavailable at home, are also less likely to have quality child care than children from more affluent families (Brooks-Gunn,Brown, Duncan, & Moore, 1995; Fuller & Strath, 2001; Phillips & Adams, 2001; Vandell & Wolfe, 2000). Researchershave found that quality child care brings with it more benefits for low-income children than for higher income children(Burchinal, Peisner-Feinberg, Bryant, & Clifford, 2000a; Peisner-Feinberg et al., 2001). Therefore, increasing accessto quality child care for low-income families is an important and meaningful public policy goal.
Although many eligible children do not receive child-care assistance (Blau & Tekin, 2001; Child Care Bureau, 2002;Shlay, Weinraub, Harmon, & Tran, 2004), there are still many children who do. In 2002, it was estimated that more than 2million children nationwide were receiving child-care subsidies through public funding programs (Adams & Rohacek,2002). Yet, little is known about the quality of subsidized child-care arrangements (Mezey, Schumacher, Greenberg,Lombardi, & Hutchins, 2002) and about how these subsidies affect the child-care usage of low-income parents.Do subsidies enable parents to have more choice in child-care arrangements, fewer work–family conflicts, and greatersatisfaction with the care, and better quality care for their children? In this study, we investigate these dimensions of carein two groups of low-income families—those using child-care subsidies to pay for care and those not using subsidies.
1.1. What we know about the effects of subsidized care
Information from administrative records and parental surveys reveal several things about subsidized care in com-parison to non-subsidized care.
First, subsidized children are more likely to be cared for in legally regulated settings, either in child-care homes orcenters, than other low-income children. Administrative figures show that 76% of children receiving CCDF subsidieswere cared for in regulated homes or centers (Adams & Rohacek, 2002), but there is wide variation across states. Astudy of five states showed that the proportion of subsidized children whose main child care arrangement was center-based ranged from 18% in Oregon to 79% in Texas (Child Care Subsidy Dynamics Study Team, 2002). Comparisonswithin groups of low-income families show that low-income families with child-care subsidies are more likely to accessformal and regulated child care than low-income families without subsidies (Brooks, Risler, Hamilton, & Nackerud,2003; Mezey et al., 2002; Schumacher & Greenberg, 1999).
Second, the programs providing child care to subsidized families tend to be diverse, ranging from small family-based programs to large child-care centers serving hundreds of children (Child Care Subsidy Dynamics Study Team,2002). The quality of those providers who serve large numbers of subsidized children has been called into question.Examining administrative records, Wisconsin researchers reported that programs specializing in meeting the demandfor subsidized care were less likely than other child care programs in the state to employ highly educated staff andmore likely to experience high staff turnover (Adams, Roach, Riley, & Edie, 2001).
Third, the average duration of subsidy for children is short. According to theChild Care Subsidy Dynamics Studyteam (2002), the average duration of subsidy across five states for any particular child ranged from 3 to 7 months.
And finally, we know that, as planned, families on subsidies pay considerably less out of pocket funds for their carethan other families (Brooks et al., 2003). According toSchumacher and Greenberg (1999), families purchasing carewith subsidies paid an average of $58 per month in 1998 dollars, compared to the $245 per month paid by familiespurchasing care without subsidies.
Studies concerning the effectiveness of the current subsidy system have been primarily limited to administrativerecords and tend to focus on subsidy utilization. While the information on the frequency of subsidy uptake amongeligible families is useful, little is known about whether subsidies enable low-income families to access higher qualitycare than they would without these subsidies, and whether the care that subsidy recipients use is more likely to meettheir needs than the care they would otherwise access. In one of the few studies addressing this issue,Brooks et al.(2003)found that compared to mothers from subsidy waiting lists, low-income mothers receiving subsidies for theirchild’s care spent half as much of their income on child care. They were also more likely to have their children in aformal licensed child-care center, report more stable care, have an easier time finding care, and be more satisfied withtheir child care arrangement. In that study, however, the researchers did not directly observe the quality of the care thatthe subsidized and non-subsidized families received.
M. Weinraub et al. / Early Childhood Research Quarterly 20 (2005) 373–392 375
There are many reasons to be concerned about whether the current subsidy system increases the access of low-incomefamilies to higher quality care. AsAdams and Rohacek (2002)have observed, the priorities of the child-care subsidysystem have been deliberately slanted toward supporting parental employment. This emphasis on parental choice hasallowed all forms of child care to be supported in some states, whether care is licensed and/or regulated or not. Inmany states, subsidy funds are payable to kith and kin caregivers with little or no child-care training or experience.Federal regulations require states to dedicate at least 4% of the CCDR-related funds to efforts that increase the qualityand availability of child care, but that amount is often not sufficient to make substantial changes in the availabilityof quality care. Finally, the limits on fees paid to providers, along with regulations on fees charged and conditionsof child-care instability, offer little opportunity to providers receiving child-care subsidies to make quality-enhancingimprovements (Helburn, Morris, & Modigliani, 2002).
1.2. This study
In this study, we investigated how the receipt of child-care subsidies affected the care families used. To do this,we compared the type and quality of early child care obtained by families using some kind of child-care subsidy orassistance to the quality of early child care used by comparable low-income families who did not receive any subsidizedassistance. Rather than rely on administrative data, we directly interviewed a sample of parents selected from a largerpool of randomly selected low-income African American parents to learn about their child care-related experiences.To measure the type and quality of child care used, we interviewed parents and providers about the children’s care, andwe observed the children in their child-care arrangement. Finally, we measured the qualifications and professionalismof the providers.
Recognizing that our findings would depend on the particular sample of families and providers we recruited forstudy, we took care to select randomly from an identified population of low-income families. We were also careful todocument the differences between the families who used child-care assistance and those who did not, as well as thedifferences between the providers who consented to be studied and those who did not.
2. Method
2.1. Sample selection
In Fig. 1, we present a flow chart diagramming the participant selection. We began by calling 12,455 randomlyselected phone numbers of households in specified Philadelphia zip codes. According to 1990 U.S. Census figures,these zip codes included a significant number of low-income residents, both African American and White. We calledeach telephone number at least once. From these contacts, 85 White1 and 457 African American respondents whowere at least 18 years of age, employed at least 25 h per week, and had children less than 4 years of age living intheir homes were identified and completed an initial telephone survey. Of these families, 316 (69%) were AfricanAmerican and met the household income eligibility criteria of being at or below the Metropolitan Statistical Area(MSA) median ($41,392), having a child under the age of five living in the household as of September 2002, using achild-care arrangement for that child at least 20 h per week on a regular basis, having no language barriers, and willingto complete a longer interview for $25. (SeeShlay et al. (2004)for further details of that sampling procedure.) Finally,143 families completed the preliminary interview and were invited to participate in this study.
2.2. Sample characteristics
Of the 143 respondents invited to participate, 111 (78%) came to university offices to participate in a study of child-care preference.2 All respondents were parents, and all but two of the parents were mothers. There were significant
1 We had planned to include both White and African American families. The 2000 Census figures, released after the sampling was completed forthis study, revealed that significant changes occurred between 1990 and 2000, with few eligible white families remaining in these census tracts in2000. The number of eligible White families (85) was insufficient for analyses, and so they were dropped from the sample.
2 Of the 32 the families who did not participate, 17 were deemed ineligible (6 no longer had a child in the household under age five and 11 were notusing child care at the time of the study), 4 were unable to be contacted, and 11 decided not to participate. One family completed a parent interview

376 M. Weinraub et al. / Early Childhood Research Quarterly 20 (2005) 373–392
Fig. 1. Flow chart for participant selection. Notes: 1 = Ineligible screening calls included those in which there was no adult in the household, thewrong zip code, no child under the age of 4, respondent not employed, or respondent not White or African American. 2 = Ineligible respondentsincluded those who had difficulties answering the interview questions, who refused many of the items, or who were repeatedly unavailable tocomplete the interview.
differences in the mean age of those respondents who participated in the study and those who did not (30 and 34 years,respectively), family type (participants were more likely to be single parents), and level of education (participants wereslightly more educated).
The average age of the target child selected for the study in each group was reported to be 3½ years old. Ofthe 111 families, 52 families reported receiving assistance to help offset the cost of child care and 59 familiesreported not receiving government assistance of any kind. The nine families who had their children in Head Startwere assigned to the group of families who reported using child-care subsidies. This is because families whosechildren were eligible for Head Start would have met the income guidelines for other federal assistance programsin the state, but did not have to apply separately for child-care funds. Head Start programs in the region alsotake children from families on subsidized care. Thus, families receiving assistance were those receiving assis-tance from any of three programs: state subsidy funding (mothers were required to be employed at least 25 h),federal TANF funding (mothers not required to work, but limited to 5 years in the program lifetime total), andHead Start (families required to be at or below 100% of the Federal Poverty Income Guideline). Of these, 64.5%were receiving state subsidies, 28.8% were receiving TANF subsidies, and 17.3% had their children in Head Start.(Because children could be both in Head Start and receive child-care assistance funds, this percentage exceeds100%.)
Table 1displays the familial and demographic characteristics of the participating parents who reported receiv-ing child-care assistance and those who did not report receiving child-care assistance. It also presents the resultsof statistical tests of the differences between the groups. Although not significantly different, there was a trend(p = .07) for those receiving child-care assistance to be somewhat younger (M = 29.3 years) than those not receiv-ing child-care assistance (M = 31.7 years). The majority of participants from both groups reported their marital
but was dropped from the sample when their data proved fictitious.

M. Weinraub et al. / Early Childhood Research Quarterly 20 (2005) 373–392 377
Table 1Demographic and background characteristics of parents receiving and not receiving financial assistance for child care expenses
Receiving child-careassistancea
Not receiving child-careassistance
t or χ2 p
N = 52 N = 59
Gender% Female 100 97 1.80 .18
Target child’s age (in months)M 43.10 43.02 .03 .98S.D. 16.75 13.74
Parent’s age (in years) n = 52 n = 58M 29.33 31.71 −1.86 .07S.D. 6.30 7.02
Marital status% Married and living with spouse 10 29 6.74 .03% Separated or widowed 10 5% Single, never been married 80 66% Currently living with a spouse or partner 81 54 8.76 <.01
Number of people in householdM 3.67 3.37 1.38 .17S.D. 1.10 1.19
Number of children in home under 18M 2.48 1.92 3.05 <.01S.D. 1.02 .93
Education level% High school diploma/GED or below 46 14 14.31 <.001% Some college/vocational school or Associate’s degree or above 54 86% Currently in school/taking classes 40 27 2.19 .14% Currently employed 79 88 1.26 .26
Times of day worked n = 41 n = 52 5.60 .02% Days (7 a.m. to 7 p.m.) 85 64% Nights (7 p.m. to 7 a.m.) or times vary 15 36
Hours per week at work (S.D.) n = 41 n = 52M 33.54 36.98 −1.75 .08S.D. 19.79 9.17
Monthly household income n = 51 n = 59M $1417.37 $2350.39 −4.17 <.001S.D. $935.45 $1394.70
a This group includes parents receiving state subsidy for working parents, child-care assistance through welfare, or Head Start.
status as single, but more of the child-care assistance recipients were single and never-married than their non-recipient counterparts (80 and 66%, respectively). At the same time, a higher percentage of assistance recipi-ents reported living with a spouse or partner (81%) than did non-assistance recipients (54%). Parents receivingchild-care assistance had significantly more children in the home under age 18 (M = 2.48) than non-recipients(M = 1.92).
Parents receiving child-care assistance were less educated than parents not receiving assistance. Only 54% ofassistance recipients had schooling beyond high school graduation compared to 86% of non-recipients. At the sametime, 40% of the assistance recipients and 27% of the non-assistance recipients were in school or taking classes at thetime of the survey, but this difference was not statistically significant.
Seventy-nine percent of the child-care assistance recipients and 88% of the non-recipients were employed. Of theseemployed parents, more assistance recipients (85%) were working during standard hours (7 a.m. to 7 p.m.) as comparedto the employed non-assistance recipients (64%). There was a tendency for families using assistance to work fewer

378 M. Weinraub et al. / Early Childhood Research Quarterly 20 (2005) 373–392
Table 2Comparison of parent characteristics by those families or care providers rated and not rated for quality
Receiving child-careassistance
t or χ2 p Not receivingchild-care assistance
t or χ2 p
Rated forquality
Not ratedfor quality
Rated forquality
Not ratedfor quality
Age n = 35 N = 17 1.25 .22 n = 34 N = 24 .68 .50M 28.57 30.88 31.18 32.46S.D. 6.53 5.64 7.17 6.89
Marital status N = 35 N = 17 .50 .78 N = 35 N = 24 .43 .81% Married and living with spouse 11.4 5.9 25.7 33.3% Separated, divorced or widowed 8.6 11.8 5.7 4.2% Single, never been married 80.0 82.4 68.6 62.5
Education level n = 35 N = 17 .25 .62 n = 35 N = 24 3.05 .08% Some college/vocational school or above 51.4 58.8 80.0 95.8
Monthly household income N = 34 N = 17 .35a .73 N = 35 N = 24 −.33 .74M $1376 $1501 $2401 $2277S.D. $588 $1418 $1453 $1332
Income-to-needs N = 32 N = 13 −.58 .57 n = 34 N = 22 −.51 .61M .58 .53 .85 .76S.D. .97 .86 1.58 1.47
Times of day worked n = 28 N = 13 .73 .39 n = 30 N = 22 2.98 .08% Nights (7 p.m. to 7 a.m.)/times vary 17.9 7.7 26.7 50.0
Number of children in home under 18 N = 35 N = 17 .82 .42 N = 35 N = 24 1.44 .16M 2.40 2.65 1.77 2.13S.D. 1.09 .86 .877 .99
a Assuming unequal variances between groups.
hours per week (M = 34 and 37 h, respectively). Assistance recipients had, on average, a significantly lower monthlyhousehold income ($1417) than non-assistance recipients ($2350).
2.2.1. Participating child-care providersNot all of the families’ child-care providers agreed to participate in the child-care observation procedures of this
study. Only 68% of the providers invited to participate in the study completed forms, and slightly fewer (64%) permittedus into their setting to observe.
Table 3Distribution of observed child care programs as a function of child-care assistance status
Receiving child-careassistance
t or χ2 p Not receivingchild-care assistance
t or χ2 p
Rated forquality
Not ratedfor quality
Rated forquality
Not ratedfor quality
% Licensed/registered arrangement n = 35 n = 17 7.91 < .01 n = 35 n = 23 7.82 .0173.9 70.6 72.4 52.2
Primary child-care arrangement grouped n = 35 n = 17 12.69 < .01 n = 34 n = 24 10.79 <.01% Center 91.4 47.1 76.5 33.3% Non-center care 8.6 52.9 23.5 66.7
Primary child care arrangement n = 35 n = 17 12.69 <.01 n=34 n=24 10.87 <.01% Center 91.4 47.1 76.5 33.3% Non-relative in their home 5.7 35.3 11.8 29.2% Relative care 2.9 17.6 11.8 37.5

M. Weinraub et al. / Early Childhood Research Quarterly 20 (2005) 373–392 379
Characteristics of those families where the providers were rated for quality of care within each child-care assistancegroup are presented inTable 2along with the results of statistical tests. There were no significant differences in theprovider participation rate between the families receiving child-care assistance and those not receiving assistance (67%versus 57%), and no significant differences between theparents’ characteristics for those whose care providers wererated for quality and those whose care providers were not rated for quality. However, within the familiesnot usingchild-care assistance (n = 59), those providers for whom we have provider information (n = 34) came from familieswhere the parents tended to be less educated (80% of those who participated had education beyond high school,compared to 96% whose caregivers did not participatep = .08) and somewhat more likely to work days than nights(73% versus 50%,p = .08). These two trends reduced the differential in education level and day and night care betweenfamilies receiving assistance and those not receiving assistance (seeTable 1), resulting in more equitable comparisonsbetween care providers in the subsidized and non-subsidized family groups.
Table 4Background characteristics of parents receiving and not receiving assistance for those families for whom child-care providers were observed
Receiving child-careassistancea
Not receiving child-careassistance
t or χ2 p
N = 35 N = 35
Gender% Female 100 97 1.01 .31
Target child’s age (in months)M 43.51 43.94 −.12 .91S.D. 17.90 12.90
Parent’s age (in years) n = 35 n = 34 −1.58 .12M 28.57 31.18S.D. 6.53 7.17
Marital status% Married and living with spouse 11.40 25.70 2.43 .30% Separated or widowed 8.60 5.70% Single, never been married 80.00 68.60% Currently living with a spouse or partner 22.9 40.00 2.39 .12
Number of people in householdM 3.63 3.17 1.67 .10S.D. 1.17 1.12
Number of children in home under 18M 2.40 1.77 2.66 .01S.D. 1.09 .88
Education level% High school diploma/GED or less 48.60 20.00 6.34 .01% Some college/vocational school or associate’s degree or above 51.40 80.00
% Currently in school/taking classes 42.90 34.30 .54 .46
% Currently employed n = 34 n = 3582.40 85.70 .15 .70
Times of day worked n = 28 n = 30 .65 .42% Days (7 a.m. to 7 p.m.) 82.1 73.3% Nights (7 p.m. to 7 a.m.) or times vary 17.9 26.7
Hours per week at work (S.D.) n = 28 n = 30 −1.01 .32M 34.73 37.08S.D. 9.14 8.69
Monthly household income n = 34 n = 35 −3.82b <.001M $1375.74 $2400.66S.D. $588.19 $1453.43
a This group includes parents receiving state subsidy for working parents, child-care assistance through welfare, or Head Start.b Assuming unequal variances between groups.

380 M. Weinraub et al. / Early Childhood Research Quarterly 20 (2005) 373–392
Table 3presents the types of child-care programs for those providers who allowed us to observe and those whodid not in each group along with the results of statistical tests of the differences between the groups. Not surprisingly,providers who consented to be observed were more likely to be licensed or registered providers and more likely to bein formal care arrangements rather than informal care than those who did not consent to be observed. These differenceswere true for both groups of families, those receiving child-care assistance and those not receiving assistance. Thus,although there were differences in the providers who chose to participate and those who refused, this differentialparticipation was about the same for the two groups of families.
Differences between the families whose care was observed or not as a function of parental child care assistance statuscan be looked at yet another way.Table 4shows the comparison of families receiving assistance and not receivingassistance for only those families whose care providers were observed. As in the larger sample, families receivingassistance whose child-care setting was observed had more children in the home under 18 years of age (2.40 versus1.77,p ≤ .01), had lower educational levels (51% with some college versus 80% with some college,p ≤ .01) and hadlower monthly incomes (M = $1375 versus $2401,p ≤ .001) than families not receiving child-care assistance whosechild care setting was observed. Because of the differential participation rate for the care providers, family differencesas a function of child-care assistance level on several other variables (marital status, times of day worked) are no longerobserved for those families whose child-care setting was rated for quality, making the comparisons for quality of carebetween families on assistance and those not on assistance somewhat more equitable.
3. Procedure
Between November 2002 and May 2003, we telephoned parents, ascertained their eligibility for this study, andinvited them to participate. We interviewed parents for 20 min to update personal, familial, and child-care information.With the parents’ help, we selected a “target child” for this study. This was determined by the ages of the childrenwithin the household in a care arrangement. A child 3 or 4 years of age was selected as the target child over youngeror older children in the household.
To determine the child-care arrangement that would become the focus for our observation, we asked parents toidentify up to three child-care arrangements they used for the target child on a regular basis for at least 20 h per week.When families used more than one child-care arrangement, we used the following criteria to select the child-carearrangement in which to observe: (1) the care arrangement used for the most hours per week and (2) the child caresetting which was the most formal of arrangements (i.e., center care versus relative care).
Upon completion of the telephone interview, parents were asked for contact information regarding their child-careprovider and were asked to notify their provider about our upcoming call. Parents were paid $30.00 as a token ofappreciation for their participation.
We then contacted child-care providers and administered a brief provider interview over the telephone. If the caretook place in a child-care center, we also asked directors to complete a brief interview about the center. Prior to theobservation visit, we sent the providers a consent form and questionnaire packet to complete. The questionnaire packetand consent form were either picked up at the visit or returned in the mail.
Trained observers, blind as to family subsidy status, visited the child-care location for approximately 2½ h on thepre-arranged morning. Visits included a brief introduction to the provider, followed by an unobtrusive observationof the caregiving environment and the care provider’s interaction with the children in the group. At the end of theobservation, the observer asked the provider questions regarding items that could not be observed (e.g., afternoonactivities) and indicated final ratings on the child-care assessment score sheets.
Observers collected child-care observation data on 59 child-care center classrooms, seven family day care homes,and five informal care arrangements.3 An additional four care providers completed the interviews and questionnairesbut refused to be observed. Sixty-eight (96%) questionnaires were completed and returned from the care providers.We paid providers $30.00 for their participation.
3 Four child-care center classrooms and one family day care home had two children from different families attending. Observations were conductedand provider questionnaires were collected only once from each arrangement if a care arrangement had multiple children assigned to the same group,i.e., receiving child-care assistance or not receiving child-care assistance. In the event the care arrangement cared for two children assigned to differentgroups; one receiving and one not receiving child-care assistance, their data was counted twice; once for each group.

M. Weinraub et al. / Early Childhood Research Quarterly 20 (2005) 373–392 381
3.1. Measures
3.1.1. Parent interviewOn the telephone, interviewers collected information from the parent regarding demographic and background
characteristics, child-care usage, parental employment experiences, and household income.During the telephone call, interviewers also administered an adapted version of the Work and Family Conflict Scale
(Marshall & Barnett, 1993) in question format. The Work and Family Conflict Scale assesses the stressors and benefitsassociated with combining work and family. The scale consists of 13 items that measure the strains associated withcombining work and family (e.g., ‘Working causes you to miss out on some of the rewarding aspects of being a parent’),and eight items that measure the benefits associated with combining work and family (e.g., ‘Having both work andfamily responsibilities gives your life more variety’). Respondents answer on a four-point rating scale from 1, ‘Not atall true’ to 4, ‘Very true.’ Reliability scores for the adapted version of the scale have been high (.87;NICHD ECCRN,1999). For this study, internal consistency coefficient yielded .78. High scores on the Work and Family Conflict Scalehave been significantly correlated with depression and anxiety in adult women (Wortman, Biernat, & Lang, 1991).
3.1.2. Child care observation measuresStandardized observational procedures were used to assess the global quality of the caregiving environment. These
included the Early Childhood Environment Rating Scale—Revised (ECERS-R;Harms, Clifford, & Cryer, 1998), theFamily Day Care Rating Scale (FDCRS;Harms & Clifford, 1989), the Infant/Toddler Environmental Rating Scale(ITERS; Harms, Cryer, & Clifford, 1990), and the Informal Child Care Quality Instrument (ICCQI;Matthews &Thornburg, 2001). To assess the caregiver’s sensitivity with the children, the Arnett Caregiver Interaction Scale wasused (Arnett, 1989). Each measure is described below.
3.1.3. Early Childhood Environment Rating Scale—Revised EditionThe Early Childhood Environment Rating Scale—Revised Edition (ECERS-R;Harms et al., 1998) is a standardized
instrument that examines the developmental appropriateness of classroom practices and the global quality of the care-giving environment in center classrooms for children 2½ to 5 years of age. It consists of 43 items organized intoseven subscales assessing particular dimensions of the environment including: Space and Furnishings, Personal CareRoutines, Activities, Interaction, Program Structure, and Parent and Staff Involvement. Within each subscale, discreteitems are scored on a seven-point scale with quality descriptors anchored at “1” (inadequate; does not meet children’scustodial care needs), “3” (minimal; meets custodial needs and some basic developmental needs), “5” (good; meetsdevelopmental needs), and “7” (excellent; highly personalized care). To obtain a score on the ECERS-R, all itemsunder odd-numbered descriptors at lower scores must be satisfied to move up the scale. When a classroom is observedto have all the characteristics in a lower description, but only part of the next higher description, the even number scorein between is assigned.
Although there is little published psychometric information on the ECERS-R, reliability, and validity of its pre-decessor, the ECERS, has been well established (Harms & Clifford, 1980). The scale authors report reliability forthe total score on the ECERS-R to be .92 and subscale internal consistencies ranging from .71 to .88 (Harms et al.,1998). For this study, we found the total score reliability to be .91, with reliability on the subscales ranging from .53(Personal Care Routines) to .89 (Activities). Higher scores on the ECERS and/or ECERS-R have been found to bepositively correlated with teacher’s education (Cassidy, Buell, Pugh-Hoese, & Russell, 1995; Holloway, Kagan, Fuller,Tsou, & Carroll, 2001; Howes, Whitebrook, & Phillips, 1992), and several child outcomes, including better cognitivelinguistic, and communicative performance (Burchinal et al., 2000a, 2000b; Peisner-Feinberg & Burchinal, 1997), andbetter math skills (Burchinal et al., 2000a; Peisner-Feinberg et al., 2001).
3.1.4. Infant/Toddler Environment Rating ScaleThe Infant/Toddler Environment Rating Scale (ITERS;Harms et al., 1990) containing 35 items is an adaptation of
the ECERS created for use with infants from birth to 11 months and toddlers 12–30 months in a center classroom.Like the ECERS-R, the ITERS is divided into seven subscales: Furnishings for Display for Children, Personal CareRoutines, Listening and Talking, Learning Activities, Interaction, Program Structure, and Adult Needs. Scoring forthe ITERS is conducted in the same fashion as for the ECERS-R.
382 M. Weinraub et al. / Early Childhood Research Quarterly 20 (2005) 373–392
The scale authors report the test–retest reliability for the overall scale as .79 and the individual subscales rangingfrom .58 to .76. For this study, we found an internal consistency coefficient for the total score to be .89. Scores on theITERS and the ECERS measure similar constructs. Scores on the ITERS have been shown to be correlated with scoreson the ECERS (Burchinal et al., 2000a, 2000b; Scarr, Eisenberg, & Deater-Decker, 1994). Like the ECERS, higherscores on the ITERS have been shown to be related to higher teacher education (Cassidy et al., 1995) and children’slanguage and cognitive development (Burchinal et al., 2000; Peisner-Feinberg & Burchinal, 1997). ITERS scores havealso been found to be related to teacher’s interaction with the children (De Kruif, McWilliam, Ridley, & Wakely, 2000).
3.1.5. Family Day Care Rating ScaleThe Family Day Care Rating Scale (FDCRS;Harms & Clifford, 1989) is a modification of the ECERS that assesses
the quality of care-giving setting in a family day care home. It consists of 32 items that cover six categories including:Space and Furnishings, Basic Care Routines, Language and Reasoning, Learning Activities, Social Development, andAdult Needs. Because family day care homes usually include children of different ages, many items have two versionsfor children younger than and older than 2 years of age. One or both versions are scored depending on the ages of thechildren served. Scoring for the FDCRS is conducted the same way as for the ECERS-R and the ITERS.
The FDCRS has demonstrated adequate psychometric properties. The scale authors have reported internal reliabilityestimates on the subscales to range from .70 to .93. For this study, we found the total score reliability to be .71. Scoreson the FDCRS have been shown to be associated with structural measures of quality such as group size (Hollowayet al., 2001), ratios (Kontos, Howes, Shin, & Galinsky, 1995), teacher education (Fiene et al., 2002; Holloway et al.,2001), and training (Kontos, Howes, & Galinsky, 1996). Higher scores have also been shown to be related to the useof a curriculum (Fiene et al., 2002).
3.1.6. Combining child-care scores across child-care typesFor comparisons of child care across families receiving assistance and those not receiving assistance, scores from
the ECERS-R, FDCRS, and ITERS were considered separately and they were also combined for an overall score of thequality of the care-giving environments. We consider combining the ECERS-R, ITERS, and the FDCRS an acceptablecourse of action, as the format of scoring on all three measures is identical. While the subscales comprising eachof the three measures are not identical, the comprehensive definition of the environment is functionally similar. Theconceptual framework for evaluating the quality of the programs is based on the current definitions of best-practicesand is consistent across all three measures.
3.1.7. Caregiver Interaction ScaleThe Caregiver Interaction Scale (CIS;Arnett, 1989) was used to assess a specific caregiver’s (usually the head care
provider) involvement and sensitivity with the children in the group. The scale consists of 26 items organized into foursubscales including positive interaction (e.g., Speaks warmly to the children), punitiveness (e.g., Seems critical of thechildren), detachment (e.g., Does not seem interested in the children’s activities), and permissiveness (e.g., Does notreprimand children when they misbehave). Items are rated on a four-point scale indicating the extent to which eachbehavior occurs, from not at all (“1”) to very much (“4”).
The CIS has been used to augment the ECERS, FDCRS, and ITERS in numerous studies (De Kruif et al., 2000;Fiene et al., 2002; Howes, Phillipsen, & Peisner-Feinberg, 2000;Jaeger & Funk, 2001; Kontos et al., 1996; Peisner-Feinberg et al., 2001) and has demonstrated adequate reliability and validity. Internal consistency coefficients reportedfor three of the subscales (harshness, detachments, and sensitivity) have been high (i.e.,≥.81) (Helburn, 1995; Howes,Smith, & Galinsky, 1995; Shlay, Jaeger, & Weinraub 1998). For this study, we found the internal consistency to be.86. Positive scores on the measure have been linked to the use of a curriculum (Fiene et al., 2002), teacher education(De Kruif et al, 2000; Howes, 1997; Kontos et al., 1996), training (Kontos et al., 1996), children’s social competence(Howes et al., 1992), and higher scores on global measures of quality (Wishard, Shivers, Howes & Ritchie, 2003).
3.1.8. Observer training and reliabilityTwo observers were trained to score the ECERS-R, FDCRS, and the ITERS. Inter-rater reliability was deemed
acceptable if observers maintained a minimum of 80% agreement within one-scale point on each item andr ≥ .70across all items at each observation. Inter-rater reliability was adequately established on four consecutive visits for

M. Weinraub et al. / Early Childhood Research Quarterly 20 (2005) 373–392 383
each measure prior to data collection.4 In addition to achieving reliability prior to data collection, checks were madethroughout the study.5
Next, observers were trained to score the ICCQI. Inter-rater reliability was determined acceptable ifr ≤ .80 overfour consecutive ratings of informal child-care environments viewed of pre-recorded video observations. Inter-raterreliability was adequately obtained prior to data collection.6
Finally, two observers were trained and certified to score the Caregiver Interaction Scale (CIS;Arnett, 1989). Tobe certified on the CIS, inter-rater reliability (r ≥ .70) needed to be established for each observation. The CIS wasconducted during all visits using each of the formal environmental quality measures (N = 12). Inter-rater reliability wasadequately demonstrated on all visits prior to and during data collection.7
3.1.9. Center director interviewWe interviewed center directors to collect information about the program and personal characteristics of the director.
We asked directors about the number of children served, number of children receiving subsidies, center fees, numberof teachers employed at the center, and the average education level of the head teachers. We also asked directors abouttheir education level, years experience in child care, and their time at the center.
3.1.10. Provider interviewWe asked the care providers 13 questions concerning their general professional and personal characteristics.
Providers reported the number of children in their group, the number of providers available each day, number ofsubsidized children, hours worked per week, child-care income, job satisfaction and commitment to being a child-careprovider. We also asked family day care providers and informal care providers about their fees.
3.1.11. Provider questionnaireCare providers completed three standardized questionnaires that assessed various care-giving characteristics includ-
ing knowledge of child development, child-rearing attitudes, and professionalism.Knowledge of child development and the appropriate activities for children of different ages was examined using the
Knowledge of Infant Development Inventory—3- to 6-year-old version (KIDI;MacPhee, 1981). The measure consistsof 58 statements about child development to which the respondent indicates their agreement or disagreement. Examplesof items include: ‘the parent just need to feed, clean and cloth the baby for it to turn out fine’ and ‘a typical four-yearold can print his/her own name.’ Internal reliability coefficients have been reported ranging from .67 to .82. (Conrad,Gross, Fogg, & Ruchala, 1992; MacPhee, 1981; Shlay et al., 1998). For this study, internal consistency coefficient forthe 3- to 6-year-old version of the KIDI is .74. Parents’ scores on the KIDI have been related to their formal educationalexperiences regarding child development (MacPhee, 1981), the age-appropriateness of stimulation they provide in thehome (MacPhee & Fabio, 1992), and, in interaction with maternal confidence, predicts the quality of the mother–childinteraction.
Child-rearing attitudes were assessed using the Parental Modernity Scale (Schaefer & Edgerton, 1985). This ques-tionnaire consists of 30 statements about rearing and education young children, assessing the extent to which therespondent has authoritarian attitudes regarding child rearing. Examples of the items include: ‘in order to be fair, ateacher must treat all children alike’ and ‘children will not do the right thing unless they must.’ The respondent indicatesthe extent to which they agree with each statement based on a five-point rating scale (1 = strongly disagree, 5 = strongly
4 Two observers obtained inter-rater reliability coefficients on the ECERS-R ranging from .86 to .98 (M = .93) with the percent agreement withinone rating point averaging 96%. Inter-rater reliability coefficients on the FDCRS ranged from .89 to .96 (M = .92) with the percent agreement withinone rating point averaging 93%. Inter-rater reliability coefficients on the ITERS ranged from .83 to .94 (M = .88) with the percent agreement withinone rating point averaging 89%.
5 Half way through data collection, two inter-rater reliability visits were conducted using the ECERS-R and one reliability visit was conductedFDCRS. Inter-rater reliability coefficients on the ECERS-R were .88 and .98 with percent agreement within one rating point registering at 88 and100%, respectively. Inter-rater reliability on the FDCRS was .98 with 100% percent agreement within one rating point. Because five or fewer visitswere conducted using the ITERS and ICCQI, reliability was not checked during data collection.
6 Two observers obtained inter-rater reliability coefficients on the ICCQI ranging from .83 to .91 (M = .86).7 Reliability coefficients on the Arnett obtained for these 12 visits ranged from .76 to.93 (M = .84). Inter-rater reliability on the Arnett was checked
again during data collection when the reliability on the ECERS-R and FDCRS was assessed and was consistently found to be adequate (r ≥ .87).

384 M. Weinraub et al. / Early Childhood Research Quarterly 20 (2005) 373–392
agree). The scale authors report a split-half reliability of .90 and a test–retest reliability of .84. Other researchershave reported internal reliability coefficients≥.75 (NICHD ECCRN, 1996; Shlay et al., 1998). For this study, internalconsistency coefficient for the Parent Modernity Scale is .81. Less authoritarian child-rearing attitudes in child carehave been related to more positive caregiving (Arnett, 1989; NICHD ECCRN, 1996).
Professionalism was measured using a questionnaire designed byJorde-Bloom (1988). Containing 13 questions,this questionnaire asks about specific activities related to the care provider’s job. Specifically, it collects informationpertaining to subscriptions to professional journals or magazines, affiliations with professional organization, trainingor educational activities undertaken in the past year, and advocacy work relating to child care. It also asks if the careprovider considers their work ‘just a job’ or a ‘career’ and their commitment to early childhood education. Alphacoefficients for the scale have been adequate ranging from .56 to .75 (Jorde-Bloom, 1989; Shlay et al., 1998). For thisstudy, internal coefficient for the professionalism scale was .63. Scores on this measure have been related to providereducation and training (Jorde-Bloom, 1989) and the availability of child care resources in the neighborhood (Shlay etal., 1998).
4. Results
First, we present comparisons of parental reports of child-care experiences for families using child care assistance(n = 52) and those not using child-care assistance (n = 59). Then, we examine how the child-care situations used byfamilies on assistance and those not on assistance differ in type, quality, and provider characteristics. Finally, to exploredifferences in the two groups of families that might lead to differential child-care usage patterns in subsidized andnon-subsidized families, we compare the correlates of quality care in the two groups.
4.1. Differences in families’ child-care usage as a function of child-care assistance receipt
Table 5presents the information we collected from both groups of parents along with the results of statistical tests.Families on assistance and those not on assistance differed in the distributions of the types of child care they used (χ2
[1, n = 111] = 10.09,p = .04). More of the families receiving assistance used center care than did families not receivingassistance (77% versus 58%). We saw little difference in the use of family day care arrangements across the two groups(15% versus 19%). At the same time, more of the families not using assistance had children cared for by a relative inthe relative’s home than did families using assistance (19% versus 2%). Families not on assistance were more likely tolearn of child-care arrangements through family and friends, while families using assistance were more likely to learnof child-care arrangements through government offices, referral agencies, or public notices (χ2 [1, n = 111] = 11.08,p ≤ .01). Overall, families using public assistance to pay for child care tended to be more likely to have their childrenin licensed, registered arrangements than families not receiving assistance (89% versus 71%,p = .07). No differenceswere observed in the hours per week families used their child-care arrangements, the length of time their child hadbeen in the arrangement or the percentage of families using more than one concurrent arrangement. Parents’ experiencewith missed days of employment and lateness were infrequent. Nevertheless, parents on assistance missed only a halfday on average in the previous month due to child-care issues; parents not receiving assistance missed on average 1.5days.
Not presented inTable 5is additional information collected from families in the two groups which showed nodifferences in the parents’ commute times from home to the child-care location (19 and 15 min, respectively), betweenthe child-care setting and the parents’ work (34 and 31 min), and no differences observed in parents’ satisfaction withthe care or with parents’ report of the stress of combining work and family.
Where families differed considerably, not surprisingly, was in how much they paid out of pocket for their child care.As shown at the bottom ofTable 5, families receiving child-care assistance paid about half as much ($43 per week) asfamilies not receiving child-care assistance ($90 per week).
4.2. Differences in child-care quality as a function of child-care assistance
Because of the differential rate of cooperation across child-care providers (seeTable 3), the distribution of providerswe observed and rated for quality was more similar across family assistance group than the distribution of providersactually used by the total sample. The small number of cases within each type of care precluded the possibility of

M. Weinraub et al. / Early Childhood Research Quarterly 20 (2005) 373–392 385
Table 5Child care used by families receiving and not receiving child-care assistance
Receiving child-careassistancea
Not receiving child-careassistancea
t or χ2 p
n = 52 n = 59b
Primary child care arrangement used% Using a center 77 58 10.09 .04% Using non-relative in their home (FDC) 15 19% Using relative in relative’s home 2 19% Using relative in child’s home 6 2
Learned of child care arrangement through. . .
% Used previously for other child 10 3 19.09 .01% Advertisement or Yellow pages 4 5% Subsidy office or referral agency 22 7% Family/friends 46 76% Noticed facility in neighborhood 14 3% Employer 6 2% Other source – 3
% Using licensed/registered arrangement 89 71 5.31 .07
Hours per week in arrangementM 40 39 .41 .69S.D. 10 10
Length of time using arrangement (in months)M 15 17 −.81 .42S.D. 12 13
% Using only one child care arrangement 96 92 1.00 .32
Average number of days arrived late to work due to child care issueM .50 (n = 48) 1.51 (n = 57) −2.23c .03S.D. 1.01 2.99
Amount paid out of pocket for child care per weekM $43 (n = 40) $90 (n = 51) −6.03 <.001S.D. $33 $39
a This group includes parents receiving state subsidy for working parents, child-care assistance through welfare, or Head Start.b Except where noted.c Assuming unequal variances between groups.
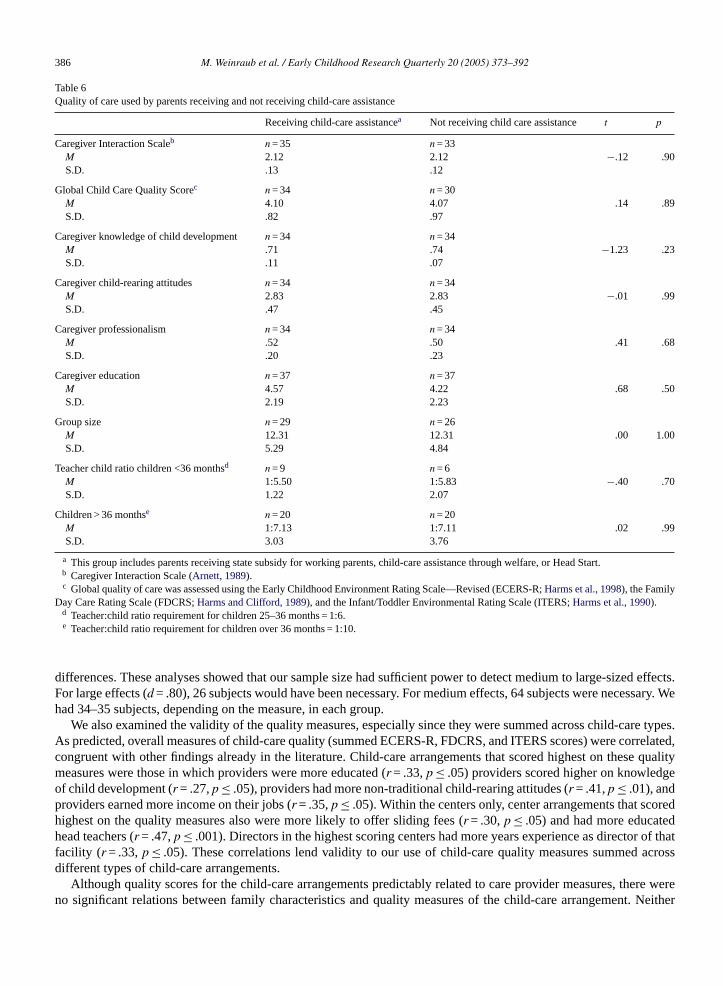
testing differences in the quality of care within each provider type, so scores from the ECERS-R, FDCRS, and ITERSwere combined across child-care arrangement types. These data are presented inTable 6.
Care providers whom we observed did not differ on the quality of interaction with the child (CIS scores of 2.12 forboth families receiving child assistance and those not receiving assistance), on global child-care quality scores on theobservational scales (4.10 versus 4.07, respectively), or on caregiver education or knowledge of child development,caregiver child-rearing attitudes, or caregiver professionalism. Also, according to our observations, there were nodifferences in group sizes or teacher–child ratios in the two groups.
Care providers also did not differ when child-care measures were grouped categorically as a function of quality ofcare over or under particular cut-off scores. There were no differences in the percent of families receiving child-careassistance and those not receiving child-care assistance in child-care arrangements that were rated very high quality(scores over 5) or low quality (scores under 3). (These data are not shown in the tables.) Finally, we observed nodifferences on any of the quality measures when we comparedonly the center providers from each of the two groups.
4.3. Exploring null findings: Power analyses and correlates of quality care in the two groups
To examine our null findings on quality comparisons between families receiving and not receiving child-careassistance we first performed power analyses to assure that sufficient power was present to detect any possible quality
386 M. Weinraub et al. / Early Childhood Research Quarterly 20 (2005) 373–392
Table 6Quality of care used by parents receiving and not receiving child-care assistance
Receiving child-care assistancea Not receiving child care assistance t p
Caregiver Interaction Scaleb n = 35 n = 33M 2.12 2.12 −.12 .90S.D. .13 .12
Global Child Care Quality Scorec n = 34 n = 30M 4.10 4.07 .14 .89S.D. .82 .97
Caregiver knowledge of child development n = 34 n = 34M .71 .74 −1.23 .23S.D. .11 .07
Caregiver child-rearing attitudes n = 34 n = 34M 2.83 2.83 −.01 .99S.D. .47 .45
Caregiver professionalism n = 34 n = 34M .52 .50 .41 .68S.D. .20 .23
Caregiver education n = 37 n = 37M 4.57 4.22 .68 .50S.D. 2.19 2.23
Group size n = 29 n = 26M 12.31 12.31 .00 1.00S.D. 5.29 4.84
Teacher child ratio children <36 monthsd n = 9 n = 6M 1:5.50 1:5.83 −.40 .70S.D. 1.22 2.07
Children > 36 monthse n = 20 n = 20M 1:7.13 1:7.11 .02 .99S.D. 3.03 3.76
a This group includes parents receiving state subsidy for working parents, child-care assistance through welfare, or Head Start.b Caregiver Interaction Scale (Arnett, 1989).c Global quality of care was assessed using the Early Childhood Environment Rating Scale—Revised (ECERS-R;Harms et al., 1998), the Family
Day Care Rating Scale (FDCRS;Harms and Clifford, 1989), and the Infant/Toddler Environmental Rating Scale (ITERS;Harms et al., 1990).d Teacher:child ratio requirement for children 25–36 months = 1:6.e Teacher:child ratio requirement for children over 36 months = 1:10.
differences. These analyses showed that our sample size had sufficient power to detect medium to large-sized effects.For large effects (d = .80), 26 subjects would have been necessary. For medium effects, 64 subjects were necessary. Wehad 34–35 subjects, depending on the measure, in each group.
We also examined the validity of the quality measures, especially since they were summed across child-care types.As predicted, overall measures of child-care quality (summed ECERS-R, FDCRS, and ITERS scores) were correlated,congruent with other findings already in the literature. Child-care arrangements that scored highest on these qualitymeasures were those in which providers were more educated (r = .33,p ≤ .05) providers scored higher on knowledgeof child development (r = .27,p ≤ .05), providers had more non-traditional child-rearing attitudes (r = .41,p ≤ .01), andproviders earned more income on their jobs (r = .35,p ≤ .05). Within the centers only, center arrangements that scoredhighest on the quality measures also were more likely to offer sliding fees (r = .30,p ≤ .05) and had more educatedhead teachers (r = .47,p ≤ .001). Directors in the highest scoring centers had more years experience as director of thatfacility (r = .33, p ≤ .05). These correlations lend validity to our use of child-care quality measures summed acrossdifferent types of child-care arrangements.
Although quality scores for the child-care arrangements predictably related to care provider measures, there wereno significant relations between family characteristics and quality measures of the child-care arrangement. Neither

M. Weinraub et al. / Early Childhood Research Quarterly 20 (2005) 373–392 387
parental income (within this restricted range), parental education level, time of day worked nor parental satisfactionwith child care was related to the observed child-care quality.
We were also concerned about the wide income difference (M = $1376 versus $2401,p ≤ .001, seeTable 4) betweenfamilies using child-care assistance and those not using assistance. Could it be that the reason there are no differencesin quality between families receiving child-care assistance and those not receiving assistance was that the familiesnot receiving assistance had higher incomes and were able to purchase higher quality care? To test this possibility,we examined whether our results were influenced by income level. Using per capita family income information, weselected from each group those families who might be eligible to receive subsidies if they were to have applied for thesesubsidies using the income information that they gave us. Using these rough criteria, we identified 50 of the 52 subsidyreceiving families and 45 of the 59 families not receiving subsidies as “eligible” based on their family income andhousehold size for child-care assistance. Eliminating those families who were on TANF from the subsidy group, wefound no per capita income differences between these two groups of subsidized and non-subsidized, subsidy eligible,non-TANF families (M = $1599 versus $1780,t = 1.00,p = .32).
We compared the 50 and 45 subsidy-eligible families on the observed child-care quality measures listed inTables 5 and 6. We found that families using subsidized child care differed from families not using subsidized childcare on only four measures—use of child care center (76% versus 51%,χ2 = 13.42, d.f. = 1,p < .01), use of licensedor registered arrangement (88% versus 69%,χ2 = 5.21, d.f. = 1,p < .02), average number of days arrived late to work(.52 versus 1.61,t =−2.24,p < .03), and amount paid out of pocket for child care per week ($44 versus $87,t =−5.15,p < .001). These findings replicated the previous findings with the larger group of families selected on the basis of lowincome alone. Again, power for these analyses was sufficient to permit identification of large differences in child-carequality between the groups, but none were observed.
5. Discussion
Changes in the federal welfare system in 1996 introduced new methods for helping states distribute child-carefunding to parents on assistance and to low-income, working-class families. The new system was designed to enableparents to have more successful employment experiences and greater child-care options, thereby increasing parentalchoice and parent child-care satisfaction and facilitating parents’ access to higher quality care. Has this new systembeen successful in enabling parents to have more choice in child-care arrangements, fewer work–family conflicts,greater satisfaction with the care and better quality care for their children?
The results of this study of low-income African American families randomly selected from a large urban sampleindicate that there are three clear differences between the care obtained when families are receiving public assistancefor child care and when they are not. First, when families are receiving child-care assistance, they are more likelyto use center care and more formal types of care and less likely to use relative care on a regular basis than familiesnot using child-care assistance. Second, families receiving assistance may be somewhat more likely to use licensedand registered child-care arrangements than other families. And third, not surprisingly given the financial subsidy,subsidized families paid about half the amount out-of-pocket as families not using subsidies. Since families usingsubsidies had significantly lower incomes, this additional money may have been critically important to the families.These findings replicate those already in the literature based on administrative and parent report data.
At the same time, we did not find other anticipated differences between families using subsidized care and thosenot using subsidized care in the quality of child care used or families’ satisfaction with child care. These urban AfricanAmerican families receiving child-care assistance were as likely to use child care located close to their home or work,as likely to be stressed combining the pressures of work and family, and as satisfied with their child’s care as otherlow-income African American parents.
More importantly, we found no evidence of differences in the child-care quality received by children from subsidizedor non-subsidized families. Not only did we find no differences in the average scores of quality in each group, butalso families in the subsidized group were no more likely to use very high or very low quality care. For families inboth groups, the average level of child care was rated only about “four” on a “one” to “seven” scale on the globalchild-care quality measures we used. Experts consider a score of “five” on these scales “good”; a score of “three” scoreis considered “minimal.” Few of the children in either group were in “good” or “excellent” quality care. The absenceof differences was found even when we compared subsidy receiving and non-subsidy receiving low-income familiesselected for being potentially subsidy eligible.

388 M. Weinraub et al. / Early Childhood Research Quarterly 20 (2005) 373–392
Thus, despite being able to document widely known differences between families on child-care assistance and thosenot on assistance, we were unable to show that child-care assistance families select better quality child care or childcare that might be more convenient in terms of commuting times between home and workplace. Use of subsidies didnot appear to reduce work–family conflict, promote greater satisfaction with child care, or affect parental employmentsuccess factors. The use of child-care subsidies was not related to better quality child care on any of the measures ofobserved care we used.
Certainly, this study suffers from a number of limitations. First, the sample is small despite our best attempts torecruit a larger sample. We had power to detect only large- to moderate-sized differences between the groups. Thesample was selected at random from a large group of households, randomly contacted in a large city. Contacting thesefamilies took more than 6 months of intensive phone calls by professional callers. Once the families were identified,there was selected attrition in care provider participation, with fewer informal caregivers agreeing to be observed.While this provided us with more comparable samples of providers from the families on assistance and those not usingassistance, it reduced our ability to observe the informal kith and kin providers used primarily by the families not usingchild-care assistance.
Like many other studies, this study suffers from a lack of information about the quality ofinformal child-carearrangements. Also, because of the small number of families and providers, we were not able to study families usingspecific types of child-care assistance; we needed to combine families using TANF, CCDF funds, and Head Start. Whilethis is justifiable in that Head Start families were eligible for federal child-care subsidies and were getting federallysubsidized care, we would have preferred to examine the effects of the subsidy system on the child-care choices aboveand beyond Head Start. Nevertheless, the inclusion of Head Start classes might have been expected to exaggerate thebeneficial effect of child-care subsidies, but no such effects were found. Post hoc analyses excluding the Head Startfamilies, showed similar null results. Also, when the data analyses were restricted to only families with incomes lowenough to most likely qualify them to receive child-care subsidies were they to have applied for them, we also failedto find any differences in the quality of care for the children in the two groups.
Lastly, this study suffers from the usual problem of selective participation of caregivers. More of the caregiverswho participated were center caregivers rather than relatives, and more often the caregivers were registered or licensedthan not. This probably biased us toward observing higher quality care than might indeed be in the population at large.Nearly every study of child-care providers suffers from this problem. What was helpful here is that the same selectionfactors operated in both groups that we were comparing. If anything, the families from whom the child-care providerswere observed were more rather than less similar after the selective participation rate of the care providers was takeninto consideration.
These limitations may have biased our study toward being more likely to observebetter quality care in the familiesusing child-care assistance than other families. So, why were we not able to find better quality care in the familiesusing child-care assistance than those not using assistance?
We do not think that the lack of found differences in child-care quality between families using public assistanceand those not using public assistance can be attributed to small sample size and limited power for analyses. Althoughwe had the power to observe only large differences in quality of care between the two groups and we had insufficientpower to detect more minimal differences that may have existed, the incredible similarity in the mean scores within thetwo groups suggest that larger samples might not have identified differences in quality of care between the two groups.
Perhaps the answer lies, asAdams and Rohacek (2002)have suggested, within the design of the child-care subsidysystem itself. TANF and CCDF funds are designed with the primary intention of supporting parental work, not parentalchoice or child-care quality. Mechanisms built into the child-care system to improve quality are minimal. The qualityset-aside in the system is small—only 4% of the funds. These funds are often used to aid in state licensing systems,provider training and compensation strategies, technical assistance networks and state professional developmentalnetworks, but they are a very small amount of funding particularly given the large size of the overall child-care marketthese funds are designed to affect. AsHelburn et al. (2002)noted, there is little incentive for providers to provide betterquality care or seek additional education or training.
These limited child-care subsidy funds may do little to increase the supply of higher quality care available tolow-income families. Child-care assistance may enable low-income families to select from a wider array of carepossibilities than families without this assistance, but subsidized families still select from the same pool of neigh-borhood care available to other low-income families in their neighborhoods. Research byElizabeth Jaeger andSuzanne Funk (2001)shows that the care provided by child care centers in Philadelphia is of only minimal quality,
M. Weinraub et al. / Early Childhood Research Quarterly 20 (2005) 373–392 389
exceeding children’s custodial needs, but not fully meeting their developmental needs. The average overall qual-ity of home-based arrangements was even lower, at or below minimal standards of quality. Thus, while subsidiesmay enable low-income families to access center care over more inferior home-based care, the center care thatthey access does not appear to be any better than is generally available to paying clients in the same low-incomeneighborhoods.
Some research suggests that low-income families with access to free or low-cost, home-based kith and kin care thatthey trust are less likely to apply for child-care subsidies than other families (Shlay et al., 2004). If this is the case,then type of care used and subsidy use may be intertwined. Studying whether subsidy use increases families’ abilityto access higher quality care may require a longitudinal investigation in which researchers examine whether change insubsidy use over time leads to higher quality care. We are currently engaged in such a study, one that will also enableus to examine ethnic differences in families’ child-care subsidy usage.
What would the families in this study have done had they not had the financial assistance to enable them to accessthe more costly centers that they used? Compared to the families not using subsidized care, the subsidized familiesin this study were more likely to be single, never-married mothers with slightly more children under the age of 18in their household and lower household incomes. Thus, it is possible that the care these families might have usedin the absence of subsidies might have been far lower in quality than that used by the comparison sample in thisstudy.
Ideally, use of families on the waiting list for subsidies would have made a better control group than selecting forfamilies of low-income status from the general population. However, use of child-care waiting lists is problematic forseveral reasons. First, families on welfare are given priority for child-care assistance, so groups of subsidy-receivingfamilies will usually have lower incomes than groups of non-subsidy receiving families, as found in this study. Second,waiting lists are often of short duration, from 3 to 7 months. Thus, families’ child-care subsidy status might havechanged by the time a family could have been enrolled in a study. Third, it is possible that families might use inferiorcare temporarily while they are on the waiting list, believing that their child is soon to enter a better child-caresetting.
Finally, our previous research (Shlay et al., 2004) showed that eligible families waiting for child care are differentfrom eligible families who decline to apply for subsidies. In our research comparing subsidy eligible families receivingand not receiving care, two-thirds of the subsidy-eligible families did not apply for child-care subsidies. Families whodid not apply for child-care subsidies were less likely to have been on welfare, more likely to be single parents withcourt-ordered child support, and more likely to be employed for longer hours and higher incomes. Nearly one-thirdof the families we interviewed who did not apply for subsidiesfor which they were eligible reported that they did notneed help paying for care, ostensibly because they felt they already had child care that met their needs. Thus, use ofcomparable low-income samples may be more advantageous than the use of waiting list controls for studying child-carequality differences in subsidized versus non-subsidized families.
Our finding that low-income families on subsidies were more likely to avail themselves of center care may besufficient evidence that child-care subsidies are effective in providing higher quality care for the children of thesefamilies. This is because center care has been documented to be of higher quality than more inexpensive, home-basedcare.Loeb, Fuller, Kagan, and Carrol (2004)showed positive cognitive effects for low-income children in centercare over those in child-care homes, and they reported that children in family child-care homes had more behavioralproblems than other children. Using data from the NICHD Study of Early Child Care and Youth Development,Tran &Weinraub (submitted for publication)andTran (in preparation)showed that families using center and family day carearrangements were more likely to have stable arrangements than families using other types of care. Enabling families tomove from more informal, family-based care to more professionalized center care may be the great benefit of child-careassistance programs. Research reviewing the effects of welfare and employment policies on young children (Morris,Gennetian, & Duncan, 2005) suggests that many welfare support programs may be effective for preschool childrendue to the increased use of center-based child-care arrangements these programs enable.
6. Policy implications
Subsidies increase affordability and access to center care for low-income families. However, we can provide noevidence that subsidies do anything to increase the quality of that care. Are policy makers content with providingsubsidies that result in care that only reaches a minimal level of quality? Researchers and policy makers may want

390 M. Weinraub et al. / Early Childhood Research Quarterly 20 (2005) 373–392
to address the capacity of a system that appears limited in its ability to increase child-care quality for low-incomefamilies.
Child-care providers maintain that the subsidies that are provided are too low to enable providers to deliver a levelof care more than minimal (Graham, personal communications, 2004, 2005). The Commonwealth of Pennsylvania setsreimbursement rates to the centers at 65% of market rate. Despite providers’ objections, this market rate is not assessedon a regular, updated basis. At the same time, some families complain that co-pays are too high, making subsidizedcare less attractive to them (Shlay et al., 2004). At an accredited child-care center in downtown Philadelphia that servesHead Start and subsidized families along with full-paying families, the weekly charge for a preschool child is $195.8
Costs co-paid by parents at that center range from $5 to $75 a week, depending on family income, number of children,and household size. Yet, the Commonwealth of Pennsylvania currently pays only $142.60 a week per child. Thus, thecenter loses money for many if not all of the subsidized children in the center. The difference between the cost of careand the reimbursed amount must be met by board fundraising and local foundation grants. For programs not as adeptat fundraising as this one, providing quality care is simply not possible. Until child-care providers receive subsidiessufficient to pay for high-quality care, the subsidy system may be less than fully effective in providing quality care forchildren.
Not only are subsidized families shortchanged in quality, but so are families who do not receive subsidies. Theaverage out of pocket payments by non-subsidized families was $90, barely half as much as it costs to provide qualitycare. Policy makers choose between subsidizing fewer people at higher rates or more people at lower rates. Either way,low-income families are not able to access high-quality care. Until more money is put into the system to increase thenumber of subsidies and the amount of those subsidies, low-income children will not be able to access the type of carewidely demonstrated to reduce the disparities between rich and poor in our nation.
Perhaps the decisive test for policy does not lie in the subsidy system’s effects on the quality of care that childrenare afforded. Perhaps the ultimate test is whether the parents who use these subsidies are likely to have more successfulemployment outcomes and become self-supporting. Are parents using child-care subsidies better able to find and holdemployment? Do parents receiving child-care subsidies miss fewer work days or days late to work because of child-careproblems? We found that it did, in the short period that we monitored. However, the frequencies associated with thesevariables were small, so we need to be cautious in interpreting the observed difference in fewer days late to work in thesubsidized care group. Longer term studies following parents using child-care subsidies are required to address thisissue more fully.
7. Conclusion
When low-income African American families received public child-care assistance, they were more likely to usecenter care and more formal types of care, less likely to use relative care on a regular basis, and somewhat more likelyto use licensed and registered child-care arrangements than other families. Subsidized child care required nearly halfas much parental out-of-pocket expenditure. However, the care used by families on child-care assistance was no morelikely to be high quality than that used by families not on assistance. Because both families receiving and not receivingchild-care assistance were drawing from the same pool of child care in the marketplace, our inability to observe anydifferences in the quality of that care may reflect that the care generally available in low-income neighborhoods is low.The size of subsidies may not be sufficient for providers to increase the quality of care that they provide. Since the careavailable to low-income families has been documented to be below quality standards, educators and policy makersmay want to consider higher subsidies or other provisions for increasing access to quality child care for low-incomefamilies than currently provided by existing policies.
Acknowledgements
This research was funded by Grant Number 9OYE001 of the Child Care Bureau of the Department of Healthand Human Services. We thank Sharonda Frink and Laura Teti for valuable research assistance, and the parents andchild-care providers who allowed us into their lives.
8 None of the children in this study were enrolled at this child care center.
M. Weinraub et al. / Early Childhood Research Quarterly 20 (2005) 373–392 391
References
Adams, D. B., Roach, M. A., Riley, D. A., & Edie, D. (2001).Wisconsin Child Care Research Partnership Issue Brief #3: Are program characteristicslinked to child care quality? Madison, WI: University of Wisconsin-Extension.
Adams, G., & Rohacek, M. (2002). More than a work support? Issues around integrating child development goals into the child care subsidy system.Early Childhood Research Quarterly, 17, 418–440.
Arnett, J. (1989). Caregivers in Day Care Centers: Does training matter?Journal of Applied Developmental Psychology, 10, 541–552.Barnett, W. S. (1995). Long-term effects of early childhood programs on cognitive and school outcomes.The Future of Children, 5, 25–50.Blau, D. & Tekin, E. (2001). The determinants and consequences of child care subsidy receipt by low-income families. In B. Meyer & G. Duncan
(Eds.),The incentives of government programs and the well-being of families (pp. 185–221). Joint Center for Poverty Research.Brooks, F., Risler, E., Hamilton, C., & Nackerud, L. (2003). Impacts of Child care subsidies on family and child well-being.Early Childhood
Research Quarterly, 18, 498–511.Brooks-Gunn, J., Brown, B. V., Duncan, G. J., & Moore, K. A. (1995). Child development in the context of family and community resources: An
agenda for national data collection. InIntegrating Federal Statistics on Children: Report of a Workshop (pp. 27–97). Washington, DC: NationalAcademy Press.
Burchinal, M. R., Peisner-Feinberg, E., Bryant, D. M., & Clifford, R. (2000). Children’s social and cognitive development and child-care quality:Testing for differential associations related to poverty, gender, or ethnicity.Applied Developmental Science, 4, 149–165.
Burchinal, M. R., Roberts, J. E., Riggins, R., Jr., Zeisel, S. A., Neebe, E., & Bryant, D. (2000). Relating quality of center-based child care to earlycognitive and learning development longitudinally.Child Development, 71(2), 339–357.
Cassidy, D. J., Buell, M. J., Pugh-Hoese, S., & Russell, S. (1995). The effects of education in child care teacher’s beliefs and classroom quality: Yearone evaluation of the T.E.A.C.H. Early Childhood Associate Degree Scholarship program.Early Childhood Research Quarterly, 10, 171–183.
Child Care Bureau. (2002). Access to child care for low-income working families.http://www.acf.dhhs.gov/programs/ccb/research/ccreport/ccreport.htm.Child Care Study Dynamics Team. (2002).The dynamics of child care subsidy use: A collaborative study of five states. National Center for Children
in Poverty, Columbia University: New York, NY.Conrad, B., Gross, D., Fogg, L., & Ruchala, P. (1992). Maternal confidence, knowledge and quality of mother–toddler interactions: A preliminary
study.Infant Mental Health Journal, 13, 353–362.De Kruif, R. E. L., McWilliam, R. A., Maher Ridley, S., & Wakely, M. B. (2000). Classification of teachers’ interaction behaviors in early childhood
classrooms.Early Childhood Research Quarterly, 15, 247–268.Duncan, G. J., & Brooks-Gunn, J. (2000). Family poverty, welfare reform, and child development.Child Development, 71, 188–196.Feagans, L. V., Fendt, K., & Farran, D. C. (1995). the effects of day care intervention on teacher’s ratings of the elementary school discourse skills
in disadvantaged children.International Journal of Behavioral Development, 18, 243–261.Fiene, R., Greenberg, M., Bergsten, M., Fegley, C., Carl, B., & Gibbons, E. (2002).The Pennsylvania early childhood quality settings study.
Research report prepared for the Task Force on Early Childhood Care and Education, Governor Schweiker’s Policy Office, Commonwealth ofPennsylvania.
Fuller, B., & Strath, A. (2001). The child care and preschool workforce: Demographics, earnings and unequal distribution.Educational Evaluationand Policy Analysis, 23, 37–55.
Graham, M. (2004). Personal communication.Harms, T., & Clifford, R. (1989).Family Day Care Rating Scale. New York: Teachers College Press.Harms, T., Clifford, R., & Cryer, D. (1998).Early Childhood Environment Rating Scale (Revised Edition). New York: Teachers College Press.Harms, T., Cryer, D., & Clifford, R. (1990).Infant/Toddler Environment Rating Scale. New York: Teachers College Press.Helburn, S. (Ed.). (1995).Cost, quality and child outcomes in child care centers—Technical report. Denver: University of Colorado at Denver,
Department of Economics, Center for Research in Economic and Social Policy.Helburn, S. W., Morris, J. R., & Modigliani, K. (2002). Family child care finances and their effect on quality and incentives.Early Childhood
Research Quarterly, 17, 512–538.Holloway, S. D., Kagan, S. L., Fuller, B., Tsou, L., & Carroll, J. (2001). Assessing child care quality with a telephone interview.Early Childhood
Research Quarterly, 16, 165–189.Howes, C. (1997). Children’s experiences in center-based child care as a function of teacher background and adult:child ratio.Merrill-Palmer
Quarterly, 43(3), 404–425.Howes, C., Smith, E., & Galinsky, E. (1995).The Florida Child Care Quality Improvement Study: Interim Report. New York: Families and Work
Institute.Howes, C., Whitebrook, M., & Phillips, D. A. (1992). Teacher characteristics and effective teaching in child care: Findings from the National Child
Care Staffing Study.Child & Youth Care Forum, 21, 399–414.Jaeger, E., & Funk, S. (2001).The Philadelphia Child Care Quality Study: An examination of quality in selected early education and Care Settings.
A technical report submitted to the Improving school readiness project of the United Way of Southeastern PA. Philadelphia, PA: Saint Joseph’sUniversity, Department of Psychology.
Jorde-Bloom, P. (1988).A great place to work: Improving conditions for staff in young children’s programs. Washington, DC: National Associationfor the Education of Young Children.
Jorde-Bloom, P. (1989). Professional orientation: Individual and organizational Perspectives.Child and Youth Quarterly, 18, 227–242.Kontos, S., Howes, C., & Galinsky, E. (1996). Does training make a difference to quality in family child care?Early Childhood Research Quarterly,
11, 427–445.Kontos, S., Howes, C., Shinn, M., & Galinsky, E. (1995).Quality in family child care and relative care. New York: Teachers College Press.

392 M. Weinraub et al. / Early Childhood Research Quarterly 20 (2005) 373–392
Loeb, S., Fuller, B., Kagan, S. L., & Carrol, B. (2004). Child care in poor communities: Early learning effects of type, quality and stability.ChildDevelopment, 75, 47–65.
MacPhee, D. (1981). Knowledge of infant development inventory. Unpublished manuscript.MacPhee, D., & Fabio, C. (1992, August). A question of match: Knowledge of child development and age appropriate stimulation. InPoster
presented at the 100th meeting of the American Psychological Association.Marshall, N., & Barnett, R. (1993). Work–family strains and gains among two-earner couples.Journal of Community Psychology, 21, 64–78.Matthews, M., & Thornburg, K. (2001). Informal child care quality instrument. Unpublished instrument.McLoyd, V. C. (1998). Socioeconomic disadvantage and child development.American Psychologist, 53, 185–204.Mezey, J., Schumacher, R., Greenberg, M., Lombardi, J., & Hutchins, J. (2002).Unfinished agenda: Child care for low-income families since 1996.
Washington, DC: Center for Law and Social Policy.Morris, P. A., Gennetian, L. A., & Duncan, G. J. (2005). Effects of welfare and employment policies on young children: New findings on policy
experiments conducted in the early 1990s.Social Policy Report, 19, 1–19.NICHD Early Childhood Research Network. (1996). Characteristics of infant child care: Factors contributing to positive caregiving.Early Childhood
Research Quarterly, 11, 269–306.NICHD Early Child Care Research Network. (1999). Child care and mother–child interaction in the first three years of life.Developmental
Psychology, 35, 1399–1413.Peisner-Feinberg, E. S., & Burchinal, M. R. (1997). Relations between preschool children’s child care experiences and concurrent development:
The Cost. Quality and Outcomes Study.Merrill Palmer Quarterly, 43, 451–477.Peisner-Feinberg, E. S., Burchinal, M. R., Clifford, R. M., Culkin, M. L., Howes, C., Kagan, S. L., & Yazejian, N. (2001). The relation of preschool
child care quality to children’s cognitive and social development trajectories through second grade.Child Development, 72(5.), 1534–1553.Phillips, D., & Adams, G. (2001). Child care and our youngest children.The Future of Children: Caring for Infants and Toddlers, 11(1), 35–51.Ramey, C. T., & Campbell, F. A. (1992). Poverty, early childhood education, and academic competence: The Abecedarian experiment. In A. C.
Huston (Ed.),Children in poverty: Child development and public policy (pp. 190–221). New York: Cambridge University Press.Scarr, S., Eisenberg, M., & Deater-Decker, K. (1994). Measurement of quality in child care centers.Early Childhood Research Quarterly, 9, 131–151.Schumacher, R., & Greenberg, M. (1999).Child care after leaving welfare: Early evidence from state studies. Washington, DC: Center for Law and
Social Policy.Shaefer, E. S., & Edgerton, M. (1985). Parent and child correlates of parental modernity. In I. E. Siegel (Ed.),Parental belief system (pp. 287–318).
Hillsdale, NJ: Lawrence Erlbaum.Shlay, A. B., Jaeger, E., & Weinraub, M. (1998).Partners in child care: An evaluation of the Philadelphia Early Childhood Collaborative.
Philadelphia, PA: Temple University, Center for Public Policy.Shlay, A. B., Weinraub, M., Harmon, M., & Tran, H. (2004). Barriers to subsidies: Why low-income families do not use child care subsidies.Social
Science Research, 33, 134–157.Tran, H. The rates, effects and mechanisms of stability in nonmaternal child care arrangements during the preschool and transition to school age
period. Dissertation, Temple University, in preparation.Tran, H., & Weinraub, M. (submitted for publication). The effects of quality, stability, and multiplicity in nonmaternal child care arrangements
during the first fifteen months of life.Developmental Psychology.U.S. General Accounting Office. (2003).Child care: Recent state policy changes affecting the availability of assistance for low-income families.
Report to the Ranking Minority Member, Subcommittee on Ways and Means, House of Representatives (GAO-03-588). Washington, DC.Vandell, D. D., & Wolfe, B. (2000).Child care quality: Does it matter and does it need to be improved? University of Wisconsin-Madison. Institute
for Research on Poverty.Wishard, A. G., Shivers, E. M., Howes, C., & Ritchie, S. (2003). Child care program and teacher practices: Associations with quality and children’s
experiences.Early Childhood Research Quarterly, 18, 65–103.Wortman, C. B., Biernat, M. R., & Lang, E. L. (1991). Coping with role overload. In M Frankenhaeuser, U. Lundberg, & M. Chesney (Eds.),Women,
work and health: Stress and opportunities (pp. 85–110). New York: Plenum.
Related Documents