This article has been accepted for inclusion in a future issue of this journal. Content is final as presented, with the exception of pagination. IEEE JOURNAL OF SELECTED TOPICS IN APPLIED EARTH OBSERVATIONS AND REMOTE SENSING 1 Subsidence Monitoring of Tianjin Suburbs by TerraSAR-X Persistent Scatterers Interferometry Qingli Luo, Daniele Perissin, Hui Lin, Yuanzhi Zhang, and Wei Wang Abstract—This paper illustrates the first wide area study over Tianjin suburbs of China using persistent scatterers interferom- etry (PSI) technique for ground subsidence monitoring via high- resolution TerraSAR-X (TSX) SAR data. The deformation rate and the displacement history of the subsiding areas from April 29, 2009 to November 11, 2011 have been reconstructed. The re- sults demonstrate the capability of applying PSI technique to high- resolution SAR time series imageries for monitoring of the subsi- dence of multiple towns and large-scale man-made linear features (LMLFs) such as railways, highways, and power lines. The com- prehensive uncertainties were analyzed between PSI results and ground-leveling data whose densities are very different in both spa- tial and temporal domains. The overall results show a good agree- ment with each other. We also found that the underground water extraction and lithological character are the two important poten- tial explanations to the location and shape of the subsiding centers. Index Terms—Large-scale man-made linear features (LMLFs), multiple towns, persistent scatterers interferometry (PSI), subsi- dence monitoring, TerraSAR-X, Tianjin suburbs. I. INTRODUCTION G ROUND subsidence has always been one of the most se- vere and widespread geological hazard in cities of China [1]. Most of the monitoring activities are concentrated in urban and downtown areas [2], [3] that have a lesser extent in the sub- urbs, where specific control points for subsidence monitoring have been implemented. Urbanization in China witnessed nu- merous large-scale man-made linear features (LMLFs), such as railways, highways, and power lines, connecting the nation as the economic lifelines that are constructed both in urban and suburbs areas, can be seriously jeopardized by the ground de- formation. The importance of monitoring deformation along power lines was emphasized especially after the storm hit South China in 2008, which caused thousands of power towers of 110–500 kV transmission lines to be damaged. However, due to Manuscript received September 26, 2012; revised January 18, 2013, April 23, 2013, and May 27, 2013; accepted June 02, 2013. This work was partially sup- ported by the Direct Grant (Proj. Ref. No. 2021113), the National Natural Sci- ence Foundation of China (NSFC) (Proj. Ref. No. 415911) of HKSAR, and Na- tional Natural Science Foundation of China (NSFC) (Proj. Ref. No. 41101370). (Corresponding author: D. Perissin.) Q. Luo, D. Perissin, H. Lin and Y. Zhang are with the Institute of Space and Earth Information Science, The Chinese University of Hong Kong, Hong Kong, China (e-mail: [email protected]; [email protected]; [email protected]; [email protected]). W. Wang is with the Tianjin Institute of Surveying and Mapping, Tianjin 300381, China (e-mail: [email protected]). Color versions of one or more of the figures in this paper are available online at http://ieeexplore.ieee.org. Digital Object Identifier 10.1109/JSTARS.2013.2271501 the lack of the awareness of the ground subsidence in suburban regions, the potential damages are still underestimated. Conse- quently, to provide information of land subsidence in suburban areas is urgently needed [4], especially deformation time series, which is able to fill in the blank of motion history in suburban regions that would further provide knowledge for the hazard de- cision system. Although traditional leveling and GPS data are able to provide reliable observations of ground subsidence, they are limited by low spatial sampling density and high cost. To overcome these intractable problems, an advanced remote sensing technique, referred to as Differential Interferometric Synthetic Aperture Radar (DInSAR), was introduced as a feasible way to monitor deformation over wide areas with cen- timeter-to-millimeter accuracy [5]. Furthermore, to overcome the two major limitations of DInSAR, namely spatial/tem- poral decorrelation and atmospheric disturbance [6], [7], the permanent scatterers (PS) [8], [9] method, known as the first persistent scatterers interferometry (PSI) [10], [11] technique, was suggested as a powerful technique for wide-area defor- mation monitoring with millimetric precision [12]. Reliable deformation and height correction information can be obtained by adopting stable scattering targets (buildings, structures, etc.) from a long temporal series of interferometric stacks. In previous investigations [2], significant attention has been focused on studying individual urban area via the PS technique. The reason is that in a general PS analysis, the temporal coher- ence and spatial density of PS point clusters in an individual downtown area, mostly artificial infrastructures distributed around one cluster center, are usually higher, ensuring the final precision of PS results [9]. However, suburbs often consist of several different towns, each linked to others with roads and distributed in a star-like graph. Thus, it is essential to monitor multiple towns simultaneously and understand the subsiding severity of each town against the background of the entire region without the external ground control points (GCPs) for individuals. Since then, there have been attempts on simultaneous monitoring of urban agglomerations or multiple towns [13]. However, the sparse spatial density of PS points connecting different towns, especially with those medium resolution SAR data, greatly influenced the final precision of PS analysis results, which became an obvious limitation for multi-town PS analysis. New generations of spaceborne satellites such as Ter- raSAR-X (TSX) can provide us with high-resolution data and possibly overcome the limitation stated above. The density of PS points extracted from high-resolution SAR data is several times higher than those from medium-resolution SAR data 1939-1404/$31.00 © 2013 IEEE

Welcome message from author
This document is posted to help you gain knowledge. Please leave a comment to let me know what you think about it! Share it to your friends and learn new things together.
Transcript

This article has been accepted for inclusion in a future issue of this journal. Content is final as presented, with the exception of pagination.
IEEE JOURNAL OF SELECTED TOPICS IN APPLIED EARTH OBSERVATIONS AND REMOTE SENSING 1
Subsidence Monitoring of Tianjin Suburbs byTerraSAR-X Persistent Scatterers Interferometry
Qingli Luo, Daniele Perissin, Hui Lin, Yuanzhi Zhang, and Wei Wang
Abstract—This paper illustrates the first wide area study overTianjin suburbs of China using persistent scatterers interferom-etry (PSI) technique for ground subsidence monitoring via high-resolution TerraSAR-X (TSX) SAR data. The deformation rateand the displacement history of the subsiding areas from April29, 2009 to November 11, 2011 have been reconstructed. The re-sults demonstrate the capability of applying PSI technique to high-resolution SAR time series imageries for monitoring of the subsi-dence of multiple towns and large-scale man-made linear features(LMLFs) such as railways, highways, and power lines. The com-prehensive uncertainties were analyzed between PSI results andground-leveling data whose densities are very different in both spa-tial and temporal domains. The overall results show a good agree-ment with each other. We also found that the underground waterextraction and lithological character are the two important poten-tial explanations to the location and shape of the subsiding centers.
Index Terms—Large-scale man-made linear features (LMLFs),multiple towns, persistent scatterers interferometry (PSI), subsi-dence monitoring, TerraSAR-X, Tianjin suburbs.
I. INTRODUCTION
G ROUND subsidence has always been one of the most se-vere and widespread geological hazard in cities of China
[1]. Most of the monitoring activities are concentrated in urbanand downtown areas [2], [3] that have a lesser extent in the sub-urbs, where specific control points for subsidence monitoringhave been implemented. Urbanization in China witnessed nu-merous large-scale man-made linear features (LMLFs), such asrailways, highways, and power lines, connecting the nation asthe economic lifelines that are constructed both in urban andsuburbs areas, can be seriously jeopardized by the ground de-formation. The importance of monitoring deformation alongpower lines was emphasized especially after the storm hit SouthChina in 2008, which caused thousands of power towers of110–500 kV transmission lines to be damaged. However, due to
Manuscript received September 26, 2012; revised January 18, 2013, April 23,2013, and May 27, 2013; accepted June 02, 2013. This work was partially sup-ported by the Direct Grant (Proj. Ref. No. 2021113), the National Natural Sci-ence Foundation of China (NSFC) (Proj. Ref. No. 415911) of HKSAR, and Na-tional Natural Science Foundation of China (NSFC) (Proj. Ref. No. 41101370).(Corresponding author: D. Perissin.)Q. Luo, D. Perissin, H. Lin and Y. Zhang are with the Institute of Space
and Earth Information Science, The Chinese University of Hong Kong, HongKong, China (e-mail: [email protected]; [email protected];[email protected]; [email protected]).W. Wang is with the Tianjin Institute of Surveying and Mapping, Tianjin
300381, China (e-mail: [email protected]).Color versions of one or more of the figures in this paper are available online
at http://ieeexplore.ieee.org.Digital Object Identifier 10.1109/JSTARS.2013.2271501
the lack of the awareness of the ground subsidence in suburbanregions, the potential damages are still underestimated. Conse-quently, to provide information of land subsidence in suburbanareas is urgently needed [4], especially deformation time series,which is able to fill in the blank of motion history in suburbanregions that would further provide knowledge for the hazard de-cision system.Although traditional leveling and GPS data are able to
provide reliable observations of ground subsidence, they arelimited by low spatial sampling density and high cost. Toovercome these intractable problems, an advanced remotesensing technique, referred to as Differential InterferometricSynthetic Aperture Radar (DInSAR), was introduced as afeasible way to monitor deformation over wide areas with cen-timeter-to-millimeter accuracy [5]. Furthermore, to overcomethe two major limitations of DInSAR, namely spatial/tem-poral decorrelation and atmospheric disturbance [6], [7], thepermanent scatterers (PS) [8], [9] method, known as the firstpersistent scatterers interferometry (PSI) [10], [11] technique,was suggested as a powerful technique for wide-area defor-mation monitoring with millimetric precision [12]. Reliabledeformation and height correction information can be obtainedby adopting stable scattering targets (buildings, structures, etc.)from a long temporal series of interferometric stacks.In previous investigations [2], significant attention has been
focused on studying individual urban area via the PS technique.The reason is that in a general PS analysis, the temporal coher-ence and spatial density of PS point clusters in an individualdowntown area, mostly artificial infrastructures distributedaround one cluster center, are usually higher, ensuring the finalprecision of PS results [9]. However, suburbs often consistof several different towns, each linked to others with roadsand distributed in a star-like graph. Thus, it is essential tomonitor multiple towns simultaneously and understand thesubsiding severity of each town against the background ofthe entire region without the external ground control points(GCPs) for individuals. Since then, there have been attempts onsimultaneous monitoring of urban agglomerations or multipletowns [13]. However, the sparse spatial density of PS pointsconnecting different towns, especially with those mediumresolution SAR data, greatly influenced the final precision ofPS analysis results, which became an obvious limitation formulti-town PS analysis.New generations of spaceborne satellites such as Ter-
raSAR-X (TSX) can provide us with high-resolution data andpossibly overcome the limitation stated above. The density ofPS points extracted from high-resolution SAR data is severaltimes higher than those from medium-resolution SAR data
1939-1404/$31.00 © 2013 IEEE

This article has been accepted for inclusion in a future issue of this journal. Content is final as presented, with the exception of pagination.
2 IEEE JOURNAL OF SELECTED TOPICS IN APPLIED EARTH OBSERVATIONS AND REMOTE SENSING
[14]. Thus, TSX offers higher temporal coherence of PS pairswith shorter revisit time that would provide better connectivitybetween towns and further increase the reliability of multitownmonitoring. Moreover, high-resolution SAR data have provedto have potential to provide more detailed information whenmonitoring railways [15], highways, and power lines.In this paper, we present a first attempt of wide-area analysis
in Tianjin suburbs using high-resolution -band SAR data withPS technique that provide simultaneous monitoring of multipletowns and LMLFs, including highways, railways, and powerlines. The corresponding validation was done between the PSanalysis results over TSX imageries and leveling that will beillustrated and analyzed in detail in the following of presentedpaper. The work provides a useful guidance and reference formonitoring of star-like-distributed multitowns in suburbs thatshare a develop pattern similar to Tianjin, as well as monitoringof urban agglomeration. Moreover, the full framework offers anew vision for monitoring of the subsidence of LMLFs.
II. STUDY AREA AND SAR DATASET
The study area is located in the west of Tianjin (see Fig. 2),including the Wuqing District, Jinghai County, and severalother towns. Tianjin is located at the junction of the Neo-cathaysian and the Tianshan-Yinshan (latitudinal) tectonicsystems. Huanghua depression is a typical extensional basinthat was formed at the intersection of Haihe and Cangdongfault systems.A dataset of 36 TSX images and 1 Tandem-X (TDX) image
(see Table I) are gathered betweenApril 29, 2009 andNovember11, 2011 over the Tianjin suburbs. TSX images have a slantrange resolution of approximately 3 m for StripMap mode witha wavelength of 3.1 cm and minimum interval of 11 days. TheTSX sensor used in this project acquires images along a de-scending orbit (from North to South) with an incidence angleof approximately 41.08 and ranging 30 by 60 km.
III. METHODOLOGY
A. PS Processing
The PS approach was applied to process the available dataset.For a detailed description of the PS approach, please refer to [8],[9], and [16]. The PS analysis requires that at least 25 imagesare available [8], [9], [16]. All images referring to one commonmaster image were acquired on November 13, 2009. The PSanalysis is conducted by the processing software SARPROZ[17]. The applied processing steps are as follows: masterimage selection, SAR data focusing and registration, baselineconstruction, digital elevation model (DEM) simulation, differ-ential interferogram generation, persistent scatterers candidate(PSC) selection, multi-image sparse grid phase unwrapping,atmospheric phase screen (APS) estimation and removal [8],[9], [16], PS point selection, PS point displacement historyanalysis, and average deformation estimation.DEM from the Shuttle Radar Topography Mission (SRTM)
with 3 arc-sec resolution was applied for topographic phaseremoval. The atmospheric filtering is performed by applyingKriging Interpolation, which uses optimum filtering (removalof outliers) and allows resampling of APS on the regular SAR
TABLE ILISTS OF TSX IMAGES
: The reference master image.
Fig. 1. SAR side-looking geometry and angular parameters.
grid at once [8], [9]. The seasonal oscillation can also be cap-tured by SARPROZ [18]. Most of the results will be displayedoverlaid onto the Google Earth (GE). There are two major out-puts for each PS analysis: 1) the average velocity map calculatedfrom the entire time period and 2) the displacement time series.
B. Detected Velocity
SAR side-looking geometry and angular parameters are illus-trated in Fig. 1, taking descending pass as an example, whererepresents the satellite position and is the target. The line
between satellite and targets gives the Line of Sight (LOS) di-rection, and is the incidence angle. Dashed line is theprojection of onto the horizontal plane. is the angle be-tween and the east direction. Thus, the detected velocityalong the LOS direction is the geometrical sum of three-dimen-sional (north–south, west–east and vertical direction) deforma-tion projected to the LOS direction, which is given by [19]
(1)
This article has been accepted for inclusion in a future issue of this journal. Content is final as presented, with the exception of pagination.
LUO et al.: SUBSIDENCE MONITORING OF TIANJIN SUBURBS BY TerraSAR-X PERSISTENT SCATTERERS INTERFEROMETRY 3
where E, N, and V are the velocities in west–east, north–south,and vertical direction, respectively.In our case, is 41.08 and is 10.3 . Thus, (1) can be
written as follows:
(2)
In (2), given the TSX orbital parameters, the system has a verylow sensitivity to the N–S component. Since no other informa-tion on the movement direction is available, we assume that thedetected movement is mostly vertical. The assumption is sup-ported by previous works, in which GPS study (2006–2010)shows that this area presents a low relative horizontal move-ment, which could be neglected [20]. Thus, positive velocitiesdetected in our case are simply due to subsiding of the referencepoint, supported by leveling results.
IV. RESULTS AND ANALYSES
The average velocity map was derived as illustrated in Fig. 2.More than 940 000 PS points were identified at approximately522 PS/km , with the temporal coherence threshold of 0.7. Dueto the location of the man-made objects, the spatial distributionof these points is not homogeneous. PS points appear to be popu-lated more densely in residential areas 1,500 2,000 PS/kmcompared with agricultural parcels 0 10 PS/km . Signifi-cant spatial gaps exist despite of the large number of PS points.As illustrated in Fig. 2, the average velocity ranges from 60 to20mm/yr along the LOS directionwith respect to (w.r.t.) the ref-erence point (see the pink star), indicating a possible maximumsubsidence rate of 80 mm/yr. Red indicates a subsidence ratehigher than that of the reference point, whereas blue indicates asubsidence rate lower than the rate of the reference point.Several subsidence centers of different sizes are shown
against the background of large-scale subsidence. Three primesubsidence centers are located in Wangqingtuo Town, Sheng-fang Town, and Nanhe Town, marked with A, B, and C,respectively, in Fig. 2. Wangqingtuo Town and ShengfangTown have experienced significant subsidence rates rangingfrom 35 to 60 mm/yr and 30 to 60 mm/yr, respectively,w.r.t. the reference point, whereas the subsidence rate of NanheTown is less significant, ranging from 18 to 60 mm/yr.The results highlighted that the strongest activity occurred inWangqingtuo Town and Shengfang Town. The subsidence ratein Wuqing district and Jinghai district tends to be small andstable compared to those in Xie’s study [21]. Nanhe Town isa newly discovered subsidence center with no deformationinformation from published results. Further investigation isrequired in that area.The analysis has been validated by means of eight leveling
points provided by the local Institute of Surveying andMapping.The accuracy of height of the available leveling data has beenassessed at 2 mm/km [22].Before comparing the leveling value and the PS results, the
following possible uncertainties were discovered:
Fig. 2. Linear deformation trend estimated using the PS technique along theLOS direction. The color scale shows stable areas in blue and moving areasin yellow ( 30 mm/year) and red ( 60 mm/year). The subsidence centers areshown as follows: A is Wangqingtuo Town, B is Shengfang Town, and C isNanhe Town. The reference point is marked with the pink star. The white place-marks highlight the location of the eight leveling points.
1) The temporal resolution of leveling data is only at the scaleof month, while for TSX data the exact acquisition dateis available, which leads to a temporal uncertainty of onemonth regardless of the exact pair of TSX records selectedfor comparison.
2) The location of the leveling point, released from the dataprovider, is expected to have an error within 15 m ac-cording to handheld GPS measurements. Moreover, hor-izontal positioning error of PS results cannot be fully ne-glected, which is introduced by geo-referencing of the PSpoints used for the comparison. The vertical positioningdispersion can be calculated as a function of the numberof images of the dataset , the dispersion of their normalbaselines , and the phase noise [8], [9], [16], [23]
(3)
where is the wavelength, is the incidence angle, andis the sensor-target distance. For multitemporal data
of images with an incidence angle of(41.08 ) and a baseline dispersion of 89 m, a PSwith the temporal coherence of ([9], [16]) is localized with an elevation dispersion of about1.31 m. Thus, a vertical error can be translated into aneast–west positioning error of approximately the same size,1.31 m in the above case.
3) When conducting the PS analysis, the spatial referencepoint is selected and assumed to be stable in the currentstudy with unknown actual deformation history, whichshould result in some degree of uncertainty. Moreover,the PS technique measures deformation using “doubledifference,” which will increase the uncertainty.
4) TSX is sensitive along the LOS direction, while levelingmeasures are only sensitive along a vertical direction.

This article has been accepted for inclusion in a future issue of this journal. Content is final as presented, with the exception of pagination.
4 IEEE JOURNAL OF SELECTED TOPICS IN APPLIED EARTH OBSERVATIONS AND REMOTE SENSING
TABLE IICOMPARISON OF DISPLACEMENT (mm) BETWEEN PS RESULTS AND
LEVELING MEASUREMENTS
During this validation process, no horizontal movementis assumed, which may introduce a certain level of uncer-tainty. Under this hypothesis, the vertical displacement ofleveling measurement is projected into the LOS directionby multiplying ( is the incidence angle, 41.08 inthis case). The process equals to scaling the measureddisplacement along the LOS direction by 1.327 ,which results in an increase in the estimated root meansquare error (RMSE) by a factor of 1.327.
5) Only eight leveling points are available, which is notenough for a statistic point of view. With only a smallnumber of observations, gross error points cannot beeliminated statistically.
6) The reference point for the leveling measurements isassumed to be stable. However, the subsidence of theentire region makes current elevation maps unreliablebecause the reference point for leveling measurements ismost likely subsiding with the entire region, resulting incorresponding uncertainties.
The nearest PS points are selected to compare with the lev-eling values. The temporal coherence of all eight selected PSpoints is very high, above 0.85, except for one at 0.78. The dis-persion of individual deformation measurements can becalculated as [16]
(4)
where is the measured temporal coherence. Then, the disper-sion of the difference between two displacements is calculatedas and listed in Table II,which represents 1 2 mm dispersion.Table II compares the results between PS and leveling. The
entire RMSE is 6.21 mm, the minimum difference is 0.92 mmand the maximum difference is 12.33 mm. Considering thesubsidence rate of this area on a large scale, ranging from 60to 20 mm/yr w.r.t. the reference point setup for the PS analysis,this accuracy may be acceptable. In addressing the uncertaintiesof the location of the leveling points, ten nearest PS points high-lighted with black dots in Fig. 3 are selected for each levelingpoint. The linear regression is performed between the nearestPS points highlighted with red dots and the leveling points. Thecorrelation coefficient is approximately 0.88, indicating a goodagreement between these two distinct measurements.The subsidence mechanism of the study area was explored
with the integration of the geological information. Naturalfactors and anthropogenic activities are two primary types ofcauses for the ground subsidence. Anthropogenic activities
Fig. 3. Displacement comparison between PS and leveling data. There are eightleveling points in total and the ten nearest PS points (black dots) are selectedfor the comparison. The nearest PS points highlighted with red crosses are usedto perform a linear regression (blue line). -axis: leveling data (mm). -axis:PS results (mm).
have a major contribution to the subsidence, particularly ex-cessive use of underground water resources [24]. However,groundwater withdrawal alone does not result in subsidencecenters because of the connectivity of water. To evaluate thegeological factors, the PS results and a geological map with ascale of 1:200 000 are geocoded and overlain in GE (see Fig. 4).Most of our study area is covered by quaternary sediments. Al-luvium and diluvium, alluvium, marine and alluvium deposit,and lacustrine deposit are four kinds of involved quaternarysediments. The porosity of deposit has effective impact onthe degree of ground subsidence when underground water iswithdrawn.In Wangqingtuo town, the surface was formed by allu-
vial–diluvial, while the surrounding is alluvium and lacustrinedeposit. The diameters of dinas in these three sediments de-crease successively. Alluvial–diluvial deposit is composed offine sand and silty sand resulting in high porosity. However, themain component of the other two deposits (alluvium depositand lacustrine deposit) is clay, and the associated porosity islow. Thus, when the same amount of underground water iswithdrawn, subsidence in shallow layer happens more easilyin alluvial–diluvial deposit. This could be a good explanationto the severe subsidence in Wangqingtuo Town. Therefore,underground water withdrawal plays a dominant role in thesubsidence in Tianjin suburbs. Moreover, other factors, such aslithological patterns, also have impacts on the degree of groundsubsidence. For deeper understanding, more investigation andgeological materials are required.
V. DISCUSSION
A. Monitoring Multiple Towns
With rapid urbanization and industrial development in thesuburbs, monitoring multitowns simultaneously in wide ranges

This article has been accepted for inclusion in a future issue of this journal. Content is final as presented, with the exception of pagination.
LUO et al.: SUBSIDENCE MONITORING OF TIANJIN SUBURBS BY TerraSAR-X PERSISTENT SCATTERERS INTERFEROMETRY 5
Fig. 4. Geological map with a scale of 1:20 000. The red frame represents the coverage of TSX full frame. The local area around Wangqingtuo Town is framedby the black rectangle which is zoomed in and illustrated in the top right inset. The legend is shown in the lower right corner.
becomes a critical task for monitoring, predicting, and pre-venting of geological subsidence. Nowadays, with the fastdevelopment of high-resolution InSAR satellite system, theabove request becomes practical. As shown in Fig. 2, the sub-sidence over star-like distributed towns referred to one singlereference point is clearly displayed, thanks to TSX data and PStechnique.Previous publication [9] has demonstrated that the precision
of PS results are related to the accuracy of APS estimation,which depends on the number of available images, the density ofPS points, and the reliability of phase difference. In our case, thenumber of images and density of PS points are already demon-strated to be eligible for the PS analysis; thus, we go further toinvestigate the reliability of phase difference, a term that is de-fined by the temporal coherence between two neighboring PScandidates (also called PS pairs), which can be calculated as [8]
(5)
where represents the number of interferograms and isthe phase difference between two neighboring PS candidates of
differential interferogram.The temporal coherence of the PS pairs in our study area is il-
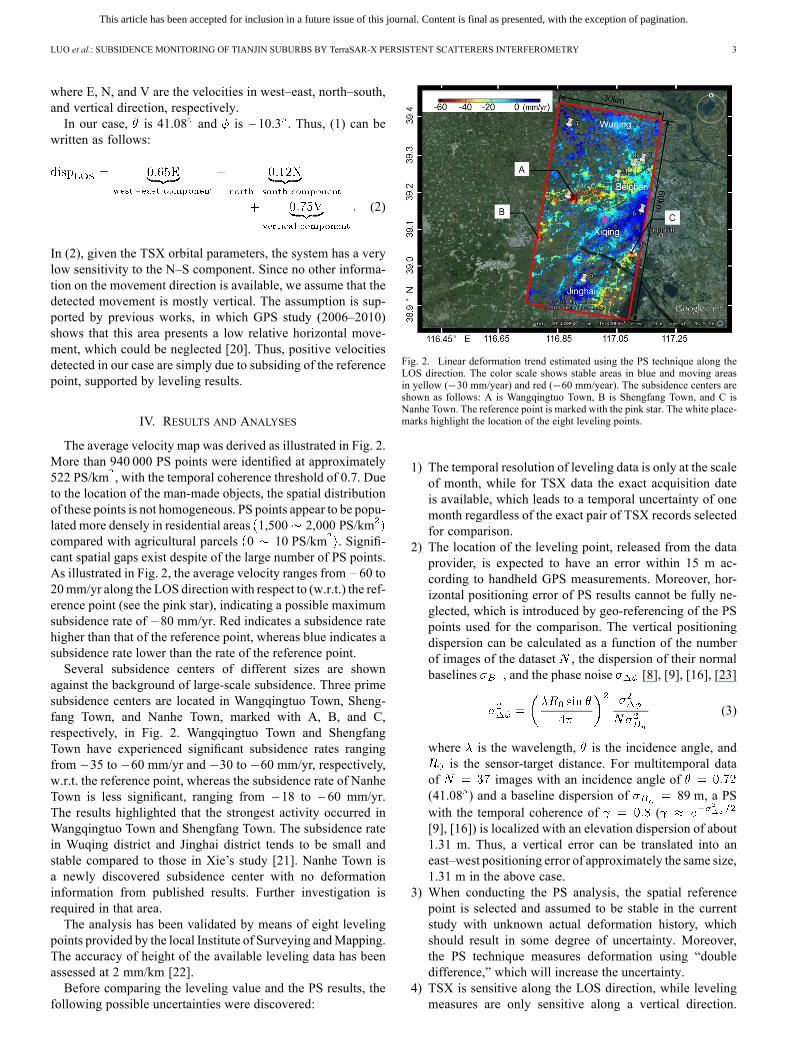
lustrated in Fig. 5. The network represents the sparse grid of PScandidates used for APS estimation, while the two neighboringPS candidates are connected via lines, for which the color rep-resents the temporal coherence of the PS pairs ranging from 0(blue) to 1 (red), where 1 indicates the best coherence.Before analyzing the results, we would like to stress two
points [8]: 1) in areas with low PS density where few identifi-
able PS points can be found, large gaps will exist, and 2) duringthe process, PS pairs are discarded when , where
is set as minimum threshold. For a star-like distri-bution, if the study area is fragmented into different clusters ofPS and no reliable equation is available between them ,the method can only apply to each individual cluster [8], and theexternal GCPs will be required to connect different clusters.As illustrated in Fig. 5, the density of PS candidates is high
enough (over 635/km ), and meanwhile the temporal coherenceof most PS pairs is good. Most important, different towns areconnected with relatively high temporal coherence, or what wecalled a “good connectivity.” As shown in the right inset ofFig. 5,Wangqingtuo Town (A) andDonggugang Town (F), 5 kmaway from each other, were selected for further interpretation.Despite the fact that the two towns are connected via a singleroad, a lot of PS candidates can be identified along the roaddue to the high resolution of TSX data. Contrarily, it is neverpossible to identify enough PS candidates along the roads withmedium resolution SAR data [14]. Moreover, the temporal co-herence of the PS pairs along this road is close to 1, indicatinga superb connection between these two towns. Therefore, withthe help of high-resolution SAR data, we are now able to over-come this obstacle of medium resolution SAR data and verymuch likely to increase the reliability of the PS results withoutexternal GCPs.
B. Monitoring Highways, Railways and Power Lines
The high density of PS candidates and good temporal coher-ence ensure the precision of the results after full-frame TSX PSprocessing. The average velocity map (see Fig. 2) shows sev-
This article has been accepted for inclusion in a future issue of this journal. Content is final as presented, with the exception of pagination.
6 IEEE JOURNAL OF SELECTED TOPICS IN APPLIED EARTH OBSERVATIONS AND REMOTE SENSING
Fig. 5. Sparse grid of PS candidates used for APS estimation and the temporal coherence. -axis: azimuth direction; -axis: range direction. The color scaleshows the temporal coherence ranges from 0 to 1. A: Wangqingtuo Town, F: Donggugang Town.
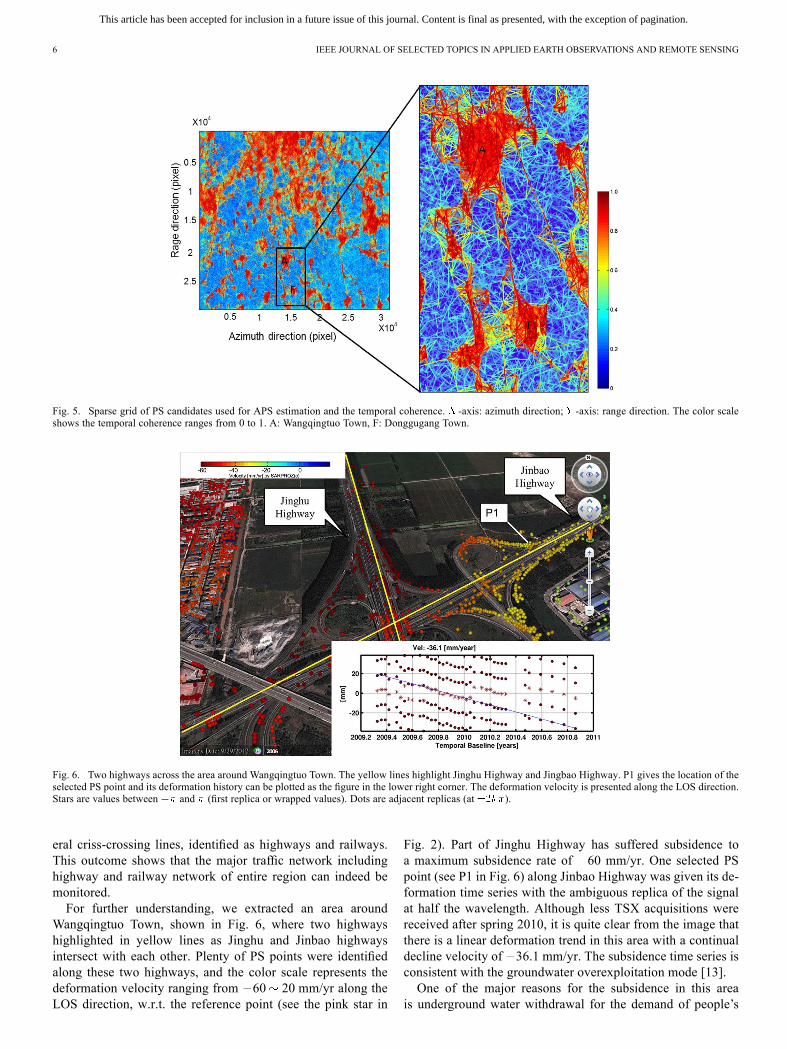
Fig. 6. Two highways across the area around Wangqingtuo Town. The yellow lines highlight Jinghu Highway and Jingbao Highway. P1 gives the location of theselected PS point and its deformation history can be plotted as the figure in the lower right corner. The deformation velocity is presented along the LOS direction.Stars are values between and (first replica or wrapped values). Dots are adjacent replicas (at ).
eral criss-crossing lines, identified as highways and railways.This outcome shows that the major traffic network includinghighway and railway network of entire region can indeed bemonitored.For further understanding, we extracted an area around
Wangqingtuo Town, shown in Fig. 6, where two highwayshighlighted in yellow lines as Jinghu and Jinbao highwaysintersect with each other. Plenty of PS points were identifiedalong these two highways, and the color scale represents thedeformation velocity ranging from 60 20 mm/yr along theLOS direction, w.r.t. the reference point (see the pink star in
Fig. 2). Part of Jinghu Highway has suffered subsidence toa maximum subsidence rate of 60 mm/yr. One selected PSpoint (see P1 in Fig. 6) along Jinbao Highway was given its de-formation time series with the ambiguous replica of the signalat half the wavelength. Although less TSX acquisitions werereceived after spring 2010, it is quite clear from the image thatthere is a linear deformation trend in this area with a continualdecline velocity of 36.1 mm/yr. The subsidence time series isconsistent with the groundwater overexploitation mode [13].One of the major reasons for the subsidence in this area
is underground water withdrawal for the demand of people’s
This article has been accepted for inclusion in a future issue of this journal. Content is final as presented, with the exception of pagination.
LUO et al.: SUBSIDENCE MONITORING OF TIANJIN SUBURBS BY TerraSAR-X PERSISTENT SCATTERERS INTERFEROMETRY 7
Fig. 7. Jingjin high-speed railway across the area near Shuangjie Town. The red line highlights the railway. P2 gives the location of the selected PS point andits deformation history is displayed in the lower right corner. The deformation velocity is presented along the LOS direction. Stars are values between and(first replica or wrapped values). Dots are adjacent replicas (at ).
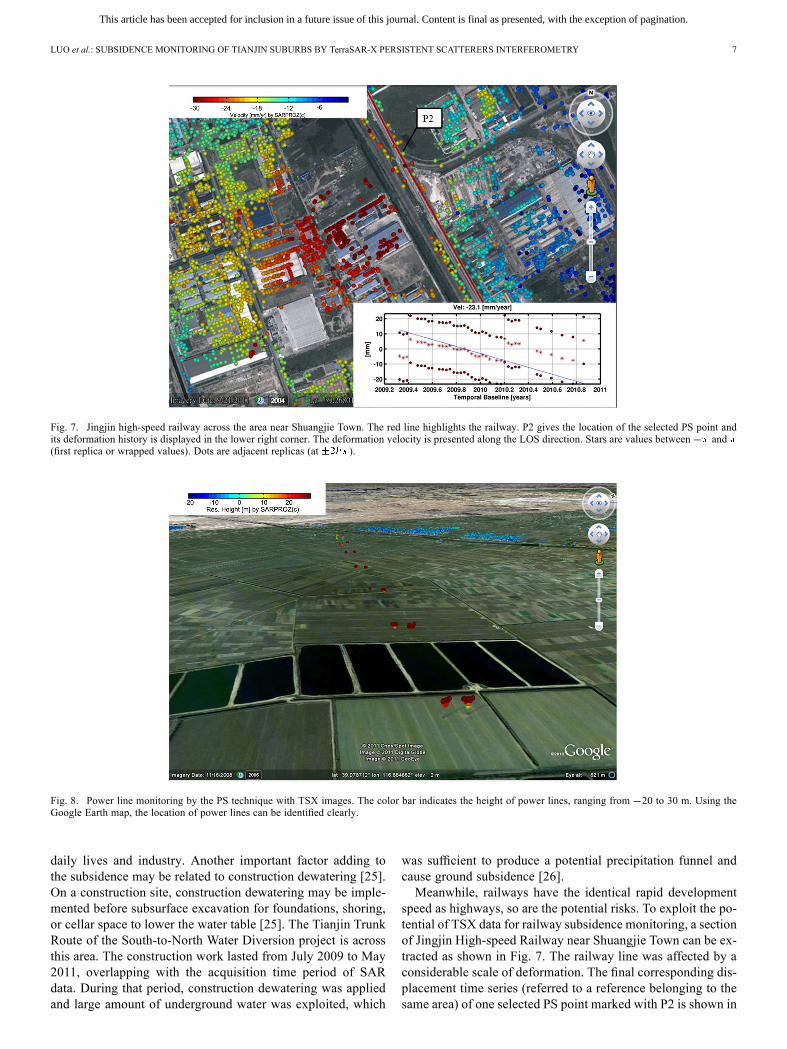
Fig. 8. Power line monitoring by the PS technique with TSX images. The color bar indicates the height of power lines, ranging from 20 to 30 m. Using theGoogle Earth map, the location of power lines can be identified clearly.
daily lives and industry. Another important factor adding tothe subsidence may be related to construction dewatering [25].On a construction site, construction dewatering may be imple-mented before subsurface excavation for foundations, shoring,or cellar space to lower the water table [25]. The Tianjin TrunkRoute of the South-to-North Water Diversion project is acrossthis area. The construction work lasted from July 2009 to May2011, overlapping with the acquisition time period of SARdata. During that period, construction dewatering was appliedand large amount of underground water was exploited, which
was sufficient to produce a potential precipitation funnel andcause ground subsidence [26].Meanwhile, railways have the identical rapid development
speed as highways, so are the potential risks. To exploit the po-tential of TSX data for railway subsidence monitoring, a sectionof Jingjin High-speed Railway near Shuangjie Town can be ex-tracted as shown in Fig. 7. The railway line was affected by aconsiderable scale of deformation. The final corresponding dis-placement time series (referred to a reference belonging to thesame area) of one selected PS point marked with P2 is shown in

This article has been accepted for inclusion in a future issue of this journal. Content is final as presented, with the exception of pagination.
8 IEEE JOURNAL OF SELECTED TOPICS IN APPLIED EARTH OBSERVATIONS AND REMOTE SENSING
the lower right corner in Fig. 7. The deformation trend is overalllinear despite of slight nonlinear component. Once again, thedetail distribution of the railway line was clearly shown by thelining of PS points, indicating that the TSX is capable of pro-viding high PSC density and monitoring railway subsidence. Itis also worth mentioning that the railway is crossing two areasthat were affected by different deformation rates. One of the im-portant reasons should be different categories of land uses. InFig. 7, the left bottom side is Beichen economic zones whileupper right side is Wuqing agricultural zones. The greater de-mand of underground water in the industrial area than that inthe agricultural areas was a possible explanation for a fasterwater-level dropping and thus more serious subsidence. It ishence referred that the subsiding trend over the railway regionwas counteracting and even overlimiting the protection capa-bility of railway foundations.In addition, it is also important to monitor the movement of
power lines and their supports. As opposed to change detectionmethods [27], our results for power lines monitoring are derivedfrom InSAR time series analysis with high-resolution SAR data.Since the subsidence of power lines in our monitoring region isnot so significant, we simply present the height analysis fromour PS analysis in Fig. 8 to identify the locations and heights ofthese power lines supports.
VI. CONCLUSION
In this paper, we have performed a first wide area PSI anal-ysis with high resolution -band SAR data covering the Tianjinsuburbs (located in the west of Tianjin). A classical PS analysiswas applied and three severe subsidence cones were identifiedfrom the average deformation map, including one newly dis-covered subsiding center located in Nanhe Town (see Fig. 2).The results demonstrate that it is feasible to use high resolutionSAR data tomonitor subsidence jointly overmultiple towns (seeFig. 5). The subsidence severity of different towns can be iden-tified clearly without external GCPs by applying the above tech-nique. Shorter revisit period, when coupled with high-resolutionTSX, enhances the understanding of subsidence time series. Inaddition, the possible uncertainties were analyzed in detail be-tween InSAR results and leveling measurements whose spatialand temporal densities are so different. Moreover, the quanti-tative comparison showed a consistent agreement with a cor-relation coefficient of 0.88 and a dispersion of 6 mm w.r.t. thegiven uncertainties (see Fig. 3 and Table II). Those indices werefurther confirmations of the capability of the TSX data and theapplied PS methodology.By integration of geological materials (see Fig. 4), an ex-
cessive amount of groundwater withdrawal is one of the majorcauses for land subsidence in Tianjin suburbs. Moreover, thelithological character may be another important factor for theformation of subsiding center.Deformation analysis showed that the PS points along the
LMLFs maintain a good coherence even in a relatively long-term time span. The derived annual velocity field covering theTianjin study site showed that TSXwas able to catch impressivemotion details and proved its advantages for monitoring LMLFs(see Figs. 6–8), which will be significant for the regional devel-opment of China. Furthermore, the linear and nonlinear trend
of the subsidence has been detected in the acquisition intervals.The linear subsidence, together with slight nonlinear compo-nents, can be detected by the PS technique using a linear defor-mation model. In addition, when the motion trend is dominatedby an evident nonlinear component, a more sophisticated defor-mation model is suggested to be used for fitting the practicalmodel.
ACKNOWLEDGMENT
TerraSAR-X data are provided by Infoterra, Germany. Thesoftware used in this work is SARProz, developed by D.Perissin. The authors are thankful to data and technical supportfrom the Tianjin Institute of Surveying and Mapping.
REFERENCES
[1] Y. Yin et al., “Land subsidence and countermeasures for its preventionin China,” Chin. J. Geologic. Hazard Control, vol. 16, pp. 1–8, 2005.
[2] D. Perissin and T. Wang, “Time-series InSAR applications over urbanareas in China,” IEEE J. Sel. Topics Appl. Remote Sens., vol. 4, pp.92–100, Mar. 2011.
[3] L. Ren et al., “Results of settlement monitoring by GPS in Tianjinduring the last ten years,” Sci. Surv. Mapp., vol. 31, pp. 17–19, 2006.
[4] T. Li et al., “Ground deformation retrieval using quasi coherent targetsDInSAR, with application to suburban area of Tianjin, China,” IEEEJ. Sel. Topics Appl. Remote Sens., vol. 5, no. 3, pp. 867–873, 2012.
[5] A. K. Gabriel et al., “Mapping small elevation changes over largeareas: Differential radar interferometry,” J. Geophys. Res., vol. 94, pp.9183–9191, 1989.
[6] H. A. Zebker and P. Rosen, “Atmospheric artifacts in interferometricSAR surface deformation and topographic maps,” J. Geophys. Res.Solid Earth, vol. 102, pp. 7547–7563, 1997.
[7] H. A. Zebker and J. Villasenor, “Decorrelation in interferometricradar echoes,” IEEE Trans. Geosci. Remote Sens., vol. 30, no. 5, pp.950–959, 1992.
[8] A. Ferretti et al., “Nonlinear subsidence rate estimation using per-manent scatterers in differential SAR interferometry,” IEEE Trans.Geosci. Remote Sens., vol. 38, pp. 2202–2212, Sep. 2000.
[9] A. Ferretti et al., “Permanent scatterers in SAR interferometry,” IEEETrans. Geosci. Remote Sens., vol. 39, pp. 8–20, Jan. 2001.
[10] O. Mora et al., “Linear and nonlinear terrain deformation maps froma reduced set of interferometric SAR images,” IEEE Trans. Geosci.Remote Sens., vol. 41, no. 10, pp. 2243–2253, 2003.
[11] A. Hooper et al., “A new method for measuring deformation on vol-canoes and other natural terrains using InSAR persistent scatterers,”Geophys. Res. Lett., vol. 31, pp. 230–234, Dec. 2004.
[12] A. Ferretti et al., “Submillimeter accuracy of InSAR time series: Ex-perimental validation,” IEEE Trans. Geosci. Remote Sens., vol. 45, pp.1142–1153, May 2007.
[13] F. Chen et al., “Ground subsidence geo-hazards induced by rapid ur-banization: Implications from InSAR observation and geological anal-ysis,” Nat. Hazards Earth Syst. Sci, vol. 12, pp. 935–942, 2012.
[14] M. Crosetto et al., “Persistent scatterer interferometry: Potential, limitsand initial C-and X-band comparison,” Photogramm. Eng. RemoteSens., vol. 76, pp. 1061–1069, 2010.
[15] G. X. Liu et al., “Exploration of subsidence estimation by persistentscatterer InSAR on time series of high resolution TerraSAR-X images,”IEEE J. Sel. Topics Appl. Remote Sens., vol. 4, pp. 159–170,Mar. 2011.
[16] C. Colesanti et al., “SAR monitoring of progressive and seasonalground deformation using the permanent scatterers technique,” IEEETrans. Geosci. Remote Sens., vol. 41, pp. 1685–1701, Jul. 2003.
[17] D. Perissin, “SARPROZSoftwareManual,” [Online]. Available: http://ihome.cuhk.edu.hk/~b122066/manual/index.html
[18] D. Perissin and F. Rocca, “High-accuracy urban DEM using permanentscatterers,” IEEE Trans. Geosci. Remote Sens., vol. 44, pp. 3338–3347,Nov 2006.
[19] D.Massonnet andK. L. Feigl, “Radar interferometry and its applicationto changes in the Earth’s surface,” Rev. Geophys., vol. 36, pp. 441–500,1998.
[20] “Introduction to promote the use of CGCS2000 coordinate system inTianjin,” Tianjin Institute of Surverying and Mapping, Tianjin, China,Internal Tech. Doc., 2011.

This article has been accepted for inclusion in a future issue of this journal. Content is final as presented, with the exception of pagination.
LUO et al.: SUBSIDENCE MONITORING OF TIANJIN SUBURBS BY TerraSAR-X PERSISTENT SCATTERERS INTERFEROMETRY 9
[21] D. Xie et al., “Researching on sub-regional management of land sub-sidence in Tianjin,” Modern Water, vol. 4, pp. 36–38, 2009.
[22] Specifications for the First and Second Order Leveling, China NationalStandard, 1991.
[23] D. Perissin, “Validation of the submetric accuracy of vertical posi-tioning of PSs in C-band,” IEEE Geosci. Remote Sens. Lett., vol. 5,pp. 502–506, Jul. 2008.
[24] K. Dong et al., “Feature of the land subsidence and its damage inTianjin City,” J. Geologic. Hazards Environ. Preservat., vol. 18, pp.67–70, 2007.
[25] R. T. Ratay, Handbook of Temporary Structures in Construction: En-gineering Standards, Designs, Practices & Procedures. New York,NY, USA: McGraw-Hill, 1984, pp. (6-2)–(6-9).
[26] Z. Xiao and T. Li, “Effects of Tianjin trunk route of the middle routeof South-to-North Water Diversion Project on regional ground waterenvironment,” South-to-North Water Divers. Water Sci. Technol., vol.10, pp. 6–10, 2012.
[27] J. Liu, “Progress in deformation monitoring for dams, bridges andpower lines,” Ann. GIS, vol. 16, pp. 81–90, 2010.
Qingli Luo received the M.Eng. degree in pho-togrammetry and remote sensing from LiaoningTechnical University, Fuxin, China, in 2010.She is currently working toward the Ph.D. degree
in SAR inteferometry fields at the Institute of Spaceand Earth Information Science, The Chinese Univer-sity of Hong Kong, Hong Kong, China. Her currentresearch interests include subsidence monitoringby applying InSAR and persistent scatterers InSARtechniques.
Daniele Perissin was born in Milan, Italy, in 1977.He received the Master’s degree in telecommunica-tion engineering and the Ph.D. degree in informationtechnology from the Politecnico di Milano, Milan,Italy, in 2002 and 2006, respectively.He joined the Signal Processing research group at
the Politecnico di Milano in 2002, and since then, hehas been working on the permanent scatterers tech-nique (PSInSAR) in the framework of radar remotesensing. Since October 2009, he has held a positionas a Research Assistant Professor in the Institute of
Space and Earth Information Science (ISEIS) at the Chinese University of HongKong (CUHK), where he teaches two courses. He is author of a patent on theuse of urban dihedral reflectors for combining multi-sensor Interferometric Syn-thetic Aperture Radar (InSAR) data, and he has published approximately 80 re-search works in journals and conference proceedings. He is the developer of thesoftware Sarproz for processing multi-temporal InSAR data.Dr. Perissin received the IEEE JOURNAL OF SELECTED TOPICS IN APPLIED
EARTH OBSERVATIONS AND REMOTE SENSING Best Paper Award in 2012.
Hui Lin received the degree from the Wuhan Tech-nical University of Surveying and Mapping, Wuhan,China, in 1980, the M.Sc. degree in cartographyand remote sensing from the Chinese Academy ofSciences, Beijing, China, in 1983, and the M.A. andPh.D. degrees in geographic information systems(GIS) from the University of Buffalo, Buffalo, NY,USA, in 1987 and 1992, respectively.Since 1993, he has been with The Chinese Uni-
versity of Hong Kong (CUHK), Shatin, Hong Kong,where he is currently a Professor and Director of the
Institute of Space and Earth Information Science. His major research interestsin satellite remote sensing for cloudy and rainy environment, virtual geographicenvironments, and historic GIS. He is the Director of the Hong Kong Base of theNational Remote Sensing Center of China. He has published over 200 academicpapers, coauthored ten books and one atlas, edited ten conference proceedings.Dr. Lin is the founding President of the International Association of Chinese
Professionals in Geographic Information Science (CPGIS) and the Chief Editorof the journal Annals of GIS. He was elected an Academician of an InternationalEurasia Academy of Sciences and member of the Expert Committee of ChinaLunar Exploring Program in 1995 and 2008, respectively.
Yuanzhi Zhang received the Bachelor’s degree ingeology from the Changchun College of Geology,Jilin University, China; the Master’s of Science inremote sensing and cartography from the ChineseAcademy of Sciences, Beijing, China; the Master’sof Science in remote sensing and geological surveyfrom the International Institute for Geo-InformationScience and Earth Observation (ITC), The Nether-lands; and the Doctor of Science in technology fromthe Helsinki University of Technology, Finland.He joined the Institute of Space and Earth Infor-
mation Science, the Chinese University of Hong Kong, in October 2006. Hisresearch interests include coastal zone studies, land use and cover change de-tection, water quality and coral ecosystem monitoring, urban heat island effect,and geothermal exploration using remote sensing data.
Wei Wang received the Ph.D. degree in geodesyand survey engineering from the School of Geodesyand Geomatics (SGG), Wuhan University, China, in2008.He is currently working on the GNSS algorithms
and applications at the R&D Center of Tianjin In-stitute of Surveying and Mapping (TJISM), Tianjin,China, where he has held a position as the DeputyChief Engineer of the R&D Center since September2012, and he is responsible for algorithm develop-ment. His current research interests focus on precise
point positioning both in real-time and post-time and continuously operatingreference station (CORS) network data processing.
Related Documents