International Immunology, Vol. 8, No. 11, pp. 1715-1727 © 1996 Oxford University Press Subset-specific analysis of calcium fluxes in murine AIDS Michel Moutschen, Mohamed Trebak, Roland Greimers, Sonia Colombi and Jacques Boniver Department of Pathology, University of Liege B35, 4000 Liege, Belgium. Keywords: calcium, immunodeficiency, four-color flow cytometry, MAIDS, signal transduction Abstract Infection of susceptible strains of mice with the Duplan strain of murine leukemia viruses induces a syndrome called MAIDS (murine acquired immunodeficiency syndrome) characterized by immunodeficiency and lymphoproliferation. In addition to a complete refractoriness of most subsets of lymphocytes to mitogen stimulation, the development of phenotypic abnormalities occurs such as the appearance of an abnormal CD4 + T cell subset lacking membrane Thy-1. This study was performed to compare the calcium responses during the early stages of MAIDS (week 9 or earlier) between T cells and B cells and between CD4 + Thy-1" and CD4 + Thy-1 + T cells. B cells were strikingly less affected than T cells: their baseline [Ca 2+ ], did not significantly increase, and their calcium response to anti-IgM antibody and concanavalin A (Con A) was partially maintained. In contrast, the response to Con A was completely abolished in T cells. Interestingly, calcium mobilization in response to membrane receptor-independent stimuli such as ionophores and thapsigargin was strongly inhibited in T cells, while no such inhibition was found in B cells. In comparison with their CD4 + Thy-1 + counterparts, CD4 + Thy-1~ T cells had blunted calcium responses in controls, as well as in infected mice. However, CD4 + Thy-1 + T cells were also strikingly altered, suggesting that the loss of membrane Thy-1 could be associated with, but not directly responsible for abnormalities of calcium responses in CD4 + T cells from RadLV-Rs- infected mice. Introduction Murine acquired immunodeficiency syndrome (MAIDS) is caused by a mixture of retroviruses known as RadLV-Rs (1,2) or LP-BM5 (3) murine leukemia virus (MuLV). MAIDS is associated with hypergammaglobulinemia, lymphoprolifer- ative disease, and a severe impairment of both B and T cell responses to mitogenic and specific antigenic stimuli (4,5). Responses of CD4 + T cells are greatly impaired 3-4 weeks after infection, while the inhibition of CD8 + T cells occurs later in the course of the disease. The responses of B cells in MAIDS have been carefully studied by several authors. Mosier et al. showed abolished proliferative responses to lipopolysaccharide (LPS) and anti-n antibodies at week 4 post-infection (4). Surprisingly, the response to anti-n but not to LPS was slightly increased at week 1 post-infection. The secretion of antibodies in response to T-independent antigens (TNP-LPS) was also strikingly decreased (4). Little is known regarding the mechanisms responsible for the anergy of lymphocytes in MAIDS. Both CD4 + and CD8 + T cells from infected animals display an abolished calcium mobilization upon stimulation with anti-CD3 mAb or con- canavalin A (Con A) (6). Moreover, both subsets present an elevated baseline [Ca 2+ ]j. This suggests that T cells from infected mice present an early defect in signal transduction possibly in relation with an abnormal function of protein tyrosine kinases (PTK). In this regard, it is interesting to note that a subset of CD4 + T cells lacking Thy-1 (a membrane glycoprotein closely associated with p59^" PTK) is expanded in the lymphoid organs of infected mice (7,8). Since the defective virus infects mostly B cells and not T cells (9), it would be of interest to determine if the mechanisms responsible for functional anergy are similar in both subsets. Selvey et al. recently demonstrated that B cells from infected mice have impaired calcium fluxes in response to anti-jx antibodies or LPS stimulation (10). However, the latter study was not designed to The first two authors contributed equally to this work Correspondence to: M. Moutschen Transmitting editor. R. R. Hardy Received 15 August 1995, accepted 26 July 1996 by guest on February 14, 2013 http://intimm.oxfordjournals.org/ Downloaded from

Welcome message from author
This document is posted to help you gain knowledge. Please leave a comment to let me know what you think about it! Share it to your friends and learn new things together.
Transcript
International Immunology, Vol. 8, No. 11, pp. 1715-1727 © 1996 Oxford University Press
Subset-specific analysis of calcium fluxes inmurine AIDS
Michel Moutschen, Mohamed Trebak, Roland Greimers, Sonia Colombi andJacques Boniver
Department of Pathology, University of Liege B35, 4000 Liege, Belgium.
Keywords: calcium, immunodeficiency, four-color flow cytometry, MAIDS, signal transduction
Abstract
Infection of susceptible strains of mice with the Duplan strain of murine leukemia viruses inducesa syndrome called MAIDS (murine acquired immunodeficiency syndrome) characterized byimmunodeficiency and lymphoproliferation. In addition to a complete refractoriness of mostsubsets of lymphocytes to mitogen stimulation, the development of phenotypic abnormalitiesoccurs such as the appearance of an abnormal CD4+ T cell subset lacking membrane Thy-1. Thisstudy was performed to compare the calcium responses during the early stages of MAIDS (week 9or earlier) between T cells and B cells and between CD4+Thy-1" and CD4+Thy-1+ T cells. B cellswere strikingly less affected than T cells: their baseline [Ca2+], did not significantly increase, andtheir calcium response to anti-IgM antibody and concanavalin A (Con A) was partially maintained.In contrast, the response to Con A was completely abolished in T cells. Interestingly, calciummobilization in response to membrane receptor-independent stimuli such as ionophores andthapsigargin was strongly inhibited in T cells, while no such inhibition was found in B cells. Incomparison with their CD4+Thy-1+ counterparts, CD4+Thy-1~ T cells had blunted calciumresponses in controls, as well as in infected mice. However, CD4+Thy-1+ T cells were alsostrikingly altered, suggesting that the loss of membrane Thy-1 could be associated with, but notdirectly responsible for abnormalities of calcium responses in CD4+ T cells from RadLV-Rs-infected mice.
Introduction
Murine acquired immunodeficiency syndrome (MAIDS) iscaused by a mixture of retroviruses known as RadLV-Rs (1,2)or LP-BM5 (3) murine leukemia virus (MuLV). MAIDS isassociated with hypergammaglobulinemia, lymphoprolifer-ative disease, and a severe impairment of both B and T cellresponses to mitogenic and specific antigenic stimuli (4,5).Responses of CD4+ T cells are greatly impaired 3-4 weeksafter infection, while the inhibition of CD8+ T cells occurslater in the course of the disease. The responses of B cellsin MAIDS have been carefully studied by several authors.Mosier et al. showed abolished proliferative responses tolipopolysaccharide (LPS) and anti-n antibodies at week 4post-infection (4). Surprisingly, the response to anti-n but notto LPS was slightly increased at week 1 post-infection. Thesecretion of antibodies in response to T-independent antigens(TNP-LPS) was also strikingly decreased (4).
Little is known regarding the mechanisms responsible for
the anergy of lymphocytes in MAIDS. Both CD4+ and CD8+
T cells from infected animals display an abolished calciummobilization upon stimulation with anti-CD3 mAb or con-canavalin A (Con A) (6). Moreover, both subsets present anelevated baseline [Ca2+]j. This suggests that T cells frominfected mice present an early defect in signal transductionpossibly in relation with an abnormal function of proteintyrosine kinases (PTK). In this regard, it is interesting to notethat a subset of CD4+ T cells lacking Thy-1 (a membraneglycoprotein closely associated with p59^" PTK) is expandedin the lymphoid organs of infected mice (7,8). Since thedefective virus infects mostly B cells and not T cells (9), it wouldbe of interest to determine if the mechanisms responsible forfunctional anergy are similar in both subsets. Selvey et al.recently demonstrated that B cells from infected mice haveimpaired calcium fluxes in response to anti-jx antibodies or LPSstimulation (10). However, the latter study was not designed to
The first two authors contributed equally to this work
Correspondence to: M. Moutschen
Transmitting editor. R. R. Hardy Received 15 August 1995, accepted 26 July 1996
by guest on February 14, 2013http://intim
m.oxfordjournals.org/
Dow
nloaded from
1716 Calcium responses in MAIDS
compare the extent or the nature of the abnormalities in thedifferent cell subsets of the infected mice.
We sequentially analyzed intracellular calcium levels inthe course of RadLV-Rs infection. In addition to baselineunstimulated calcium levels, the analysis focused on calciummobilization in response to membrane receptor-dependent(such as Con A, anti-CD3 and anti-IgM antibodies) andreceptor-independent stimuli (ionophores and thapsigargin).Con A induces calcium fluxes in T cells as well as in B cells.Therefore this lectin allowed us to compare the responses ofboth cell subsets from infected mice with the same stimulus. Inaddition to this comparison, calcium fluxes were respectivelyanalyzed in CD4+Thy-1+ and CD4+Thy-1" T cells in view ofthe association of Thy-1 with PTK. An improved FACS analysisprotocol was defined using the calcium probe Fluo-3 (11) inconjunction with three mAb directed against CD4, CD8 andThy-1 antigens (12).
Methods
Mice and cell suspensions
Male C57BI/Ka (H-2b) mice were bred in our facility. Micewere injected twice i.p. at the age of 4 and 5 weeks with0.25 ml RadLV-Rs Duplan MuLV stock solution. Aged-matchedcontrol mice were injected twice with 0.25 ml saline. Afterdifferent time intervals (first injection = time 0), mice weresacrificed with CO2 asphyxiation. Lymph nodes (LN) (inguinal,axillary and cervical) were removed. Single cell suspensionsof LN were prepared with a fitting glass homogenizer, passedthrough a nylon cell strainer, washed three times and countedon a Thoma hematocytometer.
Virus
Extracts were prepared from the LN and spleen of three miceinjected 2 months earlier with RadLV-Rs extract 64 kindlyprovided by E. Legrand (INSERM 117, Bordeaux, France)(1,2). Lymphoid organs were ground in PBS and centrifuged30 min at 1.5x10" g. This cell-free supernatant constitutedthe extract. It was injected immediately into mice or stored inliquid nitrogen. XC plaque assay (13) was used to measurevirus titer. The virus preparation contained 1.0X10³ p.f.u. ofecotopic virus/ml.
Antibodies
The following mAb were used: phycoerythrin (PE)-conjugatedanti CD4 (YTS. 191.1; Sanbio, Am Volen, The Netherlands),biotinylated anti-CD8 (53-6-7; PharMingen, ITK Diagnostics,Uithorn, The Netherlands) and allophycocyanin (APC)-labeledanti-Thy-1.2 (5a-8; Sanbio). Peridinin chlorophyl-a proteincomplex (PerCP)-labeled streptavidin (SA) (PerCP-SA;Becton Dickinson, Erembodegem, Belgium) was used as asecond step to reveal biotinylated anti-CD8. In independenttwo-color experiments, biotinylated anti-B220 (6B2) revealedby PE-labeled streptavidin (Becton Dickinson) was used toanalyze calcium fluxes in Fluo-3 loaded B cells.
Preparation of Fluo-3 loaded cells
Cells at 107/ml were incubated for 20 min with 3 nl of 20%w/v stock solution of Pluronic F-127 (Molecular Probes,
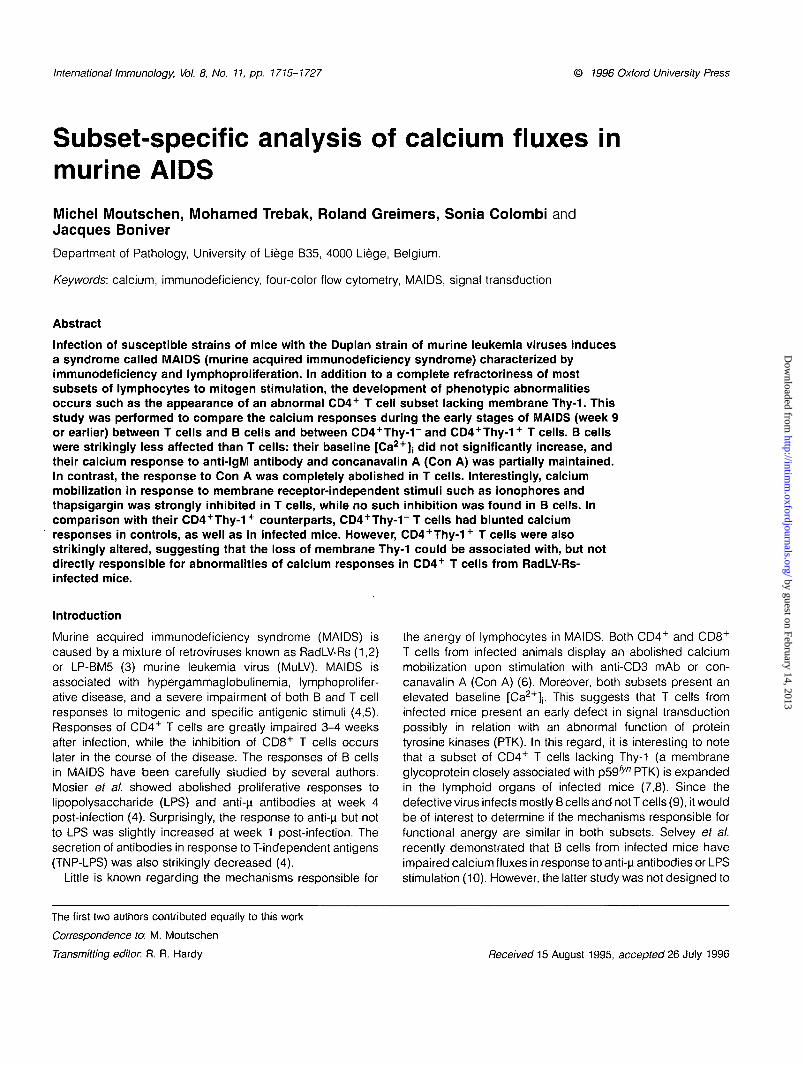
Fig. 1. Determination of the percentage of cells responding tostimulation by an increased [Ca2+]i (% stim.). The thin-line histogramrepresents Fluo-3 intensity under baseline conditions. Baselinepercentile 95 (P95base|ine) is determined using the FACS software.The bold-line histogram represents Fluo-3 intensity of the same cellpopulation after stimulation. The percentage of cells which reach,after stimulation, a Fluo-3 intensity higher than this P95t,aseiine isdefined as % stim. In this example, LN cells from a control mouseare stimulated with ionophore A23187 (10 u.M).
Eugene, OR) and in a second step with 2 |iM of Fluo-3/AM(Molecular Probes) in HBSS alone (without. FCS). They werekept in the dark at room temperature. The cells were diluted1/5 (2x10⁶ cells/ml) with HBSS containing 1% FCS and thenincubated again for 40 min in a 37.5°C water bath.
Triple immunostaining of Fluo-3 loaded cells
Fluo-3 loaded cells were washed three times in HBSS con-taining 1% FCS and incubated for. : 20 min at 4°C withappropriate concentrations of anti-Thy-1.2-APC, anti-CD4-PE and biotinylated anti-CD8 mAb. |n a second incubationPerCP-SA was added to reveal the biotinylated anti-CD8mAb. The cells were then washed three times in HBSS/1%FCS and diluted to 1 x 10⁶ cells/ml with HEPES-buffered saline.The cells were placed in a water bath at 37.5°C for -15 minbefore flow cytometry.
Flow cytometry
Analysis were performed by using a FACStar-plus flow cellsorter with the Lysys II software (Becton Dickinson). Calibrationof the cytometer was performed daily by using typical forwardscatter and autof luorescence signals generated by glutaralde-hyde-fixed chicken red blood cells. The forward and sidescatters were used to gate viable lymphocytes. For four-coloranalysis of Fluo-3 (green), PE (orange) and PerCP (red)fluorescences, blue excitation at 488 nm was provided by anargon ion laser (Air-to-Water cooled model Spinnaker 1161;Spectra Physics, Mountain View, CA). For the APC (far red)fluorescence, red excitation at 647 nm was provided by akrypton ion laser (Water cooled model 164-01; SpectraPhysics). Green fluorescence of Fluo-3 was detected at530 nm (FL-1), PE fluorescence was detected at 575 nm(FL-2), PerCP fluorescence was detected at 675 nm (FL-3)and APC fluorescence was measured at 670 nm (FL-4).Cross-over of FL-1 fluorescence into FL-2 and FL-3 detectionwindows was compensated for by analog subtraction at the
by guest on February 14, 2013http://intim
m.oxfordjournals.org/
Dow
nloaded from
Calcium responses in MAIDS 1717
400
350-
300"
S 25°"sr^ 2 0 0
'
h 15°"" 100-
50-
A. CD4+ T-cells
0 2 3 4 5Weeks
11 '
4UU"
350-
300"
250"
200-
150"
100-
50-
o-
B. CD8+ T-cells
T
JL JrAr$-^*--'Tif
T
L IT T
2 3 4 5Weeks
c
b
4UU"
350"
300"
250"
200"
150-
100"
50"
o-
C. CD4" Thy-1" CD8" cells
I I
0 1 2 3 4 5 6
Weeks
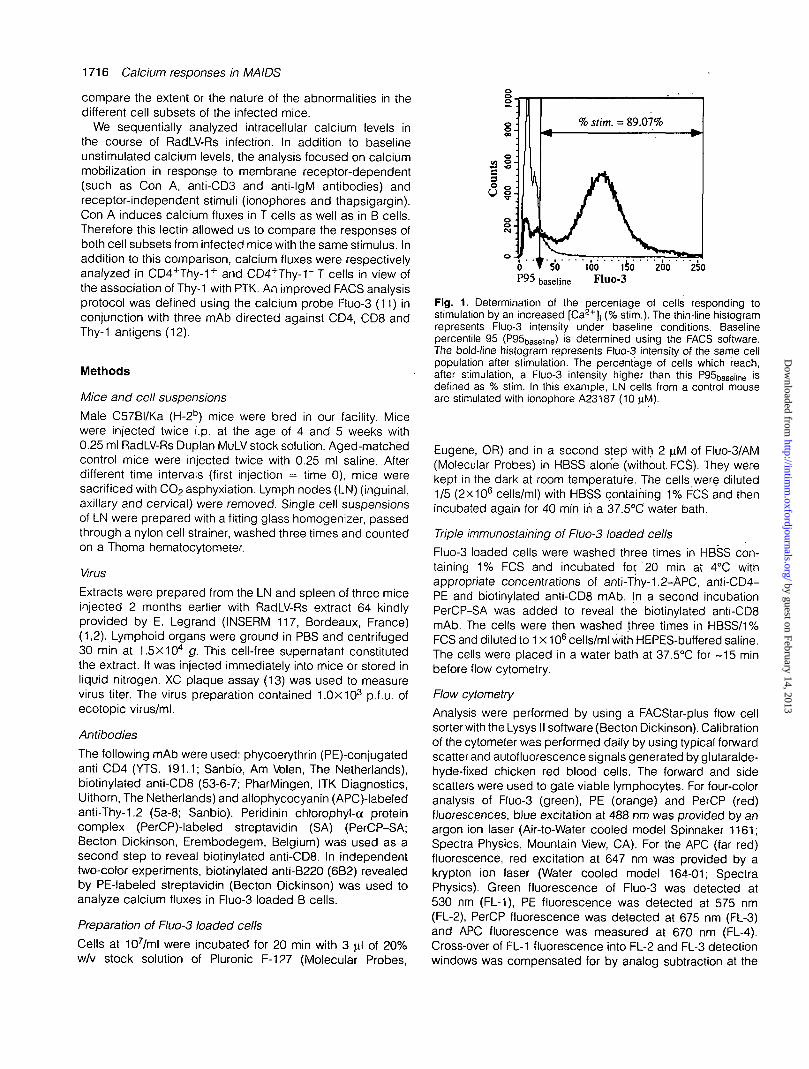
Fig. 2. Evolution of the baseline (without in vitro stimulation) [Ca2+]jin T and B cell subsets isolated from the LN of RadLV-Rs-infectedmice and sham-injected controls. (A) CD4+ T cell subsets accordingto Thy-1 expression: CD4+Thy-1~ T cells from controls (O) and fromRadLV-R-infected mice (•) ; CD4+Thy-1+ T cells from controls (3)and from RadLV-R-infected mice (•) . (B) CD8+ T cells from controls(A) and from RadLV-R-infected mice (A). (C) Thy-rCD4"CD8- (Bcells) from controls ( • ) and RadLV-R-infected mice (O). Each valueis expressed in nM and represents the mean [Ca2+]j ± SD in threemice analyzed individually (20,000-50,000 cells/sample).
Fluo-3 fluorescence intensity using the formula described byKaoefa/. (14)
[Ca2+1. =F- Frmin
where [Ca2+]j is the intracellular ionized calcium concentra-tion, Kd is 400 nM, Fis the experimental Fluo-3 fluorescenceintensity, and Fmin and Fmax are defined as described above.As shown in Results, the response to ionophores was stronglyinhibited in the infected mice and a reliable value of Fmax
could not be obtained with A23187 in these animals. Therefore,[Ca2+]j were calculated in controls and in infected mice byusing Fmax and Fmin from the equivalent lymphocyte subsetsof control animals. In each experiment, the Fluo-3 loadedcells were analyzed to obtain an unstimulated baseline.Between 2X10⁴ and 8 X 1 0 4 cells were then analyzed afterthe addition of Con A (Boehringer, 12.5 ng/ml), anti-CD3(2C11, Hamster IgG) (5 |xg/ml) and anti-IgM (ITK Diagnostics;Uithorn, The Netherlands; goat anti-mouse affinity purifiedantisera, n chain specific, 7 ng/ml) at a rate of 500-800 cells/s.In some experiments, the response to ionomycin (10 u.M),ionophore A23187 (10 uM) and thapsigargin (1 nM) wasspecifically studied. Since the gated subsets were quantitat-ively different, the number of events shown in the gated dot-plots was different for each subset. Nevertheless, in all cases,at least 5000 events were analyzed in each gate. Moretechnical details of four-color flow cytometry using Fluo-3 andtriple immunofluorescence will be given elsewhere (12).
Response indexesIn order to compare the results from control and infected mice,a calcium response index (CRI) was calculated according toMakino et al. (6). It is defined as:
CRI =A[Ca2+]| (infected)
A[Ca2+]i (controls)
where A[Ca2+], = [Ca2+], stim. - [Ca2+], baseline. This indexdoes not allow the evaluation of [Ca2+]j changes in responseto ionophore in the control mice since the denominator of thecalibration formula (Fmax - F) is 0 when ionophore is con-sidered as the stimulus. Consequently, when analyzingcalcium response to ionophore in infected mice, A[Ca2+]|values were given rather than CRI.
In some experiments, a CRI (%) was also defined as:
CRI (%) =A% (infected)
A% (controls)
where A% = % stim. - % baseline, where '% stim.' is thefrequency of cells which, after in vitro stimulation, reach afluorescence >95% of mean Fluo-3 intensity determined atbaseline (Fig. 1) and '% baseline' is the frequency of cellswith a fluorescence above the same level but without anyin vitro stimulation.
preamplifier stage. Fluo-3 fluorescence was calibrated bydetermining Fmax with 10 nM of A23187 calcium ionophore(Molecular probes) and then adding 2 mM of MnCI2 to obtainthe minimum signal (Fmin). [Ca2+]j can be calculated from the
Results
In the early stages of MAIDS, baseline [Ca2*], increases in Tcells subsets but not in B cellsAt week 3 post-inoculation, the average baseline [Ca2+]jstrongly increased in both CD4+ T cell subsets (Thy-1+ and
by guest on February 14, 2013http://intim
m.oxfordjournals.org/
Dow
nloaded from
1718 Calcium responses in MAIDS
Thy-1 ) from infected animals and culminated around week5 (Fig. 2). In comparison with their normal counterparts, bothThy-1" (306 ± 51 versus 131 ± 28 nM P < 0.0001) andThy-1+ (245 ± 42 versus 114 ± 18 nM p = 0.0472) subsetsof the infected mice showed an important increase. In the
infected mice, the baseline [Ca2+]j was therefore slightlyhigher in CD4+Thy-1" than in CD4+Thy-1+ T cells althoughthis difference was not statistically significant except at week5 (P = 0.0720). The baseline [Ca2+]j in CD8+ T cells alsoincreased around week 3 but this phenomenon was slower
a.2r >
B
»
o
RadLV-Rs (Wk 5)
^ ^ ^ ^
Thy-1.2-APC Thy-1.2-APC
BCD4+ Thy-1- CD8'
t so iee lse zeeTime (512 sec)
tie
t
CD4-Thy-1-CD8-
258
CD4+Thy-1+CD8"
a se lie l ie ' aieTime (512 sec)
CD4-Thy-1+CD8+
r'- '.;.v-:-:..;.:-;I':;.»•.- .••••;.
^ •-' • < > ! . * ' " - i •. • . ' . - • ' . • • • • . •''-• • / : i 'y='r1 i- . ' ••'••'. ' •• '" " '-'. ' i . ' ;
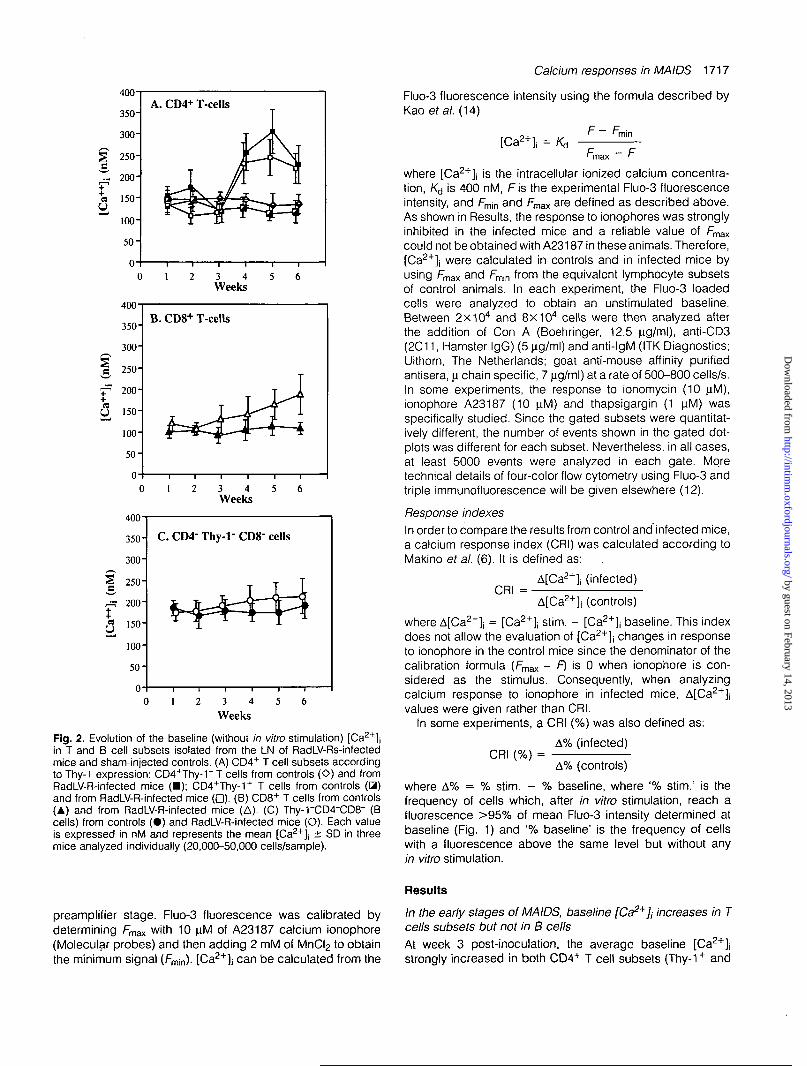
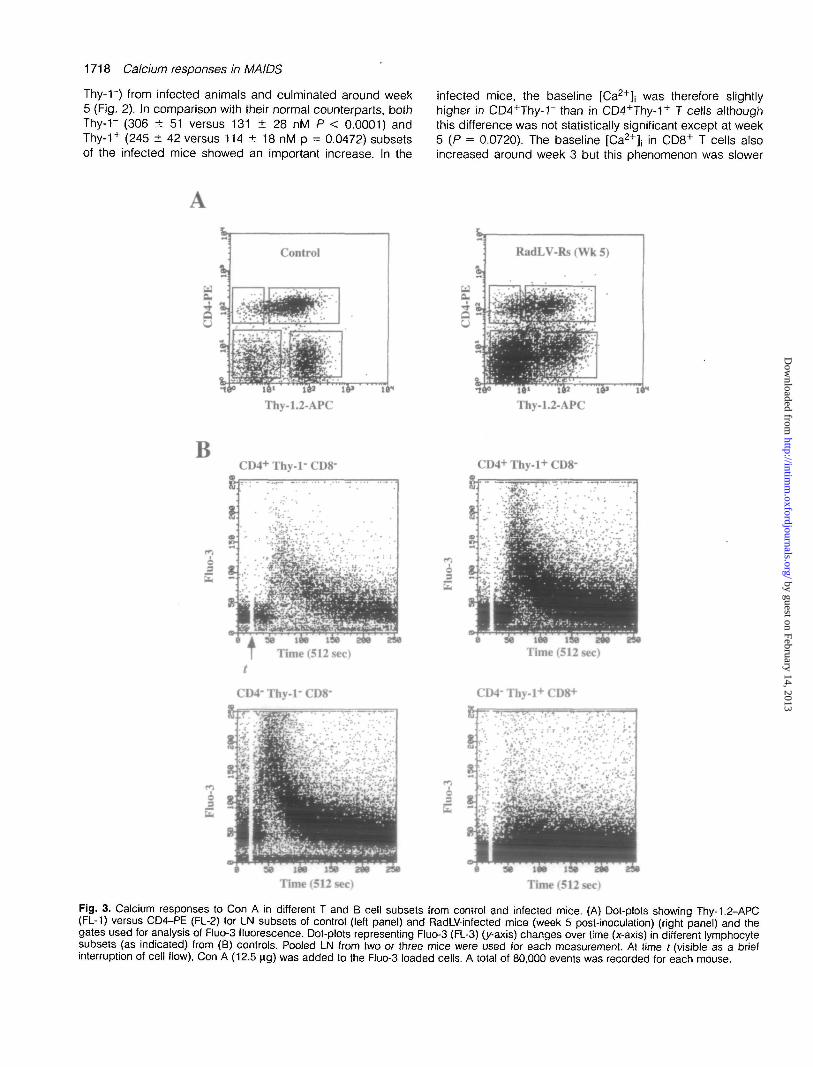
Fig. 3. Calcium responses to Con A in different T and B cell subsets from control and infected mice. (A) Dot-plots showing Thy-1.2-APC(FL-1) versus CD4-PE (FL-2) for LN subsets of control (left panel) and RadLV-infected mice (week 5 post-inoculation) (right panel) and thegates used for analysis of Fluo-3 fluorescence. Dot-plots representing Fluo-3 (FL-3) (y-axis) changes over time (x-axis) in different lymphocytesubsets (as indicated) from (B) controls. Pooled LN from two or three mice were used for each measurement. At time t (visible as a briefinterruption of cell flow), Con A (12.5 ng) was added to the Fluo-3 loaded cells. A total of 80,000 events was recorded for each mouse.
by guest on February 14, 2013http://intim
m.oxfordjournals.org/
Dow
nloaded from
and less pronounced than in CD4+ T cells. For example, atweek 5, the baseline [Ca2+]j was 164 ± 35 nM in the CD8+
T cells of infected animals versus 114 ± 23 in controls (P =0.0152). Interestingly, there was only a minimal increase ofthe baseline [Ca2"1"], in Thy-rCD4"CD8- cells from infectedanimals. We previously demonstrated that, in MAIDS as innormal mice, >90% of these Thy-1~CD4-CD8" cells are B220+and slgG+ when the analysis is gated on viable lymphocyteson the basis of forward and side scatters (unpublishedobservations). Therefore, Thy-1~CD4~CD8~ cells are consid-ered as B cells in the present report. In comparison with theirnormal counterparts, the increase of baseline [Ca2+]j in thissubset remained insignificant at week 6 (P = 0.3191) andafterwards until week 9 (not shown). Similar results wereobserved when B cells were analyzed according to theirpositivity for B220, rather than as Thy-1-CD4"CD8- cells(not shown).
Independently of their membrane Thy-1 phenotype, T cellssubsets from infected mice display a major impairment ofmembrane receptor-dependent calcium responses while Bcells are weakly altered
Early after inoculation with RadLV-Rs, calcium responses toCon A and anti-CD3 mAb were strongly inhibited in CD4+
Calcium responses in MAIDS 1719
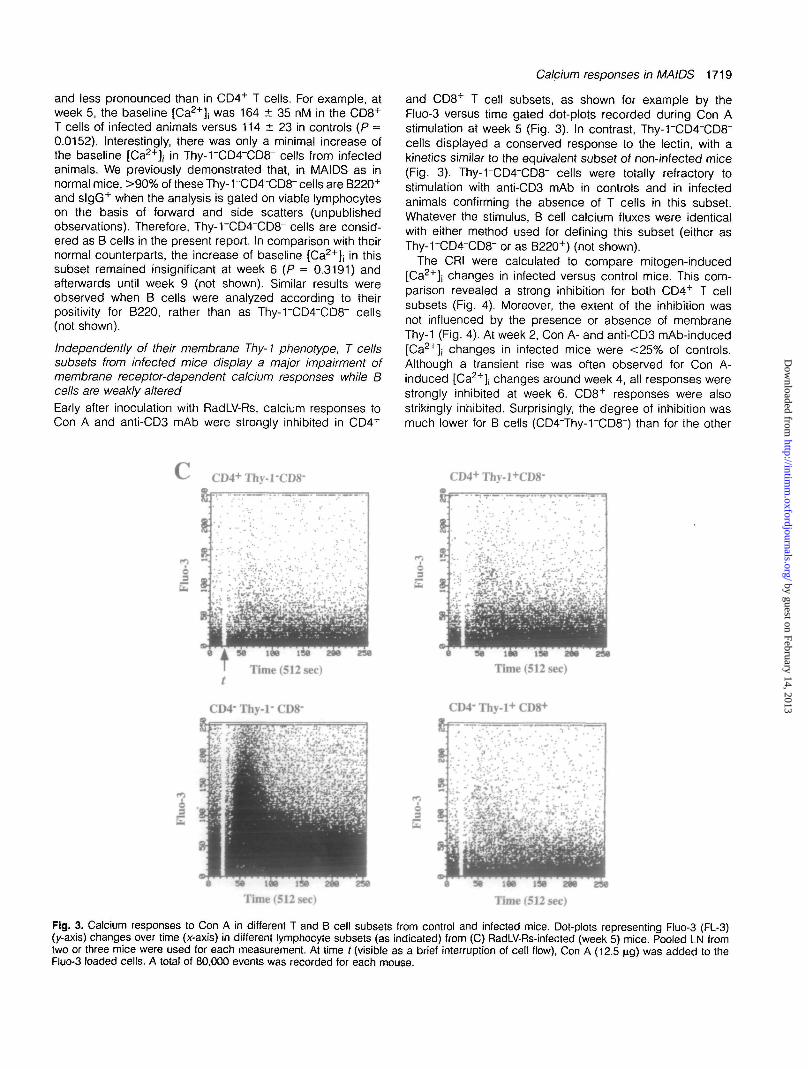
and CD8+ T cell subsets, as shown for example by theFluo-3 versus time gated dot-plots recorded during Con Astimulation at week 5 (Fig. 3). In contrast, Thy-rCD4"CD8"cells displayed a conserved response to the lectin, with akinetics similar to the equivalent subset of non-infected mice(Fig. 3). Thy-rCD4"CD8" cells were totally refractory tostimulation with anti-CD3 mAb in controls and in infectedanimals confirming the absence of T cells in this subset.Whatever the stimulus, B cell calcium fluxes were identicalwith either method used for defining this subset (either asThy-rCD4"CD8- or as B220+) (not shown).
The CRI were calculated to compare mitogen-induced[Ca2+]j changes in infected versus control mice. This com-parison revealed a strong inhibition for both CD4+ T cellsubsets (Fig. 4). Moreover, the extent of the inhibition wasnot influenced by the presence or absence of membraneThy-1 (Fig. 4). At week 2, Con A- and anti-CD3 mAb-induced[Ca2+]j changes in infected mice were <25% of controls.Although a transient rise was often observed for Con A-induced [Ca2+]| changes around week 4, all responses werestrongly inhibited at week 6. CD8+ responses were alsostrikingly inhibited. Surprisingly, the degree of inhibition wasmuch lower for B cells (CD4~Thy-rCD8~) than for the other
CD4+ Thy-1-CD8-
lee
Time (512 sec)
ii.
1
|
CD4+ Thy-1+CD8-
\ ' ' ' ' . •
.' y-;,- -
*
*' "^ "V*" ' '.':' *\ : . * * ' . -'•
1 • ' ':'*??• 71^'X X V '•'.-•ia-y ?
*
Time (512 sec)
CD4- Thy-1- CD8" CD4- Thy-1+ CD8+
§
Time (512 sec) Time (512 sec)
Fig. 3. Calcium responses to Con A in different T and B cell subsets from control and infected mice. Dot-plots representing Fluo-3 (FL-3)(y-axis) changes over time (x-axis) in different lymphocyte subsets (as indicated) from (C) RadLV-Rs-infected (week 5) mice. Pooled LN fromtwo or three mice were used for each measurement. At time / (visible as a brief interruption of cell flow), Con A (12.5 \ig) was added to theFluo-3 loaded cells. A total of 80,000 events was recorded for each mouse.
by guest on February 14, 2013http://intim
m.oxfordjournals.org/
Dow
nloaded from
1720 Calcium responses in MAIDS
1.2-
x
oaCA
0.8"
0.6-
0.4-
0.2-
0.0
CD4+Thy-l"
CD8+ CD4" Thy-1- CD8"1.2
- 1.0
- 0.8
- 0.6
0.4
h 0.2
0.0
0 1 2 3 4 5 6 0 1 2 3 4 5 6
Weeks0 1 2 3 4 5 6
1.2
0 1 2 3 4 5 6 0 1 2 3 4 5 6
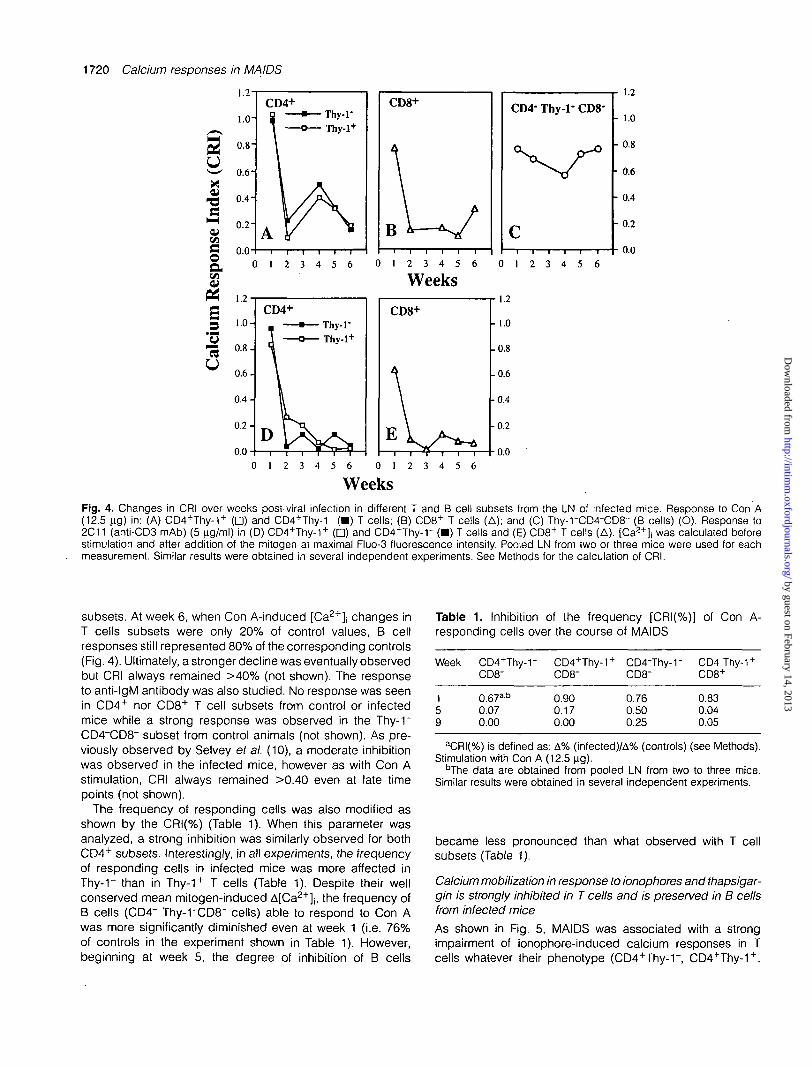
WeeksFig. 4. Changes in CRI over weeks post-viral infection in different T and B cell subsets from the LN of infected mice. Response to Con A(12.5 ng) in: (A) CD4+Thy-1+ (D) and CD4+Thy-1" (•) T cells; (B) CD8+ T cells (A); and (C) Thy-rCD4-CD8~ (B cells) (O). Response to2C11 (anti-CD3 mAb) (5 ^ig/ml) in (D) CD4+Thy-1+ ( • ) and CD4+Thy-r ( • ) T cells and (E) CD8+ T cells (A). [Ca2+]j was calculated beforestimulation and after addition of the mitogen at maximal Fluo-3 fluorescence intensity. Pooled LN from two or three mice were used for eachmeasurement. Similar results were obtained in several independent experiments. See Methods for the calculation of CRI.
subsets. At week 6, when Con A-induced [Ca2+]| changes inT cells subsets were only 20% of control values, B cellresponses still represented 80% of the corresponding controls(Fig. 4). Ultimately, a stronger decline was eventually observedbut CRI always remained >40% (not shown). The responseto anti-IgM antibody was also studied. No response was seenin CD4+ nor CD8+ T cell subsets from control or infectedmice while a strong response was observed in the Thy-1"CD4"CD8" subset from control animals (not shown). As pre-viously observed by Selvey et al. (10), a moderate inhibitionwas observed in the infected mice, however as with Con Astimulation, CRI always remained >0.40 even at late timepoints (not shown).
The frequency of responding cells was also modified asshown by the CRI(%) (Table 1). When this parameter wasanalyzed, a strong inhibition was similarly observed for bothCD4+ subsets. Interestingly, in all experiments, the frequencyof responding cells in infected mice was more affected inThy-1~ than in Thy-1+ T cells (Table 1). Despite their wellconserved mean mitogen-induced A[Ca2+]j, the frequency ofB cells (CD4~ Thy-rCD8~ cells) able to respond to Con Awas more significantly diminished even at week 1 (i.e. 76%of controls in the experiment shown in Table 1). However,beginning at week 5, the degree of inhibition of B cells
Table 1. Inhibition of the frequency [CRI(%)] of Con A-responding cells over the course of MAIDS
Week CD4+Thy-1"CD8-
CD4+Thy-1 +
CD8"CD4"Thy-rCD8"
CD4"Thy-1CD8+
0.67a'b
0.070.00
0.900.170.00
0.760.500.25
0.830.040.05
aCRI(%) is defined as: A% (infected)/A% (controls) (see Methods).Stimulation with Con A (12.5 ng).
bThe data are obtained from pooled LN from two to three mice.Similar results were obtained in several independent experiments.
became less pronounced than what observed with T cellsubsets (Table 1).
Calcium mobilization in response to ionophores and thapsigar-gin is strongly inhibited in T cells and is preserved in B cellsfrom infected mice
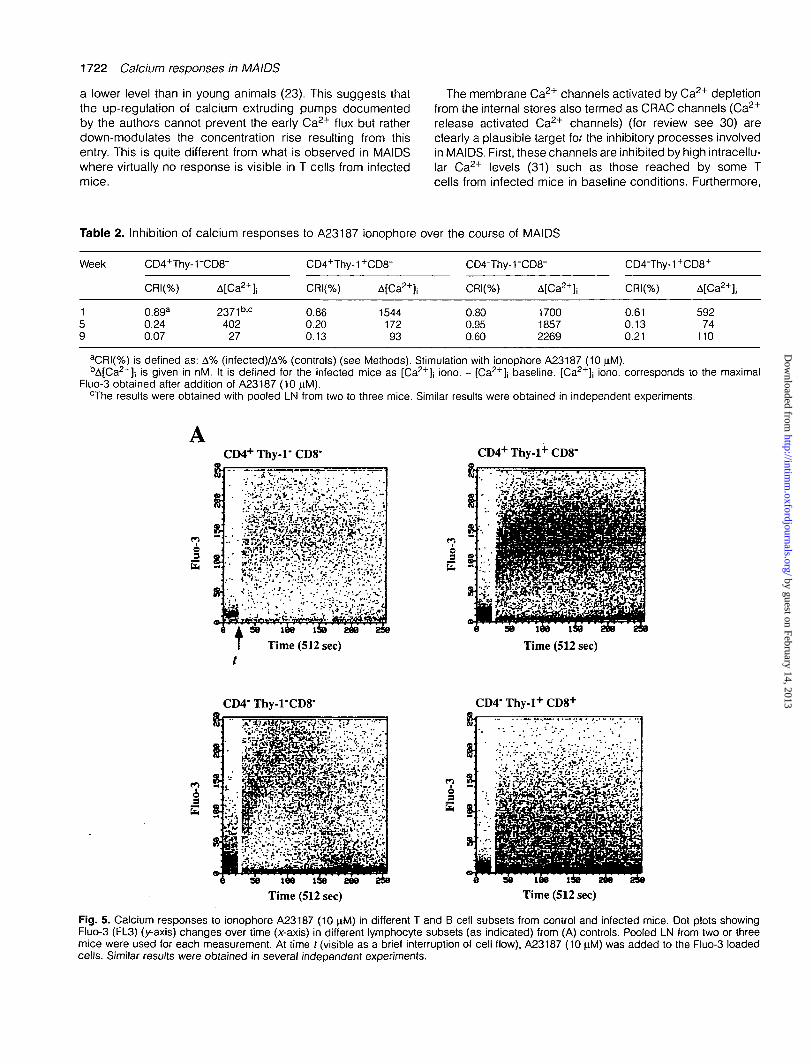
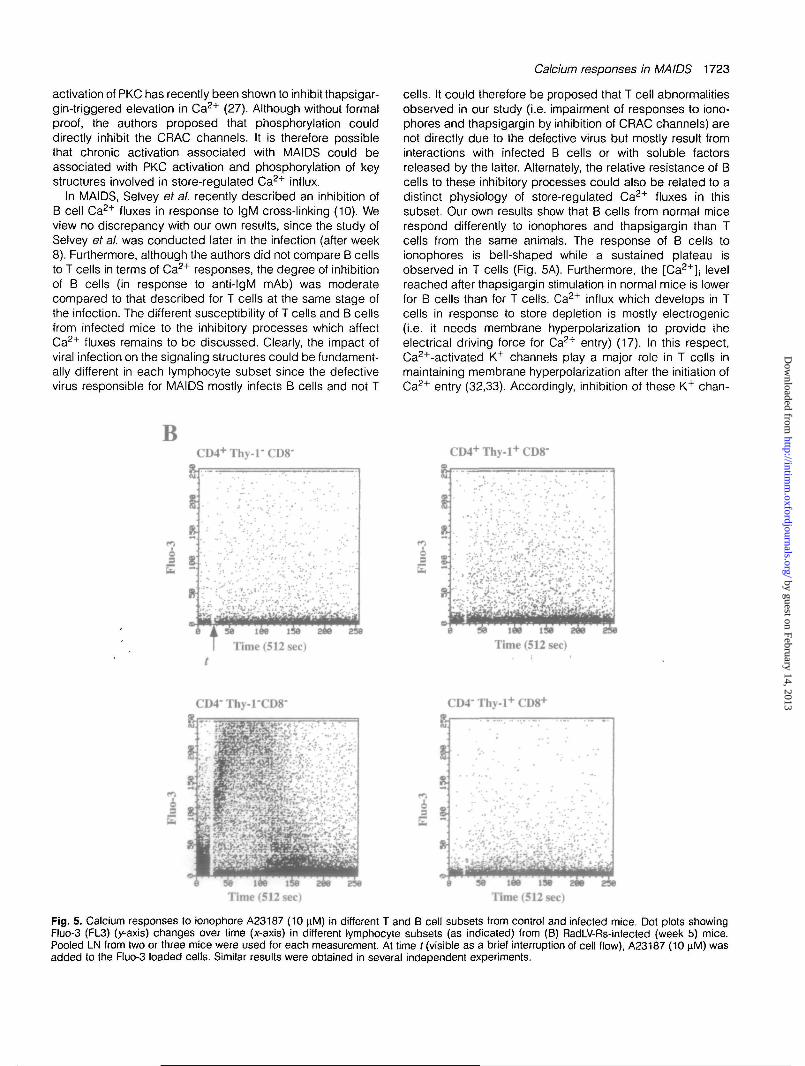
As shown in Fig. 5, MAIDS was associated with a strongimpairment of ionophore-induced calcium responses in Tcells whatever their phenotype (CD4+Thy-r, CD4+Thy-1+,
by guest on February 14, 2013http://intim
m.oxfordjournals.org/
Dow
nloaded from
Calcium responses in MAIDS 1721
CD8+). In contrast, B cells from infected mice conserved theirbell-shape response curve as in control mice (Fig. 5). Whileionophore-induced A[Ca2+]j rapidly declined in CD4+ andCD8+ subsets, falling at week 9 well below 20% of week 1values (Table 2), this parameter remained constant or evenincreased in B cells.
The frequency of responding cells was also affected, valuesbeing -20% of controls for all T cell subsets at week 5 (Table2). Interestingly, although the frequency of Con A-respondingcells was more strongly inhibited in CD4+Thy-1" T cells frominfected mice (Table 1), no such difference was observed inresponse to the ionophore (Table 2). Most B cells (CD4~Thy-1"CD8" cells) still responded to ionophore at week 5post-inoculation (Table 2). At week 9, however, despite aconserved mean A[Ca2+]j, a significant part of this subsetbecame refractory to ionophore stimulation (Table 2).
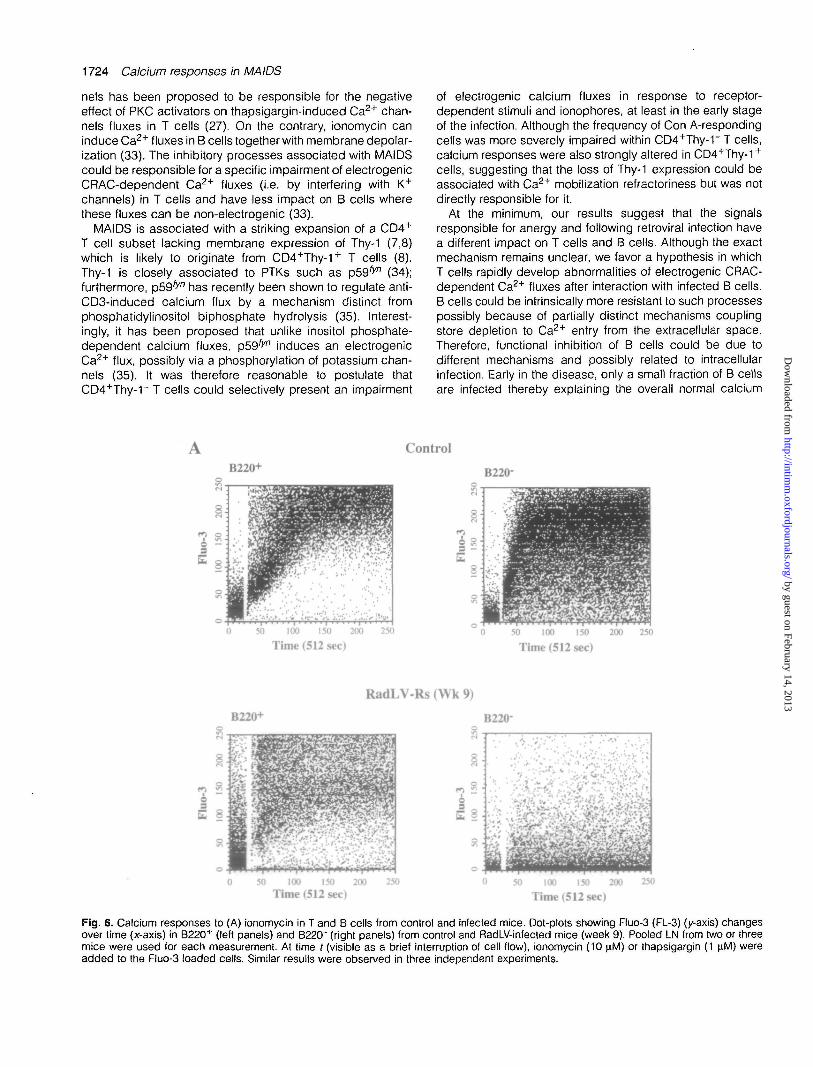
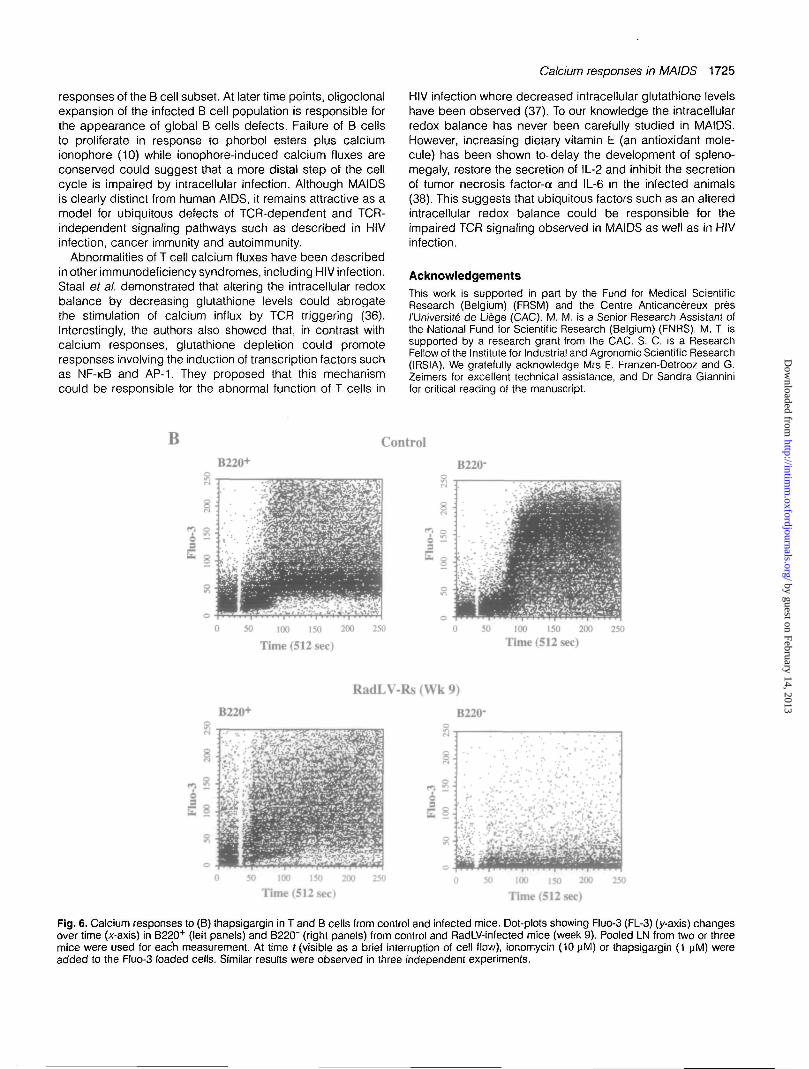
Similar results were observed with another ionophore (iono-mycin) and with another type of receptor-independent stimu-lus, thapsigargin, an inhibitor of the ATP-dependent calciumpump of the endoplasmic reticulum (15) (Fig. 6). B cells,defined as B220+, showed a strong response to ionomycin,which was only partially inhibited in the infected mice (hereat week 9). In contrast, there was virtually no response toionomycin in T cells (defined as B220") from the same animals(Fig. 6A). The results were grossly similar to what wasobserved with A23187. In comparison to ionophores, thapsi-gargin induced a delayed response in normal T cells as wellas B cells (Fig. 6B). Interestingly, the calcium flux was lessintense in B cells than in T cells although most B cells fromnormal mice clearly responded to the stimulation (Fig. 6B). Ininfected mice, T cell responses to thapsigargin were almostabolished (8% responding cells versus 80% in controls) whileB cells were less affected (58% responding cells versus 71%in controls) (Fig. 6B).
Discussion
This report illustrates important findings regarding to theimpairment of signal transduction pathways in MAIDS: (i) aspreviously described (6), in all T cell subsets from infectedmice, [Ca2+]j rapidly increases in basal conditions and failsto respond to receptor-dependent stimuli; (ii) both CD4+Thy-1~ and CD4+Thy-1+ T cells of the infected mice present amajor impairment of calcium responses, however in terms offrequency of responding cells, the inhibition is more pro-nounced in CD4+Thy-1~ T cells; (iii) T cells from infected micealso fail to mobilize Ca2+ in response to receptor-independentstimuli such as thapsigargin or ionophores A23187 andionomycin with no difference between CD4+Thy-1~ andCD4+Thy-1+ T cells; (iv) in contrast with T cells, B cellresponses to receptor-dependent stimuli are only moderatelyimpaired and little inhibition is observed in response toionophores and thapsigargin.
To our knowledge this is the first report illustrating abolishedresponses to ionophores or to thapsigargin in MAIDS. Inaddition, the analysis of the frequency of responding cellssuggests that around week 5, a significant fraction of T cellsfrom infected mice, especially CD4+Thy-1~ cells, still respondsto ionophore [CRI(%) = 0.24] but does not mobilize calciumanymore after Con A stimulation [CRI(%) = 0.07]. Proximal
steps of receptor-dependent signaling are therefore also likelyto be involved. These results therefore suggest that theimpairment of calcium responses in the syndrome is due toat least two distinct mechanisms [i.e. proximal: upstreamfrom inositol 1,4,5-triphosphate (IP3) synthesis; and distal :downstream from IP3 interaction with microsomal mem-branes].
Ionophores such as A23187 and ionomycin primarily inter-act with microsomal membranes where they induce an earlyrelease of Ca2+ from the reticulum (16,17). In turn, Ca2+
depletion of these intracellular stores initiates the process ofCa2+ entry from the extracellular compartment. The mechan-isms responsible for this coupling remain unknown although adiffusible factor with suggestive properties has been identified(18,19). Thapsigargin also induces a passive depletion ofinternal stores by inhibiting the ATP-dependent Ca2+ pumpresponsible for Ca2+ uptake by the reticulum (15,20,21).Insufficient increase of [Ca2+]j in response to ionophores haspreviously been observed by Miller et al. in the lymphocytesfrom aged mice (22-24). It was demonstrated that such afailure to increase [Ca2+]j after incubation with ionophoreswas not due to diminished membrane permeability to theionophore itself nor to ionophore-Ca2+ complexes. In MAIDS,the absence of response to ionophores as well as to thapsigar-gin also suggests that refractoriness to receptor-independentstimuli is not specific to ionophores and does not involve areduced permeability nor an abnormal interaction of thesereagents with the microsomal membranes.
It seems unlikely that pharmacological agents such asionomycin and thapsigargin, interacting in a non-reversiblefashion with the microsomal membranes, could fail to induceCa2+ depletion of the internal stores in T cells from infectedmice. An up-regulated activity of the endoplasmic reticulumCa2+-ATPase, possibly related to protein kinase C (PKC)activation (25-27) could nevertheless prevent depletion ofCa2+ stores. However, the latter hypothesis is highly improb-able since thapsigargin, an inhibitor of this ATP-dependentcalcium pump, did not induce a response. Furthermore,preincubation with this thapsigargin did not render T cellsresponsive to subsequent stimulation with ionomycin (notshown). Recently, two patients with primary immunodeficiencywere found with impaired responses to ionophores and thapsi-gargin (28,29). Using video imaging the authors demonstratedthat ionophores and thapsigargin induced a normal releasefrom internal stores (28,29).
If Ca2+ depletion of the internal stores takes place normallyin MAIDS, the defect leading to the absence of Ca2+ influxmust therefore be associated with the sequence of eventslinking this depletion to the opening of the channels presentin the plasma membrane. In their study on aged mice, whichalso present blunted responses to ionophores, Miller et al.proposed that an up-regulation of calcium extruding pumpscould be involved (23). Such a mechanism is unlikely to occurin MAIDS. First, contrary to what was observed by Miller inhis model (22,23), T cells from RadLV-Rs-infected mice arecharacterized by an increased baseline level of Ca2+. This isnot in favor of a constitutively up-regulated activity of calciumextruding pumps. Furthermore, in Miller's study, ionomycininduced a rise of [Ca2+]j with a similar kinetics in young andold mice. In old mice, however, [Ca2+]| reached a plateau at
by guest on February 14, 2013http://intim
m.oxfordjournals.org/
Dow
nloaded from
1722 Calcium responses in MAIDS
a lower level than in young animals (23). This suggests thatthe up-regulation of calcium extruding pumps documentedby the authors cannot prevent the early Ca2+ flux but ratherdown-modulates the concentration rise resulting from thisentry. This is quite different from what is observed in MAIDSwhere virtually no response is visible in T cells from infectedmice.
The membrane Ca2+ channels activated by Ca2+ depletionfrom the internal stores also termed as CRAC channels (Ca2+
release activated Ca2+ channels) (for review see 30) areclearly a plausible target for the inhibitory processes involvedin MAIDS. First, these channels are inhibited by high intracellu-lar Ca2+ levels (31) such as those reached by some Tcells from infected mice in baseline conditions. Furthermore,
Table 2. Inhibition of calcium responses to A23187 ionophore over the course of MAIDS
Week
159
CD4+Thy-1"CD8-
CRI(%)
0.89a
0.240.07
A[Ca2+];
2371 b 'c
40227
CD4
CRI(
0.860.200.13
+Thy-1+CD8"
%) A[Ca2+]i
154417293
CD4
CRI(
0.800.950.60
-Thy-1"CD8-
%) A[Ca2+]|
170018572269
CD4"Thy-1
CRI(%)
0.610.130.21
+CD8+
A[Ca2+]j
59274
110
aCRI(%) is defined as: A% (infected)/A% (controls) (see Methods). Stimulation with ionophore A23187 (10 \iM).bA[Ca2+]i is given in nM. It is defined for the infected mice as [Ca2+]j iono. - [Ca2+]j baseline. [Ca2+]j iono. corresponds to the maximal
Fluo-3 obtained after addition of A23187 (10 (iM).The results were obtained with pooled LN from two to three mice. Similar results were obtained in independent experiments.
CD4+ Thy-1" CD8' CD4+ Thy-1+ CD8"
SB lie lieTime (512 sec) Time (512 sec)
O
CD4- Thy-1-CD8- CD4" Thy-1+ CD8+
Time (512 sec) Time (512 sec)
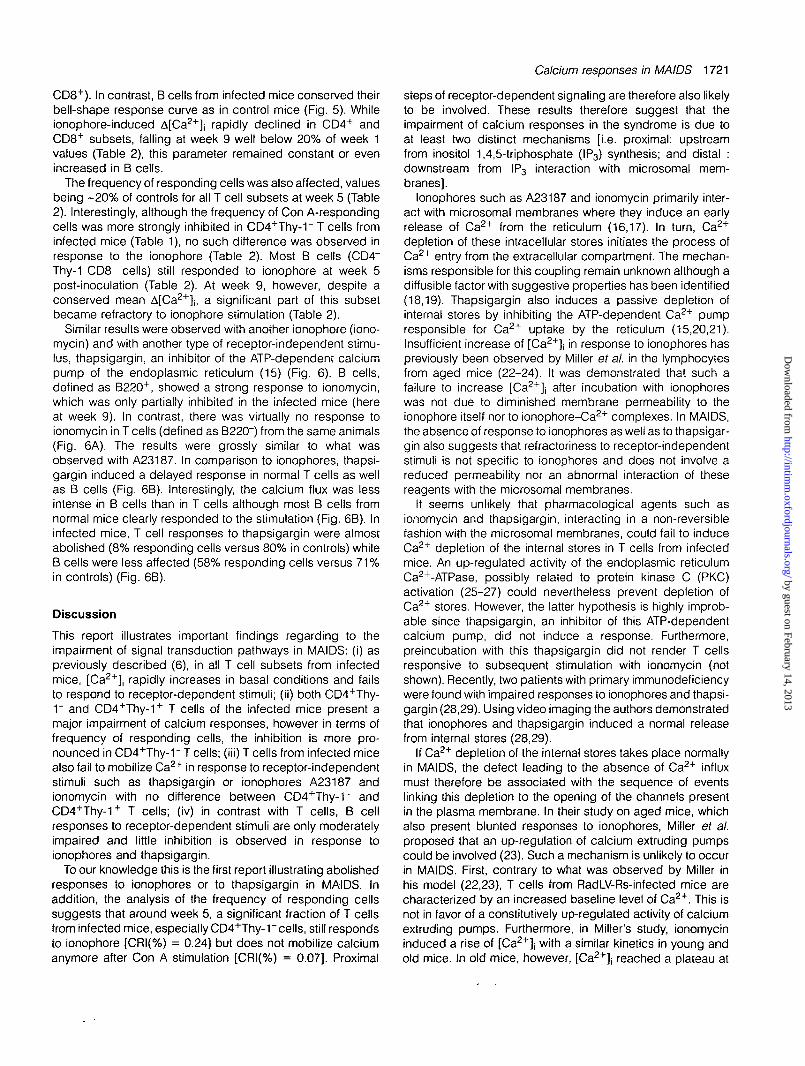
Fig. 5. Calcium responses to ionophore A23187 (10 nM) in different T and B cell subsets from control and infected mice. Dot plots showingFluo-3 (FL3) (y-axis) changes over time (x-axis) in different lymphocyte subsets (as indicated) from (A) controls. Pooled LN from two or threemice were used for each measurement. At time / (visible as a brief interruption of cell flow), A23187 (10 nM) was added to the Fluo-3 loadedcells. Similar results were obtained in several independent experiments.
by guest on February 14, 2013http://intim
m.oxfordjournals.org/
Dow
nloaded from
Calcium responses in MAIDS 1723
activation of PKC has recently been shown to inhibit thapsigar-gin-triggered elevation in Ca2+ (27). Although without formalproof, the authors proposed that phosphorylation coulddirectly inhibit the CRAC channels. It is therefore possiblethat chronic activation associated with MAIDS could beassociated with PKC activation and phosphorylation of keystructures involved in store-regulated Ca2+ influx.
In MAIDS, Selvey et al. recently described an inhibition ofB cell Ca2+ fluxes in response to IgM cross-linking (10). Weview no discrepancy with our own results, since the study ofSelvey et al. was conducted later in the infection (after week8). Furthermore, although the authors did not compare B cellsto T cells in terms of Ca2+ responses, the degree of inhibitionof B cells (in response to anti-IgM mAb) was moderatecompared to that described for T cells at the same stage ofthe infection. The different susceptibility of T cells and B cellsfrom infected mice to the inhibitory processes which affectCa2+ fluxes remains to be discussed. Clearly, the impact ofviral infection on the signaling structures could be fundament-ally different in each lymphocyte subset since the defectivevirus responsible for MAIDS mostly infects B cells and not T
cells. It could therefore be proposed that T cell abnormalitiesobserved in our study (i.e. impairment of responses to iono-phores and thapsigargin by inhibition of CRAC channels) arenot directly due to the defective virus but mostly result frominteractions with infected B cells or with soluble factorsreleased by the latter. Alternately, the relative resistance of Bcells to these inhibitory processes could also be related to adistinct physiology of store-regulated Ca2+ fluxes in thissubset. Our own results show that B cells from normal micerespond differently to ionophores and thapsigargin than Tcells from the same animals. The response of B cells toionophores is bell-shaped while a sustained plateau isobserved in T cells (Fig. 5A). Furthermore, the [Ca2+]j levelreached after thapsigargin stimulation in normal mice is lowerfor B cells than for T cells. Ca2+ influx which develops in Tcells in response to store depletion is mostly electrogenic(i.e. it needs membrane hyperpolarization to provide theelectrical driving force for Ca2+ entry) (17). In this respect,Ca2+-activated K+ channels play a major role in T cells inmaintaining membrane hyperpolarization after the initiation ofCa2+ entry (32,33). Accordingly, inhibition of these K+ chan-
BCD4+Thy-rCD8-
• ' 4.
"ii. '*"
e A 5a lee is
Time (512 sec)t
CD4+ Thy-1+ CD8"
* i .!».;•'.• • • • i V . ; " . - ' . ' , ; ,
tee isTime (512 sec)
CD4Thy-lCD8-
Time (512 sec)
CD4" Thy-1+ CD8+
Time (512 sec)
Fig. 5. Calcium responses to ionophore A23187 (10 yM) in different T and B cell subsets from control and infected mice. Dot plots showingFluo-3 (FL3) (y-axis) changes over time (x-axis) in different lymphocyte subsets (as indicated) from (B) RadLV-Rs-infected (week 5) mice.Pooled LN from two or three mice were used for each measurement. At time t (visible as a brief interruption of cell flow), A23187 (10 \iM) wasadded to the Fluo-3 loaded cells. Similar results were obtained in several independent experiments.
by guest on February 14, 2013http://intim
m.oxfordjournals.org/
Dow
nloaded from
1724 Calcium responses in MAIDS
nels has been proposed to be responsible for the negativeeffect of PKC activators on thapsigargin-induced Ca2+ chan-nels fluxes in T cells (27). On the contrary, ionomycin caninduce Ca2+ fluxes in B cells together with membrane depolar-ization (33). The inhibitory processes associated with MAIDScould be responsible for a specific impairment of electrogenicCRAC-dependent Ca2+ fluxes (i.e. by interfering with K+
channels) in T cells and have less impact on B cells wherethese fluxes can be non-electrogenic (33).
MAIDS is associated with a striking expansion of a CD4+
T cell subset lacking membrane expression of Thy-1 (7,8)which is likely to originate from CD4+Thy-1+ T cells (8).Thy-1 is closely associated to PTKs such as p59^" (34);furthermore, p59^n has recently been shown to regulate anti-CD3-induced calcium flux by a mechanism distinct fromphosphatidylinositol biphosphate hydrolysis (35). Interest-ingly, it has been proposed that unlike inositol phosphate-dependent calcium fluxes, p59'y" induces an electrogenicCa2+ flux, possibly via a phosphorylation of potassium chan-nels (35). It was therefore reasonable to postulate thatCD4+Thy-1~ T cells could selectively present an impairment
of electrogenic calcium fluxes in response to receptor-dependent stimuli and ionophores, at least in the early stageof the infection. Although the frequency of Con A-respondingcells was more severely impaired within CD4+Thy-1~ T cells,calcium responses were also strongly altered in CD4+Thy-1 +
cells, suggesting that the loss of Thy-1 expression could beassociated with Ca2+ mobilization refractoriness but was notdirectly responsible for it.
At the minimum, our results suggest that the signalsresponsible for anergy and following retroviral infection havea different impact on T cells and B cells. Although the exactmechanism remains unclear, we favor a hypothesis in whichT cells rapidly develop abnormalities of electrogenic CRAC-dependent Ca2+ fluxes after interaction with infected B cells.B cells could be intrinsically more resistant to such processespossibly because of partially distinct mechanisms couplingstore depletion to Ca2+ entry from the extracellular space.Therefore, functional inhibition of B cells could be due todifferent mechanisms and possibly related to intracellularinfection. Early in the disease, only a small fraction of B cellsare infected thereby explaining the overall normal calcium
ControlB220+
0 50 100 150 200 250
Time (512 sec)
B220-
0 50 100 150 200 250
Time (512 sec)
RadLV-Rs (Wk 9)
B220+
50 100 150 200
Time (512 sec)
B220-
250
Time (512 sec)
Fig. 6. Calcium responses to (A) ionomycin in T and B cells from control and infected mice. Dot-plots showing Fluo-3 (FL-3) (y-axis) changesover time (x-axis) in B220+ (left panels) and B22CT (right panels) from control and RadLV-infected mice (week 9). Pooled LN from two or threemice were used for each measurement. At time / (visible as a brief interruption of cell flow), ionomycin (10 \iM) or thapsigargin (1 nM) wereadded to the Fluo-3 loaded cells. Similar results were observed in three independent experiments.
by guest on February 14, 2013http://intim
m.oxfordjournals.org/
Dow
nloaded from
Calcium responses in MAIDS 1725
responses of the B cell subset. At later time points, oligoclonalexpansion of the infected B cell population is responsible forthe appearance of global B cells defects. Failure of B cellsto proliferate in response to phorbol esters plus calciumionophore (10) while ionophore-induced calcium fluxes areconserved could suggest that a more distal step of the cellcycle is impaired by intracellular infection. Although MAIDSis clearly distinct from human AIDS, it remains attractive as amodel for ubiquitous defects of TCR-dependent and TCR-independent signaling pathways such as described in HIVinfection, cancer immunity and autoimmunity.
Abnormalities of T cell calcium fluxes have been describedin other immunodeficiency syndromes, including HIV infection.Staal et al. demonstrated that altering the intracellular redoxbalance by decreasing glutathione levels could abrogatethe stimulation of calcium influx by TCR triggering (36).Interestingly, the authors also showed that, in contrast withcalcium responses, glutathione depletion could promoteresponses involving the induction of transcription factors suchas NF-KB and AP-1. They proposed that this mechanismcould be responsible for the abnormal function of T cells in
HIV infection where decreased intracellular glutathione levelshave been observed (37). To our knowledge the intracellularredox balance has never been carefully studied in MAIDS.However, increasing dietary vitamin E (an antioxidant mole-cule) has been shown to- delay the development of spleno-megaly, restore the secretion of IL-2 and inhibit the secretionof tumor necrosis factor-a and IL-6 in the infected animals(38). This suggests that ubiquitous factors such as an alteredintracellular redox balance could be responsible for theimpaired TCR signaling observed in MAIDS as well as in HIVinfection.
AcknowledgementsThis work is supported in part by the Fund for Medical ScientificResearch (Belgium) (FRSM) and the Centre Anticancereux presI'Universite de Liege (CAC). M. M. is a Senior Research Assistant ofthe National Fund for Scientific Research (Belgium) (FNRS). M. T. issupported by a research grant from the CAC. S. C. is a ResearchFellow of the Institute for Industrial and Agronomic Scientific Research(IRSIA). We gratefully acknowledge Mrs E. Franzen-Detrooz and G.Zeimers for excellent technical assistance, and Dr Sandra Gianninifor critical reading of the manuscript.
B Control
B220+
50 100 150 200 250
Time (512 sec)
B220"
50 100 150 200 250
Time (512 sec)
RadLV-Rs (Wk 9)
B220+
50 100 150 200 250
Time (512 sec)
B220-
100 150 200 250
Time (512 sec)
Fig. 6. Calcium responses to (B) thapsigargin in T and B cells from control and infected mice. Dot-plots showing Fluo-3 (FL-3) (y-axis) changesover time (x-axis) in B220+ (left panels) and B220" (right panels) from control and RadLV-infected mice (week 9). Pooled LN from two or threemice were used for each measurement. At time f (visible as a brief interruption of cell flow), ionomycin (10 nM) or thapsigargin (1 nM) wereadded to the Fluo-3 loaded cells. Similar results were observed in three independent experiments.
by guest on February 14, 2013http://intim
m.oxfordjournals.org/
Dow
nloaded from
1726 Calcium responses in MAIDS
AbbreviationsAPC[Ca2+]jCRAC channelsCRICon AIPsLNMAIDSPEPerCPPKCPTKSA
allophycocyaninintracellular ionized calcium concentrationCa2+ release-activated Ca2+ channelscalcium response indexconcanavalin Ainositol 1,4,5-triphosphatelymph nodemurine acquired immunodeficiency syndromephycoerythrinperidinin chlorophyl-a protein complexprotein kinase Cprotein tyrosine kinase.streptavidin
References
1 Mistry, P. B. and Duplan, J. F. 1973. Proprietes biologiquesd'un virus isole d'une radioleucemie C57BL. I. Premierspassages du virus natif. Bull. Cancer 60:287.
2 Legrand, E., Daculsi, R. and Duplan, J. F. 1981. Characteristicsof the cell populations involved in extra-thymic lymphosarcomainduced in C57BL/6 mice by RadLV-Rs. Leukemia Res. 5:223.
3 Haas, M. and Resheef, T. 1980. Non-thymic malignantlymphomas induced in C57BL/6 mice by cloned dualtropicviruses isolated from hematopoietic stromal cell lines. Eur. J.Cancer 16:909.
4 Mosier, D. E., Yetter, R. A. and Morse, H. C, III. 1985. Retroviralinduction of acute lymphoproliferative disease and profoundimmunosuppression in adult C57BL/6 mice. J. Exp. Med.161:766.
5 Aziz, D. C, Hanna, Z. L. and Jolicoeur, P. 1989. Severeimmunodeficiency induced by a defective murine leukemiavirus. Nature 338:505.
6 Makino, M., Sei, Y., Arora, P. K., Morse, H. C, III and Hartley,J. W. 1992. Impaired calcium mobilization in CD4+ and CD8+
T cells in a retrovirus-induced immunodeficiency syndrome:murine AIDS. J. Immunol. 149:1707.
7 Holmes, K. L, Morse, H. C, III, Makino, M., Hardy, R. R. andHayakawa, K. A. 1990. A unique subset of normal murineCD4+ T-cells lacking Thy-1 is expanded in a murine retrovirus-induced immunodeficiency syndrome, MAIDS. Eur. J. Immunol.20:2783.
8 Moutschen, M. P., Colombi, S., Deprez, M., Van Wijk, F.,Hotermans, C, Martin, M.-T., Greimers, R. and Boniver, J.1994. Population dynamics of CD4+ T-cells lacking Thy-1 inmurine retrovirus-induced immunodeficiency syndrome (MAIDS).Scand. J. Immunol. 39:216.
9 Huang, M., Simard, C. and Jolicoeur, P. 1991. The majority ofcells infected with the defective murine AIDS virus belongs tothe B-cell lineage. J. Virol. 65:6562.
10 Selvey, L. A., Morse, H. C, III, June, C. H. and Hodes, R. J.1995. Analysis of antigen receptor signaling in B cells frommice with a retrovirus-induced acquired immunodeficiencysyndrome. J. Immunol. 154:171.
11 Minta, A., Kao, J. P. Y. and Tsien, R. Y. 1989. Fluorescentindicators for cytosolic calcium based on rhodamine andfluorescein chromophores. J. Biol. Chem. 264:8171.
12 Greimers, R., Trebak, M., Moutschen, M., Jacobs, N andBoniver, J. 1996. Improved four-colour flow cytometry methodusing fluo-3 and triple immunofluorescence for analysis ofintracellular calcium ion ([Ca2+]) fluxes among mice lymphnode B and T lymphocyte subsets. Cytometry 23:205.
13 Rowe, W. P., Pugh, W. E. and Hartley, J. W. 1970. Plaqueassay techniques for murine leukemia viruses. Virology 42:1136.
14 Kao, J. P. Y, Harootunian, A. T. and Tsien, R. Y. 1989.Photochemically generated cytosolic calcium pulses and theirdetection by Fluo-3. J. Biol. Chem. 264:8179.
15 Thastrup, O., Cullen, P., Drobak, B. K., Hanley, M. R. andDawson, A. 1990. Thapsigargin, a tumor promoter, dischargesintracellular stores by specific inhibition of the endoplasmicreticulum Ca2+-ATPase. Proc. Nat! Acad. Sci. USA 87:2466.
16 Hoth, M. and Pennner, R. 1992. Depletion of intracellularcalcium stores activates a calcium current in mast cells.Nature 355:353.
17 Mason, M. J. and Grinstein, S. 1993. lonomycin activateselectrogenic Ca2+ influx in rat thymic lymphocytes. Biochem.J. 296:33.
18 Randriamampita, C. and Tsien, R. Y. 1993. Emptying ofintracellular Ca2+ stores releases a novel small messenger thatstimulates Ca2+ influx. Nature 364:809.
19 Thomas, D. and Hanley, M. R. 1995. Evaluation of calciuminflux factors from stimulated Jurkat T-lymphocytes bymicroinjection into Xenopus oocytes. J. Biol. Chem. 270:6429.
20 Gouy, H., Cefai, D., Christensen, S. B., Debre, P. and Bismuth,G. 1990. Ca2+ influx in human T lymphocytes is inducedindependently of inositol triphosphate production by mobilizationof intracellular Ca2+ stores: a study with the Ca2+ endoplasmicreticulum-ATPase inhibitor thapsigargin. Eur. J. Immunol.20:2269.
21 Premack, B. A., McDonald, T. V. and Gardner, P. 1994.Activation of Ca2+ current in Jurkat T cells following thedepletion of Ca2+ stores by microsomal Ca2+-ATPase inhibitors.J. Immunol. 152:5226.
22 Miller, R. A., Jacobson, B., Weil, G. and Simons, E. R. 1987.Diminished calcium influx in lectin-stimulated T-cells from oldmice. J. Cell. Physiol. 132:337.
23 Miller, R. A., Philosophe, B., Ginis, I., Weil, G. and Jacobson,B. 1989. Defective control of cytoplasmic calcium concentrationin T lymphocytes from old mice. J. Cell. Physiol. 138:175.
24 Philosophe, B. and Miller, R. A. 1989. T lymphocyte heterogeneityin old and young mice: functional defects in T cells selectedfor poor calcium signal generation. Eur. J. Immunol. 19:695.
25 Cavallini, L. and Alexandre, A. 1994. Ca2+ efflux from platelets:control by protein kinase C and the filling state of theintracellular Ca2+ stores. Eur. J. Biochem. 222:693.
26 Nishio, H., Ikegami, T., Segawa, T. and Nakata, Y. 1994.Stimulation of calcium sequestration by mezerein, a proteinkinase C activator, in saponized rabbit platelets. Gen.Pharmacol. 25:413.
27 Shivnan, E. and Alexander, D. R. 1995. Protein kinase Cactivation inhibits TCR-mediated calcium influx but not inositoltriphosphate production in HBP-ALL T-cells. J. Immunol.154:1146.
28 Partiseti, M., Le Deist, F., Hivroz, C, Fischer, A., Korn, H. andChoquet, D. 1994. The calcium current activated by T cellreceptor and store depletion in human lymphocytes is absentin a primary immunodeficiency. J. Biol. Chem. 269:32327.
29 Le Deist, F., Hivroz, C, Partiseti, M., Thomas, C, Buc, H. A.,Oleastro, M., Belohradsky, B., Choquet, D. and Fisher, A. 1995.A primary T-cell immunodeficiency associated with defectivetransmembrane calcium influx. Blood 85:1053,
30 Fasolato, C, Innocenti, B. and Pozzan, T. 1994. Receptor-activated Ca2+ influx: how many mechanisms for how manychannels. Trends Pharmacol. Sci. 15:149.
31 Dolmetsch, R. and Lewis, R. S. 1994. Signaling betweenintracellular Ca2+ stores and depletion-activated Ca2+-channelsgenerates [Ca2+]j oscillations in T lymphocytes. J. Gen.Physiol. 103:365.
32 Lin, C. S., Boltz, R. C, Brake, J. T, Nguyen, M., Talento, A.,Fischer, P. A., Springer, M. S., Sigal, N. H., Slaughter, R. S.,Garcia, M. L, Kaczorowski, G. J. and Koo, G. C. 1993. Voltage-gated potassium channels regulate calcium-dependent pathwayinvolved in human T-cell activation. J. Exp. Med. 177:637.
33 Ishida, Y. and Chused, T. M. 1988. Heterogeneity of lymphocytecalcium metabolism is caused by T cell specific calcium-sensitive potassium channel and sensitivity of the calciumATPase pump to membrane potential. J. Exp. Med. 168:839.
34 Thomas, P. M. and Samelson, L. E. 1992. The glycophosphatidylinositol-anchored Thyl molecule interacts with p60^" proteintyrosine kinase in T-cells. J. Biol. Chem., 267:12317.
35 Rigley, K., Slocombe, P., Proudfoot, K., Wahid, S., Mandair, K.and Bebbington, C. 1995. Human p59lyn(r> regulates OKT3-induced calcium influx by a mechanism distinct from PIP2hydrolysis in Jurkat T cells. J. Immunol. 154:1136.
by guest on February 14, 2013http://intim
m.oxfordjournals.org/
Dow
nloaded from
Calcium responses in MAIDS 1727
36 Staal, F. J. T., Anderson, M. T, Staal, G. E. J., Herzenberg, L. levels are selectively lost as the HIV infection progresses. Int.A., Gitler, C. and Herzenberg, L. A. 1994. Redox regulation of immunol. 3:933.signal transduction:tyrosine phosphorylation and calcium influx. 38 Wang, Y, Huang, D. S., Eskelson, C. D. and Watson, R. R.Proc. Natl Acad. Sci. USA 91:3619. 1994. Long-term dietary vitamin E retards development of
37 Roederer, M., Staal, F. J., Osada, H. and Herzenberg, L. A. retrovirus-induced disregulation in cytokine production. Clin.1990. CD4 and CD8 T cells with high intracellular glutathione Immunol. Immunopathol. 72:70.
by guest on February 14, 2013http://intim
m.oxfordjournals.org/
Dow
nloaded from

by guest on February 14, 2013http://intim
m.oxfordjournals.org/
Dow
nloaded from
Related Documents