______________________________________________________________________________ The Retirement Income Modelling Task Force is equally sponsored by the Commonwealth Departments of the Treasury, of Finance and of Social Security. The views expressed in this submission are those of the author and do not necessarily reflect the views of the Departments financing RIM. RimC8 doc SUBMISSION TO THE STRATEGIC REVIEW OF THE PENSIONS' INCOME AND ASSETS TESTS FROM PHIL GALLAGHER, DIRECTOR OF THE RETIREMENT INCOME MODELLING TASK FORCE* ANALYSIS OF THE INSTITUTE OF ACTUARIES' PROPOSALS FOR REFORM OF THE RETIREMENT INCOME SYSTEM __________________________________________________________________ BACKGROUND The Government announced its intention to set up the Retirement Income Modelling Task Force (RIM) in May 1992. The joint press release from the Treasurer, the Minister for Finance and the Minister for Social Security stated the purpose of the Task Force as: " The Task Force will model the impact of retirement income policies over the next half century. It will address key issues, including the implications of the Government's policies for the age pension system as well as for the level of retirement savings - by individual household categories and in aggregate - and for the distribution of retirement income benefits. " The Proposed Retirement Incomes Strategy from the Institute of Actuaries of Australia (1994a) is a major proposal which has attracted a good deal of public interest and has been subjected to quantitative analysis by groups containing members of the Institute (eg Atkinson, Creedy, Haberecht and Knox (1994)), and by the Institute of Actuaries of Australia (1994b). Much of the Institute's analysis has been based upon the National Mutual Retirement Income Policy (RIP) Model as enhanced by the RIM Task Force. Given the public interest in the Institute's proposals and the Review's discussion of them on pp106- 116 of Questions of Balance (Barber, Moon and Doolan 1994), it seemed appropriate for me to pass on my views on the use of the RIP model to analyse the IAA's proposals and to raise some concerns with you about the cost to government of the proposals and about their equity based on analysis using the RIM Task Force's current lifecycle model for individuals and couples, INDMOD. Analysis of the Institute of Actuaries Proposals Using the RIP Model The National Mutual Retirement Income Policy Model is the best existing Australian model of the accumulation of superannuation by the working population. However, it does have several limitations which have led the Task Force to begin the complex and expensive task of building a replacement model, RIMGROUP. These limitations are:

Welcome message from author
This document is posted to help you gain knowledge. Please leave a comment to let me know what you think about it! Share it to your friends and learn new things together.
Transcript
______________________________________________________________________________
The Retirement Income Modelling Task Force is equally sponsored by the CommonwealthDepartments of the Treasury, of Finance and of Social Security. The views expressed in thissubmission are those of the author and do not necessarily reflect the views of the Departmentsfinancing RIM.
RimC8 doc
SUBMISSION TO THE STRATEGIC REVIEW OFTHE PENSIONS' INCOME AND ASSETS TESTS
FROM PHIL GALLAGHER, DIRECTOR OFTHE RETIREMENT INCOME MODELLING TASK FORCE*
ANALYSIS OF THE INSTITUTE OF ACTUARIES' PROPOSALS FORREFORM OF THE RETIREMENT INCOME SYSTEM
__________________________________________________________________
BACKGROUND
The Government announced its intention to set up the Retirement Income Modelling Task Force(RIM) in May 1992. The joint press release from the Treasurer, the Minister for Finance and theMinister for Social Security stated the purpose of the Task Force as:
" The Task Force will model the impact of retirement income policies over the next halfcentury. It will address key issues, including the implications of the Government's policiesfor the age pension system as well as for the level of retirement savings - by individualhousehold categories and in aggregate - and for the distribution of retirement incomebenefits. "
The Proposed Retirement Incomes Strategy from the Institute of Actuaries of Australia (1994a) is amajor proposal which has attracted a good deal of public interest and has been subjected toquantitative analysis by groups containing members of the Institute (eg Atkinson, Creedy,Haberecht and Knox (1994)), and by the Institute of Actuaries of Australia (1994b). Much of theInstitute's analysis has been based upon the National Mutual Retirement Income Policy (RIP) Modelas enhanced by the RIM Task Force.
Given the public interest in the Institute's proposals and the Review's discussion of them on pp106-116 of Questions of Balance (Barber, Moon and Doolan 1994), it seemed appropriate for me to passon my views on the use of the RIP model to analyse the IAA's proposals and to raise some concernswith you about the cost to government of the proposals and about their equity based on analysisusing the RIM Task Force's current lifecycle model for individuals and couples, INDMOD.
Analysis of the Institute of Actuaries Proposals Using the RIP Model
The National Mutual Retirement Income Policy Model is the best existing Australian model of theaccumulation of superannuation by the working population. However, it does have severallimitations which have led the Task Force to begin the complex and expensive task of building areplacement model, RIMGROUP. These limitations are:

2
RimC8 doc
• RIP does not have an assets or income distribution for people already retired at the start of themodel's simulations. The model creates an income stream record only in the year ofretirement. All persons retired at the start of the model receive a full age pension. ThereforeRIP without modification cannot accurately cost short term changes to pensions whichmostly affect those already retired (as in the universal pension proposal). RIP is suitablefor modelling the effects of different policies for those not yet retired (such as the SGC) andcould be used to model a universal age pension introduced after 2015.
• RIP allocates early retirees a full pension when they reach pensionable age and those retiringat age pension age are 'pooled' together with others who have received superannuation and arein the same income band to become part rate pensioners. This means that the RIP modelcannot estimate the number of full or part rate age pensioners nor the number of retirees whoare not pensioners. This pooling makes the checking of age pension costings more difficult.
• RIP does not model social security payments other than age pension payments and as aconsequence does not model the additional costs to other payments of options such as raisingthe age pension age of women. I understand that the Department of Social Security hasestimated that 80% of the women affected by any increase in age pension age would becomeentitled to other social security payments. Without adjustment, the RIP model greatlyoverstates short term savings from options such as changes in women's age pension age.
• RIP does not separate its superannuation accumulations on the basis of income. The modelcombines high and low accumulations of superannuation each year. This averaging can 'pool'away some of the differences between retirement incomes which may be important for costingchanges to income and asset tests. The averaging can also affect estimates concerningexcessive retirement benefits and tax expenditures. The original National Mutual Model had afour point benefits distribution to deal with this problem and the RIM Task Force hasdeveloped an 11 point distribution of benefits.
• The RIP model does not estimate the balance of funds used for retirement payments (such asamounts in pension and annuity funds or in other savings accounts) with the effect that itunderstates the national savings impact of policies which discourage lump sums and whichencourage retirement income streams (as proposed by the Institute of Actuaries).
Implications of the RIP Model Limitations for the Costings of the IAA Proposals
We are not aware of any significant changes which National Mutual or members of the Institute ofActuaries have made to the RIP model to correct these limitations in the retirement phase of themodel. We understand that some minor changes to taxation code may have been made.
Of the above points, the most important is the fact that the RIP model does not have income for theexisting retired, who are modelled as full-rate pensioners. Dr George Rothman of the RIM TaskForce has examined the cost estimates of a universal age pension using the RIP model. His report tome says " a recent run which I have done compares pension costs with the pension income andassets tests turned off and otherwise identical assumptions. The impact at the beginning of the runis an almost negligible less than 1% rising to about 19% at the end of the run, whereas back of theenvelope calculations of the initial impact suggest up to 30% additional cost." If the modelworked properly when analysing a universal age pension, it would show an increase in pensions forthe aged of about $4.2 billion, or 30% of the $14.2 billion now spent on Age and Service pensions.
3
RimC8 doc
In fact it only shows a 1% increase initially and the increase in any year does not reach the actualcost impact.
The costings as outlined by the Institute in its Supplementary Submission to The Senate SelectCommittee on Superannuation (1994b) show the pattern of cost differences which would arise fromexisting retirees having no income or assets but future retirees having some. The graphs do notshow a large increase in expenditure from the introduction of a universal age pension in the shortterm, but they do show an increase in later years when the model contains more part ratepensioners. Instead, the graphs show a large decrease in expenditure as the age pension age forwomen is phased in more rapidly than in the Government's legislation. Atkinson, Creedy,Haberecht and Knox (see Figure 2, 1994) show that the estimated savings from the Actuaries'proposals disappear if women's age pension age is held constant.
In order to reduce the total budgetary impact of a universal age pension, the Institute proposes anumber of tax measures. The Institute has stressed that its proposal would lead to greater overalltaxation of benefits and far more stringent taxation of 'non-approved' benefits (pensions over 50%of final salary) and lump sums. Given the low existing average levels of superannuationaccumulations (see Brown, 1994), it seems unlikely that the Institute's proposals would yield taxrevenues approximating the $3 billion estimate cited on page 116 of Questions of Balance (Barber,Moon and Doolan, 1994). Estimates of the savings in tax expenditures from stopping the phase inof the SGC at 6% do not approach these levels. The Institute does not propose increasing thetaxation of contributions or earnings of superannuation funds. In fact, the Institute proposes a16.4% tax rebate for personal contributions - an increase in tax expenditures.
What Can be Said About Aggregate Effects at This Stage
I believe that a full aggregate analysis of the Institute of Actuaries proposal would require the use ofthe still to be completed RIMGROUP model combined with some macroeconomic modelling.Previous modelling using RIP suggests a significant decrease in superannuation related nationalfinancial savings if the SGC is frozen at 6% from 1996:
• by the year 2000, about 2 1/2 billion dollars of national savings (measured in today's dollars)would be lost;
• by the year 2003, about 9 1/2 billion dollars of national savings would be lost;
• by the year 2003 this loss is estimated at $3 billion each year.
If the SGC were frozen, it is a common view that the lower growth in employer contributions wouldbe offset by an equal increase in other forms of remuneration. The impact on the cost of labour toemployers (as measured by the National Accounts average earnings) would probably be minimal.The Economic Division of Treasury has advised me that macroeconomic modelling of the impactson activity, interest rates, inflation, the current account deficit and unemployment would require (asinput) RIM estimates of the effects of the change on consumption, government outlays and taxation.
Of course, any aggregate modelling of the IAA proposals would require sensitivity testing to a widerange of behavioural changes sought by the policy (such as changes in personal contributions and inthe purchase of retirement income streams).
4
RimC8 doc
Although we are unable to model the aggregate consequences of the IAA proposal at this stage, Ihave conducted a hypothetical lifecycle analysis which raises some interesting questions concerningthe cost to government and the equity of the proposals.
Initial Hypothetical Modelling of the IAA Ret irement Incomes Proposals
The effects of the Institute of Actuaries proposal on a range of hypothetical males with full workinglives have been analysed by Atkinson, Creedy, Haberecht and Knox (1994). This analysisconcentrated on the effects of the proposal on lifetime income differences as measured by Ginicoefficients and similar measures. The conclusion was that inequality in the distribution of lifetimeincome was reduced by the proposal. The policy factors which contributed to this reduction werenot demonstrated.
The analysis which follows differs significantly from that of Atkinson, Creedy, Haberecht and Knox.It uses the RIM hypothetical lifecycle model INDMOD to examine the effects of the proposals on 6hypothetical baby boomer couples retiring in 2014/15. This retirement date was chosen because it isa period when the Institute of Actuaries' estimates significant savings from its proposals. These 6couples have the same labour force participation and superannuation characteristics, namely:
• The wife does not work from 25-34 and only works half time between the ages of 35 and 40.The husband works full-time from age 25 to 64.
• When both partners are working full-time they have identical incomes.
• Both partners are eligible for 3% award contributions from 1986/87 and minimum SGCcontributions from 1992/93. Both make member contributions of 1% of salary in 1997/98,2% in 1998/99 and 3% thereafter. The members' contributions are encouraged in the IAAscheme and the government has reaffirmed its commitment to require member contributionsunder the SGC at a suitable time.
• On retirement both partners use 75% of their final benefit to buy a rollover annuity. Half ofthe remaining lump sum is invested.
The 6 couples have full-time salaries for both partners of 50%, 67% 100%, 150%, 200% and 300%of AWE. The exact levels of these incomes are not important in drawing conclusions about the costto government and equity of the IAA proposals.
All the major features of the IAA proposal are modelled, including the universal age pension at 25%of AWOTE (rather than 25% of AWE), the capping of SGC employer contributions at 6%, the16.4% rebate for personal contributions, the change in women's age pension age and the change inthe methods of lump sum and ETP taxation. Behavioural differences between the policies have notbeen included because these effects are far from certain for the bulk of the population and becausethe couples would no longer be comparable.
The main economic parameters for the steady state projections beyond 1994/95 are CPI growth of3% per year, wages growth of 4% per year, a bond rate of 6% per year and an accumulation fundearnings rate of 7% per year. The margins between these parameters are considered conservative.Higher real earnings rates by superannuation funds will give much higher final benefits. In bothpolicy scenarios, wages are decreased by any increase in employer SGC contributions. In estimating

5
RimC8 doc
tax concessions, it is assumed that 50% of any counterfactual increase in disposable income wouldbe saved. The importance of this parameter is explained in Brown (1993).
Results of Hypothetical Analysis
The results of the analysis are summarised at Attachment A.
The effect of the IAA's proposal to cap the SGC at 6% is to reduce final benefits for the couplesmodelled. This is demonstrated in Graph 1.
GRAPH 1:
COMPARISON OF FINAL BENEFITS
Salary While Working as % AWE
CO
MB
INE
D F
INA
L B
EN
EF
IT IN
$19
9
$0
$100,000
$200,000
$300,000
$400,000
$500,000
$600,000
$700,000
50.0% 67.0% 100.0% 150.0% 200.0% 300.0%
Current Policy
IAA Proposal

6
RimC8 doc
The reduced final benefit reduces private income from annuity payments and investment income.The differences are demonstrated in Graph 2.
GRAPH 2:
M e a n A n n u i t y & In te re s t In c o m e p e r y e a r ($ 1 9 9 3 )
S a la ry as % AW E w h en W o rk in g F u ll -T im e
Priv
ate
Inco
me
pa (
$199
3)
$0
$5 ,000
$10 ,000
$15 ,000
$20 ,000
$25 ,000
$30 ,000
$35 ,000
50 .0% 67 .0% 100 .0% 150 .0% 200 .0% 300 .0%
C urren t P o licy
IA A P roposa l
The differences in real age pensions for the couples are shown in Graph 3. The effect of theuniversal age pension is clear.
GRAPH 3
Comparison of Average Annual Age Pension Entitlements
Salary as % AWE while Working
Mea
n C
ombi
ned
Age
Pen
sion
per
yea
r of
Ret
irem
ent
$0
$2,000
$4,000
$6,000
$8,000
$10,000
$12,000
$14,000
$16,000
$18,000
50.0% 67.0% 100.0% 150.0% 200.0% 300.0%
Curren t Po licy
IAA Proposa l
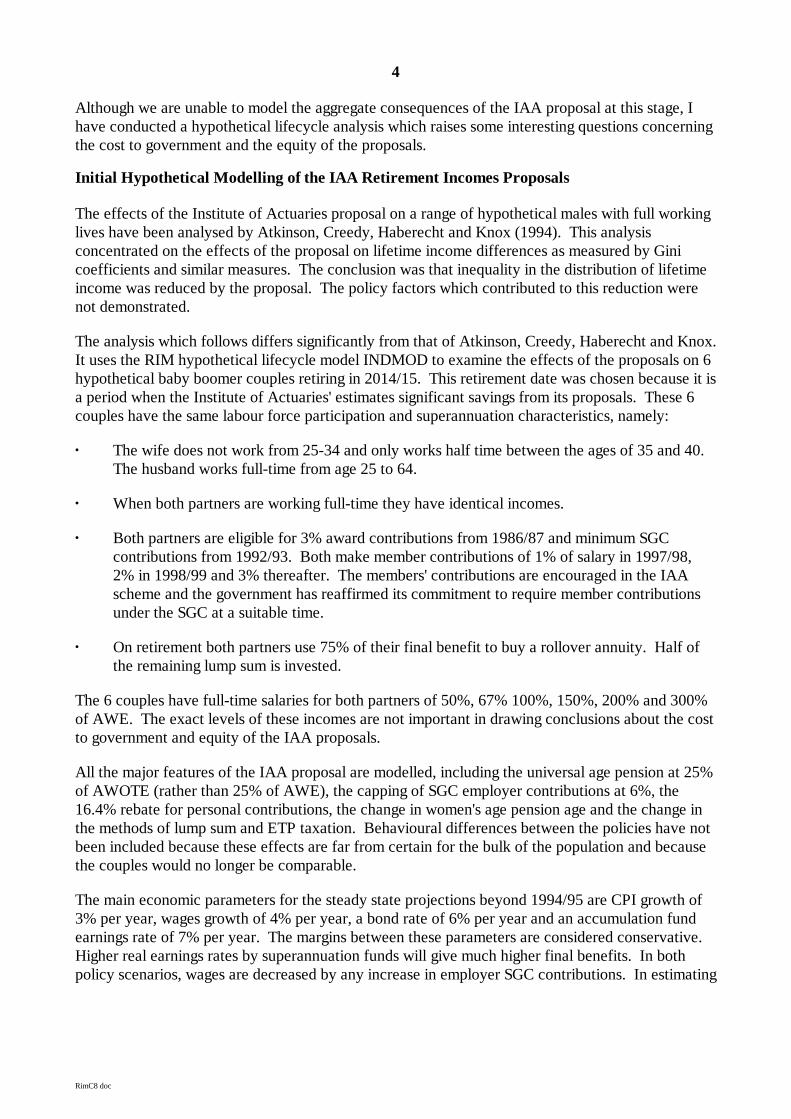
The net result of the lower private income but the higher age pension in the IAA proposal is toproduce lower incomes for the couples earning less than 100% of AWE but higher incomes for thecouples whose wage rate was AWE or above (see Graph 4). The couples who earned 3 times AWEeach (over $200,000 pa now combined) get a rise in retirement income of almost $6000 per year
7
RimC8 doc
from the IAA proposal. The couple with a wage rate of 50% of AWE ( about $33,000 nowcombined) lose almost $1000 per year of retirement because their pension is lower (25% ofAWOTE not AWE) and because their retirement benefit is reduced by capping employer SGCcontributions at 6% of salary.
GRAPH 4
Comparison of Average Net Retirement Income (pa)
Salary while Working
Ave
rage
Net
Inco
me
per Y
ear o
f Ret
irem
ent
$0
$5,000
$10,000
$15,000
$20,000
$25,000
$30,000
$35,000
$40,000
$45,000
50.0% 67.0% 100.0% 150.0% 200.0% 300.0%
Current Policy
IAA Proposa l
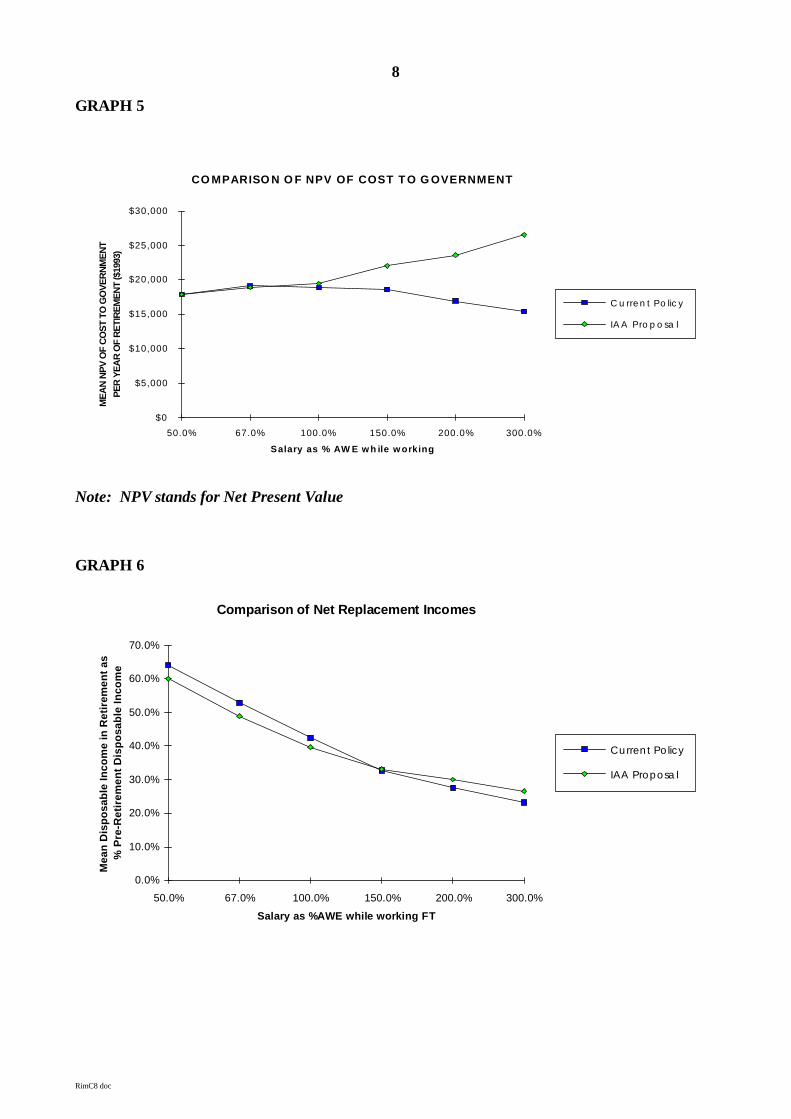
The tax expenditures from the IAA proposal do not differ appreciably from those in the currentsystem (see Attachment A). The tax paid in retirement in the IAA proposal is higher (seeAttachment A), but this is insufficient to recoup the higher age pension. The much higher pensioncost in the IAA proposal for couples with a wage rate of AWE or above leads the IAA proposal tohave a significantly greater cost to government for "self funded retirees". This effect isdemonstrated in Graph 5. Although this is not a costing of the proposal, it does suggest that the IAAproposal is not fully funded.
Graph 4 of the current hypothetical analysis suggests that the IAA proposal may be regressive whenmeasured in terms of total incomes in retirement. Graph 6 demonstrates that the proposal may alsobe less progressive in replacement rate terms. Those on lower incomes while working (below 150%of AWE) have real disposable incomes in retirement which are a lower percentage of their real pre-retirement disposable incomes. This is only partly due to the capping of the SGC at 6% givinghigher wage rises in the IAA policy scenario. The lower age pension rate also contributes. Those onhigher incomes have a higher replacement rate in the IAA scenario because the value of theuniversal age pension greatly exceeds the increased taxation in retirement.
8
RimC8 doc
GRAPH 5
CO MPARISO N O F NPV OF COST T O G OVERNMENT
Salary as % AW E w h ile w orking
ME
AN
NP
V O
F C
OS
T TO
GO
VE
RN
ME
NT
PE
R Y
EA
R O
F R
ETI
RE
ME
NT
($19
93)
$0
$5,000
$10,000
$15,000
$20,000
$25,000
$30,000
50.0% 67.0% 100.0% 150.0% 200.0% 300.0%
C u rre n t Po lic y
IA A Pro p o sa l
Note: NPV stands for Net Present Value
GRAPH 6
Comparison of Net Replacement Incomes
Salary as %AWE while working FT
Mea
n D
ispo
sabl
e In
com
e in
Ret
irem
ent a
s%
Pre
-Ret
irem
ent D
ispo
sabl
e In
com
e
0.0%
10.0%
20.0%
30.0%
40.0%
50.0%
60.0%
70.0%
50.0% 67.0% 100.0% 150.0% 200.0% 300.0%
Curren t Po licy
IAA Proposa l
9
RimC8 doc
Conclusions from Initial INDMOD Analysis of the IAA Retirement Income Proposals
An analysis of six hypothetical couples is not a full analysis of the winners and losers from a policyproposal and is by no means a costing. The initial analysis presented above is suggestive rather thanconclusive. However, the hypothetical analysis does demonstrate the interaction of the key policyfeatures and the relative magnitude of their effects. The initial suggestions are that the Institute ofActuaries' proposals for reform of the retirement income system could be regressive for the retiredbecause the proposals could give more in age pension increases to high income earners than isrecouped through taxation. The cost to government for those earning over AWE is significantlyhigher for the IAA proposals while costs to government for couples earning up to AWE appearsimilar for both systems. This suggests that the IAA proposals are likely to be significantly moreexpensive overall.
The suggestion that the IAA proposals could be more expensive and more regressive than theexisting retirement income system accords with common sense. However, I hope to presentadditional hypothetical analysis in a supplementary submission to the Review if time permits.Unfortunately RIMGROUP will not be ready in time for a definitive analysis to be presented to theStrategic Review of the Pension Income and Assets Tests.
THE BROADER QUESTIONS
The interest in the possibility of a universal age pension extends beyond the particular proposalsdeveloped by the Institute of Actuaries. To pay a universal age pension at current rates would cost$4.2 billion for all persons 65 and over and $5.25 billion in total if women aged 60-64 were alsoincluded (according to the latest Department of Social Security costings). These costs wouldincrease as the population ages. It is highly desirable that such a policy change be fully funded. Tofinance the policy from borrowing would lead to inflation and possibly a worsening of our balanceof payments. The higher inflation could significantly reduce the real value of the savings of theaged as well as causing problems in the broader economy.
Policy changes can be funded by either reducing other outlays or by increasing taxation. Analysingthe equity of any proposal involves not only looking at who receives a change in Governmentbenefits but also who pays for them. Proposals which attempt to fund greater benefits for the agedby taxing the aged involve issues of intragenerational equity. Proposals to fund increased benefitsfor the aged by higher taxes or reduced benefits for those of working age raise issues ofintergenerational equity.
The Institute of Actuaries proposal raises issues of both intragenerational and intergenerationalequity. The proposals to reduce the maximum rate of pension and to increase taxation on endbenefits imply a re-distribution within the aged. The INDMOD results presented above suggest thatthis redistribution would be from lower income to higher income retirees. It is doubtful that anygroup believes that the redistribution within the aged implied by any pension reduction option couldbe satisfactory since both adequacy and equity would be severely compromised.
Any proposal which seeks to replace the existing income and assets tests with tax increases for theaged is unlikely to recoup outlays. In addition to having lower rates of taxation, the taxation systemis not adapted to assess the value of non-income producing assets or unrealised capital gains.Income deferral is possibly more likely in the taxation system than under existing income and assetstests.
10
RimC8 doc
Over the next decade (or longer) full funding of any proposal for a universal age pension wouldneed to involve tax increases or outlays reductions for the population of working age (or theirchildren). The main taxation options would be an increase in general taxation or a reduction in taxexpenditures, with the most frequently nominated tax expenditures being those for superannuation.
Increasing the effective rate of general taxation raises clear issues of intergenerational equity.Current workers are funding the age pensions of the existing retired and also forgoing some wageincrease in order to provide for themselves (partially or wholly) in retirement. Many currentworkers may not be impressed by proposals involving higher taxation rates and/or tax basebroadening measures which are used to fund pensions for high income retirees who accumulatedtheir wealth in a period without capital gains taxation, without fringe benefits tax and when taxtreatment of superannuation was more concessional.
Reduction of tax expenditures for existing superannuation contributions and earnings is clearly thepath favoured by many welfare groups for funding a universal age pension (and other options). Anyoptions developed in this area should take account of the following difficulties:
• Since 1983, the Government has committed itself to an evolving retirement income policy nowbased on targeted age pension support, combined with private provision of superannuationunder tax-preferred award and SGC arrangements. Given the long term character and growingscale of superannuation saving, there are significant costs associated with any major upheavalin those arrangements.
• Existing tax expenditures are a cost-effective way for the current working population to fundbetter incomes for themselves when they retire (see McDiarmid 1994) - removal of all taxexpenditures would lower retirement incomes.
• If tax concessions for superannuation were removed, this would remove one of the majorexisting incentives for retirement funds to submit to the prudential supervision of the Insuranceand Superannuation Commission. The replacement of superannuation with other forms ofsaving accounts, could possibly threaten the principle of preservation of benefits to age 55 orabove. If preservation was no longer enforceable, or enforced, this could significantly reducethe national saving effect which comes from people not being able to spend their superannuationsavings until age retirement.
• The existing Treasury estimates of tax expenditures for superannuation (like most internationaltax expenditure estimates) are single year estimates of the immediate budgetary impact ofremoving tax concessions. These estimates use the standard behavioural assumptions thatwithout tax concessions for superannuation, all existing employer contributions would be paid aswages and 100% of any increase in disposable income would be saved and fully taxed atmarginal tax rates. In my view these behavioural assumptions would not hold except in the veryshort term. It is likely that the initial revenue gain from abolishing all concessions would rapidlydecline in each successive year because accruals in a fully taxed savings environment would belower (see Brown, 1993). This could lead to the declining revenue from the abolition of the taxconcessions being increasingly insufficient to fund a universal age pension for a rapidlyexpanding aged population.
11
RimC8 doc
• Any system to align tax rates on superannuation contributions and earnings with individualmarginal rates cannot be administered solely by superannuation funds because they can notknow each member's marginal tax rate. People may have many jobs in a year and/or multiplefunds. Only the individual concerned and the Australian Taxation Office (ATO) know anindividual's marginal tax rate. Any system of adjusting concessions with members' incomewould probably need to rely on superannuation funds passing information to both its membersand the ATO. The calculation of employer contributions and earnings for individuals in definedbenefits funds would be a major problem in itself.
I now firmly believe that the attempts to cost the IAA proposal using the RIP model have beencompromised by limitations of that model. My initial hypothetical modelling of the IAA proposalconfirms my suspicions about the cost to government and equity of the proposals. I look forward tothe completion of RIMGROUP by the Retirement Income Modelling Task Force so that seriousproposals such as that of the Actuaries can be adequately analysed. Further hypothetical analysisremains an option at this stage.
Please phone me on 06 263 3945 if you would like to further discuss this submission.
Phil GallagherDirectorRetirement Income Modelling Task Force
REFERENCES
Atkinson, M; Creedy, J; Haberecht, C; and Knox,D. (1994) the Cost and Equity Implications of theInstitute of Actuaries of Australia Proposed Retirement Incomes Strategy Paper Delivered to theSecond Colloquium of Superannuation Researchers, Melbourne, July 1994
Barber, J; Moon, G; and Doolan, S (1994) Questions of Balance: A Discussion Paper PresentingIssues and Options arising from the strategic review of the Pension's Income and Assets TestsDepartment of Social Security, July 1994
Brown, C. Tax Expenditures and Measuring the Long Term Costs and Benefits of RetirementIncome Policy, Retirement Income Modelling Task Force Conference Paper 93/1
Brown, C. The Distribution of Private sector Superannuation assets by Gender, Age and Salary ofMembers, Retirement Income Modelling Task Force Conference Paper 94/2
The Institute of Actuaries of Australia (1994a) Proposed Retirement Incomes Strategy, Submissionto the Senate Select Committee on Superannuation, March 1994
The Institute of Actuaries of Australia (1994b) Proposed Retirement Incomes Strategy: Effect onGovernment Revenue, Supplementary Submission to the Senate Select Committee onSuperannuation, August 1994
McDiarmid, A. (1994) Taxation of Superannuation and Disposable Income in Retirement,Retirement Income Modelling Task Force Conference Paper 94/1
______________________________________________________________________________
.
RimC8 doc
ATTACHMENT A
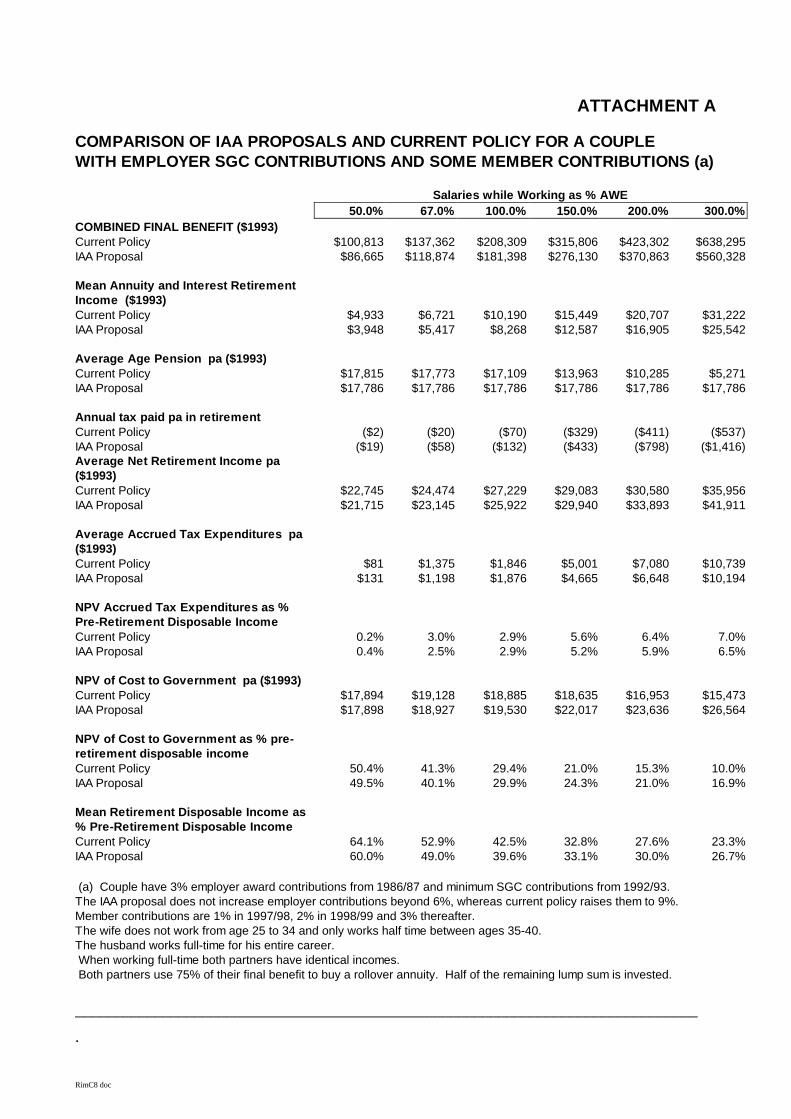
COMPARISON OF IAA PROPOSALS AND CURRENT POLICY FOR A COUPLEWITH EMPLOYER SGC CONTRIBUTIONS AND SOME MEMBER CONTRIBUTIONS (a)
Salaries while Working as % AWE50.0% 67.0% 100.0% 150.0% 200.0% 300.0%
COMBINED FINAL BENEFIT ($1993)Current Policy $100,813 $137,362 $208,309 $315,806 $423,302 $638,295IAA Proposal $86,665 $118,874 $181,398 $276,130 $370,863 $560,328
Mean Annuity and Interest RetirementIncome ($1993)Current Policy $4,933 $6,721 $10,190 $15,449 $20,707 $31,222IAA Proposal $3,948 $5,417 $8,268 $12,587 $16,905 $25,542
Average Age Pension pa ($1993)Current Policy $17,815 $17,773 $17,109 $13,963 $10,285 $5,271IAA Proposal $17,786 $17,786 $17,786 $17,786 $17,786 $17,786
Annual tax paid pa in retir ementCurrent Policy ($2) ($20) ($70) ($329) ($411) ($537)IAA Proposal ($19) ($58) ($132) ($433) ($798) ($1,416)Average Net Retirement Income pa($1993)Current Policy $22,745 $24,474 $27,229 $29,083 $30,580 $35,956IAA Proposal $21,715 $23,145 $25,922 $29,940 $33,893 $41,911
Average Accrued Tax Expenditures pa($1993)Current Policy $81 $1,375 $1,846 $5,001 $7,080 $10,739IAA Proposal $131 $1,198 $1,876 $4,665 $6,648 $10,194
NPV Accrued Tax Expenditures as %Pre-Retirement Disposable IncomeCurrent Policy 0.2% 3.0% 2.9% 5.6% 6.4% 7.0%IAA Proposal 0.4% 2.5% 2.9% 5.2% 5.9% 6.5%
NPV of Cost to Government pa ($1993)Current Policy $17,894 $19,128 $18,885 $18,635 $16,953 $15,473IAA Proposal $17,898 $18,927 $19,530 $22,017 $23,636 $26,564
NPV of Cost to Government as % pre-retirement disposable incomeCurrent Policy 50.4% 41.3% 29.4% 21.0% 15.3% 10.0%IAA Proposal 49.5% 40.1% 29.9% 24.3% 21.0% 16.9%
Mean Retirement Disposable Income as% Pre-Retirement Disposable IncomeCurrent Policy 64.1% 52.9% 42.5% 32.8% 27.6% 23.3%IAA Proposal 60.0% 49.0% 39.6% 33.1% 30.0% 26.7%
(a) Couple have 3% employer award contributions from 1986/87 and minimum SGC contributions from 1992/93.The IAA proposal does not increase employer contributions beyond 6%, whereas current policy raises them to 9%.Member contributions are 1% in 1997/98, 2% in 1998/99 and 3% thereafter.The wife does not work from age 25 to 34 and only works half time between ages 35-40.The husband works full-time for his entire career. When working full-time both partners have identical incomes. Both partners use 75% of their final benefit to buy a rollover annuity. Half of the remaining lump sum is invested.
13
RimC8 doc
AWE increases are reduced by the increase in employer contributions to the SGCThe IAA proposed changes in age pension rates and means tests, women's age pension age are modelled, as are changes in tax rebates for member contributions, changes in lump sum taxation and in rebates for pensions.
SUPPLEMENTARY SUBMISSION TO THE STRATEGIC REVIEW OFTHE PENSIONS' INCOME AND ASSETS TESTS
FROM PHIL GALLAGHER, DIRECTOR OFTHE RETIREMENT INCOME MODELLING TASK FORCE 1
FURTHER ANALYSIS OF THE INSTITUTE OF ACTUARIES' AND OTHERPROPOSALS FOR REFORM OF THE RETIREMENT INCOME SYSTEM
__________________________________________________________________
BACKGROUND
My original submission to the Strategic Review of the Pension's Income and Assets Test of 16September:
• explained why the National Mutual Retirement Income Policy model was unsuitable formodelling the universal age pension proposal of the Institute of Actuaries (1994a);
• analysed 6 hypothetical baby boomer couples using the RIM Task Force's model INDMOD2
showing that:
- the Institute of Actuaries' (IAA) proposal was possibly regressive, yielding lowerretirement incomes to those with lower wages while working, and higher incomes tothose on higher wages for the cases modelled, and
- the IAA proposal did not appear to be self funding, with markedly higher costs toGovernment for those on higher incomes;
• drew attention to the potentially significant lowering of national financial saving which couldcome from freezing the SGC at 6%;
and
1The Retirement Income Modelling Task Force is equally sponsored by the Commonwealth Departments of the Treasury,of Finance and of Social Security. The views expressed in this submission are those of the author and do not necessarilyreflect the views of the Departments financing RIM
2INDMOD is an EXCEL speadsheet model written by Mr Colin Brown of the Retirement Income Modelling Task Force.I would like to acknowledge Mr Brown's contribution to this analysis through his alteration of the taxation ofsuperannuation benefits code of INDMOD to reflect the IAA proposals.
14
RimC8 doc
• discussed broader issues arising from budget neutral universal pensions proposals such asintergenerational and intragenerational equity and identified issues for proposals which seek touse the dropping of tax concessions for superannuation as a funding mechanism.
This supplementary submission seeks to complement the initial analysis by:
• giving examples from totally different hypothetical couples;
• further examining the issue of costs to government in retirement incomes analysis; and
• further examining the nature of retirement saving in the absence of tax concessions.
INDMOD Examples From Totally Diff erent Hypothetical Couples
The original submission modelled 6 couples retiring in 2014/15 where:
• the wife did not work from 25-34 and only worked half time between the ages of 35 and 40.The husband works full-time from age 25 to 64;
• when both partners are working full-time they have identical incomes;
• both partners are eligible for 3% award contributions from 1986/87 and minimum SGCcontributions from 1992/93;
• on retirement both partners use 75% of their final benefit to buy a rollover annuity with halfof the remaining lump sum being invested.
This choice of couples has been subject to criticism because:
• the wife's salary is too high (sic);
• people would generally choose to have lump sums greater than 25% of benefits;
• corporate superannuation schemes are more likely to generate higher taxation revenue underthe IAA proposals than SGC/award schemes and this extra tax on final benefits would be amajor means of financing the universal age pension;
• a fund earnings margin of 1% above the bond rate is too conservative;
• higher non-superannuation saving and later retirement dates give more scope for SGCsuperannuation to affect age pension outlays; and
• the new version of the IAA proposal (1994b) does not propose lowering the age pension.
Accordingly, I have now modelled another 6 couples retiring in 2019/20 with the same labour forceparticipation pattern but with different wage differentials, superannuation arrangements andretirement benefit arrangements. The income of the husband's is still 50%, 67% 100%, 150%, 200%and 300% of AWE. The wife's salary is 75% of her husband's when she is working full-time. Thehusband has continuous generous corporate superannuation from age 25 to 65 with 15% employer
15
RimC8 doc
contributions and 5% employee contributions. The wife has 3% award and minimum employer SGCcontributions. At retirement, the husband has saved one year's salary in an ordinary savingsaccount. Both partners use 50% of their final benefit to buy an allocated pension. Half of theremaining superannuation is invested. The IAA proposal is modelled with the same age pension rateas under current policy.
All the other major features of the IAA proposal are modelled, including the capping of SGCemployer contributions at 6%, the 16.4% rebate for personal contributions, the change in women'sage pension age and the change in the methods of lump sum and ETP taxation. Behaviouraldifferences between the policies have not been included because these effects are far from certainfor the bulk of the population and because the couples would no longer be comparable.
The main economic parameters for the steady state projections beyond 1994/95 are CPI growth of3% per year, wages growth of 4% per year, and a bond rate of 6% per year. The accumulation fundearnings rate has been raised by 1% to 8% per year which gives higher final benefits. In both policyscenarios, wages are decreased by any increase in employer SGC contributions. In estimating taxconcessions, it is assumed that 50% of any counterfactual increase in disposable income would besaved. The importance of this parameter is explained in Brown (1993) and later in this submission.
The results from this analysis are summarised in tabular form at Attachment A.
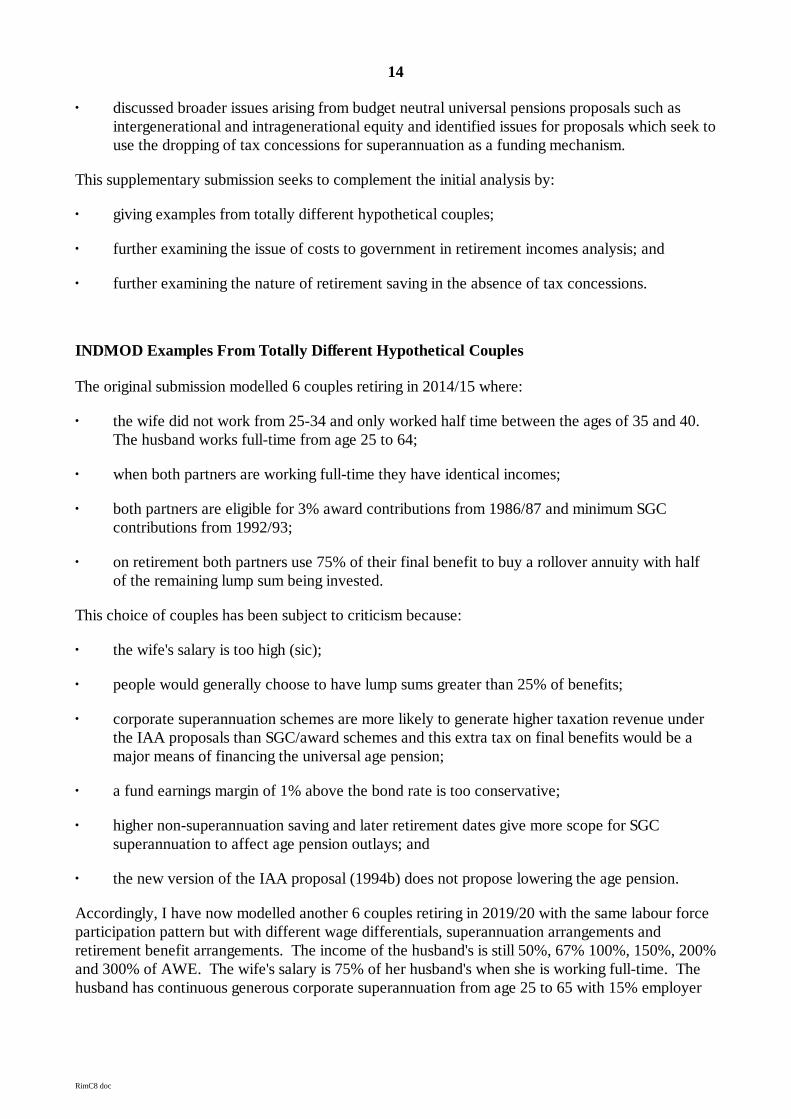
In this revised IAA proposal with age pension set to the same rate as under current policy, allcouples show higher real disposable incomes in retirement under the IAA proposals (see Graph 1).These higher incomes reflect the fact that the age pension increase is higher than the increase in taxpaid for all couples (see Attachment A). If everyone gains, the proposal could not be funded fromintragenerational transfers.
GRAPH 1
Comparison of Average Net Retirement Income (pa)
Salary while Working
Ave
rage
Net
Inco
me
per
Yea
r of
Ret
irem
ent
$0
$10,000
$20,000
$30,000
$40,000
$50,000
$60,000
$70,000
$80,000
$90,000
50.0% 67.0% 100.0% 150.0% 200.0% 300.0%
Curren t Po licy
IAA Proposa l
16
RimC8 doc
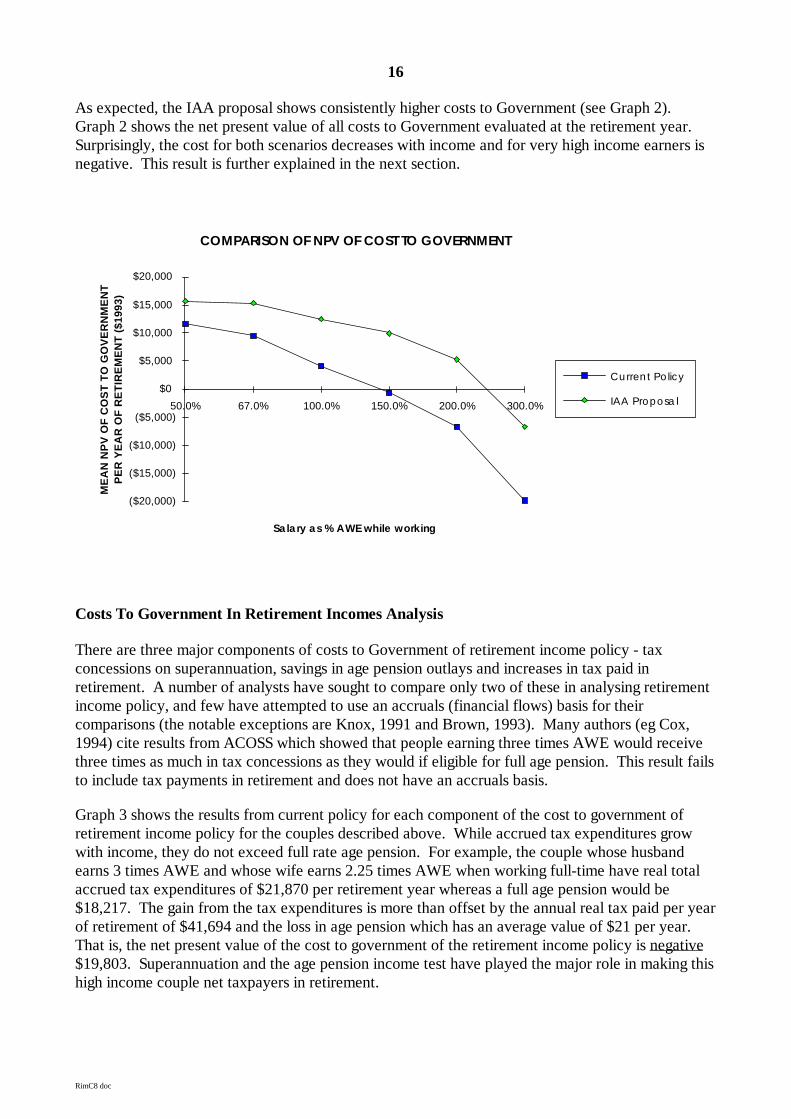
As expected, the IAA proposal shows consistently higher costs to Government (see Graph 2).Graph 2 shows the net present value of all costs to Government evaluated at the retirement year.Surprisingly, the cost for both scenarios decreases with income and for very high income earners isnegative. This result is further explained in the next section.
COMPARISON OF NPV OF COST TO GOVERNMENT
Sa la ry as % AWE while working
ME
AN
NP
V O
F C
OS
T T
O G
OV
ER
NM
EN
TP
ER
YE
AR
OF
RE
TIR
EM
EN
T (
$199
3)
($20,000)
($15,000)
($10,000)
($5,000)
$0
$5,000
$10,000
$15,000
$20,000
50.0% 67.0% 100.0% 150.0% 200.0% 300.0%
Curren t Po licy
IAA Proposa l
Costs To Government In Retirement Incomes Analysis
There are three major components of costs to Government of retirement income policy - taxconcessions on superannuation, savings in age pension outlays and increases in tax paid inretirement. A number of analysts have sought to compare only two of these in analysing retirementincome policy, and few have attempted to use an accruals (financial flows) basis for theircomparisons (the notable exceptions are Knox, 1991 and Brown, 1993). Many authors (eg Cox,1994) cite results from ACOSS which showed that people earning three times AWE would receivethree times as much in tax concessions as they would if eligible for full age pension. This result failsto include tax payments in retirement and does not have an accruals basis.
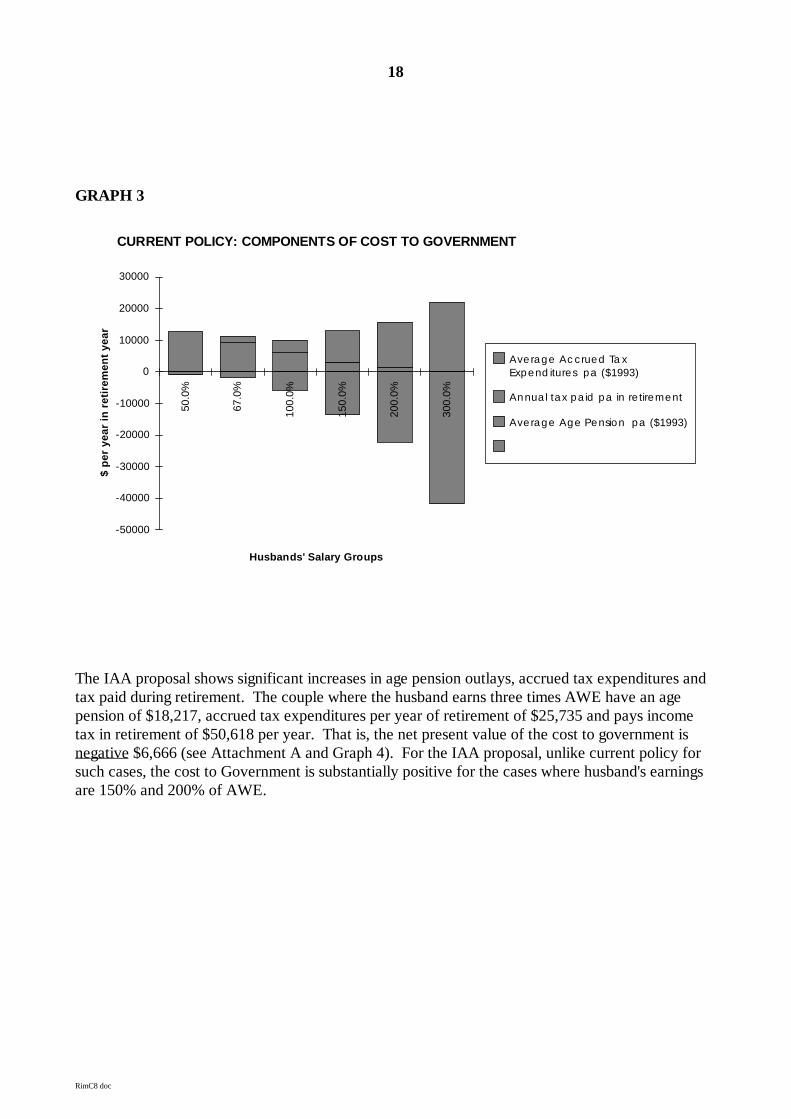
Graph 3 shows the results from current policy for each component of the cost to government ofretirement income policy for the couples described above. While accrued tax expenditures growwith income, they do not exceed full rate age pension. For example, the couple whose husbandearns 3 times AWE and whose wife earns 2.25 times AWE when working full-time have real totalaccrued tax expenditures of $21,870 per retirement year whereas a full age pension would be$18,217. The gain from the tax expenditures is more than offset by the annual real tax paid per yearof retirement of $41,694 and the loss in age pension which has an average value of $21 per year.That is, the net present value of the cost to government of the retirement income policy is negative$19,803. Superannuation and the age pension income test have played the major role in making thishigh income couple net taxpayers in retirement.

17
RimC8 doc
18
RimC8 doc
GRAPH 3
CURRENT POLICY: COMPONENTS OF COST TO GOVERNMENT
Husbands' Salary Groups
$ pe
r ye
ar in
ret
irem
ent y
ear
-50000
-40000
-30000
-20000
-10000
0
10000
20000
30000
50.0
%
67.0
%
100.
0%
150.
0%
200.
0%
300.
0%
Ave rage Ac crued Ta xExpend itures pa ($1993)
Annua l tax pa id pa in re tirement
Ave rage Age Pension pa ($1993)
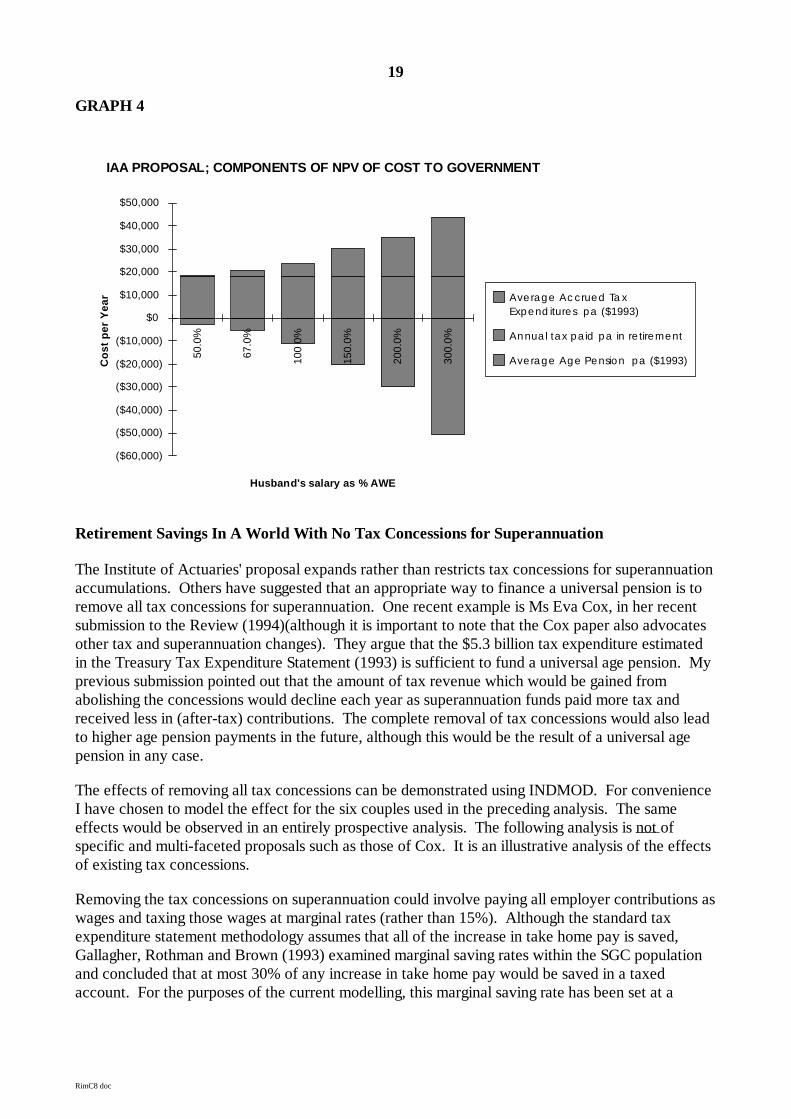
The IAA proposal shows significant increases in age pension outlays, accrued tax expenditures andtax paid during retirement. The couple where the husband earns three times AWE have an agepension of $18,217, accrued tax expenditures per year of retirement of $25,735 and pays incometax in retirement of $50,618 per year. That is, the net present value of the cost to government isnegative $6,666 (see Attachment A and Graph 4). For the IAA proposal, unlike current policy forsuch cases, the cost to Government is substantially positive for the cases where husband's earningsare 150% and 200% of AWE.
19
RimC8 doc
GRAPH 4
IAA PROPOSAL; COMPONENTS OF NPV OF COST TO GOVERNMENT
Husband's salary as % AWE
Cos
t pe
r Y
ear
($60,000)
($50,000)
($40,000)
($30,000)
($20,000)
($10,000)
$0
$10,000
$20,000
$30,000
$40,000
$50,00050
.0%
67.0
%
100
0%
150.
0%
200.
0%
300.
0%
Ave rage Ac crued Ta xExpend itures pa ($1993)
Annua l tax pa id pa in re tirement
Ave rage Age Pension pa ($1993)
Retirement Savings In A World With No Tax Concessions for Superannuation
The Institute of Actuaries' proposal expands rather than restricts tax concessions for superannuationaccumulations. Others have suggested that an appropriate way to finance a universal pension is toremove all tax concessions for superannuation. One recent example is Ms Eva Cox, in her recentsubmission to the Review (1994)(although it is important to note that the Cox paper also advocatesother tax and superannuation changes). They argue that the $5.3 billion tax expenditure estimatedin the Treasury Tax Expenditure Statement (1993) is sufficient to fund a universal age pension. Myprevious submission pointed out that the amount of tax revenue which would be gained fromabolishing the concessions would decline each year as superannuation funds paid more tax andreceived less in (after-tax) contributions. The complete removal of tax concessions would also leadto higher age pension payments in the future, although this would be the result of a universal agepension in any case.
The effects of removing all tax concessions can be demonstrated using INDMOD. For convenienceI have chosen to model the effect for the six couples used in the preceding analysis. The sameeffects would be observed in an entirely prospective analysis. The following analysis is not ofspecific and multi-faceted proposals such as those of Cox. It is an illustrative analysis of the effectsof existing tax concessions.
Removing the tax concessions on superannuation could involve paying all employer contributions aswages and taxing those wages at marginal rates (rather than 15%). Although the standard taxexpenditure statement methodology assumes that all of the increase in take home pay is saved,Gallagher, Rothman and Brown (1993) examined marginal saving rates within the SGC populationand concluded that at most 30% of any increase in take home pay would be saved in a taxedaccount. For the purposes of the current modelling, this marginal saving rate has been set at a
20
RimC8 doc
generous 50% - that is, the current analysis assumes that 50% of the increase in take home pay issaved and that interest on those savings is taxed at marginal rates.
The current analysis effectively models a world in which compulsory superannuation contributionsare not made by employers. A 100% marginal savings rate would be appropriate for modelling asystem where compulsory contributions were made from post-tax wages.
Full results for the current analysis of the effects of tax concessions for superannuation arepresented at Attachment B.
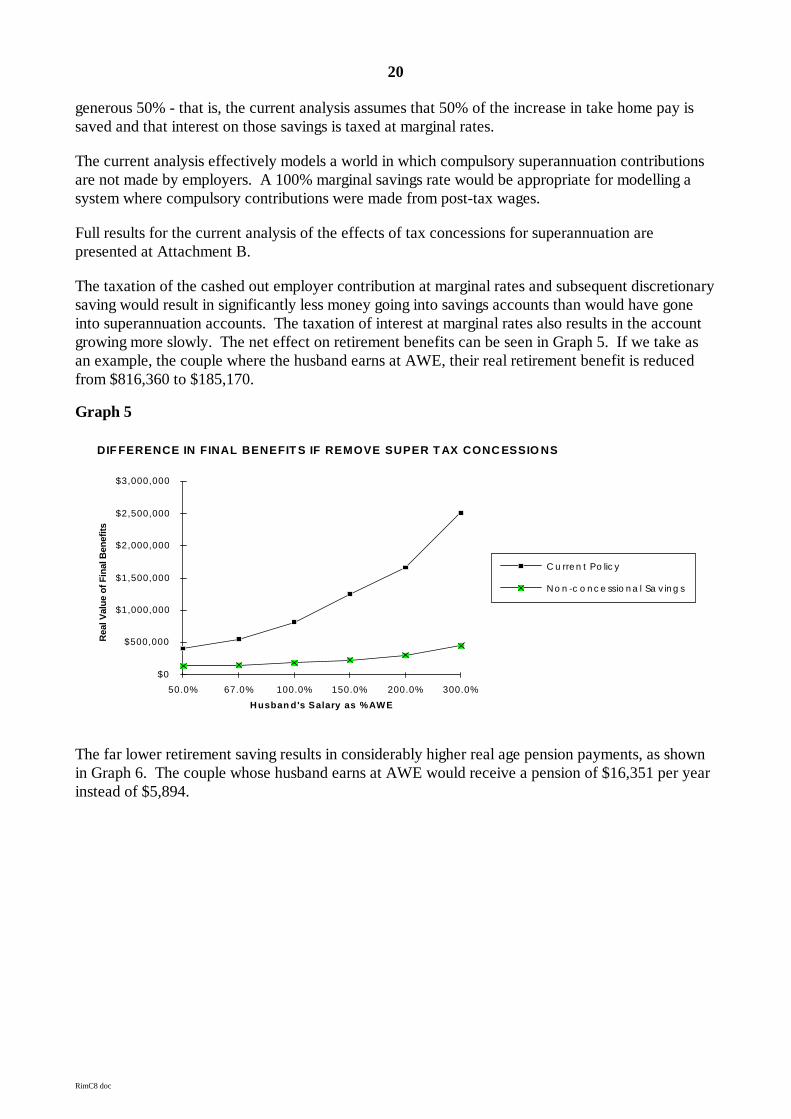
The taxation of the cashed out employer contribution at marginal rates and subsequent discretionarysaving would result in significantly less money going into savings accounts than would have goneinto superannuation accounts. The taxation of interest at marginal rates also results in the accountgrowing more slowly. The net effect on retirement benefits can be seen in Graph 5. If we take asan example, the couple where the husband earns at AWE, their real retirement benefit is reducedfrom $816,360 to $185,170.
Graph 5
DIF FERENCE IN FINAL BENEFIT S IF REMOVE SUPER T AX CONC ESSIO NS
Husban d's Salary as %AWE
Rea
l Val
ue o
f Fin
al B
enef
its
$0
$500,000
$1,000,000
$1,500,000
$2,000,000
$2,500,000
$3,000,000
50.0% 67.0% 100.0% 150.0% 200.0% 300.0%
C u rre n t Po lic y
No n -c o n c e ssio n a l Sa v in g s
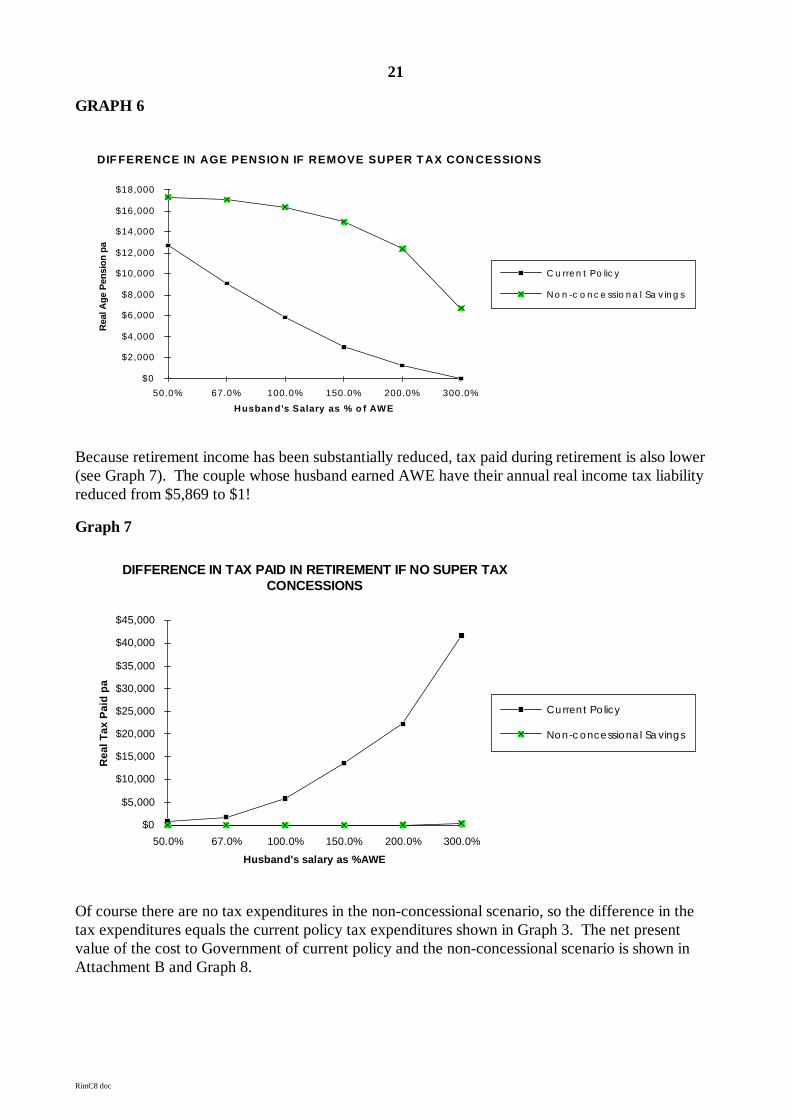
The far lower retirement saving results in considerably higher real age pension payments, as shownin Graph 6. The couple whose husband earns at AWE would receive a pension of $16,351 per yearinstead of $5,894.
21
RimC8 doc
GRAPH 6
DIF FERENCE IN AGE PENSIO N IF REMOVE SUPER T AX CON CESSIONS
Husban d's Salary as % o f AWE
Rea
l Age
Pen
sion
pa
$0
$2,000
$4,000
$6,000
$8,000
$10,000
$12,000
$14,000
$16,000
$18,000
50.0% 67.0% 100.0% 150.0% 200.0% 300.0%
C u rre n t Po lic y
No n -c o n c e ssio n a l Sa v in g s
Because retirement income has been substantially reduced, tax paid during retirement is also lower(see Graph 7). The couple whose husband earned AWE have their annual real income tax liabilityreduced from $5,869 to $1!
Graph 7
DIFFERENCE IN TAX PAID IN RETIREMENT IF NO SUPER TAXCONCESSIONS
Husband's salary as %AWE
Rea
l Tax
Pai
d pa
$0
$5,000
$10,000
$15,000
$20,000
$25,000
$30,000
$35,000
$40,000
$45,000
50.0% 67.0% 100.0% 150.0% 200.0% 300.0%
Curren t Po licy
Non-c oncessiona l Sa vings
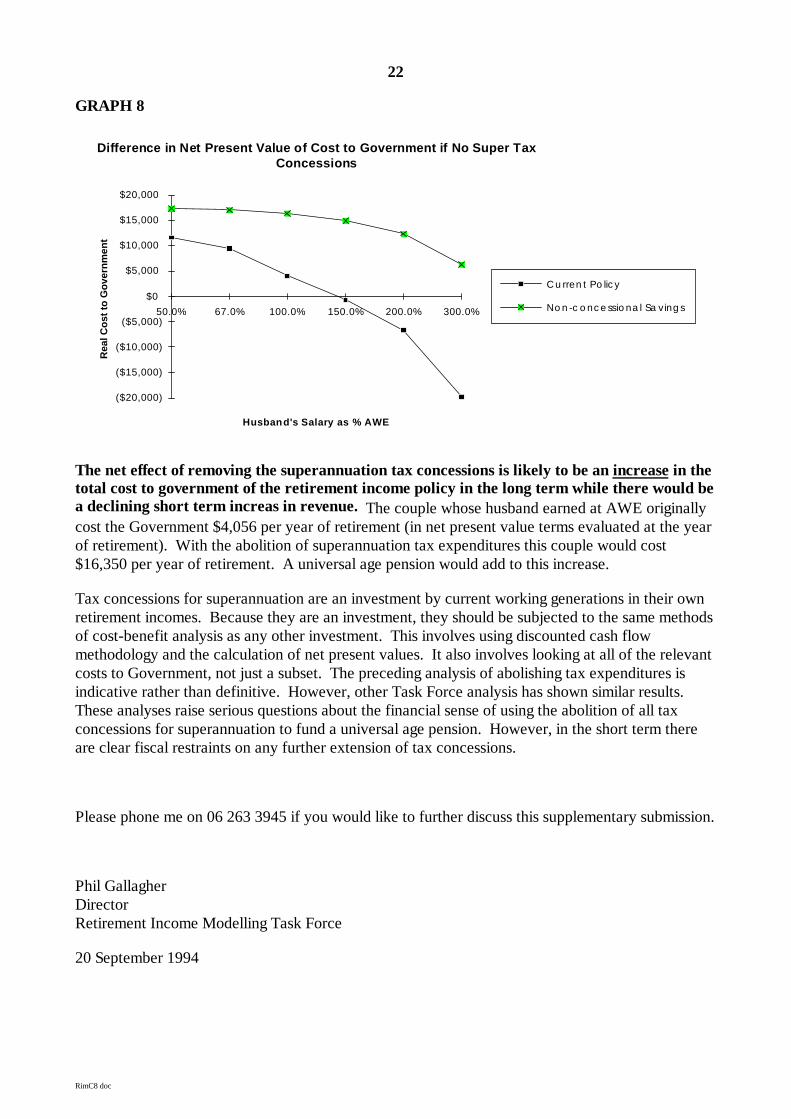
Of course there are no tax expenditures in the non-concessional scenario, so the difference in thetax expenditures equals the current policy tax expenditures shown in Graph 3. The net presentvalue of the cost to Government of current policy and the non-concessional scenario is shown inAttachment B and Graph 8.
22
RimC8 doc
GRAPH 8
Difference in Net Present Value of Cost to Government if No Super TaxConcessions
Husband's Salary as % AWE
Rea
l Cos
t to
Gov
ernm
ent
($20,000)
($15,000)
($10,000)
($5,000)
$0
$5,000
$10,000
$15,000
$20,000
50.0% 67.0% 100.0% 150.0% 200.0% 300.0%
C u rren t Po lic y
No n -c o nc e ssio na l Sa ving s
The net effect of removing the superannuation tax concessions is likely to be an increase in thetotal cost to government of the retirement income policy in the long term while there would bea declining short term increas in revenue. The couple whose husband earned at AWE originallycost the Government $4,056 per year of retirement (in net present value terms evaluated at the yearof retirement). With the abolition of superannuation tax expenditures this couple would cost$16,350 per year of retirement. A universal age pension would add to this increase.
Tax concessions for superannuation are an investment by current working generations in their ownretirement incomes. Because they are an investment, they should be subjected to the same methodsof cost-benefit analysis as any other investment. This involves using discounted cash flowmethodology and the calculation of net present values. It also involves looking at all of the relevantcosts to Government, not just a subset. The preceding analysis of abolishing tax expenditures isindicative rather than definitive. However, other Task Force analysis has shown similar results.These analyses raise serious questions about the financial sense of using the abolition of all taxconcessions for superannuation to fund a universal age pension. However, in the short term thereare clear fiscal restraints on any further extension of tax concessions.
Please phone me on 06 263 3945 if you would like to further discuss this supplementary submission.
Phil GallagherDirectorRetirement Income Modelling Task Force
20 September 1994
23
RimC8 doc
REFERENCES
Atkinson, M; Creedy, J; Haberecht, C; and Knox,D. (1994) the Cost and Equity Implications of theInstitute of Actuaries of Australia Proposed Retirement Incomes Strategy Paper Delivered to theSecond Colloquium of Superannuation Researchers, Melbourne, July 1994
Barber, J; Moon, G; and Doolan, S (1994) Questions of Balance: A Discussion Paper PresentingIssues and Options arising from the strategic review of the Pension's Income and Assets TestsDepartment of Social Security, July 1994
Brown, C. Tax Expenditures and Measuring the Long Term Costs and Benefits of RetirementIncome Policy, Retirement Income Modelling Task Force Conference Paper 93/1
Brown, C. The Distribution of Private sector Superannuation assets by Gender, Age and Salary ofMembers, Retirement Income Modelling Task Force Conference Paper 94/2
Cox, E (1994) Means Tests! Submission to the Strategic review of the pension Income and AssetsTests from the Women's Economic Think Tank, September
Gallagher, Rothman and Brown (1993) Saving for Retirement; The Benefits for Individuals and theNation, Retirement Income Modelling Task Force Conference Paper 93/2
The Institute of Actuaries of Australia (1994a) Proposed Retirement Incomes Strategy, Submissionto the Senate Select Committee on Superannuation, March 1994
The Institute of Actuaries of Australia (1994b) Proposed Retirement Incomes Strategy: Effect onGovernment Revenue, Supplementary Submission to the Senate Select Committee onSuperannuation, August 1994
Knox, D. (1991) Tax, Super and the Age Pension: The Issues of Cost, Equity and Incentives,Australian Tax Research Foundation, Research Study No. 14.
McDiarmid, A. (1994) Taxation of Superannuation and Disposable Income in Retirement,Retirement Income Modelling Task Force Conference Paper 94/1
Treasury (1993) Tax Expenditures Statement, December 1993, Australian Government PublishingService, Canberra
ATTACHMENT A
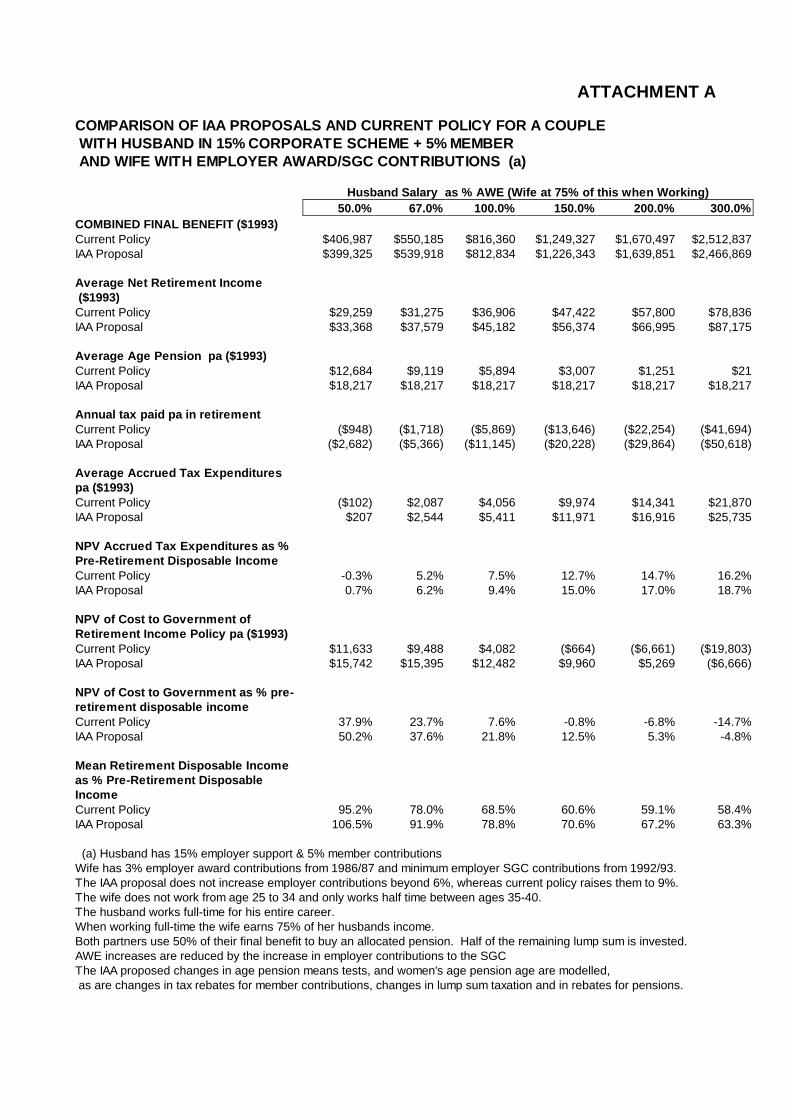
COMPARISON OF IAA PROPOSALS AND CURRENT POLICY FOR A COUPLE WITH HUSBAND IN 15% CORPORATE SCHEME + 5% MEMBER AND WIFE WITH EMPLOYER AWARD/SGC CONTRIBUTIONS (a)
Husband Salary as % AWE (Wife at 75% of this when Working)50.0% 67.0% 100.0% 150.0% 200.0% 300.0%
COMBINED FINAL BENEFIT ($1993)Current Policy $406,987 $550,185 $816,360 $1,249,327 $1,670,497 $2,512,837IAA Proposal $399,325 $539,918 $812,834 $1,226,343 $1,639,851 $2,466,869
Average Net Retir ement Income ($1993)Current Policy $29,259 $31,275 $36,906 $47,422 $57,800 $78,836IAA Proposal $33,368 $37,579 $45,182 $56,374 $66,995 $87,175
Average Age Pension pa ($1993)Current Policy $12,684 $9,119 $5,894 $3,007 $1,251 $21IAA Proposal $18,217 $18,217 $18,217 $18,217 $18,217 $18,217
Annual tax paid pa in retir ementCurrent Policy ($948) ($1,718) ($5,869) ($13,646) ($22,254) ($41,694)IAA Proposal ($2,682) ($5,366) ($11,145) ($20,228) ($29,864) ($50,618)
Average Accrued Tax Expenditurespa ($1993)Current Policy ($102) $2,087 $4,056 $9,974 $14,341 $21,870IAA Proposal $207 $2,544 $5,411 $11,971 $16,916 $25,735
NPV Accrued Tax Expenditures as %Pre-Retirement Disposable IncomeCurrent Policy -0.3% 5.2% 7.5% 12.7% 14.7% 16.2%IAA Proposal 0.7% 6.2% 9.4% 15.0% 17.0% 18.7%
NPV of Cost to Government ofRetirement Income Policy pa ($1993)Current Policy $11,633 $9,488 $4,082 ($664) ($6,661) ($19,803)IAA Proposal $15,742 $15,395 $12,482 $9,960 $5,269 ($6,666)
NPV of Cost to Government as % pre-retirement disposable incomeCurrent Policy 37.9% 23.7% 7.6% -0.8% -6.8% -14.7%IAA Proposal 50.2% 37.6% 21.8% 12.5% 5.3% -4.8%
Mean Retirement Disposable Incomeas % Pre-Retirement DisposableIncomeCurrent Policy 95.2% 78.0% 68.5% 60.6% 59.1% 58.4%IAA Proposal 106.5% 91.9% 78.8% 70.6% 67.2% 63.3%
(a) Husband has 15% employer support & 5% member contributionsWife has 3% employer award contributions from 1986/87 and minimum employer SGC contributions from 1992/93.The IAA proposal does not increase employer contributions beyond 6%, whereas current policy raises them to 9%.The wife does not work from age 25 to 34 and only works half time between ages 35-40.The husband works full-time for his entire career.When working full-time the wife earns 75% of her husbands income.Both partners use 50% of their final benefit to buy an allocated pension. Half of the remaining lump sum is invested.AWE increases are reduced by the increase in employer contributions to the SGCThe IAA proposed changes in age pension means tests, and women's age pension age are modelled, as are changes in tax rebates for member contributions, changes in lump sum taxation and in rebates for pensions.
25
ATTACHMENT B
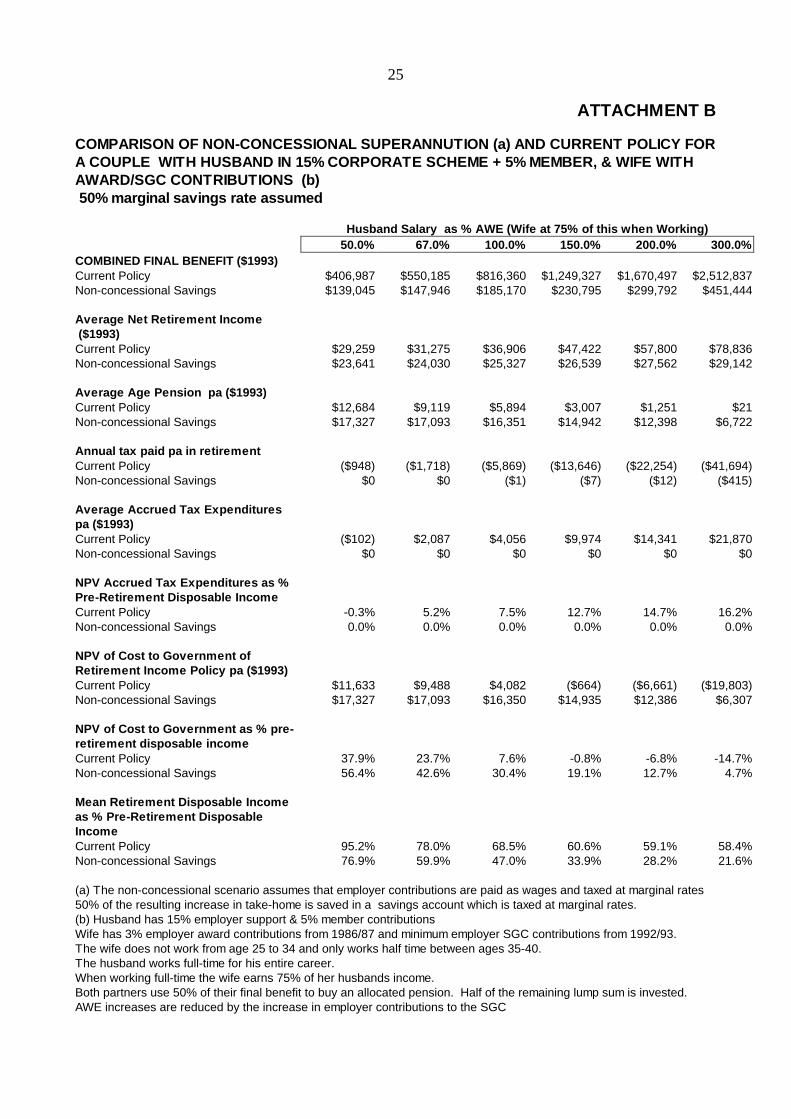
COMPARISON OF NON-CONCESSIONAL SUPERANNUTION (a) AND CURRENT POLICY FORA COUPLE WITH HUSBAND IN 15% CORPORATE SCHEME + 5% MEMBER, & WIFE WITHAWARD/SGC CONTRIBUTIONS (b) 50% marginal savings rate assumed
Husband Salary as % AWE (Wife at 75% of this when Working)50.0% 67.0% 100.0% 150.0% 200.0% 300.0%
COMBINED FINAL BENEFIT ($1993)Current Policy $406,987 $550,185 $816,360 $1,249,327 $1,670,497 $2,512,837Non-concessional Savings $139,045 $147,946 $185,170 $230,795 $299,792 $451,444
Average Net Retir ement Income ($1993)Current Policy $29,259 $31,275 $36,906 $47,422 $57,800 $78,836Non-concessional Savings $23,641 $24,030 $25,327 $26,539 $27,562 $29,142
Average Age Pension pa ($1993)Current Policy $12,684 $9,119 $5,894 $3,007 $1,251 $21Non-concessional Savings $17,327 $17,093 $16,351 $14,942 $12,398 $6,722
Annual tax paid pa in retir ementCurrent Policy ($948) ($1,718) ($5,869) ($13,646) ($22,254) ($41,694)Non-concessional Savings $0 $0 ($1) ($7) ($12) ($415)
Average Accrued Tax Expenditurespa ($1993)Current Policy ($102) $2,087 $4,056 $9,974 $14,341 $21,870Non-concessional Savings $0 $0 $0 $0 $0 $0
NPV Accrued Tax Expenditures as %Pre-Retirement Disposable IncomeCurrent Policy -0.3% 5.2% 7.5% 12.7% 14.7% 16.2%Non-concessional Savings 0.0% 0.0% 0.0% 0.0% 0.0% 0.0%
NPV of Cost to Government ofRetirement Income Policy pa ($1993)Current Policy $11,633 $9,488 $4,082 ($664) ($6,661) ($19,803)Non-concessional Savings $17,327 $17,093 $16,350 $14,935 $12,386 $6,307
NPV of Cost to Government as % pre-retirement disposable incomeCurrent Policy 37.9% 23.7% 7.6% -0.8% -6.8% -14.7%Non-concessional Savings 56.4% 42.6% 30.4% 19.1% 12.7% 4.7%
Mean Retirement Disposable Incomeas % Pre-Retirement DisposableIncomeCurrent Policy 95.2% 78.0% 68.5% 60.6% 59.1% 58.4%Non-concessional Savings 76.9% 59.9% 47.0% 33.9% 28.2% 21.6%
(a) The non-concessional scenario assumes that employer contributions are paid as wages and taxed at marginal rates50% of the resulting increase in take-home is saved in a savings account which is taxed at marginal rates.(b) Husband has 15% employer support & 5% member contributionsWife has 3% employer award contributions from 1986/87 and minimum employer SGC contributions from 1992/93.The wife does not work from age 25 to 34 and only works half time between ages 35-40.The husband works full-time for his entire career.When working full-time the wife earns 75% of her husbands income.Both partners use 50% of their final benefit to buy an allocated pension. Half of the remaining lump sum is invested.AWE increases are reduced by the increase in employer contributions to the SGC
Related Documents


![Spectraldecompositionsand L2-operatornorms … · 2013. 12. 2. · phenomenon has been called hypocoercivity (see the book of Villani [21] for the history) and has recently attracted](https://static.cupdf.com/doc/110x72/6123b95fabb8272db95daa07/spectraldecompositionsand-l2-operatornorms-2013-12-2-phenomenon-has-been-called.jpg)


