Submission doc.: IEEE 802.11- 12/0416r1 Slide 1 Broadband Indoor TVWS Channel Measurement and Characterization at 670 MHz Date: 2012-03-14 N am e A ffiliations A ddress Phone em ail M ing-Tuo Zhou N ICT 20 Science Park Rd, #01- 09/10 TeleTech Park, Singapore117674 +65 67711007 mingtuo@ nict.com.sg ChunyiSong N ICT 3-4, Hikarino O ka, Y okosuka, K anagaw a, 239- 0847, Japan [email protected] Zhou Lan N ICT 3-4, Hikarino O ka, Y okosuka, K anagaw a, 239- 0847, Japan [email protected] H iroshiH arada N ICT 3-4, Hikarino O ka, Y okosuka, K anagaw a, 239- 0847, Japan [email protected] Mar 2012 Ming-Tuo ZHOU, NICT

Submission doc.: IEEE 802.11-12/0416r1 Slide 1 Broadband Indoor TVWS Channel Measurement and Characterization at 670 MHz Date: 2012-03-14 Mar 2012 Ming-Tuo.
Dec 31, 2015
Welcome message from author
This document is posted to help you gain knowledge. Please leave a comment to let me know what you think about it! Share it to your friends and learn new things together.
Transcript

Submission
doc.: IEEE 802.11-12/0416r1
Slide 1
Broadband Indoor TVWS Channel Measurement and Characterization at 670 MHz
Date: 2012-03-14
Name Affiliations Address Phone email
Ming-Tuo Zhou NICT 20 Science Park Rd, #01-09/10 TeleTech Park, Singapore 117674
+65 67711007 [email protected]
Chunyi Song NICT 3-4, Hikarino Oka, Yokosuka, Kanagawa, 239-0847, Japan
Zhou Lan NICT 3-4, Hikarino Oka, Yokosuka, Kanagawa, 239-0847, Japan
Hiroshi Harada NICT 3-4, Hikarino Oka, Yokosuka, Kanagawa, 239-0847, Japan
Mar 2012
Ming-Tuo ZHOU, NICT
Submission
doc.: IEEE 802.11-12/0416r1
Abstract
An introduction to indoor TVWS channel measurement and results at 670 MHz
Slide 2
Mar 2012
Ming-Tuo ZHOU, NICT

Submission
doc.: IEEE 802.11-12/0416r1
Slide 3
Measurement Setup and Calibration
Measurement targets:Multipath delay spread, particularly, RMS delay spread
Channel impulse response
Path loss properties
Signaling: BPSK signal, 20 Mbps, 511-length pseudo random (PN) sequence, central frequency at
670 MHz
CW signal, central frequency at 670 MHz, for path loss measurement
Method:Custom designed receiver captures transmitted BPSK signal for measurement of
multipath delay spread and channel impulse response
For path loss measurement, the received signal power is measured by using a R&S FSU spectrum analyzer
Mar 2012
Ming-Tuo ZHOU, NICT

Submission
doc.: IEEE 802.11-12/0416r1
Measurement Setup and Calibration -- Instruments Used
Transmitter
Receiver & Spectrum Analyzer
Mar 2012
Ming-Tuo ZHOU, NICTSlide 4

Submission
doc.: IEEE 802.11-12/0416r1
Calibration Setup
Slide 5
Mar 2012
Ming-Tuo ZHOU, NICT

Submission
doc.: IEEE 802.11-12/0416r1
Measurement setup
Mar 2012
Ming-Tuo ZHOU, NICTSlide 6
Submission
doc.: IEEE 802.11-12/0416r1
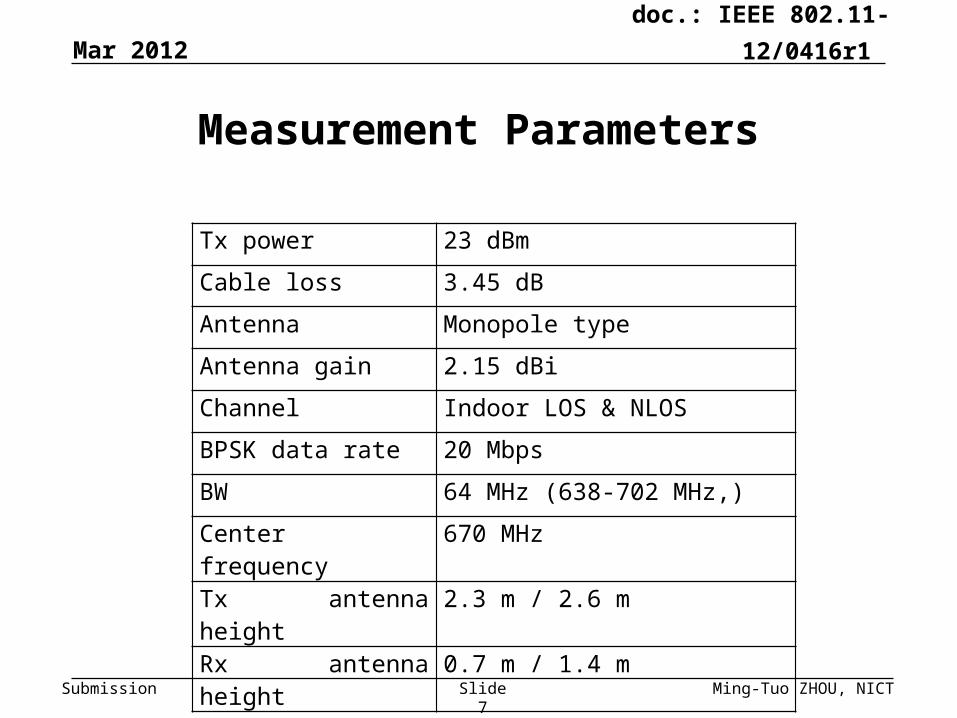
Measurement Parameters
Tx power 23 dBm
Cable loss 3.45 dB
Antenna Monopole type
Antenna gain 2.15 dBi
Channel Indoor LOS & NLOS
BPSK data rate 20 Mbps
BW 64 MHz (638-702 MHz,)
Center frequency 670 MHz
Tx antenna height 2.3 m / 2.6 m
Rx antenna height 0.7 m / 1.4 m
Mar 2012
Ming-Tuo ZHOU, NICTSlide 7

Submission
doc.: IEEE 802.11-12/0416r1
Measurement Scenarios 1 – Office 1 – small size office/lab
• 185 sqm (=14.52 m×12.74 m)
• Includes staff room, 3 experiment rooms, director room, meeting room, kitchen, reception, etc
• Walls material: plywood/concrete
• Three transmitter antenna locations
• Tx antenna – 2.3m, Rx antenna – 0.7m
Mar 2012
Ming-Tuo ZHOU, NICTSlide 8
Main door Experiment rooms
Meeting room Staff room
Reception
1 2 3
Tx-1
Tx-2
Tx-3

Submission
doc.: IEEE 802.11-12/0416r1
Measurement Scenarios 2 – Office 2 – medium size office/lab
• Includes two hall rooms, a conference room, several experiment rooms, a big lab room, store room, staff cubicle area
• Walls material: plywood/concrete
• One transmitter antenna position
• Tx antenna – 2.6m, Rx antenna – 1.4m
Mar 2012
Ming-Tuo ZHOU, NICTSlide 9
4 m
Goods Lift
Hall Room 1Lab
Store Room
Office
Office
Hall Room 2
Office Spacewith staff cubics
WashRoom
ConferenceRoom
MeetingRoom
StairCase
Tx
Rx 1
Rx 6
Rx 7
Rx 2
Rx 3
Rx 4
Rx 5
Rx 8
Rx 17
Rx 15
Rx 16
Rx 14
Rx 18
Rx 9
Rx 10
Rx 13Rx 12
Rx 11
Room
Room Room
Room Room
RoomRoom Room
Submission
doc.: IEEE 802.11-12/0416r1
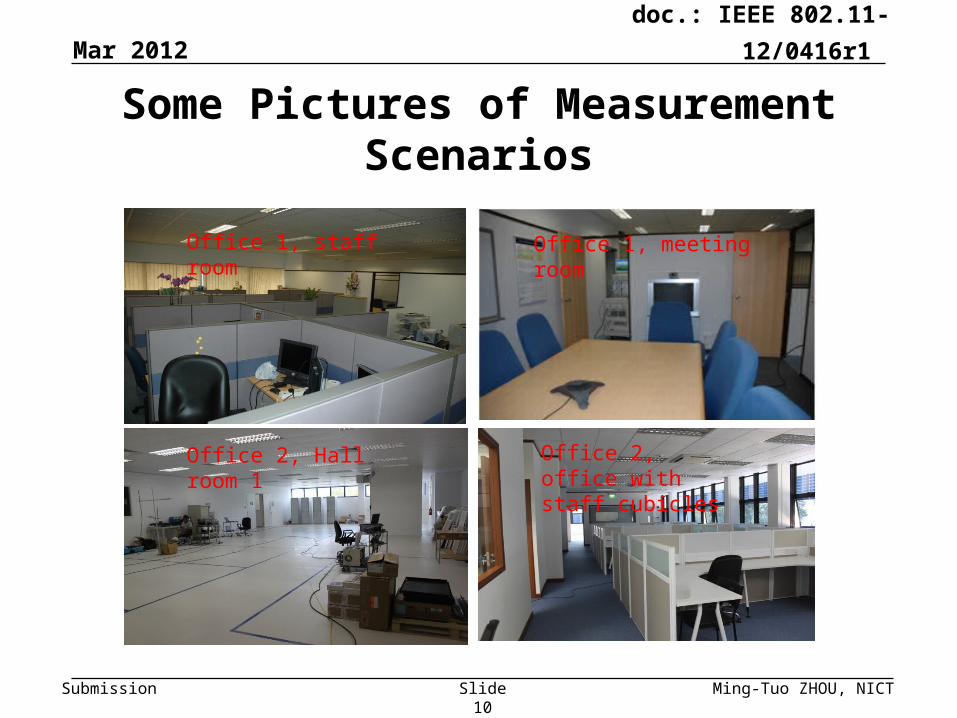
Some Pictures of Measurement Scenarios
Mar 2012
Ming-Tuo ZHOU, NICTSlide 10
Office 1, staff room Office 1, meeting room
Office 2, Hall room 1 Office 2, office with staff cubicles

Submission
doc.: IEEE 802.11-12/0416r1
Extracting Rays
For each receiver location, BPSK signal is received and the normalized power delay profile is plot as function of time stamp
A peak detection method is used to extract rays. First, the calibrated Nyquist pulse is normalized to the peak of received
signal power delay profile, and then it is subtracted from the power delay profile
Second, the calibrated Nyquist pulse is normalized to the peak of the remain part, and then it is subtracted from the remain part of power delay profile
The above process is repeated until the peak power of the remain part is less than some threshold value, e.g., -30 dB
Each peak represents a received ray (path). Power (path gain) and relative time delay of each peak with higher power than threshold (e.g., -30dB) are recorded
Mar 2012
Ming-Tuo ZHOU, NICTSlide 11

Submission
doc.: IEEE 802.11-12/0416r1
Extracting Rays (cont.)
Example
Mar 2012
Ming-Tuo ZHOU, NICTSlide 12
Ray Delay (ns) 0.00 37.5 75.00 100 125 150 187.5 212.5
Ray relative power (dB) -26.73 -13.50 0 -2.14 -5.68 -11.11 -12.55 -21.41
0 100 200 300 400 500 600 700 8000
0.5
1R
ela
tive
po
wer
Relative time (ns)
0 100 200 300 400 500 600 700 800-100
-50
0
Re
lativ
e
pow
er (
dB
)
Relative time (ns)
0 100 200 300 400 500 600 700 800-30
-20-10
0
Relative time (ns)Re
lativ
e p
ow
er (
dB)

Submission
doc.: IEEE 802.11-12/0416r1
Extracting Rays (Cont.)
The method extracting rays is verified by experiment of reconstructing the signal.
Signal is reconstructed by summing copies of calibrated Nyquist pulses, each of which is weighted by a ray power (path gain) and delayed with ray delay
The reconstructed signal is close to the measured one, as illustrated by following example
0 100 200 300 400 500 600 700 800-50
-40
-30
-20
-10
0
Time (ns)
Re
lativ
e p
ow
er (
dB)
MeasuredReconstructed
Mar 2012
Ming-Tuo ZHOU, NICTSlide 13

Submission
doc.: IEEE 802.11-12/0416r1
RMS Delay Spread
RMS delay at each receiver location is calculated for each measurement scenario
Median RMS delay is then calculated for each scenario (with different threshold)
Scenario LOS (ns)
(-30dB) LOS (ns)
(-20dB) LOS (ns) (-10dB)
NLOS (ns) (-30dB)
NLOS (ns) (-20dB)
NLOS (ns) (-10dB)
Office 1 Tx-1 32.42 31.33 20.88 41.09 36.20 27.44
Office 1 Tx-2 20.20 18.96 14.54 36.09 34.43 18.24
Office 1 Tx-3 20.51 18.72 10.34 32.37 30.36 26.48
Median for office 1 20.51 18.96 14.54 36.09 34.43 26.48
Office 2 38.52 34.67 19.04 42.47 39.32 28.19Overall Median 26.47 25.15 16.79 38.59 35.32 26.96
Mar 2012
Slide 14 Ming-Tuo ZHOU, NICT
Submission
doc.: IEEE 802.11-12/0416r1
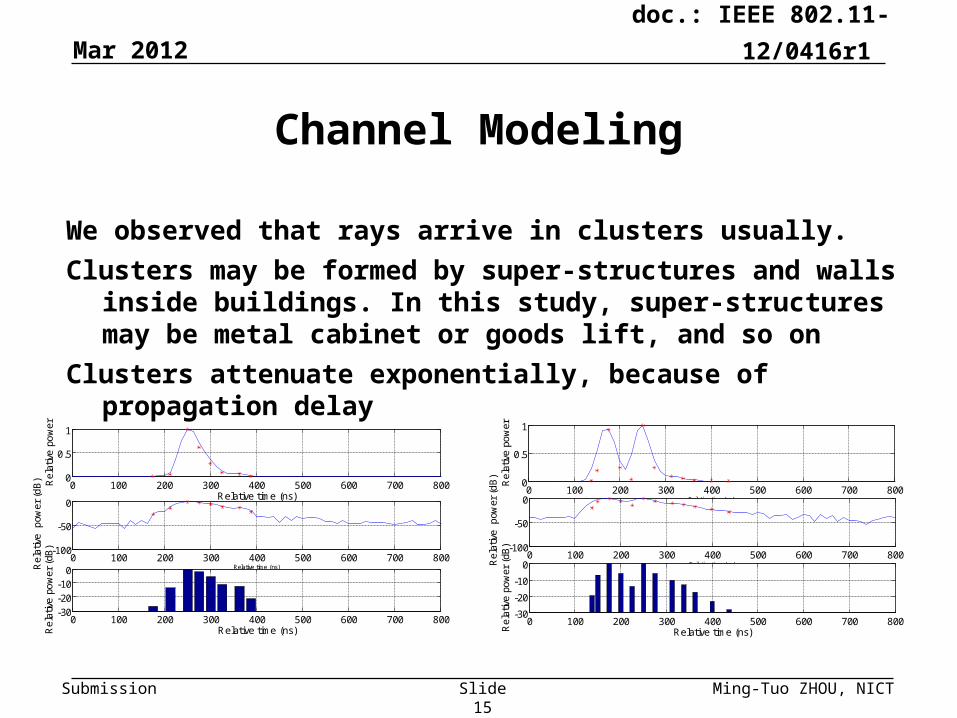
Channel Modeling
We observed that rays arrive in clusters usually.
Clusters may be formed by super-structures and walls inside buildings. In this study, super-structures may be metal cabinet or goods lift, and so on
Clusters attenuate exponentially, because of propagation delay
0 100 200 300 400 500 600 700 8000
0.5
1
Re
lativ
e p
ow
erRelative time (ns)
0 100 200 300 400 500 600 700 800-100
-50
0R
ela
tive
p
ower
(d
B)
Relative time (ns)
0 100 200 300 400 500 600 700 800-30
-20
-10
0
Relative time (ns)Re
lativ
e p
ow
er (
dB)
0 100 200 300 400 500 600 700 8000
0.5
1
Re
lativ
e p
ow
er
Relative time (ns)
0 100 200 300 400 500 600 700 800-100
-50
0
Re
lativ
e
pow
er (
dB
)
Relative time (ns)
0 100 200 300 400 500 600 700 800-30
-20-10
0
Relative time (ns)Re
lativ
e p
ow
er (
dB)
Mar 2012
Ming-Tuo ZHOU, NICTSlide 15

Submission
doc.: IEEE 802.11-12/0416r1
Channel Modeling (cont.)
Comparison to S-V model
Mar 2012
Ming-Tuo ZHOU, NICTSlide 16
New findings in this study Saleh-Valenzuela (S-V) model
A cluster may appear before the strongest cluster in some cases
The most left-side cluster is the strongest
Inside a cluster rays power may increase with time delay
Inside a cluster, rays power attenuate with time delay

Submission
doc.: IEEE 802.11-12/0416r1
Channel Modeling (cont.)
A qualitative explain to the above new findings is that different rays/clusters may have different antenna gain, due to difference in angle-of-arrival (AoA)
Lately arrived rays may have larger antenna gain, because of larger AoA
Then although they have larger propagation delay, their power are larger than earlier rays
An earlier cluster may have averagely smaller antenna gain than a later cluster, then later cluster may be stronger
Mar 2012
Ming-Tuo ZHOU, NICTSlide 17

Submission
doc.: IEEE 802.11-12/0416r1
Channel Modeling (cont.)
Illustration of qualitative explanation for rays arrival earlier may be weaker in power
Mar 2012
Ming-Tuo ZHOU, NICTSlide 18

Submission
doc.: IEEE 802.11-12/0416r1
Channel Modeling (cont.)
Proposed low-pass impulse response modelRays arrive in clusters, each cluster may consist of a group of rays.
At middle is the strongest cluster, with cluster arrival time of 0
At the middle of each cluster is the strongest ray and it represents the cluster arrival time Tl, which is arrival time relative to the strongest cluster
Rays arrival time relative to the strongest ray is , where l is the cluster index, m is the ray index
Cluster arrival time is modeled as Poisson arrival process with fixed arrival constant. Left side and right side clusters may have different cluster arrival time
Rays arrival time is modeled as Poisson arrival process with fixed arrival constant, too
Clusters decay exponentially with cluster arrival time, on both left and right sides (with possible different decay constant)
Rays decay with ray arrival time
lm
Mar 2012
Ming-Tuo ZHOU, NICTSlide 19

Submission
doc.: IEEE 802.11-12/0416r1
Channel Modeling (cont.)
Illustration of the proposed low-pass complex channel impulse response model (with comparison to S-V model)
Mar 2012
Ming-Tuo ZHOU, NICTSlide 20

Submission
doc.: IEEE 802.11-12/0416r1
Channel Modeling (cont.)
Mathematically, the low-pass complex channel impulse response model is given by
202
20
, 0
, 0
lm
lm
llm
l
e m
e m
0
0
2002
02
00
, 0
, 0
l
l
T
lT
e l
e l
l
lm
l
MLj
lm l lml L m M
h t e t T
Mar 2012
Ming-Tuo ZHOU, NICTSlide 21

Submission
doc.: IEEE 802.11-12/0416r1
Channel Modeling (cont.)
Parameters extracted from measurementsNumber of clusters: one left-side clusters occasionally, 2-4 right-side clusters
Number of rays: 2-5 left-side rays in the strongest clusters, median of 0.67 for other clusters
Cluster decay constant: left-side clusters 200ns to 1000ns, right-clusters: 25ns – 50 ns (median 33ns)
Ray decay parameter: ranges between 16ns to 22ns if treat as constant, in small room or NLOS cases, rays decay faster
Cluster arrival rate: both left-side and right-side clusters may have similar arrival rate, around 1/60ns
Ray arrival rate: in LOS cases ray arrival rate is 1/12.5ns usually, NLOS case has smaller ray arrival rate (1/25ns, even 1/37.5ns)
Mar 2012
Ming-Tuo ZHOU, NICTSlide 22

Submission
doc.: IEEE 802.11-12/0416r1
Path Loss Properties
Radio signals attenuate with distance exponentially
For each measurement distance, we took median power of the received samples
By fitting the path loss with minimum mean square error (MMSE), the exponential constant of LOS and NLOS in Office 1 is 2.02 and 2.09, respectively, indicating a strong waveguide effect
In Office 2, LOS and NLOS has exponential constant of 3.16 and 3.56, respectively.
Mar 2012
Ming-Tuo ZHOU, NICTSlide 23

Submission
doc.: IEEE 802.11-12/0416r1
Conclusion
Indoor channels at TVWS frequency of 670 MHz in both small- and medium-size mixed office/lab environment are measured and characterized
(Overall) median of RMS delay spread for LOS with -30dB threshold is 26. 47ns, and is 38.59ns for NLOS with -30dB cutoff threshold. With smaller threshold, RMS delay spreads are smaller
A low-pass complex impulse response model is proposed based on classic Saleh-Valenzuela (S-V) model and new findings
Path loss constants are presented
Mar 2012
Ming-Tuo ZHOU, NICTSlide 24
Related Documents


![PAPER Measurement-Based Spectrum Database for ......(Ofcom) in the UK started a TVWS pilot program for database-aided TVWS utilization in July, 2014 [10], [14]. For the TVWS pilot,](https://static.cupdf.com/doc/110x72/5fcf0d759f274140c51ed668/paper-measurement-based-spectrum-database-for-ofcom-in-the-uk-started.jpg)


