Submicrometer optical tomography by multiple-wavelength digital holographic microscopy Frédéric Montfort, Tristan Colomb, Florian Charrière, Jonas Kühn, Pierre Marquet, Etienne Cuche, Sylvain Herminjard, and Christian Depeursinge We present a method for submicrometer tomographic imaging using multiple wavelengths in digital holographic microscopy. This method is based on the recording, at different wavelengths equally sepa- rated in the k domain, in off-axis geometry, of the interference between a reference wave and an object wave reflected by a microscopic specimen and magnified by a microscope objective. A CCD camera records the holograms consecutively, which are then numerically reconstructed following the convolution for- mulation to obtain each corresponding complex object wavefront. Their relative phases are adjusted to be equal in a given plane of interest and the resulting complex wavefronts are summed. The result of this operation is a constructive addition of complex waves in the selected plane and destructive addition in the others. Tomography is thus obtained by the attenuation of the amplitude out of the plane of interest. Numerical variation of the plane of interest enables one to scan the object in depth. For the presented simulations and experiments, 20 wavelengths are used in the 480–700 nm range. The result is a sectioning of the object in slices 725 nm thick. © 2006 Optical Society of America OCIS codes: 090.1760, 100.3010, 110.0180, 110.6960, 110.6880. 1. Introduction The study of the internal structures of specimens has great importance in life and materials science. Thus different techniques of optical tomographic imaging have been developed to achieve the reconstruction of the optical properties of 3D specimens. The principle of so-called optical diffraction tomography (ODT) con- sists of recording the complex wave diffracted by a specimen while changing the k vector of the illumi- nating wave. This way, the frequency domain of the specimen is scanned, allowing for the reconstruction of the scattering potential of the specimen in the spatial domain. The theoretical basis of ODT was established in the 1970s by Wolf, 1 Carter, 2 Dändliker and Weiss, 3 and Fercher et al. 4 In spite of the great application potential, few suc- cessful applications of the ODT techniques to micro- scopic imaging have been reported, certainly because the accurate recording of the complex diffracted waves may involve complicated implementations. Phase- shifting interferometry combined with varying the il- lumination direction was, for example, used by Lauer for the observation of bacteria and yeasts. 5 Barty et al. obtained quantitative refractive index measurements on optical fibers, owing to their phase-retrieval algo- rithm based on three intensity measurements per- formed on different focus planes, combined with a rotation of the specimen relative to a fixed illumination beam. 6 Recently, Charrière et al. demonstrated that digital holographic microscopy could successfully be applied to cell tomography, 7 obtaining the first quan- titative refractive index measurement with an ODT technique applied to a biological specimen. Another way to perform ODT consists of changing the wavelength instead of changing the k direction. In other words, the frequency domain and specifically the diameter of the Ewald is scanned by changing the wavelength. This technique, developed along the guidelines fixed by the diffraction tomography theo- rem (see also Refs. 1– 4), may appear as rather com- plex and cumbersome in its practical application. In contrast, digital holography yields a particularly sim- ple way to express indirectly the diffraction tomo- F. Montfort ([email protected]fl.ch), T. Colomb, F. Char- rière (fl[email protected]fl.ch), J. Kühn, S. Herminjard, and C. Depeursinge are with the Institut d’Optique Appliquée, Ecole Polytechnique Fédérale de Lausanne, CH-1015 Lausanne, Swit- zerland. E. Cuche is with the Lyncée Tec SA, PSE-A, CH-1005 Lausanne, Switzerland. P. Marquet is with the Département de Psychiatrie DP-CHUV, Centre de Neurosciences Psychiatriques, Site de Cery, 1008 Prilly-Lausanne, Switzerland. Received 12 June 2006; revised 11 July 2006; accepted 11 July 2006; posted 13 July 2006 (Doc. ID 71850). 0003-6935/06/328209-09$15.00/0 © 2006 Optical Society of America 10 November 2006 Vol. 45, No. 32 APPLIED OPTICS 8209

Welcome message from author
This document is posted to help you gain knowledge. Please leave a comment to let me know what you think about it! Share it to your friends and learn new things together.
Transcript
Submicrometer optical tomography by multiple-wavelengthdigital holographic microscopy
Frédéric Montfort, Tristan Colomb, Florian Charrière, Jonas Kühn, Pierre Marquet, Etienne Cuche,Sylvain Herminjard, and Christian Depeursinge
We present a method for submicrometer tomographic imaging using multiple wavelengths in digitalholographic microscopy. This method is based on the recording, at different wavelengths equally sepa-rated in the k domain, in off-axis geometry, of the interference between a reference wave and an objectwave reflected by a microscopic specimen and magnified by a microscope objective. A CCD camera recordsthe holograms consecutively, which are then numerically reconstructed following the convolution for-mulation to obtain each corresponding complex object wavefront. Their relative phases are adjusted to beequal in a given plane of interest and the resulting complex wavefronts are summed. The result of thisoperation is a constructive addition of complex waves in the selected plane and destructive addition in theothers. Tomography is thus obtained by the attenuation of the amplitude out of the plane of interest.Numerical variation of the plane of interest enables one to scan the object in depth. For the presentedsimulations and experiments, 20 wavelengths are used in the 480–700 nm range. The result is asectioning of the object in slices 725 nm thick. © 2006 Optical Society of America
OCIS codes: 090.1760, 100.3010, 110.0180, 110.6960, 110.6880.
1. Introduction
The study of the internal structures of specimens hasgreat importance in life and materials science. Thusdifferent techniques of optical tomographic imaginghave been developed to achieve the reconstruction ofthe optical properties of 3D specimens. The principleof so-called optical diffraction tomography (ODT) con-sists of recording the complex wave diffracted by aspecimen while changing the k vector of the illumi-nating wave. This way, the frequency domain of thespecimen is scanned, allowing for the reconstructionof the scattering potential of the specimen in thespatial domain. The theoretical basis of ODT wasestablished in the 1970s by Wolf,1 Carter,2 Dändlikerand Weiss,3 and Fercher et al.4
In spite of the great application potential, few suc-cessful applications of the ODT techniques to micro-scopic imaging have been reported, certainly becausethe accurate recording of the complex diffracted wavesmay involve complicated implementations. Phase-shifting interferometry combined with varying the il-lumination direction was, for example, used by Lauerfor the observation of bacteria and yeasts.5 Barty et al.obtained quantitative refractive index measurementson optical fibers, owing to their phase-retrieval algo-rithm based on three intensity measurements per-formed on different focus planes, combined with arotation of the specimen relative to a fixed illuminationbeam.6 Recently, Charrière et al. demonstrated thatdigital holographic microscopy could successfully beapplied to cell tomography,7 obtaining the first quan-titative refractive index measurement with an ODTtechnique applied to a biological specimen.
Another way to perform ODT consists of changingthe wavelength instead of changing the k direction.In other words, the frequency domain and specificallythe diameter of the Ewald is scanned by changingthe wavelength. This technique, developed along theguidelines fixed by the diffraction tomography theo-rem (see also Refs. 1–4), may appear as rather com-plex and cumbersome in its practical application. Incontrast, digital holography yields a particularly sim-ple way to express indirectly the diffraction tomo-
F. Montfort ([email protected]), T. Colomb, F. Char-rière ([email protected]), J. Kühn, S. Herminjard, and C.Depeursinge are with the Institut d’Optique Appliquée, EcolePolytechnique Fédérale de Lausanne, CH-1015 Lausanne, Swit-zerland. E. Cuche is with the Lyncée Tec SA, PSE-A, CH-1005Lausanne, Switzerland. P. Marquet is with the Département dePsychiatrie DP-CHUV, Centre de Neurosciences Psychiatriques,Site de Cery, 1008 Prilly-Lausanne, Switzerland.
Received 12 June 2006; revised 11 July 2006; accepted 11 July2006; posted 13 July 2006 (Doc. ID 71850).
0003-6935/06/328209-09$15.00/0© 2006 Optical Society of America
10 November 2006 � Vol. 45, No. 32 � APPLIED OPTICS 8209
graphy theorem: Remaining in the direct space, to-mography of the object can be achieved by the super-position of reconstructed wavefronts from hologramstaken at multiple wavelengths. This had been pro-posed several years ago by Marron and Schroeder8
and Marron and Gleichman,9 who called it holo-graphic laser radar. They used an in-line holographicconfiguration in which the images are focused on thecamera. The combination of several phase-shifted ac-quisitions allows the phase retrieval. Reference to asimilar approach was also described by Arons andDilworth10 as Fourier synthesis holography. Morerecently, the feasibility of section imaging by wave-length scanning digital holography was demonstratedby Kim11,12 and Yu and Kim13,14 on a macroscale.Dakoff et al.15 used the same method at the microscalebut with an axial resolution of 11 �m.
In this paper, it is demonstrated that digital holo-graphic microscopy (DHM), allowing us to recon-struct the complex wavefront of an object wave froma single recorded hologram,16,17 is a particularlywell-suited technique to achieve multiwavelength to-mography. Moreover, the digital optics developed byColomb et al. and applied in this paper allows for thecompensation of the phase aberrations,18,19 but alsowhat is imperative is to reach the theoretical resolu-tion limit of the method for chromatic aberrations(position and scale different for each wavelengthwavefront reconstruction).20 We demonstrate thatDHM multiwavelength tomography enables, for thefirst time to our knowledge, the performance of tomo-graphic imaging with an axial accuracy under themicrometer and a lateral resolution down to the dif-fraction limit without using a mechanical scan.
2. Digital Holography
A. Setup
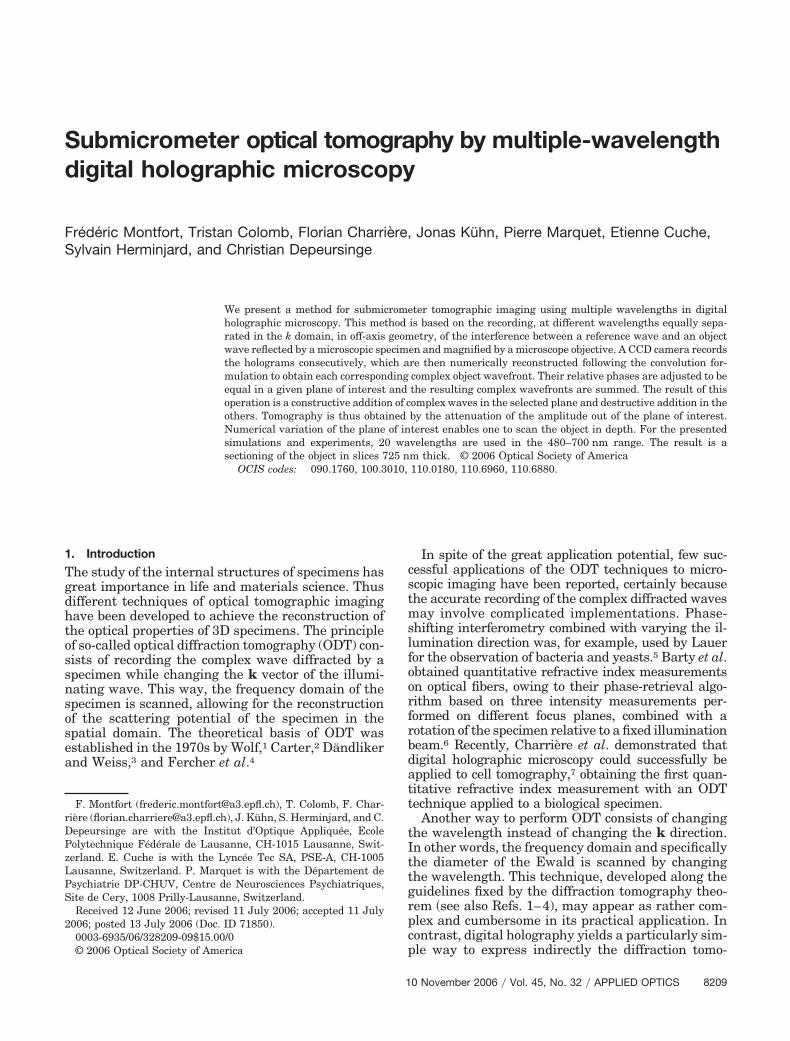
The experimental setup is based on a classical Mach–Zehnder off-axis holographic interferometer (Fig. 1).The light source is generated by an argon-ion plasmalaser (Coherent Innova 200) pumping a mode-lockedTi:sapphire laser system (Coherent Mira 900). Thebeam is then amplified by a regenerative amplifier(Coherent RegA 9000) and finally extended in a wave-length with a tunable optical parametric amplifier(OPA; Coherent OPA 9400). The beam coming fromthe OPA is split. On one side, the object beam Oilluminates the sample through the microscope objec-tive (MO; focal length of 18.4 mm, NA � 0.15, mag-nification of �10�) and the backscattered field,collected by the MO, interferes on the CCD with thereference beam R to produce a hologram. The irradi-ance at the specimen plane is of the order of hun-dredths of microwatts per square centimeter, slightlyvarying depending on the wavelength. In our case,the hologram is recorded in an off-axis geometry,meaning that a small angle � is introduced betweenboth waves. As the coherence length of the OPA beamis short ��60 �m�, the optical length of the referencebeam is adjusted to the one for the object with a delaysystem (DS). Two more lenses are used: one is the
object beam condenser (OC) that focuses the objectbeam at the back focal length of the microscope ob-jective so it has a collimated beam illuminating thesample, and the second is the reference lens (RL) thatcurves the reference beam to match approximativelythe curvature introduced by the MO on the objectbeam in the CCD plane. This curvature matching isapproximative and does not require an exact anddelicate adjustment of the RL position because theresidual curvature difference can be easily compen-sated for numerically as presented in the next sub-section. We note that the image of the specimenthrough the MO is not focused on the CCD camera.The tomographic imaging will be computed from asequence of 20 holograms recorded with 20 differentwavelengths without moving any part of the setup,except the DS will compensate for dispersion betweeneach wavelength and neutral filter to adjust the beamintensity.
B. Reconstruction Principle
The addition principle presented in Section 3 re-quires that the specimen size and position that ap-pear in the reconstruction plane obtained from thedifferent wavelengths must be identical. Ferraroet al.21 have demonstrated that a padding techniqueallows us to control the image size as a function ofdistance and wavelength within the single Fouriertransform formulation of the numerical propagationin the Fresnel approximation. But the presented pad-ding technique does not take into account the chro-matic aberrations of the optics in the setup andespecially those of the MO. Chromatic aberrations ofthe MO induce small differences in the magnification,the lateral position, and the focalization position of thespecimen images. Therefore the convolution formula-tion is preferred with the advantage of keeping thepixel size constant at any reconstructed plane regard-less of the reconstruction distance and enabling theuse of numerical lenses to compensate for the chro-matic aberrations as presented in Ref. 20.
Fig. 1. Experimental setup. O, object arm; R, reference arm; OPA,adjustable wavelength laser; NF, neutral filter; BS, beam splitters;BE, beam expander; MO, microscope objective; OC, object beamcondenser; RL, reference lens; CCD, charged-coupled device cam-era; DS, delay system.
8210 APPLIED OPTICS � Vol. 45, No. 32 � 10 November 2006
The numerical reconstruction of the holograms isthus done in four steps. The first one consists of fil-tering in the hologram frequency domain the unde-sired diffracted images (zero order and conjugateimage).22 The second one consists of compensating forthe phase aberrations (tilt due to the off-axis geome-try, curvature due to the MO not compensated for bythe RL,23 astigmatism, spherical aberration, etc.) byplacing a numerical parametric lens in the hologramplane defined with a reference conjugated hologram19
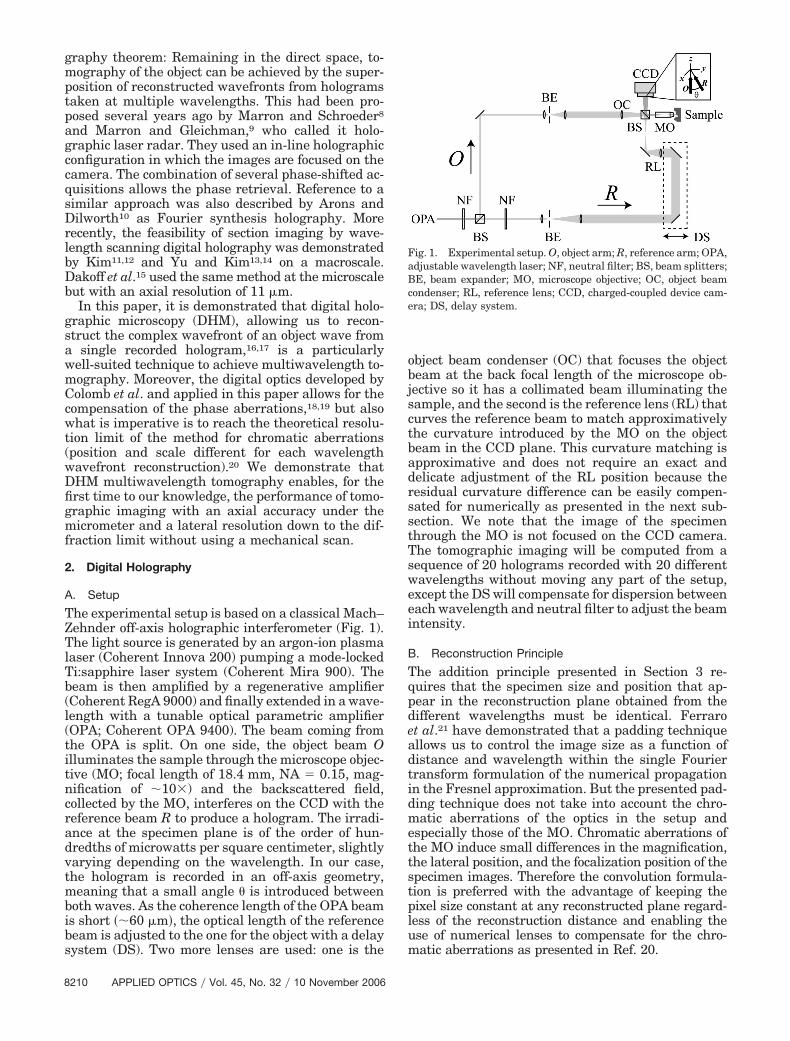
or with an automatic fitting procedure.18,20 The thirdstep is to propagate the corrected reconstructed ob-ject wave from the hologram plane to its focalizationplane by adjusting the reconstruction distance [Figs.2(a)–2(d)]. Finally, the sizes and the lateral positionsof the specimen in the different reconstruction planes
are adjusted to be identical by the use of other nu-merical lenses as presented in Ref. 20 [Figs. 2(e) and2(f)]. One should note that the aberration compensa-tions, principally for the tilt, allow for the use of theconvolution formulation of the Fresnel propagation(see Ref. 23 for the exact formulation of the convolu-tion Kernel) without constraint in the reconstructiondistance (small distances become possible withoutaliasing) giving no particular advantage to the so-called angular spectrum method as stated by Kimet al.24
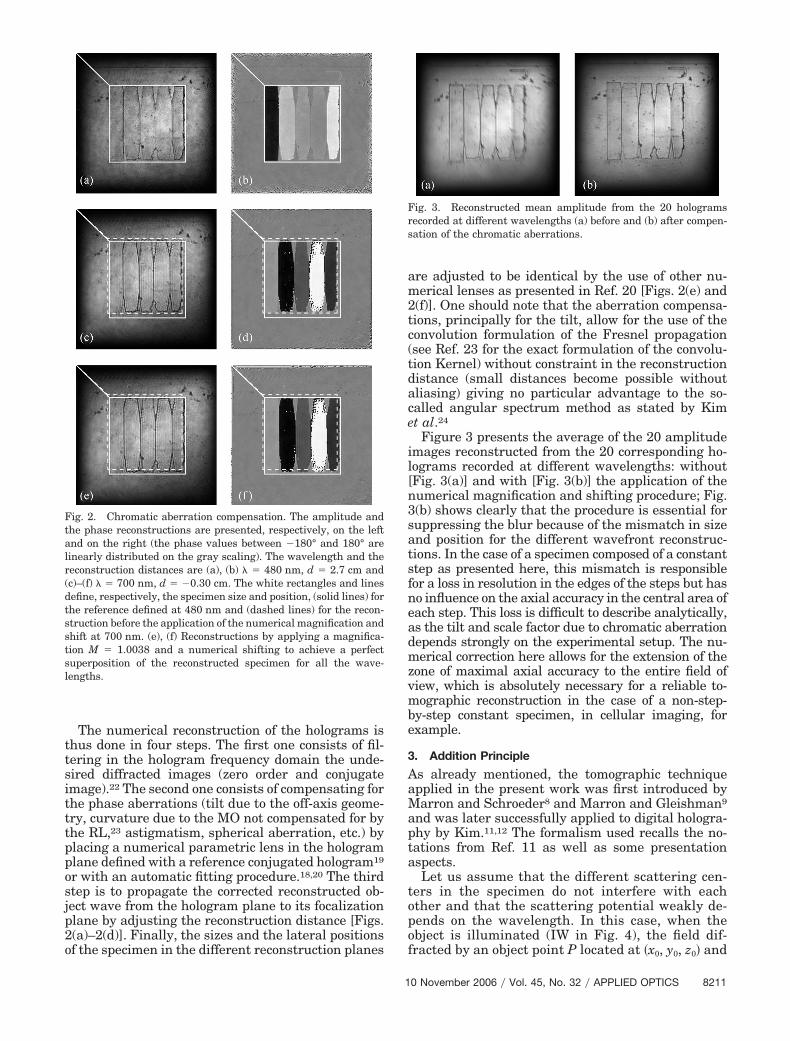
Figure 3 presents the average of the 20 amplitudeimages reconstructed from the 20 corresponding ho-lograms recorded at different wavelengths: without[Fig. 3(a)] and with [Fig. 3(b)] the application of thenumerical magnification and shifting procedure; Fig.3(b) shows clearly that the procedure is essential forsuppressing the blur because of the mismatch in sizeand position for the different wavefront reconstruc-tions. In the case of a specimen composed of a constantstep as presented here, this mismatch is responsiblefor a loss in resolution in the edges of the steps but hasno influence on the axial accuracy in the central area ofeach step. This loss is difficult to describe analytically,as the tilt and scale factor due to chromatic aberrationdepends strongly on the experimental setup. The nu-merical correction here allows for the extension of thezone of maximal axial accuracy to the entire field ofview, which is absolutely necessary for a reliable to-mographic reconstruction in the case of a non-step-by-step constant specimen, in cellular imaging, forexample.
3. Addition Principle
As already mentioned, the tomographic techniqueapplied in the present work was first introduced byMarron and Schroeder8 and Marron and Gleishman9
and was later successfully applied to digital hologra-phy by Kim.11,12 The formalism used recalls the no-tations from Ref. 11 as well as some presentationaspects.
Let us assume that the different scattering cen-ters in the specimen do not interfere with eachother and that the scattering potential weakly de-pends on the wavelength. In this case, when theobject is illuminated (IW in Fig. 4), the field dif-fracted by an object point P located at �x0, y0, z0� and
Fig. 2. Chromatic aberration compensation. The amplitude andthe phase reconstructions are presented, respectively, on the leftand on the right (the phase values between �180° and 180° arelinearly distributed on the gray scaling). The wavelength and thereconstruction distances are (a), (b) � � 480 nm, d � 2.7 cm and(c)–(f) � � 700 nm, d � �0.30 cm. The white rectangles and linesdefine, respectively, the specimen size and position, (solid lines) forthe reference defined at 480 nm and (dashed lines) for the recon-struction before the application of the numerical magnification andshift at 700 nm. (e), (f) Reconstructions by applying a magnifica-tion M � 1.0038 and a numerical shifting to achieve a perfectsuperposition of the reconstructed specimen for all the wave-lengths.
Fig. 3. Reconstructed mean amplitude from the 20 hologramsrecorded at different wavelengths (a) before and (b) after compen-sation of the chromatic aberrations.
10 November 2006 � Vol. 45, No. 32 � APPLIED OPTICS 8211
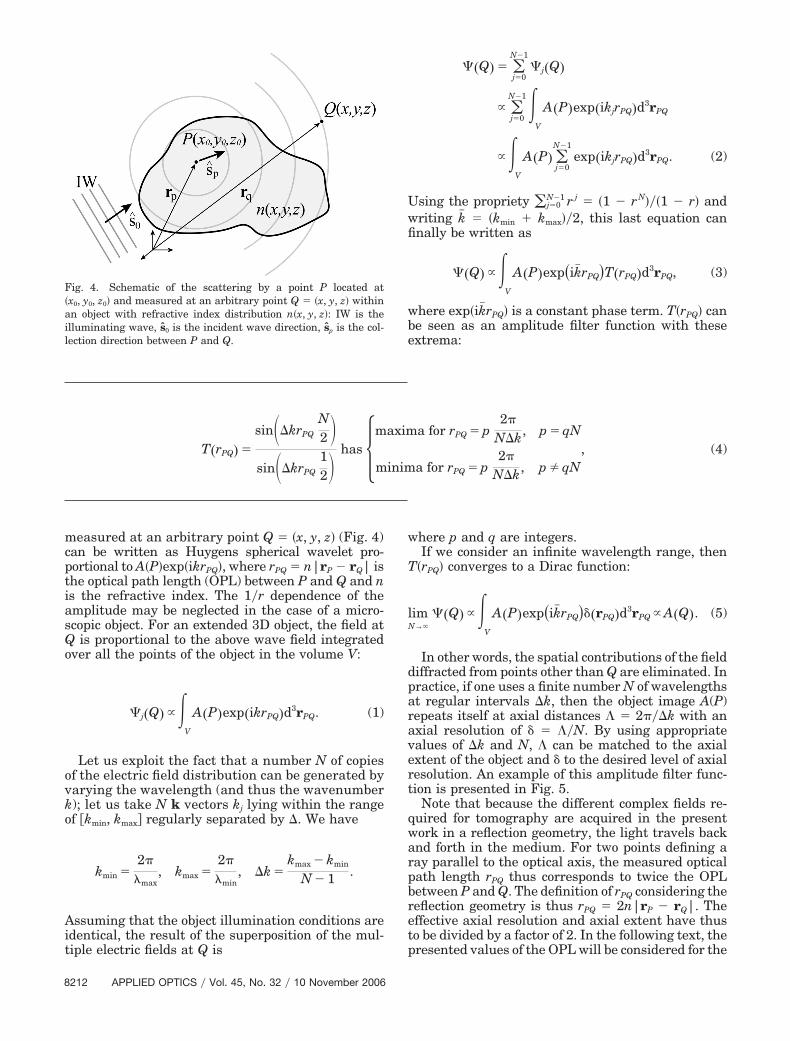
measured at an arbitrary point Q � �x, y, z� (Fig. 4)can be written as Huygens spherical wavelet pro-portional to A�P�exp�ikrPQ�, where rPQ � n|rP � rQ| isthe optical path length (OPL) between P and Q and nis the refractive index. The 1�r dependence of theamplitude may be neglected in the case of a micro-scopic object. For an extended 3D object, the field atQ is proportional to the above wave field integratedover all the points of the object in the volume V:
�j�Q� ��V
A�P�exp�ikrPQ�d3rPQ. (1)
Let us exploit the fact that a number N of copiesof the electric field distribution can be generated byvarying the wavelength (and thus the wavenumberk); let us take N k vectors kj lying within the rangeof �kmin, kmax� regularly separated by �. We have
kmin �2�
�max, kmax �
2�
�min, k �
kmax � kmin
N � 1 .
Assuming that the object illumination conditions areidentical, the result of the superposition of the mul-tiple electric fields at Q is
��Q� � �j�0
N�1
�j�Q�
� �j�0
N�1�V
A�P�exp�ikjrPQ�d3rPQ
��V
A�P� �j�0
N�1
exp�ikjrPQ�d3rPQ. (2)
Using the propriety �j�0N�1 r j � �1 � rN���1 � r� and
writing k� � �kmin kmax��2, this last equation canfinally be written as
��Q� ��V
A�P�exp�ik�rPQ�T�rPQ�d3rPQ, (3)
where exp�ik�rPQ� is a constant phase term. T�rPQ� canbe seen as an amplitude filter function with theseextrema:
where p and q are integers.If we consider an infinite wavelength range, then
T�rPQ� converges to a Dirac function:
limN→�
��Q� ��V
A�P�exp�ik�rPQ���rPQ�d3rPQ � A�Q�. (5)
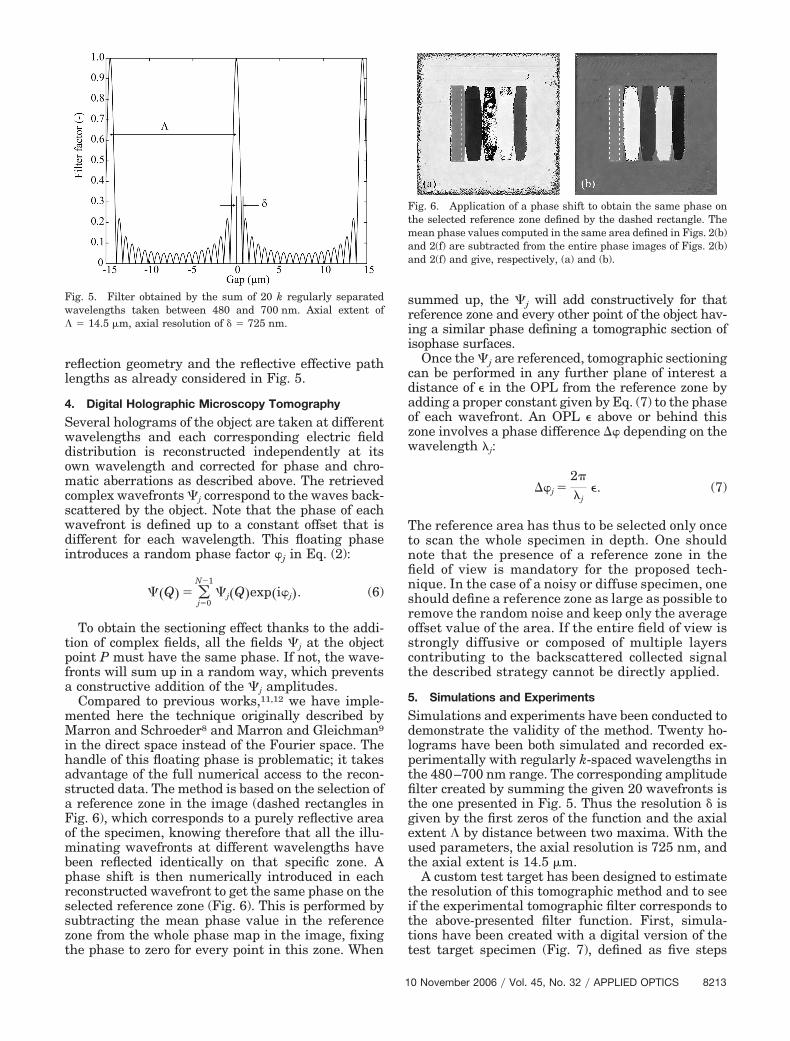
In other words, the spatial contributions of the fielddiffracted from points other than Q are eliminated. Inpractice, if one uses a finite number N of wavelengthsat regular intervals k, then the object image A(P)repeats itself at axial distances � 2��k with anaxial resolution of � � �N. By using appropriatevalues of k and N, � can be matched to the axialextent of the object and � to the desired level of axialresolution. An example of this amplitude filter func-tion is presented in Fig. 5.
Note that because the different complex fields re-quired for tomography are acquired in the presentwork in a reflection geometry, the light travels backand forth in the medium. For two points defining aray parallel to the optical axis, the measured opticalpath length rPQ thus corresponds to twice the OPLbetween P and Q. The definition of rPQ considering thereflection geometry is thus rPQ � 2n|rP � rQ|. Theeffective axial resolution and axial extent have thusto be divided by a factor of 2. In the following text, thepresented values of the OPL will be considered for the
T�rPQ� �
sinkrPQ
N2
sinkrPQ
12
has �maxima for rPQ � p2�
Nk, p � qN
minima for rPQ � p2�
Nk, p � qN, (4)
Fig. 4. Schematic of the scattering by a point P located at�x0, y0, z0� and measured at an arbitrary point Q � �x, y, z� withinan object with refractive index distribution n�x, y, z�: IW is theilluminating wave, s0 is the incident wave direction, sp is the col-lection direction between P and Q.
8212 APPLIED OPTICS � Vol. 45, No. 32 � 10 November 2006
reflection geometry and the reflective effective pathlengths as already considered in Fig. 5.
4. Digital Holographic Microscopy Tomography
Several holograms of the object are taken at differentwavelengths and each corresponding electric fielddistribution is reconstructed independently at itsown wavelength and corrected for phase and chro-matic aberrations as described above. The retrievedcomplex wavefronts �j correspond to the waves back-scattered by the object. Note that the phase of eachwavefront is defined up to a constant offset that isdifferent for each wavelength. This floating phaseintroduces a random phase factor �j in Eq. (2):
��Q� � �j�0
N�1
�j�Q�exp�i�j�. (6)
To obtain the sectioning effect thanks to the addi-tion of complex fields, all the fields �j at the objectpoint P must have the same phase. If not, the wave-fronts will sum up in a random way, which preventsa constructive addition of the �j amplitudes.
Compared to previous works,11,12 we have imple-mented here the technique originally described byMarron and Schroeder8 and Marron and Gleichman9
in the direct space instead of the Fourier space. Thehandle of this floating phase is problematic; it takesadvantage of the full numerical access to the recon-structed data. The method is based on the selection ofa reference zone in the image (dashed rectangles inFig. 6), which corresponds to a purely reflective areaof the specimen, knowing therefore that all the illu-minating wavefronts at different wavelengths havebeen reflected identically on that specific zone. Aphase shift is then numerically introduced in eachreconstructed wavefront to get the same phase on theselected reference zone (Fig. 6). This is performed bysubtracting the mean phase value in the referencezone from the whole phase map in the image, fixingthe phase to zero for every point in this zone. When
summed up, the �j will add constructively for thatreference zone and every other point of the object hav-ing a similar phase defining a tomographic section ofisophase surfaces.
Once the �j are referenced, tomographic sectioningcan be performed in any further plane of interest adistance of � in the OPL from the reference zone byadding a proper constant given by Eq. (7) to the phaseof each wavefront. An OPL � above or behind thiszone involves a phase difference �� depending on thewavelength �j:
�j �2�
�j�. (7)
The reference area has thus to be selected only onceto scan the whole specimen in depth. One shouldnote that the presence of a reference zone in thefield of view is mandatory for the proposed tech-nique. In the case of a noisy or diffuse specimen, oneshould define a reference zone as large as possible toremove the random noise and keep only the averageoffset value of the area. If the entire field of view isstrongly diffusive or composed of multiple layerscontributing to the backscattered collected signalthe described strategy cannot be directly applied.
5. Simulations and Experiments
Simulations and experiments have been conducted todemonstrate the validity of the method. Twenty ho-lograms have been both simulated and recorded ex-perimentally with regularly k-spaced wavelengths inthe 480–700 nm range. The corresponding amplitudefilter created by summing the given 20 wavefronts isthe one presented in Fig. 5. Thus the resolution � isgiven by the first zeros of the function and the axialextent � by distance between two maxima. With theused parameters, the axial resolution is 725 nm, andthe axial extent is 14.5 �m.
A custom test target has been designed to estimatethe resolution of this tomographic method and to seeif the experimental tomographic filter corresponds tothe above-presented filter function. First, simula-tions have been created with a digital version of thetest target specimen (Fig. 7), defined as five steps
Fig. 5. Filter obtained by the sum of 20 k regularly separatedwavelengths taken between 480 and 700 nm. Axial extent of � 14.5 �m, axial resolution of � � 725 nm.
Fig. 6. Application of a phase shift to obtain the same phase onthe selected reference zone defined by the dashed rectangle. Themean phase values computed in the same area defined in Figs. 2(b)and 2(f) are subtracted from the entire phase images of Figs. 2(b)and 2(f) and give, respectively, (a) and (b).
10 November 2006 � Vol. 45, No. 32 � APPLIED OPTICS 8213
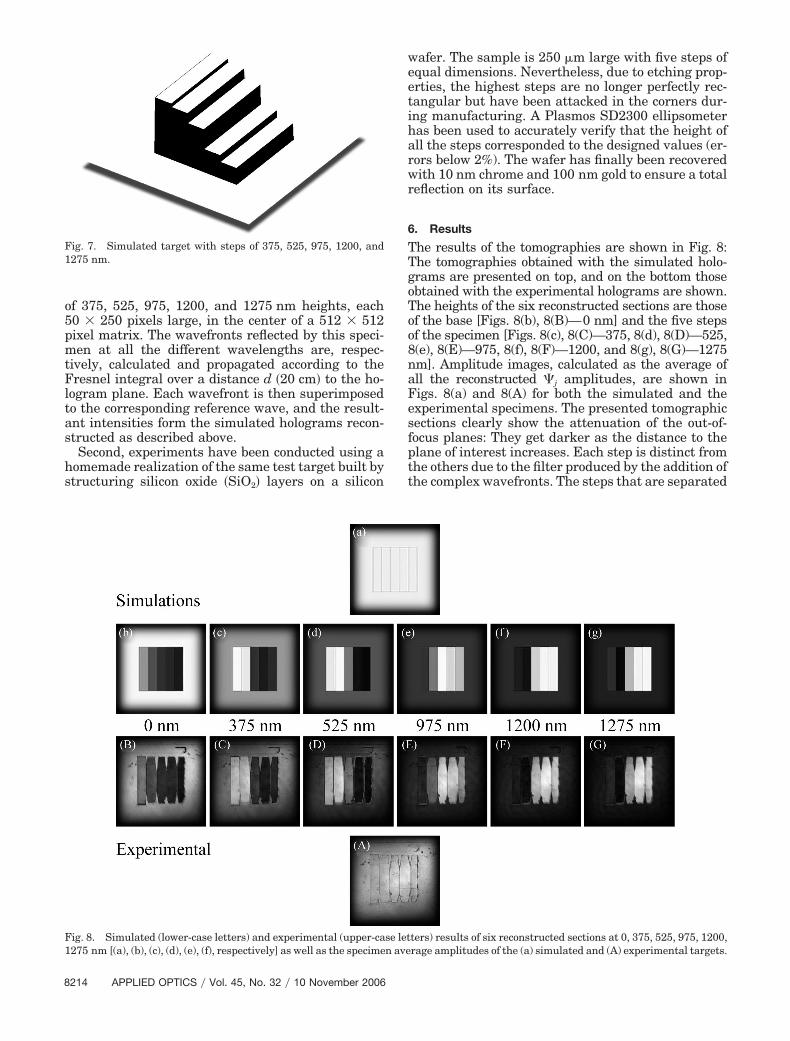
of 375, 525, 975, 1200, and 1275 nm heights, each50 250 pixels large, in the center of a 512 512pixel matrix. The wavefronts reflected by this speci-men at all the different wavelengths are, respec-tively, calculated and propagated according to theFresnel integral over a distance d �20 cm� to the ho-logram plane. Each wavefront is then superimposedto the corresponding reference wave, and the result-ant intensities form the simulated holograms recon-structed as described above.
Second, experiments have been conducted using ahomemade realization of the same test target built bystructuring silicon oxide �SiO2� layers on a silicon
wafer. The sample is 250 �m large with five steps ofequal dimensions. Nevertheless, due to etching prop-erties, the highest steps are no longer perfectly rec-tangular but have been attacked in the corners dur-ing manufacturing. A Plasmos SD2300 ellipsometerhas been used to accurately verify that the height ofall the steps corresponded to the designed values (er-rors below 2%). The wafer has finally been recoveredwith 10 nm chrome and 100 nm gold to ensure a totalreflection on its surface.
6. Results
The results of the tomographies are shown in Fig. 8:The tomographies obtained with the simulated holo-grams are presented on top, and on the bottom thoseobtained with the experimental holograms are shown.The heights of the six reconstructed sections are thoseof the base [Figs. 8(b), 8(B)—0 nm] and the five stepsof the specimen [Figs. 8(c), 8(C)—375, 8(d), 8(D)—525,8(e), 8(E)—975, 8(f), 8(F)—1200, and 8(g), 8(G)—1275nm]. Amplitude images, calculated as the average ofall the reconstructed �j amplitudes, are shown inFigs. 8(a) and 8(A) for both the simulated and theexperimental specimens. The presented tomographicsections clearly show the attenuation of the out-of-focus planes: They get darker as the distance to theplane of interest increases. Each step is distinct fromthe others due to the filter produced by the addition ofthe complex wavefronts. The steps that are separated
Fig. 7. Simulated target with steps of 375, 525, 975, 1200, and1275 nm.
Fig. 8. Simulated (lower-case letters) and experimental (upper-case letters) results of six reconstructed sections at 0, 375, 525, 975, 1200,1275 nm [(a), (b), (c), (d), (e), (f), respectively] as well as the specimen average amplitudes of the (a) simulated and (A) experimental targets.
8214 APPLIED OPTICS � Vol. 45, No. 32 � 10 November 2006
from the step of interest within a gap smaller thanthe axial resolution are not clearly eliminated, owingto the insufficient attenuation of the filter. The bestattenuation is obtained for a gap of 750 nm as shownin Figs. 8(d), 8(D) and 8(g), 8(G) between the second�525 nm� and the fifth �1275 nm� steps for negative[Figs. 8(d), 8(D)] or positive gaps [Figs. 8(g), 8(G)].This corresponds to the theoretical predictions wherethe first total cancellation of the filter function isobtained at 725 nm. The 750 nm gap is clearly thenearest available gap; the theoretical resolution isverified in both simulated and experimental results.
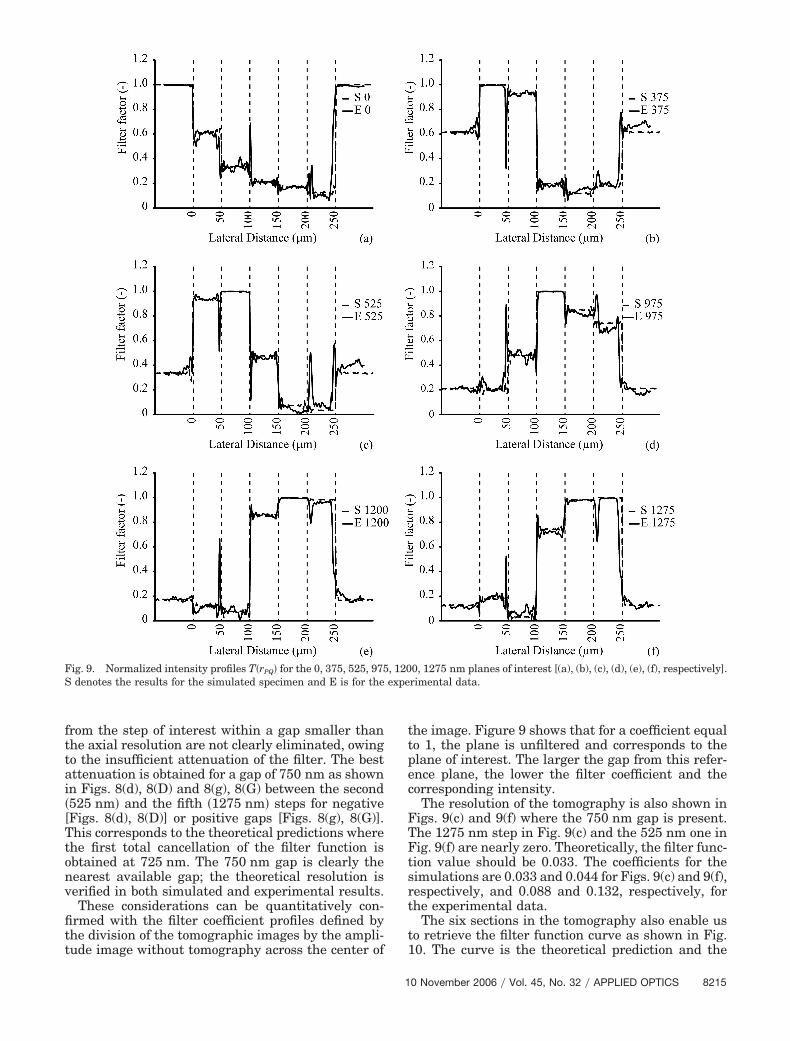
These considerations can be quantitatively con-firmed with the filter coefficient profiles defined bythe division of the tomographic images by the ampli-tude image without tomography across the center of
the image. Figure 9 shows that for a coefficient equalto 1, the plane is unfiltered and corresponds to theplane of interest. The larger the gap from this refer-ence plane, the lower the filter coefficient and thecorresponding intensity.
The resolution of the tomography is also shown inFigs. 9(c) and 9(f) where the 750 nm gap is present.The 1275 nm step in Fig. 9(c) and the 525 nm one inFig. 9(f) are nearly zero. Theoretically, the filter func-tion value should be 0.033. The coefficients for thesimulations are 0.033 and 0.044 for Figs. 9(c) and 9(f),respectively, and 0.088 and 0.132, respectively, forthe experimental data.
The six sections in the tomography also enable usto retrieve the filter function curve as shown in Fig.10. The curve is the theoretical prediction and the
Fig. 9. Normalized intensity profiles T�rPQ� for the 0, 375, 525, 975, 1200, 1275 nm planes of interest [(a), (b), (c), (d), (e), (f), respectively].S denotes the results for the simulated specimen and E is for the experimental data.
10 November 2006 � Vol. 45, No. 32 � APPLIED OPTICS 8215
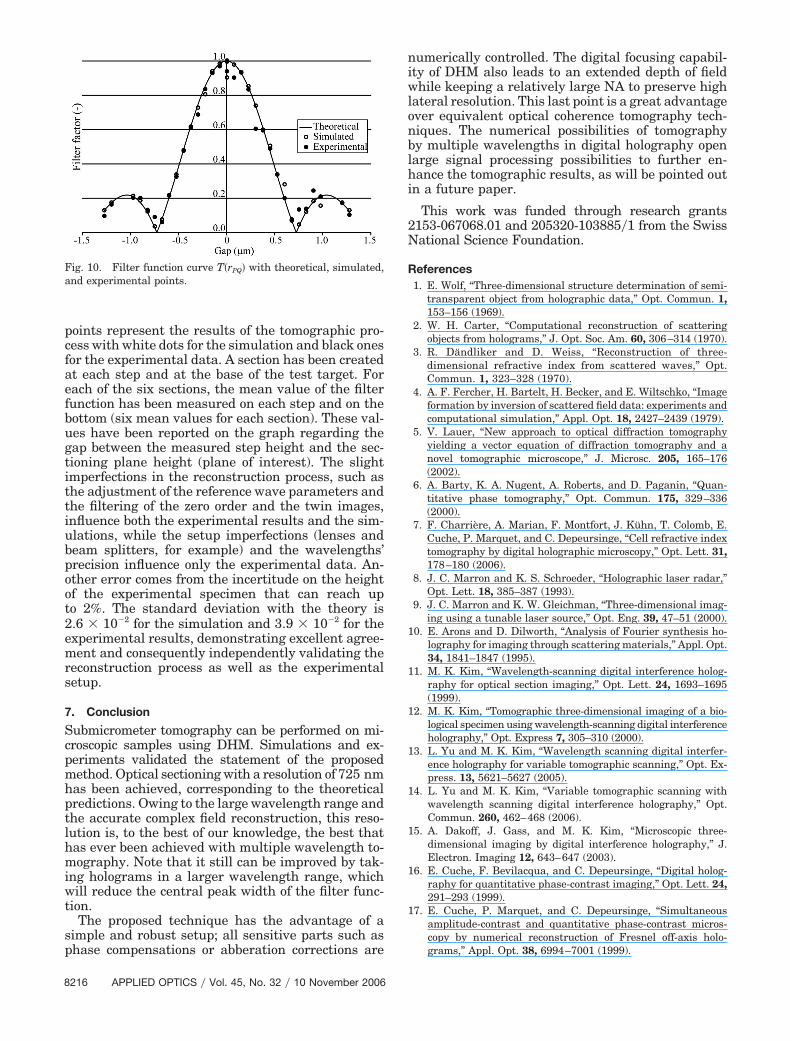
points represent the results of the tomographic pro-cess with white dots for the simulation and black onesfor the experimental data. A section has been createdat each step and at the base of the test target. Foreach of the six sections, the mean value of the filterfunction has been measured on each step and on thebottom (six mean values for each section). These val-ues have been reported on the graph regarding thegap between the measured step height and the sec-tioning plane height (plane of interest). The slightimperfections in the reconstruction process, such asthe adjustment of the reference wave parameters andthe filtering of the zero order and the twin images,influence both the experimental results and the sim-ulations, while the setup imperfections (lenses andbeam splitters, for example) and the wavelengths’precision influence only the experimental data. An-other error comes from the incertitude on the heightof the experimental specimen that can reach upto 2%. The standard deviation with the theory is2.6 � 10�2 for the simulation and 3.9 � 10�2 for theexperimental results, demonstrating excellent agree-ment and consequently independently validating thereconstruction process as well as the experimentalsetup.
7. Conclusion
Submicrometer tomography can be performed on mi-croscopic samples using DHM. Simulations and ex-periments validated the statement of the proposedmethod. Optical sectioning with a resolution of 725 nmhas been achieved, corresponding to the theoreticalpredictions. Owing to the large wavelength range andthe accurate complex field reconstruction, this reso-lution is, to the best of our knowledge, the best thathas ever been achieved with multiple wavelength to-mography. Note that it still can be improved by tak-ing holograms in a larger wavelength range, whichwill reduce the central peak width of the filter func-tion.
The proposed technique has the advantage of asimple and robust setup; all sensitive parts such asphase compensations or abberation corrections are
numerically controlled. The digital focusing capabil-ity of DHM also leads to an extended depth of fieldwhile keeping a relatively large NA to preserve highlateral resolution. This last point is a great advantageover equivalent optical coherence tomography tech-niques. The numerical possibilities of tomographyby multiple wavelengths in digital holography openlarge signal processing possibilities to further en-hance the tomographic results, as will be pointed outin a future paper.
This work was funded through research grants2153-067068.01 and 205320-103885�1 from the SwissNational Science Foundation.
References1. E. Wolf, “Three-dimensional structure determination of semi-
transparent object from holographic data,” Opt. Commun. 1,153–156 (1969).
2. W. H. Carter, “Computational reconstruction of scatteringobjects from holograms,” J. Opt. Soc. Am. 60, 306–314 (1970).
3. R. Dändliker and D. Weiss, “Reconstruction of three-dimensional refractive index from scattered waves,” Opt.Commun. 1, 323–328 (1970).
4. A. F. Fercher, H. Bartelt, H. Becker, and E. Wiltschko, “Imageformation by inversion of scattered field data: experiments andcomputational simulation,” Appl. Opt. 18, 2427–2439 (1979).
5. V. Lauer, “New approach to optical diffraction tomographyyielding a vector equation of diffraction tomography and anovel tomographic microscope,” J. Microsc. 205, 165–176(2002).
6. A. Barty, K. A. Nugent, A. Roberts, and D. Paganin, “Quan-titative phase tomography,” Opt. Commun. 175, 329–336(2000).
7. F. Charrière, A. Marian, F. Montfort, J. Kühn, T. Colomb, E.Cuche, P. Marquet, and C. Depeursinge, “Cell refractive indextomography by digital holographic microscopy,” Opt. Lett. 31,178–180 (2006).
8. J. C. Marron and K. S. Schroeder, “Holographic laser radar,”Opt. Lett. 18, 385–387 (1993).
9. J. C. Marron and K. W. Gleichman, “Three-dimensional imag-ing using a tunable laser source,” Opt. Eng. 39, 47–51 (2000).
10. E. Arons and D. Dilworth, “Analysis of Fourier synthesis ho-lography for imaging through scattering materials,” Appl. Opt.34, 1841–1847 (1995).
11. M. K. Kim, “Wavelength-scanning digital interference holog-raphy for optical section imaging,” Opt. Lett. 24, 1693–1695(1999).
12. M. K. Kim, “Tomographic three-dimensional imaging of a bio-logical specimen using wavelength-scanning digital interferenceholography,” Opt. Express 7, 305–310 (2000).
13. L. Yu and M. K. Kim, “Wavelength scanning digital interfer-ence holography for variable tomographic scanning,” Opt. Ex-press. 13, 5621–5627 (2005).
14. L. Yu and M. K. Kim, “Variable tomographic scanning withwavelength scanning digital interference holography,” Opt.Commun. 260, 462–468 (2006).
15. A. Dakoff, J. Gass, and M. K. Kim, “Microscopic three-dimensional imaging by digital interference holography,” J.Electron. Imaging 12, 643–647 (2003).
16. E. Cuche, F. Bevilacqua, and C. Depeursinge, “Digital holog-raphy for quantitative phase-contrast imaging,” Opt. Lett. 24,291–293 (1999).
17. E. Cuche, P. Marquet, and C. Depeursinge, “Simultaneousamplitude-contrast and quantitative phase-contrast micros-copy by numerical reconstruction of Fresnel off-axis holo-grams,” Appl. Opt. 38, 6994–7001 (1999).
Fig. 10. Filter function curve T�rPQ� with theoretical, simulated,and experimental points.
8216 APPLIED OPTICS � Vol. 45, No. 32 � 10 November 2006
18. T. Colomb, E. Cuche, F. Charrière, J. Kühn, N. Aspert, F.Montfort, P. Marquet, and C. Depeursinge, “Automatic proce-dure for aberration compensation in digital holographic mi-croscopy and applications to specimen shape compensation,”Appl. Opt. 45, 851–863 (2006).
19. T. Colomb, J. Kühn, F. Charrière, C. Depeursinge, P. Marquet,and N. Aspert, “Total aberrations compensation in digital ho-lographic microscopy with a reference conjugated hologram,”Opt. Express 14, 4300–4306 (2006).
20. T. Colomb, F. Montfort, J. Kühn, N. Aspert, E. Cuche, A.Marian, F. Charrière, S. Bourquin, P. Marquet, and C. Depeur-singe, “Numerical parametric lens for shifting, magnification,and complete aberration compensation in digital holographicmicroscopy,” J. Opt. Soc. Am. A 23 (2006).
21. P. Ferraro, S. D. Nicola, G. Coppola, A. Finizio, D. Alfieri, andG. Pierattini, “Controlling image size as a function of distanceand wavelength in Fresnel-transform reconstruction of digitalholograms,” Opt. Lett. 29, 854–856 (2004).
22. E. Cuche, P. Marquet, and C. Depeursinge, “Spatial filteringfor zero-order and twin-image elimination in digital off-axisholography,” Appl. Opt. 39, 4070–4075 (2000).
23. F. Montfort, F. Charrière, T. Colomb, E. Cuche, P. Marquet,and C. Depeursinge, “Purely numerical correction of the mi-croscope objective induced curvature in digital holographic mi-croscopy,” J. Opt. Soc. Am. A 23, 2944–2953 (2006).
24. M. K. Kim, L. Yu, and C. J. Mann, “Interference techniques indigital holography,” J. Opt. A, Pure Appl. Opt. 8, S518–S523(2006).
10 November 2006 � Vol. 45, No. 32 � APPLIED OPTICS 8217
Related Documents


