Ref: GIS Math G 10 C.D. 2015-2016 2011-2012 SUBJECT : Math TITLE OF COURSE : Algebra 2 GRADE LEVEL : 10 DURATION : ONE YEAR NUMBER OF CREDITS : 1.25 Goals: Expressions: An expression is a record of a computation with numbers, symbols that represent numbers, arithmetic operations, exponentiation, and, at more advanced levels, the operation of evaluating a function. Conventions about the use of parentheses and the order of operations assure that each expression is unambiguous. Creating an expression that describes a computation involving a general quantity requires the ability to express the computation in general terms, abstracting from specific instances. Reading an expression with comprehension involves analysis of its underlying structure. This may suggest a different but equivalent way of writing the expression that exhibits some different aspect of its meaning. For example, p + 0.05p can be interpreted as the addition of a 5% tax to a price p. Rewriting p + 0.05p as 1.05p shows that adding a tax is the same as multiplying the price by a constant factor. Algebraic manipulations are governed by the properties of operations and exponents, and the conventions of algebraic notation. At times, an expression is the result of applying operations to simpler expressions. For example, p + 0.05p is the sum of the simpler expressions p and 0.05p. Viewing an expression as the result of operation on simpler expressions can sometimes clarify its underlying structure. A spreadsheet or a computer algebra system (CAS) can be used to experiment with algebraic expressions, perform complicated algebraic manipulations, and understand how algebraic manipulations behave.

Welcome message from author
This document is posted to help you gain knowledge. Please leave a comment to let me know what you think about it! Share it to your friends and learn new things together.
Transcript

Ref: GIS Math G 10 C.D. 2015-2016
2011-2012
SUBJECT : Math TITLE OF COURSE : Algebra 2
GRADE LEVEL : 10
DURATION : ONE YEAR
NUMBER OF CREDITS : 1.25
Goals:
Expressions:
An expression is a record of a computation with numbers, symbols that represent
numbers, arithmetic operations, exponentiation, and, at more advanced levels, the
operation of evaluating a function. Conventions about the use of parentheses and the
order of operations assure that each expression is unambiguous. Creating an expression
that describes a computation involving a general quantity requires the ability to express
the computation in general terms, abstracting from specific instances.
Reading an expression with comprehension involves analysis of its underlying structure.
This may suggest a different but equivalent way of writing the expression that exhibits
some different aspect of its meaning. For example, p + 0.05p can be interpreted as the
addition of a 5% tax to a price p. Rewriting p + 0.05p as 1.05p shows that adding a tax is
the same as multiplying the price by a constant factor.
Algebraic manipulations are governed by the properties of operations and exponents, and
the conventions of algebraic notation. At times, an expression is the result of applying
operations to simpler expressions. For example, p + 0.05p is the sum of the simpler
expressions p and 0.05p. Viewing an expression as the result of operation on simpler
expressions can sometimes clarify its underlying structure.
A spreadsheet or a computer algebra system (CAS) can be used to experiment with
algebraic expressions, perform complicated algebraic manipulations, and understand
how algebraic manipulations behave.
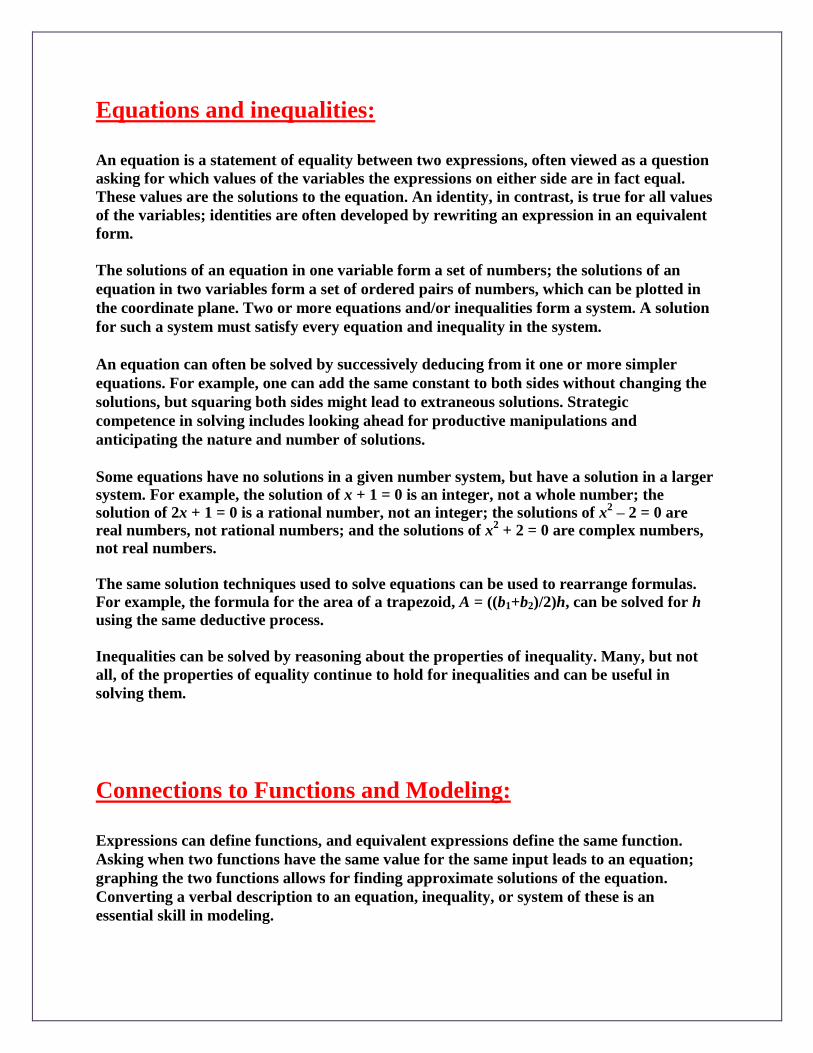
Equations and inequalities:
An equation is a statement of equality between two expressions, often viewed as a question
asking for which values of the variables the expressions on either side are in fact equal.
These values are the solutions to the equation. An identity, in contrast, is true for all values
of the variables; identities are often developed by rewriting an expression in an equivalent
form.
The solutions of an equation in one variable form a set of numbers; the solutions of an
equation in two variables form a set of ordered pairs of numbers, which can be plotted in
the coordinate plane. Two or more equations and/or inequalities form a system. A solution
for such a system must satisfy every equation and inequality in the system.
An equation can often be solved by successively deducing from it one or more simpler
equations. For example, one can add the same constant to both sides without changing the
solutions, but squaring both sides might lead to extraneous solutions. Strategic
competence in solving includes looking ahead for productive manipulations and
anticipating the nature and number of solutions.
Some equations have no solutions in a given number system, but have a solution in a larger
system. For example, the solution of x + 1 = 0 is an integer, not a whole number; the
solution of 2x + 1 = 0 is a rational number, not an integer; the solutions of x2 – 2 = 0 are
real numbers, not rational numbers; and the solutions of x2 + 2 = 0 are complex numbers,
not real numbers.
The same solution techniques used to solve equations can be used to rearrange formulas.
For example, the formula for the area of a trapezoid, A = ((b1+b2)/2)h, can be solved for h
using the same deductive process.
Inequalities can be solved by reasoning about the properties of inequality. Many, but not
all, of the properties of equality continue to hold for inequalities and can be useful in
solving them.
Connections to Functions and Modeling:
Expressions can define functions, and equivalent expressions define the same function.
Asking when two functions have the same value for the same input leads to an equation;
graphing the two functions allows for finding approximate solutions of the equation.
Converting a verbal description to an equation, inequality, or system of these is an
essential skill in modeling.
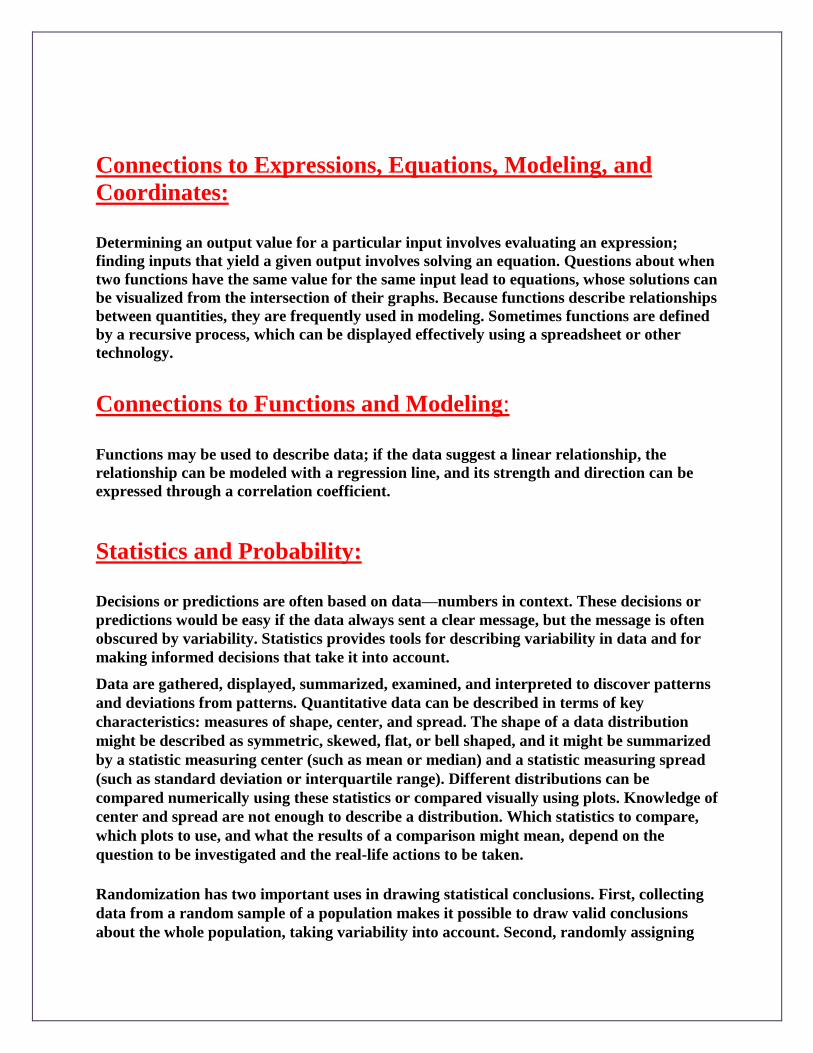
Connections to Expressions, Equations, Modeling, and
Coordinates:
Determining an output value for a particular input involves evaluating an expression;
finding inputs that yield a given output involves solving an equation. Questions about when
two functions have the same value for the same input lead to equations, whose solutions can
be visualized from the intersection of their graphs. Because functions describe relationships
between quantities, they are frequently used in modeling. Sometimes functions are defined
by a recursive process, which can be displayed effectively using a spreadsheet or other
technology.
Connections to Functions and Modeling:
Functions may be used to describe data; if the data suggest a linear relationship, the
relationship can be modeled with a regression line, and its strength and direction can be
expressed through a correlation coefficient.
Statistics and Probability:
Decisions or predictions are often based on data—numbers in context. These decisions or
predictions would be easy if the data always sent a clear message, but the message is often
obscured by variability. Statistics provides tools for describing variability in data and for
making informed decisions that take it into account. Data are gathered, displayed, summarized, examined, and interpreted to discover patterns
and deviations from patterns. Quantitative data can be described in terms of key
characteristics: measures of shape, center, and spread. The shape of a data distribution
might be described as symmetric, skewed, flat, or bell shaped, and it might be summarized
by a statistic measuring center (such as mean or median) and a statistic measuring spread
(such as standard deviation or interquartile range). Different distributions can be
compared numerically using these statistics or compared visually using plots. Knowledge of
center and spread are not enough to describe a distribution. Which statistics to compare,
which plots to use, and what the results of a comparison might mean, depend on the
question to be investigated and the real-life actions to be taken.
Randomization has two important uses in drawing statistical conclusions. First, collecting
data from a random sample of a population makes it possible to draw valid conclusions
about the whole population, taking variability into account. Second, randomly assigning

individuals to different treatments allows a fair comparison of the effectiveness of those
treatments. A statistically significant outcome is one that is unlikely to be due to chance
alone, and this can be evaluated only under the condition of randomness. The conditions
under which data are collected are important in drawing conclusions from the data; in
critically reviewing uses of statistics in public media and other reports, it is important to
consider the study design, how the data were gathered, and the analyses employed as well
as the data summaries and the conclusions drawn.
Random processes can be described mathematically by using a probability model: a list or
description of the possible outcomes (the sample space), each of which is assigned a
probability. In situations such as flipping a coin, rolling a number cube, or drawing a card,
it might be reasonable to assume various outcomes are equally likely. In a probability
model, sample points represent outcomes and combine to make up events; probabilities of
events can be computed by applying the Addition and Multiplication Rules. Interpreting
these probabilities relies on an understanding of independence and conditional probability,
which can be approached through the analysis of two-way tables.
Technology plays an important role in statistics and probability by making it possible to
generate plots, regression functions, and correlation coefficients, and to simulate many
possible outcomes in a short amount of time.
Resources:
1- HMH Algebra 2 text book.
2- Online resources
3- HMH attached resources CD’S (lesson tutorial videos, power point presentations,
one stop planer,…..)
4- Internet.
5- E-games and links
6- Teacher’s Handouts

Course Content and Objectives:
Unit 9: Statistics:
Unit Objectives:
Statistics
Gathering and displaying data
Shape, center, and spread
Data distributions
Confidence intervals and margins of error
Module 22: Gathering and displaying data Lesson 22.1: Data-Gathering techniques
Lesson 22.2: Shape, center, and spread
Module 23: Data Distributions Lesson 23.1: Probability distributions
Lesson 23.2: Normal Distributions
Lesson 23.3: Sampling Distributions
Module 24: Making inferences from data Lesson 24.1: Confidence intervals and margins of error
Lesson 24.2: Surveys, experiments, and observational studies
Lesson 24.3: Determining the significance of experimental results
Unit 8: Probability:
Unit Objectives:
Probability and set theory
Permutations and combinations
Independent and dependent events
Using probability to make fair decisions
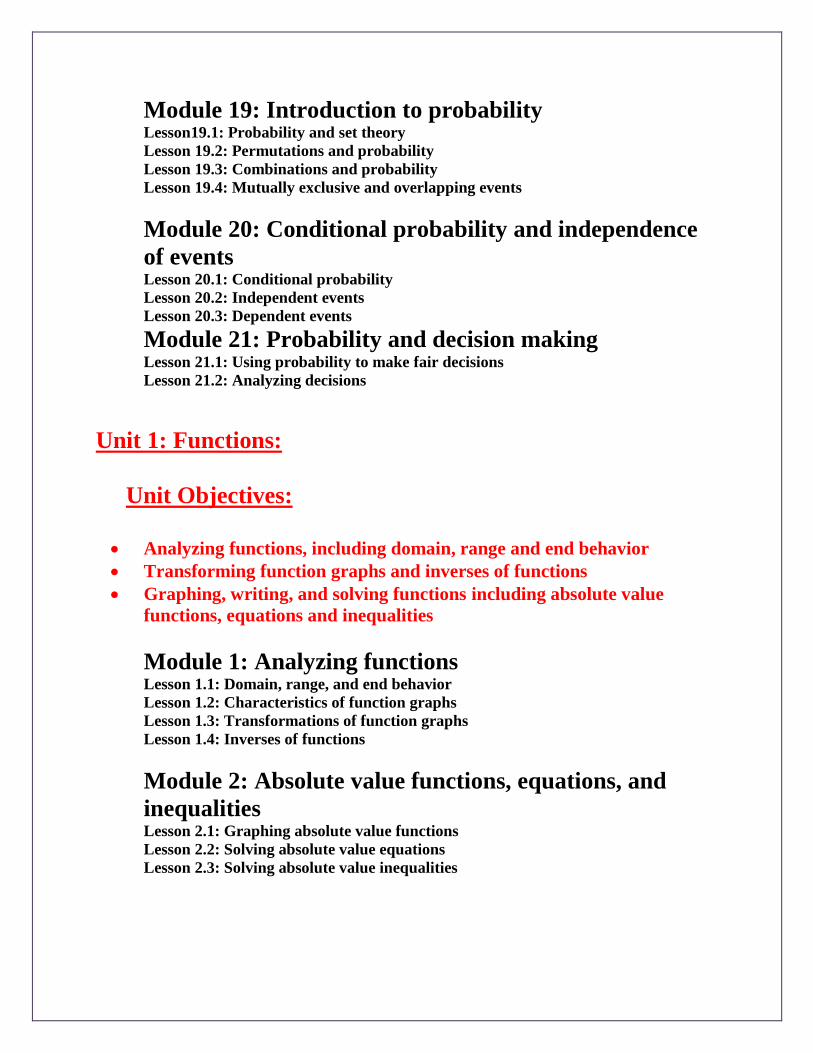
Module 19: Introduction to probability Lesson19.1: Probability and set theory
Lesson 19.2: Permutations and probability
Lesson 19.3: Combinations and probability
Lesson 19.4: Mutually exclusive and overlapping events
Module 20: Conditional probability and independence
of events Lesson 20.1: Conditional probability
Lesson 20.2: Independent events
Lesson 20.3: Dependent events
Module 21: Probability and decision making Lesson 21.1: Using probability to make fair decisions
Lesson 21.2: Analyzing decisions
Unit 1: Functions:
Unit Objectives:
Analyzing functions, including domain, range and end behavior
Transforming function graphs and inverses of functions
Graphing, writing, and solving functions including absolute value
functions, equations and inequalities
Module 1: Analyzing functions Lesson 1.1: Domain, range, and end behavior
Lesson 1.2: Characteristics of function graphs
Lesson 1.3: Transformations of function graphs
Lesson 1.4: Inverses of functions
Module 2: Absolute value functions, equations, and
inequalities Lesson 2.1: Graphing absolute value functions
Lesson 2.2: Solving absolute value equations
Lesson 2.3: Solving absolute value inequalities

Unit 2: Quadratic functions, equations, and relations:
Unit Objectives:
Quadratic equations
Complex numbers
Ways of solving quadratic equations
Circles and parabolas
Solving linear-quadratic systems of equations, linear systems in three
variables
Module 3: Quadratic equations and inequalities Lesson 3.1: Solving quadratic equations by taking square roots
Lesson 3.2: Complex numbers
Lesson 3.3: Finding complex solutions of quadratic equations
Module 4: Quadratic relations and systems of equations Lesson 4.1: Circles
Lesson 4.2: Parabolas
Lesson 4.3: Solving linear-quadratic systems
Lesson 4.4: Solving linear systems in three variables
Unit 3: Polynomial functions, expressions, and equations:
Unit Objectives:
Polynomial functions, expressions, and equations
Operations with polynomials
Finding rational solutions of polynomial equations
Finding complex solutions of polynomial equations
Module 5: Polynomial functions Lesson 5.1: Graphing cubic functions
Lesson 5.2: Graphing polynomial functions

Module 6: Polynomials Lesson 6.1: Adding and subtracting polynomials
Lesson 6.2: Multiplying polynomials
Lesson 6.3: The binomial theorem
Lesson 6.4: Factoring polynomials
Lesson 6.5: Dividing polynomials
Unit 4: Rational functions, expressions, and equations:
Unit Objectives:
Graphing rational functions
Adding and subtracting rational expressions
Multiplying and dividing rational expressions
Graphing and solving rational equations
Module 8: Rational functions Lesson 8.1: Graphing simple rational functions
Lesson 8.2: Graphing more complicated rational functions
Module 9: Rational expressions and equations Lesson 9.1: Adding and subtracting rational expressions
Lesson 9.2: Multiplying and dividing rational expressions
Lesson 9.3: Solving rational equations
Course Sequence
Term 1:
Module 22: Gathering and displaying data
Lesson 22.1: Data-Gathering techniques
Lesson 22.2: Shape, center, and spread
Module 23: Data Distributions Lesson 23.1: Probability distributions
Lesson 23.2: Normal Distributions
Lesson 23.3: Sampling Distributions

Module 24: Making inferences from data Lesson 24.1: Confidence intervals and margins of error
Lesson 24.2: Surveys, experiments, and observational studies
Lesson 24.3: Determining the significance of experimental results
Module 19: Introduction to probability Lesson19.1: Probability and set theory
Lesson 19.2: Permutations and probability
Lesson 19.3: Combinations and probability
Lesson 19.4: Mutually exclusive and overlapping events
Module 20: Conditional probability and independence of events Lesson 20.1: Conditional probability
Lesson 20.2: Independent events
Lesson 20.3: Dependent events
Module 21: Probability and decision making Lesson 21.1: Using probability to make fair decisions
Lesson 21.2: Analyzing decisions
Module 1: Analyzing functions Lesson 1.1: Domain, range, and end behavior
Lesson 1.2: Characteristics of function graphs
Lesson 1.3: Transformations of function graphs
Lesson 1.4: Inverses of functions
Term 2:
Module 2: Absolute value functions, equations, and inequalities
Lesson 2.1: Graphing absolute value functions
Lesson 2.2: Solving absolute value equations
Lesson 2.3: Solving absolute value inequalities
Module 3: Quadratic equations and inequalities Lesson 3.1: Solving quadratic equations by taking square roots
Lesson 3.2: Complex numbers
Lesson 3.3: Finding complex solutions of quadratic equations

Module 4: Quadratic relations and systems of equations Lesson 4.1: Circles
Lesson 4.2: Parabolas
Lesson 4.3: Solving linear-quadratic systems
Lesson 4.4: Solving linear systems in three variables
Module 5: Polynomial functions Lesson 5.1: Graphing cubic functions
Lesson 5.2: Graphing polynomial functions
Module 6: Polynomials Lesson 6.1: Adding and subtracting polynomials
Lesson 6.2: Multiplying polynomials
Lesson 6.3: The binomial theorem
Lesson 6.4: Factoring polynomials
Lesson 6.5: Dividing polynomials
Term 3:
Module 8: Rational functions
Lesson 8.1: Graphing simple rational functions
Lesson 8.2: Graphing more complicated rational functions
Module 9: Rational expressions and equations Lesson 9.1: Adding and subtracting rational expressions
Lesson 9.2: Multiplying and dividing rational expressions
Lesson 9.3: Solving rational equations
Assessment Tools and Strategies:
Strategieso 1
st The students will be provided with study guides or mock tests on the school
website in the students portal, based on our curriculum manual, bench marks and
objectives before every quiz, test, or exam.
o 2nd
The students will be tested based on what they have practiced at home from
the study guides or mock tests mentioned before.
o 3rd
The evaluation will be based on what objectives did the students achieve, and
in what objectives do they need help, through the detailed report that will be sent
to the parents once during the semester and once again with the report card.
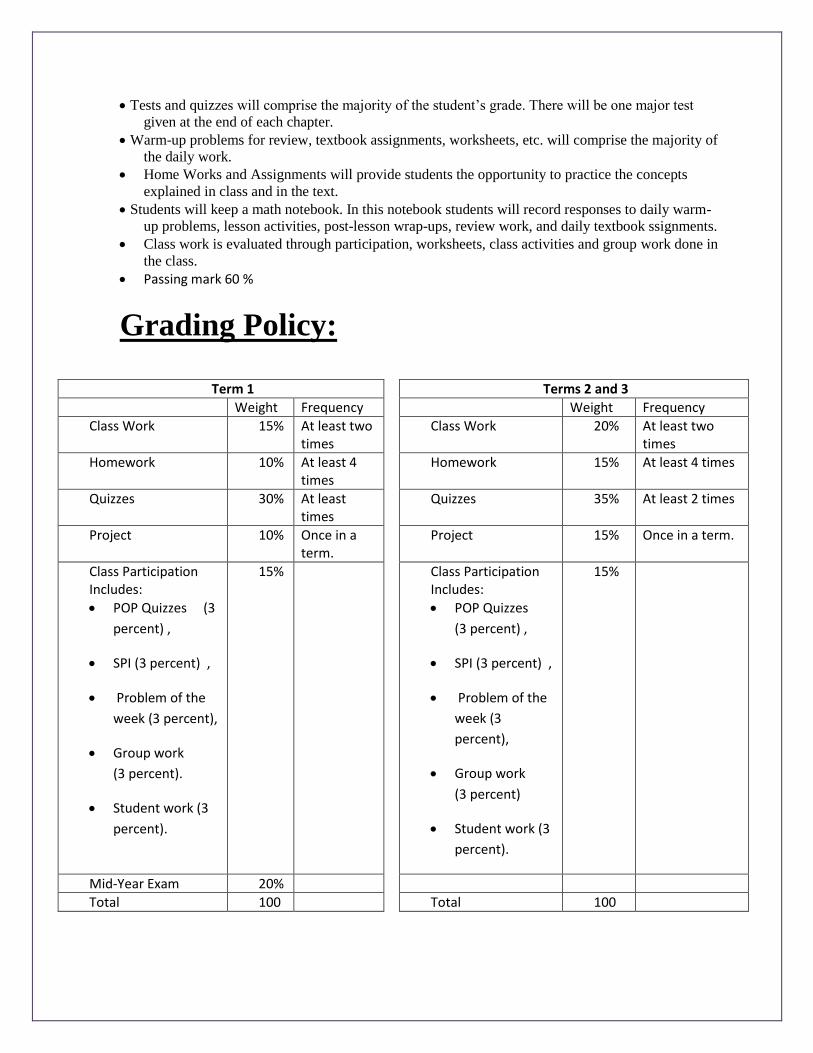
Tests and quizzes will comprise the majority of the student’s grade. There will be one major test
given at the end of each chapter.
Warm-up problems for review, textbook assignments, worksheets, etc. will comprise the majority of
the daily work.
Home Works and Assignments will provide students the opportunity to practice the concepts
explained in class and in the text.
Students will keep a math notebook. In this notebook students will record responses to daily warm-
up problems, lesson activities, post-lesson wrap-ups, review work, and daily textbook ssignments.
Class work is evaluated through participation, worksheets, class activities and group work done in
the class.
Passing mark 60 %
Grading Policy:
Term 1 Terms 2 and 3
Weight Frequency Weight Frequency
Class Work 15% At least two times
Class Work 20% At least two times
Homework 10% At least 4 times
Homework 15% At least 4 times
Quizzes 30% At least times
Quizzes 35% At least 2 times
Project 10% Once in a term.
Project 15% Once in a term.
Class Participation Includes:
POP Quizzes (3
percent) ,
SPI (3 percent) ,
Problem of the
week (3 percent),
Group work
(3 percent).
Student work (3
percent).
15% Class Participation Includes:
POP Quizzes
(3 percent) ,
SPI (3 percent) ,
Problem of the
week (3
percent),
Group work
(3 percent)
Student work (3
percent).
15%
Mid-Year Exam 20%
Total 100 Total 100
Performance Areas (skills).
Evaluation, graphing, Application, and Analysis of the Mathematical concepts and relating them to daily life, through solving exercises, word problems and applications...
Communication and social skills: through group work, or presentation of their own work.
Technology skills: using digital resources and graphic calculators or computers to solve problems or present their work.
Note: The following student materials are required for this class: Graph paper.
Scientific Calculator (Casio fx-991 ES Plus)
Graph papers.
Done by Wissam Jamal Ezzeddine Math Teacher for grade 9 & 10
Related Documents