SUBDUCTION TECTONICS, SUBDUCTION TECTONICS, MAGMATISM AND SURFACE HEAT MAGMATISM AND SURFACE HEAT FLOW IN THE ANDEAN ARC FLOW IN THE ANDEAN ARC Will Gosnold and Shan de Will Gosnold and Shan de Silva Silva

SUBDUCTION TECTONICS, MAGMATISM AND SURFACE HEAT FLOW IN THE ANDEAN ARC Will Gosnold and Shan de Silva.
Dec 19, 2015
Welcome message from author
This document is posted to help you gain knowledge. Please leave a comment to let me know what you think about it! Share it to your friends and learn new things together.
Transcript

SUBDUCTION TECTONICS, SUBDUCTION TECTONICS, MAGMATISM AND SURFACE MAGMATISM AND SURFACE
HEAT FLOW IN THE ANDEAN ARCHEAT FLOW IN THE ANDEAN ARC
Will Gosnold and Shan de SilvaWill Gosnold and Shan de Silva

Overview
• HFD data
• Data treatment
• Characteristics of each HFD profile
• Tectonic history
• Tectonic models

The Global Heat Flow Database of the International Heat Flow CommissionClick on the globe to enter
Global Heat Flow ( mW m^2) : 0-40 violet, 40-80 blue,
80-120 green, 120-240 yellow, 240+ red
www.heatflow.und.edu

Continents and Oceans
Africaxls or ASCII
Asiaxls or ASCII
Antarctica Australia
xls or ASCII
North America
xls or ASCIIGlobal in RTF format
Europexls or ASCII
South America
xls or ASCII
Eastern North Pacific
Western North Pacific
Western South Pacific
Continental Data
xls or ASCII
Eastern South Pacific
North Atlantic Ocean
xls or ASCII
Indian Ocean
Mediterranean area seas
Oceanic References
Marine Data
xls or ASCII
www.heatflow.und.edu

CountriesNorth America & South America
Argentinaxls or ASCII
Bermudaxls or ASCII
Boliviaxls or ASCII
Brazilxls or ASCII
Canadaxls or ASCII
Chilexls or ASCII
Columbiaxls or ASCII
Cubaxls or ASCII
Ecuadorxls or ASCII
Mexicoxls or ASCII
Panamaxls or ASCII
Peruxls or ASCII
Puerto Ricoxls or ASCII
USAxls or ASCII
www.heatflow.und.edu

Residual Heat Flow Density contour map of South America (Hamza et al., 2005)

Locations of active volcanoes (red triangles) and heat flow sites in South America. Light blue sites are in low-angle subduction area; purple sites are in the high angle subduction area.


0
50
100
150
200
250
300
350
400
0 1000 2000 3000 4000 5000 6000
Distance (km)
mW
m-2
Unsmoothed HFD
Smoothed HFD
The data were smoothed using a 10-point running mean of heat flow density vs. distance from the volcanic front.
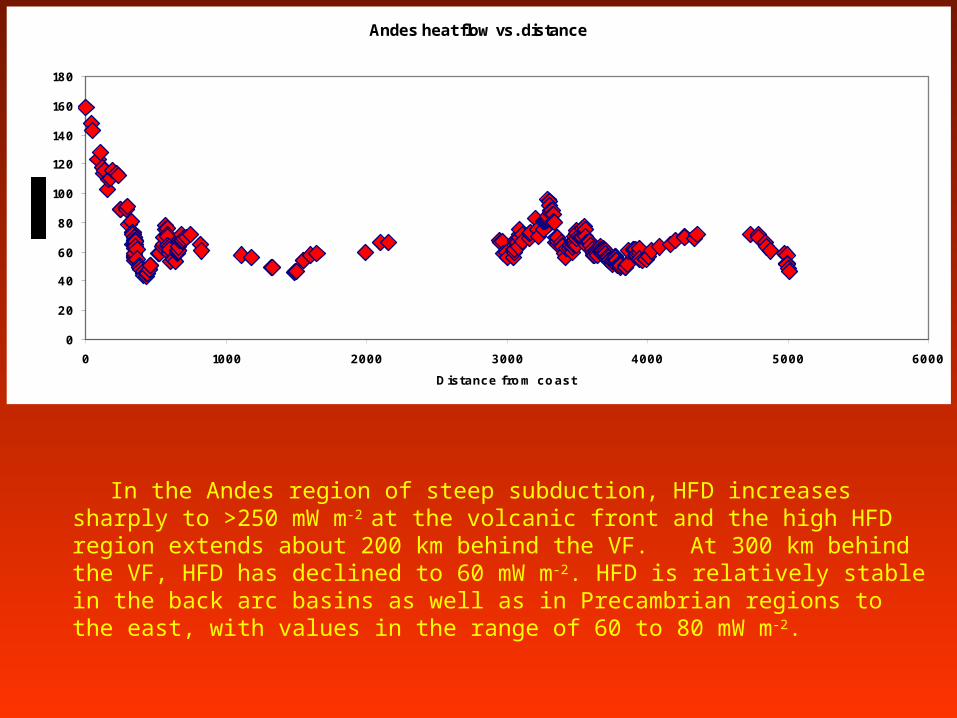
Andes heat flow vs. distance
0
20
40
60
80
100
120
140
160
180
0 1000 2000 3000 4000 5000 6000
Distance from coast
In the Andes region of steep subduction, HFD increases sharply to >250 mW m-2 at the volcanic front and the high HFD region extends about 200 km behind the VF. At 300 km behind the VF, HFD has declined to 60 mW m-2. HFD is relatively stable in the back arc basins as well as in Precambrian regions to the east, with values in the range of 60 to 80 mW m-2.

In the Andes region with sub-horizontal subduction, the transition from magmatic arc to craton is indistinguishable from normal crustal HFD variability due to age and radioactive heat production.
0
10
20
30
40
50
60
70
80
90
100
0 500 1000 1500 2000 2500 3000 3500 4000 4500 5000
Distance (km)
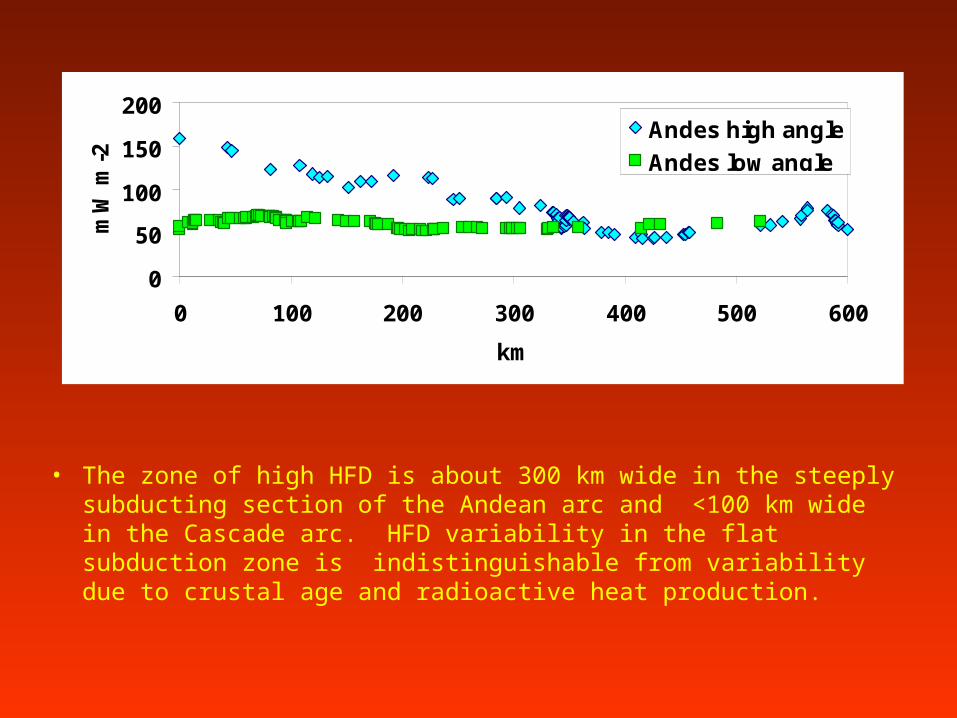
• The zone of high HFD is about 300 km wide in the steeply subducting section of the Andean arc and <100 km wide in the Cascade arc. HFD variability in the flat subduction zone is indistinguishable from variability due to crustal age and radioactive heat production.
0
50
100
150
200
0 100 200 300 400 500 600
km
mW
m-2
Andes high angle
Andes low angle
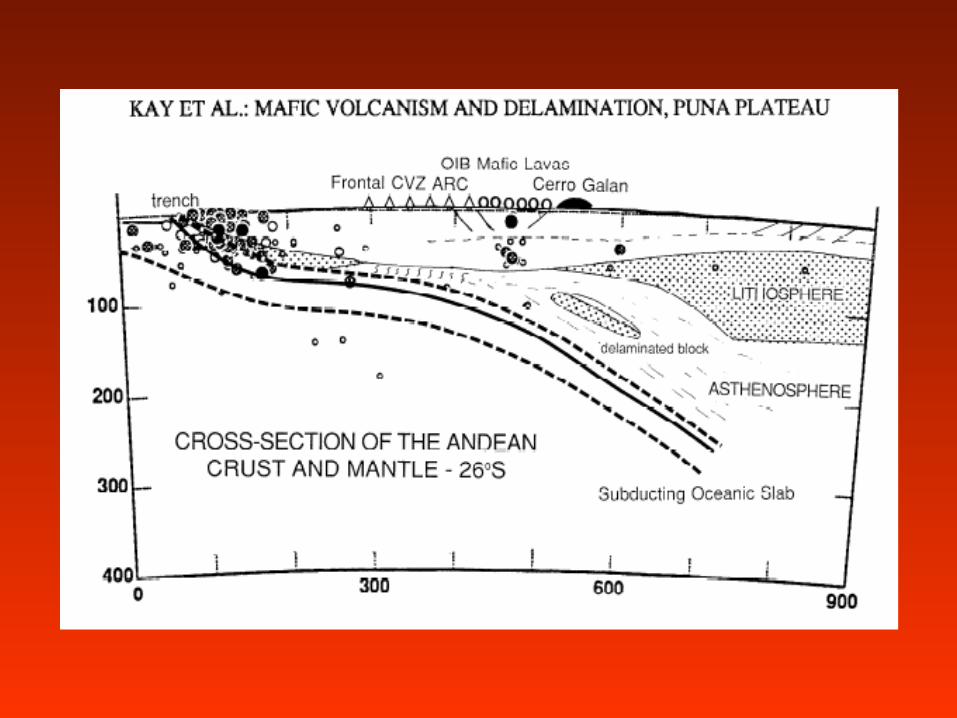

Tectonic scheme for Altiplano-Puna Volcanic Complex
• 30 ma - Crustal doubling • 13 ma – Delamination event• 10 ma – Initiation of pulsed emplacement of
upper to mid-crustal magmas which fueled eruption of at least 30,000 km3 of ignimbrites
• 10 ma – emplacement of 1,500 km3
• 8 ma – emplacement of 2,500 km3
• 6 ma – emplacement of 5,400 km3
• 4 ma – emplacement of 10,000 km3

Sources of anomalously high heat flow
1. Long-period of conductive heating
2. Magmatism in middle and upper crust

Temperature contours 13 my after delamination.
Magma emplacement in the upper crust is necessary to account for observed heat flow.
0 50000 100000 150000 200000 250000 300000-60000
-40000
-20000
0
0 50000 100000 150000 200000 250000 300000-60000
-40000
-20000
0
meters
meters
meters
meters

0
200
400
600
800
1000
1200
1400
1600
1800
0 10 20 30 40 50 60 70
Depth (km)
Deg
C
0
10
20
30
40
50
60
70
80
90
mW
m-2
Initial Tz
Tz at present
Initial HFD profile
HFD vs depth at present
Can we detect the delamination event at 13 ma?

0
200
400
600
800
1000
1200
1400
1600
1800
0 10 20 30 40 50 60 70
Depth (km)
Deg
C
0
10
20
30
40
50
60
70
80
90
mW
m-2
Initial Tz
Tz at present
Initial HFD profile
HFD vs depth at present
Can we detect the delamination event at 13 ma using surface heat flow?
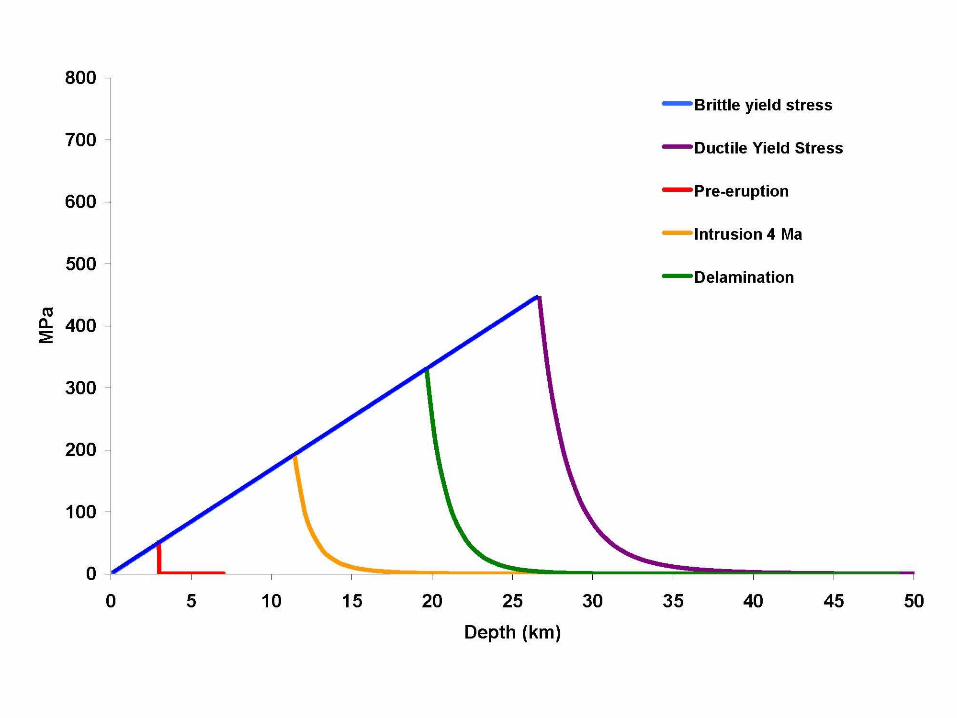
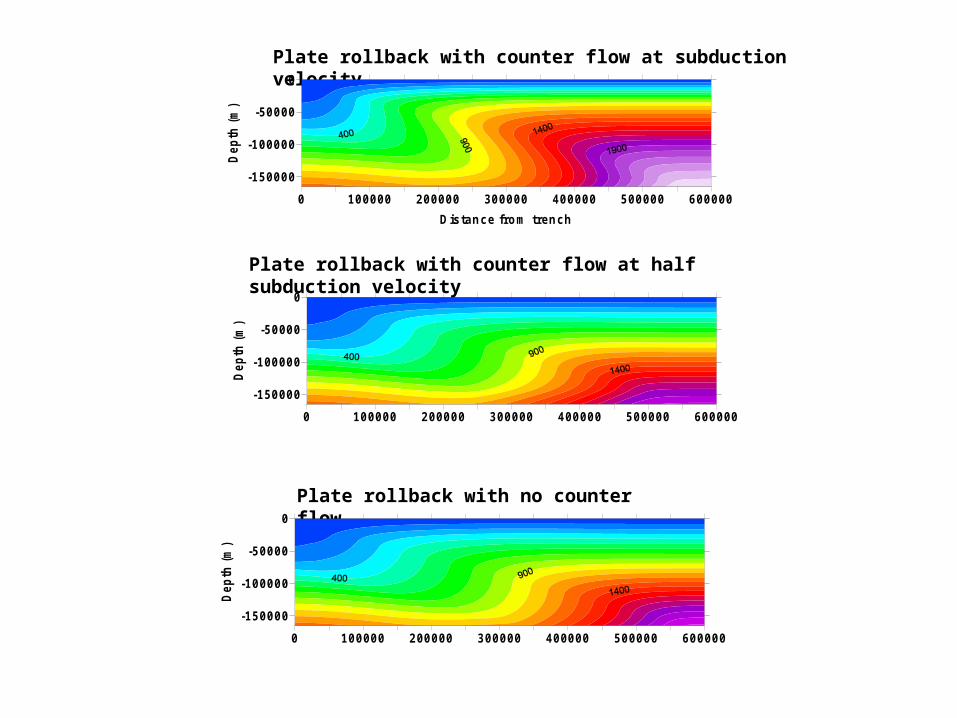
Plate rollback with counter flow at subduction velocity
Plate rollback with counter flow at half subduction velocity
Plate rollback with no counter flow
0 100000 200000 300000 400000 500000 600000
-150000
-100000
-50000
0
Dep
th (
m)
0 100000 200000 300000 400000 500000 600000
-150000
-100000
-50000
0
Dep
th (
m)
0 100000 200000 300000 400000 500000 600000
Distance from trench
-150000
-100000
-50000
0
Dep
th (
m)

0
200
400
600
800
1000
1200
1400
0 20 40 60 80 100
Depth (km)
Deg C
Initial
8ma
6ma
4ma
Present

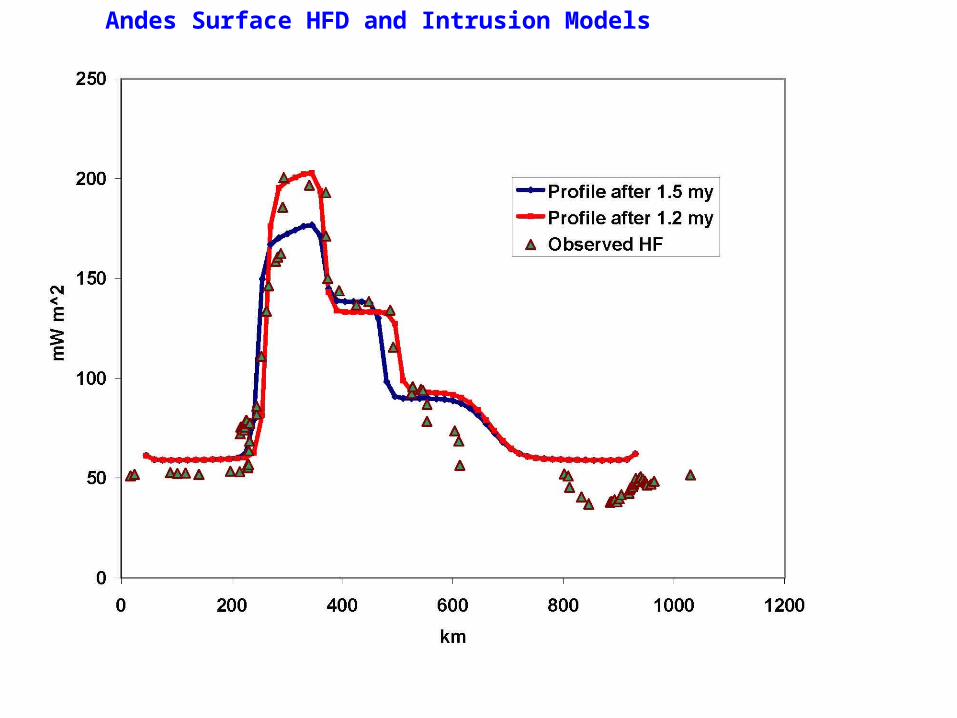
Andes Surface HFD and Intrusion Models

0
100
200
300400
500
600
700
800
0 10 20 30 40 50
Depth (km)
MP
a
Brittle yield stress
Ductile Yield Stress
Pre-eruption
Intrusion 4 Ma
Delamination

0
20
40
60
80
100
120
140
0 50 100 150 200 250 300 350 400 450
Distance (km)
Cascades HFD profile

Locations of active volcanoes (red triangles) and HFD sites in South America. Light blue sites are in low-angle subduction area; purple sites are in the high angle subduction area.

Locations of HFD sites (purple circles) and active Volcanoes (red triangles) in Cascade range.

0
50
100
150
200
0 1000 2000 3000 4000 5000
km
mW
m-2
Andes high angle
Andes low angle
Cascades
Conclusions
In all cases, the high HFD belt coincides with the zone of active volcanism and the amplitude of the HFD anomaly appears to correlate with the angle of subduction. Variable width of the high HFD zones is interpreted to be related to differences in thickness and composition of the local crust, and to the duration of subduction.

• The sharpness of changes in HFD is due to magma emplacement within the past 4 my.
• The overprint of near surface magmatism masks the thermal effects of delamination.
Special acknowledgement of volcanologist Shanaka deSilva for consultation on volcano-tectonic history.
Related Documents