Sub-THz complex dielectric constants of smectite clay thin samples with Na + /Ca ++ -ions Rezwanur Rahman, 1,2,3 Douglas K. McCarty, 4 Manika Prasad, 2,3 1 Department of Physics, Colorado School of Mines, Golden, CO 80401-1887, USA 2 Department of Petroleum Engineering, Colorado School of Mines, Golden, CO 80401-1887, USA 3 OCLASSH, Department of Petroleum Engineering, Colorado School of Mines, Golden, CO 80401-1887, USA 4 Chevron ETC, 3901 Briarpark, Houston, TX 77402, USA This article has been accepted for publication and undergone full peer review but has not been through the copyediting, typesetting, pagination and proofreading process, which may lead to differences between this version and the Version of Record. Please cite this article as doi: 10.1002/2015JB011956 c 2015 American Geophysical Union. All Rights Reserved.

Welcome message from author
This document is posted to help you gain knowledge. Please leave a comment to let me know what you think about it! Share it to your friends and learn new things together.
Transcript

Sub-THz complex dielectric constants of smectite
clay thin samples with Na+/Ca++-ions
Rezwanur Rahman,1,2,3
Douglas K. McCarty,4
Manika Prasad,2,3
1Department of Physics, Colorado School
of Mines, Golden, CO 80401-1887, USA
2Department of Petroleum Engineering,
Colorado School of Mines, Golden, CO
80401-1887, USA
3OCLASSH, Department of Petroleum
Engineering, Colorado School of Mines,
Golden, CO 80401-1887, USA
4Chevron ETC, 3901 Briarpark, Houston,
TX 77402, USA
This article has been accepted for publication and undergone full peer review but has not been throughthe copyediting, typesetting, pagination and proofreading process, which may lead to differencesbetween this version and the Version of Record. Please cite this article as doi: 10.1002/2015JB011956
c©2015 American Geophysical Union. All Rights Reserved.
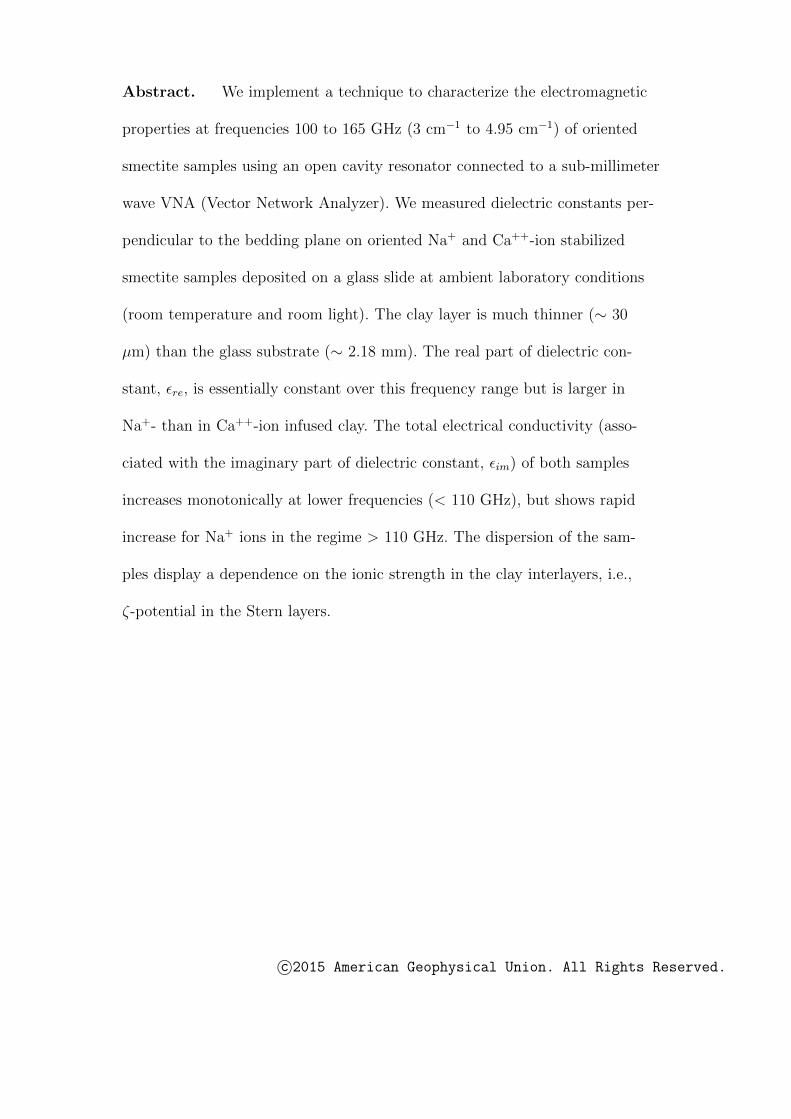
Abstract. We implement a technique to characterize the electromagnetic
properties at frequencies 100 to 165 GHz (3 cm−1 to 4.95 cm−1) of oriented
smectite samples using an open cavity resonator connected to a sub-millimeter
wave VNA (Vector Network Analyzer). We measured dielectric constants per-
pendicular to the bedding plane on oriented Na+ and Ca++-ion stabilized
smectite samples deposited on a glass slide at ambient laboratory conditions
(room temperature and room light). The clay layer is much thinner (∼ 30
µm) than the glass substrate (∼ 2.18 mm). The real part of dielectric con-
stant, εre, is essentially constant over this frequency range but is larger in
Na+- than in Ca++-ion infused clay. The total electrical conductivity (asso-
ciated with the imaginary part of dielectric constant, εim) of both samples
increases monotonically at lower frequencies (< 110 GHz), but shows rapid
increase for Na+ ions in the regime > 110 GHz. The dispersion of the sam-
ples display a dependence on the ionic strength in the clay interlayers, i.e.,
ζ-potential in the Stern layers.
c©2015 American Geophysical Union. All Rights Reserved.
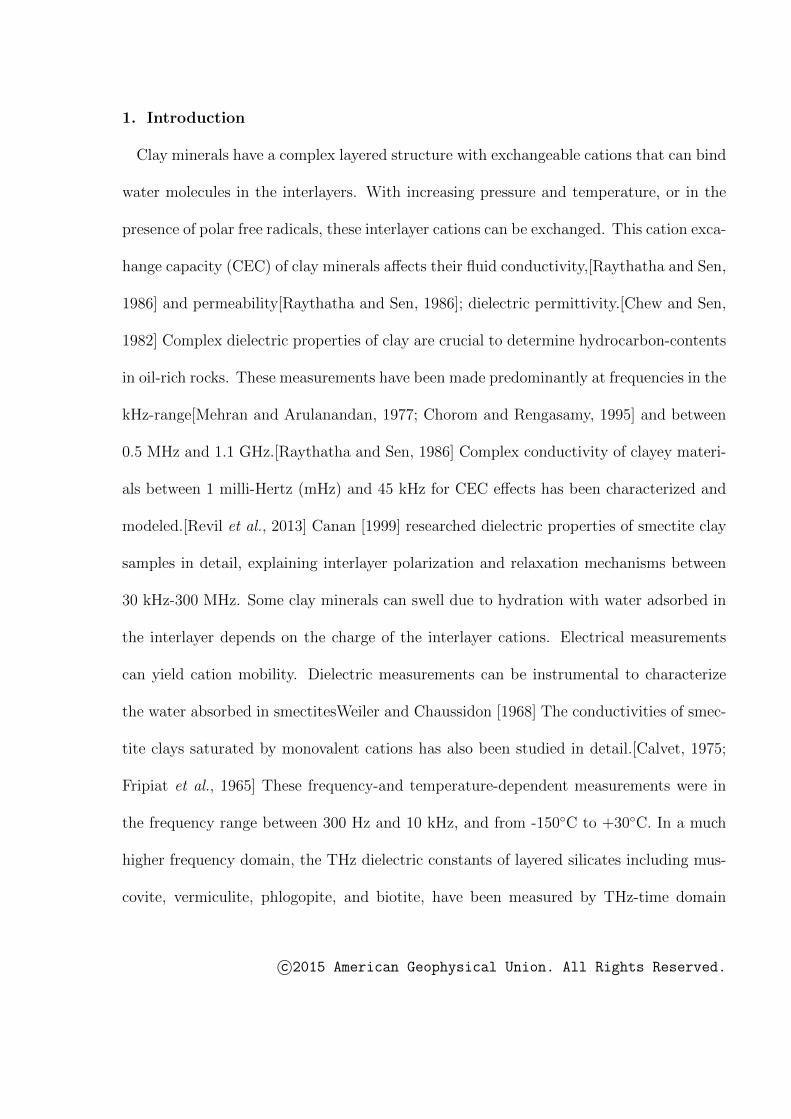
1. Introduction
Clay minerals have a complex layered structure with exchangeable cations that can bind
water molecules in the interlayers. With increasing pressure and temperature, or in the
presence of polar free radicals, these interlayer cations can be exchanged. This cation exca-
hange capacity (CEC) of clay minerals affects their fluid conductivity,[Raythatha and Sen,
1986] and permeability[Raythatha and Sen, 1986]; dielectric permittivity.[Chew and Sen,
1982] Complex dielectric properties of clay are crucial to determine hydrocarbon-contents
in oil-rich rocks. These measurements have been made predominantly at frequencies in the
kHz-range[Mehran and Arulanandan, 1977; Chorom and Rengasamy, 1995] and between
0.5 MHz and 1.1 GHz.[Raythatha and Sen, 1986] Complex conductivity of clayey materi-
als between 1 milli-Hertz (mHz) and 45 kHz for CEC effects has been characterized and
modeled.[Revil et al., 2013] Canan [1999] researched dielectric properties of smectite clay
samples in detail, explaining interlayer polarization and relaxation mechanisms between
30 kHz-300 MHz. Some clay minerals can swell due to hydration with water adsorbed in
the interlayer depends on the charge of the interlayer cations. Electrical measurements
can yield cation mobility. Dielectric measurements can be instrumental to characterize
the water absorbed in smectitesWeiler and Chaussidon [1968] The conductivities of smec-
tite clays saturated by monovalent cations has also been studied in detail.[Calvet, 1975;
Fripiat et al., 1965] These frequency-and temperature-dependent measurements were in
the frequency range between 300 Hz and 10 kHz, and from -150C to +30C. In a much
higher frequency domain, the THz dielectric constants of layered silicates including mus-
covite, vermiculite, phlogopite, and biotite, have been measured by THz-time domain
c©2015 American Geophysical Union. All Rights Reserved.

spectroscopy.[Janek et al., 2009] Unfortunately this technique is fairly noisy and low res-
olution since the THz pulses are very weak. So, in this paper we look at Monmorillionite
using much higher resolution CW methods based on harmonic multiplication of phase sta-
bilized microwaves, electronically generated; these methods provide very low noise/high
dynamic range out to about 1.4 THz at present.
2. Methods
At CSM we use three millimeter wave (or sub-THz) modalities to extract material
properties: (1) a quasi-optical System,[Scales and Batzle, 2006a, b; Greeney and Scales,
2012] to study bulk properties, (2) a near field scanning system,[Weiss et al., 2009] to
measure local properties, and (3) the open hemispherical cavity resonator,[Rahman et al.,
2013; Dudorov et al., 2005] for samples that are too thin or too low-loss for quasi-optical
techniques. In this work, using cavity resonance perturbation, we extract the complex
dielectric constants of clay-thin films in 100-165 GHz and investigate electrical properties
in the presence of Ca++/Na+-ions. We study how these cations influence conductivity
of free carriers, and relaxations. We also compare our data with low frequency measure-
ments.[Raythatha and Sen, 1986]
We use an open hemispherical cavity resonator with VNA (Vector Network Ana-
lyzer)[Rahman et al., 2013] to measure electrical properties of thin sections of clay-samples
with Ca++/Na+-ions infused. The cavity is a structure with two copper mirrors positioned
at certain distance (the “cavity length”) without any sidewalls. The top mirror is hemi-
spherical and connected to two WR-10 waveguide couplers working as a transmitter and
a receiver, and on the other hand the lower mirror is flat and smaller than the upper one
in size. We measured the real part of refractive index of ∼ 1 mm-thick glass substrate
c©2015 American Geophysical Union. All Rights Reserved.

(borosillicate) to be 1.98 at 310 GHz which is the same as its published value.[Rahman
et al., 2013] For details on the cavity and methodology see Rahman et al. [2013].
2.1. Open Cavity Resonator
The principle of this technique is cavity perturbation. The changes in axissymetric mode
profiles, mainly the frequency-shift and linewidth-variation, between an empty cavity
mode and the same mode in presence of a sample, allows us to determine the complex
dielectric constant of the sample.[Cullen and Yu, 1971; Yu and Cullen, 1982; Hirovnen
et al., 1996] The unloaded (empty) cavity has an axisymmetric mode spacing that is c/2L,
where L is the distance between two mirrors, also known as cavity length. In our cavity,
since L is around 15 cm, the unloaded mode spacing is about 1GHz.
Putting a sample on the bottom mirror perturbs the modes in a calculable but nontrivial
way. To avoid geometrical factors, we do a second perturbation which involves flipping the
sample upside down. Since the boundary values of the E-field are different, we are able to
get a simple (geometry-free) formula for the complex permittivity from 3 sweeps around
a 00q mode. This complex dielectric permittivity is related to total electrical/optical
conductivity and absorption coefficient[Strom and Taylor, 1977] with the use of basic
theory of electromagnetism as
nreα = 120πσre = 30ωεim
where nre and σre are the real part of the refractive index and conductivity (in Ω−1cm−1),
εim is imaginary part of the complex dielectric constant, and ω and α are frequency and
absorption coefficient expressed in terms wave numbers (cm−1 relative to the speed of
light), so 1cm−1 corresponds to 30 GHz. The electrical conductivity is a macroscopic
c©2015 American Geophysical Union. All Rights Reserved.

quantity which can be due to bound electrons (which is responsible for polarization and
relaxation) or free electrons (which is Drude-type mechanism). This is also valid for ab-
sorption coefficient. These parameters, σre and α, essentially describe the loss mechanisms
in a material.
2.2. Measurements
By sweeping the VNA, we identified the axissymetric empty cavity modes based on
constant frequency-spacing. This fixes the cavity-length, L, to be 145.56 mm and kept it
unchanged throughout the experiments. Using a least-squares fit of the data to a Breit-
Wigner model (as described in Rahman et al. [2013]) we retrieve the eigenfrequency-shifts
and modal quality factors (Q-values related to a linewidth) for substrate-only, film up
and film down positions in order to apply the differential method. In order to determine
uncertainty in the experiment, we repeat the entire procedure of inserting the sample,
performing the measurements, and taking it out six times and calculating the variations
in frequency shifts and linewidth changes of substrate. In Rahman et al. [2013] we showed
that by re-doing the entire procedure six times for borosillicate glass substrate, we obtained
standard deviations less than 1.0% in the complex dielectric constant. This uncertainty
also propagates to the calculations of dielectric constant. For consistency we confirmed
during each trial that the same part of the samples is probed.
The frequency shifts due to film up, film down, and substrate only are used in the Eqs.(1)
to determine the real part of the refractive index of a thin film.[Rahman et al., 2013;
Dudorov et al., 2005] This is called the differential method since it involves measurements
with the sample film up and down; the film will then see a different field because of
the boundary conditions. The result is that sample geometry factors cancel out, greatly
c©2015 American Geophysical Union. All Rights Reserved.

simplifying the calculation. Let nf and ns refer, respectively to the refractive index of the
film and substrate being measured. Then one can show that
δνfδνs
=n2f − 1
n2s − 1
. (1)
With
δνf = ν(fup) − ν(s). (2)
δνs = ν(fdown) − ν(s). (3)
Here, ν(fup) , ν(fdown) , ν(s) represent the eigenfrequency associated with the film on the
top (film up), film at the bottom (film down), and the substrate only, respectively. The
term, δνs, stands for the difference between the eigenfrequencies associated with film at
the bottom of the substrate and the substrate only, and the term, δνf , is the difference
between the eigenfrequencies with the film at the top of substrate and the substrate only.
The required condition is the real part of the refractive index of substrate must be known.
(Or since the substrate is large enough, we can measure its permittivity directly using
the quasi-optical methodology. The real part of the dielectric constant of thin film can
obtained by ε(f)re =(n
(f)re )2. We need Q-values of film up and substrate (only) to calculate the
imaginary part of complex dielectric constant of the thin film. The Q-value of a resonant
peak (perturbation) is defined as Q=ν0/∆ν. The Q-value is related to the imaginary
part of the refractive index by nim=1/2Q, so for a thin film, n(f)im=1/2Q(f). The latter
expressions assume that Q is not too small (say less than 10). In a cavity such as ours,
the Q could be 104−105 depending on technical details of the waveguide coupling. In the
differential method, Q(f) = ( Q(filmup)− Q(substrate)). Now, we are able to compute the
c©2015 American Geophysical Union. All Rights Reserved.

imaginary part of the complex dielectric constant of the thin film by
ε(f)im = 2n(f)
re n(f)im
.
2.3. Samples and Sample preparations
We studied smectite clay minerals (SWy) from the Clay Minerals Society
(‖www.clays.org‖) that were treated to yield homoionic, univalent (Na+) and divalent
(Ca++) samples. The samples were treated to remove carbonate and iron oxide cements
with a Na-acetate buffer and Na-dithionite respectively.[Jackson, 1985] The sub-0.5 µm
equivalent spherical diameter size fractions were separated from bulk samples by standard
centrifuge methods. Then the Na+ saturated clay was thoroughly cleaned with dialysis to
remove excess salt. To prepare the Ca++ exchanged smectite, a dialyzed Na+ sample was
treated with a 1M solution of CaCl2, and shaken for at least two hours, excess solution was
decanted and the process was repeated twice more. The excess Ca++ salt was removed
with dialysis.[Moore and Reynolds, 1997] Oriented aggregates were made by evaporation
onto glass slides to provide a sample ∼ 4 cm long with at least 10 mg/cm2 of clay.[Moore
and Reynolds, 1997]This evaporation method yields deposition of clay particles on the
glass slide with the clay layers parallel to the glass slide.[Prasad et al., 2002]
XRD measurements showed systematic differences between Na+ smectite and Ca++
smectite. The structure of smectite determined from oriented aggregate sample prepara-
tions and X-ray diffraction (XRD) profile modelling and especially the interlayer water
complex under different environmental conditions, is described in detail by Ferrage et al.
[2005a, b, 2010, 2011]. Ferrage et al. [2011] discuss the influence that the structure and
c©2015 American Geophysical Union. All Rights Reserved.

organization of interlayer water has on the materials dielectric constant. For this rea-
son, the diffraction profiles from the Na+ and Ca++ exchanged preparations used in the
dielectric measurements in this study were simulated following the same methods as de-
scribed by Drits and Sakharov [1976] and Drits and Tchoubar [1990]. The experimental
and modelled diffraction patterns for the Na+ and Ca++-ion stabilized clay samples are
shown in FIG.2 along with the thicknesses of bihydrated (2W), monohydrated (1W) and
dehydrated (0W) layers and their proportions that were used in the simulated diffraction
profiles. Under the ambient conditions of ∼ 50% relative himidity (RH) in the laboratory
the Na+ smectite is well described by random interstratifications of 2W (2%), 1W (85%),
and 0W (13%). In contrast, the hydrated structure of Ca++ smectite was modelled by a
different arrangement of layer thicknesses and proportions where 2W (81%), 1W (9%), and
0W (10%) were randomly interstratified. The XRD simulations in FIG.2 are not perfect
with some misfit present at different angular ranges for the Ca++ and Na+ samples. This
suggests that there is greater heterogeneity in the layer assemblage. However, the near
perfect fit of the 001 reflection at 12.54 A (Na) and 15.05 A (Ca), and the generally good
fit at higher angles indicate that the models represent the primary structures, with 1W
layers being dominant in the Na+ sample and 2W layers being the dominant layer type
in the Ca++ sample. Smectite interlayer water as probed by XRD, considered crystalline
water,[Ferrage et al., 2011] may or may not all be coordinated to interlayer cations. Based
on a combination of XRD and Grand-Canonical Monte Carlo simulations[Ferrage et al.,
2011] found that fluctuations of charge locations and water dipoles affect the dielectric
constant. These authors also point out that gravimetric adsorption methods produce sim-
ilar, but slightly higher molar equivalent water content than XRD experiments conducted
c©2015 American Geophysical Union. All Rights Reserved.

under the same humidity conditions and based on the XRD simulation method. This is
due to additional adsorption on surfaces and condensation in nm-scale pores.
Thus, in addition to millimeter wave EM analysis, we performed a variety of measure-
ments on the two samples, including thermal gravimetric analysis (TGA), gravimetric
water adsorption, and subcritical nitrogen gas adsorption (SGA) to characterize physical
differences that exist between the Na+ and Ca++ ex-infused samples. Na+ smectite has
higher SSA and dominant 1-3 nm pores typical for clay aggregates; in contrast, the Ca++
smectite sample has predominantly larger pores between 50-100 nm.[Kuila et al., 2014]
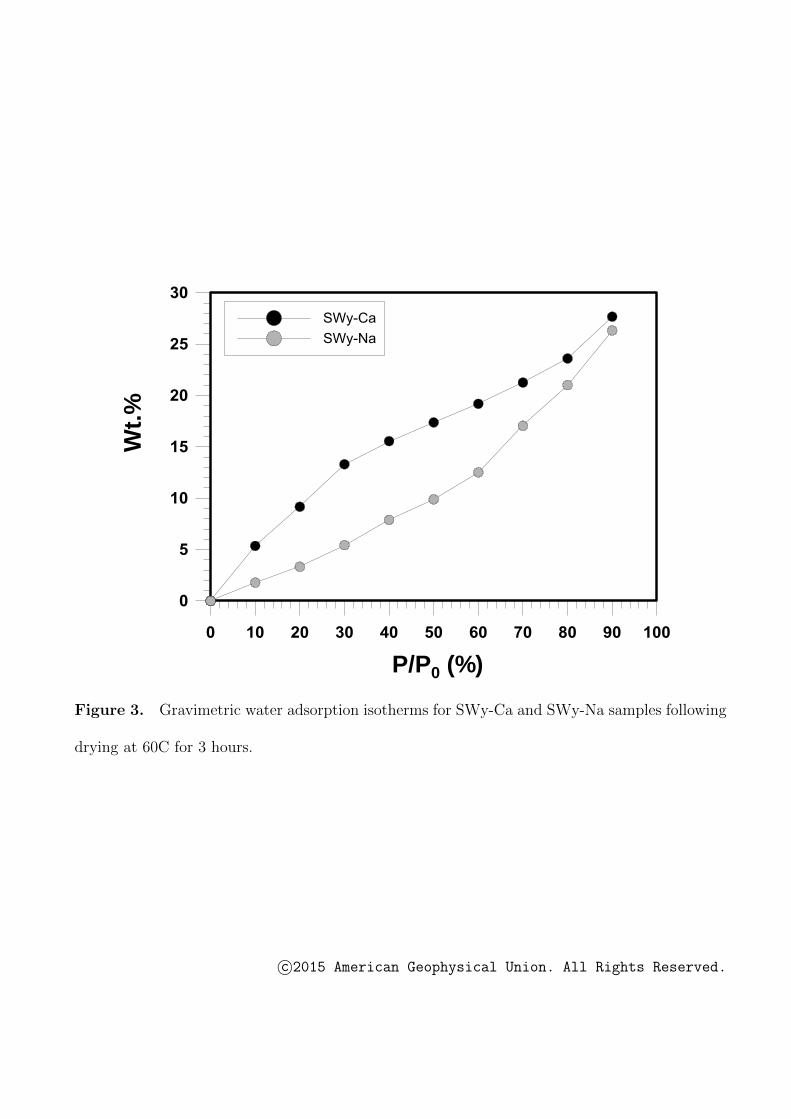
At ∼ 50 RH gravimetric water adsorption data (FIG. 3) from SWy-Ca++ and SWy-Na+
showed that the Ca++ smectite adsorbed ∼ 17.5 wt.% following dehydration at 600C for
3 hours, compared to 10 wt.% for the Na+ smectite under the same conditions. The hy-
dration enthalpy is about four times greater for Ca++ than Na+ cations and is consistent
with these gravimetric data. However, in the oriented aggregate preparations used for
the EM analysis the contrasting structural arrangement of the interlayer crystalline water
between the Na+ and Ca++ smectite samples (FIG. 2) must play a significant role in the
EM response.[Ferrage et al., 2011]
3. Results and Discussion
Referring to FIG.4, one can see that the real part of the dielectric constants of both clay
samples are nearly dispersion free (i.e., frequency independent) in our range of measure-
ments, indicating that carrier concentrations are low in both.[Zallen, 1983; Rahman et al.,
2014] The imaginary part of dielectric constant and electrical conductivity of Na+-ionized
sample, increase at two different rates: faster in the higher frequency range of our mea-
surement and slower at low frequencies. The presence of both Debye relaxation[Debye,
c©2015 American Geophysical Union. All Rights Reserved.

1929], and Maxwell-Wagner relaxationHamon [1953] at radio frequencies has been re-
ported.[Calvet, 1975] But between 100 and 165 GHz, phonon induced relaxation is domi-
nant.[Zallen, 1983]
Revil et al. [2013] proposed a theoretical model to study complex conductivity-
dependences on cation exchange capacity (CEC), specific surface area (SSA), and salinity
for clay samples at low frequency. This model also relates CEC to SSA with consis-
tency.[Revil et al., 2013] It is reported that SSA increases exponentially for Na+-clay
and linearly for Ca++-clay sample.[Egashira and Matsumoto, 1981] From our research, it
is evident that conductivity depends on CEC or SSA. The larger CEC or expnonetial-
growing SSA can contribute to more disperse Stern layer and the smaller CEC or linearly-
progressive SSA stabilize the Stern layer. Thus, electrical conductivity is linked to CEC
and zeta potential in the Stern layer.[Chorom and Rengasamy, 1995] The Na+ makes a
thicker unstable double layer where these high mobility ions are able to polarize rapidly.
Therefore, the conductivity is more dispersive. This interlayer polarization is correlated to
relaxation mechanisms. The relaxation processes are, therefore, dependent of ζ-potential
which is also correlated to CEC.[Zadaka et al., 2010] On the other hand, The imaginary
part of dielectric constant and conductivity of the sample with Ca++ increase monoton-
ically and sublinearly. The Ca++ creates more stable double Stern layer. Due to low
mobility, the interlayer polarization is less disperse so its conductivity is sublinear. Since,
εim = 2 (1/ν) σre, the effect of (1/ν) is more into imaginary part of complex dielectric
constant of samples with Na++ than that of Ca++. In this case, εim at high frequencies
faced steeper decrease than at lower frequency ends.
c©2015 American Geophysical Union. All Rights Reserved.

Comparing the results from Raythatha and Sen [1986] with ours (FIG.4), it is clear
that in the sub-THz, the electrical conductivities of clay-Na+/Ca++-ions are almost 2 to
3 orders of magnitude greater than in the RF/microwave range. On the other hand, the
real part of dielectric constants for both samples, are roughly an order of magnitude larger
in the RF/microwave range than in the sub-THz. The huge RF/microwave permittivities
have been attributed to polarization of the double-layer surrounding the ions.[Raythatha
and Sen, 1986] The lower (and nearly frequency-independent) values of εre suggest that
there are depletions of mobile charges due to phonon interactions causing the diffused
layers to thin.
4. Conclusion
We measured sub-THz complex dielectric properties of clay samples with Na+/Ca++,
and compute their εre and σre. We illustrate the connections between electromagnetic
parameters and components of surface chemistry such as CEC or SSA, ζ-potential. This
also enables us to study the clay content and free radicals in shales, and to investigate their
CEC and ζ-potential-dependences. In future, we will study more different ionized clay
samples and broader frequency ranges to capture more complete frequency-dependences
of εre and εim. This will allow us to model computationally the dispersions of these
parameters.
5. Acknowledgement
This work was supported by OCLASSH consortium and the US Department of Energy
(Basic Energy Science) under grant DE-FG02-09ER16018. We thank Dr. John Scales for
his insightful discussion on complex dielectric measurements. The Scales lab makes all of
c©2015 American Geophysical Union. All Rights Reserved.
its data available, either on-line or by request; at no cost. This work is dedicated to the
memory of Mike Batzle, who inspired us all.
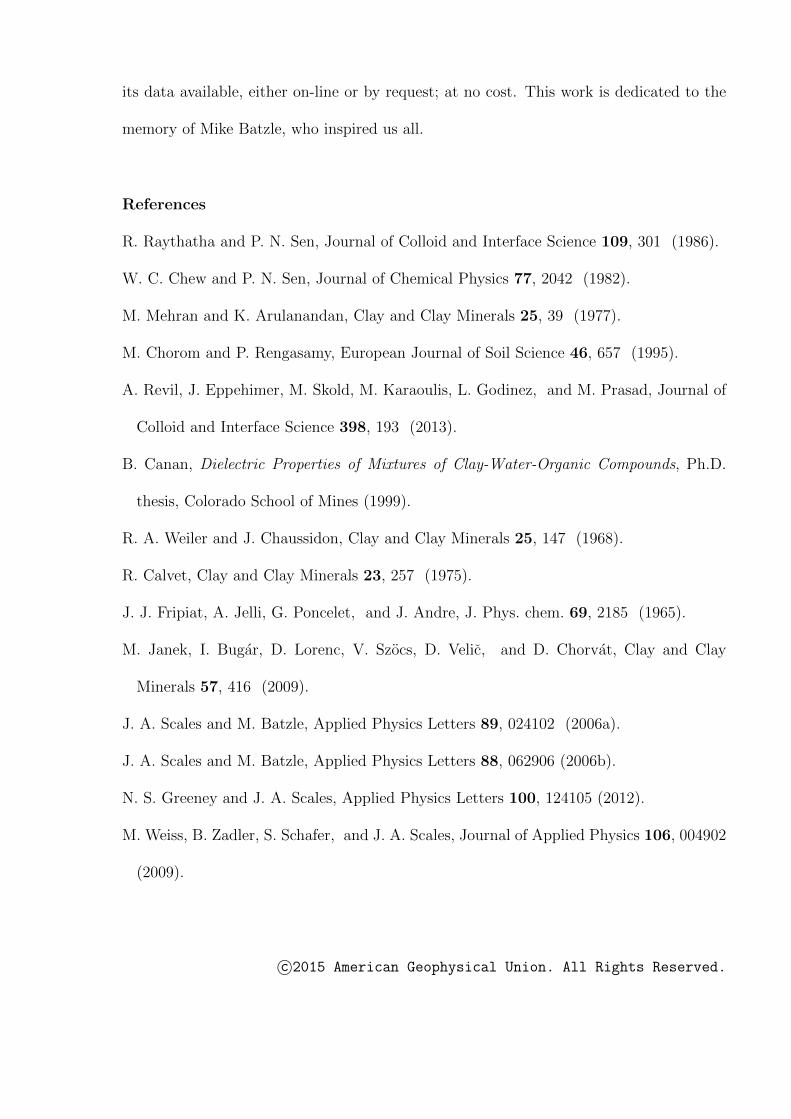
References
R. Raythatha and P. N. Sen, Journal of Colloid and Interface Science 109, 301 (1986).
W. C. Chew and P. N. Sen, Journal of Chemical Physics 77, 2042 (1982).
M. Mehran and K. Arulanandan, Clay and Clay Minerals 25, 39 (1977).
M. Chorom and P. Rengasamy, European Journal of Soil Science 46, 657 (1995).
A. Revil, J. Eppehimer, M. Skold, M. Karaoulis, L. Godinez, and M. Prasad, Journal of
Colloid and Interface Science 398, 193 (2013).
B. Canan, Dielectric Properties of Mixtures of Clay-Water-Organic Compounds, Ph.D.
thesis, Colorado School of Mines (1999).
R. A. Weiler and J. Chaussidon, Clay and Clay Minerals 25, 147 (1968).
R. Calvet, Clay and Clay Minerals 23, 257 (1975).
J. J. Fripiat, A. Jelli, G. Poncelet, and J. Andre, J. Phys. chem. 69, 2185 (1965).
M. Janek, I. Bugar, D. Lorenc, V. Szocs, D. Velic, and D. Chorvat, Clay and Clay
Minerals 57, 416 (2009).
J. A. Scales and M. Batzle, Applied Physics Letters 89, 024102 (2006a).
J. A. Scales and M. Batzle, Applied Physics Letters 88, 062906 (2006b).
N. S. Greeney and J. A. Scales, Applied Physics Letters 100, 124105 (2012).
M. Weiss, B. Zadler, S. Schafer, and J. A. Scales, Journal of Applied Physics 106, 004902
(2009).
c©2015 American Geophysical Union. All Rights Reserved.

R. Rahman, P. C. Taylor, and J. A. Scales, Review of Scientific Instruments 84, 083901
(2013).
S. N. Dudorov, D. V. Lioubtchenko, J. A. Mallat, and A. V. Raisanen, IEEE Transaction
On Instrumentation and Measurement 54, 1916 (2005).
A. L. Cullen and P. K. Yu, Proceedings of The Royal Society A 325, 49 (1971).
P. K. Yu and A. L. Cullen, Proceedings of The Royal Society A 380, 49 (1982).
M. T. Hirovnen, P. Vainikainen, A. Lozowski, and A. V. Raisanen, IEEE Transaction on
Instrumentation and Measurement 45, 780 (1996).
U. Strom and P. C. Taylor, Phys. Rev. B 16, 5512 (1977).
M. Jackson, Soil Chemical Analysis, Advanced Course, 2nd ed. (Published by the author,
Madison, WI, 1985).
D. Moore and R. J. Reynolds, X-ray Diffraction and the Identification and Analysis of
Clay Minerals, 2nd ed. (Oxford University Press, New York, 1997).
M. Prasad, M. Kopycinska, U. Rabe, and W. Arnold, Geophysical Research Letters 29,
13 (2002).
E. Ferrage et al., American Mineralogist 90, 1374 (2005a).
E. Ferrage et al., Chemistry of Materials 17, 34993512 (2005b).
E. Ferrage et al., J. Physical Chemistry 114, 4515 (2010).
E. Ferrage et al., J. Physical Chemistry 115, 1867 (2011).
V. Drits and B. Sakharov, X-ray Analysis of Mixed-layer Clay Minerals (Nauka, Moscow,
1976).
V. Drits and C. Tchoubar, X-ray diffraction by disordered lamellar structures : Theory
and applications to microdivided silicates and carbons (Spring-Verlag, Berlin, 1990).
c©2015 American Geophysical Union. All Rights Reserved.
U. Kuila, D. McCarty, A. Derkowski, T. Fischer, T. Topor, and M. Prasad, Fuel 135,
359 (2014).
R. Zallen, The Physics of Amorphous Solids (Wiley-Inerscience, 1983).
R. Rahman, T. R. Ohno, P. C. Taylor, and J. A. Scales, Appl. Phys. Lett. 104, 182104
(2014).
P. Debye, Polar Molecules (Chemical Catalogue Company, NY, 1929).
B. V. Hamon, Australian Journal of Physics 6, 304 (1953).
K. Egashira and J. Matsumoto, Soil. Sci. Plant Nutr. 27, 289 (1981).
D. Zadaka, A. Radian, and Y. Mishael, Journal of Colloid and Interface Science 352, 171
(2010).
c©2015 American Geophysical Union. All Rights Reserved.

100.60 100.65 100.70 100.75 100.80Frequency (GHz)
55
60
65
70
Am
plitu
de(a
rb.
unit)
Clay with Ca++-ion
substratefilm-upfilm-down
100.60 100.65 100.70 100.75Frequency (GHz)
55
60
65
70A
mpl
itude
(arb
.un
it)
Clay with Na+-ion
substratefilm-upfilm-down
Figure 1. Perturbations with substrate only, film up, and film down set-ups for clay with (a)
Ca++ and (b)Na+-ions (at room temperature)
.
c©2015 American Geophysical Union. All Rights Reserved.

No. of smectite
water layers
Layer
Thickness
(Å)
Layer
proportion
(%)
2W 14.98 81.0
1W 12.72 9.0
0W 10.03 10.0×5
15.05 Å
4.9
8 Å
3.5
5 Å
3.0
1 Å
12.54 Å
6.2
4 Å
3.14 Å
2.09 Å
4.2
6 Å
×3
No. of smectite
water layers
Layer
Thickness
(Å)
Layer
proportion
(%)
2W 14.80 2.0
1W 12.51 85.0
0W 9.96 13.0
SWy Na+
SWy Ca++
2q (º)
Figure 2. Experimental and simulated XRD patterns from oriented aggregate preparations
from Ca++ and Na+-ion stabilized clay samples used in EM analysis.
c©2015 American Geophysical Union. All Rights Reserved.
P/P0 (%)
Wt.
%
Figure 3. Gravimetric water adsorption isotherms for SWy-Ca and SWy-Na samples following
drying at 60C for 3 hours.
c©2015 American Geophysical Union. All Rights Reserved.

100 110 120 130 140 150 160 170
Frequency (GHz)3
4
5
6
7
8
9
ε re
Clay with Na+
Clay with Ca++
3.0 3.5 4.0 4.5 5.0Wavenumber (cm−1)
90 100 110 120 130 140 150 160 170
Frequency (GHz)0.00
0.02
0.04
0.06
0.08
0.10
0.12
0.14
0.16
0.18
ε im
Clay with Na+
Clay with Ca++
3.0 3.5 4.0 4.5 5.0Wavenumber (cm−1)
90 100 110 120 130 140 150 160 170
Frequency (GHz)0.0
0.1
0.2
0.3
0.4
0.5
σre
(Ω−
1-c
m−
1)
Clay with Na+
Clay with Ca++
3.0 3.5 4.0 4.5 5.0Wavenumber (cm−1)
Figure 4. High frequency (100-165 GHz) data of (upper left) real part and (upper right)
imaginary part of the complex dielectric constants of clay samples with Na+/Ca++-ions (at room
temperature); (lower middle) conductivity of both samples (inner plot is the expansion of the
100-110GHz responses).
c©2015 American Geophysical Union. All Rights Reserved.
Related Documents