Comp Sub-Proje Effects of Va Packaging on Properties of July Department of F Project Im Banglade 0 petitive Research Grant ect Completion Rep on acuum and Modified Atmo n Microbiological and Bioc f Fresh Fish Stored at Refri Temperature (4 °C) Project Duration y 2017 to September 2018 Fisheries, University of Rajshahi, Rajshah Submitted to mplementation Unit-BARC, NATP esh Agricultural Research Counc Farmgate, Dhaka-1215 September 2018 port osphere chemical igeration hi-6205 P 2 cil Project ID: 316

Welcome message from author
This document is posted to help you gain knowledge. Please leave a comment to let me know what you think about it! Share it to your friends and learn new things together.
Transcript
Competitive Research Grant
Sub-Project Completion Report
Effects of Vacuum and Modified Atmosphere Packaging on Microbiological and Biochemical Properties of
July 2017
Department of Fisheries, University of Rajshahi, Rajshahi
Project Implementation UnitBangladesh Agricultural
0
Competitive Research Grant
Project Completion Reporton
Effects of Vacuum and Modified Atmosphere Packaging on Microbiological and Biochemical Properties of Fresh Fish Stored at Refrigeration
Temperature (4 °C)
Project Duration July 2017 to September 2018
Department of Fisheries, University of Rajshahi, Rajshahi
Submitted to Project Implementation Unit-BARC, NATP 2Bangladesh Agricultural Research Council
Farmgate, Dhaka-1215
September 2018
Project Completion Report
Effects of Vacuum and Modified Atmosphere Packaging on Microbiological and Biochemical
Fresh Fish Stored at Refrigeration
Department of Fisheries, University of Rajshahi, Rajshahi-6205
BARC, NATP 2 Research Council
Project ID: 316
Competitive Research Grant
Sub-Project Completion Report
Effects of Vacuum and Modified Atmosphere Packaging on Microbiological and Properties of Fresh Fish Stored at Refrigeration
Temperature (
July 2017
Department of Fisheries, University of Rajshahi, Rajshahi
Project Implementation UnitBangladesh Agricultural Research Council
Farmgate, Dhaka
ompetitive Research Grant
Project Completion Reporton
Effects of Vacuum and Modified Atmosphere Packaging on Microbiological and Biochemical Properties of Fresh Fish Stored at Refrigeration
Temperature (4 °C)
Project Duration July 2017 to September 2018
Department of Fisheries, University of Rajshahi, Rajshahi-6205
Submitted to Project Implementation Unit-BARC, NATP 2Bangladesh Agricultural Research Council
Farmgate, Dhaka-1215
September 2018
Project Completion Report
Effects of Vacuum and Modified Atmosphere Biochemical
Properties of Fresh Fish Stored at Refrigeration
6205
2
Citation Effects of Vacuum and Modified Atmosphere Packaging on Microbiological and Biochemical Properties of Fresh Fish Stored at Refrigeration Temperature (4 °C) Project Implementation Unit National Agricultural Technology Program-Phase II Project (NATP-2) Bangladesh Agricultural Research Council (BARC) New Airport Road, Farmgate, Dhaka – 1215 Bangladesh Edited and Published by: Project Implementation Unit National Agricultural Technology Program-Phase II Project (NATP-2) Bangladesh Agricultural Research Council (BARC) New Airport Road, Farmgate, Dhaka – 1215 Bangladesh
Published in: September 2018 Printed by: PDF Version
Acknowledgement The execution of CRG sub-project has successfully been completed by the Department of Fisheries, University of Rajshahi, Rajshahi using the research grant of USAID Trust Fund and GoB through Ministry of Agriculture. We would like to thank to the World Bank for arranging the grant fund and supervising the CRGs by BARC. It is worthwhile to mention the cooperation and quick responses of PIU-BARC, NATP 2, in respect of field implementation of the sub-project in multiple sites. Preparing the project completion report required to contact a number of persons for collection of information and processing of research data. Without the help of those persons, the preparation of this document could not be made possible. All of them, who made it possible, deserve thanks. Our thanks are due to the Director PIU-BARC, NATP 2 and his team who extended their whole hearted support to prepare this document. We hope this publication would be helpful to the agricultural scientists of the country for designing their future research projects in order to generate technology as well as increase production and productivity for sustainable food and nutrition security in Bangladesh. It would also assist the policy makers of the agricultural sub-sectors for setting their future research directions.
i
Acronyms
BARC : Bangladesh Agricultural Research Council CFU : Colony Forming Unit FC : Fecal Coliforms MAP : Modified Atmosphere Packaging PV : Peroxide value RTC : Ready-to-cook RTE : Ready-to-eat TBARS : Thiobarbituric Acid Reactive Substance TC : Total Coliforms TVBN : Total Volatile Base Nitrogen TVC : Total viable count
ii
Table of Contents
SL No. Subjects Page No
Acronyms i Table of Contents ii
Executive summary v A Sub-Project Description 1-30
1 Sub-Project title 1 2 Implementing organization 1 3 Principal Investigator and Co-principal investigator 1 4 Sub-project budget 1 5 Duration of the sub-project 1 6 Justification for undertaking the sub-project 1 7 Sub-project goal 2 8 Sub-project objectives 2 9 Implementing location 2
10 Methodology in brief 2 11 Results and Discussions 4
11.1 Consumers Preference on fresh fish and its packaging in superstores 4 11.2 Microbiological and biochemical quality of fish stored under vacuum
and different modified atmosphere packaging at 4˚C 10
11.2.1 Tilapia (Oreochromis niloticus) 10 11.2.2 Rohu fish (Labeo rohita) 15 11.2.3 Goonch/Baghair fish (Bagarius bagarius) 21
12 Research highlight/findings 30 B Implementation Positions 31
1 Procurement 31 2 Establishment/renovation facilities 31 3 Training/study tour/ seminar/workshop/conference organized 31
C Financial and physical progress 32 D Achievement of Sub-project by objectives (Tangible form) 32 E Materials Development/Publication made under the Sub-project 33 F Technology/Knowledge generation/Policy Support (as applied) 34 G Information regarding Desk and Field Monitoring 34 H Lesson Learned (if any) 35 I Challenges (if any) 35 J References 36
iii
List of Tables
Sl.No. Title Page Table 1. General, demographic and socio-economic data of the respondents 5 Table 2. Consumers Preference for fishes and opinions toward quality and packaging 7 Table 3. List of fish species usually purchases by the consumers of those superstores in
Dhaka city 8
Table 4. The PH value of sliced Tilapia fish under vacuum and MAP conditions at refrigerated storage
10
Table 5. TVB-N value (mg/100g) of sliced Tilapia fish under vacuum and MAP conditions at refrigerated storage
11
Table 6. Peroxide value (mEq/kg of oil) of sliced Tilapia fish under vacuum and MAP conditions at refrigerated storage
12
Table 7. TBARS value (mg malonaldehyde/kg) of sliced Tilapia fish under vacuum and MAP condition at refrigerated storage
8
Table 8. Total viable count (Log CFU/g) of sliced Tilapia fish under vacuum and MAP conditions at refrigerated storage
8
Table 9. Total Coliforms (MPN/g) of fresh Tilapia fish under vacuum and MAP condition at chilled storage
1
Table 10. Faecal coliforms (MPN/g) of fresh Tilapia fish under vacuum and MAP condition at chilled storage
15
Table 11. pH value of sliced Rohu fish under vacuum and MAP condition at refrigerated storage
16
Table 12. TVBN value (mg/100 g) of sliced Rohu fish under vacuum and MAP condition at refrigerated storage
17
Table 13. Peroxide value (mEq/kg of oil ) of sliced Rohu fish under vacuum and MAP condition at refrigerated storage
17
Table 14. TBARS value (mg malonaldehyde/kg) of sliced Rohu fish under vacuum and MAP condition at refrigerated storage
18
Table 15. Total viable count (Log CFU/g) of sliced Rohu fish under vacuum and MAP condition at refrigerated storage
19
Table 16. Total Coliforms (MPN/g) of fresh Rohu fish under vacuum and MAP condition stored at chilled temperature
21
Table 17. Faecal Coliforms (MPN/g) of fresh Rohu fish under vacuum and MAP condition stored at chilled temperature
21
Table 18. pH value of sliced Baghair fish under vacuum and MAP condition at refrigerated storage (4℃)
22
Table 19. TVBN value (mg/100g) of sliced fresh Baghair fish under vacuum and MAP condition at refrigerated storage (4℃)
23
Table 20. Peroxide value (mEq/kg of oil) of sliced Baghair fish under vacuum and MAP condition at refrigerated storage (4℃)
24
Table 21. TBARS value (mg malonaldehyde/kg) of sliced Baghair fish under vacuum and MAP condition at refrigerated storage (4℃)
26
Table 22. Total viable count (Log CFU/g) of sliced Baghair fish under vacuum and MAP condition at refrigerated storage (4℃)
28
Table 23. Total Coliforms (MPN/g) of fresh Baghair fish under vacuum and MAP condition stored at chilled temperature
30
Table 24. Faecal coliforms (MPN/g) of fresh Baghair fish under vacuum and MAP condition stored at chilled temperature
30
iv
List of Figures
Sl.No. Title Page
Fig. 1: A questionnaire survey in different outlets of four superstores in Dhaka 4
Fig. 2. Total viable count (Log CFU/g) of sliced Tilapia fish under vacuum and MAP conditions at refrigerated storage
14
Fig. 3. Total viable counts of sliced Rohu fish under vacuum and MAP condition at refrigerated storage
20
Fig. 4. Total viable count of sliced Baghair fish under vacuum and MAP condition stored at 4°C
29
v
Executive Summary
The sub-project entitled “Effects of vacuum and modified atmosphere packaging on microbiological and biochemical properties of fresh fish stored at refrigeration temperature (4 °C)” has been implemented from July 2017 to September 2018 at the Department of Fisheries, University of Rajshahi. The aim of the sub-project was to develop proper vacuum and modified atmosphere packaging (MAP) for fresh fish to ensure the supply of quality fish conveniently.
At first, consumer’s acceptability and willingness to buy the fresh and packaged raw fish in the superstores of Dhaka city was investigated by survey method utilizing structured questionnaire. Total 290 shoppers/consumers, selected purposively based on the availability during the face-to-face interview from different outlets of four retail superstores in Dhaka city (Shwapno, Meena bazaar, Prince Bazar, Nandan etc.) were surveyed in January to March 2018. In the superstores, 59% consumers were male, and 63% have small family size (up to 4 members). Most of the consumers (83%) were highly educated having bachelor degree and half of the consumers involved in mid to higher class job. Consumers purchase 44 different fish species in those superstores and 75% consumers prefer marine fishes. Among the consumers, 43% purchase iced fishes, and 35% purchase fresh and iced fishes. Around 71 % consumers purchase fish weekly, and 53% spend 1001-5000 BDT monthly. About 58% and 38% consumers were satisfied and moderately satisfied respectively on purchasing fish from superstores. However, 57% and 39% were satisfied and moderately satisfied respectively on the overall quality of the fish in the superstores. Most of the consumers (85%) would prefer to buy larger fish as whole instead of cut portions. Around 58% consumers would prefer to buy packaged slice of larger fish under refrigeration storage and rest not. In case of packaged fish, about 50% consumers would prefer on 500 or 1000g pack. Besides, 54% consumers agreed to pay 10-15% excess price for getting quality products with proper packaging. Therefore, there is a scope to produce packed slice of larger fish which can be easily sold for a more extended period at refrigerated condition in the superstores.
In the second part of the research, the quality and shelf-life of three fish species namely; Tilapia (Oreochromis niloticus), Rohu (Labeo rohita), and one larger fish, Goonch catfish/Baghair (Bagarius bagarius) was evaluated by biochemical and microbiological analysis under not sealed pack (control), vacuum pack, modified atmosphere packaging-1 denoted as MAP-1 (50% CO2 & 50% N2), and modified atmosphere packaging-2 denoted as MAP-2 (50% CO2 & 50% O2) at 3 days interval during 18 days of refrigerated storage (4°C). The fishes in triplicate were subjected to biochemical and microbiological analysis (pH, total volatile base nitrogen (TVB-N), peroxide value (PV), thiobarbituric acid reactive substances (TBARS), total viable count (TVC) and total coliforms & fecal coliforms at three days interval during the storage at 4˚C.
The pH, TVB-N, PV and TBARS values of all three fish samples under all packaging conditions were within the acceptable limit during the storage period except the TBARS value in MAP-2 sample where it exceeded the acceptable limit at a later stage of storage. In case of Tilapia, significantly (p<0.05) lower TVC were observed on 9th, 12th day of storage in all packaged fish samples compared to that of control samples. The TVC values exceeded the 7 Log CFU/g, which is considered as the upper acceptable limit for fresh and frozen fish on different days for different packaged samples. Considering the bacterial counts, the shelf-life of Tilapia was determined at approximately 7, 11, 12, 15 days for not sealed pack, vacuum pack, MAP-2 and MAP-1 samples, respectively. Similarly, the shelf-life of Rohu samples was determined at approximately 8, 11, 13, 16 for not sealed pack, vacuum pack, MAP-2, and MAP-1 sample, respectively. In case of Baghair, the shelf-life was determined at approximately 6, 9, 10, 12 for not sealed pack, MAP-2, vacuum pack, and MAP-1 sample, respectively. Therefore, the MAP-1 (50% CO2& 50% N2) was designated as the best packaging system to increase the shelf-life of all three fish species. The modified atmosphere packaging along with chilled storage can be utilized by the superstores of the country to display the fish and fishery products with extended shelf-life.
1
CRG Sub-Project Completion Report (PCR)
A. Sub-project Description
1. Title of the CRG sub-project: Development of Nanomaterial Mediated Feed for Improving Growth and Immunity of Fish
2. Implementing organization: Department of Agronomy & Agricultural Extension & Dept. of Fisheries, Rajshahi University, Rajshahi- 6205.
3. Name and full address with phone, cell and E-mail of PI (s): Dr. Md. Jahangir Alam, Professor, Department of Agronomy & Agricultural Extension, Rajshahi University, Rajshahi-6205, Cell no - 01716587448.
Name and full address with phone, cell and E-mail of Co-PI: Dr. Md. Abu Sayed Jewel, Professor, Department of Fisheries, Rajshahi University, Cell no. 01727144520.
4. Sub-project budget (Tk): a. Total: 46,42,267.00/= b. Revised (if any):
5. Duration of the sub-project: 5.1 Start date (based on LoA signed) : July 2017 5.2 End date : 30 September 2018
6. Justification of undertaking the sub-project:
The aquaculture industries can be revolutionized by using nanotechnology with new tools to enhance the ability of cultivable organisms to uptake drugs like hormones, vaccines and nutrients (Rather et al. 2011). The metal nanoparticles (NPs) such as Se, Al, Fe, FeO, and ZnO play a crucial role in aquaculture operations (Zhou et al. 2009). Nanotechnology holds promise for both medication and nutrition, because materials at the nanometer dimension exhibit novel properties different from those of isolated atom and bulk material (Albrecht et al. 2006; Wang et al. 2007). Moreover, food additives in the nano forms are being increasingly used including aquaculture, iron-fortified cereals and drinks for human consumption (Hilty et al. 2010).
Recently, nanotechnology has emerged as an excellent field of technology that shows its application in various sectors including agro-food system, aquaculture (Defra, 2009) and aqua-feed (Handy, 2012). Nanotechnology involves the synthesis of nanoscale particles that exhibit unique physiochemical properties like higher intestinal absorption, bioavailability and enhanced bactericidal and catalytic activities (Dube et al. 2010).
Over the years, technological applications in aquaculture have been associated with intensification of the applied systems for increased production with economic profitability. Besides high density culture systems, efforts are also being made to achieve high-growth performances and early weaning by shortening productive cycles. Nanoparticles received considerable attention in the recent years because of their ability to deliver a wide range of molecules to the body and for a sustained period of time.
Recently quality fish feed is a major challenge for aquaculture industry of Bangladesh. Fish farmers are frequently reported that the growth responses of culture fishes are not satisfactory by feeding commercial fish feeds. Commercial fish feed cost is increasing day by day. So, there is an urgent need to develop a quality fish feed (nanomaterial mediated feed) for better growth responses of culture fishes that will help to feed industry for improving their feed quality. Finally fish farmers will be economically benefited from better growth performance of healthy fish.
2
In Bangladesh, population density is increasing day by day and demand of animal protein is also increasing. To meet this growing demand, need to proper utilization our limited resources. The introduction of nanoparticles as feed additives will enhance feed quality and that will be ensured better fish growth, production and health condition. If applying this nanotechnology in fish feed industry then the fish feed industry will be enriched and fish farmer will be economically benefited through higher fish production. It is the first attempt to incorporate nanoparticles as feed additives serve as micronutrient to observe growth performance and physiological status of culturable fishes in Bangladesh.
After completion of this project, it can be developed nanoparticle enriched quality fish feed that will ensured nutritional quality of fish and produce healthy fish for human consumption. The commercial feed industries will be benefited by adopting this project finding technology and can improve their fish feed quality.
7. Sub-project goal: Improving nutritional quality of fish feed by applying nanoparticles that would ensure better growth and health of fish for human consumption.
8. Sub-project objective (s):
a) To prepare shape and size controlled nanoparticles of different metals under oilbath heating.
b) To synthesize nanomaterials (micronutrients) mediated feed for disease free fish growth.
c) To observe growth performance, meat quality (proximate compositions), haematological parameters and immune responses of fish by adding different doses of nanoparticles in experimental diet.
9. Implementing location (s): Dept. of Agronomy & Agricultural Extension, and Dept. of Fisheries, Rajshahi University, Rajshahi-6205.
10. Methodology in brief: Nanoparticles are fundamental to modern science and technology. Nanoparticulate material delivery to fish technology also holds the promise of controlled release smart fish feed formulation and site targeted delivery of various macromolecules needed for improved fish disease resistance, efficient nutrient utilization and enhanced fish growth.
10.1. Formulation of diet
10.1.1 Raw materials: (a) Metallic salts (Fe, Cu and Zn) (b) water, (c) Polyvinylpyrrolidone (PVP), (d) Basal diets prepared with locally available feed ingredients (Balance diet).
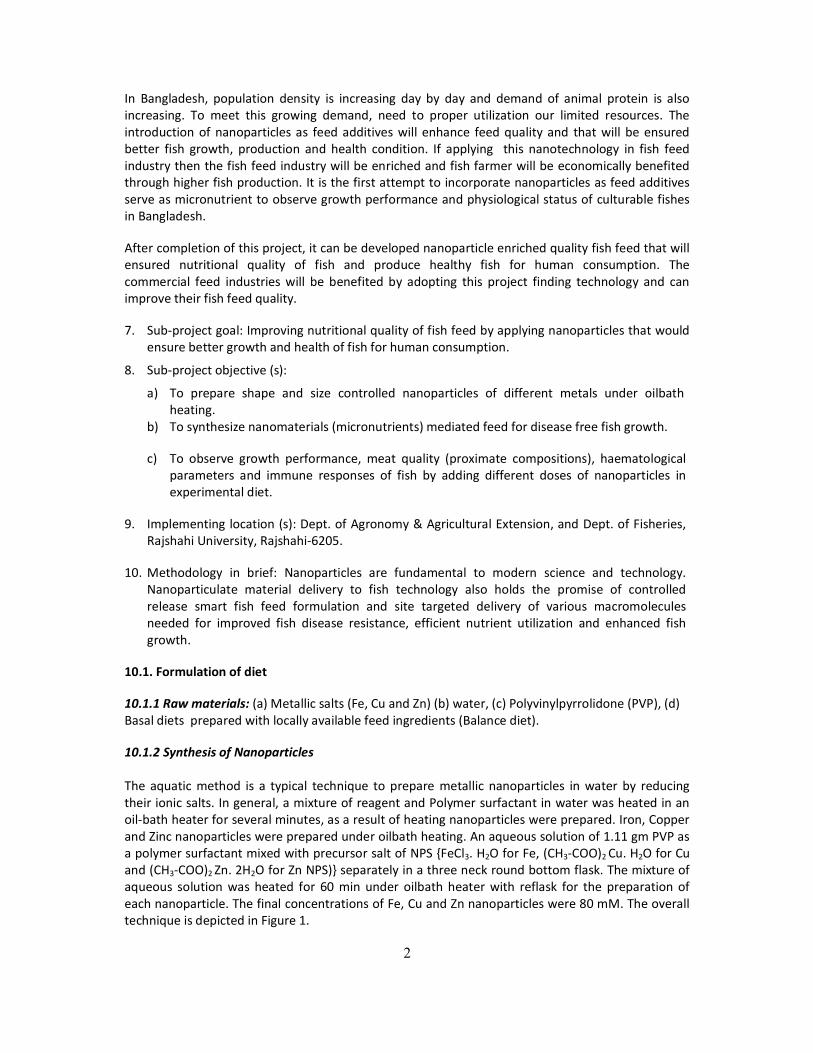
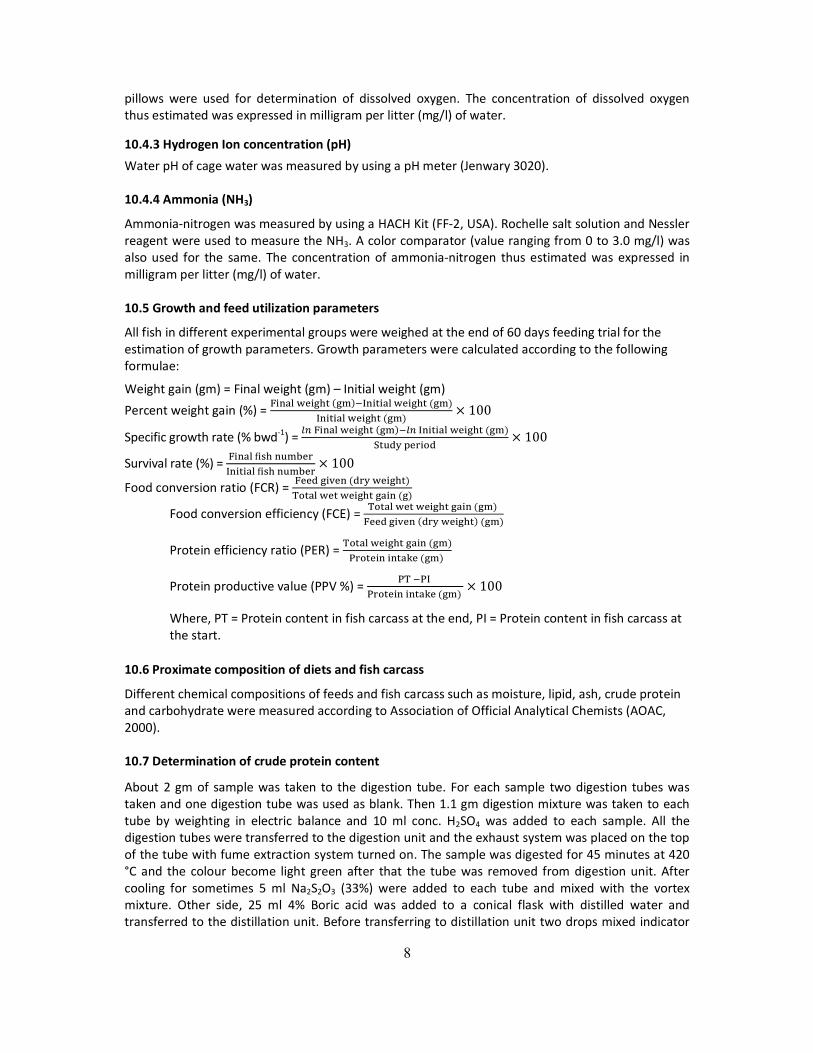
10.1.2 Synthesis of Nanoparticles The aquatic method is a typical technique to prepare metallic nanoparticles in water by reducing their ionic salts. In general, a mixture of reagent and Polymer surfactant in water was heated in an oil-bath heater for several minutes, as a result of heating nanoparticles were prepared. Iron, Copper and Zinc nanoparticles were prepared under oilbath heating. An aqueous solution of 1.11 gm PVP as a polymer surfactant mixed with precursor salt of NPS {FeCl3. H2O for Fe, (CH3-COO)2 Cu. H2O for Cu and (CH3-COO)2 Zn. 2H2O for Zn NPS)} separately in a three neck round bottom flask. The mixture of aqueous solution was heated for 60 min under oilbath heater with reflask for the preparation of each nanoparticle. The final concentrations of Fe, Cu and Zn nanoparticles were 80 mM. The overall technique is depicted in Figure 1.
3
Figure 1. Synthesis of NPs under oil bath heating
10.1.3 Characterization of Nanoparticles:
Morphologies of the Fe, Cu and Zn nanoparticles were characterized using a Scanning electron microscope (SEM; EVO 18, Courl Zesis, Germany at 200 kV). Product solutions were centrifuged at 12000 rpm three times for 30 min to ensure complete collection of the products each time. The precipitates were collected then re-dispersed in distilled water. Samples for SEM measurements were prepared by dropping a droplet of the colloidal solutions on the slide class. Ultraviolet-visible (UV-vis) extinction spectra were obtained (UV-1280; Shimadzu Corp.) using a quartz cell. The sample solution was diluted with w a t e r . 10.1.4 Preparation of diet:
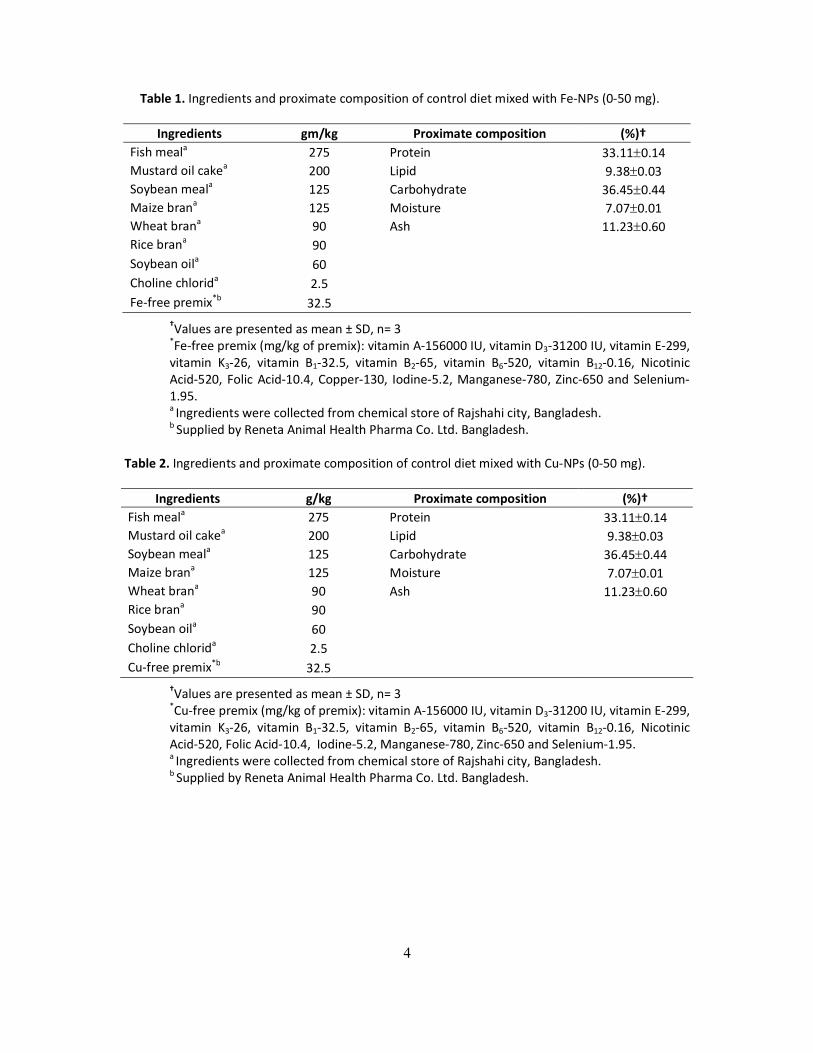
Ingredients and proximate composition of prepared control diet were shown in Table 1. All feed ingredients were purchased from local market and they were grinded in the laboratory to acquire fine powder. The powdered and sieved feed ingredients were weighed out and mixed thoroughly in 6 different ratios for preparing six different diets, one control and five different diets containing Fe-NPs, Cu-NPs, Zn-NPs and alloy (Fe-NPs and Zn-NPs) at various doses such as 0 (control-free from NPs), 10, 20, 30, 40 and 50 mg/kg dry feed weight. Then distilled water was added and blended well (5 min) until the mixture achieves a dough consistency. The dough was pelletized in a manual pelletizes fixed with 3 mm diameter and the pellets were collected in aluminum trays. A thermostatic hot air oven (Microsil INDIA, Universal Lab Product Co., Chennai, India) was used to dry the diets until the moisture content was reduced below 10%. After drying diets were kept at 20 oC until used. Ingredients and proximate composition of control diet were same due to prepare a balance fish diet, only differ in dose of NPs for evaluating the effective performance of all types of fishes.
4
Table 1. Ingredients and proximate composition of control diet mixed with Fe-NPs (0-50 mg).
Ingredients gm/kg Proximate composition (%)† Fish meala 275 Protein 33.110.14 Mustard oil cakea 200 Lipid 9.380.03 Soybean meala 125 Carbohydrate 36.450.44 Maize brana 125 Moisture 7.070.01 Wheat brana 90 Ash 11.230.60 Rice brana 90 Soybean oila 60 Choline chlorida 2.5 Fe-free premix*b 32.5
†Values are presented as mean ± SD, n= 3 *Fe-free premix (mg/kg of premix): vitamin A-156000 IU, vitamin D3-31200 IU, vitamin E-299, vitamin K3-26, vitamin B1-32.5, vitamin B2-65, vitamin B6-520, vitamin B12-0.16, Nicotinic Acid-520, Folic Acid-10.4, Copper-130, Iodine-5.2, Manganese-780, Zinc-650 and Selenium-1.95. a Ingredients were collected from chemical store of Rajshahi city, Bangladesh. b Supplied by Reneta Animal Health Pharma Co. Ltd. Bangladesh.
Table 2. Ingredients and proximate composition of control diet mixed with Cu-NPs (0-50 mg).
Ingredients g/kg Proximate composition (%)† Fish meala 275 Protein 33.110.14 Mustard oil cakea 200 Lipid 9.380.03 Soybean meala 125 Carbohydrate 36.450.44 Maize brana 125 Moisture 7.070.01 Wheat brana 90 Ash 11.230.60 Rice brana 90 Soybean oila 60 Choline chlorida 2.5 Cu-free premix*b 32.5
†Values are presented as mean ± SD, n= 3 *Cu-free premix (mg/kg of premix): vitamin A-156000 IU, vitamin D3-31200 IU, vitamin E-299, vitamin K3-26, vitamin B1-32.5, vitamin B2-65, vitamin B6-520, vitamin B12-0.16, Nicotinic Acid-520, Folic Acid-10.4, Iodine-5.2, Manganese-780, Zinc-650 and Selenium-1.95. a Ingredients were collected from chemical store of Rajshahi city, Bangladesh. b Supplied by Reneta Animal Health Pharma Co. Ltd. Bangladesh.
5
Table 3. Ingredients and proximate composition of control diet mixed with Zn-NPs (0-50 mg)
Ingredients g/kg Proximate composition (%)† Fish meala 275 Protein 33.110.14 Mustard oil cakea 200 Lipid 9.380.03 Soybean meala 125 Carbohydrate 36.450.44 Maize brana 125 Moisture 7.070.01 Wheat brana 90 Ash 11.230.60 Rice brana 90 Soybean oila 60 Choline chlorida 2.5 Zn-free premix*b 32.5
†Values are presented as mean ± SD, n= 3 *Zn-free premix (mg/kg of premix): vitamin A-156000 IU, vitamin D3-31200 IU, vitamin E-299, vitamin K3-26, vitamin B1-32.5, vitamin B2-65, vitamin B6-520, vitamin B12-0.16, Nicotinic Acid-520, Folic Acid-10.4, Copper-130, Iodine-5.2, Manganese-780, and Selenium-1.95. a Ingredients were collected from chemical store of Rajshahi city, Bangladesh. b Supplied by Reneta Animal Health Pharma Co. Ltd. Bangladesh.
Table 4. Ingredients and proximate composition of control diet mixed with alloy (combination of Fe-NPs and Zn-NPs, 0-50 mg)
Ingredients g/kg Proximate composition (%)† Fish meala 275 Protein 33.110.14 Mustard oil cakea 200 Lipid 9.380.03 Soybean meala 125 Carbohydrate 36.450.44 Maize brana 125 Moisture 7.070.01 Wheat brana 90 Ash 11.230.60 Rice brana 90 Soybean oila 60 Choline chlorida 2.5 alloy-free premix*b 32.5
†Values are presented as mean ± SD, n= 3 *Fe, Zn-free premix (mg/kg of premix): vitamin A-156000 IU, vitamin D3-31200 IU, vitamin E-299, vitamin K3-26, vitamin B1-32.5, vitamin B2-65, vitamin B6-520, vitamin B12-0.16, Nicotinic Acid-520, Folic Acid-10.4, Copper-130, Iodine-5.2, Manganese-780 and Selenium-1.95. a Ingredients were collected from chemical store of Rajshahi city, Bangladesh. b Supplied by Reneta Animal Health Pharma Co. Ltd. Bangladesh.
10.2 Collection and maintenance of experimental fishes
Juveniles of B. gonionotus and L. rohita having an average weight of 33.45±0.23 and 33.53±0.20 gm, respectively were purchased from Fish Seed Hatchery, Rajshahi and transported live in aerated plastic bags to the laboratory of Department of Fisheries, University of Rajshahi. Fishes were kept in a circular cemented tank having flow through system and were acclimatized for a period of two weeks. During the acclimatization period water temperature was maintained at optimum range as 27-30 oC, with a photoperiod of 12 hrs light and 12 hrs darkness.
6
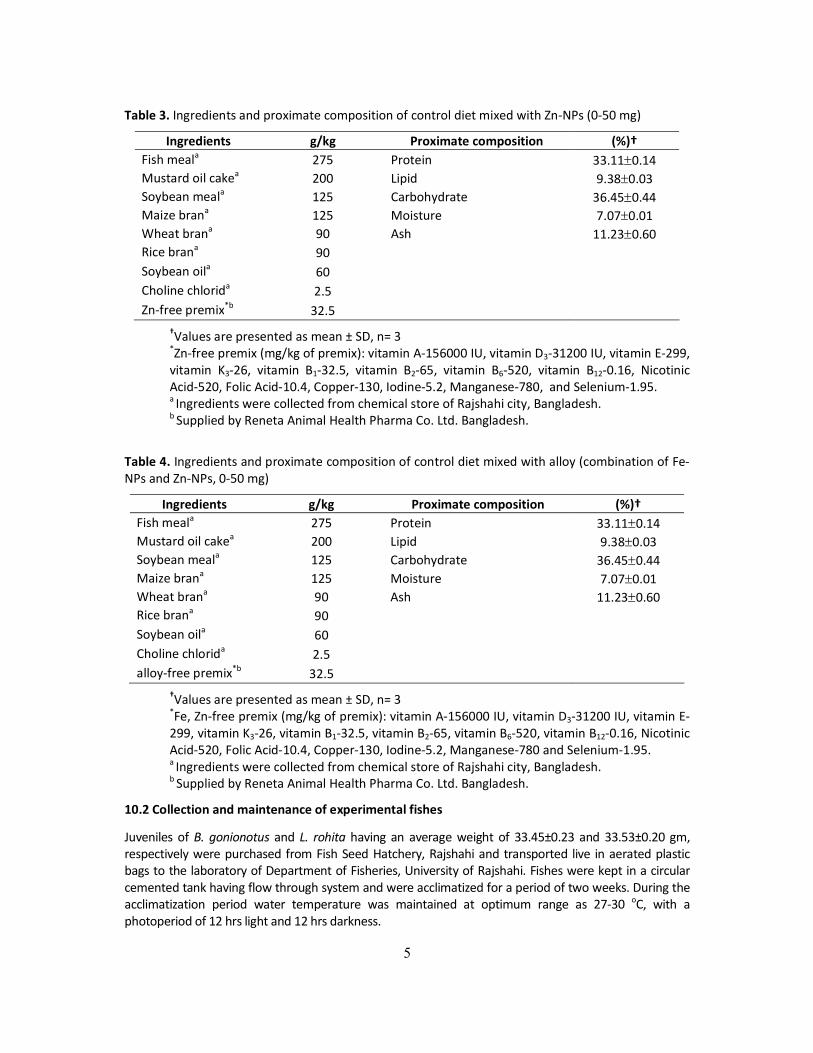
10.3 Experimental design
Three experiments were conducted during the study period. In the first experiment Effect of different nanoparticle on growth and physiology of B. gonionotus In experiment-2 Effect of different NPS on growth and physiology of L. rohita. In the third experiment, Effect of alloy on growth and physiology of B. gonionotus and L. rohita. Two best NPs among the three were selected, based on their growth and physiological performance on experimental fishes and mixed together to form alloy. The alloy was then used to evaluate the growth and physiological performance of experimental fishes in a dose dependent manner. Finally, statistical analysis was done to select best NPs and their corresponding fish species based on growth and physiological parameters.
Experiment 1: Effect of different NPS on growth and physiology of B. gonionotus.
Nanoparticles (NPS)
Dose of NPS (mg/kg feed) Feeding rate
No of fish/Aquarium
Nos/Aqu-arium
Days of culture
Replication
Fe-NPS 0 10 20 30 40 50 3% body weight
10 18 60 3
Cu-NPS 0 10 20 30 40 50
Zn-NPS 0 10 20 30 40 50
Experiment 2: Effect of different NPS on growth and physiology of L. rohita.
Nanoparticles (NPS)
Dose of NPS (mg/kg feed) Feeding rate
No of fish/Aquarium
Nos/Aqu-arium
Days of culture
Replication
Fe-NPS 0 10 20 30 40 50 3% body weight
10 18 60 3
Cu-NPS 0 10 20 30 40 50
Zn-NPS 0 10 20 30 40 50
Experiment 3: Effect of alloy (Fe NPS and Zn NPS) on growth and physiology of B. gonionotus and L. rohita.
Nanoparticles (NPS)
Dose of NPS (mg/kg feed) Feeding rate
No of fish/Aquarium
Nos/Aqu-arium
Days of culture
Replication
Alloy
(Fe-Zn) NPS
0 10 20 30 40 50 3% body
weight
10 18 60 3
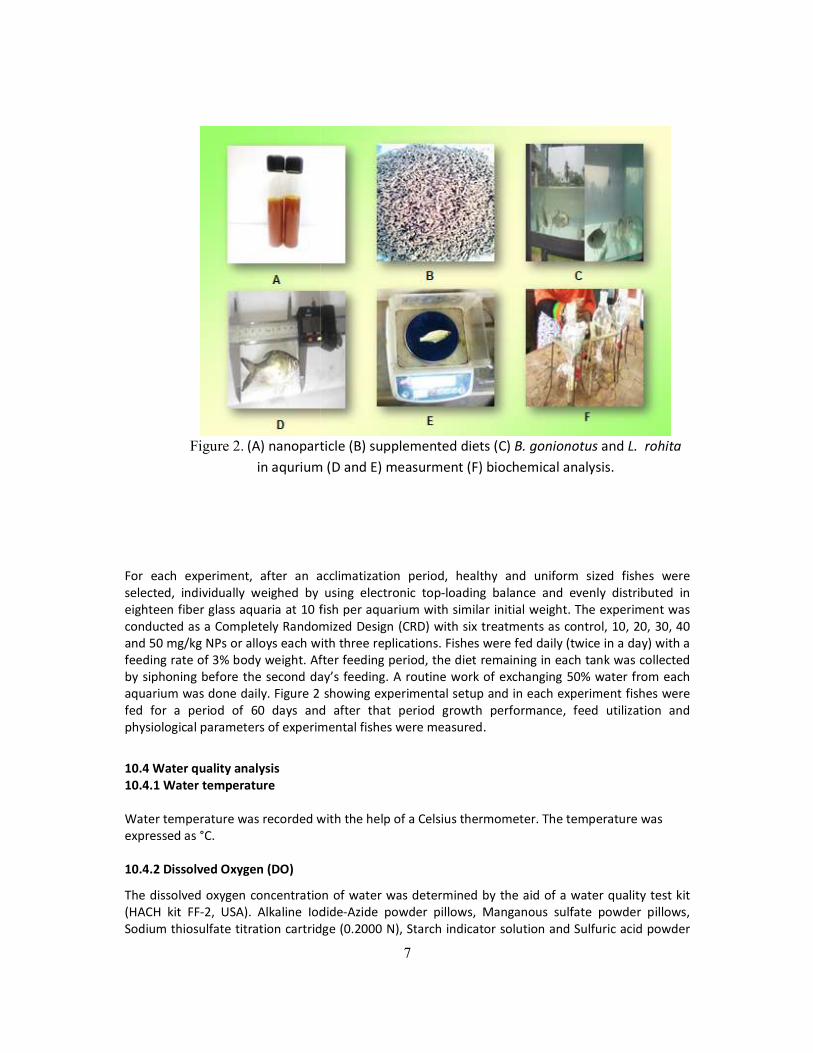
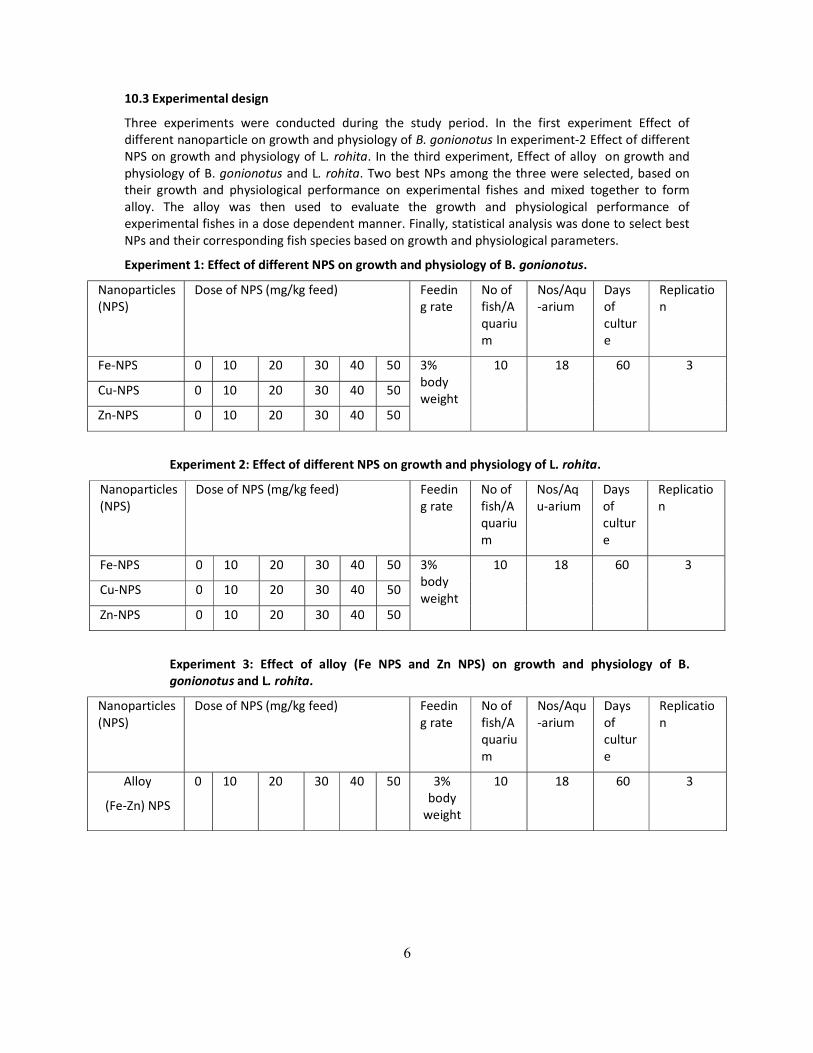
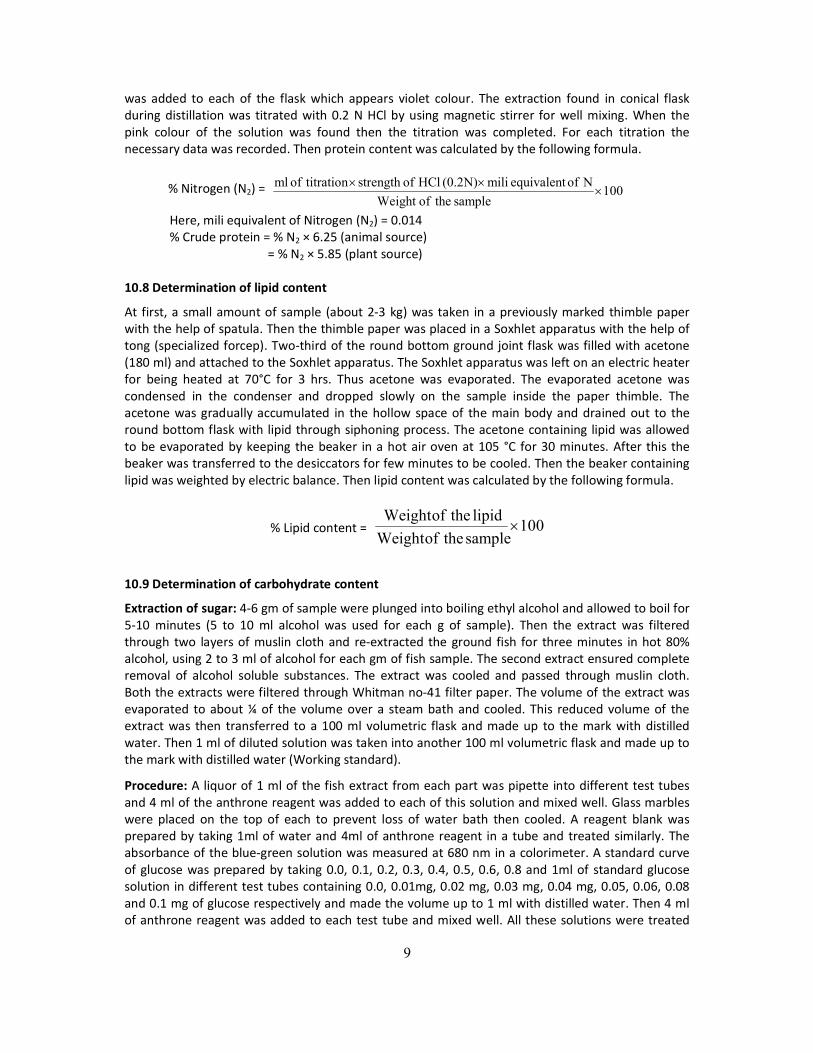
For each experiment, after an acclimatization period, healthy and uniform sized fishes were selected, individually weighed by using electronic topeighteen fiber glass aquaria at 10 fish per aquarium with similar initial weight. The exconducted as a Completely Randomized Design (CRD) with six treatments as control, 10, 20, 30, 40 and 50 mg/kg NPs or alloys each with three replications. Fishes were fed daily (twice feeding rate of 3% body weight. After feediby siphoning before the second day’s feeding. A routine work of exchanging 50% water from each aquarium was done daily. Figure 2 fed for a period of 60 days and after that period growth performance, feed utilization and physiological parameters of experimental fishes were measured.
10.4 Water quality analysis 10.4.1 Water temperature Water temperature was recorded with the help of a expressed as °C. 10.4.2 Dissolved Oxygen (DO)
The dissolved oxygen concentration of water was determined by the aid of a water quality test kit (HACH kit FF-2, USA). Alkaline IodideSodium thiosulfate titration cartridge (0.2000 N), St
Figure 2. (A) nanoparticle (B) supplemented diets (C) in aqurium (D and E) measurment (F)
7
after an acclimatization period, healthy and uniform sized fishes were selected, individually weighed by using electronic top-loading balance and evenly distributed in eighteen fiber glass aquaria at 10 fish per aquarium with similar initial weight. The exconducted as a Completely Randomized Design (CRD) with six treatments as control, 10, 20, 30, 40 and 50 mg/kg NPs or alloys each with three replications. Fishes were fed daily (twice in feeding rate of 3% body weight. After feeding period, the diet remaining in each tank was collected by siphoning before the second day’s feeding. A routine work of exchanging 50% water from each
showing experimental setup and in each experiment fishes were a period of 60 days and after that period growth performance, feed utilization and
physiological parameters of experimental fishes were measured.
Water temperature was recorded with the help of a Celsius thermometer. The temperature was
The dissolved oxygen concentration of water was determined by the aid of a water quality test kit 2, USA). Alkaline Iodide-Azide powder pillows, Manganous sulfate powder pillows,
Sodium thiosulfate titration cartridge (0.2000 N), Starch indicator solution and Sulfuric
(A) nanoparticle (B) supplemented diets (C) B. gonionotus andin aqurium (D and E) measurment (F) biochemical analysis.
after an acclimatization period, healthy and uniform sized fishes were loading balance and evenly distributed in
eighteen fiber glass aquaria at 10 fish per aquarium with similar initial weight. The experiment was conducted as a Completely Randomized Design (CRD) with six treatments as control, 10, 20, 30, 40
in a day) with a ng period, the diet remaining in each tank was collected
by siphoning before the second day’s feeding. A routine work of exchanging 50% water from each each experiment fishes were
a period of 60 days and after that period growth performance, feed utilization and
Celsius thermometer. The temperature was
The dissolved oxygen concentration of water was determined by the aid of a water quality test kit sulfate powder pillows,
furic acid powder
and L. rohita
biochemical analysis.
8
pillows were used for determination of dissolved oxygen. The concentration of dissolved oxygen thus estimated was expressed in milligram per litter (mg/l) of water.
10.4.3 Hydrogen Ion concentration (pH)
Water pH of cage water was measured by using a pH meter (Jenwary 3020). 10.4.4 Ammonia (NH3)
Ammonia-nitrogen was measured by using a HACH Kit (FF-2, USA). Rochelle salt solution and Nessler reagent were used to measure the NH3. A color comparator (value ranging from 0 to 3.0 mg/l) was also used for the same. The concentration of ammonia-nitrogen thus estimated was expressed in milligram per litter (mg/l) of water. 10.5 Growth and feed utilization parameters
All fish in different experimental groups were weighed at the end of 60 days feeding trial for the estimation of growth parameters. Growth parameters were calculated according to the following formulae:
Weight gain (gm) = Final weight (gm) – Initial weight (gm)
Percent weight gain (%) = ( ) ( )
( )× 100
Specific growth rate (% bwd-1) = ( ) ( )
× 100
Survival rate (%) =
× 100
Food conversion ratio (FCR) = ( )
( )
Food conversion efficiency (FCE) = ( )
( ) ( )
Protein efficiency ratio (PER) = ( )
( )
Protein productive value (PPV %) =
( ) × 100
Where, PT = Protein content in fish carcass at the end, PI = Protein content in fish carcass at the start.
10.6 Proximate composition of diets and fish carcass
Different chemical compositions of feeds and fish carcass such as moisture, lipid, ash, crude protein and carbohydrate were measured according to Association of Official Analytical Chemists (AOAC, 2000). 10.7 Determination of crude protein content
About 2 gm of sample was taken to the digestion tube. For each sample two digestion tubes was taken and one digestion tube was used as blank. Then 1.1 gm digestion mixture was taken to each tube by weighting in electric balance and 10 ml conc. H2SO4 was added to each sample. All the digestion tubes were transferred to the digestion unit and the exhaust system was placed on the top of the tube with fume extraction system turned on. The sample was digested for 45 minutes at 420 °C and the colour become light green after that the tube was removed from digestion unit. After cooling for sometimes 5 ml Na2S2O3 (33%) were added to each tube and mixed with the vortex mixture. Other side, 25 ml 4% Boric acid was added to a conical flask with distilled water and transferred to the distillation unit. Before transferring to distillation unit two drops mixed indicator
9
was added to each of the flask which appears violet colour. The extraction found in conical flask during distillation was titrated with 0.2 N HCl by using magnetic stirrer for well mixing. When the pink colour of the solution was found then the titration was completed. For each titration the necessary data was recorded. Then protein content was calculated by the following formula.
% Nitrogen (N2) = 100sampletheofWeight
N of equivalent mili(0.2N) HCl ofstrength titrationof ml
Here, mili equivalent of Nitrogen (N2) = 0.014 % Crude protein = % N2 × 6.25 (animal source)
= % N2 × 5.85 (plant source) 10.8 Determination of lipid content
At first, a small amount of sample (about 2-3 kg) was taken in a previously marked thimble paper with the help of spatula. Then the thimble paper was placed in a Soxhlet apparatus with the help of tong (specialized forcep). Two-third of the round bottom ground joint flask was filled with acetone (180 ml) and attached to the Soxhlet apparatus. The Soxhlet apparatus was left on an electric heater for being heated at 70°C for 3 hrs. Thus acetone was evaporated. The evaporated acetone was condensed in the condenser and dropped slowly on the sample inside the paper thimble. The acetone was gradually accumulated in the hollow space of the main body and drained out to the round bottom flask with lipid through siphoning process. The acetone containing lipid was allowed to be evaporated by keeping the beaker in a hot air oven at 105 °C for 30 minutes. After this the beaker was transferred to the desiccators for few minutes to be cooled. Then the beaker containing lipid was weighted by electric balance. Then lipid content was calculated by the following formula.
% Lipid content = 100sampletheofWeight
lipidtheofWeight
10.9 Determination of carbohydrate content
Extraction of sugar: 4-6 gm of sample were plunged into boiling ethyl alcohol and allowed to boil for 5-10 minutes (5 to 10 ml alcohol was used for each g of sample). Then the extract was filtered through two layers of muslin cloth and re-extracted the ground fish for three minutes in hot 80% alcohol, using 2 to 3 ml of alcohol for each gm of fish sample. The second extract ensured complete removal of alcohol soluble substances. The extract was cooled and passed through muslin cloth. Both the extracts were filtered through Whitman no-41 filter paper. The volume of the extract was evaporated to about ¼ of the volume over a steam bath and cooled. This reduced volume of the extract was then transferred to a 100 ml volumetric flask and made up to the mark with distilled water. Then 1 ml of diluted solution was taken into another 100 ml volumetric flask and made up to the mark with distilled water (Working standard).
Procedure: A liquor of 1 ml of the fish extract from each part was pipette into different test tubes and 4 ml of the anthrone reagent was added to each of this solution and mixed well. Glass marbles were placed on the top of each to prevent loss of water bath then cooled. A reagent blank was prepared by taking 1ml of water and 4ml of anthrone reagent in a tube and treated similarly. The absorbance of the blue-green solution was measured at 680 nm in a colorimeter. A standard curve of glucose was prepared by taking 0.0, 0.1, 0.2, 0.3, 0.4, 0.5, 0.6, 0.8 and 1ml of standard glucose solution in different test tubes containing 0.0, 0.01mg, 0.02 mg, 0.03 mg, 0.04 mg, 0.05, 0.06, 0.08 and 0.1 mg of glucose respectively and made the volume up to 1 ml with distilled water. Then 4 ml of anthrone reagent was added to each test tube and mixed well. All these solutions were treated
10
similarly as described above. The absorbance was measured at 680 nm using the blank containing 1 ml of water 4 ml of anthrone reagent. The amount of free sugar was calculated from the standard curve of glucose. The carbohydrate content was calculated by the following formula.
% of carbohydrate = 100feedtheofWeight
tesCarbohydraofAmount
10.10 Determination of ash content
At first the marked empty crucible was taken and weighted by using by electric balance. Then 2-3 gm of sample was taken into the crucible and weighted. Then the crucible with sample was kept in a muffle furnace at 550 °C for 6 hrs. Then the muffle furnace was stopped and allowed to cool but it was not open because of its high temperature. After a certain period, when the muffle furnace was fully cooled, the sample was taken out by using spatula. Then the sample was weighted by using same electric balance. Then ash content was calculated by the following formula.
% Ash content = 100sampletheofWeight
ashofWeight
10.11 Determination of moisture content Marking the empty crucible according to the sample used. Their weight was taken by using an electric balance and recorded. Then about 2-3 gm of each of the sample was weighted out into the clean weighted crucible by using the sample balance. Then the crucible with samples was placed in a hot air oven at 105 °C for 24 hrs. Then the sample was carefully taken out from oven by using a specialized forceps and kept in desiccators for cooling. Finally the weight was taken again. The difference in weights represents the moisture content of the sample. Then moisture content was calculated by the following formula.
% of the moisture = 100C
D-B %
Where, B = Weight of crucible + Sample (gm)
D = Weight of crucible + Dry sample (gm)
C = Weight of sample (gm) 10.12 Serum biochemical profile
At the end of feeding trial, two fish from each treated group was randomly selected for measurement of serum biochemical profile. The blood was drawn from caudal vein of individual fish and were transferred into sterile tubes without any addition of anticoagulant and kept for 3 hours in slanting position. Samples were centrifuged at 5000 rpm for 10 minutes at 4 oC. Sera were collected by one ml auto-pipette. The collected sera samples were stored in deep freeze at -20 °C for serum biochemical studies. Red blood cells (RBCs) and white blood cells (WBCs) diluting fluids were used for determining total erythrocyte and leucocyte counts. It was done by mixing 20 µl of blood with 3,980 µl of the corresponding diluting fluid in a clean test tube. The hemoglobin level of blood was analyzed following the cyanomethemoglobin method using Drabkins Fluid (Qualigens Chemicals) (Darbkin, 1945). The absorbance was measured using a spectrophotometer at 540 nm and the final concentration was calculated by comparing with the standard cyanmethemoglobin (Qualigens Chemicals). The hemoglobin concentration was then calculated using the following formula: hemoglobin (g/dl) = [OD (T)/OD (S)] × [251/ 1,000] × 60 where OD (T) is the absorbance of the test and OD (S) the absorbance of the standard. Total protein, cholesterol, triglyceride, high density lipoprotein (HDL), low density lipoprotein (LDL), alanine aminotransferase (ALT), aspartate
11
aminotransferase (AST) and alkaline phosphatase (ALP) were estimated by atomic absorption spectrophotometry using the kits prepared by Crest Biosystems®. Serum iron content was estimated by Biuret and bromocresol green (BCG) dye binding method (Dumas et al., 1971).
10.13 Statistical analysis
In the experiments, the data were analyzed by one-way analysis of variance to select suitable dose of each nanoparticles. The percentage and ratio data that didn’t show normal distribution by Kolmogorov-Smirnov test (P > 0.05) were analyzed after normalization using arcsine transformed data. All analyses were performed using SPSS (Statistical Package for Social Science) version 20.0 (IBM Corporation, Armonk, NY, USA). Data were expressed as mean ± SD. 10.14 Materials and methods (Field experiment) 10.14.1 Experimental design The experiment was conducted in 2 earthen ponds with 1 replication each (17 bigha) for a period of 180 days (March’2018-Auguest’2018) in selected farmer’s ponds in Mohonpur, Rajshahi district. Pond 1 (Nano feed) and Pond 2 (commercial Pellet feed). 10.14.2 Preparation and stocking of experimental ponds The ponds used for this experiment were rectangular in shape and were fully exposed to prevailing sunlight. The main sources of water of the ponds were rainfall and deep tube well. Before starting the experiment the aquatic weeds of the ponds were removed completely by manual effort. All unwanted fishes and other larger aquatic organisms were eradicated by application of rotenone at the rate of 2.5 gm m-3 followed by repeated netting. After one week of rotenone application, the ponds were limed at the rate of 247 kg/ha. One week after liming, the ponds were filled with water from adjacent deep tube-well. Then the ponds were fertilized with urea and TSP at the rate of 38 and 20 kg/ha, respectively. After the preparation of the ponds, fishes such as L.rohita, Cirhinus cirrhosis, Catla catla, Ctenopharyngodon idellus, Mylopharyngodon piceus, Hypophthalmichthys molitrix and L.calbasu were stocked. 10.14.3 Water quality monitoring
Water samples were collected fortnightly (twice in a month) between 10:00 and 11:00 hours for the analysis of various physico-chemical parameters using dark bottles. Water temperature and transparency were measured using a Celsius Thermometer and a black and white standard colour coded Secchi disc of 30 cm diameter. Water pH was measured using an electronic pH meter (Jenwary, 3020) and dissolved oxygen (DO) was measured directly with a DO meter (Lutron, DO-5509). Total alkalinity was measured using a HACH water analysis kit (Model FF-2, USA).
10.14.4 Formulation of diet
Ingredients and proximate composition of prepared control diet were shown in Table 1-5. All feed ingredients were purchased from local market and in the laboratory they were grinded to acquire fine powder. The powdered and sieved feed ingredients were weighed out and mixed thoroughly for preparing diets. Then distilled water was added and blending well (10 min) until the mixture achieves a dough consistency. The dough was pelletized in a manual pelletizer fixed with 3 mm diameter and the pellets were collected in aluminum trays. A thermostatic hot air oven (Microsil INDIA, Universal Lab Product Co., Chennai, India) was used to dry the diets until the moisture content was reduced below 10%. After drying diets were kept at 20 oC until used. The cost of the formulated diet was 30 BDT/kg. A commercial diet was collected from the market to compare with experimental diet. The cost of commercial diet was 28 BDT/kg.
12
Table 5. Ingredients and proximate composition of control diet mixed with Zn-NPs
Ingredients g/kg Proximate composition (%)† Fish meala 275 Protein 33.110.14 Mustard oil cakea 200 Lipid 9.380.03 Soybean meala 125 Carbohydrate 36.450.44 Maize brana 125 Moisture 7.070.01 Wheat brana 90 Ash 11.230.60 Rice brana 90 Soybean oila 60 Choline chlorida 2.5 Zn-free premix*b 32.5 Zn-NPs 0.04
†Values are presented as mean ± SD, n= 3 *Zn-free premix (mg/kg of premix): vitamin A-156000 IU, vitamin D3-31200 IU, vitamin E-299, vitamin K3-26, vitamin B1-32.5, vitamin B2-65, vitamin B6-520, vitamin B12-0.16, Nicotinic Acid-520, Folic Acid-10.4, Copper-130, Iodine-5.2, Manganese-780, and Selenium-1.95. a Ingredients purched from local market of Rajshahi, Bangladadesh. b Supplied by Reneta Animal Health Pharma Co. Ltd. Bangladesh.
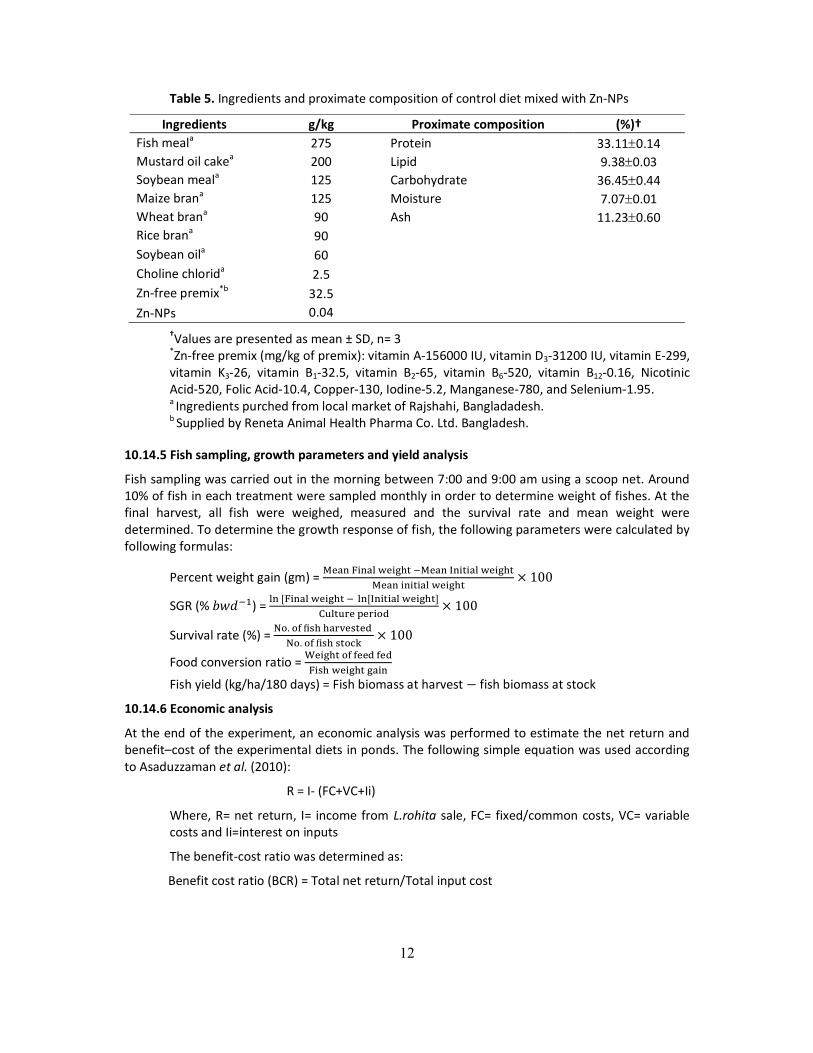
10.14.5 Fish sampling, growth parameters and yield analysis
Fish sampling was carried out in the morning between 7:00 and 9:00 am using a scoop net. Around 10% of fish in each treatment were sampled monthly in order to determine weight of fishes. At the final harvest, all fish were weighed, measured and the survival rate and mean weight were determined. To determine the growth response of fish, the following parameters were calculated by following formulas:
Percent weight gain (gm) =
× 100
SGR (% 𝑏𝑤𝑑 ) = [ [ ]
× 100
Survival rate (%) = . .
× 100
Food conversion ratio =
Fish yield (kg/ha/180 days) = Fish biomass at harvest − fish biomass at stock
10.14.6 Economic analysis
At the end of the experiment, an economic analysis was performed to estimate the net return and benefit–cost of the experimental diets in ponds. The following simple equation was used according to Asaduzzaman et al. (2010):
R = I- (FC+VC+Ii)
Where, R= net return, I= income from L.rohita sale, FC= fixed/common costs, VC= variable costs and Ii=interest on inputs
The benefit-cost ratio was determined as:
Benefit cost ratio (BCR) = Total net return/Total input cost
10.14.7 Statistical analysis
Water quality, fish growth and yield parameters and economic performance were analyzed by independent sample t-test and significance level was evaluated at 5%. The data were analyzed using arcsine transformed data. All the analyses were performed using SPSS (Statistical Package for Social Science) version 20.0 (IBM Corporation, Armonk, NY, USA).
11. Results and discussion
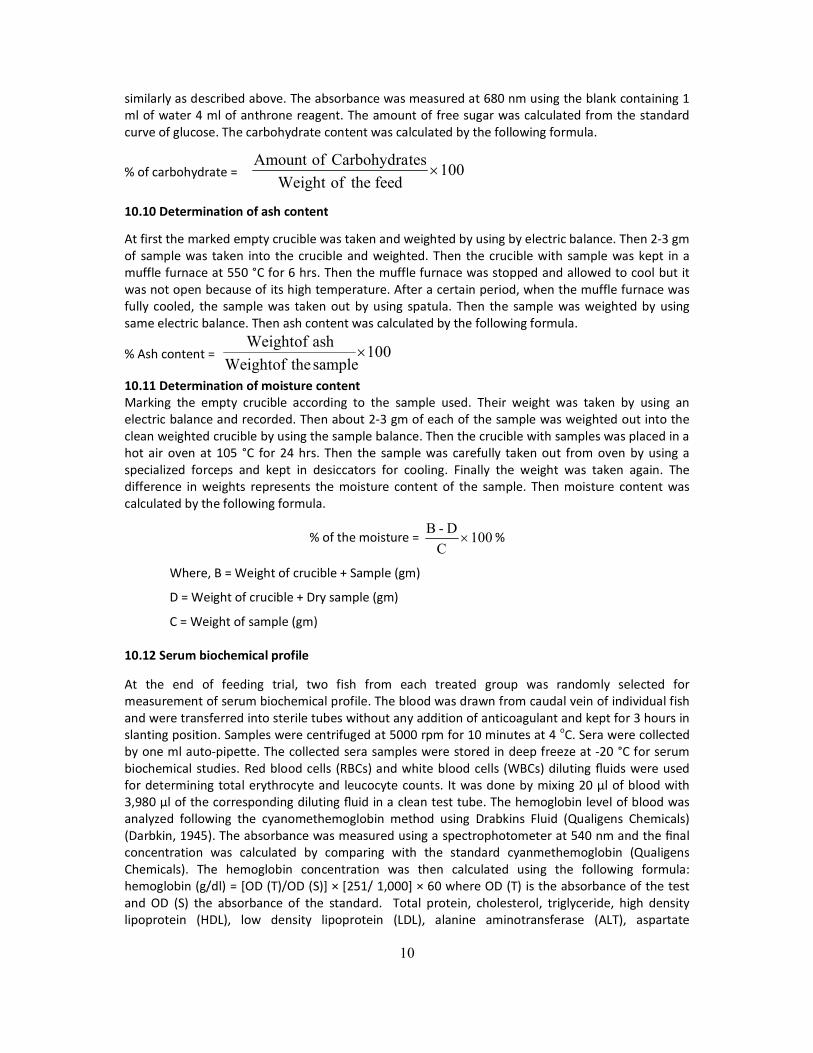
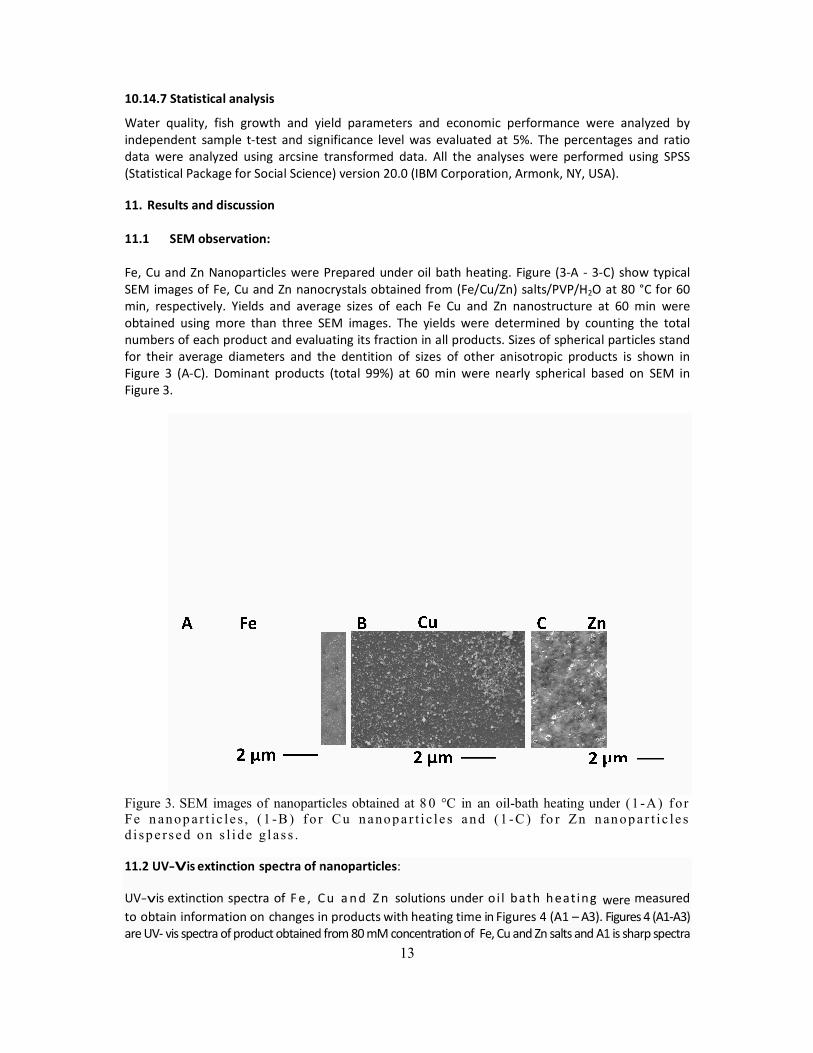
11.1 SEM observation: Fe, Cu and Zn Nanoparticles were Prepared under oil bath heatingSEM images of Fe, Cu and Zn nanocrystals obtained frommin, respectively. Yields and average sizes of each Fe Cu and Zn obtained using more than three SEM imagesnumbers of each product and evaluating its fraction in all products. Sizes of spherical particles stand for their average diameters and the Figure 3 (A-C). Dominant products (total 99%) at 60 min were nearly spherical based on SEM in Figure 3.
Figure 3. SEM images of nanoparticlesFe n anop ar t i c le s , ( 1 -B ) f o r Cu nanop a r t i c le s a n d d i sp e r se d on s l i de g l as s .
11.2 UV-Vis extinction spectra of nanoparticles
UV-vis extinction spectra of F e , C u a n d Z nto obtain information on changes in productsare UV- vis spectra of product obtained from
13
Water quality, fish growth and yield parameters and economic performance were analyzed by test and significance level was evaluated at 5%. The percentages and ratio
data were analyzed using arcsine transformed data. All the analyses were performed using SPSS (Statistical Package for Social Science) version 20.0 (IBM Corporation, Armonk, NY, USA).
and Zn Nanoparticles were Prepared under oil bath heating. Figure (3-A - 3-Cnanocrystals obtained from (Fe/Cu/Zn) salts/PVP/H2O at 80 °C for 60
min, respectively. Yields and average sizes of each Fe Cu and Zn nanostructure at 60 minobtained using more than three SEM images. The yields were determined by counting the total numbers of each product and evaluating its fraction in all products. Sizes of spherical particles stand
the dentition of sizes of other anisotropic products is shown in C). Dominant products (total 99%) at 60 min were nearly spherical based on SEM in
particles obtained at 8 0 °C in an oil-bath heating underfo r Cu n anop a r t i c le s a n d (1 -C ) fo r Zn n ano p a r t i c l e s
spectra of nanoparticles:
F e , C u a n d Z n solutions under o i l bath h eat ing werein products with heating time in Figures 4 (A1 – A3). Figures
vis spectra of product obtained from 80 mM concentration of Fe, Cu and Zn salts and A1 is sharp spectra
Water quality, fish growth and yield parameters and economic performance were analyzed by percentages and ratio
data were analyzed using arcsine transformed data. All the analyses were performed using SPSS (Statistical Package for Social Science) version 20.0 (IBM Corporation, Armonk, NY, USA).
C) show typical O at 80 °C for 60
nanostructure at 60 min were The yields were determined by counting the total
numbers of each product and evaluating its fraction in all products. Sizes of spherical particles stand of sizes of other anisotropic products is shown in
C). Dominant products (total 99%) at 60 min were nearly spherical based on SEM in
under (1 -A) f or
fo r Zn nan op ar t i c le s
were measured Figures 4 (A1-A3) 1 is sharp spectra
14
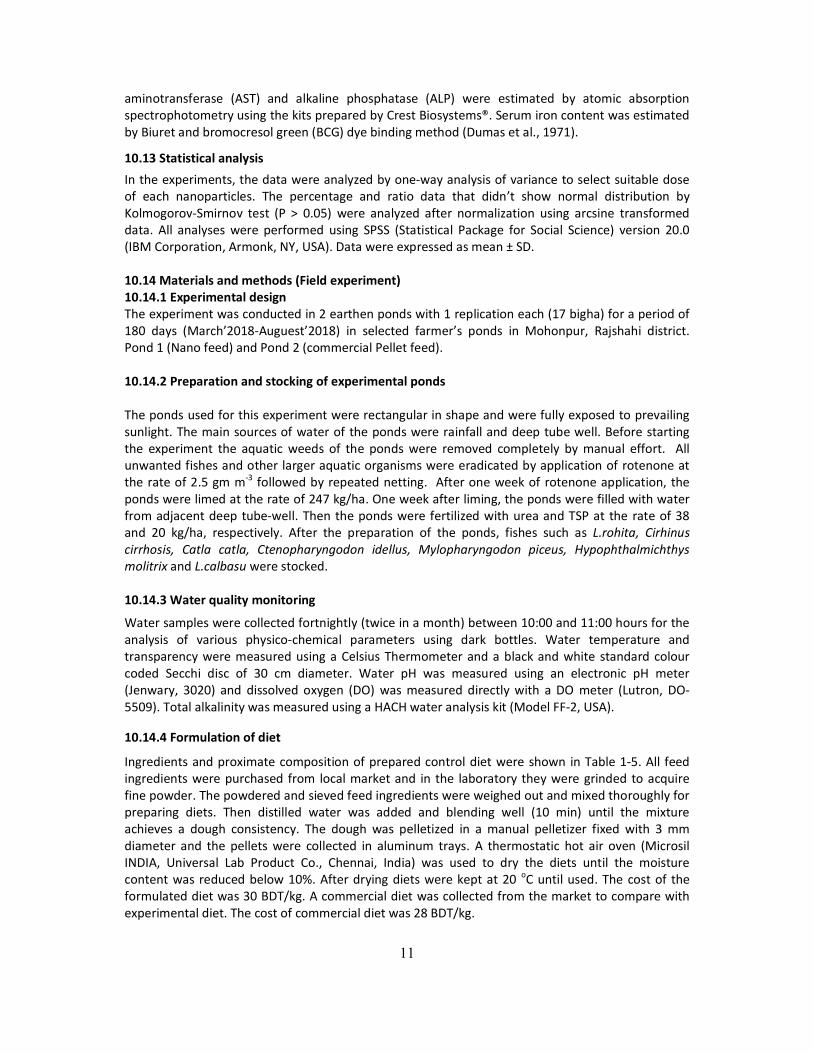
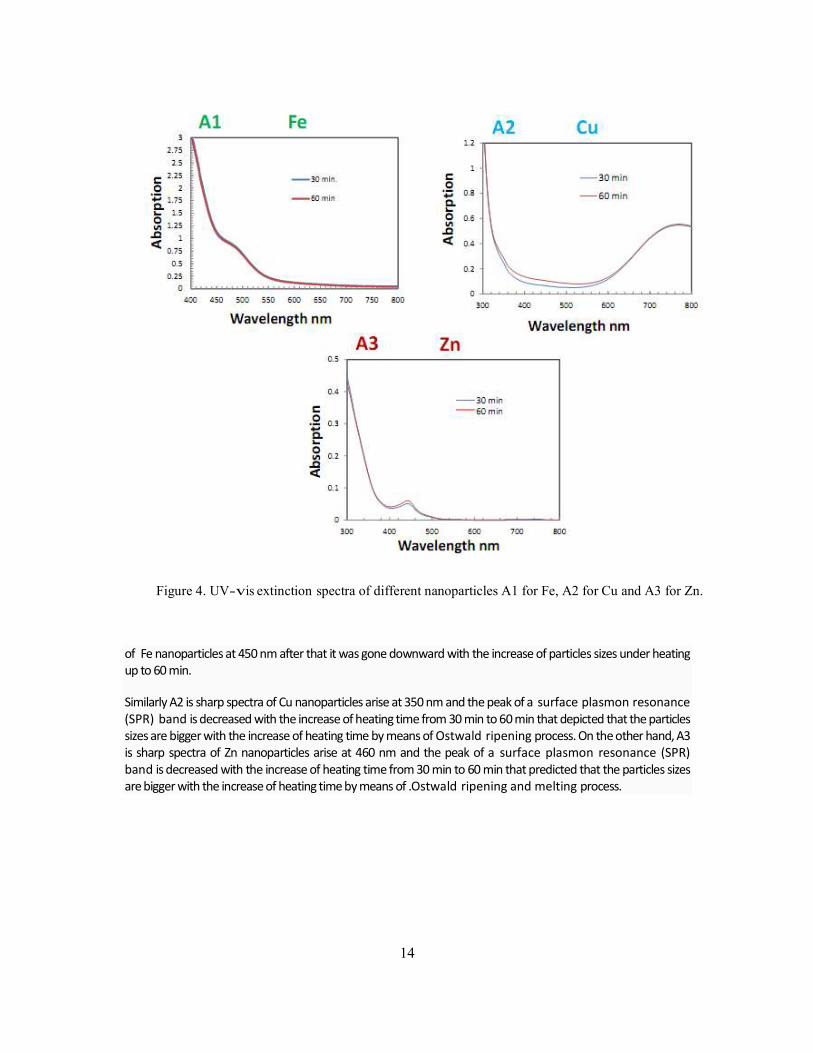
Figure 4. UV-vis extinction spectra of different nanoparticles A1 for Fe, A2 for Cu and A3 for Zn.
of Fe nanoparticles at 450 nm after that it was gone downward with the increase of particles sizes under heating up to 60 min.
Similarly A2 is sharp spectra of Cu nanoparticles arise at 350 nm and the peak of a surface plasmon resonance (SPR) band is decreased with the increase of heating time from 30 min to 60 min that depicted that the particles sizes are bigger with the increase of heating time by means of Ostwald ripening process. On the other hand, A3 is sharp spectra of Zn nanoparticles arise at 460 nm and the peak of a surface plasmon resonance (SPR) band is decreased with the increase of heating time from 30 min to 60 min that predicted that the particles sizes are bigger with the increase of heating time by means of .Ostwald ripening and melting process.
15
Similarly A2 is sharp spectgra of Cu manuparticles arise at 350 nm and the peak of a surface plasmon resonance (SPR) band is decrerased with the increase of heating time from 30 min to 60 min that depicted that the particles sizes are bigger with the increase of heating time by means of Ostwald ripening process. On the other hand A3 is sharp spectra of Zn nanoparticles arise at 460 nm and the peak of a surface plasmon resonance (SPR) band is decreased with the increase of heating time from 30 min to 60 min that predicted that the particles sizes are bigger with the increase of heating time by means of Ostwald ripening and melting process.
11.3 (Experiment-1): Effect of different nanoparticle on growth and physiology of B. gonionotus
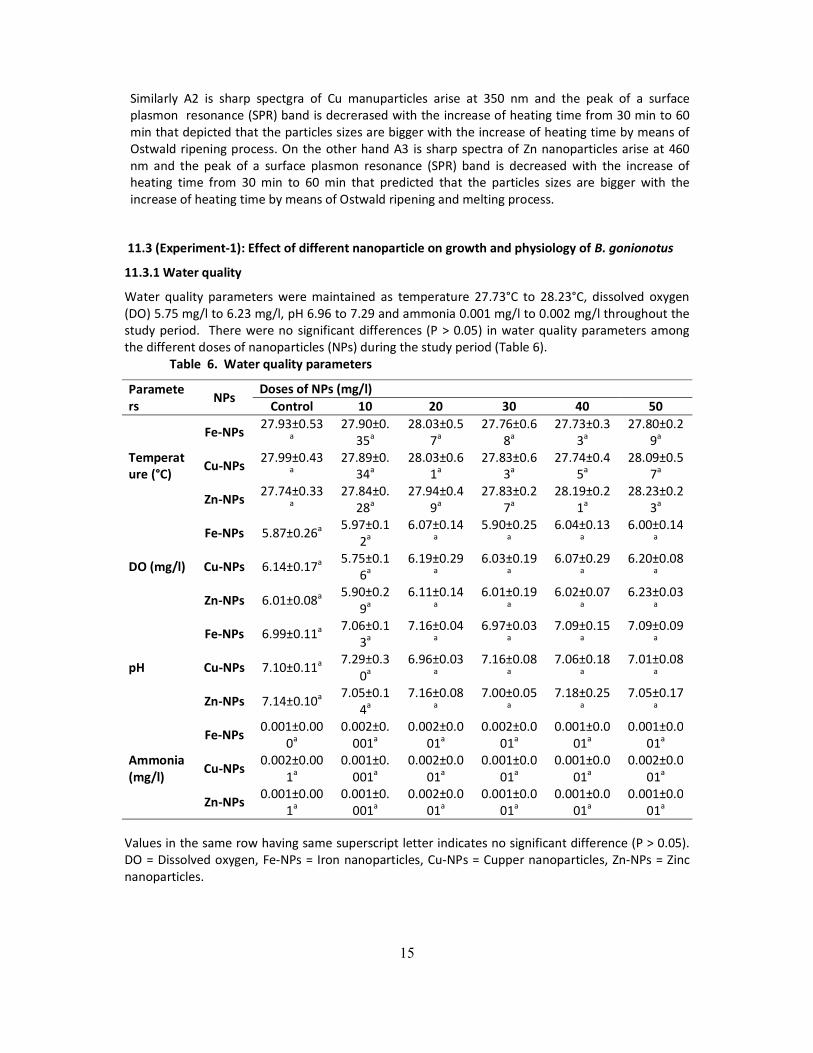
11.3.1 Water quality
Water quality parameters were maintained as temperature 27.73°C to 28.23°C, dissolved oxygen (DO) 5.75 mg/l to 6.23 mg/l, pH 6.96 to 7.29 and ammonia 0.001 mg/l to 0.002 mg/l throughout the study period. There were no significant differences (P > 0.05) in water quality parameters among the different doses of nanoparticles (NPs) during the study period (Table 6).
Table 6. Water quality parameters
Parameters
NPs Doses of NPs (mg/l)
Control 10 20 30 40 50
Temperature (°C)
Fe-NPs 27.93±0.53a
27.90±0.35a
28.03±0.57a
27.76±0.68a
27.73±0.33a
27.80±0.29a
Cu-NPs 27.99±0.43a
27.89±0.34a
28.03±0.61a
27.83±0.63a
27.74±0.45a
28.09±0.57a
Zn-NPs 27.74±0.33a
27.84±0.28a
27.94±0.49a
27.83±0.27a
28.19±0.21a
28.23±0.23a
DO (mg/l)
Fe-NPs 5.87±0.26a 5.97±0.12a
6.07±0.14a
5.90±0.25a
6.04±0.13a
6.00±0.14a
Cu-NPs 6.14±0.17a 5.75±0.16a
6.19±0.29a
6.03±0.19a
6.07±0.29a
6.20±0.08a
Zn-NPs 6.01±0.08a 5.90±0.2
9a 6.11±0.14
a 6.01±0.19
a 6.02±0.07
a 6.23±0.03
a
pH
Fe-NPs 6.99±0.11a 7.06±0.13a
7.16±0.04a
6.97±0.03a
7.09±0.15a
7.09±0.09a
Cu-NPs 7.10±0.11a 7.29±0.3
0a 6.96±0.03
a 7.16±0.08
a 7.06±0.18
a 7.01±0.08
a
Zn-NPs 7.14±0.10a 7.05±0.1
4a 7.16±0.08
a 7.00±0.05
a 7.18±0.25
a 7.05±0.17
a
Ammonia (mg/l)
Fe-NPs 0.001±0.00
0a 0.002±0.
001a 0.002±0.0
01a 0.002±0.0
01a 0.001±0.0
01a 0.001±0.0
01a
Cu-NPs 0.002±0.00
1a 0.001±0.
001a 0.002±0.0
01a 0.001±0.0
01a 0.001±0.0
01a 0.002±0.0
01a
Zn-NPs 0.001±0.001a
0.001±0.001a
0.002±0.001a
0.001±0.001a
0.001±0.001a
0.001±0.001a
Values in the same row having same superscript letter indicates no significant difference (P > 0.05). DO = Dissolved oxygen, Fe-NPs = Iron nanoparticles, Cu-NPs = Cupper nanoparticles, Zn-NPs = Zinc nanoparticles.
16
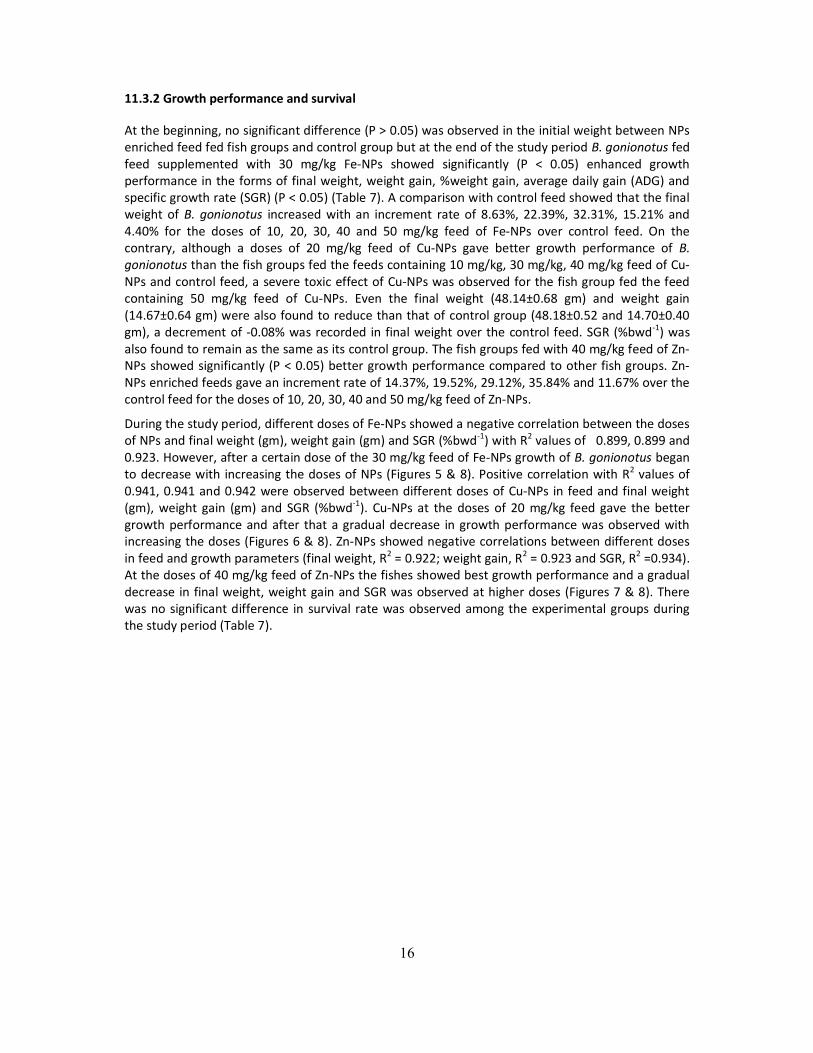
11.3.2 Growth performance and survival
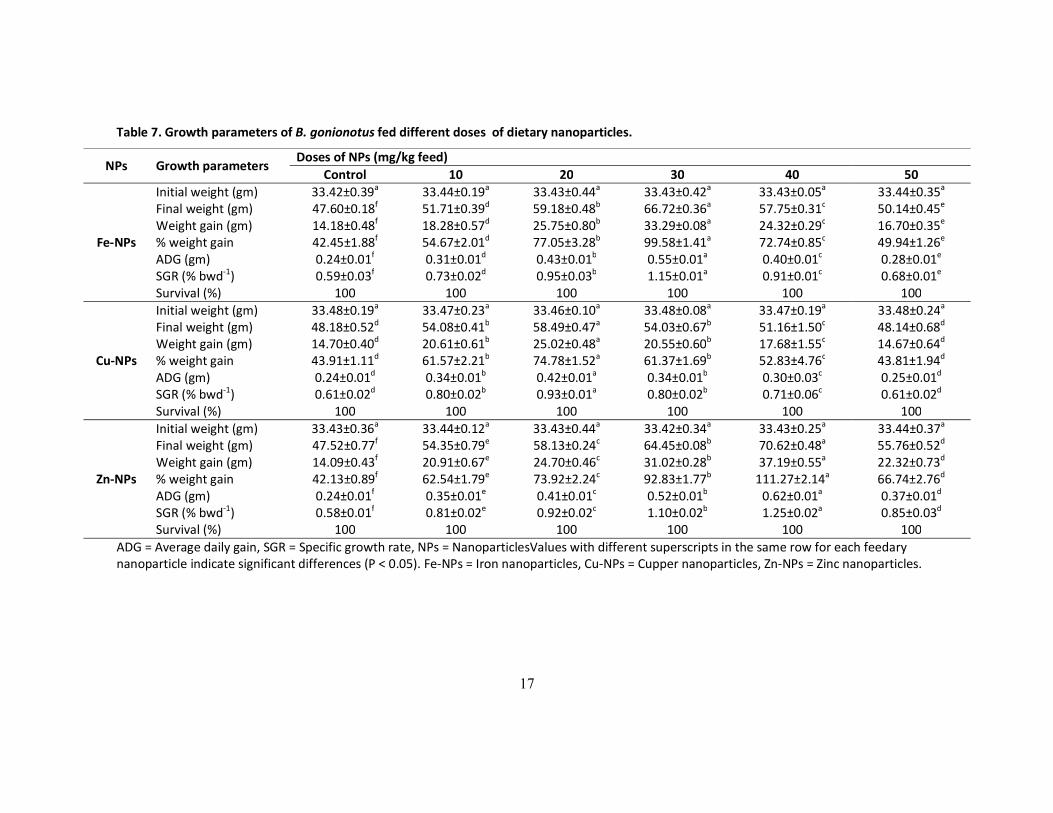
At the beginning, no significant difference (P > 0.05) was observed in the initial weight between NPs enriched feed fed fish groups and control group but at the end of the study period B. gonionotus fed feed supplemented with 30 mg/kg Fe-NPs showed significantly (P < 0.05) enhanced growth performance in the forms of final weight, weight gain, %weight gain, average daily gain (ADG) and specific growth rate (SGR) (P < 0.05) (Table 7). A comparison with control feed showed that the final weight of B. gonionotus increased with an increment rate of 8.63%, 22.39%, 32.31%, 15.21% and 4.40% for the doses of 10, 20, 30, 40 and 50 mg/kg feed of Fe-NPs over control feed. On the contrary, although a doses of 20 mg/kg feed of Cu-NPs gave better growth performance of B. gonionotus than the fish groups fed the feeds containing 10 mg/kg, 30 mg/kg, 40 mg/kg feed of Cu-NPs and control feed, a severe toxic effect of Cu-NPs was observed for the fish group fed the feed containing 50 mg/kg feed of Cu-NPs. Even the final weight (48.14±0.68 gm) and weight gain (14.67±0.64 gm) were also found to reduce than that of control group (48.18±0.52 and 14.70±0.40 gm), a decrement of -0.08% was recorded in final weight over the control feed. SGR (%bwd-1) was also found to remain as the same as its control group. The fish groups fed with 40 mg/kg feed of Zn-NPs showed significantly (P < 0.05) better growth performance compared to other fish groups. Zn-NPs enriched feeds gave an increment rate of 14.37%, 19.52%, 29.12%, 35.84% and 11.67% over the control feed for the doses of 10, 20, 30, 40 and 50 mg/kg feed of Zn-NPs.
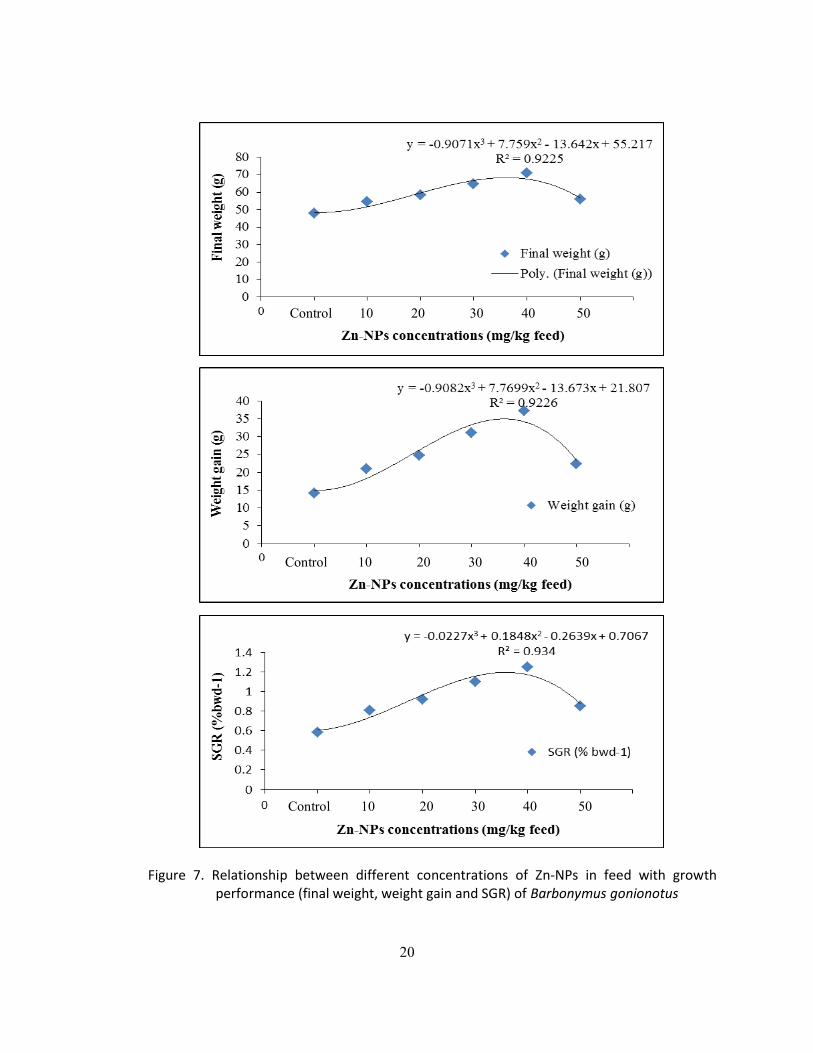
During the study period, different doses of Fe-NPs showed a negative correlation between the doses of NPs and final weight (gm), weight gain (gm) and SGR (%bwd-1) with R2 values of 0.899, 0.899 and 0.923. However, after a certain dose of the 30 mg/kg feed of Fe-NPs growth of B. gonionotus began to decrease with increasing the doses of NPs (Figures 5 & 8). Positive correlation with R2 values of 0.941, 0.941 and 0.942 were observed between different doses of Cu-NPs in feed and final weight (gm), weight gain (gm) and SGR (%bwd-1). Cu-NPs at the doses of 20 mg/kg feed gave the better growth performance and after that a gradual decrease in growth performance was observed with increasing the doses (Figures 6 & 8). Zn-NPs showed negative correlations between different doses in feed and growth parameters (final weight, R2 = 0.922; weight gain, R2 = 0.923 and SGR, R2 =0.934). At the doses of 40 mg/kg feed of Zn-NPs the fishes showed best growth performance and a gradual decrease in final weight, weight gain and SGR was observed at higher doses (Figures 7 & 8). There was no significant difference in survival rate was observed among the experimental groups during the study period (Table 7).
17
Table 7. Growth parameters of B. gonionotus fed different doses of dietary nanoparticles.
NPs Growth parameters Doses of NPs (mg/kg feed)
Control 10 20 30 40 50
Fe-NPs
Initial weight (gm) 33.42±0.39a 33.44±0.19a 33.43±0.44a 33.43±0.42a 33.43±0.05a 33.44±0.35a Final weight (gm) 47.60±0.18f 51.71±0.39d 59.18±0.48b 66.72±0.36a 57.75±0.31c 50.14±0.45e Weight gain (gm) 14.18±0.48f 18.28±0.57d 25.75±0.80b 33.29±0.08a 24.32±0.29c 16.70±0.35e % weight gain 42.45±1.88f 54.67±2.01d 77.05±3.28b 99.58±1.41a 72.74±0.85c 49.94±1.26e ADG (gm) 0.24±0.01f 0.31±0.01d 0.43±0.01b 0.55±0.01a 0.40±0.01c 0.28±0.01e SGR (% bwd-1) 0.59±0.03f 0.73±0.02d 0.95±0.03b 1.15±0.01a 0.91±0.01c 0.68±0.01e Survival (%) 100 100 100 100 100 100
Cu-NPs
Initial weight (gm) 33.48±0.19a 33.47±0.23a 33.46±0.10a 33.48±0.08a 33.47±0.19a 33.48±0.24a Final weight (gm) 48.18±0.52d 54.08±0.41b 58.49±0.47a 54.03±0.67b 51.16±1.50c 48.14±0.68d Weight gain (gm) 14.70±0.40d 20.61±0.61b 25.02±0.48a 20.55±0.60b 17.68±1.55c 14.67±0.64d % weight gain 43.91±1.11d 61.57±2.21b 74.78±1.52a 61.37±1.69b 52.83±4.76c 43.81±1.94d ADG (gm) 0.24±0.01d 0.34±0.01b 0.42±0.01a 0.34±0.01b 0.30±0.03c 0.25±0.01d SGR (% bwd-1) 0.61±0.02d 0.80±0.02b 0.93±0.01a 0.80±0.02b 0.71±0.06c 0.61±0.02d Survival (%) 100 100 100 100 100 100
Zn-NPs
Initial weight (gm) 33.43±0.36a 33.44±0.12a 33.43±0.44a 33.42±0.34a 33.43±0.25a 33.44±0.37a Final weight (gm) 47.52±0.77f 54.35±0.79e 58.13±0.24c 64.45±0.08b 70.62±0.48a 55.76±0.52d Weight gain (gm) 14.09±0.43f 20.91±0.67e 24.70±0.46c 31.02±0.28b 37.19±0.55a 22.32±0.73d % weight gain 42.13±0.89f 62.54±1.79e 73.92±2.24c 92.83±1.77b 111.27±2.14a 66.74±2.76d ADG (gm) 0.24±0.01f 0.35±0.01e 0.41±0.01c 0.52±0.01b 0.62±0.01a 0.37±0.01d SGR (% bwd-1) 0.58±0.01f 0.81±0.02e 0.92±0.02c 1.10±0.02b 1.25±0.02a 0.85±0.03d Survival (%) 100 100 100 100 100 100
ADG = Average daily gain, SGR = Specific growth rate, NPs = NanoparticlesValues with different superscripts in the same row for each feedary nanoparticle indicate significant differences (P < 0.05). Fe-NPs = Iron nanoparticles, Cu-NPs = Cupper nanoparticles, Zn-NPs = Zinc nanoparticles.
18
y = -0.5531x3 + 3.5873x2 - 0.8938x + 44.893R² = 0.8999
01020304050607080
0 1 2 3 4 5 6 7
Fin
al w
eigh
t (g)
Fe-NPs concentrations (mg/kg feed)
Final weight (g)
Poly. (Fina l weight (g))
Control 10 20 30 40 50
Control 10 20 30 40 50
Control 10 20 30 40 50
Figure 5. Relationship between different concentrations of Fe-NPs in feed with growth performance (final weight, weight gain and SGR) of B. gonionotus
19
Control 10 20 30 40 50
Control 10 20 30 40 50
Control 10 20 30 40 50
Figure 6. Relationship between different concentrations of Cu-NPs in feed with growth performance (final weight, weight gain and SGR) of Barbonymus gonionotus
20
Control 10 20 30 40 50
Control 10 20 30 40 50
Control 10 20 30 40 50
Figure 7. Relationship between different concentrations of Zn-NPs in feed with growth performance (final weight, weight gain and SGR) of Barbonymus gonionotus
11.3.3 Feed utilization parameters
Results of feed utilization in terms of feed conversion ratio (FCR), feed conversion efficiency (FCE), protein efficiency ratio (PER), protein productive value (PPV%), and protein growth rate (PGR%) of B. gonionotusthe feed utilization parameters showed significant (P < 0.05) differences among different doses of Fe-NPs, Cu-NPs and Znsignificantly better performance for 30 mg/kg feed of Fecontrol and other feed groups. The FCR found to be 4.25±0.19 for the control group and 3.30±0.12, 2.34±0.10, 1.81±0.03, 2.47±0.03 and 3.60±0.09 for groups of fish fed feed containing 10, 20, 30, 40 and 50 mg/kg feed of Fecontrol group and 0.92±0.03, 1.30±0.06, 1.67±0.03, 1.22±0.02 and 0.84±0.02 for 10, 20, 30,
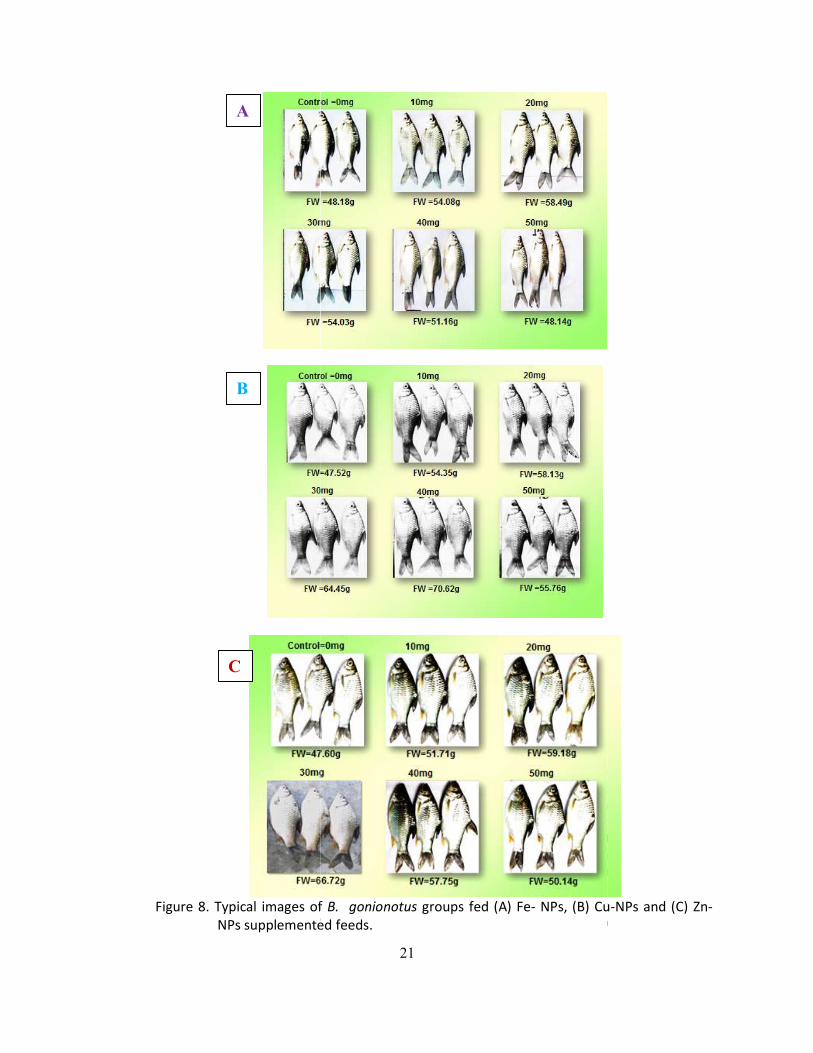
Figure 8. Typical images of NPs supplemented feeds.
A
B
C
21
.3 Feed utilization parameters Results of feed utilization in terms of feed conversion ratio (FCR), feed conversion efficiency (FCE), protein efficiency ratio (PER), protein productive value (PPV%), and protein growth
B. gonionotus fed different types and doses of NPs are shown in Table the feed utilization parameters showed significant (P < 0.05) differences among different
NPs and Zn-NPs. FCR, FCE, PER, PPV% and PGR were found to show er performance for 30 mg/kg feed of Fe-NPs fed fish group compared to the
control and other feed groups. The FCR found to be 4.25±0.19 for the control group and 3.30±0.12, 2.34±0.10, 1.81±0.03, 2.47±0.03 and 3.60±0.09 for groups of fish fed feed
10, 20, 30, 40 and 50 mg/kg feed of Fe-NPs, respectively. PER were 0.71±0.03 for control group and 0.92±0.03, 1.30±0.06, 1.67±0.03, 1.22±0.02 and 0.84±0.02 for 10, 20, 30,
of B. gonionotus groups fed (A) Fe- NPs, (B) Cusupplemented feeds.
Results of feed utilization in terms of feed conversion ratio (FCR), feed conversion efficiency (FCE), protein efficiency ratio (PER), protein productive value (PPV%), and protein growth
fed different types and doses of NPs are shown in Table 8. All the feed utilization parameters showed significant (P < 0.05) differences among different
NPs. FCR, FCE, PER, PPV% and PGR were found to show NPs fed fish group compared to the
control and other feed groups. The FCR found to be 4.25±0.19 for the control group and 3.30±0.12, 2.34±0.10, 1.81±0.03, 2.47±0.03 and 3.60±0.09 for groups of fish fed feed
NPs, respectively. PER were 0.71±0.03 for control group and 0.92±0.03, 1.30±0.06, 1.67±0.03, 1.22±0.02 and 0.84±0.02 for 10, 20, 30,
Cu-NPs and (C) Zn-
22
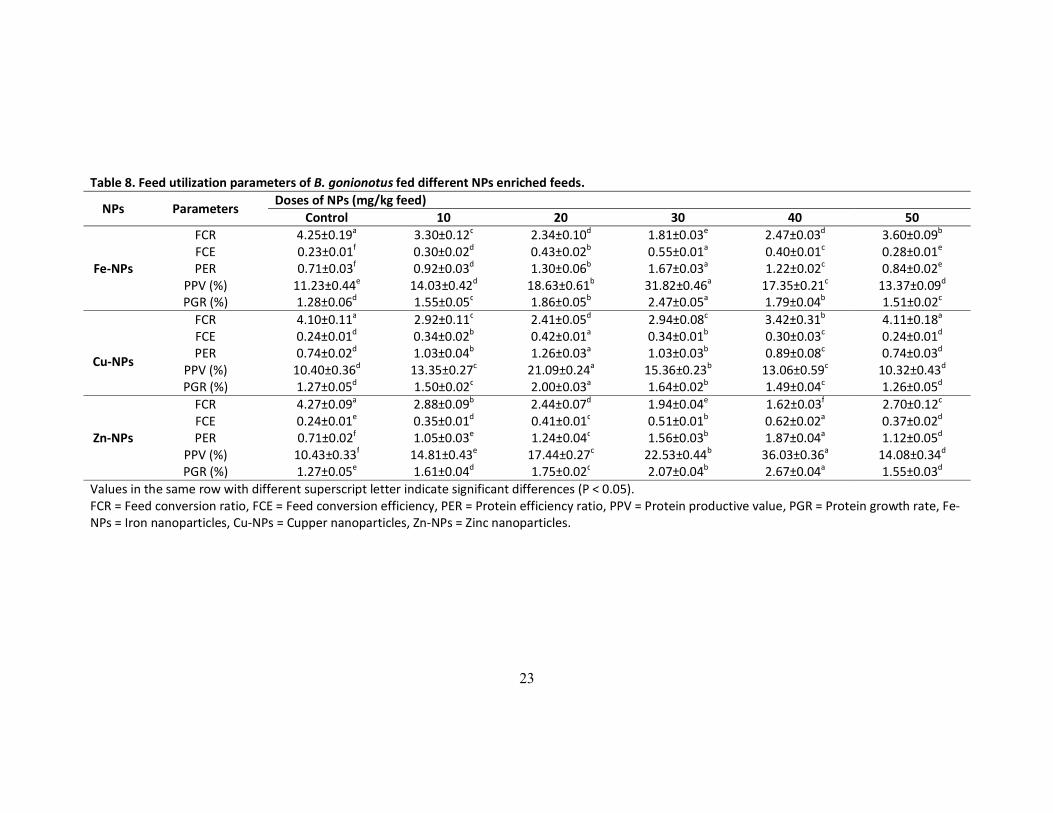
40 and 50 mg/kg feed of Fe-NPs doses, respectively. However, in case of Cu-NPs mediated feeds, the FCR and PPV% of feed containing 50 mg/kg feed of Cu-NPs showed reduced performance even than control group. Along with this no improvement in FCE and PER was noted at this feed compared to the control feed. However, some shorts of improvement that observed in PGR% was negligible to be realized. Better performance in feed utilization parameters for fishes fed with Cu-NPs enriched feeds was found at the doses of 20 mg/kg feed of Cu-NPs. In case of Zn-NPs the best performance of the feed utilization parameters were observed in fish group fed with 40 mg/kg feed of Zn-NPs mixed feed. FCR found to be 4.10±0.11 for the control group and 2.92±0.11, 2.41±0.05, 2.94±0.08, 3.42±0.31 and 4.11±0.18 for group of fishes fed feed containing 10, 20, 30, 40 and 50 mg/kg feed of Zn-NPs, respectively. Whereas, PER for different feed groups was found as 0.71±0.02 for the control group and 1.05±0.03, 1.24±0.04, 1.56±0.03, 1.87±0.04 and 1.12±0.05 for 10, 20, 30, 40 and50 mg/kg feed Zn-NPs, respectively.
23
Table 8. Feed utilization parameters of B. gonionotus fed different NPs enriched feeds.
NPs Parameters Doses of NPs (mg/kg feed)
Control 10 20 30 40 50
Fe-NPs
FCR 4.25±0.19a 3.30±0.12c 2.34±0.10d 1.81±0.03e 2.47±0.03d 3.60±0.09b FCE 0.23±0.01f 0.30±0.02d 0.43±0.02b 0.55±0.01a 0.40±0.01c 0.28±0.01e PER 0.71±0.03f 0.92±0.03d 1.30±0.06b 1.67±0.03a 1.22±0.02c 0.84±0.02e
PPV (%) 11.23±0.44e 14.03±0.42d 18.63±0.61b 31.82±0.46a 17.35±0.21c 13.37±0.09d PGR (%) 1.28±0.06d 1.55±0.05c 1.86±0.05b 2.47±0.05a 1.79±0.04b 1.51±0.02c
Cu-NPs
FCR 4.10±0.11a 2.92±0.11c 2.41±0.05d 2.94±0.08c 3.42±0.31b 4.11±0.18a FCE 0.24±0.01d 0.34±0.02b 0.42±0.01a 0.34±0.01b 0.30±0.03c 0.24±0.01d PER 0.74±0.02d 1.03±0.04b 1.26±0.03a 1.03±0.03b 0.89±0.08c 0.74±0.03d
PPV (%) 10.40±0.36d 13.35±0.27c 21.09±0.24a 15.36±0.23b 13.06±0.59c 10.32±0.43d PGR (%) 1.27±0.05d 1.50±0.02c 2.00±0.03a 1.64±0.02b 1.49±0.04c 1.26±0.05d
Zn-NPs
FCR 4.27±0.09a 2.88±0.09b 2.44±0.07d 1.94±0.04e 1.62±0.03f 2.70±0.12c FCE 0.24±0.01e 0.35±0.01d 0.41±0.01c 0.51±0.01b 0.62±0.02a 0.37±0.02d PER 0.71±0.02f 1.05±0.03e 1.24±0.04c 1.56±0.03b 1.87±0.04a 1.12±0.05d
PPV (%) 10.43±0.33f 14.81±0.43e 17.44±0.27c 22.53±0.44b 36.03±0.36a 14.08±0.34d PGR (%) 1.27±0.05e 1.61±0.04d 1.75±0.02c 2.07±0.04b 2.67±0.04a 1.55±0.03d
Values in the same row with different superscript letter indicate significant differences (P < 0.05). FCR = Feed conversion ratio, FCE = Feed conversion efficiency, PER = Protein efficiency ratio, PPV = Protein productive value, PGR = Protein growth rate, Fe-NPs = Iron nanoparticles, Cu-NPs = Cupper nanoparticles, Zn-NPs = Zinc nanoparticles.
24
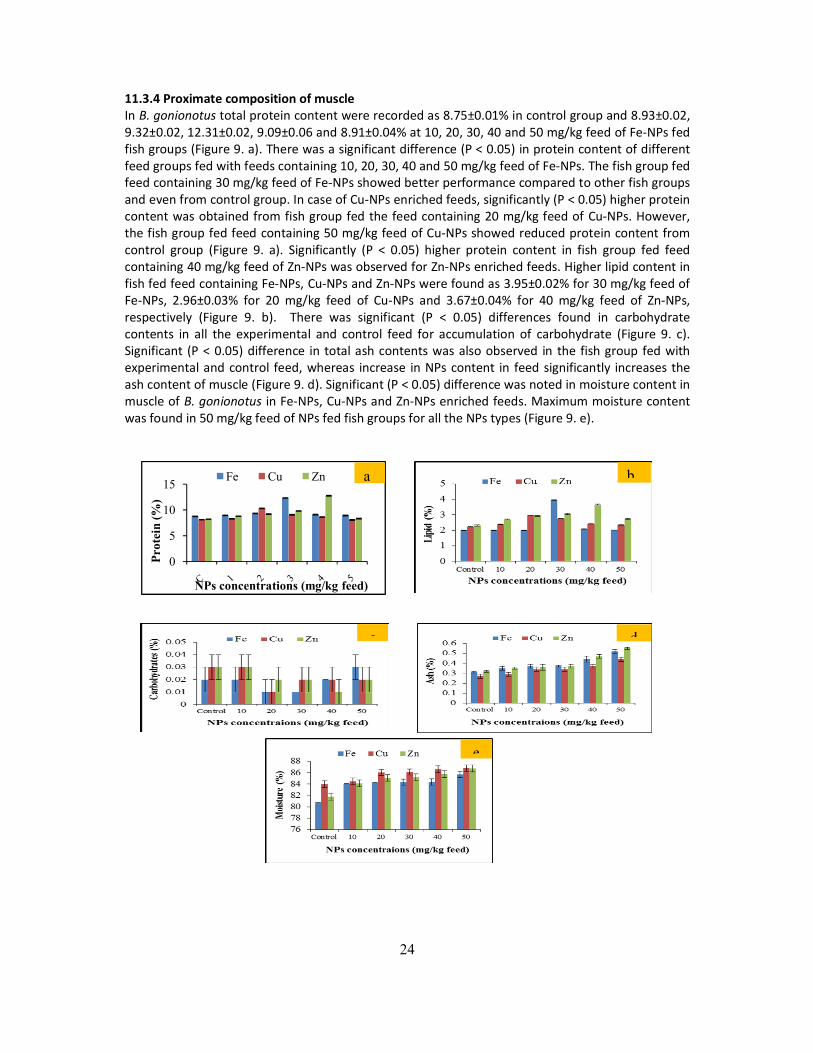
11.3.4 Proximate composition of muscle In B. gonionotus total protein content were recorded as 8.75±0.01% in control group and 8.93±0.02, 9.32±0.02, 12.31±0.02, 9.09±0.06 and 8.91±0.04% at 10, 20, 30, 40 and 50 mg/kg feed of Fe-NPs fed fish groups (Figure 9. a). There was a significant difference (P < 0.05) in protein content of different feed groups fed with feeds containing 10, 20, 30, 40 and 50 mg/kg feed of Fe-NPs. The fish group fed feed containing 30 mg/kg feed of Fe-NPs showed better performance compared to other fish groups and even from control group. In case of Cu-NPs enriched feeds, significantly (P < 0.05) higher protein content was obtained from fish group fed the feed containing 20 mg/kg feed of Cu-NPs. However, the fish group fed feed containing 50 mg/kg feed of Cu-NPs showed reduced protein content from control group (Figure 9. a). Significantly (P < 0.05) higher protein content in fish group fed feed containing 40 mg/kg feed of Zn-NPs was observed for Zn-NPs enriched feeds. Higher lipid content in fish fed feed containing Fe-NPs, Cu-NPs and Zn-NPs were found as 3.95±0.02% for 30 mg/kg feed of Fe-NPs, 2.96±0.03% for 20 mg/kg feed of Cu-NPs and 3.67±0.04% for 40 mg/kg feed of Zn-NPs, respectively (Figure 9. b). There was significant (P < 0.05) differences found in carbohydrate contents in all the experimental and control feed for accumulation of carbohydrate (Figure 9. c). Significant (P < 0.05) difference in total ash contents was also observed in the fish group fed with experimental and control feed, whereas increase in NPs content in feed significantly increases the ash content of muscle (Figure 9. d). Significant (P < 0.05) difference was noted in moisture content in muscle of B. gonionotus in Fe-NPs, Cu-NPs and Zn-NPs enriched feeds. Maximum moisture content was found in 50 mg/kg feed of NPs fed fish groups for all the NPs types (Figure 9. e).
0
5
10
15
Pro
tein
(%
)
NPs concentrations (mg/kg feed)
Fe Cu Zn a
c
b
e
d
25
11.3.5 Hematological parameters
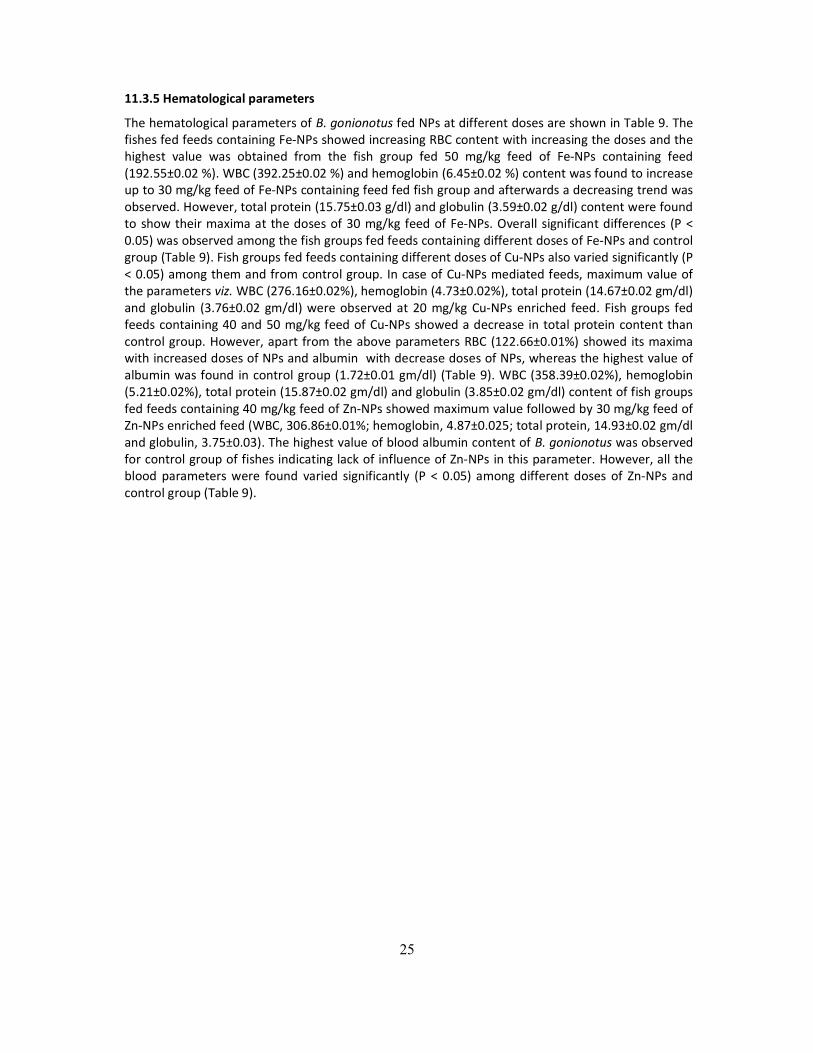
The hematological parameters of B. gonionotus fed NPs at different doses are shown in Table 9. The fishes fed feeds containing Fe-NPs showed increasing RBC content with increasing the doses and the highest value was obtained from the fish group fed 50 mg/kg feed of Fe-NPs containing feed (192.55±0.02 %). WBC (392.25±0.02 %) and hemoglobin (6.45±0.02 %) content was found to increase up to 30 mg/kg feed of Fe-NPs containing feed fed fish group and afterwards a decreasing trend was observed. However, total protein (15.75±0.03 g/dl) and globulin (3.59±0.02 g/dl) content were found to show their maxima at the doses of 30 mg/kg feed of Fe-NPs. Overall significant differences (P < 0.05) was observed among the fish groups fed feeds containing different doses of Fe-NPs and control group (Table 9). Fish groups fed feeds containing different doses of Cu-NPs also varied significantly (P < 0.05) among them and from control group. In case of Cu-NPs mediated feeds, maximum value of the parameters viz. WBC (276.16±0.02%), hemoglobin (4.73±0.02%), total protein (14.67±0.02 gm/dl) and globulin (3.76±0.02 gm/dl) were observed at 20 mg/kg Cu-NPs enriched feed. Fish groups fed feeds containing 40 and 50 mg/kg feed of Cu-NPs showed a decrease in total protein content than control group. However, apart from the above parameters RBC (122.66±0.01%) showed its maxima with increased doses of NPs and albumin with decrease doses of NPs, whereas the highest value of albumin was found in control group (1.72±0.01 gm/dl) (Table 9). WBC (358.39±0.02%), hemoglobin (5.21±0.02%), total protein (15.87±0.02 gm/dl) and globulin (3.85±0.02 gm/dl) content of fish groups fed feeds containing 40 mg/kg feed of Zn-NPs showed maximum value followed by 30 mg/kg feed of Zn-NPs enriched feed (WBC, 306.86±0.01%; hemoglobin, 4.87±0.025; total protein, 14.93±0.02 gm/dl and globulin, 3.75±0.03). The highest value of blood albumin content of B. gonionotus was observed for control group of fishes indicating lack of influence of Zn-NPs in this parameter. However, all the blood parameters were found varied significantly (P < 0.05) among different doses of Zn-NPs and control group (Table 9).
38
Table 9. Hematological parameters of B. gonionotus fed different NPs enriched feeds.
NPs Parameters Doses of NPs (mg/kg feed)
Control 10 20 30 40 50
Fe-NPs
RBC (%) 23.87±0.03f 83.64±0.03e 94.49±0.02d 105.71±0.02c 113.17±0.02b 192.55±0.02a WBC (%) 121.36±0.02f 249.85±0.02d 327.97±0.02c 392.25±0.02a 362.44±0.03b 220.45±0.03e Hemoglobin (%) 3.75±0.03f 4.79±0.02d 4.97±0.02c 6.45±0.02a 5.26±0.02b 4.43±0.02e Total protein (gm/dl) 12.66±0.02f 13.55±0.02d 13.65±0.02c 15.75±0.03a 14.15±0.02b 13.05±0.02e Albumin (gm/dl) 1.83±0.02d 1.82±0.02a 1.67±0.01b 1.64±0.02b 1.53±0.02c 1.43±0.02a Globulin (gm/dl) 2.38±0.01d 3.37±0.01b 3.35±0.01b 3.59±0.02a 3.34±0.03b 3.19±0.02c
Cu-NPs
RBC (%) 21.83±0.02f 82.83±0.02e 84.76±0.02d 109.23±0.02c 111.71±0.02b 122.66±0.01a WBC (%) 113.17±0.02f 207.85±0.02e 276.16±0.02a 251.47±0.02b 215.35±0.03c 209.36±0.01d Hemoglobin (%) 3.29±0.02f 4.38±0.02b 4.73±0.02a 4.13±0.02c 3.44±0.01d 3.35±0.01e Total protein (gm/dl) 12.64±0.01d 13.73±0.02c 14.67±0.02a 14.23±0.03b 12.63±0.02d 12.54±0.02e Albumin (gm/dl) 1.72±0.01a 1.53±0.02b 1.47±0.02c 1.53±0.02b 1.39±0.02d 1.29±0.02e Globulin (gm/dl) 2.73±0.01f 3.64±0.01b 3.76±0.02a 3.54±0.03c 3.45±0.02d 3.15±0.01e
Zn-NPs
RBC (%) 25.17±0.02f 95.65±0.02e 103.24±0.03d 109.27±0.02c 112.57±0.02b 115.27±0.02a WBC (%) 122.63±0.02f 269.74±0.01e 287.87±0.02c 306.86±0.01b 358.39±0.02a 271.86±0.01d Hemoglobin (%) 3.43±0.02f 3.87±0.02e 4.63±0.01c 4.87±0.02b 5.21±0.02a 3.74±0.01d Total protein (gm/dl) 12.93±0.02e 13.97±0.02d 14.76±0.02c 14.93±0.02b 15.87±0.02a 13.97±0.02d Albumin (gm/dl) 1.73±0.02a 1.69±0.02b 1.58±0.02c 1.55±0.01c 1.43±0.02d 1.29±0.02e Globulin (gm/dl) 2.73±0.01f 3.33±0.02d 3.49±0.02c 3.75±0.03b 3.85±0.02a 3.23±0.02e
Values in the same row with different superscript letter indicate significant differences (P < 0.05). Fe-NPs = Iron nanoparticles, Cu-NPs = Cupper nanoparticles, Zn-NPs = Zinc nanoparticles.
39
11.3.6 Blood lipid profile
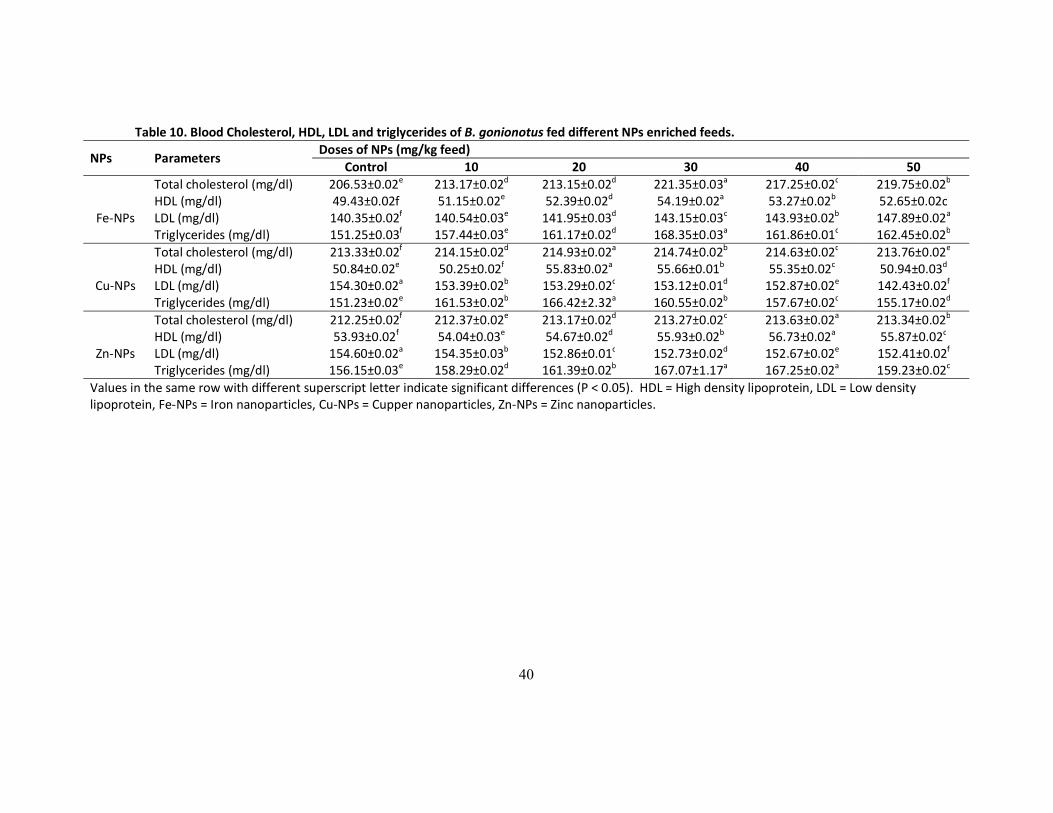
Lipid profile (total cholesterol, HDL, LDL and triglycerides) of blood of B. gonionotus is shown in Table 10. The fish groups fed Fe-NPs enriched feeds at different doses showed higher total cholesterol, HDL, LDL and triglyceride level compared to control feed fed fish group. However, HDL was found to increase and LDL was found to decrease with increase in Fe-NPs doses in feeds. Increasing trend in total cholesterol, HDL and triglyceride content was observed up to 30 mg/kg feed of Fe-NPs and there after it showed decreasing trend at 40 mg/kg and 50 mg/kg feed Fe-NPs mixed feed. However, significant differences (P < 0.05) were observed between the Fe-NPs enriched feeds and control group (Table 10). Similar results were also obtained from fish fed with Cu-NPs enriched feeds where control group showed minimum total cholesterol, HDL, LDL and triglyceride and 50 mg/kg feed of Cu-NPs group showed the highest LDL compared to other Cu-NPs mediated feeds. However, LDL was found to decrease with increasing Cu-NPs doses in feeds and it gave maximum value at control group. Significant differences (P < 0.05) in lipid profile of blood were also observed for Zn-NPs mediated feeds and control group. Similar to Fe-NPs and Cu-NPs enriched feeds, Zn-NPs enriched feed groups also showed higher total cholesterol and HDL for fish group fed 40 mg/kg feed of Zn-NPs and the lowest in control group. Significant (P < 0.05) decrease in LDL was observed with increasing the doses of Zn-NPs in feeds. However, triglycerides was found to increase up to 40 mg/kg feed of Zn-NPs enriched feed fed fish group and showed decreasing trend there after (Table 10).
40
Table 10. Blood Cholesterol, HDL, LDL and triglycerides of B. gonionotus fed different NPs enriched feeds.
NPs Parameters Doses of NPs (mg/kg feed)
Control 10 20 30 40 50
Fe-NPs
Total cholesterol (mg/dl) 206.53±0.02e 213.17±0.02d 213.15±0.02d 221.35±0.03a 217.25±0.02c 219.75±0.02b HDL (mg/dl) 49.43±0.02f 51.15±0.02e 52.39±0.02d 54.19±0.02a 53.27±0.02b 52.65±0.02c LDL (mg/dl) 140.35±0.02f 140.54±0.03e 141.95±0.03d 143.15±0.03c 143.93±0.02b 147.89±0.02a Triglycerides (mg/dl) 151.25±0.03f 157.44±0.03e 161.17±0.02d 168.35±0.03a 161.86±0.01c 162.45±0.02b
Cu-NPs
Total cholesterol (mg/dl) 213.33±0.02f 214.15±0.02d 214.93±0.02a 214.74±0.02b 214.63±0.02c 213.76±0.02e HDL (mg/dl) 50.84±0.02e 50.25±0.02f 55.83±0.02a 55.66±0.01b 55.35±0.02c 50.94±0.03d LDL (mg/dl) 154.30±0.02a 153.39±0.02b 153.29±0.02c 153.12±0.01d 152.87±0.02e 142.43±0.02f Triglycerides (mg/dl) 151.23±0.02e 161.53±0.02b 166.42±2.32a 160.55±0.02b 157.67±0.02c 155.17±0.02d
Zn-NPs
Total cholesterol (mg/dl) 212.25±0.02f 212.37±0.02e 213.17±0.02d 213.27±0.02c 213.63±0.02a 213.34±0.02b HDL (mg/dl) 53.93±0.02f 54.04±0.03e 54.67±0.02d 55.93±0.02b 56.73±0.02a 55.87±0.02c LDL (mg/dl) 154.60±0.02a 154.35±0.03b 152.86±0.01c 152.73±0.02d 152.67±0.02e 152.41±0.02f Triglycerides (mg/dl) 156.15±0.03e 158.29±0.02d 161.39±0.02b 167.07±1.17a 167.25±0.02a 159.23±0.02c
Values in the same row with different superscript letter indicate significant differences (P < 0.05). HDL = High density lipoprotein, LDL = Low density lipoprotein, Fe-NPs = Iron nanoparticles, Cu-NPs = Cupper nanoparticles, Zn-NPs = Zinc nanoparticles.
41
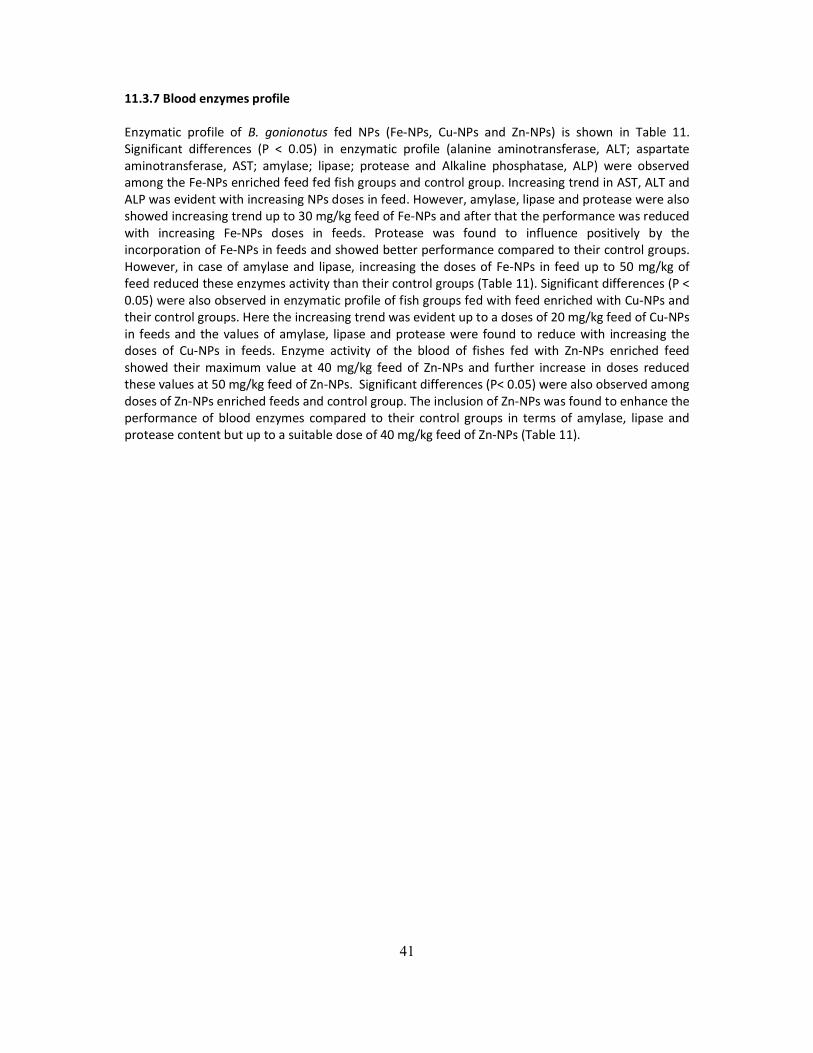
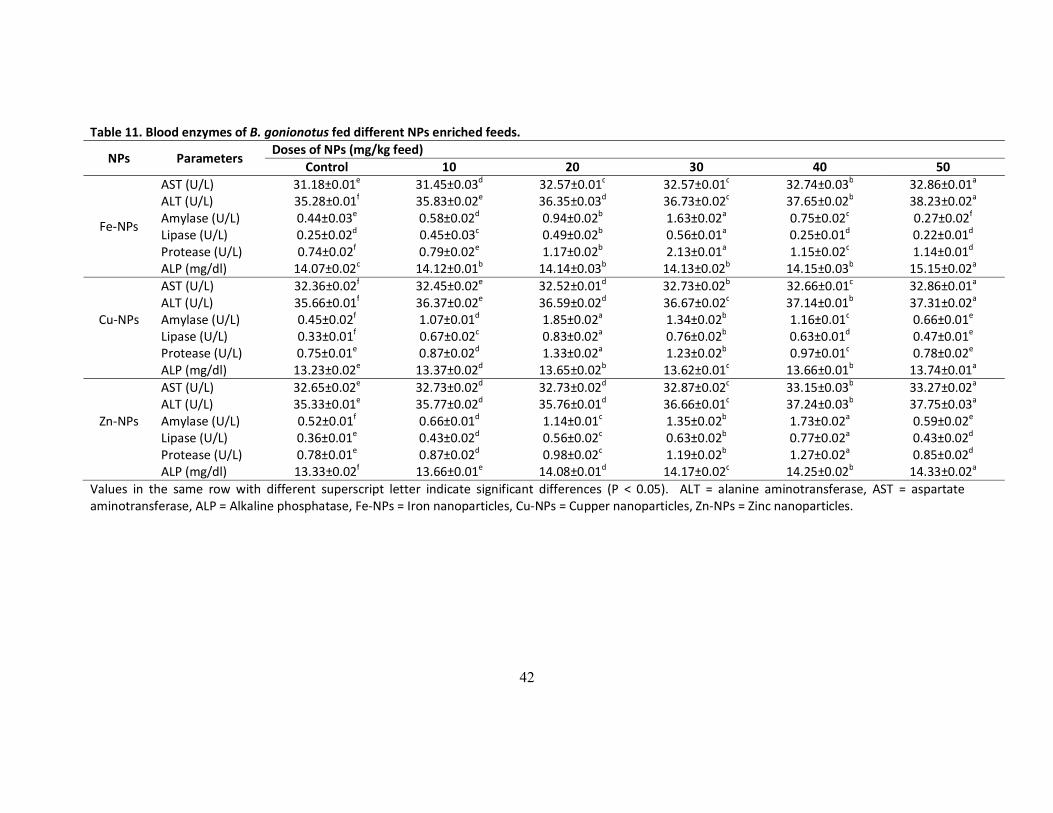
11.3.7 Blood enzymes profile Enzymatic profile of B. gonionotus fed NPs (Fe-NPs, Cu-NPs and Zn-NPs) is shown in Table 11. Significant differences (P < 0.05) in enzymatic profile (alanine aminotransferase, ALT; aspartate aminotransferase, AST; amylase; lipase; protease and Alkaline phosphatase, ALP) were observed among the Fe-NPs enriched feed fed fish groups and control group. Increasing trend in AST, ALT and ALP was evident with increasing NPs doses in feed. However, amylase, lipase and protease were also showed increasing trend up to 30 mg/kg feed of Fe-NPs and after that the performance was reduced with increasing Fe-NPs doses in feeds. Protease was found to influence positively by the incorporation of Fe-NPs in feeds and showed better performance compared to their control groups. However, in case of amylase and lipase, increasing the doses of Fe-NPs in feed up to 50 mg/kg of feed reduced these enzymes activity than their control groups (Table 11). Significant differences (P < 0.05) were also observed in enzymatic profile of fish groups fed with feed enriched with Cu-NPs and their control groups. Here the increasing trend was evident up to a doses of 20 mg/kg feed of Cu-NPs in feeds and the values of amylase, lipase and protease were found to reduce with increasing the doses of Cu-NPs in feeds. Enzyme activity of the blood of fishes fed with Zn-NPs enriched feed showed their maximum value at 40 mg/kg feed of Zn-NPs and further increase in doses reduced these values at 50 mg/kg feed of Zn-NPs. Significant differences (P< 0.05) were also observed among doses of Zn-NPs enriched feeds and control group. The inclusion of Zn-NPs was found to enhance the performance of blood enzymes compared to their control groups in terms of amylase, lipase and protease content but up to a suitable dose of 40 mg/kg feed of Zn-NPs (Table 11).
42
Table 11. Blood enzymes of B. gonionotus fed different NPs enriched feeds.
NPs Parameters Doses of NPs (mg/kg feed)
Control 10 20 30 40 50
Fe-NPs
AST (U/L) 31.18±0.01e 31.45±0.03d 32.57±0.01c 32.57±0.01c 32.74±0.03b 32.86±0.01a ALT (U/L) 35.28±0.01f 35.83±0.02e 36.35±0.03d 36.73±0.02c 37.65±0.02b 38.23±0.02a Amylase (U/L) 0.44±0.03e 0.58±0.02d 0.94±0.02b 1.63±0.02a 0.75±0.02c 0.27±0.02f Lipase (U/L) 0.25±0.02d 0.45±0.03c 0.49±0.02b 0.56±0.01a 0.25±0.01d 0.22±0.01d Protease (U/L) 0.74±0.02f 0.79±0.02e 1.17±0.02b 2.13±0.01a 1.15±0.02c 1.14±0.01d
ALP (mg/dl) 14.07±0.02c 14.12±0.01b 14.14±0.03b 14.13±0.02b 14.15±0.03b 15.15±0.02a
Cu-NPs
AST (U/L) 32.36±0.02f 32.45±0.02e 32.52±0.01d 32.73±0.02b 32.66±0.01c 32.86±0.01a ALT (U/L) 35.66±0.01f 36.37±0.02e 36.59±0.02d 36.67±0.02c 37.14±0.01b 37.31±0.02a Amylase (U/L) 0.45±0.02f 1.07±0.01d 1.85±0.02a 1.34±0.02b 1.16±0.01c 0.66±0.01e Lipase (U/L) 0.33±0.01f 0.67±0.02c 0.83±0.02a 0.76±0.02b 0.63±0.01d 0.47±0.01e Protease (U/L) 0.75±0.01e 0.87±0.02d 1.33±0.02a 1.23±0.02b 0.97±0.01c 0.78±0.02e
ALP (mg/dl) 13.23±0.02e 13.37±0.02d 13.65±0.02b 13.62±0.01c 13.66±0.01b 13.74±0.01a
Zn-NPs
AST (U/L) 32.65±0.02e 32.73±0.02d 32.73±0.02d 32.87±0.02c 33.15±0.03b 33.27±0.02a ALT (U/L) 35.33±0.01e 35.77±0.02d 35.76±0.01d 36.66±0.01c 37.24±0.03b 37.75±0.03a Amylase (U/L) 0.52±0.01f 0.66±0.01d 1.14±0.01c 1.35±0.02b 1.73±0.02a 0.59±0.02e Lipase (U/L) 0.36±0.01e 0.43±0.02d 0.56±0.02c 0.63±0.02b 0.77±0.02a 0.43±0.02d Protease (U/L) 0.78±0.01e 0.87±0.02d 0.98±0.02c 1.19±0.02b 1.27±0.02a 0.85±0.02d
ALP (mg/dl) 13.33±0.02f 13.66±0.01e 14.08±0.01d 14.17±0.02c 14.25±0.02b 14.33±0.02a Values in the same row with different superscript letter indicate significant differences (P < 0.05). ALT = alanine aminotransferase, AST = aspartate aminotransferase, ALP = Alkaline phosphatase, Fe-NPs = Iron nanoparticles, Cu-NPs = Cupper nanoparticles, Zn-NPs = Zinc nanoparticles.
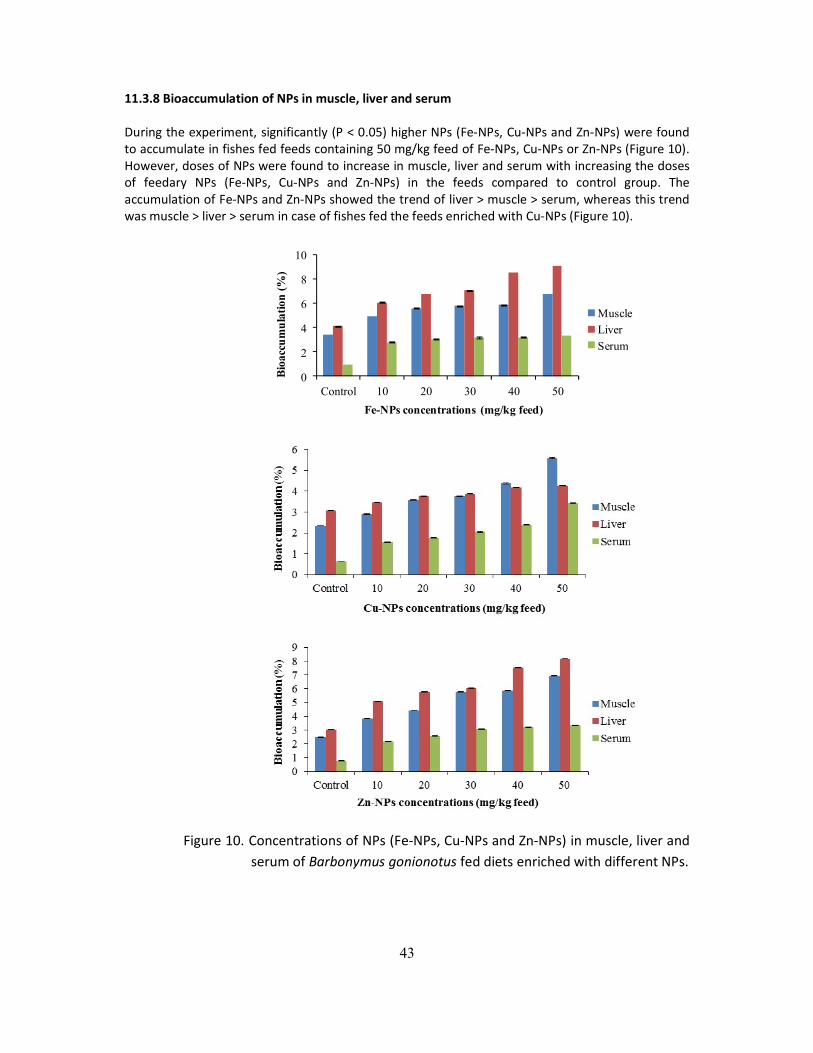
43
11.3.8 Bioaccumulation of NPs in muscle, liver and serum During the experiment, significantly (P < 0.05) higher NPs (Fe-NPs, Cu-NPs and Zn-NPs) were found to accumulate in fishes fed feeds containing 50 mg/kg feed of Fe-NPs, Cu-NPs or Zn-NPs (Figure 10). However, doses of NPs were found to increase in muscle, liver and serum with increasing the doses of feedary NPs (Fe-NPs, Cu-NPs and Zn-NPs) in the feeds compared to control group. The accumulation of Fe-NPs and Zn-NPs showed the trend of liver > muscle > serum, whereas this trend was muscle > liver > serum in case of fishes fed the feeds enriched with Cu-NPs (Figure 10).
0
2
4
6
8
10
Control 10 20 30 40 50
Bio
accu
mu
lati
on (
%)
Fe-NPs concentrations (mg/kg feed)
Muscle
Liver
Serum
Figure 10. Concentrations of NPs (Fe-NPs, Cu-NPs and Zn-NPs) in muscle, liver and serum of Barbonymus gonionotus fed diets enriched with different NPs.
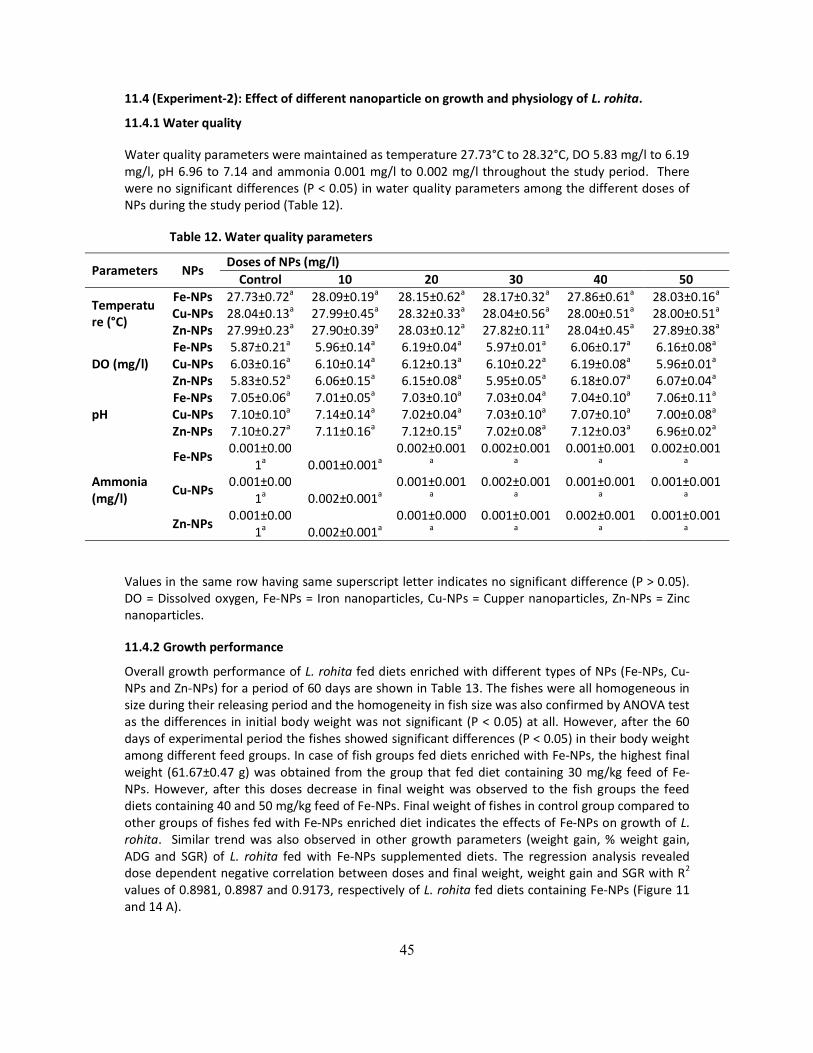
45
11.4 (Experiment-2): Effect of different nanoparticle on growth and physiology of L. rohita.
11.4.1 Water quality
Water quality parameters were maintained as temperature 27.73°C to 28.32°C, DO 5.83 mg/l to 6.19 mg/l, pH 6.96 to 7.14 and ammonia 0.001 mg/l to 0.002 mg/l throughout the study period. There were no significant differences (P < 0.05) in water quality parameters among the different doses of NPs during the study period (Table 12).
Table 12. Water quality parameters
Parameters NPs Doses of NPs (mg/l)
Control 10 20 30 40 50
Temperature (°C)
Fe-NPs 27.73±0.72a 28.09±0.19a 28.15±0.62a 28.17±0.32a 27.86±0.61a 28.03±0.16a Cu-NPs 28.04±0.13a 27.99±0.45a 28.32±0.33a 28.04±0.56a 28.00±0.51a 28.00±0.51a Zn-NPs 27.99±0.23a 27.90±0.39a 28.03±0.12a 27.82±0.11a 28.04±0.45a 27.89±0.38a
DO (mg/l) Fe-NPs 5.87±0.21a 5.96±0.14a 6.19±0.04a 5.97±0.01a 6.06±0.17a 6.16±0.08a Cu-NPs 6.03±0.16a 6.10±0.14a 6.12±0.13a 6.10±0.22a 6.19±0.08a 5.96±0.01a Zn-NPs 5.83±0.52a 6.06±0.15a 6.15±0.08a 5.95±0.05a 6.18±0.07a 6.07±0.04a
pH Fe-NPs 7.05±0.06a 7.01±0.05a 7.03±0.10a 7.03±0.04a 7.04±0.10a 7.06±0.11a Cu-NPs 7.10±0.10a 7.14±0.14a 7.02±0.04a 7.03±0.10a 7.07±0.10a 7.00±0.08a Zn-NPs 7.10±0.27a 7.11±0.16a 7.12±0.15a 7.02±0.08a 7.12±0.03a 6.96±0.02a
Ammonia (mg/l)
Fe-NPs 0.001±0.00
1a 0.001±0.001a 0.002±0.001
a 0.002±0.001
a 0.001±0.001
a 0.002±0.001
a
Cu-NPs 0.001±0.00
1a 0.002±0.001a 0.001±0.001
a 0.002±0.001
a 0.001±0.001
a 0.001±0.001
a
Zn-NPs 0.001±0.00
1a 0.002±0.001a 0.001±0.000
a 0.001±0.001
a 0.002±0.001
a 0.001±0.001
a
Values in the same row having same superscript letter indicates no significant difference (P > 0.05). DO = Dissolved oxygen, Fe-NPs = Iron nanoparticles, Cu-NPs = Cupper nanoparticles, Zn-NPs = Zinc nanoparticles.
11.4.2 Growth performance
Overall growth performance of L. rohita fed diets enriched with different types of NPs (Fe-NPs, Cu-NPs and Zn-NPs) for a period of 60 days are shown in Table 13. The fishes were all homogeneous in size during their releasing period and the homogeneity in fish size was also confirmed by ANOVA test as the differences in initial body weight was not significant (P < 0.05) at all. However, after the 60 days of experimental period the fishes showed significant differences (P < 0.05) in their body weight among different feed groups. In case of fish groups fed diets enriched with Fe-NPs, the highest final weight (61.67±0.47 g) was obtained from the group that fed diet containing 30 mg/kg feed of Fe-NPs. However, after this doses decrease in final weight was observed to the fish groups the feed diets containing 40 and 50 mg/kg feed of Fe-NPs. Final weight of fishes in control group compared to other groups of fishes fed with Fe-NPs enriched diet indicates the effects of Fe-NPs on growth of L. rohita. Similar trend was also observed in other growth parameters (weight gain, % weight gain, ADG and SGR) of L. rohita fed with Fe-NPs supplemented diets. The regression analysis revealed dose dependent negative correlation between doses and final weight, weight gain and SGR with R2 values of 0.8981, 0.8987 and 0.9173, respectively of L. rohita fed diets containing Fe-NPs (Figure 11 and 14 A).
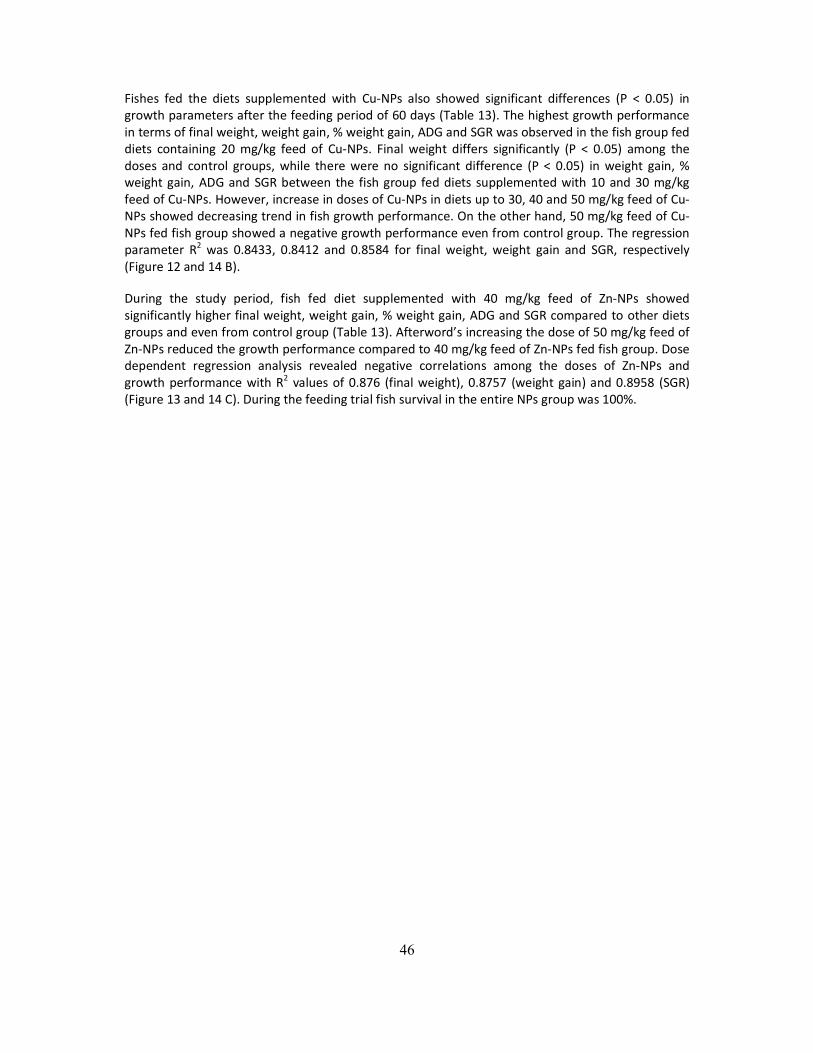
46
Fishes fed the diets supplemented with Cu-NPs also showed significant differences (P < 0.05) in growth parameters after the feeding period of 60 days (Table 13). The highest growth performance in terms of final weight, weight gain, % weight gain, ADG and SGR was observed in the fish group fed diets containing 20 mg/kg feed of Cu-NPs. Final weight differs significantly (P < 0.05) among the doses and control groups, while there were no significant difference (P < 0.05) in weight gain, % weight gain, ADG and SGR between the fish group fed diets supplemented with 10 and 30 mg/kg feed of Cu-NPs. However, increase in doses of Cu-NPs in diets up to 30, 40 and 50 mg/kg feed of Cu-NPs showed decreasing trend in fish growth performance. On the other hand, 50 mg/kg feed of Cu-NPs fed fish group showed a negative growth performance even from control group. The regression parameter R2 was 0.8433, 0.8412 and 0.8584 for final weight, weight gain and SGR, respectively (Figure 12 and 14 B).
During the study period, fish fed diet supplemented with 40 mg/kg feed of Zn-NPs showed significantly higher final weight, weight gain, % weight gain, ADG and SGR compared to other diets groups and even from control group (Table 13). Afterword’s increasing the dose of 50 mg/kg feed of Zn-NPs reduced the growth performance compared to 40 mg/kg feed of Zn-NPs fed fish group. Dose dependent regression analysis revealed negative correlations among the doses of Zn-NPs and growth performance with R2 values of 0.876 (final weight), 0.8757 (weight gain) and 0.8958 (SGR) (Figure 13 and 14 C). During the feeding trial fish survival in the entire NPs group was 100%.
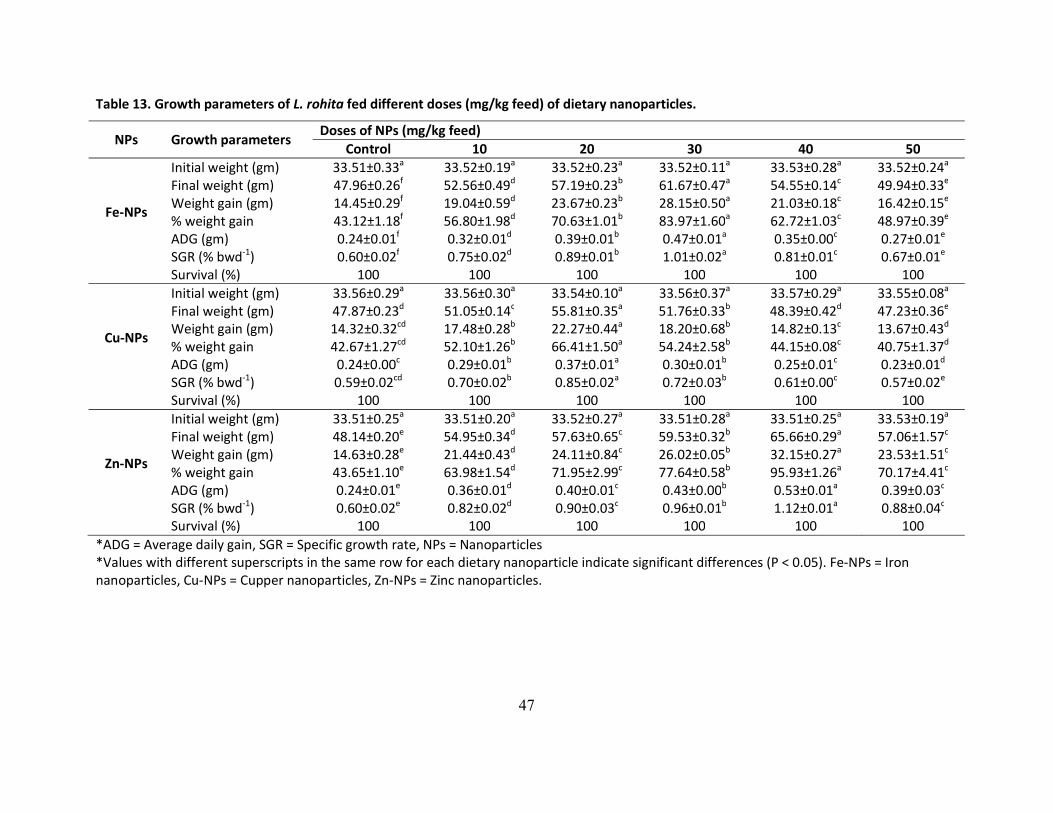
47
Table 13. Growth parameters of L. rohita fed different doses (mg/kg feed) of dietary nanoparticles.
NPs Growth parameters Doses of NPs (mg/kg feed)
Control 10 20 30 40 50
Fe-NPs
Initial weight (gm) 33.51±0.33a 33.52±0.19a 33.52±0.23a 33.52±0.11a 33.53±0.28a 33.52±0.24a Final weight (gm) 47.96±0.26f 52.56±0.49d 57.19±0.23b 61.67±0.47a 54.55±0.14c 49.94±0.33e Weight gain (gm) 14.45±0.29f 19.04±0.59d 23.67±0.23b 28.15±0.50a 21.03±0.18c 16.42±0.15e % weight gain 43.12±1.18f 56.80±1.98d 70.63±1.01b 83.97±1.60a 62.72±1.03c 48.97±0.39e ADG (gm) 0.24±0.01f 0.32±0.01d 0.39±0.01b 0.47±0.01a 0.35±0.00c 0.27±0.01e SGR (% bwd-1) 0.60±0.02f 0.75±0.02d 0.89±0.01b 1.01±0.02a 0.81±0.01c 0.67±0.01e
Survival (%) 100 100 100 100 100 100
Cu-NPs
Initial weight (gm) 33.56±0.29a 33.56±0.30a 33.54±0.10a 33.56±0.37a 33.57±0.29a 33.55±0.08a Final weight (gm) 47.87±0.23d 51.05±0.14c 55.81±0.35a 51.76±0.33b 48.39±0.42d 47.23±0.36e Weight gain (gm) 14.32±0.32cd 17.48±0.28b 22.27±0.44a 18.20±0.68b 14.82±0.13c 13.67±0.43d % weight gain 42.67±1.27cd 52.10±1.26b 66.41±1.50a 54.24±2.58b 44.15±0.08c 40.75±1.37d ADG (gm) 0.24±0.00c 0.29±0.01b 0.37±0.01a 0.30±0.01b 0.25±0.01c 0.23±0.01d SGR (% bwd-1) 0.59±0.02cd 0.70±0.02b 0.85±0.02a 0.72±0.03b 0.61±0.00c 0.57±0.02e
Survival (%) 100 100 100 100 100 100
Zn-NPs
Initial weight (gm) 33.51±0.25a 33.51±0.20a 33.52±0.27a 33.51±0.28a 33.51±0.25a 33.53±0.19a Final weight (gm) 48.14±0.20e 54.95±0.34d 57.63±0.65c 59.53±0.32b 65.66±0.29a 57.06±1.57c Weight gain (gm) 14.63±0.28e 21.44±0.43d 24.11±0.84c 26.02±0.05b 32.15±0.27a 23.53±1.51c % weight gain 43.65±1.10e 63.98±1.54d 71.95±2.99c 77.64±0.58b 95.93±1.26a 70.17±4.41c ADG (gm) 0.24±0.01e 0.36±0.01d 0.40±0.01c 0.43±0.00b 0.53±0.01a 0.39±0.03c SGR (% bwd-1) 0.60±0.02e 0.82±0.02d 0.90±0.03c 0.96±0.01b 1.12±0.01a 0.88±0.04c
Survival (%) 100 100 100 100 100 100 *ADG = Average daily gain, SGR = Specific growth rate, NPs = Nanoparticles *Values with different superscripts in the same row for each dietary nanoparticle indicate significant differences (P < 0.05). Fe-NPs = Iron nanoparticles, Cu-NPs = Cupper nanoparticles, Zn-NPs = Zinc nanoparticles.
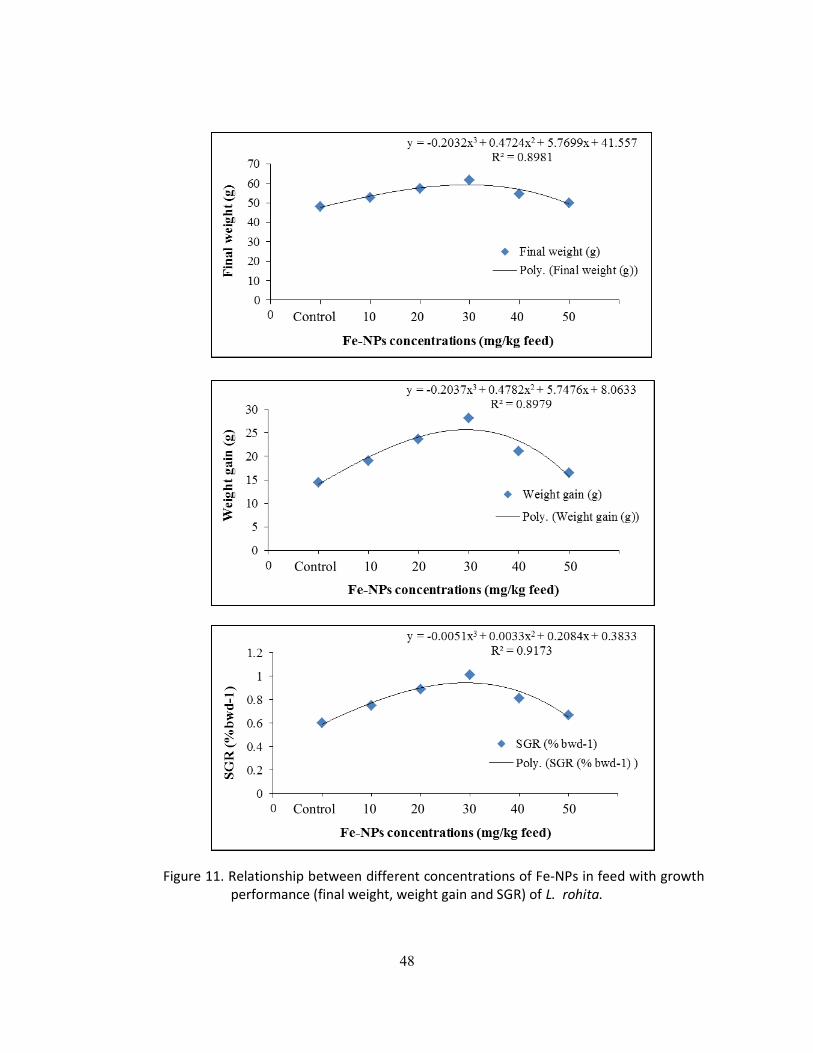
48
Control 10 20 30 40 50
Control 10 20 30 40 50
Figure 11. Relationship between different concentrations of Fe-NPs in feed with growth performance (final weight, weight gain and SGR) of L. rohita.
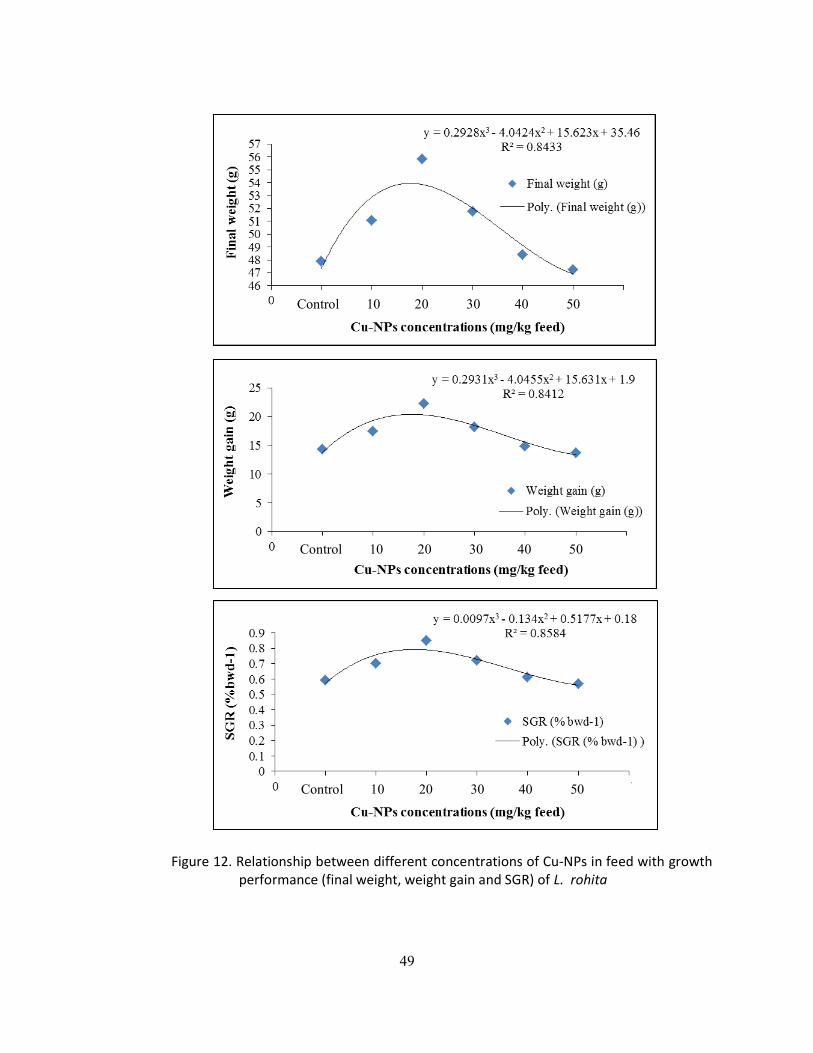
49
Control 10 20 30 40 50
Control 10 20 30 40 50
Control 10 20 30 40 50
Figure 12. Relationship between different concentrations of Cu-NPs in feed with growth performance (final weight, weight gain and SGR) of L. rohita
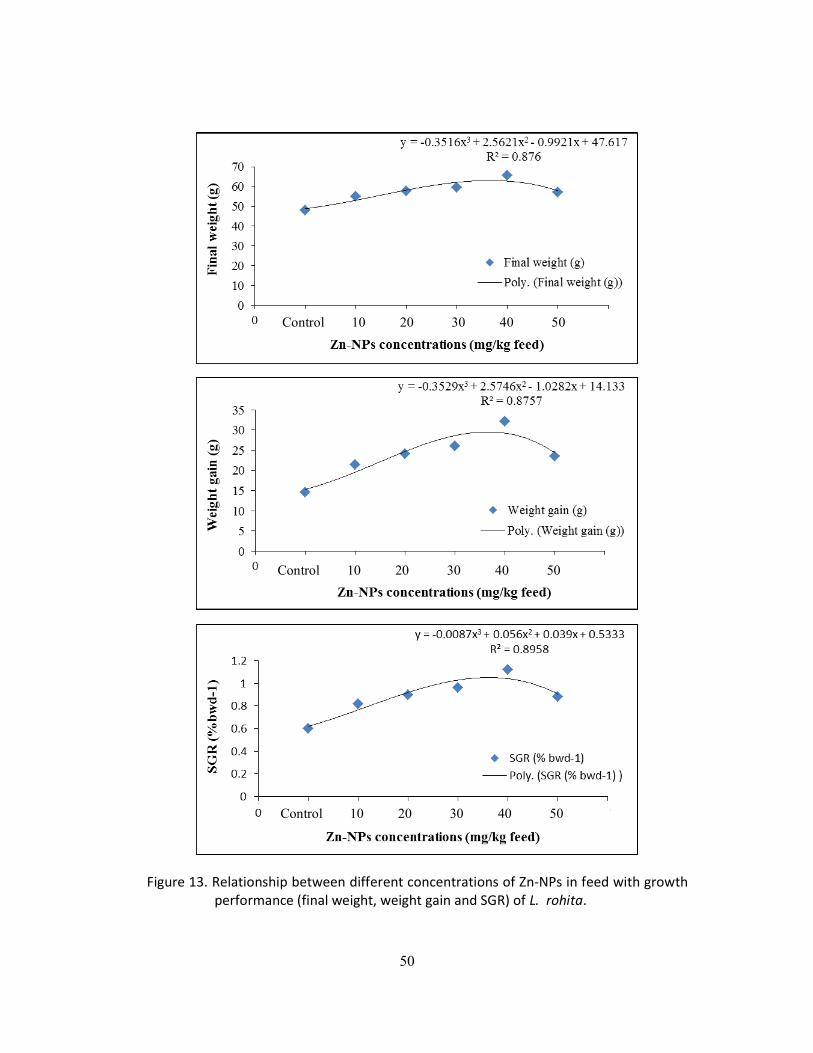
50
Control 10 20 30 40 50
Control 10 20 30 40 50
Control 10 20 30 40 50
Figure 13. Relationship between different concentrations of Zn-NPs in feed with growth performance (final weight, weight gain and SGR) of L. rohita.
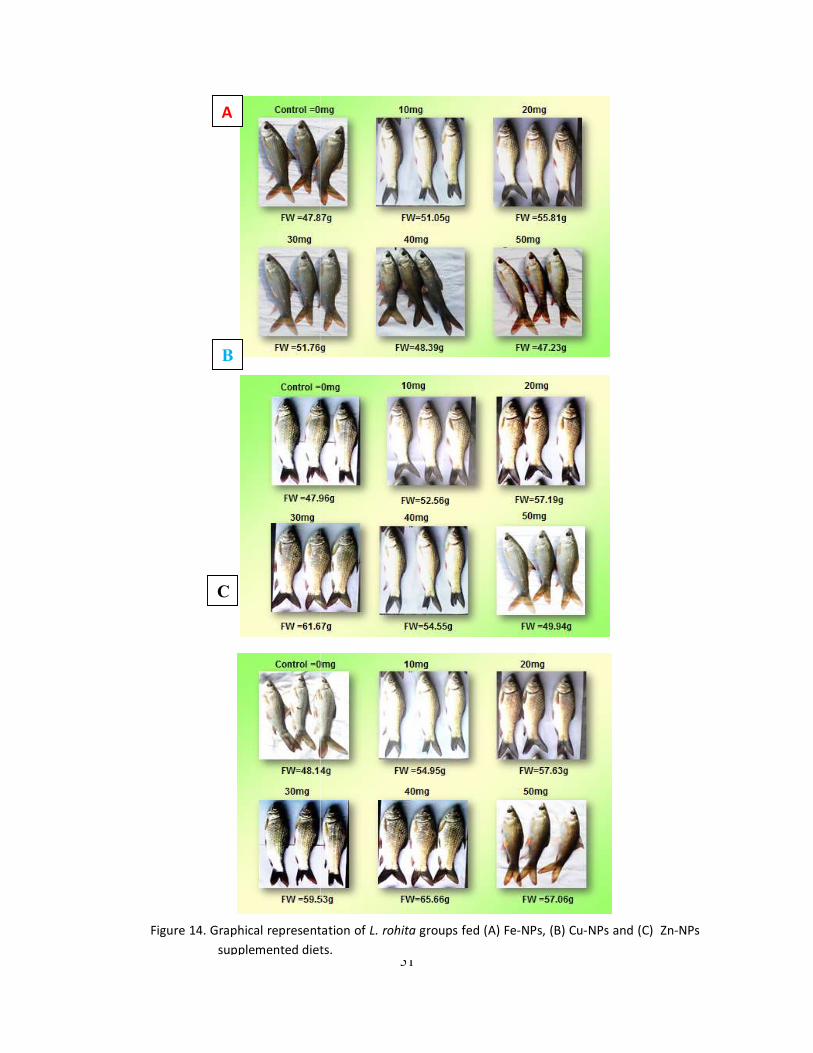
Figure 14. Graphical representation of supplemented diets.
A
B
C
51
Graphical representation of L. rohita groups fed (A) Fe-NPs, (B) Cu-NPs and (C) diets.
NPs and (C) Zn-NPs
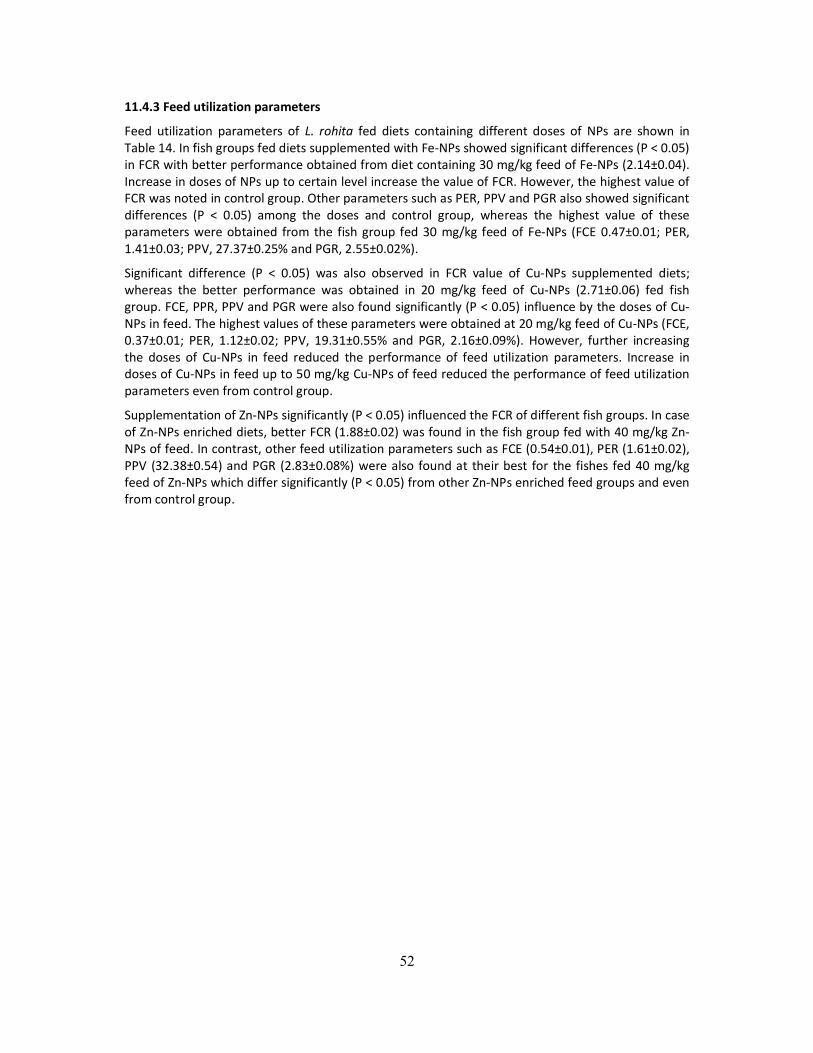
52
11.4.3 Feed utilization parameters
Feed utilization parameters of L. rohita fed diets containing different doses of NPs are shown in Table 14. In fish groups fed diets supplemented with Fe-NPs showed significant differences (P < 0.05) in FCR with better performance obtained from diet containing 30 mg/kg feed of Fe-NPs (2.14±0.04). Increase in doses of NPs up to certain level increase the value of FCR. However, the highest value of FCR was noted in control group. Other parameters such as PER, PPV and PGR also showed significant differences (P < 0.05) among the doses and control group, whereas the highest value of these parameters were obtained from the fish group fed 30 mg/kg feed of Fe-NPs (FCE 0.47±0.01; PER, 1.41±0.03; PPV, 27.37±0.25% and PGR, 2.55±0.02%).
Significant difference (P < 0.05) was also observed in FCR value of Cu-NPs supplemented diets; whereas the better performance was obtained in 20 mg/kg feed of Cu-NPs (2.71±0.06) fed fish group. FCE, PPR, PPV and PGR were also found significantly (P < 0.05) influence by the doses of Cu-NPs in feed. The highest values of these parameters were obtained at 20 mg/kg feed of Cu-NPs (FCE, 0.37±0.01; PER, 1.12±0.02; PPV, 19.31±0.55% and PGR, 2.16±0.09%). However, further increasing the doses of Cu-NPs in feed reduced the performance of feed utilization parameters. Increase in doses of Cu-NPs in feed up to 50 mg/kg Cu-NPs of feed reduced the performance of feed utilization parameters even from control group.
Supplementation of Zn-NPs significantly (P < 0.05) influenced the FCR of different fish groups. In case of Zn-NPs enriched diets, better FCR (1.88±0.02) was found in the fish group fed with 40 mg/kg Zn-NPs of feed. In contrast, other feed utilization parameters such as FCE (0.54±0.01), PER (1.61±0.02), PPV (32.38±0.54) and PGR (2.83±0.08%) were also found at their best for the fishes fed 40 mg/kg feed of Zn-NPs which differ significantly (P < 0.05) from other Zn-NPs enriched feed groups and even from control group.
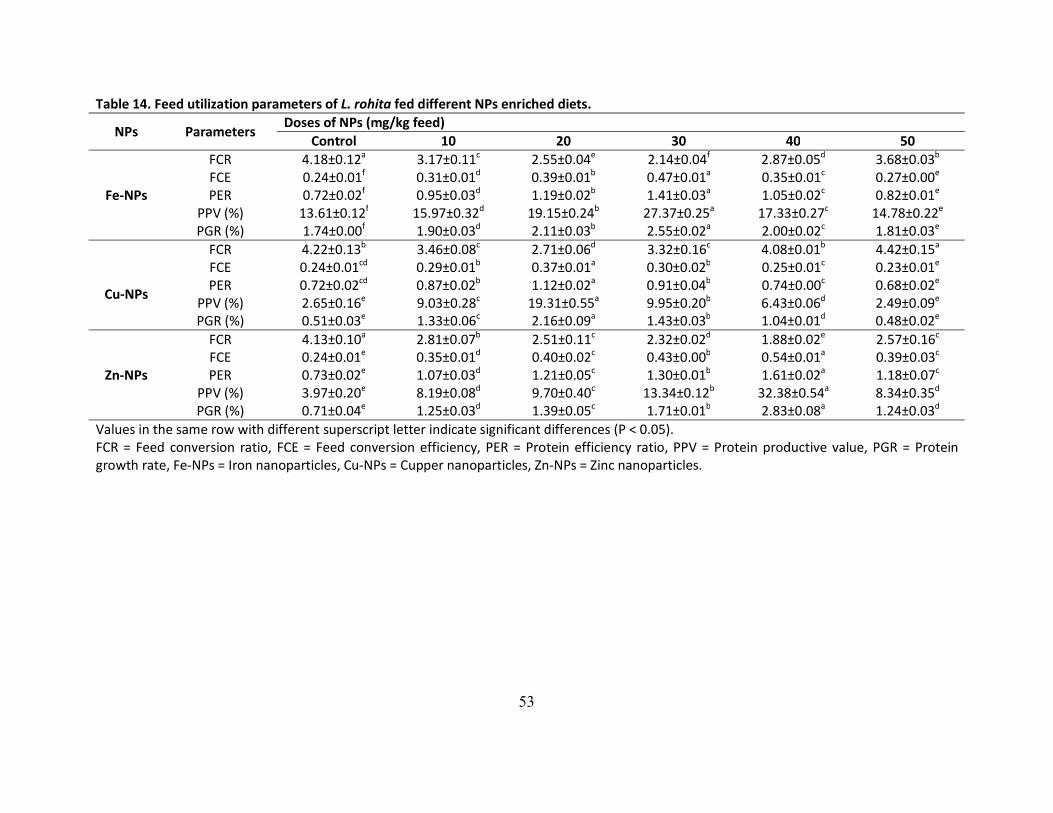
53
Table 14. Feed utilization parameters of L. rohita fed different NPs enriched diets.
NPs Parameters Doses of NPs (mg/kg feed)
Control 10 20 30 40 50
Fe-NPs
FCR 4.18±0.12a 3.17±0.11c 2.55±0.04e 2.14±0.04f 2.87±0.05d 3.68±0.03b FCE 0.24±0.01f 0.31±0.01d 0.39±0.01b 0.47±0.01a 0.35±0.01c 0.27±0.00e PER 0.72±0.02f 0.95±0.03d 1.19±0.02b 1.41±0.03a 1.05±0.02c 0.82±0.01e
PPV (%) 13.61±0.12f 15.97±0.32d 19.15±0.24b 27.37±0.25a 17.33±0.27c 14.78±0.22e PGR (%) 1.74±0.00f 1.90±0.03d 2.11±0.03b 2.55±0.02a 2.00±0.02c 1.81±0.03e
Cu-NPs
FCR 4.22±0.13b 3.46±0.08c 2.71±0.06d 3.32±0.16c 4.08±0.01b 4.42±0.15a FCE 0.24±0.01cd 0.29±0.01b 0.37±0.01a 0.30±0.02b 0.25±0.01c 0.23±0.01e PER 0.72±0.02cd 0.87±0.02b 1.12±0.02a 0.91±0.04b 0.74±0.00c 0.68±0.02e
PPV (%) 2.65±0.16e 9.03±0.28c 19.31±0.55a 9.95±0.20b 6.43±0.06d 2.49±0.09e PGR (%) 0.51±0.03e 1.33±0.06c 2.16±0.09a 1.43±0.03b 1.04±0.01d 0.48±0.02e
Zn-NPs
FCR 4.13±0.10a 2.81±0.07b 2.51±0.11c 2.32±0.02d 1.88±0.02e 2.57±0.16c FCE 0.24±0.01e 0.35±0.01d 0.40±0.02c 0.43±0.00b 0.54±0.01a 0.39±0.03c PER 0.73±0.02e 1.07±0.03d 1.21±0.05c 1.30±0.01b 1.61±0.02a 1.18±0.07c
PPV (%) 3.97±0.20e 8.19±0.08d 9.70±0.40c 13.34±0.12b 32.38±0.54a 8.34±0.35d PGR (%) 0.71±0.04e 1.25±0.03d 1.39±0.05c 1.71±0.01b 2.83±0.08a 1.24±0.03d
Values in the same row with different superscript letter indicate significant differences (P < 0.05). FCR = Feed conversion ratio, FCE = Feed conversion efficiency, PER = Protein efficiency ratio, PPV = Protein productive value, PGR = Protein growth rate, Fe-NPs = Iron nanoparticles, Cu-NPs = Cupper nanoparticles, Zn-NPs = Zinc nanoparticles.
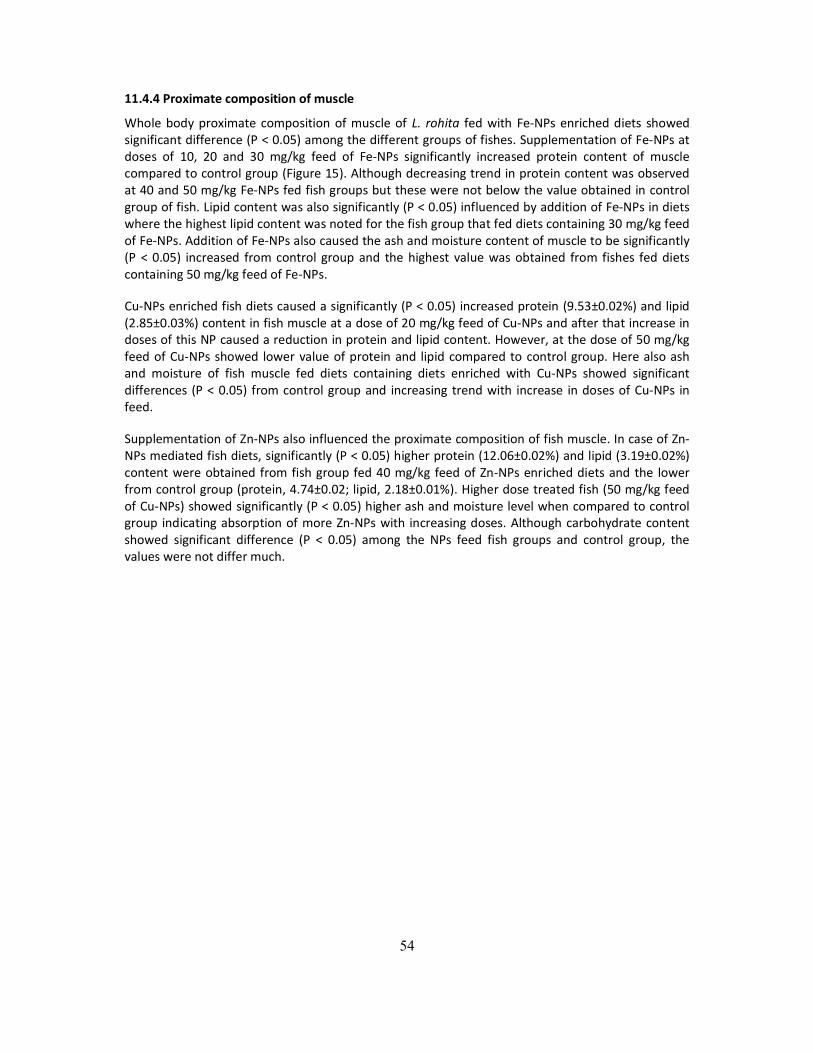
54
11.4.4 Proximate composition of muscle
Whole body proximate composition of muscle of L. rohita fed with Fe-NPs enriched diets showed significant difference (P < 0.05) among the different groups of fishes. Supplementation of Fe-NPs at doses of 10, 20 and 30 mg/kg feed of Fe-NPs significantly increased protein content of muscle compared to control group (Figure 15). Although decreasing trend in protein content was observed at 40 and 50 mg/kg Fe-NPs fed fish groups but these were not below the value obtained in control group of fish. Lipid content was also significantly (P < 0.05) influenced by addition of Fe-NPs in diets where the highest lipid content was noted for the fish group that fed diets containing 30 mg/kg feed of Fe-NPs. Addition of Fe-NPs also caused the ash and moisture content of muscle to be significantly (P < 0.05) increased from control group and the highest value was obtained from fishes fed diets containing 50 mg/kg feed of Fe-NPs.
Cu-NPs enriched fish diets caused a significantly (P < 0.05) increased protein (9.53±0.02%) and lipid (2.85±0.03%) content in fish muscle at a dose of 20 mg/kg feed of Cu-NPs and after that increase in doses of this NP caused a reduction in protein and lipid content. However, at the dose of 50 mg/kg feed of Cu-NPs showed lower value of protein and lipid compared to control group. Here also ash and moisture of fish muscle fed diets containing diets enriched with Cu-NPs showed significant differences (P < 0.05) from control group and increasing trend with increase in doses of Cu-NPs in feed.
Supplementation of Zn-NPs also influenced the proximate composition of fish muscle. In case of Zn-NPs mediated fish diets, significantly (P < 0.05) higher protein (12.06±0.02%) and lipid (3.19±0.02%) content were obtained from fish group fed 40 mg/kg feed of Zn-NPs enriched diets and the lower from control group (protein, 4.74±0.02; lipid, 2.18±0.01%). Higher dose treated fish (50 mg/kg feed of Cu-NPs) showed significantly (P < 0.05) higher ash and moisture level when compared to control group indicating absorption of more Zn-NPs with increasing doses. Although carbohydrate content showed significant difference (P < 0.05) among the NPs feed fish groups and control group, the values were not differ much.
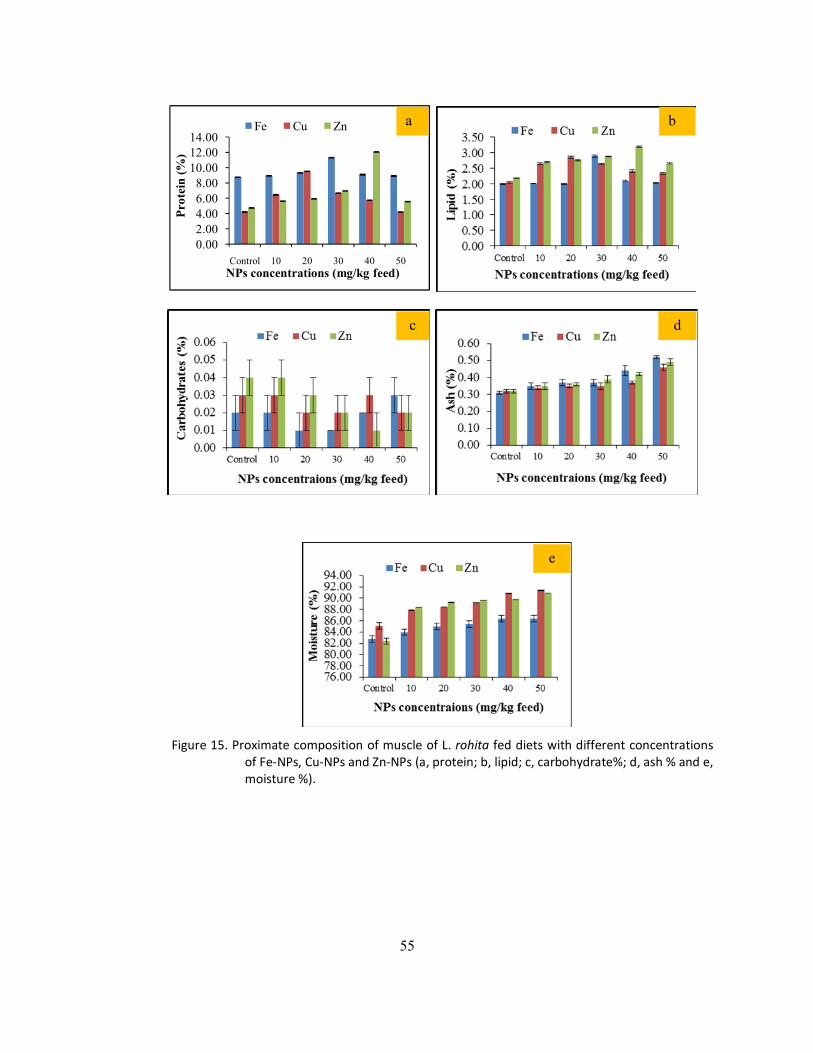
55
0.002.004.006.008.00
10.0012.0014.00
Control 10 20 30 40 50
Pro
tein
(%
)
NPs concentrations (mg/kg feed)
Fe Cu Zn a
Figure 15. Proximate composition of muscle of L. rohita fed diets with different concentrations of Fe-NPs, Cu-NPs and Zn-NPs (a, protein; b, lipid; c, carbohydrate%; d, ash % and e, moisture %).
e
c
b
d
56
11.2.5 Hematological parameters
Blood parameters of L. rohita fed diets supplemented with different NPs at different doses are shown in Table 15. Significant (P < 0.05) increase in RBC level was observed with increasing the doses of Fe-NPs in diets compared to control group. WBC content also varied significantly (P < 0.05) among the feed groups and control group; whereas significantly (P < 0.05) higher WBC content was observed in fish group fed diets enriched with 30 mg/kg feed of Fe-NPs. However, further increase in doses of Fe-NPs reduced the immune system of fish which was evident by decreasing trend of WBC content. Similar to RBC, hemoglobin content was also found to increase with increasing Fe-NPs doses in diets. Significant (P < 0.05) increase in total protein content was observed in the Fe-NPs supplemented diet fed fish compared to control group and significantly higher total protein content was noted for fishes fed 30 mg/kg feed of Fe-NPs. Albumin and globulin content also influenced by addition of Fe-NPs in diets compared to control group whereas lowest albumin content were found to decrease with increase in doses of Fe-NPs in diets. However, the highest globulin (3.85±0.02 gm/dl) content was found in fish group fed 30 mg/kg feed of Fe-NPs and the lowest in control group (2.57±0.01 gm/dl).
Addition of Cu-NPs in diets significantly (P < 0.05) influenced the RBC, WBC, hemoglobin, albumin and globulin content of fish blood. A dose of 20 mg/kg feed Cu-NPs significantly increase the hematological parameters compared to other feed group of fishes and control group. However, Cu-NPs doses of 30, 40 and 50 mg/kg feed showed significantly (P < 0.05) reducing trend in RBC, WBC, hemoglobin, total protein and globulin content compared to the fish group fed 20 mg/kg feed of Cu-NPs.
In case of fish groups fed diets containing Zn-NPs showed significantly (P < 0.05) highest RBC (114.73±0.02%), WBC (347.55±0.02%), hemoglobin (5.15±0.02%), total protein (15.83±0.02 g/dl) and globulin (3.89±0.02 g/dl) content in 40 mg/kg feed of Zn-NPs enriched diet compared to other doses and control group (Table 15). However, increase in doses up to 50 mg/kg feed of Zn-NPs significantly (P < 0.05) reduced these aforementioned blood parameters. Albumin content was found to significantly (P < 0.05) reduced with increasing Zn-NPs content in diets compared to control group.
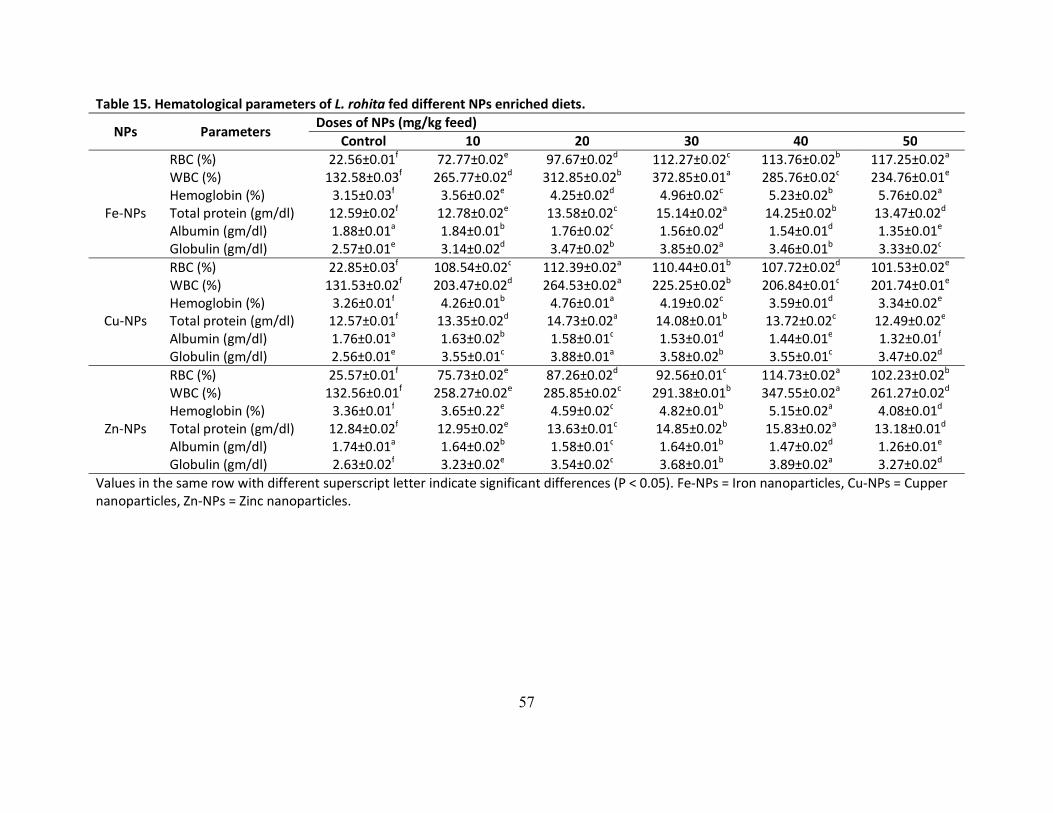
57
Table 15. Hematological parameters of L. rohita fed different NPs enriched diets.
NPs Parameters Doses of NPs (mg/kg feed)
Control 10 20 30 40 50
Fe-NPs
RBC (%) 22.56±0.01f 72.77±0.02e 97.67±0.02d 112.27±0.02c 113.76±0.02b 117.25±0.02a WBC (%) 132.58±0.03f 265.77±0.02d 312.85±0.02b 372.85±0.01a 285.76±0.02c 234.76±0.01e Hemoglobin (%) 3.15±0.03f 3.56±0.02e 4.25±0.02d 4.96±0.02c 5.23±0.02b 5.76±0.02a Total protein (gm/dl) 12.59±0.02f 12.78±0.02e 13.58±0.02c 15.14±0.02a 14.25±0.02b 13.47±0.02d Albumin (gm/dl) 1.88±0.01a 1.84±0.01b 1.76±0.02c 1.56±0.02d 1.54±0.01d 1.35±0.01e Globulin (gm/dl) 2.57±0.01e 3.14±0.02d 3.47±0.02b 3.85±0.02a 3.46±0.01b 3.33±0.02c
Cu-NPs
RBC (%) 22.85±0.03f 108.54±0.02c 112.39±0.02a 110.44±0.01b 107.72±0.02d 101.53±0.02e WBC (%) 131.53±0.02f 203.47±0.02d 264.53±0.02a 225.25±0.02b 206.84±0.01c 201.74±0.01e Hemoglobin (%) 3.26±0.01f 4.26±0.01b 4.76±0.01a 4.19±0.02c 3.59±0.01d 3.34±0.02e Total protein (gm/dl) 12.57±0.01f 13.35±0.02d 14.73±0.02a 14.08±0.01b 13.72±0.02c 12.49±0.02e Albumin (gm/dl) 1.76±0.01a 1.63±0.02b 1.58±0.01c 1.53±0.01d 1.44±0.01e 1.32±0.01f Globulin (gm/dl) 2.56±0.01e 3.55±0.01c 3.88±0.01a 3.58±0.02b 3.55±0.01c 3.47±0.02d
Zn-NPs
RBC (%) 25.57±0.01f 75.73±0.02e 87.26±0.02d 92.56±0.01c 114.73±0.02a 102.23±0.02b WBC (%) 132.56±0.01f 258.27±0.02e 285.85±0.02c 291.38±0.01b 347.55±0.02a 261.27±0.02d Hemoglobin (%) 3.36±0.01f 3.65±0.22e 4.59±0.02c 4.82±0.01b 5.15±0.02a 4.08±0.01d Total protein (gm/dl) 12.84±0.02f 12.95±0.02e 13.63±0.01c 14.85±0.02b 15.83±0.02a 13.18±0.01d Albumin (gm/dl) 1.74±0.01a 1.64±0.02b 1.58±0.01c 1.64±0.01b 1.47±0.02d 1.26±0.01e Globulin (gm/dl) 2.63±0.02f 3.23±0.02e 3.54±0.02c 3.68±0.01b 3.89±0.02a 3.27±0.02d
Values in the same row with different superscript letter indicate significant differences (P < 0.05). Fe-NPs = Iron nanoparticles, Cu-NPs = Cupper nanoparticles, Zn-NPs = Zinc nanoparticles.
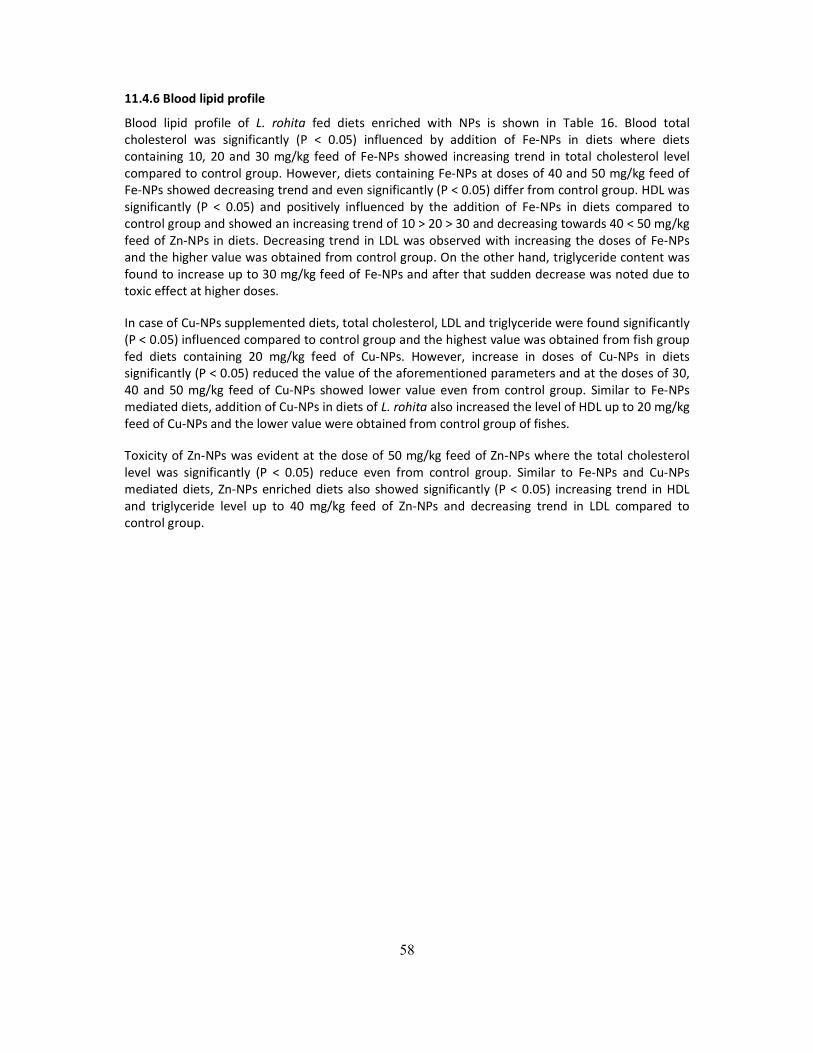
58
11.4.6 Blood lipid profile
Blood lipid profile of L. rohita fed diets enriched with NPs is shown in Table 16. Blood total cholesterol was significantly (P < 0.05) influenced by addition of Fe-NPs in diets where diets containing 10, 20 and 30 mg/kg feed of Fe-NPs showed increasing trend in total cholesterol level compared to control group. However, diets containing Fe-NPs at doses of 40 and 50 mg/kg feed of Fe-NPs showed decreasing trend and even significantly (P < 0.05) differ from control group. HDL was significantly (P < 0.05) and positively influenced by the addition of Fe-NPs in diets compared to control group and showed an increasing trend of 10 > 20 > 30 and decreasing towards 40 < 50 mg/kg feed of Zn-NPs in diets. Decreasing trend in LDL was observed with increasing the doses of Fe-NPs and the higher value was obtained from control group. On the other hand, triglyceride content was found to increase up to 30 mg/kg feed of Fe-NPs and after that sudden decrease was noted due to toxic effect at higher doses.
In case of Cu-NPs supplemented diets, total cholesterol, LDL and triglyceride were found significantly (P < 0.05) influenced compared to control group and the highest value was obtained from fish group fed diets containing 20 mg/kg feed of Cu-NPs. However, increase in doses of Cu-NPs in diets significantly (P < 0.05) reduced the value of the aforementioned parameters and at the doses of 30, 40 and 50 mg/kg feed of Cu-NPs showed lower value even from control group. Similar to Fe-NPs mediated diets, addition of Cu-NPs in diets of L. rohita also increased the level of HDL up to 20 mg/kg feed of Cu-NPs and the lower value were obtained from control group of fishes.
Toxicity of Zn-NPs was evident at the dose of 50 mg/kg feed of Zn-NPs where the total cholesterol level was significantly (P < 0.05) reduce even from control group. Similar to Fe-NPs and Cu-NPs mediated diets, Zn-NPs enriched diets also showed significantly (P < 0.05) increasing trend in HDL and triglyceride level up to 40 mg/kg feed of Zn-NPs and decreasing trend in LDL compared to control group.
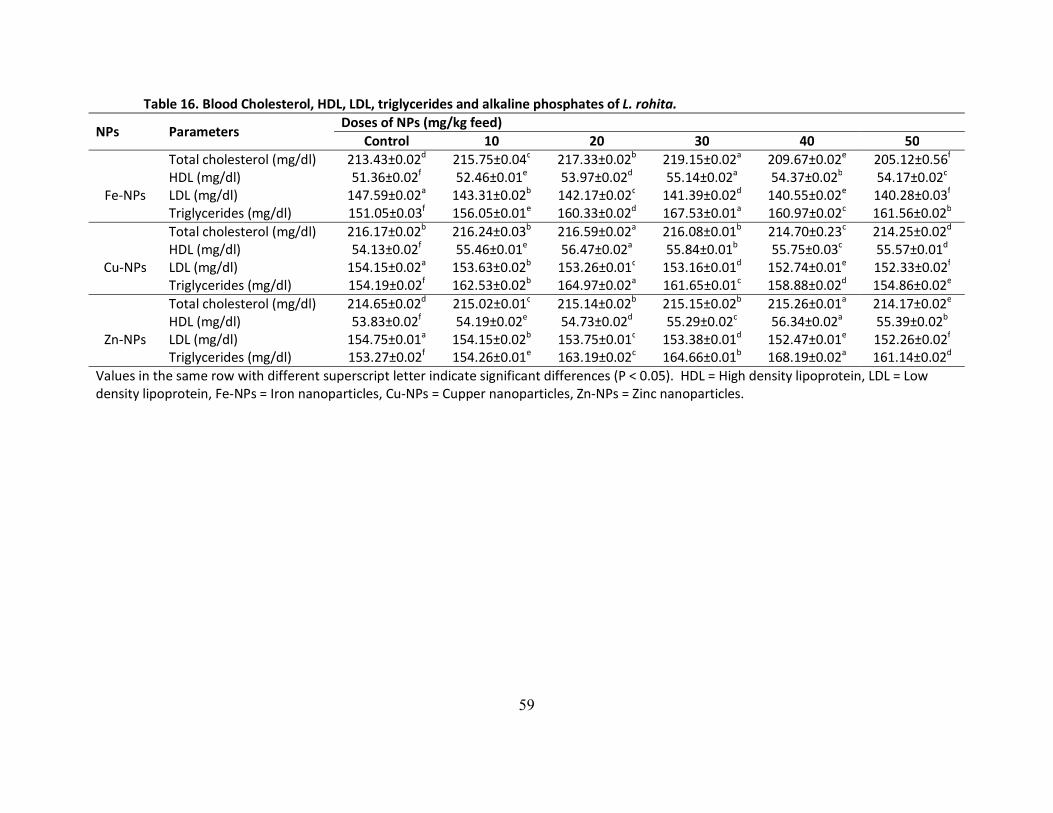
59
Table 16. Blood Cholesterol, HDL, LDL, triglycerides and alkaline phosphates of L. rohita.
NPs Parameters Doses of NPs (mg/kg feed)
Control 10 20 30 40 50
Fe-NPs
Total cholesterol (mg/dl) 213.43±0.02d 215.75±0.04c 217.33±0.02b 219.15±0.02a 209.67±0.02e 205.12±0.56f HDL (mg/dl) 51.36±0.02f 52.46±0.01e 53.97±0.02d 55.14±0.02a 54.37±0.02b 54.17±0.02c LDL (mg/dl) 147.59±0.02a 143.31±0.02b 142.17±0.02c 141.39±0.02d 140.55±0.02e 140.28±0.03f Triglycerides (mg/dl) 151.05±0.03f 156.05±0.01e 160.33±0.02d 167.53±0.01a 160.97±0.02c 161.56±0.02b
Cu-NPs
Total cholesterol (mg/dl) 216.17±0.02b 216.24±0.03b 216.59±0.02a 216.08±0.01b 214.70±0.23c 214.25±0.02d HDL (mg/dl) 54.13±0.02f 55.46±0.01e 56.47±0.02a 55.84±0.01b 55.75±0.03c 55.57±0.01d LDL (mg/dl) 154.15±0.02a 153.63±0.02b 153.26±0.01c 153.16±0.01d 152.74±0.01e 152.33±0.02f Triglycerides (mg/dl) 154.19±0.02f 162.53±0.02b 164.97±0.02a 161.65±0.01c 158.88±0.02d 154.86±0.02e
Zn-NPs
Total cholesterol (mg/dl) 214.65±0.02d 215.02±0.01c 215.14±0.02b 215.15±0.02b 215.26±0.01a 214.17±0.02e HDL (mg/dl) 53.83±0.02f 54.19±0.02e 54.73±0.02d 55.29±0.02c 56.34±0.02a 55.39±0.02b LDL (mg/dl) 154.75±0.01a 154.15±0.02b 153.75±0.01c 153.38±0.01d 152.47±0.01e 152.26±0.02f Triglycerides (mg/dl) 153.27±0.02f 154.26±0.01e 163.19±0.02c 164.66±0.01b 168.19±0.02a 161.14±0.02d
Values in the same row with different superscript letter indicate significant differences (P < 0.05). HDL = High density lipoprotein, LDL = Low density lipoprotein, Fe-NPs = Iron nanoparticles, Cu-NPs = Cupper nanoparticles, Zn-NPs = Zinc nanoparticles.
60
11.4.7 Serum enzyme profile Data in Table 17 showed a significant (P < 0.05) increase in the serum level of alanine aminotransferase (ALT) and aspartate aminotransferase (AST) in all treated groups of Fe-NPs, Cu-NPs and Zn-NPs enriched diets compared to control group of fishes. However, amylase, lipase and protease were found significantly (P < 0.05) increase in fish groups fed diets containing Fe-NPs supplemented diets up to 30 mg/kg feed of Fe-NPs compared to control group. After that, further increase in doses of Fe-NPs in feed significantly (P < 0.05) reduced the above mentioned enzymatic activities. Enzymatic activities in fish serum fed diets supplemented with Cu-NPs showed gradual increase up to 20 mg /kg feed of Cu-NPs. Further increase in dose gradually reduced the activity of amylase, lipase and protease in fish serum. However, fish fed diet containing 50 mg/kg feed of Cu-NPs did not showed significant (P < 0.05) difference from control group. In fishes fed the diets enriched with Zn-NPs showed the activity of amylase, lipase and protease in order of 40 > 30 > 20 > 50 > 10 mg/kg feed of Zn-NPs and these groups were significantly (P < 0.05) different from control group. Alkaline phosphatase (ALP) was found to increase with increasing the doses of NPs (Fe-NPs, Cu-NPs and Zn-NPs) in diets compared to control group. Although ALP showed significant (P < 0.05) difference among the control group and Cu-NPs enriched diets, no significant differences (P < 0.05) were observed among the diets containing different doses of Cu-NPs in feed.
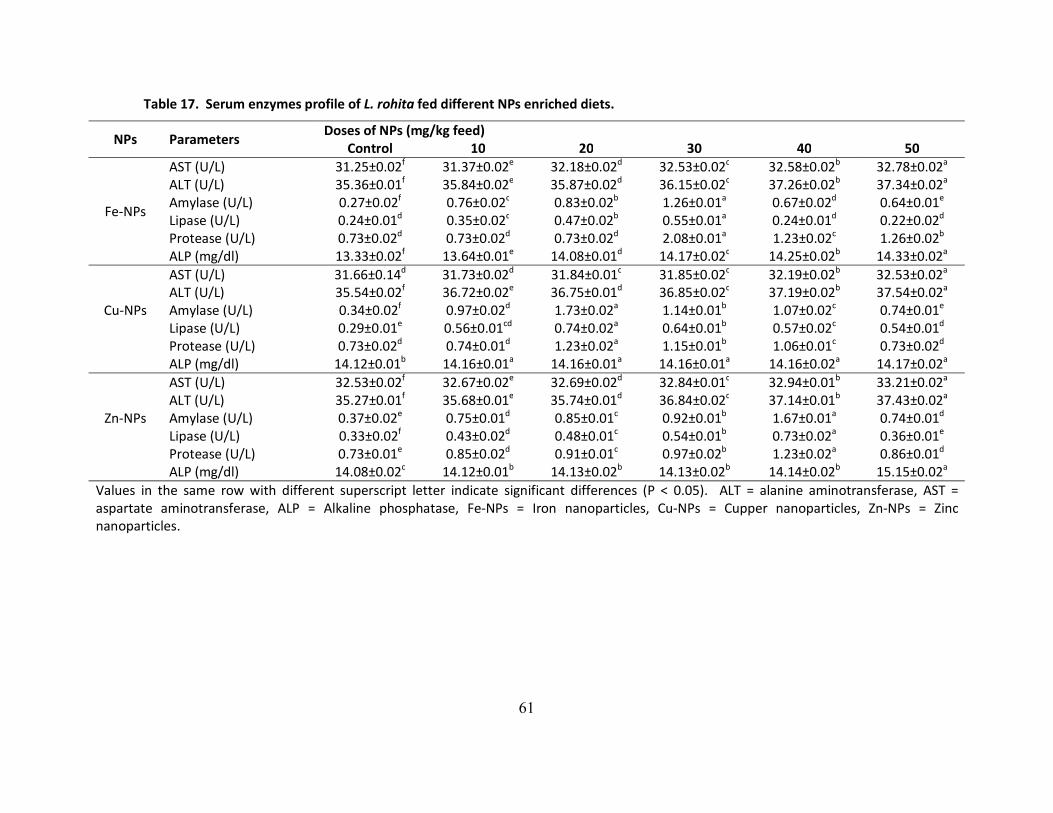
61
Table 17. Serum enzymes profile of L. rohita fed different NPs enriched diets.
NPs Parameters Doses of NPs (mg/kg feed) Control 10 20 30 40 50
Fe-NPs
AST (U/L) 31.25±0.02f 31.37±0.02e 32.18±0.02d 32.53±0.02c 32.58±0.02b 32.78±0.02a ALT (U/L) 35.36±0.01f 35.84±0.02e 35.87±0.02d 36.15±0.02c 37.26±0.02b 37.34±0.02a Amylase (U/L) 0.27±0.02f 0.76±0.02c 0.83±0.02b 1.26±0.01a 0.67±0.02d 0.64±0.01e Lipase (U/L) 0.24±0.01d 0.35±0.02c 0.47±0.02b 0.55±0.01a 0.24±0.01d 0.22±0.02d Protease (U/L) 0.73±0.02d 0.73±0.02d 0.73±0.02d 2.08±0.01a 1.23±0.02c 1.26±0.02b ALP (mg/dl) 13.33±0.02f 13.64±0.01e 14.08±0.01d 14.17±0.02c 14.25±0.02b 14.33±0.02a
Cu-NPs
AST (U/L) 31.66±0.14d 31.73±0.02d 31.84±0.01c 31.85±0.02c 32.19±0.02b 32.53±0.02a ALT (U/L) 35.54±0.02f 36.72±0.02e 36.75±0.01d 36.85±0.02c 37.19±0.02b 37.54±0.02a Amylase (U/L) 0.34±0.02f 0.97±0.02d 1.73±0.02a 1.14±0.01b 1.07±0.02c 0.74±0.01e Lipase (U/L) 0.29±0.01e 0.56±0.01cd 0.74±0.02a 0.64±0.01b 0.57±0.02c 0.54±0.01d Protease (U/L) 0.73±0.02d 0.74±0.01d 1.23±0.02a 1.15±0.01b 1.06±0.01c 0.73±0.02d ALP (mg/dl) 14.12±0.01b 14.16±0.01a 14.16±0.01a 14.16±0.01a 14.16±0.02a 14.17±0.02a
Zn-NPs
AST (U/L) 32.53±0.02f 32.67±0.02e 32.69±0.02d 32.84±0.01c 32.94±0.01b 33.21±0.02a ALT (U/L) 35.27±0.01f 35.68±0.01e 35.74±0.01d 36.84±0.02c 37.14±0.01b 37.43±0.02a Amylase (U/L) 0.37±0.02e 0.75±0.01d 0.85±0.01c 0.92±0.01b 1.67±0.01a 0.74±0.01d Lipase (U/L) 0.33±0.02f 0.43±0.02d 0.48±0.01c 0.54±0.01b 0.73±0.02a 0.36±0.01e Protease (U/L) 0.73±0.01e 0.85±0.02d 0.91±0.01c 0.97±0.02b 1.23±0.02a 0.86±0.01d ALP (mg/dl) 14.08±0.02c 14.12±0.01b 14.13±0.02b 14.13±0.02b 14.14±0.02b 15.15±0.02a
Values in the same row with different superscript letter indicate significant differences (P < 0.05). ALT = alanine aminotransferase, AST = aspartate aminotransferase, ALP = Alkaline phosphatase, Fe-NPs = Iron nanoparticles, Cu-NPs = Cupper nanoparticles, Zn-NPs = Zinc nanoparticles.
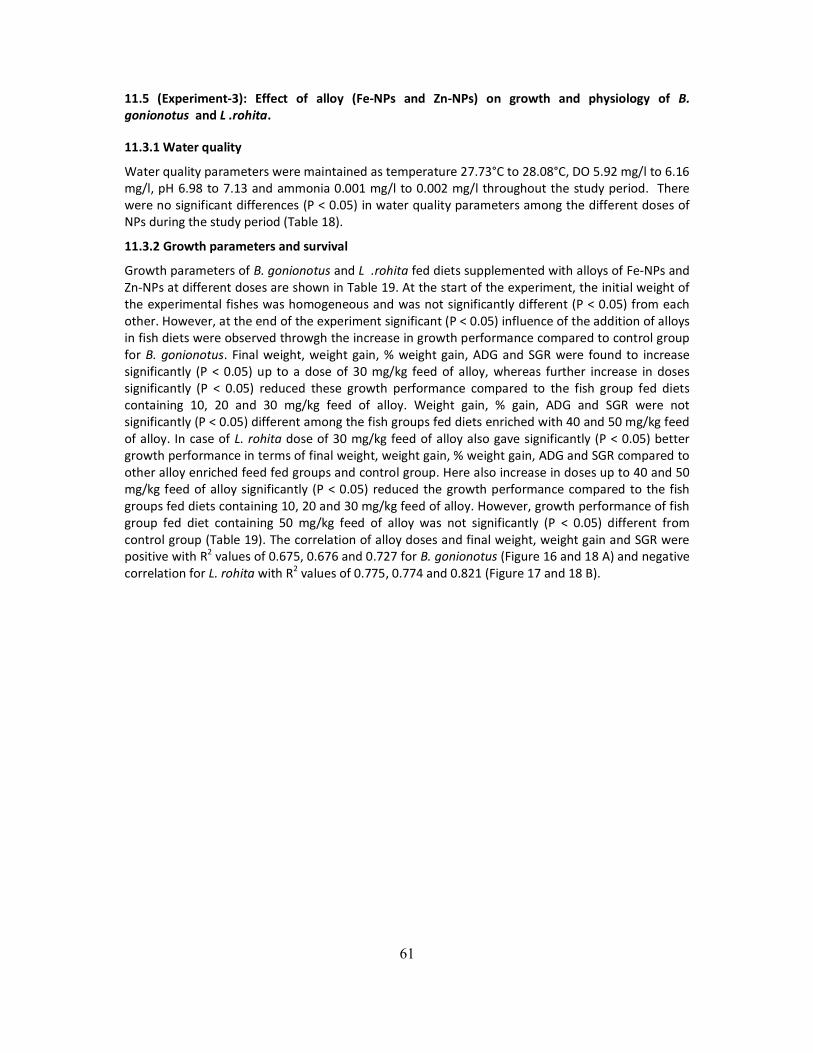
61
11.5 (Experiment-3): Effect of alloy (Fe-NPs and Zn-NPs) on growth and physiology of B. gonionotus and L .rohita.
11.3.1 Water quality
Water quality parameters were maintained as temperature 27.73°C to 28.08°C, DO 5.92 mg/l to 6.16 mg/l, pH 6.98 to 7.13 and ammonia 0.001 mg/l to 0.002 mg/l throughout the study period. There were no significant differences (P < 0.05) in water quality parameters among the different doses of NPs during the study period (Table 18).
11.3.2 Growth parameters and survival
Growth parameters of B. gonionotus and L .rohita fed diets supplemented with alloys of Fe-NPs and Zn-NPs at different doses are shown in Table 19. At the start of the experiment, the initial weight of the experimental fishes was homogeneous and was not significantly different (P < 0.05) from each other. However, at the end of the experiment significant (P < 0.05) influence of the addition of alloys in fish diets were observed throwgh the increase in growth performance compared to control group for B. gonionotus. Final weight, weight gain, % weight gain, ADG and SGR were found to increase significantly (P < 0.05) up to a dose of 30 mg/kg feed of alloy, whereas further increase in doses significantly (P < 0.05) reduced these growth performance compared to the fish group fed diets containing 10, 20 and 30 mg/kg feed of alloy. Weight gain, % gain, ADG and SGR were not significantly (P < 0.05) different among the fish groups fed diets enriched with 40 and 50 mg/kg feed of alloy. In case of L. rohita dose of 30 mg/kg feed of alloy also gave significantly (P < 0.05) better growth performance in terms of final weight, weight gain, % weight gain, ADG and SGR compared to other alloy enriched feed fed groups and control group. Here also increase in doses up to 40 and 50 mg/kg feed of alloy significantly (P < 0.05) reduced the growth performance compared to the fish groups fed diets containing 10, 20 and 30 mg/kg feed of alloy. However, growth performance of fish group fed diet containing 50 mg/kg feed of alloy was not significantly (P < 0.05) different from control group (Table 19). The correlation of alloy doses and final weight, weight gain and SGR were positive with R2 values of 0.675, 0.676 and 0.727 for B. gonionotus (Figure 16 and 18 A) and negative correlation for L. rohita with R2 values of 0.775, 0.774 and 0.821 (Figure 17 and 18 B).
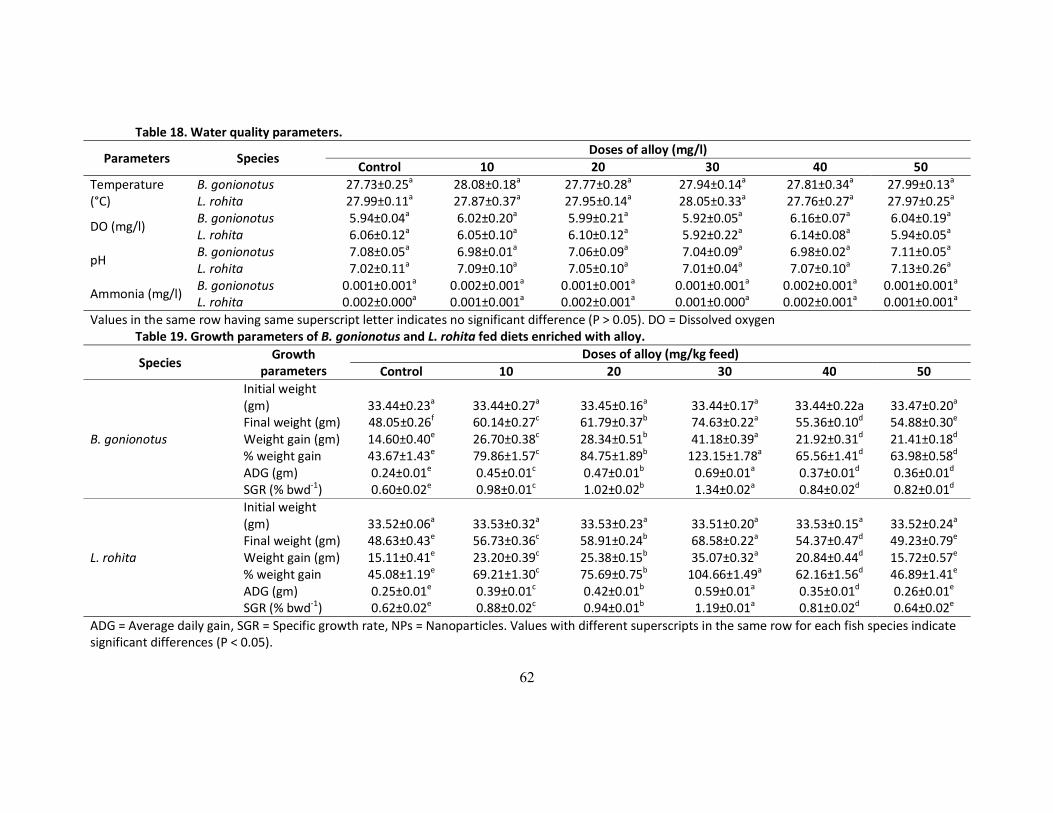
62
Table 18. Water quality parameters.
Parameters Species Doses of alloy (mg/l)
Control 10 20 30 40 50 Temperature (°C)
B. gonionotus 27.73±0.25a 28.08±0.18a 27.77±0.28a 27.94±0.14a 27.81±0.34a 27.99±0.13a L. rohita 27.99±0.11a 27.87±0.37a 27.95±0.14a 28.05±0.33a 27.76±0.27a 27.97±0.25a
DO (mg/l) B. gonionotus 5.94±0.04a 6.02±0.20a 5.99±0.21a 5.92±0.05a 6.16±0.07a 6.04±0.19a L. rohita 6.06±0.12a 6.05±0.10a 6.10±0.12a 5.92±0.22a 6.14±0.08a 5.94±0.05a
pH B. gonionotus 7.08±0.05a 6.98±0.01a 7.06±0.09a 7.04±0.09a 6.98±0.02a 7.11±0.05a L. rohita 7.02±0.11a 7.09±0.10a 7.05±0.10a 7.01±0.04a 7.07±0.10a 7.13±0.26a
Ammonia (mg/l) B. gonionotus 0.001±0.001a 0.002±0.001a 0.001±0.001a 0.001±0.001a 0.002±0.001a 0.001±0.001a L. rohita 0.002±0.000a 0.001±0.001a 0.002±0.001a 0.001±0.000a 0.002±0.001a 0.001±0.001a
Values in the same row having same superscript letter indicates no significant difference (P > 0.05). DO = Dissolved oxygen Table 19. Growth parameters of B. gonionotus and L. rohita fed diets enriched with alloy.
Species Growth
parameters Doses of alloy (mg/kg feed)
Control 10 20 30 40 50
B. gonionotus
Initial weight (gm) 33.44±0.23a 33.44±0.27a 33.45±0.16a 33.44±0.17a 33.44±0.22a 33.47±0.20a Final weight (gm) 48.05±0.26f 60.14±0.27c 61.79±0.37b 74.63±0.22a 55.36±0.10d 54.88±0.30e Weight gain (gm) 14.60±0.40e 26.70±0.38c 28.34±0.51b 41.18±0.39a 21.92±0.31d 21.41±0.18d % weight gain 43.67±1.43e 79.86±1.57c 84.75±1.89b 123.15±1.78a 65.56±1.41d 63.98±0.58d ADG (gm) 0.24±0.01e 0.45±0.01c 0.47±0.01b 0.69±0.01a 0.37±0.01d 0.36±0.01d SGR (% bwd-1) 0.60±0.02e 0.98±0.01c 1.02±0.02b 1.34±0.02a 0.84±0.02d 0.82±0.01d
L. rohita
Initial weight (gm) 33.52±0.06a 33.53±0.32a 33.53±0.23a 33.51±0.20a 33.53±0.15a 33.52±0.24a Final weight (gm) 48.63±0.43e 56.73±0.36c 58.91±0.24b 68.58±0.22a 54.37±0.47d 49.23±0.79e Weight gain (gm) 15.11±0.41e 23.20±0.39c 25.38±0.15b 35.07±0.32a 20.84±0.44d 15.72±0.57e % weight gain 45.08±1.19e 69.21±1.30c 75.69±0.75b 104.66±1.49a 62.16±1.56d 46.89±1.41e ADG (gm) 0.25±0.01e 0.39±0.01c 0.42±0.01b 0.59±0.01a 0.35±0.01d 0.26±0.01e SGR (% bwd-1) 0.62±0.02e 0.88±0.02c 0.94±0.01b 1.19±0.01a 0.81±0.02d 0.64±0.02e
ADG = Average daily gain, SGR = Specific growth rate, NPs = Nanoparticles. Values with different superscripts in the same row for each fish species indicate significant differences (P < 0.05).
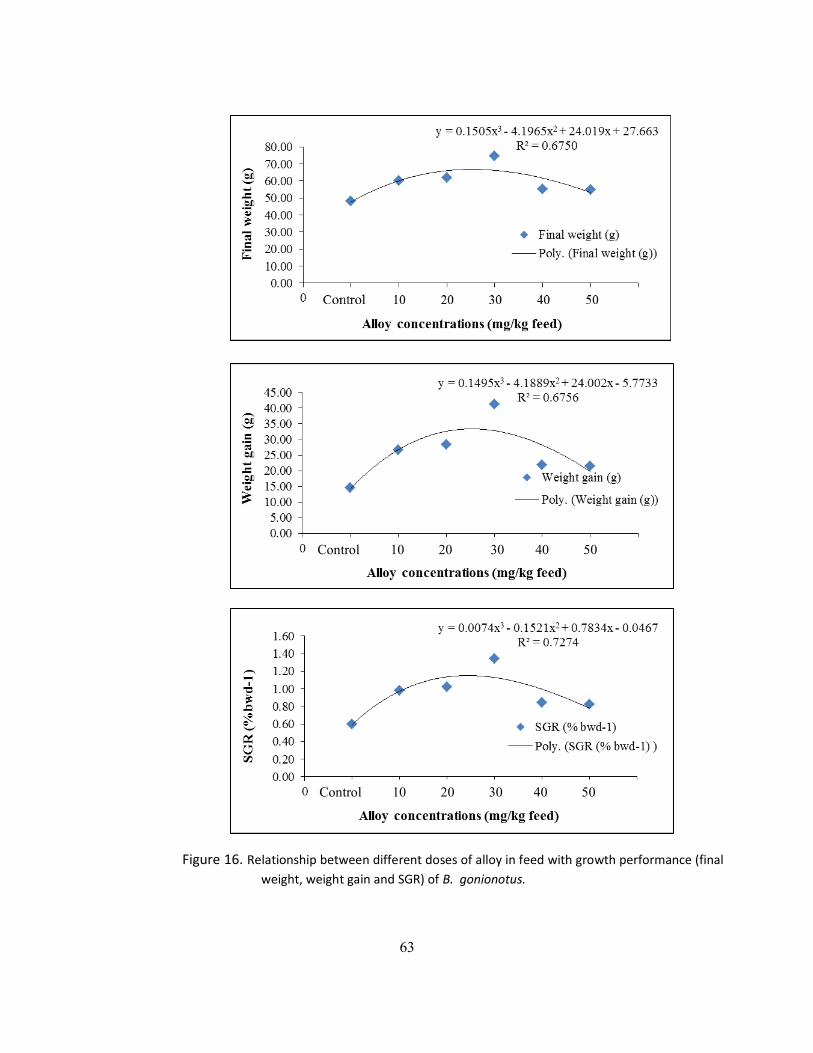
63
Control 10 20 30 40 50
Control 10 20 30 40 50
Figure 16. Relationship between different doses of alloy in feed with growth performance (final weight, weight gain and SGR) of B. gonionotus.
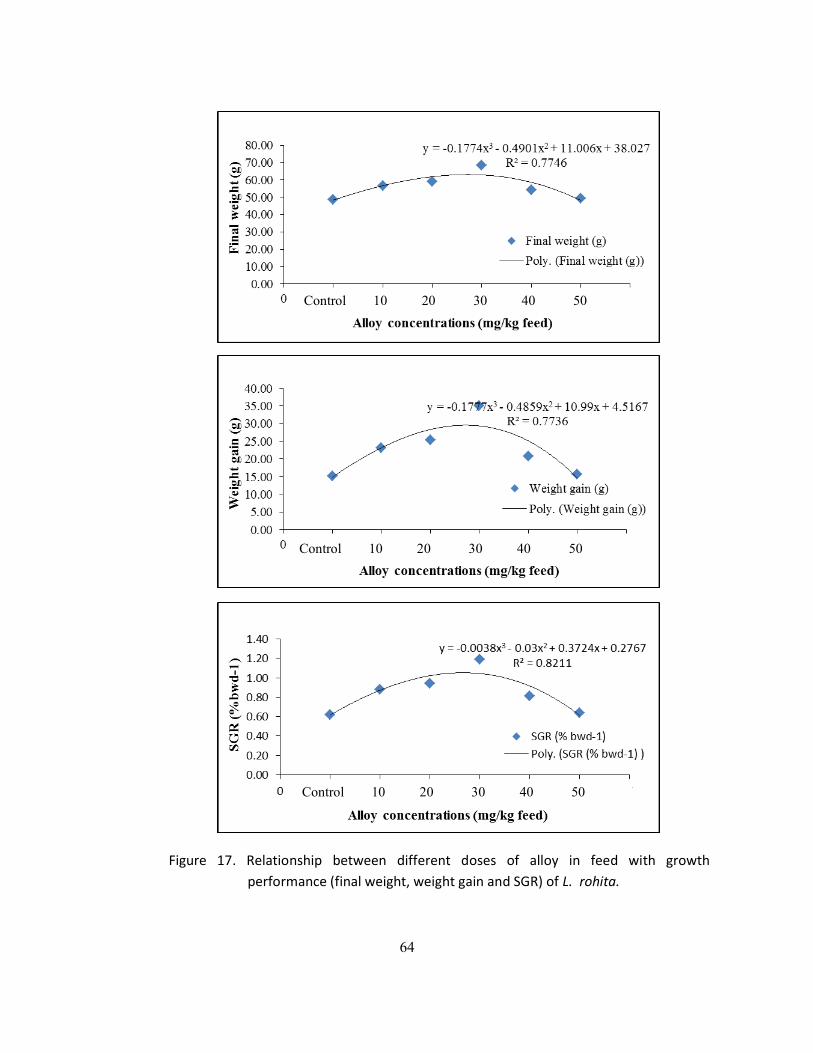
64
Control 10 20 30 40 50
Control 10 20 30 40 50
Control 10 20 30 40 50
Figure 17. Relationship between different doses of alloy in feed with growth performance (final weight, weight gain and SGR) of L. rohita.
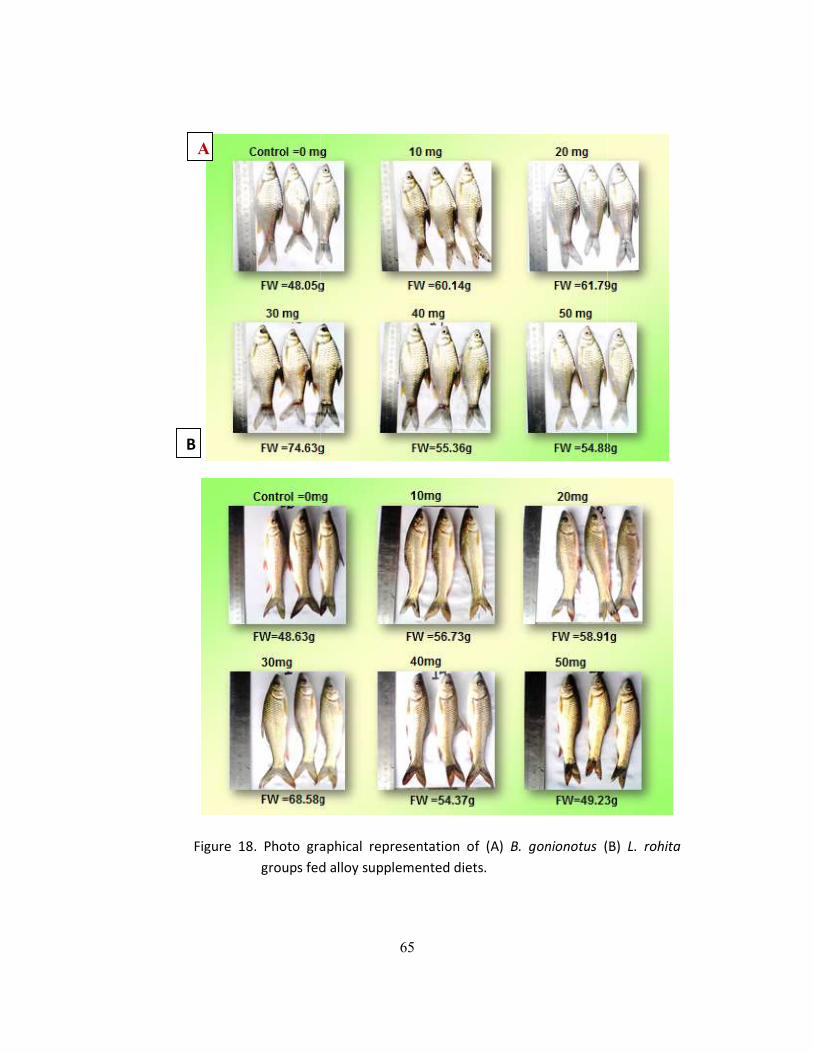
Figure 18. Photo graphical representation of
groups fed alloy supplemented diets.
A
B
65
raphical representation of (A) B. gonionotus (B) groups fed alloy supplemented diets.
(B) L. rohita
66
11.5.3 Feed utilization parameters In the present experiment, supplementation of alloys in diets significantly enhanced the feed utilization parameters of B. gonionotus and L. rohita (Table 20). In case of B. gonionotus, better performance of FCR was observed in fish group fed diet containing 30 mg/kg feed of alloy (1.46±0.02) compared to control group (4.12±0.14). Similar to growth performance, further increase in dose of alloy in diets up to 40 and 50 mg/kg feed significantly increased the FCR compared to 10, 20 and 30 mg/kg feed alloy fed fish groups. However, fish fed diet containing 10 and 50 mg/kg feed of alloy was not significantly different (P < 0.05) from each other. Significantly (P < 0.05) higher PER and PGR were observed in fish group fed 30 mg/kg feed of alloy compared to other NPs fed and control group. However, PPV showed its highest value in fish group fed 40 mg/kg feed of alloy and lowest in control group. In case of L. rohita, better performance in FCR was noted for the fish group feed 30 mg/kg feed of alloy, where also FCE and PER were found to give significantly (P < 0.05) higher value compared to other groups. Addition of 50 mg/kg feed of alloy caused significantly (P < 0.05) impact on PPV and reduced the value even lower than control group. However, PGR was not significantly (P < 0.05) different among 10, 50 mg/kg feed of alloy fed fish group and control group. Significant difference (P < 0.05) was also not observed between 20 and 30 mg/kg feed of alloy fed fish groups. The highest value of PGR were recorded in fish group fed 40 mg/kg feed of alloy.
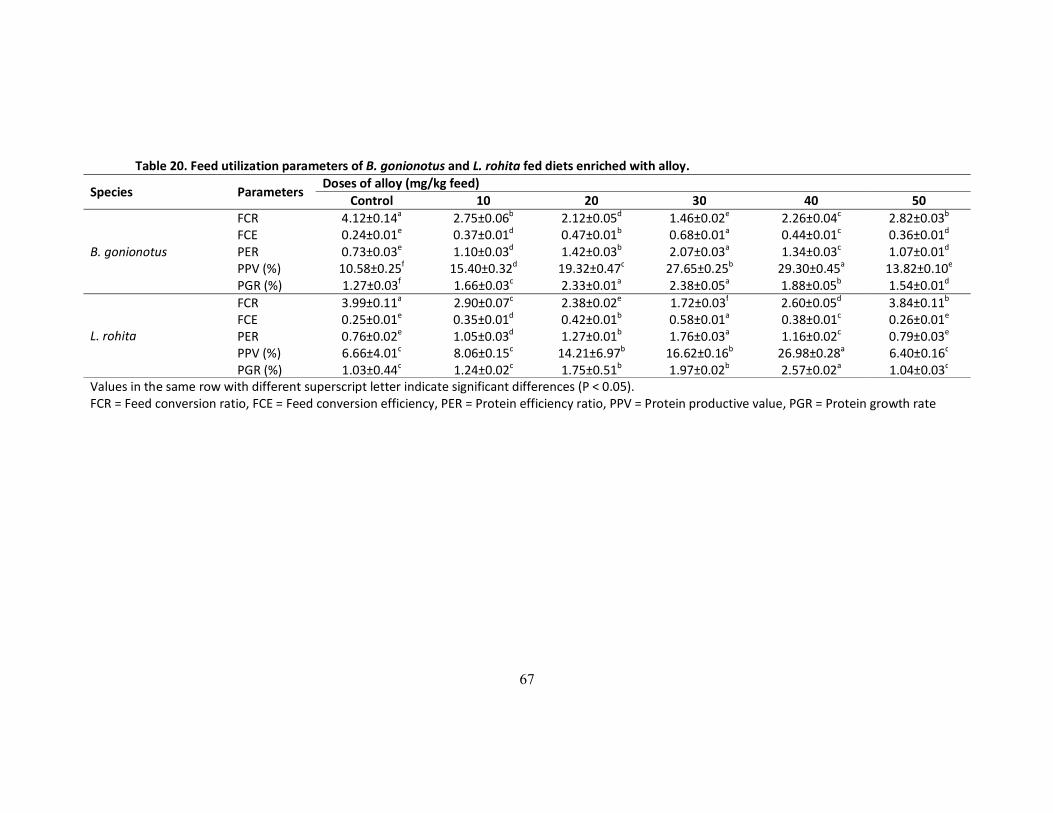
67
Table 20. Feed utilization parameters of B. gonionotus and L. rohita fed diets enriched with alloy.
Species Parameters Doses of alloy (mg/kg feed)
Control 10 20 30 40 50
B. gonionotus
FCR 4.12±0.14a 2.75±0.06b 2.12±0.05d 1.46±0.02e 2.26±0.04c 2.82±0.03b FCE 0.24±0.01e 0.37±0.01d 0.47±0.01b 0.68±0.01a 0.44±0.01c 0.36±0.01d PER 0.73±0.03e 1.10±0.03d 1.42±0.03b 2.07±0.03a 1.34±0.03c 1.07±0.01d PPV (%) 10.58±0.25f 15.40±0.32d 19.32±0.47c 27.65±0.25b 29.30±0.45a 13.82±0.10e PGR (%) 1.27±0.03f 1.66±0.03c 2.33±0.01a 2.38±0.05a 1.88±0.05b 1.54±0.01d
L. rohita
FCR 3.99±0.11a 2.90±0.07c 2.38±0.02e 1.72±0.03f 2.60±0.05d 3.84±0.11b FCE 0.25±0.01e 0.35±0.01d 0.42±0.01b 0.58±0.01a 0.38±0.01c 0.26±0.01e PER 0.76±0.02e 1.05±0.03d 1.27±0.01b 1.76±0.03a 1.16±0.02c 0.79±0.03e PPV (%) 6.66±4.01c 8.06±0.15c 14.21±6.97b 16.62±0.16b 26.98±0.28a 6.40±0.16c PGR (%) 1.03±0.44c 1.24±0.02c 1.75±0.51b 1.97±0.02b 2.57±0.02a 1.04±0.03c
Values in the same row with different superscript letter indicate significant differences (P < 0.05). FCR = Feed conversion ratio, FCE = Feed conversion efficiency, PER = Protein efficiency ratio, PPV = Protein productive value, PGR = Protein growth rate
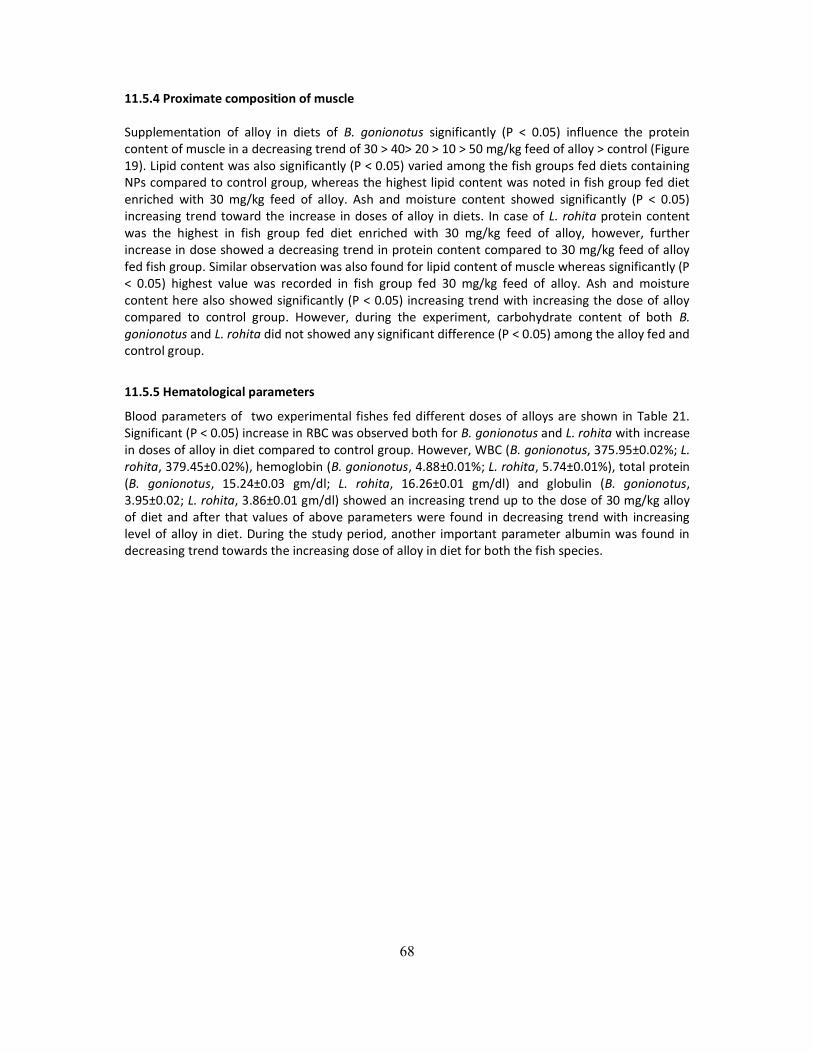
68
11.5.4 Proximate composition of muscle Supplementation of alloy in diets of B. gonionotus significantly (P < 0.05) influence the protein content of muscle in a decreasing trend of 30 > 40> 20 > 10 > 50 mg/kg feed of alloy > control (Figure 19). Lipid content was also significantly (P < 0.05) varied among the fish groups fed diets containing NPs compared to control group, whereas the highest lipid content was noted in fish group fed diet enriched with 30 mg/kg feed of alloy. Ash and moisture content showed significantly (P < 0.05) increasing trend toward the increase in doses of alloy in diets. In case of L. rohita protein content was the highest in fish group fed diet enriched with 30 mg/kg feed of alloy, however, further increase in dose showed a decreasing trend in protein content compared to 30 mg/kg feed of alloy fed fish group. Similar observation was also found for lipid content of muscle whereas significantly (P < 0.05) highest value was recorded in fish group fed 30 mg/kg feed of alloy. Ash and moisture content here also showed significantly (P < 0.05) increasing trend with increasing the dose of alloy compared to control group. However, during the experiment, carbohydrate content of both B. gonionotus and L. rohita did not showed any significant difference (P < 0.05) among the alloy fed and control group.
11.5.5 Hematological parameters
Blood parameters of two experimental fishes fed different doses of alloys are shown in Table 21. Significant (P < 0.05) increase in RBC was observed both for B. gonionotus and L. rohita with increase in doses of alloy in diet compared to control group. However, WBC (B. gonionotus, 375.95±0.02%; L. rohita, 379.45±0.02%), hemoglobin (B. gonionotus, 4.88±0.01%; L. rohita, 5.74±0.01%), total protein (B. gonionotus, 15.24±0.03 gm/dl; L. rohita, 16.26±0.01 gm/dl) and globulin (B. gonionotus, 3.95±0.02; L. rohita, 3.86±0.01 gm/dl) showed an increasing trend up to the dose of 30 mg/kg alloy of diet and after that values of above parameters were found in decreasing trend with increasing level of alloy in diet. During the study period, another important parameter albumin was found in decreasing trend towards the increasing dose of alloy in diet for both the fish species.
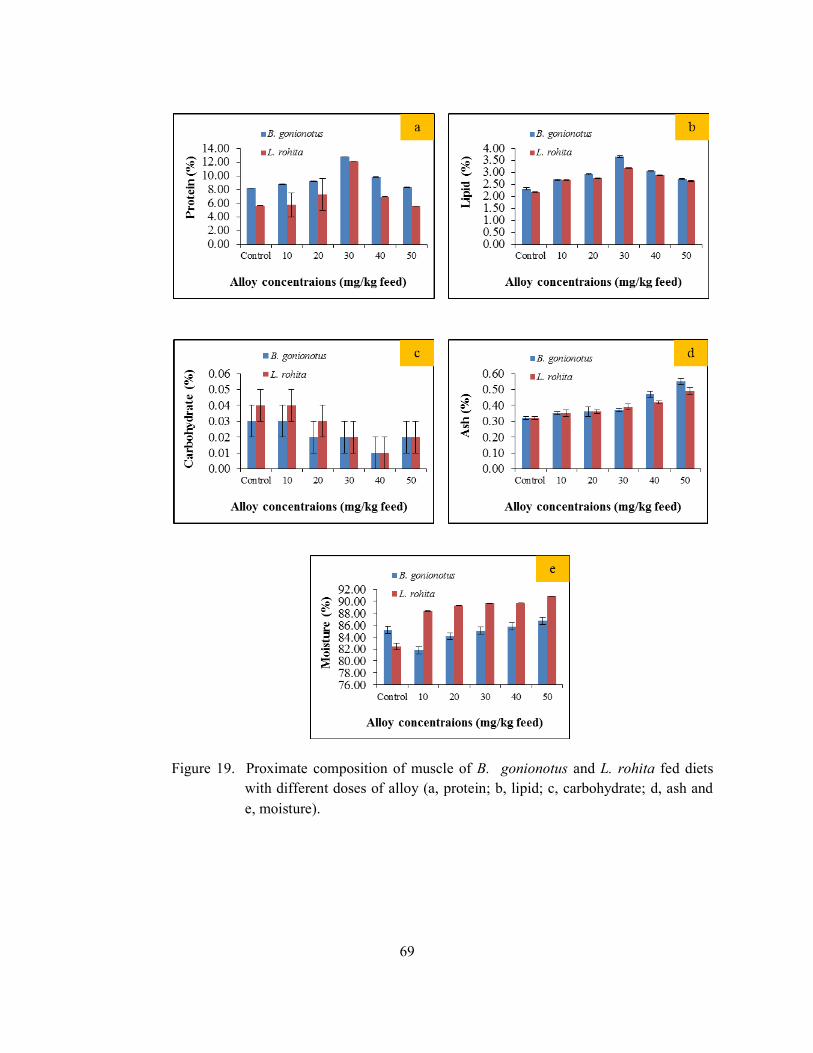
69
Figure 19. Proximate composition of muscle of B. gonionotus and L. rohita fed diets with different doses of alloy (a, protein; b, lipid; c, carbohydrate; d, ash and e, moisture).
70
Table 21. Hematological parameters of B. gonionotus and L. rohita fed diets enriched with alloy.
Species Parameters Doses of alloy (mg/kg feed)
Control 10 20 30 40 50
B. gonionotus
RBC (%) 22.75±0.03f 71.58±0.03e 98.77±0.02d 113.55±0.03c 115.55±0.03b 117.44±0.03a WBC (%) 133.65±0.03f 268.87±0.02c 310.39±0.02b 375.95±0.02a 252.50±0.02d 243.59±0.02e Hemoglobin (%) 3.24±0.03f 3.69±0.02e 4.35±0.02c 4.88±0.01b 4.19±0.02d 5.15±0.03a Total protein (gm/dl) 12.74±0.03f 12.84±0.02e 13.66±0.02d 15.24±0.03a 14.36±0.02b 14.15±0.03c Albumin (gm/dl) 1.88±0.01a 1.87±0.02a 1.69±0.02b 1.67±0.02b 1.45±0.02c 1.37±0.02d Globulin (gm/dl) 2.63±0.02e 3.25±0.02d 3.54±0.03c 3.95±0.02a 3.75±0.03b 3.26±0.02d
L. rohita
RBC (%) 23.67±0.02f 78.59±0.02e 105.43±0.02d 112.73±0.02c 116.56±0.01b 127.54±0.01a WBC (%) 135.63±0.02f 257.84±0.01c 321.35±0.02b 379.45±0.02a 256.47±0.02d 232.55±0.02e Hemoglobin (%) 3.42±0.01f 3.66±0.01e 4.32±0.02d 5.74±0.01a 5.64±0.02b 5.38±0.01c Total protein (gm/dl) 12.93±0.02f 13.95±0.02d 14.17±0.02c 16.26±0.01a 14.33±0.02b 13.54±0.02e Albumin (gm/dl) 1.87±0.01a 1.84±0.01b 1.76±0.01c 1.55±0.02d 1.56±0.01d 1.35±0.01e Globulin (gm/dl) 2.67±0.02f 3.27±0.01d 3.54±0.01c 3.86±0.01a 3.73±0.02b 3.24±0.02e
Values in the same row with different superscript letter indicate significant differences (P < 0.05).
71
11.5.6 Blood lipid profile
During the study period, total cholesterol and triglycerides of blood were found to increase with increasing the dose of alloy in diets and reached its highest value for fishes fed diets containing 30 mg/kg feed of alloy for both B. gonionotus and L. rohita. However, further increase in dose of alloy in diets significantly (P < 0.05) reduced the cholesterol level of blood for both the animals. HDL and LDL also showed significant (P < 0.05) variation among the alloy enriched diet groups and control group; whereas HDL showed an increasing trend with increasing the dose of alloy in diets up to 30 mg/kg feed of alloy and decreasing trend was noted for LDL content of blood for both B. gonionotus and L. rohita (P < 0.05) in Table 22.
11.5.7 Serum enzyme profile
During the study period, the stress indicator enzymes (alanine aminotransferase, ALT; aspartate aminotransferase, AST; amylase; lipase; protease and Alkaline phosphatase, ALP) of serum were found to increase with increasing alloy doses in diets and therefore, the alloy fed fish groups were significantly (P < 0.05) different from their control group for both B. gonionotus and L. rohita (Table 23). However, in case of L. rohita, ALP was found not significantly (P < 0.05) different in fish groups fed diets containing 10, 20, 30 and 40 mg/kg feed of alloy. On the other hand, enzymes such as amylase, lipase and protease were also found to vary significantly (P < 0.05) among the fish groups and significant (P < 0.05) increase of these parameters were observed up to a dose of 30 mg/kg feed of alloy fed fish group. However, further increase in dose of alloy in feed significantly reduced the activity of amylase, lipase and protease in blood of both B. gonionotus and L. rohita.
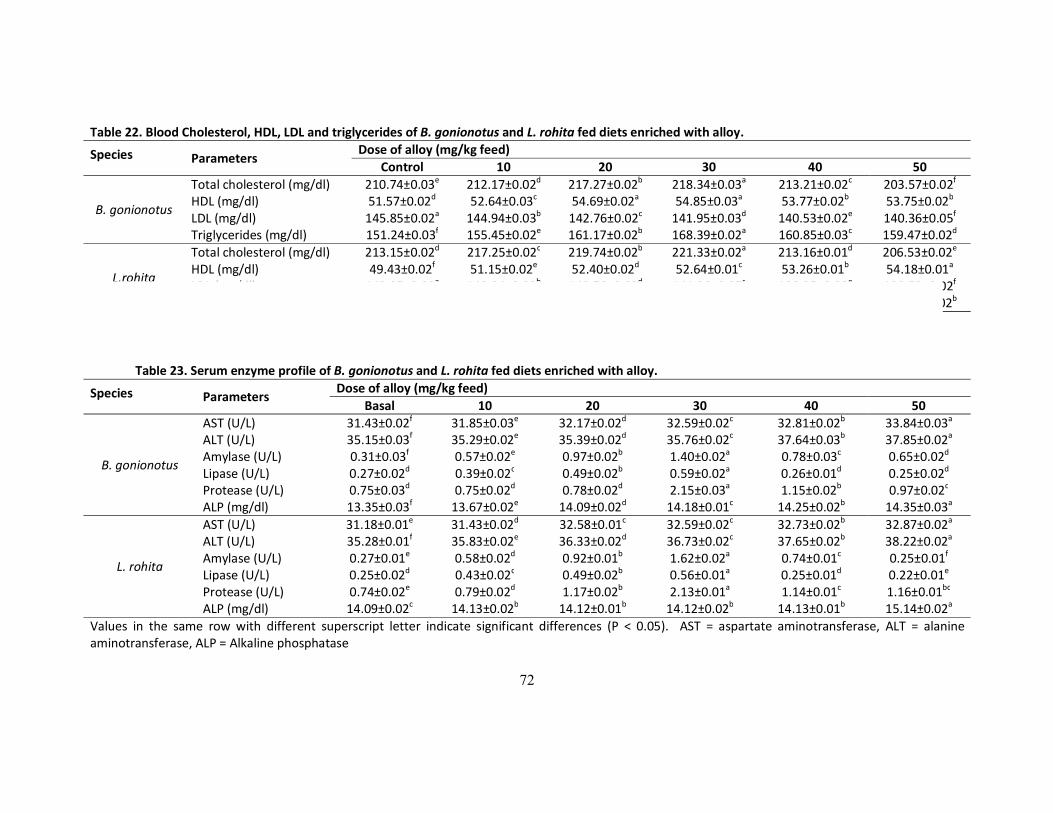
72
Table 22. Blood Cholesterol, HDL, LDL and triglycerides of B. gonionotus and L. rohita fed diets enriched with alloy.
Species Parameters Dose of alloy (mg/kg feed)
Control 10 20 30 40 50
B. gonionotus
Total cholesterol (mg/dl) 210.74±0.03e 212.17±0.02d 217.27±0.02b 218.34±0.03a 213.21±0.02c 203.57±0.02f HDL (mg/dl) 51.57±0.02d 52.64±0.03c 54.69±0.02a 54.85±0.03a 53.77±0.02b 53.75±0.02b LDL (mg/dl) 145.85±0.02a 144.94±0.03b 142.76±0.02c 141.95±0.03d 140.53±0.02e 140.36±0.05f Triglycerides (mg/dl) 151.24±0.03f 155.45±0.02e 161.17±0.02b 168.39±0.02a 160.85±0.03c 159.47±0.02d
L.rohita
Total cholesterol (mg/dl) 213.15±0.02d 217.25±0.02c 219.74±0.02b 221.33±0.02a 213.16±0.01d 206.53±0.02e HDL (mg/dl) 49.43±0.02f 51.15±0.02e 52.40±0.02d 52.64±0.01c 53.26±0.01b 54.18±0.01a LDL (mg/dl) 143.85±0.02a 142.94±0.03b 140.76±0.02d 141.36±0.05c 138.95±0.03e 138.53±0.02f Triglycerides (mg/dl) 151.25±0.02f 157.42±0.02e 161.16±0.01d 168.33±0.02a 161.85±0.02c 162.45±0.02b
Values in the same row with different superscript letter indicate significant differences (P < 0.05). HDL = High density lipoprotein, LDL = Low density lipoprotein
Table 23. Serum enzyme profile of B. gonionotus and L. rohita fed diets enriched with alloy.
Species Parameters Dose of alloy (mg/kg feed)
Basal 10 20 30 40 50
B. gonionotus
AST (U/L) 31.43±0.02f 31.85±0.03e 32.17±0.02d 32.59±0.02c 32.81±0.02b 33.84±0.03a ALT (U/L) 35.15±0.03f 35.29±0.02e 35.39±0.02d 35.76±0.02c 37.64±0.03b 37.85±0.02a Amylase (U/L) 0.31±0.03f 0.57±0.02e 0.97±0.02b 1.40±0.02a 0.78±0.03c 0.65±0.02d Lipase (U/L) 0.27±0.02d 0.39±0.02c 0.49±0.02b 0.59±0.02a 0.26±0.01d 0.25±0.02d Protease (U/L) 0.75±0.03d 0.75±0.02d 0.78±0.02d 2.15±0.03a 1.15±0.02b 0.97±0.02c ALP (mg/dl) 13.35±0.03f 13.67±0.02e 14.09±0.02d 14.18±0.01c 14.25±0.02b 14.35±0.03a
L. rohita
AST (U/L) 31.18±0.01e 31.43±0.02d 32.58±0.01c 32.59±0.02c 32.73±0.02b 32.87±0.02a ALT (U/L) 35.28±0.01f 35.83±0.02e 36.33±0.02d 36.73±0.02c 37.65±0.02b 38.22±0.02a Amylase (U/L) 0.27±0.01e 0.58±0.02d 0.92±0.01b 1.62±0.02a 0.74±0.01c 0.25±0.01f Lipase (U/L) 0.25±0.02d 0.43±0.02c 0.49±0.02b 0.56±0.01a 0.25±0.01d 0.22±0.01e Protease (U/L) 0.74±0.02e 0.79±0.02d 1.17±0.02b 2.13±0.01a 1.14±0.01c 1.16±0.01bc ALP (mg/dl) 14.09±0.02c 14.13±0.02b 14.12±0.01b 14.12±0.02b 14.13±0.01b 15.14±0.02a
Values in the same row with different superscript letter indicate significant differences (P < 0.05). AST = aspartate aminotransferase, ALT = alanine aminotransferase, ALP = Alkaline phosphatase
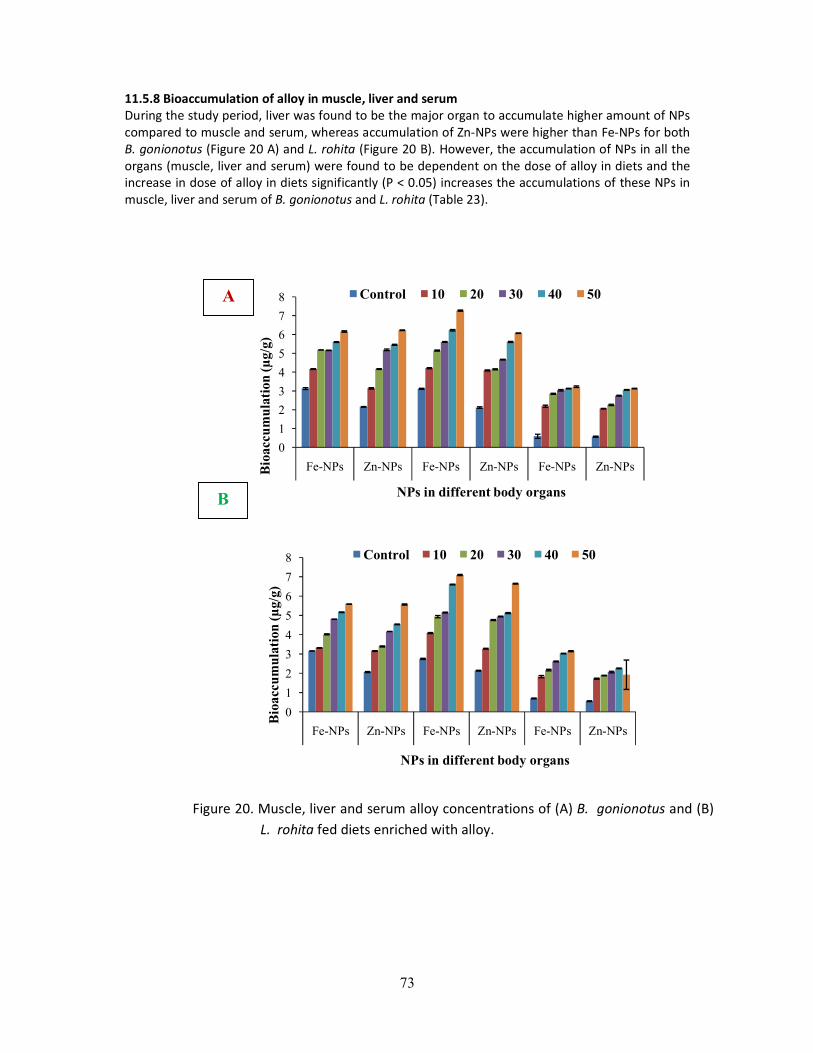
73
11.5.8 Bioaccumulation of alloy in muscle, liver and serum During the study period, liver was found to be the major organ to accumulate higher amount of NPs compared to muscle and serum, whereas accumulation of Zn-NPs were higher than Fe-NPs for both B. gonionotus (Figure 20 A) and L. rohita (Figure 20 B). However, the accumulation of NPs in all the organs (muscle, liver and serum) were found to be dependent on the dose of alloy in diets and the increase in dose of alloy in diets significantly (P < 0.05) increases the accumulations of these NPs in muscle, liver and serum of B. gonionotus and L. rohita (Table 23).
Figure 20. Muscle, liver and serum alloy concentrations of (A) B. gonionotus and (B) L. rohita fed diets enriched with alloy.
0
1
2
3
4
5
6
7
8
Fe-NPs Zn-NPs Fe-NPs Zn-NPs Fe-NPs Zn-NPsBio
accu
mul
atio
n (µ
g/g)
NPs in different body organs
Control 10 20 30 40 50
0
1
2
3
4
5
6
7
8
Fe-NPs Zn-NPs Fe-NPs Zn-NPs Fe-NPs Zn-NPs
Bio
accu
mul
atio
n (µ
g/g)
NPs in different body organs
Control 10 20 30 40 50
A
B
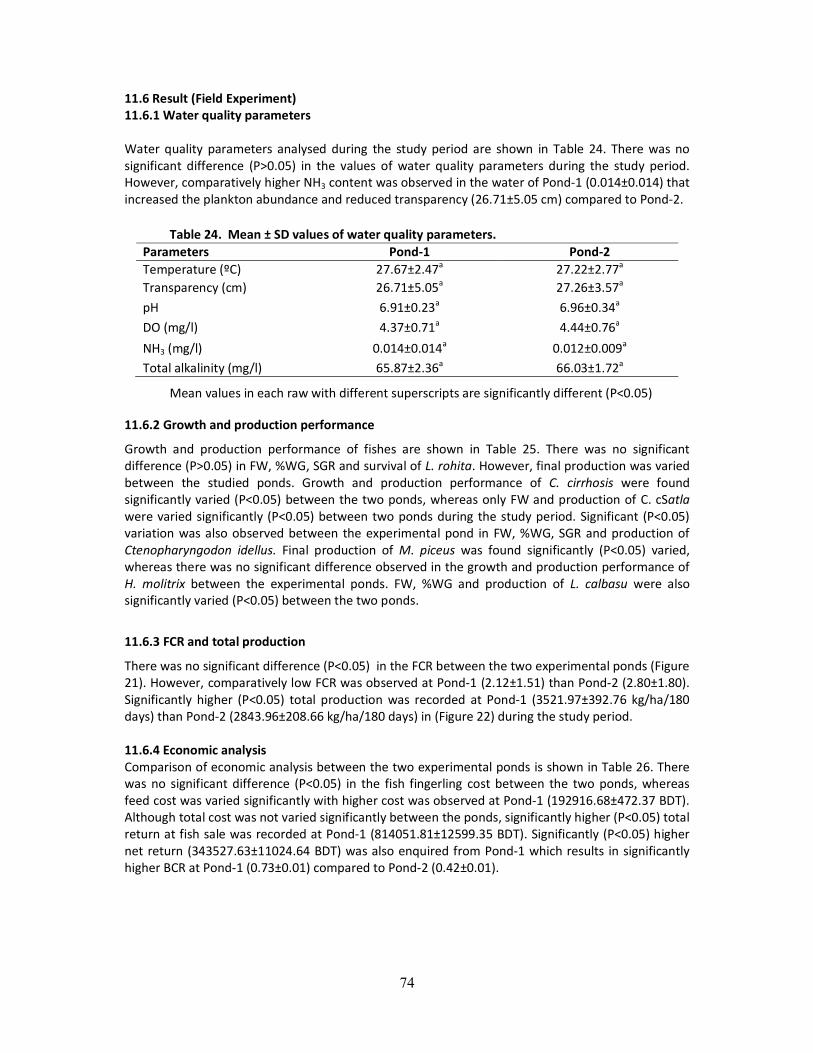
74
11.6 Result (Field Experiment) 11.6.1 Water quality parameters Water quality parameters analysed during the study period are shown in Table 24. There was no significant difference (P>0.05) in the values of water quality parameters during the study period. However, comparatively higher NH3 content was observed in the water of Pond-1 (0.014±0.014) that increased the plankton abundance and reduced transparency (26.71±5.05 cm) compared to Pond-2.
Table 24. Mean ± SD values of water quality parameters.
Parameters Pond-1 Pond-2 Temperature (ºC) 27.67±2.47a 27.22±2.77a Transparency (cm) 26.71±5.05a 27.26±3.57a pH 6.91±0.23a 6.96±0.34a DO (mg/l) 4.37±0.71a 4.44±0.76a NH3 (mg/l) 0.014±0.014a 0.012±0.009a Total alkalinity (mg/l) 65.87±2.36a 66.03±1.72a
Mean values in each raw with different superscripts are significantly different (P<0.05)
11.6.2 Growth and production performance
Growth and production performance of fishes are shown in Table 25. There was no significant difference (P>0.05) in FW, %WG, SGR and survival of L. rohita. However, final production was varied between the studied ponds. Growth and production performance of C. cirrhosis were found significantly varied (P<0.05) between the two ponds, whereas only FW and production of C. cSatla were varied significantly (P<0.05) between two ponds during the study period. Significant (P<0.05) variation was also observed between the experimental pond in FW, %WG, SGR and production of Ctenopharyngodon idellus. Final production of M. piceus was found significantly (P<0.05) varied, whereas there was no significant difference observed in the growth and production performance of H. molitrix between the experimental ponds. FW, %WG and production of L. calbasu were also significantly varied (P<0.05) between the two ponds.
11.6.3 FCR and total production
There was no significant difference (P<0.05) in the FCR between the two experimental ponds (Figure 21). However, comparatively low FCR was observed at Pond-1 (2.12±1.51) than Pond-2 (2.80±1.80). Significantly higher (P<0.05) total production was recorded at Pond-1 (3521.97±392.76 kg/ha/180 days) than Pond-2 (2843.96±208.66 kg/ha/180 days) in (Figure 22) during the study period.
11.6.4 Economic analysis Comparison of economic analysis between the two experimental ponds is shown in Table 26. There was no significant difference (P<0.05) in the fish fingerling cost between the two ponds, whereas feed cost was varied significantly with higher cost was observed at Pond-1 (192916.68±472.37 BDT). Although total cost was not varied significantly between the ponds, significantly higher (P<0.05) total return at fish sale was recorded at Pond-1 (814051.81±12599.35 BDT). Significantly (P<0.05) higher net return (343527.63±11024.64 BDT) was also enquired from Pond-1 which results in significantly higher BCR at Pond-1 (0.73±0.01) compared to Pond-2 (0.42±0.01).
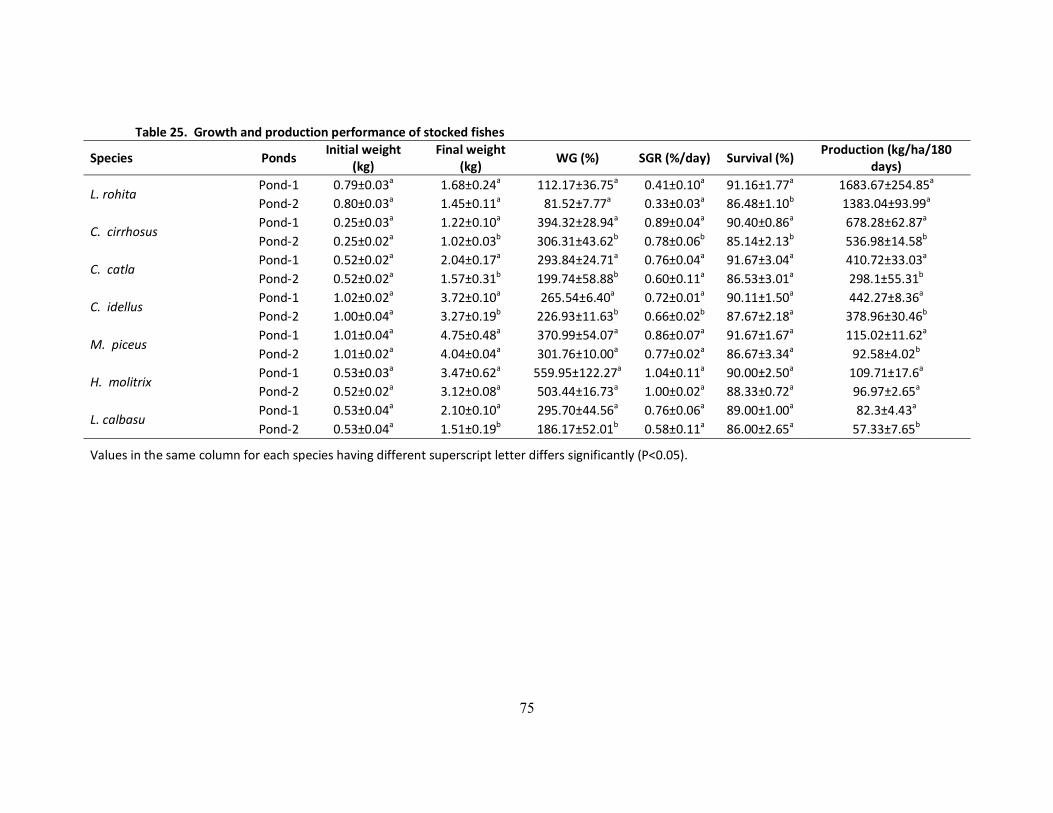
75
Table 25. Growth and production performance of stocked fishes
Species Ponds Initial weight
(kg) Final weight
(kg) WG (%) SGR (%/day) Survival (%)
Production (kg/ha/180 days)
L. rohita Pond-1 0.79±0.03a 1.68±0.24a 112.17±36.75a 0.41±0.10a 91.16±1.77a 1683.67±254.85a Pond-2 0.80±0.03a 1.45±0.11a 81.52±7.77a 0.33±0.03a 86.48±1.10b 1383.04±93.99a
C. cirrhosus Pond-1 0.25±0.03a 1.22±0.10a 394.32±28.94a 0.89±0.04a 90.40±0.86a 678.28±62.87a Pond-2 0.25±0.02a 1.02±0.03b 306.31±43.62b 0.78±0.06b 85.14±2.13b 536.98±14.58b
C. catla Pond-1 0.52±0.02a 2.04±0.17a 293.84±24.71a 0.76±0.04a 91.67±3.04a 410.72±33.03a Pond-2 0.52±0.02a 1.57±0.31b 199.74±58.88b 0.60±0.11a 86.53±3.01a 298.1±55.31b
C. idellus Pond-1 1.02±0.02a 3.72±0.10a 265.54±6.40a 0.72±0.01a 90.11±1.50a 442.27±8.36a Pond-2 1.00±0.04a 3.27±0.19b 226.93±11.63b 0.66±0.02b 87.67±2.18a 378.96±30.46b
M. piceus Pond-1 1.01±0.04a 4.75±0.48a 370.99±54.07a 0.86±0.07a 91.67±1.67a 115.02±11.62a Pond-2 1.01±0.02a 4.04±0.04a 301.76±10.00a 0.77±0.02a 86.67±3.34a 92.58±4.02b
H. molitrix Pond-1 0.53±0.03a 3.47±0.62a 559.95±122.27a 1.04±0.11a 90.00±2.50a 109.71±17.6a Pond-2 0.52±0.02a 3.12±0.08a 503.44±16.73a 1.00±0.02a 88.33±0.72a 96.97±2.65a
L. calbasu Pond-1 0.53±0.04a 2.10±0.10a 295.70±44.56a 0.76±0.06a 89.00±1.00a 82.3±4.43a Pond-2 0.53±0.04a 1.51±0.19b 186.17±52.01b 0.58±0.11a 86.00±2.65a 57.33±7.65b
Values in the same column for each species having different superscript letter differs significantly (P<0.05).
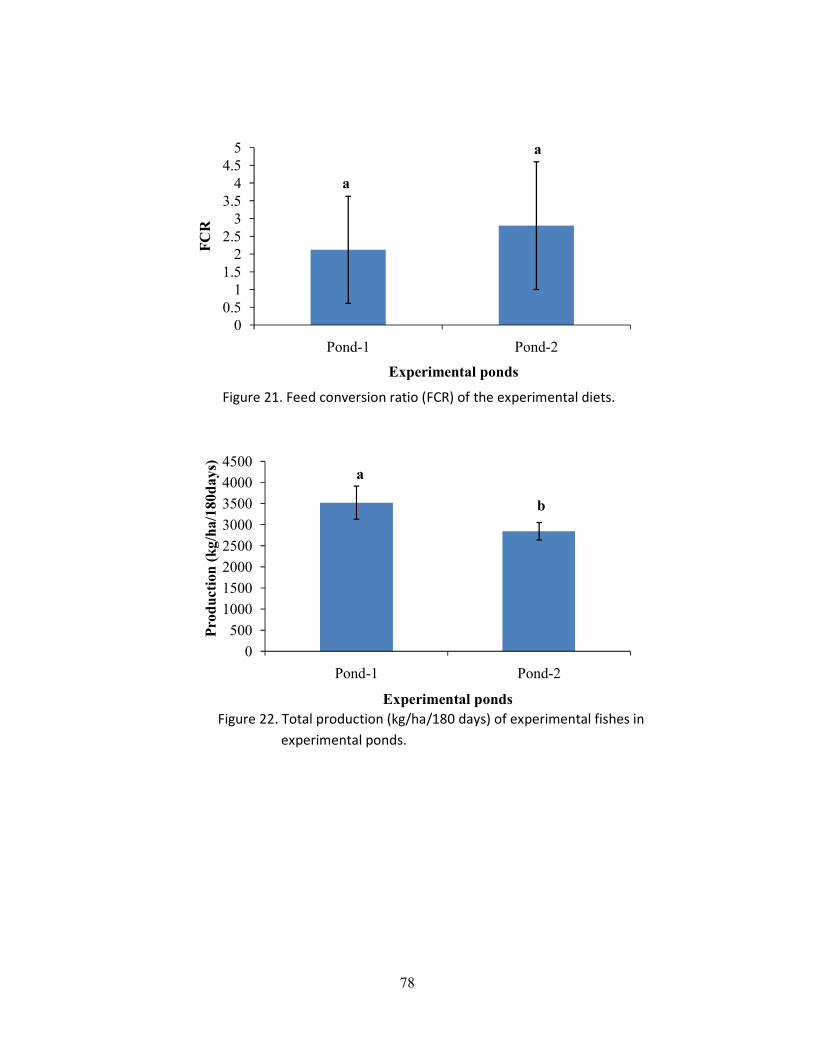
78
Figure 21. Feed conversion ratio (FCR) of the experimental diets.
Figure 22. Total production (kg/ha/180 days) of experimental fishes in
experimental ponds.
00.5
11.5
22.5
33.5
44.5
5
Pond-1 Pond-2
FC
R
Experimental ponds
a
a
0
500
1000
1500
2000
2500
3000
3500
4000
4500
Pond-1 Pond-2
Pro
duc
tion
(kg
/ha/
180d
ays)
Experimental ponds
a
b
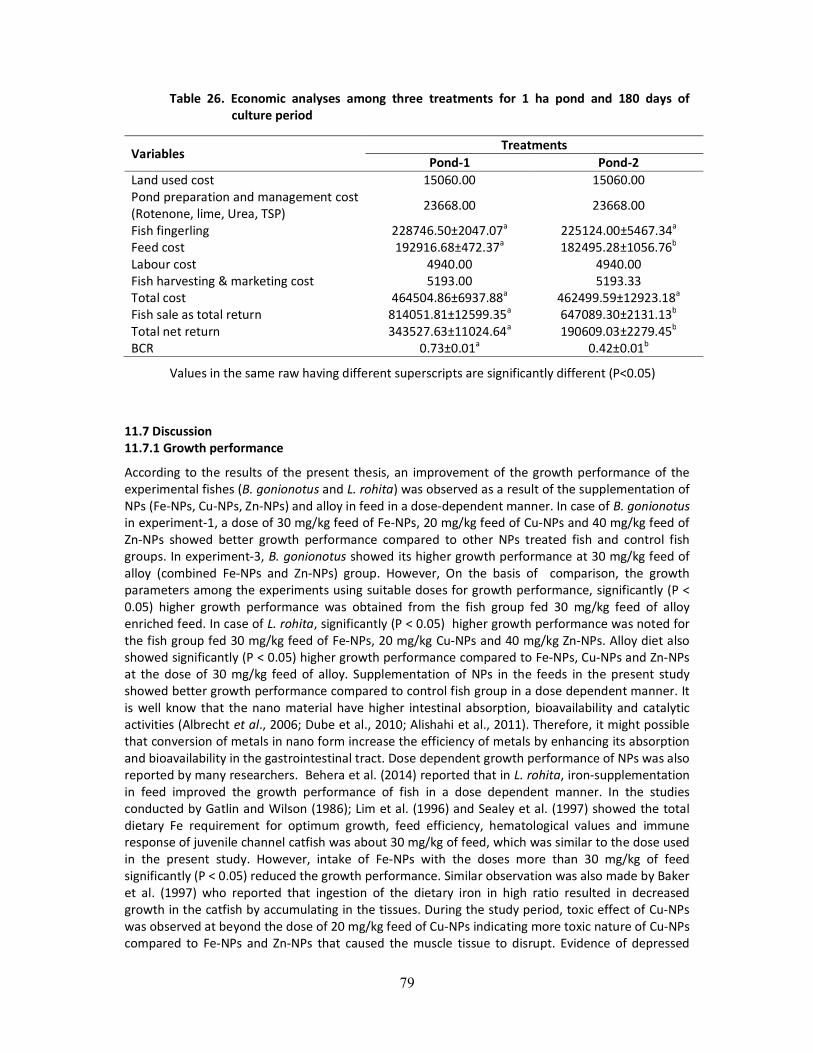
79
Table 26. Economic analyses among three treatments for 1 ha pond and 180 days of culture period
Values in the same raw having different superscripts are significantly different (P<0.05)
11.7 Discussion 11.7.1 Growth performance
According to the results of the present thesis, an improvement of the growth performance of the experimental fishes (B. gonionotus and L. rohita) was observed as a result of the supplementation of NPs (Fe-NPs, Cu-NPs, Zn-NPs) and alloy in feed in a dose-dependent manner. In case of B. gonionotus in experiment-1, a dose of 30 mg/kg feed of Fe-NPs, 20 mg/kg feed of Cu-NPs and 40 mg/kg feed of Zn-NPs showed better growth performance compared to other NPs treated fish and control fish groups. In experiment-3, B. gonionotus showed its higher growth performance at 30 mg/kg feed of alloy (combined Fe-NPs and Zn-NPs) group. However, On the basis of comparison, the growth parameters among the experiments using suitable doses for growth performance, significantly (P < 0.05) higher growth performance was obtained from the fish group fed 30 mg/kg feed of alloy enriched feed. In case of L. rohita, significantly (P < 0.05) higher growth performance was noted for the fish group fed 30 mg/kg feed of Fe-NPs, 20 mg/kg Cu-NPs and 40 mg/kg Zn-NPs. Alloy diet also showed significantly (P < 0.05) higher growth performance compared to Fe-NPs, Cu-NPs and Zn-NPs at the dose of 30 mg/kg feed of alloy. Supplementation of NPs in the feeds in the present study showed better growth performance compared to control fish group in a dose dependent manner. It is well know that the nano material have higher intestinal absorption, bioavailability and catalytic activities (Albrecht et al., 2006; Dube et al., 2010; Alishahi et al., 2011). Therefore, it might possible that conversion of metals in nano form increase the efficiency of metals by enhancing its absorption and bioavailability in the gastrointestinal tract. Dose dependent growth performance of NPs was also reported by many researchers. Behera et al. (2014) reported that in L. rohita, iron-supplementation in feed improved the growth performance of fish in a dose dependent manner. In the studies conducted by Gatlin and Wilson (1986); Lim et al. (1996) and Sealey et al. (1997) showed the total dietary Fe requirement for optimum growth, feed efficiency, hematological values and immune response of juvenile channel catfish was about 30 mg/kg of feed, which was similar to the dose used in the present study. However, intake of Fe-NPs with the doses more than 30 mg/kg of feed significantly (P < 0.05) reduced the growth performance. Similar observation was also made by Baker et al. (1997) who reported that ingestion of the dietary iron in high ratio resulted in decreased growth in the catfish by accumulating in the tissues. During the study period, toxic effect of Cu-NPs was observed at beyond the dose of 20 mg/kg feed of Cu-NPs indicating more toxic nature of Cu-NPs compared to Fe-NPs and Zn-NPs that caused the muscle tissue to disrupt. Evidence of depressed
Variables Treatments
Pond-1 Pond-2 Land used cost 15060.00 15060.00 Pond preparation and management cost (Rotenone, lime, Urea, TSP) 23668.00 23668.00
Fish fingerling 228746.50±2047.07a 225124.00±5467.34a Feed cost 192916.68±472.37a 182495.28±1056.76b Labour cost 4940.00 4940.00 Fish harvesting & marketing cost 5193.00 5193.33 Total cost 464504.86±6937.88a 462499.59±12923.18a Fish sale as total return 814051.81±12599.35a 647089.30±2131.13b Total net return 343527.63±11024.64a 190609.03±2279.45b BCR 0.73±0.01a 0.42±0.01b
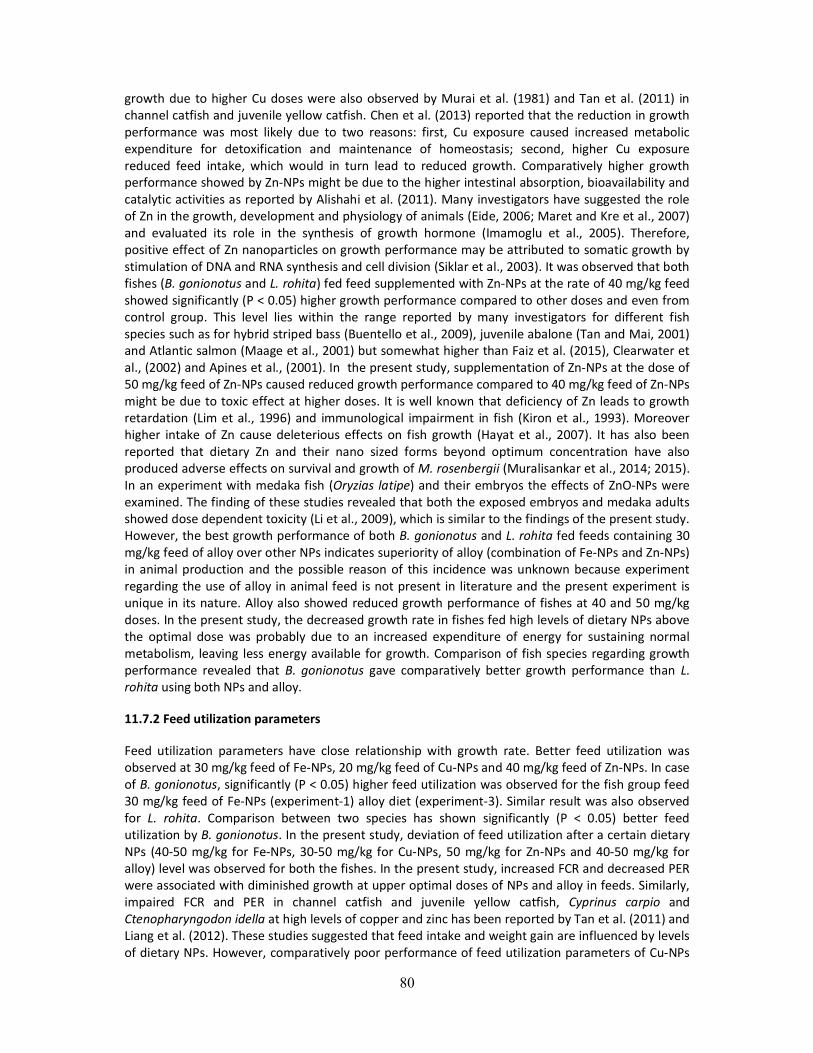
80
growth due to higher Cu doses were also observed by Murai et al. (1981) and Tan et al. (2011) in channel catfish and juvenile yellow catfish. Chen et al. (2013) reported that the reduction in growth performance was most likely due to two reasons: first, Cu exposure caused increased metabolic expenditure for detoxification and maintenance of homeostasis; second, higher Cu exposure reduced feed intake, which would in turn lead to reduced growth. Comparatively higher growth performance showed by Zn-NPs might be due to the higher intestinal absorption, bioavailability and catalytic activities as reported by Alishahi et al. (2011). Many investigators have suggested the role of Zn in the growth, development and physiology of animals (Eide, 2006; Maret and Kre et al., 2007) and evaluated its role in the synthesis of growth hormone (Imamoglu et al., 2005). Therefore, positive effect of Zn nanoparticles on growth performance may be attributed to somatic growth by stimulation of DNA and RNA synthesis and cell division (Siklar et al., 2003). It was observed that both fishes (B. gonionotus and L. rohita) fed feed supplemented with Zn-NPs at the rate of 40 mg/kg feed showed significantly (P < 0.05) higher growth performance compared to other doses and even from control group. This level lies within the range reported by many investigators for different fish species such as for hybrid striped bass (Buentello et al., 2009), juvenile abalone (Tan and Mai, 2001) and Atlantic salmon (Maage et al., 2001) but somewhat higher than Faiz et al. (2015), Clearwater et al., (2002) and Apines et al., (2001). In the present study, supplementation of Zn-NPs at the dose of 50 mg/kg feed of Zn-NPs caused reduced growth performance compared to 40 mg/kg feed of Zn-NPs might be due to toxic effect at higher doses. It is well known that deficiency of Zn leads to growth retardation (Lim et al., 1996) and immunological impairment in fish (Kiron et al., 1993). Moreover higher intake of Zn cause deleterious effects on fish growth (Hayat et al., 2007). It has also been reported that dietary Zn and their nano sized forms beyond optimum concentration have also produced adverse effects on survival and growth of M. rosenbergii (Muralisankar et al., 2014; 2015). In an experiment with medaka fish (Oryzias latipe) and their embryos the effects of ZnO-NPs were examined. The finding of these studies revealed that both the exposed embryos and medaka adults showed dose dependent toxicity (Li et al., 2009), which is similar to the findings of the present study. However, the best growth performance of both B. gonionotus and L. rohita fed feeds containing 30 mg/kg feed of alloy over other NPs indicates superiority of alloy (combination of Fe-NPs and Zn-NPs) in animal production and the possible reason of this incidence was unknown because experiment regarding the use of alloy in animal feed is not present in literature and the present experiment is unique in its nature. Alloy also showed reduced growth performance of fishes at 40 and 50 mg/kg doses. In the present study, the decreased growth rate in fishes fed high levels of dietary NPs above the optimal dose was probably due to an increased expenditure of energy for sustaining normal metabolism, leaving less energy available for growth. Comparison of fish species regarding growth performance revealed that B. gonionotus gave comparatively better growth performance than L. rohita using both NPs and alloy.
11.7.2 Feed utilization parameters
Feed utilization parameters have close relationship with growth rate. Better feed utilization was observed at 30 mg/kg feed of Fe-NPs, 20 mg/kg feed of Cu-NPs and 40 mg/kg feed of Zn-NPs. In case of B. gonionotus, significantly (P < 0.05) higher feed utilization was observed for the fish group feed 30 mg/kg feed of Fe-NPs (experiment-1) alloy diet (experiment-3). Similar result was also observed for L. rohita. Comparison between two species has shown significantly (P < 0.05) better feed utilization by B. gonionotus. In the present study, deviation of feed utilization after a certain dietary NPs (40-50 mg/kg for Fe-NPs, 30-50 mg/kg for Cu-NPs, 50 mg/kg for Zn-NPs and 40-50 mg/kg for alloy) level was observed for both the fishes. In the present study, increased FCR and decreased PER were associated with diminished growth at upper optimal doses of NPs and alloy in feeds. Similarly, impaired FCR and PER in channel catfish and juvenile yellow catfish, Cyprinus carpio and Ctenopharyngodon idella at high levels of copper and zinc has been reported by Tan et al. (2011) and Liang et al. (2012). These studies suggested that feed intake and weight gain are influenced by levels of dietary NPs. However, comparatively poor performance of feed utilization parameters of Cu-NPs
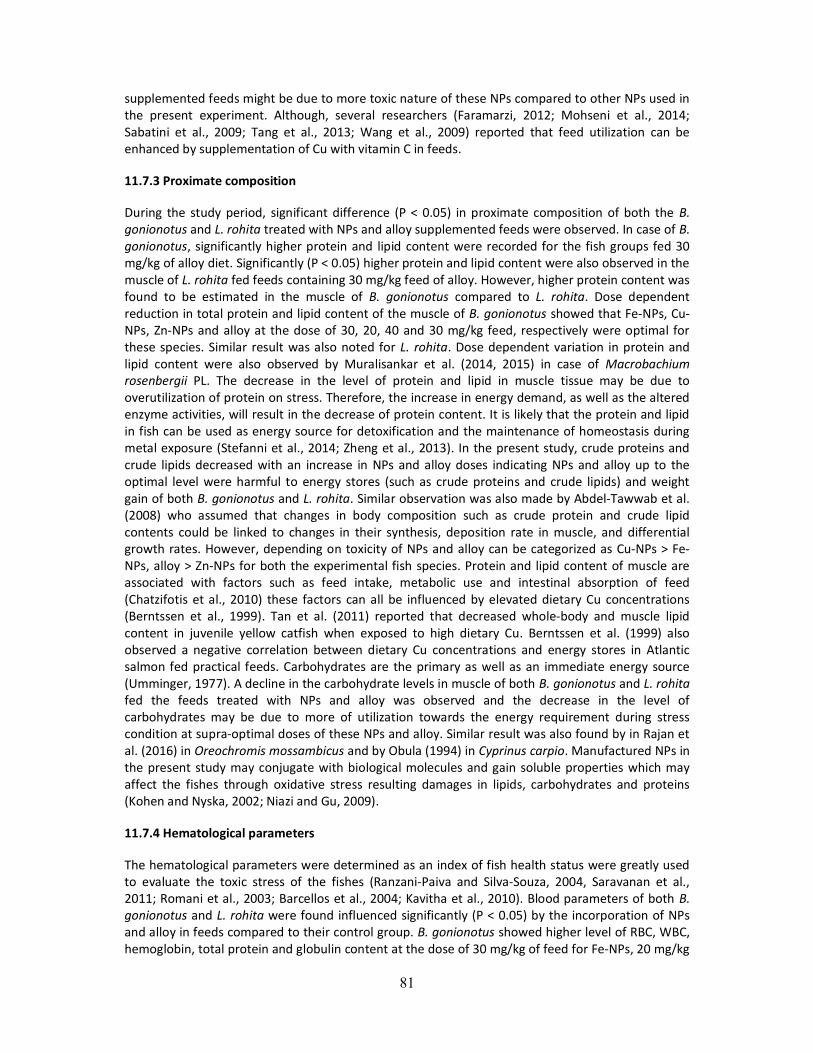
81
supplemented feeds might be due to more toxic nature of these NPs compared to other NPs used in the present experiment. Although, several researchers (Faramarzi, 2012; Mohseni et al., 2014; Sabatini et al., 2009; Tang et al., 2013; Wang et al., 2009) reported that feed utilization can be enhanced by supplementation of Cu with vitamin C in feeds.
11.7.3 Proximate composition
During the study period, significant difference (P < 0.05) in proximate composition of both the B. gonionotus and L. rohita treated with NPs and alloy supplemented feeds were observed. In case of B. gonionotus, significantly higher protein and lipid content were recorded for the fish groups fed 30 mg/kg of alloy diet. Significantly (P < 0.05) higher protein and lipid content were also observed in the muscle of L. rohita fed feeds containing 30 mg/kg feed of alloy. However, higher protein content was found to be estimated in the muscle of B. gonionotus compared to L. rohita. Dose dependent reduction in total protein and lipid content of the muscle of B. gonionotus showed that Fe-NPs, Cu-NPs, Zn-NPs and alloy at the dose of 30, 20, 40 and 30 mg/kg feed, respectively were optimal for these species. Similar result was also noted for L. rohita. Dose dependent variation in protein and lipid content were also observed by Muralisankar et al. (2014, 2015) in case of Macrobachium rosenbergii PL. The decrease in the level of protein and lipid in muscle tissue may be due to overutilization of protein on stress. Therefore, the increase in energy demand, as well as the altered enzyme activities, will result in the decrease of protein content. It is likely that the protein and lipid in fish can be used as energy source for detoxification and the maintenance of homeostasis during metal exposure (Stefanni et al., 2014; Zheng et al., 2013). In the present study, crude proteins and crude lipids decreased with an increase in NPs and alloy doses indicating NPs and alloy up to the optimal level were harmful to energy stores (such as crude proteins and crude lipids) and weight gain of both B. gonionotus and L. rohita. Similar observation was also made by Abdel-Tawwab et al. (2008) who assumed that changes in body composition such as crude protein and crude lipid contents could be linked to changes in their synthesis, deposition rate in muscle, and differential growth rates. However, depending on toxicity of NPs and alloy can be categorized as Cu-NPs > Fe-NPs, alloy > Zn-NPs for both the experimental fish species. Protein and lipid content of muscle are associated with factors such as feed intake, metabolic use and intestinal absorption of feed (Chatzifotis et al., 2010) these factors can all be influenced by elevated dietary Cu concentrations (Berntssen et al., 1999). Tan et al. (2011) reported that decreased whole-body and muscle lipid content in juvenile yellow catfish when exposed to high dietary Cu. Berntssen et al. (1999) also observed a negative correlation between dietary Cu concentrations and energy stores in Atlantic salmon fed practical feeds. Carbohydrates are the primary as well as an immediate energy source (Umminger, 1977). A decline in the carbohydrate levels in muscle of both B. gonionotus and L. rohita fed the feeds treated with NPs and alloy was observed and the decrease in the level of carbohydrates may be due to more of utilization towards the energy requirement during stress condition at supra-optimal doses of these NPs and alloy. Similar result was also found by in Rajan et al. (2016) in Oreochromis mossambicus and by Obula (1994) in Cyprinus carpio. Manufactured NPs in the present study may conjugate with biological molecules and gain soluble properties which may affect the fishes through oxidative stress resulting damages in lipids, carbohydrates and proteins (Kohen and Nyska, 2002; Niazi and Gu, 2009).
11.7.4 Hematological parameters
The hematological parameters were determined as an index of fish health status were greatly used to evaluate the toxic stress of the fishes (Ranzani-Paiva and Silva-Souza, 2004, Saravanan et al., 2011; Romani et al., 2003; Barcellos et al., 2004; Kavitha et al., 2010). Blood parameters of both B. gonionotus and L. rohita were found influenced significantly (P < 0.05) by the incorporation of NPs and alloy in feeds compared to their control group. B. gonionotus showed higher level of RBC, WBC, hemoglobin, total protein and globulin content at the dose of 30 mg/kg of feed for Fe-NPs, 20 mg/kg
82
feed of Cu-NPs, 40 mg/kg feed of Zn-NPs and 30 mg/kg feed of alloy. However, beyond these doses the values of blood parameters were found to reduce. A similar result was also obtained for L. rohita. These results corroborated the study by Murai et al. (1981) that observed a decrease in the RBC number of catfish (Ictalurus punctatus) fed feeds formulated with levels above the requirement. In the blood of fish under stress, an increase in RBC counts and hemoglobin concentrations levels are frequently observed by Sevcikova et al., 2016). In this study, the increased RBC and hemoglobin values could be due to enhanced erythropoiesis as a result of chronic toxicity of high doses of NPs (Kondera and Witeska, 2013). Research showed that nanoparticle reduces the number of red blood cells and thus result in anemia by diminishing the life span of red blood cells or suppressing the activity of bone marrow stem cells (Faiz et al., 2015). The dose dependent reduction in RBCs of both the fish species fed NPs supplemented feed may be due to the swelling of the red cells that lead to hemolysis. Therefore, free radicals produced by nanoparticles can cause inflammation of red cells (Alkaladi et al., 2015). Hemolysis of erythrocytes has also been reported in Heteroclarias (Oti and Avoaja, 2005; Kori-Siakpere et al., 2008) and rainbow trout (Koyama et al., 1984) in response to Zn. Moreover, significantly higher RBCs value in response to Fe-NPs enriched feed as compared to other NPs types may be due to the causes that iron is important parameters of RBC and thus increase in Fe increased the RBC content of blood. In all vertebrates including fish, the WBCs count increase or decrease in response to various stressors like infections and chemical pollutant (Olurin et al., 2012; Moharram et al., 2011). Due to the role of WBC in non-specific or innate immunity (Kumar et al., 2007), increase in the WBC count and its functions is quite likely to result in an enhancement of the non-specific defense. The increasing trend in WBC count could be related to a stimulation of the immune system. These findings indicated that, the decrease in the WBC level observed in the fishes (B. gonionotus and L. rohita) fed feeds containing Fe-NPs 40-50 mg/kg of feed, Cu-NPs 30-50 mg/kg of feed, Zn-NPs 50 mg/kg of feed and alloy 40-50 mg/kg of feed may be associated with a decrease in nonspecific immunity of the fish due to exposure to toxicity. Thus doses of NPs below the above mentioned level were having beneficial effects on fish health and enhance their immune system. However, lower value of WBC in control group of each NPs and alloy indicates deficiency of minerals in fishes. Like these results, other scientists also reported the decrease in WBCs count in Clarias and “Heteroclarias” species (Oti and Avoaja, 2005; Kori-Siakpere et al., 2008) in response to Zn. The decreasing trend in the level of white blood cells in the present study or previous studies may either be the result of bioaccumulation of NPs and alloy in different tissues that cause toxicity and effect on cell production from spleen (Firat, 2007) or due to an increased level of corticosteroid hormones (Celik et al., 2013) because these hormones are important for prevention and healing of inflammation. In B. gonionotus, Fe-NPs mediated feeds at 30 mg/kg of feed were found to more active to develop nonspecific immunity as it processes significantly higher value of WBC compared to other doses of NPs and alloy. However, in L. rohita, alloy at the dose of 30 mg/kg of feed were found to give the same result. Decreased hemoglobin after exposure to the optimal doses of NPs have been observed in the present study indicated hemodilution in response to toxic effect of NPs. Similar observation was also made by Svobodova et al., (1994), where they showed that high concentrations of heavy metal or long term exposure of fish to sub lethal concentrations usually decrease the haematocrit, haemoglobin, and red blood cell. Again B. gonionotus gave significantly (P < 0.05) higher hemoglobin level at 30 mg/kg Fe-NPs feed fed group and L. rohita at 30 mg/kg feed of alloy fed group. However, Buentello et al., (2009) reported that Zn in nanoform was more efficiently absorbed, utilized and showed no negative impact on the absorption and bioavailability of other trace elements. Measurement of total protein, albumin and globulin, in serum is of considerable diagnostic value in fish, as it relates to general nutritional status (Schaperclaus et al., 1992). Albumin is the most abundant blood protein and is responsible for nutrient transportation and the maintenance of osmotic balance, and globulin is involved in the defense mechanism of animals. During the present study, total protein content of serum in all the three experiments was influenced in a dose dependent manner of NPs. Significant (P < 0.05) increase in serum total protein and globulin were observed up to 30 mg/kg feed of Fe-NPs, 20 mg/kg feed of Cu-NPs and 40 mg/kg feed
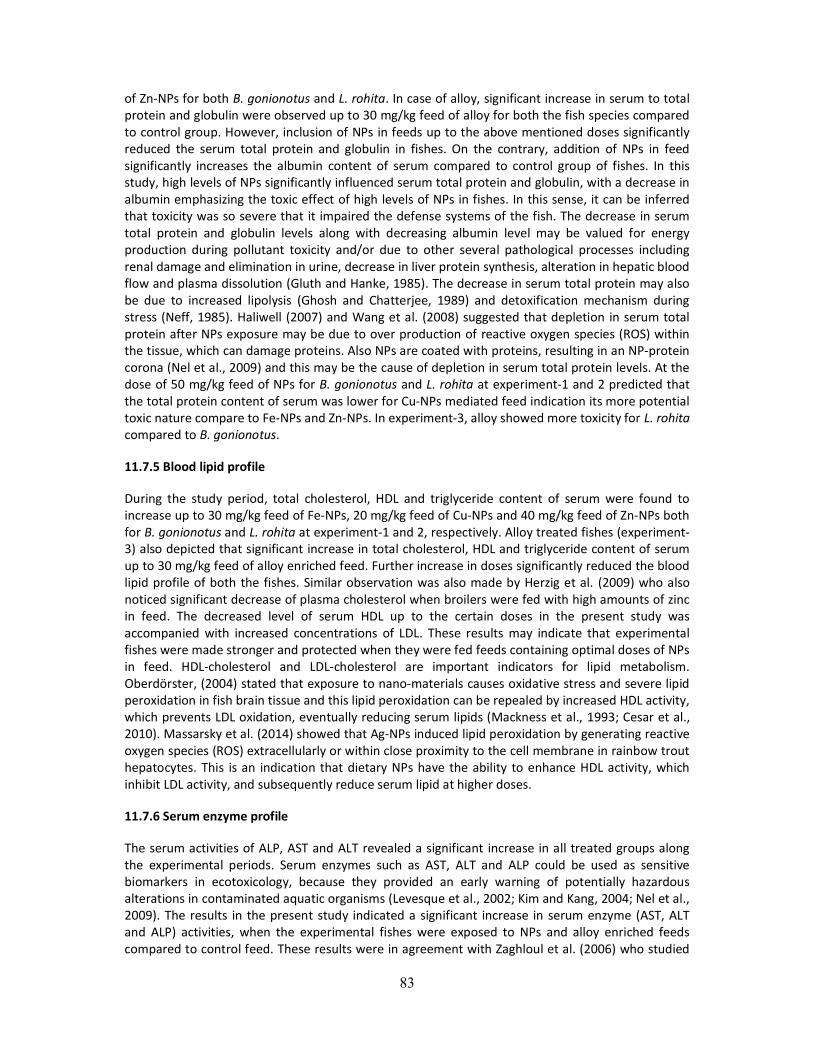
83
of Zn-NPs for both B. gonionotus and L. rohita. In case of alloy, significant increase in serum to total protein and globulin were observed up to 30 mg/kg feed of alloy for both the fish species compared to control group. However, inclusion of NPs in feeds up to the above mentioned doses significantly reduced the serum total protein and globulin in fishes. On the contrary, addition of NPs in feed significantly increases the albumin content of serum compared to control group of fishes. In this study, high levels of NPs significantly influenced serum total protein and globulin, with a decrease in albumin emphasizing the toxic effect of high levels of NPs in fishes. In this sense, it can be inferred that toxicity was so severe that it impaired the defense systems of the fish. The decrease in serum total protein and globulin levels along with decreasing albumin level may be valued for energy production during pollutant toxicity and/or due to other several pathological processes including renal damage and elimination in urine, decrease in liver protein synthesis, alteration in hepatic blood flow and plasma dissolution (Gluth and Hanke, 1985). The decrease in serum total protein may also be due to increased lipolysis (Ghosh and Chatterjee, 1989) and detoxification mechanism during stress (Neff, 1985). Haliwell (2007) and Wang et al. (2008) suggested that depletion in serum total protein after NPs exposure may be due to over production of reactive oxygen species (ROS) within the tissue, which can damage proteins. Also NPs are coated with proteins, resulting in an NP-protein corona (Nel et al., 2009) and this may be the cause of depletion in serum total protein levels. At the dose of 50 mg/kg feed of NPs for B. gonionotus and L. rohita at experiment-1 and 2 predicted that the total protein content of serum was lower for Cu-NPs mediated feed indication its more potential toxic nature compare to Fe-NPs and Zn-NPs. In experiment-3, alloy showed more toxicity for L. rohita compared to B. gonionotus.
11.7.5 Blood lipid profile
During the study period, total cholesterol, HDL and triglyceride content of serum were found to increase up to 30 mg/kg feed of Fe-NPs, 20 mg/kg feed of Cu-NPs and 40 mg/kg feed of Zn-NPs both for B. gonionotus and L. rohita at experiment-1 and 2, respectively. Alloy treated fishes (experiment-3) also depicted that significant increase in total cholesterol, HDL and triglyceride content of serum up to 30 mg/kg feed of alloy enriched feed. Further increase in doses significantly reduced the blood lipid profile of both the fishes. Similar observation was also made by Herzig et al. (2009) who also noticed significant decrease of plasma cholesterol when broilers were fed with high amounts of zinc in feed. The decreased level of serum HDL up to the certain doses in the present study was accompanied with increased concentrations of LDL. These results may indicate that experimental fishes were made stronger and protected when they were fed feeds containing optimal doses of NPs in feed. HDL-cholesterol and LDL-cholesterol are important indicators for lipid metabolism. Oberdörster, (2004) stated that exposure to nano-materials causes oxidative stress and severe lipid peroxidation in fish brain tissue and this lipid peroxidation can be repealed by increased HDL activity, which prevents LDL oxidation, eventually reducing serum lipids (Mackness et al., 1993; Cesar et al., 2010). Massarsky et al. (2014) showed that Ag-NPs induced lipid peroxidation by generating reactive oxygen species (ROS) extracellularly or within close proximity to the cell membrane in rainbow trout hepatocytes. This is an indication that dietary NPs have the ability to enhance HDL activity, which inhibit LDL activity, and subsequently reduce serum lipid at higher doses.
11.7.6 Serum enzyme profile
The serum activities of ALP, AST and ALT revealed a significant increase in all treated groups along the experimental periods. Serum enzymes such as AST, ALT and ALP could be used as sensitive biomarkers in ecotoxicology, because they provided an early warning of potentially hazardous alterations in contaminated aquatic organisms (Levesque et al., 2002; Kim and Kang, 2004; Nel et al., 2009). The results in the present study indicated a significant increase in serum enzyme (AST, ALT and ALP) activities, when the experimental fishes were exposed to NPs and alloy enriched feeds compared to control feed. These results were in agreement with Zaghloul et al. (2006) who studied
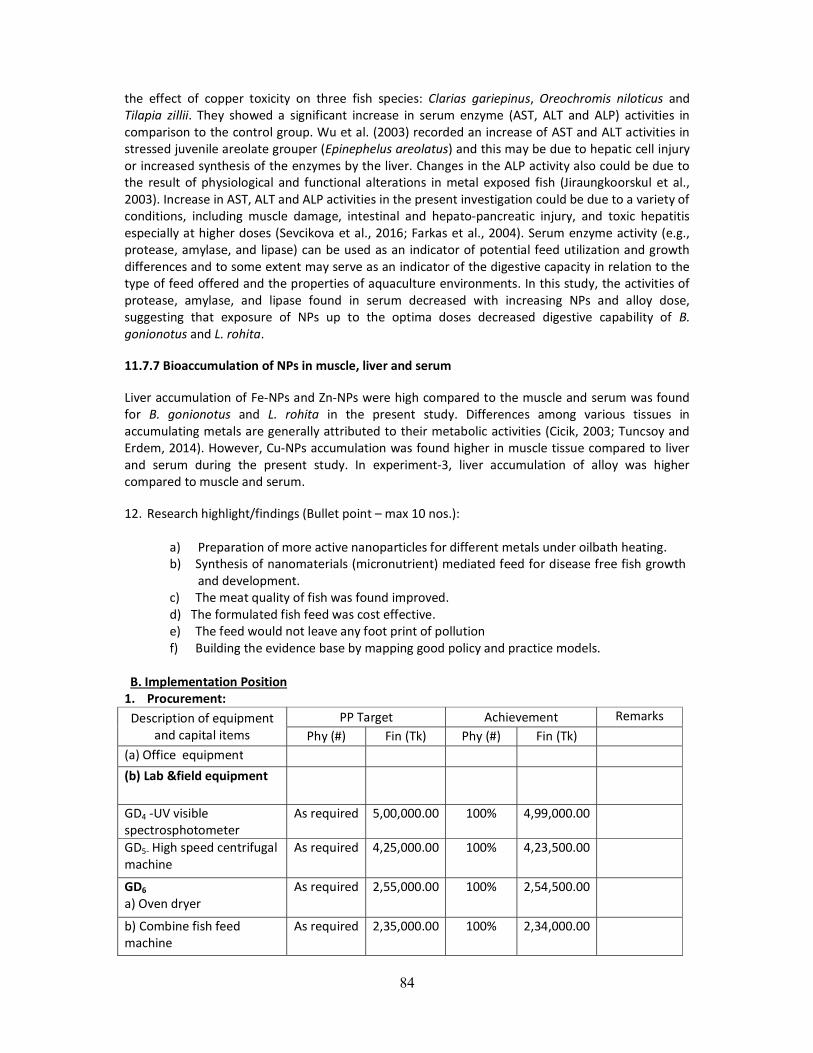
84
the effect of copper toxicity on three fish species: Clarias gariepinus, Oreochromis niloticus and Tilapia zillii. They showed a significant increase in serum enzyme (AST, ALT and ALP) activities in comparison to the control group. Wu et al. (2003) recorded an increase of AST and ALT activities in stressed juvenile areolate grouper (Epinephelus areolatus) and this may be due to hepatic cell injury or increased synthesis of the enzymes by the liver. Changes in the ALP activity also could be due to the result of physiological and functional alterations in metal exposed fish (Jiraungkoorskul et al., 2003). Increase in AST, ALT and ALP activities in the present investigation could be due to a variety of conditions, including muscle damage, intestinal and hepato-pancreatic injury, and toxic hepatitis especially at higher doses (Sevcikova et al., 2016; Farkas et al., 2004). Serum enzyme activity (e.g., protease, amylase, and lipase) can be used as an indicator of potential feed utilization and growth differences and to some extent may serve as an indicator of the digestive capacity in relation to the type of feed offered and the properties of aquaculture environments. In this study, the activities of protease, amylase, and lipase found in serum decreased with increasing NPs and alloy dose, suggesting that exposure of NPs up to the optima doses decreased digestive capability of B. gonionotus and L. rohita.
11.7.7 Bioaccumulation of NPs in muscle, liver and serum
Liver accumulation of Fe-NPs and Zn-NPs were high compared to the muscle and serum was found for B. gonionotus and L. rohita in the present study. Differences among various tissues in accumulating metals are generally attributed to their metabolic activities (Cicik, 2003; Tuncsoy and Erdem, 2014). However, Cu-NPs accumulation was found higher in muscle tissue compared to liver and serum during the present study. In experiment-3, liver accumulation of alloy was higher compared to muscle and serum.
12. Research highlight/findings (Bullet point – max 10 nos.):
a) Preparation of more active nanoparticles for different metals under oilbath heating. b) Synthesis of nanomaterials (micronutrient) mediated feed for disease free fish growth
and development. c) The meat quality of fish was found improved. d) The formulated fish feed was cost effective. e) The feed would not leave any foot print of pollution f) Building the evidence base by mapping good policy and practice models.
B. Implementation Position 1. Procurement: Description of equipment
and capital items PP Target Achievement Remarks
Phy (#) Fin (Tk) Phy (#) Fin (Tk) (a) Office equipment (b) Lab &field equipment
GD4 -UV visible spectrosphotometer
As required 5,00,000.00 100% 4,99,000.00
GD5- High speed centrifugal machine
As required 4,25,000.00 100% 4,23,500.00
GD6 a) Oven dryer
As required 2,55,000.00 100% 2,54,500.00
b) Combine fish feed machine
As required 2,35,000.00 100% 2,34,000.00
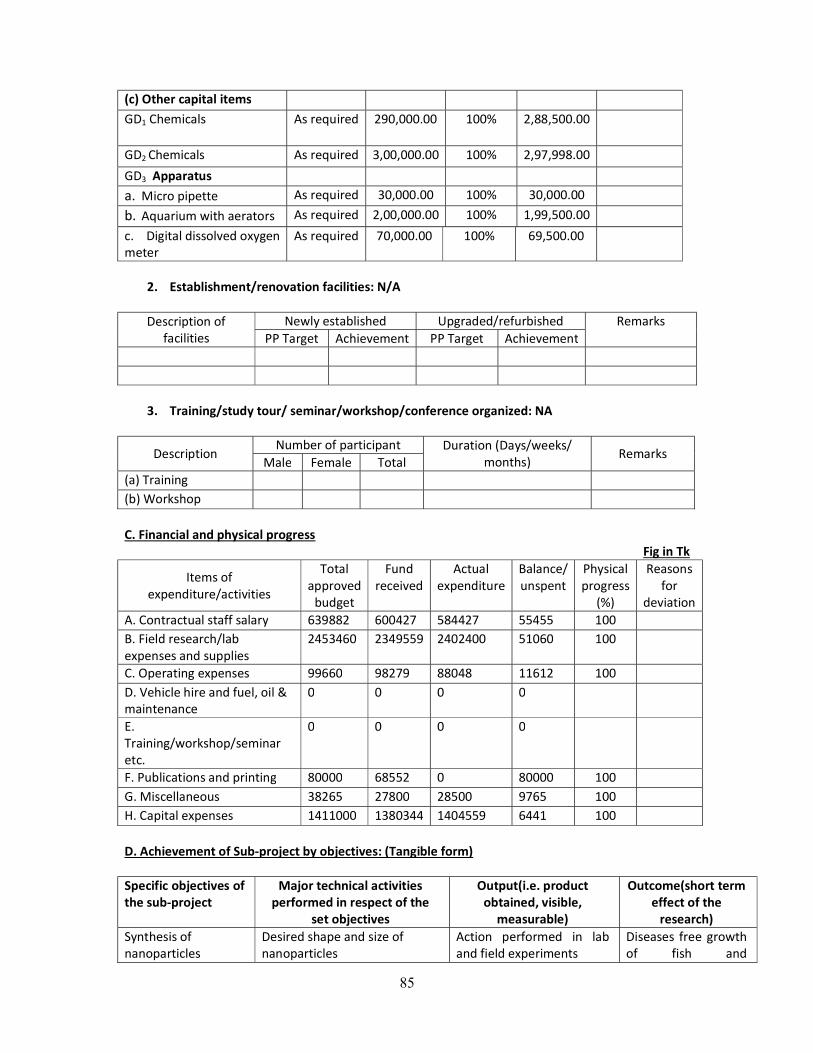
85
(c) Other capital items GD1 Chemicals As required 290,000.00
100% 2,88,500.00
GD2 Chemicals As required 3,00,000.00 100% 2,97,998.00 GD3 Apparatus a. Micro pipette As required 30,000.00 100% 30,000.00 b. Aquarium with aerators As required 2,00,000.00 100% 1,99,500.00 c. Digital dissolved oxygen meter
As required 70,000.00 100% 69,500.00
2. Establishment/renovation facilities: N/A Description of
facilities Newly established Upgraded/refurbished Remarks
PP Target Achievement PP Target Achievement
3. Training/study tour/ seminar/workshop/conference organized: NA
Description Number of participant Duration (Days/weeks/ months) Remarks
Male Female Total (a) Training (b) Workshop C. Financial and physical progress
Fig in Tk
Items of expenditure/activities
Total approved
budget
Fund received
Actual expenditure
Balance/ unspent
Physical progress
(%)
Reasons for
deviation A. Contractual staff salary 639882 600427 584427 55455 100 B. Field research/lab expenses and supplies
2453460 2349559 2402400 51060 100
C. Operating expenses 99660 98279 88048 11612 100 D. Vehicle hire and fuel, oil & maintenance
0 0 0 0
E. Training/workshop/seminar etc.
0 0 0 0
F. Publications and printing 80000 68552 0 80000 100 G. Miscellaneous 38265 27800 28500 9765 100 H. Capital expenses 1411000 1380344 1404559 6441 100 D. Achievement of Sub-project by objectives: (Tangible form) Specific objectives of the sub-project
Major technical activities performed in respect of the
set objectives
Output(i.e. product obtained, visible,
measurable)
Outcome(short term effect of the
research) Synthesis of nanoparticles
Desired shape and size of nanoparticles
Action performed in lab and field experiments
Diseases free growth of fish and
86
development
Synthesis of nanomaterials mediated feed
Fish feed formulation Laboratory investigation and validation of results
Safe adsorption of nanoparticles mediated fish feed
E. Materials Development/Publication made under the Sub-project:
Publication Number of publication Remarks (e.g. paper
title, name of journal, conference name, etc.)
Under preparation
Completed and published
Technology bulletin/ booklet/leaflet/flyer etc.
Journal publication Under preparation
Title , journal etc
Information development Other publications, if any F. Technology/Knowledge generation/Policy Support (as applied):
i. Generation of technology (Commodity & Non-commodity)
ii. Generation of new knowledge that help in developing more technology in future
iii. Technology transferred that help increased agricultural productivity and farmers’
income
iv. Policy Support
G. Information regarding Desk and Field Monitoring
i) Desk Monitoring [description & output of consultation meeting, monitoring workshops/seminars etc.):
CRG Sub- Project Implementation Progress Workshop, held in BARC, Farmgate Dhaka on 21 December 2017. Appreciated by NATP and other stakeholders.
Development of nanoparticles mediated feed for disease free growth and development of fish.
Proper utilization and safe adsorption of nanomaterials in Agriculture sector.
The nobel technology that helps increased agricultural productivity and farmers’ income in short time.
Nanomaterials in Agriculture supports the Agriculture policy of Bangladesh - 2018.
87
CRG Sub- Project Progress review Workshop held in BARC, Farmgate Dhaka on 10 April 2018. Found satisfactory
ii) Field Monitoring (time& No. of visit, Team visit and output):
No. of visit Team members of BARC
Date Visiting area Output
01 02 07.03.2018 Lab and Field Satisfactory
H. Lesson Learned/Challenges (if any): I.
i) Nanoparticles are more active than bulk materials. ii) It has peculiar behavior in aquaculture due to tiny amount of nanomaterials serve as micronutrient as well as enhance of growth and development of fish.
iii) Save and safe adsorption of nanomaterials facilitated disease free growth and development.
I. Challenges (if any):
I. Lack of pure raw materials for the preparation nanomaterial mediated fish feed in local market.
II. Scarcity of sophisticated instrument for characterization of nanoparticles and sample. III. Discontinuous power supply in laboratory. IV. Availability of room and field space for research work. V. Delivery of pure chemicals takes much more time.
Signature of the Principal Investigator Date …………………………. Seal
Counter signature of the Head of the organization/authorized representative Date ………………………….. Seal
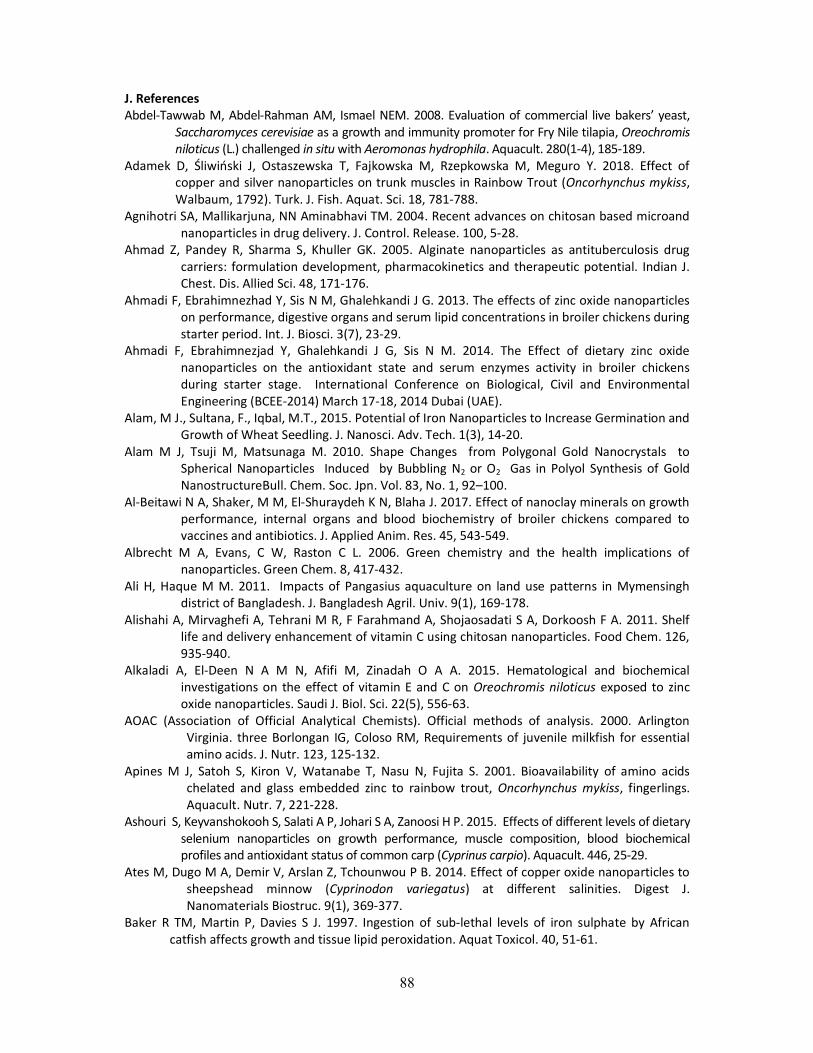
88
J. References Abdel-Tawwab M, Abdel-Rahman AM, Ismael NEM. 2008. Evaluation of commercial live bakers’ yeast,
Saccharomyces cerevisiae as a growth and immunity promoter for Fry Nile tilapia, Oreochromis niloticus (L.) challenged in situ with Aeromonas hydrophila. Aquacult. 280(1-4), 185-189.
Adamek D, Śliwiński J, Ostaszewska T, Fajkowska M, Rzepkowska M, Meguro Y. 2018. Effect of copper and silver nanoparticles on trunk muscles in Rainbow Trout (Oncorhynchus mykiss, Walbaum, 1792). Turk. J. Fish. Aquat. Sci. 18, 781-788.
Agnihotri SA, Mallikarjuna, NN Aminabhavi TM. 2004. Recent advances on chitosan based microand nanoparticles in drug delivery. J. Control. Release. 100, 5-28.
Ahmad Z, Pandey R, Sharma S, Khuller GK. 2005. Alginate nanoparticles as antituberculosis drug carriers: formulation development, pharmacokinetics and therapeutic potential. Indian J. Chest. Dis. Allied Sci. 48, 171-176.
Ahmadi F, Ebrahimnezhad Y, Sis N M, Ghalehkandi J G. 2013. The effects of zinc oxide nanoparticles on performance, digestive organs and serum lipid concentrations in broiler chickens during starter period. Int. J. Biosci. 3(7), 23-29.
Ahmadi F, Ebrahimnezjad Y, Ghalehkandi J G, Sis N M. 2014. The Effect of dietary zinc oxide nanoparticles on the antioxidant state and serum enzymes activity in broiler chickens during starter stage. International Conference on Biological, Civil and Environmental Engineering (BCEE-2014) March 17-18, 2014 Dubai (UAE).
Alam, M J., Sultana, F., Iqbal, M.T., 2015. Potential of Iron Nanoparticles to Increase Germination and Growth of Wheat Seedling. J. Nanosci. Adv. Tech. 1(3), 14-20.
Alam M J, Tsuji M, Matsunaga M. 2010. Shape Changes from Polygonal Gold Nanocrystals to Spherical Nanoparticles Induced by Bubbling N2 or O2 Gas in Polyol Synthesis of Gold NanostructureBull. Chem. Soc. Jpn. Vol. 83, No. 1, 92–100.
Al-Beitawi N A, Shaker, M M, El-Shuraydeh K N, Blaha J. 2017. Effect of nanoclay minerals on growth performance, internal organs and blood biochemistry of broiler chickens compared to vaccines and antibiotics. J. Applied Anim. Res. 45, 543-549.
Albrecht M A, Evans, C W, Raston C L. 2006. Green chemistry and the health implications of nanoparticles. Green Chem. 8, 417-432.
Ali H, Haque M M. 2011. Impacts of Pangasius aquaculture on land use patterns in Mymensingh district of Bangladesh. J. Bangladesh Agril. Univ. 9(1), 169-178.
Alishahi A, Mirvaghefi A, Tehrani M R, F Farahmand A, Shojaosadati S A, Dorkoosh F A. 2011. Shelf life and delivery enhancement of vitamin C using chitosan nanoparticles. Food Chem. 126, 935-940.
Alkaladi A, El-Deen N A M N, Afifi M, Zinadah O A A. 2015. Hematological and biochemical investigations on the effect of vitamin E and C on Oreochromis niloticus exposed to zinc oxide nanoparticles. Saudi J. Biol. Sci. 22(5), 556-63.
AOAC (Association of Official Analytical Chemists). Official methods of analysis. 2000. Arlington Virginia. three Borlongan IG, Coloso RM, Requirements of juvenile milkfish for essential amino acids. J. Nutr. 123, 125-132.
Apines M J, Satoh S, Kiron V, Watanabe T, Nasu N, Fujita S. 2001. Bioavailability of amino acids chelated and glass embedded zinc to rainbow trout, Oncorhynchus mykiss, fingerlings. Aquacult. Nutr. 7, 221-228.
Ashouri S, Keyvanshokooh S, Salati A P, Johari S A, Zanoosi H P. 2015. Effects of different levels of dietary selenium nanoparticles on growth performance, muscle composition, blood biochemical profiles and antioxidant status of common carp (Cyprinus carpio). Aquacult. 446, 25-29.
Ates M, Dugo M A, Demir V, Arslan Z, Tchounwou P B. 2014. Effect of copper oxide nanoparticles to sheepshead minnow (Cyprinodon variegatus) at different salinities. Digest J. Nanomaterials Biostruc. 9(1), 369-377.
Baker R TM, Martin P, Davies S J. 1997. Ingestion of sub-lethal levels of iron sulphate by African catfish affects growth and tissue lipid peroxidation. Aquat Toxicol. 40, 51-61.
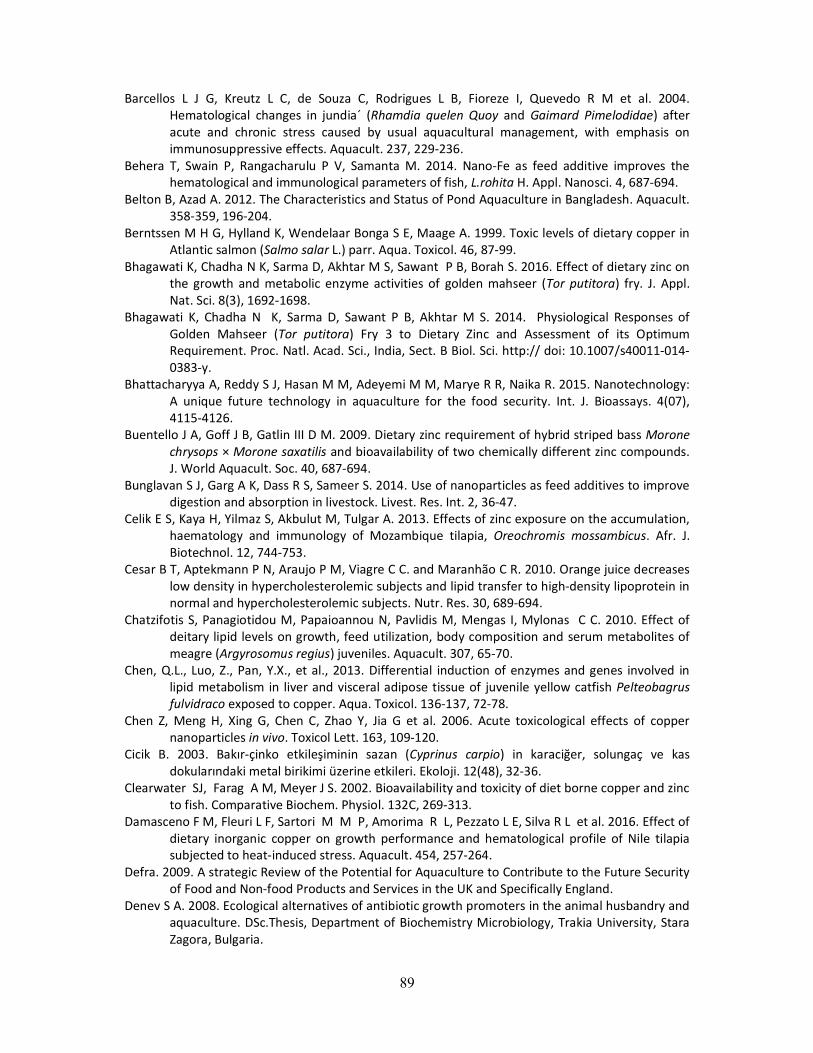
89
Barcellos L J G, Kreutz L C, de Souza C, Rodrigues L B, Fioreze I, Quevedo R M et al. 2004. Hematological changes in jundia´ (Rhamdia quelen Quoy and Gaimard Pimelodidae) after acute and chronic stress caused by usual aquacultural management, with emphasis on immunosuppressive effects. Aquacult. 237, 229-236.
Behera T, Swain P, Rangacharulu P V, Samanta M. 2014. Nano-Fe as feed additive improves the hematological and immunological parameters of fish, L.rohita H. Appl. Nanosci. 4, 687-694.
Belton B, Azad A. 2012. The Characteristics and Status of Pond Aquaculture in Bangladesh. Aquacult. 358-359, 196-204.
Berntssen M H G, Hylland K, Wendelaar Bonga S E, Maage A. 1999. Toxic levels of dietary copper in Atlantic salmon (Salmo salar L.) parr. Aqua. Toxicol. 46, 87-99.
Bhagawati K, Chadha N K, Sarma D, Akhtar M S, Sawant P B, Borah S. 2016. Effect of dietary zinc on the growth and metabolic enzyme activities of golden mahseer (Tor putitora) fry. J. Appl. Nat. Sci. 8(3), 1692-1698.
Bhagawati K, Chadha N K, Sarma D, Sawant P B, Akhtar M S. 2014. Physiological Responses of Golden Mahseer (Tor putitora) Fry 3 to Dietary Zinc and Assessment of its Optimum Requirement. Proc. Natl. Acad. Sci., India, Sect. B Biol. Sci. http:// doi: 10.1007/s40011-014-0383-y.
Bhattacharyya A, Reddy S J, Hasan M M, Adeyemi M M, Marye R R, Naika R. 2015. Nanotechnology: A unique future technology in aquaculture for the food security. Int. J. Bioassays. 4(07), 4115-4126.
Buentello J A, Goff J B, Gatlin III D M. 2009. Dietary zinc requirement of hybrid striped bass Morone chrysops × Morone saxatilis and bioavailability of two chemically different zinc compounds. J. World Aquacult. Soc. 40, 687-694.
Bunglavan S J, Garg A K, Dass R S, Sameer S. 2014. Use of nanoparticles as feed additives to improve digestion and absorption in livestock. Livest. Res. Int. 2, 36-47.
Celik E S, Kaya H, Yilmaz S, Akbulut M, Tulgar A. 2013. Effects of zinc exposure on the accumulation, haematology and immunology of Mozambique tilapia, Oreochromis mossambicus. Afr. J. Biotechnol. 12, 744-753.
Cesar B T, Aptekmann P N, Araujo P M, Viagre C C. and Maranhão C R. 2010. Orange juice decreases low density in hypercholesterolemic subjects and lipid transfer to high-density lipoprotein in normal and hypercholesterolemic subjects. Nutr. Res. 30, 689-694.
Chatzifotis S, Panagiotidou M, Papaioannou N, Pavlidis M, Mengas I, Mylonas C C. 2010. Effect of deitary lipid levels on growth, feed utilization, body composition and serum metabolites of meagre (Argyrosomus regius) juveniles. Aquacult. 307, 65-70.
Chen, Q.L., Luo, Z., Pan, Y.X., et al., 2013. Differential induction of enzymes and genes involved in lipid metabolism in liver and visceral adipose tissue of juvenile yellow catfish Pelteobagrus fulvidraco exposed to copper. Aqua. Toxicol. 136-137, 72-78.
Chen Z, Meng H, Xing G, Chen C, Zhao Y, Jia G et al. 2006. Acute toxicological effects of copper nanoparticles in vivo. Toxicol Lett. 163, 109-120.
Cicik B. 2003. Bakır-çinko etkileşiminin sazan (Cyprinus carpio) in karaciğer, solungaç ve kas dokularındaki metal birikimi üzerine etkileri. Ekoloji. 12(48), 32-36.
Clearwater SJ, Farag A M, Meyer J S. 2002. Bioavailability and toxicity of diet borne copper and zinc to fish. Comparative Biochem. Physiol. 132C, 269-313.
Damasceno F M, Fleuri L F, Sartori M M P, Amorima R L, Pezzato L E, Silva R L et al. 2016. Effect of dietary inorganic copper on growth performance and hematological profile of Nile tilapia subjected to heat-induced stress. Aquacult. 454, 257-264.
Defra. 2009. A strategic Review of the Potential for Aquaculture to Contribute to the Future Security of Food and Non-food Products and Services in the UK and Specifically England.
Denev S A. 2008. Ecological alternatives of antibiotic growth promoters in the animal husbandry and aquaculture. DSc.Thesis, Department of Biochemistry Microbiology, Trakia University, Stara Zagora, Bulgaria.

90
Drabkin D R. 1945. Crystallographic and optical properties of human hemoglobin: a proposal for the standardization of hemoglobin. American J. Medi. Sci. 209, 268-270.
Dube A, Nicolazzo J A, Larson I. 2010. Chitosan nanoparticles enhance the intestinal absorption of the green tea catechins (+) catechin and (-) -epigallocatechin gallate. Eur. J. Pharm. Sci. 41, 219-225.
Dumas B T, Watson W A, Biggs H G. 1971. Albumin standards and the measurement of serum albumin with bromocresol green. Clin. Chim. Acta 31, 87-96.
Eide D J. 2006. Zinc transporters and the cellular trafficking of zinc. Biochim. Biophys. Acta. 1763, 711-722.
El Basuini M F, El-Hais A M, Dawood M A O, Abou-Zeid A E S, El-Damrawy S Z, Khalafalla et al. 2016. Effects of dietary copper nanoparticles and vitamin C supplementations on growth performance, immune response and stress resistance of red sea bream, Pagrus major. Aquacult. Nutr. 00, 1–12.
Eldridge J H, Hammond C J, Meulbroek J A, Staas J K, Gilley R M, Tice T R. 1990. Controlled vaccine release in gut-associated lymphoid tissues. I. Orally administered biodegradable microspheres target the Peyer’s patches. J. Control. Release. 11, 205-214.
ETC Group (Action Group on Erosion, Technology and Concentration). 2003. [webpage on the Internet]. Down on the farm: the impact of nanoscale technologies on food and agriculture. Ottawa, ON: ETC Group.
Faiz H, Zuberi A, Nazir S, Rauf M, Younus N. 2015. Zinc Oxide, Zinc Sulfate and Zinc Oxide Nanoparticles as Source of Dietary Zinc: Comparative Effects on Growth and Hematological Indices of Juvenile Grass Carp (Ctenopharyngodon idella). Int. J. Agri. Biol. 17, 568-574.
FAO. 2016. The State of World Fisheries and Aquaculture 2016. Contributing to food security and nutrition for all. Rome. 200pp.
Faramarzi M. 2012. Effect of dietary vitamin C on growth and feeding parameters, carcass composition and survival rate of Common Carp (Cyprinus carpio). Global Vet. 8, 507-510.
Farkas J, Farkas P, Hyde D. 2004. Liver and gastroenterology tests. In: Lee, M., 3rd (Ed.), Basic Skills in Interpreting Laboratory Data. American Society of Health-System Pharmacists, Bethesda, pp. 330–336.
Fathi M, Haydari M, Tanha T. 2016. Effects of zinc oxide nanoparticles on antioxidant status, serum enzymes activities, biochemical parameters and performance in broiler chickens. J. Livestock Sci. Tech. 4(2), 07-13.
Firat O. 2007. Effects of metal (Zn, Cd) and metal mixtures (Zn + Cd) on physiological and biochemical parameters in blood tissues of Oreochromis niloticus. Ph. D Thesis, Çukurova University, Turkey.
Florence A T, Hillery A M, Hussain N, Jani PU. 1995. Nanoparticles as carriers for oral peptide absorption: studies on particle uptake and fate. J. Control. Release. 36, 39-44.
Food Safety Authority of Ireland (FSAI). 2008. The Relevance for Food Safety of Applications of Nanotechnology in the Food and Feed Industries Abbey Court, Lower Abbey Street, Dublin.
Fountoulaki E, Morgane H, Rigos G, Antigoni V, Mente E, Sweetman J., Nengas, I. 2010. Evaluation of zinc supplementation in European sea bass (Dicentrarchus labrax) juvenile diets. Aquacult. Res. 41, 208-216.
FRSS. 2017. Yearbook of Fisheries Statistics of Bangladesh. Fisheries Resources Survey System (FRSS), Department of Fisheries, Bangladesh. Volume 33: 124p.
Gatlin III D M, Wilson R P. 1986. Characterization of iron deficiency and the dietary iron requirement of fingerling channel catfish. Aquacult. 52, 191-198.
Ghosh T K, Chatterjee S K. 1989. Influence of nuvan on the organic reserves of Indian freshwater murrel, Channa punctatus. J. Environ. Biol. 10, 93-99.
Gluth G, Hanke W. 1985. A comparison of physiological changes in carp; Cyprinus carpio induced by several pollutants of sublethal concentrations. I-The dependency on exposure time. Ecotoxicol. Environ. Saf. 9, 179-188.
91
Gomes T, Pinheiro J P et al. 2011. Effects of copper nanoparticles exposure in the mussel Mytilus galloprovincialis . Environ. Sci. Technol. 45 (21), 9356-9362.
Gong, P., Li, H., He, X., Wang, K., Hu, J., Tan, W., et al. 2007. Preparation and antibacterial activity of Fe3O4@Ag nanoparticles. Nanotechnology, 18, 604-11.
Gu H, Ho P L, Tong E, Wang L, Xu B. 2003. Presenting vancomycin on nanoparticles to enhance anti-microbial activities. Nano. Lett. 3, 1261-1263.
Gupta Y R, Sellegounder D, Kannan M, Deepa S, Senthilkumaran B, Basavaraju Y. 2016. Effect of copper nanoparticles exposure in the physiology of the common carp (Cyprinus carpio): Biochemical, histological and proteomic approaches. Aquacult. Fish. 1, 15-23.
Haliwell B. 2007. Oxidative stress and cancer, have we moved forward? Biochem. J, 401, 1-10. Handy R D. 2012. Nanotechnology in Fisheries and Aquaculture. Fisheries Society of the British Isles
School of Biomedical and Biological Sciences, University of Plymouth, Drake Circus, Plymouth. UK.
Herzig I, Navratilova M, Totusek J, Suchy P, Vecerek V, Blahova J, Zraly Z. 2009. The effect of humic acid on zinc accumulation in chicken broiler tissues. Czech J. Anim. Sci. 54, 121-127.
Hett A. 2004. Nanotechnology. Small matter, many unknowns. Zurich: Swiss Reinsurance Company. Houng-Yung C, Yu-Chun C, Li-Chi H, Meng-Hsien C. 2014. Dietary zinc requirements of juvenile
grouper, Epinephelus malabaricus. Aquacult. 432, 360-364. Imamoğlu S, Bereket A, Turan S, Tagaand Y, Haklar G. 2005. Effect of zinc supplementation on
growth hormone secretion, IGF-I, IGFBP-3, somatomedin generation, alkaline phosphatase, osteocalcin and growth in prepubertal children with idiopathic short stature. J. Pediatr. Endocrinol. Metab. 18, 69-74.
Jani P, Halbert G W, Langridge J, Florence A T. 1990. Nanoparticle uptake by the rat gastrointestinal mucosa: quantitation and particle size dependency. J. Pharma. Pharmacol. 42, 821-826.
Jiraungkoorskul W, Upatham E S, Kruatrachue M, Shaphong S, Vichasri-Grams S, Pokethitiyook P. 2003. Biochemical and histopathological effects of glyphosate herbicide on Nile tilapia (Oreochromis niloticus). Environ. Toxicol. 18, 260-267.
Kavitha C, Malarvizhi A, Kumaran S S, Ramesh M. 2010. Toxicological effects of arsenate exposure on hematological, biochemical and liver transaminases activity in an Indian Major Carp, Catla catla. Food Chem. Toxicol. 48, 2848-2854.
Kaya H, Aydın F, Gürkanc M, Yılmaza S, Atesd M, Demire V et al. 2015. Effects of zinc oxide nanoparticles on bioaccumulation and oxidativestress in different organs of tilapia (Oreochromis niloticus). Environ. Toxicol. Pharmacol. 40, 936-947.
Khabbazi M, Harsij M, Hedayatim A K, Gholipoorm H, Geramim M H, Ghafari F H. 2015. Effect of CuO nanoparticles on some hematological indices of rainbow trout Oncorhynchus mykiss and their potential toxicity, Nanomed. J. 2(1), 67-73.
Kim S G, Kang J C. 2004. Effect of dietary copper exposure on accumulation, growth and hematological parameters of the juvenile rockfish, Sebastes schlegeli. Mar Environ. Res. 58, 65-82.
Kiron V, Gunji A, Okamoto N, Satoh S, Ikeda Y, Watanabe T. 1993. Dietary nutrient dependent variations on natural-killer activity of the leucocytes of rainbow trout. Fish Pathol. 28, 71-76.
Kohen R, Nyska A. 2002. Oxidation of biological systems: oxidative stress phenomena, antioxidants, redox reactions, and methods for their quantification Toxicol. Pathol. 30, 620-650.
Kondera E, Witeska M. 2013. Cadmium and copper reduce hematopoietic potential in common carp (Cyprinus carpio L.) head kidney. Fish Physiol. Biochem. 39, 755-764.
Kori-Siakpere O, Ubogu E O. 2008. Sublethal haematological effects of zinc on the freshwater fish, Heteroclarias sp. (Osteichthyes: Clariidae). African J. Biotech. 7(12), 2068-2073.
Koyama J, Ozaki H. 1984. Hematological changes of fish exposed to low concentrations of cadmium in the water. Beltline of Japanese Society Specialist of Fish, 50, 199-203.
92
Kumar A J, Pal A K, Sahu N P, Kumar S, Mukherjee S C. 2007. Haemato-immunological responses to dietary yeast RNA, ω-3 fatty acid and β -carotene in catla catla juveniles, Fish and Shellfish Immnol. 23, 917-927.
Kuzma J, VerHage P. 2006. Nanotechnology in Agriculture and Food Production: Anticipated Applications. Washington, DC, The Project on Emerging Nanotechnologies, 2006.
Lakani F B, Meshkini S, Sadati M A Y, Falahatkar B. 2016. Bioaccumulation of copper nanoparticle in gill, liver, intestine and muscle of Siberian sturgeon (Acipenser baerii) juvenile. Caspian J. Environ. Sci. 14(2), 105-115.
Levesque H M, Moon T W, Campbell P G C, Hontela A. 2002. Seasonal variation in carbohydrate and lipid metabolism of yellow perch (Perca flavescens) chronically exposed to metals in the field. Aquat. Toxicol. 60, 257-267.
Li, H., Zhou, Q., Wu, Y., Fu, J., Wang, T., Jiang, G. 2009. Effects of waterborne nano-iron on medaka (Oryzias latipes): antioxidant enzymatic activity, lipid peroxidation and histopathology. Ecotoxicol. Environ. Safe. 72, 684-692.
Li Q L, Mahendra S, Lyon D Y, Brunet L., Liga M V, Li D, Alvarez P J J. 2008. Antimicrobial nanomaterials for water disinfection and microbial control: potential applications and implications. Water Res. 42, 4591-4602.
Liang J J, Yang H J, Liu Y J, Tian L X, Liang G Y. 2012. Dietary zinc requirement of juvenile grass carp (Ctenopharyngodon idella) based on growth and mineralization. Aquacult. Nutr. 18, 380-387.
Lim C, Klesius P H, Duncan P L. 1996. Immune response and resistance of channel catfish to Edwardsiella ictaluri challenge when fed various dietary levels of zinc methionine and zinc sulfate. J. Aquat. Anim. Healt. 8, 302-307.
Maage A, Julshamn K, Berge G E. 2001. Zinc gluconate and zinc sulphate as dietary zinc sources for Atlantic salmon. Aquac. Nutr. 7, 183-187.
Mackness I M, Abbott C, Arrols S and Durrington N P. 1993. The role of high-density lipoprotein and lipid-soluble antioxidant vitamins in inhibiting low-density lipoprotein oxidation. Biochem. J. 294, 829–834.
Mansouri B, S, Johari E A, Azadi N A, Sarkheil M. 2018. Effects of waterborne ZnO nanoparticles and Zn2+ ions on the gills of Rainbow Trout (Oncorhynchus mykiss): bioaccumulation, histopathological and ultrastructural changes. Turk. J. Fish. Aquat. Sci. 18, 739-746.
Maret W, Krężel A. 2007. Cellular zinc and redox buffering capacity of metallothionein/thionein in health and disease. Mol. Med. 13, 371- 375.
Massarsky A, Abrahama R, Nguyen K C, Rippstein P, Tayabali A F, Trudeau V L. and Moona T W. 2014. Nanosilver cytotoxicity in rainbow trout (Oncorhynchus mykiss) erythrocytes and hepatocytes. Comparative Biochem. Physio. 159C, 10-21.
Mishra A, Swain R K, Mishra S K, Panda N, Sethy K. 2014. Growth performance and serum biochemical parameters as affected by nano zinc supplementation in layer chicks. Indian J. Anim. Nutr. 31(4), 384-388.
Moharram S G, Wahbi O M, El-Greisy Z A. 2011. Effect of polluted water from the Egyptian Eastern Mediterranean coast on reproductive, toxicological and hematological characteristics of Siganus rivulatus. Pak. J. Biol. Sci. 14, 668-681.
Mohseni M, Pourkazemi M, Bai S C. 2014. Effects of dietary inorganic copper on growth performance and immune responses of juvenile beluga, Huso huso. Aquacult. Nutr. https://doi: 10.1111/anu.12107.
Murai T, Andrews J W, Smith R G II. 1981. Effects of dietary copper on channel catfish. Aquacult. 22, 353-357.
Muralisankar T, Bhavan P S, Radhakrishnan S, Seenivasan C, Manickam N, Srinivasan V. 2014. Dietary Supplementation of Zinc Nanoparticles and Its Influence on Biology, Physiology and Immune Responses of the Freshwater Prawn, Macrobrachium rosenbergii. Biol. Trace. Elem. Res. http//: doi: 10.1007/s12011-014-0026-4
93
Muralisankar T, Bhavan PS, Radhakrishnan S, Seenivasan C, Srinivasan V, Santhanam P. 2015. Effects of dietary zinc on the growth, digestive enzyme activities, muscle biochemical compositions, and antioxidant status of the giant freshwater prawn Macrobrachium rosenbergii. Aquacult. 448, 98-104.
Neff JM. 1985. Use of biochemical measurement to detect pollutant-mediated damage to fish. ASTM Spec. Tech. Publ. 854, 155-183.
Nel A E, Ma¨ dler L, Velegol D, Xia T, Hoek E M, Somasundaran P, Klaessig F, Castranova V, Thompson M. 2009. Understanding biophysicochemical interactions at the nano bio interface. Nat. Mater. 8, 543-557.
Niazi J H, Gu M B. 2009. Toxicity of metallic nanoparticles in microorganisms- a Review Y.J. Kim, U. Platt, M.B. Gu, H. Iwahashi (Eds.), Atmospheric and biological environmental monitoring, Springer Science+Business Media B.V. (2009), 10.1007/978-1-4020-9674-7 12.
Oberdörster E. 2004. Manufactured nanomaterials (Fullerenes, C60) induce oxidative stress in the brain of juvenile largemouth bass. Environ. Health Perspec. 112(10), 1058-1062.
Oberdörster G, Oberdörster E, Oberdörster J. 2005. Nanotoxicology: an emerging discipline evolving from studies of ultrafine particles. Environ. health perspec. 823-839.
Obula R K P. 1994. Certain metabolic modulation in carbohydrate metabolism of fry of Cyprinus carpio on ammonia stress. Ph. D thesis, S. V University, Tirupathi, India.
Olurin K B, Olojo E A A, Tijani O B. 2012. Effect of Zinc on Hematological Parameters of African catfish (Clarias gariepinus). Asian. J. Pharmacol. Health. Sci. 2, 266-272.
Onuegbu C U, Aggarwal A, Singh N B. 2018. ZnO nanoparticles as feed supplement on growth performance of cultured African catfish fingerlings. J. Sci. Indust. Res. 77, 213-218.
Oti E E, Avoaja D A. 2005. Haematological assessment of freshwater catfishes, Clarias gariepinus (Burch) and “Heteroclarias” (hybrid) exposed to sublethal concentrations of zinc. Pak. J. Zool. 37, 101- 105.
Rai M, Yadav A, Gade A. 2009. Silver nanoparticles as a new generation of antimicrobials. Biotechnol. Adv. 27, 76-83.
Rajan M R, Archana J, Ramesh R, Keerthika V. 2016. Toxicity of Zinc Oxide Nanoparticles in Tilapia Oreochromis mossambicus. J. of Res. 5(10), 220-224.
Rajendran D. 2013. Application of nano minerals in animal production system. Res. J. Biotech. 8(3), 13.
Ranzani-paiva M J T; Silva-Souza A. 2004. Hematologia de peixes Brasileiros In: Ranzani-Paiva, M. J. T.; Takemoto, R. M.; Lizama, M. A. P. Sanidade de organismos aquáticos. São Paulo: Varela. 89-120.
Rather M A, Sharma R, Aklakur M et al. 2011. Nanotechnology: a novel tool for aquaculture and fisheries development. A prospective mini-review. Fish. Aquacult. J. 16, 1-5.
Remya A S, Ramesh M, Saravanan M, Poopal R K, Bharathi S, Nataraj D. 2015. Iron oxide nanoparticles to an Indian major carp, L.rohita: Impacts on hematology, iono regulation and gill Na+/K+ ATPase activity. J. King Saud University Sci. 27, 151-160.
Ringo E, Zhou Z, Vecino J L G, Wadsworth S, Romero J et al. 2016. Effect of dietary components on the gut microbiota of aquatic animals. A never-ending story? Aquacult. Nutr. 22, 219-282.
Romani R, Antognelli C, Baldracchini F, De Santis A, Isani G, Giovannini E, Rosi G. 2003. Increased acetylcholinesterase activities in specimens of Sparus auratus exposed to sublethal copper concentrations. Chem-Biol. Interac. 145, 321-329.
Sa´M, Carmo V, Pezzato L E, Lima M M B F, Padilha P M. 2004. Optimum zinc supplementation level in Nile tilapia Oreochromis niloticus juveniles diets. Aquacult. 238, 385-401.
Sabatini S E, Juarez A B, Eppis M R, Bianchi L, Luquet C M, Rios de Molinaa M C. 2009. Oxidative stress and antioxidant defences in two green microalgae exposed to copper. Ecotoxicol. Environ. Safety. 72, 1200-1206.
Saffari S, Keyvanshokooh Saeed, Zakeri M, Johar S A, Zanoosi H P, Mozanzadeh M T. 2018. Effects of dietary organic, inorganic, and nanoparticulate selenium sources on growth, hemato-

94
immunological, and serum biochemical parameters of common carp (Cyprinus carpio). Fish. Physiol. Biochem. https://doi.org/10.1007/s10695-018-0496-y.
Saravanan M, Kumar P, Ramesh M. 2011. Haematological and biochemical responses of freshwater teleost fish Cyprinus carpio (Actinopterygii: Cypriniformes) during acute and chronic sublethal exposure to lindane Pestic. Biochem. Physiol. 100, 206-211.
Schaperclaus W, Kulow H, schreckenbach K. 1992. Fish diseases. A.A. Balkema, Rotterdam, the Netherlands.
Sealey W M, Lim C, Klesius PH. 1997. Influence of dietary level of iron from iron methionine and iron sulfate on immune response and resistance of channel catfish to Edwardsiella ictaluri. J. World Aquacult. Soc. 28, 142-149.
Sekhon B S. 2014. Nanotechnology in agri-food production: an overview. Nanotech. Sci. Appli. 7, 31-53.
Sevcikova M, Modra H, Blahova J, Dobsikova R, Plhalova L, Zitka O et al. 2016. Biochemical, haematological and oxidative stress responses of common carp (Cyprinus carpio L.) after sub-chronic exposure to copper. Vet. Medi. 61(1), 35-50.
Siklar Z, Tuna C, Dallar Y, Tanyer G. 2003. Zinc deficiency: a contributing factor of short stature in growth hormone deficient children. J. Trop. Pediatr. 49, 187-188.
Srinivasan V, Bhavan P S, Rajkumar G, Satgurunathan T, Muralisankar T. 2016. Effects of dietary iron oxide nanoparticles on the growth performance, biochemical constituents and physiological stress responses of the giant freshwater prawn Macrobrachium rosenbergii post-larvae. Int. J. Fish. Aqua. Studi. 4(2), 170-182.
Stanley SL and Doris LL (2000). Glyconutritionals: Implications in Antimicrobial Activity. GlycoScience, 1(22): 1-4.
Stefanni S, Bettencourt R, Pinheiro M, de Moro, G, Bongiorni L, Pallavicini A. 2014. Transcriptome of the deep-sea black scabbardfish, Aphanopus carbo (Perciformes: Trichiuridae): tissue-specific expression patterns and candidate genes associated to depth adaptation. Int. J. Genom. 2014, 21.
Suganthi P, Murali M, Sadiq B A, Syed M H E, Basu H b, Singhal R K. 2015. Haematological studies on freshwater Tilapia treated with ZnO nanoparticles. J. Adv. Appl. Scienti. Res. 1, 41-67.
Svobodova Z, Vykusova B, Machova J. 1994. The effects of pollutants on selected haematological and biochemical parameters in fish. In: Muller R, Lloyd R (eds.): Sublethal and Chronic Effects of Pollutants on Freshwater Fish, FAO Fishing News Books, 39–52.
Swain P S, Rajendran D, Rao S B N, Dominic G. 2015. Preparation and effects of nano mineral particle feeding in livestock: A review. Vet. World. 8(7), 888-891.
Tacon A G J 1988. The nutrition and feeding of farmed fish and shrimp. A training manual. 3. Feeding Methods. FAO Field Document Project GCP/RLA/075/ITA. Field Document No. 7 208 pp. Brasilia, Brazil.
Tacon A G J, 1993. Feed formulation and on-farm feed management, pp. 61-74. In: New MB, Tacon, A.G.J., Csavas I (eds) Farm-made Aquafeeds. Proceedings of the FAO/AADCP Regional Expert Consultation, 14-18 De. 1992. Bangkok, Thailand. FAO-RAPA/AADCP, Bangkok, Thailand.
Tan B, Mai K. 2001. Zinc methionine and zinc sulfate as sources of dietary zinc for juvenile abalone, Haliotis discus hannai. Aquacult. 192, 67-84.
Tan X Y, Luo Z, Liu X, Xie C X. 2011. Dietary copper (Cu) requirement for juvenile yellow catfish Pelteobagrus fulvidraco. Aquacult. Nutr. 17, 170-176.
Tang QQ, Feng L, Jiang W D, Liu Y, Jiang J, Li S H, Kuang S Y, Tang L, Zhou X Q. 2013. Effects of dietary copper on growth, digestive, and brush border enzyme activities and antioxidant defense of hepatopancreas and intestine for young grass carp (Ctenopharyngodon idella). Biol. Trace Element Res. 155, 370-380.
95
Tawfik M M M, Moustafa M M, Abumourad I M K, El-Meliegy E M, Refai M K. 2017. Evaluation of nano Zinc Oxide feed additive on tilapia growth and immunity. 15th International Conference on Environmental Science and Technology Rhodes, Greece.
Taylor S, Qu L, Kitaygorodskiy A, Teske J, Latour R A, Sun Y P. 2004. Synthesis and characterization of peptide-functionalized polymeric nanoparticles. Biomacromolecules. 5, 245-248.
Tunçsoy M, Duran S, Ay Ö, Cicik B, Erdem C. 2017. Effects of copper oxide nanoparticles on antioxidant enzyme activities and on tissue accumulation of Oreochromis niloticus. Bull. Environ. Contam. Toxicol. 99, 360-364.
Wang H W, Cai D B, Xiao G H, Zhao C L, Wang Z H, Xu H M, Guan Y Q. 2009. Effects of selenium on the activity of antioxidant enzymes in the shrimp, Neocaridina heteropoda. Isr. J. Aquacult. 61, 322-329.
Wang T, Long X, Cheng Y, Liu Z, Yan S. 2015. A comparison effect of copper nanoparticles versus copper sulphate on juvenile Epinephelus coioides: growth parameters, digestive enzymes, body composition, and histology as biomarkers. Int. J. Genom. 2015, 10. http://dx.doi.org/10.1155/2015/783021
Wang Y, Li K, Han H, Zheng Z, Bureau D P. 2008. Potential of using a blend of rendered animal protein ingredients to replace fish meal in practical diets for malabar grouper (Epinephelus malabaricus). Aquacult. 281, 113-117.
Wu R S, Pollino C A, Au D W, Zheng D W, Yuen B, Lam P K. 2003. Evaluation of biomarkers of exposure and effect in juvenile areolated grouper (Epinephelus areolatus) on food-borne exposure to benzo-a-pyrene Environ. Toxicol. Chem. 22, 68-73.
Zaghloul K H, Omar W A, Abo-Hegab S. 2006. Toxicity specificity of copper in some freshwater fishes. Egypt. J. Zool. 47, 383-400.
Zheng J L, Luo Z, Liu CX et al. 2013. Differential effects of acute and chronic zinc (Zn) exposure on hepatic lipid deposition and metabolism in yellow catfish Pelteobagrus fulvidraco. Aqua. Toxicol. 132-133, 173-181.
Zhou X, Wang Y, Guand Q, Li W. 2009. Effects of different dietary selenium sources (selenium nanoparticle and selenomethionine) on growth performance, muscle composition and glutathione peroxidase enzyme activity of Crucian carp (Carassius auratusg ibelio). Aquacult. 291, 78-81.
Related Documents