Studying permeation of hydrogen (H and D) through Palladium membrane dynamically with ERDA method S. Markelj * , P. Pelicon, J. Simc ˇic ˇ, Z. Rupnik, I. C ˇ adez ˇ Joz ˇef Stefan Institute, Jamova 39, 1000 Ljubljana, Slovenia Available online 4 May 2007 Abstract Permeation of H and D through palladium membrane was studied in real-time with Elastic Recoil Detection Analysis (ERDA). Con- centration depth profile of hydrogen at the low pressure side of the membrane was followed by successive recording of ERDA spectra. Bulk concentration of hydrogen was high at low temperatures (below 380 K and 420 K for D and H, respectively) indicating that per- meation is desorption limited. At higher temperatures concentration in the low pressure side of membrane diminished and hydrogen flux through the membrane increased as indicated by pressure rise in the vacuum chamber. Permeation of hydrogen therefore becomes dif- fusion limited. Ó 2007 Elsevier B.V. All rights reserved. PACS: 82.80.Yc; 68.43.Mn; 68.43.Jk Keywords: Hydrogen; Permeation; ERDA method 1. Introduction Interaction of hydrogen atoms and molecules with solids is an important research subject of surface science and plasma wall interaction in fusion reactors. We have used ion beam analytical method Elastic Recoil Detection Anal- ysis (ERDA) in order to study processes occurring on metal surface and in bulk dynamically. We followed sur- face processes and diffusion in bulk in real-time and in situ by hydrogen and deuterium concentration depth profiling with ERDA. Palladium is known to have a high permeability for hydrogen [1] and we have chosen it as a first material in our program to study hydrogen surface recombination. In particular we are interested in internal energy of mole- cules formed after permeation. For these studies we are using our newly developed instrument for vibrational spec- troscopy of hydrogen molecules [2]. Here we present results of dynamical study of hydrogen permeation [3,4] through palladium membrane. One side of the membrane was exposed to high pressure of hydro- gen gas (H 2 and D 2 ) while the other side was in vacuum. The permeation mechanism of hydrogen through palla- dium involves dissociative adsorption and recombinative desorption at the surface and also diffusion in the bulk [5,6]. Diffusion is the limiting process of permeation of hydrogen through palladium membrane at high driving pressures and higher temperatures. The hydrogen flux through the membrane is then proportional to diffusion coefficient and to the square root of the driving pressure [7]. Our goal was to measure the hydrogen concentration in the membrane. Hydrogen concentrations were obtained from ERDA spectra. Measurements were performed at dif- ferent temperatures of the membrane. Measuring method and results are presented. Time resolution for studied sur- face processes and diffusion in bulk is determined by the time needed to achieve sufficient statistics of ERDA spec- tra. In the present study this time was about 10 min. 0168-583X/$ - see front matter Ó 2007 Elsevier B.V. All rights reserved. doi:10.1016/j.nimb.2007.04.242 * Corresponding author. Tel.: +386 1 5885 265; fax: +386 1 5885 377. E-mail address: [email protected] (S. Markelj). www.elsevier.com/locate/nimb Nuclear Instruments and Methods in Physics Research B 261 (2007) 498–503 NIM B Beam Interactions with Materials & Atoms

Welcome message from author
This document is posted to help you gain knowledge. Please leave a comment to let me know what you think about it! Share it to your friends and learn new things together.
Transcript
www.elsevier.com/locate/nimb
Nuclear Instruments and Methods in Physics Research B 261 (2007) 498–503
NIMBBeam Interactions
with Materials & Atoms
Studying permeation of hydrogen (H and D) throughPalladium membrane dynamically with ERDA method
S. Markelj *, P. Pelicon, J. Simcic, Z. Rupnik, I. Cadez
Jozef Stefan Institute, Jamova 39, 1000 Ljubljana, Slovenia
Available online 4 May 2007
Abstract
Permeation of H and D through palladium membrane was studied in real-time with Elastic Recoil Detection Analysis (ERDA). Con-centration depth profile of hydrogen at the low pressure side of the membrane was followed by successive recording of ERDA spectra.Bulk concentration of hydrogen was high at low temperatures (below 380 K and 420 K for D and H, respectively) indicating that per-meation is desorption limited. At higher temperatures concentration in the low pressure side of membrane diminished and hydrogen fluxthrough the membrane increased as indicated by pressure rise in the vacuum chamber. Permeation of hydrogen therefore becomes dif-fusion limited.� 2007 Elsevier B.V. All rights reserved.
PACS: 82.80.Yc; 68.43.Mn; 68.43.Jk
Keywords: Hydrogen; Permeation; ERDA method
1. Introduction
Interaction of hydrogen atoms and molecules with solidsis an important research subject of surface science andplasma wall interaction in fusion reactors. We have usedion beam analytical method Elastic Recoil Detection Anal-ysis (ERDA) in order to study processes occurring onmetal surface and in bulk dynamically. We followed sur-face processes and diffusion in bulk in real-time andin situ by hydrogen and deuterium concentration depthprofiling with ERDA.
Palladium is known to have a high permeability forhydrogen [1] and we have chosen it as a first material inour program to study hydrogen surface recombination.In particular we are interested in internal energy of mole-cules formed after permeation. For these studies we areusing our newly developed instrument for vibrational spec-troscopy of hydrogen molecules [2].
0168-583X/$ - see front matter � 2007 Elsevier B.V. All rights reserved.
doi:10.1016/j.nimb.2007.04.242
* Corresponding author. Tel.: +386 1 5885 265; fax: +386 1 5885 377.E-mail address: [email protected] (S. Markelj).
Here we present results of dynamical study of hydrogenpermeation [3,4] through palladium membrane. One sideof the membrane was exposed to high pressure of hydro-gen gas (H2 and D2) while the other side was in vacuum.The permeation mechanism of hydrogen through palla-dium involves dissociative adsorption and recombinativedesorption at the surface and also diffusion in the bulk[5,6]. Diffusion is the limiting process of permeation ofhydrogen through palladium membrane at high drivingpressures and higher temperatures. The hydrogen fluxthrough the membrane is then proportional to diffusioncoefficient and to the square root of the driving pressure[7].
Our goal was to measure the hydrogen concentration inthe membrane. Hydrogen concentrations were obtainedfrom ERDA spectra. Measurements were performed at dif-ferent temperatures of the membrane. Measuring methodand results are presented. Time resolution for studied sur-face processes and diffusion in bulk is determined by thetime needed to achieve sufficient statistics of ERDA spec-tra. In the present study this time was about 10 min.

S. Markelj et al. / Nucl. Instr. and Meth. in Phys. Res. B 261 (2007) 498–503 499
2. Experiment
Experiment was performed with 100 lm thick palladiummembrane. Palladium membrane was soldered on a smallstainless-steel cylinder with diameter of 10 mm. This mem-brane holder is welded on a smaller tube, 6 mm diameter,which was then connected to the gas source. The mem-brane assembly was mounted in the ERDA vacuum cham-ber. Inner side of the palladium membrane was exposed to1 bar of hydrogen gas, while the outer side of the mem-brane was in the vacuum. Background pressure was about2 · 10�6 mbar. The low pressure side was probed with the7Li ion beam. The membrane’s temperature was controlledby a heater mounted around the cylinder and monitored bya thermocouple inserted in a small hole in the cylinder. Theset-up is shown in Fig. 1.
Measurements were preformed at the ERDA measure-ment chamber at the 2 MV Tandem accelerator at the JozefStefan Institute (JSI) in Ljubljana. As the probing beam4.2 MeV 7Li2+ was being used, impinging at 75� withrespect to surface normal. Detector of recoiled particleswas placed at 75� with respect to surface normal. Analyzingdepth for 7Li beam in palladium was about1700 · 1015 Pd at/cm2 (250 nm) in the case of H and2300 · 1015 Pd at/cm2 (340 nm) in the case of D. The inci-dent beam was collimated by a round shaping slit with adiameter of 1 mm. An 11 lm thick aluminum absorber foilwas inserted in front of ERDA detector to separate hydro-gen recoils from scattered Li ions. Solid angle of the detec-tor was 0.86 msr as determined by calibration measurementwith kapton. Experimental set-up of ERDA was describedin more detail elsewhere [8].
Energy spectrum of recoiled H and D ions was acquiredin order to determine the depth profile of hydrogen in thesample. Concentration depth profiles of H and D for eachindividual experimental ERDA spectrum were obtained byits fitting with SIMNRA [9]. Accurate experimental elasticcross section for 7Li on H [10] was being used for the deter-mination of the H concentration. Rutherford elastic crosssection was used in the fitting procedure obtaining D con-centrations, due to lack of accurate cross section for 7Li onD. In a case when D was contained only on a sample sur-face, an extra peak in ERDA spectrum between surface D
Fig. 1. Schematic drawing and picture of the set-up of permeation membrannormal and the incoming probing ion beam and between surface normal and
peak and H signal was recorded. With further analysis itturned out that this signal was due to protons from nuclearreaction d(7Li, p)8Li. One possible way to determine theelastic cross section for 7Li on D is to normalize it to thecross section of this nuclear reaction [11]. Hydrogen con-centration depth profile was presented as a function ofnumber of Pd atoms per cm2. We have presumed that thePd crystal lattice did not change with hydrogen uptakeand that hydrogen atoms were sitting in the interstitial sitesin the crystal lattice. However there is some lattice dilata-tion at higher hydrogen concentrations [12] but this wasnot taken into consideration in present spectra analysis.
3. Results and discussions
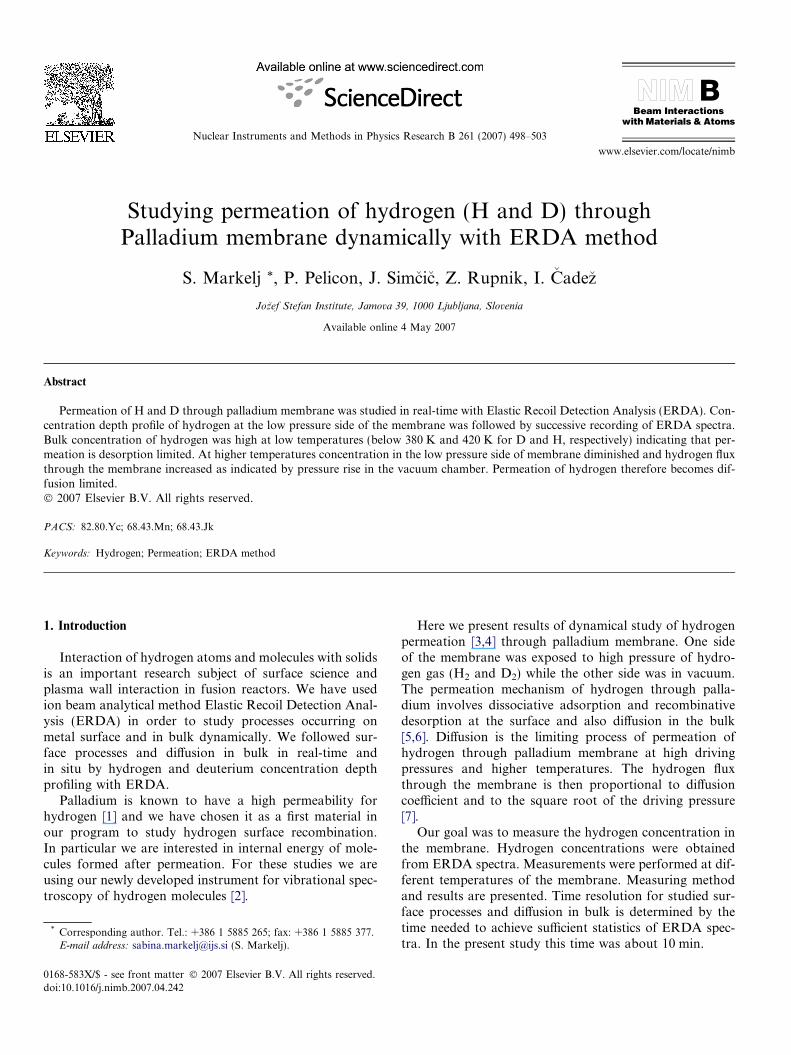
Initial set of measurements was performed with mem-brane exposed to H2 gas. The permeation was first followedat room temperature. ERDA spectra were recorded untilthe accumulated dose of each spectrum was equal to1.7 lC in order to obtain sufficient statistics. SuccessiveERDA spectra labelled with letters in alphabetical orderand corresponding hydrogen concentration depth profilesare shown in Fig. 2(a) and (b), respectively. Spectrum ‘‘a’’was recorded before hydrogen exposure. Spectra ‘‘b’’ and‘‘c’’ indicate temporal increase of hydrogen concentrationat room temperature. Stabilised hydrogen concentrationin palladium membrane was attained in spectrum ‘‘d’’. Sta-bilization of hydrogen concentration was thereforeachieved at the end of the spectrum ‘‘c’’ that lasted around26 min. Temperature was then increased to 338 K duringspectrum ‘‘e’’ (not shown). Spectra from ‘‘f’’ to ‘‘h’’ wererecorded at this temperature and collection of all these spec-tra lasted 1 h. The concentration of H in Pd remained con-stant as is seen in Fig. 2, where spectrum ‘‘h’’ is shown andits corresponding concentration depth profile. SuccessiveERDA spectra and hydrogen concentrations while temper-ature increased from 380 K to 428 K are shown in Fig. 3(a)and (b). Spectra ‘‘m’’ and ‘‘p’’ were measured at stable tem-peratures, whereas temperature was increasing during ‘‘n’’and ‘‘o’’ spectra. Exposure dose and acquisition time ofeach spectrum was 1.7 lC and around 15 min, respectively.As the temperature increased the hydrogen concentration inthe membrane decreased and the pressure in the vacuum
e assembly as mounted in the vacuum chamber. Angles between surfacedetector of recoiled hydrogen atoms are both 75�.
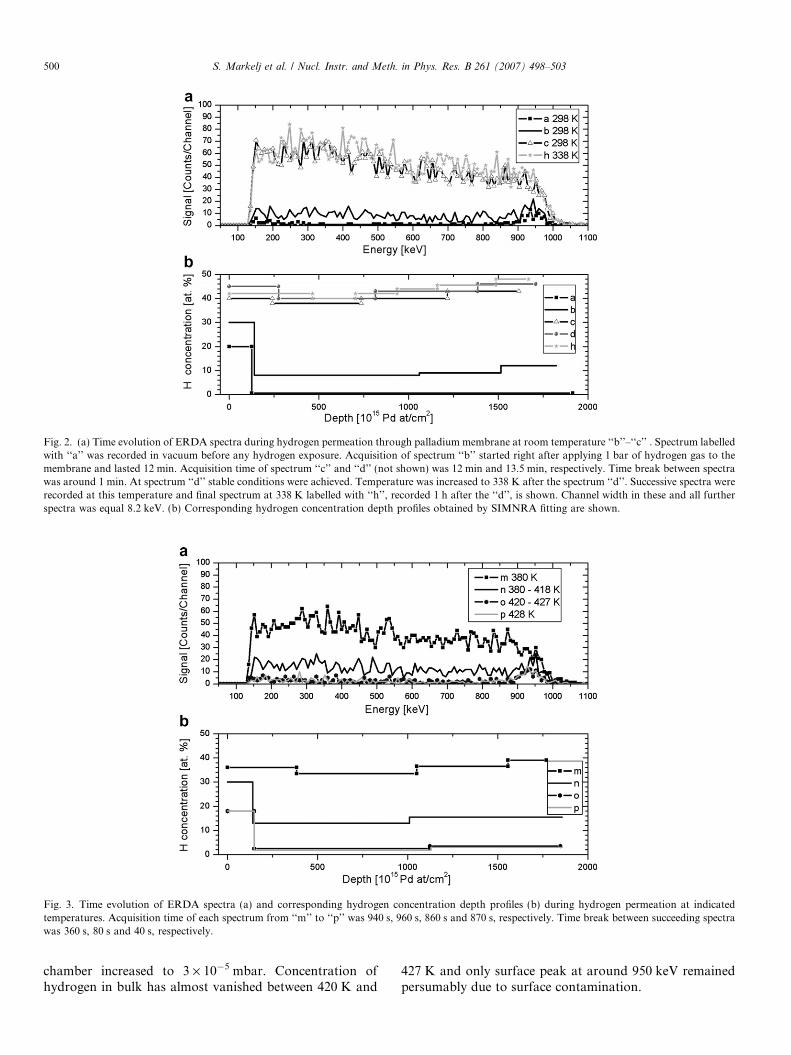
Fig. 2. (a) Time evolution of ERDA spectra during hydrogen permeation through palladium membrane at room temperature ‘‘b’’–‘‘c’’ . Spectrum labelledwith ‘‘a’’ was recorded in vacuum before any hydrogen exposure. Acquisition of spectrum ‘‘b’’ started right after applying 1 bar of hydrogen gas to themembrane and lasted 12 min. Acquisition time of spectrum ‘‘c’’ and ‘‘d’’ (not shown) was 12 min and 13.5 min, respectively. Time break between spectrawas around 1 min. At spectrum ‘‘d’’ stable conditions were achieved. Temperature was increased to 338 K after the spectrum ‘‘d’’. Successive spectra wererecorded at this temperature and final spectrum at 338 K labelled with ‘‘h’’, recorded 1 h after the ‘‘d’’, is shown. Channel width in these and all furtherspectra was equal 8.2 keV. (b) Corresponding hydrogen concentration depth profiles obtained by SIMNRA fitting are shown.
Fig. 3. Time evolution of ERDA spectra (a) and corresponding hydrogen concentration depth profiles (b) during hydrogen permeation at indicatedtemperatures. Acquisition time of each spectrum from ‘‘m’’ to ‘‘p’’ was 940 s, 960 s, 860 s and 870 s, respectively. Time break between succeeding spectrawas 360 s, 80 s and 40 s, respectively.
500 S. Markelj et al. / Nucl. Instr. and Meth. in Phys. Res. B 261 (2007) 498–503
chamber increased to 3 · 10�5 mbar. Concentration ofhydrogen in bulk has almost vanished between 420 K and
427 K and only surface peak at around 950 keV remainedpersumably due to surface contamination.

Fig. 4. Time evolution of ERDA spectra (a) and corresponding deuterium concentration depth profiles (b) during deuterium permeation at roomtemperature. Recording time of each spectrum lasted 9 min and time break between two succeeding spectra was not longer than 1 min.
S. Markelj et al. / Nucl. Instr. and Meth. in Phys. Res. B 261 (2007) 498–503 501
At low temperatures, as shown in Fig. 2, the hydrogenconcentration in the membrane is high and relatively con-stant throughout the analysed depth. Concentration of His presumably constant through the whole Pd membrane.Average H concentration at room temperature and at338 K is 43 atomic % and therefore a ratio of number ofH atoms to the number of Pd atoms is x = 0.75. The pro-cess that prevents atoms to go through the whole mem-brane is recombinative desorption, so the permeation isdesorption-limited, what was already pointed out in [13].At higher temperatures, above 420 K, the concentrationof hydrogen in bulk diminished. The pressure inside thevacuum chamber on the other hand increased, indicatinghydrogen flux trough the membrane. The permeationnow becomes diffusion limited. At low concentrations,x� 1, the Sievert’s law is valid [12,13]ffiffiffi
pp ¼ Ksx; ð1Þ
where p is pressure and Ks is the Sievert’s constant, alsonamed solution constant. Condition is fulfilled in spectrum‘‘p’’ in Fig. 3, where the temperature is 428 K. Averagex = 0.025 and at pressure 1 bar, we get Ks equal 41 atm1/
2. This value is between values that we found in the litera-ture, 73 atm1/2[12] and 33 atm1/2 [13].
More detailed measurements were performed with deu-terium gas at the high pressure side of palladium mem-brane. The time evolution of deuterium concentration inthe same palladium membrane at room temperature wasmeasured first. Exposure dose for each ERDA spectrumwas two times lower than in the case of H measurements,namely 0.86 lC. in order to increase the time resolution.
Recording time for each spectrum was around 9 min. Someof successive ERDA spectra and deuterium depth profile ofeach individual spectrum at room temperature are shownin Fig. 4(a) and (b), respectively. Deuterium surface signalis at around 1650 keV, while signal from D ions comingfrom the bulk is at lower energy. A small peak at around950 keV is due to hydrogen on the surface and there issmall H content also in the bulk during exposure to D2,due to prior membrane exposure to H2. H concentrationwas equal for all spectra at room temperature, namely 5atomic % throughout the analyzing depth. The D concen-tration stabilized after spectrum ‘‘h’’. Time required forthe stabilization was equal 57 min what was longer thanin the case of H2 exposure. Constant concentration of D,40 atomic % (x = 0.66), was presumed throughout theregion where H and D signals are superimposed. The mem-brane temperature was increased to 333 K afterwards.Deuterium concentration depth profiles of successiveERDA spectra are shown in Fig. 5. Deuterium concentra-tion has increased a little. Stabilized D concentration is56 atomic % which yields the value of x equal 1.27. Themembrane temperature was increased from 333 K to380 K, during recording the spectrum labelled with ‘‘o’’.Concentration depth profile of this spectrum is shown inFig. 6. Successive spectra from ‘‘n’’ to ‘‘u’’ were recordedat 380 K and corresponding evaluated D concentrationdepth profiles are shown in Fig. 6. Deuterium concentra-tion decreased at this temperature.
Permeation of D through the membrane is similar to Hconcerning high hydrogen concentration in the bulk at lowtemperature and low concentrations at high temperature.
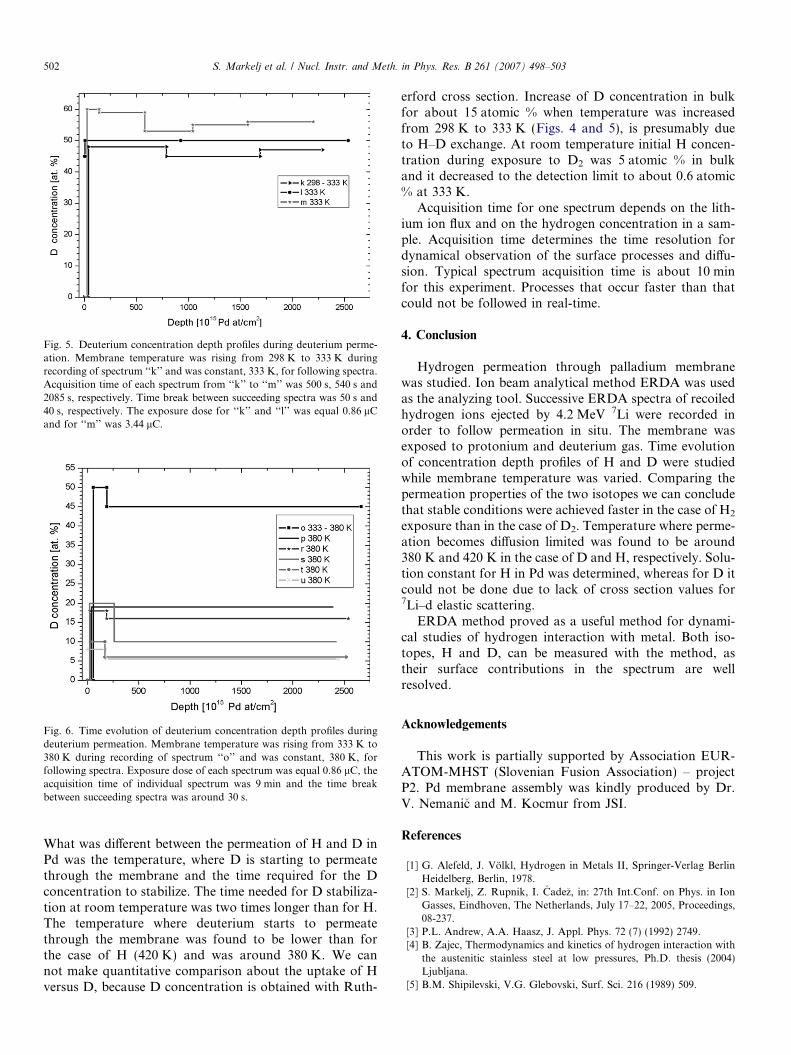
Fig. 5. Deuterium concentration depth profiles during deuterium perme-ation. Membrane temperature was rising from 298 K to 333 K duringrecording of spectrum ‘‘k’’ and was constant, 333 K, for following spectra.Acquisition time of each spectrum from ‘‘k’’ to ‘‘m’’ was 500 s, 540 s and2085 s, respectively. Time break between succeeding spectra was 50 s and40 s, respectively. The exposure dose for ‘‘k’’ and ‘‘l’’ was equal 0.86 lCand for ‘‘m’’ was 3.44 lC.
Fig. 6. Time evolution of deuterium concentration depth profiles duringdeuterium permeation. Membrane temperature was rising from 333 K to380 K during recording of spectrum ‘‘o’’ and was constant, 380 K, forfollowing spectra. Exposure dose of each spectrum was equal 0.86 lC, theacquisition time of individual spectrum was 9 min and the time breakbetween succeeding spectra was around 30 s.
502 S. Markelj et al. / Nucl. Instr. and Meth. in Phys. Res. B 261 (2007) 498–503
What was different between the permeation of H and D inPd was the temperature, where D is starting to permeatethrough the membrane and the time required for the Dconcentration to stabilize. The time needed for D stabiliza-tion at room temperature was two times longer than for H.The temperature where deuterium starts to permeatethrough the membrane was found to be lower than forthe case of H (420 K) and was around 380 K. We cannot make quantitative comparison about the uptake of Hversus D, because D concentration is obtained with Ruth-
erford cross section. Increase of D concentration in bulkfor about 15 atomic % when temperature was increasedfrom 298 K to 333 K (Figs. 4 and 5), is presumably dueto H–D exchange. At room temperature initial H concen-tration during exposure to D2 was 5 atomic % in bulkand it decreased to the detection limit to about 0.6 atomic% at 333 K.
Acquisition time for one spectrum depends on the lith-ium ion flux and on the hydrogen concentration in a sam-ple. Acquisition time determines the time resolution fordynamical observation of the surface processes and diffu-sion. Typical spectrum acquisition time is about 10 minfor this experiment. Processes that occur faster than thatcould not be followed in real-time.
4. Conclusion
Hydrogen permeation through palladium membranewas studied. Ion beam analytical method ERDA was usedas the analyzing tool. Successive ERDA spectra of recoiledhydrogen ions ejected by 4.2 MeV 7Li were recorded inorder to follow permeation in situ. The membrane wasexposed to protonium and deuterium gas. Time evolutionof concentration depth profiles of H and D were studiedwhile membrane temperature was varied. Comparing thepermeation properties of the two isotopes we can concludethat stable conditions were achieved faster in the case of H2
exposure than in the case of D2. Temperature where perme-ation becomes diffusion limited was found to be around380 K and 420 K in the case of D and H, respectively. Solu-tion constant for H in Pd was determined, whereas for D itcould not be done due to lack of cross section values for7Li–d elastic scattering.
ERDA method proved as a useful method for dynami-cal studies of hydrogen interaction with metal. Both iso-topes, H and D, can be measured with the method, astheir surface contributions in the spectrum are wellresolved.
Acknowledgements
This work is partially supported by Association EUR-ATOM-MHST (Slovenian Fusion Association) – projectP2. Pd membrane assembly was kindly produced by Dr.V. Nemanic and M. Kocmur from JSI.
References
[1] G. Alefeld, J. Volkl, Hydrogen in Metals II, Springer-Verlag BerlinHeidelberg, Berlin, 1978.
[2] S. Markelj, Z. Rupnik, I. Cadez, in: 27th Int.Conf. on Phys. in IonGasses, Eindhoven, The Netherlands, July 17–22, 2005, Proceedings,08-237.
[3] P.L. Andrew, A.A. Haasz, J. Appl. Phys. 72 (7) (1992) 2749.[4] B. Zajec, Thermodynamics and kinetics of hydrogen interaction with
the austenitic stainless steel at low pressures, Ph.D. thesis (2004)Ljubljana.
[5] B.M. Shipilevski, V.G. Glebovski, Surf. Sci. 216 (1989) 509.

S. Markelj et al. / Nucl. Instr. and Meth. in Phys. Res. B 261 (2007) 498–503 503
[6] E. Fromm, Kinetics of Metal–Gas Interactions at Low Temperatures,Springer-Verlag Berlin Heidelberg, Berlin, 1998.
[7] P.L. Andrew, A.A. Haasz, J. Appl. Phys. 70 (7) (1991) 3600.[8] P. Pelicon, A. Razpet, S. Markelj, I. Cadez, M. Budnar, Nucl. Instr.
and Meth. B 227 (2005) 591.[9] <http://www.rzg.mpg.de/~mam/>.
[10] Z. Siketic, I. Bogdanovic Radovic, H. Muto, M. Jaksic, Nucl. Instr.and Meth. B 229 (2005) 180.
[11] S. Markelj, M. Lipoglavsek, P. Pelicon, I. Cadez, in preparation.[12] Y. Fukai, The Metal–Hydrogen System, Springer-Verlag Berlin
Heidelberg, Berlin, 2005.[13] T.L. Ward, T. Dao, J. Membrane Sci. 153 (1999) 211.
Related Documents