Written by Marco Caliendo, Jochen Kluve, Jonathan Stöterau, and Stefan Tübbicke with contributions from Claire Dheret, Kari Hadjivassiliou and Francesco Pastore November - 2018 Social Europe Study on the Youth Guarantee in light of changes in the world of work Part 1 Youth Guarantee: Intervention Models, Sustainability and Relevance

Welcome message from author
This document is posted to help you gain knowledge. Please leave a comment to let me know what you think about it! Share it to your friends and learn new things together.
Transcript

Written by Marco Caliendo Jochen Kluve Jonathan Stoumlterau
and Stefan Tuumlbbicke with contributions from Claire Dheret
Kari Hadjivassiliou and Francesco Pastore
November - 2018
Social Europe
Study on the Youth Guarantee in
light of changes in the
world of work
Part 1
Youth Guarantee Intervention Models Sustainability
and Relevance
The Youth Guarantee in light of changes in the world of work Youth Guarantee Intervention Models Sustainability and Relevance
EUROPEAN COMMISSION
Directorate-General for Employment Social Affairs and Inclusion Directorate B mdash Employment Unit B1mdash Employment Strategy
Contact Pablo Cornide
E-mail EMPL-PES-SECRETARIATeceuropaeu
European Commission B-1049 Brussels
The Youth Guarantee in light of changes in the world of work Youth Guarantee Intervention Models Sustainability and Relevance
Directorate-General for Employment Social Affairs and Inclusion European Network of Public Employment Services (PES)
Study on the Youth Guarantee in light of changes in the
world of work
Part 1
Youth Guarantee Intervention Models Sustainability
and Relevance
The Youth Guarantee in light of changes in the world of work Youth Guarantee Intervention Models Sustainability and Relevance
1
LEGAL NOTICE
This document has been prepared for the European Commission however it reflects the views only of the authors and the Commission cannot be held responsible for any use which may be made of the information contained therein
More information on the European Union is available on the Internet (httpwwweuropaeu)
Luxembourg Publications Office of the European Union 2018
ISBN 978-92-79-99983-3 doi 102767371432
copy European Union 2018 The European Network of Public Employment Services was created following a Decision of the European Par-liament and Council in June 20141 Its objective is to reinforce PES capacity effectiveness and efficiency This activity has been developed within the work programme of the European PES Network For further information httpeceuropaeusocialPESNetwork
This publication has received financial support from the European Union Programme for Employment and Social Innovation EaSI (2014-2020) For further information please consult httpeceuropaeusocialeasi
1 DECISION No 5732014EU
Europe Direct is a service to help you find answers
to your questions about the European Union
Freephone number ()
00 800 6 7 8 9 10 11
() The information given is free as are most calls (though some operators phone boxes or hotels may charge you)
The Youth Guarantee in light of changes in the world of work Youth Guarantee Intervention Models Sustainability and Relevance
2
Table of contents
1 The Youth Guarantee background and outline of the study 6 11 The youth employment challenge in the European Union 6 12 The Youth Guarantee 8 13 Outline of the project and the present report 9
2 Implementation features of the YG and related indicators 10 21 Features of Youth Guarantee implementation 10
211 Financial resources for implementing the Youth Guarantee 10 212 The Youth Guarantee as part of national policy-making 14 213 Youth labour market challenges 17 214 The heterogeneity of the NEET population 21 215 Design and implementation features of the Youth Guarantee 24 216 The role of the apprenticeship system in the Youth Guarantee 26
22 Empirical indicators of Youth Guarantee features 28 221 Indicator set 1 Financial resources for implementing the Youth Guarantee 28 222 Indicator set 2 The Youth Guarantee as part of national policy-making 29 223 Indicator set 3 Youth labour market challenges 30 224 Indicator set 4 The heterogeneity of the NEET population 31 225 Indicator set 5 Design and implementation features of the Youth Guarantee 31 226 Indicator set 6 The role of the apprenticeship system in the Youth Guarantee 32
23 Conclusion 32
3 Typology of Youth Guarantee models 33 31 Empirical approach to establishing Youth Guarantee models 33 32 Description of first-step clusters 34
321 Indicator set 1 Financial resources 34 322 Indicator set 2 Youth Guarantee as part of national policy-making 34 323 Indicator set 3 Youth labour market challenges 35 324 Indicator set 4 The heterogeneity of the NEET population 35 325 Indicator set 5 Design and implementation features of the Youth Guarantee 36 326 Indicator set 6 The apprenticeship system 36 327 Summary of first-step cluster analysis 37
33 Results and discussion of second-step clusters 38 34 Conclusion of second-step clusters 41 35 Measures of performance 41 36 Assessing the correlation between Youth Guarantee models and performance 44
4 Summary and conclusions 46
References 49
Annex 53
The Youth Guarantee in light of changes in the world of work Youth Guarantee Intervention Models Sustainability and Relevance
3
List of Figures
Figure 1 Youth unemployment rates (15-24 years old) in EU Member States 2015 compared to 2018 7 Figure 2 Rates of young people (15-24 years old) not in employment education or training (NEET) in EU Member States 2015 2017 8 Figure 3 Absolute number of youth-related active labour market reforms between 2013 and 2016 14 Figure 4 Composition of the EU NEET population (percentage of the population of young people) 23 Figure 5 Number of indicators identified by variable set 33 Figure 6 YG-monitoring data performance indicators by Member States 43 Figure 7 Eurostat performance indicators by Member States 44 Figure 8 YG monitoring data performance indicators by clusters 45 Figure 9 Aggregate performance measures 46
List of Tables
Table 1 Overview of actors involved in implementing the YG in 10 Member States 16 Table 2 Summary of Results of Cluster Analysis 38 Table 3 List of indicators 53 Table 4 Outcome cluster means 57
The Youth Guarantee in light of changes in the world of work Youth Guarantee Intervention Models Sustainability and Relevance
4
Executive summary
The economic recession following the financial crisis and its prolonged aftermath com-
pounded the challenge that substantial youth unemployment put on the Member States
of the European Union In addition changes in the world of work for example increas-
ingly complex school-to-work transitions and new challenges arising from rapid techno-
logical changes may further impede the labour market prospects of young people
The Youth Guarantee (YG) was launched as a Council Recommendation adopted by all
Member States in 2013 in particular as a response to the high cyclical unemployment
among its youth The YG meant that all young people aged between 15 and 24 would
receive a good quality offer of employment training education or apprenticeship within
a period of four months of becoming unemployed or leaving formal education Following
this recommendation EU Member States took steps to introduce such a scheme albeit
with widely varying national approaches on (among many other differences) target
groups timing the types of interventions used and the types of partnerships
This report synthesises the vast amount of available information on the implementation
of the YG and its performance Based on an extensive desk research in its first part the
study identifies six key aspects of YG implementation and delivery as well as background
characteristics that are important determinants of YG performance across Member
States specifically these are (1) the financial resources for implementing the YG (2)
the role of the YG as part of national policy making (3) challenges for the youth labour
market (4) the heterogeneity of the NEET population (5) the design and implementa-
tion features of the YG and (6) the role of the apprenticeship system in the Youth Guar-
antee The overall findings of desk research and data analysis indicate that in sum EU
funding via the Youth Employment Initiative (YEI) and the European Social Fund (ESF)
played a key role in supporting YG measures financially especially for countries suffering
from simultaneously high NEET rates and a significant economic downturn or structural
labour market challenges Many of these countries increased spending on active labour
market policies which can be interpreted with caution as an indirect effect of the YG In
some Member States the YG also fostered the introduction of reforms to national youth
policies improvements in monitoring systems for youth activation policies and the
building of new partnerships These changes are likely to outlast the YG initiative and
thereby provide sustained and ongoing benefits
Whereas these are substantive positive changes brought about by the YG not all of its
objectives were achieved First neither reducing labour market segmentation through
quality offers nor providing a remedy for imperfectly performing education systems was
fully achieved One reason was a prevalence of employment offers compared to relative-
ly few education or apprenticeship offers in the YG The low share of apprenticeship of-
fers in some Member States appears to be related to the institutional setup and school-
to-work (STW) transition regime increasing the prominence of the apprenticeship sys-
tem would need to be accompanied by broader institutional change Second several
Member States were not able to fully address the heterogeneity of the NEET population ndash
especially those furthest away from the labour market In contrast countries that per-
formed well generally improved the capacity of their Public Employment Services (PES)
and developed partnerships to implement strong outreach programmes
The second part of the study builds on the six key aspects to develop a Youth Guarantee
typology this novel approach uses cluster analysis techniques to identify groups of simi-
lar countries This analysis highlights several insights for the implementation of the
Youth Guarantee across Member States firstly country clusters within the single key
aspects are not always the same as the final country clusters for all six key aspects
Second certain contextual and implementation variables are clearly correlated suggest-
The Youth Guarantee in light of changes in the world of work Youth Guarantee Intervention Models Sustainability and Relevance
5
ing that some implementation features relate to each other for instance some countries
with a low estimated cost for implementing the YG tend to be countries that closely fol-
lowed the Recommendation in particular in terms of timing of the intervention and tar-
get groups chosen Other Member States with a more pronounced NEET challenge are
more likely to deviate from the recommendation for example by increasing the targeted
time frame of intervention
The most comprehensive version of the cluster analysis simultaneously takes into ac-
count all six key aspects and a total of 76 empirical indicators that properly reflect these
key aspects and identifies five final clusters
Cluster A Member States with previous YG experience lower initial NEET rates ambi-
tious implementation and improved PES capacity low educated NEETs and diversified
offers (AT DK DE FI IE NL SE)
Cluster B Member States with intermediate NEET challenges strong outreach efforts by
the PES relatively poor monitoring data quality high NEET rates due to family responsi-
bilities and strong focus on employment offers (CZ EE FR HU RO UK)
Cluster C Member States hit by the economic recession with highest initial NEET rates
severe long-term unemployment large support via EU funding highest reform efforts
and highest entry rates into apprenticeship offers (CY EL ES IT PT)
Cluster D Member States characterised by relatively low initial NEET rates and short-
term unemployed rather than inactive NEETs some funding under YEI strong outreach
efforts through the PES and partnership approach and diversified offers with a stronger
focus on education offers (BE MT LT LU PL SI)
Cluster E Member States that joined the EU relatively recently with lsquotransitionalrsquo STW
regimes high initial NEET rates structural challenges and substantial EU funding focus
on employment offers rather high reform efforts (BG HR LV SK)
Evidently these explicit labels for the clusters tend to simplify the other factors of heter-
ogeneity across Member States that determine the typology However some conclusions
can be drawn regarding the fit of underlying challenges to be addressed with the policy
response observed In particular it appears that countries in Cluster A C and D reflected
the challenges observed in the design and implementation of the YG to a higher degree
compared to cluster B and E as policies implemented ndash for example regarding outreach
efforts ndash seem to better match key factors of heterogeneity in the NEET population
In a final step the study investigates the YG models resulting from the typology and
basic performance indicators Cluster A performs well in terms of the NEET ldquocoveragerdquo
rate but less well regarding the reduction in NEET and unemployment rates over time
Clusters B and D perform relatively similar across all YG outcome measures Cluster C
shows the largest share of youth in the preparatory phase beyond the envisaged four
months but also the largest median decline in NEET rates Cluster E has the lowest share
of positive and timely exits but the largest decline in youth unemployment out of all clus-
ters
Whereas therefore the evidence is not fully conclusive partly due to the number and
complex inter-relation of the aspects in which clusters differ the reportrsquos findings none-
theless clearly indicate that not only initial conditions but also the way Member States
implement the YG has affected its success
The Youth Guarantee in light of changes in the world of work Youth Guarantee Intervention Models Sustainability and Relevance
6
1 The Youth Guarantee background and outline of the
study
An essential aim of the policies that promote economic growth and social equity is to
ensure that young people are adequately educated that they enter the labour market
smoothly and that they then continue successfully through a lifetime in employment
through till retirement Young people face a wide range of structural challenges ndash fre-
quently perceived as increasingly complex ndash regarding their school-to-work (STW) tran-
sition and their long-term labour market prospects (Quintini et al 2007)
The economic recession of the late 2000s and its aftermath exacerbated these challeng-
es while the on-going Fourth Industrial Revolution comprising innovations in digitalisa-
tion artificial intelligence and robotics is constantly generating new and potentially fun-
damental challenges In general these developments have resulted in the following pat-
terns (i) a dramatic rise of youth unemployment in most countries during the recession
together with relatively low employment rates (ii) lengthier complex unstable and
non-linear STW transitions (iii) a deterioration in the quality of youth employment com-
bined with greater precariousness (iv) the patchy availability of quality work experience
which increasingly plays a crucial role in STW transitions (v) increased inactivity dis-
couragement and labour market detachment and (vi) greater labour market vulnerabil-
ity for disadvantaged youth such as the low-skilled migrants and young people with a
disability and more generally young people not in employment education or training
(NEETs)
While the wider macro-economic situation including business cycle fluctuations together
with the recession-related economic deterioration of the late 2000s and the subsequent
lsquojob-poorrsquo recovery accounts for these developments they are also rooted in persistent
structural deficiencies These include imperfectly performing education and training sys-
tems with poor outcomes and ensuing skills mismatches and segmented labour markets
(resulting in hollowing-out and skill polarisation) Sometimes poor PES (Public Employ-
ment Service) resources prevent the provision of youth-related tailored services in gen-
eral and in particular concentrating appropriate resources on vulnerable hard-to-reach
young people including certain sub-groups of NEETs (European Commission 2017a)
Yet unsatisfactory early labour market experience and lengthy unstable STW transitions
can lead to long-term lsquoscarringrsquo effects on young people in terms of reduced lifetime
earnings a higher probability of subsequent periods of unemployment a greater likeli-
hood of precarious employment and poorer health and well-being (Gregg and Tominey
2005 Scarpetta et al 2010 European Commission 2017a)
The remainder of this section describes the youth unemployment situation in the Euro-
pean Union (EU) and the challenges it poses for youth generally It also introduces the
Youth Guarantee (YG) and it summarises the joint response to these challenges under-
taken in the EU An explanation of the objectives and content of the present report as
well as the project in general concludes this section
11 The youth employment challenge in the European Union
In the second quarter of 2018 as many as approximately 34 million out of a total of
about 57 million young people in the 15-24 age group were unemployed in the EU (lat-
est available data from Eurostat) Whereas this constitutes a substantial decline from the
peak of 57 million in January 2013 the numbers still remain high the average youth
unemployment rate ndash ie the percentage of unemployment in the 15-24 age group com-
pared to the total labour force in that age group ndash stood at 168 in 2017 in the EU 28
The Youth Guarantee in light of changes in the world of work Youth Guarantee Intervention Models Sustainability and Relevance
7
and the NEET rate (the share of young people neither in employment nor in education or
training) was 109 If young people up to 29 years of age are included the average
rate of youth unemployment in the EU 28 was 127 while the NEET rate reached
134 (amounting to 177 specifically within the 25-29 age bracket) Figures 1 and 2 show the numbers for the 15-24 age group and illustrate the policy chal-
lenge of the youth unemployment rate (Figure 1) and the NEET rate (Figure 2) They
also show the substantial variation across EU countries as Figure 1 shows the youth
unemployment rate (Q2 2018) is below 10 in Austria Germany Estonia Denmark the
Netherlands the Czech Republic and Hungary In the majority of EU countries however
it ranges from 10 to 20 while it is above 30 and up to almost 40 in Italy Spain
and Greece Looking specifically at the most recent development by comparing it with
the Q2 2015 youth unemployment rate however the figure also shows a general down-
ward trend across all EU Member States which is quite pronounced in some countries
(Bulgaria Croatia Malta and Hungary for example)
Looking at the NEET rates in Figure 2 this downward trend in the most recent develop-
ment comparing 2015 and 2017 is also clearly visible Again there is notable variation
across Member States On average EU countries have a NEET rate of around 109 as
of 2017 and Ireland and Poland have NEET rates close to the EU average While the
Netherlands is the only EU country with a rate below 5 Croatia Romania Bulgaria
and Italy have the highest NEET rates with the rate reaching almost 20 in Italy
Figure 1 Youth unemployment rates (15-24 years old) in EU Member States
2015 compared to 2018
Source Authorsrsquo illustration based on latest available Eurostat data youth unemployment rate as percentage
of the active population quarterly average Countries are ordered by Q2 2015 rates Data is seasonally adjust-
ed For Italy and Cyprus the Q1 2018 rates are reported (latest available)
0
5
10
15
20
25
30
35
40
45
50
DE EE AT
DK
NL
CZ
MT LV UK LT SI LU HU IE
EU28 P
L
SE BE
RO FI BG FR SK PT
CY IT HR ES EL
2015Q2 2018Q2
The Youth Guarantee in light of changes in the world of work Youth Guarantee Intervention Models Sustainability and Relevance
8
Figure 2 Rates of young people (15-24 years old) not in employment educa-
tion or training (NEET) in EU Member States 2015 2017
Source Authorsrsquo illustration based on latest available Eurostat data annual averages Countries are in order of
the 2015 rates
In addition to these aggregate statistics the difficulties for youth in the STW transition
can be related to several structural challenges or market failures In particular these
concern (a) Labour market segmentation ndash a labour market pattern in which young
people are over-represented in temporary part-time non-permanent work (b) (under-)
performance of the education and training system ndash the low achievement of a substantial
section of youth in basic and lsquotransversalrsquo (transferable) skills (c) the limited availability
of lsquoqualityrsquo work experience and (d) insufficient capacity of the Public Employment Ser-
vice (PES) to ensure effective provision of tailored services and support for young people
(see European Commission 2017a)
12 The Youth Guarantee
The significant challenges that young people face in relation to fast smooth and effec-
tive STW transitions were exacerbated during and after the recession Since then they
have also acted as a catalyst for policy change in many Member States Accordingly a
YG was introduced following the 2013 Council Recommendation (Council of the European
Union 2013) Together with associated structural reforms of vocational education and
training (VET) and activation policies that are implemented across the EU its aim is to
address these challenges More specifically following a proposal from the European
Commission all Member States adhered to the establishment of the YG committing
themselves to giving every young person a good-quality offer of employment continuing
education or an apprenticeship or a traineeship within a period of four months of be-
coming unemployed or leaving formal education (Council of the European Union 2013)
The idea of YG style policies originated in the Nordic countries where such initiatives
were first implemented in Sweden in 1984 and then elsewhere in the 1990s (Norway in
1993 Denmark and Finland in 1996 see for example Escudero and Loacutepez Mourelo
2017)
In a Communication published three years after the launch of the YG by the European
Commission (2016a) it was observed that the YG had become a reality across the EU
Starting from January 2014 14 million young people had already registered in YG
schemes by 2016 Around nine million young people had taken up an offer the majority
0
5
10
15
20
25N
L
DK
DE
LU SE CZ
AT LT SI
MT LV FI EE PL
UK PT
HU
EU2
8 FR BE SK IE CY ES EL HR
RO
BG IT
2015 2017
The Youth Guarantee in light of changes in the world of work Youth Guarantee Intervention Models Sustainability and Relevance
9
of which were offers of employment almost two thirds of young people who left the YG
in 2015 took up an offer of employment education traineeship or apprenticeship While
the Commission Communication also concluded that the YG has significantly facilitated
structural reforms and innovation in policy design across Member States it also asserted
that nonetheless youth unemployment remained unacceptably high and many chal-
lenges still need to be addressed by Member States
13 Outline of the project and the present report
The main objective of this project is to undertake an up-to-date review of the current
approaches and implementation of the YG especially in view of new challenges for youth
in the changing world of work thereby providing the basis for a future YG model that is
both robust and dynamic
This report constitutes the first phase of the research project In the first phase a com-
prehensive desk review of existing documents and data was undertaken together with
the construction of a database of indicators for a cluster analysis as well as supplemen-
tary country case studies This approach is explained and implemented throughout this
report Aspects that guide the analysis are 1) the degree to which EU financing helped
to implement the YG 2) whether the YG became a sustainable part of national policy
making 3) the main challenges faced by young people in their transition into the labour
market 4) the heterogeneity of the NEET population 5) the design and implementation
features of the YG and 6) the role of apprenticeships in the YG Based on these insights
a typology of YG models is developed and the correlation of these types is assessed re-
garding measures of performance
The second phase of the research project will address the emerging challenges for young
peoplersquos transition into the world of work drawing extensively on consultation with
stakeholders both through an online survey and more importantly through a stakehold-
er seminar held in Brussels on Oct 1 2018 during which experiences with the YG were
exchanged and future challenges identified and discussed The results of this second
phase will be published in a separate report2 Together these two reports should inform
reflection on further developments of the YG
The report at hand is structured as follows Section 2 has two parts the first part identi-
fies the main characteristics of YG implementation in context while the second part de-
fines empirical indicators for these characteristics and their sub-dimensions In section 3
these indicators are used for constructing a typology of YG models also showing how the
different types of models differ regarding performance indicators Section 4 presents the
conclusions of the analysis
2 European Commission (forthcoming) The Youth Guarantee in light of changes in the world of work Emerging challenges related to young peoplersquos transition in the labour market
The Youth Guarantee in light of changes in the world of work Youth Guarantee Intervention Models Sustainability and Relevance
10
2 Implementation features of the YG and related indica-
tors
This section provides a comprehensive overview of the main features that characterise
YG implementation and assess the main features that are likely to determine its success
in Member States It has two steps first section 21 gives an overview of the relevant
dimensions of YG implementation along the six guiding aspects outlined above Based on
this characterisation section 22 discusses the ways in which each of these aspects can
be represented by a set of empirical indicators and which will be used in chapter 3 for a
YG typology The list of indicators for each of the six aspects comprise key contextual
characteristics for each Member State as well as implementation-related features such as
partnerships created as a result of YG implementation or the types of interventions
used In particular indicators that characterise Member States at the outset of the YG
(measured in 2012 or 2013) as well as the way the YG was implemented (mostly meas-
ured up until 2016) inform the typology Indicators of YG performance such as for ex-
ample the estimated proportion of the NEET population reached by the YG (the so-called
YG ldquocoverage raterdquo) are considered outcomes of the way Member States implemented
the YG
The presentation and discussion of intervention features and corresponding empirical
indicators in section 2 is complemented by selected information from five brief country
case studies The case studies are a supplementary element in the review exercise that
feeds into this chapter and they are meant to illustrate the intervention features dis-
cussed throughout the chapter in more detail for selected countries Based on an lsquoex
ante assessmentrsquo of a set of qualitative and quantitative country indicators the following
five countries were selected for case studies Austria Denmark Ireland Italy and Lat-
via The countries were selected firstly to cover (to the extent that is possible) the ex-
isting types of STW regimes and secondly to reflect the heterogeneity of the NEET popu-
lation NEET implementation is characterised by high and low NEET and youth unem-
ployment rates high and low YG coverage and the financial resources put into its im-
plementation3
21 Features of Youth Guarantee implementation
211 Financial resources for implementing the Youth Guarantee
The YG is not a funding programme in itself It is instead a political commitment sup-
ported among other ways by financial contributions from the EU and national budgets
as well as contributions from the private and non-profit sectors This section on the first
YG implementation aspect financial resources briefly outlines the relevance of these
different sources Specific focus will be given to the Youth Employment Initiative (YEI)
and the European Social Fund (ESF) as the main EU sources to financially underpin the
implementation of the YG
Youth Employment Initiative The YEI was established during three informal summits of
EU Heads of State in 2013-14 and then given euro32 billion for the 2014-15 period Eligi-
bility for measures funded through the YEI is confined to young people aged 16-254 who
3 It is important to emphasise the lsquoex-antersquo nature of case study selection they were chosen based on a preliminary set of indicators at the outset of the study whereas the full in-depth identi-fication and discussion of indicators ndash as presented in this chapter ndash and their analysis in Chapter 3
becomes a key element of the study itself 4 The upper age band is 29 in some Member States
The Youth Guarantee in light of changes in the world of work Youth Guarantee Intervention Models Sustainability and Relevance
11
are not in employment education or training (lsquoNEETsrsquo) Funding from the YEI was only
allocated to regions in those Member States where youth unemployment was higher than
25 in 20125 Since national allocations are based on the number of unemployed young
people in 2012 in these regions YEI funds were allocated to a varying extent to each
Member State based on their (regional) unemployment rates (European Commission
2016a) Spain was the largest recipient of the initial YEI specific allocation receiving
euro9435 million and Slovenia the smallest receiving euro92 million In 2015 in view of the
immensity of the youth-employment challenge the European Commission took steps to
ensure a quick mobilisation of its funds6 Specifically a higher pre-financing rate for the
euro32 billion YEI specific allocation in 2015 than for other ESF allocations (30 instead of
the original 1-15 of the specific allocation for other ESF funds) was introduced
This led to an amount of around euro1 billion in additional pre-financing to Member States
in 2015 (European Commission 2016a) In the summer of 2017 during the mid-term
review of the EUrsquos seven-year budget the YEI was extended until 2020 and it received
an additional financial allocation of euro12 billion In addition it was targeted at regions
where youth unemployment still exceeded 25 in 2016 (Andor and Veselyacute 2018) Ac-
cording to the Commissionrsquos report in October 2016 the YEI is seen by Member States
as a key mechanism through which to operationalise national Youth Guarantee schemes
ldquoIn some cases the YEI is being used to support most or all measures planned under the
YG schemes while in others it is one funding source amongst others Countries where
large shares of YG funding comes from the YEI include Lithuania ndash where 23 of all YG
actions are supported by the YEI Poland ndash where 34 of all YG actions YEI funded and
Spain ndash where 80 of all YG actions are funded through the YEIrdquo (European Commis-
sion 2016b p89)
YEI funds were provided from the EU budget as a top-up to the already available ESF
funds for 2014-2020 to provide additional support for programmes with a specific focus
on NEETs (European Court of Auditors 2017) However the funding allocated to each
Member State under the YEI has to be matched by an equal amount from the respective
Member State allocations in the ESF 2014-20 budget This holds for the initial allocation
in 2013 as well as the additional funds in 2017 Hence the total budget of the YEI (for
all eligible EU Member States) now totals euro88 billion for the period 2014-2020
European Social Fund In addition to ESF funds that were directly used to match the YEI
contributions (see above) some Member States also utilised additional funds from the
ESF for further employment-related programmes7 directly or indirectly benefiting youth
but with no specific focus on NEETs In contrast to YEI funds which are intended to di-
rectly support NEETs ESF funds may also be used to support structural reforms In total
Andor and Veselyacute (2018) estimate that approximately euro14-15 billion from the EU budget
over the period 2014-20 financed the implementation of the YG through the YEI and ESF
5 The exact methodology for allocating Youth Employment Initiative funds among Member States is set out in Annexe VIII to the lsquoCommon Provisions Regulationrsquo ie Regulation (EU) No 13032013 of 17 December 2013 OJ L 347 20122013 p 320ndash469
6 An additional reason was that many Member States ldquoraised the issue that they dont have the national budget necessary to pay advance funding to projects working with young peoplerdquo (source httpeuropaeurapidpress-release_MEMO-15-5020_enhtm)
7 The ESF is Europersquos main instrument for supporting jobs helping people get better jobs and en-suring fairer job opportunities for all EU citizens (European Parliament 2018)
The Youth Guarantee in light of changes in the world of work Youth Guarantee Intervention Models Sustainability and Relevance
12
funds8 This is a significant share of the total ESF funding of euro864 billion available to MS
for the 2014-2020 period (including the YEI)
Country case study Austria
Young people in Austria were already benefiting from special attention before the intro-
duction of the YG Several measures were set up to facilitate the transition from educa-
tion to the labour market in particular through a well-established apprenticeship sys-
tem Reducing the age for early school-leaving existed before the 2013 Council Recom-
mendation The long-standing existence of policy measures for young people is reflected
in Austriarsquos relatively successful performance as regards youth employment and STW
transition The labour market situation of young people in Austria is better than the EU
average and it continues to improve The rate of youth unemployment (15-24 years old)
went down from 106 in 2015 to 98 in 2017 which is significantly below the EU
average (168) This good performance is also reflected in the number of NEETs The
NEET rate in Austria was at 65 in 2017 well below the EU average (109)
In addition evidence shows that Austria is performing better than the rest of the EU as
regards its YG implementation (European Commission 2018a) It is acknowledged that
Austria has established a comprehensive Youth Guarantee based on effective partner-
ships targeted policy measures and a robust monitoring system with interconnected
administrative data (European Commission 2016a) The countryrsquos performance is par-
ticularly outstanding in two dimensions the NEET coverage and the delivery of a good
quality offer
Data for 2016 shows that an estimated 829 of NEETs in Austria are reached by the
YG which is the highest figure amongst Member States and almost double the EU aver-
age (425)9 In addition this ldquocoverage indicatorrdquo has been at consistently high levels
since the start of the YG A second more suggestive but somewhat less reliable way of
looking at the performance of a YG scheme is trying to estimate the rate of recycling
ie the percentage of NEETS entering the YG with previous YG experience10 This recy-
cling rate is rather high in Austria (739 compared to 341 for EU 28) suggesting
that employment services have little difficulty in lsquostaying in touchrsquo with young people
who already had a YG experience
The Austrian YG provides a wide range of offers (European Commission 2016d) It
comprises apprenticeship traineeship education and employment offers that are tar-
geted specifically at young people such as for example supra-company apprentice-
ships or production schools Additionally the general education training apprenticeship
and employment offers are open to young people
At the same time it is to be noted that Austria still faces difficulties in integrating cer-
tain sub-groups into the labour market in particular women migrants and young peo-
8 This figure is slightly higher than the euro127 billion stated by the Commission in its October 2016 report which YEI and the ESF are directly investing in ldquolabour market integration measures for young people in the programming period 2014-2020rdquo (European Commission 2016a p 12)
9 These figures are based on the indicator average annual stock of young people in the YG pre-paratory phase NEET population (annual average) included in the Indicator Framework for Moni-toring the Youth Guarantee This indicator combines administrative and survey data Whilst this is
not ideal the indicator is useful to give an approximate indication of the proportion of NEETs regis-tered in the YG scheme at any point during the year Results should therefore be interpreted as an estimation rather than a definitive measurement of the extent to which YG schemes achieve the objective of reaching all young people that become or are already NEET
10 The recycling rate is only experimental data and not officially part of the YG monitoring dataset
The Youth Guarantee in light of changes in the world of work Youth Guarantee Intervention Models Sustainability and Relevance
13
ple with low skills (European Commission 2018a) Ongoing efforts for these target
groups need to be intensified as recent measures have not led to sufficient results yet
Other EU sources Several other EU budget lines support employment- and education-
related programmes in Member States including the European Regional Development
Fund (ERDF) the ERASMUS programme as well as Horizon 2020 and the European Glob-
alisation Adjustment Fund (EGF) For an analysis of their job-creation potential and their
relation to the ESFYEI see European Parliament (2018) In addition a range of smaller
EU programmes finance employment-related measures for (young) people such as the
European Solidarity Corps or the EU Programme for Employment and Social Innovation
(EaSI)11
Three aspects deserve to be highlighted regarding differences across Member States in
financing the implementation of YG activities
First as the 2017 European Court of Auditors report on ldquoYouth unemployment ndash have EU
policies made a differencerdquo highlights the level of YEIESF funding available would only
address a small proportion of the required amount for the full implementation of a YG
Member States therefore need to leverage significant additional resources from national
budgets to achieve this goal However so far there has been ldquono assessment of cost
and available funding by Member Statesrdquo (European Court of Auditors 2017)
Second the extent to which the YEIESF funds simply financed youth-related schemes
that already existed prior to the YG is unclear They may be funded either by other EU
schemes or Member State national budgets The European Court of Auditors states that
YEIESF should ldquonot replace public or equivalent expenditure by the Member Statesrdquo
(ibid) However the Commission notes in its reply to the report that the YEI provisions
do not deny to Member States finance for measures previously supported by the national
budget or measures that require Member States to increase public spending regarding
certain types of measures or target groups At the same time the European Court of
Auditors analysis of seven Member Statesrsquo Operational Plans for the YEIESF showed that
ldquo[hellip] the majority of the measures which were to receive YEI financing already existed
prior to the introduction of the Youth Guarantee [hellip]rdquo (ibid p 54) In fact even in 2011
the Youth Opportunities Initiative proposed by the European Commission (2011) allowed
the governments of Member States to make increased use of the ESF for promoting
youth employment (Tosun et al 2017) The degree to which additional funds under the
YEIESF actually presented additional funds for Member States may therefore vary
greatly and there is without doubt also some variation in Member States as to whether
this caused them to step up their efforts regarding youth employment
Third despite the frontloading of the YEI in 2017 take-up of the YEI developed slowly in
its early phases of implementation (European Parliament 2017b) According to Andor
and Veselyacute (2018) two aspects delayed the implementation of the YG in the start from a
financial perspective firstly it took Member States and the Commission time to design
and review the lsquoOperational Programmesrsquo (OPs) specifying how YEI and ESF money
would be used Most of the Operational Programmes were only approved in late 2014 or
even in 2015 Secondly several Member States had accumulated delays in absorbing EU
structural funds for 2007-13 Hence they focused their efforts on implementing these
schemes in order not to lose these allocations (due to the so-called de-commitment
11 For instance one of the aims of the EaSI programme is to enhance mobility via the ldquoYour first Eures jobrdquo As these programmes are rather small in scale and not directly linked to the YG the study does not provide a detailed overview (see European Parliamentary Research Service 2017)
The Youth Guarantee in light of changes in the world of work Youth Guarantee Intervention Models Sustainability and Relevance
14
rule) Only afterwards did they move on to use YEI funding An assessment commis-
sioned by the European Parliament concluded that most delays that limited the impact of
the increased pre-financing were due to procedural rather than financial problems (Euro-
pean Parliament 2017b)
212 The Youth Guarantee as part of national policy-making
A variety of aspects may be used to determine the degree to which the YG has become a
part of national policy making and hence whether the changes introduced by the YG are
likely to be sustained over time The following discussion focuses on three measurable
factors related to the sustainability of YG-related policy changes Firstly whether the
Council Recommendation has spurred on Member States to introduce youth-related la-
bour-market reforms rather than merely set up an additional offer of active labour mar-
ket measures Secondly whether Member States have introduced monitoring and evalu-
ation systems to assess the effectiveness of YG-related measures Thirdly to find the
degree to which Member States have attempted to build up (lasting) partnerships be-
tween all relevant stakeholders (such as public and private employment services gov-
ernment authorities education and training institutions and so on)
The introduction of youth-related labour-market reforms the first key factor reflects
whether Member States have attempted to embed the main guidelines of the Council
Recommendation in their national policies In particular whether Member States have
used the political momentum created by the YG to introduce structural reforms to mod-
ernise their overall labour market policies in support of young people Such reforms con-
cern the functioning of the labour market (its institutional and regulatory framework)
and are aimed at better matching supply with demand The implementation of structural
reforms can be considered a key determinant as to whether the YG can have a long-
term sustainable impact in Member States beyond the YEI and the ESF funding associ-
ated with the YG
Information on the nature and intensity of youth-related active labour market policy re-
forms provided in the LABREF database indicates that EU Member States are imple-
menting the Recommendationrsquos policy guidelines unevenly Figure 3 displays the number
of active labour market policy reforms between 2013 and 2016 across Member States
The figure indicates for instance that virtually all Member States implemented addition-
al ALMP reforms for youth and that several Member States ndash such as Bulgaria France
Latvia Lithuania and Greece ndash have a relatively broad scope of reforms
Figure 3 Absolute number of youth-related active labour market reforms be-
tween 2013 and 2016
Note This figure shows the absolute number of youth-related active labour market policy reforms in the EU
Member States between 2013 and 2016 Identification of youth-related reforms is done via the indicator ldquoIs
the measure targeted at young peoplerdquo in the LABREF database
0
2
4
6
8
10
NL SI CZ
DE
LU FI HR
DK IE UK
AT PL
BE EE MT
RO SK ES HU CY IT PT SE BG FR LV LT EL
The Youth Guarantee in light of changes in the world of work Youth Guarantee Intervention Models Sustainability and Relevance
15
The introduction of monitoring and evaluation systems the fifth principal element in the
Council Recommendation on the YG and the strict reporting guidelines were aimed at
fostering a culture of policy analysis Despite the additional administrative burden asso-
ciated with reporting activities requiring Member States to obtain administrative data on
in- and outflows from the YG as well as follow-up data the creation of a monitoring and
evaluation system is one of the effects that people in charge of implementing the YG at
the country level have recognised as being positive12 In fact many Member States did
not have specialised monitoring systems allowing to track youth on the labour market
and in education and evaluate activation measures for youth before the Council Rec-
ommendation
At the same time the capacity of countries to monitor what happens to young people
after leaving the YG and the corresponding data quality varies in fact a substantial
share of Member States do not know about young peoplersquos reasons for exiting either the
YG or the labour market nor do they register the educational status of previous partici-
pants after they exited This issue is most likely due to a pre-YG lack of policy evaluation
culture or a lack of capacity to collect data An additional aspect to consider in this re-
gard is whether Member States attempted to evaluate the effectiveness of specific
measures under the YG using rigorous impact evaluations The EU helps Member States
conduct impact evaluations on interventions funded by the European Commission name-
ly the ESF and the YEI for example by setting up the Centre for Research on Impact
Evaluation (CRIE) which provides scientific expertise and methodological support to
Member States conducting an impact evaluation (see European Commission (2016b) for
details) Escudero and Murelo (2017) provide an overview of various impact evaluations
of pilot programmes that were set up within the context of the European YG However
there does not so far seem to be a systematic account of ongoing or completed impact
evaluations of YG instruments
Partnership approach Most Member States make a reference to the partnership ap-
proach in their YG Implementation Plan (YGIP) Table 1 shows the clear differences
based on an assessment of ten selected Member States conducted by Eurofound
(2015) In addition to the differences within countries the findings based on this sample
of ten countries also indicate that cooperation with some stakeholders seems to be more
widespread than it is with others For instance cooperation between ministries particu-
larly the ones dealing with employment and education policies is rather well developed
In comparison cooperation is less frequent with non-institutional stakeholders such as
the third sector notably NGOs social partners and youth organisations In 2016 the
European Commissionrsquos three-year assessment came to the conclusion that ldquowhile many
Member States have taken steps to support the involvement of a wide range of actors
and established institutional frameworks for partnerships the functioning of these part-
nerships remains a challenge due to problems of design which affects their ability to
deliverrdquo (European Commission 2016b p24)
In addition previous studies (eg Dheacuteret and Roden 2016) highlight the strong path-
dependency in how countries or regions apply the partnership approach While some
countries have put new structures in place to monitor the progress of the YG implemen-
tation and coordinate the work of relevant stakeholders other countries tend to have
consolidated partnerships that existed before the YG was established
12 Information collected through the interviews organised in the context of the EPC Task Force on Youth Employment The results of these interviews are further presented and developed in Dheacuteret and Roden (2016)
The Youth Guarantee in light of changes in the world of work Youth Guarantee Intervention Models Sustainability and Relevance
16
There also seems to be some discrepancy between the involvement of stakeholders in
the design implementation and monitoring of the YG In some Member States stake-
holders in the third sector particularly youth organisations reported that they were only
consulted in the design phase and never again (European Youth Forum 2018)13 Recent-
ly more positive evidence is provided by ETUC (2018) showing that the great majority
of interviewed representatives of unions was at least `somewhat satisfiedrsquo with their
degree of participation in the YG
Table 1 Overview of actors involved in implementing the YG in 10 Member
States
Min
istr
y
of
Em
plo
ym
ent
(or
equiv
ale
nt)
Min
istr
y
responsib
le
for
socia
l benefits
Min
istr
yo
rganis
ation
re-
sponsib
le for
ESFY
EI
Min
istr
y o
f Education
Min
istr
y
responsib
le
for
youth
work
Oth
er
min
istr
y
(justice
defe
nce
inte
rior
health
housin
g)
PES
(either
at
national
regio
nal or
local le
vel)
Youth
org
anis
ation (r
epre
-
senta
tive)
Local
youth
org
anis
ation
(im
ple
menta
tion)
Socia
l part
ners
Education s
ecto
r
BE XX XX X XX X XXX X X XX
BG XXX XX XX XX XX XX XX XX XX XX
EE XX X XX XXX XXX X XX XX XX X X
EL XXX X X XX X X
ES XXX
XXX
(em-ploy-ment)
XX XX XX XX XX X XX X
FR XXX
XXX (em-ploy-
ment)
XX (em-ploy-
ment)
XX XX X XX X
IE XX XXX XX XX XX XX X X X
IT XXX XXX XX XX XX XX X X XXX X
PL XX X XXX X XX X
UK XX XX (LEP)
X X XX X X
Source Eurofound (2015a)
Note XXX means authoritycoordinator XX means principal partner-stakeholders and X means associated
partnerstakeholder A distinction needs to be made in Belgium between the federal and local authori-
tyregional level social benefits are (still) the responsibility of the federal government while education and
PES are the responsibility of the regionslocal authorities Similar to Belgium in Spain many responsibilities
are delegated to the regional level LEPs - Local Enterprise Partnerships
13 Some more evidence from the European Youth Forum on involvement for a sub-set of countries can be found under httptoolsyouthforumorgyouth-guarantee
The Youth Guarantee in light of changes in the world of work Youth Guarantee Intervention Models Sustainability and Relevance
17
213 Youth labour market challenges
The third key factor of YG implementation is its contribution to and targeting of the
young peoplersquos labour market challenges Given that the recession of the late 2000s (the
lsquoGreat Recessionrsquo) and its aftermath exacerbated the difficulties that young people face
in their STW transition and labour market career this section presents a brief discussion
of these challenges and how YG interventions have sought to address them
Challenge 1 ndash Youth unemployment long-term unemployment and inactivity The Great
Recession and its immediate effects on youth unemployment ndash highlighted in section 1 ndash
also resulted in an increase in youth long-term unemployment which although gradual-
ly falling from its peak of 8 in 2013 has remained high (European Parliament 2015
European Commission 2017a) Long-term unemployment can result in well-documented
lifelong consequences and lsquoscarringrsquo effects on those young people who remain unem-
ployed for some time (Eurofound 2015b Eurostat 2015) In addition a considerable
proportion of the EUrsquos youth remain economically inactive Whereas a large share of
them are in education or training many are discouraged and have become detached
from the labour market or they have not entered it after leaving education
The macroeconomic state of the economy also affects the level of demand for young
people where employer absorption capacity in providing training places (such as appren-
ticeships) and jobs for young people may be limited (Eurofound 2015a) In addition the
highly variable youth labour market performance across the EU before during and after
the Great Recession has been attributed to many factors These include differences in
the institutional and structural set-up of Member States regarding the education and
training systems (initial) education and vocational training (IVET) labour market insti-
tutions and labour market policy (such as employment protection legislation - EPL) and
active labour market policies (ALMPs) and social welfare systems (Eichhorst et al 2013
OrsquoReilly et al 2015 Pohl and Walther 2005 Pohl and Walther 2007)
The introduction of the YG ndash and its underlying philosophy of early intervention with a
personalised approach ndash across the EU sought to address the issue of rising youth un-
employment including long-term unemployment and inactivity (Eurofound 2015a Eu-
ropean Commission 2016a) The YG approach precisely addresses these challenges
providing unemployed inactive youth with a short-term activation and a perspective in
employment or education
In the five years since the launch of the YG youth unemployment rates have improved
considerably as highlighted in section 1 (see also for example the European Commis-
sion 2018g Eurostat 2018) Although this development is partially attributable to the
recovery from the Great Recession according to the European Commission this is also
partially due to the YG together with the effect of the Youth Employment Initiative (YEI)
(European Commission 2018g)
Challenge 2 ndash Labour market segmentation A key challenge facing youth is labour mar-
ket segmentation often resulting in young people being over-represented in temporary
or part-time forms employment in particular involuntary part-time casual a-typical or
precarious work (European Commission 2017a 2017g and 2018i Eurostat 2015 and
2018) Although such non-standard forms of employment have increased for all age
groups the more recent cohorts of younger workers have been particularly adversely
affected (European Commission 2017g) Specifically although in 1995 23 of younger
workers in the then EU 15 were on non-standard contracts by 2016 this proportion had
increased to 32 for the same age group (European Commission 2017g)
This trend is reflected across the EU 28 where over the last decade non-standard forms
of employment among younger workers rose from 26 to 29 with 35 million fewer
The Youth Guarantee in light of changes in the world of work Youth Guarantee Intervention Models Sustainability and Relevance
18
employees on permanent full-time contracts and 12 million more on non-standard con-
tracts (European Commission 2017g) Moreover younger workers in 2016 were still
more than twice as likely to be working full-time on temporary contracts (12) than
workers in their prime and older workers (5) (European Commission 2017g)
In general young people are more likely to find themselves as labour market lsquooutsidersrsquo
with little access to permanent contracts with high levels of employment protection and
workersrsquo rights especially compared to their older counterparts (European Parliament
2015 European Commission 2017a 2017g and 2018j) Since access to stable employ-
ment with positive career prospects matters young peoplersquos successful transition into
fully independent lives is one of the primary objectives of the YG (Council of the Europe-
an Union 2013 Eurofound 2014)
The degree of lsquodualismrsquo of labour markets varies across Member States recent analysis
suggests that four in ten European young people are on temporary contracts rising to
over 60 in many Southern and Eastern European countries (European Court of Audi-
tors 2017) While temporary employment can either be a lsquostepping stonersquo or a lsquotraprsquo in
terms of STW transitions recent data suggests that the former is rarely the case (Euro-
pean Commission 2015 2017a and 2017g) the average proportion of temporary work-
ers transitioning into permanent employment fell from 28 in 2007 to 23 in 2013
This however masks major country variations ranging from 10 in France to for ex-
ample 65 in Estonia (ibid)
Predictably when studying age groups the probability of moving from temporary to
permanent contracts over one year is lowest for young people aged 15-24 (European
Commission 2016g) However it is worth noting that transition rates from temporary to
permanent contracts among young people have recently either increased or remained
stable in most Member States where data are available (European Commission 2017g)
In most Member States these rates are still lower than 20 and in countries such as
Poland and Greece temporary employment lsquohas almost no stepping-stone functionrsquo (Eu-
ropean Commission 2017g) Countries such as France and Spain with highly segmented
labour markets and high shares of (young) workers on fixed-term contracts have been
also characterised by low transition rates towards permanent employment (European
Commission 2017h Eurofound 2013a and 2013b)
Country case study Ireland
Ireland was one of the EU countries most adversely affected by the Great Recession
which resulted in high levels of youth unemployment As a result addressing youth
unemployment especially long-term unemployment has been a key challenge (EEPO
2015) The youth unemployment rate more than tripled from about 10 in 2008-09 to
a peak of just over 33 in mid-2012 (DSP 2014a) Likewise the NEET rate for those
aged 15-24 was 18 in 2014 although the picture is more nuanced especially in re-
lation to inactive NEETs (DSP 2014a) Specifically excluding students and the young
unemployed inactive NEETs account for a relatively small proportion (about 3) of
the youth population (DSP 2014a EEPO 2015) Most tend to be lone parentscarers
(60) and people with a disability (20) (DSP 2014a EEPO 2015) Thanks to Ire-
landrsquos universal means-tested unemployment benefit system for those aged over 18
the vast majority of young NEETs are registered with the benefitsemployment service
(EMCO 2017)
Against this background the Youth Guarantee (YG) has two target groups (i) poorly
qualified young people aged under 18 who are in turn provided with a quality second-
chance educationaltraining pathway outside the school system (for example
Youthreach) or are supported in re-entering the school system and (ii) unemployed
The Youth Guarantee in light of changes in the world of work Youth Guarantee Intervention Models Sustainability and Relevance
19
young people aged 18-24 with a particular focus on long-term unemployed youth
(EEPO 2015 Stokes 2016) To this end the YG offer is quite comprehensive and
comprises a number of programmes ndash some pre-existing (for example the JobBridge
internship programme) and others such as the First Steps Youth Developmental In-
ternship Programme (for the most disadvantaged young people) and JobsPlus Youth
(an employer subsidy scheme) introduced as part of the YG (DSP 2014a Leigh-Doyle
2014 Treadwell Shine 2016)
The delivery of the Irish YG seems to be integrated within the overall policy approach
towards youth employment with most measures aimed at young jobseekers predating
its introduction (DSP 2016a) This embedding of the YG within the existing youth em-
ployment policy framework means there is a close alignment between the two Indeed
Irelandrsquos YG builds upon existing services and programmes but it crucially entails ear-
lier intervention for and a tailored approach to the young unemployed with a strong
focus on enhancing processespolicies to help the young unemployed enter sustainable
employment receive appropriate training andor gain relevant work experience (DSP
2014a Treadwell Shine 2016 DohertyDSP 2018) YG-related partnership arrange-
ments are also situated within the main policy making process which in turn means
that the implementation of the YG is policy based as opposed to project based
(ESFYEI) (EMCO 2017) As such the YG and associated measures are likely to be
sustained over time
Ireland has made notable progress in implementing the YG with a substantial reduc-
tion in the number of unemployed youth In general there has been intensified en-
gagement with young people while access to different programmes has been enhanced
and partnerships strengthened (European Commission 2018a) Evaluations of YG-
related programmes such as the Tuacutes and Job-Bridge work placementinternship pro-
grammes have shown positive outcomes (Leigh-Doyle 2014 Indecon 2016 Depart-
ment of Education and Skills 2016) The Irish YG seems to be quite successful in de-
livering sustainable outcomes which indicates that the offers provided are of good
quality (European Commission 2018a)
However a number of challenges remain For example the uptake of key measures
such as JobsPlus Youth and the First Steps Youth Development Internship has not
been as extensive as it could in view of the youth cohort concerned and there is also
a lack of sufficient training places (DSP 2016a European Commission 2017f) Em-
ployer engagement particularly in the provision of employment opportunities for the
most disadvantaged youth also remains a challenge as does the timeliness of YG of-
fers (European Commission 2017f and 2018a EMCO 2017)
In principle one response to the challenge of labour market segmentation would be
structural reforms such as for example the reforms Spain implemented in the aftermath
of the crisis Given that the YG was implemented at the height of the recession most
Member States focused on a ldquowork firstrdquo approach to give short-term relief to unem-
ployed young people specifically the implementation of subsidised employment pro-
grammes many specifically targeted at young people at risk has been quite common
across the EU and hiring incentives have featured prominently in many YG plans (Euro-
pean Commission 2018h) Many of these programmes involve incentives such as wage
subsidies aimed at encouraging employers to offer employment to young people
In general countries promoting employment offers under the YG use a form of employ-
ment subsidy which typically involves supplementing the individual labour costs of the
person employed over a fixed period whilst the majority of the labour costs remain cov-
ered by the employer (European Commission 2018h - See Annex Points 9 and 10)
The Youth Guarantee in light of changes in the world of work Youth Guarantee Intervention Models Sustainability and Relevance
20
These wage subsidies also play a crucial role in many countries (including Belgium
France Estonia Greece the Netherlands Poland Spain Sweden and Denmark) in facili-
tating the acquisition of work experience andor entry in their first job by young people
and this especially helps young people from disadvantaged backgrounds (Eurofound
2013b 2016 and 2017 European Commission 2018d and 2018h) In addition the
broader set of labour market reforms accompanying the YG (see previous subsections)
has contributed to addressing labour market dualism in many Member States
Challenge 3 ndash Poor performance of education and training systems (including skills mis-
matches and the limited availability of quality work experience) Another key structural
challenge is given by an unsatisfactory performance in the education and training sys-
tems including VET this means that young people do not have appropriate education
when they graduate and when they enter the labour market which in turn exacerbates
skills mismatches and adversely affects their employability (for example Quintini et al
2007 Quintini and Martin 2014) Indeed the mismatch between (youth) labour supply
and demand seems to be a growing challenge for instance there is growing concern
about graduate under-utilisation and the fact that that higher education graduates expe-
rience considerable and persistent occupational vertical skills mismatch (234 in 2016)
by working in jobs typically requiring a lower level qualification (European Commission
2017c) However it is also worth pointing out that higher education graduates have bet-
ter employment rates (828) than young people with upper secondary education quali-
fications (726) (European Commission 2017c)
Another major challenge in light of rapid and constant technological change relates to
the need for effective skills anticipation against the largely unknown future evolution of
work and work organisation This is in turn is closely related to the need to ensure that
the education and training systems across the EU respond accordingly by being lsquoagilersquo
and by equipping young people with relevant skills including lsquodynamicrsquo skills such as
adaptability resilience and career management skills This concern was also reflected in
the latest European Commissionrsquos report on Employment and Social Developments in
Europe according to which ldquomuch will depend on whether or not education and training
systems are agile enough to respond appropriately to fast-changing technological oppor-
tunitiesrdquo (European Commission 2018g)
In recent years there has been a concerted effort to reform or strengthen education and
training systems including vocational education and trainingapprenticeships and their
role in STW transitions Indeed extensive VET reforms are currently being implemented
in many EU countries (for example Croatia Cyprus Estonia Greece Finland France
Ireland Italy Poland Spain Sweden and the United Kingdom) ndash instigated to some ex-
tent by the YG These reforms seek to improve the labour market relevance quality and
attractiveness of VET together with an effort to develop a VET system often along the
lines of the German dual training system which combines time spent at school with time
spent in the workplace In addition many reforms of VET systems often associated with
the YG have sought to create closer links with the labour market (European Commis-
sion 2018c)
In addition a range of other educational measures offered under the YG has aimed to
bring young people with low levels of skills and qualifications back to education and
training These measures are summarised by the term lsquocontinued education offersrsquo (Eu-
ropean Commission 2018l) These continued education offers are set up to provide
young people with the chance to re-enter the regular education and training system to
move on to a higher-level qualification Alternatively ALMPs bridging courses or second
chance education programmes can also equip early school-leavers and low-skilled youth
The Youth Guarantee in light of changes in the world of work Youth Guarantee Intervention Models Sustainability and Relevance
21
with the skills and qualifications needed for an initial (and targeted sustainable) labour
market integration
214 The heterogeneity of the NEET population
The fourth key aspect of YG implementation assessed in this report concerns the way in
which the YG has addressed the heterogeneity of the NEET population Due to its diversi-
ty the NEET population in the EU can be divided into sub-groups According to Euro-
found (2016) the NEET can be categorised firstly by their activity status ndash those who
are available to the labour market or educational opportunities are counted as active
while the rest is classified as inactive The former group consists of short- and long-term
unemployed individuals and those soon to return to education or employment the latter
group includes people with illness or disability individuals with family responsibilities and
lsquodiscouragedrsquo workers Throughout this report the phrase lsquodiscouraged workersrsquo refers to
people who simply stopped searching for employment or education opportunities
Data from the EU Labour Force Survey from 2013 (also used in Eurofound 2016) pro-
vides an indication about the labour-market attachment of NEETs in Europe before the
YG was implemented Among the active NEETs the largest proportion of 15-24-year-old
NEETs were short-term unemployed (298) Long-term unemployed youth made up
about 22 of the NEET population while returnees into work or education accounted for
roughly 8 of NEETs Among those considered inactive the largest share corresponds to
individuals with family care responsibilities (154) Individuals with illness or disability
made up 8 of the NEET population Discouraged workers accounted for almost 6 of
NEETs and 125 were NEETs for other reasons Consequently around 60 of the
NEET population were neither in education employment nor training for labour market
related reasons (the unemployed the discouraged workers and the returnees) and
around 40 were NEETs for other reasons
Furthermore NEETs can be categorised by their educational attainment as subgroups
with lower education are at a much higher risk of being in a vulnerable position This can
be seen by the fact that less educated youth are overrepresented among the NEETs As
of 2014 44 of NEETs aged 15-24 had completed an lsquoupper secondaryrsquo education
closely followed by 43 with a lsquolower secondaryrsquo education and only 8 of NEETs had
tertiary education or a degree (Eurofound 2016)
These sub-groups have diverse needs and are therefore likely to benefit from different
types of policy responses regarding interventions and they may require additional out-
reach efforts Most importantly those furthest away from the labour market are most
likely to be in substantial need of outreach activities One important factor here is their
point of access to the YG While other entry points exist access is often governed by
PES In all EU countries except Malta the PES plays a role in registering people for the
YG Among other determinants the extent to which the PES are able to actually reach
the NEET population also depends on their responsibilities for administering and paying
(unemployment) benefits According to European Commission (2017b) only three PES
are responsible for administering other types of benefits aside from (mostly insurance-
based) unemployment benefits (Lithuania Luxemburg and Slovakia) These types of
benefits tend to exclude youth due to their limited length of work experience reducing
the scope for outreach without further intervention Indeed the registration of NEETs
with the PES was somewhat limited at the onset of the YG (Eurofound 2016) However
many PES have launched substantial outreach activities to make up for this EC (2017a)
shows that roughly 46 of PES make use of new media for their outreach work 39
provide mobile services and about 43 have specific outreach caseworkers Moreover
The Youth Guarantee in light of changes in the world of work Youth Guarantee Intervention Models Sustainability and Relevance
22
46 of PES have created a one-stop-shop type of framework to enhance their degree of
outreach (eg this includes Belgium Finland and the United Kingdom ibid)
Country case study Italy
Italy is a country with a relatively rigid labour market despite the recent reforms aimed
at increasing the degree of labour market flexibility Moreover the Italian education
system endows youth with a relatively high level of general education but with few
work-related skills which dramatically slows down their transition to a job (Pastore
2018) Along with their relatively large number of early school-leavers this helps ex-
plain their 347 youth unemployment rate in 2017
The lack of previous experience with the YG framework and the dramatically low rate of
job-finding ndash ranging from 11 to 18 in the 2010s ndash represented another obstacle to
successfully implementing the YG According to Pastore (2015) macro- and micro-
economic obstacles should have been overcome to make the programme work at its
best Economic growth has been sluggish at least from the early 1990s which would
normally have reduced the pace of job creation and forced young people into more edu-
cation and training rather than employment Moreover public and private employment
services could count only on human resources which were scant in both quantitative and
qualitative terms as they had a low share of university graduates (ANPAL 2018)
The number of ANPAL staff has been reduced in recent years and as financial resources
for paying for an increase in the number of staff are scarce improvement has been
sought by implementing important reforms such as the `legislative decree 1502015rsquo of
the so-called Jobs Act package (ANPAL 2018) This reform introduced lsquoquasi-marketsrsquo
in the management of employment services the NEETs are profiled by PES and then
assigned a voucher for a different amount according to their lsquoneed bandrsquo NEETs can
spend vouchers in the PES andor with private (for profit or non-profit) employment
agencies to buy the services they need However so far the reform has not been fully
implemented partly due to the lack of financial resources (ibid)
Further problems with the implementation of the YG has been due to the reallocation of
competences in the PES from provinces to regions and the establishment of a national
agency (ANPAL) to coordinate the work of regional entities which detracted from the
full implementation of the YG (ANPAL 2018)
The Italian YG scheme has also managed to improve its monitoring system of the indi-
viduals involved the activities done and their level of absorption into the labour market
when the programme is completed The last monitoring report available shows that of
about 15 million registered NEETs 13 million had the prescribed requirements About
one million were actually profiled of which about a half were given some completed
form of assistance About 60 underwent on-the-job training 23 benefited from sub-
sidised employment 123 received off-the-job training 23 received some form of
placement services 16 did voluntary service in the third sector and a small number
received support for self-employment About six months before completion of the pro-
gramme 479 of recipients were in work and 692 had experienced at least one
employment spell (ANPAL 2017)
A few recent evaluation studies provide a full assessment of regional programmes and
show that on-the-job training is effective in confirming the importance of providing
young people with work-related competences (for example see Ghirelli et al 2019)
Despite these efforts monitoring data on the Youth Guarantee for 2016 shows that in
the EU as a whole an estimated 385 of the NEET population were registered in YG
schemes in the year 2016 Although some Member States are doing much better (cover-
The Youth Guarantee in light of changes in the world of work Youth Guarantee Intervention Models Sustainability and Relevance
23
age rates are higher than 50 in 12 Member States - in Belgium Finland and Austria
the corresponding rate is even above 70) Moreover the YG currently does not suffi-
ciently cover inactive NEETs (European Youth Forum 2018) as this problem is less se-
vere in countries with minimum income support systems where less strict entry require-
ments are usually applied This is the case in Ireland for example (see European Court
of Auditors 2017) This under-coverage of inactive NEETs is reflected in Figure 4 which
shows that the decline in NEET rates since the introduction of the YG is mostly due to
reductions in long-term and short-term unemployment
Figure 4 Composition of the EU NEET population (percentage of the population
of young people)
Source Eurofound (2017)
Thus it seems that the YG so far has benefitted youth closer to the labour market which
may be partly reflect the high prevalence of employment offers within the YG framework
(in 2016 around 67 of all the offers taken up within the four-month time limit set by
the YG were employment offers) Low-skilled individuals lsquodiscouragedrsquo workers and indi-
viduals without work experience are likely to benefit more from offers that combine gain-
ing job experience and building (job-specific) skills However as of 2016 these types of
offer only make up a minority of all the offers taken up within the four-month time limit
Furthermore the 2013 Council Recommendation on the YG insufficiently addressed the
needs of those among the youth that are NEETs for reasons other than labour market
related factors as these individuals had other constraints keeping them from the labour
market Among this group are mainly individuals with family care responsibilities and
youth with illnesses or disabilities For individuals with family responsibilities the Euro-
pean Quality of Life Survey shows that 11 of young fathers and 35 of young mothers
are inactive This is despite the fact that the majority of them would like to work under
flexible work and with adequate care arrangements (European Youth Forum 2017)
Nonetheless some Member States introduced additional reforms beyond the YG recom-
mendations to decrease high school dropout or aimed at improving social and welfare
policies
The Youth Guarantee in light of changes in the world of work Youth Guarantee Intervention Models Sustainability and Relevance
24
215 Design and implementation features of the Youth Guarantee
The fifth key aspect of the YG concerns design and implementation-related factors af-
fecting its capacity to address the main objectives ndash does it provide a broad set of young
people with a quality offer within a short period of time Specifically the Council of the
European Union (EU) recommended providing a quality offer to all young people under
25 within a four-month period of their becoming unemployed or having left the education
system
Substantial variation between Member States can be observed in the way the national
YG was designed and implemented previous experience implementing a YG-type of
framework is also important For example Denmark and Sweden are among countries
that had a relatively long history of this sort of framework even before the introduction
of the YG Furthermore at the very fundamental level of design some Member States
opted for different target time-frames as well as different age cut offs for YG eligibility
Some countries chose a shorter time-frame than the four months envisaged by the
Council of the European Union others opted for a longer duration (European Commis-
sion 2016a) Regarding the age range a substantial number of Member States chose
youth aged under 30 as a target rather than the suggested age of 25 as the cut off This
included for example Bulgaria Denmark Italy and Poland Depending on the size of
these cohorts this may represent a considerably more ambitious approach which - if it
is not supported by sufficient financial and human resources - is more likely to fall short
of expectations Furthermore some countries put specific emphasis on targeting the
long-term unemployed youth (Escudero and Mourelo 2017) Among others this includes
Hungary Poland and the United Kingdom
In order to support the target of reaching every NEET in a timely manner some PES
have also introduced YG-specific staff hired additional caseworkers or at least main-
tained their staff level since the introduction of the YG (European Commission 2017a)
On the issue of the quality of offers 17 PES formally defined their criteria for a quality
offer or distributed national quality management guidelines regarding offers being made
within the YG framework (5 countries)14 Many Member States have chosen an outcome-
based approach for their definition of offer quality meaning they define an offer as being
of high quality when individuals have favourable education or employment outcomes
after leaving one of the YG programmes (European Commission 2016a) In addition
some PES also introduced youth-specific targets (European Commission 2017a)
There is also cross-country variation in terms of the main YG providers Almost all coun-
tries rely to some extent on their national PES for providing YG services while some do
so exclusively This is the case for example in Austria the Czech Republic and Greece
Most Member States however chose some combination of the PES and other institutions
as their main providers (European Commission 2016a) Aside from the institutions
through which YG services can be obtained online access to the programmes may be an
important driver of success In 18 EU countries potential participants can register online
for the YG at least in some regions of the country This is not the case in for example
Bulgaria France or Luxembourg
14 See European Commission 2017a
The Youth Guarantee in light of changes in the world of work Youth Guarantee Intervention Models Sustainability and Relevance
25
Country case study Latvia
Young people in Latvia were very adversely affected by the lsquoGreat Recessionrsquo of
20082009 In the years before the recession youth unemployment had been relatively
low standing at 105 in mid-2008 but then it more than tripled to more than 35
within a two year period In a parallel development the NEET rate for 15-24 year old
Latvians rose from 108 in 2008 to 178 in 2010 Both youth unemployment and the
NEET rate effectively peaked in 2010 in Latvia and since then they have steadily de-
clined reaching pre-crisis levels by 2015 One specific challenge of the Latvian labour
market is the variation in employment outcomes by educational level as the high-
skilled face very low unemployment rates (clearly below the EU average) whereas un-
employment among the low-skilled is much higher than EU average
Following the Council Recommendation the Latvian YG Implementation Plan was pre-
sented in December 2013 (updated in April 2014) and implementation started in 2014
targeting young people aged 15-29 not in employment education or training (European
Commission 2018c) The Ministry of Welfare is in charge of establishing and managing
the YG while the Latvian PES (the lsquoState Employment Agencyrsquo) and the State Education
Development Agency (SEDA) are responsible for its implementation Other main imple-
menting actors include the Ministry of Science and Education the local authorities (the
municipalities) and youth organisations The Latvian Youth Guarantee is fully funded by
the Youth Employment Initiative (ibid)
The immediate strengths of YG implementation in Latvia are the rapid formal adoption
of the YG the adaptability of existing institutions and structures (which also enabled the
creation of new institutions such as a YG Advisory Board) and the emergence of part-
nership as a key component for implementing the YG This active inclusion of a broad
set of partnerships remains a particular strength of the Latvian YG implementation (EM-
CO 2017)
The Latvian YG scheme exclusively provides employment and education offers so that
apprenticeships and traineeships are not provided The employment offers are mostly
subsidised employment in the regular labour market such as first work experience for
labour market entrants and subsidised jobs for the disadvantaged Young people receive
fixed term contracts that range in duration from six months to two years and there is
also financial support for up to two years for young people wanting to become self-
employed or to start a business
The education system includes several vocational elements typically between 480 and
960 hours and up to 15 years in one specific programme Additionally the Latvian YG
provides ldquoyouth workshopsrdquo as part of the preparatory phase which provide training in
three different areas (up to three weeks each) to help young people with their career
choices
In 2016 just over a quarter (271 of the total entrants) of those entering the YG
scheme were re-entrants of which nearly half (127) had previously taken up an of-
fer These re-entry rates are below the EU average but the rates may be understated
as data for participants applying via the SEDA data on previous experience are not
available (European Commission 2018a)
The Youth Guarantee in light of changes in the world of work Youth Guarantee Intervention Models Sustainability and Relevance
26
216 The role of the apprenticeship system in the Youth Guarantee
The sixth main aspect of YG implementation addressed in this study specifically concerns
the role of apprenticeships indeed one of the greatest problems for young peoplersquos
transition into the labour market is their lack of work-related competences especially in
the countries with sequential STW transition systems that focus on general education
rather than building lsquoall-round human capitalrsquo as in lsquodualrsquo STW transition systems where
school and work are linked at the same time (Austria Denmark and Germany) An ap-
prenticeship is therefore one of the key elements of the dual system as it traditionally
involves off-the-job in-class education together with on-the-job training of different
lengths
According to comparative evidence provided by the European Commission (2013) based
on the European Labour Force Survey in most EU Member States the share of appren-
ticeships in any cohort of young people (15-29 years old) is between 15 and 5 with
the only exception being Germany Austria and Denmark where young people who un-
dertake an apprenticeship amount to above 5 All other EU countries are below 15
The EU average share was 37
This general tendency is also partly reflected in the usage of apprenticeships in the con-
text of the YG as they correspond to important cultural and institutional factors within
Member States15 The monitoring data shows that in 2016 some of the countries with the
highest share of apprenticeship offers within the YG programme have a dual STW sys-
tem Portugal is one major exception from this rule this may be related to its general
shortage of employment opportunities and therefore the tendency of apprenticeships to
occupy a higher than average share among participants of the YG Overall however
only 34 of timely exits from the YG were the result of apprenticeship offers a share
not far away from the share in the overall population of young people mentioned above
For a large number of countries the share was close to zero It should be noted howev-
er that due to data limitations some countries may record entries into apprenticeship
offers as entries into employment (European Commission 2016b)
Apart from data-related issues one reason why apprenticeship offers remain rather ex-
ceptional within the YG is that they require employersrsquo commitment to providing training
places and to designing curricula in cooperation with schools This can be a big constraint
in the development of apprenticeships especially in sequential SWT systems In 2013
the European Alliance for Apprenticeship (EAFA) was therefore launched to boost ap-
prenticeships in the EU The EAFA gave guidelines for the implementation of apprentice-
ships in all Member States and encouraged sharing experiences and good practices and
provided strategic expert support from the European Centre for the Development of Vo-
cational Training (CEDEFOP) and through the European Training Foundation Within the
context of the EAFA all member countries signed a declaration of commitments on ac-
tions to spread the use of apprenticeships as the main port of entry to the labour market
15 Note that the Commissionrsquos definition of apprenticeships (European Commission 2013) may differ from Member Statesrsquo definitions A recent Council Recommendation (Council of the European Union 2018) intends to harmonise the definition by saying that apprenticeships are understood as formal vocational education and training schemes that a) combine learning in education or training institutions with substantial work-based learning in companies and other workplaces b) lead to
nationally recognised qualifications c) are based on an agreement defining the rights and obliga-tions of the apprentice the employer and where appropriate the vocational education and train-ing institution and d) with the apprentice being paid or otherwise compensated for the work-based component Despite this recommendation varying national definitions still exist across Member States
The Youth Guarantee in light of changes in the world of work Youth Guarantee Intervention Models Sustainability and Relevance
27
for young people16 Moreover in their declarations each country committed itself to im-
plement the dual principle in their STW transition
Country case study Denmark
Denmark is among those EU countries that even before the introduction of the YG in
2013 (European Commission 2016a) already had a particularly well-functioning labour
market and educational system to help NEETs In fact Denmark already had some ex-
perience of a YG-like framework for a relatively long period before it was proposed by
the Council of the European Union The situation for Denmarkrsquos youth was therefore
more favourable than the EU average in 2012 The share of young people between 15
and 25 that were NEETs was only 66 - significantly below the proportion of NEETs in
many other EU countries Furthermore the majority of those individuals that were clas-
sified as NEETs were relatively close to the labour market and were therefore easier to
reach For example only 53 of Danish NEETs belonged to the group of long-term
unemployed or discouraged workers (Eurofound 2016)
Due to these circumstances the case for additional reforms within the YG was limited
Therefore along with reform efforts regarding active labour market policies concerning
youth and the educational system17 the implementation of the YG mostly required the
updating of existing policies This is exemplified by a strong increase in ALMP spending
from roughly 13 of GDP in 2012 to about 14 in 2015 despite declining rates of
youth unemployment and therefore a decrease in ALMP expenditure in other countries
over the same time period Denmark chose a particularly ambitious implementation by
focusing on youth under the age of 30 with a target window of less than four months so
as to offer their NEET population a quality measure In contrast to many other Member
States Denmark focuses on increasing the employability of NEETs via (continued) edu-
cation measures resulting in a share of apprenticeship take ups of over 50 relative to
the total number of timely exits from the YG This approach also matches the relatively
large proportion of low and medium educated youth among the NEETs
Two of the main pillars in the original 2014 Danish implementation plan were the ldquore-
tention task forcerdquo and the ldquoBridge Building to Educationrdquo programmes Both types of
initiatives were well-founded in regional and inter-organisational partnerships (for ex-
ample people involved include job centres municipalities educational facilities youth
organisations and others) While the aim of the first programme was to decrease high
school drop-out rates the latter took place at a vocational school in close cooperation
with the jobcentres and it focuses on helping youth to find their right path to success
through making the transition to vocational education This was done by assigning men-
tors to the NEET and giving them access to basic literacy and numeracy courses if they
needed them as well as further professional courses and traineeships The evaluation of
the ldquoBridge Building to Educationrdquo initiative yielded positive effects for youngsters par-
ticipating in the intervention compared to the control group (with a similar profile) which
did not participate in the intervention As a result two additional initiatives were set up
Firstly funds were made available to support the further implementation of ldquoBridge
Building to Educationrdquo initiatives Secondly ldquoJob-Bridge to Educationrdquo a randomised
controlled trial building on the core elements of ldquoBridge Building to Educationrdquo and tar-
geting the most vulnerable youth under 30 years without an education was also set up
16 Declarations of national commitment are downloadable from the EAFA website httpeceuropaeuapprenticeships-alliance
17 For more information see httpsuvmdkreform-af-de-forberedende-tilbudforberedende-grunduddannelseopbygning-og-maalgruppe
The Youth Guarantee in light of changes in the world of work Youth Guarantee Intervention Models Sustainability and Relevance
28
The project is set to end in mid-2020 where it will be followed by an evaluation of the
results
The Danish YG has also managed to set up a high-quality monitoring system with only
relatively few cases of missing information on YG participantsrsquo exit destinations (Euro-
pean Commission 2018a) Together with the relatively large share of NEETs who are
registered with the PES and the development of ldquoyouth guidance centresrdquo to reach out
to those who are not the Danish YG model is able to cover a substantial portion of
NEETs For instance in 2016 the YG coverage rate reached almost 60 of the NEET
population compared to the EU YG scheme average of 425 Thus despite more fa-
vourable initial conditions in Denmark the YG helped put a focus on the most vulnera-
ble youth and spur on a further integration of policies into national policymaking for
example through additional reforms aimed at improving active labour market policies
for young people Youth unemployment rates are currently trending downwards even
further in Denmark However there remain some issues especially with regard to the
integration of migrants given that youth unemployment is a much more pervasive issue
among them compared to native Danes (European Commission 2018a)
22 Empirical indicators of Youth Guarantee features
Section 21 has presented the key aspects that reflect how Members States implemented
the Youth Guarantee following the Recommendation In order to prepare the systematic
analysis of the YG in section 3 which develops a YG typology it is necessary to build
empirical indicators for each of these key aspects That is to say that this section dis-
cusses how information on each of these aspects can be measured and expressed in da-
ta18 These empirical indicators are therefore grouped into the corresponding six sets
1 Financial resources for implementing the Youth Guarantee
2 The Youth Guarantee as part of national policy-making
3 Youth labour market challenges
4 The heterogeneity of the NEET population
5 Design and implementation features of the Youth Guarantee
6 The role of the apprenticeship system in the Youth Guarantee
221 Indicator set 1 Financial resources for implementing the Youth
Guarantee
The set of indicators below represents the level and composition of financial resources
that Member States employed to support the Youth Guarantees implementation
i The size of ESFYEI transfers to match the respective NEET challenge is measured
by the ratio of initial YEI allocations as well as the YEI+ESF matching funds EU el-
igible cost both relative to Member Statesrsquo GDP in 2012 In addition a categori-
18 For each group of contextual and implementation features of the Youth Guarantee discussed in Section 21 an overview of potential quantitative or qualitative indicators was established which could represent these constructs Through a desk research of the available literature and online databases the availability of the respective indicators at the Member State level was assessed for a sufficiently large set of countries Unfortunately for a subset of potential indicators it was not possible to retrieve sufficient andor adequate information for a large enough sample of Member
States In some cases where several potential indicators were available to represent the same dimension or construct the available indicators that best represent the specific feature were iden-tified while also taking data quality into account In some cases single combined indicators were constructed to reduce the lsquodimensionalityrsquo of the database underlying the cluster analysis in sec-tion 3 See appendix A for more details on the exact indicators used and their source
The Youth Guarantee in light of changes in the world of work Youth Guarantee Intervention Models Sustainability and Relevance
29
cal variable for the estimated yearly costs relative to GDP for offering interven-
tions to all NEETs is included derived from Eurofound (2015a) The comparison of
both allows judgement of the importance of EU transfers in financing the YG
ii The degree to which Member States allocated additional funding from the ESF to
fund measures related to youth employment is measured in data about ldquoOther
ESF EU eligible costsrdquo (European Commission 2018k)
iii To proxy whether Member States dedicated additional funding from national
budgets to finance YG-related measures the evolution of overall active labour
market spending from 2012 to 2015 is used (Eurostat lmp_expsumm)19
iv Finally the degree to which Member States were able to absorb the additional
funding from the YEI in a timely manner is measured by the share of EU eligible
costs among YEI+ESF funds that were actually declared YEI+ESF funds based on
data from European Commission (2018k)
222 Indicator set 2 The Youth Guarantee as part of national policy-
making
The second set of indicators reflects the degree to which Member States made efforts to
introduce elements of the YG into national policy making and started partnerships
Regarding reform efforts the following indicators are included
i The degree to which the YG spurred wider longer-term reforms in Member States
is quantified by the total number of youth-related active labour market policy re-
forms between 2013-2016 based on LABREF information (the European Commis-
sionrsquos labour database)20
ii In addition the degree to which Member States were committed to the policy
change is approximated by the number of areas in which additional measures
were taken in the context of YG beyond the scope of the Recommendation (based
on European Commission 2016c)21
iii Finally the degree to which Member States were able to set up an effective YG
monitoring and follow-up system is taken into account as an indication of whether
they were committed to delivering the YG This means including 2016 data for the
proportion of YG exits with unknown destinations and the proportion of unknown
situations in the six-month follow-up data (European Commission 2018a)
The degree of partnerships built in each Member State is measured using the following
indicators
iv The degree to which partnerships were an element of the initial YG design is in-
cluded using the Member Statesrsquo self-reported involvement of social partners and
19 At the time of writing this report more recent data was only available for relatively small subset of EU countries
20 The authors refrain from using 2017 data on labour market reforms from the LABREF database as the objective is to measure the degree to which the YG was a driver of reforms in Member States That is this link becomes weaker over time such that the added value of more recent data
for the analysis is questionable
21 Due to their high correlation with LABREFrsquos own variations indicators of receipt and implemen-tation of country-specific recommendation between 2013-2017 and the qualitative classification by the Commission for the extent to which YG has acted as a driver of reform (European Commission 2016a) are not included in the set of indicators used
The Youth Guarantee in light of changes in the world of work Youth Guarantee Intervention Models Sustainability and Relevance
30
youth organisations in the design implementation and monitoring of the YG
(based on European Commission 2016c)22
v Furthermore the involvement of partners is approximated using the number of
areas where the PES is declared to have formed partnerships (based on European
Commission 2017a)23 In addition indicators are included for national PES re-
ported as having involved youth organisations and young people in the design of
YG services (based on European Commission 2017a)
223 Indicator set 3 Youth labour market challenges
To reflect how the challenges faced by young people in their transition from STW differ
across Member States the following empirical indicators are considered
i A set of indicators that reflect the significance of the youth unemployment chal-
lenge at the time when the YG was designed and rolled out These include the ra-
tio of unemployment rates for youth (age 15-24) and adults (age 25-74) the
share of people aged 15-24 of the total population (age 15-74) and the NEET
rate among youth aged 15-29 to obtain a measure of the size of the NEET chal-
lenge also for Member States that target individuals up to 29 years of age (Euro-
stat lfsa_pgaed une_rt_a edat_lfse_14 all indicators were measured in 2012)
ii To measure the initial degree of labour market segmentation and the quality of
entry-level jobs available to youth in each Member State the absolute difference
in the share of youth (15-24) to adults (25-54) in terms of the number on tempo-
rary employment contracts in 2012 (Eurostat lfsi_pt_a)
iii To address Member Statesrsquo response to these conditions several indicators are
included on the degree to which employment offers were favoured possibly re-
flecting a ldquowork-firstrdquo approach specifically the number of offers of employment
relative to the total number of all types of offers that are typically made to young
people registered in YG schemes (based on European Commission 2018b) In ad-
dition this includes a measure for the employment intensity of timely exits in
2016 (the share of all timely exits that were employment offers based on Euro-
pean Commission 2018b)
iv Lastly two indicators approximate the performance of education and training sys-
tems from which youth enter into the labour market and the potential severity of
the skills mismatch first the share of early school-leavers from education and
training among the youth population (age 18-24) in 2012 (Eurostat
edat_lfse_14) and second the share of NEETs with low and medium educational
attainment in 2012 To approximate the YG implementation with respect to skills
mismatches the number of offers of education relative to the total number of all
types of offers that are typically made to young people registered in YG schemes
is used (based on European Commission 2018b) In addition a measure is in-
cluded for the education intensity of timely exits in 2016 ie the share of all
timely exits that were education offers (based on European Commission 2018b)
22 An alternative source for partnership information is provided by ETUC (2018) Their data is ndash in
contrast to the data employed ndash not self-reported by the Member States However the ETUC (2018) report contains substantial missing information and hence was not used
23 Namely PES partnerships aimed at (i) ensuring that young people have full information and support available (ii) increasing employment apprenticeship and traineeship opportunities and (iii) supporting transitions from unemployment inactivity or education into work
The Youth Guarantee in light of changes in the world of work Youth Guarantee Intervention Models Sustainability and Relevance
31
224 Indicator set 4 The heterogeneity of the NEET population
The next set of indicators aims to reflect the diversity of the NEET population While
some indicators have already been introduced in the indicators above (for example NEET
rates by educational attainment) this additionally integrates the following
i The composition of NEETs as measured by the share of NEETs that are short-term
or long-term unemployed individuals about to re-enter education or employment
discouraged NEETs youth with illnesses or disabilities and the share of NEETs
with family responsibilities This gives an indication of the NEETsrsquo activity status
the potential reasons for their NEET status and their degree of closeness to the
labour market (Eurofound 2016 all indicators measured in 2013)24
ii Indicators describing the links between the PES for the YG This includes the
number of responsibilities of the PES in the YG as well as their main outreach
tools based on European Commission (2017a) Furthermore it includes indicators
on whether the PES is the main body responsible for the administration and pay-
ment of unemployment andor other types of benefits (based on European Com-
mission 2017a)
iii An indicator from European Commission (2017a) that reflects whether the re-
spective PES is reported to have taken any additional measures with respect to
preventing school drop-out
225 Indicator set 5 Design and implementation features of the Youth Guarantee
This set covers further design and implementation indicators that are likely to affect the
performance of the YG as implemented by the Member States
i Indicators on the envisaged length of the preparatory phase the eligible age
group the main YG provider whether online registration is possible for potential
YG participants as well as whether Member States created a legal entitlement to
receive an offer (all based on European Commission 2016c) In addition there is
an indicator measuring whether Member States specifically target the long-term
unemployed (Escudero and Mourelo 2017)
ii A categorical indicator providing information on whether a YG-related scheme was
already in place (in the long-term or recently) before the Recommendation
(based on European Commission 2016c)
iii Information on whether the Member States established a formal definition of a
good quality offer within the YG scheme (European Commission 2016a) and
whether quality management guidelines exist from the national administration to
organisations involved in YG (based on European Commission 2017a)
iv Indicators to reflect the relevance and potential upscaling of national PES capacity
since the YG Recommendation (all reflecting 2017 responses of PES based on
European Commission 2017a) These include whether the PES has dedicated YG
staff whether the PES provides training for YG staff whether the PES staff in-
creased or remained the same from 2014-2017 and whether the PES has specific
targets for youth (ibid)
24 Optionally the use of a more general measure of the NEET Cluster Type was tested which is a composite indicator on different levels reflecting the STW transition system and the composition of NEET in 2012 (Eurofound 2016) However as the clustering is based on the share and STW transition type data already employed the indicator is not used in the analysis
The Youth Guarantee in light of changes in the world of work Youth Guarantee Intervention Models Sustainability and Relevance
32
226 Indicator set 6 The role of the apprenticeship system in the Youth Guarantee
The final set of indicators represents the relevance and the set-up of apprenticeships in
the national education and training system as well as their role in the YGs implementa-
tion
i To provide information on the STW transition types of Member States indicators
are included based on the classification by Pohl and Walther (2005 2007) Fur-
thermore an indicator on the share of firms employing initial vocational training
participants in 2010 is used (Ireland 2015) (Eurostat trng_cvt_34s)
ii To reflect the relevance of apprenticeships in the YG implementation indicators
on the number of offers of apprenticeships relative to the total number of all
types of offers that are typically made to young people registered in YG schemes
(based on European Commission 2018b) In addition a measure for the appren-
ticeship-intensity of timely exits in 2016 ie the share of all timely exits that
were apprenticeship offers (based on European Commission 2018b)
iii The normalised number of pledges from firms and institutions to the European Al-
liance for Apprenticeships between the outset of the YG in 2013 and 2018 (based
on the national commitments database25)
23 Conclusion
This chapter has provided a comprehensive overview of the main aspects of the YG im-
plementation in context Specifically subsection 21 discussed a) the main financial re-
sources for implementing the YG b) the YGrsquos integration within national policy-making
c) the YG and youthrsquos labour market challenges d) the diversity of the NEET population
e) design and implementation features of the YG and f) the role of the apprenticeship
system in the YG Section 22 proceeded to identify and map six sets of empirical indica-
tors to each of these six implementation aspects In total 76 empirical indicators were
identified which will form the basis of the systematic analysis of a YG typology in the
next section Figure 5 gives a graphic overview of the number of indicators included in
each of the six indicator sets representing the key implementation aspects
25 The national commitments database available at httpeceuropaeusocialmainjspcatId=1148amplangId=en as of September 17 2018 This data-base also provides information on the number of pledges made by firms and institutions For the analysis the number of pledges is normalised by the share of firms employing IVET participants in each Member State to account for the relevance of the VET system
The Youth Guarantee in light of changes in the world of work Youth Guarantee Intervention Models Sustainability and Relevance
33
Figure 5 Number of indicators identified by variable set
Source Own analysis
Figure 5 illustrates that for example indicator set (5) ndash which represents the design and
implementation features of the YG ndash is the largest set comprising 20 indicators Whereas
the indicator sets (1) on financial resources for implementing the YG and (6) on the role
of the apprenticeship system (6) are somewhat smaller they still contain seven and nine
indicators respectively
3 Typology of Youth Guarantee models
This section is the empirical part of the analysis Based on the identification of the set of
relevant implementation aspects and the corresponding empirical indicators in the previ-
ous section Chapter 3 intends to systematise the main models that are currently in
place for delivering the YG in Member States It is an empirical attempt at establishing a
typology of different intervention models based on cluster analysis This section also
explores whether a correlation between specific types of intervention models and per-
formance in delivering the YG can be identified
31 Empirical approach to establishing Youth Guarantee models
To address the question about which main models are currently in place for delivering
the YG the analysis groups Member States according to their similarity across the em-
pirical indicators presented in section 22 Since both contextual features and implemen-
tation-related factors are included this procedure identifies types of countries that are
similar in both dimensions
To detect these types cluster analysis techniques are used in which the goal is to find
groups of observations in the data ndash that is groups of Member States ndash that are most
similar within clusters while being as dissimilar as possible across clusters In this study
hierarchical agglomerative clustering methods are employed These methods start out by
specifying each Member State as one individual cluster The cluster approach then grad-
ually combines Member States into clusters The choice of which clusters are to be com-
bined is determined by comparing their (dis-) similarity In the empirical application an
adequate measure of dissimilarity is the coefficient by Gower (1971) as it allows for the
combination of binary indicators and multivalued variables The choice of the linkage
method (the way the clustering algorithm combines similar observations into clusters) is
of similar importance in this case the Ward method (1963) is chosen which combines
groups or observations if they increase the within-group variance of the chosen indica-
tors by the least amount possible in the data Lastly the authors needed to choose the
7
11
11
18
20
9 (1) Financial resources for implementing the YG
(2) YG as part of national policy-making
(3) Youth labour market challenges
(4) Heterogeneity of NEET population
(5) Design and implementation features of the YG
(6) Role of the apprenticeship system in the YG
The Youth Guarantee in light of changes in the world of work Youth Guarantee Intervention Models Sustainability and Relevance
34
number of clusters to be generated Since this is not obvious in the application at hand
the Duda-Hart optimality criterion as described by Milligan and Cooper (1985) was ap-
plied This means that intuitively the index computes the added value of increasing the
number of clusters by one so a low Duda-Hart index indicates an optimal number of
clusters In the YG case the comparison is restricted to between three and seven clus-
ters as fewer clusters provide too little information while too many clusters hamper the
interpretability of results
The empirical application follows a two-step procedure In the first step a cluster analy-
sis for each set of the empirical indicators defined in section 22 determines sets of coun-
tries that are similar within each of these six conceptual sets For example the set on
financial resources puts countries with magnitudes of expected and realised costs for
implementing the YG based on the available information together In the second step
the main cluster analysis based on all indicators determines a final cluster analysis which
also allows the authors to analyse their correspondence to the sub-clusters from the first
stage Readers should note that the quality of the cluster groups depends ndash among other
factors- on the data quality of available indicators as well as the number of indicators
used The more indicators are required for meaningful results the more difficult it is to
obtain clusters that differ sharply with respect to all the chosen indicators Thus it may
be that one country differs quite substantially in terms of one indicator from the rest of
the countries in a particular cluster if the other indicators show similar realisations
Hence for the description of clusters attention is restricted to those indicators that
summarise the cluster differences the best presenting the general tendencies of the
cluster analysis necessarily simplifying to a certain degree Furthermore readers should
also note that the groupings following from this exercise do generally not imply any
qualitative ranking
32 Description of first-step clusters
321 Indicator set 1 Financial resources
Cluster A (AT DK FI DE LU NL and SE) is a set of countries with a low estimated cost
of fully implementing the YG that received relatively little financial support from EU
funds both via the YEI and the ESF On average these states show very little changes in
active labour market policy (ALMP) spending between 2012 and 2015
Cluster B (BE CZ EE FR IE IT MT RO SI and UK) and Cluster C (ES LT LV PL and
PT) are countries with costs estimated to be of medium magnitude to fully implement
the YG Country cluster C received more EU funds from the YEI and the ESF matching
funds - and other ESF eligible youth-related projects - compared to cluster B Both clus-
ters showed only a small change in ALMP expenditure
Cluster D (BG CY EL HU HR and SK) has high estimated YG costs and they received
substantial monetary support from the EU to support the implementation of the YG
through the YEI through the ESF matching funds and through financing of other eligible
youth-related projects Cluster D is also the only one in the analysis that shows a sub-
stantial increase in ALMP spending between 2012 and 2015 despite declining (youth)
unemployment rates
322 Indicator set 2 Youth Guarantee as part of national policy-
making
Cluster A (DK ES FR HU IE SE and SK) has a large average number of youth-related
ALMP reforms and additional measures implemented beyond the scope of the Recom-
mendation These Member States also tend to enforce comparatively effective YG moni-
The Youth Guarantee in light of changes in the world of work Youth Guarantee Intervention Models Sustainability and Relevance
35
toring and follow-up systems which may be interpreted as an indication that they are
committed to deliver on the YG However on average these Member States did not pri-
oritise partnerships as much as other clusters
Cluster B (AT CZ DE EE EL NL RO and UK) is mostly defined by the lack of effective
monitoring and follow-up systems and also fewer reforms were put in place compared to
Member States in other clusters Nonetheless on average they put more emphasis on
involving social partners and youth organisations and built more partnerships than coun-
tries in cluster A
Cluster C (BE BG CY FI HR IT LV LT LU MT PL PT and SI) implemented many
youth-related reforms and additional measures as part of the implementation of YG rec-
ommendations However in contrast with cluster A these Member States also included
partnerships with social partners and youth organisations as a central element of the
initial YG design Consequently the PES in these Member States often said that they had
formed partnerships and that they regularly involve youth and youth organisations into
their work Nonetheless their monitoring systems are still underperforming compared to
countries in Cluster A
323 Indicator set 3 Youth labour market challenges
Cluster A (BG CY EL HR PL and SK) includes Member States that had the highest
NEET rate amongst 15-29 year olds in 2012 before the YG was rolled out Moreover
they show the largest difference in shares of temporary employment contracts between
the youth and adults Countries in this cluster have the best educated NEETs on average
This also reflects the point that the issue was not so much the education system as the
figures also show a comparatively low average shares of school drop-outs Correspond-
ingly Member States in cluster A usually responded by focusing on employment-related
measures under the YG rather than offers of education
Cluster B (AT DE DK ES LV and MT) relates to the contrasting cases These Member
States tend to have comparatively low NEET shares with most of them having a poor
level of education and the lowest average youth-to-adult unemployment ratio In addi-
tion these countries appear to have a rather well-functioning educational system with
similarly low average shares of early school-leavers compared to cluster A Most of
these Member States responded to this setting with a strong focus on educational offers
under the YG
Cluster C (BE CZ EE FI FR HU IE IT LT LU NL PT RO SI SE and UK) ranks in
between cluster two and three on many indicators including the prevalence of low edu-
cated NEETs education and employment offers In general this cluster has the lowest
difference in temporary employment shares between adults and the youth
324 Indicator set 4 The heterogeneity of the NEET population
Cluster A (BE BG FI MT and NL) consists of countries that have a particularly high
share of NEETs in short-term unemployment illness or disability and lsquodiscouragement
from workingrsquo The policy response of these countries is characterised by the highest
average outreach efforts on the part of the national PES
Cluster B (CZ DE EE EL FR HU HR LT LU PL SI and UK) has the highest share of
short-term unemployed and individuals with family responsibilities among the NEETs
Similar to cluster A countries from cluster B display strong average outreach efforts and
a large degree of involvement of the PES in delivering the YG
The Youth Guarantee in light of changes in the world of work Youth Guarantee Intervention Models Sustainability and Relevance
36
Cluster C (AT CY DK ES IE IT LV PT RO SK and SE) is the most diverse for this
indicator set and shows the highest share of long-term unemployed and relatively high
rates of discouraged youth among the NEET population compared to other clusters The
governance structure shows a lower degree of PES having responsibility for administer-
ing and paying (unemployment) benefits as well as regarding the implementation and
delivery of the YG in general Compared to clusters A and B Member States from cluster
C tend to show fewer outreach efforts
325 Indicator set 5 Design and implementation features of the Youth Guarantee
Cluster A (AT CY DE DK EL FI HR IE LU and SE) includes many Member States
which set the age target as under-25 years old26 These countries also tend to define
very few other eligibility criteria or target groups Importantly all Member States includ-
ed in this category have a relatively long experience of YG-type schemes prior to 2013
However only very few of them defined a legal entitlement to receive an offer These
are also countries that mostly allowed individuals to register online set a definition for a
quality offer and also provided national quality guidelines for all actors involved in the
YG Many of the Member States in this cluster also primarily rely on their PES in the YG
implementation and have strengthened their PES capacities since the YG rollout
Cluster B (BG CZ ES FR MT NL PT and RO) includes a relatively diverse set of coun-
tries Most countries in this cluster have no prior experience of a YG-type of scheme
relatively low availability of online registration and a low prevalence of the definition of
quality offers While some countries additionally target NEETs under 30 years old in
general they neither upgraded the capacity of nor relied strongly on their PES in its im-
plementation
Cluster C (BE EE HU IT LV LT PL SI SK and UK) primarily consists of countries that
set the target for youth aged under 30 In addition many of these countries set addi-
tional target groups beyond the general criteria (such as a specific focus on long-term
unemployed) or defined specific sub-groups within the broad target population Similar
to cluster A some Member States with previous YG-related experience are included in
this cluster In addition they tend to have upgraded their PES capacity for YG implemen-
tation (but they also rely on other providers) These are also mainly countries that im-
plemented a legal entitlement and also a definition of a quality offer (without however
providing national guidelines)
326 Indicator set 6 The apprenticeship system
Cluster A (AT BE DE FR LU and NL) consists of countries with an employment-centred
STW transition type27 that is characterised by high levels of employer involvement in
education and training system and the largest share of firms employing initial vocational
and educational training (IVET) participants On average Member States in this group
show the largest share of timely exits from apprenticeships Relative to the share of
firms employing IVET participants the number of pledges within the EAFA framework is
26 It is important to note that most implementation-related indicators for example information on eligible age groups were measured in 2016 For a few countries these conditions have changed recently However in the analysis it was decided to stick to the initial implementation features to focus on the way Member States initially aimed to combat youth unemployment
27 See Pohl and Walther (2005) for details
The Youth Guarantee in light of changes in the world of work Youth Guarantee Intervention Models Sustainability and Relevance
37
the lowest in this group potentially reflecting the already high importance of apprentice-
ships in these countries
Cluster B (BG CZ EE HU LT LV RO SK and SI) is made up of Member States that
joined the EU relatively recently with a lsquotransitionalrsquo STW transition type and the lowest
share of firms employing IVETs Their share of apprenticeships is lowest among the
timely exits and their number for EAFA pledges is relatively the largest
Compared to cluster A and B cluster C (CY DK EL ES FI HR IE IT MT PL PT SE
and UK) also consists of a mixture of STW types and a medium share of firms hiring
IVETs Apprenticeship offers are of medium importance relative to the other two clus-
ters
327 Summary of first-step cluster analysis
The analysis of Member Statesrsquo similarities within the indicator sets shows that the re-
sulting country clusters tend to be different depending on the set of indicators although
certain tendencies are already apparent For instance countries that are included in the
same cluster for the YG design and implementation indicators tend to also be grouped
into the same finance cluster meaning that some countries with a low estimated cost of
implementing the YG tend to also be countries that show implementation patterns that
closely followed the Recommendation Similarly countries in the same apprenticeship
cluster tend to be in the same ldquoyouth labour market challengesrdquo cluster While this al-
ready provides some suggestions for the final grouping of Member States with respect to
all indicators chosen the overlap across clusters for the different indicator sets is not
complete so a more in-depth analysis is needed Specifically some clusters remain rela-
tively heterogeneous in terms of the underlying empirical indicators indicating that the
cluster analysis has some difficulties if Member Statesrsquo realisations of indicators do not
follow a simple pattern making the interpretation of some cluster results more difficult
than others For these reasons and to further reduce the dimensionality of the problem
the next section groups Member States based on all the chosen indicators To make the
connection between the first-step analysis and the ensuing second step the association
of first-step clusters with the final cluster results is also shown
The Youth Guarantee in light of changes in the world of work Youth Guarantee Intervention Models Sustainability and Relevance
38
33 Results and discussion of second-step clusters
The final cluster analysis uses all the indicators described in the previous section and
performs the clustering procedure for all variables in a combined step thereby arriving
at clusters that take the individual sub-clusters as well as the interaction between them
into account Table 2 shows the results by Member States including their association
with the clusters uncovered in the first stage of the analysis all ordered by the final re-
sults Being in the same first-step cluster is visualised as having the same shade of the
colour in the respective column It is important to note that the colours chosen imply no
qualitative or quantitative judgement apart from the cluster membership
Table 2 Summary of Results of Cluster Analysis
Country
Financial resources for implementing the YG
YG as part of national policymaking
Youth labour market chal-lenges
Heterogenei-ty of the NEET population
Design and implementa-tion features of the YG
Role of the apprentice-ship system in the YG
Overall cluster
Austria
A
Denmark
Finland
Germany
Ireland
The Netherlands
Sweden
The Czech Republic
B
Estonia
France
Hungary
Romania
The United Kingdom
Cyprus
C
Greece
Italy
Portugal
Spain
Belgium
D
Lithuania
Luxembourg
Malta
Poland
Slovenia
Bulgaria
E Croatia
Latvia
Slovakia
Source Own analysis
Note Countries that share the same first-stage cluster have the same shade of the colour in the respective
column Note that the colour shades imply no qualitative or quantitative ranking of Member States
The Youth Guarantee in light of changes in the world of work Youth Guarantee Intervention Models Sustainability and Relevance
39
Cluster A Member States with previous YG experience lower initial NEET rates
ambitious implementation and improved PES capacity low educated NEETs and
diversified offers (AT DK DE FI IE NL SE)
The first cluster is a set of Member States that are mostly countries which already had
longer experience with YG-related schemes On average YG implementation in these
countries was quite ambitious many of these Member States undercut the recommend-
ed four-month target for the preparatory phase and formally defined their offer quality
and quality guidelines Countries in this cluster tend to rely relatively strongly on their
PES for the YG while upscaling their PES capacity through hiring additional staff At the
same time they also experienced the lowest average NEET rates in 2012 for all clusters
and they consequently had comparatively low estimated costs and therefore low levels of
funding allocated under the YEI However the clusterrsquos NEET population has the highest
share of individuals with low educational background and youth with a disability Follow-
ing this NEET challenge they diversified their offers under the YG across types the most
compared to other clusters with the lowest focus on employment-type offers Involve-
ment and integration of partners within the YG framework in these countries was about
average compared to the other clusters
Cluster B Member States with intermediate NEET challenges strong outreach
efforts by the PES relatively poor monitoring data quality high NEET rates due
to family responsibilities and strong focus on employment offers (CZ EE FR HU
RO UK)
On average these Member States mostly observed a NEET challenge of intermediate
magnitude relative to other clusters at the time of the YG roll-out The labour markets
for youth in this cluster were under more stress and characterised by high rates of short-
term unemployment among their youth ndash for some of them also as a consequence of the
great recession Furthermore this cluster also had by far the highest share of youth that
were NEETs due to family responsibilities and the largest gap between youth and adult
unemployment rates As a result most of them received some funding under the YEI It
is also notable that countries in this cluster showed the largest increase in ALMP ex-
penditure between 2012 and 2015 However compared to the other clusters countries
in this cluster showed particularly poor monitoring data quality so their information has
a high degree of unknown destinations and situations for previous YG participants On
implementation a significant fraction of Member States from cluster B chose slightly
different targets (for example through targeting long-term unemployed introducing a
legal entitlement to a YG offer and extending the age limit up to age 29) They could
build on a comparatively advanced outreach system through the PES which they also
relied on in their YG implementation Furthermore four of the seven countries in this
cluster follow the post-socialisttransitional STW model (the Czech Republic Estonia
Hungary and Romania) On average these countries showed the lowest level of in-
volvement of the social partners and youth organisations and relatively few efforts at
reform On average countries in this cluster had the highest rate of timely exits into
employment indicating a tendency towards an ldquoemployment-firstrdquo approach
Cluster C Member States hit by the economic recession with highest initial
NEET rates severe long-term unemployment large support via EU funding
highest reform efforts and highest entry rates into apprenticeship offers (CY EL
ES IT PT)
The third cluster consists mainly of Member States that were hit particularly hard by the
economic recession following the financial crisis in the years after 2008 and they were
struggling to revive their labour markets in the ensuing recovery As a consequence
most countries had a severe problem with long-term youth unemployment into 2012
The Youth Guarantee in light of changes in the world of work Youth Guarantee Intervention Models Sustainability and Relevance
40
Moreover countries in this cluster had on average the highest rate of early school-
leavers Almost all these Member States received significant funds from the EU to sup-
port the YG implementation and delivery In contrast to Member States in Clusters A and
B none of the countries in cluster C had any kind of experience of a YG type of frame-
work before the Recommendation making its implementation even more difficult in
these countries However in terms of policy integration these Member States rank at
the top of youth-related ALMP reform efforts At the same time most of these countries
still have monitoring systems with relatively poor data quality and their PES used rela-
tively few channels for outreach activities compared to countries in the other clusters
Regarding partnerships built countries in this cluster show an average degree of effort
While the share of low educated NEET is comparable to those in Cluster B and average
exits rates into education are only slightly smaller than among countries from Cluster B
the share of individuals entering apprenticeships is highest among these countries sug-
gesting a stronger focus on the provision of both training and work experience to combat
the NEET challenge
Cluster D Member States characterised by relatively low initial NEET rates and
short-term unemployed rather than inactive NEETs some funding under YEI
strong outreach efforts through the PES and partnership approach and diversi-
fied offers with a stronger focus on education offers (BE MT LT LU PL SI)
The challenge for most Member States in this cluster was the high proportion of youth in
unemployment rather than a structural NEET challenge as most of their NEETs are
short term unemployed rather than discouraged NEETs or inactive for other reasons
Most of the countries in cluster D have medium-level estimated costs of fully implement-
ing the YG Consequently most of these Member States did not receive particularly large
amounts of funding from the EU (except Lithuania and Poland) At the same time these
are mainly Member States that put the most weight on building partnerships involving
social partners and youth organisations as well as outreach efforts including through the
PES Many of the Member States in this cluster followed the Recommendation quite
closely in terms of the time-frame for the YG but they did not establish strong monitor-
ing systems and they did not carry out many youth-related reforms in recent years
relative to other Member States In terms of the offer distribution these countries gen-
erally showed diversified offers with the strongest focus on education measures shown
by the largest share of timely exits from the YG into education and the lowest focus on
employment offers This is despite the fact that on average clusters B C and D had
very similar shares of low and medium educated NEETs at the onset of the YG suggest-
ing a very different policy response
Cluster E Member States that joined the EU relatively recently with lsquotransi-
tionalrsquo STW regimes high initial NEET rates structural challenges and substan-
tial EU funding focus on employment offers rather high reform efforts (BG HR
LV SK)
This cluster consists entirely of countries that joined the EU relatively recently compared
to the other Member States They are countries with a lsquotransitionalrsquo STW regime and
without prior experience in YG-type of frameworks before the Recommendation While
these countries have the lowest rate of early school-leavers and a substantially lower
share of low educated individuals among the NEETs compared to the other clusters this
cluster has the second largest share of NEETs with family responsibilities and the largest
share of discouraged youth This suggests that they struggled with more significant
structural NEET challenges compared to the other clusters The high NEET rates resulted
in high estimated costs for implementing the YG and consequently these Member States
also received substantial funding from the EU
The Youth Guarantee in light of changes in the world of work Youth Guarantee Intervention Models Sustainability and Relevance
41
Moreover these Member States also put in place a significant number of youth-related
ALMP reforms between 2013 and 2016 only outpaced by cluster C In terms of design
and implementation all of these countries chose to target youth under 30 and most put
particular emphasis on long-term unemployed individuals The degree of outreach efforts
through the PES is of average magnitude but the involvement of social partners and
youth organisations is highest among countries in this cluster This may indicate a cer-
tain degree of mismatch regarding outreach activities and the efforts likely to be re-
quired to activate the substantial share of discouraged NEETs in the youth population
However this cluster is the only in which all the Member States have YG-specific staff at
the PES and where all of them increased PES staff in recent years Due to the relatively
well-qualified nature of the NEET population Member States in this cluster concentrated
mostly on employment-type offers
34 Conclusion of second-step clusters
Breaking down the differences between clusters in a simple way is evidently challenging
due to the many aspects considered and highlighted in the cluster-specific characterisa-
tions This section therefore only provides a short conclusion to the findings in the final
cluster analysis indicating several sorts of Youth Guarantee models in place in the Euro-
pean Union It shows three clusters with comparatively low initial NEET rates at the out-
set of the YG Cluster A Cluster B and Cluster D What distinguishes these clusters from
one another among other issues is that Member States in Cluster A already had a long-
er experience of YG-related schemes they observed fewer youth-related challenges and
hence they received less additional funds from the EU
In contrast to this most Member States with the most pressing NEET challenges in 2012
are found in the other two clusters Cluster C and Cluster E include Member States with
particular NEET challenges mostly related to the financial crisis and recession for coun-
tries in Cluster C Member States in Cluster E also had a particular structural NEET chal-
lenge partially stemming from the transitional STW regime and they all received signifi-
cant funding from the EU
35 Measures of performance
Before investigating the correlation between the types of European YG models identified
and the performance of the YG implementation the analysis needs to define the relevant
outcome measures employed for this last step of the empirical analysis The correlation
analysis will make substantive use of information from the YG monitoring data The most
recent data available at the time of writing are from 2016 and they include information
on the main dimensions of the Recommendation
i ldquoCoveragerdquo rate provides an estimation of the degree to which the NEET popula-
tion was reached by the YG (the estimated proportion of the NEET population
aged 15-24 that was enrolled in the YG scheme at any point during the reference
year)28
28 These figures are based on the indicator average annual stock of young people in the YG pre-
paratory phase NEET population (annual average) included in the Indicator Framework for Moni-
toring the Youth Guarantee This indicator combines administrative and survey data Whilst this is not ideal the indicator is useful to give an approximate indication of the proportion of NEETs regis-tered in the YG scheme at any point during the year Results should therefore be interpreted as an estimation rather than a definitive measurement of the extent to which YG schemes achieve the objective of reaching all young people that become or are already NEET
The Youth Guarantee in light of changes in the world of work Youth Guarantee Intervention Models Sustainability and Relevance
42
ii The share beyond the four-month target the share of young people in the pre-
paratory phase beyond the four-month goal measured as a percentage of the
average annual stock of participants
iii Positive and timely exits the share of positive and timely exits shows how suc-
cessful Member States were at providing offers within the envisaged four-month
preparatory phase measured in percentage of all exits
iv Positive situations after six months this measure gives the percentage of YG par-
ticipants being in a positive situation at six months after exiting the programme -
the share of individuals either in education training or employment as a percent-
age of all exits
These performance indicators provide the most comprehensive and direct evidence on
the performance of the YG However there are some data limitations regarding the de-
gree to which the entire NEET population can be identified relevant for the comparability
of the coverage rate across Member States The quality of information on positive and
timely exits as well as the share of participants in a positive situation after exiting the YG
depends on the degree to which the destination of exits is known and how well individu-
als can be followed up Again to a certain degree this limits comparability across coun-
tries The distribution of these indicators across Member States is depicted in Figure 6 For the interested reader a separate cluster analysis solely based on the measures of YG
performance in Table 4 is included in the Annex
The Youth Guarantee in light of changes in the world of work Youth Guarantee Intervention Models Sustainability and Relevance
43
Figure 6 YG-monitoring data performance indicators by Member States 2016
Source YG monitoring data
0
10
20
30
40
50
60
70
80
90
100M
T
HU
UK
BG IT RO CY LV LU EE ES LT IE EL SE SK NL
CZ
HR PL
DK PT SI DE
FR BE FI AT
Coverage rate Share beyond the 4 month target
0
10
20
30
40
50
60
70
80
90
100
CY UK RO FR EL SI HR SK IE BG PT NL LV SE ES LU LT BE PL FI AT EE DE CZ IT DK HU MT
Positive and timely exits Positive situations after 6 months
The Youth Guarantee in light of changes in the world of work Youth Guarantee Intervention Models Sustainability and Relevance
44
To account for measuring issues in the monitoring data and because the main goal of
the YG was to lower youth unemployment and the prevalence of NEETs in general the
reduction from 2012 to 2017 in NEET rates and youth unemployment rates based on
Eurostat indicators is used as additional outcome measures
v Youth unemployment this measure gives the percentage of the 15-24 year old
young people in the labour force that are unemployed
vi NEET rates the NEET rate indicator is defined as the share of the youth popula-
tion (active or inactive) aged 15-24 that is not in employment education or
training
The distribution of these indicators is shown in Figure 7
Figure 7 Eurostat performance indicators by Member States 2012-2017
Source Eurostat (une_rt_a lfsi_neet_a)
36 Assessing the correlation between Youth Guarantee models
and performance
The goal of this section is to compare the performance of the YG as implemented in each
Member State across the clusters identified in section 34 and then to assess emerging
patterns This will be done by using box plots shown for each of the performance indica-
tors separately Box plots allow the comparison of the distribution of indicators across
clusters The median ie the observation in the middle in terms of outcomes (for in-
stance the middle value of all coverage rates within a cluster Figure 8 upper left panel)
is shown by the horizontal lines within each box Furthermore the size of the box shows
the location of the 50 closest observations to the median Observations outside this
box are shown in the graph by the so-called lsquowhiskersrsquo Extreme values that are far away
from the box are displayed as dots Figure 8 shows the distribution of performance
measures for the YG monitoring data
-5
0
5
10
15
20
FI AT
BE IT DE
FR LU NL
CY
DK
MT
RO SE EE UK SI LV CZ EL PL LT PT ES HR SK BG IE
HU
Reduction in youth unemployment Reduction in NEET rates
The Youth Guarantee in light of changes in the world of work Youth Guarantee Intervention Models Sustainability and Relevance
45
Figure 8 YG monitoring data performance indicators by clusters
Source Own analysis
The graph for the coverage rate (upper left panel) shows that clusters A and D have the
highest median coverage rates among the five clusters This appears quite natural as
these countries have had the lowest NEET rates at the onset of the YG making it easier
to cover a large portion of vulnerable youth compared to other countries Clusters B C
and E perform relatively similarly in terms of coverage with median values in the range
of 20 to 40 coverage rate despite the fact that clusters C and E had considerably larg-
er NEET rates when the YG was first introduced Among other factors these two clusters
have in common is that they received substantial funds from the EU to support YG
measures and that countries from both clusters enacted a significant number of youth-
related ALMP reforms
The upper right panel displays results for the share of participants still being in the pre-
paratory phase beyond the envisaged four months in each of the clusters A B D and E
this share is in the range of 45 to 50 in terms of the median values in cluster C this
value is 60 Clusters B and D show considerably more variation than the other clus-
ters The figure indicates therefore that the countries in cluster C appear to have put in
comparatively lower effort to upscaling their PES to provide YG services in time reflected
in the fact that these countries have the highest share of individuals in the preparatory
phase beyond the four month target
With respect to positive and timely exits (bottom left panel) there is no pronounced vari-
ation in terms of median outcomes across the clusters All of the clusters have positive
and timely exit rates of around 40 or slightly higher Finally looking at the share of
positive situations for YG participants after 6 months of leaving the programme (bottom
right panel) one can see that the median outcomes are quite similar for all clusters ex-
cept cluster B which has substantially lower positive outcomes after 6 months In addi-
tion there appear to be substantial differences in the within-cluster variation of this out-
The Youth Guarantee in light of changes in the world of work Youth Guarantee Intervention Models Sustainability and Relevance
46
come however this finding is probably due to the lack of data since for some Member
States these figures are not available (and coded as zero in the monitoring data) A simi-
lar reasoning can be used to explain the large variation between clusters A and D
Figure 9 Aggregate performance measures
Source Own analysis
Figure 9 investigates the reductions in youth unemployment rates and NEET rates from
2012 to 2017 respectively Both graphs display a similar pattern although the reduction
in youth unemployment is generally larger implying that a larger reduction was
achieved among those youth closer to the labour market Focusing on the cluster medi-
ans the figure indicates that cluster A ndash the cluster with the lowest initial NEET and un-
employment rates ndash shows the smallest decline Clusters B C and D show relatively
similar reductions in youth unemployment cluster E being at the top of the distribution
The picture is slightly different when looking at the reduction of NEET rates Here cluster
C has the largest median reduction in NEETs and clusters B D and E display similar per-
formance despite differences in variability Thus cluster E ndash the cluster with a combina-
tion of high initial NEET rates and more structural issues (such as a high share of dis-
couraged NEETs) ndash was more successful in reducing youth unemployment while clus-
ter C (with similarly high NEET rates for 2012 but lower educated NEETs and the highest
apprenticeship take-up rate in terms of timely exits among all clusters) was more suc-
cessful in reducing its NEET rates
4 Summary and conclusions
This report provides an updated overview of the implementation of the YG across EU
Member States based on the recent literature and data on the YG and European labour
markets On this basis six aspects of the Youth Guarantee implementation are dis-
cussed (1) financial resources for implementing the YG (2) the YG as part of national
policy making (3) youth labour market challenges (4) the heterogeneity of the NEET
population (5) the design and implementation features of the YG and (6) the role of the
apprenticeship system in the YG
The overall findings of the desk research and data analysis can be summarised as fol-
lows EU funding initiatives via the Youth Employment Initiative (YEI) and the European
Structural Fund (ESF) played a key role in supporting YG measures financially especially
for those countries suffering from high NEET rates and a significant economic downturn
or structural challenges Many of these countries increased spending on active labour
market policy which may be cautiously interpreted as an indirect effect of the YG In
some Member States the YG also fostered introduction of reforms of national youth poli-
The Youth Guarantee in light of changes in the world of work Youth Guarantee Intervention Models Sustainability and Relevance
47
cies improvements in monitoring systems for activation policies among young people
and the building of partnerships These changes are likely to outlast the YG initiative and
therefore provide sustained and ongoing benefits
Whereas these are substantive positive changes brought about by the YG not all of its
objectives were achieved First neither reducing labour market segmentation through
quality offers nor providing a remedy for imperfectly performing education systems was
fully achieved One reason was a prevalence of employment offers compared to relative-
ly few education or apprenticeship offers The low share of apprenticeship offers in some
Member States appears to be related to the existing institutional setup and STW transi-
tion regime increasing the prominence of the apprenticeship system would need to be
accompanied by broader institutional change Second several Member States were not
able to fully address the heterogeneity of the NEET population ndash especially those furthest
away from the labour market In contrast countries that performed well generally im-
proved the capacity of their Public Employment Services (PES) and developed partner-
ships to implement strong outreach programmes
Based on desk research of the six key aspects that are likely to influence the perfor-
mance of the YG as delivered by Member States a set of empirical indicators was de-
fined to measure the components of these six aspects using available quantitative and
qualitative data These empirical indicators feed into the main part of the analysis that
identifies the YG typology in terms of the key aspects specifically this approach groups
together Member States that share similar outputs across all the features included in the
analysis In practice the typology is derived from a two-step cluster analysis using an
agglomerative clustering algorithm
The first step of the typology discusses the similarity between Member States regarding
implementation-related and contextual features within six pre-defined sets of indicators
each corresponding to one of the six key aspects of the YG The cluster analysis gener-
ates different group compositions regarding Member States for each of the sets of empir-
ical indicators defined so a low-dimensional analysis is only partially informative This
result indicates that many aspects of the YG ndash and their interrelation ndash need to be con-
sidered in a comprehensive typology The second-step cluster analysis therefore simul-
taneously takes into account all of the 76 empirical indicators and identifies five final
clusters
Cluster A Member States with previous YG experience lower initial NEET rates ambi-
tious implementation and improved PES capacity low educated NEETs and diversified
offers (AT DK DE FI IE NL SE)
Cluster B Member States with intermediate NEET challenges strong outreach efforts by
the PES relatively poor monitoring data quality high NEET rates due to family responsi-
bilities and strong focus on employment offers (CZ EE FR HU RO UK)
Cluster C Member States hit by the economic recession with highest initial NEET rates
severe long-term unemployment large support via EU funding highest reform efforts
and highest entry rates into apprenticeship offers (CY EL ES IT PT)
Cluster D Member States characterised by relatively low initial NEET rates and short-
term unemployed rather than inactive NEETs some funding under YEI strong outreach
efforts through the PES and partnership approach and diversified offers with a stronger
focus on education offers (BE MT LT LU PL SI)
Cluster E Member States that joined the EU relatively recently with lsquotransitionalrsquo STW
regimes high initial NEET rates structural challenges and substantial EU funding focus
on employment offers rather high reform efforts (BG HR LV SK)
The Youth Guarantee in light of changes in the world of work Youth Guarantee Intervention Models Sustainability and Relevance
48
Obviously these explicit labels for the clusters tend to simplify the other factors of het-
erogeneity across Member States that determine the typology However some conclu-
sions can be drawn regarding the fit of underlying challenges to be addressed with the
policy response observed In particular it appears that countries in Cluster A C and D
reflected the challenges observed in the design and implementation of the YG to a higher
degree compared to cluster B and E as policies implemented ndash for example regarding
outreach efforts the extent of partnerships and the offer mix introduced ndash seem to bet-
ter match key factors of heterogeneity in the NEET population
Based on these insights the analysis continues with a correlation analysis relating the
identified YG models to basic performance indicators The findings highlight that there is
no evident pattern regarding the clustersrsquo performance in general Cluster A performs
well in terms of the NEET ldquocoveragerdquo rate but less well regarding the reduction in NEET
and unemployment rates over time Clusters B and D perform relatively similar across all
outcome measures although there is some variation that probably stems from meas-
urement issues in the monitoring data Cluster C shows the largest share of youth in the
preparatory phase beyond the envisaged four months but also the largest median de-
cline in NEET rates Cluster E has the lowest share of positive and timely exits but the
largest decline in youth unemployment out of all clusters
While the evidence is thus far from conclusive partly due to the number and complex
inter-relation of the aspects in which clusters differ the reportrsquos findings nonetheless
indicate that not only initial conditions but also the way Member States implement the
YG has affected its success
The Youth Guarantee in light of changes in the world of work Youth Guarantee Intervention Models Sustainability and Relevance
49
References
Andor L and Veselyacute L (2018) The EUrsquos Youth Guarantee a broadly accepted reform in
need of full implementation OSE paper series No 19
ANPAL (2017) Rapporto sullrsquoattuazione della Garanzia Giovani in Italia Rapporto
trimestrale n 4 Roma
ANPAL (2018) Monitoraggio sulla struttura e il funzionamento dei servizi per il lavoro
2017 Roma
Council of the European Union (2013) Council Recommendation of 22 April 2013 on es-
tablishing a Youth Guarantee Official Journal of the European Union Brussels
Department of Education and Skills (2016) Evaluation of the operation of the Youth Em-
ployment Initiative (YEI) element of the European Social Fund (ESF) Programme for Em-
ployability Inclusion and Learning (PEIL) 2014-2020
Department of Social Protection (DSP) (2014a) Pathways to Work - The Implementation
of the EU Council Recommendation for a Youth Guarantee
Department of Social Protection (DSP) (2016a) Member Statesrsquo response to 2013 Coun-
cil Recommendation on establishing a Youth Guarantee [Ireland]
Dheacuteret C and Roden J (2016) Towards a Europeanisation of Youth Employment Poli-
cies ndash A Comparative Analysis of Regional Youth Guarantee Policy Designs EPC Issue
Paper Ndeg81
Dheacuteret C and Morosi M (2015) lsquoOne Year After the Youth Guarantee Policy Fatigue or
Signs of Actionrsquo EPC Policy Brief Brussels European Policy Centre (EPC)
Doherty R (2018) lsquoWritten answer ndash Youth Guaranteersquo Daacuteil Eacuteireann Debate 22 March
2018
Eichhorst W Hinte H and Rinne U (2013) Youth Unemployment in Europe What to
Do about It IZA Policy Paper No 65 July httpftpizaorgpp65pdf
Employment Committee (EMCO) (2017) Ireland - 2017 EMCO Review on the Youth
Guarantee ndash Self-Assessment Questionnaire
Escudero V and E Loacutepez Mourelo (2017) The European Youth Guarantee A systematic
review of its implementation across countries Research Department Working Paper No
21 ILO Geneva
Eurofound (2013a) Young People and Temporary Employment in Europe Publications
Office of the European Union Luxembourg
Eurofound (2013b) Working Conditions of Young Entrants to the Labour Market Publica-
tions Office of the European Union Luxembourg
Eurofound (2014) Mapping Youth Transitions in Europe 2372014 Publications Office
of the European Union Luxembourg
Eurofound (2015a) Beyond the Youth Guarantee - Lessons Learned in the First Year of
Implementation Background Document prepared by Eurofound as a contribution to the
informal EPSCO meeting of 16-17 July 2015 Publications Office of the European Union
Luxembourg
Eurofound (2015b) Social Inclusion of Young People Publications Office of the European
Union Luxembourg
Eurofound (2016) Exploring the diversity of NEETs Publications Office of the European
Union Luxembourg
Eurofound (2017) Long-term unemployed youth Characteristics and policy responses
Publications Office of the European Union Luxembourg
The Youth Guarantee in light of changes in the world of work Youth Guarantee Intervention Models Sustainability and Relevance
50
European Alliance for Apprenticeship (2013) ldquoDeclaration of the European Social Part-
ners the European Commission and the Lithuanian Presidency of the Council of the Eu-
ropean Unionrdquo Brussels
European Commission (2011) Youth Opportunities Initiative ndash Communication From The
Commission To The European Parliament The Council The European Economic And So-
cial Committee And The Committee Of The Regions Brussels
European Commission (2013) Guidebook for Policy Planners and Practitioners on Ap-
prenticeship and Traineeship Schemes in EU27 December
European Commission (2016a) The Youth Guarantee and Youth Employment Initiative
three years on European Commission Directorate-General for Employment Social Af-
fairs and Inclusion Brussels
European Commission (2016b) Staff working documents 1 on ldquoThe Youth Guarantee
and Youth Employment Initiative three years onrdquo European Commission Directorate-
General for Employment Social Affairs and Inclusion Brussels
European Commission (2016c) Member Statesrsquo response to 2013 Council Recommenda-
tion on establishing a Youth Guarantee survey results unpublished
European Commission (2016d) Youth Guarantee Country by Country March 2016
European Commission (2017a) Report on PES Implementation of the Youth Guarantee
European Commission Directorate-General for Employment Social Affairs and Inclusion
Publications Office of the European Union Luxembourg
European Commission (2017b) Assessment Report on PES Capacity European Commis-
sion and Directorate-General for Employment Social Affairs and Inclusion Publications
Office of the European Union Luxembourg
European Commission (2017c) Education amp Training Monitor 2017 Comparative Report
European Commission (2017d) JobsPlus Youth
European Commission (2017e) Youth Guarantee Country by Country March 2017
European Commission (2017f) Draft Joint Employment Report from the Commission and
the Council accompanying the Communication from the Commission on the Annual
Growth Survey 2018 COM (2017) 674 final Brussels
European Commission (2017g) Employment and Social Developments in Europe 2017
European Commission (2017h) European Semester Thematic Factsheet ndash Employment
Protection Legislation
European Commission (2018a) The Youth Guarantee Country by Country Brussels
European Commission (2018b) Data collection for monitoring of Youth Guarantee
schemes Employment Social Affairs amp Inclusion
European Commission (2018c) Continued Education Offers in the Youth Guarantee -
Experience from the ground
European Commission (2018d) Traineeship offers under the Youth Guarantee
European Commission (2018e) Activation measures for young people in vulnerable situ-
ations - Experience from the ground
European Commission (2018f) Effective outreach to NEETs - Experience from the
ground
European Commission (2018g) Youth Guarantee amp Youth Employment Initiative Fact-
sheet 2762018
European Commission (2018h) Employment and entrepreneurship under the Youth
Guarantee ndash Experiences from the ground
The Youth Guarantee in light of changes in the world of work Youth Guarantee Intervention Models Sustainability and Relevance
51
European Commission (2018i) Employment and Social Developments in Europe 2018
European Commission (2018j) data on national commitments regarding the European
Alliance for Apprenticeships httpeceuropaeusocialmainjspcatId=1148amplangId=en
European Commission (2018k) ESF and YEI financial data by end 2017 submitted
through SFC2014 by Member States ndash Note EU amounts have been calculated on the
basis of the applicable co-financing rates
European Commission (2018l) Continued Education Offers under the Youth Guarantee ndash
Experience from the ground Brussels
European Court of Auditors (2017) Youth unemployment ndash have EU policies made a dif-
ference An assessment of the Youth Guarantee and the Youth Employment Initiative
Publications Office of the European Union Luxembourg
European Employment Policy Observatory (EEPO) (2015) EEPO Country Reports ndash Ire-
land Implementation of the 2013 Recommendation on establishing a Youth Guarantee
European Parliament (2015) Differential Treatment of Workers under 25 with a view to
their Access to the Labour Market Directorate General for Internal Policies Policy De-
partment A Economic and Scientific Policy
European Parliament (2017a) Workshop Summary Report Youth Guarantee and Youth
Employment Initiative Lessons from implementation Policy Department A Economy
and Scientific Policy European Parliament Brussels
European Parliament (2017b) Youth Employment Initiative Lessons from implementa-
tion Policy Department A Economy and Scientific Policy European Parliament Brussels
European Parliament (2017c) Youth Guarantee Lessons from implementation Policy
Department A Economy and Scientific Policy European Parliament Brussels
European Parliament (2018) Ensuring high-quality job creation from EU funding pro-
grammes How can the best practice of Horizon 2020 be better integrated into other
programmes (ESF Youth Guarantee Globalisation Fund) Policy Department for Budget-
ary Affairs Directorate General for Internal Policies of the Union
European Trade Union Confederation (2018) Boosting Unionsrsquo Participation to Guarantee
Quality Transitions and Employment to Young People in Europe
European Youth Forum (2017) Excluding youth a threat to our future
European Youth Forum (2018) Updated position on the Implementation of the Youth
Guarantee Brussels Belgium
Eurostat (2015) Being Young in Europe Today
Eurostat (2018) How common is temporary employment in your country
Ghirelli C E Havari G Santangelo and M Scettri (2019) ldquoDoes on-the-job Training
Help Graduates Find a Job Evidence from an Italian Regionrdquo forthcoming in the Inter-
national Journal of Manpower 40(1)
Gower J C (1971) A general coefficient of similarity and some of its properties in
Biometrics Vol 27 Nr 4 S 857ndash872
Gregg P and Tominey E (2005) The wage scar from male youth unemployment La-
bour Economics 12 487ndash509
Indecon (2016) Indecon Evaluation of JobBridge Activation Programme Report pre-
pared by Indecon International Research Economists and submitted to the Department
of Social Protection
International Labour Organisation and European Commission (2017) National Outreach
Strategy for non-registered young unemployed and inactive young people in Portugal
The Youth Guarantee in light of changes in the world of work Youth Guarantee Intervention Models Sustainability and Relevance
52
Leigh-Doyle S (2014) Can subsidised employment and work-first measures assist the
labour market integration of low-skilled unemployed youth Peer Country Comments
paper ndash Ireland EU Peer Review on lsquoEmplois drsquoavenirrsquo ndash Jobs with a futurersquo Scheme Par-
is (France) 10-11 February 2014
Milligan G W and Cooper M C (1985) An examination of procedures for determining
the number of clusters in a dataset Psychometrika 50 159-179
OrsquoReilly J Eichhorst W Gaacutebos A Hadjivassiliou K Lain D Leschke J McGuin-
ness S Kurekovaacute L M Nazio T Ortlieb R Russell H and Villa P (2015) lsquoFive
Characteristics of Youth Unemployment in Europe Flexibility Education Migration
Family Legacies and EU Policyrsquo SAGE Open January-March 2015 1ndash19
Pastore F (2018) Why is youth unemployment so high and different across countries
IZA World of Labor 2018 420 doi 1015185izawol420
Pastore F (2015) The Youth Experience Gap Explaining National Differences in the
School-to-Work Transition Heidelberg Springer International Publishing AG 2015
Pohl A and Walther A (2005) Tackling Disadvantage in Youth Transitions - A Themat-
ic Study on Policy Measures Concerning Disadvantaged Youth Report funded by the EU
Action Programme to combat Social Exclusion October
Pohl A and Walther A (2007) Activating the Disadvantaged ndash Variations in Address-
ing Youth Transitions across Europe International Journal of Lifelong Education 265
pp533-553
Quintini G and Martin S (2014) lsquoSame Same but Different School-to-Work Transi-
tions in Emerging and Advanced Economiesrsquo OECD Social Employment and Migration
Working Papers No 154 OECD Publishing
Quintini Glenda and Martin John P and Martin Seacutebastien (2007) The Changing Nature
of the School-to-Work Transition Process in OECD Countries WDA-HSG Discussion Paper
No 2007-2
Scarpetta S A Sonnet and Manfredi T (2010) lsquoRising Youth Unemployment During
The Crisis How to Prevent Negative Long-term Consequences on a Generationrsquo OECD
Social Employment and Migration Working Papers No 106
Stokes D (2016) Opening gateways to work for youth But can success be guaran-
teed Peer Country Comments Paper ndash Ireland EU Peer Review on The Guarantee for
Youth (a particular measure within the broader context of the Youth Guarantee) Paris
(France) 7-8 April 2016
Tosun J Unt M and Wadensjouml E (2017) Youth‐oriented Active Labour Market Poli-
cies Explaining Policy Effort in the Nordic and the Baltic States Social Policy amp Admin-
istration 51 598ndash616
Treadwell Shine K (2016) lsquoYouth Guarantee in Irelandrsquo Department of Social Protec-
tion presentation Youth Opportunities at EU Level Cork
Walther A (2006) Regimes of Youth Transitions Choice Flexibility and Security in
Young Peoples Experiences across different European Contexts Young Vol 14 No 2
pp119ndash139
Ward J H Jr (1963) Hierarchical Grouping to Optimize an Objective Function Journal
of the American Statistical Association 58 236ndash244
The Youth Guarantee in light of changes in the world of work Youth Guarantee Intervention Models Sustainability and Relevance
53
Annex
Table 3 List of indicators
Indicator name and time of measurement
Source Explanation
Financial resources for implementing the Youth Guarantee
Initial YEI allocation (2014-2017)
EC (2016b) Euros-tat (nama_10_gdp)
YEI allocation in of GDP
YEI+ESF EU eligible cost
(2017)
EC (2018k) Euros-
tat (nama_10_gdp) YEI+ESF eligible cost in of GDP
Other ESF eligible cost (2017)
EC (2018k) Euros-tat (nama_10_gdp)
Other ESF eligible cost in of GDP
Share of declared YEI+ESF funds (2017)
EC (2018k) Declared YEI+ESF funds as a share of eligible cost
Estimated cost of the YG (2015)
Eurofound (2015)
Binary indicator for medium cost (03-06 of
GDP) reference category low cost
Binary indicator for high cost (gt06 of GDP) reference category low cost
Change in ALMP expenditure (2012 to 2015)
Eurostat (lmp_expsumm)
Difference in ALMP expenditure in of GDP
YG as part of national policy-making
Number of youth-related ALMP reforms (2013-2016)
LABREF database Absolute number of reforms
Number of additional measures beyond Recom-mendation implemented in the context of the YG (2016)
EC (2016c)
Sum of binary indicators for additional measures regarding school dropout social and welfare policies volunteering social economy and oth-er
Share of YG exits with un-known destination (2016)
EC (2018b)
Binary indicator for an unknown share of 10-30 reference category 0-10
Binary indicator for an unknown share of more than 30 reference category 0-10
Share of unknown situations in the six month follow up
(2016)
EC (2018b)
Binary indicator for an unknown share of 40-99 reference category 0-39
Binary indicator for an unknown share of 100 reference category 0-39
Involvement of social part-ners (2016)
EC (2016c) Sum of binary indicators for the involvement of social partners in design implementation and evaluationmonitoring
Involvement of youth organi-sations (2016)
EC (2016c) Sum of binary indicators for the involvement of social partners in design implementation and
evaluationmonitoring
PES involvement of youth in design of YG (2017)
EC (2017a) Binary indicator
PES involvement of youth organisations in design of YG (2017)
EC (2017a) Binary indicator
Partnerships formed by PES (2017)
EC (2017a)
Sum of binary indicators for PES partnerships aimed at increasing information availability increasing workeducation opportunities and easing the transition into employment from educationunemployment
The Youth Guarantee in light of changes in the world of work Youth Guarantee Intervention Models Sustainability and Relevance
54
Indicator name and time of measurement
Source Explanation
Youth labour market challenges
Youth share of total popula-tion (2012)
Eurostat (lfsa_pgaed)
Number of youth (15-24) expressed as of total population
Youth-to-adult unemploy-ment ratio (2012)
Eurostat (une_rt_a) Youth (15-24) unemployment rate divided by adult unemployment rate (25-74)
NEET rate among 15-29 year
olds (2012)
Eurostat
(edat_lfse_21)
Total number of NEETs aged between 15 and 29
in of total youth population
Difference in temporary em-ployment shares (2012)
Eurostat (lfsi_pt_a) Difference in temporary employment rates be-tween youth (15-24) and adults (25-54)
Share of early school-leavers (2012)
Eurostat (edat_lfse_14)
Share of early school-leavers as of youth population (18-24)
Share of low-educated NEETs
(2012) Eurostat (edat_lfse_21)
Number of NEETs with low education back-
ground divided by total number of NEETs (15-24)
Share of medium-educated NEETs (2012)
Number of NEETs with medium education back-ground divided by total number of NEETs (15-24)
Share of employment offers (2016)
European Commis-sion (2018b)
Number of employment offers as of total offers typically made to participants
Share of timely exits into employment (2016)
European Commis-sion (2018b)
Number of exits into employment as of total timely exits from the YG
Share of education offers (2016)
European Commis-sion (2018b)
Number of education offers ias of total offers typically made to participants
Share of timely exits into education (2016)
European Commis-sion (2018b)
Number of exits into education as of total timely exits from the YG
The heterogeneity of the NEET population
Share of re-entrants among NEET (2013)
Eurofound (2016) Number of individuals in the respective group in of total NEET population
Share of short-term unem-ployed among NEET (2013)
Share of long-term unem-ployed among NEET (2013)
Share of individuals with illnessesdisabilities among NEET (2013)
Share of individuals with family responsibilities among NEET (2013)
Share of discouraged workers among NEET (2013)
PES responsibility regarding paying of unemployment benefits (2017)
European Commis-sion (2017b)
Binary indicator for the PES responsibility
PES responsibility regarding administering unemployment benefits (2017)
PES responsibility regarding other types of benefits
(2017)
The Youth Guarantee in light of changes in the world of work Youth Guarantee Intervention Models Sustainability and Relevance
55
Indicator name and time of measurement
Source Explanation
Number of responsibilities of the PES within the YG (2017)
European Commis-sion (2017a)
Sum of binary indicators for the PES being re-sponsible for managing the YG scheme regis-tering unemployed youth providing (placement) services to youth coordinating partners out-reach to NEETs follow-up of participants and design and maintenance of the monitoring scheme
PES outreach activities
(2017)
European Commis-
sion (2017a)
Binary indicator for the PES having awareness raising initiatives
Binary indicator for the PES having outreach programmes for pro-active work with schools
Binary indicator for the PES to cooperate with NGOs and youth organisations for outreach
Binary indicator for the PES to have specific outreach caseworkers
Binary indicator for the PES to have new points of entry (via new media)
Binary indicator for the PES to provide single-point servicesone-stop shops
Binary indicator for the PES to have mobile PES initiatives
Binary indicator for the PES to have follow-up programmes to reach out to YG drop-outs
PES programme for prevent-ing high school dropout (2017)
European Commis-sion (2017a)
Binary indicator
Design and implementation features of the Youth Guarantee
Eligible age group (2016) European Commis-sion (2016c)
Binary indicator for YG eligible age group being under 25 year and recent graduates reference category under 25
Binary indicator for YG eligible age group being under 26 reference category under 25
Binary indicator for YG eligible age group being
under 27 reference category under 25
Binary indicator for YG eligible age group being under 30 reference category under 25
Envisaged time-frame of intervention (2016)
European Commis-sion (2016c)
Binary indicator for the target time frame being below 4 months reference category 4 months
Binary indicator for the target time frame being above 4 months reference category 4 months
YG scheme specifically tar-geting long-term unemployed (2016)
Escudero and Mourelo (2017)
Binary indicator
Main YG provider (2016) European Commis-sion (2016c)
Binary indicator for the YG to be provided main-ly by the PES and other institutions reference category only PES
Binary indicator for the YG to be provided main-
ly by other institutions reference category only PES
The Youth Guarantee in light of changes in the world of work Youth Guarantee Intervention Models Sustainability and Relevance
56
Indicator name and time of measurement
Source Explanation
Degree to which online regis-
tration for the YG is possible (2016)
European Commis-sion (2016c)
Binary indicator for online registration being partly possible reference category not at all
Binary indicator for online registration being
possible everywhere reference category not at all
Legal entitlement to offer (2016)
European Commis-sion (2016c)
Binary indicator for whether there exists an entitlement for young people to receive an offer in line with or similar to the Youth Guarantee
Previous experience with a
YG-type of framework (2014)
European Commis-
sion (2016c)
Binary indicator for having recent experience with a YG-type of framework reference catego-ry none
Binary indicator for having longer experience with a YG-type of framework reference catego-ry none
Formal definition of quality
offer (2016)
European Commis-
sion (2016c)
Binary indicator having formally defined offer
quality
National quality guidelines (2017)
European Commis-sion (2017a)
Binary indicator having national quality guide-lines from the national administration to all PES officesother organisations involved in the YG
PES has YG-specific staff (2017)
European Commis-sion (2017a)
Binary indicator for having YG-specific staff
PES training (2017) European Commis-sion (2017a)
Binary indicator for the PES providing training specifically tailored working with youth
PES staff increase (2014-2017)
European Commis-sion (2017a)
Binary indicator for the PES having in-creasedunchanged staff from 2014-2017
PES has youth-specific tar-
gets (2017)
European Commis-
sion (2017a)
Binary indicator for the PES having youth-
specific targets
The role of the apprenticeship system in the YG
Share of firms with IVET participants (2010)
Eurostat (trng_cvt_34s)
Share of firms hiring initial vocational training participants expressed as a of all firms
Share of apprenticeship of-fers (2016)
European Commis-sion (2018b)
Number of offers of apprenticeships as of total offers typically made to participants
Share of timely exits into apprenticeships (2016)
European Commis-sion (2018b)
Number of exits into apprenticeships as of total timely exits from the YG
School-to-work transition cluster (2005)
PohlWalther (2005)
Binary indicator for STW being of type transi-tionalpost-socialist reference category miss-ing
Binary indicator for STW being of type sub-protective reference category missing
Binary indicator for STW being of type univer-salistic reference category missing
Binary indicator for STW being of type liberal reference category missing
Binary indicator for STW being of type employ-ment-centred reference category missing
Number of EAfA pledges (2018)
European Commis-sion (2018j)
Number of pledges to increase apprenticeships by firms or organisations normalised by the share of firms hiring IVETs
The Youth Guarantee in light of changes in the world of work Youth Guarantee Intervention Models Sustainability and Relevance
57
Table 4 Outcome cluster means
Cluster A Cluster B Cluster C Cluster D
ldquoCoveragerdquo rate (in ) 488 76 479 448
Share in preparatory phase beyond four
months (in )
433 284 606 519
Share of positive and timely exits (in ) 511 740 366 372
Share with positive situation after six
months (in )
576 521 562 60
Reduction in youth unemployment (in
-points)
37 121 145 62
Reduction in NEET rates (in -points) 11 42 43 18
Note This table shows cluster means (averages) for a cluster analysis solely based on the authorsrsquo measures
of performance (see section 35 for their description) The analysis creates Cluster A (AT BE DK IT LT LU
and SE) Cluster B (BG HU and MT) Cluster C (EL ES HR IE PT and SK) and cluster D (CY CZ DE EE FI
FR LV NL PL RO SI and UK)
The Youth Guarantee in light of changes in the world of work Youth Guarantee Intervention Models Sustainability and Relevance
58
HOW TO OBTAIN EU PUBLICATIONS
Free publications
bull one copy
via EU Bookshop (httpbookshopeuropaeu)
bull more than one copy or postersmaps
from the European Unionrsquos representations (httpeceuropaeurepresent_enhtm)
from the delegations in non-EU countries
(httpeeaseuropaeudelegationsindex_enhtm)
by contacting the Europe Direct service
(httpeuropaeueuropedirectindex_enhtm) or calling 00 800 6 7 8 9 10 11 (free-
phone number from anywhere in the EU) () () The information given is free as are most calls (though some operators phone boxes or hotels may charge you)
Priced publications
bull via EU Bookshop (httpbookshopeuropaeu)
Priced subscriptions
bull via one of the sales agents of the Publications Office of the European Union
(httppublicationseuropaeuothersagentsindex_enhtm)
doi 102767371432
KE-0
1-1
9-1
28-E
N-N

The Youth Guarantee in light of changes in the world of work Youth Guarantee Intervention Models Sustainability and Relevance
2
Table of contents
1 The Youth Guarantee background and outline of the study 6 11 The youth employment challenge in the European Union 6 12 The Youth Guarantee 8 13 Outline of the project and the present report 9
2 Implementation features of the YG and related indicators 10 21 Features of Youth Guarantee implementation 10
211 Financial resources for implementing the Youth Guarantee 10 212 The Youth Guarantee as part of national policy-making 14 213 Youth labour market challenges 17 214 The heterogeneity of the NEET population 21 215 Design and implementation features of the Youth Guarantee 24 216 The role of the apprenticeship system in the Youth Guarantee 26
22 Empirical indicators of Youth Guarantee features 28 221 Indicator set 1 Financial resources for implementing the Youth Guarantee 28 222 Indicator set 2 The Youth Guarantee as part of national policy-making 29 223 Indicator set 3 Youth labour market challenges 30 224 Indicator set 4 The heterogeneity of the NEET population 31 225 Indicator set 5 Design and implementation features of the Youth Guarantee 31 226 Indicator set 6 The role of the apprenticeship system in the Youth Guarantee 32
23 Conclusion 32
3 Typology of Youth Guarantee models 33 31 Empirical approach to establishing Youth Guarantee models 33 32 Description of first-step clusters 34
321 Indicator set 1 Financial resources 34 322 Indicator set 2 Youth Guarantee as part of national policy-making 34 323 Indicator set 3 Youth labour market challenges 35 324 Indicator set 4 The heterogeneity of the NEET population 35 325 Indicator set 5 Design and implementation features of the Youth Guarantee 36 326 Indicator set 6 The apprenticeship system 36 327 Summary of first-step cluster analysis 37
33 Results and discussion of second-step clusters 38 34 Conclusion of second-step clusters 41 35 Measures of performance 41 36 Assessing the correlation between Youth Guarantee models and performance 44
4 Summary and conclusions 46
References 49
Annex 53
The Youth Guarantee in light of changes in the world of work Youth Guarantee Intervention Models Sustainability and Relevance
3
List of Figures
Figure 1 Youth unemployment rates (15-24 years old) in EU Member States 2015 compared to 2018 7 Figure 2 Rates of young people (15-24 years old) not in employment education or training (NEET) in EU Member States 2015 2017 8 Figure 3 Absolute number of youth-related active labour market reforms between 2013 and 2016 14 Figure 4 Composition of the EU NEET population (percentage of the population of young people) 23 Figure 5 Number of indicators identified by variable set 33 Figure 6 YG-monitoring data performance indicators by Member States 43 Figure 7 Eurostat performance indicators by Member States 44 Figure 8 YG monitoring data performance indicators by clusters 45 Figure 9 Aggregate performance measures 46
List of Tables
Table 1 Overview of actors involved in implementing the YG in 10 Member States 16 Table 2 Summary of Results of Cluster Analysis 38 Table 3 List of indicators 53 Table 4 Outcome cluster means 57
The Youth Guarantee in light of changes in the world of work Youth Guarantee Intervention Models Sustainability and Relevance
4
Executive summary
The economic recession following the financial crisis and its prolonged aftermath com-
pounded the challenge that substantial youth unemployment put on the Member States
of the European Union In addition changes in the world of work for example increas-
ingly complex school-to-work transitions and new challenges arising from rapid techno-
logical changes may further impede the labour market prospects of young people
The Youth Guarantee (YG) was launched as a Council Recommendation adopted by all
Member States in 2013 in particular as a response to the high cyclical unemployment
among its youth The YG meant that all young people aged between 15 and 24 would
receive a good quality offer of employment training education or apprenticeship within
a period of four months of becoming unemployed or leaving formal education Following
this recommendation EU Member States took steps to introduce such a scheme albeit
with widely varying national approaches on (among many other differences) target
groups timing the types of interventions used and the types of partnerships
This report synthesises the vast amount of available information on the implementation
of the YG and its performance Based on an extensive desk research in its first part the
study identifies six key aspects of YG implementation and delivery as well as background
characteristics that are important determinants of YG performance across Member
States specifically these are (1) the financial resources for implementing the YG (2)
the role of the YG as part of national policy making (3) challenges for the youth labour
market (4) the heterogeneity of the NEET population (5) the design and implementa-
tion features of the YG and (6) the role of the apprenticeship system in the Youth Guar-
antee The overall findings of desk research and data analysis indicate that in sum EU
funding via the Youth Employment Initiative (YEI) and the European Social Fund (ESF)
played a key role in supporting YG measures financially especially for countries suffering
from simultaneously high NEET rates and a significant economic downturn or structural
labour market challenges Many of these countries increased spending on active labour
market policies which can be interpreted with caution as an indirect effect of the YG In
some Member States the YG also fostered the introduction of reforms to national youth
policies improvements in monitoring systems for youth activation policies and the
building of new partnerships These changes are likely to outlast the YG initiative and
thereby provide sustained and ongoing benefits
Whereas these are substantive positive changes brought about by the YG not all of its
objectives were achieved First neither reducing labour market segmentation through
quality offers nor providing a remedy for imperfectly performing education systems was
fully achieved One reason was a prevalence of employment offers compared to relative-
ly few education or apprenticeship offers in the YG The low share of apprenticeship of-
fers in some Member States appears to be related to the institutional setup and school-
to-work (STW) transition regime increasing the prominence of the apprenticeship sys-
tem would need to be accompanied by broader institutional change Second several
Member States were not able to fully address the heterogeneity of the NEET population ndash
especially those furthest away from the labour market In contrast countries that per-
formed well generally improved the capacity of their Public Employment Services (PES)
and developed partnerships to implement strong outreach programmes
The second part of the study builds on the six key aspects to develop a Youth Guarantee
typology this novel approach uses cluster analysis techniques to identify groups of simi-
lar countries This analysis highlights several insights for the implementation of the
Youth Guarantee across Member States firstly country clusters within the single key
aspects are not always the same as the final country clusters for all six key aspects
Second certain contextual and implementation variables are clearly correlated suggest-
The Youth Guarantee in light of changes in the world of work Youth Guarantee Intervention Models Sustainability and Relevance
5
ing that some implementation features relate to each other for instance some countries
with a low estimated cost for implementing the YG tend to be countries that closely fol-
lowed the Recommendation in particular in terms of timing of the intervention and tar-
get groups chosen Other Member States with a more pronounced NEET challenge are
more likely to deviate from the recommendation for example by increasing the targeted
time frame of intervention
The most comprehensive version of the cluster analysis simultaneously takes into ac-
count all six key aspects and a total of 76 empirical indicators that properly reflect these
key aspects and identifies five final clusters
Cluster A Member States with previous YG experience lower initial NEET rates ambi-
tious implementation and improved PES capacity low educated NEETs and diversified
offers (AT DK DE FI IE NL SE)
Cluster B Member States with intermediate NEET challenges strong outreach efforts by
the PES relatively poor monitoring data quality high NEET rates due to family responsi-
bilities and strong focus on employment offers (CZ EE FR HU RO UK)
Cluster C Member States hit by the economic recession with highest initial NEET rates
severe long-term unemployment large support via EU funding highest reform efforts
and highest entry rates into apprenticeship offers (CY EL ES IT PT)
Cluster D Member States characterised by relatively low initial NEET rates and short-
term unemployed rather than inactive NEETs some funding under YEI strong outreach
efforts through the PES and partnership approach and diversified offers with a stronger
focus on education offers (BE MT LT LU PL SI)
Cluster E Member States that joined the EU relatively recently with lsquotransitionalrsquo STW
regimes high initial NEET rates structural challenges and substantial EU funding focus
on employment offers rather high reform efforts (BG HR LV SK)
Evidently these explicit labels for the clusters tend to simplify the other factors of heter-
ogeneity across Member States that determine the typology However some conclusions
can be drawn regarding the fit of underlying challenges to be addressed with the policy
response observed In particular it appears that countries in Cluster A C and D reflected
the challenges observed in the design and implementation of the YG to a higher degree
compared to cluster B and E as policies implemented ndash for example regarding outreach
efforts ndash seem to better match key factors of heterogeneity in the NEET population
In a final step the study investigates the YG models resulting from the typology and
basic performance indicators Cluster A performs well in terms of the NEET ldquocoveragerdquo
rate but less well regarding the reduction in NEET and unemployment rates over time
Clusters B and D perform relatively similar across all YG outcome measures Cluster C
shows the largest share of youth in the preparatory phase beyond the envisaged four
months but also the largest median decline in NEET rates Cluster E has the lowest share
of positive and timely exits but the largest decline in youth unemployment out of all clus-
ters
Whereas therefore the evidence is not fully conclusive partly due to the number and
complex inter-relation of the aspects in which clusters differ the reportrsquos findings none-
theless clearly indicate that not only initial conditions but also the way Member States
implement the YG has affected its success
The Youth Guarantee in light of changes in the world of work Youth Guarantee Intervention Models Sustainability and Relevance
6
1 The Youth Guarantee background and outline of the
study
An essential aim of the policies that promote economic growth and social equity is to
ensure that young people are adequately educated that they enter the labour market
smoothly and that they then continue successfully through a lifetime in employment
through till retirement Young people face a wide range of structural challenges ndash fre-
quently perceived as increasingly complex ndash regarding their school-to-work (STW) tran-
sition and their long-term labour market prospects (Quintini et al 2007)
The economic recession of the late 2000s and its aftermath exacerbated these challeng-
es while the on-going Fourth Industrial Revolution comprising innovations in digitalisa-
tion artificial intelligence and robotics is constantly generating new and potentially fun-
damental challenges In general these developments have resulted in the following pat-
terns (i) a dramatic rise of youth unemployment in most countries during the recession
together with relatively low employment rates (ii) lengthier complex unstable and
non-linear STW transitions (iii) a deterioration in the quality of youth employment com-
bined with greater precariousness (iv) the patchy availability of quality work experience
which increasingly plays a crucial role in STW transitions (v) increased inactivity dis-
couragement and labour market detachment and (vi) greater labour market vulnerabil-
ity for disadvantaged youth such as the low-skilled migrants and young people with a
disability and more generally young people not in employment education or training
(NEETs)
While the wider macro-economic situation including business cycle fluctuations together
with the recession-related economic deterioration of the late 2000s and the subsequent
lsquojob-poorrsquo recovery accounts for these developments they are also rooted in persistent
structural deficiencies These include imperfectly performing education and training sys-
tems with poor outcomes and ensuing skills mismatches and segmented labour markets
(resulting in hollowing-out and skill polarisation) Sometimes poor PES (Public Employ-
ment Service) resources prevent the provision of youth-related tailored services in gen-
eral and in particular concentrating appropriate resources on vulnerable hard-to-reach
young people including certain sub-groups of NEETs (European Commission 2017a)
Yet unsatisfactory early labour market experience and lengthy unstable STW transitions
can lead to long-term lsquoscarringrsquo effects on young people in terms of reduced lifetime
earnings a higher probability of subsequent periods of unemployment a greater likeli-
hood of precarious employment and poorer health and well-being (Gregg and Tominey
2005 Scarpetta et al 2010 European Commission 2017a)
The remainder of this section describes the youth unemployment situation in the Euro-
pean Union (EU) and the challenges it poses for youth generally It also introduces the
Youth Guarantee (YG) and it summarises the joint response to these challenges under-
taken in the EU An explanation of the objectives and content of the present report as
well as the project in general concludes this section
11 The youth employment challenge in the European Union
In the second quarter of 2018 as many as approximately 34 million out of a total of
about 57 million young people in the 15-24 age group were unemployed in the EU (lat-
est available data from Eurostat) Whereas this constitutes a substantial decline from the
peak of 57 million in January 2013 the numbers still remain high the average youth
unemployment rate ndash ie the percentage of unemployment in the 15-24 age group com-
pared to the total labour force in that age group ndash stood at 168 in 2017 in the EU 28
The Youth Guarantee in light of changes in the world of work Youth Guarantee Intervention Models Sustainability and Relevance
7
and the NEET rate (the share of young people neither in employment nor in education or
training) was 109 If young people up to 29 years of age are included the average
rate of youth unemployment in the EU 28 was 127 while the NEET rate reached
134 (amounting to 177 specifically within the 25-29 age bracket) Figures 1 and 2 show the numbers for the 15-24 age group and illustrate the policy chal-
lenge of the youth unemployment rate (Figure 1) and the NEET rate (Figure 2) They
also show the substantial variation across EU countries as Figure 1 shows the youth
unemployment rate (Q2 2018) is below 10 in Austria Germany Estonia Denmark the
Netherlands the Czech Republic and Hungary In the majority of EU countries however
it ranges from 10 to 20 while it is above 30 and up to almost 40 in Italy Spain
and Greece Looking specifically at the most recent development by comparing it with
the Q2 2015 youth unemployment rate however the figure also shows a general down-
ward trend across all EU Member States which is quite pronounced in some countries
(Bulgaria Croatia Malta and Hungary for example)
Looking at the NEET rates in Figure 2 this downward trend in the most recent develop-
ment comparing 2015 and 2017 is also clearly visible Again there is notable variation
across Member States On average EU countries have a NEET rate of around 109 as
of 2017 and Ireland and Poland have NEET rates close to the EU average While the
Netherlands is the only EU country with a rate below 5 Croatia Romania Bulgaria
and Italy have the highest NEET rates with the rate reaching almost 20 in Italy
Figure 1 Youth unemployment rates (15-24 years old) in EU Member States
2015 compared to 2018
Source Authorsrsquo illustration based on latest available Eurostat data youth unemployment rate as percentage
of the active population quarterly average Countries are ordered by Q2 2015 rates Data is seasonally adjust-
ed For Italy and Cyprus the Q1 2018 rates are reported (latest available)
0
5
10
15
20
25
30
35
40
45
50
DE EE AT
DK
NL
CZ
MT LV UK LT SI LU HU IE
EU28 P
L
SE BE
RO FI BG FR SK PT
CY IT HR ES EL
2015Q2 2018Q2
The Youth Guarantee in light of changes in the world of work Youth Guarantee Intervention Models Sustainability and Relevance
8
Figure 2 Rates of young people (15-24 years old) not in employment educa-
tion or training (NEET) in EU Member States 2015 2017
Source Authorsrsquo illustration based on latest available Eurostat data annual averages Countries are in order of
the 2015 rates
In addition to these aggregate statistics the difficulties for youth in the STW transition
can be related to several structural challenges or market failures In particular these
concern (a) Labour market segmentation ndash a labour market pattern in which young
people are over-represented in temporary part-time non-permanent work (b) (under-)
performance of the education and training system ndash the low achievement of a substantial
section of youth in basic and lsquotransversalrsquo (transferable) skills (c) the limited availability
of lsquoqualityrsquo work experience and (d) insufficient capacity of the Public Employment Ser-
vice (PES) to ensure effective provision of tailored services and support for young people
(see European Commission 2017a)
12 The Youth Guarantee
The significant challenges that young people face in relation to fast smooth and effec-
tive STW transitions were exacerbated during and after the recession Since then they
have also acted as a catalyst for policy change in many Member States Accordingly a
YG was introduced following the 2013 Council Recommendation (Council of the European
Union 2013) Together with associated structural reforms of vocational education and
training (VET) and activation policies that are implemented across the EU its aim is to
address these challenges More specifically following a proposal from the European
Commission all Member States adhered to the establishment of the YG committing
themselves to giving every young person a good-quality offer of employment continuing
education or an apprenticeship or a traineeship within a period of four months of be-
coming unemployed or leaving formal education (Council of the European Union 2013)
The idea of YG style policies originated in the Nordic countries where such initiatives
were first implemented in Sweden in 1984 and then elsewhere in the 1990s (Norway in
1993 Denmark and Finland in 1996 see for example Escudero and Loacutepez Mourelo
2017)
In a Communication published three years after the launch of the YG by the European
Commission (2016a) it was observed that the YG had become a reality across the EU
Starting from January 2014 14 million young people had already registered in YG
schemes by 2016 Around nine million young people had taken up an offer the majority
0
5
10
15
20
25N
L
DK
DE
LU SE CZ
AT LT SI
MT LV FI EE PL
UK PT
HU
EU2
8 FR BE SK IE CY ES EL HR
RO
BG IT
2015 2017
The Youth Guarantee in light of changes in the world of work Youth Guarantee Intervention Models Sustainability and Relevance
9
of which were offers of employment almost two thirds of young people who left the YG
in 2015 took up an offer of employment education traineeship or apprenticeship While
the Commission Communication also concluded that the YG has significantly facilitated
structural reforms and innovation in policy design across Member States it also asserted
that nonetheless youth unemployment remained unacceptably high and many chal-
lenges still need to be addressed by Member States
13 Outline of the project and the present report
The main objective of this project is to undertake an up-to-date review of the current
approaches and implementation of the YG especially in view of new challenges for youth
in the changing world of work thereby providing the basis for a future YG model that is
both robust and dynamic
This report constitutes the first phase of the research project In the first phase a com-
prehensive desk review of existing documents and data was undertaken together with
the construction of a database of indicators for a cluster analysis as well as supplemen-
tary country case studies This approach is explained and implemented throughout this
report Aspects that guide the analysis are 1) the degree to which EU financing helped
to implement the YG 2) whether the YG became a sustainable part of national policy
making 3) the main challenges faced by young people in their transition into the labour
market 4) the heterogeneity of the NEET population 5) the design and implementation
features of the YG and 6) the role of apprenticeships in the YG Based on these insights
a typology of YG models is developed and the correlation of these types is assessed re-
garding measures of performance
The second phase of the research project will address the emerging challenges for young
peoplersquos transition into the world of work drawing extensively on consultation with
stakeholders both through an online survey and more importantly through a stakehold-
er seminar held in Brussels on Oct 1 2018 during which experiences with the YG were
exchanged and future challenges identified and discussed The results of this second
phase will be published in a separate report2 Together these two reports should inform
reflection on further developments of the YG
The report at hand is structured as follows Section 2 has two parts the first part identi-
fies the main characteristics of YG implementation in context while the second part de-
fines empirical indicators for these characteristics and their sub-dimensions In section 3
these indicators are used for constructing a typology of YG models also showing how the
different types of models differ regarding performance indicators Section 4 presents the
conclusions of the analysis
2 European Commission (forthcoming) The Youth Guarantee in light of changes in the world of work Emerging challenges related to young peoplersquos transition in the labour market
The Youth Guarantee in light of changes in the world of work Youth Guarantee Intervention Models Sustainability and Relevance
10
2 Implementation features of the YG and related indica-
tors
This section provides a comprehensive overview of the main features that characterise
YG implementation and assess the main features that are likely to determine its success
in Member States It has two steps first section 21 gives an overview of the relevant
dimensions of YG implementation along the six guiding aspects outlined above Based on
this characterisation section 22 discusses the ways in which each of these aspects can
be represented by a set of empirical indicators and which will be used in chapter 3 for a
YG typology The list of indicators for each of the six aspects comprise key contextual
characteristics for each Member State as well as implementation-related features such as
partnerships created as a result of YG implementation or the types of interventions
used In particular indicators that characterise Member States at the outset of the YG
(measured in 2012 or 2013) as well as the way the YG was implemented (mostly meas-
ured up until 2016) inform the typology Indicators of YG performance such as for ex-
ample the estimated proportion of the NEET population reached by the YG (the so-called
YG ldquocoverage raterdquo) are considered outcomes of the way Member States implemented
the YG
The presentation and discussion of intervention features and corresponding empirical
indicators in section 2 is complemented by selected information from five brief country
case studies The case studies are a supplementary element in the review exercise that
feeds into this chapter and they are meant to illustrate the intervention features dis-
cussed throughout the chapter in more detail for selected countries Based on an lsquoex
ante assessmentrsquo of a set of qualitative and quantitative country indicators the following
five countries were selected for case studies Austria Denmark Ireland Italy and Lat-
via The countries were selected firstly to cover (to the extent that is possible) the ex-
isting types of STW regimes and secondly to reflect the heterogeneity of the NEET popu-
lation NEET implementation is characterised by high and low NEET and youth unem-
ployment rates high and low YG coverage and the financial resources put into its im-
plementation3
21 Features of Youth Guarantee implementation
211 Financial resources for implementing the Youth Guarantee
The YG is not a funding programme in itself It is instead a political commitment sup-
ported among other ways by financial contributions from the EU and national budgets
as well as contributions from the private and non-profit sectors This section on the first
YG implementation aspect financial resources briefly outlines the relevance of these
different sources Specific focus will be given to the Youth Employment Initiative (YEI)
and the European Social Fund (ESF) as the main EU sources to financially underpin the
implementation of the YG
Youth Employment Initiative The YEI was established during three informal summits of
EU Heads of State in 2013-14 and then given euro32 billion for the 2014-15 period Eligi-
bility for measures funded through the YEI is confined to young people aged 16-254 who
3 It is important to emphasise the lsquoex-antersquo nature of case study selection they were chosen based on a preliminary set of indicators at the outset of the study whereas the full in-depth identi-fication and discussion of indicators ndash as presented in this chapter ndash and their analysis in Chapter 3
becomes a key element of the study itself 4 The upper age band is 29 in some Member States
The Youth Guarantee in light of changes in the world of work Youth Guarantee Intervention Models Sustainability and Relevance
11
are not in employment education or training (lsquoNEETsrsquo) Funding from the YEI was only
allocated to regions in those Member States where youth unemployment was higher than
25 in 20125 Since national allocations are based on the number of unemployed young
people in 2012 in these regions YEI funds were allocated to a varying extent to each
Member State based on their (regional) unemployment rates (European Commission
2016a) Spain was the largest recipient of the initial YEI specific allocation receiving
euro9435 million and Slovenia the smallest receiving euro92 million In 2015 in view of the
immensity of the youth-employment challenge the European Commission took steps to
ensure a quick mobilisation of its funds6 Specifically a higher pre-financing rate for the
euro32 billion YEI specific allocation in 2015 than for other ESF allocations (30 instead of
the original 1-15 of the specific allocation for other ESF funds) was introduced
This led to an amount of around euro1 billion in additional pre-financing to Member States
in 2015 (European Commission 2016a) In the summer of 2017 during the mid-term
review of the EUrsquos seven-year budget the YEI was extended until 2020 and it received
an additional financial allocation of euro12 billion In addition it was targeted at regions
where youth unemployment still exceeded 25 in 2016 (Andor and Veselyacute 2018) Ac-
cording to the Commissionrsquos report in October 2016 the YEI is seen by Member States
as a key mechanism through which to operationalise national Youth Guarantee schemes
ldquoIn some cases the YEI is being used to support most or all measures planned under the
YG schemes while in others it is one funding source amongst others Countries where
large shares of YG funding comes from the YEI include Lithuania ndash where 23 of all YG
actions are supported by the YEI Poland ndash where 34 of all YG actions YEI funded and
Spain ndash where 80 of all YG actions are funded through the YEIrdquo (European Commis-
sion 2016b p89)
YEI funds were provided from the EU budget as a top-up to the already available ESF
funds for 2014-2020 to provide additional support for programmes with a specific focus
on NEETs (European Court of Auditors 2017) However the funding allocated to each
Member State under the YEI has to be matched by an equal amount from the respective
Member State allocations in the ESF 2014-20 budget This holds for the initial allocation
in 2013 as well as the additional funds in 2017 Hence the total budget of the YEI (for
all eligible EU Member States) now totals euro88 billion for the period 2014-2020
European Social Fund In addition to ESF funds that were directly used to match the YEI
contributions (see above) some Member States also utilised additional funds from the
ESF for further employment-related programmes7 directly or indirectly benefiting youth
but with no specific focus on NEETs In contrast to YEI funds which are intended to di-
rectly support NEETs ESF funds may also be used to support structural reforms In total
Andor and Veselyacute (2018) estimate that approximately euro14-15 billion from the EU budget
over the period 2014-20 financed the implementation of the YG through the YEI and ESF
5 The exact methodology for allocating Youth Employment Initiative funds among Member States is set out in Annexe VIII to the lsquoCommon Provisions Regulationrsquo ie Regulation (EU) No 13032013 of 17 December 2013 OJ L 347 20122013 p 320ndash469
6 An additional reason was that many Member States ldquoraised the issue that they dont have the national budget necessary to pay advance funding to projects working with young peoplerdquo (source httpeuropaeurapidpress-release_MEMO-15-5020_enhtm)
7 The ESF is Europersquos main instrument for supporting jobs helping people get better jobs and en-suring fairer job opportunities for all EU citizens (European Parliament 2018)
The Youth Guarantee in light of changes in the world of work Youth Guarantee Intervention Models Sustainability and Relevance
12
funds8 This is a significant share of the total ESF funding of euro864 billion available to MS
for the 2014-2020 period (including the YEI)
Country case study Austria
Young people in Austria were already benefiting from special attention before the intro-
duction of the YG Several measures were set up to facilitate the transition from educa-
tion to the labour market in particular through a well-established apprenticeship sys-
tem Reducing the age for early school-leaving existed before the 2013 Council Recom-
mendation The long-standing existence of policy measures for young people is reflected
in Austriarsquos relatively successful performance as regards youth employment and STW
transition The labour market situation of young people in Austria is better than the EU
average and it continues to improve The rate of youth unemployment (15-24 years old)
went down from 106 in 2015 to 98 in 2017 which is significantly below the EU
average (168) This good performance is also reflected in the number of NEETs The
NEET rate in Austria was at 65 in 2017 well below the EU average (109)
In addition evidence shows that Austria is performing better than the rest of the EU as
regards its YG implementation (European Commission 2018a) It is acknowledged that
Austria has established a comprehensive Youth Guarantee based on effective partner-
ships targeted policy measures and a robust monitoring system with interconnected
administrative data (European Commission 2016a) The countryrsquos performance is par-
ticularly outstanding in two dimensions the NEET coverage and the delivery of a good
quality offer
Data for 2016 shows that an estimated 829 of NEETs in Austria are reached by the
YG which is the highest figure amongst Member States and almost double the EU aver-
age (425)9 In addition this ldquocoverage indicatorrdquo has been at consistently high levels
since the start of the YG A second more suggestive but somewhat less reliable way of
looking at the performance of a YG scheme is trying to estimate the rate of recycling
ie the percentage of NEETS entering the YG with previous YG experience10 This recy-
cling rate is rather high in Austria (739 compared to 341 for EU 28) suggesting
that employment services have little difficulty in lsquostaying in touchrsquo with young people
who already had a YG experience
The Austrian YG provides a wide range of offers (European Commission 2016d) It
comprises apprenticeship traineeship education and employment offers that are tar-
geted specifically at young people such as for example supra-company apprentice-
ships or production schools Additionally the general education training apprenticeship
and employment offers are open to young people
At the same time it is to be noted that Austria still faces difficulties in integrating cer-
tain sub-groups into the labour market in particular women migrants and young peo-
8 This figure is slightly higher than the euro127 billion stated by the Commission in its October 2016 report which YEI and the ESF are directly investing in ldquolabour market integration measures for young people in the programming period 2014-2020rdquo (European Commission 2016a p 12)
9 These figures are based on the indicator average annual stock of young people in the YG pre-paratory phase NEET population (annual average) included in the Indicator Framework for Moni-toring the Youth Guarantee This indicator combines administrative and survey data Whilst this is
not ideal the indicator is useful to give an approximate indication of the proportion of NEETs regis-tered in the YG scheme at any point during the year Results should therefore be interpreted as an estimation rather than a definitive measurement of the extent to which YG schemes achieve the objective of reaching all young people that become or are already NEET
10 The recycling rate is only experimental data and not officially part of the YG monitoring dataset
The Youth Guarantee in light of changes in the world of work Youth Guarantee Intervention Models Sustainability and Relevance
13
ple with low skills (European Commission 2018a) Ongoing efforts for these target
groups need to be intensified as recent measures have not led to sufficient results yet
Other EU sources Several other EU budget lines support employment- and education-
related programmes in Member States including the European Regional Development
Fund (ERDF) the ERASMUS programme as well as Horizon 2020 and the European Glob-
alisation Adjustment Fund (EGF) For an analysis of their job-creation potential and their
relation to the ESFYEI see European Parliament (2018) In addition a range of smaller
EU programmes finance employment-related measures for (young) people such as the
European Solidarity Corps or the EU Programme for Employment and Social Innovation
(EaSI)11
Three aspects deserve to be highlighted regarding differences across Member States in
financing the implementation of YG activities
First as the 2017 European Court of Auditors report on ldquoYouth unemployment ndash have EU
policies made a differencerdquo highlights the level of YEIESF funding available would only
address a small proportion of the required amount for the full implementation of a YG
Member States therefore need to leverage significant additional resources from national
budgets to achieve this goal However so far there has been ldquono assessment of cost
and available funding by Member Statesrdquo (European Court of Auditors 2017)
Second the extent to which the YEIESF funds simply financed youth-related schemes
that already existed prior to the YG is unclear They may be funded either by other EU
schemes or Member State national budgets The European Court of Auditors states that
YEIESF should ldquonot replace public or equivalent expenditure by the Member Statesrdquo
(ibid) However the Commission notes in its reply to the report that the YEI provisions
do not deny to Member States finance for measures previously supported by the national
budget or measures that require Member States to increase public spending regarding
certain types of measures or target groups At the same time the European Court of
Auditors analysis of seven Member Statesrsquo Operational Plans for the YEIESF showed that
ldquo[hellip] the majority of the measures which were to receive YEI financing already existed
prior to the introduction of the Youth Guarantee [hellip]rdquo (ibid p 54) In fact even in 2011
the Youth Opportunities Initiative proposed by the European Commission (2011) allowed
the governments of Member States to make increased use of the ESF for promoting
youth employment (Tosun et al 2017) The degree to which additional funds under the
YEIESF actually presented additional funds for Member States may therefore vary
greatly and there is without doubt also some variation in Member States as to whether
this caused them to step up their efforts regarding youth employment
Third despite the frontloading of the YEI in 2017 take-up of the YEI developed slowly in
its early phases of implementation (European Parliament 2017b) According to Andor
and Veselyacute (2018) two aspects delayed the implementation of the YG in the start from a
financial perspective firstly it took Member States and the Commission time to design
and review the lsquoOperational Programmesrsquo (OPs) specifying how YEI and ESF money
would be used Most of the Operational Programmes were only approved in late 2014 or
even in 2015 Secondly several Member States had accumulated delays in absorbing EU
structural funds for 2007-13 Hence they focused their efforts on implementing these
schemes in order not to lose these allocations (due to the so-called de-commitment
11 For instance one of the aims of the EaSI programme is to enhance mobility via the ldquoYour first Eures jobrdquo As these programmes are rather small in scale and not directly linked to the YG the study does not provide a detailed overview (see European Parliamentary Research Service 2017)
The Youth Guarantee in light of changes in the world of work Youth Guarantee Intervention Models Sustainability and Relevance
14
rule) Only afterwards did they move on to use YEI funding An assessment commis-
sioned by the European Parliament concluded that most delays that limited the impact of
the increased pre-financing were due to procedural rather than financial problems (Euro-
pean Parliament 2017b)
212 The Youth Guarantee as part of national policy-making
A variety of aspects may be used to determine the degree to which the YG has become a
part of national policy making and hence whether the changes introduced by the YG are
likely to be sustained over time The following discussion focuses on three measurable
factors related to the sustainability of YG-related policy changes Firstly whether the
Council Recommendation has spurred on Member States to introduce youth-related la-
bour-market reforms rather than merely set up an additional offer of active labour mar-
ket measures Secondly whether Member States have introduced monitoring and evalu-
ation systems to assess the effectiveness of YG-related measures Thirdly to find the
degree to which Member States have attempted to build up (lasting) partnerships be-
tween all relevant stakeholders (such as public and private employment services gov-
ernment authorities education and training institutions and so on)
The introduction of youth-related labour-market reforms the first key factor reflects
whether Member States have attempted to embed the main guidelines of the Council
Recommendation in their national policies In particular whether Member States have
used the political momentum created by the YG to introduce structural reforms to mod-
ernise their overall labour market policies in support of young people Such reforms con-
cern the functioning of the labour market (its institutional and regulatory framework)
and are aimed at better matching supply with demand The implementation of structural
reforms can be considered a key determinant as to whether the YG can have a long-
term sustainable impact in Member States beyond the YEI and the ESF funding associ-
ated with the YG
Information on the nature and intensity of youth-related active labour market policy re-
forms provided in the LABREF database indicates that EU Member States are imple-
menting the Recommendationrsquos policy guidelines unevenly Figure 3 displays the number
of active labour market policy reforms between 2013 and 2016 across Member States
The figure indicates for instance that virtually all Member States implemented addition-
al ALMP reforms for youth and that several Member States ndash such as Bulgaria France
Latvia Lithuania and Greece ndash have a relatively broad scope of reforms
Figure 3 Absolute number of youth-related active labour market reforms be-
tween 2013 and 2016
Note This figure shows the absolute number of youth-related active labour market policy reforms in the EU
Member States between 2013 and 2016 Identification of youth-related reforms is done via the indicator ldquoIs
the measure targeted at young peoplerdquo in the LABREF database
0
2
4
6
8
10
NL SI CZ
DE
LU FI HR
DK IE UK
AT PL
BE EE MT
RO SK ES HU CY IT PT SE BG FR LV LT EL
The Youth Guarantee in light of changes in the world of work Youth Guarantee Intervention Models Sustainability and Relevance
15
The introduction of monitoring and evaluation systems the fifth principal element in the
Council Recommendation on the YG and the strict reporting guidelines were aimed at
fostering a culture of policy analysis Despite the additional administrative burden asso-
ciated with reporting activities requiring Member States to obtain administrative data on
in- and outflows from the YG as well as follow-up data the creation of a monitoring and
evaluation system is one of the effects that people in charge of implementing the YG at
the country level have recognised as being positive12 In fact many Member States did
not have specialised monitoring systems allowing to track youth on the labour market
and in education and evaluate activation measures for youth before the Council Rec-
ommendation
At the same time the capacity of countries to monitor what happens to young people
after leaving the YG and the corresponding data quality varies in fact a substantial
share of Member States do not know about young peoplersquos reasons for exiting either the
YG or the labour market nor do they register the educational status of previous partici-
pants after they exited This issue is most likely due to a pre-YG lack of policy evaluation
culture or a lack of capacity to collect data An additional aspect to consider in this re-
gard is whether Member States attempted to evaluate the effectiveness of specific
measures under the YG using rigorous impact evaluations The EU helps Member States
conduct impact evaluations on interventions funded by the European Commission name-
ly the ESF and the YEI for example by setting up the Centre for Research on Impact
Evaluation (CRIE) which provides scientific expertise and methodological support to
Member States conducting an impact evaluation (see European Commission (2016b) for
details) Escudero and Murelo (2017) provide an overview of various impact evaluations
of pilot programmes that were set up within the context of the European YG However
there does not so far seem to be a systematic account of ongoing or completed impact
evaluations of YG instruments
Partnership approach Most Member States make a reference to the partnership ap-
proach in their YG Implementation Plan (YGIP) Table 1 shows the clear differences
based on an assessment of ten selected Member States conducted by Eurofound
(2015) In addition to the differences within countries the findings based on this sample
of ten countries also indicate that cooperation with some stakeholders seems to be more
widespread than it is with others For instance cooperation between ministries particu-
larly the ones dealing with employment and education policies is rather well developed
In comparison cooperation is less frequent with non-institutional stakeholders such as
the third sector notably NGOs social partners and youth organisations In 2016 the
European Commissionrsquos three-year assessment came to the conclusion that ldquowhile many
Member States have taken steps to support the involvement of a wide range of actors
and established institutional frameworks for partnerships the functioning of these part-
nerships remains a challenge due to problems of design which affects their ability to
deliverrdquo (European Commission 2016b p24)
In addition previous studies (eg Dheacuteret and Roden 2016) highlight the strong path-
dependency in how countries or regions apply the partnership approach While some
countries have put new structures in place to monitor the progress of the YG implemen-
tation and coordinate the work of relevant stakeholders other countries tend to have
consolidated partnerships that existed before the YG was established
12 Information collected through the interviews organised in the context of the EPC Task Force on Youth Employment The results of these interviews are further presented and developed in Dheacuteret and Roden (2016)
The Youth Guarantee in light of changes in the world of work Youth Guarantee Intervention Models Sustainability and Relevance
16
There also seems to be some discrepancy between the involvement of stakeholders in
the design implementation and monitoring of the YG In some Member States stake-
holders in the third sector particularly youth organisations reported that they were only
consulted in the design phase and never again (European Youth Forum 2018)13 Recent-
ly more positive evidence is provided by ETUC (2018) showing that the great majority
of interviewed representatives of unions was at least `somewhat satisfiedrsquo with their
degree of participation in the YG
Table 1 Overview of actors involved in implementing the YG in 10 Member
States
Min
istr
y
of
Em
plo
ym
ent
(or
equiv
ale
nt)
Min
istr
y
responsib
le
for
socia
l benefits
Min
istr
yo
rganis
ation
re-
sponsib
le for
ESFY
EI
Min
istr
y o
f Education
Min
istr
y
responsib
le
for
youth
work
Oth
er
min
istr
y
(justice
defe
nce
inte
rior
health
housin
g)
PES
(either
at
national
regio
nal or
local le
vel)
Youth
org
anis
ation (r
epre
-
senta
tive)
Local
youth
org
anis
ation
(im
ple
menta
tion)
Socia
l part
ners
Education s
ecto
r
BE XX XX X XX X XXX X X XX
BG XXX XX XX XX XX XX XX XX XX XX
EE XX X XX XXX XXX X XX XX XX X X
EL XXX X X XX X X
ES XXX
XXX
(em-ploy-ment)
XX XX XX XX XX X XX X
FR XXX
XXX (em-ploy-
ment)
XX (em-ploy-
ment)
XX XX X XX X
IE XX XXX XX XX XX XX X X X
IT XXX XXX XX XX XX XX X X XXX X
PL XX X XXX X XX X
UK XX XX (LEP)
X X XX X X
Source Eurofound (2015a)
Note XXX means authoritycoordinator XX means principal partner-stakeholders and X means associated
partnerstakeholder A distinction needs to be made in Belgium between the federal and local authori-
tyregional level social benefits are (still) the responsibility of the federal government while education and
PES are the responsibility of the regionslocal authorities Similar to Belgium in Spain many responsibilities
are delegated to the regional level LEPs - Local Enterprise Partnerships
13 Some more evidence from the European Youth Forum on involvement for a sub-set of countries can be found under httptoolsyouthforumorgyouth-guarantee
The Youth Guarantee in light of changes in the world of work Youth Guarantee Intervention Models Sustainability and Relevance
17
213 Youth labour market challenges
The third key factor of YG implementation is its contribution to and targeting of the
young peoplersquos labour market challenges Given that the recession of the late 2000s (the
lsquoGreat Recessionrsquo) and its aftermath exacerbated the difficulties that young people face
in their STW transition and labour market career this section presents a brief discussion
of these challenges and how YG interventions have sought to address them
Challenge 1 ndash Youth unemployment long-term unemployment and inactivity The Great
Recession and its immediate effects on youth unemployment ndash highlighted in section 1 ndash
also resulted in an increase in youth long-term unemployment which although gradual-
ly falling from its peak of 8 in 2013 has remained high (European Parliament 2015
European Commission 2017a) Long-term unemployment can result in well-documented
lifelong consequences and lsquoscarringrsquo effects on those young people who remain unem-
ployed for some time (Eurofound 2015b Eurostat 2015) In addition a considerable
proportion of the EUrsquos youth remain economically inactive Whereas a large share of
them are in education or training many are discouraged and have become detached
from the labour market or they have not entered it after leaving education
The macroeconomic state of the economy also affects the level of demand for young
people where employer absorption capacity in providing training places (such as appren-
ticeships) and jobs for young people may be limited (Eurofound 2015a) In addition the
highly variable youth labour market performance across the EU before during and after
the Great Recession has been attributed to many factors These include differences in
the institutional and structural set-up of Member States regarding the education and
training systems (initial) education and vocational training (IVET) labour market insti-
tutions and labour market policy (such as employment protection legislation - EPL) and
active labour market policies (ALMPs) and social welfare systems (Eichhorst et al 2013
OrsquoReilly et al 2015 Pohl and Walther 2005 Pohl and Walther 2007)
The introduction of the YG ndash and its underlying philosophy of early intervention with a
personalised approach ndash across the EU sought to address the issue of rising youth un-
employment including long-term unemployment and inactivity (Eurofound 2015a Eu-
ropean Commission 2016a) The YG approach precisely addresses these challenges
providing unemployed inactive youth with a short-term activation and a perspective in
employment or education
In the five years since the launch of the YG youth unemployment rates have improved
considerably as highlighted in section 1 (see also for example the European Commis-
sion 2018g Eurostat 2018) Although this development is partially attributable to the
recovery from the Great Recession according to the European Commission this is also
partially due to the YG together with the effect of the Youth Employment Initiative (YEI)
(European Commission 2018g)
Challenge 2 ndash Labour market segmentation A key challenge facing youth is labour mar-
ket segmentation often resulting in young people being over-represented in temporary
or part-time forms employment in particular involuntary part-time casual a-typical or
precarious work (European Commission 2017a 2017g and 2018i Eurostat 2015 and
2018) Although such non-standard forms of employment have increased for all age
groups the more recent cohorts of younger workers have been particularly adversely
affected (European Commission 2017g) Specifically although in 1995 23 of younger
workers in the then EU 15 were on non-standard contracts by 2016 this proportion had
increased to 32 for the same age group (European Commission 2017g)
This trend is reflected across the EU 28 where over the last decade non-standard forms
of employment among younger workers rose from 26 to 29 with 35 million fewer
The Youth Guarantee in light of changes in the world of work Youth Guarantee Intervention Models Sustainability and Relevance
18
employees on permanent full-time contracts and 12 million more on non-standard con-
tracts (European Commission 2017g) Moreover younger workers in 2016 were still
more than twice as likely to be working full-time on temporary contracts (12) than
workers in their prime and older workers (5) (European Commission 2017g)
In general young people are more likely to find themselves as labour market lsquooutsidersrsquo
with little access to permanent contracts with high levels of employment protection and
workersrsquo rights especially compared to their older counterparts (European Parliament
2015 European Commission 2017a 2017g and 2018j) Since access to stable employ-
ment with positive career prospects matters young peoplersquos successful transition into
fully independent lives is one of the primary objectives of the YG (Council of the Europe-
an Union 2013 Eurofound 2014)
The degree of lsquodualismrsquo of labour markets varies across Member States recent analysis
suggests that four in ten European young people are on temporary contracts rising to
over 60 in many Southern and Eastern European countries (European Court of Audi-
tors 2017) While temporary employment can either be a lsquostepping stonersquo or a lsquotraprsquo in
terms of STW transitions recent data suggests that the former is rarely the case (Euro-
pean Commission 2015 2017a and 2017g) the average proportion of temporary work-
ers transitioning into permanent employment fell from 28 in 2007 to 23 in 2013
This however masks major country variations ranging from 10 in France to for ex-
ample 65 in Estonia (ibid)
Predictably when studying age groups the probability of moving from temporary to
permanent contracts over one year is lowest for young people aged 15-24 (European
Commission 2016g) However it is worth noting that transition rates from temporary to
permanent contracts among young people have recently either increased or remained
stable in most Member States where data are available (European Commission 2017g)
In most Member States these rates are still lower than 20 and in countries such as
Poland and Greece temporary employment lsquohas almost no stepping-stone functionrsquo (Eu-
ropean Commission 2017g) Countries such as France and Spain with highly segmented
labour markets and high shares of (young) workers on fixed-term contracts have been
also characterised by low transition rates towards permanent employment (European
Commission 2017h Eurofound 2013a and 2013b)
Country case study Ireland
Ireland was one of the EU countries most adversely affected by the Great Recession
which resulted in high levels of youth unemployment As a result addressing youth
unemployment especially long-term unemployment has been a key challenge (EEPO
2015) The youth unemployment rate more than tripled from about 10 in 2008-09 to
a peak of just over 33 in mid-2012 (DSP 2014a) Likewise the NEET rate for those
aged 15-24 was 18 in 2014 although the picture is more nuanced especially in re-
lation to inactive NEETs (DSP 2014a) Specifically excluding students and the young
unemployed inactive NEETs account for a relatively small proportion (about 3) of
the youth population (DSP 2014a EEPO 2015) Most tend to be lone parentscarers
(60) and people with a disability (20) (DSP 2014a EEPO 2015) Thanks to Ire-
landrsquos universal means-tested unemployment benefit system for those aged over 18
the vast majority of young NEETs are registered with the benefitsemployment service
(EMCO 2017)
Against this background the Youth Guarantee (YG) has two target groups (i) poorly
qualified young people aged under 18 who are in turn provided with a quality second-
chance educationaltraining pathway outside the school system (for example
Youthreach) or are supported in re-entering the school system and (ii) unemployed
The Youth Guarantee in light of changes in the world of work Youth Guarantee Intervention Models Sustainability and Relevance
19
young people aged 18-24 with a particular focus on long-term unemployed youth
(EEPO 2015 Stokes 2016) To this end the YG offer is quite comprehensive and
comprises a number of programmes ndash some pre-existing (for example the JobBridge
internship programme) and others such as the First Steps Youth Developmental In-
ternship Programme (for the most disadvantaged young people) and JobsPlus Youth
(an employer subsidy scheme) introduced as part of the YG (DSP 2014a Leigh-Doyle
2014 Treadwell Shine 2016)
The delivery of the Irish YG seems to be integrated within the overall policy approach
towards youth employment with most measures aimed at young jobseekers predating
its introduction (DSP 2016a) This embedding of the YG within the existing youth em-
ployment policy framework means there is a close alignment between the two Indeed
Irelandrsquos YG builds upon existing services and programmes but it crucially entails ear-
lier intervention for and a tailored approach to the young unemployed with a strong
focus on enhancing processespolicies to help the young unemployed enter sustainable
employment receive appropriate training andor gain relevant work experience (DSP
2014a Treadwell Shine 2016 DohertyDSP 2018) YG-related partnership arrange-
ments are also situated within the main policy making process which in turn means
that the implementation of the YG is policy based as opposed to project based
(ESFYEI) (EMCO 2017) As such the YG and associated measures are likely to be
sustained over time
Ireland has made notable progress in implementing the YG with a substantial reduc-
tion in the number of unemployed youth In general there has been intensified en-
gagement with young people while access to different programmes has been enhanced
and partnerships strengthened (European Commission 2018a) Evaluations of YG-
related programmes such as the Tuacutes and Job-Bridge work placementinternship pro-
grammes have shown positive outcomes (Leigh-Doyle 2014 Indecon 2016 Depart-
ment of Education and Skills 2016) The Irish YG seems to be quite successful in de-
livering sustainable outcomes which indicates that the offers provided are of good
quality (European Commission 2018a)
However a number of challenges remain For example the uptake of key measures
such as JobsPlus Youth and the First Steps Youth Development Internship has not
been as extensive as it could in view of the youth cohort concerned and there is also
a lack of sufficient training places (DSP 2016a European Commission 2017f) Em-
ployer engagement particularly in the provision of employment opportunities for the
most disadvantaged youth also remains a challenge as does the timeliness of YG of-
fers (European Commission 2017f and 2018a EMCO 2017)
In principle one response to the challenge of labour market segmentation would be
structural reforms such as for example the reforms Spain implemented in the aftermath
of the crisis Given that the YG was implemented at the height of the recession most
Member States focused on a ldquowork firstrdquo approach to give short-term relief to unem-
ployed young people specifically the implementation of subsidised employment pro-
grammes many specifically targeted at young people at risk has been quite common
across the EU and hiring incentives have featured prominently in many YG plans (Euro-
pean Commission 2018h) Many of these programmes involve incentives such as wage
subsidies aimed at encouraging employers to offer employment to young people
In general countries promoting employment offers under the YG use a form of employ-
ment subsidy which typically involves supplementing the individual labour costs of the
person employed over a fixed period whilst the majority of the labour costs remain cov-
ered by the employer (European Commission 2018h - See Annex Points 9 and 10)
The Youth Guarantee in light of changes in the world of work Youth Guarantee Intervention Models Sustainability and Relevance
20
These wage subsidies also play a crucial role in many countries (including Belgium
France Estonia Greece the Netherlands Poland Spain Sweden and Denmark) in facili-
tating the acquisition of work experience andor entry in their first job by young people
and this especially helps young people from disadvantaged backgrounds (Eurofound
2013b 2016 and 2017 European Commission 2018d and 2018h) In addition the
broader set of labour market reforms accompanying the YG (see previous subsections)
has contributed to addressing labour market dualism in many Member States
Challenge 3 ndash Poor performance of education and training systems (including skills mis-
matches and the limited availability of quality work experience) Another key structural
challenge is given by an unsatisfactory performance in the education and training sys-
tems including VET this means that young people do not have appropriate education
when they graduate and when they enter the labour market which in turn exacerbates
skills mismatches and adversely affects their employability (for example Quintini et al
2007 Quintini and Martin 2014) Indeed the mismatch between (youth) labour supply
and demand seems to be a growing challenge for instance there is growing concern
about graduate under-utilisation and the fact that that higher education graduates expe-
rience considerable and persistent occupational vertical skills mismatch (234 in 2016)
by working in jobs typically requiring a lower level qualification (European Commission
2017c) However it is also worth pointing out that higher education graduates have bet-
ter employment rates (828) than young people with upper secondary education quali-
fications (726) (European Commission 2017c)
Another major challenge in light of rapid and constant technological change relates to
the need for effective skills anticipation against the largely unknown future evolution of
work and work organisation This is in turn is closely related to the need to ensure that
the education and training systems across the EU respond accordingly by being lsquoagilersquo
and by equipping young people with relevant skills including lsquodynamicrsquo skills such as
adaptability resilience and career management skills This concern was also reflected in
the latest European Commissionrsquos report on Employment and Social Developments in
Europe according to which ldquomuch will depend on whether or not education and training
systems are agile enough to respond appropriately to fast-changing technological oppor-
tunitiesrdquo (European Commission 2018g)
In recent years there has been a concerted effort to reform or strengthen education and
training systems including vocational education and trainingapprenticeships and their
role in STW transitions Indeed extensive VET reforms are currently being implemented
in many EU countries (for example Croatia Cyprus Estonia Greece Finland France
Ireland Italy Poland Spain Sweden and the United Kingdom) ndash instigated to some ex-
tent by the YG These reforms seek to improve the labour market relevance quality and
attractiveness of VET together with an effort to develop a VET system often along the
lines of the German dual training system which combines time spent at school with time
spent in the workplace In addition many reforms of VET systems often associated with
the YG have sought to create closer links with the labour market (European Commis-
sion 2018c)
In addition a range of other educational measures offered under the YG has aimed to
bring young people with low levels of skills and qualifications back to education and
training These measures are summarised by the term lsquocontinued education offersrsquo (Eu-
ropean Commission 2018l) These continued education offers are set up to provide
young people with the chance to re-enter the regular education and training system to
move on to a higher-level qualification Alternatively ALMPs bridging courses or second
chance education programmes can also equip early school-leavers and low-skilled youth
The Youth Guarantee in light of changes in the world of work Youth Guarantee Intervention Models Sustainability and Relevance
21
with the skills and qualifications needed for an initial (and targeted sustainable) labour
market integration
214 The heterogeneity of the NEET population
The fourth key aspect of YG implementation assessed in this report concerns the way in
which the YG has addressed the heterogeneity of the NEET population Due to its diversi-
ty the NEET population in the EU can be divided into sub-groups According to Euro-
found (2016) the NEET can be categorised firstly by their activity status ndash those who
are available to the labour market or educational opportunities are counted as active
while the rest is classified as inactive The former group consists of short- and long-term
unemployed individuals and those soon to return to education or employment the latter
group includes people with illness or disability individuals with family responsibilities and
lsquodiscouragedrsquo workers Throughout this report the phrase lsquodiscouraged workersrsquo refers to
people who simply stopped searching for employment or education opportunities
Data from the EU Labour Force Survey from 2013 (also used in Eurofound 2016) pro-
vides an indication about the labour-market attachment of NEETs in Europe before the
YG was implemented Among the active NEETs the largest proportion of 15-24-year-old
NEETs were short-term unemployed (298) Long-term unemployed youth made up
about 22 of the NEET population while returnees into work or education accounted for
roughly 8 of NEETs Among those considered inactive the largest share corresponds to
individuals with family care responsibilities (154) Individuals with illness or disability
made up 8 of the NEET population Discouraged workers accounted for almost 6 of
NEETs and 125 were NEETs for other reasons Consequently around 60 of the
NEET population were neither in education employment nor training for labour market
related reasons (the unemployed the discouraged workers and the returnees) and
around 40 were NEETs for other reasons
Furthermore NEETs can be categorised by their educational attainment as subgroups
with lower education are at a much higher risk of being in a vulnerable position This can
be seen by the fact that less educated youth are overrepresented among the NEETs As
of 2014 44 of NEETs aged 15-24 had completed an lsquoupper secondaryrsquo education
closely followed by 43 with a lsquolower secondaryrsquo education and only 8 of NEETs had
tertiary education or a degree (Eurofound 2016)
These sub-groups have diverse needs and are therefore likely to benefit from different
types of policy responses regarding interventions and they may require additional out-
reach efforts Most importantly those furthest away from the labour market are most
likely to be in substantial need of outreach activities One important factor here is their
point of access to the YG While other entry points exist access is often governed by
PES In all EU countries except Malta the PES plays a role in registering people for the
YG Among other determinants the extent to which the PES are able to actually reach
the NEET population also depends on their responsibilities for administering and paying
(unemployment) benefits According to European Commission (2017b) only three PES
are responsible for administering other types of benefits aside from (mostly insurance-
based) unemployment benefits (Lithuania Luxemburg and Slovakia) These types of
benefits tend to exclude youth due to their limited length of work experience reducing
the scope for outreach without further intervention Indeed the registration of NEETs
with the PES was somewhat limited at the onset of the YG (Eurofound 2016) However
many PES have launched substantial outreach activities to make up for this EC (2017a)
shows that roughly 46 of PES make use of new media for their outreach work 39
provide mobile services and about 43 have specific outreach caseworkers Moreover
The Youth Guarantee in light of changes in the world of work Youth Guarantee Intervention Models Sustainability and Relevance
22
46 of PES have created a one-stop-shop type of framework to enhance their degree of
outreach (eg this includes Belgium Finland and the United Kingdom ibid)
Country case study Italy
Italy is a country with a relatively rigid labour market despite the recent reforms aimed
at increasing the degree of labour market flexibility Moreover the Italian education
system endows youth with a relatively high level of general education but with few
work-related skills which dramatically slows down their transition to a job (Pastore
2018) Along with their relatively large number of early school-leavers this helps ex-
plain their 347 youth unemployment rate in 2017
The lack of previous experience with the YG framework and the dramatically low rate of
job-finding ndash ranging from 11 to 18 in the 2010s ndash represented another obstacle to
successfully implementing the YG According to Pastore (2015) macro- and micro-
economic obstacles should have been overcome to make the programme work at its
best Economic growth has been sluggish at least from the early 1990s which would
normally have reduced the pace of job creation and forced young people into more edu-
cation and training rather than employment Moreover public and private employment
services could count only on human resources which were scant in both quantitative and
qualitative terms as they had a low share of university graduates (ANPAL 2018)
The number of ANPAL staff has been reduced in recent years and as financial resources
for paying for an increase in the number of staff are scarce improvement has been
sought by implementing important reforms such as the `legislative decree 1502015rsquo of
the so-called Jobs Act package (ANPAL 2018) This reform introduced lsquoquasi-marketsrsquo
in the management of employment services the NEETs are profiled by PES and then
assigned a voucher for a different amount according to their lsquoneed bandrsquo NEETs can
spend vouchers in the PES andor with private (for profit or non-profit) employment
agencies to buy the services they need However so far the reform has not been fully
implemented partly due to the lack of financial resources (ibid)
Further problems with the implementation of the YG has been due to the reallocation of
competences in the PES from provinces to regions and the establishment of a national
agency (ANPAL) to coordinate the work of regional entities which detracted from the
full implementation of the YG (ANPAL 2018)
The Italian YG scheme has also managed to improve its monitoring system of the indi-
viduals involved the activities done and their level of absorption into the labour market
when the programme is completed The last monitoring report available shows that of
about 15 million registered NEETs 13 million had the prescribed requirements About
one million were actually profiled of which about a half were given some completed
form of assistance About 60 underwent on-the-job training 23 benefited from sub-
sidised employment 123 received off-the-job training 23 received some form of
placement services 16 did voluntary service in the third sector and a small number
received support for self-employment About six months before completion of the pro-
gramme 479 of recipients were in work and 692 had experienced at least one
employment spell (ANPAL 2017)
A few recent evaluation studies provide a full assessment of regional programmes and
show that on-the-job training is effective in confirming the importance of providing
young people with work-related competences (for example see Ghirelli et al 2019)
Despite these efforts monitoring data on the Youth Guarantee for 2016 shows that in
the EU as a whole an estimated 385 of the NEET population were registered in YG
schemes in the year 2016 Although some Member States are doing much better (cover-
The Youth Guarantee in light of changes in the world of work Youth Guarantee Intervention Models Sustainability and Relevance
23
age rates are higher than 50 in 12 Member States - in Belgium Finland and Austria
the corresponding rate is even above 70) Moreover the YG currently does not suffi-
ciently cover inactive NEETs (European Youth Forum 2018) as this problem is less se-
vere in countries with minimum income support systems where less strict entry require-
ments are usually applied This is the case in Ireland for example (see European Court
of Auditors 2017) This under-coverage of inactive NEETs is reflected in Figure 4 which
shows that the decline in NEET rates since the introduction of the YG is mostly due to
reductions in long-term and short-term unemployment
Figure 4 Composition of the EU NEET population (percentage of the population
of young people)
Source Eurofound (2017)
Thus it seems that the YG so far has benefitted youth closer to the labour market which
may be partly reflect the high prevalence of employment offers within the YG framework
(in 2016 around 67 of all the offers taken up within the four-month time limit set by
the YG were employment offers) Low-skilled individuals lsquodiscouragedrsquo workers and indi-
viduals without work experience are likely to benefit more from offers that combine gain-
ing job experience and building (job-specific) skills However as of 2016 these types of
offer only make up a minority of all the offers taken up within the four-month time limit
Furthermore the 2013 Council Recommendation on the YG insufficiently addressed the
needs of those among the youth that are NEETs for reasons other than labour market
related factors as these individuals had other constraints keeping them from the labour
market Among this group are mainly individuals with family care responsibilities and
youth with illnesses or disabilities For individuals with family responsibilities the Euro-
pean Quality of Life Survey shows that 11 of young fathers and 35 of young mothers
are inactive This is despite the fact that the majority of them would like to work under
flexible work and with adequate care arrangements (European Youth Forum 2017)
Nonetheless some Member States introduced additional reforms beyond the YG recom-
mendations to decrease high school dropout or aimed at improving social and welfare
policies
The Youth Guarantee in light of changes in the world of work Youth Guarantee Intervention Models Sustainability and Relevance
24
215 Design and implementation features of the Youth Guarantee
The fifth key aspect of the YG concerns design and implementation-related factors af-
fecting its capacity to address the main objectives ndash does it provide a broad set of young
people with a quality offer within a short period of time Specifically the Council of the
European Union (EU) recommended providing a quality offer to all young people under
25 within a four-month period of their becoming unemployed or having left the education
system
Substantial variation between Member States can be observed in the way the national
YG was designed and implemented previous experience implementing a YG-type of
framework is also important For example Denmark and Sweden are among countries
that had a relatively long history of this sort of framework even before the introduction
of the YG Furthermore at the very fundamental level of design some Member States
opted for different target time-frames as well as different age cut offs for YG eligibility
Some countries chose a shorter time-frame than the four months envisaged by the
Council of the European Union others opted for a longer duration (European Commis-
sion 2016a) Regarding the age range a substantial number of Member States chose
youth aged under 30 as a target rather than the suggested age of 25 as the cut off This
included for example Bulgaria Denmark Italy and Poland Depending on the size of
these cohorts this may represent a considerably more ambitious approach which - if it
is not supported by sufficient financial and human resources - is more likely to fall short
of expectations Furthermore some countries put specific emphasis on targeting the
long-term unemployed youth (Escudero and Mourelo 2017) Among others this includes
Hungary Poland and the United Kingdom
In order to support the target of reaching every NEET in a timely manner some PES
have also introduced YG-specific staff hired additional caseworkers or at least main-
tained their staff level since the introduction of the YG (European Commission 2017a)
On the issue of the quality of offers 17 PES formally defined their criteria for a quality
offer or distributed national quality management guidelines regarding offers being made
within the YG framework (5 countries)14 Many Member States have chosen an outcome-
based approach for their definition of offer quality meaning they define an offer as being
of high quality when individuals have favourable education or employment outcomes
after leaving one of the YG programmes (European Commission 2016a) In addition
some PES also introduced youth-specific targets (European Commission 2017a)
There is also cross-country variation in terms of the main YG providers Almost all coun-
tries rely to some extent on their national PES for providing YG services while some do
so exclusively This is the case for example in Austria the Czech Republic and Greece
Most Member States however chose some combination of the PES and other institutions
as their main providers (European Commission 2016a) Aside from the institutions
through which YG services can be obtained online access to the programmes may be an
important driver of success In 18 EU countries potential participants can register online
for the YG at least in some regions of the country This is not the case in for example
Bulgaria France or Luxembourg
14 See European Commission 2017a
The Youth Guarantee in light of changes in the world of work Youth Guarantee Intervention Models Sustainability and Relevance
25
Country case study Latvia
Young people in Latvia were very adversely affected by the lsquoGreat Recessionrsquo of
20082009 In the years before the recession youth unemployment had been relatively
low standing at 105 in mid-2008 but then it more than tripled to more than 35
within a two year period In a parallel development the NEET rate for 15-24 year old
Latvians rose from 108 in 2008 to 178 in 2010 Both youth unemployment and the
NEET rate effectively peaked in 2010 in Latvia and since then they have steadily de-
clined reaching pre-crisis levels by 2015 One specific challenge of the Latvian labour
market is the variation in employment outcomes by educational level as the high-
skilled face very low unemployment rates (clearly below the EU average) whereas un-
employment among the low-skilled is much higher than EU average
Following the Council Recommendation the Latvian YG Implementation Plan was pre-
sented in December 2013 (updated in April 2014) and implementation started in 2014
targeting young people aged 15-29 not in employment education or training (European
Commission 2018c) The Ministry of Welfare is in charge of establishing and managing
the YG while the Latvian PES (the lsquoState Employment Agencyrsquo) and the State Education
Development Agency (SEDA) are responsible for its implementation Other main imple-
menting actors include the Ministry of Science and Education the local authorities (the
municipalities) and youth organisations The Latvian Youth Guarantee is fully funded by
the Youth Employment Initiative (ibid)
The immediate strengths of YG implementation in Latvia are the rapid formal adoption
of the YG the adaptability of existing institutions and structures (which also enabled the
creation of new institutions such as a YG Advisory Board) and the emergence of part-
nership as a key component for implementing the YG This active inclusion of a broad
set of partnerships remains a particular strength of the Latvian YG implementation (EM-
CO 2017)
The Latvian YG scheme exclusively provides employment and education offers so that
apprenticeships and traineeships are not provided The employment offers are mostly
subsidised employment in the regular labour market such as first work experience for
labour market entrants and subsidised jobs for the disadvantaged Young people receive
fixed term contracts that range in duration from six months to two years and there is
also financial support for up to two years for young people wanting to become self-
employed or to start a business
The education system includes several vocational elements typically between 480 and
960 hours and up to 15 years in one specific programme Additionally the Latvian YG
provides ldquoyouth workshopsrdquo as part of the preparatory phase which provide training in
three different areas (up to three weeks each) to help young people with their career
choices
In 2016 just over a quarter (271 of the total entrants) of those entering the YG
scheme were re-entrants of which nearly half (127) had previously taken up an of-
fer These re-entry rates are below the EU average but the rates may be understated
as data for participants applying via the SEDA data on previous experience are not
available (European Commission 2018a)
The Youth Guarantee in light of changes in the world of work Youth Guarantee Intervention Models Sustainability and Relevance
26
216 The role of the apprenticeship system in the Youth Guarantee
The sixth main aspect of YG implementation addressed in this study specifically concerns
the role of apprenticeships indeed one of the greatest problems for young peoplersquos
transition into the labour market is their lack of work-related competences especially in
the countries with sequential STW transition systems that focus on general education
rather than building lsquoall-round human capitalrsquo as in lsquodualrsquo STW transition systems where
school and work are linked at the same time (Austria Denmark and Germany) An ap-
prenticeship is therefore one of the key elements of the dual system as it traditionally
involves off-the-job in-class education together with on-the-job training of different
lengths
According to comparative evidence provided by the European Commission (2013) based
on the European Labour Force Survey in most EU Member States the share of appren-
ticeships in any cohort of young people (15-29 years old) is between 15 and 5 with
the only exception being Germany Austria and Denmark where young people who un-
dertake an apprenticeship amount to above 5 All other EU countries are below 15
The EU average share was 37
This general tendency is also partly reflected in the usage of apprenticeships in the con-
text of the YG as they correspond to important cultural and institutional factors within
Member States15 The monitoring data shows that in 2016 some of the countries with the
highest share of apprenticeship offers within the YG programme have a dual STW sys-
tem Portugal is one major exception from this rule this may be related to its general
shortage of employment opportunities and therefore the tendency of apprenticeships to
occupy a higher than average share among participants of the YG Overall however
only 34 of timely exits from the YG were the result of apprenticeship offers a share
not far away from the share in the overall population of young people mentioned above
For a large number of countries the share was close to zero It should be noted howev-
er that due to data limitations some countries may record entries into apprenticeship
offers as entries into employment (European Commission 2016b)
Apart from data-related issues one reason why apprenticeship offers remain rather ex-
ceptional within the YG is that they require employersrsquo commitment to providing training
places and to designing curricula in cooperation with schools This can be a big constraint
in the development of apprenticeships especially in sequential SWT systems In 2013
the European Alliance for Apprenticeship (EAFA) was therefore launched to boost ap-
prenticeships in the EU The EAFA gave guidelines for the implementation of apprentice-
ships in all Member States and encouraged sharing experiences and good practices and
provided strategic expert support from the European Centre for the Development of Vo-
cational Training (CEDEFOP) and through the European Training Foundation Within the
context of the EAFA all member countries signed a declaration of commitments on ac-
tions to spread the use of apprenticeships as the main port of entry to the labour market
15 Note that the Commissionrsquos definition of apprenticeships (European Commission 2013) may differ from Member Statesrsquo definitions A recent Council Recommendation (Council of the European Union 2018) intends to harmonise the definition by saying that apprenticeships are understood as formal vocational education and training schemes that a) combine learning in education or training institutions with substantial work-based learning in companies and other workplaces b) lead to
nationally recognised qualifications c) are based on an agreement defining the rights and obliga-tions of the apprentice the employer and where appropriate the vocational education and train-ing institution and d) with the apprentice being paid or otherwise compensated for the work-based component Despite this recommendation varying national definitions still exist across Member States
The Youth Guarantee in light of changes in the world of work Youth Guarantee Intervention Models Sustainability and Relevance
27
for young people16 Moreover in their declarations each country committed itself to im-
plement the dual principle in their STW transition
Country case study Denmark
Denmark is among those EU countries that even before the introduction of the YG in
2013 (European Commission 2016a) already had a particularly well-functioning labour
market and educational system to help NEETs In fact Denmark already had some ex-
perience of a YG-like framework for a relatively long period before it was proposed by
the Council of the European Union The situation for Denmarkrsquos youth was therefore
more favourable than the EU average in 2012 The share of young people between 15
and 25 that were NEETs was only 66 - significantly below the proportion of NEETs in
many other EU countries Furthermore the majority of those individuals that were clas-
sified as NEETs were relatively close to the labour market and were therefore easier to
reach For example only 53 of Danish NEETs belonged to the group of long-term
unemployed or discouraged workers (Eurofound 2016)
Due to these circumstances the case for additional reforms within the YG was limited
Therefore along with reform efforts regarding active labour market policies concerning
youth and the educational system17 the implementation of the YG mostly required the
updating of existing policies This is exemplified by a strong increase in ALMP spending
from roughly 13 of GDP in 2012 to about 14 in 2015 despite declining rates of
youth unemployment and therefore a decrease in ALMP expenditure in other countries
over the same time period Denmark chose a particularly ambitious implementation by
focusing on youth under the age of 30 with a target window of less than four months so
as to offer their NEET population a quality measure In contrast to many other Member
States Denmark focuses on increasing the employability of NEETs via (continued) edu-
cation measures resulting in a share of apprenticeship take ups of over 50 relative to
the total number of timely exits from the YG This approach also matches the relatively
large proportion of low and medium educated youth among the NEETs
Two of the main pillars in the original 2014 Danish implementation plan were the ldquore-
tention task forcerdquo and the ldquoBridge Building to Educationrdquo programmes Both types of
initiatives were well-founded in regional and inter-organisational partnerships (for ex-
ample people involved include job centres municipalities educational facilities youth
organisations and others) While the aim of the first programme was to decrease high
school drop-out rates the latter took place at a vocational school in close cooperation
with the jobcentres and it focuses on helping youth to find their right path to success
through making the transition to vocational education This was done by assigning men-
tors to the NEET and giving them access to basic literacy and numeracy courses if they
needed them as well as further professional courses and traineeships The evaluation of
the ldquoBridge Building to Educationrdquo initiative yielded positive effects for youngsters par-
ticipating in the intervention compared to the control group (with a similar profile) which
did not participate in the intervention As a result two additional initiatives were set up
Firstly funds were made available to support the further implementation of ldquoBridge
Building to Educationrdquo initiatives Secondly ldquoJob-Bridge to Educationrdquo a randomised
controlled trial building on the core elements of ldquoBridge Building to Educationrdquo and tar-
geting the most vulnerable youth under 30 years without an education was also set up
16 Declarations of national commitment are downloadable from the EAFA website httpeceuropaeuapprenticeships-alliance
17 For more information see httpsuvmdkreform-af-de-forberedende-tilbudforberedende-grunduddannelseopbygning-og-maalgruppe
The Youth Guarantee in light of changes in the world of work Youth Guarantee Intervention Models Sustainability and Relevance
28
The project is set to end in mid-2020 where it will be followed by an evaluation of the
results
The Danish YG has also managed to set up a high-quality monitoring system with only
relatively few cases of missing information on YG participantsrsquo exit destinations (Euro-
pean Commission 2018a) Together with the relatively large share of NEETs who are
registered with the PES and the development of ldquoyouth guidance centresrdquo to reach out
to those who are not the Danish YG model is able to cover a substantial portion of
NEETs For instance in 2016 the YG coverage rate reached almost 60 of the NEET
population compared to the EU YG scheme average of 425 Thus despite more fa-
vourable initial conditions in Denmark the YG helped put a focus on the most vulnera-
ble youth and spur on a further integration of policies into national policymaking for
example through additional reforms aimed at improving active labour market policies
for young people Youth unemployment rates are currently trending downwards even
further in Denmark However there remain some issues especially with regard to the
integration of migrants given that youth unemployment is a much more pervasive issue
among them compared to native Danes (European Commission 2018a)
22 Empirical indicators of Youth Guarantee features
Section 21 has presented the key aspects that reflect how Members States implemented
the Youth Guarantee following the Recommendation In order to prepare the systematic
analysis of the YG in section 3 which develops a YG typology it is necessary to build
empirical indicators for each of these key aspects That is to say that this section dis-
cusses how information on each of these aspects can be measured and expressed in da-
ta18 These empirical indicators are therefore grouped into the corresponding six sets
1 Financial resources for implementing the Youth Guarantee
2 The Youth Guarantee as part of national policy-making
3 Youth labour market challenges
4 The heterogeneity of the NEET population
5 Design and implementation features of the Youth Guarantee
6 The role of the apprenticeship system in the Youth Guarantee
221 Indicator set 1 Financial resources for implementing the Youth
Guarantee
The set of indicators below represents the level and composition of financial resources
that Member States employed to support the Youth Guarantees implementation
i The size of ESFYEI transfers to match the respective NEET challenge is measured
by the ratio of initial YEI allocations as well as the YEI+ESF matching funds EU el-
igible cost both relative to Member Statesrsquo GDP in 2012 In addition a categori-
18 For each group of contextual and implementation features of the Youth Guarantee discussed in Section 21 an overview of potential quantitative or qualitative indicators was established which could represent these constructs Through a desk research of the available literature and online databases the availability of the respective indicators at the Member State level was assessed for a sufficiently large set of countries Unfortunately for a subset of potential indicators it was not possible to retrieve sufficient andor adequate information for a large enough sample of Member
States In some cases where several potential indicators were available to represent the same dimension or construct the available indicators that best represent the specific feature were iden-tified while also taking data quality into account In some cases single combined indicators were constructed to reduce the lsquodimensionalityrsquo of the database underlying the cluster analysis in sec-tion 3 See appendix A for more details on the exact indicators used and their source
The Youth Guarantee in light of changes in the world of work Youth Guarantee Intervention Models Sustainability and Relevance
29
cal variable for the estimated yearly costs relative to GDP for offering interven-
tions to all NEETs is included derived from Eurofound (2015a) The comparison of
both allows judgement of the importance of EU transfers in financing the YG
ii The degree to which Member States allocated additional funding from the ESF to
fund measures related to youth employment is measured in data about ldquoOther
ESF EU eligible costsrdquo (European Commission 2018k)
iii To proxy whether Member States dedicated additional funding from national
budgets to finance YG-related measures the evolution of overall active labour
market spending from 2012 to 2015 is used (Eurostat lmp_expsumm)19
iv Finally the degree to which Member States were able to absorb the additional
funding from the YEI in a timely manner is measured by the share of EU eligible
costs among YEI+ESF funds that were actually declared YEI+ESF funds based on
data from European Commission (2018k)
222 Indicator set 2 The Youth Guarantee as part of national policy-
making
The second set of indicators reflects the degree to which Member States made efforts to
introduce elements of the YG into national policy making and started partnerships
Regarding reform efforts the following indicators are included
i The degree to which the YG spurred wider longer-term reforms in Member States
is quantified by the total number of youth-related active labour market policy re-
forms between 2013-2016 based on LABREF information (the European Commis-
sionrsquos labour database)20
ii In addition the degree to which Member States were committed to the policy
change is approximated by the number of areas in which additional measures
were taken in the context of YG beyond the scope of the Recommendation (based
on European Commission 2016c)21
iii Finally the degree to which Member States were able to set up an effective YG
monitoring and follow-up system is taken into account as an indication of whether
they were committed to delivering the YG This means including 2016 data for the
proportion of YG exits with unknown destinations and the proportion of unknown
situations in the six-month follow-up data (European Commission 2018a)
The degree of partnerships built in each Member State is measured using the following
indicators
iv The degree to which partnerships were an element of the initial YG design is in-
cluded using the Member Statesrsquo self-reported involvement of social partners and
19 At the time of writing this report more recent data was only available for relatively small subset of EU countries
20 The authors refrain from using 2017 data on labour market reforms from the LABREF database as the objective is to measure the degree to which the YG was a driver of reforms in Member States That is this link becomes weaker over time such that the added value of more recent data
for the analysis is questionable
21 Due to their high correlation with LABREFrsquos own variations indicators of receipt and implemen-tation of country-specific recommendation between 2013-2017 and the qualitative classification by the Commission for the extent to which YG has acted as a driver of reform (European Commission 2016a) are not included in the set of indicators used
The Youth Guarantee in light of changes in the world of work Youth Guarantee Intervention Models Sustainability and Relevance
30
youth organisations in the design implementation and monitoring of the YG
(based on European Commission 2016c)22
v Furthermore the involvement of partners is approximated using the number of
areas where the PES is declared to have formed partnerships (based on European
Commission 2017a)23 In addition indicators are included for national PES re-
ported as having involved youth organisations and young people in the design of
YG services (based on European Commission 2017a)
223 Indicator set 3 Youth labour market challenges
To reflect how the challenges faced by young people in their transition from STW differ
across Member States the following empirical indicators are considered
i A set of indicators that reflect the significance of the youth unemployment chal-
lenge at the time when the YG was designed and rolled out These include the ra-
tio of unemployment rates for youth (age 15-24) and adults (age 25-74) the
share of people aged 15-24 of the total population (age 15-74) and the NEET
rate among youth aged 15-29 to obtain a measure of the size of the NEET chal-
lenge also for Member States that target individuals up to 29 years of age (Euro-
stat lfsa_pgaed une_rt_a edat_lfse_14 all indicators were measured in 2012)
ii To measure the initial degree of labour market segmentation and the quality of
entry-level jobs available to youth in each Member State the absolute difference
in the share of youth (15-24) to adults (25-54) in terms of the number on tempo-
rary employment contracts in 2012 (Eurostat lfsi_pt_a)
iii To address Member Statesrsquo response to these conditions several indicators are
included on the degree to which employment offers were favoured possibly re-
flecting a ldquowork-firstrdquo approach specifically the number of offers of employment
relative to the total number of all types of offers that are typically made to young
people registered in YG schemes (based on European Commission 2018b) In ad-
dition this includes a measure for the employment intensity of timely exits in
2016 (the share of all timely exits that were employment offers based on Euro-
pean Commission 2018b)
iv Lastly two indicators approximate the performance of education and training sys-
tems from which youth enter into the labour market and the potential severity of
the skills mismatch first the share of early school-leavers from education and
training among the youth population (age 18-24) in 2012 (Eurostat
edat_lfse_14) and second the share of NEETs with low and medium educational
attainment in 2012 To approximate the YG implementation with respect to skills
mismatches the number of offers of education relative to the total number of all
types of offers that are typically made to young people registered in YG schemes
is used (based on European Commission 2018b) In addition a measure is in-
cluded for the education intensity of timely exits in 2016 ie the share of all
timely exits that were education offers (based on European Commission 2018b)
22 An alternative source for partnership information is provided by ETUC (2018) Their data is ndash in
contrast to the data employed ndash not self-reported by the Member States However the ETUC (2018) report contains substantial missing information and hence was not used
23 Namely PES partnerships aimed at (i) ensuring that young people have full information and support available (ii) increasing employment apprenticeship and traineeship opportunities and (iii) supporting transitions from unemployment inactivity or education into work
The Youth Guarantee in light of changes in the world of work Youth Guarantee Intervention Models Sustainability and Relevance
31
224 Indicator set 4 The heterogeneity of the NEET population
The next set of indicators aims to reflect the diversity of the NEET population While
some indicators have already been introduced in the indicators above (for example NEET
rates by educational attainment) this additionally integrates the following
i The composition of NEETs as measured by the share of NEETs that are short-term
or long-term unemployed individuals about to re-enter education or employment
discouraged NEETs youth with illnesses or disabilities and the share of NEETs
with family responsibilities This gives an indication of the NEETsrsquo activity status
the potential reasons for their NEET status and their degree of closeness to the
labour market (Eurofound 2016 all indicators measured in 2013)24
ii Indicators describing the links between the PES for the YG This includes the
number of responsibilities of the PES in the YG as well as their main outreach
tools based on European Commission (2017a) Furthermore it includes indicators
on whether the PES is the main body responsible for the administration and pay-
ment of unemployment andor other types of benefits (based on European Com-
mission 2017a)
iii An indicator from European Commission (2017a) that reflects whether the re-
spective PES is reported to have taken any additional measures with respect to
preventing school drop-out
225 Indicator set 5 Design and implementation features of the Youth Guarantee
This set covers further design and implementation indicators that are likely to affect the
performance of the YG as implemented by the Member States
i Indicators on the envisaged length of the preparatory phase the eligible age
group the main YG provider whether online registration is possible for potential
YG participants as well as whether Member States created a legal entitlement to
receive an offer (all based on European Commission 2016c) In addition there is
an indicator measuring whether Member States specifically target the long-term
unemployed (Escudero and Mourelo 2017)
ii A categorical indicator providing information on whether a YG-related scheme was
already in place (in the long-term or recently) before the Recommendation
(based on European Commission 2016c)
iii Information on whether the Member States established a formal definition of a
good quality offer within the YG scheme (European Commission 2016a) and
whether quality management guidelines exist from the national administration to
organisations involved in YG (based on European Commission 2017a)
iv Indicators to reflect the relevance and potential upscaling of national PES capacity
since the YG Recommendation (all reflecting 2017 responses of PES based on
European Commission 2017a) These include whether the PES has dedicated YG
staff whether the PES provides training for YG staff whether the PES staff in-
creased or remained the same from 2014-2017 and whether the PES has specific
targets for youth (ibid)
24 Optionally the use of a more general measure of the NEET Cluster Type was tested which is a composite indicator on different levels reflecting the STW transition system and the composition of NEET in 2012 (Eurofound 2016) However as the clustering is based on the share and STW transition type data already employed the indicator is not used in the analysis
The Youth Guarantee in light of changes in the world of work Youth Guarantee Intervention Models Sustainability and Relevance
32
226 Indicator set 6 The role of the apprenticeship system in the Youth Guarantee
The final set of indicators represents the relevance and the set-up of apprenticeships in
the national education and training system as well as their role in the YGs implementa-
tion
i To provide information on the STW transition types of Member States indicators
are included based on the classification by Pohl and Walther (2005 2007) Fur-
thermore an indicator on the share of firms employing initial vocational training
participants in 2010 is used (Ireland 2015) (Eurostat trng_cvt_34s)
ii To reflect the relevance of apprenticeships in the YG implementation indicators
on the number of offers of apprenticeships relative to the total number of all
types of offers that are typically made to young people registered in YG schemes
(based on European Commission 2018b) In addition a measure for the appren-
ticeship-intensity of timely exits in 2016 ie the share of all timely exits that
were apprenticeship offers (based on European Commission 2018b)
iii The normalised number of pledges from firms and institutions to the European Al-
liance for Apprenticeships between the outset of the YG in 2013 and 2018 (based
on the national commitments database25)
23 Conclusion
This chapter has provided a comprehensive overview of the main aspects of the YG im-
plementation in context Specifically subsection 21 discussed a) the main financial re-
sources for implementing the YG b) the YGrsquos integration within national policy-making
c) the YG and youthrsquos labour market challenges d) the diversity of the NEET population
e) design and implementation features of the YG and f) the role of the apprenticeship
system in the YG Section 22 proceeded to identify and map six sets of empirical indica-
tors to each of these six implementation aspects In total 76 empirical indicators were
identified which will form the basis of the systematic analysis of a YG typology in the
next section Figure 5 gives a graphic overview of the number of indicators included in
each of the six indicator sets representing the key implementation aspects
25 The national commitments database available at httpeceuropaeusocialmainjspcatId=1148amplangId=en as of September 17 2018 This data-base also provides information on the number of pledges made by firms and institutions For the analysis the number of pledges is normalised by the share of firms employing IVET participants in each Member State to account for the relevance of the VET system
The Youth Guarantee in light of changes in the world of work Youth Guarantee Intervention Models Sustainability and Relevance
33
Figure 5 Number of indicators identified by variable set
Source Own analysis
Figure 5 illustrates that for example indicator set (5) ndash which represents the design and
implementation features of the YG ndash is the largest set comprising 20 indicators Whereas
the indicator sets (1) on financial resources for implementing the YG and (6) on the role
of the apprenticeship system (6) are somewhat smaller they still contain seven and nine
indicators respectively
3 Typology of Youth Guarantee models
This section is the empirical part of the analysis Based on the identification of the set of
relevant implementation aspects and the corresponding empirical indicators in the previ-
ous section Chapter 3 intends to systematise the main models that are currently in
place for delivering the YG in Member States It is an empirical attempt at establishing a
typology of different intervention models based on cluster analysis This section also
explores whether a correlation between specific types of intervention models and per-
formance in delivering the YG can be identified
31 Empirical approach to establishing Youth Guarantee models
To address the question about which main models are currently in place for delivering
the YG the analysis groups Member States according to their similarity across the em-
pirical indicators presented in section 22 Since both contextual features and implemen-
tation-related factors are included this procedure identifies types of countries that are
similar in both dimensions
To detect these types cluster analysis techniques are used in which the goal is to find
groups of observations in the data ndash that is groups of Member States ndash that are most
similar within clusters while being as dissimilar as possible across clusters In this study
hierarchical agglomerative clustering methods are employed These methods start out by
specifying each Member State as one individual cluster The cluster approach then grad-
ually combines Member States into clusters The choice of which clusters are to be com-
bined is determined by comparing their (dis-) similarity In the empirical application an
adequate measure of dissimilarity is the coefficient by Gower (1971) as it allows for the
combination of binary indicators and multivalued variables The choice of the linkage
method (the way the clustering algorithm combines similar observations into clusters) is
of similar importance in this case the Ward method (1963) is chosen which combines
groups or observations if they increase the within-group variance of the chosen indica-
tors by the least amount possible in the data Lastly the authors needed to choose the
7
11
11
18
20
9 (1) Financial resources for implementing the YG
(2) YG as part of national policy-making
(3) Youth labour market challenges
(4) Heterogeneity of NEET population
(5) Design and implementation features of the YG
(6) Role of the apprenticeship system in the YG
The Youth Guarantee in light of changes in the world of work Youth Guarantee Intervention Models Sustainability and Relevance
34
number of clusters to be generated Since this is not obvious in the application at hand
the Duda-Hart optimality criterion as described by Milligan and Cooper (1985) was ap-
plied This means that intuitively the index computes the added value of increasing the
number of clusters by one so a low Duda-Hart index indicates an optimal number of
clusters In the YG case the comparison is restricted to between three and seven clus-
ters as fewer clusters provide too little information while too many clusters hamper the
interpretability of results
The empirical application follows a two-step procedure In the first step a cluster analy-
sis for each set of the empirical indicators defined in section 22 determines sets of coun-
tries that are similar within each of these six conceptual sets For example the set on
financial resources puts countries with magnitudes of expected and realised costs for
implementing the YG based on the available information together In the second step
the main cluster analysis based on all indicators determines a final cluster analysis which
also allows the authors to analyse their correspondence to the sub-clusters from the first
stage Readers should note that the quality of the cluster groups depends ndash among other
factors- on the data quality of available indicators as well as the number of indicators
used The more indicators are required for meaningful results the more difficult it is to
obtain clusters that differ sharply with respect to all the chosen indicators Thus it may
be that one country differs quite substantially in terms of one indicator from the rest of
the countries in a particular cluster if the other indicators show similar realisations
Hence for the description of clusters attention is restricted to those indicators that
summarise the cluster differences the best presenting the general tendencies of the
cluster analysis necessarily simplifying to a certain degree Furthermore readers should
also note that the groupings following from this exercise do generally not imply any
qualitative ranking
32 Description of first-step clusters
321 Indicator set 1 Financial resources
Cluster A (AT DK FI DE LU NL and SE) is a set of countries with a low estimated cost
of fully implementing the YG that received relatively little financial support from EU
funds both via the YEI and the ESF On average these states show very little changes in
active labour market policy (ALMP) spending between 2012 and 2015
Cluster B (BE CZ EE FR IE IT MT RO SI and UK) and Cluster C (ES LT LV PL and
PT) are countries with costs estimated to be of medium magnitude to fully implement
the YG Country cluster C received more EU funds from the YEI and the ESF matching
funds - and other ESF eligible youth-related projects - compared to cluster B Both clus-
ters showed only a small change in ALMP expenditure
Cluster D (BG CY EL HU HR and SK) has high estimated YG costs and they received
substantial monetary support from the EU to support the implementation of the YG
through the YEI through the ESF matching funds and through financing of other eligible
youth-related projects Cluster D is also the only one in the analysis that shows a sub-
stantial increase in ALMP spending between 2012 and 2015 despite declining (youth)
unemployment rates
322 Indicator set 2 Youth Guarantee as part of national policy-
making
Cluster A (DK ES FR HU IE SE and SK) has a large average number of youth-related
ALMP reforms and additional measures implemented beyond the scope of the Recom-
mendation These Member States also tend to enforce comparatively effective YG moni-
The Youth Guarantee in light of changes in the world of work Youth Guarantee Intervention Models Sustainability and Relevance
35
toring and follow-up systems which may be interpreted as an indication that they are
committed to deliver on the YG However on average these Member States did not pri-
oritise partnerships as much as other clusters
Cluster B (AT CZ DE EE EL NL RO and UK) is mostly defined by the lack of effective
monitoring and follow-up systems and also fewer reforms were put in place compared to
Member States in other clusters Nonetheless on average they put more emphasis on
involving social partners and youth organisations and built more partnerships than coun-
tries in cluster A
Cluster C (BE BG CY FI HR IT LV LT LU MT PL PT and SI) implemented many
youth-related reforms and additional measures as part of the implementation of YG rec-
ommendations However in contrast with cluster A these Member States also included
partnerships with social partners and youth organisations as a central element of the
initial YG design Consequently the PES in these Member States often said that they had
formed partnerships and that they regularly involve youth and youth organisations into
their work Nonetheless their monitoring systems are still underperforming compared to
countries in Cluster A
323 Indicator set 3 Youth labour market challenges
Cluster A (BG CY EL HR PL and SK) includes Member States that had the highest
NEET rate amongst 15-29 year olds in 2012 before the YG was rolled out Moreover
they show the largest difference in shares of temporary employment contracts between
the youth and adults Countries in this cluster have the best educated NEETs on average
This also reflects the point that the issue was not so much the education system as the
figures also show a comparatively low average shares of school drop-outs Correspond-
ingly Member States in cluster A usually responded by focusing on employment-related
measures under the YG rather than offers of education
Cluster B (AT DE DK ES LV and MT) relates to the contrasting cases These Member
States tend to have comparatively low NEET shares with most of them having a poor
level of education and the lowest average youth-to-adult unemployment ratio In addi-
tion these countries appear to have a rather well-functioning educational system with
similarly low average shares of early school-leavers compared to cluster A Most of
these Member States responded to this setting with a strong focus on educational offers
under the YG
Cluster C (BE CZ EE FI FR HU IE IT LT LU NL PT RO SI SE and UK) ranks in
between cluster two and three on many indicators including the prevalence of low edu-
cated NEETs education and employment offers In general this cluster has the lowest
difference in temporary employment shares between adults and the youth
324 Indicator set 4 The heterogeneity of the NEET population
Cluster A (BE BG FI MT and NL) consists of countries that have a particularly high
share of NEETs in short-term unemployment illness or disability and lsquodiscouragement
from workingrsquo The policy response of these countries is characterised by the highest
average outreach efforts on the part of the national PES
Cluster B (CZ DE EE EL FR HU HR LT LU PL SI and UK) has the highest share of
short-term unemployed and individuals with family responsibilities among the NEETs
Similar to cluster A countries from cluster B display strong average outreach efforts and
a large degree of involvement of the PES in delivering the YG
The Youth Guarantee in light of changes in the world of work Youth Guarantee Intervention Models Sustainability and Relevance
36
Cluster C (AT CY DK ES IE IT LV PT RO SK and SE) is the most diverse for this
indicator set and shows the highest share of long-term unemployed and relatively high
rates of discouraged youth among the NEET population compared to other clusters The
governance structure shows a lower degree of PES having responsibility for administer-
ing and paying (unemployment) benefits as well as regarding the implementation and
delivery of the YG in general Compared to clusters A and B Member States from cluster
C tend to show fewer outreach efforts
325 Indicator set 5 Design and implementation features of the Youth Guarantee
Cluster A (AT CY DE DK EL FI HR IE LU and SE) includes many Member States
which set the age target as under-25 years old26 These countries also tend to define
very few other eligibility criteria or target groups Importantly all Member States includ-
ed in this category have a relatively long experience of YG-type schemes prior to 2013
However only very few of them defined a legal entitlement to receive an offer These
are also countries that mostly allowed individuals to register online set a definition for a
quality offer and also provided national quality guidelines for all actors involved in the
YG Many of the Member States in this cluster also primarily rely on their PES in the YG
implementation and have strengthened their PES capacities since the YG rollout
Cluster B (BG CZ ES FR MT NL PT and RO) includes a relatively diverse set of coun-
tries Most countries in this cluster have no prior experience of a YG-type of scheme
relatively low availability of online registration and a low prevalence of the definition of
quality offers While some countries additionally target NEETs under 30 years old in
general they neither upgraded the capacity of nor relied strongly on their PES in its im-
plementation
Cluster C (BE EE HU IT LV LT PL SI SK and UK) primarily consists of countries that
set the target for youth aged under 30 In addition many of these countries set addi-
tional target groups beyond the general criteria (such as a specific focus on long-term
unemployed) or defined specific sub-groups within the broad target population Similar
to cluster A some Member States with previous YG-related experience are included in
this cluster In addition they tend to have upgraded their PES capacity for YG implemen-
tation (but they also rely on other providers) These are also mainly countries that im-
plemented a legal entitlement and also a definition of a quality offer (without however
providing national guidelines)
326 Indicator set 6 The apprenticeship system
Cluster A (AT BE DE FR LU and NL) consists of countries with an employment-centred
STW transition type27 that is characterised by high levels of employer involvement in
education and training system and the largest share of firms employing initial vocational
and educational training (IVET) participants On average Member States in this group
show the largest share of timely exits from apprenticeships Relative to the share of
firms employing IVET participants the number of pledges within the EAFA framework is
26 It is important to note that most implementation-related indicators for example information on eligible age groups were measured in 2016 For a few countries these conditions have changed recently However in the analysis it was decided to stick to the initial implementation features to focus on the way Member States initially aimed to combat youth unemployment
27 See Pohl and Walther (2005) for details
The Youth Guarantee in light of changes in the world of work Youth Guarantee Intervention Models Sustainability and Relevance
37
the lowest in this group potentially reflecting the already high importance of apprentice-
ships in these countries
Cluster B (BG CZ EE HU LT LV RO SK and SI) is made up of Member States that
joined the EU relatively recently with a lsquotransitionalrsquo STW transition type and the lowest
share of firms employing IVETs Their share of apprenticeships is lowest among the
timely exits and their number for EAFA pledges is relatively the largest
Compared to cluster A and B cluster C (CY DK EL ES FI HR IE IT MT PL PT SE
and UK) also consists of a mixture of STW types and a medium share of firms hiring
IVETs Apprenticeship offers are of medium importance relative to the other two clus-
ters
327 Summary of first-step cluster analysis
The analysis of Member Statesrsquo similarities within the indicator sets shows that the re-
sulting country clusters tend to be different depending on the set of indicators although
certain tendencies are already apparent For instance countries that are included in the
same cluster for the YG design and implementation indicators tend to also be grouped
into the same finance cluster meaning that some countries with a low estimated cost of
implementing the YG tend to also be countries that show implementation patterns that
closely followed the Recommendation Similarly countries in the same apprenticeship
cluster tend to be in the same ldquoyouth labour market challengesrdquo cluster While this al-
ready provides some suggestions for the final grouping of Member States with respect to
all indicators chosen the overlap across clusters for the different indicator sets is not
complete so a more in-depth analysis is needed Specifically some clusters remain rela-
tively heterogeneous in terms of the underlying empirical indicators indicating that the
cluster analysis has some difficulties if Member Statesrsquo realisations of indicators do not
follow a simple pattern making the interpretation of some cluster results more difficult
than others For these reasons and to further reduce the dimensionality of the problem
the next section groups Member States based on all the chosen indicators To make the
connection between the first-step analysis and the ensuing second step the association
of first-step clusters with the final cluster results is also shown
The Youth Guarantee in light of changes in the world of work Youth Guarantee Intervention Models Sustainability and Relevance
38
33 Results and discussion of second-step clusters
The final cluster analysis uses all the indicators described in the previous section and
performs the clustering procedure for all variables in a combined step thereby arriving
at clusters that take the individual sub-clusters as well as the interaction between them
into account Table 2 shows the results by Member States including their association
with the clusters uncovered in the first stage of the analysis all ordered by the final re-
sults Being in the same first-step cluster is visualised as having the same shade of the
colour in the respective column It is important to note that the colours chosen imply no
qualitative or quantitative judgement apart from the cluster membership
Table 2 Summary of Results of Cluster Analysis
Country
Financial resources for implementing the YG
YG as part of national policymaking
Youth labour market chal-lenges
Heterogenei-ty of the NEET population
Design and implementa-tion features of the YG
Role of the apprentice-ship system in the YG
Overall cluster
Austria
A
Denmark
Finland
Germany
Ireland
The Netherlands
Sweden
The Czech Republic
B
Estonia
France
Hungary
Romania
The United Kingdom
Cyprus
C
Greece
Italy
Portugal
Spain
Belgium
D
Lithuania
Luxembourg
Malta
Poland
Slovenia
Bulgaria
E Croatia
Latvia
Slovakia
Source Own analysis
Note Countries that share the same first-stage cluster have the same shade of the colour in the respective
column Note that the colour shades imply no qualitative or quantitative ranking of Member States
The Youth Guarantee in light of changes in the world of work Youth Guarantee Intervention Models Sustainability and Relevance
39
Cluster A Member States with previous YG experience lower initial NEET rates
ambitious implementation and improved PES capacity low educated NEETs and
diversified offers (AT DK DE FI IE NL SE)
The first cluster is a set of Member States that are mostly countries which already had
longer experience with YG-related schemes On average YG implementation in these
countries was quite ambitious many of these Member States undercut the recommend-
ed four-month target for the preparatory phase and formally defined their offer quality
and quality guidelines Countries in this cluster tend to rely relatively strongly on their
PES for the YG while upscaling their PES capacity through hiring additional staff At the
same time they also experienced the lowest average NEET rates in 2012 for all clusters
and they consequently had comparatively low estimated costs and therefore low levels of
funding allocated under the YEI However the clusterrsquos NEET population has the highest
share of individuals with low educational background and youth with a disability Follow-
ing this NEET challenge they diversified their offers under the YG across types the most
compared to other clusters with the lowest focus on employment-type offers Involve-
ment and integration of partners within the YG framework in these countries was about
average compared to the other clusters
Cluster B Member States with intermediate NEET challenges strong outreach
efforts by the PES relatively poor monitoring data quality high NEET rates due
to family responsibilities and strong focus on employment offers (CZ EE FR HU
RO UK)
On average these Member States mostly observed a NEET challenge of intermediate
magnitude relative to other clusters at the time of the YG roll-out The labour markets
for youth in this cluster were under more stress and characterised by high rates of short-
term unemployment among their youth ndash for some of them also as a consequence of the
great recession Furthermore this cluster also had by far the highest share of youth that
were NEETs due to family responsibilities and the largest gap between youth and adult
unemployment rates As a result most of them received some funding under the YEI It
is also notable that countries in this cluster showed the largest increase in ALMP ex-
penditure between 2012 and 2015 However compared to the other clusters countries
in this cluster showed particularly poor monitoring data quality so their information has
a high degree of unknown destinations and situations for previous YG participants On
implementation a significant fraction of Member States from cluster B chose slightly
different targets (for example through targeting long-term unemployed introducing a
legal entitlement to a YG offer and extending the age limit up to age 29) They could
build on a comparatively advanced outreach system through the PES which they also
relied on in their YG implementation Furthermore four of the seven countries in this
cluster follow the post-socialisttransitional STW model (the Czech Republic Estonia
Hungary and Romania) On average these countries showed the lowest level of in-
volvement of the social partners and youth organisations and relatively few efforts at
reform On average countries in this cluster had the highest rate of timely exits into
employment indicating a tendency towards an ldquoemployment-firstrdquo approach
Cluster C Member States hit by the economic recession with highest initial
NEET rates severe long-term unemployment large support via EU funding
highest reform efforts and highest entry rates into apprenticeship offers (CY EL
ES IT PT)
The third cluster consists mainly of Member States that were hit particularly hard by the
economic recession following the financial crisis in the years after 2008 and they were
struggling to revive their labour markets in the ensuing recovery As a consequence
most countries had a severe problem with long-term youth unemployment into 2012
The Youth Guarantee in light of changes in the world of work Youth Guarantee Intervention Models Sustainability and Relevance
40
Moreover countries in this cluster had on average the highest rate of early school-
leavers Almost all these Member States received significant funds from the EU to sup-
port the YG implementation and delivery In contrast to Member States in Clusters A and
B none of the countries in cluster C had any kind of experience of a YG type of frame-
work before the Recommendation making its implementation even more difficult in
these countries However in terms of policy integration these Member States rank at
the top of youth-related ALMP reform efforts At the same time most of these countries
still have monitoring systems with relatively poor data quality and their PES used rela-
tively few channels for outreach activities compared to countries in the other clusters
Regarding partnerships built countries in this cluster show an average degree of effort
While the share of low educated NEET is comparable to those in Cluster B and average
exits rates into education are only slightly smaller than among countries from Cluster B
the share of individuals entering apprenticeships is highest among these countries sug-
gesting a stronger focus on the provision of both training and work experience to combat
the NEET challenge
Cluster D Member States characterised by relatively low initial NEET rates and
short-term unemployed rather than inactive NEETs some funding under YEI
strong outreach efforts through the PES and partnership approach and diversi-
fied offers with a stronger focus on education offers (BE MT LT LU PL SI)
The challenge for most Member States in this cluster was the high proportion of youth in
unemployment rather than a structural NEET challenge as most of their NEETs are
short term unemployed rather than discouraged NEETs or inactive for other reasons
Most of the countries in cluster D have medium-level estimated costs of fully implement-
ing the YG Consequently most of these Member States did not receive particularly large
amounts of funding from the EU (except Lithuania and Poland) At the same time these
are mainly Member States that put the most weight on building partnerships involving
social partners and youth organisations as well as outreach efforts including through the
PES Many of the Member States in this cluster followed the Recommendation quite
closely in terms of the time-frame for the YG but they did not establish strong monitor-
ing systems and they did not carry out many youth-related reforms in recent years
relative to other Member States In terms of the offer distribution these countries gen-
erally showed diversified offers with the strongest focus on education measures shown
by the largest share of timely exits from the YG into education and the lowest focus on
employment offers This is despite the fact that on average clusters B C and D had
very similar shares of low and medium educated NEETs at the onset of the YG suggest-
ing a very different policy response
Cluster E Member States that joined the EU relatively recently with lsquotransi-
tionalrsquo STW regimes high initial NEET rates structural challenges and substan-
tial EU funding focus on employment offers rather high reform efforts (BG HR
LV SK)
This cluster consists entirely of countries that joined the EU relatively recently compared
to the other Member States They are countries with a lsquotransitionalrsquo STW regime and
without prior experience in YG-type of frameworks before the Recommendation While
these countries have the lowest rate of early school-leavers and a substantially lower
share of low educated individuals among the NEETs compared to the other clusters this
cluster has the second largest share of NEETs with family responsibilities and the largest
share of discouraged youth This suggests that they struggled with more significant
structural NEET challenges compared to the other clusters The high NEET rates resulted
in high estimated costs for implementing the YG and consequently these Member States
also received substantial funding from the EU
The Youth Guarantee in light of changes in the world of work Youth Guarantee Intervention Models Sustainability and Relevance
41
Moreover these Member States also put in place a significant number of youth-related
ALMP reforms between 2013 and 2016 only outpaced by cluster C In terms of design
and implementation all of these countries chose to target youth under 30 and most put
particular emphasis on long-term unemployed individuals The degree of outreach efforts
through the PES is of average magnitude but the involvement of social partners and
youth organisations is highest among countries in this cluster This may indicate a cer-
tain degree of mismatch regarding outreach activities and the efforts likely to be re-
quired to activate the substantial share of discouraged NEETs in the youth population
However this cluster is the only in which all the Member States have YG-specific staff at
the PES and where all of them increased PES staff in recent years Due to the relatively
well-qualified nature of the NEET population Member States in this cluster concentrated
mostly on employment-type offers
34 Conclusion of second-step clusters
Breaking down the differences between clusters in a simple way is evidently challenging
due to the many aspects considered and highlighted in the cluster-specific characterisa-
tions This section therefore only provides a short conclusion to the findings in the final
cluster analysis indicating several sorts of Youth Guarantee models in place in the Euro-
pean Union It shows three clusters with comparatively low initial NEET rates at the out-
set of the YG Cluster A Cluster B and Cluster D What distinguishes these clusters from
one another among other issues is that Member States in Cluster A already had a long-
er experience of YG-related schemes they observed fewer youth-related challenges and
hence they received less additional funds from the EU
In contrast to this most Member States with the most pressing NEET challenges in 2012
are found in the other two clusters Cluster C and Cluster E include Member States with
particular NEET challenges mostly related to the financial crisis and recession for coun-
tries in Cluster C Member States in Cluster E also had a particular structural NEET chal-
lenge partially stemming from the transitional STW regime and they all received signifi-
cant funding from the EU
35 Measures of performance
Before investigating the correlation between the types of European YG models identified
and the performance of the YG implementation the analysis needs to define the relevant
outcome measures employed for this last step of the empirical analysis The correlation
analysis will make substantive use of information from the YG monitoring data The most
recent data available at the time of writing are from 2016 and they include information
on the main dimensions of the Recommendation
i ldquoCoveragerdquo rate provides an estimation of the degree to which the NEET popula-
tion was reached by the YG (the estimated proportion of the NEET population
aged 15-24 that was enrolled in the YG scheme at any point during the reference
year)28
28 These figures are based on the indicator average annual stock of young people in the YG pre-
paratory phase NEET population (annual average) included in the Indicator Framework for Moni-
toring the Youth Guarantee This indicator combines administrative and survey data Whilst this is not ideal the indicator is useful to give an approximate indication of the proportion of NEETs regis-tered in the YG scheme at any point during the year Results should therefore be interpreted as an estimation rather than a definitive measurement of the extent to which YG schemes achieve the objective of reaching all young people that become or are already NEET
The Youth Guarantee in light of changes in the world of work Youth Guarantee Intervention Models Sustainability and Relevance
42
ii The share beyond the four-month target the share of young people in the pre-
paratory phase beyond the four-month goal measured as a percentage of the
average annual stock of participants
iii Positive and timely exits the share of positive and timely exits shows how suc-
cessful Member States were at providing offers within the envisaged four-month
preparatory phase measured in percentage of all exits
iv Positive situations after six months this measure gives the percentage of YG par-
ticipants being in a positive situation at six months after exiting the programme -
the share of individuals either in education training or employment as a percent-
age of all exits
These performance indicators provide the most comprehensive and direct evidence on
the performance of the YG However there are some data limitations regarding the de-
gree to which the entire NEET population can be identified relevant for the comparability
of the coverage rate across Member States The quality of information on positive and
timely exits as well as the share of participants in a positive situation after exiting the YG
depends on the degree to which the destination of exits is known and how well individu-
als can be followed up Again to a certain degree this limits comparability across coun-
tries The distribution of these indicators across Member States is depicted in Figure 6 For the interested reader a separate cluster analysis solely based on the measures of YG
performance in Table 4 is included in the Annex
The Youth Guarantee in light of changes in the world of work Youth Guarantee Intervention Models Sustainability and Relevance
43
Figure 6 YG-monitoring data performance indicators by Member States 2016
Source YG monitoring data
0
10
20
30
40
50
60
70
80
90
100M
T
HU
UK
BG IT RO CY LV LU EE ES LT IE EL SE SK NL
CZ
HR PL
DK PT SI DE
FR BE FI AT
Coverage rate Share beyond the 4 month target
0
10
20
30
40
50
60
70
80
90
100
CY UK RO FR EL SI HR SK IE BG PT NL LV SE ES LU LT BE PL FI AT EE DE CZ IT DK HU MT
Positive and timely exits Positive situations after 6 months
The Youth Guarantee in light of changes in the world of work Youth Guarantee Intervention Models Sustainability and Relevance
44
To account for measuring issues in the monitoring data and because the main goal of
the YG was to lower youth unemployment and the prevalence of NEETs in general the
reduction from 2012 to 2017 in NEET rates and youth unemployment rates based on
Eurostat indicators is used as additional outcome measures
v Youth unemployment this measure gives the percentage of the 15-24 year old
young people in the labour force that are unemployed
vi NEET rates the NEET rate indicator is defined as the share of the youth popula-
tion (active or inactive) aged 15-24 that is not in employment education or
training
The distribution of these indicators is shown in Figure 7
Figure 7 Eurostat performance indicators by Member States 2012-2017
Source Eurostat (une_rt_a lfsi_neet_a)
36 Assessing the correlation between Youth Guarantee models
and performance
The goal of this section is to compare the performance of the YG as implemented in each
Member State across the clusters identified in section 34 and then to assess emerging
patterns This will be done by using box plots shown for each of the performance indica-
tors separately Box plots allow the comparison of the distribution of indicators across
clusters The median ie the observation in the middle in terms of outcomes (for in-
stance the middle value of all coverage rates within a cluster Figure 8 upper left panel)
is shown by the horizontal lines within each box Furthermore the size of the box shows
the location of the 50 closest observations to the median Observations outside this
box are shown in the graph by the so-called lsquowhiskersrsquo Extreme values that are far away
from the box are displayed as dots Figure 8 shows the distribution of performance
measures for the YG monitoring data
-5
0
5
10
15
20
FI AT
BE IT DE
FR LU NL
CY
DK
MT
RO SE EE UK SI LV CZ EL PL LT PT ES HR SK BG IE
HU
Reduction in youth unemployment Reduction in NEET rates
The Youth Guarantee in light of changes in the world of work Youth Guarantee Intervention Models Sustainability and Relevance
45
Figure 8 YG monitoring data performance indicators by clusters
Source Own analysis
The graph for the coverage rate (upper left panel) shows that clusters A and D have the
highest median coverage rates among the five clusters This appears quite natural as
these countries have had the lowest NEET rates at the onset of the YG making it easier
to cover a large portion of vulnerable youth compared to other countries Clusters B C
and E perform relatively similarly in terms of coverage with median values in the range
of 20 to 40 coverage rate despite the fact that clusters C and E had considerably larg-
er NEET rates when the YG was first introduced Among other factors these two clusters
have in common is that they received substantial funds from the EU to support YG
measures and that countries from both clusters enacted a significant number of youth-
related ALMP reforms
The upper right panel displays results for the share of participants still being in the pre-
paratory phase beyond the envisaged four months in each of the clusters A B D and E
this share is in the range of 45 to 50 in terms of the median values in cluster C this
value is 60 Clusters B and D show considerably more variation than the other clus-
ters The figure indicates therefore that the countries in cluster C appear to have put in
comparatively lower effort to upscaling their PES to provide YG services in time reflected
in the fact that these countries have the highest share of individuals in the preparatory
phase beyond the four month target
With respect to positive and timely exits (bottom left panel) there is no pronounced vari-
ation in terms of median outcomes across the clusters All of the clusters have positive
and timely exit rates of around 40 or slightly higher Finally looking at the share of
positive situations for YG participants after 6 months of leaving the programme (bottom
right panel) one can see that the median outcomes are quite similar for all clusters ex-
cept cluster B which has substantially lower positive outcomes after 6 months In addi-
tion there appear to be substantial differences in the within-cluster variation of this out-
The Youth Guarantee in light of changes in the world of work Youth Guarantee Intervention Models Sustainability and Relevance
46
come however this finding is probably due to the lack of data since for some Member
States these figures are not available (and coded as zero in the monitoring data) A simi-
lar reasoning can be used to explain the large variation between clusters A and D
Figure 9 Aggregate performance measures
Source Own analysis
Figure 9 investigates the reductions in youth unemployment rates and NEET rates from
2012 to 2017 respectively Both graphs display a similar pattern although the reduction
in youth unemployment is generally larger implying that a larger reduction was
achieved among those youth closer to the labour market Focusing on the cluster medi-
ans the figure indicates that cluster A ndash the cluster with the lowest initial NEET and un-
employment rates ndash shows the smallest decline Clusters B C and D show relatively
similar reductions in youth unemployment cluster E being at the top of the distribution
The picture is slightly different when looking at the reduction of NEET rates Here cluster
C has the largest median reduction in NEETs and clusters B D and E display similar per-
formance despite differences in variability Thus cluster E ndash the cluster with a combina-
tion of high initial NEET rates and more structural issues (such as a high share of dis-
couraged NEETs) ndash was more successful in reducing youth unemployment while clus-
ter C (with similarly high NEET rates for 2012 but lower educated NEETs and the highest
apprenticeship take-up rate in terms of timely exits among all clusters) was more suc-
cessful in reducing its NEET rates
4 Summary and conclusions
This report provides an updated overview of the implementation of the YG across EU
Member States based on the recent literature and data on the YG and European labour
markets On this basis six aspects of the Youth Guarantee implementation are dis-
cussed (1) financial resources for implementing the YG (2) the YG as part of national
policy making (3) youth labour market challenges (4) the heterogeneity of the NEET
population (5) the design and implementation features of the YG and (6) the role of the
apprenticeship system in the YG
The overall findings of the desk research and data analysis can be summarised as fol-
lows EU funding initiatives via the Youth Employment Initiative (YEI) and the European
Structural Fund (ESF) played a key role in supporting YG measures financially especially
for those countries suffering from high NEET rates and a significant economic downturn
or structural challenges Many of these countries increased spending on active labour
market policy which may be cautiously interpreted as an indirect effect of the YG In
some Member States the YG also fostered introduction of reforms of national youth poli-
The Youth Guarantee in light of changes in the world of work Youth Guarantee Intervention Models Sustainability and Relevance
47
cies improvements in monitoring systems for activation policies among young people
and the building of partnerships These changes are likely to outlast the YG initiative and
therefore provide sustained and ongoing benefits
Whereas these are substantive positive changes brought about by the YG not all of its
objectives were achieved First neither reducing labour market segmentation through
quality offers nor providing a remedy for imperfectly performing education systems was
fully achieved One reason was a prevalence of employment offers compared to relative-
ly few education or apprenticeship offers The low share of apprenticeship offers in some
Member States appears to be related to the existing institutional setup and STW transi-
tion regime increasing the prominence of the apprenticeship system would need to be
accompanied by broader institutional change Second several Member States were not
able to fully address the heterogeneity of the NEET population ndash especially those furthest
away from the labour market In contrast countries that performed well generally im-
proved the capacity of their Public Employment Services (PES) and developed partner-
ships to implement strong outreach programmes
Based on desk research of the six key aspects that are likely to influence the perfor-
mance of the YG as delivered by Member States a set of empirical indicators was de-
fined to measure the components of these six aspects using available quantitative and
qualitative data These empirical indicators feed into the main part of the analysis that
identifies the YG typology in terms of the key aspects specifically this approach groups
together Member States that share similar outputs across all the features included in the
analysis In practice the typology is derived from a two-step cluster analysis using an
agglomerative clustering algorithm
The first step of the typology discusses the similarity between Member States regarding
implementation-related and contextual features within six pre-defined sets of indicators
each corresponding to one of the six key aspects of the YG The cluster analysis gener-
ates different group compositions regarding Member States for each of the sets of empir-
ical indicators defined so a low-dimensional analysis is only partially informative This
result indicates that many aspects of the YG ndash and their interrelation ndash need to be con-
sidered in a comprehensive typology The second-step cluster analysis therefore simul-
taneously takes into account all of the 76 empirical indicators and identifies five final
clusters
Cluster A Member States with previous YG experience lower initial NEET rates ambi-
tious implementation and improved PES capacity low educated NEETs and diversified
offers (AT DK DE FI IE NL SE)
Cluster B Member States with intermediate NEET challenges strong outreach efforts by
the PES relatively poor monitoring data quality high NEET rates due to family responsi-
bilities and strong focus on employment offers (CZ EE FR HU RO UK)
Cluster C Member States hit by the economic recession with highest initial NEET rates
severe long-term unemployment large support via EU funding highest reform efforts
and highest entry rates into apprenticeship offers (CY EL ES IT PT)
Cluster D Member States characterised by relatively low initial NEET rates and short-
term unemployed rather than inactive NEETs some funding under YEI strong outreach
efforts through the PES and partnership approach and diversified offers with a stronger
focus on education offers (BE MT LT LU PL SI)
Cluster E Member States that joined the EU relatively recently with lsquotransitionalrsquo STW
regimes high initial NEET rates structural challenges and substantial EU funding focus
on employment offers rather high reform efforts (BG HR LV SK)
The Youth Guarantee in light of changes in the world of work Youth Guarantee Intervention Models Sustainability and Relevance
48
Obviously these explicit labels for the clusters tend to simplify the other factors of het-
erogeneity across Member States that determine the typology However some conclu-
sions can be drawn regarding the fit of underlying challenges to be addressed with the
policy response observed In particular it appears that countries in Cluster A C and D
reflected the challenges observed in the design and implementation of the YG to a higher
degree compared to cluster B and E as policies implemented ndash for example regarding
outreach efforts the extent of partnerships and the offer mix introduced ndash seem to bet-
ter match key factors of heterogeneity in the NEET population
Based on these insights the analysis continues with a correlation analysis relating the
identified YG models to basic performance indicators The findings highlight that there is
no evident pattern regarding the clustersrsquo performance in general Cluster A performs
well in terms of the NEET ldquocoveragerdquo rate but less well regarding the reduction in NEET
and unemployment rates over time Clusters B and D perform relatively similar across all
outcome measures although there is some variation that probably stems from meas-
urement issues in the monitoring data Cluster C shows the largest share of youth in the
preparatory phase beyond the envisaged four months but also the largest median de-
cline in NEET rates Cluster E has the lowest share of positive and timely exits but the
largest decline in youth unemployment out of all clusters
While the evidence is thus far from conclusive partly due to the number and complex
inter-relation of the aspects in which clusters differ the reportrsquos findings nonetheless
indicate that not only initial conditions but also the way Member States implement the
YG has affected its success
The Youth Guarantee in light of changes in the world of work Youth Guarantee Intervention Models Sustainability and Relevance
49
References
Andor L and Veselyacute L (2018) The EUrsquos Youth Guarantee a broadly accepted reform in
need of full implementation OSE paper series No 19
ANPAL (2017) Rapporto sullrsquoattuazione della Garanzia Giovani in Italia Rapporto
trimestrale n 4 Roma
ANPAL (2018) Monitoraggio sulla struttura e il funzionamento dei servizi per il lavoro
2017 Roma
Council of the European Union (2013) Council Recommendation of 22 April 2013 on es-
tablishing a Youth Guarantee Official Journal of the European Union Brussels
Department of Education and Skills (2016) Evaluation of the operation of the Youth Em-
ployment Initiative (YEI) element of the European Social Fund (ESF) Programme for Em-
ployability Inclusion and Learning (PEIL) 2014-2020
Department of Social Protection (DSP) (2014a) Pathways to Work - The Implementation
of the EU Council Recommendation for a Youth Guarantee
Department of Social Protection (DSP) (2016a) Member Statesrsquo response to 2013 Coun-
cil Recommendation on establishing a Youth Guarantee [Ireland]
Dheacuteret C and Roden J (2016) Towards a Europeanisation of Youth Employment Poli-
cies ndash A Comparative Analysis of Regional Youth Guarantee Policy Designs EPC Issue
Paper Ndeg81
Dheacuteret C and Morosi M (2015) lsquoOne Year After the Youth Guarantee Policy Fatigue or
Signs of Actionrsquo EPC Policy Brief Brussels European Policy Centre (EPC)
Doherty R (2018) lsquoWritten answer ndash Youth Guaranteersquo Daacuteil Eacuteireann Debate 22 March
2018
Eichhorst W Hinte H and Rinne U (2013) Youth Unemployment in Europe What to
Do about It IZA Policy Paper No 65 July httpftpizaorgpp65pdf
Employment Committee (EMCO) (2017) Ireland - 2017 EMCO Review on the Youth
Guarantee ndash Self-Assessment Questionnaire
Escudero V and E Loacutepez Mourelo (2017) The European Youth Guarantee A systematic
review of its implementation across countries Research Department Working Paper No
21 ILO Geneva
Eurofound (2013a) Young People and Temporary Employment in Europe Publications
Office of the European Union Luxembourg
Eurofound (2013b) Working Conditions of Young Entrants to the Labour Market Publica-
tions Office of the European Union Luxembourg
Eurofound (2014) Mapping Youth Transitions in Europe 2372014 Publications Office
of the European Union Luxembourg
Eurofound (2015a) Beyond the Youth Guarantee - Lessons Learned in the First Year of
Implementation Background Document prepared by Eurofound as a contribution to the
informal EPSCO meeting of 16-17 July 2015 Publications Office of the European Union
Luxembourg
Eurofound (2015b) Social Inclusion of Young People Publications Office of the European
Union Luxembourg
Eurofound (2016) Exploring the diversity of NEETs Publications Office of the European
Union Luxembourg
Eurofound (2017) Long-term unemployed youth Characteristics and policy responses
Publications Office of the European Union Luxembourg
The Youth Guarantee in light of changes in the world of work Youth Guarantee Intervention Models Sustainability and Relevance
50
European Alliance for Apprenticeship (2013) ldquoDeclaration of the European Social Part-
ners the European Commission and the Lithuanian Presidency of the Council of the Eu-
ropean Unionrdquo Brussels
European Commission (2011) Youth Opportunities Initiative ndash Communication From The
Commission To The European Parliament The Council The European Economic And So-
cial Committee And The Committee Of The Regions Brussels
European Commission (2013) Guidebook for Policy Planners and Practitioners on Ap-
prenticeship and Traineeship Schemes in EU27 December
European Commission (2016a) The Youth Guarantee and Youth Employment Initiative
three years on European Commission Directorate-General for Employment Social Af-
fairs and Inclusion Brussels
European Commission (2016b) Staff working documents 1 on ldquoThe Youth Guarantee
and Youth Employment Initiative three years onrdquo European Commission Directorate-
General for Employment Social Affairs and Inclusion Brussels
European Commission (2016c) Member Statesrsquo response to 2013 Council Recommenda-
tion on establishing a Youth Guarantee survey results unpublished
European Commission (2016d) Youth Guarantee Country by Country March 2016
European Commission (2017a) Report on PES Implementation of the Youth Guarantee
European Commission Directorate-General for Employment Social Affairs and Inclusion
Publications Office of the European Union Luxembourg
European Commission (2017b) Assessment Report on PES Capacity European Commis-
sion and Directorate-General for Employment Social Affairs and Inclusion Publications
Office of the European Union Luxembourg
European Commission (2017c) Education amp Training Monitor 2017 Comparative Report
European Commission (2017d) JobsPlus Youth
European Commission (2017e) Youth Guarantee Country by Country March 2017
European Commission (2017f) Draft Joint Employment Report from the Commission and
the Council accompanying the Communication from the Commission on the Annual
Growth Survey 2018 COM (2017) 674 final Brussels
European Commission (2017g) Employment and Social Developments in Europe 2017
European Commission (2017h) European Semester Thematic Factsheet ndash Employment
Protection Legislation
European Commission (2018a) The Youth Guarantee Country by Country Brussels
European Commission (2018b) Data collection for monitoring of Youth Guarantee
schemes Employment Social Affairs amp Inclusion
European Commission (2018c) Continued Education Offers in the Youth Guarantee -
Experience from the ground
European Commission (2018d) Traineeship offers under the Youth Guarantee
European Commission (2018e) Activation measures for young people in vulnerable situ-
ations - Experience from the ground
European Commission (2018f) Effective outreach to NEETs - Experience from the
ground
European Commission (2018g) Youth Guarantee amp Youth Employment Initiative Fact-
sheet 2762018
European Commission (2018h) Employment and entrepreneurship under the Youth
Guarantee ndash Experiences from the ground
The Youth Guarantee in light of changes in the world of work Youth Guarantee Intervention Models Sustainability and Relevance
51
European Commission (2018i) Employment and Social Developments in Europe 2018
European Commission (2018j) data on national commitments regarding the European
Alliance for Apprenticeships httpeceuropaeusocialmainjspcatId=1148amplangId=en
European Commission (2018k) ESF and YEI financial data by end 2017 submitted
through SFC2014 by Member States ndash Note EU amounts have been calculated on the
basis of the applicable co-financing rates
European Commission (2018l) Continued Education Offers under the Youth Guarantee ndash
Experience from the ground Brussels
European Court of Auditors (2017) Youth unemployment ndash have EU policies made a dif-
ference An assessment of the Youth Guarantee and the Youth Employment Initiative
Publications Office of the European Union Luxembourg
European Employment Policy Observatory (EEPO) (2015) EEPO Country Reports ndash Ire-
land Implementation of the 2013 Recommendation on establishing a Youth Guarantee
European Parliament (2015) Differential Treatment of Workers under 25 with a view to
their Access to the Labour Market Directorate General for Internal Policies Policy De-
partment A Economic and Scientific Policy
European Parliament (2017a) Workshop Summary Report Youth Guarantee and Youth
Employment Initiative Lessons from implementation Policy Department A Economy
and Scientific Policy European Parliament Brussels
European Parliament (2017b) Youth Employment Initiative Lessons from implementa-
tion Policy Department A Economy and Scientific Policy European Parliament Brussels
European Parliament (2017c) Youth Guarantee Lessons from implementation Policy
Department A Economy and Scientific Policy European Parliament Brussels
European Parliament (2018) Ensuring high-quality job creation from EU funding pro-
grammes How can the best practice of Horizon 2020 be better integrated into other
programmes (ESF Youth Guarantee Globalisation Fund) Policy Department for Budget-
ary Affairs Directorate General for Internal Policies of the Union
European Trade Union Confederation (2018) Boosting Unionsrsquo Participation to Guarantee
Quality Transitions and Employment to Young People in Europe
European Youth Forum (2017) Excluding youth a threat to our future
European Youth Forum (2018) Updated position on the Implementation of the Youth
Guarantee Brussels Belgium
Eurostat (2015) Being Young in Europe Today
Eurostat (2018) How common is temporary employment in your country
Ghirelli C E Havari G Santangelo and M Scettri (2019) ldquoDoes on-the-job Training
Help Graduates Find a Job Evidence from an Italian Regionrdquo forthcoming in the Inter-
national Journal of Manpower 40(1)
Gower J C (1971) A general coefficient of similarity and some of its properties in
Biometrics Vol 27 Nr 4 S 857ndash872
Gregg P and Tominey E (2005) The wage scar from male youth unemployment La-
bour Economics 12 487ndash509
Indecon (2016) Indecon Evaluation of JobBridge Activation Programme Report pre-
pared by Indecon International Research Economists and submitted to the Department
of Social Protection
International Labour Organisation and European Commission (2017) National Outreach
Strategy for non-registered young unemployed and inactive young people in Portugal
The Youth Guarantee in light of changes in the world of work Youth Guarantee Intervention Models Sustainability and Relevance
52
Leigh-Doyle S (2014) Can subsidised employment and work-first measures assist the
labour market integration of low-skilled unemployed youth Peer Country Comments
paper ndash Ireland EU Peer Review on lsquoEmplois drsquoavenirrsquo ndash Jobs with a futurersquo Scheme Par-
is (France) 10-11 February 2014
Milligan G W and Cooper M C (1985) An examination of procedures for determining
the number of clusters in a dataset Psychometrika 50 159-179
OrsquoReilly J Eichhorst W Gaacutebos A Hadjivassiliou K Lain D Leschke J McGuin-
ness S Kurekovaacute L M Nazio T Ortlieb R Russell H and Villa P (2015) lsquoFive
Characteristics of Youth Unemployment in Europe Flexibility Education Migration
Family Legacies and EU Policyrsquo SAGE Open January-March 2015 1ndash19
Pastore F (2018) Why is youth unemployment so high and different across countries
IZA World of Labor 2018 420 doi 1015185izawol420
Pastore F (2015) The Youth Experience Gap Explaining National Differences in the
School-to-Work Transition Heidelberg Springer International Publishing AG 2015
Pohl A and Walther A (2005) Tackling Disadvantage in Youth Transitions - A Themat-
ic Study on Policy Measures Concerning Disadvantaged Youth Report funded by the EU
Action Programme to combat Social Exclusion October
Pohl A and Walther A (2007) Activating the Disadvantaged ndash Variations in Address-
ing Youth Transitions across Europe International Journal of Lifelong Education 265
pp533-553
Quintini G and Martin S (2014) lsquoSame Same but Different School-to-Work Transi-
tions in Emerging and Advanced Economiesrsquo OECD Social Employment and Migration
Working Papers No 154 OECD Publishing
Quintini Glenda and Martin John P and Martin Seacutebastien (2007) The Changing Nature
of the School-to-Work Transition Process in OECD Countries WDA-HSG Discussion Paper
No 2007-2
Scarpetta S A Sonnet and Manfredi T (2010) lsquoRising Youth Unemployment During
The Crisis How to Prevent Negative Long-term Consequences on a Generationrsquo OECD
Social Employment and Migration Working Papers No 106
Stokes D (2016) Opening gateways to work for youth But can success be guaran-
teed Peer Country Comments Paper ndash Ireland EU Peer Review on The Guarantee for
Youth (a particular measure within the broader context of the Youth Guarantee) Paris
(France) 7-8 April 2016
Tosun J Unt M and Wadensjouml E (2017) Youth‐oriented Active Labour Market Poli-
cies Explaining Policy Effort in the Nordic and the Baltic States Social Policy amp Admin-
istration 51 598ndash616
Treadwell Shine K (2016) lsquoYouth Guarantee in Irelandrsquo Department of Social Protec-
tion presentation Youth Opportunities at EU Level Cork
Walther A (2006) Regimes of Youth Transitions Choice Flexibility and Security in
Young Peoples Experiences across different European Contexts Young Vol 14 No 2
pp119ndash139
Ward J H Jr (1963) Hierarchical Grouping to Optimize an Objective Function Journal
of the American Statistical Association 58 236ndash244
The Youth Guarantee in light of changes in the world of work Youth Guarantee Intervention Models Sustainability and Relevance
53
Annex
Table 3 List of indicators
Indicator name and time of measurement
Source Explanation
Financial resources for implementing the Youth Guarantee
Initial YEI allocation (2014-2017)
EC (2016b) Euros-tat (nama_10_gdp)
YEI allocation in of GDP
YEI+ESF EU eligible cost
(2017)
EC (2018k) Euros-
tat (nama_10_gdp) YEI+ESF eligible cost in of GDP
Other ESF eligible cost (2017)
EC (2018k) Euros-tat (nama_10_gdp)
Other ESF eligible cost in of GDP
Share of declared YEI+ESF funds (2017)
EC (2018k) Declared YEI+ESF funds as a share of eligible cost
Estimated cost of the YG (2015)
Eurofound (2015)
Binary indicator for medium cost (03-06 of
GDP) reference category low cost
Binary indicator for high cost (gt06 of GDP) reference category low cost
Change in ALMP expenditure (2012 to 2015)
Eurostat (lmp_expsumm)
Difference in ALMP expenditure in of GDP
YG as part of national policy-making
Number of youth-related ALMP reforms (2013-2016)
LABREF database Absolute number of reforms
Number of additional measures beyond Recom-mendation implemented in the context of the YG (2016)
EC (2016c)
Sum of binary indicators for additional measures regarding school dropout social and welfare policies volunteering social economy and oth-er
Share of YG exits with un-known destination (2016)
EC (2018b)
Binary indicator for an unknown share of 10-30 reference category 0-10
Binary indicator for an unknown share of more than 30 reference category 0-10
Share of unknown situations in the six month follow up
(2016)
EC (2018b)
Binary indicator for an unknown share of 40-99 reference category 0-39
Binary indicator for an unknown share of 100 reference category 0-39
Involvement of social part-ners (2016)
EC (2016c) Sum of binary indicators for the involvement of social partners in design implementation and evaluationmonitoring
Involvement of youth organi-sations (2016)
EC (2016c) Sum of binary indicators for the involvement of social partners in design implementation and
evaluationmonitoring
PES involvement of youth in design of YG (2017)
EC (2017a) Binary indicator
PES involvement of youth organisations in design of YG (2017)
EC (2017a) Binary indicator
Partnerships formed by PES (2017)
EC (2017a)
Sum of binary indicators for PES partnerships aimed at increasing information availability increasing workeducation opportunities and easing the transition into employment from educationunemployment
The Youth Guarantee in light of changes in the world of work Youth Guarantee Intervention Models Sustainability and Relevance
54
Indicator name and time of measurement
Source Explanation
Youth labour market challenges
Youth share of total popula-tion (2012)
Eurostat (lfsa_pgaed)
Number of youth (15-24) expressed as of total population
Youth-to-adult unemploy-ment ratio (2012)
Eurostat (une_rt_a) Youth (15-24) unemployment rate divided by adult unemployment rate (25-74)
NEET rate among 15-29 year
olds (2012)
Eurostat
(edat_lfse_21)
Total number of NEETs aged between 15 and 29
in of total youth population
Difference in temporary em-ployment shares (2012)
Eurostat (lfsi_pt_a) Difference in temporary employment rates be-tween youth (15-24) and adults (25-54)
Share of early school-leavers (2012)
Eurostat (edat_lfse_14)
Share of early school-leavers as of youth population (18-24)
Share of low-educated NEETs
(2012) Eurostat (edat_lfse_21)
Number of NEETs with low education back-
ground divided by total number of NEETs (15-24)
Share of medium-educated NEETs (2012)
Number of NEETs with medium education back-ground divided by total number of NEETs (15-24)
Share of employment offers (2016)
European Commis-sion (2018b)
Number of employment offers as of total offers typically made to participants
Share of timely exits into employment (2016)
European Commis-sion (2018b)
Number of exits into employment as of total timely exits from the YG
Share of education offers (2016)
European Commis-sion (2018b)
Number of education offers ias of total offers typically made to participants
Share of timely exits into education (2016)
European Commis-sion (2018b)
Number of exits into education as of total timely exits from the YG
The heterogeneity of the NEET population
Share of re-entrants among NEET (2013)
Eurofound (2016) Number of individuals in the respective group in of total NEET population
Share of short-term unem-ployed among NEET (2013)
Share of long-term unem-ployed among NEET (2013)
Share of individuals with illnessesdisabilities among NEET (2013)
Share of individuals with family responsibilities among NEET (2013)
Share of discouraged workers among NEET (2013)
PES responsibility regarding paying of unemployment benefits (2017)
European Commis-sion (2017b)
Binary indicator for the PES responsibility
PES responsibility regarding administering unemployment benefits (2017)
PES responsibility regarding other types of benefits
(2017)
The Youth Guarantee in light of changes in the world of work Youth Guarantee Intervention Models Sustainability and Relevance
55
Indicator name and time of measurement
Source Explanation
Number of responsibilities of the PES within the YG (2017)
European Commis-sion (2017a)
Sum of binary indicators for the PES being re-sponsible for managing the YG scheme regis-tering unemployed youth providing (placement) services to youth coordinating partners out-reach to NEETs follow-up of participants and design and maintenance of the monitoring scheme
PES outreach activities
(2017)
European Commis-
sion (2017a)
Binary indicator for the PES having awareness raising initiatives
Binary indicator for the PES having outreach programmes for pro-active work with schools
Binary indicator for the PES to cooperate with NGOs and youth organisations for outreach
Binary indicator for the PES to have specific outreach caseworkers
Binary indicator for the PES to have new points of entry (via new media)
Binary indicator for the PES to provide single-point servicesone-stop shops
Binary indicator for the PES to have mobile PES initiatives
Binary indicator for the PES to have follow-up programmes to reach out to YG drop-outs
PES programme for prevent-ing high school dropout (2017)
European Commis-sion (2017a)
Binary indicator
Design and implementation features of the Youth Guarantee
Eligible age group (2016) European Commis-sion (2016c)
Binary indicator for YG eligible age group being under 25 year and recent graduates reference category under 25
Binary indicator for YG eligible age group being under 26 reference category under 25
Binary indicator for YG eligible age group being
under 27 reference category under 25
Binary indicator for YG eligible age group being under 30 reference category under 25
Envisaged time-frame of intervention (2016)
European Commis-sion (2016c)
Binary indicator for the target time frame being below 4 months reference category 4 months
Binary indicator for the target time frame being above 4 months reference category 4 months
YG scheme specifically tar-geting long-term unemployed (2016)
Escudero and Mourelo (2017)
Binary indicator
Main YG provider (2016) European Commis-sion (2016c)
Binary indicator for the YG to be provided main-ly by the PES and other institutions reference category only PES
Binary indicator for the YG to be provided main-
ly by other institutions reference category only PES
The Youth Guarantee in light of changes in the world of work Youth Guarantee Intervention Models Sustainability and Relevance
56
Indicator name and time of measurement
Source Explanation
Degree to which online regis-
tration for the YG is possible (2016)
European Commis-sion (2016c)
Binary indicator for online registration being partly possible reference category not at all
Binary indicator for online registration being
possible everywhere reference category not at all
Legal entitlement to offer (2016)
European Commis-sion (2016c)
Binary indicator for whether there exists an entitlement for young people to receive an offer in line with or similar to the Youth Guarantee
Previous experience with a
YG-type of framework (2014)
European Commis-
sion (2016c)
Binary indicator for having recent experience with a YG-type of framework reference catego-ry none
Binary indicator for having longer experience with a YG-type of framework reference catego-ry none
Formal definition of quality
offer (2016)
European Commis-
sion (2016c)
Binary indicator having formally defined offer
quality
National quality guidelines (2017)
European Commis-sion (2017a)
Binary indicator having national quality guide-lines from the national administration to all PES officesother organisations involved in the YG
PES has YG-specific staff (2017)
European Commis-sion (2017a)
Binary indicator for having YG-specific staff
PES training (2017) European Commis-sion (2017a)
Binary indicator for the PES providing training specifically tailored working with youth
PES staff increase (2014-2017)
European Commis-sion (2017a)
Binary indicator for the PES having in-creasedunchanged staff from 2014-2017
PES has youth-specific tar-
gets (2017)
European Commis-
sion (2017a)
Binary indicator for the PES having youth-
specific targets
The role of the apprenticeship system in the YG
Share of firms with IVET participants (2010)
Eurostat (trng_cvt_34s)
Share of firms hiring initial vocational training participants expressed as a of all firms
Share of apprenticeship of-fers (2016)
European Commis-sion (2018b)
Number of offers of apprenticeships as of total offers typically made to participants
Share of timely exits into apprenticeships (2016)
European Commis-sion (2018b)
Number of exits into apprenticeships as of total timely exits from the YG
School-to-work transition cluster (2005)
PohlWalther (2005)
Binary indicator for STW being of type transi-tionalpost-socialist reference category miss-ing
Binary indicator for STW being of type sub-protective reference category missing
Binary indicator for STW being of type univer-salistic reference category missing
Binary indicator for STW being of type liberal reference category missing
Binary indicator for STW being of type employ-ment-centred reference category missing
Number of EAfA pledges (2018)
European Commis-sion (2018j)
Number of pledges to increase apprenticeships by firms or organisations normalised by the share of firms hiring IVETs
The Youth Guarantee in light of changes in the world of work Youth Guarantee Intervention Models Sustainability and Relevance
57
Table 4 Outcome cluster means
Cluster A Cluster B Cluster C Cluster D
ldquoCoveragerdquo rate (in ) 488 76 479 448
Share in preparatory phase beyond four
months (in )
433 284 606 519
Share of positive and timely exits (in ) 511 740 366 372
Share with positive situation after six
months (in )
576 521 562 60
Reduction in youth unemployment (in
-points)
37 121 145 62
Reduction in NEET rates (in -points) 11 42 43 18
Note This table shows cluster means (averages) for a cluster analysis solely based on the authorsrsquo measures
of performance (see section 35 for their description) The analysis creates Cluster A (AT BE DK IT LT LU
and SE) Cluster B (BG HU and MT) Cluster C (EL ES HR IE PT and SK) and cluster D (CY CZ DE EE FI
FR LV NL PL RO SI and UK)
The Youth Guarantee in light of changes in the world of work Youth Guarantee Intervention Models Sustainability and Relevance
58
HOW TO OBTAIN EU PUBLICATIONS
Free publications
bull one copy
via EU Bookshop (httpbookshopeuropaeu)
bull more than one copy or postersmaps
from the European Unionrsquos representations (httpeceuropaeurepresent_enhtm)
from the delegations in non-EU countries
(httpeeaseuropaeudelegationsindex_enhtm)
by contacting the Europe Direct service
(httpeuropaeueuropedirectindex_enhtm) or calling 00 800 6 7 8 9 10 11 (free-
phone number from anywhere in the EU) () () The information given is free as are most calls (though some operators phone boxes or hotels may charge you)
Priced publications
bull via EU Bookshop (httpbookshopeuropaeu)
Priced subscriptions
bull via one of the sales agents of the Publications Office of the European Union
(httppublicationseuropaeuothersagentsindex_enhtm)
doi 102767371432
KE-0
1-1
9-1
28-E
N-N

The Youth Guarantee in light of changes in the world of work Youth Guarantee Intervention Models Sustainability and Relevance
4
Executive summary
The economic recession following the financial crisis and its prolonged aftermath com-
pounded the challenge that substantial youth unemployment put on the Member States
of the European Union In addition changes in the world of work for example increas-
ingly complex school-to-work transitions and new challenges arising from rapid techno-
logical changes may further impede the labour market prospects of young people
The Youth Guarantee (YG) was launched as a Council Recommendation adopted by all
Member States in 2013 in particular as a response to the high cyclical unemployment
among its youth The YG meant that all young people aged between 15 and 24 would
receive a good quality offer of employment training education or apprenticeship within
a period of four months of becoming unemployed or leaving formal education Following
this recommendation EU Member States took steps to introduce such a scheme albeit
with widely varying national approaches on (among many other differences) target
groups timing the types of interventions used and the types of partnerships
This report synthesises the vast amount of available information on the implementation
of the YG and its performance Based on an extensive desk research in its first part the
study identifies six key aspects of YG implementation and delivery as well as background
characteristics that are important determinants of YG performance across Member
States specifically these are (1) the financial resources for implementing the YG (2)
the role of the YG as part of national policy making (3) challenges for the youth labour
market (4) the heterogeneity of the NEET population (5) the design and implementa-
tion features of the YG and (6) the role of the apprenticeship system in the Youth Guar-
antee The overall findings of desk research and data analysis indicate that in sum EU
funding via the Youth Employment Initiative (YEI) and the European Social Fund (ESF)
played a key role in supporting YG measures financially especially for countries suffering
from simultaneously high NEET rates and a significant economic downturn or structural
labour market challenges Many of these countries increased spending on active labour
market policies which can be interpreted with caution as an indirect effect of the YG In
some Member States the YG also fostered the introduction of reforms to national youth
policies improvements in monitoring systems for youth activation policies and the
building of new partnerships These changes are likely to outlast the YG initiative and
thereby provide sustained and ongoing benefits
Whereas these are substantive positive changes brought about by the YG not all of its
objectives were achieved First neither reducing labour market segmentation through
quality offers nor providing a remedy for imperfectly performing education systems was
fully achieved One reason was a prevalence of employment offers compared to relative-
ly few education or apprenticeship offers in the YG The low share of apprenticeship of-
fers in some Member States appears to be related to the institutional setup and school-
to-work (STW) transition regime increasing the prominence of the apprenticeship sys-
tem would need to be accompanied by broader institutional change Second several
Member States were not able to fully address the heterogeneity of the NEET population ndash
especially those furthest away from the labour market In contrast countries that per-
formed well generally improved the capacity of their Public Employment Services (PES)
and developed partnerships to implement strong outreach programmes
The second part of the study builds on the six key aspects to develop a Youth Guarantee
typology this novel approach uses cluster analysis techniques to identify groups of simi-
lar countries This analysis highlights several insights for the implementation of the
Youth Guarantee across Member States firstly country clusters within the single key
aspects are not always the same as the final country clusters for all six key aspects
Second certain contextual and implementation variables are clearly correlated suggest-
The Youth Guarantee in light of changes in the world of work Youth Guarantee Intervention Models Sustainability and Relevance
5
ing that some implementation features relate to each other for instance some countries
with a low estimated cost for implementing the YG tend to be countries that closely fol-
lowed the Recommendation in particular in terms of timing of the intervention and tar-
get groups chosen Other Member States with a more pronounced NEET challenge are
more likely to deviate from the recommendation for example by increasing the targeted
time frame of intervention
The most comprehensive version of the cluster analysis simultaneously takes into ac-
count all six key aspects and a total of 76 empirical indicators that properly reflect these
key aspects and identifies five final clusters
Cluster A Member States with previous YG experience lower initial NEET rates ambi-
tious implementation and improved PES capacity low educated NEETs and diversified
offers (AT DK DE FI IE NL SE)
Cluster B Member States with intermediate NEET challenges strong outreach efforts by
the PES relatively poor monitoring data quality high NEET rates due to family responsi-
bilities and strong focus on employment offers (CZ EE FR HU RO UK)
Cluster C Member States hit by the economic recession with highest initial NEET rates
severe long-term unemployment large support via EU funding highest reform efforts
and highest entry rates into apprenticeship offers (CY EL ES IT PT)
Cluster D Member States characterised by relatively low initial NEET rates and short-
term unemployed rather than inactive NEETs some funding under YEI strong outreach
efforts through the PES and partnership approach and diversified offers with a stronger
focus on education offers (BE MT LT LU PL SI)
Cluster E Member States that joined the EU relatively recently with lsquotransitionalrsquo STW
regimes high initial NEET rates structural challenges and substantial EU funding focus
on employment offers rather high reform efforts (BG HR LV SK)
Evidently these explicit labels for the clusters tend to simplify the other factors of heter-
ogeneity across Member States that determine the typology However some conclusions
can be drawn regarding the fit of underlying challenges to be addressed with the policy
response observed In particular it appears that countries in Cluster A C and D reflected
the challenges observed in the design and implementation of the YG to a higher degree
compared to cluster B and E as policies implemented ndash for example regarding outreach
efforts ndash seem to better match key factors of heterogeneity in the NEET population
In a final step the study investigates the YG models resulting from the typology and
basic performance indicators Cluster A performs well in terms of the NEET ldquocoveragerdquo
rate but less well regarding the reduction in NEET and unemployment rates over time
Clusters B and D perform relatively similar across all YG outcome measures Cluster C
shows the largest share of youth in the preparatory phase beyond the envisaged four
months but also the largest median decline in NEET rates Cluster E has the lowest share
of positive and timely exits but the largest decline in youth unemployment out of all clus-
ters
Whereas therefore the evidence is not fully conclusive partly due to the number and
complex inter-relation of the aspects in which clusters differ the reportrsquos findings none-
theless clearly indicate that not only initial conditions but also the way Member States
implement the YG has affected its success
The Youth Guarantee in light of changes in the world of work Youth Guarantee Intervention Models Sustainability and Relevance
6
1 The Youth Guarantee background and outline of the
study
An essential aim of the policies that promote economic growth and social equity is to
ensure that young people are adequately educated that they enter the labour market
smoothly and that they then continue successfully through a lifetime in employment
through till retirement Young people face a wide range of structural challenges ndash fre-
quently perceived as increasingly complex ndash regarding their school-to-work (STW) tran-
sition and their long-term labour market prospects (Quintini et al 2007)
The economic recession of the late 2000s and its aftermath exacerbated these challeng-
es while the on-going Fourth Industrial Revolution comprising innovations in digitalisa-
tion artificial intelligence and robotics is constantly generating new and potentially fun-
damental challenges In general these developments have resulted in the following pat-
terns (i) a dramatic rise of youth unemployment in most countries during the recession
together with relatively low employment rates (ii) lengthier complex unstable and
non-linear STW transitions (iii) a deterioration in the quality of youth employment com-
bined with greater precariousness (iv) the patchy availability of quality work experience
which increasingly plays a crucial role in STW transitions (v) increased inactivity dis-
couragement and labour market detachment and (vi) greater labour market vulnerabil-
ity for disadvantaged youth such as the low-skilled migrants and young people with a
disability and more generally young people not in employment education or training
(NEETs)
While the wider macro-economic situation including business cycle fluctuations together
with the recession-related economic deterioration of the late 2000s and the subsequent
lsquojob-poorrsquo recovery accounts for these developments they are also rooted in persistent
structural deficiencies These include imperfectly performing education and training sys-
tems with poor outcomes and ensuing skills mismatches and segmented labour markets
(resulting in hollowing-out and skill polarisation) Sometimes poor PES (Public Employ-
ment Service) resources prevent the provision of youth-related tailored services in gen-
eral and in particular concentrating appropriate resources on vulnerable hard-to-reach
young people including certain sub-groups of NEETs (European Commission 2017a)
Yet unsatisfactory early labour market experience and lengthy unstable STW transitions
can lead to long-term lsquoscarringrsquo effects on young people in terms of reduced lifetime
earnings a higher probability of subsequent periods of unemployment a greater likeli-
hood of precarious employment and poorer health and well-being (Gregg and Tominey
2005 Scarpetta et al 2010 European Commission 2017a)
The remainder of this section describes the youth unemployment situation in the Euro-
pean Union (EU) and the challenges it poses for youth generally It also introduces the
Youth Guarantee (YG) and it summarises the joint response to these challenges under-
taken in the EU An explanation of the objectives and content of the present report as
well as the project in general concludes this section
11 The youth employment challenge in the European Union
In the second quarter of 2018 as many as approximately 34 million out of a total of
about 57 million young people in the 15-24 age group were unemployed in the EU (lat-
est available data from Eurostat) Whereas this constitutes a substantial decline from the
peak of 57 million in January 2013 the numbers still remain high the average youth
unemployment rate ndash ie the percentage of unemployment in the 15-24 age group com-
pared to the total labour force in that age group ndash stood at 168 in 2017 in the EU 28
The Youth Guarantee in light of changes in the world of work Youth Guarantee Intervention Models Sustainability and Relevance
7
and the NEET rate (the share of young people neither in employment nor in education or
training) was 109 If young people up to 29 years of age are included the average
rate of youth unemployment in the EU 28 was 127 while the NEET rate reached
134 (amounting to 177 specifically within the 25-29 age bracket) Figures 1 and 2 show the numbers for the 15-24 age group and illustrate the policy chal-
lenge of the youth unemployment rate (Figure 1) and the NEET rate (Figure 2) They
also show the substantial variation across EU countries as Figure 1 shows the youth
unemployment rate (Q2 2018) is below 10 in Austria Germany Estonia Denmark the
Netherlands the Czech Republic and Hungary In the majority of EU countries however
it ranges from 10 to 20 while it is above 30 and up to almost 40 in Italy Spain
and Greece Looking specifically at the most recent development by comparing it with
the Q2 2015 youth unemployment rate however the figure also shows a general down-
ward trend across all EU Member States which is quite pronounced in some countries
(Bulgaria Croatia Malta and Hungary for example)
Looking at the NEET rates in Figure 2 this downward trend in the most recent develop-
ment comparing 2015 and 2017 is also clearly visible Again there is notable variation
across Member States On average EU countries have a NEET rate of around 109 as
of 2017 and Ireland and Poland have NEET rates close to the EU average While the
Netherlands is the only EU country with a rate below 5 Croatia Romania Bulgaria
and Italy have the highest NEET rates with the rate reaching almost 20 in Italy
Figure 1 Youth unemployment rates (15-24 years old) in EU Member States
2015 compared to 2018
Source Authorsrsquo illustration based on latest available Eurostat data youth unemployment rate as percentage
of the active population quarterly average Countries are ordered by Q2 2015 rates Data is seasonally adjust-
ed For Italy and Cyprus the Q1 2018 rates are reported (latest available)
0
5
10
15
20
25
30
35
40
45
50
DE EE AT
DK
NL
CZ
MT LV UK LT SI LU HU IE
EU28 P
L
SE BE
RO FI BG FR SK PT
CY IT HR ES EL
2015Q2 2018Q2
The Youth Guarantee in light of changes in the world of work Youth Guarantee Intervention Models Sustainability and Relevance
8
Figure 2 Rates of young people (15-24 years old) not in employment educa-
tion or training (NEET) in EU Member States 2015 2017
Source Authorsrsquo illustration based on latest available Eurostat data annual averages Countries are in order of
the 2015 rates
In addition to these aggregate statistics the difficulties for youth in the STW transition
can be related to several structural challenges or market failures In particular these
concern (a) Labour market segmentation ndash a labour market pattern in which young
people are over-represented in temporary part-time non-permanent work (b) (under-)
performance of the education and training system ndash the low achievement of a substantial
section of youth in basic and lsquotransversalrsquo (transferable) skills (c) the limited availability
of lsquoqualityrsquo work experience and (d) insufficient capacity of the Public Employment Ser-
vice (PES) to ensure effective provision of tailored services and support for young people
(see European Commission 2017a)
12 The Youth Guarantee
The significant challenges that young people face in relation to fast smooth and effec-
tive STW transitions were exacerbated during and after the recession Since then they
have also acted as a catalyst for policy change in many Member States Accordingly a
YG was introduced following the 2013 Council Recommendation (Council of the European
Union 2013) Together with associated structural reforms of vocational education and
training (VET) and activation policies that are implemented across the EU its aim is to
address these challenges More specifically following a proposal from the European
Commission all Member States adhered to the establishment of the YG committing
themselves to giving every young person a good-quality offer of employment continuing
education or an apprenticeship or a traineeship within a period of four months of be-
coming unemployed or leaving formal education (Council of the European Union 2013)
The idea of YG style policies originated in the Nordic countries where such initiatives
were first implemented in Sweden in 1984 and then elsewhere in the 1990s (Norway in
1993 Denmark and Finland in 1996 see for example Escudero and Loacutepez Mourelo
2017)
In a Communication published three years after the launch of the YG by the European
Commission (2016a) it was observed that the YG had become a reality across the EU
Starting from January 2014 14 million young people had already registered in YG
schemes by 2016 Around nine million young people had taken up an offer the majority
0
5
10
15
20
25N
L
DK
DE
LU SE CZ
AT LT SI
MT LV FI EE PL
UK PT
HU
EU2
8 FR BE SK IE CY ES EL HR
RO
BG IT
2015 2017
The Youth Guarantee in light of changes in the world of work Youth Guarantee Intervention Models Sustainability and Relevance
9
of which were offers of employment almost two thirds of young people who left the YG
in 2015 took up an offer of employment education traineeship or apprenticeship While
the Commission Communication also concluded that the YG has significantly facilitated
structural reforms and innovation in policy design across Member States it also asserted
that nonetheless youth unemployment remained unacceptably high and many chal-
lenges still need to be addressed by Member States
13 Outline of the project and the present report
The main objective of this project is to undertake an up-to-date review of the current
approaches and implementation of the YG especially in view of new challenges for youth
in the changing world of work thereby providing the basis for a future YG model that is
both robust and dynamic
This report constitutes the first phase of the research project In the first phase a com-
prehensive desk review of existing documents and data was undertaken together with
the construction of a database of indicators for a cluster analysis as well as supplemen-
tary country case studies This approach is explained and implemented throughout this
report Aspects that guide the analysis are 1) the degree to which EU financing helped
to implement the YG 2) whether the YG became a sustainable part of national policy
making 3) the main challenges faced by young people in their transition into the labour
market 4) the heterogeneity of the NEET population 5) the design and implementation
features of the YG and 6) the role of apprenticeships in the YG Based on these insights
a typology of YG models is developed and the correlation of these types is assessed re-
garding measures of performance
The second phase of the research project will address the emerging challenges for young
peoplersquos transition into the world of work drawing extensively on consultation with
stakeholders both through an online survey and more importantly through a stakehold-
er seminar held in Brussels on Oct 1 2018 during which experiences with the YG were
exchanged and future challenges identified and discussed The results of this second
phase will be published in a separate report2 Together these two reports should inform
reflection on further developments of the YG
The report at hand is structured as follows Section 2 has two parts the first part identi-
fies the main characteristics of YG implementation in context while the second part de-
fines empirical indicators for these characteristics and their sub-dimensions In section 3
these indicators are used for constructing a typology of YG models also showing how the
different types of models differ regarding performance indicators Section 4 presents the
conclusions of the analysis
2 European Commission (forthcoming) The Youth Guarantee in light of changes in the world of work Emerging challenges related to young peoplersquos transition in the labour market
The Youth Guarantee in light of changes in the world of work Youth Guarantee Intervention Models Sustainability and Relevance
10
2 Implementation features of the YG and related indica-
tors
This section provides a comprehensive overview of the main features that characterise
YG implementation and assess the main features that are likely to determine its success
in Member States It has two steps first section 21 gives an overview of the relevant
dimensions of YG implementation along the six guiding aspects outlined above Based on
this characterisation section 22 discusses the ways in which each of these aspects can
be represented by a set of empirical indicators and which will be used in chapter 3 for a
YG typology The list of indicators for each of the six aspects comprise key contextual
characteristics for each Member State as well as implementation-related features such as
partnerships created as a result of YG implementation or the types of interventions
used In particular indicators that characterise Member States at the outset of the YG
(measured in 2012 or 2013) as well as the way the YG was implemented (mostly meas-
ured up until 2016) inform the typology Indicators of YG performance such as for ex-
ample the estimated proportion of the NEET population reached by the YG (the so-called
YG ldquocoverage raterdquo) are considered outcomes of the way Member States implemented
the YG
The presentation and discussion of intervention features and corresponding empirical
indicators in section 2 is complemented by selected information from five brief country
case studies The case studies are a supplementary element in the review exercise that
feeds into this chapter and they are meant to illustrate the intervention features dis-
cussed throughout the chapter in more detail for selected countries Based on an lsquoex
ante assessmentrsquo of a set of qualitative and quantitative country indicators the following
five countries were selected for case studies Austria Denmark Ireland Italy and Lat-
via The countries were selected firstly to cover (to the extent that is possible) the ex-
isting types of STW regimes and secondly to reflect the heterogeneity of the NEET popu-
lation NEET implementation is characterised by high and low NEET and youth unem-
ployment rates high and low YG coverage and the financial resources put into its im-
plementation3
21 Features of Youth Guarantee implementation
211 Financial resources for implementing the Youth Guarantee
The YG is not a funding programme in itself It is instead a political commitment sup-
ported among other ways by financial contributions from the EU and national budgets
as well as contributions from the private and non-profit sectors This section on the first
YG implementation aspect financial resources briefly outlines the relevance of these
different sources Specific focus will be given to the Youth Employment Initiative (YEI)
and the European Social Fund (ESF) as the main EU sources to financially underpin the
implementation of the YG
Youth Employment Initiative The YEI was established during three informal summits of
EU Heads of State in 2013-14 and then given euro32 billion for the 2014-15 period Eligi-
bility for measures funded through the YEI is confined to young people aged 16-254 who
3 It is important to emphasise the lsquoex-antersquo nature of case study selection they were chosen based on a preliminary set of indicators at the outset of the study whereas the full in-depth identi-fication and discussion of indicators ndash as presented in this chapter ndash and their analysis in Chapter 3
becomes a key element of the study itself 4 The upper age band is 29 in some Member States
The Youth Guarantee in light of changes in the world of work Youth Guarantee Intervention Models Sustainability and Relevance
11
are not in employment education or training (lsquoNEETsrsquo) Funding from the YEI was only
allocated to regions in those Member States where youth unemployment was higher than
25 in 20125 Since national allocations are based on the number of unemployed young
people in 2012 in these regions YEI funds were allocated to a varying extent to each
Member State based on their (regional) unemployment rates (European Commission
2016a) Spain was the largest recipient of the initial YEI specific allocation receiving
euro9435 million and Slovenia the smallest receiving euro92 million In 2015 in view of the
immensity of the youth-employment challenge the European Commission took steps to
ensure a quick mobilisation of its funds6 Specifically a higher pre-financing rate for the
euro32 billion YEI specific allocation in 2015 than for other ESF allocations (30 instead of
the original 1-15 of the specific allocation for other ESF funds) was introduced
This led to an amount of around euro1 billion in additional pre-financing to Member States
in 2015 (European Commission 2016a) In the summer of 2017 during the mid-term
review of the EUrsquos seven-year budget the YEI was extended until 2020 and it received
an additional financial allocation of euro12 billion In addition it was targeted at regions
where youth unemployment still exceeded 25 in 2016 (Andor and Veselyacute 2018) Ac-
cording to the Commissionrsquos report in October 2016 the YEI is seen by Member States
as a key mechanism through which to operationalise national Youth Guarantee schemes
ldquoIn some cases the YEI is being used to support most or all measures planned under the
YG schemes while in others it is one funding source amongst others Countries where
large shares of YG funding comes from the YEI include Lithuania ndash where 23 of all YG
actions are supported by the YEI Poland ndash where 34 of all YG actions YEI funded and
Spain ndash where 80 of all YG actions are funded through the YEIrdquo (European Commis-
sion 2016b p89)
YEI funds were provided from the EU budget as a top-up to the already available ESF
funds for 2014-2020 to provide additional support for programmes with a specific focus
on NEETs (European Court of Auditors 2017) However the funding allocated to each
Member State under the YEI has to be matched by an equal amount from the respective
Member State allocations in the ESF 2014-20 budget This holds for the initial allocation
in 2013 as well as the additional funds in 2017 Hence the total budget of the YEI (for
all eligible EU Member States) now totals euro88 billion for the period 2014-2020
European Social Fund In addition to ESF funds that were directly used to match the YEI
contributions (see above) some Member States also utilised additional funds from the
ESF for further employment-related programmes7 directly or indirectly benefiting youth
but with no specific focus on NEETs In contrast to YEI funds which are intended to di-
rectly support NEETs ESF funds may also be used to support structural reforms In total
Andor and Veselyacute (2018) estimate that approximately euro14-15 billion from the EU budget
over the period 2014-20 financed the implementation of the YG through the YEI and ESF
5 The exact methodology for allocating Youth Employment Initiative funds among Member States is set out in Annexe VIII to the lsquoCommon Provisions Regulationrsquo ie Regulation (EU) No 13032013 of 17 December 2013 OJ L 347 20122013 p 320ndash469
6 An additional reason was that many Member States ldquoraised the issue that they dont have the national budget necessary to pay advance funding to projects working with young peoplerdquo (source httpeuropaeurapidpress-release_MEMO-15-5020_enhtm)
7 The ESF is Europersquos main instrument for supporting jobs helping people get better jobs and en-suring fairer job opportunities for all EU citizens (European Parliament 2018)
The Youth Guarantee in light of changes in the world of work Youth Guarantee Intervention Models Sustainability and Relevance
12
funds8 This is a significant share of the total ESF funding of euro864 billion available to MS
for the 2014-2020 period (including the YEI)
Country case study Austria
Young people in Austria were already benefiting from special attention before the intro-
duction of the YG Several measures were set up to facilitate the transition from educa-
tion to the labour market in particular through a well-established apprenticeship sys-
tem Reducing the age for early school-leaving existed before the 2013 Council Recom-
mendation The long-standing existence of policy measures for young people is reflected
in Austriarsquos relatively successful performance as regards youth employment and STW
transition The labour market situation of young people in Austria is better than the EU
average and it continues to improve The rate of youth unemployment (15-24 years old)
went down from 106 in 2015 to 98 in 2017 which is significantly below the EU
average (168) This good performance is also reflected in the number of NEETs The
NEET rate in Austria was at 65 in 2017 well below the EU average (109)
In addition evidence shows that Austria is performing better than the rest of the EU as
regards its YG implementation (European Commission 2018a) It is acknowledged that
Austria has established a comprehensive Youth Guarantee based on effective partner-
ships targeted policy measures and a robust monitoring system with interconnected
administrative data (European Commission 2016a) The countryrsquos performance is par-
ticularly outstanding in two dimensions the NEET coverage and the delivery of a good
quality offer
Data for 2016 shows that an estimated 829 of NEETs in Austria are reached by the
YG which is the highest figure amongst Member States and almost double the EU aver-
age (425)9 In addition this ldquocoverage indicatorrdquo has been at consistently high levels
since the start of the YG A second more suggestive but somewhat less reliable way of
looking at the performance of a YG scheme is trying to estimate the rate of recycling
ie the percentage of NEETS entering the YG with previous YG experience10 This recy-
cling rate is rather high in Austria (739 compared to 341 for EU 28) suggesting
that employment services have little difficulty in lsquostaying in touchrsquo with young people
who already had a YG experience
The Austrian YG provides a wide range of offers (European Commission 2016d) It
comprises apprenticeship traineeship education and employment offers that are tar-
geted specifically at young people such as for example supra-company apprentice-
ships or production schools Additionally the general education training apprenticeship
and employment offers are open to young people
At the same time it is to be noted that Austria still faces difficulties in integrating cer-
tain sub-groups into the labour market in particular women migrants and young peo-
8 This figure is slightly higher than the euro127 billion stated by the Commission in its October 2016 report which YEI and the ESF are directly investing in ldquolabour market integration measures for young people in the programming period 2014-2020rdquo (European Commission 2016a p 12)
9 These figures are based on the indicator average annual stock of young people in the YG pre-paratory phase NEET population (annual average) included in the Indicator Framework for Moni-toring the Youth Guarantee This indicator combines administrative and survey data Whilst this is
not ideal the indicator is useful to give an approximate indication of the proportion of NEETs regis-tered in the YG scheme at any point during the year Results should therefore be interpreted as an estimation rather than a definitive measurement of the extent to which YG schemes achieve the objective of reaching all young people that become or are already NEET
10 The recycling rate is only experimental data and not officially part of the YG monitoring dataset
The Youth Guarantee in light of changes in the world of work Youth Guarantee Intervention Models Sustainability and Relevance
13
ple with low skills (European Commission 2018a) Ongoing efforts for these target
groups need to be intensified as recent measures have not led to sufficient results yet
Other EU sources Several other EU budget lines support employment- and education-
related programmes in Member States including the European Regional Development
Fund (ERDF) the ERASMUS programme as well as Horizon 2020 and the European Glob-
alisation Adjustment Fund (EGF) For an analysis of their job-creation potential and their
relation to the ESFYEI see European Parliament (2018) In addition a range of smaller
EU programmes finance employment-related measures for (young) people such as the
European Solidarity Corps or the EU Programme for Employment and Social Innovation
(EaSI)11
Three aspects deserve to be highlighted regarding differences across Member States in
financing the implementation of YG activities
First as the 2017 European Court of Auditors report on ldquoYouth unemployment ndash have EU
policies made a differencerdquo highlights the level of YEIESF funding available would only
address a small proportion of the required amount for the full implementation of a YG
Member States therefore need to leverage significant additional resources from national
budgets to achieve this goal However so far there has been ldquono assessment of cost
and available funding by Member Statesrdquo (European Court of Auditors 2017)
Second the extent to which the YEIESF funds simply financed youth-related schemes
that already existed prior to the YG is unclear They may be funded either by other EU
schemes or Member State national budgets The European Court of Auditors states that
YEIESF should ldquonot replace public or equivalent expenditure by the Member Statesrdquo
(ibid) However the Commission notes in its reply to the report that the YEI provisions
do not deny to Member States finance for measures previously supported by the national
budget or measures that require Member States to increase public spending regarding
certain types of measures or target groups At the same time the European Court of
Auditors analysis of seven Member Statesrsquo Operational Plans for the YEIESF showed that
ldquo[hellip] the majority of the measures which were to receive YEI financing already existed
prior to the introduction of the Youth Guarantee [hellip]rdquo (ibid p 54) In fact even in 2011
the Youth Opportunities Initiative proposed by the European Commission (2011) allowed
the governments of Member States to make increased use of the ESF for promoting
youth employment (Tosun et al 2017) The degree to which additional funds under the
YEIESF actually presented additional funds for Member States may therefore vary
greatly and there is without doubt also some variation in Member States as to whether
this caused them to step up their efforts regarding youth employment
Third despite the frontloading of the YEI in 2017 take-up of the YEI developed slowly in
its early phases of implementation (European Parliament 2017b) According to Andor
and Veselyacute (2018) two aspects delayed the implementation of the YG in the start from a
financial perspective firstly it took Member States and the Commission time to design
and review the lsquoOperational Programmesrsquo (OPs) specifying how YEI and ESF money
would be used Most of the Operational Programmes were only approved in late 2014 or
even in 2015 Secondly several Member States had accumulated delays in absorbing EU
structural funds for 2007-13 Hence they focused their efforts on implementing these
schemes in order not to lose these allocations (due to the so-called de-commitment
11 For instance one of the aims of the EaSI programme is to enhance mobility via the ldquoYour first Eures jobrdquo As these programmes are rather small in scale and not directly linked to the YG the study does not provide a detailed overview (see European Parliamentary Research Service 2017)
The Youth Guarantee in light of changes in the world of work Youth Guarantee Intervention Models Sustainability and Relevance
14
rule) Only afterwards did they move on to use YEI funding An assessment commis-
sioned by the European Parliament concluded that most delays that limited the impact of
the increased pre-financing were due to procedural rather than financial problems (Euro-
pean Parliament 2017b)
212 The Youth Guarantee as part of national policy-making
A variety of aspects may be used to determine the degree to which the YG has become a
part of national policy making and hence whether the changes introduced by the YG are
likely to be sustained over time The following discussion focuses on three measurable
factors related to the sustainability of YG-related policy changes Firstly whether the
Council Recommendation has spurred on Member States to introduce youth-related la-
bour-market reforms rather than merely set up an additional offer of active labour mar-
ket measures Secondly whether Member States have introduced monitoring and evalu-
ation systems to assess the effectiveness of YG-related measures Thirdly to find the
degree to which Member States have attempted to build up (lasting) partnerships be-
tween all relevant stakeholders (such as public and private employment services gov-
ernment authorities education and training institutions and so on)
The introduction of youth-related labour-market reforms the first key factor reflects
whether Member States have attempted to embed the main guidelines of the Council
Recommendation in their national policies In particular whether Member States have
used the political momentum created by the YG to introduce structural reforms to mod-
ernise their overall labour market policies in support of young people Such reforms con-
cern the functioning of the labour market (its institutional and regulatory framework)
and are aimed at better matching supply with demand The implementation of structural
reforms can be considered a key determinant as to whether the YG can have a long-
term sustainable impact in Member States beyond the YEI and the ESF funding associ-
ated with the YG
Information on the nature and intensity of youth-related active labour market policy re-
forms provided in the LABREF database indicates that EU Member States are imple-
menting the Recommendationrsquos policy guidelines unevenly Figure 3 displays the number
of active labour market policy reforms between 2013 and 2016 across Member States
The figure indicates for instance that virtually all Member States implemented addition-
al ALMP reforms for youth and that several Member States ndash such as Bulgaria France
Latvia Lithuania and Greece ndash have a relatively broad scope of reforms
Figure 3 Absolute number of youth-related active labour market reforms be-
tween 2013 and 2016
Note This figure shows the absolute number of youth-related active labour market policy reforms in the EU
Member States between 2013 and 2016 Identification of youth-related reforms is done via the indicator ldquoIs
the measure targeted at young peoplerdquo in the LABREF database
0
2
4
6
8
10
NL SI CZ
DE
LU FI HR
DK IE UK
AT PL
BE EE MT
RO SK ES HU CY IT PT SE BG FR LV LT EL
The Youth Guarantee in light of changes in the world of work Youth Guarantee Intervention Models Sustainability and Relevance
15
The introduction of monitoring and evaluation systems the fifth principal element in the
Council Recommendation on the YG and the strict reporting guidelines were aimed at
fostering a culture of policy analysis Despite the additional administrative burden asso-
ciated with reporting activities requiring Member States to obtain administrative data on
in- and outflows from the YG as well as follow-up data the creation of a monitoring and
evaluation system is one of the effects that people in charge of implementing the YG at
the country level have recognised as being positive12 In fact many Member States did
not have specialised monitoring systems allowing to track youth on the labour market
and in education and evaluate activation measures for youth before the Council Rec-
ommendation
At the same time the capacity of countries to monitor what happens to young people
after leaving the YG and the corresponding data quality varies in fact a substantial
share of Member States do not know about young peoplersquos reasons for exiting either the
YG or the labour market nor do they register the educational status of previous partici-
pants after they exited This issue is most likely due to a pre-YG lack of policy evaluation
culture or a lack of capacity to collect data An additional aspect to consider in this re-
gard is whether Member States attempted to evaluate the effectiveness of specific
measures under the YG using rigorous impact evaluations The EU helps Member States
conduct impact evaluations on interventions funded by the European Commission name-
ly the ESF and the YEI for example by setting up the Centre for Research on Impact
Evaluation (CRIE) which provides scientific expertise and methodological support to
Member States conducting an impact evaluation (see European Commission (2016b) for
details) Escudero and Murelo (2017) provide an overview of various impact evaluations
of pilot programmes that were set up within the context of the European YG However
there does not so far seem to be a systematic account of ongoing or completed impact
evaluations of YG instruments
Partnership approach Most Member States make a reference to the partnership ap-
proach in their YG Implementation Plan (YGIP) Table 1 shows the clear differences
based on an assessment of ten selected Member States conducted by Eurofound
(2015) In addition to the differences within countries the findings based on this sample
of ten countries also indicate that cooperation with some stakeholders seems to be more
widespread than it is with others For instance cooperation between ministries particu-
larly the ones dealing with employment and education policies is rather well developed
In comparison cooperation is less frequent with non-institutional stakeholders such as
the third sector notably NGOs social partners and youth organisations In 2016 the
European Commissionrsquos three-year assessment came to the conclusion that ldquowhile many
Member States have taken steps to support the involvement of a wide range of actors
and established institutional frameworks for partnerships the functioning of these part-
nerships remains a challenge due to problems of design which affects their ability to
deliverrdquo (European Commission 2016b p24)
In addition previous studies (eg Dheacuteret and Roden 2016) highlight the strong path-
dependency in how countries or regions apply the partnership approach While some
countries have put new structures in place to monitor the progress of the YG implemen-
tation and coordinate the work of relevant stakeholders other countries tend to have
consolidated partnerships that existed before the YG was established
12 Information collected through the interviews organised in the context of the EPC Task Force on Youth Employment The results of these interviews are further presented and developed in Dheacuteret and Roden (2016)
The Youth Guarantee in light of changes in the world of work Youth Guarantee Intervention Models Sustainability and Relevance
16
There also seems to be some discrepancy between the involvement of stakeholders in
the design implementation and monitoring of the YG In some Member States stake-
holders in the third sector particularly youth organisations reported that they were only
consulted in the design phase and never again (European Youth Forum 2018)13 Recent-
ly more positive evidence is provided by ETUC (2018) showing that the great majority
of interviewed representatives of unions was at least `somewhat satisfiedrsquo with their
degree of participation in the YG
Table 1 Overview of actors involved in implementing the YG in 10 Member
States
Min
istr
y
of
Em
plo
ym
ent
(or
equiv
ale
nt)
Min
istr
y
responsib
le
for
socia
l benefits
Min
istr
yo
rganis
ation
re-
sponsib
le for
ESFY
EI
Min
istr
y o
f Education
Min
istr
y
responsib
le
for
youth
work
Oth
er
min
istr
y
(justice
defe
nce
inte
rior
health
housin
g)
PES
(either
at
national
regio
nal or
local le
vel)
Youth
org
anis
ation (r
epre
-
senta
tive)
Local
youth
org
anis
ation
(im
ple
menta
tion)
Socia
l part
ners
Education s
ecto
r
BE XX XX X XX X XXX X X XX
BG XXX XX XX XX XX XX XX XX XX XX
EE XX X XX XXX XXX X XX XX XX X X
EL XXX X X XX X X
ES XXX
XXX
(em-ploy-ment)
XX XX XX XX XX X XX X
FR XXX
XXX (em-ploy-
ment)
XX (em-ploy-
ment)
XX XX X XX X
IE XX XXX XX XX XX XX X X X
IT XXX XXX XX XX XX XX X X XXX X
PL XX X XXX X XX X
UK XX XX (LEP)
X X XX X X
Source Eurofound (2015a)
Note XXX means authoritycoordinator XX means principal partner-stakeholders and X means associated
partnerstakeholder A distinction needs to be made in Belgium between the federal and local authori-
tyregional level social benefits are (still) the responsibility of the federal government while education and
PES are the responsibility of the regionslocal authorities Similar to Belgium in Spain many responsibilities
are delegated to the regional level LEPs - Local Enterprise Partnerships
13 Some more evidence from the European Youth Forum on involvement for a sub-set of countries can be found under httptoolsyouthforumorgyouth-guarantee
The Youth Guarantee in light of changes in the world of work Youth Guarantee Intervention Models Sustainability and Relevance
17
213 Youth labour market challenges
The third key factor of YG implementation is its contribution to and targeting of the
young peoplersquos labour market challenges Given that the recession of the late 2000s (the
lsquoGreat Recessionrsquo) and its aftermath exacerbated the difficulties that young people face
in their STW transition and labour market career this section presents a brief discussion
of these challenges and how YG interventions have sought to address them
Challenge 1 ndash Youth unemployment long-term unemployment and inactivity The Great
Recession and its immediate effects on youth unemployment ndash highlighted in section 1 ndash
also resulted in an increase in youth long-term unemployment which although gradual-
ly falling from its peak of 8 in 2013 has remained high (European Parliament 2015
European Commission 2017a) Long-term unemployment can result in well-documented
lifelong consequences and lsquoscarringrsquo effects on those young people who remain unem-
ployed for some time (Eurofound 2015b Eurostat 2015) In addition a considerable
proportion of the EUrsquos youth remain economically inactive Whereas a large share of
them are in education or training many are discouraged and have become detached
from the labour market or they have not entered it after leaving education
The macroeconomic state of the economy also affects the level of demand for young
people where employer absorption capacity in providing training places (such as appren-
ticeships) and jobs for young people may be limited (Eurofound 2015a) In addition the
highly variable youth labour market performance across the EU before during and after
the Great Recession has been attributed to many factors These include differences in
the institutional and structural set-up of Member States regarding the education and
training systems (initial) education and vocational training (IVET) labour market insti-
tutions and labour market policy (such as employment protection legislation - EPL) and
active labour market policies (ALMPs) and social welfare systems (Eichhorst et al 2013
OrsquoReilly et al 2015 Pohl and Walther 2005 Pohl and Walther 2007)
The introduction of the YG ndash and its underlying philosophy of early intervention with a
personalised approach ndash across the EU sought to address the issue of rising youth un-
employment including long-term unemployment and inactivity (Eurofound 2015a Eu-
ropean Commission 2016a) The YG approach precisely addresses these challenges
providing unemployed inactive youth with a short-term activation and a perspective in
employment or education
In the five years since the launch of the YG youth unemployment rates have improved
considerably as highlighted in section 1 (see also for example the European Commis-
sion 2018g Eurostat 2018) Although this development is partially attributable to the
recovery from the Great Recession according to the European Commission this is also
partially due to the YG together with the effect of the Youth Employment Initiative (YEI)
(European Commission 2018g)
Challenge 2 ndash Labour market segmentation A key challenge facing youth is labour mar-
ket segmentation often resulting in young people being over-represented in temporary
or part-time forms employment in particular involuntary part-time casual a-typical or
precarious work (European Commission 2017a 2017g and 2018i Eurostat 2015 and
2018) Although such non-standard forms of employment have increased for all age
groups the more recent cohorts of younger workers have been particularly adversely
affected (European Commission 2017g) Specifically although in 1995 23 of younger
workers in the then EU 15 were on non-standard contracts by 2016 this proportion had
increased to 32 for the same age group (European Commission 2017g)
This trend is reflected across the EU 28 where over the last decade non-standard forms
of employment among younger workers rose from 26 to 29 with 35 million fewer
The Youth Guarantee in light of changes in the world of work Youth Guarantee Intervention Models Sustainability and Relevance
18
employees on permanent full-time contracts and 12 million more on non-standard con-
tracts (European Commission 2017g) Moreover younger workers in 2016 were still
more than twice as likely to be working full-time on temporary contracts (12) than
workers in their prime and older workers (5) (European Commission 2017g)
In general young people are more likely to find themselves as labour market lsquooutsidersrsquo
with little access to permanent contracts with high levels of employment protection and
workersrsquo rights especially compared to their older counterparts (European Parliament
2015 European Commission 2017a 2017g and 2018j) Since access to stable employ-
ment with positive career prospects matters young peoplersquos successful transition into
fully independent lives is one of the primary objectives of the YG (Council of the Europe-
an Union 2013 Eurofound 2014)
The degree of lsquodualismrsquo of labour markets varies across Member States recent analysis
suggests that four in ten European young people are on temporary contracts rising to
over 60 in many Southern and Eastern European countries (European Court of Audi-
tors 2017) While temporary employment can either be a lsquostepping stonersquo or a lsquotraprsquo in
terms of STW transitions recent data suggests that the former is rarely the case (Euro-
pean Commission 2015 2017a and 2017g) the average proportion of temporary work-
ers transitioning into permanent employment fell from 28 in 2007 to 23 in 2013
This however masks major country variations ranging from 10 in France to for ex-
ample 65 in Estonia (ibid)
Predictably when studying age groups the probability of moving from temporary to
permanent contracts over one year is lowest for young people aged 15-24 (European
Commission 2016g) However it is worth noting that transition rates from temporary to
permanent contracts among young people have recently either increased or remained
stable in most Member States where data are available (European Commission 2017g)
In most Member States these rates are still lower than 20 and in countries such as
Poland and Greece temporary employment lsquohas almost no stepping-stone functionrsquo (Eu-
ropean Commission 2017g) Countries such as France and Spain with highly segmented
labour markets and high shares of (young) workers on fixed-term contracts have been
also characterised by low transition rates towards permanent employment (European
Commission 2017h Eurofound 2013a and 2013b)
Country case study Ireland
Ireland was one of the EU countries most adversely affected by the Great Recession
which resulted in high levels of youth unemployment As a result addressing youth
unemployment especially long-term unemployment has been a key challenge (EEPO
2015) The youth unemployment rate more than tripled from about 10 in 2008-09 to
a peak of just over 33 in mid-2012 (DSP 2014a) Likewise the NEET rate for those
aged 15-24 was 18 in 2014 although the picture is more nuanced especially in re-
lation to inactive NEETs (DSP 2014a) Specifically excluding students and the young
unemployed inactive NEETs account for a relatively small proportion (about 3) of
the youth population (DSP 2014a EEPO 2015) Most tend to be lone parentscarers
(60) and people with a disability (20) (DSP 2014a EEPO 2015) Thanks to Ire-
landrsquos universal means-tested unemployment benefit system for those aged over 18
the vast majority of young NEETs are registered with the benefitsemployment service
(EMCO 2017)
Against this background the Youth Guarantee (YG) has two target groups (i) poorly
qualified young people aged under 18 who are in turn provided with a quality second-
chance educationaltraining pathway outside the school system (for example
Youthreach) or are supported in re-entering the school system and (ii) unemployed
The Youth Guarantee in light of changes in the world of work Youth Guarantee Intervention Models Sustainability and Relevance
19
young people aged 18-24 with a particular focus on long-term unemployed youth
(EEPO 2015 Stokes 2016) To this end the YG offer is quite comprehensive and
comprises a number of programmes ndash some pre-existing (for example the JobBridge
internship programme) and others such as the First Steps Youth Developmental In-
ternship Programme (for the most disadvantaged young people) and JobsPlus Youth
(an employer subsidy scheme) introduced as part of the YG (DSP 2014a Leigh-Doyle
2014 Treadwell Shine 2016)
The delivery of the Irish YG seems to be integrated within the overall policy approach
towards youth employment with most measures aimed at young jobseekers predating
its introduction (DSP 2016a) This embedding of the YG within the existing youth em-
ployment policy framework means there is a close alignment between the two Indeed
Irelandrsquos YG builds upon existing services and programmes but it crucially entails ear-
lier intervention for and a tailored approach to the young unemployed with a strong
focus on enhancing processespolicies to help the young unemployed enter sustainable
employment receive appropriate training andor gain relevant work experience (DSP
2014a Treadwell Shine 2016 DohertyDSP 2018) YG-related partnership arrange-
ments are also situated within the main policy making process which in turn means
that the implementation of the YG is policy based as opposed to project based
(ESFYEI) (EMCO 2017) As such the YG and associated measures are likely to be
sustained over time
Ireland has made notable progress in implementing the YG with a substantial reduc-
tion in the number of unemployed youth In general there has been intensified en-
gagement with young people while access to different programmes has been enhanced
and partnerships strengthened (European Commission 2018a) Evaluations of YG-
related programmes such as the Tuacutes and Job-Bridge work placementinternship pro-
grammes have shown positive outcomes (Leigh-Doyle 2014 Indecon 2016 Depart-
ment of Education and Skills 2016) The Irish YG seems to be quite successful in de-
livering sustainable outcomes which indicates that the offers provided are of good
quality (European Commission 2018a)
However a number of challenges remain For example the uptake of key measures
such as JobsPlus Youth and the First Steps Youth Development Internship has not
been as extensive as it could in view of the youth cohort concerned and there is also
a lack of sufficient training places (DSP 2016a European Commission 2017f) Em-
ployer engagement particularly in the provision of employment opportunities for the
most disadvantaged youth also remains a challenge as does the timeliness of YG of-
fers (European Commission 2017f and 2018a EMCO 2017)
In principle one response to the challenge of labour market segmentation would be
structural reforms such as for example the reforms Spain implemented in the aftermath
of the crisis Given that the YG was implemented at the height of the recession most
Member States focused on a ldquowork firstrdquo approach to give short-term relief to unem-
ployed young people specifically the implementation of subsidised employment pro-
grammes many specifically targeted at young people at risk has been quite common
across the EU and hiring incentives have featured prominently in many YG plans (Euro-
pean Commission 2018h) Many of these programmes involve incentives such as wage
subsidies aimed at encouraging employers to offer employment to young people
In general countries promoting employment offers under the YG use a form of employ-
ment subsidy which typically involves supplementing the individual labour costs of the
person employed over a fixed period whilst the majority of the labour costs remain cov-
ered by the employer (European Commission 2018h - See Annex Points 9 and 10)
The Youth Guarantee in light of changes in the world of work Youth Guarantee Intervention Models Sustainability and Relevance
20
These wage subsidies also play a crucial role in many countries (including Belgium
France Estonia Greece the Netherlands Poland Spain Sweden and Denmark) in facili-
tating the acquisition of work experience andor entry in their first job by young people
and this especially helps young people from disadvantaged backgrounds (Eurofound
2013b 2016 and 2017 European Commission 2018d and 2018h) In addition the
broader set of labour market reforms accompanying the YG (see previous subsections)
has contributed to addressing labour market dualism in many Member States
Challenge 3 ndash Poor performance of education and training systems (including skills mis-
matches and the limited availability of quality work experience) Another key structural
challenge is given by an unsatisfactory performance in the education and training sys-
tems including VET this means that young people do not have appropriate education
when they graduate and when they enter the labour market which in turn exacerbates
skills mismatches and adversely affects their employability (for example Quintini et al
2007 Quintini and Martin 2014) Indeed the mismatch between (youth) labour supply
and demand seems to be a growing challenge for instance there is growing concern
about graduate under-utilisation and the fact that that higher education graduates expe-
rience considerable and persistent occupational vertical skills mismatch (234 in 2016)
by working in jobs typically requiring a lower level qualification (European Commission
2017c) However it is also worth pointing out that higher education graduates have bet-
ter employment rates (828) than young people with upper secondary education quali-
fications (726) (European Commission 2017c)
Another major challenge in light of rapid and constant technological change relates to
the need for effective skills anticipation against the largely unknown future evolution of
work and work organisation This is in turn is closely related to the need to ensure that
the education and training systems across the EU respond accordingly by being lsquoagilersquo
and by equipping young people with relevant skills including lsquodynamicrsquo skills such as
adaptability resilience and career management skills This concern was also reflected in
the latest European Commissionrsquos report on Employment and Social Developments in
Europe according to which ldquomuch will depend on whether or not education and training
systems are agile enough to respond appropriately to fast-changing technological oppor-
tunitiesrdquo (European Commission 2018g)
In recent years there has been a concerted effort to reform or strengthen education and
training systems including vocational education and trainingapprenticeships and their
role in STW transitions Indeed extensive VET reforms are currently being implemented
in many EU countries (for example Croatia Cyprus Estonia Greece Finland France
Ireland Italy Poland Spain Sweden and the United Kingdom) ndash instigated to some ex-
tent by the YG These reforms seek to improve the labour market relevance quality and
attractiveness of VET together with an effort to develop a VET system often along the
lines of the German dual training system which combines time spent at school with time
spent in the workplace In addition many reforms of VET systems often associated with
the YG have sought to create closer links with the labour market (European Commis-
sion 2018c)
In addition a range of other educational measures offered under the YG has aimed to
bring young people with low levels of skills and qualifications back to education and
training These measures are summarised by the term lsquocontinued education offersrsquo (Eu-
ropean Commission 2018l) These continued education offers are set up to provide
young people with the chance to re-enter the regular education and training system to
move on to a higher-level qualification Alternatively ALMPs bridging courses or second
chance education programmes can also equip early school-leavers and low-skilled youth
The Youth Guarantee in light of changes in the world of work Youth Guarantee Intervention Models Sustainability and Relevance
21
with the skills and qualifications needed for an initial (and targeted sustainable) labour
market integration
214 The heterogeneity of the NEET population
The fourth key aspect of YG implementation assessed in this report concerns the way in
which the YG has addressed the heterogeneity of the NEET population Due to its diversi-
ty the NEET population in the EU can be divided into sub-groups According to Euro-
found (2016) the NEET can be categorised firstly by their activity status ndash those who
are available to the labour market or educational opportunities are counted as active
while the rest is classified as inactive The former group consists of short- and long-term
unemployed individuals and those soon to return to education or employment the latter
group includes people with illness or disability individuals with family responsibilities and
lsquodiscouragedrsquo workers Throughout this report the phrase lsquodiscouraged workersrsquo refers to
people who simply stopped searching for employment or education opportunities
Data from the EU Labour Force Survey from 2013 (also used in Eurofound 2016) pro-
vides an indication about the labour-market attachment of NEETs in Europe before the
YG was implemented Among the active NEETs the largest proportion of 15-24-year-old
NEETs were short-term unemployed (298) Long-term unemployed youth made up
about 22 of the NEET population while returnees into work or education accounted for
roughly 8 of NEETs Among those considered inactive the largest share corresponds to
individuals with family care responsibilities (154) Individuals with illness or disability
made up 8 of the NEET population Discouraged workers accounted for almost 6 of
NEETs and 125 were NEETs for other reasons Consequently around 60 of the
NEET population were neither in education employment nor training for labour market
related reasons (the unemployed the discouraged workers and the returnees) and
around 40 were NEETs for other reasons
Furthermore NEETs can be categorised by their educational attainment as subgroups
with lower education are at a much higher risk of being in a vulnerable position This can
be seen by the fact that less educated youth are overrepresented among the NEETs As
of 2014 44 of NEETs aged 15-24 had completed an lsquoupper secondaryrsquo education
closely followed by 43 with a lsquolower secondaryrsquo education and only 8 of NEETs had
tertiary education or a degree (Eurofound 2016)
These sub-groups have diverse needs and are therefore likely to benefit from different
types of policy responses regarding interventions and they may require additional out-
reach efforts Most importantly those furthest away from the labour market are most
likely to be in substantial need of outreach activities One important factor here is their
point of access to the YG While other entry points exist access is often governed by
PES In all EU countries except Malta the PES plays a role in registering people for the
YG Among other determinants the extent to which the PES are able to actually reach
the NEET population also depends on their responsibilities for administering and paying
(unemployment) benefits According to European Commission (2017b) only three PES
are responsible for administering other types of benefits aside from (mostly insurance-
based) unemployment benefits (Lithuania Luxemburg and Slovakia) These types of
benefits tend to exclude youth due to their limited length of work experience reducing
the scope for outreach without further intervention Indeed the registration of NEETs
with the PES was somewhat limited at the onset of the YG (Eurofound 2016) However
many PES have launched substantial outreach activities to make up for this EC (2017a)
shows that roughly 46 of PES make use of new media for their outreach work 39
provide mobile services and about 43 have specific outreach caseworkers Moreover
The Youth Guarantee in light of changes in the world of work Youth Guarantee Intervention Models Sustainability and Relevance
22
46 of PES have created a one-stop-shop type of framework to enhance their degree of
outreach (eg this includes Belgium Finland and the United Kingdom ibid)
Country case study Italy
Italy is a country with a relatively rigid labour market despite the recent reforms aimed
at increasing the degree of labour market flexibility Moreover the Italian education
system endows youth with a relatively high level of general education but with few
work-related skills which dramatically slows down their transition to a job (Pastore
2018) Along with their relatively large number of early school-leavers this helps ex-
plain their 347 youth unemployment rate in 2017
The lack of previous experience with the YG framework and the dramatically low rate of
job-finding ndash ranging from 11 to 18 in the 2010s ndash represented another obstacle to
successfully implementing the YG According to Pastore (2015) macro- and micro-
economic obstacles should have been overcome to make the programme work at its
best Economic growth has been sluggish at least from the early 1990s which would
normally have reduced the pace of job creation and forced young people into more edu-
cation and training rather than employment Moreover public and private employment
services could count only on human resources which were scant in both quantitative and
qualitative terms as they had a low share of university graduates (ANPAL 2018)
The number of ANPAL staff has been reduced in recent years and as financial resources
for paying for an increase in the number of staff are scarce improvement has been
sought by implementing important reforms such as the `legislative decree 1502015rsquo of
the so-called Jobs Act package (ANPAL 2018) This reform introduced lsquoquasi-marketsrsquo
in the management of employment services the NEETs are profiled by PES and then
assigned a voucher for a different amount according to their lsquoneed bandrsquo NEETs can
spend vouchers in the PES andor with private (for profit or non-profit) employment
agencies to buy the services they need However so far the reform has not been fully
implemented partly due to the lack of financial resources (ibid)
Further problems with the implementation of the YG has been due to the reallocation of
competences in the PES from provinces to regions and the establishment of a national
agency (ANPAL) to coordinate the work of regional entities which detracted from the
full implementation of the YG (ANPAL 2018)
The Italian YG scheme has also managed to improve its monitoring system of the indi-
viduals involved the activities done and their level of absorption into the labour market
when the programme is completed The last monitoring report available shows that of
about 15 million registered NEETs 13 million had the prescribed requirements About
one million were actually profiled of which about a half were given some completed
form of assistance About 60 underwent on-the-job training 23 benefited from sub-
sidised employment 123 received off-the-job training 23 received some form of
placement services 16 did voluntary service in the third sector and a small number
received support for self-employment About six months before completion of the pro-
gramme 479 of recipients were in work and 692 had experienced at least one
employment spell (ANPAL 2017)
A few recent evaluation studies provide a full assessment of regional programmes and
show that on-the-job training is effective in confirming the importance of providing
young people with work-related competences (for example see Ghirelli et al 2019)
Despite these efforts monitoring data on the Youth Guarantee for 2016 shows that in
the EU as a whole an estimated 385 of the NEET population were registered in YG
schemes in the year 2016 Although some Member States are doing much better (cover-
The Youth Guarantee in light of changes in the world of work Youth Guarantee Intervention Models Sustainability and Relevance
23
age rates are higher than 50 in 12 Member States - in Belgium Finland and Austria
the corresponding rate is even above 70) Moreover the YG currently does not suffi-
ciently cover inactive NEETs (European Youth Forum 2018) as this problem is less se-
vere in countries with minimum income support systems where less strict entry require-
ments are usually applied This is the case in Ireland for example (see European Court
of Auditors 2017) This under-coverage of inactive NEETs is reflected in Figure 4 which
shows that the decline in NEET rates since the introduction of the YG is mostly due to
reductions in long-term and short-term unemployment
Figure 4 Composition of the EU NEET population (percentage of the population
of young people)
Source Eurofound (2017)
Thus it seems that the YG so far has benefitted youth closer to the labour market which
may be partly reflect the high prevalence of employment offers within the YG framework
(in 2016 around 67 of all the offers taken up within the four-month time limit set by
the YG were employment offers) Low-skilled individuals lsquodiscouragedrsquo workers and indi-
viduals without work experience are likely to benefit more from offers that combine gain-
ing job experience and building (job-specific) skills However as of 2016 these types of
offer only make up a minority of all the offers taken up within the four-month time limit
Furthermore the 2013 Council Recommendation on the YG insufficiently addressed the
needs of those among the youth that are NEETs for reasons other than labour market
related factors as these individuals had other constraints keeping them from the labour
market Among this group are mainly individuals with family care responsibilities and
youth with illnesses or disabilities For individuals with family responsibilities the Euro-
pean Quality of Life Survey shows that 11 of young fathers and 35 of young mothers
are inactive This is despite the fact that the majority of them would like to work under
flexible work and with adequate care arrangements (European Youth Forum 2017)
Nonetheless some Member States introduced additional reforms beyond the YG recom-
mendations to decrease high school dropout or aimed at improving social and welfare
policies
The Youth Guarantee in light of changes in the world of work Youth Guarantee Intervention Models Sustainability and Relevance
24
215 Design and implementation features of the Youth Guarantee
The fifth key aspect of the YG concerns design and implementation-related factors af-
fecting its capacity to address the main objectives ndash does it provide a broad set of young
people with a quality offer within a short period of time Specifically the Council of the
European Union (EU) recommended providing a quality offer to all young people under
25 within a four-month period of their becoming unemployed or having left the education
system
Substantial variation between Member States can be observed in the way the national
YG was designed and implemented previous experience implementing a YG-type of
framework is also important For example Denmark and Sweden are among countries
that had a relatively long history of this sort of framework even before the introduction
of the YG Furthermore at the very fundamental level of design some Member States
opted for different target time-frames as well as different age cut offs for YG eligibility
Some countries chose a shorter time-frame than the four months envisaged by the
Council of the European Union others opted for a longer duration (European Commis-
sion 2016a) Regarding the age range a substantial number of Member States chose
youth aged under 30 as a target rather than the suggested age of 25 as the cut off This
included for example Bulgaria Denmark Italy and Poland Depending on the size of
these cohorts this may represent a considerably more ambitious approach which - if it
is not supported by sufficient financial and human resources - is more likely to fall short
of expectations Furthermore some countries put specific emphasis on targeting the
long-term unemployed youth (Escudero and Mourelo 2017) Among others this includes
Hungary Poland and the United Kingdom
In order to support the target of reaching every NEET in a timely manner some PES
have also introduced YG-specific staff hired additional caseworkers or at least main-
tained their staff level since the introduction of the YG (European Commission 2017a)
On the issue of the quality of offers 17 PES formally defined their criteria for a quality
offer or distributed national quality management guidelines regarding offers being made
within the YG framework (5 countries)14 Many Member States have chosen an outcome-
based approach for their definition of offer quality meaning they define an offer as being
of high quality when individuals have favourable education or employment outcomes
after leaving one of the YG programmes (European Commission 2016a) In addition
some PES also introduced youth-specific targets (European Commission 2017a)
There is also cross-country variation in terms of the main YG providers Almost all coun-
tries rely to some extent on their national PES for providing YG services while some do
so exclusively This is the case for example in Austria the Czech Republic and Greece
Most Member States however chose some combination of the PES and other institutions
as their main providers (European Commission 2016a) Aside from the institutions
through which YG services can be obtained online access to the programmes may be an
important driver of success In 18 EU countries potential participants can register online
for the YG at least in some regions of the country This is not the case in for example
Bulgaria France or Luxembourg
14 See European Commission 2017a
The Youth Guarantee in light of changes in the world of work Youth Guarantee Intervention Models Sustainability and Relevance
25
Country case study Latvia
Young people in Latvia were very adversely affected by the lsquoGreat Recessionrsquo of
20082009 In the years before the recession youth unemployment had been relatively
low standing at 105 in mid-2008 but then it more than tripled to more than 35
within a two year period In a parallel development the NEET rate for 15-24 year old
Latvians rose from 108 in 2008 to 178 in 2010 Both youth unemployment and the
NEET rate effectively peaked in 2010 in Latvia and since then they have steadily de-
clined reaching pre-crisis levels by 2015 One specific challenge of the Latvian labour
market is the variation in employment outcomes by educational level as the high-
skilled face very low unemployment rates (clearly below the EU average) whereas un-
employment among the low-skilled is much higher than EU average
Following the Council Recommendation the Latvian YG Implementation Plan was pre-
sented in December 2013 (updated in April 2014) and implementation started in 2014
targeting young people aged 15-29 not in employment education or training (European
Commission 2018c) The Ministry of Welfare is in charge of establishing and managing
the YG while the Latvian PES (the lsquoState Employment Agencyrsquo) and the State Education
Development Agency (SEDA) are responsible for its implementation Other main imple-
menting actors include the Ministry of Science and Education the local authorities (the
municipalities) and youth organisations The Latvian Youth Guarantee is fully funded by
the Youth Employment Initiative (ibid)
The immediate strengths of YG implementation in Latvia are the rapid formal adoption
of the YG the adaptability of existing institutions and structures (which also enabled the
creation of new institutions such as a YG Advisory Board) and the emergence of part-
nership as a key component for implementing the YG This active inclusion of a broad
set of partnerships remains a particular strength of the Latvian YG implementation (EM-
CO 2017)
The Latvian YG scheme exclusively provides employment and education offers so that
apprenticeships and traineeships are not provided The employment offers are mostly
subsidised employment in the regular labour market such as first work experience for
labour market entrants and subsidised jobs for the disadvantaged Young people receive
fixed term contracts that range in duration from six months to two years and there is
also financial support for up to two years for young people wanting to become self-
employed or to start a business
The education system includes several vocational elements typically between 480 and
960 hours and up to 15 years in one specific programme Additionally the Latvian YG
provides ldquoyouth workshopsrdquo as part of the preparatory phase which provide training in
three different areas (up to three weeks each) to help young people with their career
choices
In 2016 just over a quarter (271 of the total entrants) of those entering the YG
scheme were re-entrants of which nearly half (127) had previously taken up an of-
fer These re-entry rates are below the EU average but the rates may be understated
as data for participants applying via the SEDA data on previous experience are not
available (European Commission 2018a)
The Youth Guarantee in light of changes in the world of work Youth Guarantee Intervention Models Sustainability and Relevance
26
216 The role of the apprenticeship system in the Youth Guarantee
The sixth main aspect of YG implementation addressed in this study specifically concerns
the role of apprenticeships indeed one of the greatest problems for young peoplersquos
transition into the labour market is their lack of work-related competences especially in
the countries with sequential STW transition systems that focus on general education
rather than building lsquoall-round human capitalrsquo as in lsquodualrsquo STW transition systems where
school and work are linked at the same time (Austria Denmark and Germany) An ap-
prenticeship is therefore one of the key elements of the dual system as it traditionally
involves off-the-job in-class education together with on-the-job training of different
lengths
According to comparative evidence provided by the European Commission (2013) based
on the European Labour Force Survey in most EU Member States the share of appren-
ticeships in any cohort of young people (15-29 years old) is between 15 and 5 with
the only exception being Germany Austria and Denmark where young people who un-
dertake an apprenticeship amount to above 5 All other EU countries are below 15
The EU average share was 37
This general tendency is also partly reflected in the usage of apprenticeships in the con-
text of the YG as they correspond to important cultural and institutional factors within
Member States15 The monitoring data shows that in 2016 some of the countries with the
highest share of apprenticeship offers within the YG programme have a dual STW sys-
tem Portugal is one major exception from this rule this may be related to its general
shortage of employment opportunities and therefore the tendency of apprenticeships to
occupy a higher than average share among participants of the YG Overall however
only 34 of timely exits from the YG were the result of apprenticeship offers a share
not far away from the share in the overall population of young people mentioned above
For a large number of countries the share was close to zero It should be noted howev-
er that due to data limitations some countries may record entries into apprenticeship
offers as entries into employment (European Commission 2016b)
Apart from data-related issues one reason why apprenticeship offers remain rather ex-
ceptional within the YG is that they require employersrsquo commitment to providing training
places and to designing curricula in cooperation with schools This can be a big constraint
in the development of apprenticeships especially in sequential SWT systems In 2013
the European Alliance for Apprenticeship (EAFA) was therefore launched to boost ap-
prenticeships in the EU The EAFA gave guidelines for the implementation of apprentice-
ships in all Member States and encouraged sharing experiences and good practices and
provided strategic expert support from the European Centre for the Development of Vo-
cational Training (CEDEFOP) and through the European Training Foundation Within the
context of the EAFA all member countries signed a declaration of commitments on ac-
tions to spread the use of apprenticeships as the main port of entry to the labour market
15 Note that the Commissionrsquos definition of apprenticeships (European Commission 2013) may differ from Member Statesrsquo definitions A recent Council Recommendation (Council of the European Union 2018) intends to harmonise the definition by saying that apprenticeships are understood as formal vocational education and training schemes that a) combine learning in education or training institutions with substantial work-based learning in companies and other workplaces b) lead to
nationally recognised qualifications c) are based on an agreement defining the rights and obliga-tions of the apprentice the employer and where appropriate the vocational education and train-ing institution and d) with the apprentice being paid or otherwise compensated for the work-based component Despite this recommendation varying national definitions still exist across Member States
The Youth Guarantee in light of changes in the world of work Youth Guarantee Intervention Models Sustainability and Relevance
27
for young people16 Moreover in their declarations each country committed itself to im-
plement the dual principle in their STW transition
Country case study Denmark
Denmark is among those EU countries that even before the introduction of the YG in
2013 (European Commission 2016a) already had a particularly well-functioning labour
market and educational system to help NEETs In fact Denmark already had some ex-
perience of a YG-like framework for a relatively long period before it was proposed by
the Council of the European Union The situation for Denmarkrsquos youth was therefore
more favourable than the EU average in 2012 The share of young people between 15
and 25 that were NEETs was only 66 - significantly below the proportion of NEETs in
many other EU countries Furthermore the majority of those individuals that were clas-
sified as NEETs were relatively close to the labour market and were therefore easier to
reach For example only 53 of Danish NEETs belonged to the group of long-term
unemployed or discouraged workers (Eurofound 2016)
Due to these circumstances the case for additional reforms within the YG was limited
Therefore along with reform efforts regarding active labour market policies concerning
youth and the educational system17 the implementation of the YG mostly required the
updating of existing policies This is exemplified by a strong increase in ALMP spending
from roughly 13 of GDP in 2012 to about 14 in 2015 despite declining rates of
youth unemployment and therefore a decrease in ALMP expenditure in other countries
over the same time period Denmark chose a particularly ambitious implementation by
focusing on youth under the age of 30 with a target window of less than four months so
as to offer their NEET population a quality measure In contrast to many other Member
States Denmark focuses on increasing the employability of NEETs via (continued) edu-
cation measures resulting in a share of apprenticeship take ups of over 50 relative to
the total number of timely exits from the YG This approach also matches the relatively
large proportion of low and medium educated youth among the NEETs
Two of the main pillars in the original 2014 Danish implementation plan were the ldquore-
tention task forcerdquo and the ldquoBridge Building to Educationrdquo programmes Both types of
initiatives were well-founded in regional and inter-organisational partnerships (for ex-
ample people involved include job centres municipalities educational facilities youth
organisations and others) While the aim of the first programme was to decrease high
school drop-out rates the latter took place at a vocational school in close cooperation
with the jobcentres and it focuses on helping youth to find their right path to success
through making the transition to vocational education This was done by assigning men-
tors to the NEET and giving them access to basic literacy and numeracy courses if they
needed them as well as further professional courses and traineeships The evaluation of
the ldquoBridge Building to Educationrdquo initiative yielded positive effects for youngsters par-
ticipating in the intervention compared to the control group (with a similar profile) which
did not participate in the intervention As a result two additional initiatives were set up
Firstly funds were made available to support the further implementation of ldquoBridge
Building to Educationrdquo initiatives Secondly ldquoJob-Bridge to Educationrdquo a randomised
controlled trial building on the core elements of ldquoBridge Building to Educationrdquo and tar-
geting the most vulnerable youth under 30 years without an education was also set up
16 Declarations of national commitment are downloadable from the EAFA website httpeceuropaeuapprenticeships-alliance
17 For more information see httpsuvmdkreform-af-de-forberedende-tilbudforberedende-grunduddannelseopbygning-og-maalgruppe
The Youth Guarantee in light of changes in the world of work Youth Guarantee Intervention Models Sustainability and Relevance
28
The project is set to end in mid-2020 where it will be followed by an evaluation of the
results
The Danish YG has also managed to set up a high-quality monitoring system with only
relatively few cases of missing information on YG participantsrsquo exit destinations (Euro-
pean Commission 2018a) Together with the relatively large share of NEETs who are
registered with the PES and the development of ldquoyouth guidance centresrdquo to reach out
to those who are not the Danish YG model is able to cover a substantial portion of
NEETs For instance in 2016 the YG coverage rate reached almost 60 of the NEET
population compared to the EU YG scheme average of 425 Thus despite more fa-
vourable initial conditions in Denmark the YG helped put a focus on the most vulnera-
ble youth and spur on a further integration of policies into national policymaking for
example through additional reforms aimed at improving active labour market policies
for young people Youth unemployment rates are currently trending downwards even
further in Denmark However there remain some issues especially with regard to the
integration of migrants given that youth unemployment is a much more pervasive issue
among them compared to native Danes (European Commission 2018a)
22 Empirical indicators of Youth Guarantee features
Section 21 has presented the key aspects that reflect how Members States implemented
the Youth Guarantee following the Recommendation In order to prepare the systematic
analysis of the YG in section 3 which develops a YG typology it is necessary to build
empirical indicators for each of these key aspects That is to say that this section dis-
cusses how information on each of these aspects can be measured and expressed in da-
ta18 These empirical indicators are therefore grouped into the corresponding six sets
1 Financial resources for implementing the Youth Guarantee
2 The Youth Guarantee as part of national policy-making
3 Youth labour market challenges
4 The heterogeneity of the NEET population
5 Design and implementation features of the Youth Guarantee
6 The role of the apprenticeship system in the Youth Guarantee
221 Indicator set 1 Financial resources for implementing the Youth
Guarantee
The set of indicators below represents the level and composition of financial resources
that Member States employed to support the Youth Guarantees implementation
i The size of ESFYEI transfers to match the respective NEET challenge is measured
by the ratio of initial YEI allocations as well as the YEI+ESF matching funds EU el-
igible cost both relative to Member Statesrsquo GDP in 2012 In addition a categori-
18 For each group of contextual and implementation features of the Youth Guarantee discussed in Section 21 an overview of potential quantitative or qualitative indicators was established which could represent these constructs Through a desk research of the available literature and online databases the availability of the respective indicators at the Member State level was assessed for a sufficiently large set of countries Unfortunately for a subset of potential indicators it was not possible to retrieve sufficient andor adequate information for a large enough sample of Member
States In some cases where several potential indicators were available to represent the same dimension or construct the available indicators that best represent the specific feature were iden-tified while also taking data quality into account In some cases single combined indicators were constructed to reduce the lsquodimensionalityrsquo of the database underlying the cluster analysis in sec-tion 3 See appendix A for more details on the exact indicators used and their source
The Youth Guarantee in light of changes in the world of work Youth Guarantee Intervention Models Sustainability and Relevance
29
cal variable for the estimated yearly costs relative to GDP for offering interven-
tions to all NEETs is included derived from Eurofound (2015a) The comparison of
both allows judgement of the importance of EU transfers in financing the YG
ii The degree to which Member States allocated additional funding from the ESF to
fund measures related to youth employment is measured in data about ldquoOther
ESF EU eligible costsrdquo (European Commission 2018k)
iii To proxy whether Member States dedicated additional funding from national
budgets to finance YG-related measures the evolution of overall active labour
market spending from 2012 to 2015 is used (Eurostat lmp_expsumm)19
iv Finally the degree to which Member States were able to absorb the additional
funding from the YEI in a timely manner is measured by the share of EU eligible
costs among YEI+ESF funds that were actually declared YEI+ESF funds based on
data from European Commission (2018k)
222 Indicator set 2 The Youth Guarantee as part of national policy-
making
The second set of indicators reflects the degree to which Member States made efforts to
introduce elements of the YG into national policy making and started partnerships
Regarding reform efforts the following indicators are included
i The degree to which the YG spurred wider longer-term reforms in Member States
is quantified by the total number of youth-related active labour market policy re-
forms between 2013-2016 based on LABREF information (the European Commis-
sionrsquos labour database)20
ii In addition the degree to which Member States were committed to the policy
change is approximated by the number of areas in which additional measures
were taken in the context of YG beyond the scope of the Recommendation (based
on European Commission 2016c)21
iii Finally the degree to which Member States were able to set up an effective YG
monitoring and follow-up system is taken into account as an indication of whether
they were committed to delivering the YG This means including 2016 data for the
proportion of YG exits with unknown destinations and the proportion of unknown
situations in the six-month follow-up data (European Commission 2018a)
The degree of partnerships built in each Member State is measured using the following
indicators
iv The degree to which partnerships were an element of the initial YG design is in-
cluded using the Member Statesrsquo self-reported involvement of social partners and
19 At the time of writing this report more recent data was only available for relatively small subset of EU countries
20 The authors refrain from using 2017 data on labour market reforms from the LABREF database as the objective is to measure the degree to which the YG was a driver of reforms in Member States That is this link becomes weaker over time such that the added value of more recent data
for the analysis is questionable
21 Due to their high correlation with LABREFrsquos own variations indicators of receipt and implemen-tation of country-specific recommendation between 2013-2017 and the qualitative classification by the Commission for the extent to which YG has acted as a driver of reform (European Commission 2016a) are not included in the set of indicators used
The Youth Guarantee in light of changes in the world of work Youth Guarantee Intervention Models Sustainability and Relevance
30
youth organisations in the design implementation and monitoring of the YG
(based on European Commission 2016c)22
v Furthermore the involvement of partners is approximated using the number of
areas where the PES is declared to have formed partnerships (based on European
Commission 2017a)23 In addition indicators are included for national PES re-
ported as having involved youth organisations and young people in the design of
YG services (based on European Commission 2017a)
223 Indicator set 3 Youth labour market challenges
To reflect how the challenges faced by young people in their transition from STW differ
across Member States the following empirical indicators are considered
i A set of indicators that reflect the significance of the youth unemployment chal-
lenge at the time when the YG was designed and rolled out These include the ra-
tio of unemployment rates for youth (age 15-24) and adults (age 25-74) the
share of people aged 15-24 of the total population (age 15-74) and the NEET
rate among youth aged 15-29 to obtain a measure of the size of the NEET chal-
lenge also for Member States that target individuals up to 29 years of age (Euro-
stat lfsa_pgaed une_rt_a edat_lfse_14 all indicators were measured in 2012)
ii To measure the initial degree of labour market segmentation and the quality of
entry-level jobs available to youth in each Member State the absolute difference
in the share of youth (15-24) to adults (25-54) in terms of the number on tempo-
rary employment contracts in 2012 (Eurostat lfsi_pt_a)
iii To address Member Statesrsquo response to these conditions several indicators are
included on the degree to which employment offers were favoured possibly re-
flecting a ldquowork-firstrdquo approach specifically the number of offers of employment
relative to the total number of all types of offers that are typically made to young
people registered in YG schemes (based on European Commission 2018b) In ad-
dition this includes a measure for the employment intensity of timely exits in
2016 (the share of all timely exits that were employment offers based on Euro-
pean Commission 2018b)
iv Lastly two indicators approximate the performance of education and training sys-
tems from which youth enter into the labour market and the potential severity of
the skills mismatch first the share of early school-leavers from education and
training among the youth population (age 18-24) in 2012 (Eurostat
edat_lfse_14) and second the share of NEETs with low and medium educational
attainment in 2012 To approximate the YG implementation with respect to skills
mismatches the number of offers of education relative to the total number of all
types of offers that are typically made to young people registered in YG schemes
is used (based on European Commission 2018b) In addition a measure is in-
cluded for the education intensity of timely exits in 2016 ie the share of all
timely exits that were education offers (based on European Commission 2018b)
22 An alternative source for partnership information is provided by ETUC (2018) Their data is ndash in
contrast to the data employed ndash not self-reported by the Member States However the ETUC (2018) report contains substantial missing information and hence was not used
23 Namely PES partnerships aimed at (i) ensuring that young people have full information and support available (ii) increasing employment apprenticeship and traineeship opportunities and (iii) supporting transitions from unemployment inactivity or education into work
The Youth Guarantee in light of changes in the world of work Youth Guarantee Intervention Models Sustainability and Relevance
31
224 Indicator set 4 The heterogeneity of the NEET population
The next set of indicators aims to reflect the diversity of the NEET population While
some indicators have already been introduced in the indicators above (for example NEET
rates by educational attainment) this additionally integrates the following
i The composition of NEETs as measured by the share of NEETs that are short-term
or long-term unemployed individuals about to re-enter education or employment
discouraged NEETs youth with illnesses or disabilities and the share of NEETs
with family responsibilities This gives an indication of the NEETsrsquo activity status
the potential reasons for their NEET status and their degree of closeness to the
labour market (Eurofound 2016 all indicators measured in 2013)24
ii Indicators describing the links between the PES for the YG This includes the
number of responsibilities of the PES in the YG as well as their main outreach
tools based on European Commission (2017a) Furthermore it includes indicators
on whether the PES is the main body responsible for the administration and pay-
ment of unemployment andor other types of benefits (based on European Com-
mission 2017a)
iii An indicator from European Commission (2017a) that reflects whether the re-
spective PES is reported to have taken any additional measures with respect to
preventing school drop-out
225 Indicator set 5 Design and implementation features of the Youth Guarantee
This set covers further design and implementation indicators that are likely to affect the
performance of the YG as implemented by the Member States
i Indicators on the envisaged length of the preparatory phase the eligible age
group the main YG provider whether online registration is possible for potential
YG participants as well as whether Member States created a legal entitlement to
receive an offer (all based on European Commission 2016c) In addition there is
an indicator measuring whether Member States specifically target the long-term
unemployed (Escudero and Mourelo 2017)
ii A categorical indicator providing information on whether a YG-related scheme was
already in place (in the long-term or recently) before the Recommendation
(based on European Commission 2016c)
iii Information on whether the Member States established a formal definition of a
good quality offer within the YG scheme (European Commission 2016a) and
whether quality management guidelines exist from the national administration to
organisations involved in YG (based on European Commission 2017a)
iv Indicators to reflect the relevance and potential upscaling of national PES capacity
since the YG Recommendation (all reflecting 2017 responses of PES based on
European Commission 2017a) These include whether the PES has dedicated YG
staff whether the PES provides training for YG staff whether the PES staff in-
creased or remained the same from 2014-2017 and whether the PES has specific
targets for youth (ibid)
24 Optionally the use of a more general measure of the NEET Cluster Type was tested which is a composite indicator on different levels reflecting the STW transition system and the composition of NEET in 2012 (Eurofound 2016) However as the clustering is based on the share and STW transition type data already employed the indicator is not used in the analysis
The Youth Guarantee in light of changes in the world of work Youth Guarantee Intervention Models Sustainability and Relevance
32
226 Indicator set 6 The role of the apprenticeship system in the Youth Guarantee
The final set of indicators represents the relevance and the set-up of apprenticeships in
the national education and training system as well as their role in the YGs implementa-
tion
i To provide information on the STW transition types of Member States indicators
are included based on the classification by Pohl and Walther (2005 2007) Fur-
thermore an indicator on the share of firms employing initial vocational training
participants in 2010 is used (Ireland 2015) (Eurostat trng_cvt_34s)
ii To reflect the relevance of apprenticeships in the YG implementation indicators
on the number of offers of apprenticeships relative to the total number of all
types of offers that are typically made to young people registered in YG schemes
(based on European Commission 2018b) In addition a measure for the appren-
ticeship-intensity of timely exits in 2016 ie the share of all timely exits that
were apprenticeship offers (based on European Commission 2018b)
iii The normalised number of pledges from firms and institutions to the European Al-
liance for Apprenticeships between the outset of the YG in 2013 and 2018 (based
on the national commitments database25)
23 Conclusion
This chapter has provided a comprehensive overview of the main aspects of the YG im-
plementation in context Specifically subsection 21 discussed a) the main financial re-
sources for implementing the YG b) the YGrsquos integration within national policy-making
c) the YG and youthrsquos labour market challenges d) the diversity of the NEET population
e) design and implementation features of the YG and f) the role of the apprenticeship
system in the YG Section 22 proceeded to identify and map six sets of empirical indica-
tors to each of these six implementation aspects In total 76 empirical indicators were
identified which will form the basis of the systematic analysis of a YG typology in the
next section Figure 5 gives a graphic overview of the number of indicators included in
each of the six indicator sets representing the key implementation aspects
25 The national commitments database available at httpeceuropaeusocialmainjspcatId=1148amplangId=en as of September 17 2018 This data-base also provides information on the number of pledges made by firms and institutions For the analysis the number of pledges is normalised by the share of firms employing IVET participants in each Member State to account for the relevance of the VET system
The Youth Guarantee in light of changes in the world of work Youth Guarantee Intervention Models Sustainability and Relevance
33
Figure 5 Number of indicators identified by variable set
Source Own analysis
Figure 5 illustrates that for example indicator set (5) ndash which represents the design and
implementation features of the YG ndash is the largest set comprising 20 indicators Whereas
the indicator sets (1) on financial resources for implementing the YG and (6) on the role
of the apprenticeship system (6) are somewhat smaller they still contain seven and nine
indicators respectively
3 Typology of Youth Guarantee models
This section is the empirical part of the analysis Based on the identification of the set of
relevant implementation aspects and the corresponding empirical indicators in the previ-
ous section Chapter 3 intends to systematise the main models that are currently in
place for delivering the YG in Member States It is an empirical attempt at establishing a
typology of different intervention models based on cluster analysis This section also
explores whether a correlation between specific types of intervention models and per-
formance in delivering the YG can be identified
31 Empirical approach to establishing Youth Guarantee models
To address the question about which main models are currently in place for delivering
the YG the analysis groups Member States according to their similarity across the em-
pirical indicators presented in section 22 Since both contextual features and implemen-
tation-related factors are included this procedure identifies types of countries that are
similar in both dimensions
To detect these types cluster analysis techniques are used in which the goal is to find
groups of observations in the data ndash that is groups of Member States ndash that are most
similar within clusters while being as dissimilar as possible across clusters In this study
hierarchical agglomerative clustering methods are employed These methods start out by
specifying each Member State as one individual cluster The cluster approach then grad-
ually combines Member States into clusters The choice of which clusters are to be com-
bined is determined by comparing their (dis-) similarity In the empirical application an
adequate measure of dissimilarity is the coefficient by Gower (1971) as it allows for the
combination of binary indicators and multivalued variables The choice of the linkage
method (the way the clustering algorithm combines similar observations into clusters) is
of similar importance in this case the Ward method (1963) is chosen which combines
groups or observations if they increase the within-group variance of the chosen indica-
tors by the least amount possible in the data Lastly the authors needed to choose the
7
11
11
18
20
9 (1) Financial resources for implementing the YG
(2) YG as part of national policy-making
(3) Youth labour market challenges
(4) Heterogeneity of NEET population
(5) Design and implementation features of the YG
(6) Role of the apprenticeship system in the YG
The Youth Guarantee in light of changes in the world of work Youth Guarantee Intervention Models Sustainability and Relevance
34
number of clusters to be generated Since this is not obvious in the application at hand
the Duda-Hart optimality criterion as described by Milligan and Cooper (1985) was ap-
plied This means that intuitively the index computes the added value of increasing the
number of clusters by one so a low Duda-Hart index indicates an optimal number of
clusters In the YG case the comparison is restricted to between three and seven clus-
ters as fewer clusters provide too little information while too many clusters hamper the
interpretability of results
The empirical application follows a two-step procedure In the first step a cluster analy-
sis for each set of the empirical indicators defined in section 22 determines sets of coun-
tries that are similar within each of these six conceptual sets For example the set on
financial resources puts countries with magnitudes of expected and realised costs for
implementing the YG based on the available information together In the second step
the main cluster analysis based on all indicators determines a final cluster analysis which
also allows the authors to analyse their correspondence to the sub-clusters from the first
stage Readers should note that the quality of the cluster groups depends ndash among other
factors- on the data quality of available indicators as well as the number of indicators
used The more indicators are required for meaningful results the more difficult it is to
obtain clusters that differ sharply with respect to all the chosen indicators Thus it may
be that one country differs quite substantially in terms of one indicator from the rest of
the countries in a particular cluster if the other indicators show similar realisations
Hence for the description of clusters attention is restricted to those indicators that
summarise the cluster differences the best presenting the general tendencies of the
cluster analysis necessarily simplifying to a certain degree Furthermore readers should
also note that the groupings following from this exercise do generally not imply any
qualitative ranking
32 Description of first-step clusters
321 Indicator set 1 Financial resources
Cluster A (AT DK FI DE LU NL and SE) is a set of countries with a low estimated cost
of fully implementing the YG that received relatively little financial support from EU
funds both via the YEI and the ESF On average these states show very little changes in
active labour market policy (ALMP) spending between 2012 and 2015
Cluster B (BE CZ EE FR IE IT MT RO SI and UK) and Cluster C (ES LT LV PL and
PT) are countries with costs estimated to be of medium magnitude to fully implement
the YG Country cluster C received more EU funds from the YEI and the ESF matching
funds - and other ESF eligible youth-related projects - compared to cluster B Both clus-
ters showed only a small change in ALMP expenditure
Cluster D (BG CY EL HU HR and SK) has high estimated YG costs and they received
substantial monetary support from the EU to support the implementation of the YG
through the YEI through the ESF matching funds and through financing of other eligible
youth-related projects Cluster D is also the only one in the analysis that shows a sub-
stantial increase in ALMP spending between 2012 and 2015 despite declining (youth)
unemployment rates
322 Indicator set 2 Youth Guarantee as part of national policy-
making
Cluster A (DK ES FR HU IE SE and SK) has a large average number of youth-related
ALMP reforms and additional measures implemented beyond the scope of the Recom-
mendation These Member States also tend to enforce comparatively effective YG moni-
The Youth Guarantee in light of changes in the world of work Youth Guarantee Intervention Models Sustainability and Relevance
35
toring and follow-up systems which may be interpreted as an indication that they are
committed to deliver on the YG However on average these Member States did not pri-
oritise partnerships as much as other clusters
Cluster B (AT CZ DE EE EL NL RO and UK) is mostly defined by the lack of effective
monitoring and follow-up systems and also fewer reforms were put in place compared to
Member States in other clusters Nonetheless on average they put more emphasis on
involving social partners and youth organisations and built more partnerships than coun-
tries in cluster A
Cluster C (BE BG CY FI HR IT LV LT LU MT PL PT and SI) implemented many
youth-related reforms and additional measures as part of the implementation of YG rec-
ommendations However in contrast with cluster A these Member States also included
partnerships with social partners and youth organisations as a central element of the
initial YG design Consequently the PES in these Member States often said that they had
formed partnerships and that they regularly involve youth and youth organisations into
their work Nonetheless their monitoring systems are still underperforming compared to
countries in Cluster A
323 Indicator set 3 Youth labour market challenges
Cluster A (BG CY EL HR PL and SK) includes Member States that had the highest
NEET rate amongst 15-29 year olds in 2012 before the YG was rolled out Moreover
they show the largest difference in shares of temporary employment contracts between
the youth and adults Countries in this cluster have the best educated NEETs on average
This also reflects the point that the issue was not so much the education system as the
figures also show a comparatively low average shares of school drop-outs Correspond-
ingly Member States in cluster A usually responded by focusing on employment-related
measures under the YG rather than offers of education
Cluster B (AT DE DK ES LV and MT) relates to the contrasting cases These Member
States tend to have comparatively low NEET shares with most of them having a poor
level of education and the lowest average youth-to-adult unemployment ratio In addi-
tion these countries appear to have a rather well-functioning educational system with
similarly low average shares of early school-leavers compared to cluster A Most of
these Member States responded to this setting with a strong focus on educational offers
under the YG
Cluster C (BE CZ EE FI FR HU IE IT LT LU NL PT RO SI SE and UK) ranks in
between cluster two and three on many indicators including the prevalence of low edu-
cated NEETs education and employment offers In general this cluster has the lowest
difference in temporary employment shares between adults and the youth
324 Indicator set 4 The heterogeneity of the NEET population
Cluster A (BE BG FI MT and NL) consists of countries that have a particularly high
share of NEETs in short-term unemployment illness or disability and lsquodiscouragement
from workingrsquo The policy response of these countries is characterised by the highest
average outreach efforts on the part of the national PES
Cluster B (CZ DE EE EL FR HU HR LT LU PL SI and UK) has the highest share of
short-term unemployed and individuals with family responsibilities among the NEETs
Similar to cluster A countries from cluster B display strong average outreach efforts and
a large degree of involvement of the PES in delivering the YG
The Youth Guarantee in light of changes in the world of work Youth Guarantee Intervention Models Sustainability and Relevance
36
Cluster C (AT CY DK ES IE IT LV PT RO SK and SE) is the most diverse for this
indicator set and shows the highest share of long-term unemployed and relatively high
rates of discouraged youth among the NEET population compared to other clusters The
governance structure shows a lower degree of PES having responsibility for administer-
ing and paying (unemployment) benefits as well as regarding the implementation and
delivery of the YG in general Compared to clusters A and B Member States from cluster
C tend to show fewer outreach efforts
325 Indicator set 5 Design and implementation features of the Youth Guarantee
Cluster A (AT CY DE DK EL FI HR IE LU and SE) includes many Member States
which set the age target as under-25 years old26 These countries also tend to define
very few other eligibility criteria or target groups Importantly all Member States includ-
ed in this category have a relatively long experience of YG-type schemes prior to 2013
However only very few of them defined a legal entitlement to receive an offer These
are also countries that mostly allowed individuals to register online set a definition for a
quality offer and also provided national quality guidelines for all actors involved in the
YG Many of the Member States in this cluster also primarily rely on their PES in the YG
implementation and have strengthened their PES capacities since the YG rollout
Cluster B (BG CZ ES FR MT NL PT and RO) includes a relatively diverse set of coun-
tries Most countries in this cluster have no prior experience of a YG-type of scheme
relatively low availability of online registration and a low prevalence of the definition of
quality offers While some countries additionally target NEETs under 30 years old in
general they neither upgraded the capacity of nor relied strongly on their PES in its im-
plementation
Cluster C (BE EE HU IT LV LT PL SI SK and UK) primarily consists of countries that
set the target for youth aged under 30 In addition many of these countries set addi-
tional target groups beyond the general criteria (such as a specific focus on long-term
unemployed) or defined specific sub-groups within the broad target population Similar
to cluster A some Member States with previous YG-related experience are included in
this cluster In addition they tend to have upgraded their PES capacity for YG implemen-
tation (but they also rely on other providers) These are also mainly countries that im-
plemented a legal entitlement and also a definition of a quality offer (without however
providing national guidelines)
326 Indicator set 6 The apprenticeship system
Cluster A (AT BE DE FR LU and NL) consists of countries with an employment-centred
STW transition type27 that is characterised by high levels of employer involvement in
education and training system and the largest share of firms employing initial vocational
and educational training (IVET) participants On average Member States in this group
show the largest share of timely exits from apprenticeships Relative to the share of
firms employing IVET participants the number of pledges within the EAFA framework is
26 It is important to note that most implementation-related indicators for example information on eligible age groups were measured in 2016 For a few countries these conditions have changed recently However in the analysis it was decided to stick to the initial implementation features to focus on the way Member States initially aimed to combat youth unemployment
27 See Pohl and Walther (2005) for details
The Youth Guarantee in light of changes in the world of work Youth Guarantee Intervention Models Sustainability and Relevance
37
the lowest in this group potentially reflecting the already high importance of apprentice-
ships in these countries
Cluster B (BG CZ EE HU LT LV RO SK and SI) is made up of Member States that
joined the EU relatively recently with a lsquotransitionalrsquo STW transition type and the lowest
share of firms employing IVETs Their share of apprenticeships is lowest among the
timely exits and their number for EAFA pledges is relatively the largest
Compared to cluster A and B cluster C (CY DK EL ES FI HR IE IT MT PL PT SE
and UK) also consists of a mixture of STW types and a medium share of firms hiring
IVETs Apprenticeship offers are of medium importance relative to the other two clus-
ters
327 Summary of first-step cluster analysis
The analysis of Member Statesrsquo similarities within the indicator sets shows that the re-
sulting country clusters tend to be different depending on the set of indicators although
certain tendencies are already apparent For instance countries that are included in the
same cluster for the YG design and implementation indicators tend to also be grouped
into the same finance cluster meaning that some countries with a low estimated cost of
implementing the YG tend to also be countries that show implementation patterns that
closely followed the Recommendation Similarly countries in the same apprenticeship
cluster tend to be in the same ldquoyouth labour market challengesrdquo cluster While this al-
ready provides some suggestions for the final grouping of Member States with respect to
all indicators chosen the overlap across clusters for the different indicator sets is not
complete so a more in-depth analysis is needed Specifically some clusters remain rela-
tively heterogeneous in terms of the underlying empirical indicators indicating that the
cluster analysis has some difficulties if Member Statesrsquo realisations of indicators do not
follow a simple pattern making the interpretation of some cluster results more difficult
than others For these reasons and to further reduce the dimensionality of the problem
the next section groups Member States based on all the chosen indicators To make the
connection between the first-step analysis and the ensuing second step the association
of first-step clusters with the final cluster results is also shown
The Youth Guarantee in light of changes in the world of work Youth Guarantee Intervention Models Sustainability and Relevance
38
33 Results and discussion of second-step clusters
The final cluster analysis uses all the indicators described in the previous section and
performs the clustering procedure for all variables in a combined step thereby arriving
at clusters that take the individual sub-clusters as well as the interaction between them
into account Table 2 shows the results by Member States including their association
with the clusters uncovered in the first stage of the analysis all ordered by the final re-
sults Being in the same first-step cluster is visualised as having the same shade of the
colour in the respective column It is important to note that the colours chosen imply no
qualitative or quantitative judgement apart from the cluster membership
Table 2 Summary of Results of Cluster Analysis
Country
Financial resources for implementing the YG
YG as part of national policymaking
Youth labour market chal-lenges
Heterogenei-ty of the NEET population
Design and implementa-tion features of the YG
Role of the apprentice-ship system in the YG
Overall cluster
Austria
A
Denmark
Finland
Germany
Ireland
The Netherlands
Sweden
The Czech Republic
B
Estonia
France
Hungary
Romania
The United Kingdom
Cyprus
C
Greece
Italy
Portugal
Spain
Belgium
D
Lithuania
Luxembourg
Malta
Poland
Slovenia
Bulgaria
E Croatia
Latvia
Slovakia
Source Own analysis
Note Countries that share the same first-stage cluster have the same shade of the colour in the respective
column Note that the colour shades imply no qualitative or quantitative ranking of Member States
The Youth Guarantee in light of changes in the world of work Youth Guarantee Intervention Models Sustainability and Relevance
39
Cluster A Member States with previous YG experience lower initial NEET rates
ambitious implementation and improved PES capacity low educated NEETs and
diversified offers (AT DK DE FI IE NL SE)
The first cluster is a set of Member States that are mostly countries which already had
longer experience with YG-related schemes On average YG implementation in these
countries was quite ambitious many of these Member States undercut the recommend-
ed four-month target for the preparatory phase and formally defined their offer quality
and quality guidelines Countries in this cluster tend to rely relatively strongly on their
PES for the YG while upscaling their PES capacity through hiring additional staff At the
same time they also experienced the lowest average NEET rates in 2012 for all clusters
and they consequently had comparatively low estimated costs and therefore low levels of
funding allocated under the YEI However the clusterrsquos NEET population has the highest
share of individuals with low educational background and youth with a disability Follow-
ing this NEET challenge they diversified their offers under the YG across types the most
compared to other clusters with the lowest focus on employment-type offers Involve-
ment and integration of partners within the YG framework in these countries was about
average compared to the other clusters
Cluster B Member States with intermediate NEET challenges strong outreach
efforts by the PES relatively poor monitoring data quality high NEET rates due
to family responsibilities and strong focus on employment offers (CZ EE FR HU
RO UK)
On average these Member States mostly observed a NEET challenge of intermediate
magnitude relative to other clusters at the time of the YG roll-out The labour markets
for youth in this cluster were under more stress and characterised by high rates of short-
term unemployment among their youth ndash for some of them also as a consequence of the
great recession Furthermore this cluster also had by far the highest share of youth that
were NEETs due to family responsibilities and the largest gap between youth and adult
unemployment rates As a result most of them received some funding under the YEI It
is also notable that countries in this cluster showed the largest increase in ALMP ex-
penditure between 2012 and 2015 However compared to the other clusters countries
in this cluster showed particularly poor monitoring data quality so their information has
a high degree of unknown destinations and situations for previous YG participants On
implementation a significant fraction of Member States from cluster B chose slightly
different targets (for example through targeting long-term unemployed introducing a
legal entitlement to a YG offer and extending the age limit up to age 29) They could
build on a comparatively advanced outreach system through the PES which they also
relied on in their YG implementation Furthermore four of the seven countries in this
cluster follow the post-socialisttransitional STW model (the Czech Republic Estonia
Hungary and Romania) On average these countries showed the lowest level of in-
volvement of the social partners and youth organisations and relatively few efforts at
reform On average countries in this cluster had the highest rate of timely exits into
employment indicating a tendency towards an ldquoemployment-firstrdquo approach
Cluster C Member States hit by the economic recession with highest initial
NEET rates severe long-term unemployment large support via EU funding
highest reform efforts and highest entry rates into apprenticeship offers (CY EL
ES IT PT)
The third cluster consists mainly of Member States that were hit particularly hard by the
economic recession following the financial crisis in the years after 2008 and they were
struggling to revive their labour markets in the ensuing recovery As a consequence
most countries had a severe problem with long-term youth unemployment into 2012
The Youth Guarantee in light of changes in the world of work Youth Guarantee Intervention Models Sustainability and Relevance
40
Moreover countries in this cluster had on average the highest rate of early school-
leavers Almost all these Member States received significant funds from the EU to sup-
port the YG implementation and delivery In contrast to Member States in Clusters A and
B none of the countries in cluster C had any kind of experience of a YG type of frame-
work before the Recommendation making its implementation even more difficult in
these countries However in terms of policy integration these Member States rank at
the top of youth-related ALMP reform efforts At the same time most of these countries
still have monitoring systems with relatively poor data quality and their PES used rela-
tively few channels for outreach activities compared to countries in the other clusters
Regarding partnerships built countries in this cluster show an average degree of effort
While the share of low educated NEET is comparable to those in Cluster B and average
exits rates into education are only slightly smaller than among countries from Cluster B
the share of individuals entering apprenticeships is highest among these countries sug-
gesting a stronger focus on the provision of both training and work experience to combat
the NEET challenge
Cluster D Member States characterised by relatively low initial NEET rates and
short-term unemployed rather than inactive NEETs some funding under YEI
strong outreach efforts through the PES and partnership approach and diversi-
fied offers with a stronger focus on education offers (BE MT LT LU PL SI)
The challenge for most Member States in this cluster was the high proportion of youth in
unemployment rather than a structural NEET challenge as most of their NEETs are
short term unemployed rather than discouraged NEETs or inactive for other reasons
Most of the countries in cluster D have medium-level estimated costs of fully implement-
ing the YG Consequently most of these Member States did not receive particularly large
amounts of funding from the EU (except Lithuania and Poland) At the same time these
are mainly Member States that put the most weight on building partnerships involving
social partners and youth organisations as well as outreach efforts including through the
PES Many of the Member States in this cluster followed the Recommendation quite
closely in terms of the time-frame for the YG but they did not establish strong monitor-
ing systems and they did not carry out many youth-related reforms in recent years
relative to other Member States In terms of the offer distribution these countries gen-
erally showed diversified offers with the strongest focus on education measures shown
by the largest share of timely exits from the YG into education and the lowest focus on
employment offers This is despite the fact that on average clusters B C and D had
very similar shares of low and medium educated NEETs at the onset of the YG suggest-
ing a very different policy response
Cluster E Member States that joined the EU relatively recently with lsquotransi-
tionalrsquo STW regimes high initial NEET rates structural challenges and substan-
tial EU funding focus on employment offers rather high reform efforts (BG HR
LV SK)
This cluster consists entirely of countries that joined the EU relatively recently compared
to the other Member States They are countries with a lsquotransitionalrsquo STW regime and
without prior experience in YG-type of frameworks before the Recommendation While
these countries have the lowest rate of early school-leavers and a substantially lower
share of low educated individuals among the NEETs compared to the other clusters this
cluster has the second largest share of NEETs with family responsibilities and the largest
share of discouraged youth This suggests that they struggled with more significant
structural NEET challenges compared to the other clusters The high NEET rates resulted
in high estimated costs for implementing the YG and consequently these Member States
also received substantial funding from the EU
The Youth Guarantee in light of changes in the world of work Youth Guarantee Intervention Models Sustainability and Relevance
41
Moreover these Member States also put in place a significant number of youth-related
ALMP reforms between 2013 and 2016 only outpaced by cluster C In terms of design
and implementation all of these countries chose to target youth under 30 and most put
particular emphasis on long-term unemployed individuals The degree of outreach efforts
through the PES is of average magnitude but the involvement of social partners and
youth organisations is highest among countries in this cluster This may indicate a cer-
tain degree of mismatch regarding outreach activities and the efforts likely to be re-
quired to activate the substantial share of discouraged NEETs in the youth population
However this cluster is the only in which all the Member States have YG-specific staff at
the PES and where all of them increased PES staff in recent years Due to the relatively
well-qualified nature of the NEET population Member States in this cluster concentrated
mostly on employment-type offers
34 Conclusion of second-step clusters
Breaking down the differences between clusters in a simple way is evidently challenging
due to the many aspects considered and highlighted in the cluster-specific characterisa-
tions This section therefore only provides a short conclusion to the findings in the final
cluster analysis indicating several sorts of Youth Guarantee models in place in the Euro-
pean Union It shows three clusters with comparatively low initial NEET rates at the out-
set of the YG Cluster A Cluster B and Cluster D What distinguishes these clusters from
one another among other issues is that Member States in Cluster A already had a long-
er experience of YG-related schemes they observed fewer youth-related challenges and
hence they received less additional funds from the EU
In contrast to this most Member States with the most pressing NEET challenges in 2012
are found in the other two clusters Cluster C and Cluster E include Member States with
particular NEET challenges mostly related to the financial crisis and recession for coun-
tries in Cluster C Member States in Cluster E also had a particular structural NEET chal-
lenge partially stemming from the transitional STW regime and they all received signifi-
cant funding from the EU
35 Measures of performance
Before investigating the correlation between the types of European YG models identified
and the performance of the YG implementation the analysis needs to define the relevant
outcome measures employed for this last step of the empirical analysis The correlation
analysis will make substantive use of information from the YG monitoring data The most
recent data available at the time of writing are from 2016 and they include information
on the main dimensions of the Recommendation
i ldquoCoveragerdquo rate provides an estimation of the degree to which the NEET popula-
tion was reached by the YG (the estimated proportion of the NEET population
aged 15-24 that was enrolled in the YG scheme at any point during the reference
year)28
28 These figures are based on the indicator average annual stock of young people in the YG pre-
paratory phase NEET population (annual average) included in the Indicator Framework for Moni-
toring the Youth Guarantee This indicator combines administrative and survey data Whilst this is not ideal the indicator is useful to give an approximate indication of the proportion of NEETs regis-tered in the YG scheme at any point during the year Results should therefore be interpreted as an estimation rather than a definitive measurement of the extent to which YG schemes achieve the objective of reaching all young people that become or are already NEET
The Youth Guarantee in light of changes in the world of work Youth Guarantee Intervention Models Sustainability and Relevance
42
ii The share beyond the four-month target the share of young people in the pre-
paratory phase beyond the four-month goal measured as a percentage of the
average annual stock of participants
iii Positive and timely exits the share of positive and timely exits shows how suc-
cessful Member States were at providing offers within the envisaged four-month
preparatory phase measured in percentage of all exits
iv Positive situations after six months this measure gives the percentage of YG par-
ticipants being in a positive situation at six months after exiting the programme -
the share of individuals either in education training or employment as a percent-
age of all exits
These performance indicators provide the most comprehensive and direct evidence on
the performance of the YG However there are some data limitations regarding the de-
gree to which the entire NEET population can be identified relevant for the comparability
of the coverage rate across Member States The quality of information on positive and
timely exits as well as the share of participants in a positive situation after exiting the YG
depends on the degree to which the destination of exits is known and how well individu-
als can be followed up Again to a certain degree this limits comparability across coun-
tries The distribution of these indicators across Member States is depicted in Figure 6 For the interested reader a separate cluster analysis solely based on the measures of YG
performance in Table 4 is included in the Annex
The Youth Guarantee in light of changes in the world of work Youth Guarantee Intervention Models Sustainability and Relevance
43
Figure 6 YG-monitoring data performance indicators by Member States 2016
Source YG monitoring data
0
10
20
30
40
50
60
70
80
90
100M
T
HU
UK
BG IT RO CY LV LU EE ES LT IE EL SE SK NL
CZ
HR PL
DK PT SI DE
FR BE FI AT
Coverage rate Share beyond the 4 month target
0
10
20
30
40
50
60
70
80
90
100
CY UK RO FR EL SI HR SK IE BG PT NL LV SE ES LU LT BE PL FI AT EE DE CZ IT DK HU MT
Positive and timely exits Positive situations after 6 months
The Youth Guarantee in light of changes in the world of work Youth Guarantee Intervention Models Sustainability and Relevance
44
To account for measuring issues in the monitoring data and because the main goal of
the YG was to lower youth unemployment and the prevalence of NEETs in general the
reduction from 2012 to 2017 in NEET rates and youth unemployment rates based on
Eurostat indicators is used as additional outcome measures
v Youth unemployment this measure gives the percentage of the 15-24 year old
young people in the labour force that are unemployed
vi NEET rates the NEET rate indicator is defined as the share of the youth popula-
tion (active or inactive) aged 15-24 that is not in employment education or
training
The distribution of these indicators is shown in Figure 7
Figure 7 Eurostat performance indicators by Member States 2012-2017
Source Eurostat (une_rt_a lfsi_neet_a)
36 Assessing the correlation between Youth Guarantee models
and performance
The goal of this section is to compare the performance of the YG as implemented in each
Member State across the clusters identified in section 34 and then to assess emerging
patterns This will be done by using box plots shown for each of the performance indica-
tors separately Box plots allow the comparison of the distribution of indicators across
clusters The median ie the observation in the middle in terms of outcomes (for in-
stance the middle value of all coverage rates within a cluster Figure 8 upper left panel)
is shown by the horizontal lines within each box Furthermore the size of the box shows
the location of the 50 closest observations to the median Observations outside this
box are shown in the graph by the so-called lsquowhiskersrsquo Extreme values that are far away
from the box are displayed as dots Figure 8 shows the distribution of performance
measures for the YG monitoring data
-5
0
5
10
15
20
FI AT
BE IT DE
FR LU NL
CY
DK
MT
RO SE EE UK SI LV CZ EL PL LT PT ES HR SK BG IE
HU
Reduction in youth unemployment Reduction in NEET rates
The Youth Guarantee in light of changes in the world of work Youth Guarantee Intervention Models Sustainability and Relevance
45
Figure 8 YG monitoring data performance indicators by clusters
Source Own analysis
The graph for the coverage rate (upper left panel) shows that clusters A and D have the
highest median coverage rates among the five clusters This appears quite natural as
these countries have had the lowest NEET rates at the onset of the YG making it easier
to cover a large portion of vulnerable youth compared to other countries Clusters B C
and E perform relatively similarly in terms of coverage with median values in the range
of 20 to 40 coverage rate despite the fact that clusters C and E had considerably larg-
er NEET rates when the YG was first introduced Among other factors these two clusters
have in common is that they received substantial funds from the EU to support YG
measures and that countries from both clusters enacted a significant number of youth-
related ALMP reforms
The upper right panel displays results for the share of participants still being in the pre-
paratory phase beyond the envisaged four months in each of the clusters A B D and E
this share is in the range of 45 to 50 in terms of the median values in cluster C this
value is 60 Clusters B and D show considerably more variation than the other clus-
ters The figure indicates therefore that the countries in cluster C appear to have put in
comparatively lower effort to upscaling their PES to provide YG services in time reflected
in the fact that these countries have the highest share of individuals in the preparatory
phase beyond the four month target
With respect to positive and timely exits (bottom left panel) there is no pronounced vari-
ation in terms of median outcomes across the clusters All of the clusters have positive
and timely exit rates of around 40 or slightly higher Finally looking at the share of
positive situations for YG participants after 6 months of leaving the programme (bottom
right panel) one can see that the median outcomes are quite similar for all clusters ex-
cept cluster B which has substantially lower positive outcomes after 6 months In addi-
tion there appear to be substantial differences in the within-cluster variation of this out-
The Youth Guarantee in light of changes in the world of work Youth Guarantee Intervention Models Sustainability and Relevance
46
come however this finding is probably due to the lack of data since for some Member
States these figures are not available (and coded as zero in the monitoring data) A simi-
lar reasoning can be used to explain the large variation between clusters A and D
Figure 9 Aggregate performance measures
Source Own analysis
Figure 9 investigates the reductions in youth unemployment rates and NEET rates from
2012 to 2017 respectively Both graphs display a similar pattern although the reduction
in youth unemployment is generally larger implying that a larger reduction was
achieved among those youth closer to the labour market Focusing on the cluster medi-
ans the figure indicates that cluster A ndash the cluster with the lowest initial NEET and un-
employment rates ndash shows the smallest decline Clusters B C and D show relatively
similar reductions in youth unemployment cluster E being at the top of the distribution
The picture is slightly different when looking at the reduction of NEET rates Here cluster
C has the largest median reduction in NEETs and clusters B D and E display similar per-
formance despite differences in variability Thus cluster E ndash the cluster with a combina-
tion of high initial NEET rates and more structural issues (such as a high share of dis-
couraged NEETs) ndash was more successful in reducing youth unemployment while clus-
ter C (with similarly high NEET rates for 2012 but lower educated NEETs and the highest
apprenticeship take-up rate in terms of timely exits among all clusters) was more suc-
cessful in reducing its NEET rates
4 Summary and conclusions
This report provides an updated overview of the implementation of the YG across EU
Member States based on the recent literature and data on the YG and European labour
markets On this basis six aspects of the Youth Guarantee implementation are dis-
cussed (1) financial resources for implementing the YG (2) the YG as part of national
policy making (3) youth labour market challenges (4) the heterogeneity of the NEET
population (5) the design and implementation features of the YG and (6) the role of the
apprenticeship system in the YG
The overall findings of the desk research and data analysis can be summarised as fol-
lows EU funding initiatives via the Youth Employment Initiative (YEI) and the European
Structural Fund (ESF) played a key role in supporting YG measures financially especially
for those countries suffering from high NEET rates and a significant economic downturn
or structural challenges Many of these countries increased spending on active labour
market policy which may be cautiously interpreted as an indirect effect of the YG In
some Member States the YG also fostered introduction of reforms of national youth poli-
The Youth Guarantee in light of changes in the world of work Youth Guarantee Intervention Models Sustainability and Relevance
47
cies improvements in monitoring systems for activation policies among young people
and the building of partnerships These changes are likely to outlast the YG initiative and
therefore provide sustained and ongoing benefits
Whereas these are substantive positive changes brought about by the YG not all of its
objectives were achieved First neither reducing labour market segmentation through
quality offers nor providing a remedy for imperfectly performing education systems was
fully achieved One reason was a prevalence of employment offers compared to relative-
ly few education or apprenticeship offers The low share of apprenticeship offers in some
Member States appears to be related to the existing institutional setup and STW transi-
tion regime increasing the prominence of the apprenticeship system would need to be
accompanied by broader institutional change Second several Member States were not
able to fully address the heterogeneity of the NEET population ndash especially those furthest
away from the labour market In contrast countries that performed well generally im-
proved the capacity of their Public Employment Services (PES) and developed partner-
ships to implement strong outreach programmes
Based on desk research of the six key aspects that are likely to influence the perfor-
mance of the YG as delivered by Member States a set of empirical indicators was de-
fined to measure the components of these six aspects using available quantitative and
qualitative data These empirical indicators feed into the main part of the analysis that
identifies the YG typology in terms of the key aspects specifically this approach groups
together Member States that share similar outputs across all the features included in the
analysis In practice the typology is derived from a two-step cluster analysis using an
agglomerative clustering algorithm
The first step of the typology discusses the similarity between Member States regarding
implementation-related and contextual features within six pre-defined sets of indicators
each corresponding to one of the six key aspects of the YG The cluster analysis gener-
ates different group compositions regarding Member States for each of the sets of empir-
ical indicators defined so a low-dimensional analysis is only partially informative This
result indicates that many aspects of the YG ndash and their interrelation ndash need to be con-
sidered in a comprehensive typology The second-step cluster analysis therefore simul-
taneously takes into account all of the 76 empirical indicators and identifies five final
clusters
Cluster A Member States with previous YG experience lower initial NEET rates ambi-
tious implementation and improved PES capacity low educated NEETs and diversified
offers (AT DK DE FI IE NL SE)
Cluster B Member States with intermediate NEET challenges strong outreach efforts by
the PES relatively poor monitoring data quality high NEET rates due to family responsi-
bilities and strong focus on employment offers (CZ EE FR HU RO UK)
Cluster C Member States hit by the economic recession with highest initial NEET rates
severe long-term unemployment large support via EU funding highest reform efforts
and highest entry rates into apprenticeship offers (CY EL ES IT PT)
Cluster D Member States characterised by relatively low initial NEET rates and short-
term unemployed rather than inactive NEETs some funding under YEI strong outreach
efforts through the PES and partnership approach and diversified offers with a stronger
focus on education offers (BE MT LT LU PL SI)
Cluster E Member States that joined the EU relatively recently with lsquotransitionalrsquo STW
regimes high initial NEET rates structural challenges and substantial EU funding focus
on employment offers rather high reform efforts (BG HR LV SK)
The Youth Guarantee in light of changes in the world of work Youth Guarantee Intervention Models Sustainability and Relevance
48
Obviously these explicit labels for the clusters tend to simplify the other factors of het-
erogeneity across Member States that determine the typology However some conclu-
sions can be drawn regarding the fit of underlying challenges to be addressed with the
policy response observed In particular it appears that countries in Cluster A C and D
reflected the challenges observed in the design and implementation of the YG to a higher
degree compared to cluster B and E as policies implemented ndash for example regarding
outreach efforts the extent of partnerships and the offer mix introduced ndash seem to bet-
ter match key factors of heterogeneity in the NEET population
Based on these insights the analysis continues with a correlation analysis relating the
identified YG models to basic performance indicators The findings highlight that there is
no evident pattern regarding the clustersrsquo performance in general Cluster A performs
well in terms of the NEET ldquocoveragerdquo rate but less well regarding the reduction in NEET
and unemployment rates over time Clusters B and D perform relatively similar across all
outcome measures although there is some variation that probably stems from meas-
urement issues in the monitoring data Cluster C shows the largest share of youth in the
preparatory phase beyond the envisaged four months but also the largest median de-
cline in NEET rates Cluster E has the lowest share of positive and timely exits but the
largest decline in youth unemployment out of all clusters
While the evidence is thus far from conclusive partly due to the number and complex
inter-relation of the aspects in which clusters differ the reportrsquos findings nonetheless
indicate that not only initial conditions but also the way Member States implement the
YG has affected its success
The Youth Guarantee in light of changes in the world of work Youth Guarantee Intervention Models Sustainability and Relevance
49
References
Andor L and Veselyacute L (2018) The EUrsquos Youth Guarantee a broadly accepted reform in
need of full implementation OSE paper series No 19
ANPAL (2017) Rapporto sullrsquoattuazione della Garanzia Giovani in Italia Rapporto
trimestrale n 4 Roma
ANPAL (2018) Monitoraggio sulla struttura e il funzionamento dei servizi per il lavoro
2017 Roma
Council of the European Union (2013) Council Recommendation of 22 April 2013 on es-
tablishing a Youth Guarantee Official Journal of the European Union Brussels
Department of Education and Skills (2016) Evaluation of the operation of the Youth Em-
ployment Initiative (YEI) element of the European Social Fund (ESF) Programme for Em-
ployability Inclusion and Learning (PEIL) 2014-2020
Department of Social Protection (DSP) (2014a) Pathways to Work - The Implementation
of the EU Council Recommendation for a Youth Guarantee
Department of Social Protection (DSP) (2016a) Member Statesrsquo response to 2013 Coun-
cil Recommendation on establishing a Youth Guarantee [Ireland]
Dheacuteret C and Roden J (2016) Towards a Europeanisation of Youth Employment Poli-
cies ndash A Comparative Analysis of Regional Youth Guarantee Policy Designs EPC Issue
Paper Ndeg81
Dheacuteret C and Morosi M (2015) lsquoOne Year After the Youth Guarantee Policy Fatigue or
Signs of Actionrsquo EPC Policy Brief Brussels European Policy Centre (EPC)
Doherty R (2018) lsquoWritten answer ndash Youth Guaranteersquo Daacuteil Eacuteireann Debate 22 March
2018
Eichhorst W Hinte H and Rinne U (2013) Youth Unemployment in Europe What to
Do about It IZA Policy Paper No 65 July httpftpizaorgpp65pdf
Employment Committee (EMCO) (2017) Ireland - 2017 EMCO Review on the Youth
Guarantee ndash Self-Assessment Questionnaire
Escudero V and E Loacutepez Mourelo (2017) The European Youth Guarantee A systematic
review of its implementation across countries Research Department Working Paper No
21 ILO Geneva
Eurofound (2013a) Young People and Temporary Employment in Europe Publications
Office of the European Union Luxembourg
Eurofound (2013b) Working Conditions of Young Entrants to the Labour Market Publica-
tions Office of the European Union Luxembourg
Eurofound (2014) Mapping Youth Transitions in Europe 2372014 Publications Office
of the European Union Luxembourg
Eurofound (2015a) Beyond the Youth Guarantee - Lessons Learned in the First Year of
Implementation Background Document prepared by Eurofound as a contribution to the
informal EPSCO meeting of 16-17 July 2015 Publications Office of the European Union
Luxembourg
Eurofound (2015b) Social Inclusion of Young People Publications Office of the European
Union Luxembourg
Eurofound (2016) Exploring the diversity of NEETs Publications Office of the European
Union Luxembourg
Eurofound (2017) Long-term unemployed youth Characteristics and policy responses
Publications Office of the European Union Luxembourg
The Youth Guarantee in light of changes in the world of work Youth Guarantee Intervention Models Sustainability and Relevance
50
European Alliance for Apprenticeship (2013) ldquoDeclaration of the European Social Part-
ners the European Commission and the Lithuanian Presidency of the Council of the Eu-
ropean Unionrdquo Brussels
European Commission (2011) Youth Opportunities Initiative ndash Communication From The
Commission To The European Parliament The Council The European Economic And So-
cial Committee And The Committee Of The Regions Brussels
European Commission (2013) Guidebook for Policy Planners and Practitioners on Ap-
prenticeship and Traineeship Schemes in EU27 December
European Commission (2016a) The Youth Guarantee and Youth Employment Initiative
three years on European Commission Directorate-General for Employment Social Af-
fairs and Inclusion Brussels
European Commission (2016b) Staff working documents 1 on ldquoThe Youth Guarantee
and Youth Employment Initiative three years onrdquo European Commission Directorate-
General for Employment Social Affairs and Inclusion Brussels
European Commission (2016c) Member Statesrsquo response to 2013 Council Recommenda-
tion on establishing a Youth Guarantee survey results unpublished
European Commission (2016d) Youth Guarantee Country by Country March 2016
European Commission (2017a) Report on PES Implementation of the Youth Guarantee
European Commission Directorate-General for Employment Social Affairs and Inclusion
Publications Office of the European Union Luxembourg
European Commission (2017b) Assessment Report on PES Capacity European Commis-
sion and Directorate-General for Employment Social Affairs and Inclusion Publications
Office of the European Union Luxembourg
European Commission (2017c) Education amp Training Monitor 2017 Comparative Report
European Commission (2017d) JobsPlus Youth
European Commission (2017e) Youth Guarantee Country by Country March 2017
European Commission (2017f) Draft Joint Employment Report from the Commission and
the Council accompanying the Communication from the Commission on the Annual
Growth Survey 2018 COM (2017) 674 final Brussels
European Commission (2017g) Employment and Social Developments in Europe 2017
European Commission (2017h) European Semester Thematic Factsheet ndash Employment
Protection Legislation
European Commission (2018a) The Youth Guarantee Country by Country Brussels
European Commission (2018b) Data collection for monitoring of Youth Guarantee
schemes Employment Social Affairs amp Inclusion
European Commission (2018c) Continued Education Offers in the Youth Guarantee -
Experience from the ground
European Commission (2018d) Traineeship offers under the Youth Guarantee
European Commission (2018e) Activation measures for young people in vulnerable situ-
ations - Experience from the ground
European Commission (2018f) Effective outreach to NEETs - Experience from the
ground
European Commission (2018g) Youth Guarantee amp Youth Employment Initiative Fact-
sheet 2762018
European Commission (2018h) Employment and entrepreneurship under the Youth
Guarantee ndash Experiences from the ground
The Youth Guarantee in light of changes in the world of work Youth Guarantee Intervention Models Sustainability and Relevance
51
European Commission (2018i) Employment and Social Developments in Europe 2018
European Commission (2018j) data on national commitments regarding the European
Alliance for Apprenticeships httpeceuropaeusocialmainjspcatId=1148amplangId=en
European Commission (2018k) ESF and YEI financial data by end 2017 submitted
through SFC2014 by Member States ndash Note EU amounts have been calculated on the
basis of the applicable co-financing rates
European Commission (2018l) Continued Education Offers under the Youth Guarantee ndash
Experience from the ground Brussels
European Court of Auditors (2017) Youth unemployment ndash have EU policies made a dif-
ference An assessment of the Youth Guarantee and the Youth Employment Initiative
Publications Office of the European Union Luxembourg
European Employment Policy Observatory (EEPO) (2015) EEPO Country Reports ndash Ire-
land Implementation of the 2013 Recommendation on establishing a Youth Guarantee
European Parliament (2015) Differential Treatment of Workers under 25 with a view to
their Access to the Labour Market Directorate General for Internal Policies Policy De-
partment A Economic and Scientific Policy
European Parliament (2017a) Workshop Summary Report Youth Guarantee and Youth
Employment Initiative Lessons from implementation Policy Department A Economy
and Scientific Policy European Parliament Brussels
European Parliament (2017b) Youth Employment Initiative Lessons from implementa-
tion Policy Department A Economy and Scientific Policy European Parliament Brussels
European Parliament (2017c) Youth Guarantee Lessons from implementation Policy
Department A Economy and Scientific Policy European Parliament Brussels
European Parliament (2018) Ensuring high-quality job creation from EU funding pro-
grammes How can the best practice of Horizon 2020 be better integrated into other
programmes (ESF Youth Guarantee Globalisation Fund) Policy Department for Budget-
ary Affairs Directorate General for Internal Policies of the Union
European Trade Union Confederation (2018) Boosting Unionsrsquo Participation to Guarantee
Quality Transitions and Employment to Young People in Europe
European Youth Forum (2017) Excluding youth a threat to our future
European Youth Forum (2018) Updated position on the Implementation of the Youth
Guarantee Brussels Belgium
Eurostat (2015) Being Young in Europe Today
Eurostat (2018) How common is temporary employment in your country
Ghirelli C E Havari G Santangelo and M Scettri (2019) ldquoDoes on-the-job Training
Help Graduates Find a Job Evidence from an Italian Regionrdquo forthcoming in the Inter-
national Journal of Manpower 40(1)
Gower J C (1971) A general coefficient of similarity and some of its properties in
Biometrics Vol 27 Nr 4 S 857ndash872
Gregg P and Tominey E (2005) The wage scar from male youth unemployment La-
bour Economics 12 487ndash509
Indecon (2016) Indecon Evaluation of JobBridge Activation Programme Report pre-
pared by Indecon International Research Economists and submitted to the Department
of Social Protection
International Labour Organisation and European Commission (2017) National Outreach
Strategy for non-registered young unemployed and inactive young people in Portugal
The Youth Guarantee in light of changes in the world of work Youth Guarantee Intervention Models Sustainability and Relevance
52
Leigh-Doyle S (2014) Can subsidised employment and work-first measures assist the
labour market integration of low-skilled unemployed youth Peer Country Comments
paper ndash Ireland EU Peer Review on lsquoEmplois drsquoavenirrsquo ndash Jobs with a futurersquo Scheme Par-
is (France) 10-11 February 2014
Milligan G W and Cooper M C (1985) An examination of procedures for determining
the number of clusters in a dataset Psychometrika 50 159-179
OrsquoReilly J Eichhorst W Gaacutebos A Hadjivassiliou K Lain D Leschke J McGuin-
ness S Kurekovaacute L M Nazio T Ortlieb R Russell H and Villa P (2015) lsquoFive
Characteristics of Youth Unemployment in Europe Flexibility Education Migration
Family Legacies and EU Policyrsquo SAGE Open January-March 2015 1ndash19
Pastore F (2018) Why is youth unemployment so high and different across countries
IZA World of Labor 2018 420 doi 1015185izawol420
Pastore F (2015) The Youth Experience Gap Explaining National Differences in the
School-to-Work Transition Heidelberg Springer International Publishing AG 2015
Pohl A and Walther A (2005) Tackling Disadvantage in Youth Transitions - A Themat-
ic Study on Policy Measures Concerning Disadvantaged Youth Report funded by the EU
Action Programme to combat Social Exclusion October
Pohl A and Walther A (2007) Activating the Disadvantaged ndash Variations in Address-
ing Youth Transitions across Europe International Journal of Lifelong Education 265
pp533-553
Quintini G and Martin S (2014) lsquoSame Same but Different School-to-Work Transi-
tions in Emerging and Advanced Economiesrsquo OECD Social Employment and Migration
Working Papers No 154 OECD Publishing
Quintini Glenda and Martin John P and Martin Seacutebastien (2007) The Changing Nature
of the School-to-Work Transition Process in OECD Countries WDA-HSG Discussion Paper
No 2007-2
Scarpetta S A Sonnet and Manfredi T (2010) lsquoRising Youth Unemployment During
The Crisis How to Prevent Negative Long-term Consequences on a Generationrsquo OECD
Social Employment and Migration Working Papers No 106
Stokes D (2016) Opening gateways to work for youth But can success be guaran-
teed Peer Country Comments Paper ndash Ireland EU Peer Review on The Guarantee for
Youth (a particular measure within the broader context of the Youth Guarantee) Paris
(France) 7-8 April 2016
Tosun J Unt M and Wadensjouml E (2017) Youth‐oriented Active Labour Market Poli-
cies Explaining Policy Effort in the Nordic and the Baltic States Social Policy amp Admin-
istration 51 598ndash616
Treadwell Shine K (2016) lsquoYouth Guarantee in Irelandrsquo Department of Social Protec-
tion presentation Youth Opportunities at EU Level Cork
Walther A (2006) Regimes of Youth Transitions Choice Flexibility and Security in
Young Peoples Experiences across different European Contexts Young Vol 14 No 2
pp119ndash139
Ward J H Jr (1963) Hierarchical Grouping to Optimize an Objective Function Journal
of the American Statistical Association 58 236ndash244
The Youth Guarantee in light of changes in the world of work Youth Guarantee Intervention Models Sustainability and Relevance
53
Annex
Table 3 List of indicators
Indicator name and time of measurement
Source Explanation
Financial resources for implementing the Youth Guarantee
Initial YEI allocation (2014-2017)
EC (2016b) Euros-tat (nama_10_gdp)
YEI allocation in of GDP
YEI+ESF EU eligible cost
(2017)
EC (2018k) Euros-
tat (nama_10_gdp) YEI+ESF eligible cost in of GDP
Other ESF eligible cost (2017)
EC (2018k) Euros-tat (nama_10_gdp)
Other ESF eligible cost in of GDP
Share of declared YEI+ESF funds (2017)
EC (2018k) Declared YEI+ESF funds as a share of eligible cost
Estimated cost of the YG (2015)
Eurofound (2015)
Binary indicator for medium cost (03-06 of
GDP) reference category low cost
Binary indicator for high cost (gt06 of GDP) reference category low cost
Change in ALMP expenditure (2012 to 2015)
Eurostat (lmp_expsumm)
Difference in ALMP expenditure in of GDP
YG as part of national policy-making
Number of youth-related ALMP reforms (2013-2016)
LABREF database Absolute number of reforms
Number of additional measures beyond Recom-mendation implemented in the context of the YG (2016)
EC (2016c)
Sum of binary indicators for additional measures regarding school dropout social and welfare policies volunteering social economy and oth-er
Share of YG exits with un-known destination (2016)
EC (2018b)
Binary indicator for an unknown share of 10-30 reference category 0-10
Binary indicator for an unknown share of more than 30 reference category 0-10
Share of unknown situations in the six month follow up
(2016)
EC (2018b)
Binary indicator for an unknown share of 40-99 reference category 0-39
Binary indicator for an unknown share of 100 reference category 0-39
Involvement of social part-ners (2016)
EC (2016c) Sum of binary indicators for the involvement of social partners in design implementation and evaluationmonitoring
Involvement of youth organi-sations (2016)
EC (2016c) Sum of binary indicators for the involvement of social partners in design implementation and
evaluationmonitoring
PES involvement of youth in design of YG (2017)
EC (2017a) Binary indicator
PES involvement of youth organisations in design of YG (2017)
EC (2017a) Binary indicator
Partnerships formed by PES (2017)
EC (2017a)
Sum of binary indicators for PES partnerships aimed at increasing information availability increasing workeducation opportunities and easing the transition into employment from educationunemployment
The Youth Guarantee in light of changes in the world of work Youth Guarantee Intervention Models Sustainability and Relevance
54
Indicator name and time of measurement
Source Explanation
Youth labour market challenges
Youth share of total popula-tion (2012)
Eurostat (lfsa_pgaed)
Number of youth (15-24) expressed as of total population
Youth-to-adult unemploy-ment ratio (2012)
Eurostat (une_rt_a) Youth (15-24) unemployment rate divided by adult unemployment rate (25-74)
NEET rate among 15-29 year
olds (2012)
Eurostat
(edat_lfse_21)
Total number of NEETs aged between 15 and 29
in of total youth population
Difference in temporary em-ployment shares (2012)
Eurostat (lfsi_pt_a) Difference in temporary employment rates be-tween youth (15-24) and adults (25-54)
Share of early school-leavers (2012)
Eurostat (edat_lfse_14)
Share of early school-leavers as of youth population (18-24)
Share of low-educated NEETs
(2012) Eurostat (edat_lfse_21)
Number of NEETs with low education back-
ground divided by total number of NEETs (15-24)
Share of medium-educated NEETs (2012)
Number of NEETs with medium education back-ground divided by total number of NEETs (15-24)
Share of employment offers (2016)
European Commis-sion (2018b)
Number of employment offers as of total offers typically made to participants
Share of timely exits into employment (2016)
European Commis-sion (2018b)
Number of exits into employment as of total timely exits from the YG
Share of education offers (2016)
European Commis-sion (2018b)
Number of education offers ias of total offers typically made to participants
Share of timely exits into education (2016)
European Commis-sion (2018b)
Number of exits into education as of total timely exits from the YG
The heterogeneity of the NEET population
Share of re-entrants among NEET (2013)
Eurofound (2016) Number of individuals in the respective group in of total NEET population
Share of short-term unem-ployed among NEET (2013)
Share of long-term unem-ployed among NEET (2013)
Share of individuals with illnessesdisabilities among NEET (2013)
Share of individuals with family responsibilities among NEET (2013)
Share of discouraged workers among NEET (2013)
PES responsibility regarding paying of unemployment benefits (2017)
European Commis-sion (2017b)
Binary indicator for the PES responsibility
PES responsibility regarding administering unemployment benefits (2017)
PES responsibility regarding other types of benefits
(2017)
The Youth Guarantee in light of changes in the world of work Youth Guarantee Intervention Models Sustainability and Relevance
55
Indicator name and time of measurement
Source Explanation
Number of responsibilities of the PES within the YG (2017)
European Commis-sion (2017a)
Sum of binary indicators for the PES being re-sponsible for managing the YG scheme regis-tering unemployed youth providing (placement) services to youth coordinating partners out-reach to NEETs follow-up of participants and design and maintenance of the monitoring scheme
PES outreach activities
(2017)
European Commis-
sion (2017a)
Binary indicator for the PES having awareness raising initiatives
Binary indicator for the PES having outreach programmes for pro-active work with schools
Binary indicator for the PES to cooperate with NGOs and youth organisations for outreach
Binary indicator for the PES to have specific outreach caseworkers
Binary indicator for the PES to have new points of entry (via new media)
Binary indicator for the PES to provide single-point servicesone-stop shops
Binary indicator for the PES to have mobile PES initiatives
Binary indicator for the PES to have follow-up programmes to reach out to YG drop-outs
PES programme for prevent-ing high school dropout (2017)
European Commis-sion (2017a)
Binary indicator
Design and implementation features of the Youth Guarantee
Eligible age group (2016) European Commis-sion (2016c)
Binary indicator for YG eligible age group being under 25 year and recent graduates reference category under 25
Binary indicator for YG eligible age group being under 26 reference category under 25
Binary indicator for YG eligible age group being
under 27 reference category under 25
Binary indicator for YG eligible age group being under 30 reference category under 25
Envisaged time-frame of intervention (2016)
European Commis-sion (2016c)
Binary indicator for the target time frame being below 4 months reference category 4 months
Binary indicator for the target time frame being above 4 months reference category 4 months
YG scheme specifically tar-geting long-term unemployed (2016)
Escudero and Mourelo (2017)
Binary indicator
Main YG provider (2016) European Commis-sion (2016c)
Binary indicator for the YG to be provided main-ly by the PES and other institutions reference category only PES
Binary indicator for the YG to be provided main-
ly by other institutions reference category only PES
The Youth Guarantee in light of changes in the world of work Youth Guarantee Intervention Models Sustainability and Relevance
56
Indicator name and time of measurement
Source Explanation
Degree to which online regis-
tration for the YG is possible (2016)
European Commis-sion (2016c)
Binary indicator for online registration being partly possible reference category not at all
Binary indicator for online registration being
possible everywhere reference category not at all
Legal entitlement to offer (2016)
European Commis-sion (2016c)
Binary indicator for whether there exists an entitlement for young people to receive an offer in line with or similar to the Youth Guarantee
Previous experience with a
YG-type of framework (2014)
European Commis-
sion (2016c)
Binary indicator for having recent experience with a YG-type of framework reference catego-ry none
Binary indicator for having longer experience with a YG-type of framework reference catego-ry none
Formal definition of quality
offer (2016)
European Commis-
sion (2016c)
Binary indicator having formally defined offer
quality
National quality guidelines (2017)
European Commis-sion (2017a)
Binary indicator having national quality guide-lines from the national administration to all PES officesother organisations involved in the YG
PES has YG-specific staff (2017)
European Commis-sion (2017a)
Binary indicator for having YG-specific staff
PES training (2017) European Commis-sion (2017a)
Binary indicator for the PES providing training specifically tailored working with youth
PES staff increase (2014-2017)
European Commis-sion (2017a)
Binary indicator for the PES having in-creasedunchanged staff from 2014-2017
PES has youth-specific tar-
gets (2017)
European Commis-
sion (2017a)
Binary indicator for the PES having youth-
specific targets
The role of the apprenticeship system in the YG
Share of firms with IVET participants (2010)
Eurostat (trng_cvt_34s)
Share of firms hiring initial vocational training participants expressed as a of all firms
Share of apprenticeship of-fers (2016)
European Commis-sion (2018b)
Number of offers of apprenticeships as of total offers typically made to participants
Share of timely exits into apprenticeships (2016)
European Commis-sion (2018b)
Number of exits into apprenticeships as of total timely exits from the YG
School-to-work transition cluster (2005)
PohlWalther (2005)
Binary indicator for STW being of type transi-tionalpost-socialist reference category miss-ing
Binary indicator for STW being of type sub-protective reference category missing
Binary indicator for STW being of type univer-salistic reference category missing
Binary indicator for STW being of type liberal reference category missing
Binary indicator for STW being of type employ-ment-centred reference category missing
Number of EAfA pledges (2018)
European Commis-sion (2018j)
Number of pledges to increase apprenticeships by firms or organisations normalised by the share of firms hiring IVETs
The Youth Guarantee in light of changes in the world of work Youth Guarantee Intervention Models Sustainability and Relevance
57
Table 4 Outcome cluster means
Cluster A Cluster B Cluster C Cluster D
ldquoCoveragerdquo rate (in ) 488 76 479 448
Share in preparatory phase beyond four
months (in )
433 284 606 519
Share of positive and timely exits (in ) 511 740 366 372
Share with positive situation after six
months (in )
576 521 562 60
Reduction in youth unemployment (in
-points)
37 121 145 62
Reduction in NEET rates (in -points) 11 42 43 18
Note This table shows cluster means (averages) for a cluster analysis solely based on the authorsrsquo measures
of performance (see section 35 for their description) The analysis creates Cluster A (AT BE DK IT LT LU
and SE) Cluster B (BG HU and MT) Cluster C (EL ES HR IE PT and SK) and cluster D (CY CZ DE EE FI
FR LV NL PL RO SI and UK)
The Youth Guarantee in light of changes in the world of work Youth Guarantee Intervention Models Sustainability and Relevance
58
HOW TO OBTAIN EU PUBLICATIONS
Free publications
bull one copy
via EU Bookshop (httpbookshopeuropaeu)
bull more than one copy or postersmaps
from the European Unionrsquos representations (httpeceuropaeurepresent_enhtm)
from the delegations in non-EU countries
(httpeeaseuropaeudelegationsindex_enhtm)
by contacting the Europe Direct service
(httpeuropaeueuropedirectindex_enhtm) or calling 00 800 6 7 8 9 10 11 (free-
phone number from anywhere in the EU) () () The information given is free as are most calls (though some operators phone boxes or hotels may charge you)
Priced publications
bull via EU Bookshop (httpbookshopeuropaeu)
Priced subscriptions
bull via one of the sales agents of the Publications Office of the European Union
(httppublicationseuropaeuothersagentsindex_enhtm)
doi 102767371432
KE-0
1-1
9-1
28-E
N-N

The Youth Guarantee in light of changes in the world of work Youth Guarantee Intervention Models Sustainability and Relevance
5
ing that some implementation features relate to each other for instance some countries
with a low estimated cost for implementing the YG tend to be countries that closely fol-
lowed the Recommendation in particular in terms of timing of the intervention and tar-
get groups chosen Other Member States with a more pronounced NEET challenge are
more likely to deviate from the recommendation for example by increasing the targeted
time frame of intervention
The most comprehensive version of the cluster analysis simultaneously takes into ac-
count all six key aspects and a total of 76 empirical indicators that properly reflect these
key aspects and identifies five final clusters
Cluster A Member States with previous YG experience lower initial NEET rates ambi-
tious implementation and improved PES capacity low educated NEETs and diversified
offers (AT DK DE FI IE NL SE)
Cluster B Member States with intermediate NEET challenges strong outreach efforts by
the PES relatively poor monitoring data quality high NEET rates due to family responsi-
bilities and strong focus on employment offers (CZ EE FR HU RO UK)
Cluster C Member States hit by the economic recession with highest initial NEET rates
severe long-term unemployment large support via EU funding highest reform efforts
and highest entry rates into apprenticeship offers (CY EL ES IT PT)
Cluster D Member States characterised by relatively low initial NEET rates and short-
term unemployed rather than inactive NEETs some funding under YEI strong outreach
efforts through the PES and partnership approach and diversified offers with a stronger
focus on education offers (BE MT LT LU PL SI)
Cluster E Member States that joined the EU relatively recently with lsquotransitionalrsquo STW
regimes high initial NEET rates structural challenges and substantial EU funding focus
on employment offers rather high reform efforts (BG HR LV SK)
Evidently these explicit labels for the clusters tend to simplify the other factors of heter-
ogeneity across Member States that determine the typology However some conclusions
can be drawn regarding the fit of underlying challenges to be addressed with the policy
response observed In particular it appears that countries in Cluster A C and D reflected
the challenges observed in the design and implementation of the YG to a higher degree
compared to cluster B and E as policies implemented ndash for example regarding outreach
efforts ndash seem to better match key factors of heterogeneity in the NEET population
In a final step the study investigates the YG models resulting from the typology and
basic performance indicators Cluster A performs well in terms of the NEET ldquocoveragerdquo
rate but less well regarding the reduction in NEET and unemployment rates over time
Clusters B and D perform relatively similar across all YG outcome measures Cluster C
shows the largest share of youth in the preparatory phase beyond the envisaged four
months but also the largest median decline in NEET rates Cluster E has the lowest share
of positive and timely exits but the largest decline in youth unemployment out of all clus-
ters
Whereas therefore the evidence is not fully conclusive partly due to the number and
complex inter-relation of the aspects in which clusters differ the reportrsquos findings none-
theless clearly indicate that not only initial conditions but also the way Member States
implement the YG has affected its success
The Youth Guarantee in light of changes in the world of work Youth Guarantee Intervention Models Sustainability and Relevance
6
1 The Youth Guarantee background and outline of the
study
An essential aim of the policies that promote economic growth and social equity is to
ensure that young people are adequately educated that they enter the labour market
smoothly and that they then continue successfully through a lifetime in employment
through till retirement Young people face a wide range of structural challenges ndash fre-
quently perceived as increasingly complex ndash regarding their school-to-work (STW) tran-
sition and their long-term labour market prospects (Quintini et al 2007)
The economic recession of the late 2000s and its aftermath exacerbated these challeng-
es while the on-going Fourth Industrial Revolution comprising innovations in digitalisa-
tion artificial intelligence and robotics is constantly generating new and potentially fun-
damental challenges In general these developments have resulted in the following pat-
terns (i) a dramatic rise of youth unemployment in most countries during the recession
together with relatively low employment rates (ii) lengthier complex unstable and
non-linear STW transitions (iii) a deterioration in the quality of youth employment com-
bined with greater precariousness (iv) the patchy availability of quality work experience
which increasingly plays a crucial role in STW transitions (v) increased inactivity dis-
couragement and labour market detachment and (vi) greater labour market vulnerabil-
ity for disadvantaged youth such as the low-skilled migrants and young people with a
disability and more generally young people not in employment education or training
(NEETs)
While the wider macro-economic situation including business cycle fluctuations together
with the recession-related economic deterioration of the late 2000s and the subsequent
lsquojob-poorrsquo recovery accounts for these developments they are also rooted in persistent
structural deficiencies These include imperfectly performing education and training sys-
tems with poor outcomes and ensuing skills mismatches and segmented labour markets
(resulting in hollowing-out and skill polarisation) Sometimes poor PES (Public Employ-
ment Service) resources prevent the provision of youth-related tailored services in gen-
eral and in particular concentrating appropriate resources on vulnerable hard-to-reach
young people including certain sub-groups of NEETs (European Commission 2017a)
Yet unsatisfactory early labour market experience and lengthy unstable STW transitions
can lead to long-term lsquoscarringrsquo effects on young people in terms of reduced lifetime
earnings a higher probability of subsequent periods of unemployment a greater likeli-
hood of precarious employment and poorer health and well-being (Gregg and Tominey
2005 Scarpetta et al 2010 European Commission 2017a)
The remainder of this section describes the youth unemployment situation in the Euro-
pean Union (EU) and the challenges it poses for youth generally It also introduces the
Youth Guarantee (YG) and it summarises the joint response to these challenges under-
taken in the EU An explanation of the objectives and content of the present report as
well as the project in general concludes this section
11 The youth employment challenge in the European Union
In the second quarter of 2018 as many as approximately 34 million out of a total of
about 57 million young people in the 15-24 age group were unemployed in the EU (lat-
est available data from Eurostat) Whereas this constitutes a substantial decline from the
peak of 57 million in January 2013 the numbers still remain high the average youth
unemployment rate ndash ie the percentage of unemployment in the 15-24 age group com-
pared to the total labour force in that age group ndash stood at 168 in 2017 in the EU 28
The Youth Guarantee in light of changes in the world of work Youth Guarantee Intervention Models Sustainability and Relevance
7
and the NEET rate (the share of young people neither in employment nor in education or
training) was 109 If young people up to 29 years of age are included the average
rate of youth unemployment in the EU 28 was 127 while the NEET rate reached
134 (amounting to 177 specifically within the 25-29 age bracket) Figures 1 and 2 show the numbers for the 15-24 age group and illustrate the policy chal-
lenge of the youth unemployment rate (Figure 1) and the NEET rate (Figure 2) They
also show the substantial variation across EU countries as Figure 1 shows the youth
unemployment rate (Q2 2018) is below 10 in Austria Germany Estonia Denmark the
Netherlands the Czech Republic and Hungary In the majority of EU countries however
it ranges from 10 to 20 while it is above 30 and up to almost 40 in Italy Spain
and Greece Looking specifically at the most recent development by comparing it with
the Q2 2015 youth unemployment rate however the figure also shows a general down-
ward trend across all EU Member States which is quite pronounced in some countries
(Bulgaria Croatia Malta and Hungary for example)
Looking at the NEET rates in Figure 2 this downward trend in the most recent develop-
ment comparing 2015 and 2017 is also clearly visible Again there is notable variation
across Member States On average EU countries have a NEET rate of around 109 as
of 2017 and Ireland and Poland have NEET rates close to the EU average While the
Netherlands is the only EU country with a rate below 5 Croatia Romania Bulgaria
and Italy have the highest NEET rates with the rate reaching almost 20 in Italy
Figure 1 Youth unemployment rates (15-24 years old) in EU Member States
2015 compared to 2018
Source Authorsrsquo illustration based on latest available Eurostat data youth unemployment rate as percentage
of the active population quarterly average Countries are ordered by Q2 2015 rates Data is seasonally adjust-
ed For Italy and Cyprus the Q1 2018 rates are reported (latest available)
0
5
10
15
20
25
30
35
40
45
50
DE EE AT
DK
NL
CZ
MT LV UK LT SI LU HU IE
EU28 P
L
SE BE
RO FI BG FR SK PT
CY IT HR ES EL
2015Q2 2018Q2
The Youth Guarantee in light of changes in the world of work Youth Guarantee Intervention Models Sustainability and Relevance
8
Figure 2 Rates of young people (15-24 years old) not in employment educa-
tion or training (NEET) in EU Member States 2015 2017
Source Authorsrsquo illustration based on latest available Eurostat data annual averages Countries are in order of
the 2015 rates
In addition to these aggregate statistics the difficulties for youth in the STW transition
can be related to several structural challenges or market failures In particular these
concern (a) Labour market segmentation ndash a labour market pattern in which young
people are over-represented in temporary part-time non-permanent work (b) (under-)
performance of the education and training system ndash the low achievement of a substantial
section of youth in basic and lsquotransversalrsquo (transferable) skills (c) the limited availability
of lsquoqualityrsquo work experience and (d) insufficient capacity of the Public Employment Ser-
vice (PES) to ensure effective provision of tailored services and support for young people
(see European Commission 2017a)
12 The Youth Guarantee
The significant challenges that young people face in relation to fast smooth and effec-
tive STW transitions were exacerbated during and after the recession Since then they
have also acted as a catalyst for policy change in many Member States Accordingly a
YG was introduced following the 2013 Council Recommendation (Council of the European
Union 2013) Together with associated structural reforms of vocational education and
training (VET) and activation policies that are implemented across the EU its aim is to
address these challenges More specifically following a proposal from the European
Commission all Member States adhered to the establishment of the YG committing
themselves to giving every young person a good-quality offer of employment continuing
education or an apprenticeship or a traineeship within a period of four months of be-
coming unemployed or leaving formal education (Council of the European Union 2013)
The idea of YG style policies originated in the Nordic countries where such initiatives
were first implemented in Sweden in 1984 and then elsewhere in the 1990s (Norway in
1993 Denmark and Finland in 1996 see for example Escudero and Loacutepez Mourelo
2017)
In a Communication published three years after the launch of the YG by the European
Commission (2016a) it was observed that the YG had become a reality across the EU
Starting from January 2014 14 million young people had already registered in YG
schemes by 2016 Around nine million young people had taken up an offer the majority
0
5
10
15
20
25N
L
DK
DE
LU SE CZ
AT LT SI
MT LV FI EE PL
UK PT
HU
EU2
8 FR BE SK IE CY ES EL HR
RO
BG IT
2015 2017
The Youth Guarantee in light of changes in the world of work Youth Guarantee Intervention Models Sustainability and Relevance
9
of which were offers of employment almost two thirds of young people who left the YG
in 2015 took up an offer of employment education traineeship or apprenticeship While
the Commission Communication also concluded that the YG has significantly facilitated
structural reforms and innovation in policy design across Member States it also asserted
that nonetheless youth unemployment remained unacceptably high and many chal-
lenges still need to be addressed by Member States
13 Outline of the project and the present report
The main objective of this project is to undertake an up-to-date review of the current
approaches and implementation of the YG especially in view of new challenges for youth
in the changing world of work thereby providing the basis for a future YG model that is
both robust and dynamic
This report constitutes the first phase of the research project In the first phase a com-
prehensive desk review of existing documents and data was undertaken together with
the construction of a database of indicators for a cluster analysis as well as supplemen-
tary country case studies This approach is explained and implemented throughout this
report Aspects that guide the analysis are 1) the degree to which EU financing helped
to implement the YG 2) whether the YG became a sustainable part of national policy
making 3) the main challenges faced by young people in their transition into the labour
market 4) the heterogeneity of the NEET population 5) the design and implementation
features of the YG and 6) the role of apprenticeships in the YG Based on these insights
a typology of YG models is developed and the correlation of these types is assessed re-
garding measures of performance
The second phase of the research project will address the emerging challenges for young
peoplersquos transition into the world of work drawing extensively on consultation with
stakeholders both through an online survey and more importantly through a stakehold-
er seminar held in Brussels on Oct 1 2018 during which experiences with the YG were
exchanged and future challenges identified and discussed The results of this second
phase will be published in a separate report2 Together these two reports should inform
reflection on further developments of the YG
The report at hand is structured as follows Section 2 has two parts the first part identi-
fies the main characteristics of YG implementation in context while the second part de-
fines empirical indicators for these characteristics and their sub-dimensions In section 3
these indicators are used for constructing a typology of YG models also showing how the
different types of models differ regarding performance indicators Section 4 presents the
conclusions of the analysis
2 European Commission (forthcoming) The Youth Guarantee in light of changes in the world of work Emerging challenges related to young peoplersquos transition in the labour market
The Youth Guarantee in light of changes in the world of work Youth Guarantee Intervention Models Sustainability and Relevance
10
2 Implementation features of the YG and related indica-
tors
This section provides a comprehensive overview of the main features that characterise
YG implementation and assess the main features that are likely to determine its success
in Member States It has two steps first section 21 gives an overview of the relevant
dimensions of YG implementation along the six guiding aspects outlined above Based on
this characterisation section 22 discusses the ways in which each of these aspects can
be represented by a set of empirical indicators and which will be used in chapter 3 for a
YG typology The list of indicators for each of the six aspects comprise key contextual
characteristics for each Member State as well as implementation-related features such as
partnerships created as a result of YG implementation or the types of interventions
used In particular indicators that characterise Member States at the outset of the YG
(measured in 2012 or 2013) as well as the way the YG was implemented (mostly meas-
ured up until 2016) inform the typology Indicators of YG performance such as for ex-
ample the estimated proportion of the NEET population reached by the YG (the so-called
YG ldquocoverage raterdquo) are considered outcomes of the way Member States implemented
the YG
The presentation and discussion of intervention features and corresponding empirical
indicators in section 2 is complemented by selected information from five brief country
case studies The case studies are a supplementary element in the review exercise that
feeds into this chapter and they are meant to illustrate the intervention features dis-
cussed throughout the chapter in more detail for selected countries Based on an lsquoex
ante assessmentrsquo of a set of qualitative and quantitative country indicators the following
five countries were selected for case studies Austria Denmark Ireland Italy and Lat-
via The countries were selected firstly to cover (to the extent that is possible) the ex-
isting types of STW regimes and secondly to reflect the heterogeneity of the NEET popu-
lation NEET implementation is characterised by high and low NEET and youth unem-
ployment rates high and low YG coverage and the financial resources put into its im-
plementation3
21 Features of Youth Guarantee implementation
211 Financial resources for implementing the Youth Guarantee
The YG is not a funding programme in itself It is instead a political commitment sup-
ported among other ways by financial contributions from the EU and national budgets
as well as contributions from the private and non-profit sectors This section on the first
YG implementation aspect financial resources briefly outlines the relevance of these
different sources Specific focus will be given to the Youth Employment Initiative (YEI)
and the European Social Fund (ESF) as the main EU sources to financially underpin the
implementation of the YG
Youth Employment Initiative The YEI was established during three informal summits of
EU Heads of State in 2013-14 and then given euro32 billion for the 2014-15 period Eligi-
bility for measures funded through the YEI is confined to young people aged 16-254 who
3 It is important to emphasise the lsquoex-antersquo nature of case study selection they were chosen based on a preliminary set of indicators at the outset of the study whereas the full in-depth identi-fication and discussion of indicators ndash as presented in this chapter ndash and their analysis in Chapter 3
becomes a key element of the study itself 4 The upper age band is 29 in some Member States
The Youth Guarantee in light of changes in the world of work Youth Guarantee Intervention Models Sustainability and Relevance
11
are not in employment education or training (lsquoNEETsrsquo) Funding from the YEI was only
allocated to regions in those Member States where youth unemployment was higher than
25 in 20125 Since national allocations are based on the number of unemployed young
people in 2012 in these regions YEI funds were allocated to a varying extent to each
Member State based on their (regional) unemployment rates (European Commission
2016a) Spain was the largest recipient of the initial YEI specific allocation receiving
euro9435 million and Slovenia the smallest receiving euro92 million In 2015 in view of the
immensity of the youth-employment challenge the European Commission took steps to
ensure a quick mobilisation of its funds6 Specifically a higher pre-financing rate for the
euro32 billion YEI specific allocation in 2015 than for other ESF allocations (30 instead of
the original 1-15 of the specific allocation for other ESF funds) was introduced
This led to an amount of around euro1 billion in additional pre-financing to Member States
in 2015 (European Commission 2016a) In the summer of 2017 during the mid-term
review of the EUrsquos seven-year budget the YEI was extended until 2020 and it received
an additional financial allocation of euro12 billion In addition it was targeted at regions
where youth unemployment still exceeded 25 in 2016 (Andor and Veselyacute 2018) Ac-
cording to the Commissionrsquos report in October 2016 the YEI is seen by Member States
as a key mechanism through which to operationalise national Youth Guarantee schemes
ldquoIn some cases the YEI is being used to support most or all measures planned under the
YG schemes while in others it is one funding source amongst others Countries where
large shares of YG funding comes from the YEI include Lithuania ndash where 23 of all YG
actions are supported by the YEI Poland ndash where 34 of all YG actions YEI funded and
Spain ndash where 80 of all YG actions are funded through the YEIrdquo (European Commis-
sion 2016b p89)
YEI funds were provided from the EU budget as a top-up to the already available ESF
funds for 2014-2020 to provide additional support for programmes with a specific focus
on NEETs (European Court of Auditors 2017) However the funding allocated to each
Member State under the YEI has to be matched by an equal amount from the respective
Member State allocations in the ESF 2014-20 budget This holds for the initial allocation
in 2013 as well as the additional funds in 2017 Hence the total budget of the YEI (for
all eligible EU Member States) now totals euro88 billion for the period 2014-2020
European Social Fund In addition to ESF funds that were directly used to match the YEI
contributions (see above) some Member States also utilised additional funds from the
ESF for further employment-related programmes7 directly or indirectly benefiting youth
but with no specific focus on NEETs In contrast to YEI funds which are intended to di-
rectly support NEETs ESF funds may also be used to support structural reforms In total
Andor and Veselyacute (2018) estimate that approximately euro14-15 billion from the EU budget
over the period 2014-20 financed the implementation of the YG through the YEI and ESF
5 The exact methodology for allocating Youth Employment Initiative funds among Member States is set out in Annexe VIII to the lsquoCommon Provisions Regulationrsquo ie Regulation (EU) No 13032013 of 17 December 2013 OJ L 347 20122013 p 320ndash469
6 An additional reason was that many Member States ldquoraised the issue that they dont have the national budget necessary to pay advance funding to projects working with young peoplerdquo (source httpeuropaeurapidpress-release_MEMO-15-5020_enhtm)
7 The ESF is Europersquos main instrument for supporting jobs helping people get better jobs and en-suring fairer job opportunities for all EU citizens (European Parliament 2018)
The Youth Guarantee in light of changes in the world of work Youth Guarantee Intervention Models Sustainability and Relevance
12
funds8 This is a significant share of the total ESF funding of euro864 billion available to MS
for the 2014-2020 period (including the YEI)
Country case study Austria
Young people in Austria were already benefiting from special attention before the intro-
duction of the YG Several measures were set up to facilitate the transition from educa-
tion to the labour market in particular through a well-established apprenticeship sys-
tem Reducing the age for early school-leaving existed before the 2013 Council Recom-
mendation The long-standing existence of policy measures for young people is reflected
in Austriarsquos relatively successful performance as regards youth employment and STW
transition The labour market situation of young people in Austria is better than the EU
average and it continues to improve The rate of youth unemployment (15-24 years old)
went down from 106 in 2015 to 98 in 2017 which is significantly below the EU
average (168) This good performance is also reflected in the number of NEETs The
NEET rate in Austria was at 65 in 2017 well below the EU average (109)
In addition evidence shows that Austria is performing better than the rest of the EU as
regards its YG implementation (European Commission 2018a) It is acknowledged that
Austria has established a comprehensive Youth Guarantee based on effective partner-
ships targeted policy measures and a robust monitoring system with interconnected
administrative data (European Commission 2016a) The countryrsquos performance is par-
ticularly outstanding in two dimensions the NEET coverage and the delivery of a good
quality offer
Data for 2016 shows that an estimated 829 of NEETs in Austria are reached by the
YG which is the highest figure amongst Member States and almost double the EU aver-
age (425)9 In addition this ldquocoverage indicatorrdquo has been at consistently high levels
since the start of the YG A second more suggestive but somewhat less reliable way of
looking at the performance of a YG scheme is trying to estimate the rate of recycling
ie the percentage of NEETS entering the YG with previous YG experience10 This recy-
cling rate is rather high in Austria (739 compared to 341 for EU 28) suggesting
that employment services have little difficulty in lsquostaying in touchrsquo with young people
who already had a YG experience
The Austrian YG provides a wide range of offers (European Commission 2016d) It
comprises apprenticeship traineeship education and employment offers that are tar-
geted specifically at young people such as for example supra-company apprentice-
ships or production schools Additionally the general education training apprenticeship
and employment offers are open to young people
At the same time it is to be noted that Austria still faces difficulties in integrating cer-
tain sub-groups into the labour market in particular women migrants and young peo-
8 This figure is slightly higher than the euro127 billion stated by the Commission in its October 2016 report which YEI and the ESF are directly investing in ldquolabour market integration measures for young people in the programming period 2014-2020rdquo (European Commission 2016a p 12)
9 These figures are based on the indicator average annual stock of young people in the YG pre-paratory phase NEET population (annual average) included in the Indicator Framework for Moni-toring the Youth Guarantee This indicator combines administrative and survey data Whilst this is
not ideal the indicator is useful to give an approximate indication of the proportion of NEETs regis-tered in the YG scheme at any point during the year Results should therefore be interpreted as an estimation rather than a definitive measurement of the extent to which YG schemes achieve the objective of reaching all young people that become or are already NEET
10 The recycling rate is only experimental data and not officially part of the YG monitoring dataset
The Youth Guarantee in light of changes in the world of work Youth Guarantee Intervention Models Sustainability and Relevance
13
ple with low skills (European Commission 2018a) Ongoing efforts for these target
groups need to be intensified as recent measures have not led to sufficient results yet
Other EU sources Several other EU budget lines support employment- and education-
related programmes in Member States including the European Regional Development
Fund (ERDF) the ERASMUS programme as well as Horizon 2020 and the European Glob-
alisation Adjustment Fund (EGF) For an analysis of their job-creation potential and their
relation to the ESFYEI see European Parliament (2018) In addition a range of smaller
EU programmes finance employment-related measures for (young) people such as the
European Solidarity Corps or the EU Programme for Employment and Social Innovation
(EaSI)11
Three aspects deserve to be highlighted regarding differences across Member States in
financing the implementation of YG activities
First as the 2017 European Court of Auditors report on ldquoYouth unemployment ndash have EU
policies made a differencerdquo highlights the level of YEIESF funding available would only
address a small proportion of the required amount for the full implementation of a YG
Member States therefore need to leverage significant additional resources from national
budgets to achieve this goal However so far there has been ldquono assessment of cost
and available funding by Member Statesrdquo (European Court of Auditors 2017)
Second the extent to which the YEIESF funds simply financed youth-related schemes
that already existed prior to the YG is unclear They may be funded either by other EU
schemes or Member State national budgets The European Court of Auditors states that
YEIESF should ldquonot replace public or equivalent expenditure by the Member Statesrdquo
(ibid) However the Commission notes in its reply to the report that the YEI provisions
do not deny to Member States finance for measures previously supported by the national
budget or measures that require Member States to increase public spending regarding
certain types of measures or target groups At the same time the European Court of
Auditors analysis of seven Member Statesrsquo Operational Plans for the YEIESF showed that
ldquo[hellip] the majority of the measures which were to receive YEI financing already existed
prior to the introduction of the Youth Guarantee [hellip]rdquo (ibid p 54) In fact even in 2011
the Youth Opportunities Initiative proposed by the European Commission (2011) allowed
the governments of Member States to make increased use of the ESF for promoting
youth employment (Tosun et al 2017) The degree to which additional funds under the
YEIESF actually presented additional funds for Member States may therefore vary
greatly and there is without doubt also some variation in Member States as to whether
this caused them to step up their efforts regarding youth employment
Third despite the frontloading of the YEI in 2017 take-up of the YEI developed slowly in
its early phases of implementation (European Parliament 2017b) According to Andor
and Veselyacute (2018) two aspects delayed the implementation of the YG in the start from a
financial perspective firstly it took Member States and the Commission time to design
and review the lsquoOperational Programmesrsquo (OPs) specifying how YEI and ESF money
would be used Most of the Operational Programmes were only approved in late 2014 or
even in 2015 Secondly several Member States had accumulated delays in absorbing EU
structural funds for 2007-13 Hence they focused their efforts on implementing these
schemes in order not to lose these allocations (due to the so-called de-commitment
11 For instance one of the aims of the EaSI programme is to enhance mobility via the ldquoYour first Eures jobrdquo As these programmes are rather small in scale and not directly linked to the YG the study does not provide a detailed overview (see European Parliamentary Research Service 2017)
The Youth Guarantee in light of changes in the world of work Youth Guarantee Intervention Models Sustainability and Relevance
14
rule) Only afterwards did they move on to use YEI funding An assessment commis-
sioned by the European Parliament concluded that most delays that limited the impact of
the increased pre-financing were due to procedural rather than financial problems (Euro-
pean Parliament 2017b)
212 The Youth Guarantee as part of national policy-making
A variety of aspects may be used to determine the degree to which the YG has become a
part of national policy making and hence whether the changes introduced by the YG are
likely to be sustained over time The following discussion focuses on three measurable
factors related to the sustainability of YG-related policy changes Firstly whether the
Council Recommendation has spurred on Member States to introduce youth-related la-
bour-market reforms rather than merely set up an additional offer of active labour mar-
ket measures Secondly whether Member States have introduced monitoring and evalu-
ation systems to assess the effectiveness of YG-related measures Thirdly to find the
degree to which Member States have attempted to build up (lasting) partnerships be-
tween all relevant stakeholders (such as public and private employment services gov-
ernment authorities education and training institutions and so on)
The introduction of youth-related labour-market reforms the first key factor reflects
whether Member States have attempted to embed the main guidelines of the Council
Recommendation in their national policies In particular whether Member States have
used the political momentum created by the YG to introduce structural reforms to mod-
ernise their overall labour market policies in support of young people Such reforms con-
cern the functioning of the labour market (its institutional and regulatory framework)
and are aimed at better matching supply with demand The implementation of structural
reforms can be considered a key determinant as to whether the YG can have a long-
term sustainable impact in Member States beyond the YEI and the ESF funding associ-
ated with the YG
Information on the nature and intensity of youth-related active labour market policy re-
forms provided in the LABREF database indicates that EU Member States are imple-
menting the Recommendationrsquos policy guidelines unevenly Figure 3 displays the number
of active labour market policy reforms between 2013 and 2016 across Member States
The figure indicates for instance that virtually all Member States implemented addition-
al ALMP reforms for youth and that several Member States ndash such as Bulgaria France
Latvia Lithuania and Greece ndash have a relatively broad scope of reforms
Figure 3 Absolute number of youth-related active labour market reforms be-
tween 2013 and 2016
Note This figure shows the absolute number of youth-related active labour market policy reforms in the EU
Member States between 2013 and 2016 Identification of youth-related reforms is done via the indicator ldquoIs
the measure targeted at young peoplerdquo in the LABREF database
0
2
4
6
8
10
NL SI CZ
DE
LU FI HR
DK IE UK
AT PL
BE EE MT
RO SK ES HU CY IT PT SE BG FR LV LT EL
The Youth Guarantee in light of changes in the world of work Youth Guarantee Intervention Models Sustainability and Relevance
15
The introduction of monitoring and evaluation systems the fifth principal element in the
Council Recommendation on the YG and the strict reporting guidelines were aimed at
fostering a culture of policy analysis Despite the additional administrative burden asso-
ciated with reporting activities requiring Member States to obtain administrative data on
in- and outflows from the YG as well as follow-up data the creation of a monitoring and
evaluation system is one of the effects that people in charge of implementing the YG at
the country level have recognised as being positive12 In fact many Member States did
not have specialised monitoring systems allowing to track youth on the labour market
and in education and evaluate activation measures for youth before the Council Rec-
ommendation
At the same time the capacity of countries to monitor what happens to young people
after leaving the YG and the corresponding data quality varies in fact a substantial
share of Member States do not know about young peoplersquos reasons for exiting either the
YG or the labour market nor do they register the educational status of previous partici-
pants after they exited This issue is most likely due to a pre-YG lack of policy evaluation
culture or a lack of capacity to collect data An additional aspect to consider in this re-
gard is whether Member States attempted to evaluate the effectiveness of specific
measures under the YG using rigorous impact evaluations The EU helps Member States
conduct impact evaluations on interventions funded by the European Commission name-
ly the ESF and the YEI for example by setting up the Centre for Research on Impact
Evaluation (CRIE) which provides scientific expertise and methodological support to
Member States conducting an impact evaluation (see European Commission (2016b) for
details) Escudero and Murelo (2017) provide an overview of various impact evaluations
of pilot programmes that were set up within the context of the European YG However
there does not so far seem to be a systematic account of ongoing or completed impact
evaluations of YG instruments
Partnership approach Most Member States make a reference to the partnership ap-
proach in their YG Implementation Plan (YGIP) Table 1 shows the clear differences
based on an assessment of ten selected Member States conducted by Eurofound
(2015) In addition to the differences within countries the findings based on this sample
of ten countries also indicate that cooperation with some stakeholders seems to be more
widespread than it is with others For instance cooperation between ministries particu-
larly the ones dealing with employment and education policies is rather well developed
In comparison cooperation is less frequent with non-institutional stakeholders such as
the third sector notably NGOs social partners and youth organisations In 2016 the
European Commissionrsquos three-year assessment came to the conclusion that ldquowhile many
Member States have taken steps to support the involvement of a wide range of actors
and established institutional frameworks for partnerships the functioning of these part-
nerships remains a challenge due to problems of design which affects their ability to
deliverrdquo (European Commission 2016b p24)
In addition previous studies (eg Dheacuteret and Roden 2016) highlight the strong path-
dependency in how countries or regions apply the partnership approach While some
countries have put new structures in place to monitor the progress of the YG implemen-
tation and coordinate the work of relevant stakeholders other countries tend to have
consolidated partnerships that existed before the YG was established
12 Information collected through the interviews organised in the context of the EPC Task Force on Youth Employment The results of these interviews are further presented and developed in Dheacuteret and Roden (2016)
The Youth Guarantee in light of changes in the world of work Youth Guarantee Intervention Models Sustainability and Relevance
16
There also seems to be some discrepancy between the involvement of stakeholders in
the design implementation and monitoring of the YG In some Member States stake-
holders in the third sector particularly youth organisations reported that they were only
consulted in the design phase and never again (European Youth Forum 2018)13 Recent-
ly more positive evidence is provided by ETUC (2018) showing that the great majority
of interviewed representatives of unions was at least `somewhat satisfiedrsquo with their
degree of participation in the YG
Table 1 Overview of actors involved in implementing the YG in 10 Member
States
Min
istr
y
of
Em
plo
ym
ent
(or
equiv
ale
nt)
Min
istr
y
responsib
le
for
socia
l benefits
Min
istr
yo
rganis
ation
re-
sponsib
le for
ESFY
EI
Min
istr
y o
f Education
Min
istr
y
responsib
le
for
youth
work
Oth
er
min
istr
y
(justice
defe
nce
inte
rior
health
housin
g)
PES
(either
at
national
regio
nal or
local le
vel)
Youth
org
anis
ation (r
epre
-
senta
tive)
Local
youth
org
anis
ation
(im
ple
menta
tion)
Socia
l part
ners
Education s
ecto
r
BE XX XX X XX X XXX X X XX
BG XXX XX XX XX XX XX XX XX XX XX
EE XX X XX XXX XXX X XX XX XX X X
EL XXX X X XX X X
ES XXX
XXX
(em-ploy-ment)
XX XX XX XX XX X XX X
FR XXX
XXX (em-ploy-
ment)
XX (em-ploy-
ment)
XX XX X XX X
IE XX XXX XX XX XX XX X X X
IT XXX XXX XX XX XX XX X X XXX X
PL XX X XXX X XX X
UK XX XX (LEP)
X X XX X X
Source Eurofound (2015a)
Note XXX means authoritycoordinator XX means principal partner-stakeholders and X means associated
partnerstakeholder A distinction needs to be made in Belgium between the federal and local authori-
tyregional level social benefits are (still) the responsibility of the federal government while education and
PES are the responsibility of the regionslocal authorities Similar to Belgium in Spain many responsibilities
are delegated to the regional level LEPs - Local Enterprise Partnerships
13 Some more evidence from the European Youth Forum on involvement for a sub-set of countries can be found under httptoolsyouthforumorgyouth-guarantee
The Youth Guarantee in light of changes in the world of work Youth Guarantee Intervention Models Sustainability and Relevance
17
213 Youth labour market challenges
The third key factor of YG implementation is its contribution to and targeting of the
young peoplersquos labour market challenges Given that the recession of the late 2000s (the
lsquoGreat Recessionrsquo) and its aftermath exacerbated the difficulties that young people face
in their STW transition and labour market career this section presents a brief discussion
of these challenges and how YG interventions have sought to address them
Challenge 1 ndash Youth unemployment long-term unemployment and inactivity The Great
Recession and its immediate effects on youth unemployment ndash highlighted in section 1 ndash
also resulted in an increase in youth long-term unemployment which although gradual-
ly falling from its peak of 8 in 2013 has remained high (European Parliament 2015
European Commission 2017a) Long-term unemployment can result in well-documented
lifelong consequences and lsquoscarringrsquo effects on those young people who remain unem-
ployed for some time (Eurofound 2015b Eurostat 2015) In addition a considerable
proportion of the EUrsquos youth remain economically inactive Whereas a large share of
them are in education or training many are discouraged and have become detached
from the labour market or they have not entered it after leaving education
The macroeconomic state of the economy also affects the level of demand for young
people where employer absorption capacity in providing training places (such as appren-
ticeships) and jobs for young people may be limited (Eurofound 2015a) In addition the
highly variable youth labour market performance across the EU before during and after
the Great Recession has been attributed to many factors These include differences in
the institutional and structural set-up of Member States regarding the education and
training systems (initial) education and vocational training (IVET) labour market insti-
tutions and labour market policy (such as employment protection legislation - EPL) and
active labour market policies (ALMPs) and social welfare systems (Eichhorst et al 2013
OrsquoReilly et al 2015 Pohl and Walther 2005 Pohl and Walther 2007)
The introduction of the YG ndash and its underlying philosophy of early intervention with a
personalised approach ndash across the EU sought to address the issue of rising youth un-
employment including long-term unemployment and inactivity (Eurofound 2015a Eu-
ropean Commission 2016a) The YG approach precisely addresses these challenges
providing unemployed inactive youth with a short-term activation and a perspective in
employment or education
In the five years since the launch of the YG youth unemployment rates have improved
considerably as highlighted in section 1 (see also for example the European Commis-
sion 2018g Eurostat 2018) Although this development is partially attributable to the
recovery from the Great Recession according to the European Commission this is also
partially due to the YG together with the effect of the Youth Employment Initiative (YEI)
(European Commission 2018g)
Challenge 2 ndash Labour market segmentation A key challenge facing youth is labour mar-
ket segmentation often resulting in young people being over-represented in temporary
or part-time forms employment in particular involuntary part-time casual a-typical or
precarious work (European Commission 2017a 2017g and 2018i Eurostat 2015 and
2018) Although such non-standard forms of employment have increased for all age
groups the more recent cohorts of younger workers have been particularly adversely
affected (European Commission 2017g) Specifically although in 1995 23 of younger
workers in the then EU 15 were on non-standard contracts by 2016 this proportion had
increased to 32 for the same age group (European Commission 2017g)
This trend is reflected across the EU 28 where over the last decade non-standard forms
of employment among younger workers rose from 26 to 29 with 35 million fewer
The Youth Guarantee in light of changes in the world of work Youth Guarantee Intervention Models Sustainability and Relevance
18
employees on permanent full-time contracts and 12 million more on non-standard con-
tracts (European Commission 2017g) Moreover younger workers in 2016 were still
more than twice as likely to be working full-time on temporary contracts (12) than
workers in their prime and older workers (5) (European Commission 2017g)
In general young people are more likely to find themselves as labour market lsquooutsidersrsquo
with little access to permanent contracts with high levels of employment protection and
workersrsquo rights especially compared to their older counterparts (European Parliament
2015 European Commission 2017a 2017g and 2018j) Since access to stable employ-
ment with positive career prospects matters young peoplersquos successful transition into
fully independent lives is one of the primary objectives of the YG (Council of the Europe-
an Union 2013 Eurofound 2014)
The degree of lsquodualismrsquo of labour markets varies across Member States recent analysis
suggests that four in ten European young people are on temporary contracts rising to
over 60 in many Southern and Eastern European countries (European Court of Audi-
tors 2017) While temporary employment can either be a lsquostepping stonersquo or a lsquotraprsquo in
terms of STW transitions recent data suggests that the former is rarely the case (Euro-
pean Commission 2015 2017a and 2017g) the average proportion of temporary work-
ers transitioning into permanent employment fell from 28 in 2007 to 23 in 2013
This however masks major country variations ranging from 10 in France to for ex-
ample 65 in Estonia (ibid)
Predictably when studying age groups the probability of moving from temporary to
permanent contracts over one year is lowest for young people aged 15-24 (European
Commission 2016g) However it is worth noting that transition rates from temporary to
permanent contracts among young people have recently either increased or remained
stable in most Member States where data are available (European Commission 2017g)
In most Member States these rates are still lower than 20 and in countries such as
Poland and Greece temporary employment lsquohas almost no stepping-stone functionrsquo (Eu-
ropean Commission 2017g) Countries such as France and Spain with highly segmented
labour markets and high shares of (young) workers on fixed-term contracts have been
also characterised by low transition rates towards permanent employment (European
Commission 2017h Eurofound 2013a and 2013b)
Country case study Ireland
Ireland was one of the EU countries most adversely affected by the Great Recession
which resulted in high levels of youth unemployment As a result addressing youth
unemployment especially long-term unemployment has been a key challenge (EEPO
2015) The youth unemployment rate more than tripled from about 10 in 2008-09 to
a peak of just over 33 in mid-2012 (DSP 2014a) Likewise the NEET rate for those
aged 15-24 was 18 in 2014 although the picture is more nuanced especially in re-
lation to inactive NEETs (DSP 2014a) Specifically excluding students and the young
unemployed inactive NEETs account for a relatively small proportion (about 3) of
the youth population (DSP 2014a EEPO 2015) Most tend to be lone parentscarers
(60) and people with a disability (20) (DSP 2014a EEPO 2015) Thanks to Ire-
landrsquos universal means-tested unemployment benefit system for those aged over 18
the vast majority of young NEETs are registered with the benefitsemployment service
(EMCO 2017)
Against this background the Youth Guarantee (YG) has two target groups (i) poorly
qualified young people aged under 18 who are in turn provided with a quality second-
chance educationaltraining pathway outside the school system (for example
Youthreach) or are supported in re-entering the school system and (ii) unemployed
The Youth Guarantee in light of changes in the world of work Youth Guarantee Intervention Models Sustainability and Relevance
19
young people aged 18-24 with a particular focus on long-term unemployed youth
(EEPO 2015 Stokes 2016) To this end the YG offer is quite comprehensive and
comprises a number of programmes ndash some pre-existing (for example the JobBridge
internship programme) and others such as the First Steps Youth Developmental In-
ternship Programme (for the most disadvantaged young people) and JobsPlus Youth
(an employer subsidy scheme) introduced as part of the YG (DSP 2014a Leigh-Doyle
2014 Treadwell Shine 2016)
The delivery of the Irish YG seems to be integrated within the overall policy approach
towards youth employment with most measures aimed at young jobseekers predating
its introduction (DSP 2016a) This embedding of the YG within the existing youth em-
ployment policy framework means there is a close alignment between the two Indeed
Irelandrsquos YG builds upon existing services and programmes but it crucially entails ear-
lier intervention for and a tailored approach to the young unemployed with a strong
focus on enhancing processespolicies to help the young unemployed enter sustainable
employment receive appropriate training andor gain relevant work experience (DSP
2014a Treadwell Shine 2016 DohertyDSP 2018) YG-related partnership arrange-
ments are also situated within the main policy making process which in turn means
that the implementation of the YG is policy based as opposed to project based
(ESFYEI) (EMCO 2017) As such the YG and associated measures are likely to be
sustained over time
Ireland has made notable progress in implementing the YG with a substantial reduc-
tion in the number of unemployed youth In general there has been intensified en-
gagement with young people while access to different programmes has been enhanced
and partnerships strengthened (European Commission 2018a) Evaluations of YG-
related programmes such as the Tuacutes and Job-Bridge work placementinternship pro-
grammes have shown positive outcomes (Leigh-Doyle 2014 Indecon 2016 Depart-
ment of Education and Skills 2016) The Irish YG seems to be quite successful in de-
livering sustainable outcomes which indicates that the offers provided are of good
quality (European Commission 2018a)
However a number of challenges remain For example the uptake of key measures
such as JobsPlus Youth and the First Steps Youth Development Internship has not
been as extensive as it could in view of the youth cohort concerned and there is also
a lack of sufficient training places (DSP 2016a European Commission 2017f) Em-
ployer engagement particularly in the provision of employment opportunities for the
most disadvantaged youth also remains a challenge as does the timeliness of YG of-
fers (European Commission 2017f and 2018a EMCO 2017)
In principle one response to the challenge of labour market segmentation would be
structural reforms such as for example the reforms Spain implemented in the aftermath
of the crisis Given that the YG was implemented at the height of the recession most
Member States focused on a ldquowork firstrdquo approach to give short-term relief to unem-
ployed young people specifically the implementation of subsidised employment pro-
grammes many specifically targeted at young people at risk has been quite common
across the EU and hiring incentives have featured prominently in many YG plans (Euro-
pean Commission 2018h) Many of these programmes involve incentives such as wage
subsidies aimed at encouraging employers to offer employment to young people
In general countries promoting employment offers under the YG use a form of employ-
ment subsidy which typically involves supplementing the individual labour costs of the
person employed over a fixed period whilst the majority of the labour costs remain cov-
ered by the employer (European Commission 2018h - See Annex Points 9 and 10)
The Youth Guarantee in light of changes in the world of work Youth Guarantee Intervention Models Sustainability and Relevance
20
These wage subsidies also play a crucial role in many countries (including Belgium
France Estonia Greece the Netherlands Poland Spain Sweden and Denmark) in facili-
tating the acquisition of work experience andor entry in their first job by young people
and this especially helps young people from disadvantaged backgrounds (Eurofound
2013b 2016 and 2017 European Commission 2018d and 2018h) In addition the
broader set of labour market reforms accompanying the YG (see previous subsections)
has contributed to addressing labour market dualism in many Member States
Challenge 3 ndash Poor performance of education and training systems (including skills mis-
matches and the limited availability of quality work experience) Another key structural
challenge is given by an unsatisfactory performance in the education and training sys-
tems including VET this means that young people do not have appropriate education
when they graduate and when they enter the labour market which in turn exacerbates
skills mismatches and adversely affects their employability (for example Quintini et al
2007 Quintini and Martin 2014) Indeed the mismatch between (youth) labour supply
and demand seems to be a growing challenge for instance there is growing concern
about graduate under-utilisation and the fact that that higher education graduates expe-
rience considerable and persistent occupational vertical skills mismatch (234 in 2016)
by working in jobs typically requiring a lower level qualification (European Commission
2017c) However it is also worth pointing out that higher education graduates have bet-
ter employment rates (828) than young people with upper secondary education quali-
fications (726) (European Commission 2017c)
Another major challenge in light of rapid and constant technological change relates to
the need for effective skills anticipation against the largely unknown future evolution of
work and work organisation This is in turn is closely related to the need to ensure that
the education and training systems across the EU respond accordingly by being lsquoagilersquo
and by equipping young people with relevant skills including lsquodynamicrsquo skills such as
adaptability resilience and career management skills This concern was also reflected in
the latest European Commissionrsquos report on Employment and Social Developments in
Europe according to which ldquomuch will depend on whether or not education and training
systems are agile enough to respond appropriately to fast-changing technological oppor-
tunitiesrdquo (European Commission 2018g)
In recent years there has been a concerted effort to reform or strengthen education and
training systems including vocational education and trainingapprenticeships and their
role in STW transitions Indeed extensive VET reforms are currently being implemented
in many EU countries (for example Croatia Cyprus Estonia Greece Finland France
Ireland Italy Poland Spain Sweden and the United Kingdom) ndash instigated to some ex-
tent by the YG These reforms seek to improve the labour market relevance quality and
attractiveness of VET together with an effort to develop a VET system often along the
lines of the German dual training system which combines time spent at school with time
spent in the workplace In addition many reforms of VET systems often associated with
the YG have sought to create closer links with the labour market (European Commis-
sion 2018c)
In addition a range of other educational measures offered under the YG has aimed to
bring young people with low levels of skills and qualifications back to education and
training These measures are summarised by the term lsquocontinued education offersrsquo (Eu-
ropean Commission 2018l) These continued education offers are set up to provide
young people with the chance to re-enter the regular education and training system to
move on to a higher-level qualification Alternatively ALMPs bridging courses or second
chance education programmes can also equip early school-leavers and low-skilled youth
The Youth Guarantee in light of changes in the world of work Youth Guarantee Intervention Models Sustainability and Relevance
21
with the skills and qualifications needed for an initial (and targeted sustainable) labour
market integration
214 The heterogeneity of the NEET population
The fourth key aspect of YG implementation assessed in this report concerns the way in
which the YG has addressed the heterogeneity of the NEET population Due to its diversi-
ty the NEET population in the EU can be divided into sub-groups According to Euro-
found (2016) the NEET can be categorised firstly by their activity status ndash those who
are available to the labour market or educational opportunities are counted as active
while the rest is classified as inactive The former group consists of short- and long-term
unemployed individuals and those soon to return to education or employment the latter
group includes people with illness or disability individuals with family responsibilities and
lsquodiscouragedrsquo workers Throughout this report the phrase lsquodiscouraged workersrsquo refers to
people who simply stopped searching for employment or education opportunities
Data from the EU Labour Force Survey from 2013 (also used in Eurofound 2016) pro-
vides an indication about the labour-market attachment of NEETs in Europe before the
YG was implemented Among the active NEETs the largest proportion of 15-24-year-old
NEETs were short-term unemployed (298) Long-term unemployed youth made up
about 22 of the NEET population while returnees into work or education accounted for
roughly 8 of NEETs Among those considered inactive the largest share corresponds to
individuals with family care responsibilities (154) Individuals with illness or disability
made up 8 of the NEET population Discouraged workers accounted for almost 6 of
NEETs and 125 were NEETs for other reasons Consequently around 60 of the
NEET population were neither in education employment nor training for labour market
related reasons (the unemployed the discouraged workers and the returnees) and
around 40 were NEETs for other reasons
Furthermore NEETs can be categorised by their educational attainment as subgroups
with lower education are at a much higher risk of being in a vulnerable position This can
be seen by the fact that less educated youth are overrepresented among the NEETs As
of 2014 44 of NEETs aged 15-24 had completed an lsquoupper secondaryrsquo education
closely followed by 43 with a lsquolower secondaryrsquo education and only 8 of NEETs had
tertiary education or a degree (Eurofound 2016)
These sub-groups have diverse needs and are therefore likely to benefit from different
types of policy responses regarding interventions and they may require additional out-
reach efforts Most importantly those furthest away from the labour market are most
likely to be in substantial need of outreach activities One important factor here is their
point of access to the YG While other entry points exist access is often governed by
PES In all EU countries except Malta the PES plays a role in registering people for the
YG Among other determinants the extent to which the PES are able to actually reach
the NEET population also depends on their responsibilities for administering and paying
(unemployment) benefits According to European Commission (2017b) only three PES
are responsible for administering other types of benefits aside from (mostly insurance-
based) unemployment benefits (Lithuania Luxemburg and Slovakia) These types of
benefits tend to exclude youth due to their limited length of work experience reducing
the scope for outreach without further intervention Indeed the registration of NEETs
with the PES was somewhat limited at the onset of the YG (Eurofound 2016) However
many PES have launched substantial outreach activities to make up for this EC (2017a)
shows that roughly 46 of PES make use of new media for their outreach work 39
provide mobile services and about 43 have specific outreach caseworkers Moreover
The Youth Guarantee in light of changes in the world of work Youth Guarantee Intervention Models Sustainability and Relevance
22
46 of PES have created a one-stop-shop type of framework to enhance their degree of
outreach (eg this includes Belgium Finland and the United Kingdom ibid)
Country case study Italy
Italy is a country with a relatively rigid labour market despite the recent reforms aimed
at increasing the degree of labour market flexibility Moreover the Italian education
system endows youth with a relatively high level of general education but with few
work-related skills which dramatically slows down their transition to a job (Pastore
2018) Along with their relatively large number of early school-leavers this helps ex-
plain their 347 youth unemployment rate in 2017
The lack of previous experience with the YG framework and the dramatically low rate of
job-finding ndash ranging from 11 to 18 in the 2010s ndash represented another obstacle to
successfully implementing the YG According to Pastore (2015) macro- and micro-
economic obstacles should have been overcome to make the programme work at its
best Economic growth has been sluggish at least from the early 1990s which would
normally have reduced the pace of job creation and forced young people into more edu-
cation and training rather than employment Moreover public and private employment
services could count only on human resources which were scant in both quantitative and
qualitative terms as they had a low share of university graduates (ANPAL 2018)
The number of ANPAL staff has been reduced in recent years and as financial resources
for paying for an increase in the number of staff are scarce improvement has been
sought by implementing important reforms such as the `legislative decree 1502015rsquo of
the so-called Jobs Act package (ANPAL 2018) This reform introduced lsquoquasi-marketsrsquo
in the management of employment services the NEETs are profiled by PES and then
assigned a voucher for a different amount according to their lsquoneed bandrsquo NEETs can
spend vouchers in the PES andor with private (for profit or non-profit) employment
agencies to buy the services they need However so far the reform has not been fully
implemented partly due to the lack of financial resources (ibid)
Further problems with the implementation of the YG has been due to the reallocation of
competences in the PES from provinces to regions and the establishment of a national
agency (ANPAL) to coordinate the work of regional entities which detracted from the
full implementation of the YG (ANPAL 2018)
The Italian YG scheme has also managed to improve its monitoring system of the indi-
viduals involved the activities done and their level of absorption into the labour market
when the programme is completed The last monitoring report available shows that of
about 15 million registered NEETs 13 million had the prescribed requirements About
one million were actually profiled of which about a half were given some completed
form of assistance About 60 underwent on-the-job training 23 benefited from sub-
sidised employment 123 received off-the-job training 23 received some form of
placement services 16 did voluntary service in the third sector and a small number
received support for self-employment About six months before completion of the pro-
gramme 479 of recipients were in work and 692 had experienced at least one
employment spell (ANPAL 2017)
A few recent evaluation studies provide a full assessment of regional programmes and
show that on-the-job training is effective in confirming the importance of providing
young people with work-related competences (for example see Ghirelli et al 2019)
Despite these efforts monitoring data on the Youth Guarantee for 2016 shows that in
the EU as a whole an estimated 385 of the NEET population were registered in YG
schemes in the year 2016 Although some Member States are doing much better (cover-
The Youth Guarantee in light of changes in the world of work Youth Guarantee Intervention Models Sustainability and Relevance
23
age rates are higher than 50 in 12 Member States - in Belgium Finland and Austria
the corresponding rate is even above 70) Moreover the YG currently does not suffi-
ciently cover inactive NEETs (European Youth Forum 2018) as this problem is less se-
vere in countries with minimum income support systems where less strict entry require-
ments are usually applied This is the case in Ireland for example (see European Court
of Auditors 2017) This under-coverage of inactive NEETs is reflected in Figure 4 which
shows that the decline in NEET rates since the introduction of the YG is mostly due to
reductions in long-term and short-term unemployment
Figure 4 Composition of the EU NEET population (percentage of the population
of young people)
Source Eurofound (2017)
Thus it seems that the YG so far has benefitted youth closer to the labour market which
may be partly reflect the high prevalence of employment offers within the YG framework
(in 2016 around 67 of all the offers taken up within the four-month time limit set by
the YG were employment offers) Low-skilled individuals lsquodiscouragedrsquo workers and indi-
viduals without work experience are likely to benefit more from offers that combine gain-
ing job experience and building (job-specific) skills However as of 2016 these types of
offer only make up a minority of all the offers taken up within the four-month time limit
Furthermore the 2013 Council Recommendation on the YG insufficiently addressed the
needs of those among the youth that are NEETs for reasons other than labour market
related factors as these individuals had other constraints keeping them from the labour
market Among this group are mainly individuals with family care responsibilities and
youth with illnesses or disabilities For individuals with family responsibilities the Euro-
pean Quality of Life Survey shows that 11 of young fathers and 35 of young mothers
are inactive This is despite the fact that the majority of them would like to work under
flexible work and with adequate care arrangements (European Youth Forum 2017)
Nonetheless some Member States introduced additional reforms beyond the YG recom-
mendations to decrease high school dropout or aimed at improving social and welfare
policies
The Youth Guarantee in light of changes in the world of work Youth Guarantee Intervention Models Sustainability and Relevance
24
215 Design and implementation features of the Youth Guarantee
The fifth key aspect of the YG concerns design and implementation-related factors af-
fecting its capacity to address the main objectives ndash does it provide a broad set of young
people with a quality offer within a short period of time Specifically the Council of the
European Union (EU) recommended providing a quality offer to all young people under
25 within a four-month period of their becoming unemployed or having left the education
system
Substantial variation between Member States can be observed in the way the national
YG was designed and implemented previous experience implementing a YG-type of
framework is also important For example Denmark and Sweden are among countries
that had a relatively long history of this sort of framework even before the introduction
of the YG Furthermore at the very fundamental level of design some Member States
opted for different target time-frames as well as different age cut offs for YG eligibility
Some countries chose a shorter time-frame than the four months envisaged by the
Council of the European Union others opted for a longer duration (European Commis-
sion 2016a) Regarding the age range a substantial number of Member States chose
youth aged under 30 as a target rather than the suggested age of 25 as the cut off This
included for example Bulgaria Denmark Italy and Poland Depending on the size of
these cohorts this may represent a considerably more ambitious approach which - if it
is not supported by sufficient financial and human resources - is more likely to fall short
of expectations Furthermore some countries put specific emphasis on targeting the
long-term unemployed youth (Escudero and Mourelo 2017) Among others this includes
Hungary Poland and the United Kingdom
In order to support the target of reaching every NEET in a timely manner some PES
have also introduced YG-specific staff hired additional caseworkers or at least main-
tained their staff level since the introduction of the YG (European Commission 2017a)
On the issue of the quality of offers 17 PES formally defined their criteria for a quality
offer or distributed national quality management guidelines regarding offers being made
within the YG framework (5 countries)14 Many Member States have chosen an outcome-
based approach for their definition of offer quality meaning they define an offer as being
of high quality when individuals have favourable education or employment outcomes
after leaving one of the YG programmes (European Commission 2016a) In addition
some PES also introduced youth-specific targets (European Commission 2017a)
There is also cross-country variation in terms of the main YG providers Almost all coun-
tries rely to some extent on their national PES for providing YG services while some do
so exclusively This is the case for example in Austria the Czech Republic and Greece
Most Member States however chose some combination of the PES and other institutions
as their main providers (European Commission 2016a) Aside from the institutions
through which YG services can be obtained online access to the programmes may be an
important driver of success In 18 EU countries potential participants can register online
for the YG at least in some regions of the country This is not the case in for example
Bulgaria France or Luxembourg
14 See European Commission 2017a
The Youth Guarantee in light of changes in the world of work Youth Guarantee Intervention Models Sustainability and Relevance
25
Country case study Latvia
Young people in Latvia were very adversely affected by the lsquoGreat Recessionrsquo of
20082009 In the years before the recession youth unemployment had been relatively
low standing at 105 in mid-2008 but then it more than tripled to more than 35
within a two year period In a parallel development the NEET rate for 15-24 year old
Latvians rose from 108 in 2008 to 178 in 2010 Both youth unemployment and the
NEET rate effectively peaked in 2010 in Latvia and since then they have steadily de-
clined reaching pre-crisis levels by 2015 One specific challenge of the Latvian labour
market is the variation in employment outcomes by educational level as the high-
skilled face very low unemployment rates (clearly below the EU average) whereas un-
employment among the low-skilled is much higher than EU average
Following the Council Recommendation the Latvian YG Implementation Plan was pre-
sented in December 2013 (updated in April 2014) and implementation started in 2014
targeting young people aged 15-29 not in employment education or training (European
Commission 2018c) The Ministry of Welfare is in charge of establishing and managing
the YG while the Latvian PES (the lsquoState Employment Agencyrsquo) and the State Education
Development Agency (SEDA) are responsible for its implementation Other main imple-
menting actors include the Ministry of Science and Education the local authorities (the
municipalities) and youth organisations The Latvian Youth Guarantee is fully funded by
the Youth Employment Initiative (ibid)
The immediate strengths of YG implementation in Latvia are the rapid formal adoption
of the YG the adaptability of existing institutions and structures (which also enabled the
creation of new institutions such as a YG Advisory Board) and the emergence of part-
nership as a key component for implementing the YG This active inclusion of a broad
set of partnerships remains a particular strength of the Latvian YG implementation (EM-
CO 2017)
The Latvian YG scheme exclusively provides employment and education offers so that
apprenticeships and traineeships are not provided The employment offers are mostly
subsidised employment in the regular labour market such as first work experience for
labour market entrants and subsidised jobs for the disadvantaged Young people receive
fixed term contracts that range in duration from six months to two years and there is
also financial support for up to two years for young people wanting to become self-
employed or to start a business
The education system includes several vocational elements typically between 480 and
960 hours and up to 15 years in one specific programme Additionally the Latvian YG
provides ldquoyouth workshopsrdquo as part of the preparatory phase which provide training in
three different areas (up to three weeks each) to help young people with their career
choices
In 2016 just over a quarter (271 of the total entrants) of those entering the YG
scheme were re-entrants of which nearly half (127) had previously taken up an of-
fer These re-entry rates are below the EU average but the rates may be understated
as data for participants applying via the SEDA data on previous experience are not
available (European Commission 2018a)
The Youth Guarantee in light of changes in the world of work Youth Guarantee Intervention Models Sustainability and Relevance
26
216 The role of the apprenticeship system in the Youth Guarantee
The sixth main aspect of YG implementation addressed in this study specifically concerns
the role of apprenticeships indeed one of the greatest problems for young peoplersquos
transition into the labour market is their lack of work-related competences especially in
the countries with sequential STW transition systems that focus on general education
rather than building lsquoall-round human capitalrsquo as in lsquodualrsquo STW transition systems where
school and work are linked at the same time (Austria Denmark and Germany) An ap-
prenticeship is therefore one of the key elements of the dual system as it traditionally
involves off-the-job in-class education together with on-the-job training of different
lengths
According to comparative evidence provided by the European Commission (2013) based
on the European Labour Force Survey in most EU Member States the share of appren-
ticeships in any cohort of young people (15-29 years old) is between 15 and 5 with
the only exception being Germany Austria and Denmark where young people who un-
dertake an apprenticeship amount to above 5 All other EU countries are below 15
The EU average share was 37
This general tendency is also partly reflected in the usage of apprenticeships in the con-
text of the YG as they correspond to important cultural and institutional factors within
Member States15 The monitoring data shows that in 2016 some of the countries with the
highest share of apprenticeship offers within the YG programme have a dual STW sys-
tem Portugal is one major exception from this rule this may be related to its general
shortage of employment opportunities and therefore the tendency of apprenticeships to
occupy a higher than average share among participants of the YG Overall however
only 34 of timely exits from the YG were the result of apprenticeship offers a share
not far away from the share in the overall population of young people mentioned above
For a large number of countries the share was close to zero It should be noted howev-
er that due to data limitations some countries may record entries into apprenticeship
offers as entries into employment (European Commission 2016b)
Apart from data-related issues one reason why apprenticeship offers remain rather ex-
ceptional within the YG is that they require employersrsquo commitment to providing training
places and to designing curricula in cooperation with schools This can be a big constraint
in the development of apprenticeships especially in sequential SWT systems In 2013
the European Alliance for Apprenticeship (EAFA) was therefore launched to boost ap-
prenticeships in the EU The EAFA gave guidelines for the implementation of apprentice-
ships in all Member States and encouraged sharing experiences and good practices and
provided strategic expert support from the European Centre for the Development of Vo-
cational Training (CEDEFOP) and through the European Training Foundation Within the
context of the EAFA all member countries signed a declaration of commitments on ac-
tions to spread the use of apprenticeships as the main port of entry to the labour market
15 Note that the Commissionrsquos definition of apprenticeships (European Commission 2013) may differ from Member Statesrsquo definitions A recent Council Recommendation (Council of the European Union 2018) intends to harmonise the definition by saying that apprenticeships are understood as formal vocational education and training schemes that a) combine learning in education or training institutions with substantial work-based learning in companies and other workplaces b) lead to
nationally recognised qualifications c) are based on an agreement defining the rights and obliga-tions of the apprentice the employer and where appropriate the vocational education and train-ing institution and d) with the apprentice being paid or otherwise compensated for the work-based component Despite this recommendation varying national definitions still exist across Member States
The Youth Guarantee in light of changes in the world of work Youth Guarantee Intervention Models Sustainability and Relevance
27
for young people16 Moreover in their declarations each country committed itself to im-
plement the dual principle in their STW transition
Country case study Denmark
Denmark is among those EU countries that even before the introduction of the YG in
2013 (European Commission 2016a) already had a particularly well-functioning labour
market and educational system to help NEETs In fact Denmark already had some ex-
perience of a YG-like framework for a relatively long period before it was proposed by
the Council of the European Union The situation for Denmarkrsquos youth was therefore
more favourable than the EU average in 2012 The share of young people between 15
and 25 that were NEETs was only 66 - significantly below the proportion of NEETs in
many other EU countries Furthermore the majority of those individuals that were clas-
sified as NEETs were relatively close to the labour market and were therefore easier to
reach For example only 53 of Danish NEETs belonged to the group of long-term
unemployed or discouraged workers (Eurofound 2016)
Due to these circumstances the case for additional reforms within the YG was limited
Therefore along with reform efforts regarding active labour market policies concerning
youth and the educational system17 the implementation of the YG mostly required the
updating of existing policies This is exemplified by a strong increase in ALMP spending
from roughly 13 of GDP in 2012 to about 14 in 2015 despite declining rates of
youth unemployment and therefore a decrease in ALMP expenditure in other countries
over the same time period Denmark chose a particularly ambitious implementation by
focusing on youth under the age of 30 with a target window of less than four months so
as to offer their NEET population a quality measure In contrast to many other Member
States Denmark focuses on increasing the employability of NEETs via (continued) edu-
cation measures resulting in a share of apprenticeship take ups of over 50 relative to
the total number of timely exits from the YG This approach also matches the relatively
large proportion of low and medium educated youth among the NEETs
Two of the main pillars in the original 2014 Danish implementation plan were the ldquore-
tention task forcerdquo and the ldquoBridge Building to Educationrdquo programmes Both types of
initiatives were well-founded in regional and inter-organisational partnerships (for ex-
ample people involved include job centres municipalities educational facilities youth
organisations and others) While the aim of the first programme was to decrease high
school drop-out rates the latter took place at a vocational school in close cooperation
with the jobcentres and it focuses on helping youth to find their right path to success
through making the transition to vocational education This was done by assigning men-
tors to the NEET and giving them access to basic literacy and numeracy courses if they
needed them as well as further professional courses and traineeships The evaluation of
the ldquoBridge Building to Educationrdquo initiative yielded positive effects for youngsters par-
ticipating in the intervention compared to the control group (with a similar profile) which
did not participate in the intervention As a result two additional initiatives were set up
Firstly funds were made available to support the further implementation of ldquoBridge
Building to Educationrdquo initiatives Secondly ldquoJob-Bridge to Educationrdquo a randomised
controlled trial building on the core elements of ldquoBridge Building to Educationrdquo and tar-
geting the most vulnerable youth under 30 years without an education was also set up
16 Declarations of national commitment are downloadable from the EAFA website httpeceuropaeuapprenticeships-alliance
17 For more information see httpsuvmdkreform-af-de-forberedende-tilbudforberedende-grunduddannelseopbygning-og-maalgruppe
The Youth Guarantee in light of changes in the world of work Youth Guarantee Intervention Models Sustainability and Relevance
28
The project is set to end in mid-2020 where it will be followed by an evaluation of the
results
The Danish YG has also managed to set up a high-quality monitoring system with only
relatively few cases of missing information on YG participantsrsquo exit destinations (Euro-
pean Commission 2018a) Together with the relatively large share of NEETs who are
registered with the PES and the development of ldquoyouth guidance centresrdquo to reach out
to those who are not the Danish YG model is able to cover a substantial portion of
NEETs For instance in 2016 the YG coverage rate reached almost 60 of the NEET
population compared to the EU YG scheme average of 425 Thus despite more fa-
vourable initial conditions in Denmark the YG helped put a focus on the most vulnera-
ble youth and spur on a further integration of policies into national policymaking for
example through additional reforms aimed at improving active labour market policies
for young people Youth unemployment rates are currently trending downwards even
further in Denmark However there remain some issues especially with regard to the
integration of migrants given that youth unemployment is a much more pervasive issue
among them compared to native Danes (European Commission 2018a)
22 Empirical indicators of Youth Guarantee features
Section 21 has presented the key aspects that reflect how Members States implemented
the Youth Guarantee following the Recommendation In order to prepare the systematic
analysis of the YG in section 3 which develops a YG typology it is necessary to build
empirical indicators for each of these key aspects That is to say that this section dis-
cusses how information on each of these aspects can be measured and expressed in da-
ta18 These empirical indicators are therefore grouped into the corresponding six sets
1 Financial resources for implementing the Youth Guarantee
2 The Youth Guarantee as part of national policy-making
3 Youth labour market challenges
4 The heterogeneity of the NEET population
5 Design and implementation features of the Youth Guarantee
6 The role of the apprenticeship system in the Youth Guarantee
221 Indicator set 1 Financial resources for implementing the Youth
Guarantee
The set of indicators below represents the level and composition of financial resources
that Member States employed to support the Youth Guarantees implementation
i The size of ESFYEI transfers to match the respective NEET challenge is measured
by the ratio of initial YEI allocations as well as the YEI+ESF matching funds EU el-
igible cost both relative to Member Statesrsquo GDP in 2012 In addition a categori-
18 For each group of contextual and implementation features of the Youth Guarantee discussed in Section 21 an overview of potential quantitative or qualitative indicators was established which could represent these constructs Through a desk research of the available literature and online databases the availability of the respective indicators at the Member State level was assessed for a sufficiently large set of countries Unfortunately for a subset of potential indicators it was not possible to retrieve sufficient andor adequate information for a large enough sample of Member
States In some cases where several potential indicators were available to represent the same dimension or construct the available indicators that best represent the specific feature were iden-tified while also taking data quality into account In some cases single combined indicators were constructed to reduce the lsquodimensionalityrsquo of the database underlying the cluster analysis in sec-tion 3 See appendix A for more details on the exact indicators used and their source
The Youth Guarantee in light of changes in the world of work Youth Guarantee Intervention Models Sustainability and Relevance
29
cal variable for the estimated yearly costs relative to GDP for offering interven-
tions to all NEETs is included derived from Eurofound (2015a) The comparison of
both allows judgement of the importance of EU transfers in financing the YG
ii The degree to which Member States allocated additional funding from the ESF to
fund measures related to youth employment is measured in data about ldquoOther
ESF EU eligible costsrdquo (European Commission 2018k)
iii To proxy whether Member States dedicated additional funding from national
budgets to finance YG-related measures the evolution of overall active labour
market spending from 2012 to 2015 is used (Eurostat lmp_expsumm)19
iv Finally the degree to which Member States were able to absorb the additional
funding from the YEI in a timely manner is measured by the share of EU eligible
costs among YEI+ESF funds that were actually declared YEI+ESF funds based on
data from European Commission (2018k)
222 Indicator set 2 The Youth Guarantee as part of national policy-
making
The second set of indicators reflects the degree to which Member States made efforts to
introduce elements of the YG into national policy making and started partnerships
Regarding reform efforts the following indicators are included
i The degree to which the YG spurred wider longer-term reforms in Member States
is quantified by the total number of youth-related active labour market policy re-
forms between 2013-2016 based on LABREF information (the European Commis-
sionrsquos labour database)20
ii In addition the degree to which Member States were committed to the policy
change is approximated by the number of areas in which additional measures
were taken in the context of YG beyond the scope of the Recommendation (based
on European Commission 2016c)21
iii Finally the degree to which Member States were able to set up an effective YG
monitoring and follow-up system is taken into account as an indication of whether
they were committed to delivering the YG This means including 2016 data for the
proportion of YG exits with unknown destinations and the proportion of unknown
situations in the six-month follow-up data (European Commission 2018a)
The degree of partnerships built in each Member State is measured using the following
indicators
iv The degree to which partnerships were an element of the initial YG design is in-
cluded using the Member Statesrsquo self-reported involvement of social partners and
19 At the time of writing this report more recent data was only available for relatively small subset of EU countries
20 The authors refrain from using 2017 data on labour market reforms from the LABREF database as the objective is to measure the degree to which the YG was a driver of reforms in Member States That is this link becomes weaker over time such that the added value of more recent data
for the analysis is questionable
21 Due to their high correlation with LABREFrsquos own variations indicators of receipt and implemen-tation of country-specific recommendation between 2013-2017 and the qualitative classification by the Commission for the extent to which YG has acted as a driver of reform (European Commission 2016a) are not included in the set of indicators used
The Youth Guarantee in light of changes in the world of work Youth Guarantee Intervention Models Sustainability and Relevance
30
youth organisations in the design implementation and monitoring of the YG
(based on European Commission 2016c)22
v Furthermore the involvement of partners is approximated using the number of
areas where the PES is declared to have formed partnerships (based on European
Commission 2017a)23 In addition indicators are included for national PES re-
ported as having involved youth organisations and young people in the design of
YG services (based on European Commission 2017a)
223 Indicator set 3 Youth labour market challenges
To reflect how the challenges faced by young people in their transition from STW differ
across Member States the following empirical indicators are considered
i A set of indicators that reflect the significance of the youth unemployment chal-
lenge at the time when the YG was designed and rolled out These include the ra-
tio of unemployment rates for youth (age 15-24) and adults (age 25-74) the
share of people aged 15-24 of the total population (age 15-74) and the NEET
rate among youth aged 15-29 to obtain a measure of the size of the NEET chal-
lenge also for Member States that target individuals up to 29 years of age (Euro-
stat lfsa_pgaed une_rt_a edat_lfse_14 all indicators were measured in 2012)
ii To measure the initial degree of labour market segmentation and the quality of
entry-level jobs available to youth in each Member State the absolute difference
in the share of youth (15-24) to adults (25-54) in terms of the number on tempo-
rary employment contracts in 2012 (Eurostat lfsi_pt_a)
iii To address Member Statesrsquo response to these conditions several indicators are
included on the degree to which employment offers were favoured possibly re-
flecting a ldquowork-firstrdquo approach specifically the number of offers of employment
relative to the total number of all types of offers that are typically made to young
people registered in YG schemes (based on European Commission 2018b) In ad-
dition this includes a measure for the employment intensity of timely exits in
2016 (the share of all timely exits that were employment offers based on Euro-
pean Commission 2018b)
iv Lastly two indicators approximate the performance of education and training sys-
tems from which youth enter into the labour market and the potential severity of
the skills mismatch first the share of early school-leavers from education and
training among the youth population (age 18-24) in 2012 (Eurostat
edat_lfse_14) and second the share of NEETs with low and medium educational
attainment in 2012 To approximate the YG implementation with respect to skills
mismatches the number of offers of education relative to the total number of all
types of offers that are typically made to young people registered in YG schemes
is used (based on European Commission 2018b) In addition a measure is in-
cluded for the education intensity of timely exits in 2016 ie the share of all
timely exits that were education offers (based on European Commission 2018b)
22 An alternative source for partnership information is provided by ETUC (2018) Their data is ndash in
contrast to the data employed ndash not self-reported by the Member States However the ETUC (2018) report contains substantial missing information and hence was not used
23 Namely PES partnerships aimed at (i) ensuring that young people have full information and support available (ii) increasing employment apprenticeship and traineeship opportunities and (iii) supporting transitions from unemployment inactivity or education into work
The Youth Guarantee in light of changes in the world of work Youth Guarantee Intervention Models Sustainability and Relevance
31
224 Indicator set 4 The heterogeneity of the NEET population
The next set of indicators aims to reflect the diversity of the NEET population While
some indicators have already been introduced in the indicators above (for example NEET
rates by educational attainment) this additionally integrates the following
i The composition of NEETs as measured by the share of NEETs that are short-term
or long-term unemployed individuals about to re-enter education or employment
discouraged NEETs youth with illnesses or disabilities and the share of NEETs
with family responsibilities This gives an indication of the NEETsrsquo activity status
the potential reasons for their NEET status and their degree of closeness to the
labour market (Eurofound 2016 all indicators measured in 2013)24
ii Indicators describing the links between the PES for the YG This includes the
number of responsibilities of the PES in the YG as well as their main outreach
tools based on European Commission (2017a) Furthermore it includes indicators
on whether the PES is the main body responsible for the administration and pay-
ment of unemployment andor other types of benefits (based on European Com-
mission 2017a)
iii An indicator from European Commission (2017a) that reflects whether the re-
spective PES is reported to have taken any additional measures with respect to
preventing school drop-out
225 Indicator set 5 Design and implementation features of the Youth Guarantee
This set covers further design and implementation indicators that are likely to affect the
performance of the YG as implemented by the Member States
i Indicators on the envisaged length of the preparatory phase the eligible age
group the main YG provider whether online registration is possible for potential
YG participants as well as whether Member States created a legal entitlement to
receive an offer (all based on European Commission 2016c) In addition there is
an indicator measuring whether Member States specifically target the long-term
unemployed (Escudero and Mourelo 2017)
ii A categorical indicator providing information on whether a YG-related scheme was
already in place (in the long-term or recently) before the Recommendation
(based on European Commission 2016c)
iii Information on whether the Member States established a formal definition of a
good quality offer within the YG scheme (European Commission 2016a) and
whether quality management guidelines exist from the national administration to
organisations involved in YG (based on European Commission 2017a)
iv Indicators to reflect the relevance and potential upscaling of national PES capacity
since the YG Recommendation (all reflecting 2017 responses of PES based on
European Commission 2017a) These include whether the PES has dedicated YG
staff whether the PES provides training for YG staff whether the PES staff in-
creased or remained the same from 2014-2017 and whether the PES has specific
targets for youth (ibid)
24 Optionally the use of a more general measure of the NEET Cluster Type was tested which is a composite indicator on different levels reflecting the STW transition system and the composition of NEET in 2012 (Eurofound 2016) However as the clustering is based on the share and STW transition type data already employed the indicator is not used in the analysis
The Youth Guarantee in light of changes in the world of work Youth Guarantee Intervention Models Sustainability and Relevance
32
226 Indicator set 6 The role of the apprenticeship system in the Youth Guarantee
The final set of indicators represents the relevance and the set-up of apprenticeships in
the national education and training system as well as their role in the YGs implementa-
tion
i To provide information on the STW transition types of Member States indicators
are included based on the classification by Pohl and Walther (2005 2007) Fur-
thermore an indicator on the share of firms employing initial vocational training
participants in 2010 is used (Ireland 2015) (Eurostat trng_cvt_34s)
ii To reflect the relevance of apprenticeships in the YG implementation indicators
on the number of offers of apprenticeships relative to the total number of all
types of offers that are typically made to young people registered in YG schemes
(based on European Commission 2018b) In addition a measure for the appren-
ticeship-intensity of timely exits in 2016 ie the share of all timely exits that
were apprenticeship offers (based on European Commission 2018b)
iii The normalised number of pledges from firms and institutions to the European Al-
liance for Apprenticeships between the outset of the YG in 2013 and 2018 (based
on the national commitments database25)
23 Conclusion
This chapter has provided a comprehensive overview of the main aspects of the YG im-
plementation in context Specifically subsection 21 discussed a) the main financial re-
sources for implementing the YG b) the YGrsquos integration within national policy-making
c) the YG and youthrsquos labour market challenges d) the diversity of the NEET population
e) design and implementation features of the YG and f) the role of the apprenticeship
system in the YG Section 22 proceeded to identify and map six sets of empirical indica-
tors to each of these six implementation aspects In total 76 empirical indicators were
identified which will form the basis of the systematic analysis of a YG typology in the
next section Figure 5 gives a graphic overview of the number of indicators included in
each of the six indicator sets representing the key implementation aspects
25 The national commitments database available at httpeceuropaeusocialmainjspcatId=1148amplangId=en as of September 17 2018 This data-base also provides information on the number of pledges made by firms and institutions For the analysis the number of pledges is normalised by the share of firms employing IVET participants in each Member State to account for the relevance of the VET system
The Youth Guarantee in light of changes in the world of work Youth Guarantee Intervention Models Sustainability and Relevance
33
Figure 5 Number of indicators identified by variable set
Source Own analysis
Figure 5 illustrates that for example indicator set (5) ndash which represents the design and
implementation features of the YG ndash is the largest set comprising 20 indicators Whereas
the indicator sets (1) on financial resources for implementing the YG and (6) on the role
of the apprenticeship system (6) are somewhat smaller they still contain seven and nine
indicators respectively
3 Typology of Youth Guarantee models
This section is the empirical part of the analysis Based on the identification of the set of
relevant implementation aspects and the corresponding empirical indicators in the previ-
ous section Chapter 3 intends to systematise the main models that are currently in
place for delivering the YG in Member States It is an empirical attempt at establishing a
typology of different intervention models based on cluster analysis This section also
explores whether a correlation between specific types of intervention models and per-
formance in delivering the YG can be identified
31 Empirical approach to establishing Youth Guarantee models
To address the question about which main models are currently in place for delivering
the YG the analysis groups Member States according to their similarity across the em-
pirical indicators presented in section 22 Since both contextual features and implemen-
tation-related factors are included this procedure identifies types of countries that are
similar in both dimensions
To detect these types cluster analysis techniques are used in which the goal is to find
groups of observations in the data ndash that is groups of Member States ndash that are most
similar within clusters while being as dissimilar as possible across clusters In this study
hierarchical agglomerative clustering methods are employed These methods start out by
specifying each Member State as one individual cluster The cluster approach then grad-
ually combines Member States into clusters The choice of which clusters are to be com-
bined is determined by comparing their (dis-) similarity In the empirical application an
adequate measure of dissimilarity is the coefficient by Gower (1971) as it allows for the
combination of binary indicators and multivalued variables The choice of the linkage
method (the way the clustering algorithm combines similar observations into clusters) is
of similar importance in this case the Ward method (1963) is chosen which combines
groups or observations if they increase the within-group variance of the chosen indica-
tors by the least amount possible in the data Lastly the authors needed to choose the
7
11
11
18
20
9 (1) Financial resources for implementing the YG
(2) YG as part of national policy-making
(3) Youth labour market challenges
(4) Heterogeneity of NEET population
(5) Design and implementation features of the YG
(6) Role of the apprenticeship system in the YG
The Youth Guarantee in light of changes in the world of work Youth Guarantee Intervention Models Sustainability and Relevance
34
number of clusters to be generated Since this is not obvious in the application at hand
the Duda-Hart optimality criterion as described by Milligan and Cooper (1985) was ap-
plied This means that intuitively the index computes the added value of increasing the
number of clusters by one so a low Duda-Hart index indicates an optimal number of
clusters In the YG case the comparison is restricted to between three and seven clus-
ters as fewer clusters provide too little information while too many clusters hamper the
interpretability of results
The empirical application follows a two-step procedure In the first step a cluster analy-
sis for each set of the empirical indicators defined in section 22 determines sets of coun-
tries that are similar within each of these six conceptual sets For example the set on
financial resources puts countries with magnitudes of expected and realised costs for
implementing the YG based on the available information together In the second step
the main cluster analysis based on all indicators determines a final cluster analysis which
also allows the authors to analyse their correspondence to the sub-clusters from the first
stage Readers should note that the quality of the cluster groups depends ndash among other
factors- on the data quality of available indicators as well as the number of indicators
used The more indicators are required for meaningful results the more difficult it is to
obtain clusters that differ sharply with respect to all the chosen indicators Thus it may
be that one country differs quite substantially in terms of one indicator from the rest of
the countries in a particular cluster if the other indicators show similar realisations
Hence for the description of clusters attention is restricted to those indicators that
summarise the cluster differences the best presenting the general tendencies of the
cluster analysis necessarily simplifying to a certain degree Furthermore readers should
also note that the groupings following from this exercise do generally not imply any
qualitative ranking
32 Description of first-step clusters
321 Indicator set 1 Financial resources
Cluster A (AT DK FI DE LU NL and SE) is a set of countries with a low estimated cost
of fully implementing the YG that received relatively little financial support from EU
funds both via the YEI and the ESF On average these states show very little changes in
active labour market policy (ALMP) spending between 2012 and 2015
Cluster B (BE CZ EE FR IE IT MT RO SI and UK) and Cluster C (ES LT LV PL and
PT) are countries with costs estimated to be of medium magnitude to fully implement
the YG Country cluster C received more EU funds from the YEI and the ESF matching
funds - and other ESF eligible youth-related projects - compared to cluster B Both clus-
ters showed only a small change in ALMP expenditure
Cluster D (BG CY EL HU HR and SK) has high estimated YG costs and they received
substantial monetary support from the EU to support the implementation of the YG
through the YEI through the ESF matching funds and through financing of other eligible
youth-related projects Cluster D is also the only one in the analysis that shows a sub-
stantial increase in ALMP spending between 2012 and 2015 despite declining (youth)
unemployment rates
322 Indicator set 2 Youth Guarantee as part of national policy-
making
Cluster A (DK ES FR HU IE SE and SK) has a large average number of youth-related
ALMP reforms and additional measures implemented beyond the scope of the Recom-
mendation These Member States also tend to enforce comparatively effective YG moni-
The Youth Guarantee in light of changes in the world of work Youth Guarantee Intervention Models Sustainability and Relevance
35
toring and follow-up systems which may be interpreted as an indication that they are
committed to deliver on the YG However on average these Member States did not pri-
oritise partnerships as much as other clusters
Cluster B (AT CZ DE EE EL NL RO and UK) is mostly defined by the lack of effective
monitoring and follow-up systems and also fewer reforms were put in place compared to
Member States in other clusters Nonetheless on average they put more emphasis on
involving social partners and youth organisations and built more partnerships than coun-
tries in cluster A
Cluster C (BE BG CY FI HR IT LV LT LU MT PL PT and SI) implemented many
youth-related reforms and additional measures as part of the implementation of YG rec-
ommendations However in contrast with cluster A these Member States also included
partnerships with social partners and youth organisations as a central element of the
initial YG design Consequently the PES in these Member States often said that they had
formed partnerships and that they regularly involve youth and youth organisations into
their work Nonetheless their monitoring systems are still underperforming compared to
countries in Cluster A
323 Indicator set 3 Youth labour market challenges
Cluster A (BG CY EL HR PL and SK) includes Member States that had the highest
NEET rate amongst 15-29 year olds in 2012 before the YG was rolled out Moreover
they show the largest difference in shares of temporary employment contracts between
the youth and adults Countries in this cluster have the best educated NEETs on average
This also reflects the point that the issue was not so much the education system as the
figures also show a comparatively low average shares of school drop-outs Correspond-
ingly Member States in cluster A usually responded by focusing on employment-related
measures under the YG rather than offers of education
Cluster B (AT DE DK ES LV and MT) relates to the contrasting cases These Member
States tend to have comparatively low NEET shares with most of them having a poor
level of education and the lowest average youth-to-adult unemployment ratio In addi-
tion these countries appear to have a rather well-functioning educational system with
similarly low average shares of early school-leavers compared to cluster A Most of
these Member States responded to this setting with a strong focus on educational offers
under the YG
Cluster C (BE CZ EE FI FR HU IE IT LT LU NL PT RO SI SE and UK) ranks in
between cluster two and three on many indicators including the prevalence of low edu-
cated NEETs education and employment offers In general this cluster has the lowest
difference in temporary employment shares between adults and the youth
324 Indicator set 4 The heterogeneity of the NEET population
Cluster A (BE BG FI MT and NL) consists of countries that have a particularly high
share of NEETs in short-term unemployment illness or disability and lsquodiscouragement
from workingrsquo The policy response of these countries is characterised by the highest
average outreach efforts on the part of the national PES
Cluster B (CZ DE EE EL FR HU HR LT LU PL SI and UK) has the highest share of
short-term unemployed and individuals with family responsibilities among the NEETs
Similar to cluster A countries from cluster B display strong average outreach efforts and
a large degree of involvement of the PES in delivering the YG
The Youth Guarantee in light of changes in the world of work Youth Guarantee Intervention Models Sustainability and Relevance
36
Cluster C (AT CY DK ES IE IT LV PT RO SK and SE) is the most diverse for this
indicator set and shows the highest share of long-term unemployed and relatively high
rates of discouraged youth among the NEET population compared to other clusters The
governance structure shows a lower degree of PES having responsibility for administer-
ing and paying (unemployment) benefits as well as regarding the implementation and
delivery of the YG in general Compared to clusters A and B Member States from cluster
C tend to show fewer outreach efforts
325 Indicator set 5 Design and implementation features of the Youth Guarantee
Cluster A (AT CY DE DK EL FI HR IE LU and SE) includes many Member States
which set the age target as under-25 years old26 These countries also tend to define
very few other eligibility criteria or target groups Importantly all Member States includ-
ed in this category have a relatively long experience of YG-type schemes prior to 2013
However only very few of them defined a legal entitlement to receive an offer These
are also countries that mostly allowed individuals to register online set a definition for a
quality offer and also provided national quality guidelines for all actors involved in the
YG Many of the Member States in this cluster also primarily rely on their PES in the YG
implementation and have strengthened their PES capacities since the YG rollout
Cluster B (BG CZ ES FR MT NL PT and RO) includes a relatively diverse set of coun-
tries Most countries in this cluster have no prior experience of a YG-type of scheme
relatively low availability of online registration and a low prevalence of the definition of
quality offers While some countries additionally target NEETs under 30 years old in
general they neither upgraded the capacity of nor relied strongly on their PES in its im-
plementation
Cluster C (BE EE HU IT LV LT PL SI SK and UK) primarily consists of countries that
set the target for youth aged under 30 In addition many of these countries set addi-
tional target groups beyond the general criteria (such as a specific focus on long-term
unemployed) or defined specific sub-groups within the broad target population Similar
to cluster A some Member States with previous YG-related experience are included in
this cluster In addition they tend to have upgraded their PES capacity for YG implemen-
tation (but they also rely on other providers) These are also mainly countries that im-
plemented a legal entitlement and also a definition of a quality offer (without however
providing national guidelines)
326 Indicator set 6 The apprenticeship system
Cluster A (AT BE DE FR LU and NL) consists of countries with an employment-centred
STW transition type27 that is characterised by high levels of employer involvement in
education and training system and the largest share of firms employing initial vocational
and educational training (IVET) participants On average Member States in this group
show the largest share of timely exits from apprenticeships Relative to the share of
firms employing IVET participants the number of pledges within the EAFA framework is
26 It is important to note that most implementation-related indicators for example information on eligible age groups were measured in 2016 For a few countries these conditions have changed recently However in the analysis it was decided to stick to the initial implementation features to focus on the way Member States initially aimed to combat youth unemployment
27 See Pohl and Walther (2005) for details
The Youth Guarantee in light of changes in the world of work Youth Guarantee Intervention Models Sustainability and Relevance
37
the lowest in this group potentially reflecting the already high importance of apprentice-
ships in these countries
Cluster B (BG CZ EE HU LT LV RO SK and SI) is made up of Member States that
joined the EU relatively recently with a lsquotransitionalrsquo STW transition type and the lowest
share of firms employing IVETs Their share of apprenticeships is lowest among the
timely exits and their number for EAFA pledges is relatively the largest
Compared to cluster A and B cluster C (CY DK EL ES FI HR IE IT MT PL PT SE
and UK) also consists of a mixture of STW types and a medium share of firms hiring
IVETs Apprenticeship offers are of medium importance relative to the other two clus-
ters
327 Summary of first-step cluster analysis
The analysis of Member Statesrsquo similarities within the indicator sets shows that the re-
sulting country clusters tend to be different depending on the set of indicators although
certain tendencies are already apparent For instance countries that are included in the
same cluster for the YG design and implementation indicators tend to also be grouped
into the same finance cluster meaning that some countries with a low estimated cost of
implementing the YG tend to also be countries that show implementation patterns that
closely followed the Recommendation Similarly countries in the same apprenticeship
cluster tend to be in the same ldquoyouth labour market challengesrdquo cluster While this al-
ready provides some suggestions for the final grouping of Member States with respect to
all indicators chosen the overlap across clusters for the different indicator sets is not
complete so a more in-depth analysis is needed Specifically some clusters remain rela-
tively heterogeneous in terms of the underlying empirical indicators indicating that the
cluster analysis has some difficulties if Member Statesrsquo realisations of indicators do not
follow a simple pattern making the interpretation of some cluster results more difficult
than others For these reasons and to further reduce the dimensionality of the problem
the next section groups Member States based on all the chosen indicators To make the
connection between the first-step analysis and the ensuing second step the association
of first-step clusters with the final cluster results is also shown
The Youth Guarantee in light of changes in the world of work Youth Guarantee Intervention Models Sustainability and Relevance
38
33 Results and discussion of second-step clusters
The final cluster analysis uses all the indicators described in the previous section and
performs the clustering procedure for all variables in a combined step thereby arriving
at clusters that take the individual sub-clusters as well as the interaction between them
into account Table 2 shows the results by Member States including their association
with the clusters uncovered in the first stage of the analysis all ordered by the final re-
sults Being in the same first-step cluster is visualised as having the same shade of the
colour in the respective column It is important to note that the colours chosen imply no
qualitative or quantitative judgement apart from the cluster membership
Table 2 Summary of Results of Cluster Analysis
Country
Financial resources for implementing the YG
YG as part of national policymaking
Youth labour market chal-lenges
Heterogenei-ty of the NEET population
Design and implementa-tion features of the YG
Role of the apprentice-ship system in the YG
Overall cluster
Austria
A
Denmark
Finland
Germany
Ireland
The Netherlands
Sweden
The Czech Republic
B
Estonia
France
Hungary
Romania
The United Kingdom
Cyprus
C
Greece
Italy
Portugal
Spain
Belgium
D
Lithuania
Luxembourg
Malta
Poland
Slovenia
Bulgaria
E Croatia
Latvia
Slovakia
Source Own analysis
Note Countries that share the same first-stage cluster have the same shade of the colour in the respective
column Note that the colour shades imply no qualitative or quantitative ranking of Member States
The Youth Guarantee in light of changes in the world of work Youth Guarantee Intervention Models Sustainability and Relevance
39
Cluster A Member States with previous YG experience lower initial NEET rates
ambitious implementation and improved PES capacity low educated NEETs and
diversified offers (AT DK DE FI IE NL SE)
The first cluster is a set of Member States that are mostly countries which already had
longer experience with YG-related schemes On average YG implementation in these
countries was quite ambitious many of these Member States undercut the recommend-
ed four-month target for the preparatory phase and formally defined their offer quality
and quality guidelines Countries in this cluster tend to rely relatively strongly on their
PES for the YG while upscaling their PES capacity through hiring additional staff At the
same time they also experienced the lowest average NEET rates in 2012 for all clusters
and they consequently had comparatively low estimated costs and therefore low levels of
funding allocated under the YEI However the clusterrsquos NEET population has the highest
share of individuals with low educational background and youth with a disability Follow-
ing this NEET challenge they diversified their offers under the YG across types the most
compared to other clusters with the lowest focus on employment-type offers Involve-
ment and integration of partners within the YG framework in these countries was about
average compared to the other clusters
Cluster B Member States with intermediate NEET challenges strong outreach
efforts by the PES relatively poor monitoring data quality high NEET rates due
to family responsibilities and strong focus on employment offers (CZ EE FR HU
RO UK)
On average these Member States mostly observed a NEET challenge of intermediate
magnitude relative to other clusters at the time of the YG roll-out The labour markets
for youth in this cluster were under more stress and characterised by high rates of short-
term unemployment among their youth ndash for some of them also as a consequence of the
great recession Furthermore this cluster also had by far the highest share of youth that
were NEETs due to family responsibilities and the largest gap between youth and adult
unemployment rates As a result most of them received some funding under the YEI It
is also notable that countries in this cluster showed the largest increase in ALMP ex-
penditure between 2012 and 2015 However compared to the other clusters countries
in this cluster showed particularly poor monitoring data quality so their information has
a high degree of unknown destinations and situations for previous YG participants On
implementation a significant fraction of Member States from cluster B chose slightly
different targets (for example through targeting long-term unemployed introducing a
legal entitlement to a YG offer and extending the age limit up to age 29) They could
build on a comparatively advanced outreach system through the PES which they also
relied on in their YG implementation Furthermore four of the seven countries in this
cluster follow the post-socialisttransitional STW model (the Czech Republic Estonia
Hungary and Romania) On average these countries showed the lowest level of in-
volvement of the social partners and youth organisations and relatively few efforts at
reform On average countries in this cluster had the highest rate of timely exits into
employment indicating a tendency towards an ldquoemployment-firstrdquo approach
Cluster C Member States hit by the economic recession with highest initial
NEET rates severe long-term unemployment large support via EU funding
highest reform efforts and highest entry rates into apprenticeship offers (CY EL
ES IT PT)
The third cluster consists mainly of Member States that were hit particularly hard by the
economic recession following the financial crisis in the years after 2008 and they were
struggling to revive their labour markets in the ensuing recovery As a consequence
most countries had a severe problem with long-term youth unemployment into 2012
The Youth Guarantee in light of changes in the world of work Youth Guarantee Intervention Models Sustainability and Relevance
40
Moreover countries in this cluster had on average the highest rate of early school-
leavers Almost all these Member States received significant funds from the EU to sup-
port the YG implementation and delivery In contrast to Member States in Clusters A and
B none of the countries in cluster C had any kind of experience of a YG type of frame-
work before the Recommendation making its implementation even more difficult in
these countries However in terms of policy integration these Member States rank at
the top of youth-related ALMP reform efforts At the same time most of these countries
still have monitoring systems with relatively poor data quality and their PES used rela-
tively few channels for outreach activities compared to countries in the other clusters
Regarding partnerships built countries in this cluster show an average degree of effort
While the share of low educated NEET is comparable to those in Cluster B and average
exits rates into education are only slightly smaller than among countries from Cluster B
the share of individuals entering apprenticeships is highest among these countries sug-
gesting a stronger focus on the provision of both training and work experience to combat
the NEET challenge
Cluster D Member States characterised by relatively low initial NEET rates and
short-term unemployed rather than inactive NEETs some funding under YEI
strong outreach efforts through the PES and partnership approach and diversi-
fied offers with a stronger focus on education offers (BE MT LT LU PL SI)
The challenge for most Member States in this cluster was the high proportion of youth in
unemployment rather than a structural NEET challenge as most of their NEETs are
short term unemployed rather than discouraged NEETs or inactive for other reasons
Most of the countries in cluster D have medium-level estimated costs of fully implement-
ing the YG Consequently most of these Member States did not receive particularly large
amounts of funding from the EU (except Lithuania and Poland) At the same time these
are mainly Member States that put the most weight on building partnerships involving
social partners and youth organisations as well as outreach efforts including through the
PES Many of the Member States in this cluster followed the Recommendation quite
closely in terms of the time-frame for the YG but they did not establish strong monitor-
ing systems and they did not carry out many youth-related reforms in recent years
relative to other Member States In terms of the offer distribution these countries gen-
erally showed diversified offers with the strongest focus on education measures shown
by the largest share of timely exits from the YG into education and the lowest focus on
employment offers This is despite the fact that on average clusters B C and D had
very similar shares of low and medium educated NEETs at the onset of the YG suggest-
ing a very different policy response
Cluster E Member States that joined the EU relatively recently with lsquotransi-
tionalrsquo STW regimes high initial NEET rates structural challenges and substan-
tial EU funding focus on employment offers rather high reform efforts (BG HR
LV SK)
This cluster consists entirely of countries that joined the EU relatively recently compared
to the other Member States They are countries with a lsquotransitionalrsquo STW regime and
without prior experience in YG-type of frameworks before the Recommendation While
these countries have the lowest rate of early school-leavers and a substantially lower
share of low educated individuals among the NEETs compared to the other clusters this
cluster has the second largest share of NEETs with family responsibilities and the largest
share of discouraged youth This suggests that they struggled with more significant
structural NEET challenges compared to the other clusters The high NEET rates resulted
in high estimated costs for implementing the YG and consequently these Member States
also received substantial funding from the EU
The Youth Guarantee in light of changes in the world of work Youth Guarantee Intervention Models Sustainability and Relevance
41
Moreover these Member States also put in place a significant number of youth-related
ALMP reforms between 2013 and 2016 only outpaced by cluster C In terms of design
and implementation all of these countries chose to target youth under 30 and most put
particular emphasis on long-term unemployed individuals The degree of outreach efforts
through the PES is of average magnitude but the involvement of social partners and
youth organisations is highest among countries in this cluster This may indicate a cer-
tain degree of mismatch regarding outreach activities and the efforts likely to be re-
quired to activate the substantial share of discouraged NEETs in the youth population
However this cluster is the only in which all the Member States have YG-specific staff at
the PES and where all of them increased PES staff in recent years Due to the relatively
well-qualified nature of the NEET population Member States in this cluster concentrated
mostly on employment-type offers
34 Conclusion of second-step clusters
Breaking down the differences between clusters in a simple way is evidently challenging
due to the many aspects considered and highlighted in the cluster-specific characterisa-
tions This section therefore only provides a short conclusion to the findings in the final
cluster analysis indicating several sorts of Youth Guarantee models in place in the Euro-
pean Union It shows three clusters with comparatively low initial NEET rates at the out-
set of the YG Cluster A Cluster B and Cluster D What distinguishes these clusters from
one another among other issues is that Member States in Cluster A already had a long-
er experience of YG-related schemes they observed fewer youth-related challenges and
hence they received less additional funds from the EU
In contrast to this most Member States with the most pressing NEET challenges in 2012
are found in the other two clusters Cluster C and Cluster E include Member States with
particular NEET challenges mostly related to the financial crisis and recession for coun-
tries in Cluster C Member States in Cluster E also had a particular structural NEET chal-
lenge partially stemming from the transitional STW regime and they all received signifi-
cant funding from the EU
35 Measures of performance
Before investigating the correlation between the types of European YG models identified
and the performance of the YG implementation the analysis needs to define the relevant
outcome measures employed for this last step of the empirical analysis The correlation
analysis will make substantive use of information from the YG monitoring data The most
recent data available at the time of writing are from 2016 and they include information
on the main dimensions of the Recommendation
i ldquoCoveragerdquo rate provides an estimation of the degree to which the NEET popula-
tion was reached by the YG (the estimated proportion of the NEET population
aged 15-24 that was enrolled in the YG scheme at any point during the reference
year)28
28 These figures are based on the indicator average annual stock of young people in the YG pre-
paratory phase NEET population (annual average) included in the Indicator Framework for Moni-
toring the Youth Guarantee This indicator combines administrative and survey data Whilst this is not ideal the indicator is useful to give an approximate indication of the proportion of NEETs regis-tered in the YG scheme at any point during the year Results should therefore be interpreted as an estimation rather than a definitive measurement of the extent to which YG schemes achieve the objective of reaching all young people that become or are already NEET
The Youth Guarantee in light of changes in the world of work Youth Guarantee Intervention Models Sustainability and Relevance
42
ii The share beyond the four-month target the share of young people in the pre-
paratory phase beyond the four-month goal measured as a percentage of the
average annual stock of participants
iii Positive and timely exits the share of positive and timely exits shows how suc-
cessful Member States were at providing offers within the envisaged four-month
preparatory phase measured in percentage of all exits
iv Positive situations after six months this measure gives the percentage of YG par-
ticipants being in a positive situation at six months after exiting the programme -
the share of individuals either in education training or employment as a percent-
age of all exits
These performance indicators provide the most comprehensive and direct evidence on
the performance of the YG However there are some data limitations regarding the de-
gree to which the entire NEET population can be identified relevant for the comparability
of the coverage rate across Member States The quality of information on positive and
timely exits as well as the share of participants in a positive situation after exiting the YG
depends on the degree to which the destination of exits is known and how well individu-
als can be followed up Again to a certain degree this limits comparability across coun-
tries The distribution of these indicators across Member States is depicted in Figure 6 For the interested reader a separate cluster analysis solely based on the measures of YG
performance in Table 4 is included in the Annex
The Youth Guarantee in light of changes in the world of work Youth Guarantee Intervention Models Sustainability and Relevance
43
Figure 6 YG-monitoring data performance indicators by Member States 2016
Source YG monitoring data
0
10
20
30
40
50
60
70
80
90
100M
T
HU
UK
BG IT RO CY LV LU EE ES LT IE EL SE SK NL
CZ
HR PL
DK PT SI DE
FR BE FI AT
Coverage rate Share beyond the 4 month target
0
10
20
30
40
50
60
70
80
90
100
CY UK RO FR EL SI HR SK IE BG PT NL LV SE ES LU LT BE PL FI AT EE DE CZ IT DK HU MT
Positive and timely exits Positive situations after 6 months
The Youth Guarantee in light of changes in the world of work Youth Guarantee Intervention Models Sustainability and Relevance
44
To account for measuring issues in the monitoring data and because the main goal of
the YG was to lower youth unemployment and the prevalence of NEETs in general the
reduction from 2012 to 2017 in NEET rates and youth unemployment rates based on
Eurostat indicators is used as additional outcome measures
v Youth unemployment this measure gives the percentage of the 15-24 year old
young people in the labour force that are unemployed
vi NEET rates the NEET rate indicator is defined as the share of the youth popula-
tion (active or inactive) aged 15-24 that is not in employment education or
training
The distribution of these indicators is shown in Figure 7
Figure 7 Eurostat performance indicators by Member States 2012-2017
Source Eurostat (une_rt_a lfsi_neet_a)
36 Assessing the correlation between Youth Guarantee models
and performance
The goal of this section is to compare the performance of the YG as implemented in each
Member State across the clusters identified in section 34 and then to assess emerging
patterns This will be done by using box plots shown for each of the performance indica-
tors separately Box plots allow the comparison of the distribution of indicators across
clusters The median ie the observation in the middle in terms of outcomes (for in-
stance the middle value of all coverage rates within a cluster Figure 8 upper left panel)
is shown by the horizontal lines within each box Furthermore the size of the box shows
the location of the 50 closest observations to the median Observations outside this
box are shown in the graph by the so-called lsquowhiskersrsquo Extreme values that are far away
from the box are displayed as dots Figure 8 shows the distribution of performance
measures for the YG monitoring data
-5
0
5
10
15
20
FI AT
BE IT DE
FR LU NL
CY
DK
MT
RO SE EE UK SI LV CZ EL PL LT PT ES HR SK BG IE
HU
Reduction in youth unemployment Reduction in NEET rates
The Youth Guarantee in light of changes in the world of work Youth Guarantee Intervention Models Sustainability and Relevance
45
Figure 8 YG monitoring data performance indicators by clusters
Source Own analysis
The graph for the coverage rate (upper left panel) shows that clusters A and D have the
highest median coverage rates among the five clusters This appears quite natural as
these countries have had the lowest NEET rates at the onset of the YG making it easier
to cover a large portion of vulnerable youth compared to other countries Clusters B C
and E perform relatively similarly in terms of coverage with median values in the range
of 20 to 40 coverage rate despite the fact that clusters C and E had considerably larg-
er NEET rates when the YG was first introduced Among other factors these two clusters
have in common is that they received substantial funds from the EU to support YG
measures and that countries from both clusters enacted a significant number of youth-
related ALMP reforms
The upper right panel displays results for the share of participants still being in the pre-
paratory phase beyond the envisaged four months in each of the clusters A B D and E
this share is in the range of 45 to 50 in terms of the median values in cluster C this
value is 60 Clusters B and D show considerably more variation than the other clus-
ters The figure indicates therefore that the countries in cluster C appear to have put in
comparatively lower effort to upscaling their PES to provide YG services in time reflected
in the fact that these countries have the highest share of individuals in the preparatory
phase beyond the four month target
With respect to positive and timely exits (bottom left panel) there is no pronounced vari-
ation in terms of median outcomes across the clusters All of the clusters have positive
and timely exit rates of around 40 or slightly higher Finally looking at the share of
positive situations for YG participants after 6 months of leaving the programme (bottom
right panel) one can see that the median outcomes are quite similar for all clusters ex-
cept cluster B which has substantially lower positive outcomes after 6 months In addi-
tion there appear to be substantial differences in the within-cluster variation of this out-
The Youth Guarantee in light of changes in the world of work Youth Guarantee Intervention Models Sustainability and Relevance
46
come however this finding is probably due to the lack of data since for some Member
States these figures are not available (and coded as zero in the monitoring data) A simi-
lar reasoning can be used to explain the large variation between clusters A and D
Figure 9 Aggregate performance measures
Source Own analysis
Figure 9 investigates the reductions in youth unemployment rates and NEET rates from
2012 to 2017 respectively Both graphs display a similar pattern although the reduction
in youth unemployment is generally larger implying that a larger reduction was
achieved among those youth closer to the labour market Focusing on the cluster medi-
ans the figure indicates that cluster A ndash the cluster with the lowest initial NEET and un-
employment rates ndash shows the smallest decline Clusters B C and D show relatively
similar reductions in youth unemployment cluster E being at the top of the distribution
The picture is slightly different when looking at the reduction of NEET rates Here cluster
C has the largest median reduction in NEETs and clusters B D and E display similar per-
formance despite differences in variability Thus cluster E ndash the cluster with a combina-
tion of high initial NEET rates and more structural issues (such as a high share of dis-
couraged NEETs) ndash was more successful in reducing youth unemployment while clus-
ter C (with similarly high NEET rates for 2012 but lower educated NEETs and the highest
apprenticeship take-up rate in terms of timely exits among all clusters) was more suc-
cessful in reducing its NEET rates
4 Summary and conclusions
This report provides an updated overview of the implementation of the YG across EU
Member States based on the recent literature and data on the YG and European labour
markets On this basis six aspects of the Youth Guarantee implementation are dis-
cussed (1) financial resources for implementing the YG (2) the YG as part of national
policy making (3) youth labour market challenges (4) the heterogeneity of the NEET
population (5) the design and implementation features of the YG and (6) the role of the
apprenticeship system in the YG
The overall findings of the desk research and data analysis can be summarised as fol-
lows EU funding initiatives via the Youth Employment Initiative (YEI) and the European
Structural Fund (ESF) played a key role in supporting YG measures financially especially
for those countries suffering from high NEET rates and a significant economic downturn
or structural challenges Many of these countries increased spending on active labour
market policy which may be cautiously interpreted as an indirect effect of the YG In
some Member States the YG also fostered introduction of reforms of national youth poli-
The Youth Guarantee in light of changes in the world of work Youth Guarantee Intervention Models Sustainability and Relevance
47
cies improvements in monitoring systems for activation policies among young people
and the building of partnerships These changes are likely to outlast the YG initiative and
therefore provide sustained and ongoing benefits
Whereas these are substantive positive changes brought about by the YG not all of its
objectives were achieved First neither reducing labour market segmentation through
quality offers nor providing a remedy for imperfectly performing education systems was
fully achieved One reason was a prevalence of employment offers compared to relative-
ly few education or apprenticeship offers The low share of apprenticeship offers in some
Member States appears to be related to the existing institutional setup and STW transi-
tion regime increasing the prominence of the apprenticeship system would need to be
accompanied by broader institutional change Second several Member States were not
able to fully address the heterogeneity of the NEET population ndash especially those furthest
away from the labour market In contrast countries that performed well generally im-
proved the capacity of their Public Employment Services (PES) and developed partner-
ships to implement strong outreach programmes
Based on desk research of the six key aspects that are likely to influence the perfor-
mance of the YG as delivered by Member States a set of empirical indicators was de-
fined to measure the components of these six aspects using available quantitative and
qualitative data These empirical indicators feed into the main part of the analysis that
identifies the YG typology in terms of the key aspects specifically this approach groups
together Member States that share similar outputs across all the features included in the
analysis In practice the typology is derived from a two-step cluster analysis using an
agglomerative clustering algorithm
The first step of the typology discusses the similarity between Member States regarding
implementation-related and contextual features within six pre-defined sets of indicators
each corresponding to one of the six key aspects of the YG The cluster analysis gener-
ates different group compositions regarding Member States for each of the sets of empir-
ical indicators defined so a low-dimensional analysis is only partially informative This
result indicates that many aspects of the YG ndash and their interrelation ndash need to be con-
sidered in a comprehensive typology The second-step cluster analysis therefore simul-
taneously takes into account all of the 76 empirical indicators and identifies five final
clusters
Cluster A Member States with previous YG experience lower initial NEET rates ambi-
tious implementation and improved PES capacity low educated NEETs and diversified
offers (AT DK DE FI IE NL SE)
Cluster B Member States with intermediate NEET challenges strong outreach efforts by
the PES relatively poor monitoring data quality high NEET rates due to family responsi-
bilities and strong focus on employment offers (CZ EE FR HU RO UK)
Cluster C Member States hit by the economic recession with highest initial NEET rates
severe long-term unemployment large support via EU funding highest reform efforts
and highest entry rates into apprenticeship offers (CY EL ES IT PT)
Cluster D Member States characterised by relatively low initial NEET rates and short-
term unemployed rather than inactive NEETs some funding under YEI strong outreach
efforts through the PES and partnership approach and diversified offers with a stronger
focus on education offers (BE MT LT LU PL SI)
Cluster E Member States that joined the EU relatively recently with lsquotransitionalrsquo STW
regimes high initial NEET rates structural challenges and substantial EU funding focus
on employment offers rather high reform efforts (BG HR LV SK)
The Youth Guarantee in light of changes in the world of work Youth Guarantee Intervention Models Sustainability and Relevance
48
Obviously these explicit labels for the clusters tend to simplify the other factors of het-
erogeneity across Member States that determine the typology However some conclu-
sions can be drawn regarding the fit of underlying challenges to be addressed with the
policy response observed In particular it appears that countries in Cluster A C and D
reflected the challenges observed in the design and implementation of the YG to a higher
degree compared to cluster B and E as policies implemented ndash for example regarding
outreach efforts the extent of partnerships and the offer mix introduced ndash seem to bet-
ter match key factors of heterogeneity in the NEET population
Based on these insights the analysis continues with a correlation analysis relating the
identified YG models to basic performance indicators The findings highlight that there is
no evident pattern regarding the clustersrsquo performance in general Cluster A performs
well in terms of the NEET ldquocoveragerdquo rate but less well regarding the reduction in NEET
and unemployment rates over time Clusters B and D perform relatively similar across all
outcome measures although there is some variation that probably stems from meas-
urement issues in the monitoring data Cluster C shows the largest share of youth in the
preparatory phase beyond the envisaged four months but also the largest median de-
cline in NEET rates Cluster E has the lowest share of positive and timely exits but the
largest decline in youth unemployment out of all clusters
While the evidence is thus far from conclusive partly due to the number and complex
inter-relation of the aspects in which clusters differ the reportrsquos findings nonetheless
indicate that not only initial conditions but also the way Member States implement the
YG has affected its success
The Youth Guarantee in light of changes in the world of work Youth Guarantee Intervention Models Sustainability and Relevance
49
References
Andor L and Veselyacute L (2018) The EUrsquos Youth Guarantee a broadly accepted reform in
need of full implementation OSE paper series No 19
ANPAL (2017) Rapporto sullrsquoattuazione della Garanzia Giovani in Italia Rapporto
trimestrale n 4 Roma
ANPAL (2018) Monitoraggio sulla struttura e il funzionamento dei servizi per il lavoro
2017 Roma
Council of the European Union (2013) Council Recommendation of 22 April 2013 on es-
tablishing a Youth Guarantee Official Journal of the European Union Brussels
Department of Education and Skills (2016) Evaluation of the operation of the Youth Em-
ployment Initiative (YEI) element of the European Social Fund (ESF) Programme for Em-
ployability Inclusion and Learning (PEIL) 2014-2020
Department of Social Protection (DSP) (2014a) Pathways to Work - The Implementation
of the EU Council Recommendation for a Youth Guarantee
Department of Social Protection (DSP) (2016a) Member Statesrsquo response to 2013 Coun-
cil Recommendation on establishing a Youth Guarantee [Ireland]
Dheacuteret C and Roden J (2016) Towards a Europeanisation of Youth Employment Poli-
cies ndash A Comparative Analysis of Regional Youth Guarantee Policy Designs EPC Issue
Paper Ndeg81
Dheacuteret C and Morosi M (2015) lsquoOne Year After the Youth Guarantee Policy Fatigue or
Signs of Actionrsquo EPC Policy Brief Brussels European Policy Centre (EPC)
Doherty R (2018) lsquoWritten answer ndash Youth Guaranteersquo Daacuteil Eacuteireann Debate 22 March
2018
Eichhorst W Hinte H and Rinne U (2013) Youth Unemployment in Europe What to
Do about It IZA Policy Paper No 65 July httpftpizaorgpp65pdf
Employment Committee (EMCO) (2017) Ireland - 2017 EMCO Review on the Youth
Guarantee ndash Self-Assessment Questionnaire
Escudero V and E Loacutepez Mourelo (2017) The European Youth Guarantee A systematic
review of its implementation across countries Research Department Working Paper No
21 ILO Geneva
Eurofound (2013a) Young People and Temporary Employment in Europe Publications
Office of the European Union Luxembourg
Eurofound (2013b) Working Conditions of Young Entrants to the Labour Market Publica-
tions Office of the European Union Luxembourg
Eurofound (2014) Mapping Youth Transitions in Europe 2372014 Publications Office
of the European Union Luxembourg
Eurofound (2015a) Beyond the Youth Guarantee - Lessons Learned in the First Year of
Implementation Background Document prepared by Eurofound as a contribution to the
informal EPSCO meeting of 16-17 July 2015 Publications Office of the European Union
Luxembourg
Eurofound (2015b) Social Inclusion of Young People Publications Office of the European
Union Luxembourg
Eurofound (2016) Exploring the diversity of NEETs Publications Office of the European
Union Luxembourg
Eurofound (2017) Long-term unemployed youth Characteristics and policy responses
Publications Office of the European Union Luxembourg
The Youth Guarantee in light of changes in the world of work Youth Guarantee Intervention Models Sustainability and Relevance
50
European Alliance for Apprenticeship (2013) ldquoDeclaration of the European Social Part-
ners the European Commission and the Lithuanian Presidency of the Council of the Eu-
ropean Unionrdquo Brussels
European Commission (2011) Youth Opportunities Initiative ndash Communication From The
Commission To The European Parliament The Council The European Economic And So-
cial Committee And The Committee Of The Regions Brussels
European Commission (2013) Guidebook for Policy Planners and Practitioners on Ap-
prenticeship and Traineeship Schemes in EU27 December
European Commission (2016a) The Youth Guarantee and Youth Employment Initiative
three years on European Commission Directorate-General for Employment Social Af-
fairs and Inclusion Brussels
European Commission (2016b) Staff working documents 1 on ldquoThe Youth Guarantee
and Youth Employment Initiative three years onrdquo European Commission Directorate-
General for Employment Social Affairs and Inclusion Brussels
European Commission (2016c) Member Statesrsquo response to 2013 Council Recommenda-
tion on establishing a Youth Guarantee survey results unpublished
European Commission (2016d) Youth Guarantee Country by Country March 2016
European Commission (2017a) Report on PES Implementation of the Youth Guarantee
European Commission Directorate-General for Employment Social Affairs and Inclusion
Publications Office of the European Union Luxembourg
European Commission (2017b) Assessment Report on PES Capacity European Commis-
sion and Directorate-General for Employment Social Affairs and Inclusion Publications
Office of the European Union Luxembourg
European Commission (2017c) Education amp Training Monitor 2017 Comparative Report
European Commission (2017d) JobsPlus Youth
European Commission (2017e) Youth Guarantee Country by Country March 2017
European Commission (2017f) Draft Joint Employment Report from the Commission and
the Council accompanying the Communication from the Commission on the Annual
Growth Survey 2018 COM (2017) 674 final Brussels
European Commission (2017g) Employment and Social Developments in Europe 2017
European Commission (2017h) European Semester Thematic Factsheet ndash Employment
Protection Legislation
European Commission (2018a) The Youth Guarantee Country by Country Brussels
European Commission (2018b) Data collection for monitoring of Youth Guarantee
schemes Employment Social Affairs amp Inclusion
European Commission (2018c) Continued Education Offers in the Youth Guarantee -
Experience from the ground
European Commission (2018d) Traineeship offers under the Youth Guarantee
European Commission (2018e) Activation measures for young people in vulnerable situ-
ations - Experience from the ground
European Commission (2018f) Effective outreach to NEETs - Experience from the
ground
European Commission (2018g) Youth Guarantee amp Youth Employment Initiative Fact-
sheet 2762018
European Commission (2018h) Employment and entrepreneurship under the Youth
Guarantee ndash Experiences from the ground
The Youth Guarantee in light of changes in the world of work Youth Guarantee Intervention Models Sustainability and Relevance
51
European Commission (2018i) Employment and Social Developments in Europe 2018
European Commission (2018j) data on national commitments regarding the European
Alliance for Apprenticeships httpeceuropaeusocialmainjspcatId=1148amplangId=en
European Commission (2018k) ESF and YEI financial data by end 2017 submitted
through SFC2014 by Member States ndash Note EU amounts have been calculated on the
basis of the applicable co-financing rates
European Commission (2018l) Continued Education Offers under the Youth Guarantee ndash
Experience from the ground Brussels
European Court of Auditors (2017) Youth unemployment ndash have EU policies made a dif-
ference An assessment of the Youth Guarantee and the Youth Employment Initiative
Publications Office of the European Union Luxembourg
European Employment Policy Observatory (EEPO) (2015) EEPO Country Reports ndash Ire-
land Implementation of the 2013 Recommendation on establishing a Youth Guarantee
European Parliament (2015) Differential Treatment of Workers under 25 with a view to
their Access to the Labour Market Directorate General for Internal Policies Policy De-
partment A Economic and Scientific Policy
European Parliament (2017a) Workshop Summary Report Youth Guarantee and Youth
Employment Initiative Lessons from implementation Policy Department A Economy
and Scientific Policy European Parliament Brussels
European Parliament (2017b) Youth Employment Initiative Lessons from implementa-
tion Policy Department A Economy and Scientific Policy European Parliament Brussels
European Parliament (2017c) Youth Guarantee Lessons from implementation Policy
Department A Economy and Scientific Policy European Parliament Brussels
European Parliament (2018) Ensuring high-quality job creation from EU funding pro-
grammes How can the best practice of Horizon 2020 be better integrated into other
programmes (ESF Youth Guarantee Globalisation Fund) Policy Department for Budget-
ary Affairs Directorate General for Internal Policies of the Union
European Trade Union Confederation (2018) Boosting Unionsrsquo Participation to Guarantee
Quality Transitions and Employment to Young People in Europe
European Youth Forum (2017) Excluding youth a threat to our future
European Youth Forum (2018) Updated position on the Implementation of the Youth
Guarantee Brussels Belgium
Eurostat (2015) Being Young in Europe Today
Eurostat (2018) How common is temporary employment in your country
Ghirelli C E Havari G Santangelo and M Scettri (2019) ldquoDoes on-the-job Training
Help Graduates Find a Job Evidence from an Italian Regionrdquo forthcoming in the Inter-
national Journal of Manpower 40(1)
Gower J C (1971) A general coefficient of similarity and some of its properties in
Biometrics Vol 27 Nr 4 S 857ndash872
Gregg P and Tominey E (2005) The wage scar from male youth unemployment La-
bour Economics 12 487ndash509
Indecon (2016) Indecon Evaluation of JobBridge Activation Programme Report pre-
pared by Indecon International Research Economists and submitted to the Department
of Social Protection
International Labour Organisation and European Commission (2017) National Outreach
Strategy for non-registered young unemployed and inactive young people in Portugal
The Youth Guarantee in light of changes in the world of work Youth Guarantee Intervention Models Sustainability and Relevance
52
Leigh-Doyle S (2014) Can subsidised employment and work-first measures assist the
labour market integration of low-skilled unemployed youth Peer Country Comments
paper ndash Ireland EU Peer Review on lsquoEmplois drsquoavenirrsquo ndash Jobs with a futurersquo Scheme Par-
is (France) 10-11 February 2014
Milligan G W and Cooper M C (1985) An examination of procedures for determining
the number of clusters in a dataset Psychometrika 50 159-179
OrsquoReilly J Eichhorst W Gaacutebos A Hadjivassiliou K Lain D Leschke J McGuin-
ness S Kurekovaacute L M Nazio T Ortlieb R Russell H and Villa P (2015) lsquoFive
Characteristics of Youth Unemployment in Europe Flexibility Education Migration
Family Legacies and EU Policyrsquo SAGE Open January-March 2015 1ndash19
Pastore F (2018) Why is youth unemployment so high and different across countries
IZA World of Labor 2018 420 doi 1015185izawol420
Pastore F (2015) The Youth Experience Gap Explaining National Differences in the
School-to-Work Transition Heidelberg Springer International Publishing AG 2015
Pohl A and Walther A (2005) Tackling Disadvantage in Youth Transitions - A Themat-
ic Study on Policy Measures Concerning Disadvantaged Youth Report funded by the EU
Action Programme to combat Social Exclusion October
Pohl A and Walther A (2007) Activating the Disadvantaged ndash Variations in Address-
ing Youth Transitions across Europe International Journal of Lifelong Education 265
pp533-553
Quintini G and Martin S (2014) lsquoSame Same but Different School-to-Work Transi-
tions in Emerging and Advanced Economiesrsquo OECD Social Employment and Migration
Working Papers No 154 OECD Publishing
Quintini Glenda and Martin John P and Martin Seacutebastien (2007) The Changing Nature
of the School-to-Work Transition Process in OECD Countries WDA-HSG Discussion Paper
No 2007-2
Scarpetta S A Sonnet and Manfredi T (2010) lsquoRising Youth Unemployment During
The Crisis How to Prevent Negative Long-term Consequences on a Generationrsquo OECD
Social Employment and Migration Working Papers No 106
Stokes D (2016) Opening gateways to work for youth But can success be guaran-
teed Peer Country Comments Paper ndash Ireland EU Peer Review on The Guarantee for
Youth (a particular measure within the broader context of the Youth Guarantee) Paris
(France) 7-8 April 2016
Tosun J Unt M and Wadensjouml E (2017) Youth‐oriented Active Labour Market Poli-
cies Explaining Policy Effort in the Nordic and the Baltic States Social Policy amp Admin-
istration 51 598ndash616
Treadwell Shine K (2016) lsquoYouth Guarantee in Irelandrsquo Department of Social Protec-
tion presentation Youth Opportunities at EU Level Cork
Walther A (2006) Regimes of Youth Transitions Choice Flexibility and Security in
Young Peoples Experiences across different European Contexts Young Vol 14 No 2
pp119ndash139
Ward J H Jr (1963) Hierarchical Grouping to Optimize an Objective Function Journal
of the American Statistical Association 58 236ndash244
The Youth Guarantee in light of changes in the world of work Youth Guarantee Intervention Models Sustainability and Relevance
53
Annex
Table 3 List of indicators
Indicator name and time of measurement
Source Explanation
Financial resources for implementing the Youth Guarantee
Initial YEI allocation (2014-2017)
EC (2016b) Euros-tat (nama_10_gdp)
YEI allocation in of GDP
YEI+ESF EU eligible cost
(2017)
EC (2018k) Euros-
tat (nama_10_gdp) YEI+ESF eligible cost in of GDP
Other ESF eligible cost (2017)
EC (2018k) Euros-tat (nama_10_gdp)
Other ESF eligible cost in of GDP
Share of declared YEI+ESF funds (2017)
EC (2018k) Declared YEI+ESF funds as a share of eligible cost
Estimated cost of the YG (2015)
Eurofound (2015)
Binary indicator for medium cost (03-06 of
GDP) reference category low cost
Binary indicator for high cost (gt06 of GDP) reference category low cost
Change in ALMP expenditure (2012 to 2015)
Eurostat (lmp_expsumm)
Difference in ALMP expenditure in of GDP
YG as part of national policy-making
Number of youth-related ALMP reforms (2013-2016)
LABREF database Absolute number of reforms
Number of additional measures beyond Recom-mendation implemented in the context of the YG (2016)
EC (2016c)
Sum of binary indicators for additional measures regarding school dropout social and welfare policies volunteering social economy and oth-er
Share of YG exits with un-known destination (2016)
EC (2018b)
Binary indicator for an unknown share of 10-30 reference category 0-10
Binary indicator for an unknown share of more than 30 reference category 0-10
Share of unknown situations in the six month follow up
(2016)
EC (2018b)
Binary indicator for an unknown share of 40-99 reference category 0-39
Binary indicator for an unknown share of 100 reference category 0-39
Involvement of social part-ners (2016)
EC (2016c) Sum of binary indicators for the involvement of social partners in design implementation and evaluationmonitoring
Involvement of youth organi-sations (2016)
EC (2016c) Sum of binary indicators for the involvement of social partners in design implementation and
evaluationmonitoring
PES involvement of youth in design of YG (2017)
EC (2017a) Binary indicator
PES involvement of youth organisations in design of YG (2017)
EC (2017a) Binary indicator
Partnerships formed by PES (2017)
EC (2017a)
Sum of binary indicators for PES partnerships aimed at increasing information availability increasing workeducation opportunities and easing the transition into employment from educationunemployment
The Youth Guarantee in light of changes in the world of work Youth Guarantee Intervention Models Sustainability and Relevance
54
Indicator name and time of measurement
Source Explanation
Youth labour market challenges
Youth share of total popula-tion (2012)
Eurostat (lfsa_pgaed)
Number of youth (15-24) expressed as of total population
Youth-to-adult unemploy-ment ratio (2012)
Eurostat (une_rt_a) Youth (15-24) unemployment rate divided by adult unemployment rate (25-74)
NEET rate among 15-29 year
olds (2012)
Eurostat
(edat_lfse_21)
Total number of NEETs aged between 15 and 29
in of total youth population
Difference in temporary em-ployment shares (2012)
Eurostat (lfsi_pt_a) Difference in temporary employment rates be-tween youth (15-24) and adults (25-54)
Share of early school-leavers (2012)
Eurostat (edat_lfse_14)
Share of early school-leavers as of youth population (18-24)
Share of low-educated NEETs
(2012) Eurostat (edat_lfse_21)
Number of NEETs with low education back-
ground divided by total number of NEETs (15-24)
Share of medium-educated NEETs (2012)
Number of NEETs with medium education back-ground divided by total number of NEETs (15-24)
Share of employment offers (2016)
European Commis-sion (2018b)
Number of employment offers as of total offers typically made to participants
Share of timely exits into employment (2016)
European Commis-sion (2018b)
Number of exits into employment as of total timely exits from the YG
Share of education offers (2016)
European Commis-sion (2018b)
Number of education offers ias of total offers typically made to participants
Share of timely exits into education (2016)
European Commis-sion (2018b)
Number of exits into education as of total timely exits from the YG
The heterogeneity of the NEET population
Share of re-entrants among NEET (2013)
Eurofound (2016) Number of individuals in the respective group in of total NEET population
Share of short-term unem-ployed among NEET (2013)
Share of long-term unem-ployed among NEET (2013)
Share of individuals with illnessesdisabilities among NEET (2013)
Share of individuals with family responsibilities among NEET (2013)
Share of discouraged workers among NEET (2013)
PES responsibility regarding paying of unemployment benefits (2017)
European Commis-sion (2017b)
Binary indicator for the PES responsibility
PES responsibility regarding administering unemployment benefits (2017)
PES responsibility regarding other types of benefits
(2017)
The Youth Guarantee in light of changes in the world of work Youth Guarantee Intervention Models Sustainability and Relevance
55
Indicator name and time of measurement
Source Explanation
Number of responsibilities of the PES within the YG (2017)
European Commis-sion (2017a)
Sum of binary indicators for the PES being re-sponsible for managing the YG scheme regis-tering unemployed youth providing (placement) services to youth coordinating partners out-reach to NEETs follow-up of participants and design and maintenance of the monitoring scheme
PES outreach activities
(2017)
European Commis-
sion (2017a)
Binary indicator for the PES having awareness raising initiatives
Binary indicator for the PES having outreach programmes for pro-active work with schools
Binary indicator for the PES to cooperate with NGOs and youth organisations for outreach
Binary indicator for the PES to have specific outreach caseworkers
Binary indicator for the PES to have new points of entry (via new media)
Binary indicator for the PES to provide single-point servicesone-stop shops
Binary indicator for the PES to have mobile PES initiatives
Binary indicator for the PES to have follow-up programmes to reach out to YG drop-outs
PES programme for prevent-ing high school dropout (2017)
European Commis-sion (2017a)
Binary indicator
Design and implementation features of the Youth Guarantee
Eligible age group (2016) European Commis-sion (2016c)
Binary indicator for YG eligible age group being under 25 year and recent graduates reference category under 25
Binary indicator for YG eligible age group being under 26 reference category under 25
Binary indicator for YG eligible age group being
under 27 reference category under 25
Binary indicator for YG eligible age group being under 30 reference category under 25
Envisaged time-frame of intervention (2016)
European Commis-sion (2016c)
Binary indicator for the target time frame being below 4 months reference category 4 months
Binary indicator for the target time frame being above 4 months reference category 4 months
YG scheme specifically tar-geting long-term unemployed (2016)
Escudero and Mourelo (2017)
Binary indicator
Main YG provider (2016) European Commis-sion (2016c)
Binary indicator for the YG to be provided main-ly by the PES and other institutions reference category only PES
Binary indicator for the YG to be provided main-
ly by other institutions reference category only PES
The Youth Guarantee in light of changes in the world of work Youth Guarantee Intervention Models Sustainability and Relevance
56
Indicator name and time of measurement
Source Explanation
Degree to which online regis-
tration for the YG is possible (2016)
European Commis-sion (2016c)
Binary indicator for online registration being partly possible reference category not at all
Binary indicator for online registration being
possible everywhere reference category not at all
Legal entitlement to offer (2016)
European Commis-sion (2016c)
Binary indicator for whether there exists an entitlement for young people to receive an offer in line with or similar to the Youth Guarantee
Previous experience with a
YG-type of framework (2014)
European Commis-
sion (2016c)
Binary indicator for having recent experience with a YG-type of framework reference catego-ry none
Binary indicator for having longer experience with a YG-type of framework reference catego-ry none
Formal definition of quality
offer (2016)
European Commis-
sion (2016c)
Binary indicator having formally defined offer
quality
National quality guidelines (2017)
European Commis-sion (2017a)
Binary indicator having national quality guide-lines from the national administration to all PES officesother organisations involved in the YG
PES has YG-specific staff (2017)
European Commis-sion (2017a)
Binary indicator for having YG-specific staff
PES training (2017) European Commis-sion (2017a)
Binary indicator for the PES providing training specifically tailored working with youth
PES staff increase (2014-2017)
European Commis-sion (2017a)
Binary indicator for the PES having in-creasedunchanged staff from 2014-2017
PES has youth-specific tar-
gets (2017)
European Commis-
sion (2017a)
Binary indicator for the PES having youth-
specific targets
The role of the apprenticeship system in the YG
Share of firms with IVET participants (2010)
Eurostat (trng_cvt_34s)
Share of firms hiring initial vocational training participants expressed as a of all firms
Share of apprenticeship of-fers (2016)
European Commis-sion (2018b)
Number of offers of apprenticeships as of total offers typically made to participants
Share of timely exits into apprenticeships (2016)
European Commis-sion (2018b)
Number of exits into apprenticeships as of total timely exits from the YG
School-to-work transition cluster (2005)
PohlWalther (2005)
Binary indicator for STW being of type transi-tionalpost-socialist reference category miss-ing
Binary indicator for STW being of type sub-protective reference category missing
Binary indicator for STW being of type univer-salistic reference category missing
Binary indicator for STW being of type liberal reference category missing
Binary indicator for STW being of type employ-ment-centred reference category missing
Number of EAfA pledges (2018)
European Commis-sion (2018j)
Number of pledges to increase apprenticeships by firms or organisations normalised by the share of firms hiring IVETs
The Youth Guarantee in light of changes in the world of work Youth Guarantee Intervention Models Sustainability and Relevance
57
Table 4 Outcome cluster means
Cluster A Cluster B Cluster C Cluster D
ldquoCoveragerdquo rate (in ) 488 76 479 448
Share in preparatory phase beyond four
months (in )
433 284 606 519
Share of positive and timely exits (in ) 511 740 366 372
Share with positive situation after six
months (in )
576 521 562 60
Reduction in youth unemployment (in
-points)
37 121 145 62
Reduction in NEET rates (in -points) 11 42 43 18
Note This table shows cluster means (averages) for a cluster analysis solely based on the authorsrsquo measures
of performance (see section 35 for their description) The analysis creates Cluster A (AT BE DK IT LT LU
and SE) Cluster B (BG HU and MT) Cluster C (EL ES HR IE PT and SK) and cluster D (CY CZ DE EE FI
FR LV NL PL RO SI and UK)
The Youth Guarantee in light of changes in the world of work Youth Guarantee Intervention Models Sustainability and Relevance
58
HOW TO OBTAIN EU PUBLICATIONS
Free publications
bull one copy
via EU Bookshop (httpbookshopeuropaeu)
bull more than one copy or postersmaps
from the European Unionrsquos representations (httpeceuropaeurepresent_enhtm)
from the delegations in non-EU countries
(httpeeaseuropaeudelegationsindex_enhtm)
by contacting the Europe Direct service
(httpeuropaeueuropedirectindex_enhtm) or calling 00 800 6 7 8 9 10 11 (free-
phone number from anywhere in the EU) () () The information given is free as are most calls (though some operators phone boxes or hotels may charge you)
Priced publications
bull via EU Bookshop (httpbookshopeuropaeu)
Priced subscriptions
bull via one of the sales agents of the Publications Office of the European Union
(httppublicationseuropaeuothersagentsindex_enhtm)
doi 102767371432
KE-0
1-1
9-1
28-E
N-N

The Youth Guarantee in light of changes in the world of work Youth Guarantee Intervention Models Sustainability and Relevance
6
1 The Youth Guarantee background and outline of the
study
An essential aim of the policies that promote economic growth and social equity is to
ensure that young people are adequately educated that they enter the labour market
smoothly and that they then continue successfully through a lifetime in employment
through till retirement Young people face a wide range of structural challenges ndash fre-
quently perceived as increasingly complex ndash regarding their school-to-work (STW) tran-
sition and their long-term labour market prospects (Quintini et al 2007)
The economic recession of the late 2000s and its aftermath exacerbated these challeng-
es while the on-going Fourth Industrial Revolution comprising innovations in digitalisa-
tion artificial intelligence and robotics is constantly generating new and potentially fun-
damental challenges In general these developments have resulted in the following pat-
terns (i) a dramatic rise of youth unemployment in most countries during the recession
together with relatively low employment rates (ii) lengthier complex unstable and
non-linear STW transitions (iii) a deterioration in the quality of youth employment com-
bined with greater precariousness (iv) the patchy availability of quality work experience
which increasingly plays a crucial role in STW transitions (v) increased inactivity dis-
couragement and labour market detachment and (vi) greater labour market vulnerabil-
ity for disadvantaged youth such as the low-skilled migrants and young people with a
disability and more generally young people not in employment education or training
(NEETs)
While the wider macro-economic situation including business cycle fluctuations together
with the recession-related economic deterioration of the late 2000s and the subsequent
lsquojob-poorrsquo recovery accounts for these developments they are also rooted in persistent
structural deficiencies These include imperfectly performing education and training sys-
tems with poor outcomes and ensuing skills mismatches and segmented labour markets
(resulting in hollowing-out and skill polarisation) Sometimes poor PES (Public Employ-
ment Service) resources prevent the provision of youth-related tailored services in gen-
eral and in particular concentrating appropriate resources on vulnerable hard-to-reach
young people including certain sub-groups of NEETs (European Commission 2017a)
Yet unsatisfactory early labour market experience and lengthy unstable STW transitions
can lead to long-term lsquoscarringrsquo effects on young people in terms of reduced lifetime
earnings a higher probability of subsequent periods of unemployment a greater likeli-
hood of precarious employment and poorer health and well-being (Gregg and Tominey
2005 Scarpetta et al 2010 European Commission 2017a)
The remainder of this section describes the youth unemployment situation in the Euro-
pean Union (EU) and the challenges it poses for youth generally It also introduces the
Youth Guarantee (YG) and it summarises the joint response to these challenges under-
taken in the EU An explanation of the objectives and content of the present report as
well as the project in general concludes this section
11 The youth employment challenge in the European Union
In the second quarter of 2018 as many as approximately 34 million out of a total of
about 57 million young people in the 15-24 age group were unemployed in the EU (lat-
est available data from Eurostat) Whereas this constitutes a substantial decline from the
peak of 57 million in January 2013 the numbers still remain high the average youth
unemployment rate ndash ie the percentage of unemployment in the 15-24 age group com-
pared to the total labour force in that age group ndash stood at 168 in 2017 in the EU 28
The Youth Guarantee in light of changes in the world of work Youth Guarantee Intervention Models Sustainability and Relevance
7
and the NEET rate (the share of young people neither in employment nor in education or
training) was 109 If young people up to 29 years of age are included the average
rate of youth unemployment in the EU 28 was 127 while the NEET rate reached
134 (amounting to 177 specifically within the 25-29 age bracket) Figures 1 and 2 show the numbers for the 15-24 age group and illustrate the policy chal-
lenge of the youth unemployment rate (Figure 1) and the NEET rate (Figure 2) They
also show the substantial variation across EU countries as Figure 1 shows the youth
unemployment rate (Q2 2018) is below 10 in Austria Germany Estonia Denmark the
Netherlands the Czech Republic and Hungary In the majority of EU countries however
it ranges from 10 to 20 while it is above 30 and up to almost 40 in Italy Spain
and Greece Looking specifically at the most recent development by comparing it with
the Q2 2015 youth unemployment rate however the figure also shows a general down-
ward trend across all EU Member States which is quite pronounced in some countries
(Bulgaria Croatia Malta and Hungary for example)
Looking at the NEET rates in Figure 2 this downward trend in the most recent develop-
ment comparing 2015 and 2017 is also clearly visible Again there is notable variation
across Member States On average EU countries have a NEET rate of around 109 as
of 2017 and Ireland and Poland have NEET rates close to the EU average While the
Netherlands is the only EU country with a rate below 5 Croatia Romania Bulgaria
and Italy have the highest NEET rates with the rate reaching almost 20 in Italy
Figure 1 Youth unemployment rates (15-24 years old) in EU Member States
2015 compared to 2018
Source Authorsrsquo illustration based on latest available Eurostat data youth unemployment rate as percentage
of the active population quarterly average Countries are ordered by Q2 2015 rates Data is seasonally adjust-
ed For Italy and Cyprus the Q1 2018 rates are reported (latest available)
0
5
10
15
20
25
30
35
40
45
50
DE EE AT
DK
NL
CZ
MT LV UK LT SI LU HU IE
EU28 P
L
SE BE
RO FI BG FR SK PT
CY IT HR ES EL
2015Q2 2018Q2
The Youth Guarantee in light of changes in the world of work Youth Guarantee Intervention Models Sustainability and Relevance
8
Figure 2 Rates of young people (15-24 years old) not in employment educa-
tion or training (NEET) in EU Member States 2015 2017
Source Authorsrsquo illustration based on latest available Eurostat data annual averages Countries are in order of
the 2015 rates
In addition to these aggregate statistics the difficulties for youth in the STW transition
can be related to several structural challenges or market failures In particular these
concern (a) Labour market segmentation ndash a labour market pattern in which young
people are over-represented in temporary part-time non-permanent work (b) (under-)
performance of the education and training system ndash the low achievement of a substantial
section of youth in basic and lsquotransversalrsquo (transferable) skills (c) the limited availability
of lsquoqualityrsquo work experience and (d) insufficient capacity of the Public Employment Ser-
vice (PES) to ensure effective provision of tailored services and support for young people
(see European Commission 2017a)
12 The Youth Guarantee
The significant challenges that young people face in relation to fast smooth and effec-
tive STW transitions were exacerbated during and after the recession Since then they
have also acted as a catalyst for policy change in many Member States Accordingly a
YG was introduced following the 2013 Council Recommendation (Council of the European
Union 2013) Together with associated structural reforms of vocational education and
training (VET) and activation policies that are implemented across the EU its aim is to
address these challenges More specifically following a proposal from the European
Commission all Member States adhered to the establishment of the YG committing
themselves to giving every young person a good-quality offer of employment continuing
education or an apprenticeship or a traineeship within a period of four months of be-
coming unemployed or leaving formal education (Council of the European Union 2013)
The idea of YG style policies originated in the Nordic countries where such initiatives
were first implemented in Sweden in 1984 and then elsewhere in the 1990s (Norway in
1993 Denmark and Finland in 1996 see for example Escudero and Loacutepez Mourelo
2017)
In a Communication published three years after the launch of the YG by the European
Commission (2016a) it was observed that the YG had become a reality across the EU
Starting from January 2014 14 million young people had already registered in YG
schemes by 2016 Around nine million young people had taken up an offer the majority
0
5
10
15
20
25N
L
DK
DE
LU SE CZ
AT LT SI
MT LV FI EE PL
UK PT
HU
EU2
8 FR BE SK IE CY ES EL HR
RO
BG IT
2015 2017
The Youth Guarantee in light of changes in the world of work Youth Guarantee Intervention Models Sustainability and Relevance
9
of which were offers of employment almost two thirds of young people who left the YG
in 2015 took up an offer of employment education traineeship or apprenticeship While
the Commission Communication also concluded that the YG has significantly facilitated
structural reforms and innovation in policy design across Member States it also asserted
that nonetheless youth unemployment remained unacceptably high and many chal-
lenges still need to be addressed by Member States
13 Outline of the project and the present report
The main objective of this project is to undertake an up-to-date review of the current
approaches and implementation of the YG especially in view of new challenges for youth
in the changing world of work thereby providing the basis for a future YG model that is
both robust and dynamic
This report constitutes the first phase of the research project In the first phase a com-
prehensive desk review of existing documents and data was undertaken together with
the construction of a database of indicators for a cluster analysis as well as supplemen-
tary country case studies This approach is explained and implemented throughout this
report Aspects that guide the analysis are 1) the degree to which EU financing helped
to implement the YG 2) whether the YG became a sustainable part of national policy
making 3) the main challenges faced by young people in their transition into the labour
market 4) the heterogeneity of the NEET population 5) the design and implementation
features of the YG and 6) the role of apprenticeships in the YG Based on these insights
a typology of YG models is developed and the correlation of these types is assessed re-
garding measures of performance
The second phase of the research project will address the emerging challenges for young
peoplersquos transition into the world of work drawing extensively on consultation with
stakeholders both through an online survey and more importantly through a stakehold-
er seminar held in Brussels on Oct 1 2018 during which experiences with the YG were
exchanged and future challenges identified and discussed The results of this second
phase will be published in a separate report2 Together these two reports should inform
reflection on further developments of the YG
The report at hand is structured as follows Section 2 has two parts the first part identi-
fies the main characteristics of YG implementation in context while the second part de-
fines empirical indicators for these characteristics and their sub-dimensions In section 3
these indicators are used for constructing a typology of YG models also showing how the
different types of models differ regarding performance indicators Section 4 presents the
conclusions of the analysis
2 European Commission (forthcoming) The Youth Guarantee in light of changes in the world of work Emerging challenges related to young peoplersquos transition in the labour market
The Youth Guarantee in light of changes in the world of work Youth Guarantee Intervention Models Sustainability and Relevance
10
2 Implementation features of the YG and related indica-
tors
This section provides a comprehensive overview of the main features that characterise
YG implementation and assess the main features that are likely to determine its success
in Member States It has two steps first section 21 gives an overview of the relevant
dimensions of YG implementation along the six guiding aspects outlined above Based on
this characterisation section 22 discusses the ways in which each of these aspects can
be represented by a set of empirical indicators and which will be used in chapter 3 for a
YG typology The list of indicators for each of the six aspects comprise key contextual
characteristics for each Member State as well as implementation-related features such as
partnerships created as a result of YG implementation or the types of interventions
used In particular indicators that characterise Member States at the outset of the YG
(measured in 2012 or 2013) as well as the way the YG was implemented (mostly meas-
ured up until 2016) inform the typology Indicators of YG performance such as for ex-
ample the estimated proportion of the NEET population reached by the YG (the so-called
YG ldquocoverage raterdquo) are considered outcomes of the way Member States implemented
the YG
The presentation and discussion of intervention features and corresponding empirical
indicators in section 2 is complemented by selected information from five brief country
case studies The case studies are a supplementary element in the review exercise that
feeds into this chapter and they are meant to illustrate the intervention features dis-
cussed throughout the chapter in more detail for selected countries Based on an lsquoex
ante assessmentrsquo of a set of qualitative and quantitative country indicators the following
five countries were selected for case studies Austria Denmark Ireland Italy and Lat-
via The countries were selected firstly to cover (to the extent that is possible) the ex-
isting types of STW regimes and secondly to reflect the heterogeneity of the NEET popu-
lation NEET implementation is characterised by high and low NEET and youth unem-
ployment rates high and low YG coverage and the financial resources put into its im-
plementation3
21 Features of Youth Guarantee implementation
211 Financial resources for implementing the Youth Guarantee
The YG is not a funding programme in itself It is instead a political commitment sup-
ported among other ways by financial contributions from the EU and national budgets
as well as contributions from the private and non-profit sectors This section on the first
YG implementation aspect financial resources briefly outlines the relevance of these
different sources Specific focus will be given to the Youth Employment Initiative (YEI)
and the European Social Fund (ESF) as the main EU sources to financially underpin the
implementation of the YG
Youth Employment Initiative The YEI was established during three informal summits of
EU Heads of State in 2013-14 and then given euro32 billion for the 2014-15 period Eligi-
bility for measures funded through the YEI is confined to young people aged 16-254 who
3 It is important to emphasise the lsquoex-antersquo nature of case study selection they were chosen based on a preliminary set of indicators at the outset of the study whereas the full in-depth identi-fication and discussion of indicators ndash as presented in this chapter ndash and their analysis in Chapter 3
becomes a key element of the study itself 4 The upper age band is 29 in some Member States
The Youth Guarantee in light of changes in the world of work Youth Guarantee Intervention Models Sustainability and Relevance
11
are not in employment education or training (lsquoNEETsrsquo) Funding from the YEI was only
allocated to regions in those Member States where youth unemployment was higher than
25 in 20125 Since national allocations are based on the number of unemployed young
people in 2012 in these regions YEI funds were allocated to a varying extent to each
Member State based on their (regional) unemployment rates (European Commission
2016a) Spain was the largest recipient of the initial YEI specific allocation receiving
euro9435 million and Slovenia the smallest receiving euro92 million In 2015 in view of the
immensity of the youth-employment challenge the European Commission took steps to
ensure a quick mobilisation of its funds6 Specifically a higher pre-financing rate for the
euro32 billion YEI specific allocation in 2015 than for other ESF allocations (30 instead of
the original 1-15 of the specific allocation for other ESF funds) was introduced
This led to an amount of around euro1 billion in additional pre-financing to Member States
in 2015 (European Commission 2016a) In the summer of 2017 during the mid-term
review of the EUrsquos seven-year budget the YEI was extended until 2020 and it received
an additional financial allocation of euro12 billion In addition it was targeted at regions
where youth unemployment still exceeded 25 in 2016 (Andor and Veselyacute 2018) Ac-
cording to the Commissionrsquos report in October 2016 the YEI is seen by Member States
as a key mechanism through which to operationalise national Youth Guarantee schemes
ldquoIn some cases the YEI is being used to support most or all measures planned under the
YG schemes while in others it is one funding source amongst others Countries where
large shares of YG funding comes from the YEI include Lithuania ndash where 23 of all YG
actions are supported by the YEI Poland ndash where 34 of all YG actions YEI funded and
Spain ndash where 80 of all YG actions are funded through the YEIrdquo (European Commis-
sion 2016b p89)
YEI funds were provided from the EU budget as a top-up to the already available ESF
funds for 2014-2020 to provide additional support for programmes with a specific focus
on NEETs (European Court of Auditors 2017) However the funding allocated to each
Member State under the YEI has to be matched by an equal amount from the respective
Member State allocations in the ESF 2014-20 budget This holds for the initial allocation
in 2013 as well as the additional funds in 2017 Hence the total budget of the YEI (for
all eligible EU Member States) now totals euro88 billion for the period 2014-2020
European Social Fund In addition to ESF funds that were directly used to match the YEI
contributions (see above) some Member States also utilised additional funds from the
ESF for further employment-related programmes7 directly or indirectly benefiting youth
but with no specific focus on NEETs In contrast to YEI funds which are intended to di-
rectly support NEETs ESF funds may also be used to support structural reforms In total
Andor and Veselyacute (2018) estimate that approximately euro14-15 billion from the EU budget
over the period 2014-20 financed the implementation of the YG through the YEI and ESF
5 The exact methodology for allocating Youth Employment Initiative funds among Member States is set out in Annexe VIII to the lsquoCommon Provisions Regulationrsquo ie Regulation (EU) No 13032013 of 17 December 2013 OJ L 347 20122013 p 320ndash469
6 An additional reason was that many Member States ldquoraised the issue that they dont have the national budget necessary to pay advance funding to projects working with young peoplerdquo (source httpeuropaeurapidpress-release_MEMO-15-5020_enhtm)
7 The ESF is Europersquos main instrument for supporting jobs helping people get better jobs and en-suring fairer job opportunities for all EU citizens (European Parliament 2018)
The Youth Guarantee in light of changes in the world of work Youth Guarantee Intervention Models Sustainability and Relevance
12
funds8 This is a significant share of the total ESF funding of euro864 billion available to MS
for the 2014-2020 period (including the YEI)
Country case study Austria
Young people in Austria were already benefiting from special attention before the intro-
duction of the YG Several measures were set up to facilitate the transition from educa-
tion to the labour market in particular through a well-established apprenticeship sys-
tem Reducing the age for early school-leaving existed before the 2013 Council Recom-
mendation The long-standing existence of policy measures for young people is reflected
in Austriarsquos relatively successful performance as regards youth employment and STW
transition The labour market situation of young people in Austria is better than the EU
average and it continues to improve The rate of youth unemployment (15-24 years old)
went down from 106 in 2015 to 98 in 2017 which is significantly below the EU
average (168) This good performance is also reflected in the number of NEETs The
NEET rate in Austria was at 65 in 2017 well below the EU average (109)
In addition evidence shows that Austria is performing better than the rest of the EU as
regards its YG implementation (European Commission 2018a) It is acknowledged that
Austria has established a comprehensive Youth Guarantee based on effective partner-
ships targeted policy measures and a robust monitoring system with interconnected
administrative data (European Commission 2016a) The countryrsquos performance is par-
ticularly outstanding in two dimensions the NEET coverage and the delivery of a good
quality offer
Data for 2016 shows that an estimated 829 of NEETs in Austria are reached by the
YG which is the highest figure amongst Member States and almost double the EU aver-
age (425)9 In addition this ldquocoverage indicatorrdquo has been at consistently high levels
since the start of the YG A second more suggestive but somewhat less reliable way of
looking at the performance of a YG scheme is trying to estimate the rate of recycling
ie the percentage of NEETS entering the YG with previous YG experience10 This recy-
cling rate is rather high in Austria (739 compared to 341 for EU 28) suggesting
that employment services have little difficulty in lsquostaying in touchrsquo with young people
who already had a YG experience
The Austrian YG provides a wide range of offers (European Commission 2016d) It
comprises apprenticeship traineeship education and employment offers that are tar-
geted specifically at young people such as for example supra-company apprentice-
ships or production schools Additionally the general education training apprenticeship
and employment offers are open to young people
At the same time it is to be noted that Austria still faces difficulties in integrating cer-
tain sub-groups into the labour market in particular women migrants and young peo-
8 This figure is slightly higher than the euro127 billion stated by the Commission in its October 2016 report which YEI and the ESF are directly investing in ldquolabour market integration measures for young people in the programming period 2014-2020rdquo (European Commission 2016a p 12)
9 These figures are based on the indicator average annual stock of young people in the YG pre-paratory phase NEET population (annual average) included in the Indicator Framework for Moni-toring the Youth Guarantee This indicator combines administrative and survey data Whilst this is
not ideal the indicator is useful to give an approximate indication of the proportion of NEETs regis-tered in the YG scheme at any point during the year Results should therefore be interpreted as an estimation rather than a definitive measurement of the extent to which YG schemes achieve the objective of reaching all young people that become or are already NEET
10 The recycling rate is only experimental data and not officially part of the YG monitoring dataset
The Youth Guarantee in light of changes in the world of work Youth Guarantee Intervention Models Sustainability and Relevance
13
ple with low skills (European Commission 2018a) Ongoing efforts for these target
groups need to be intensified as recent measures have not led to sufficient results yet
Other EU sources Several other EU budget lines support employment- and education-
related programmes in Member States including the European Regional Development
Fund (ERDF) the ERASMUS programme as well as Horizon 2020 and the European Glob-
alisation Adjustment Fund (EGF) For an analysis of their job-creation potential and their
relation to the ESFYEI see European Parliament (2018) In addition a range of smaller
EU programmes finance employment-related measures for (young) people such as the
European Solidarity Corps or the EU Programme for Employment and Social Innovation
(EaSI)11
Three aspects deserve to be highlighted regarding differences across Member States in
financing the implementation of YG activities
First as the 2017 European Court of Auditors report on ldquoYouth unemployment ndash have EU
policies made a differencerdquo highlights the level of YEIESF funding available would only
address a small proportion of the required amount for the full implementation of a YG
Member States therefore need to leverage significant additional resources from national
budgets to achieve this goal However so far there has been ldquono assessment of cost
and available funding by Member Statesrdquo (European Court of Auditors 2017)
Second the extent to which the YEIESF funds simply financed youth-related schemes
that already existed prior to the YG is unclear They may be funded either by other EU
schemes or Member State national budgets The European Court of Auditors states that
YEIESF should ldquonot replace public or equivalent expenditure by the Member Statesrdquo
(ibid) However the Commission notes in its reply to the report that the YEI provisions
do not deny to Member States finance for measures previously supported by the national
budget or measures that require Member States to increase public spending regarding
certain types of measures or target groups At the same time the European Court of
Auditors analysis of seven Member Statesrsquo Operational Plans for the YEIESF showed that
ldquo[hellip] the majority of the measures which were to receive YEI financing already existed
prior to the introduction of the Youth Guarantee [hellip]rdquo (ibid p 54) In fact even in 2011
the Youth Opportunities Initiative proposed by the European Commission (2011) allowed
the governments of Member States to make increased use of the ESF for promoting
youth employment (Tosun et al 2017) The degree to which additional funds under the
YEIESF actually presented additional funds for Member States may therefore vary
greatly and there is without doubt also some variation in Member States as to whether
this caused them to step up their efforts regarding youth employment
Third despite the frontloading of the YEI in 2017 take-up of the YEI developed slowly in
its early phases of implementation (European Parliament 2017b) According to Andor
and Veselyacute (2018) two aspects delayed the implementation of the YG in the start from a
financial perspective firstly it took Member States and the Commission time to design
and review the lsquoOperational Programmesrsquo (OPs) specifying how YEI and ESF money
would be used Most of the Operational Programmes were only approved in late 2014 or
even in 2015 Secondly several Member States had accumulated delays in absorbing EU
structural funds for 2007-13 Hence they focused their efforts on implementing these
schemes in order not to lose these allocations (due to the so-called de-commitment
11 For instance one of the aims of the EaSI programme is to enhance mobility via the ldquoYour first Eures jobrdquo As these programmes are rather small in scale and not directly linked to the YG the study does not provide a detailed overview (see European Parliamentary Research Service 2017)
The Youth Guarantee in light of changes in the world of work Youth Guarantee Intervention Models Sustainability and Relevance
14
rule) Only afterwards did they move on to use YEI funding An assessment commis-
sioned by the European Parliament concluded that most delays that limited the impact of
the increased pre-financing were due to procedural rather than financial problems (Euro-
pean Parliament 2017b)
212 The Youth Guarantee as part of national policy-making
A variety of aspects may be used to determine the degree to which the YG has become a
part of national policy making and hence whether the changes introduced by the YG are
likely to be sustained over time The following discussion focuses on three measurable
factors related to the sustainability of YG-related policy changes Firstly whether the
Council Recommendation has spurred on Member States to introduce youth-related la-
bour-market reforms rather than merely set up an additional offer of active labour mar-
ket measures Secondly whether Member States have introduced monitoring and evalu-
ation systems to assess the effectiveness of YG-related measures Thirdly to find the
degree to which Member States have attempted to build up (lasting) partnerships be-
tween all relevant stakeholders (such as public and private employment services gov-
ernment authorities education and training institutions and so on)
The introduction of youth-related labour-market reforms the first key factor reflects
whether Member States have attempted to embed the main guidelines of the Council
Recommendation in their national policies In particular whether Member States have
used the political momentum created by the YG to introduce structural reforms to mod-
ernise their overall labour market policies in support of young people Such reforms con-
cern the functioning of the labour market (its institutional and regulatory framework)
and are aimed at better matching supply with demand The implementation of structural
reforms can be considered a key determinant as to whether the YG can have a long-
term sustainable impact in Member States beyond the YEI and the ESF funding associ-
ated with the YG
Information on the nature and intensity of youth-related active labour market policy re-
forms provided in the LABREF database indicates that EU Member States are imple-
menting the Recommendationrsquos policy guidelines unevenly Figure 3 displays the number
of active labour market policy reforms between 2013 and 2016 across Member States
The figure indicates for instance that virtually all Member States implemented addition-
al ALMP reforms for youth and that several Member States ndash such as Bulgaria France
Latvia Lithuania and Greece ndash have a relatively broad scope of reforms
Figure 3 Absolute number of youth-related active labour market reforms be-
tween 2013 and 2016
Note This figure shows the absolute number of youth-related active labour market policy reforms in the EU
Member States between 2013 and 2016 Identification of youth-related reforms is done via the indicator ldquoIs
the measure targeted at young peoplerdquo in the LABREF database
0
2
4
6
8
10
NL SI CZ
DE
LU FI HR
DK IE UK
AT PL
BE EE MT
RO SK ES HU CY IT PT SE BG FR LV LT EL
The Youth Guarantee in light of changes in the world of work Youth Guarantee Intervention Models Sustainability and Relevance
15
The introduction of monitoring and evaluation systems the fifth principal element in the
Council Recommendation on the YG and the strict reporting guidelines were aimed at
fostering a culture of policy analysis Despite the additional administrative burden asso-
ciated with reporting activities requiring Member States to obtain administrative data on
in- and outflows from the YG as well as follow-up data the creation of a monitoring and
evaluation system is one of the effects that people in charge of implementing the YG at
the country level have recognised as being positive12 In fact many Member States did
not have specialised monitoring systems allowing to track youth on the labour market
and in education and evaluate activation measures for youth before the Council Rec-
ommendation
At the same time the capacity of countries to monitor what happens to young people
after leaving the YG and the corresponding data quality varies in fact a substantial
share of Member States do not know about young peoplersquos reasons for exiting either the
YG or the labour market nor do they register the educational status of previous partici-
pants after they exited This issue is most likely due to a pre-YG lack of policy evaluation
culture or a lack of capacity to collect data An additional aspect to consider in this re-
gard is whether Member States attempted to evaluate the effectiveness of specific
measures under the YG using rigorous impact evaluations The EU helps Member States
conduct impact evaluations on interventions funded by the European Commission name-
ly the ESF and the YEI for example by setting up the Centre for Research on Impact
Evaluation (CRIE) which provides scientific expertise and methodological support to
Member States conducting an impact evaluation (see European Commission (2016b) for
details) Escudero and Murelo (2017) provide an overview of various impact evaluations
of pilot programmes that were set up within the context of the European YG However
there does not so far seem to be a systematic account of ongoing or completed impact
evaluations of YG instruments
Partnership approach Most Member States make a reference to the partnership ap-
proach in their YG Implementation Plan (YGIP) Table 1 shows the clear differences
based on an assessment of ten selected Member States conducted by Eurofound
(2015) In addition to the differences within countries the findings based on this sample
of ten countries also indicate that cooperation with some stakeholders seems to be more
widespread than it is with others For instance cooperation between ministries particu-
larly the ones dealing with employment and education policies is rather well developed
In comparison cooperation is less frequent with non-institutional stakeholders such as
the third sector notably NGOs social partners and youth organisations In 2016 the
European Commissionrsquos three-year assessment came to the conclusion that ldquowhile many
Member States have taken steps to support the involvement of a wide range of actors
and established institutional frameworks for partnerships the functioning of these part-
nerships remains a challenge due to problems of design which affects their ability to
deliverrdquo (European Commission 2016b p24)
In addition previous studies (eg Dheacuteret and Roden 2016) highlight the strong path-
dependency in how countries or regions apply the partnership approach While some
countries have put new structures in place to monitor the progress of the YG implemen-
tation and coordinate the work of relevant stakeholders other countries tend to have
consolidated partnerships that existed before the YG was established
12 Information collected through the interviews organised in the context of the EPC Task Force on Youth Employment The results of these interviews are further presented and developed in Dheacuteret and Roden (2016)
The Youth Guarantee in light of changes in the world of work Youth Guarantee Intervention Models Sustainability and Relevance
16
There also seems to be some discrepancy between the involvement of stakeholders in
the design implementation and monitoring of the YG In some Member States stake-
holders in the third sector particularly youth organisations reported that they were only
consulted in the design phase and never again (European Youth Forum 2018)13 Recent-
ly more positive evidence is provided by ETUC (2018) showing that the great majority
of interviewed representatives of unions was at least `somewhat satisfiedrsquo with their
degree of participation in the YG
Table 1 Overview of actors involved in implementing the YG in 10 Member
States
Min
istr
y
of
Em
plo
ym
ent
(or
equiv
ale
nt)
Min
istr
y
responsib
le
for
socia
l benefits
Min
istr
yo
rganis
ation
re-
sponsib
le for
ESFY
EI
Min
istr
y o
f Education
Min
istr
y
responsib
le
for
youth
work
Oth
er
min
istr
y
(justice
defe
nce
inte
rior
health
housin
g)
PES
(either
at
national
regio
nal or
local le
vel)
Youth
org
anis
ation (r
epre
-
senta
tive)
Local
youth
org
anis
ation
(im
ple
menta
tion)
Socia
l part
ners
Education s
ecto
r
BE XX XX X XX X XXX X X XX
BG XXX XX XX XX XX XX XX XX XX XX
EE XX X XX XXX XXX X XX XX XX X X
EL XXX X X XX X X
ES XXX
XXX
(em-ploy-ment)
XX XX XX XX XX X XX X
FR XXX
XXX (em-ploy-
ment)
XX (em-ploy-
ment)
XX XX X XX X
IE XX XXX XX XX XX XX X X X
IT XXX XXX XX XX XX XX X X XXX X
PL XX X XXX X XX X
UK XX XX (LEP)
X X XX X X
Source Eurofound (2015a)
Note XXX means authoritycoordinator XX means principal partner-stakeholders and X means associated
partnerstakeholder A distinction needs to be made in Belgium between the federal and local authori-
tyregional level social benefits are (still) the responsibility of the federal government while education and
PES are the responsibility of the regionslocal authorities Similar to Belgium in Spain many responsibilities
are delegated to the regional level LEPs - Local Enterprise Partnerships
13 Some more evidence from the European Youth Forum on involvement for a sub-set of countries can be found under httptoolsyouthforumorgyouth-guarantee
The Youth Guarantee in light of changes in the world of work Youth Guarantee Intervention Models Sustainability and Relevance
17
213 Youth labour market challenges
The third key factor of YG implementation is its contribution to and targeting of the
young peoplersquos labour market challenges Given that the recession of the late 2000s (the
lsquoGreat Recessionrsquo) and its aftermath exacerbated the difficulties that young people face
in their STW transition and labour market career this section presents a brief discussion
of these challenges and how YG interventions have sought to address them
Challenge 1 ndash Youth unemployment long-term unemployment and inactivity The Great
Recession and its immediate effects on youth unemployment ndash highlighted in section 1 ndash
also resulted in an increase in youth long-term unemployment which although gradual-
ly falling from its peak of 8 in 2013 has remained high (European Parliament 2015
European Commission 2017a) Long-term unemployment can result in well-documented
lifelong consequences and lsquoscarringrsquo effects on those young people who remain unem-
ployed for some time (Eurofound 2015b Eurostat 2015) In addition a considerable
proportion of the EUrsquos youth remain economically inactive Whereas a large share of
them are in education or training many are discouraged and have become detached
from the labour market or they have not entered it after leaving education
The macroeconomic state of the economy also affects the level of demand for young
people where employer absorption capacity in providing training places (such as appren-
ticeships) and jobs for young people may be limited (Eurofound 2015a) In addition the
highly variable youth labour market performance across the EU before during and after
the Great Recession has been attributed to many factors These include differences in
the institutional and structural set-up of Member States regarding the education and
training systems (initial) education and vocational training (IVET) labour market insti-
tutions and labour market policy (such as employment protection legislation - EPL) and
active labour market policies (ALMPs) and social welfare systems (Eichhorst et al 2013
OrsquoReilly et al 2015 Pohl and Walther 2005 Pohl and Walther 2007)
The introduction of the YG ndash and its underlying philosophy of early intervention with a
personalised approach ndash across the EU sought to address the issue of rising youth un-
employment including long-term unemployment and inactivity (Eurofound 2015a Eu-
ropean Commission 2016a) The YG approach precisely addresses these challenges
providing unemployed inactive youth with a short-term activation and a perspective in
employment or education
In the five years since the launch of the YG youth unemployment rates have improved
considerably as highlighted in section 1 (see also for example the European Commis-
sion 2018g Eurostat 2018) Although this development is partially attributable to the
recovery from the Great Recession according to the European Commission this is also
partially due to the YG together with the effect of the Youth Employment Initiative (YEI)
(European Commission 2018g)
Challenge 2 ndash Labour market segmentation A key challenge facing youth is labour mar-
ket segmentation often resulting in young people being over-represented in temporary
or part-time forms employment in particular involuntary part-time casual a-typical or
precarious work (European Commission 2017a 2017g and 2018i Eurostat 2015 and
2018) Although such non-standard forms of employment have increased for all age
groups the more recent cohorts of younger workers have been particularly adversely
affected (European Commission 2017g) Specifically although in 1995 23 of younger
workers in the then EU 15 were on non-standard contracts by 2016 this proportion had
increased to 32 for the same age group (European Commission 2017g)
This trend is reflected across the EU 28 where over the last decade non-standard forms
of employment among younger workers rose from 26 to 29 with 35 million fewer
The Youth Guarantee in light of changes in the world of work Youth Guarantee Intervention Models Sustainability and Relevance
18
employees on permanent full-time contracts and 12 million more on non-standard con-
tracts (European Commission 2017g) Moreover younger workers in 2016 were still
more than twice as likely to be working full-time on temporary contracts (12) than
workers in their prime and older workers (5) (European Commission 2017g)
In general young people are more likely to find themselves as labour market lsquooutsidersrsquo
with little access to permanent contracts with high levels of employment protection and
workersrsquo rights especially compared to their older counterparts (European Parliament
2015 European Commission 2017a 2017g and 2018j) Since access to stable employ-
ment with positive career prospects matters young peoplersquos successful transition into
fully independent lives is one of the primary objectives of the YG (Council of the Europe-
an Union 2013 Eurofound 2014)
The degree of lsquodualismrsquo of labour markets varies across Member States recent analysis
suggests that four in ten European young people are on temporary contracts rising to
over 60 in many Southern and Eastern European countries (European Court of Audi-
tors 2017) While temporary employment can either be a lsquostepping stonersquo or a lsquotraprsquo in
terms of STW transitions recent data suggests that the former is rarely the case (Euro-
pean Commission 2015 2017a and 2017g) the average proportion of temporary work-
ers transitioning into permanent employment fell from 28 in 2007 to 23 in 2013
This however masks major country variations ranging from 10 in France to for ex-
ample 65 in Estonia (ibid)
Predictably when studying age groups the probability of moving from temporary to
permanent contracts over one year is lowest for young people aged 15-24 (European
Commission 2016g) However it is worth noting that transition rates from temporary to
permanent contracts among young people have recently either increased or remained
stable in most Member States where data are available (European Commission 2017g)
In most Member States these rates are still lower than 20 and in countries such as
Poland and Greece temporary employment lsquohas almost no stepping-stone functionrsquo (Eu-
ropean Commission 2017g) Countries such as France and Spain with highly segmented
labour markets and high shares of (young) workers on fixed-term contracts have been
also characterised by low transition rates towards permanent employment (European
Commission 2017h Eurofound 2013a and 2013b)
Country case study Ireland
Ireland was one of the EU countries most adversely affected by the Great Recession
which resulted in high levels of youth unemployment As a result addressing youth
unemployment especially long-term unemployment has been a key challenge (EEPO
2015) The youth unemployment rate more than tripled from about 10 in 2008-09 to
a peak of just over 33 in mid-2012 (DSP 2014a) Likewise the NEET rate for those
aged 15-24 was 18 in 2014 although the picture is more nuanced especially in re-
lation to inactive NEETs (DSP 2014a) Specifically excluding students and the young
unemployed inactive NEETs account for a relatively small proportion (about 3) of
the youth population (DSP 2014a EEPO 2015) Most tend to be lone parentscarers
(60) and people with a disability (20) (DSP 2014a EEPO 2015) Thanks to Ire-
landrsquos universal means-tested unemployment benefit system for those aged over 18
the vast majority of young NEETs are registered with the benefitsemployment service
(EMCO 2017)
Against this background the Youth Guarantee (YG) has two target groups (i) poorly
qualified young people aged under 18 who are in turn provided with a quality second-
chance educationaltraining pathway outside the school system (for example
Youthreach) or are supported in re-entering the school system and (ii) unemployed
The Youth Guarantee in light of changes in the world of work Youth Guarantee Intervention Models Sustainability and Relevance
19
young people aged 18-24 with a particular focus on long-term unemployed youth
(EEPO 2015 Stokes 2016) To this end the YG offer is quite comprehensive and
comprises a number of programmes ndash some pre-existing (for example the JobBridge
internship programme) and others such as the First Steps Youth Developmental In-
ternship Programme (for the most disadvantaged young people) and JobsPlus Youth
(an employer subsidy scheme) introduced as part of the YG (DSP 2014a Leigh-Doyle
2014 Treadwell Shine 2016)
The delivery of the Irish YG seems to be integrated within the overall policy approach
towards youth employment with most measures aimed at young jobseekers predating
its introduction (DSP 2016a) This embedding of the YG within the existing youth em-
ployment policy framework means there is a close alignment between the two Indeed
Irelandrsquos YG builds upon existing services and programmes but it crucially entails ear-
lier intervention for and a tailored approach to the young unemployed with a strong
focus on enhancing processespolicies to help the young unemployed enter sustainable
employment receive appropriate training andor gain relevant work experience (DSP
2014a Treadwell Shine 2016 DohertyDSP 2018) YG-related partnership arrange-
ments are also situated within the main policy making process which in turn means
that the implementation of the YG is policy based as opposed to project based
(ESFYEI) (EMCO 2017) As such the YG and associated measures are likely to be
sustained over time
Ireland has made notable progress in implementing the YG with a substantial reduc-
tion in the number of unemployed youth In general there has been intensified en-
gagement with young people while access to different programmes has been enhanced
and partnerships strengthened (European Commission 2018a) Evaluations of YG-
related programmes such as the Tuacutes and Job-Bridge work placementinternship pro-
grammes have shown positive outcomes (Leigh-Doyle 2014 Indecon 2016 Depart-
ment of Education and Skills 2016) The Irish YG seems to be quite successful in de-
livering sustainable outcomes which indicates that the offers provided are of good
quality (European Commission 2018a)
However a number of challenges remain For example the uptake of key measures
such as JobsPlus Youth and the First Steps Youth Development Internship has not
been as extensive as it could in view of the youth cohort concerned and there is also
a lack of sufficient training places (DSP 2016a European Commission 2017f) Em-
ployer engagement particularly in the provision of employment opportunities for the
most disadvantaged youth also remains a challenge as does the timeliness of YG of-
fers (European Commission 2017f and 2018a EMCO 2017)
In principle one response to the challenge of labour market segmentation would be
structural reforms such as for example the reforms Spain implemented in the aftermath
of the crisis Given that the YG was implemented at the height of the recession most
Member States focused on a ldquowork firstrdquo approach to give short-term relief to unem-
ployed young people specifically the implementation of subsidised employment pro-
grammes many specifically targeted at young people at risk has been quite common
across the EU and hiring incentives have featured prominently in many YG plans (Euro-
pean Commission 2018h) Many of these programmes involve incentives such as wage
subsidies aimed at encouraging employers to offer employment to young people
In general countries promoting employment offers under the YG use a form of employ-
ment subsidy which typically involves supplementing the individual labour costs of the
person employed over a fixed period whilst the majority of the labour costs remain cov-
ered by the employer (European Commission 2018h - See Annex Points 9 and 10)
The Youth Guarantee in light of changes in the world of work Youth Guarantee Intervention Models Sustainability and Relevance
20
These wage subsidies also play a crucial role in many countries (including Belgium
France Estonia Greece the Netherlands Poland Spain Sweden and Denmark) in facili-
tating the acquisition of work experience andor entry in their first job by young people
and this especially helps young people from disadvantaged backgrounds (Eurofound
2013b 2016 and 2017 European Commission 2018d and 2018h) In addition the
broader set of labour market reforms accompanying the YG (see previous subsections)
has contributed to addressing labour market dualism in many Member States
Challenge 3 ndash Poor performance of education and training systems (including skills mis-
matches and the limited availability of quality work experience) Another key structural
challenge is given by an unsatisfactory performance in the education and training sys-
tems including VET this means that young people do not have appropriate education
when they graduate and when they enter the labour market which in turn exacerbates
skills mismatches and adversely affects their employability (for example Quintini et al
2007 Quintini and Martin 2014) Indeed the mismatch between (youth) labour supply
and demand seems to be a growing challenge for instance there is growing concern
about graduate under-utilisation and the fact that that higher education graduates expe-
rience considerable and persistent occupational vertical skills mismatch (234 in 2016)
by working in jobs typically requiring a lower level qualification (European Commission
2017c) However it is also worth pointing out that higher education graduates have bet-
ter employment rates (828) than young people with upper secondary education quali-
fications (726) (European Commission 2017c)
Another major challenge in light of rapid and constant technological change relates to
the need for effective skills anticipation against the largely unknown future evolution of
work and work organisation This is in turn is closely related to the need to ensure that
the education and training systems across the EU respond accordingly by being lsquoagilersquo
and by equipping young people with relevant skills including lsquodynamicrsquo skills such as
adaptability resilience and career management skills This concern was also reflected in
the latest European Commissionrsquos report on Employment and Social Developments in
Europe according to which ldquomuch will depend on whether or not education and training
systems are agile enough to respond appropriately to fast-changing technological oppor-
tunitiesrdquo (European Commission 2018g)
In recent years there has been a concerted effort to reform or strengthen education and
training systems including vocational education and trainingapprenticeships and their
role in STW transitions Indeed extensive VET reforms are currently being implemented
in many EU countries (for example Croatia Cyprus Estonia Greece Finland France
Ireland Italy Poland Spain Sweden and the United Kingdom) ndash instigated to some ex-
tent by the YG These reforms seek to improve the labour market relevance quality and
attractiveness of VET together with an effort to develop a VET system often along the
lines of the German dual training system which combines time spent at school with time
spent in the workplace In addition many reforms of VET systems often associated with
the YG have sought to create closer links with the labour market (European Commis-
sion 2018c)
In addition a range of other educational measures offered under the YG has aimed to
bring young people with low levels of skills and qualifications back to education and
training These measures are summarised by the term lsquocontinued education offersrsquo (Eu-
ropean Commission 2018l) These continued education offers are set up to provide
young people with the chance to re-enter the regular education and training system to
move on to a higher-level qualification Alternatively ALMPs bridging courses or second
chance education programmes can also equip early school-leavers and low-skilled youth
The Youth Guarantee in light of changes in the world of work Youth Guarantee Intervention Models Sustainability and Relevance
21
with the skills and qualifications needed for an initial (and targeted sustainable) labour
market integration
214 The heterogeneity of the NEET population
The fourth key aspect of YG implementation assessed in this report concerns the way in
which the YG has addressed the heterogeneity of the NEET population Due to its diversi-
ty the NEET population in the EU can be divided into sub-groups According to Euro-
found (2016) the NEET can be categorised firstly by their activity status ndash those who
are available to the labour market or educational opportunities are counted as active
while the rest is classified as inactive The former group consists of short- and long-term
unemployed individuals and those soon to return to education or employment the latter
group includes people with illness or disability individuals with family responsibilities and
lsquodiscouragedrsquo workers Throughout this report the phrase lsquodiscouraged workersrsquo refers to
people who simply stopped searching for employment or education opportunities
Data from the EU Labour Force Survey from 2013 (also used in Eurofound 2016) pro-
vides an indication about the labour-market attachment of NEETs in Europe before the
YG was implemented Among the active NEETs the largest proportion of 15-24-year-old
NEETs were short-term unemployed (298) Long-term unemployed youth made up
about 22 of the NEET population while returnees into work or education accounted for
roughly 8 of NEETs Among those considered inactive the largest share corresponds to
individuals with family care responsibilities (154) Individuals with illness or disability
made up 8 of the NEET population Discouraged workers accounted for almost 6 of
NEETs and 125 were NEETs for other reasons Consequently around 60 of the
NEET population were neither in education employment nor training for labour market
related reasons (the unemployed the discouraged workers and the returnees) and
around 40 were NEETs for other reasons
Furthermore NEETs can be categorised by their educational attainment as subgroups
with lower education are at a much higher risk of being in a vulnerable position This can
be seen by the fact that less educated youth are overrepresented among the NEETs As
of 2014 44 of NEETs aged 15-24 had completed an lsquoupper secondaryrsquo education
closely followed by 43 with a lsquolower secondaryrsquo education and only 8 of NEETs had
tertiary education or a degree (Eurofound 2016)
These sub-groups have diverse needs and are therefore likely to benefit from different
types of policy responses regarding interventions and they may require additional out-
reach efforts Most importantly those furthest away from the labour market are most
likely to be in substantial need of outreach activities One important factor here is their
point of access to the YG While other entry points exist access is often governed by
PES In all EU countries except Malta the PES plays a role in registering people for the
YG Among other determinants the extent to which the PES are able to actually reach
the NEET population also depends on their responsibilities for administering and paying
(unemployment) benefits According to European Commission (2017b) only three PES
are responsible for administering other types of benefits aside from (mostly insurance-
based) unemployment benefits (Lithuania Luxemburg and Slovakia) These types of
benefits tend to exclude youth due to their limited length of work experience reducing
the scope for outreach without further intervention Indeed the registration of NEETs
with the PES was somewhat limited at the onset of the YG (Eurofound 2016) However
many PES have launched substantial outreach activities to make up for this EC (2017a)
shows that roughly 46 of PES make use of new media for their outreach work 39
provide mobile services and about 43 have specific outreach caseworkers Moreover
The Youth Guarantee in light of changes in the world of work Youth Guarantee Intervention Models Sustainability and Relevance
22
46 of PES have created a one-stop-shop type of framework to enhance their degree of
outreach (eg this includes Belgium Finland and the United Kingdom ibid)
Country case study Italy
Italy is a country with a relatively rigid labour market despite the recent reforms aimed
at increasing the degree of labour market flexibility Moreover the Italian education
system endows youth with a relatively high level of general education but with few
work-related skills which dramatically slows down their transition to a job (Pastore
2018) Along with their relatively large number of early school-leavers this helps ex-
plain their 347 youth unemployment rate in 2017
The lack of previous experience with the YG framework and the dramatically low rate of
job-finding ndash ranging from 11 to 18 in the 2010s ndash represented another obstacle to
successfully implementing the YG According to Pastore (2015) macro- and micro-
economic obstacles should have been overcome to make the programme work at its
best Economic growth has been sluggish at least from the early 1990s which would
normally have reduced the pace of job creation and forced young people into more edu-
cation and training rather than employment Moreover public and private employment
services could count only on human resources which were scant in both quantitative and
qualitative terms as they had a low share of university graduates (ANPAL 2018)
The number of ANPAL staff has been reduced in recent years and as financial resources
for paying for an increase in the number of staff are scarce improvement has been
sought by implementing important reforms such as the `legislative decree 1502015rsquo of
the so-called Jobs Act package (ANPAL 2018) This reform introduced lsquoquasi-marketsrsquo
in the management of employment services the NEETs are profiled by PES and then
assigned a voucher for a different amount according to their lsquoneed bandrsquo NEETs can
spend vouchers in the PES andor with private (for profit or non-profit) employment
agencies to buy the services they need However so far the reform has not been fully
implemented partly due to the lack of financial resources (ibid)
Further problems with the implementation of the YG has been due to the reallocation of
competences in the PES from provinces to regions and the establishment of a national
agency (ANPAL) to coordinate the work of regional entities which detracted from the
full implementation of the YG (ANPAL 2018)
The Italian YG scheme has also managed to improve its monitoring system of the indi-
viduals involved the activities done and their level of absorption into the labour market
when the programme is completed The last monitoring report available shows that of
about 15 million registered NEETs 13 million had the prescribed requirements About
one million were actually profiled of which about a half were given some completed
form of assistance About 60 underwent on-the-job training 23 benefited from sub-
sidised employment 123 received off-the-job training 23 received some form of
placement services 16 did voluntary service in the third sector and a small number
received support for self-employment About six months before completion of the pro-
gramme 479 of recipients were in work and 692 had experienced at least one
employment spell (ANPAL 2017)
A few recent evaluation studies provide a full assessment of regional programmes and
show that on-the-job training is effective in confirming the importance of providing
young people with work-related competences (for example see Ghirelli et al 2019)
Despite these efforts monitoring data on the Youth Guarantee for 2016 shows that in
the EU as a whole an estimated 385 of the NEET population were registered in YG
schemes in the year 2016 Although some Member States are doing much better (cover-
The Youth Guarantee in light of changes in the world of work Youth Guarantee Intervention Models Sustainability and Relevance
23
age rates are higher than 50 in 12 Member States - in Belgium Finland and Austria
the corresponding rate is even above 70) Moreover the YG currently does not suffi-
ciently cover inactive NEETs (European Youth Forum 2018) as this problem is less se-
vere in countries with minimum income support systems where less strict entry require-
ments are usually applied This is the case in Ireland for example (see European Court
of Auditors 2017) This under-coverage of inactive NEETs is reflected in Figure 4 which
shows that the decline in NEET rates since the introduction of the YG is mostly due to
reductions in long-term and short-term unemployment
Figure 4 Composition of the EU NEET population (percentage of the population
of young people)
Source Eurofound (2017)
Thus it seems that the YG so far has benefitted youth closer to the labour market which
may be partly reflect the high prevalence of employment offers within the YG framework
(in 2016 around 67 of all the offers taken up within the four-month time limit set by
the YG were employment offers) Low-skilled individuals lsquodiscouragedrsquo workers and indi-
viduals without work experience are likely to benefit more from offers that combine gain-
ing job experience and building (job-specific) skills However as of 2016 these types of
offer only make up a minority of all the offers taken up within the four-month time limit
Furthermore the 2013 Council Recommendation on the YG insufficiently addressed the
needs of those among the youth that are NEETs for reasons other than labour market
related factors as these individuals had other constraints keeping them from the labour
market Among this group are mainly individuals with family care responsibilities and
youth with illnesses or disabilities For individuals with family responsibilities the Euro-
pean Quality of Life Survey shows that 11 of young fathers and 35 of young mothers
are inactive This is despite the fact that the majority of them would like to work under
flexible work and with adequate care arrangements (European Youth Forum 2017)
Nonetheless some Member States introduced additional reforms beyond the YG recom-
mendations to decrease high school dropout or aimed at improving social and welfare
policies
The Youth Guarantee in light of changes in the world of work Youth Guarantee Intervention Models Sustainability and Relevance
24
215 Design and implementation features of the Youth Guarantee
The fifth key aspect of the YG concerns design and implementation-related factors af-
fecting its capacity to address the main objectives ndash does it provide a broad set of young
people with a quality offer within a short period of time Specifically the Council of the
European Union (EU) recommended providing a quality offer to all young people under
25 within a four-month period of their becoming unemployed or having left the education
system
Substantial variation between Member States can be observed in the way the national
YG was designed and implemented previous experience implementing a YG-type of
framework is also important For example Denmark and Sweden are among countries
that had a relatively long history of this sort of framework even before the introduction
of the YG Furthermore at the very fundamental level of design some Member States
opted for different target time-frames as well as different age cut offs for YG eligibility
Some countries chose a shorter time-frame than the four months envisaged by the
Council of the European Union others opted for a longer duration (European Commis-
sion 2016a) Regarding the age range a substantial number of Member States chose
youth aged under 30 as a target rather than the suggested age of 25 as the cut off This
included for example Bulgaria Denmark Italy and Poland Depending on the size of
these cohorts this may represent a considerably more ambitious approach which - if it
is not supported by sufficient financial and human resources - is more likely to fall short
of expectations Furthermore some countries put specific emphasis on targeting the
long-term unemployed youth (Escudero and Mourelo 2017) Among others this includes
Hungary Poland and the United Kingdom
In order to support the target of reaching every NEET in a timely manner some PES
have also introduced YG-specific staff hired additional caseworkers or at least main-
tained their staff level since the introduction of the YG (European Commission 2017a)
On the issue of the quality of offers 17 PES formally defined their criteria for a quality
offer or distributed national quality management guidelines regarding offers being made
within the YG framework (5 countries)14 Many Member States have chosen an outcome-
based approach for their definition of offer quality meaning they define an offer as being
of high quality when individuals have favourable education or employment outcomes
after leaving one of the YG programmes (European Commission 2016a) In addition
some PES also introduced youth-specific targets (European Commission 2017a)
There is also cross-country variation in terms of the main YG providers Almost all coun-
tries rely to some extent on their national PES for providing YG services while some do
so exclusively This is the case for example in Austria the Czech Republic and Greece
Most Member States however chose some combination of the PES and other institutions
as their main providers (European Commission 2016a) Aside from the institutions
through which YG services can be obtained online access to the programmes may be an
important driver of success In 18 EU countries potential participants can register online
for the YG at least in some regions of the country This is not the case in for example
Bulgaria France or Luxembourg
14 See European Commission 2017a
The Youth Guarantee in light of changes in the world of work Youth Guarantee Intervention Models Sustainability and Relevance
25
Country case study Latvia
Young people in Latvia were very adversely affected by the lsquoGreat Recessionrsquo of
20082009 In the years before the recession youth unemployment had been relatively
low standing at 105 in mid-2008 but then it more than tripled to more than 35
within a two year period In a parallel development the NEET rate for 15-24 year old
Latvians rose from 108 in 2008 to 178 in 2010 Both youth unemployment and the
NEET rate effectively peaked in 2010 in Latvia and since then they have steadily de-
clined reaching pre-crisis levels by 2015 One specific challenge of the Latvian labour
market is the variation in employment outcomes by educational level as the high-
skilled face very low unemployment rates (clearly below the EU average) whereas un-
employment among the low-skilled is much higher than EU average
Following the Council Recommendation the Latvian YG Implementation Plan was pre-
sented in December 2013 (updated in April 2014) and implementation started in 2014
targeting young people aged 15-29 not in employment education or training (European
Commission 2018c) The Ministry of Welfare is in charge of establishing and managing
the YG while the Latvian PES (the lsquoState Employment Agencyrsquo) and the State Education
Development Agency (SEDA) are responsible for its implementation Other main imple-
menting actors include the Ministry of Science and Education the local authorities (the
municipalities) and youth organisations The Latvian Youth Guarantee is fully funded by
the Youth Employment Initiative (ibid)
The immediate strengths of YG implementation in Latvia are the rapid formal adoption
of the YG the adaptability of existing institutions and structures (which also enabled the
creation of new institutions such as a YG Advisory Board) and the emergence of part-
nership as a key component for implementing the YG This active inclusion of a broad
set of partnerships remains a particular strength of the Latvian YG implementation (EM-
CO 2017)
The Latvian YG scheme exclusively provides employment and education offers so that
apprenticeships and traineeships are not provided The employment offers are mostly
subsidised employment in the regular labour market such as first work experience for
labour market entrants and subsidised jobs for the disadvantaged Young people receive
fixed term contracts that range in duration from six months to two years and there is
also financial support for up to two years for young people wanting to become self-
employed or to start a business
The education system includes several vocational elements typically between 480 and
960 hours and up to 15 years in one specific programme Additionally the Latvian YG
provides ldquoyouth workshopsrdquo as part of the preparatory phase which provide training in
three different areas (up to three weeks each) to help young people with their career
choices
In 2016 just over a quarter (271 of the total entrants) of those entering the YG
scheme were re-entrants of which nearly half (127) had previously taken up an of-
fer These re-entry rates are below the EU average but the rates may be understated
as data for participants applying via the SEDA data on previous experience are not
available (European Commission 2018a)
The Youth Guarantee in light of changes in the world of work Youth Guarantee Intervention Models Sustainability and Relevance
26
216 The role of the apprenticeship system in the Youth Guarantee
The sixth main aspect of YG implementation addressed in this study specifically concerns
the role of apprenticeships indeed one of the greatest problems for young peoplersquos
transition into the labour market is their lack of work-related competences especially in
the countries with sequential STW transition systems that focus on general education
rather than building lsquoall-round human capitalrsquo as in lsquodualrsquo STW transition systems where
school and work are linked at the same time (Austria Denmark and Germany) An ap-
prenticeship is therefore one of the key elements of the dual system as it traditionally
involves off-the-job in-class education together with on-the-job training of different
lengths
According to comparative evidence provided by the European Commission (2013) based
on the European Labour Force Survey in most EU Member States the share of appren-
ticeships in any cohort of young people (15-29 years old) is between 15 and 5 with
the only exception being Germany Austria and Denmark where young people who un-
dertake an apprenticeship amount to above 5 All other EU countries are below 15
The EU average share was 37
This general tendency is also partly reflected in the usage of apprenticeships in the con-
text of the YG as they correspond to important cultural and institutional factors within
Member States15 The monitoring data shows that in 2016 some of the countries with the
highest share of apprenticeship offers within the YG programme have a dual STW sys-
tem Portugal is one major exception from this rule this may be related to its general
shortage of employment opportunities and therefore the tendency of apprenticeships to
occupy a higher than average share among participants of the YG Overall however
only 34 of timely exits from the YG were the result of apprenticeship offers a share
not far away from the share in the overall population of young people mentioned above
For a large number of countries the share was close to zero It should be noted howev-
er that due to data limitations some countries may record entries into apprenticeship
offers as entries into employment (European Commission 2016b)
Apart from data-related issues one reason why apprenticeship offers remain rather ex-
ceptional within the YG is that they require employersrsquo commitment to providing training
places and to designing curricula in cooperation with schools This can be a big constraint
in the development of apprenticeships especially in sequential SWT systems In 2013
the European Alliance for Apprenticeship (EAFA) was therefore launched to boost ap-
prenticeships in the EU The EAFA gave guidelines for the implementation of apprentice-
ships in all Member States and encouraged sharing experiences and good practices and
provided strategic expert support from the European Centre for the Development of Vo-
cational Training (CEDEFOP) and through the European Training Foundation Within the
context of the EAFA all member countries signed a declaration of commitments on ac-
tions to spread the use of apprenticeships as the main port of entry to the labour market
15 Note that the Commissionrsquos definition of apprenticeships (European Commission 2013) may differ from Member Statesrsquo definitions A recent Council Recommendation (Council of the European Union 2018) intends to harmonise the definition by saying that apprenticeships are understood as formal vocational education and training schemes that a) combine learning in education or training institutions with substantial work-based learning in companies and other workplaces b) lead to
nationally recognised qualifications c) are based on an agreement defining the rights and obliga-tions of the apprentice the employer and where appropriate the vocational education and train-ing institution and d) with the apprentice being paid or otherwise compensated for the work-based component Despite this recommendation varying national definitions still exist across Member States
The Youth Guarantee in light of changes in the world of work Youth Guarantee Intervention Models Sustainability and Relevance
27
for young people16 Moreover in their declarations each country committed itself to im-
plement the dual principle in their STW transition
Country case study Denmark
Denmark is among those EU countries that even before the introduction of the YG in
2013 (European Commission 2016a) already had a particularly well-functioning labour
market and educational system to help NEETs In fact Denmark already had some ex-
perience of a YG-like framework for a relatively long period before it was proposed by
the Council of the European Union The situation for Denmarkrsquos youth was therefore
more favourable than the EU average in 2012 The share of young people between 15
and 25 that were NEETs was only 66 - significantly below the proportion of NEETs in
many other EU countries Furthermore the majority of those individuals that were clas-
sified as NEETs were relatively close to the labour market and were therefore easier to
reach For example only 53 of Danish NEETs belonged to the group of long-term
unemployed or discouraged workers (Eurofound 2016)
Due to these circumstances the case for additional reforms within the YG was limited
Therefore along with reform efforts regarding active labour market policies concerning
youth and the educational system17 the implementation of the YG mostly required the
updating of existing policies This is exemplified by a strong increase in ALMP spending
from roughly 13 of GDP in 2012 to about 14 in 2015 despite declining rates of
youth unemployment and therefore a decrease in ALMP expenditure in other countries
over the same time period Denmark chose a particularly ambitious implementation by
focusing on youth under the age of 30 with a target window of less than four months so
as to offer their NEET population a quality measure In contrast to many other Member
States Denmark focuses on increasing the employability of NEETs via (continued) edu-
cation measures resulting in a share of apprenticeship take ups of over 50 relative to
the total number of timely exits from the YG This approach also matches the relatively
large proportion of low and medium educated youth among the NEETs
Two of the main pillars in the original 2014 Danish implementation plan were the ldquore-
tention task forcerdquo and the ldquoBridge Building to Educationrdquo programmes Both types of
initiatives were well-founded in regional and inter-organisational partnerships (for ex-
ample people involved include job centres municipalities educational facilities youth
organisations and others) While the aim of the first programme was to decrease high
school drop-out rates the latter took place at a vocational school in close cooperation
with the jobcentres and it focuses on helping youth to find their right path to success
through making the transition to vocational education This was done by assigning men-
tors to the NEET and giving them access to basic literacy and numeracy courses if they
needed them as well as further professional courses and traineeships The evaluation of
the ldquoBridge Building to Educationrdquo initiative yielded positive effects for youngsters par-
ticipating in the intervention compared to the control group (with a similar profile) which
did not participate in the intervention As a result two additional initiatives were set up
Firstly funds were made available to support the further implementation of ldquoBridge
Building to Educationrdquo initiatives Secondly ldquoJob-Bridge to Educationrdquo a randomised
controlled trial building on the core elements of ldquoBridge Building to Educationrdquo and tar-
geting the most vulnerable youth under 30 years without an education was also set up
16 Declarations of national commitment are downloadable from the EAFA website httpeceuropaeuapprenticeships-alliance
17 For more information see httpsuvmdkreform-af-de-forberedende-tilbudforberedende-grunduddannelseopbygning-og-maalgruppe
The Youth Guarantee in light of changes in the world of work Youth Guarantee Intervention Models Sustainability and Relevance
28
The project is set to end in mid-2020 where it will be followed by an evaluation of the
results
The Danish YG has also managed to set up a high-quality monitoring system with only
relatively few cases of missing information on YG participantsrsquo exit destinations (Euro-
pean Commission 2018a) Together with the relatively large share of NEETs who are
registered with the PES and the development of ldquoyouth guidance centresrdquo to reach out
to those who are not the Danish YG model is able to cover a substantial portion of
NEETs For instance in 2016 the YG coverage rate reached almost 60 of the NEET
population compared to the EU YG scheme average of 425 Thus despite more fa-
vourable initial conditions in Denmark the YG helped put a focus on the most vulnera-
ble youth and spur on a further integration of policies into national policymaking for
example through additional reforms aimed at improving active labour market policies
for young people Youth unemployment rates are currently trending downwards even
further in Denmark However there remain some issues especially with regard to the
integration of migrants given that youth unemployment is a much more pervasive issue
among them compared to native Danes (European Commission 2018a)
22 Empirical indicators of Youth Guarantee features
Section 21 has presented the key aspects that reflect how Members States implemented
the Youth Guarantee following the Recommendation In order to prepare the systematic
analysis of the YG in section 3 which develops a YG typology it is necessary to build
empirical indicators for each of these key aspects That is to say that this section dis-
cusses how information on each of these aspects can be measured and expressed in da-
ta18 These empirical indicators are therefore grouped into the corresponding six sets
1 Financial resources for implementing the Youth Guarantee
2 The Youth Guarantee as part of national policy-making
3 Youth labour market challenges
4 The heterogeneity of the NEET population
5 Design and implementation features of the Youth Guarantee
6 The role of the apprenticeship system in the Youth Guarantee
221 Indicator set 1 Financial resources for implementing the Youth
Guarantee
The set of indicators below represents the level and composition of financial resources
that Member States employed to support the Youth Guarantees implementation
i The size of ESFYEI transfers to match the respective NEET challenge is measured
by the ratio of initial YEI allocations as well as the YEI+ESF matching funds EU el-
igible cost both relative to Member Statesrsquo GDP in 2012 In addition a categori-
18 For each group of contextual and implementation features of the Youth Guarantee discussed in Section 21 an overview of potential quantitative or qualitative indicators was established which could represent these constructs Through a desk research of the available literature and online databases the availability of the respective indicators at the Member State level was assessed for a sufficiently large set of countries Unfortunately for a subset of potential indicators it was not possible to retrieve sufficient andor adequate information for a large enough sample of Member
States In some cases where several potential indicators were available to represent the same dimension or construct the available indicators that best represent the specific feature were iden-tified while also taking data quality into account In some cases single combined indicators were constructed to reduce the lsquodimensionalityrsquo of the database underlying the cluster analysis in sec-tion 3 See appendix A for more details on the exact indicators used and their source
The Youth Guarantee in light of changes in the world of work Youth Guarantee Intervention Models Sustainability and Relevance
29
cal variable for the estimated yearly costs relative to GDP for offering interven-
tions to all NEETs is included derived from Eurofound (2015a) The comparison of
both allows judgement of the importance of EU transfers in financing the YG
ii The degree to which Member States allocated additional funding from the ESF to
fund measures related to youth employment is measured in data about ldquoOther
ESF EU eligible costsrdquo (European Commission 2018k)
iii To proxy whether Member States dedicated additional funding from national
budgets to finance YG-related measures the evolution of overall active labour
market spending from 2012 to 2015 is used (Eurostat lmp_expsumm)19
iv Finally the degree to which Member States were able to absorb the additional
funding from the YEI in a timely manner is measured by the share of EU eligible
costs among YEI+ESF funds that were actually declared YEI+ESF funds based on
data from European Commission (2018k)
222 Indicator set 2 The Youth Guarantee as part of national policy-
making
The second set of indicators reflects the degree to which Member States made efforts to
introduce elements of the YG into national policy making and started partnerships
Regarding reform efforts the following indicators are included
i The degree to which the YG spurred wider longer-term reforms in Member States
is quantified by the total number of youth-related active labour market policy re-
forms between 2013-2016 based on LABREF information (the European Commis-
sionrsquos labour database)20
ii In addition the degree to which Member States were committed to the policy
change is approximated by the number of areas in which additional measures
were taken in the context of YG beyond the scope of the Recommendation (based
on European Commission 2016c)21
iii Finally the degree to which Member States were able to set up an effective YG
monitoring and follow-up system is taken into account as an indication of whether
they were committed to delivering the YG This means including 2016 data for the
proportion of YG exits with unknown destinations and the proportion of unknown
situations in the six-month follow-up data (European Commission 2018a)
The degree of partnerships built in each Member State is measured using the following
indicators
iv The degree to which partnerships were an element of the initial YG design is in-
cluded using the Member Statesrsquo self-reported involvement of social partners and
19 At the time of writing this report more recent data was only available for relatively small subset of EU countries
20 The authors refrain from using 2017 data on labour market reforms from the LABREF database as the objective is to measure the degree to which the YG was a driver of reforms in Member States That is this link becomes weaker over time such that the added value of more recent data
for the analysis is questionable
21 Due to their high correlation with LABREFrsquos own variations indicators of receipt and implemen-tation of country-specific recommendation between 2013-2017 and the qualitative classification by the Commission for the extent to which YG has acted as a driver of reform (European Commission 2016a) are not included in the set of indicators used
The Youth Guarantee in light of changes in the world of work Youth Guarantee Intervention Models Sustainability and Relevance
30
youth organisations in the design implementation and monitoring of the YG
(based on European Commission 2016c)22
v Furthermore the involvement of partners is approximated using the number of
areas where the PES is declared to have formed partnerships (based on European
Commission 2017a)23 In addition indicators are included for national PES re-
ported as having involved youth organisations and young people in the design of
YG services (based on European Commission 2017a)
223 Indicator set 3 Youth labour market challenges
To reflect how the challenges faced by young people in their transition from STW differ
across Member States the following empirical indicators are considered
i A set of indicators that reflect the significance of the youth unemployment chal-
lenge at the time when the YG was designed and rolled out These include the ra-
tio of unemployment rates for youth (age 15-24) and adults (age 25-74) the
share of people aged 15-24 of the total population (age 15-74) and the NEET
rate among youth aged 15-29 to obtain a measure of the size of the NEET chal-
lenge also for Member States that target individuals up to 29 years of age (Euro-
stat lfsa_pgaed une_rt_a edat_lfse_14 all indicators were measured in 2012)
ii To measure the initial degree of labour market segmentation and the quality of
entry-level jobs available to youth in each Member State the absolute difference
in the share of youth (15-24) to adults (25-54) in terms of the number on tempo-
rary employment contracts in 2012 (Eurostat lfsi_pt_a)
iii To address Member Statesrsquo response to these conditions several indicators are
included on the degree to which employment offers were favoured possibly re-
flecting a ldquowork-firstrdquo approach specifically the number of offers of employment
relative to the total number of all types of offers that are typically made to young
people registered in YG schemes (based on European Commission 2018b) In ad-
dition this includes a measure for the employment intensity of timely exits in
2016 (the share of all timely exits that were employment offers based on Euro-
pean Commission 2018b)
iv Lastly two indicators approximate the performance of education and training sys-
tems from which youth enter into the labour market and the potential severity of
the skills mismatch first the share of early school-leavers from education and
training among the youth population (age 18-24) in 2012 (Eurostat
edat_lfse_14) and second the share of NEETs with low and medium educational
attainment in 2012 To approximate the YG implementation with respect to skills
mismatches the number of offers of education relative to the total number of all
types of offers that are typically made to young people registered in YG schemes
is used (based on European Commission 2018b) In addition a measure is in-
cluded for the education intensity of timely exits in 2016 ie the share of all
timely exits that were education offers (based on European Commission 2018b)
22 An alternative source for partnership information is provided by ETUC (2018) Their data is ndash in
contrast to the data employed ndash not self-reported by the Member States However the ETUC (2018) report contains substantial missing information and hence was not used
23 Namely PES partnerships aimed at (i) ensuring that young people have full information and support available (ii) increasing employment apprenticeship and traineeship opportunities and (iii) supporting transitions from unemployment inactivity or education into work
The Youth Guarantee in light of changes in the world of work Youth Guarantee Intervention Models Sustainability and Relevance
31
224 Indicator set 4 The heterogeneity of the NEET population
The next set of indicators aims to reflect the diversity of the NEET population While
some indicators have already been introduced in the indicators above (for example NEET
rates by educational attainment) this additionally integrates the following
i The composition of NEETs as measured by the share of NEETs that are short-term
or long-term unemployed individuals about to re-enter education or employment
discouraged NEETs youth with illnesses or disabilities and the share of NEETs
with family responsibilities This gives an indication of the NEETsrsquo activity status
the potential reasons for their NEET status and their degree of closeness to the
labour market (Eurofound 2016 all indicators measured in 2013)24
ii Indicators describing the links between the PES for the YG This includes the
number of responsibilities of the PES in the YG as well as their main outreach
tools based on European Commission (2017a) Furthermore it includes indicators
on whether the PES is the main body responsible for the administration and pay-
ment of unemployment andor other types of benefits (based on European Com-
mission 2017a)
iii An indicator from European Commission (2017a) that reflects whether the re-
spective PES is reported to have taken any additional measures with respect to
preventing school drop-out
225 Indicator set 5 Design and implementation features of the Youth Guarantee
This set covers further design and implementation indicators that are likely to affect the
performance of the YG as implemented by the Member States
i Indicators on the envisaged length of the preparatory phase the eligible age
group the main YG provider whether online registration is possible for potential
YG participants as well as whether Member States created a legal entitlement to
receive an offer (all based on European Commission 2016c) In addition there is
an indicator measuring whether Member States specifically target the long-term
unemployed (Escudero and Mourelo 2017)
ii A categorical indicator providing information on whether a YG-related scheme was
already in place (in the long-term or recently) before the Recommendation
(based on European Commission 2016c)
iii Information on whether the Member States established a formal definition of a
good quality offer within the YG scheme (European Commission 2016a) and
whether quality management guidelines exist from the national administration to
organisations involved in YG (based on European Commission 2017a)
iv Indicators to reflect the relevance and potential upscaling of national PES capacity
since the YG Recommendation (all reflecting 2017 responses of PES based on
European Commission 2017a) These include whether the PES has dedicated YG
staff whether the PES provides training for YG staff whether the PES staff in-
creased or remained the same from 2014-2017 and whether the PES has specific
targets for youth (ibid)
24 Optionally the use of a more general measure of the NEET Cluster Type was tested which is a composite indicator on different levels reflecting the STW transition system and the composition of NEET in 2012 (Eurofound 2016) However as the clustering is based on the share and STW transition type data already employed the indicator is not used in the analysis
The Youth Guarantee in light of changes in the world of work Youth Guarantee Intervention Models Sustainability and Relevance
32
226 Indicator set 6 The role of the apprenticeship system in the Youth Guarantee
The final set of indicators represents the relevance and the set-up of apprenticeships in
the national education and training system as well as their role in the YGs implementa-
tion
i To provide information on the STW transition types of Member States indicators
are included based on the classification by Pohl and Walther (2005 2007) Fur-
thermore an indicator on the share of firms employing initial vocational training
participants in 2010 is used (Ireland 2015) (Eurostat trng_cvt_34s)
ii To reflect the relevance of apprenticeships in the YG implementation indicators
on the number of offers of apprenticeships relative to the total number of all
types of offers that are typically made to young people registered in YG schemes
(based on European Commission 2018b) In addition a measure for the appren-
ticeship-intensity of timely exits in 2016 ie the share of all timely exits that
were apprenticeship offers (based on European Commission 2018b)
iii The normalised number of pledges from firms and institutions to the European Al-
liance for Apprenticeships between the outset of the YG in 2013 and 2018 (based
on the national commitments database25)
23 Conclusion
This chapter has provided a comprehensive overview of the main aspects of the YG im-
plementation in context Specifically subsection 21 discussed a) the main financial re-
sources for implementing the YG b) the YGrsquos integration within national policy-making
c) the YG and youthrsquos labour market challenges d) the diversity of the NEET population
e) design and implementation features of the YG and f) the role of the apprenticeship
system in the YG Section 22 proceeded to identify and map six sets of empirical indica-
tors to each of these six implementation aspects In total 76 empirical indicators were
identified which will form the basis of the systematic analysis of a YG typology in the
next section Figure 5 gives a graphic overview of the number of indicators included in
each of the six indicator sets representing the key implementation aspects
25 The national commitments database available at httpeceuropaeusocialmainjspcatId=1148amplangId=en as of September 17 2018 This data-base also provides information on the number of pledges made by firms and institutions For the analysis the number of pledges is normalised by the share of firms employing IVET participants in each Member State to account for the relevance of the VET system
The Youth Guarantee in light of changes in the world of work Youth Guarantee Intervention Models Sustainability and Relevance
33
Figure 5 Number of indicators identified by variable set
Source Own analysis
Figure 5 illustrates that for example indicator set (5) ndash which represents the design and
implementation features of the YG ndash is the largest set comprising 20 indicators Whereas
the indicator sets (1) on financial resources for implementing the YG and (6) on the role
of the apprenticeship system (6) are somewhat smaller they still contain seven and nine
indicators respectively
3 Typology of Youth Guarantee models
This section is the empirical part of the analysis Based on the identification of the set of
relevant implementation aspects and the corresponding empirical indicators in the previ-
ous section Chapter 3 intends to systematise the main models that are currently in
place for delivering the YG in Member States It is an empirical attempt at establishing a
typology of different intervention models based on cluster analysis This section also
explores whether a correlation between specific types of intervention models and per-
formance in delivering the YG can be identified
31 Empirical approach to establishing Youth Guarantee models
To address the question about which main models are currently in place for delivering
the YG the analysis groups Member States according to their similarity across the em-
pirical indicators presented in section 22 Since both contextual features and implemen-
tation-related factors are included this procedure identifies types of countries that are
similar in both dimensions
To detect these types cluster analysis techniques are used in which the goal is to find
groups of observations in the data ndash that is groups of Member States ndash that are most
similar within clusters while being as dissimilar as possible across clusters In this study
hierarchical agglomerative clustering methods are employed These methods start out by
specifying each Member State as one individual cluster The cluster approach then grad-
ually combines Member States into clusters The choice of which clusters are to be com-
bined is determined by comparing their (dis-) similarity In the empirical application an
adequate measure of dissimilarity is the coefficient by Gower (1971) as it allows for the
combination of binary indicators and multivalued variables The choice of the linkage
method (the way the clustering algorithm combines similar observations into clusters) is
of similar importance in this case the Ward method (1963) is chosen which combines
groups or observations if they increase the within-group variance of the chosen indica-
tors by the least amount possible in the data Lastly the authors needed to choose the
7
11
11
18
20
9 (1) Financial resources for implementing the YG
(2) YG as part of national policy-making
(3) Youth labour market challenges
(4) Heterogeneity of NEET population
(5) Design and implementation features of the YG
(6) Role of the apprenticeship system in the YG
The Youth Guarantee in light of changes in the world of work Youth Guarantee Intervention Models Sustainability and Relevance
34
number of clusters to be generated Since this is not obvious in the application at hand
the Duda-Hart optimality criterion as described by Milligan and Cooper (1985) was ap-
plied This means that intuitively the index computes the added value of increasing the
number of clusters by one so a low Duda-Hart index indicates an optimal number of
clusters In the YG case the comparison is restricted to between three and seven clus-
ters as fewer clusters provide too little information while too many clusters hamper the
interpretability of results
The empirical application follows a two-step procedure In the first step a cluster analy-
sis for each set of the empirical indicators defined in section 22 determines sets of coun-
tries that are similar within each of these six conceptual sets For example the set on
financial resources puts countries with magnitudes of expected and realised costs for
implementing the YG based on the available information together In the second step
the main cluster analysis based on all indicators determines a final cluster analysis which
also allows the authors to analyse their correspondence to the sub-clusters from the first
stage Readers should note that the quality of the cluster groups depends ndash among other
factors- on the data quality of available indicators as well as the number of indicators
used The more indicators are required for meaningful results the more difficult it is to
obtain clusters that differ sharply with respect to all the chosen indicators Thus it may
be that one country differs quite substantially in terms of one indicator from the rest of
the countries in a particular cluster if the other indicators show similar realisations
Hence for the description of clusters attention is restricted to those indicators that
summarise the cluster differences the best presenting the general tendencies of the
cluster analysis necessarily simplifying to a certain degree Furthermore readers should
also note that the groupings following from this exercise do generally not imply any
qualitative ranking
32 Description of first-step clusters
321 Indicator set 1 Financial resources
Cluster A (AT DK FI DE LU NL and SE) is a set of countries with a low estimated cost
of fully implementing the YG that received relatively little financial support from EU
funds both via the YEI and the ESF On average these states show very little changes in
active labour market policy (ALMP) spending between 2012 and 2015
Cluster B (BE CZ EE FR IE IT MT RO SI and UK) and Cluster C (ES LT LV PL and
PT) are countries with costs estimated to be of medium magnitude to fully implement
the YG Country cluster C received more EU funds from the YEI and the ESF matching
funds - and other ESF eligible youth-related projects - compared to cluster B Both clus-
ters showed only a small change in ALMP expenditure
Cluster D (BG CY EL HU HR and SK) has high estimated YG costs and they received
substantial monetary support from the EU to support the implementation of the YG
through the YEI through the ESF matching funds and through financing of other eligible
youth-related projects Cluster D is also the only one in the analysis that shows a sub-
stantial increase in ALMP spending between 2012 and 2015 despite declining (youth)
unemployment rates
322 Indicator set 2 Youth Guarantee as part of national policy-
making
Cluster A (DK ES FR HU IE SE and SK) has a large average number of youth-related
ALMP reforms and additional measures implemented beyond the scope of the Recom-
mendation These Member States also tend to enforce comparatively effective YG moni-
The Youth Guarantee in light of changes in the world of work Youth Guarantee Intervention Models Sustainability and Relevance
35
toring and follow-up systems which may be interpreted as an indication that they are
committed to deliver on the YG However on average these Member States did not pri-
oritise partnerships as much as other clusters
Cluster B (AT CZ DE EE EL NL RO and UK) is mostly defined by the lack of effective
monitoring and follow-up systems and also fewer reforms were put in place compared to
Member States in other clusters Nonetheless on average they put more emphasis on
involving social partners and youth organisations and built more partnerships than coun-
tries in cluster A
Cluster C (BE BG CY FI HR IT LV LT LU MT PL PT and SI) implemented many
youth-related reforms and additional measures as part of the implementation of YG rec-
ommendations However in contrast with cluster A these Member States also included
partnerships with social partners and youth organisations as a central element of the
initial YG design Consequently the PES in these Member States often said that they had
formed partnerships and that they regularly involve youth and youth organisations into
their work Nonetheless their monitoring systems are still underperforming compared to
countries in Cluster A
323 Indicator set 3 Youth labour market challenges
Cluster A (BG CY EL HR PL and SK) includes Member States that had the highest
NEET rate amongst 15-29 year olds in 2012 before the YG was rolled out Moreover
they show the largest difference in shares of temporary employment contracts between
the youth and adults Countries in this cluster have the best educated NEETs on average
This also reflects the point that the issue was not so much the education system as the
figures also show a comparatively low average shares of school drop-outs Correspond-
ingly Member States in cluster A usually responded by focusing on employment-related
measures under the YG rather than offers of education
Cluster B (AT DE DK ES LV and MT) relates to the contrasting cases These Member
States tend to have comparatively low NEET shares with most of them having a poor
level of education and the lowest average youth-to-adult unemployment ratio In addi-
tion these countries appear to have a rather well-functioning educational system with
similarly low average shares of early school-leavers compared to cluster A Most of
these Member States responded to this setting with a strong focus on educational offers
under the YG
Cluster C (BE CZ EE FI FR HU IE IT LT LU NL PT RO SI SE and UK) ranks in
between cluster two and three on many indicators including the prevalence of low edu-
cated NEETs education and employment offers In general this cluster has the lowest
difference in temporary employment shares between adults and the youth
324 Indicator set 4 The heterogeneity of the NEET population
Cluster A (BE BG FI MT and NL) consists of countries that have a particularly high
share of NEETs in short-term unemployment illness or disability and lsquodiscouragement
from workingrsquo The policy response of these countries is characterised by the highest
average outreach efforts on the part of the national PES
Cluster B (CZ DE EE EL FR HU HR LT LU PL SI and UK) has the highest share of
short-term unemployed and individuals with family responsibilities among the NEETs
Similar to cluster A countries from cluster B display strong average outreach efforts and
a large degree of involvement of the PES in delivering the YG
The Youth Guarantee in light of changes in the world of work Youth Guarantee Intervention Models Sustainability and Relevance
36
Cluster C (AT CY DK ES IE IT LV PT RO SK and SE) is the most diverse for this
indicator set and shows the highest share of long-term unemployed and relatively high
rates of discouraged youth among the NEET population compared to other clusters The
governance structure shows a lower degree of PES having responsibility for administer-
ing and paying (unemployment) benefits as well as regarding the implementation and
delivery of the YG in general Compared to clusters A and B Member States from cluster
C tend to show fewer outreach efforts
325 Indicator set 5 Design and implementation features of the Youth Guarantee
Cluster A (AT CY DE DK EL FI HR IE LU and SE) includes many Member States
which set the age target as under-25 years old26 These countries also tend to define
very few other eligibility criteria or target groups Importantly all Member States includ-
ed in this category have a relatively long experience of YG-type schemes prior to 2013
However only very few of them defined a legal entitlement to receive an offer These
are also countries that mostly allowed individuals to register online set a definition for a
quality offer and also provided national quality guidelines for all actors involved in the
YG Many of the Member States in this cluster also primarily rely on their PES in the YG
implementation and have strengthened their PES capacities since the YG rollout
Cluster B (BG CZ ES FR MT NL PT and RO) includes a relatively diverse set of coun-
tries Most countries in this cluster have no prior experience of a YG-type of scheme
relatively low availability of online registration and a low prevalence of the definition of
quality offers While some countries additionally target NEETs under 30 years old in
general they neither upgraded the capacity of nor relied strongly on their PES in its im-
plementation
Cluster C (BE EE HU IT LV LT PL SI SK and UK) primarily consists of countries that
set the target for youth aged under 30 In addition many of these countries set addi-
tional target groups beyond the general criteria (such as a specific focus on long-term
unemployed) or defined specific sub-groups within the broad target population Similar
to cluster A some Member States with previous YG-related experience are included in
this cluster In addition they tend to have upgraded their PES capacity for YG implemen-
tation (but they also rely on other providers) These are also mainly countries that im-
plemented a legal entitlement and also a definition of a quality offer (without however
providing national guidelines)
326 Indicator set 6 The apprenticeship system
Cluster A (AT BE DE FR LU and NL) consists of countries with an employment-centred
STW transition type27 that is characterised by high levels of employer involvement in
education and training system and the largest share of firms employing initial vocational
and educational training (IVET) participants On average Member States in this group
show the largest share of timely exits from apprenticeships Relative to the share of
firms employing IVET participants the number of pledges within the EAFA framework is
26 It is important to note that most implementation-related indicators for example information on eligible age groups were measured in 2016 For a few countries these conditions have changed recently However in the analysis it was decided to stick to the initial implementation features to focus on the way Member States initially aimed to combat youth unemployment
27 See Pohl and Walther (2005) for details
The Youth Guarantee in light of changes in the world of work Youth Guarantee Intervention Models Sustainability and Relevance
37
the lowest in this group potentially reflecting the already high importance of apprentice-
ships in these countries
Cluster B (BG CZ EE HU LT LV RO SK and SI) is made up of Member States that
joined the EU relatively recently with a lsquotransitionalrsquo STW transition type and the lowest
share of firms employing IVETs Their share of apprenticeships is lowest among the
timely exits and their number for EAFA pledges is relatively the largest
Compared to cluster A and B cluster C (CY DK EL ES FI HR IE IT MT PL PT SE
and UK) also consists of a mixture of STW types and a medium share of firms hiring
IVETs Apprenticeship offers are of medium importance relative to the other two clus-
ters
327 Summary of first-step cluster analysis
The analysis of Member Statesrsquo similarities within the indicator sets shows that the re-
sulting country clusters tend to be different depending on the set of indicators although
certain tendencies are already apparent For instance countries that are included in the
same cluster for the YG design and implementation indicators tend to also be grouped
into the same finance cluster meaning that some countries with a low estimated cost of
implementing the YG tend to also be countries that show implementation patterns that
closely followed the Recommendation Similarly countries in the same apprenticeship
cluster tend to be in the same ldquoyouth labour market challengesrdquo cluster While this al-
ready provides some suggestions for the final grouping of Member States with respect to
all indicators chosen the overlap across clusters for the different indicator sets is not
complete so a more in-depth analysis is needed Specifically some clusters remain rela-
tively heterogeneous in terms of the underlying empirical indicators indicating that the
cluster analysis has some difficulties if Member Statesrsquo realisations of indicators do not
follow a simple pattern making the interpretation of some cluster results more difficult
than others For these reasons and to further reduce the dimensionality of the problem
the next section groups Member States based on all the chosen indicators To make the
connection between the first-step analysis and the ensuing second step the association
of first-step clusters with the final cluster results is also shown
The Youth Guarantee in light of changes in the world of work Youth Guarantee Intervention Models Sustainability and Relevance
38
33 Results and discussion of second-step clusters
The final cluster analysis uses all the indicators described in the previous section and
performs the clustering procedure for all variables in a combined step thereby arriving
at clusters that take the individual sub-clusters as well as the interaction between them
into account Table 2 shows the results by Member States including their association
with the clusters uncovered in the first stage of the analysis all ordered by the final re-
sults Being in the same first-step cluster is visualised as having the same shade of the
colour in the respective column It is important to note that the colours chosen imply no
qualitative or quantitative judgement apart from the cluster membership
Table 2 Summary of Results of Cluster Analysis
Country
Financial resources for implementing the YG
YG as part of national policymaking
Youth labour market chal-lenges
Heterogenei-ty of the NEET population
Design and implementa-tion features of the YG
Role of the apprentice-ship system in the YG
Overall cluster
Austria
A
Denmark
Finland
Germany
Ireland
The Netherlands
Sweden
The Czech Republic
B
Estonia
France
Hungary
Romania
The United Kingdom
Cyprus
C
Greece
Italy
Portugal
Spain
Belgium
D
Lithuania
Luxembourg
Malta
Poland
Slovenia
Bulgaria
E Croatia
Latvia
Slovakia
Source Own analysis
Note Countries that share the same first-stage cluster have the same shade of the colour in the respective
column Note that the colour shades imply no qualitative or quantitative ranking of Member States
The Youth Guarantee in light of changes in the world of work Youth Guarantee Intervention Models Sustainability and Relevance
39
Cluster A Member States with previous YG experience lower initial NEET rates
ambitious implementation and improved PES capacity low educated NEETs and
diversified offers (AT DK DE FI IE NL SE)
The first cluster is a set of Member States that are mostly countries which already had
longer experience with YG-related schemes On average YG implementation in these
countries was quite ambitious many of these Member States undercut the recommend-
ed four-month target for the preparatory phase and formally defined their offer quality
and quality guidelines Countries in this cluster tend to rely relatively strongly on their
PES for the YG while upscaling their PES capacity through hiring additional staff At the
same time they also experienced the lowest average NEET rates in 2012 for all clusters
and they consequently had comparatively low estimated costs and therefore low levels of
funding allocated under the YEI However the clusterrsquos NEET population has the highest
share of individuals with low educational background and youth with a disability Follow-
ing this NEET challenge they diversified their offers under the YG across types the most
compared to other clusters with the lowest focus on employment-type offers Involve-
ment and integration of partners within the YG framework in these countries was about
average compared to the other clusters
Cluster B Member States with intermediate NEET challenges strong outreach
efforts by the PES relatively poor monitoring data quality high NEET rates due
to family responsibilities and strong focus on employment offers (CZ EE FR HU
RO UK)
On average these Member States mostly observed a NEET challenge of intermediate
magnitude relative to other clusters at the time of the YG roll-out The labour markets
for youth in this cluster were under more stress and characterised by high rates of short-
term unemployment among their youth ndash for some of them also as a consequence of the
great recession Furthermore this cluster also had by far the highest share of youth that
were NEETs due to family responsibilities and the largest gap between youth and adult
unemployment rates As a result most of them received some funding under the YEI It
is also notable that countries in this cluster showed the largest increase in ALMP ex-
penditure between 2012 and 2015 However compared to the other clusters countries
in this cluster showed particularly poor monitoring data quality so their information has
a high degree of unknown destinations and situations for previous YG participants On
implementation a significant fraction of Member States from cluster B chose slightly
different targets (for example through targeting long-term unemployed introducing a
legal entitlement to a YG offer and extending the age limit up to age 29) They could
build on a comparatively advanced outreach system through the PES which they also
relied on in their YG implementation Furthermore four of the seven countries in this
cluster follow the post-socialisttransitional STW model (the Czech Republic Estonia
Hungary and Romania) On average these countries showed the lowest level of in-
volvement of the social partners and youth organisations and relatively few efforts at
reform On average countries in this cluster had the highest rate of timely exits into
employment indicating a tendency towards an ldquoemployment-firstrdquo approach
Cluster C Member States hit by the economic recession with highest initial
NEET rates severe long-term unemployment large support via EU funding
highest reform efforts and highest entry rates into apprenticeship offers (CY EL
ES IT PT)
The third cluster consists mainly of Member States that were hit particularly hard by the
economic recession following the financial crisis in the years after 2008 and they were
struggling to revive their labour markets in the ensuing recovery As a consequence
most countries had a severe problem with long-term youth unemployment into 2012
The Youth Guarantee in light of changes in the world of work Youth Guarantee Intervention Models Sustainability and Relevance
40
Moreover countries in this cluster had on average the highest rate of early school-
leavers Almost all these Member States received significant funds from the EU to sup-
port the YG implementation and delivery In contrast to Member States in Clusters A and
B none of the countries in cluster C had any kind of experience of a YG type of frame-
work before the Recommendation making its implementation even more difficult in
these countries However in terms of policy integration these Member States rank at
the top of youth-related ALMP reform efforts At the same time most of these countries
still have monitoring systems with relatively poor data quality and their PES used rela-
tively few channels for outreach activities compared to countries in the other clusters
Regarding partnerships built countries in this cluster show an average degree of effort
While the share of low educated NEET is comparable to those in Cluster B and average
exits rates into education are only slightly smaller than among countries from Cluster B
the share of individuals entering apprenticeships is highest among these countries sug-
gesting a stronger focus on the provision of both training and work experience to combat
the NEET challenge
Cluster D Member States characterised by relatively low initial NEET rates and
short-term unemployed rather than inactive NEETs some funding under YEI
strong outreach efforts through the PES and partnership approach and diversi-
fied offers with a stronger focus on education offers (BE MT LT LU PL SI)
The challenge for most Member States in this cluster was the high proportion of youth in
unemployment rather than a structural NEET challenge as most of their NEETs are
short term unemployed rather than discouraged NEETs or inactive for other reasons
Most of the countries in cluster D have medium-level estimated costs of fully implement-
ing the YG Consequently most of these Member States did not receive particularly large
amounts of funding from the EU (except Lithuania and Poland) At the same time these
are mainly Member States that put the most weight on building partnerships involving
social partners and youth organisations as well as outreach efforts including through the
PES Many of the Member States in this cluster followed the Recommendation quite
closely in terms of the time-frame for the YG but they did not establish strong monitor-
ing systems and they did not carry out many youth-related reforms in recent years
relative to other Member States In terms of the offer distribution these countries gen-
erally showed diversified offers with the strongest focus on education measures shown
by the largest share of timely exits from the YG into education and the lowest focus on
employment offers This is despite the fact that on average clusters B C and D had
very similar shares of low and medium educated NEETs at the onset of the YG suggest-
ing a very different policy response
Cluster E Member States that joined the EU relatively recently with lsquotransi-
tionalrsquo STW regimes high initial NEET rates structural challenges and substan-
tial EU funding focus on employment offers rather high reform efforts (BG HR
LV SK)
This cluster consists entirely of countries that joined the EU relatively recently compared
to the other Member States They are countries with a lsquotransitionalrsquo STW regime and
without prior experience in YG-type of frameworks before the Recommendation While
these countries have the lowest rate of early school-leavers and a substantially lower
share of low educated individuals among the NEETs compared to the other clusters this
cluster has the second largest share of NEETs with family responsibilities and the largest
share of discouraged youth This suggests that they struggled with more significant
structural NEET challenges compared to the other clusters The high NEET rates resulted
in high estimated costs for implementing the YG and consequently these Member States
also received substantial funding from the EU
The Youth Guarantee in light of changes in the world of work Youth Guarantee Intervention Models Sustainability and Relevance
41
Moreover these Member States also put in place a significant number of youth-related
ALMP reforms between 2013 and 2016 only outpaced by cluster C In terms of design
and implementation all of these countries chose to target youth under 30 and most put
particular emphasis on long-term unemployed individuals The degree of outreach efforts
through the PES is of average magnitude but the involvement of social partners and
youth organisations is highest among countries in this cluster This may indicate a cer-
tain degree of mismatch regarding outreach activities and the efforts likely to be re-
quired to activate the substantial share of discouraged NEETs in the youth population
However this cluster is the only in which all the Member States have YG-specific staff at
the PES and where all of them increased PES staff in recent years Due to the relatively
well-qualified nature of the NEET population Member States in this cluster concentrated
mostly on employment-type offers
34 Conclusion of second-step clusters
Breaking down the differences between clusters in a simple way is evidently challenging
due to the many aspects considered and highlighted in the cluster-specific characterisa-
tions This section therefore only provides a short conclusion to the findings in the final
cluster analysis indicating several sorts of Youth Guarantee models in place in the Euro-
pean Union It shows three clusters with comparatively low initial NEET rates at the out-
set of the YG Cluster A Cluster B and Cluster D What distinguishes these clusters from
one another among other issues is that Member States in Cluster A already had a long-
er experience of YG-related schemes they observed fewer youth-related challenges and
hence they received less additional funds from the EU
In contrast to this most Member States with the most pressing NEET challenges in 2012
are found in the other two clusters Cluster C and Cluster E include Member States with
particular NEET challenges mostly related to the financial crisis and recession for coun-
tries in Cluster C Member States in Cluster E also had a particular structural NEET chal-
lenge partially stemming from the transitional STW regime and they all received signifi-
cant funding from the EU
35 Measures of performance
Before investigating the correlation between the types of European YG models identified
and the performance of the YG implementation the analysis needs to define the relevant
outcome measures employed for this last step of the empirical analysis The correlation
analysis will make substantive use of information from the YG monitoring data The most
recent data available at the time of writing are from 2016 and they include information
on the main dimensions of the Recommendation
i ldquoCoveragerdquo rate provides an estimation of the degree to which the NEET popula-
tion was reached by the YG (the estimated proportion of the NEET population
aged 15-24 that was enrolled in the YG scheme at any point during the reference
year)28
28 These figures are based on the indicator average annual stock of young people in the YG pre-
paratory phase NEET population (annual average) included in the Indicator Framework for Moni-
toring the Youth Guarantee This indicator combines administrative and survey data Whilst this is not ideal the indicator is useful to give an approximate indication of the proportion of NEETs regis-tered in the YG scheme at any point during the year Results should therefore be interpreted as an estimation rather than a definitive measurement of the extent to which YG schemes achieve the objective of reaching all young people that become or are already NEET
The Youth Guarantee in light of changes in the world of work Youth Guarantee Intervention Models Sustainability and Relevance
42
ii The share beyond the four-month target the share of young people in the pre-
paratory phase beyond the four-month goal measured as a percentage of the
average annual stock of participants
iii Positive and timely exits the share of positive and timely exits shows how suc-
cessful Member States were at providing offers within the envisaged four-month
preparatory phase measured in percentage of all exits
iv Positive situations after six months this measure gives the percentage of YG par-
ticipants being in a positive situation at six months after exiting the programme -
the share of individuals either in education training or employment as a percent-
age of all exits
These performance indicators provide the most comprehensive and direct evidence on
the performance of the YG However there are some data limitations regarding the de-
gree to which the entire NEET population can be identified relevant for the comparability
of the coverage rate across Member States The quality of information on positive and
timely exits as well as the share of participants in a positive situation after exiting the YG
depends on the degree to which the destination of exits is known and how well individu-
als can be followed up Again to a certain degree this limits comparability across coun-
tries The distribution of these indicators across Member States is depicted in Figure 6 For the interested reader a separate cluster analysis solely based on the measures of YG
performance in Table 4 is included in the Annex
The Youth Guarantee in light of changes in the world of work Youth Guarantee Intervention Models Sustainability and Relevance
43
Figure 6 YG-monitoring data performance indicators by Member States 2016
Source YG monitoring data
0
10
20
30
40
50
60
70
80
90
100M
T
HU
UK
BG IT RO CY LV LU EE ES LT IE EL SE SK NL
CZ
HR PL
DK PT SI DE
FR BE FI AT
Coverage rate Share beyond the 4 month target
0
10
20
30
40
50
60
70
80
90
100
CY UK RO FR EL SI HR SK IE BG PT NL LV SE ES LU LT BE PL FI AT EE DE CZ IT DK HU MT
Positive and timely exits Positive situations after 6 months
The Youth Guarantee in light of changes in the world of work Youth Guarantee Intervention Models Sustainability and Relevance
44
To account for measuring issues in the monitoring data and because the main goal of
the YG was to lower youth unemployment and the prevalence of NEETs in general the
reduction from 2012 to 2017 in NEET rates and youth unemployment rates based on
Eurostat indicators is used as additional outcome measures
v Youth unemployment this measure gives the percentage of the 15-24 year old
young people in the labour force that are unemployed
vi NEET rates the NEET rate indicator is defined as the share of the youth popula-
tion (active or inactive) aged 15-24 that is not in employment education or
training
The distribution of these indicators is shown in Figure 7
Figure 7 Eurostat performance indicators by Member States 2012-2017
Source Eurostat (une_rt_a lfsi_neet_a)
36 Assessing the correlation between Youth Guarantee models
and performance
The goal of this section is to compare the performance of the YG as implemented in each
Member State across the clusters identified in section 34 and then to assess emerging
patterns This will be done by using box plots shown for each of the performance indica-
tors separately Box plots allow the comparison of the distribution of indicators across
clusters The median ie the observation in the middle in terms of outcomes (for in-
stance the middle value of all coverage rates within a cluster Figure 8 upper left panel)
is shown by the horizontal lines within each box Furthermore the size of the box shows
the location of the 50 closest observations to the median Observations outside this
box are shown in the graph by the so-called lsquowhiskersrsquo Extreme values that are far away
from the box are displayed as dots Figure 8 shows the distribution of performance
measures for the YG monitoring data
-5
0
5
10
15
20
FI AT
BE IT DE
FR LU NL
CY
DK
MT
RO SE EE UK SI LV CZ EL PL LT PT ES HR SK BG IE
HU
Reduction in youth unemployment Reduction in NEET rates
The Youth Guarantee in light of changes in the world of work Youth Guarantee Intervention Models Sustainability and Relevance
45
Figure 8 YG monitoring data performance indicators by clusters
Source Own analysis
The graph for the coverage rate (upper left panel) shows that clusters A and D have the
highest median coverage rates among the five clusters This appears quite natural as
these countries have had the lowest NEET rates at the onset of the YG making it easier
to cover a large portion of vulnerable youth compared to other countries Clusters B C
and E perform relatively similarly in terms of coverage with median values in the range
of 20 to 40 coverage rate despite the fact that clusters C and E had considerably larg-
er NEET rates when the YG was first introduced Among other factors these two clusters
have in common is that they received substantial funds from the EU to support YG
measures and that countries from both clusters enacted a significant number of youth-
related ALMP reforms
The upper right panel displays results for the share of participants still being in the pre-
paratory phase beyond the envisaged four months in each of the clusters A B D and E
this share is in the range of 45 to 50 in terms of the median values in cluster C this
value is 60 Clusters B and D show considerably more variation than the other clus-
ters The figure indicates therefore that the countries in cluster C appear to have put in
comparatively lower effort to upscaling their PES to provide YG services in time reflected
in the fact that these countries have the highest share of individuals in the preparatory
phase beyond the four month target
With respect to positive and timely exits (bottom left panel) there is no pronounced vari-
ation in terms of median outcomes across the clusters All of the clusters have positive
and timely exit rates of around 40 or slightly higher Finally looking at the share of
positive situations for YG participants after 6 months of leaving the programme (bottom
right panel) one can see that the median outcomes are quite similar for all clusters ex-
cept cluster B which has substantially lower positive outcomes after 6 months In addi-
tion there appear to be substantial differences in the within-cluster variation of this out-
The Youth Guarantee in light of changes in the world of work Youth Guarantee Intervention Models Sustainability and Relevance
46
come however this finding is probably due to the lack of data since for some Member
States these figures are not available (and coded as zero in the monitoring data) A simi-
lar reasoning can be used to explain the large variation between clusters A and D
Figure 9 Aggregate performance measures
Source Own analysis
Figure 9 investigates the reductions in youth unemployment rates and NEET rates from
2012 to 2017 respectively Both graphs display a similar pattern although the reduction
in youth unemployment is generally larger implying that a larger reduction was
achieved among those youth closer to the labour market Focusing on the cluster medi-
ans the figure indicates that cluster A ndash the cluster with the lowest initial NEET and un-
employment rates ndash shows the smallest decline Clusters B C and D show relatively
similar reductions in youth unemployment cluster E being at the top of the distribution
The picture is slightly different when looking at the reduction of NEET rates Here cluster
C has the largest median reduction in NEETs and clusters B D and E display similar per-
formance despite differences in variability Thus cluster E ndash the cluster with a combina-
tion of high initial NEET rates and more structural issues (such as a high share of dis-
couraged NEETs) ndash was more successful in reducing youth unemployment while clus-
ter C (with similarly high NEET rates for 2012 but lower educated NEETs and the highest
apprenticeship take-up rate in terms of timely exits among all clusters) was more suc-
cessful in reducing its NEET rates
4 Summary and conclusions
This report provides an updated overview of the implementation of the YG across EU
Member States based on the recent literature and data on the YG and European labour
markets On this basis six aspects of the Youth Guarantee implementation are dis-
cussed (1) financial resources for implementing the YG (2) the YG as part of national
policy making (3) youth labour market challenges (4) the heterogeneity of the NEET
population (5) the design and implementation features of the YG and (6) the role of the
apprenticeship system in the YG
The overall findings of the desk research and data analysis can be summarised as fol-
lows EU funding initiatives via the Youth Employment Initiative (YEI) and the European
Structural Fund (ESF) played a key role in supporting YG measures financially especially
for those countries suffering from high NEET rates and a significant economic downturn
or structural challenges Many of these countries increased spending on active labour
market policy which may be cautiously interpreted as an indirect effect of the YG In
some Member States the YG also fostered introduction of reforms of national youth poli-
The Youth Guarantee in light of changes in the world of work Youth Guarantee Intervention Models Sustainability and Relevance
47
cies improvements in monitoring systems for activation policies among young people
and the building of partnerships These changes are likely to outlast the YG initiative and
therefore provide sustained and ongoing benefits
Whereas these are substantive positive changes brought about by the YG not all of its
objectives were achieved First neither reducing labour market segmentation through
quality offers nor providing a remedy for imperfectly performing education systems was
fully achieved One reason was a prevalence of employment offers compared to relative-
ly few education or apprenticeship offers The low share of apprenticeship offers in some
Member States appears to be related to the existing institutional setup and STW transi-
tion regime increasing the prominence of the apprenticeship system would need to be
accompanied by broader institutional change Second several Member States were not
able to fully address the heterogeneity of the NEET population ndash especially those furthest
away from the labour market In contrast countries that performed well generally im-
proved the capacity of their Public Employment Services (PES) and developed partner-
ships to implement strong outreach programmes
Based on desk research of the six key aspects that are likely to influence the perfor-
mance of the YG as delivered by Member States a set of empirical indicators was de-
fined to measure the components of these six aspects using available quantitative and
qualitative data These empirical indicators feed into the main part of the analysis that
identifies the YG typology in terms of the key aspects specifically this approach groups
together Member States that share similar outputs across all the features included in the
analysis In practice the typology is derived from a two-step cluster analysis using an
agglomerative clustering algorithm
The first step of the typology discusses the similarity between Member States regarding
implementation-related and contextual features within six pre-defined sets of indicators
each corresponding to one of the six key aspects of the YG The cluster analysis gener-
ates different group compositions regarding Member States for each of the sets of empir-
ical indicators defined so a low-dimensional analysis is only partially informative This
result indicates that many aspects of the YG ndash and their interrelation ndash need to be con-
sidered in a comprehensive typology The second-step cluster analysis therefore simul-
taneously takes into account all of the 76 empirical indicators and identifies five final
clusters
Cluster A Member States with previous YG experience lower initial NEET rates ambi-
tious implementation and improved PES capacity low educated NEETs and diversified
offers (AT DK DE FI IE NL SE)
Cluster B Member States with intermediate NEET challenges strong outreach efforts by
the PES relatively poor monitoring data quality high NEET rates due to family responsi-
bilities and strong focus on employment offers (CZ EE FR HU RO UK)
Cluster C Member States hit by the economic recession with highest initial NEET rates
severe long-term unemployment large support via EU funding highest reform efforts
and highest entry rates into apprenticeship offers (CY EL ES IT PT)
Cluster D Member States characterised by relatively low initial NEET rates and short-
term unemployed rather than inactive NEETs some funding under YEI strong outreach
efforts through the PES and partnership approach and diversified offers with a stronger
focus on education offers (BE MT LT LU PL SI)
Cluster E Member States that joined the EU relatively recently with lsquotransitionalrsquo STW
regimes high initial NEET rates structural challenges and substantial EU funding focus
on employment offers rather high reform efforts (BG HR LV SK)
The Youth Guarantee in light of changes in the world of work Youth Guarantee Intervention Models Sustainability and Relevance
48
Obviously these explicit labels for the clusters tend to simplify the other factors of het-
erogeneity across Member States that determine the typology However some conclu-
sions can be drawn regarding the fit of underlying challenges to be addressed with the
policy response observed In particular it appears that countries in Cluster A C and D
reflected the challenges observed in the design and implementation of the YG to a higher
degree compared to cluster B and E as policies implemented ndash for example regarding
outreach efforts the extent of partnerships and the offer mix introduced ndash seem to bet-
ter match key factors of heterogeneity in the NEET population
Based on these insights the analysis continues with a correlation analysis relating the
identified YG models to basic performance indicators The findings highlight that there is
no evident pattern regarding the clustersrsquo performance in general Cluster A performs
well in terms of the NEET ldquocoveragerdquo rate but less well regarding the reduction in NEET
and unemployment rates over time Clusters B and D perform relatively similar across all
outcome measures although there is some variation that probably stems from meas-
urement issues in the monitoring data Cluster C shows the largest share of youth in the
preparatory phase beyond the envisaged four months but also the largest median de-
cline in NEET rates Cluster E has the lowest share of positive and timely exits but the
largest decline in youth unemployment out of all clusters
While the evidence is thus far from conclusive partly due to the number and complex
inter-relation of the aspects in which clusters differ the reportrsquos findings nonetheless
indicate that not only initial conditions but also the way Member States implement the
YG has affected its success
The Youth Guarantee in light of changes in the world of work Youth Guarantee Intervention Models Sustainability and Relevance
49
References
Andor L and Veselyacute L (2018) The EUrsquos Youth Guarantee a broadly accepted reform in
need of full implementation OSE paper series No 19
ANPAL (2017) Rapporto sullrsquoattuazione della Garanzia Giovani in Italia Rapporto
trimestrale n 4 Roma
ANPAL (2018) Monitoraggio sulla struttura e il funzionamento dei servizi per il lavoro
2017 Roma
Council of the European Union (2013) Council Recommendation of 22 April 2013 on es-
tablishing a Youth Guarantee Official Journal of the European Union Brussels
Department of Education and Skills (2016) Evaluation of the operation of the Youth Em-
ployment Initiative (YEI) element of the European Social Fund (ESF) Programme for Em-
ployability Inclusion and Learning (PEIL) 2014-2020
Department of Social Protection (DSP) (2014a) Pathways to Work - The Implementation
of the EU Council Recommendation for a Youth Guarantee
Department of Social Protection (DSP) (2016a) Member Statesrsquo response to 2013 Coun-
cil Recommendation on establishing a Youth Guarantee [Ireland]
Dheacuteret C and Roden J (2016) Towards a Europeanisation of Youth Employment Poli-
cies ndash A Comparative Analysis of Regional Youth Guarantee Policy Designs EPC Issue
Paper Ndeg81
Dheacuteret C and Morosi M (2015) lsquoOne Year After the Youth Guarantee Policy Fatigue or
Signs of Actionrsquo EPC Policy Brief Brussels European Policy Centre (EPC)
Doherty R (2018) lsquoWritten answer ndash Youth Guaranteersquo Daacuteil Eacuteireann Debate 22 March
2018
Eichhorst W Hinte H and Rinne U (2013) Youth Unemployment in Europe What to
Do about It IZA Policy Paper No 65 July httpftpizaorgpp65pdf
Employment Committee (EMCO) (2017) Ireland - 2017 EMCO Review on the Youth
Guarantee ndash Self-Assessment Questionnaire
Escudero V and E Loacutepez Mourelo (2017) The European Youth Guarantee A systematic
review of its implementation across countries Research Department Working Paper No
21 ILO Geneva
Eurofound (2013a) Young People and Temporary Employment in Europe Publications
Office of the European Union Luxembourg
Eurofound (2013b) Working Conditions of Young Entrants to the Labour Market Publica-
tions Office of the European Union Luxembourg
Eurofound (2014) Mapping Youth Transitions in Europe 2372014 Publications Office
of the European Union Luxembourg
Eurofound (2015a) Beyond the Youth Guarantee - Lessons Learned in the First Year of
Implementation Background Document prepared by Eurofound as a contribution to the
informal EPSCO meeting of 16-17 July 2015 Publications Office of the European Union
Luxembourg
Eurofound (2015b) Social Inclusion of Young People Publications Office of the European
Union Luxembourg
Eurofound (2016) Exploring the diversity of NEETs Publications Office of the European
Union Luxembourg
Eurofound (2017) Long-term unemployed youth Characteristics and policy responses
Publications Office of the European Union Luxembourg
The Youth Guarantee in light of changes in the world of work Youth Guarantee Intervention Models Sustainability and Relevance
50
European Alliance for Apprenticeship (2013) ldquoDeclaration of the European Social Part-
ners the European Commission and the Lithuanian Presidency of the Council of the Eu-
ropean Unionrdquo Brussels
European Commission (2011) Youth Opportunities Initiative ndash Communication From The
Commission To The European Parliament The Council The European Economic And So-
cial Committee And The Committee Of The Regions Brussels
European Commission (2013) Guidebook for Policy Planners and Practitioners on Ap-
prenticeship and Traineeship Schemes in EU27 December
European Commission (2016a) The Youth Guarantee and Youth Employment Initiative
three years on European Commission Directorate-General for Employment Social Af-
fairs and Inclusion Brussels
European Commission (2016b) Staff working documents 1 on ldquoThe Youth Guarantee
and Youth Employment Initiative three years onrdquo European Commission Directorate-
General for Employment Social Affairs and Inclusion Brussels
European Commission (2016c) Member Statesrsquo response to 2013 Council Recommenda-
tion on establishing a Youth Guarantee survey results unpublished
European Commission (2016d) Youth Guarantee Country by Country March 2016
European Commission (2017a) Report on PES Implementation of the Youth Guarantee
European Commission Directorate-General for Employment Social Affairs and Inclusion
Publications Office of the European Union Luxembourg
European Commission (2017b) Assessment Report on PES Capacity European Commis-
sion and Directorate-General for Employment Social Affairs and Inclusion Publications
Office of the European Union Luxembourg
European Commission (2017c) Education amp Training Monitor 2017 Comparative Report
European Commission (2017d) JobsPlus Youth
European Commission (2017e) Youth Guarantee Country by Country March 2017
European Commission (2017f) Draft Joint Employment Report from the Commission and
the Council accompanying the Communication from the Commission on the Annual
Growth Survey 2018 COM (2017) 674 final Brussels
European Commission (2017g) Employment and Social Developments in Europe 2017
European Commission (2017h) European Semester Thematic Factsheet ndash Employment
Protection Legislation
European Commission (2018a) The Youth Guarantee Country by Country Brussels
European Commission (2018b) Data collection for monitoring of Youth Guarantee
schemes Employment Social Affairs amp Inclusion
European Commission (2018c) Continued Education Offers in the Youth Guarantee -
Experience from the ground
European Commission (2018d) Traineeship offers under the Youth Guarantee
European Commission (2018e) Activation measures for young people in vulnerable situ-
ations - Experience from the ground
European Commission (2018f) Effective outreach to NEETs - Experience from the
ground
European Commission (2018g) Youth Guarantee amp Youth Employment Initiative Fact-
sheet 2762018
European Commission (2018h) Employment and entrepreneurship under the Youth
Guarantee ndash Experiences from the ground
The Youth Guarantee in light of changes in the world of work Youth Guarantee Intervention Models Sustainability and Relevance
51
European Commission (2018i) Employment and Social Developments in Europe 2018
European Commission (2018j) data on national commitments regarding the European
Alliance for Apprenticeships httpeceuropaeusocialmainjspcatId=1148amplangId=en
European Commission (2018k) ESF and YEI financial data by end 2017 submitted
through SFC2014 by Member States ndash Note EU amounts have been calculated on the
basis of the applicable co-financing rates
European Commission (2018l) Continued Education Offers under the Youth Guarantee ndash
Experience from the ground Brussels
European Court of Auditors (2017) Youth unemployment ndash have EU policies made a dif-
ference An assessment of the Youth Guarantee and the Youth Employment Initiative
Publications Office of the European Union Luxembourg
European Employment Policy Observatory (EEPO) (2015) EEPO Country Reports ndash Ire-
land Implementation of the 2013 Recommendation on establishing a Youth Guarantee
European Parliament (2015) Differential Treatment of Workers under 25 with a view to
their Access to the Labour Market Directorate General for Internal Policies Policy De-
partment A Economic and Scientific Policy
European Parliament (2017a) Workshop Summary Report Youth Guarantee and Youth
Employment Initiative Lessons from implementation Policy Department A Economy
and Scientific Policy European Parliament Brussels
European Parliament (2017b) Youth Employment Initiative Lessons from implementa-
tion Policy Department A Economy and Scientific Policy European Parliament Brussels
European Parliament (2017c) Youth Guarantee Lessons from implementation Policy
Department A Economy and Scientific Policy European Parliament Brussels
European Parliament (2018) Ensuring high-quality job creation from EU funding pro-
grammes How can the best practice of Horizon 2020 be better integrated into other
programmes (ESF Youth Guarantee Globalisation Fund) Policy Department for Budget-
ary Affairs Directorate General for Internal Policies of the Union
European Trade Union Confederation (2018) Boosting Unionsrsquo Participation to Guarantee
Quality Transitions and Employment to Young People in Europe
European Youth Forum (2017) Excluding youth a threat to our future
European Youth Forum (2018) Updated position on the Implementation of the Youth
Guarantee Brussels Belgium
Eurostat (2015) Being Young in Europe Today
Eurostat (2018) How common is temporary employment in your country
Ghirelli C E Havari G Santangelo and M Scettri (2019) ldquoDoes on-the-job Training
Help Graduates Find a Job Evidence from an Italian Regionrdquo forthcoming in the Inter-
national Journal of Manpower 40(1)
Gower J C (1971) A general coefficient of similarity and some of its properties in
Biometrics Vol 27 Nr 4 S 857ndash872
Gregg P and Tominey E (2005) The wage scar from male youth unemployment La-
bour Economics 12 487ndash509
Indecon (2016) Indecon Evaluation of JobBridge Activation Programme Report pre-
pared by Indecon International Research Economists and submitted to the Department
of Social Protection
International Labour Organisation and European Commission (2017) National Outreach
Strategy for non-registered young unemployed and inactive young people in Portugal
The Youth Guarantee in light of changes in the world of work Youth Guarantee Intervention Models Sustainability and Relevance
52
Leigh-Doyle S (2014) Can subsidised employment and work-first measures assist the
labour market integration of low-skilled unemployed youth Peer Country Comments
paper ndash Ireland EU Peer Review on lsquoEmplois drsquoavenirrsquo ndash Jobs with a futurersquo Scheme Par-
is (France) 10-11 February 2014
Milligan G W and Cooper M C (1985) An examination of procedures for determining
the number of clusters in a dataset Psychometrika 50 159-179
OrsquoReilly J Eichhorst W Gaacutebos A Hadjivassiliou K Lain D Leschke J McGuin-
ness S Kurekovaacute L M Nazio T Ortlieb R Russell H and Villa P (2015) lsquoFive
Characteristics of Youth Unemployment in Europe Flexibility Education Migration
Family Legacies and EU Policyrsquo SAGE Open January-March 2015 1ndash19
Pastore F (2018) Why is youth unemployment so high and different across countries
IZA World of Labor 2018 420 doi 1015185izawol420
Pastore F (2015) The Youth Experience Gap Explaining National Differences in the
School-to-Work Transition Heidelberg Springer International Publishing AG 2015
Pohl A and Walther A (2005) Tackling Disadvantage in Youth Transitions - A Themat-
ic Study on Policy Measures Concerning Disadvantaged Youth Report funded by the EU
Action Programme to combat Social Exclusion October
Pohl A and Walther A (2007) Activating the Disadvantaged ndash Variations in Address-
ing Youth Transitions across Europe International Journal of Lifelong Education 265
pp533-553
Quintini G and Martin S (2014) lsquoSame Same but Different School-to-Work Transi-
tions in Emerging and Advanced Economiesrsquo OECD Social Employment and Migration
Working Papers No 154 OECD Publishing
Quintini Glenda and Martin John P and Martin Seacutebastien (2007) The Changing Nature
of the School-to-Work Transition Process in OECD Countries WDA-HSG Discussion Paper
No 2007-2
Scarpetta S A Sonnet and Manfredi T (2010) lsquoRising Youth Unemployment During
The Crisis How to Prevent Negative Long-term Consequences on a Generationrsquo OECD
Social Employment and Migration Working Papers No 106
Stokes D (2016) Opening gateways to work for youth But can success be guaran-
teed Peer Country Comments Paper ndash Ireland EU Peer Review on The Guarantee for
Youth (a particular measure within the broader context of the Youth Guarantee) Paris
(France) 7-8 April 2016
Tosun J Unt M and Wadensjouml E (2017) Youth‐oriented Active Labour Market Poli-
cies Explaining Policy Effort in the Nordic and the Baltic States Social Policy amp Admin-
istration 51 598ndash616
Treadwell Shine K (2016) lsquoYouth Guarantee in Irelandrsquo Department of Social Protec-
tion presentation Youth Opportunities at EU Level Cork
Walther A (2006) Regimes of Youth Transitions Choice Flexibility and Security in
Young Peoples Experiences across different European Contexts Young Vol 14 No 2
pp119ndash139
Ward J H Jr (1963) Hierarchical Grouping to Optimize an Objective Function Journal
of the American Statistical Association 58 236ndash244
The Youth Guarantee in light of changes in the world of work Youth Guarantee Intervention Models Sustainability and Relevance
53
Annex
Table 3 List of indicators
Indicator name and time of measurement
Source Explanation
Financial resources for implementing the Youth Guarantee
Initial YEI allocation (2014-2017)
EC (2016b) Euros-tat (nama_10_gdp)
YEI allocation in of GDP
YEI+ESF EU eligible cost
(2017)
EC (2018k) Euros-
tat (nama_10_gdp) YEI+ESF eligible cost in of GDP
Other ESF eligible cost (2017)
EC (2018k) Euros-tat (nama_10_gdp)
Other ESF eligible cost in of GDP
Share of declared YEI+ESF funds (2017)
EC (2018k) Declared YEI+ESF funds as a share of eligible cost
Estimated cost of the YG (2015)
Eurofound (2015)
Binary indicator for medium cost (03-06 of
GDP) reference category low cost
Binary indicator for high cost (gt06 of GDP) reference category low cost
Change in ALMP expenditure (2012 to 2015)
Eurostat (lmp_expsumm)
Difference in ALMP expenditure in of GDP
YG as part of national policy-making
Number of youth-related ALMP reforms (2013-2016)
LABREF database Absolute number of reforms
Number of additional measures beyond Recom-mendation implemented in the context of the YG (2016)
EC (2016c)
Sum of binary indicators for additional measures regarding school dropout social and welfare policies volunteering social economy and oth-er
Share of YG exits with un-known destination (2016)
EC (2018b)
Binary indicator for an unknown share of 10-30 reference category 0-10
Binary indicator for an unknown share of more than 30 reference category 0-10
Share of unknown situations in the six month follow up
(2016)
EC (2018b)
Binary indicator for an unknown share of 40-99 reference category 0-39
Binary indicator for an unknown share of 100 reference category 0-39
Involvement of social part-ners (2016)
EC (2016c) Sum of binary indicators for the involvement of social partners in design implementation and evaluationmonitoring
Involvement of youth organi-sations (2016)
EC (2016c) Sum of binary indicators for the involvement of social partners in design implementation and
evaluationmonitoring
PES involvement of youth in design of YG (2017)
EC (2017a) Binary indicator
PES involvement of youth organisations in design of YG (2017)
EC (2017a) Binary indicator
Partnerships formed by PES (2017)
EC (2017a)
Sum of binary indicators for PES partnerships aimed at increasing information availability increasing workeducation opportunities and easing the transition into employment from educationunemployment
The Youth Guarantee in light of changes in the world of work Youth Guarantee Intervention Models Sustainability and Relevance
54
Indicator name and time of measurement
Source Explanation
Youth labour market challenges
Youth share of total popula-tion (2012)
Eurostat (lfsa_pgaed)
Number of youth (15-24) expressed as of total population
Youth-to-adult unemploy-ment ratio (2012)
Eurostat (une_rt_a) Youth (15-24) unemployment rate divided by adult unemployment rate (25-74)
NEET rate among 15-29 year
olds (2012)
Eurostat
(edat_lfse_21)
Total number of NEETs aged between 15 and 29
in of total youth population
Difference in temporary em-ployment shares (2012)
Eurostat (lfsi_pt_a) Difference in temporary employment rates be-tween youth (15-24) and adults (25-54)
Share of early school-leavers (2012)
Eurostat (edat_lfse_14)
Share of early school-leavers as of youth population (18-24)
Share of low-educated NEETs
(2012) Eurostat (edat_lfse_21)
Number of NEETs with low education back-
ground divided by total number of NEETs (15-24)
Share of medium-educated NEETs (2012)
Number of NEETs with medium education back-ground divided by total number of NEETs (15-24)
Share of employment offers (2016)
European Commis-sion (2018b)
Number of employment offers as of total offers typically made to participants
Share of timely exits into employment (2016)
European Commis-sion (2018b)
Number of exits into employment as of total timely exits from the YG
Share of education offers (2016)
European Commis-sion (2018b)
Number of education offers ias of total offers typically made to participants
Share of timely exits into education (2016)
European Commis-sion (2018b)
Number of exits into education as of total timely exits from the YG
The heterogeneity of the NEET population
Share of re-entrants among NEET (2013)
Eurofound (2016) Number of individuals in the respective group in of total NEET population
Share of short-term unem-ployed among NEET (2013)
Share of long-term unem-ployed among NEET (2013)
Share of individuals with illnessesdisabilities among NEET (2013)
Share of individuals with family responsibilities among NEET (2013)
Share of discouraged workers among NEET (2013)
PES responsibility regarding paying of unemployment benefits (2017)
European Commis-sion (2017b)
Binary indicator for the PES responsibility
PES responsibility regarding administering unemployment benefits (2017)
PES responsibility regarding other types of benefits
(2017)
The Youth Guarantee in light of changes in the world of work Youth Guarantee Intervention Models Sustainability and Relevance
55
Indicator name and time of measurement
Source Explanation
Number of responsibilities of the PES within the YG (2017)
European Commis-sion (2017a)
Sum of binary indicators for the PES being re-sponsible for managing the YG scheme regis-tering unemployed youth providing (placement) services to youth coordinating partners out-reach to NEETs follow-up of participants and design and maintenance of the monitoring scheme
PES outreach activities
(2017)
European Commis-
sion (2017a)
Binary indicator for the PES having awareness raising initiatives
Binary indicator for the PES having outreach programmes for pro-active work with schools
Binary indicator for the PES to cooperate with NGOs and youth organisations for outreach
Binary indicator for the PES to have specific outreach caseworkers
Binary indicator for the PES to have new points of entry (via new media)
Binary indicator for the PES to provide single-point servicesone-stop shops
Binary indicator for the PES to have mobile PES initiatives
Binary indicator for the PES to have follow-up programmes to reach out to YG drop-outs
PES programme for prevent-ing high school dropout (2017)
European Commis-sion (2017a)
Binary indicator
Design and implementation features of the Youth Guarantee
Eligible age group (2016) European Commis-sion (2016c)
Binary indicator for YG eligible age group being under 25 year and recent graduates reference category under 25
Binary indicator for YG eligible age group being under 26 reference category under 25
Binary indicator for YG eligible age group being
under 27 reference category under 25
Binary indicator for YG eligible age group being under 30 reference category under 25
Envisaged time-frame of intervention (2016)
European Commis-sion (2016c)
Binary indicator for the target time frame being below 4 months reference category 4 months
Binary indicator for the target time frame being above 4 months reference category 4 months
YG scheme specifically tar-geting long-term unemployed (2016)
Escudero and Mourelo (2017)
Binary indicator
Main YG provider (2016) European Commis-sion (2016c)
Binary indicator for the YG to be provided main-ly by the PES and other institutions reference category only PES
Binary indicator for the YG to be provided main-
ly by other institutions reference category only PES
The Youth Guarantee in light of changes in the world of work Youth Guarantee Intervention Models Sustainability and Relevance
56
Indicator name and time of measurement
Source Explanation
Degree to which online regis-
tration for the YG is possible (2016)
European Commis-sion (2016c)
Binary indicator for online registration being partly possible reference category not at all
Binary indicator for online registration being
possible everywhere reference category not at all
Legal entitlement to offer (2016)
European Commis-sion (2016c)
Binary indicator for whether there exists an entitlement for young people to receive an offer in line with or similar to the Youth Guarantee
Previous experience with a
YG-type of framework (2014)
European Commis-
sion (2016c)
Binary indicator for having recent experience with a YG-type of framework reference catego-ry none
Binary indicator for having longer experience with a YG-type of framework reference catego-ry none
Formal definition of quality
offer (2016)
European Commis-
sion (2016c)
Binary indicator having formally defined offer
quality
National quality guidelines (2017)
European Commis-sion (2017a)
Binary indicator having national quality guide-lines from the national administration to all PES officesother organisations involved in the YG
PES has YG-specific staff (2017)
European Commis-sion (2017a)
Binary indicator for having YG-specific staff
PES training (2017) European Commis-sion (2017a)
Binary indicator for the PES providing training specifically tailored working with youth
PES staff increase (2014-2017)
European Commis-sion (2017a)
Binary indicator for the PES having in-creasedunchanged staff from 2014-2017
PES has youth-specific tar-
gets (2017)
European Commis-
sion (2017a)
Binary indicator for the PES having youth-
specific targets
The role of the apprenticeship system in the YG
Share of firms with IVET participants (2010)
Eurostat (trng_cvt_34s)
Share of firms hiring initial vocational training participants expressed as a of all firms
Share of apprenticeship of-fers (2016)
European Commis-sion (2018b)
Number of offers of apprenticeships as of total offers typically made to participants
Share of timely exits into apprenticeships (2016)
European Commis-sion (2018b)
Number of exits into apprenticeships as of total timely exits from the YG
School-to-work transition cluster (2005)
PohlWalther (2005)
Binary indicator for STW being of type transi-tionalpost-socialist reference category miss-ing
Binary indicator for STW being of type sub-protective reference category missing
Binary indicator for STW being of type univer-salistic reference category missing
Binary indicator for STW being of type liberal reference category missing
Binary indicator for STW being of type employ-ment-centred reference category missing
Number of EAfA pledges (2018)
European Commis-sion (2018j)
Number of pledges to increase apprenticeships by firms or organisations normalised by the share of firms hiring IVETs
The Youth Guarantee in light of changes in the world of work Youth Guarantee Intervention Models Sustainability and Relevance
57
Table 4 Outcome cluster means
Cluster A Cluster B Cluster C Cluster D
ldquoCoveragerdquo rate (in ) 488 76 479 448
Share in preparatory phase beyond four
months (in )
433 284 606 519
Share of positive and timely exits (in ) 511 740 366 372
Share with positive situation after six
months (in )
576 521 562 60
Reduction in youth unemployment (in
-points)
37 121 145 62
Reduction in NEET rates (in -points) 11 42 43 18
Note This table shows cluster means (averages) for a cluster analysis solely based on the authorsrsquo measures
of performance (see section 35 for their description) The analysis creates Cluster A (AT BE DK IT LT LU
and SE) Cluster B (BG HU and MT) Cluster C (EL ES HR IE PT and SK) and cluster D (CY CZ DE EE FI
FR LV NL PL RO SI and UK)
The Youth Guarantee in light of changes in the world of work Youth Guarantee Intervention Models Sustainability and Relevance
58
HOW TO OBTAIN EU PUBLICATIONS
Free publications
bull one copy
via EU Bookshop (httpbookshopeuropaeu)
bull more than one copy or postersmaps
from the European Unionrsquos representations (httpeceuropaeurepresent_enhtm)
from the delegations in non-EU countries
(httpeeaseuropaeudelegationsindex_enhtm)
by contacting the Europe Direct service
(httpeuropaeueuropedirectindex_enhtm) or calling 00 800 6 7 8 9 10 11 (free-
phone number from anywhere in the EU) () () The information given is free as are most calls (though some operators phone boxes or hotels may charge you)
Priced publications
bull via EU Bookshop (httpbookshopeuropaeu)
Priced subscriptions
bull via one of the sales agents of the Publications Office of the European Union
(httppublicationseuropaeuothersagentsindex_enhtm)
doi 102767371432
KE-0
1-1
9-1
28-E
N-N

The Youth Guarantee in light of changes in the world of work Youth Guarantee Intervention Models Sustainability and Relevance
7
and the NEET rate (the share of young people neither in employment nor in education or
training) was 109 If young people up to 29 years of age are included the average
rate of youth unemployment in the EU 28 was 127 while the NEET rate reached
134 (amounting to 177 specifically within the 25-29 age bracket) Figures 1 and 2 show the numbers for the 15-24 age group and illustrate the policy chal-
lenge of the youth unemployment rate (Figure 1) and the NEET rate (Figure 2) They
also show the substantial variation across EU countries as Figure 1 shows the youth
unemployment rate (Q2 2018) is below 10 in Austria Germany Estonia Denmark the
Netherlands the Czech Republic and Hungary In the majority of EU countries however
it ranges from 10 to 20 while it is above 30 and up to almost 40 in Italy Spain
and Greece Looking specifically at the most recent development by comparing it with
the Q2 2015 youth unemployment rate however the figure also shows a general down-
ward trend across all EU Member States which is quite pronounced in some countries
(Bulgaria Croatia Malta and Hungary for example)
Looking at the NEET rates in Figure 2 this downward trend in the most recent develop-
ment comparing 2015 and 2017 is also clearly visible Again there is notable variation
across Member States On average EU countries have a NEET rate of around 109 as
of 2017 and Ireland and Poland have NEET rates close to the EU average While the
Netherlands is the only EU country with a rate below 5 Croatia Romania Bulgaria
and Italy have the highest NEET rates with the rate reaching almost 20 in Italy
Figure 1 Youth unemployment rates (15-24 years old) in EU Member States
2015 compared to 2018
Source Authorsrsquo illustration based on latest available Eurostat data youth unemployment rate as percentage
of the active population quarterly average Countries are ordered by Q2 2015 rates Data is seasonally adjust-
ed For Italy and Cyprus the Q1 2018 rates are reported (latest available)
0
5
10
15
20
25
30
35
40
45
50
DE EE AT
DK
NL
CZ
MT LV UK LT SI LU HU IE
EU28 P
L
SE BE
RO FI BG FR SK PT
CY IT HR ES EL
2015Q2 2018Q2
The Youth Guarantee in light of changes in the world of work Youth Guarantee Intervention Models Sustainability and Relevance
8
Figure 2 Rates of young people (15-24 years old) not in employment educa-
tion or training (NEET) in EU Member States 2015 2017
Source Authorsrsquo illustration based on latest available Eurostat data annual averages Countries are in order of
the 2015 rates
In addition to these aggregate statistics the difficulties for youth in the STW transition
can be related to several structural challenges or market failures In particular these
concern (a) Labour market segmentation ndash a labour market pattern in which young
people are over-represented in temporary part-time non-permanent work (b) (under-)
performance of the education and training system ndash the low achievement of a substantial
section of youth in basic and lsquotransversalrsquo (transferable) skills (c) the limited availability
of lsquoqualityrsquo work experience and (d) insufficient capacity of the Public Employment Ser-
vice (PES) to ensure effective provision of tailored services and support for young people
(see European Commission 2017a)
12 The Youth Guarantee
The significant challenges that young people face in relation to fast smooth and effec-
tive STW transitions were exacerbated during and after the recession Since then they
have also acted as a catalyst for policy change in many Member States Accordingly a
YG was introduced following the 2013 Council Recommendation (Council of the European
Union 2013) Together with associated structural reforms of vocational education and
training (VET) and activation policies that are implemented across the EU its aim is to
address these challenges More specifically following a proposal from the European
Commission all Member States adhered to the establishment of the YG committing
themselves to giving every young person a good-quality offer of employment continuing
education or an apprenticeship or a traineeship within a period of four months of be-
coming unemployed or leaving formal education (Council of the European Union 2013)
The idea of YG style policies originated in the Nordic countries where such initiatives
were first implemented in Sweden in 1984 and then elsewhere in the 1990s (Norway in
1993 Denmark and Finland in 1996 see for example Escudero and Loacutepez Mourelo
2017)
In a Communication published three years after the launch of the YG by the European
Commission (2016a) it was observed that the YG had become a reality across the EU
Starting from January 2014 14 million young people had already registered in YG
schemes by 2016 Around nine million young people had taken up an offer the majority
0
5
10
15
20
25N
L
DK
DE
LU SE CZ
AT LT SI
MT LV FI EE PL
UK PT
HU
EU2
8 FR BE SK IE CY ES EL HR
RO
BG IT
2015 2017
The Youth Guarantee in light of changes in the world of work Youth Guarantee Intervention Models Sustainability and Relevance
9
of which were offers of employment almost two thirds of young people who left the YG
in 2015 took up an offer of employment education traineeship or apprenticeship While
the Commission Communication also concluded that the YG has significantly facilitated
structural reforms and innovation in policy design across Member States it also asserted
that nonetheless youth unemployment remained unacceptably high and many chal-
lenges still need to be addressed by Member States
13 Outline of the project and the present report
The main objective of this project is to undertake an up-to-date review of the current
approaches and implementation of the YG especially in view of new challenges for youth
in the changing world of work thereby providing the basis for a future YG model that is
both robust and dynamic
This report constitutes the first phase of the research project In the first phase a com-
prehensive desk review of existing documents and data was undertaken together with
the construction of a database of indicators for a cluster analysis as well as supplemen-
tary country case studies This approach is explained and implemented throughout this
report Aspects that guide the analysis are 1) the degree to which EU financing helped
to implement the YG 2) whether the YG became a sustainable part of national policy
making 3) the main challenges faced by young people in their transition into the labour
market 4) the heterogeneity of the NEET population 5) the design and implementation
features of the YG and 6) the role of apprenticeships in the YG Based on these insights
a typology of YG models is developed and the correlation of these types is assessed re-
garding measures of performance
The second phase of the research project will address the emerging challenges for young
peoplersquos transition into the world of work drawing extensively on consultation with
stakeholders both through an online survey and more importantly through a stakehold-
er seminar held in Brussels on Oct 1 2018 during which experiences with the YG were
exchanged and future challenges identified and discussed The results of this second
phase will be published in a separate report2 Together these two reports should inform
reflection on further developments of the YG
The report at hand is structured as follows Section 2 has two parts the first part identi-
fies the main characteristics of YG implementation in context while the second part de-
fines empirical indicators for these characteristics and their sub-dimensions In section 3
these indicators are used for constructing a typology of YG models also showing how the
different types of models differ regarding performance indicators Section 4 presents the
conclusions of the analysis
2 European Commission (forthcoming) The Youth Guarantee in light of changes in the world of work Emerging challenges related to young peoplersquos transition in the labour market
The Youth Guarantee in light of changes in the world of work Youth Guarantee Intervention Models Sustainability and Relevance
10
2 Implementation features of the YG and related indica-
tors
This section provides a comprehensive overview of the main features that characterise
YG implementation and assess the main features that are likely to determine its success
in Member States It has two steps first section 21 gives an overview of the relevant
dimensions of YG implementation along the six guiding aspects outlined above Based on
this characterisation section 22 discusses the ways in which each of these aspects can
be represented by a set of empirical indicators and which will be used in chapter 3 for a
YG typology The list of indicators for each of the six aspects comprise key contextual
characteristics for each Member State as well as implementation-related features such as
partnerships created as a result of YG implementation or the types of interventions
used In particular indicators that characterise Member States at the outset of the YG
(measured in 2012 or 2013) as well as the way the YG was implemented (mostly meas-
ured up until 2016) inform the typology Indicators of YG performance such as for ex-
ample the estimated proportion of the NEET population reached by the YG (the so-called
YG ldquocoverage raterdquo) are considered outcomes of the way Member States implemented
the YG
The presentation and discussion of intervention features and corresponding empirical
indicators in section 2 is complemented by selected information from five brief country
case studies The case studies are a supplementary element in the review exercise that
feeds into this chapter and they are meant to illustrate the intervention features dis-
cussed throughout the chapter in more detail for selected countries Based on an lsquoex
ante assessmentrsquo of a set of qualitative and quantitative country indicators the following
five countries were selected for case studies Austria Denmark Ireland Italy and Lat-
via The countries were selected firstly to cover (to the extent that is possible) the ex-
isting types of STW regimes and secondly to reflect the heterogeneity of the NEET popu-
lation NEET implementation is characterised by high and low NEET and youth unem-
ployment rates high and low YG coverage and the financial resources put into its im-
plementation3
21 Features of Youth Guarantee implementation
211 Financial resources for implementing the Youth Guarantee
The YG is not a funding programme in itself It is instead a political commitment sup-
ported among other ways by financial contributions from the EU and national budgets
as well as contributions from the private and non-profit sectors This section on the first
YG implementation aspect financial resources briefly outlines the relevance of these
different sources Specific focus will be given to the Youth Employment Initiative (YEI)
and the European Social Fund (ESF) as the main EU sources to financially underpin the
implementation of the YG
Youth Employment Initiative The YEI was established during three informal summits of
EU Heads of State in 2013-14 and then given euro32 billion for the 2014-15 period Eligi-
bility for measures funded through the YEI is confined to young people aged 16-254 who
3 It is important to emphasise the lsquoex-antersquo nature of case study selection they were chosen based on a preliminary set of indicators at the outset of the study whereas the full in-depth identi-fication and discussion of indicators ndash as presented in this chapter ndash and their analysis in Chapter 3
becomes a key element of the study itself 4 The upper age band is 29 in some Member States
The Youth Guarantee in light of changes in the world of work Youth Guarantee Intervention Models Sustainability and Relevance
11
are not in employment education or training (lsquoNEETsrsquo) Funding from the YEI was only
allocated to regions in those Member States where youth unemployment was higher than
25 in 20125 Since national allocations are based on the number of unemployed young
people in 2012 in these regions YEI funds were allocated to a varying extent to each
Member State based on their (regional) unemployment rates (European Commission
2016a) Spain was the largest recipient of the initial YEI specific allocation receiving
euro9435 million and Slovenia the smallest receiving euro92 million In 2015 in view of the
immensity of the youth-employment challenge the European Commission took steps to
ensure a quick mobilisation of its funds6 Specifically a higher pre-financing rate for the
euro32 billion YEI specific allocation in 2015 than for other ESF allocations (30 instead of
the original 1-15 of the specific allocation for other ESF funds) was introduced
This led to an amount of around euro1 billion in additional pre-financing to Member States
in 2015 (European Commission 2016a) In the summer of 2017 during the mid-term
review of the EUrsquos seven-year budget the YEI was extended until 2020 and it received
an additional financial allocation of euro12 billion In addition it was targeted at regions
where youth unemployment still exceeded 25 in 2016 (Andor and Veselyacute 2018) Ac-
cording to the Commissionrsquos report in October 2016 the YEI is seen by Member States
as a key mechanism through which to operationalise national Youth Guarantee schemes
ldquoIn some cases the YEI is being used to support most or all measures planned under the
YG schemes while in others it is one funding source amongst others Countries where
large shares of YG funding comes from the YEI include Lithuania ndash where 23 of all YG
actions are supported by the YEI Poland ndash where 34 of all YG actions YEI funded and
Spain ndash where 80 of all YG actions are funded through the YEIrdquo (European Commis-
sion 2016b p89)
YEI funds were provided from the EU budget as a top-up to the already available ESF
funds for 2014-2020 to provide additional support for programmes with a specific focus
on NEETs (European Court of Auditors 2017) However the funding allocated to each
Member State under the YEI has to be matched by an equal amount from the respective
Member State allocations in the ESF 2014-20 budget This holds for the initial allocation
in 2013 as well as the additional funds in 2017 Hence the total budget of the YEI (for
all eligible EU Member States) now totals euro88 billion for the period 2014-2020
European Social Fund In addition to ESF funds that were directly used to match the YEI
contributions (see above) some Member States also utilised additional funds from the
ESF for further employment-related programmes7 directly or indirectly benefiting youth
but with no specific focus on NEETs In contrast to YEI funds which are intended to di-
rectly support NEETs ESF funds may also be used to support structural reforms In total
Andor and Veselyacute (2018) estimate that approximately euro14-15 billion from the EU budget
over the period 2014-20 financed the implementation of the YG through the YEI and ESF
5 The exact methodology for allocating Youth Employment Initiative funds among Member States is set out in Annexe VIII to the lsquoCommon Provisions Regulationrsquo ie Regulation (EU) No 13032013 of 17 December 2013 OJ L 347 20122013 p 320ndash469
6 An additional reason was that many Member States ldquoraised the issue that they dont have the national budget necessary to pay advance funding to projects working with young peoplerdquo (source httpeuropaeurapidpress-release_MEMO-15-5020_enhtm)
7 The ESF is Europersquos main instrument for supporting jobs helping people get better jobs and en-suring fairer job opportunities for all EU citizens (European Parliament 2018)
The Youth Guarantee in light of changes in the world of work Youth Guarantee Intervention Models Sustainability and Relevance
12
funds8 This is a significant share of the total ESF funding of euro864 billion available to MS
for the 2014-2020 period (including the YEI)
Country case study Austria
Young people in Austria were already benefiting from special attention before the intro-
duction of the YG Several measures were set up to facilitate the transition from educa-
tion to the labour market in particular through a well-established apprenticeship sys-
tem Reducing the age for early school-leaving existed before the 2013 Council Recom-
mendation The long-standing existence of policy measures for young people is reflected
in Austriarsquos relatively successful performance as regards youth employment and STW
transition The labour market situation of young people in Austria is better than the EU
average and it continues to improve The rate of youth unemployment (15-24 years old)
went down from 106 in 2015 to 98 in 2017 which is significantly below the EU
average (168) This good performance is also reflected in the number of NEETs The
NEET rate in Austria was at 65 in 2017 well below the EU average (109)
In addition evidence shows that Austria is performing better than the rest of the EU as
regards its YG implementation (European Commission 2018a) It is acknowledged that
Austria has established a comprehensive Youth Guarantee based on effective partner-
ships targeted policy measures and a robust monitoring system with interconnected
administrative data (European Commission 2016a) The countryrsquos performance is par-
ticularly outstanding in two dimensions the NEET coverage and the delivery of a good
quality offer
Data for 2016 shows that an estimated 829 of NEETs in Austria are reached by the
YG which is the highest figure amongst Member States and almost double the EU aver-
age (425)9 In addition this ldquocoverage indicatorrdquo has been at consistently high levels
since the start of the YG A second more suggestive but somewhat less reliable way of
looking at the performance of a YG scheme is trying to estimate the rate of recycling
ie the percentage of NEETS entering the YG with previous YG experience10 This recy-
cling rate is rather high in Austria (739 compared to 341 for EU 28) suggesting
that employment services have little difficulty in lsquostaying in touchrsquo with young people
who already had a YG experience
The Austrian YG provides a wide range of offers (European Commission 2016d) It
comprises apprenticeship traineeship education and employment offers that are tar-
geted specifically at young people such as for example supra-company apprentice-
ships or production schools Additionally the general education training apprenticeship
and employment offers are open to young people
At the same time it is to be noted that Austria still faces difficulties in integrating cer-
tain sub-groups into the labour market in particular women migrants and young peo-
8 This figure is slightly higher than the euro127 billion stated by the Commission in its October 2016 report which YEI and the ESF are directly investing in ldquolabour market integration measures for young people in the programming period 2014-2020rdquo (European Commission 2016a p 12)
9 These figures are based on the indicator average annual stock of young people in the YG pre-paratory phase NEET population (annual average) included in the Indicator Framework for Moni-toring the Youth Guarantee This indicator combines administrative and survey data Whilst this is
not ideal the indicator is useful to give an approximate indication of the proportion of NEETs regis-tered in the YG scheme at any point during the year Results should therefore be interpreted as an estimation rather than a definitive measurement of the extent to which YG schemes achieve the objective of reaching all young people that become or are already NEET
10 The recycling rate is only experimental data and not officially part of the YG monitoring dataset
The Youth Guarantee in light of changes in the world of work Youth Guarantee Intervention Models Sustainability and Relevance
13
ple with low skills (European Commission 2018a) Ongoing efforts for these target
groups need to be intensified as recent measures have not led to sufficient results yet
Other EU sources Several other EU budget lines support employment- and education-
related programmes in Member States including the European Regional Development
Fund (ERDF) the ERASMUS programme as well as Horizon 2020 and the European Glob-
alisation Adjustment Fund (EGF) For an analysis of their job-creation potential and their
relation to the ESFYEI see European Parliament (2018) In addition a range of smaller
EU programmes finance employment-related measures for (young) people such as the
European Solidarity Corps or the EU Programme for Employment and Social Innovation
(EaSI)11
Three aspects deserve to be highlighted regarding differences across Member States in
financing the implementation of YG activities
First as the 2017 European Court of Auditors report on ldquoYouth unemployment ndash have EU
policies made a differencerdquo highlights the level of YEIESF funding available would only
address a small proportion of the required amount for the full implementation of a YG
Member States therefore need to leverage significant additional resources from national
budgets to achieve this goal However so far there has been ldquono assessment of cost
and available funding by Member Statesrdquo (European Court of Auditors 2017)
Second the extent to which the YEIESF funds simply financed youth-related schemes
that already existed prior to the YG is unclear They may be funded either by other EU
schemes or Member State national budgets The European Court of Auditors states that
YEIESF should ldquonot replace public or equivalent expenditure by the Member Statesrdquo
(ibid) However the Commission notes in its reply to the report that the YEI provisions
do not deny to Member States finance for measures previously supported by the national
budget or measures that require Member States to increase public spending regarding
certain types of measures or target groups At the same time the European Court of
Auditors analysis of seven Member Statesrsquo Operational Plans for the YEIESF showed that
ldquo[hellip] the majority of the measures which were to receive YEI financing already existed
prior to the introduction of the Youth Guarantee [hellip]rdquo (ibid p 54) In fact even in 2011
the Youth Opportunities Initiative proposed by the European Commission (2011) allowed
the governments of Member States to make increased use of the ESF for promoting
youth employment (Tosun et al 2017) The degree to which additional funds under the
YEIESF actually presented additional funds for Member States may therefore vary
greatly and there is without doubt also some variation in Member States as to whether
this caused them to step up their efforts regarding youth employment
Third despite the frontloading of the YEI in 2017 take-up of the YEI developed slowly in
its early phases of implementation (European Parliament 2017b) According to Andor
and Veselyacute (2018) two aspects delayed the implementation of the YG in the start from a
financial perspective firstly it took Member States and the Commission time to design
and review the lsquoOperational Programmesrsquo (OPs) specifying how YEI and ESF money
would be used Most of the Operational Programmes were only approved in late 2014 or
even in 2015 Secondly several Member States had accumulated delays in absorbing EU
structural funds for 2007-13 Hence they focused their efforts on implementing these
schemes in order not to lose these allocations (due to the so-called de-commitment
11 For instance one of the aims of the EaSI programme is to enhance mobility via the ldquoYour first Eures jobrdquo As these programmes are rather small in scale and not directly linked to the YG the study does not provide a detailed overview (see European Parliamentary Research Service 2017)
The Youth Guarantee in light of changes in the world of work Youth Guarantee Intervention Models Sustainability and Relevance
14
rule) Only afterwards did they move on to use YEI funding An assessment commis-
sioned by the European Parliament concluded that most delays that limited the impact of
the increased pre-financing were due to procedural rather than financial problems (Euro-
pean Parliament 2017b)
212 The Youth Guarantee as part of national policy-making
A variety of aspects may be used to determine the degree to which the YG has become a
part of national policy making and hence whether the changes introduced by the YG are
likely to be sustained over time The following discussion focuses on three measurable
factors related to the sustainability of YG-related policy changes Firstly whether the
Council Recommendation has spurred on Member States to introduce youth-related la-
bour-market reforms rather than merely set up an additional offer of active labour mar-
ket measures Secondly whether Member States have introduced monitoring and evalu-
ation systems to assess the effectiveness of YG-related measures Thirdly to find the
degree to which Member States have attempted to build up (lasting) partnerships be-
tween all relevant stakeholders (such as public and private employment services gov-
ernment authorities education and training institutions and so on)
The introduction of youth-related labour-market reforms the first key factor reflects
whether Member States have attempted to embed the main guidelines of the Council
Recommendation in their national policies In particular whether Member States have
used the political momentum created by the YG to introduce structural reforms to mod-
ernise their overall labour market policies in support of young people Such reforms con-
cern the functioning of the labour market (its institutional and regulatory framework)
and are aimed at better matching supply with demand The implementation of structural
reforms can be considered a key determinant as to whether the YG can have a long-
term sustainable impact in Member States beyond the YEI and the ESF funding associ-
ated with the YG
Information on the nature and intensity of youth-related active labour market policy re-
forms provided in the LABREF database indicates that EU Member States are imple-
menting the Recommendationrsquos policy guidelines unevenly Figure 3 displays the number
of active labour market policy reforms between 2013 and 2016 across Member States
The figure indicates for instance that virtually all Member States implemented addition-
al ALMP reforms for youth and that several Member States ndash such as Bulgaria France
Latvia Lithuania and Greece ndash have a relatively broad scope of reforms
Figure 3 Absolute number of youth-related active labour market reforms be-
tween 2013 and 2016
Note This figure shows the absolute number of youth-related active labour market policy reforms in the EU
Member States between 2013 and 2016 Identification of youth-related reforms is done via the indicator ldquoIs
the measure targeted at young peoplerdquo in the LABREF database
0
2
4
6
8
10
NL SI CZ
DE
LU FI HR
DK IE UK
AT PL
BE EE MT
RO SK ES HU CY IT PT SE BG FR LV LT EL
The Youth Guarantee in light of changes in the world of work Youth Guarantee Intervention Models Sustainability and Relevance
15
The introduction of monitoring and evaluation systems the fifth principal element in the
Council Recommendation on the YG and the strict reporting guidelines were aimed at
fostering a culture of policy analysis Despite the additional administrative burden asso-
ciated with reporting activities requiring Member States to obtain administrative data on
in- and outflows from the YG as well as follow-up data the creation of a monitoring and
evaluation system is one of the effects that people in charge of implementing the YG at
the country level have recognised as being positive12 In fact many Member States did
not have specialised monitoring systems allowing to track youth on the labour market
and in education and evaluate activation measures for youth before the Council Rec-
ommendation
At the same time the capacity of countries to monitor what happens to young people
after leaving the YG and the corresponding data quality varies in fact a substantial
share of Member States do not know about young peoplersquos reasons for exiting either the
YG or the labour market nor do they register the educational status of previous partici-
pants after they exited This issue is most likely due to a pre-YG lack of policy evaluation
culture or a lack of capacity to collect data An additional aspect to consider in this re-
gard is whether Member States attempted to evaluate the effectiveness of specific
measures under the YG using rigorous impact evaluations The EU helps Member States
conduct impact evaluations on interventions funded by the European Commission name-
ly the ESF and the YEI for example by setting up the Centre for Research on Impact
Evaluation (CRIE) which provides scientific expertise and methodological support to
Member States conducting an impact evaluation (see European Commission (2016b) for
details) Escudero and Murelo (2017) provide an overview of various impact evaluations
of pilot programmes that were set up within the context of the European YG However
there does not so far seem to be a systematic account of ongoing or completed impact
evaluations of YG instruments
Partnership approach Most Member States make a reference to the partnership ap-
proach in their YG Implementation Plan (YGIP) Table 1 shows the clear differences
based on an assessment of ten selected Member States conducted by Eurofound
(2015) In addition to the differences within countries the findings based on this sample
of ten countries also indicate that cooperation with some stakeholders seems to be more
widespread than it is with others For instance cooperation between ministries particu-
larly the ones dealing with employment and education policies is rather well developed
In comparison cooperation is less frequent with non-institutional stakeholders such as
the third sector notably NGOs social partners and youth organisations In 2016 the
European Commissionrsquos three-year assessment came to the conclusion that ldquowhile many
Member States have taken steps to support the involvement of a wide range of actors
and established institutional frameworks for partnerships the functioning of these part-
nerships remains a challenge due to problems of design which affects their ability to
deliverrdquo (European Commission 2016b p24)
In addition previous studies (eg Dheacuteret and Roden 2016) highlight the strong path-
dependency in how countries or regions apply the partnership approach While some
countries have put new structures in place to monitor the progress of the YG implemen-
tation and coordinate the work of relevant stakeholders other countries tend to have
consolidated partnerships that existed before the YG was established
12 Information collected through the interviews organised in the context of the EPC Task Force on Youth Employment The results of these interviews are further presented and developed in Dheacuteret and Roden (2016)
The Youth Guarantee in light of changes in the world of work Youth Guarantee Intervention Models Sustainability and Relevance
16
There also seems to be some discrepancy between the involvement of stakeholders in
the design implementation and monitoring of the YG In some Member States stake-
holders in the third sector particularly youth organisations reported that they were only
consulted in the design phase and never again (European Youth Forum 2018)13 Recent-
ly more positive evidence is provided by ETUC (2018) showing that the great majority
of interviewed representatives of unions was at least `somewhat satisfiedrsquo with their
degree of participation in the YG
Table 1 Overview of actors involved in implementing the YG in 10 Member
States
Min
istr
y
of
Em
plo
ym
ent
(or
equiv
ale
nt)
Min
istr
y
responsib
le
for
socia
l benefits
Min
istr
yo
rganis
ation
re-
sponsib
le for
ESFY
EI
Min
istr
y o
f Education
Min
istr
y
responsib
le
for
youth
work
Oth
er
min
istr
y
(justice
defe
nce
inte
rior
health
housin
g)
PES
(either
at
national
regio
nal or
local le
vel)
Youth
org
anis
ation (r
epre
-
senta
tive)
Local
youth
org
anis
ation
(im
ple
menta
tion)
Socia
l part
ners
Education s
ecto
r
BE XX XX X XX X XXX X X XX
BG XXX XX XX XX XX XX XX XX XX XX
EE XX X XX XXX XXX X XX XX XX X X
EL XXX X X XX X X
ES XXX
XXX
(em-ploy-ment)
XX XX XX XX XX X XX X
FR XXX
XXX (em-ploy-
ment)
XX (em-ploy-
ment)
XX XX X XX X
IE XX XXX XX XX XX XX X X X
IT XXX XXX XX XX XX XX X X XXX X
PL XX X XXX X XX X
UK XX XX (LEP)
X X XX X X
Source Eurofound (2015a)
Note XXX means authoritycoordinator XX means principal partner-stakeholders and X means associated
partnerstakeholder A distinction needs to be made in Belgium between the federal and local authori-
tyregional level social benefits are (still) the responsibility of the federal government while education and
PES are the responsibility of the regionslocal authorities Similar to Belgium in Spain many responsibilities
are delegated to the regional level LEPs - Local Enterprise Partnerships
13 Some more evidence from the European Youth Forum on involvement for a sub-set of countries can be found under httptoolsyouthforumorgyouth-guarantee
The Youth Guarantee in light of changes in the world of work Youth Guarantee Intervention Models Sustainability and Relevance
17
213 Youth labour market challenges
The third key factor of YG implementation is its contribution to and targeting of the
young peoplersquos labour market challenges Given that the recession of the late 2000s (the
lsquoGreat Recessionrsquo) and its aftermath exacerbated the difficulties that young people face
in their STW transition and labour market career this section presents a brief discussion
of these challenges and how YG interventions have sought to address them
Challenge 1 ndash Youth unemployment long-term unemployment and inactivity The Great
Recession and its immediate effects on youth unemployment ndash highlighted in section 1 ndash
also resulted in an increase in youth long-term unemployment which although gradual-
ly falling from its peak of 8 in 2013 has remained high (European Parliament 2015
European Commission 2017a) Long-term unemployment can result in well-documented
lifelong consequences and lsquoscarringrsquo effects on those young people who remain unem-
ployed for some time (Eurofound 2015b Eurostat 2015) In addition a considerable
proportion of the EUrsquos youth remain economically inactive Whereas a large share of
them are in education or training many are discouraged and have become detached
from the labour market or they have not entered it after leaving education
The macroeconomic state of the economy also affects the level of demand for young
people where employer absorption capacity in providing training places (such as appren-
ticeships) and jobs for young people may be limited (Eurofound 2015a) In addition the
highly variable youth labour market performance across the EU before during and after
the Great Recession has been attributed to many factors These include differences in
the institutional and structural set-up of Member States regarding the education and
training systems (initial) education and vocational training (IVET) labour market insti-
tutions and labour market policy (such as employment protection legislation - EPL) and
active labour market policies (ALMPs) and social welfare systems (Eichhorst et al 2013
OrsquoReilly et al 2015 Pohl and Walther 2005 Pohl and Walther 2007)
The introduction of the YG ndash and its underlying philosophy of early intervention with a
personalised approach ndash across the EU sought to address the issue of rising youth un-
employment including long-term unemployment and inactivity (Eurofound 2015a Eu-
ropean Commission 2016a) The YG approach precisely addresses these challenges
providing unemployed inactive youth with a short-term activation and a perspective in
employment or education
In the five years since the launch of the YG youth unemployment rates have improved
considerably as highlighted in section 1 (see also for example the European Commis-
sion 2018g Eurostat 2018) Although this development is partially attributable to the
recovery from the Great Recession according to the European Commission this is also
partially due to the YG together with the effect of the Youth Employment Initiative (YEI)
(European Commission 2018g)
Challenge 2 ndash Labour market segmentation A key challenge facing youth is labour mar-
ket segmentation often resulting in young people being over-represented in temporary
or part-time forms employment in particular involuntary part-time casual a-typical or
precarious work (European Commission 2017a 2017g and 2018i Eurostat 2015 and
2018) Although such non-standard forms of employment have increased for all age
groups the more recent cohorts of younger workers have been particularly adversely
affected (European Commission 2017g) Specifically although in 1995 23 of younger
workers in the then EU 15 were on non-standard contracts by 2016 this proportion had
increased to 32 for the same age group (European Commission 2017g)
This trend is reflected across the EU 28 where over the last decade non-standard forms
of employment among younger workers rose from 26 to 29 with 35 million fewer
The Youth Guarantee in light of changes in the world of work Youth Guarantee Intervention Models Sustainability and Relevance
18
employees on permanent full-time contracts and 12 million more on non-standard con-
tracts (European Commission 2017g) Moreover younger workers in 2016 were still
more than twice as likely to be working full-time on temporary contracts (12) than
workers in their prime and older workers (5) (European Commission 2017g)
In general young people are more likely to find themselves as labour market lsquooutsidersrsquo
with little access to permanent contracts with high levels of employment protection and
workersrsquo rights especially compared to their older counterparts (European Parliament
2015 European Commission 2017a 2017g and 2018j) Since access to stable employ-
ment with positive career prospects matters young peoplersquos successful transition into
fully independent lives is one of the primary objectives of the YG (Council of the Europe-
an Union 2013 Eurofound 2014)
The degree of lsquodualismrsquo of labour markets varies across Member States recent analysis
suggests that four in ten European young people are on temporary contracts rising to
over 60 in many Southern and Eastern European countries (European Court of Audi-
tors 2017) While temporary employment can either be a lsquostepping stonersquo or a lsquotraprsquo in
terms of STW transitions recent data suggests that the former is rarely the case (Euro-
pean Commission 2015 2017a and 2017g) the average proportion of temporary work-
ers transitioning into permanent employment fell from 28 in 2007 to 23 in 2013
This however masks major country variations ranging from 10 in France to for ex-
ample 65 in Estonia (ibid)
Predictably when studying age groups the probability of moving from temporary to
permanent contracts over one year is lowest for young people aged 15-24 (European
Commission 2016g) However it is worth noting that transition rates from temporary to
permanent contracts among young people have recently either increased or remained
stable in most Member States where data are available (European Commission 2017g)
In most Member States these rates are still lower than 20 and in countries such as
Poland and Greece temporary employment lsquohas almost no stepping-stone functionrsquo (Eu-
ropean Commission 2017g) Countries such as France and Spain with highly segmented
labour markets and high shares of (young) workers on fixed-term contracts have been
also characterised by low transition rates towards permanent employment (European
Commission 2017h Eurofound 2013a and 2013b)
Country case study Ireland
Ireland was one of the EU countries most adversely affected by the Great Recession
which resulted in high levels of youth unemployment As a result addressing youth
unemployment especially long-term unemployment has been a key challenge (EEPO
2015) The youth unemployment rate more than tripled from about 10 in 2008-09 to
a peak of just over 33 in mid-2012 (DSP 2014a) Likewise the NEET rate for those
aged 15-24 was 18 in 2014 although the picture is more nuanced especially in re-
lation to inactive NEETs (DSP 2014a) Specifically excluding students and the young
unemployed inactive NEETs account for a relatively small proportion (about 3) of
the youth population (DSP 2014a EEPO 2015) Most tend to be lone parentscarers
(60) and people with a disability (20) (DSP 2014a EEPO 2015) Thanks to Ire-
landrsquos universal means-tested unemployment benefit system for those aged over 18
the vast majority of young NEETs are registered with the benefitsemployment service
(EMCO 2017)
Against this background the Youth Guarantee (YG) has two target groups (i) poorly
qualified young people aged under 18 who are in turn provided with a quality second-
chance educationaltraining pathway outside the school system (for example
Youthreach) or are supported in re-entering the school system and (ii) unemployed
The Youth Guarantee in light of changes in the world of work Youth Guarantee Intervention Models Sustainability and Relevance
19
young people aged 18-24 with a particular focus on long-term unemployed youth
(EEPO 2015 Stokes 2016) To this end the YG offer is quite comprehensive and
comprises a number of programmes ndash some pre-existing (for example the JobBridge
internship programme) and others such as the First Steps Youth Developmental In-
ternship Programme (for the most disadvantaged young people) and JobsPlus Youth
(an employer subsidy scheme) introduced as part of the YG (DSP 2014a Leigh-Doyle
2014 Treadwell Shine 2016)
The delivery of the Irish YG seems to be integrated within the overall policy approach
towards youth employment with most measures aimed at young jobseekers predating
its introduction (DSP 2016a) This embedding of the YG within the existing youth em-
ployment policy framework means there is a close alignment between the two Indeed
Irelandrsquos YG builds upon existing services and programmes but it crucially entails ear-
lier intervention for and a tailored approach to the young unemployed with a strong
focus on enhancing processespolicies to help the young unemployed enter sustainable
employment receive appropriate training andor gain relevant work experience (DSP
2014a Treadwell Shine 2016 DohertyDSP 2018) YG-related partnership arrange-
ments are also situated within the main policy making process which in turn means
that the implementation of the YG is policy based as opposed to project based
(ESFYEI) (EMCO 2017) As such the YG and associated measures are likely to be
sustained over time
Ireland has made notable progress in implementing the YG with a substantial reduc-
tion in the number of unemployed youth In general there has been intensified en-
gagement with young people while access to different programmes has been enhanced
and partnerships strengthened (European Commission 2018a) Evaluations of YG-
related programmes such as the Tuacutes and Job-Bridge work placementinternship pro-
grammes have shown positive outcomes (Leigh-Doyle 2014 Indecon 2016 Depart-
ment of Education and Skills 2016) The Irish YG seems to be quite successful in de-
livering sustainable outcomes which indicates that the offers provided are of good
quality (European Commission 2018a)
However a number of challenges remain For example the uptake of key measures
such as JobsPlus Youth and the First Steps Youth Development Internship has not
been as extensive as it could in view of the youth cohort concerned and there is also
a lack of sufficient training places (DSP 2016a European Commission 2017f) Em-
ployer engagement particularly in the provision of employment opportunities for the
most disadvantaged youth also remains a challenge as does the timeliness of YG of-
fers (European Commission 2017f and 2018a EMCO 2017)
In principle one response to the challenge of labour market segmentation would be
structural reforms such as for example the reforms Spain implemented in the aftermath
of the crisis Given that the YG was implemented at the height of the recession most
Member States focused on a ldquowork firstrdquo approach to give short-term relief to unem-
ployed young people specifically the implementation of subsidised employment pro-
grammes many specifically targeted at young people at risk has been quite common
across the EU and hiring incentives have featured prominently in many YG plans (Euro-
pean Commission 2018h) Many of these programmes involve incentives such as wage
subsidies aimed at encouraging employers to offer employment to young people
In general countries promoting employment offers under the YG use a form of employ-
ment subsidy which typically involves supplementing the individual labour costs of the
person employed over a fixed period whilst the majority of the labour costs remain cov-
ered by the employer (European Commission 2018h - See Annex Points 9 and 10)
The Youth Guarantee in light of changes in the world of work Youth Guarantee Intervention Models Sustainability and Relevance
20
These wage subsidies also play a crucial role in many countries (including Belgium
France Estonia Greece the Netherlands Poland Spain Sweden and Denmark) in facili-
tating the acquisition of work experience andor entry in their first job by young people
and this especially helps young people from disadvantaged backgrounds (Eurofound
2013b 2016 and 2017 European Commission 2018d and 2018h) In addition the
broader set of labour market reforms accompanying the YG (see previous subsections)
has contributed to addressing labour market dualism in many Member States
Challenge 3 ndash Poor performance of education and training systems (including skills mis-
matches and the limited availability of quality work experience) Another key structural
challenge is given by an unsatisfactory performance in the education and training sys-
tems including VET this means that young people do not have appropriate education
when they graduate and when they enter the labour market which in turn exacerbates
skills mismatches and adversely affects their employability (for example Quintini et al
2007 Quintini and Martin 2014) Indeed the mismatch between (youth) labour supply
and demand seems to be a growing challenge for instance there is growing concern
about graduate under-utilisation and the fact that that higher education graduates expe-
rience considerable and persistent occupational vertical skills mismatch (234 in 2016)
by working in jobs typically requiring a lower level qualification (European Commission
2017c) However it is also worth pointing out that higher education graduates have bet-
ter employment rates (828) than young people with upper secondary education quali-
fications (726) (European Commission 2017c)
Another major challenge in light of rapid and constant technological change relates to
the need for effective skills anticipation against the largely unknown future evolution of
work and work organisation This is in turn is closely related to the need to ensure that
the education and training systems across the EU respond accordingly by being lsquoagilersquo
and by equipping young people with relevant skills including lsquodynamicrsquo skills such as
adaptability resilience and career management skills This concern was also reflected in
the latest European Commissionrsquos report on Employment and Social Developments in
Europe according to which ldquomuch will depend on whether or not education and training
systems are agile enough to respond appropriately to fast-changing technological oppor-
tunitiesrdquo (European Commission 2018g)
In recent years there has been a concerted effort to reform or strengthen education and
training systems including vocational education and trainingapprenticeships and their
role in STW transitions Indeed extensive VET reforms are currently being implemented
in many EU countries (for example Croatia Cyprus Estonia Greece Finland France
Ireland Italy Poland Spain Sweden and the United Kingdom) ndash instigated to some ex-
tent by the YG These reforms seek to improve the labour market relevance quality and
attractiveness of VET together with an effort to develop a VET system often along the
lines of the German dual training system which combines time spent at school with time
spent in the workplace In addition many reforms of VET systems often associated with
the YG have sought to create closer links with the labour market (European Commis-
sion 2018c)
In addition a range of other educational measures offered under the YG has aimed to
bring young people with low levels of skills and qualifications back to education and
training These measures are summarised by the term lsquocontinued education offersrsquo (Eu-
ropean Commission 2018l) These continued education offers are set up to provide
young people with the chance to re-enter the regular education and training system to
move on to a higher-level qualification Alternatively ALMPs bridging courses or second
chance education programmes can also equip early school-leavers and low-skilled youth
The Youth Guarantee in light of changes in the world of work Youth Guarantee Intervention Models Sustainability and Relevance
21
with the skills and qualifications needed for an initial (and targeted sustainable) labour
market integration
214 The heterogeneity of the NEET population
The fourth key aspect of YG implementation assessed in this report concerns the way in
which the YG has addressed the heterogeneity of the NEET population Due to its diversi-
ty the NEET population in the EU can be divided into sub-groups According to Euro-
found (2016) the NEET can be categorised firstly by their activity status ndash those who
are available to the labour market or educational opportunities are counted as active
while the rest is classified as inactive The former group consists of short- and long-term
unemployed individuals and those soon to return to education or employment the latter
group includes people with illness or disability individuals with family responsibilities and
lsquodiscouragedrsquo workers Throughout this report the phrase lsquodiscouraged workersrsquo refers to
people who simply stopped searching for employment or education opportunities
Data from the EU Labour Force Survey from 2013 (also used in Eurofound 2016) pro-
vides an indication about the labour-market attachment of NEETs in Europe before the
YG was implemented Among the active NEETs the largest proportion of 15-24-year-old
NEETs were short-term unemployed (298) Long-term unemployed youth made up
about 22 of the NEET population while returnees into work or education accounted for
roughly 8 of NEETs Among those considered inactive the largest share corresponds to
individuals with family care responsibilities (154) Individuals with illness or disability
made up 8 of the NEET population Discouraged workers accounted for almost 6 of
NEETs and 125 were NEETs for other reasons Consequently around 60 of the
NEET population were neither in education employment nor training for labour market
related reasons (the unemployed the discouraged workers and the returnees) and
around 40 were NEETs for other reasons
Furthermore NEETs can be categorised by their educational attainment as subgroups
with lower education are at a much higher risk of being in a vulnerable position This can
be seen by the fact that less educated youth are overrepresented among the NEETs As
of 2014 44 of NEETs aged 15-24 had completed an lsquoupper secondaryrsquo education
closely followed by 43 with a lsquolower secondaryrsquo education and only 8 of NEETs had
tertiary education or a degree (Eurofound 2016)
These sub-groups have diverse needs and are therefore likely to benefit from different
types of policy responses regarding interventions and they may require additional out-
reach efforts Most importantly those furthest away from the labour market are most
likely to be in substantial need of outreach activities One important factor here is their
point of access to the YG While other entry points exist access is often governed by
PES In all EU countries except Malta the PES plays a role in registering people for the
YG Among other determinants the extent to which the PES are able to actually reach
the NEET population also depends on their responsibilities for administering and paying
(unemployment) benefits According to European Commission (2017b) only three PES
are responsible for administering other types of benefits aside from (mostly insurance-
based) unemployment benefits (Lithuania Luxemburg and Slovakia) These types of
benefits tend to exclude youth due to their limited length of work experience reducing
the scope for outreach without further intervention Indeed the registration of NEETs
with the PES was somewhat limited at the onset of the YG (Eurofound 2016) However
many PES have launched substantial outreach activities to make up for this EC (2017a)
shows that roughly 46 of PES make use of new media for their outreach work 39
provide mobile services and about 43 have specific outreach caseworkers Moreover
The Youth Guarantee in light of changes in the world of work Youth Guarantee Intervention Models Sustainability and Relevance
22
46 of PES have created a one-stop-shop type of framework to enhance their degree of
outreach (eg this includes Belgium Finland and the United Kingdom ibid)
Country case study Italy
Italy is a country with a relatively rigid labour market despite the recent reforms aimed
at increasing the degree of labour market flexibility Moreover the Italian education
system endows youth with a relatively high level of general education but with few
work-related skills which dramatically slows down their transition to a job (Pastore
2018) Along with their relatively large number of early school-leavers this helps ex-
plain their 347 youth unemployment rate in 2017
The lack of previous experience with the YG framework and the dramatically low rate of
job-finding ndash ranging from 11 to 18 in the 2010s ndash represented another obstacle to
successfully implementing the YG According to Pastore (2015) macro- and micro-
economic obstacles should have been overcome to make the programme work at its
best Economic growth has been sluggish at least from the early 1990s which would
normally have reduced the pace of job creation and forced young people into more edu-
cation and training rather than employment Moreover public and private employment
services could count only on human resources which were scant in both quantitative and
qualitative terms as they had a low share of university graduates (ANPAL 2018)
The number of ANPAL staff has been reduced in recent years and as financial resources
for paying for an increase in the number of staff are scarce improvement has been
sought by implementing important reforms such as the `legislative decree 1502015rsquo of
the so-called Jobs Act package (ANPAL 2018) This reform introduced lsquoquasi-marketsrsquo
in the management of employment services the NEETs are profiled by PES and then
assigned a voucher for a different amount according to their lsquoneed bandrsquo NEETs can
spend vouchers in the PES andor with private (for profit or non-profit) employment
agencies to buy the services they need However so far the reform has not been fully
implemented partly due to the lack of financial resources (ibid)
Further problems with the implementation of the YG has been due to the reallocation of
competences in the PES from provinces to regions and the establishment of a national
agency (ANPAL) to coordinate the work of regional entities which detracted from the
full implementation of the YG (ANPAL 2018)
The Italian YG scheme has also managed to improve its monitoring system of the indi-
viduals involved the activities done and their level of absorption into the labour market
when the programme is completed The last monitoring report available shows that of
about 15 million registered NEETs 13 million had the prescribed requirements About
one million were actually profiled of which about a half were given some completed
form of assistance About 60 underwent on-the-job training 23 benefited from sub-
sidised employment 123 received off-the-job training 23 received some form of
placement services 16 did voluntary service in the third sector and a small number
received support for self-employment About six months before completion of the pro-
gramme 479 of recipients were in work and 692 had experienced at least one
employment spell (ANPAL 2017)
A few recent evaluation studies provide a full assessment of regional programmes and
show that on-the-job training is effective in confirming the importance of providing
young people with work-related competences (for example see Ghirelli et al 2019)
Despite these efforts monitoring data on the Youth Guarantee for 2016 shows that in
the EU as a whole an estimated 385 of the NEET population were registered in YG
schemes in the year 2016 Although some Member States are doing much better (cover-
The Youth Guarantee in light of changes in the world of work Youth Guarantee Intervention Models Sustainability and Relevance
23
age rates are higher than 50 in 12 Member States - in Belgium Finland and Austria
the corresponding rate is even above 70) Moreover the YG currently does not suffi-
ciently cover inactive NEETs (European Youth Forum 2018) as this problem is less se-
vere in countries with minimum income support systems where less strict entry require-
ments are usually applied This is the case in Ireland for example (see European Court
of Auditors 2017) This under-coverage of inactive NEETs is reflected in Figure 4 which
shows that the decline in NEET rates since the introduction of the YG is mostly due to
reductions in long-term and short-term unemployment
Figure 4 Composition of the EU NEET population (percentage of the population
of young people)
Source Eurofound (2017)
Thus it seems that the YG so far has benefitted youth closer to the labour market which
may be partly reflect the high prevalence of employment offers within the YG framework
(in 2016 around 67 of all the offers taken up within the four-month time limit set by
the YG were employment offers) Low-skilled individuals lsquodiscouragedrsquo workers and indi-
viduals without work experience are likely to benefit more from offers that combine gain-
ing job experience and building (job-specific) skills However as of 2016 these types of
offer only make up a minority of all the offers taken up within the four-month time limit
Furthermore the 2013 Council Recommendation on the YG insufficiently addressed the
needs of those among the youth that are NEETs for reasons other than labour market
related factors as these individuals had other constraints keeping them from the labour
market Among this group are mainly individuals with family care responsibilities and
youth with illnesses or disabilities For individuals with family responsibilities the Euro-
pean Quality of Life Survey shows that 11 of young fathers and 35 of young mothers
are inactive This is despite the fact that the majority of them would like to work under
flexible work and with adequate care arrangements (European Youth Forum 2017)
Nonetheless some Member States introduced additional reforms beyond the YG recom-
mendations to decrease high school dropout or aimed at improving social and welfare
policies
The Youth Guarantee in light of changes in the world of work Youth Guarantee Intervention Models Sustainability and Relevance
24
215 Design and implementation features of the Youth Guarantee
The fifth key aspect of the YG concerns design and implementation-related factors af-
fecting its capacity to address the main objectives ndash does it provide a broad set of young
people with a quality offer within a short period of time Specifically the Council of the
European Union (EU) recommended providing a quality offer to all young people under
25 within a four-month period of their becoming unemployed or having left the education
system
Substantial variation between Member States can be observed in the way the national
YG was designed and implemented previous experience implementing a YG-type of
framework is also important For example Denmark and Sweden are among countries
that had a relatively long history of this sort of framework even before the introduction
of the YG Furthermore at the very fundamental level of design some Member States
opted for different target time-frames as well as different age cut offs for YG eligibility
Some countries chose a shorter time-frame than the four months envisaged by the
Council of the European Union others opted for a longer duration (European Commis-
sion 2016a) Regarding the age range a substantial number of Member States chose
youth aged under 30 as a target rather than the suggested age of 25 as the cut off This
included for example Bulgaria Denmark Italy and Poland Depending on the size of
these cohorts this may represent a considerably more ambitious approach which - if it
is not supported by sufficient financial and human resources - is more likely to fall short
of expectations Furthermore some countries put specific emphasis on targeting the
long-term unemployed youth (Escudero and Mourelo 2017) Among others this includes
Hungary Poland and the United Kingdom
In order to support the target of reaching every NEET in a timely manner some PES
have also introduced YG-specific staff hired additional caseworkers or at least main-
tained their staff level since the introduction of the YG (European Commission 2017a)
On the issue of the quality of offers 17 PES formally defined their criteria for a quality
offer or distributed national quality management guidelines regarding offers being made
within the YG framework (5 countries)14 Many Member States have chosen an outcome-
based approach for their definition of offer quality meaning they define an offer as being
of high quality when individuals have favourable education or employment outcomes
after leaving one of the YG programmes (European Commission 2016a) In addition
some PES also introduced youth-specific targets (European Commission 2017a)
There is also cross-country variation in terms of the main YG providers Almost all coun-
tries rely to some extent on their national PES for providing YG services while some do
so exclusively This is the case for example in Austria the Czech Republic and Greece
Most Member States however chose some combination of the PES and other institutions
as their main providers (European Commission 2016a) Aside from the institutions
through which YG services can be obtained online access to the programmes may be an
important driver of success In 18 EU countries potential participants can register online
for the YG at least in some regions of the country This is not the case in for example
Bulgaria France or Luxembourg
14 See European Commission 2017a
The Youth Guarantee in light of changes in the world of work Youth Guarantee Intervention Models Sustainability and Relevance
25
Country case study Latvia
Young people in Latvia were very adversely affected by the lsquoGreat Recessionrsquo of
20082009 In the years before the recession youth unemployment had been relatively
low standing at 105 in mid-2008 but then it more than tripled to more than 35
within a two year period In a parallel development the NEET rate for 15-24 year old
Latvians rose from 108 in 2008 to 178 in 2010 Both youth unemployment and the
NEET rate effectively peaked in 2010 in Latvia and since then they have steadily de-
clined reaching pre-crisis levels by 2015 One specific challenge of the Latvian labour
market is the variation in employment outcomes by educational level as the high-
skilled face very low unemployment rates (clearly below the EU average) whereas un-
employment among the low-skilled is much higher than EU average
Following the Council Recommendation the Latvian YG Implementation Plan was pre-
sented in December 2013 (updated in April 2014) and implementation started in 2014
targeting young people aged 15-29 not in employment education or training (European
Commission 2018c) The Ministry of Welfare is in charge of establishing and managing
the YG while the Latvian PES (the lsquoState Employment Agencyrsquo) and the State Education
Development Agency (SEDA) are responsible for its implementation Other main imple-
menting actors include the Ministry of Science and Education the local authorities (the
municipalities) and youth organisations The Latvian Youth Guarantee is fully funded by
the Youth Employment Initiative (ibid)
The immediate strengths of YG implementation in Latvia are the rapid formal adoption
of the YG the adaptability of existing institutions and structures (which also enabled the
creation of new institutions such as a YG Advisory Board) and the emergence of part-
nership as a key component for implementing the YG This active inclusion of a broad
set of partnerships remains a particular strength of the Latvian YG implementation (EM-
CO 2017)
The Latvian YG scheme exclusively provides employment and education offers so that
apprenticeships and traineeships are not provided The employment offers are mostly
subsidised employment in the regular labour market such as first work experience for
labour market entrants and subsidised jobs for the disadvantaged Young people receive
fixed term contracts that range in duration from six months to two years and there is
also financial support for up to two years for young people wanting to become self-
employed or to start a business
The education system includes several vocational elements typically between 480 and
960 hours and up to 15 years in one specific programme Additionally the Latvian YG
provides ldquoyouth workshopsrdquo as part of the preparatory phase which provide training in
three different areas (up to three weeks each) to help young people with their career
choices
In 2016 just over a quarter (271 of the total entrants) of those entering the YG
scheme were re-entrants of which nearly half (127) had previously taken up an of-
fer These re-entry rates are below the EU average but the rates may be understated
as data for participants applying via the SEDA data on previous experience are not
available (European Commission 2018a)
The Youth Guarantee in light of changes in the world of work Youth Guarantee Intervention Models Sustainability and Relevance
26
216 The role of the apprenticeship system in the Youth Guarantee
The sixth main aspect of YG implementation addressed in this study specifically concerns
the role of apprenticeships indeed one of the greatest problems for young peoplersquos
transition into the labour market is their lack of work-related competences especially in
the countries with sequential STW transition systems that focus on general education
rather than building lsquoall-round human capitalrsquo as in lsquodualrsquo STW transition systems where
school and work are linked at the same time (Austria Denmark and Germany) An ap-
prenticeship is therefore one of the key elements of the dual system as it traditionally
involves off-the-job in-class education together with on-the-job training of different
lengths
According to comparative evidence provided by the European Commission (2013) based
on the European Labour Force Survey in most EU Member States the share of appren-
ticeships in any cohort of young people (15-29 years old) is between 15 and 5 with
the only exception being Germany Austria and Denmark where young people who un-
dertake an apprenticeship amount to above 5 All other EU countries are below 15
The EU average share was 37
This general tendency is also partly reflected in the usage of apprenticeships in the con-
text of the YG as they correspond to important cultural and institutional factors within
Member States15 The monitoring data shows that in 2016 some of the countries with the
highest share of apprenticeship offers within the YG programme have a dual STW sys-
tem Portugal is one major exception from this rule this may be related to its general
shortage of employment opportunities and therefore the tendency of apprenticeships to
occupy a higher than average share among participants of the YG Overall however
only 34 of timely exits from the YG were the result of apprenticeship offers a share
not far away from the share in the overall population of young people mentioned above
For a large number of countries the share was close to zero It should be noted howev-
er that due to data limitations some countries may record entries into apprenticeship
offers as entries into employment (European Commission 2016b)
Apart from data-related issues one reason why apprenticeship offers remain rather ex-
ceptional within the YG is that they require employersrsquo commitment to providing training
places and to designing curricula in cooperation with schools This can be a big constraint
in the development of apprenticeships especially in sequential SWT systems In 2013
the European Alliance for Apprenticeship (EAFA) was therefore launched to boost ap-
prenticeships in the EU The EAFA gave guidelines for the implementation of apprentice-
ships in all Member States and encouraged sharing experiences and good practices and
provided strategic expert support from the European Centre for the Development of Vo-
cational Training (CEDEFOP) and through the European Training Foundation Within the
context of the EAFA all member countries signed a declaration of commitments on ac-
tions to spread the use of apprenticeships as the main port of entry to the labour market
15 Note that the Commissionrsquos definition of apprenticeships (European Commission 2013) may differ from Member Statesrsquo definitions A recent Council Recommendation (Council of the European Union 2018) intends to harmonise the definition by saying that apprenticeships are understood as formal vocational education and training schemes that a) combine learning in education or training institutions with substantial work-based learning in companies and other workplaces b) lead to
nationally recognised qualifications c) are based on an agreement defining the rights and obliga-tions of the apprentice the employer and where appropriate the vocational education and train-ing institution and d) with the apprentice being paid or otherwise compensated for the work-based component Despite this recommendation varying national definitions still exist across Member States
The Youth Guarantee in light of changes in the world of work Youth Guarantee Intervention Models Sustainability and Relevance
27
for young people16 Moreover in their declarations each country committed itself to im-
plement the dual principle in their STW transition
Country case study Denmark
Denmark is among those EU countries that even before the introduction of the YG in
2013 (European Commission 2016a) already had a particularly well-functioning labour
market and educational system to help NEETs In fact Denmark already had some ex-
perience of a YG-like framework for a relatively long period before it was proposed by
the Council of the European Union The situation for Denmarkrsquos youth was therefore
more favourable than the EU average in 2012 The share of young people between 15
and 25 that were NEETs was only 66 - significantly below the proportion of NEETs in
many other EU countries Furthermore the majority of those individuals that were clas-
sified as NEETs were relatively close to the labour market and were therefore easier to
reach For example only 53 of Danish NEETs belonged to the group of long-term
unemployed or discouraged workers (Eurofound 2016)
Due to these circumstances the case for additional reforms within the YG was limited
Therefore along with reform efforts regarding active labour market policies concerning
youth and the educational system17 the implementation of the YG mostly required the
updating of existing policies This is exemplified by a strong increase in ALMP spending
from roughly 13 of GDP in 2012 to about 14 in 2015 despite declining rates of
youth unemployment and therefore a decrease in ALMP expenditure in other countries
over the same time period Denmark chose a particularly ambitious implementation by
focusing on youth under the age of 30 with a target window of less than four months so
as to offer their NEET population a quality measure In contrast to many other Member
States Denmark focuses on increasing the employability of NEETs via (continued) edu-
cation measures resulting in a share of apprenticeship take ups of over 50 relative to
the total number of timely exits from the YG This approach also matches the relatively
large proportion of low and medium educated youth among the NEETs
Two of the main pillars in the original 2014 Danish implementation plan were the ldquore-
tention task forcerdquo and the ldquoBridge Building to Educationrdquo programmes Both types of
initiatives were well-founded in regional and inter-organisational partnerships (for ex-
ample people involved include job centres municipalities educational facilities youth
organisations and others) While the aim of the first programme was to decrease high
school drop-out rates the latter took place at a vocational school in close cooperation
with the jobcentres and it focuses on helping youth to find their right path to success
through making the transition to vocational education This was done by assigning men-
tors to the NEET and giving them access to basic literacy and numeracy courses if they
needed them as well as further professional courses and traineeships The evaluation of
the ldquoBridge Building to Educationrdquo initiative yielded positive effects for youngsters par-
ticipating in the intervention compared to the control group (with a similar profile) which
did not participate in the intervention As a result two additional initiatives were set up
Firstly funds were made available to support the further implementation of ldquoBridge
Building to Educationrdquo initiatives Secondly ldquoJob-Bridge to Educationrdquo a randomised
controlled trial building on the core elements of ldquoBridge Building to Educationrdquo and tar-
geting the most vulnerable youth under 30 years without an education was also set up
16 Declarations of national commitment are downloadable from the EAFA website httpeceuropaeuapprenticeships-alliance
17 For more information see httpsuvmdkreform-af-de-forberedende-tilbudforberedende-grunduddannelseopbygning-og-maalgruppe
The Youth Guarantee in light of changes in the world of work Youth Guarantee Intervention Models Sustainability and Relevance
28
The project is set to end in mid-2020 where it will be followed by an evaluation of the
results
The Danish YG has also managed to set up a high-quality monitoring system with only
relatively few cases of missing information on YG participantsrsquo exit destinations (Euro-
pean Commission 2018a) Together with the relatively large share of NEETs who are
registered with the PES and the development of ldquoyouth guidance centresrdquo to reach out
to those who are not the Danish YG model is able to cover a substantial portion of
NEETs For instance in 2016 the YG coverage rate reached almost 60 of the NEET
population compared to the EU YG scheme average of 425 Thus despite more fa-
vourable initial conditions in Denmark the YG helped put a focus on the most vulnera-
ble youth and spur on a further integration of policies into national policymaking for
example through additional reforms aimed at improving active labour market policies
for young people Youth unemployment rates are currently trending downwards even
further in Denmark However there remain some issues especially with regard to the
integration of migrants given that youth unemployment is a much more pervasive issue
among them compared to native Danes (European Commission 2018a)
22 Empirical indicators of Youth Guarantee features
Section 21 has presented the key aspects that reflect how Members States implemented
the Youth Guarantee following the Recommendation In order to prepare the systematic
analysis of the YG in section 3 which develops a YG typology it is necessary to build
empirical indicators for each of these key aspects That is to say that this section dis-
cusses how information on each of these aspects can be measured and expressed in da-
ta18 These empirical indicators are therefore grouped into the corresponding six sets
1 Financial resources for implementing the Youth Guarantee
2 The Youth Guarantee as part of national policy-making
3 Youth labour market challenges
4 The heterogeneity of the NEET population
5 Design and implementation features of the Youth Guarantee
6 The role of the apprenticeship system in the Youth Guarantee
221 Indicator set 1 Financial resources for implementing the Youth
Guarantee
The set of indicators below represents the level and composition of financial resources
that Member States employed to support the Youth Guarantees implementation
i The size of ESFYEI transfers to match the respective NEET challenge is measured
by the ratio of initial YEI allocations as well as the YEI+ESF matching funds EU el-
igible cost both relative to Member Statesrsquo GDP in 2012 In addition a categori-
18 For each group of contextual and implementation features of the Youth Guarantee discussed in Section 21 an overview of potential quantitative or qualitative indicators was established which could represent these constructs Through a desk research of the available literature and online databases the availability of the respective indicators at the Member State level was assessed for a sufficiently large set of countries Unfortunately for a subset of potential indicators it was not possible to retrieve sufficient andor adequate information for a large enough sample of Member
States In some cases where several potential indicators were available to represent the same dimension or construct the available indicators that best represent the specific feature were iden-tified while also taking data quality into account In some cases single combined indicators were constructed to reduce the lsquodimensionalityrsquo of the database underlying the cluster analysis in sec-tion 3 See appendix A for more details on the exact indicators used and their source
The Youth Guarantee in light of changes in the world of work Youth Guarantee Intervention Models Sustainability and Relevance
29
cal variable for the estimated yearly costs relative to GDP for offering interven-
tions to all NEETs is included derived from Eurofound (2015a) The comparison of
both allows judgement of the importance of EU transfers in financing the YG
ii The degree to which Member States allocated additional funding from the ESF to
fund measures related to youth employment is measured in data about ldquoOther
ESF EU eligible costsrdquo (European Commission 2018k)
iii To proxy whether Member States dedicated additional funding from national
budgets to finance YG-related measures the evolution of overall active labour
market spending from 2012 to 2015 is used (Eurostat lmp_expsumm)19
iv Finally the degree to which Member States were able to absorb the additional
funding from the YEI in a timely manner is measured by the share of EU eligible
costs among YEI+ESF funds that were actually declared YEI+ESF funds based on
data from European Commission (2018k)
222 Indicator set 2 The Youth Guarantee as part of national policy-
making
The second set of indicators reflects the degree to which Member States made efforts to
introduce elements of the YG into national policy making and started partnerships
Regarding reform efforts the following indicators are included
i The degree to which the YG spurred wider longer-term reforms in Member States
is quantified by the total number of youth-related active labour market policy re-
forms between 2013-2016 based on LABREF information (the European Commis-
sionrsquos labour database)20
ii In addition the degree to which Member States were committed to the policy
change is approximated by the number of areas in which additional measures
were taken in the context of YG beyond the scope of the Recommendation (based
on European Commission 2016c)21
iii Finally the degree to which Member States were able to set up an effective YG
monitoring and follow-up system is taken into account as an indication of whether
they were committed to delivering the YG This means including 2016 data for the
proportion of YG exits with unknown destinations and the proportion of unknown
situations in the six-month follow-up data (European Commission 2018a)
The degree of partnerships built in each Member State is measured using the following
indicators
iv The degree to which partnerships were an element of the initial YG design is in-
cluded using the Member Statesrsquo self-reported involvement of social partners and
19 At the time of writing this report more recent data was only available for relatively small subset of EU countries
20 The authors refrain from using 2017 data on labour market reforms from the LABREF database as the objective is to measure the degree to which the YG was a driver of reforms in Member States That is this link becomes weaker over time such that the added value of more recent data
for the analysis is questionable
21 Due to their high correlation with LABREFrsquos own variations indicators of receipt and implemen-tation of country-specific recommendation between 2013-2017 and the qualitative classification by the Commission for the extent to which YG has acted as a driver of reform (European Commission 2016a) are not included in the set of indicators used
The Youth Guarantee in light of changes in the world of work Youth Guarantee Intervention Models Sustainability and Relevance
30
youth organisations in the design implementation and monitoring of the YG
(based on European Commission 2016c)22
v Furthermore the involvement of partners is approximated using the number of
areas where the PES is declared to have formed partnerships (based on European
Commission 2017a)23 In addition indicators are included for national PES re-
ported as having involved youth organisations and young people in the design of
YG services (based on European Commission 2017a)
223 Indicator set 3 Youth labour market challenges
To reflect how the challenges faced by young people in their transition from STW differ
across Member States the following empirical indicators are considered
i A set of indicators that reflect the significance of the youth unemployment chal-
lenge at the time when the YG was designed and rolled out These include the ra-
tio of unemployment rates for youth (age 15-24) and adults (age 25-74) the
share of people aged 15-24 of the total population (age 15-74) and the NEET
rate among youth aged 15-29 to obtain a measure of the size of the NEET chal-
lenge also for Member States that target individuals up to 29 years of age (Euro-
stat lfsa_pgaed une_rt_a edat_lfse_14 all indicators were measured in 2012)
ii To measure the initial degree of labour market segmentation and the quality of
entry-level jobs available to youth in each Member State the absolute difference
in the share of youth (15-24) to adults (25-54) in terms of the number on tempo-
rary employment contracts in 2012 (Eurostat lfsi_pt_a)
iii To address Member Statesrsquo response to these conditions several indicators are
included on the degree to which employment offers were favoured possibly re-
flecting a ldquowork-firstrdquo approach specifically the number of offers of employment
relative to the total number of all types of offers that are typically made to young
people registered in YG schemes (based on European Commission 2018b) In ad-
dition this includes a measure for the employment intensity of timely exits in
2016 (the share of all timely exits that were employment offers based on Euro-
pean Commission 2018b)
iv Lastly two indicators approximate the performance of education and training sys-
tems from which youth enter into the labour market and the potential severity of
the skills mismatch first the share of early school-leavers from education and
training among the youth population (age 18-24) in 2012 (Eurostat
edat_lfse_14) and second the share of NEETs with low and medium educational
attainment in 2012 To approximate the YG implementation with respect to skills
mismatches the number of offers of education relative to the total number of all
types of offers that are typically made to young people registered in YG schemes
is used (based on European Commission 2018b) In addition a measure is in-
cluded for the education intensity of timely exits in 2016 ie the share of all
timely exits that were education offers (based on European Commission 2018b)
22 An alternative source for partnership information is provided by ETUC (2018) Their data is ndash in
contrast to the data employed ndash not self-reported by the Member States However the ETUC (2018) report contains substantial missing information and hence was not used
23 Namely PES partnerships aimed at (i) ensuring that young people have full information and support available (ii) increasing employment apprenticeship and traineeship opportunities and (iii) supporting transitions from unemployment inactivity or education into work
The Youth Guarantee in light of changes in the world of work Youth Guarantee Intervention Models Sustainability and Relevance
31
224 Indicator set 4 The heterogeneity of the NEET population
The next set of indicators aims to reflect the diversity of the NEET population While
some indicators have already been introduced in the indicators above (for example NEET
rates by educational attainment) this additionally integrates the following
i The composition of NEETs as measured by the share of NEETs that are short-term
or long-term unemployed individuals about to re-enter education or employment
discouraged NEETs youth with illnesses or disabilities and the share of NEETs
with family responsibilities This gives an indication of the NEETsrsquo activity status
the potential reasons for their NEET status and their degree of closeness to the
labour market (Eurofound 2016 all indicators measured in 2013)24
ii Indicators describing the links between the PES for the YG This includes the
number of responsibilities of the PES in the YG as well as their main outreach
tools based on European Commission (2017a) Furthermore it includes indicators
on whether the PES is the main body responsible for the administration and pay-
ment of unemployment andor other types of benefits (based on European Com-
mission 2017a)
iii An indicator from European Commission (2017a) that reflects whether the re-
spective PES is reported to have taken any additional measures with respect to
preventing school drop-out
225 Indicator set 5 Design and implementation features of the Youth Guarantee
This set covers further design and implementation indicators that are likely to affect the
performance of the YG as implemented by the Member States
i Indicators on the envisaged length of the preparatory phase the eligible age
group the main YG provider whether online registration is possible for potential
YG participants as well as whether Member States created a legal entitlement to
receive an offer (all based on European Commission 2016c) In addition there is
an indicator measuring whether Member States specifically target the long-term
unemployed (Escudero and Mourelo 2017)
ii A categorical indicator providing information on whether a YG-related scheme was
already in place (in the long-term or recently) before the Recommendation
(based on European Commission 2016c)
iii Information on whether the Member States established a formal definition of a
good quality offer within the YG scheme (European Commission 2016a) and
whether quality management guidelines exist from the national administration to
organisations involved in YG (based on European Commission 2017a)
iv Indicators to reflect the relevance and potential upscaling of national PES capacity
since the YG Recommendation (all reflecting 2017 responses of PES based on
European Commission 2017a) These include whether the PES has dedicated YG
staff whether the PES provides training for YG staff whether the PES staff in-
creased or remained the same from 2014-2017 and whether the PES has specific
targets for youth (ibid)
24 Optionally the use of a more general measure of the NEET Cluster Type was tested which is a composite indicator on different levels reflecting the STW transition system and the composition of NEET in 2012 (Eurofound 2016) However as the clustering is based on the share and STW transition type data already employed the indicator is not used in the analysis
The Youth Guarantee in light of changes in the world of work Youth Guarantee Intervention Models Sustainability and Relevance
32
226 Indicator set 6 The role of the apprenticeship system in the Youth Guarantee
The final set of indicators represents the relevance and the set-up of apprenticeships in
the national education and training system as well as their role in the YGs implementa-
tion
i To provide information on the STW transition types of Member States indicators
are included based on the classification by Pohl and Walther (2005 2007) Fur-
thermore an indicator on the share of firms employing initial vocational training
participants in 2010 is used (Ireland 2015) (Eurostat trng_cvt_34s)
ii To reflect the relevance of apprenticeships in the YG implementation indicators
on the number of offers of apprenticeships relative to the total number of all
types of offers that are typically made to young people registered in YG schemes
(based on European Commission 2018b) In addition a measure for the appren-
ticeship-intensity of timely exits in 2016 ie the share of all timely exits that
were apprenticeship offers (based on European Commission 2018b)
iii The normalised number of pledges from firms and institutions to the European Al-
liance for Apprenticeships between the outset of the YG in 2013 and 2018 (based
on the national commitments database25)
23 Conclusion
This chapter has provided a comprehensive overview of the main aspects of the YG im-
plementation in context Specifically subsection 21 discussed a) the main financial re-
sources for implementing the YG b) the YGrsquos integration within national policy-making
c) the YG and youthrsquos labour market challenges d) the diversity of the NEET population
e) design and implementation features of the YG and f) the role of the apprenticeship
system in the YG Section 22 proceeded to identify and map six sets of empirical indica-
tors to each of these six implementation aspects In total 76 empirical indicators were
identified which will form the basis of the systematic analysis of a YG typology in the
next section Figure 5 gives a graphic overview of the number of indicators included in
each of the six indicator sets representing the key implementation aspects
25 The national commitments database available at httpeceuropaeusocialmainjspcatId=1148amplangId=en as of September 17 2018 This data-base also provides information on the number of pledges made by firms and institutions For the analysis the number of pledges is normalised by the share of firms employing IVET participants in each Member State to account for the relevance of the VET system
The Youth Guarantee in light of changes in the world of work Youth Guarantee Intervention Models Sustainability and Relevance
33
Figure 5 Number of indicators identified by variable set
Source Own analysis
Figure 5 illustrates that for example indicator set (5) ndash which represents the design and
implementation features of the YG ndash is the largest set comprising 20 indicators Whereas
the indicator sets (1) on financial resources for implementing the YG and (6) on the role
of the apprenticeship system (6) are somewhat smaller they still contain seven and nine
indicators respectively
3 Typology of Youth Guarantee models
This section is the empirical part of the analysis Based on the identification of the set of
relevant implementation aspects and the corresponding empirical indicators in the previ-
ous section Chapter 3 intends to systematise the main models that are currently in
place for delivering the YG in Member States It is an empirical attempt at establishing a
typology of different intervention models based on cluster analysis This section also
explores whether a correlation between specific types of intervention models and per-
formance in delivering the YG can be identified
31 Empirical approach to establishing Youth Guarantee models
To address the question about which main models are currently in place for delivering
the YG the analysis groups Member States according to their similarity across the em-
pirical indicators presented in section 22 Since both contextual features and implemen-
tation-related factors are included this procedure identifies types of countries that are
similar in both dimensions
To detect these types cluster analysis techniques are used in which the goal is to find
groups of observations in the data ndash that is groups of Member States ndash that are most
similar within clusters while being as dissimilar as possible across clusters In this study
hierarchical agglomerative clustering methods are employed These methods start out by
specifying each Member State as one individual cluster The cluster approach then grad-
ually combines Member States into clusters The choice of which clusters are to be com-
bined is determined by comparing their (dis-) similarity In the empirical application an
adequate measure of dissimilarity is the coefficient by Gower (1971) as it allows for the
combination of binary indicators and multivalued variables The choice of the linkage
method (the way the clustering algorithm combines similar observations into clusters) is
of similar importance in this case the Ward method (1963) is chosen which combines
groups or observations if they increase the within-group variance of the chosen indica-
tors by the least amount possible in the data Lastly the authors needed to choose the
7
11
11
18
20
9 (1) Financial resources for implementing the YG
(2) YG as part of national policy-making
(3) Youth labour market challenges
(4) Heterogeneity of NEET population
(5) Design and implementation features of the YG
(6) Role of the apprenticeship system in the YG
The Youth Guarantee in light of changes in the world of work Youth Guarantee Intervention Models Sustainability and Relevance
34
number of clusters to be generated Since this is not obvious in the application at hand
the Duda-Hart optimality criterion as described by Milligan and Cooper (1985) was ap-
plied This means that intuitively the index computes the added value of increasing the
number of clusters by one so a low Duda-Hart index indicates an optimal number of
clusters In the YG case the comparison is restricted to between three and seven clus-
ters as fewer clusters provide too little information while too many clusters hamper the
interpretability of results
The empirical application follows a two-step procedure In the first step a cluster analy-
sis for each set of the empirical indicators defined in section 22 determines sets of coun-
tries that are similar within each of these six conceptual sets For example the set on
financial resources puts countries with magnitudes of expected and realised costs for
implementing the YG based on the available information together In the second step
the main cluster analysis based on all indicators determines a final cluster analysis which
also allows the authors to analyse their correspondence to the sub-clusters from the first
stage Readers should note that the quality of the cluster groups depends ndash among other
factors- on the data quality of available indicators as well as the number of indicators
used The more indicators are required for meaningful results the more difficult it is to
obtain clusters that differ sharply with respect to all the chosen indicators Thus it may
be that one country differs quite substantially in terms of one indicator from the rest of
the countries in a particular cluster if the other indicators show similar realisations
Hence for the description of clusters attention is restricted to those indicators that
summarise the cluster differences the best presenting the general tendencies of the
cluster analysis necessarily simplifying to a certain degree Furthermore readers should
also note that the groupings following from this exercise do generally not imply any
qualitative ranking
32 Description of first-step clusters
321 Indicator set 1 Financial resources
Cluster A (AT DK FI DE LU NL and SE) is a set of countries with a low estimated cost
of fully implementing the YG that received relatively little financial support from EU
funds both via the YEI and the ESF On average these states show very little changes in
active labour market policy (ALMP) spending between 2012 and 2015
Cluster B (BE CZ EE FR IE IT MT RO SI and UK) and Cluster C (ES LT LV PL and
PT) are countries with costs estimated to be of medium magnitude to fully implement
the YG Country cluster C received more EU funds from the YEI and the ESF matching
funds - and other ESF eligible youth-related projects - compared to cluster B Both clus-
ters showed only a small change in ALMP expenditure
Cluster D (BG CY EL HU HR and SK) has high estimated YG costs and they received
substantial monetary support from the EU to support the implementation of the YG
through the YEI through the ESF matching funds and through financing of other eligible
youth-related projects Cluster D is also the only one in the analysis that shows a sub-
stantial increase in ALMP spending between 2012 and 2015 despite declining (youth)
unemployment rates
322 Indicator set 2 Youth Guarantee as part of national policy-
making
Cluster A (DK ES FR HU IE SE and SK) has a large average number of youth-related
ALMP reforms and additional measures implemented beyond the scope of the Recom-
mendation These Member States also tend to enforce comparatively effective YG moni-
The Youth Guarantee in light of changes in the world of work Youth Guarantee Intervention Models Sustainability and Relevance
35
toring and follow-up systems which may be interpreted as an indication that they are
committed to deliver on the YG However on average these Member States did not pri-
oritise partnerships as much as other clusters
Cluster B (AT CZ DE EE EL NL RO and UK) is mostly defined by the lack of effective
monitoring and follow-up systems and also fewer reforms were put in place compared to
Member States in other clusters Nonetheless on average they put more emphasis on
involving social partners and youth organisations and built more partnerships than coun-
tries in cluster A
Cluster C (BE BG CY FI HR IT LV LT LU MT PL PT and SI) implemented many
youth-related reforms and additional measures as part of the implementation of YG rec-
ommendations However in contrast with cluster A these Member States also included
partnerships with social partners and youth organisations as a central element of the
initial YG design Consequently the PES in these Member States often said that they had
formed partnerships and that they regularly involve youth and youth organisations into
their work Nonetheless their monitoring systems are still underperforming compared to
countries in Cluster A
323 Indicator set 3 Youth labour market challenges
Cluster A (BG CY EL HR PL and SK) includes Member States that had the highest
NEET rate amongst 15-29 year olds in 2012 before the YG was rolled out Moreover
they show the largest difference in shares of temporary employment contracts between
the youth and adults Countries in this cluster have the best educated NEETs on average
This also reflects the point that the issue was not so much the education system as the
figures also show a comparatively low average shares of school drop-outs Correspond-
ingly Member States in cluster A usually responded by focusing on employment-related
measures under the YG rather than offers of education
Cluster B (AT DE DK ES LV and MT) relates to the contrasting cases These Member
States tend to have comparatively low NEET shares with most of them having a poor
level of education and the lowest average youth-to-adult unemployment ratio In addi-
tion these countries appear to have a rather well-functioning educational system with
similarly low average shares of early school-leavers compared to cluster A Most of
these Member States responded to this setting with a strong focus on educational offers
under the YG
Cluster C (BE CZ EE FI FR HU IE IT LT LU NL PT RO SI SE and UK) ranks in
between cluster two and three on many indicators including the prevalence of low edu-
cated NEETs education and employment offers In general this cluster has the lowest
difference in temporary employment shares between adults and the youth
324 Indicator set 4 The heterogeneity of the NEET population
Cluster A (BE BG FI MT and NL) consists of countries that have a particularly high
share of NEETs in short-term unemployment illness or disability and lsquodiscouragement
from workingrsquo The policy response of these countries is characterised by the highest
average outreach efforts on the part of the national PES
Cluster B (CZ DE EE EL FR HU HR LT LU PL SI and UK) has the highest share of
short-term unemployed and individuals with family responsibilities among the NEETs
Similar to cluster A countries from cluster B display strong average outreach efforts and
a large degree of involvement of the PES in delivering the YG
The Youth Guarantee in light of changes in the world of work Youth Guarantee Intervention Models Sustainability and Relevance
36
Cluster C (AT CY DK ES IE IT LV PT RO SK and SE) is the most diverse for this
indicator set and shows the highest share of long-term unemployed and relatively high
rates of discouraged youth among the NEET population compared to other clusters The
governance structure shows a lower degree of PES having responsibility for administer-
ing and paying (unemployment) benefits as well as regarding the implementation and
delivery of the YG in general Compared to clusters A and B Member States from cluster
C tend to show fewer outreach efforts
325 Indicator set 5 Design and implementation features of the Youth Guarantee
Cluster A (AT CY DE DK EL FI HR IE LU and SE) includes many Member States
which set the age target as under-25 years old26 These countries also tend to define
very few other eligibility criteria or target groups Importantly all Member States includ-
ed in this category have a relatively long experience of YG-type schemes prior to 2013
However only very few of them defined a legal entitlement to receive an offer These
are also countries that mostly allowed individuals to register online set a definition for a
quality offer and also provided national quality guidelines for all actors involved in the
YG Many of the Member States in this cluster also primarily rely on their PES in the YG
implementation and have strengthened their PES capacities since the YG rollout
Cluster B (BG CZ ES FR MT NL PT and RO) includes a relatively diverse set of coun-
tries Most countries in this cluster have no prior experience of a YG-type of scheme
relatively low availability of online registration and a low prevalence of the definition of
quality offers While some countries additionally target NEETs under 30 years old in
general they neither upgraded the capacity of nor relied strongly on their PES in its im-
plementation
Cluster C (BE EE HU IT LV LT PL SI SK and UK) primarily consists of countries that
set the target for youth aged under 30 In addition many of these countries set addi-
tional target groups beyond the general criteria (such as a specific focus on long-term
unemployed) or defined specific sub-groups within the broad target population Similar
to cluster A some Member States with previous YG-related experience are included in
this cluster In addition they tend to have upgraded their PES capacity for YG implemen-
tation (but they also rely on other providers) These are also mainly countries that im-
plemented a legal entitlement and also a definition of a quality offer (without however
providing national guidelines)
326 Indicator set 6 The apprenticeship system
Cluster A (AT BE DE FR LU and NL) consists of countries with an employment-centred
STW transition type27 that is characterised by high levels of employer involvement in
education and training system and the largest share of firms employing initial vocational
and educational training (IVET) participants On average Member States in this group
show the largest share of timely exits from apprenticeships Relative to the share of
firms employing IVET participants the number of pledges within the EAFA framework is
26 It is important to note that most implementation-related indicators for example information on eligible age groups were measured in 2016 For a few countries these conditions have changed recently However in the analysis it was decided to stick to the initial implementation features to focus on the way Member States initially aimed to combat youth unemployment
27 See Pohl and Walther (2005) for details
The Youth Guarantee in light of changes in the world of work Youth Guarantee Intervention Models Sustainability and Relevance
37
the lowest in this group potentially reflecting the already high importance of apprentice-
ships in these countries
Cluster B (BG CZ EE HU LT LV RO SK and SI) is made up of Member States that
joined the EU relatively recently with a lsquotransitionalrsquo STW transition type and the lowest
share of firms employing IVETs Their share of apprenticeships is lowest among the
timely exits and their number for EAFA pledges is relatively the largest
Compared to cluster A and B cluster C (CY DK EL ES FI HR IE IT MT PL PT SE
and UK) also consists of a mixture of STW types and a medium share of firms hiring
IVETs Apprenticeship offers are of medium importance relative to the other two clus-
ters
327 Summary of first-step cluster analysis
The analysis of Member Statesrsquo similarities within the indicator sets shows that the re-
sulting country clusters tend to be different depending on the set of indicators although
certain tendencies are already apparent For instance countries that are included in the
same cluster for the YG design and implementation indicators tend to also be grouped
into the same finance cluster meaning that some countries with a low estimated cost of
implementing the YG tend to also be countries that show implementation patterns that
closely followed the Recommendation Similarly countries in the same apprenticeship
cluster tend to be in the same ldquoyouth labour market challengesrdquo cluster While this al-
ready provides some suggestions for the final grouping of Member States with respect to
all indicators chosen the overlap across clusters for the different indicator sets is not
complete so a more in-depth analysis is needed Specifically some clusters remain rela-
tively heterogeneous in terms of the underlying empirical indicators indicating that the
cluster analysis has some difficulties if Member Statesrsquo realisations of indicators do not
follow a simple pattern making the interpretation of some cluster results more difficult
than others For these reasons and to further reduce the dimensionality of the problem
the next section groups Member States based on all the chosen indicators To make the
connection between the first-step analysis and the ensuing second step the association
of first-step clusters with the final cluster results is also shown
The Youth Guarantee in light of changes in the world of work Youth Guarantee Intervention Models Sustainability and Relevance
38
33 Results and discussion of second-step clusters
The final cluster analysis uses all the indicators described in the previous section and
performs the clustering procedure for all variables in a combined step thereby arriving
at clusters that take the individual sub-clusters as well as the interaction between them
into account Table 2 shows the results by Member States including their association
with the clusters uncovered in the first stage of the analysis all ordered by the final re-
sults Being in the same first-step cluster is visualised as having the same shade of the
colour in the respective column It is important to note that the colours chosen imply no
qualitative or quantitative judgement apart from the cluster membership
Table 2 Summary of Results of Cluster Analysis
Country
Financial resources for implementing the YG
YG as part of national policymaking
Youth labour market chal-lenges
Heterogenei-ty of the NEET population
Design and implementa-tion features of the YG
Role of the apprentice-ship system in the YG
Overall cluster
Austria
A
Denmark
Finland
Germany
Ireland
The Netherlands
Sweden
The Czech Republic
B
Estonia
France
Hungary
Romania
The United Kingdom
Cyprus
C
Greece
Italy
Portugal
Spain
Belgium
D
Lithuania
Luxembourg
Malta
Poland
Slovenia
Bulgaria
E Croatia
Latvia
Slovakia
Source Own analysis
Note Countries that share the same first-stage cluster have the same shade of the colour in the respective
column Note that the colour shades imply no qualitative or quantitative ranking of Member States
The Youth Guarantee in light of changes in the world of work Youth Guarantee Intervention Models Sustainability and Relevance
39
Cluster A Member States with previous YG experience lower initial NEET rates
ambitious implementation and improved PES capacity low educated NEETs and
diversified offers (AT DK DE FI IE NL SE)
The first cluster is a set of Member States that are mostly countries which already had
longer experience with YG-related schemes On average YG implementation in these
countries was quite ambitious many of these Member States undercut the recommend-
ed four-month target for the preparatory phase and formally defined their offer quality
and quality guidelines Countries in this cluster tend to rely relatively strongly on their
PES for the YG while upscaling their PES capacity through hiring additional staff At the
same time they also experienced the lowest average NEET rates in 2012 for all clusters
and they consequently had comparatively low estimated costs and therefore low levels of
funding allocated under the YEI However the clusterrsquos NEET population has the highest
share of individuals with low educational background and youth with a disability Follow-
ing this NEET challenge they diversified their offers under the YG across types the most
compared to other clusters with the lowest focus on employment-type offers Involve-
ment and integration of partners within the YG framework in these countries was about
average compared to the other clusters
Cluster B Member States with intermediate NEET challenges strong outreach
efforts by the PES relatively poor monitoring data quality high NEET rates due
to family responsibilities and strong focus on employment offers (CZ EE FR HU
RO UK)
On average these Member States mostly observed a NEET challenge of intermediate
magnitude relative to other clusters at the time of the YG roll-out The labour markets
for youth in this cluster were under more stress and characterised by high rates of short-
term unemployment among their youth ndash for some of them also as a consequence of the
great recession Furthermore this cluster also had by far the highest share of youth that
were NEETs due to family responsibilities and the largest gap between youth and adult
unemployment rates As a result most of them received some funding under the YEI It
is also notable that countries in this cluster showed the largest increase in ALMP ex-
penditure between 2012 and 2015 However compared to the other clusters countries
in this cluster showed particularly poor monitoring data quality so their information has
a high degree of unknown destinations and situations for previous YG participants On
implementation a significant fraction of Member States from cluster B chose slightly
different targets (for example through targeting long-term unemployed introducing a
legal entitlement to a YG offer and extending the age limit up to age 29) They could
build on a comparatively advanced outreach system through the PES which they also
relied on in their YG implementation Furthermore four of the seven countries in this
cluster follow the post-socialisttransitional STW model (the Czech Republic Estonia
Hungary and Romania) On average these countries showed the lowest level of in-
volvement of the social partners and youth organisations and relatively few efforts at
reform On average countries in this cluster had the highest rate of timely exits into
employment indicating a tendency towards an ldquoemployment-firstrdquo approach
Cluster C Member States hit by the economic recession with highest initial
NEET rates severe long-term unemployment large support via EU funding
highest reform efforts and highest entry rates into apprenticeship offers (CY EL
ES IT PT)
The third cluster consists mainly of Member States that were hit particularly hard by the
economic recession following the financial crisis in the years after 2008 and they were
struggling to revive their labour markets in the ensuing recovery As a consequence
most countries had a severe problem with long-term youth unemployment into 2012
The Youth Guarantee in light of changes in the world of work Youth Guarantee Intervention Models Sustainability and Relevance
40
Moreover countries in this cluster had on average the highest rate of early school-
leavers Almost all these Member States received significant funds from the EU to sup-
port the YG implementation and delivery In contrast to Member States in Clusters A and
B none of the countries in cluster C had any kind of experience of a YG type of frame-
work before the Recommendation making its implementation even more difficult in
these countries However in terms of policy integration these Member States rank at
the top of youth-related ALMP reform efforts At the same time most of these countries
still have monitoring systems with relatively poor data quality and their PES used rela-
tively few channels for outreach activities compared to countries in the other clusters
Regarding partnerships built countries in this cluster show an average degree of effort
While the share of low educated NEET is comparable to those in Cluster B and average
exits rates into education are only slightly smaller than among countries from Cluster B
the share of individuals entering apprenticeships is highest among these countries sug-
gesting a stronger focus on the provision of both training and work experience to combat
the NEET challenge
Cluster D Member States characterised by relatively low initial NEET rates and
short-term unemployed rather than inactive NEETs some funding under YEI
strong outreach efforts through the PES and partnership approach and diversi-
fied offers with a stronger focus on education offers (BE MT LT LU PL SI)
The challenge for most Member States in this cluster was the high proportion of youth in
unemployment rather than a structural NEET challenge as most of their NEETs are
short term unemployed rather than discouraged NEETs or inactive for other reasons
Most of the countries in cluster D have medium-level estimated costs of fully implement-
ing the YG Consequently most of these Member States did not receive particularly large
amounts of funding from the EU (except Lithuania and Poland) At the same time these
are mainly Member States that put the most weight on building partnerships involving
social partners and youth organisations as well as outreach efforts including through the
PES Many of the Member States in this cluster followed the Recommendation quite
closely in terms of the time-frame for the YG but they did not establish strong monitor-
ing systems and they did not carry out many youth-related reforms in recent years
relative to other Member States In terms of the offer distribution these countries gen-
erally showed diversified offers with the strongest focus on education measures shown
by the largest share of timely exits from the YG into education and the lowest focus on
employment offers This is despite the fact that on average clusters B C and D had
very similar shares of low and medium educated NEETs at the onset of the YG suggest-
ing a very different policy response
Cluster E Member States that joined the EU relatively recently with lsquotransi-
tionalrsquo STW regimes high initial NEET rates structural challenges and substan-
tial EU funding focus on employment offers rather high reform efforts (BG HR
LV SK)
This cluster consists entirely of countries that joined the EU relatively recently compared
to the other Member States They are countries with a lsquotransitionalrsquo STW regime and
without prior experience in YG-type of frameworks before the Recommendation While
these countries have the lowest rate of early school-leavers and a substantially lower
share of low educated individuals among the NEETs compared to the other clusters this
cluster has the second largest share of NEETs with family responsibilities and the largest
share of discouraged youth This suggests that they struggled with more significant
structural NEET challenges compared to the other clusters The high NEET rates resulted
in high estimated costs for implementing the YG and consequently these Member States
also received substantial funding from the EU
The Youth Guarantee in light of changes in the world of work Youth Guarantee Intervention Models Sustainability and Relevance
41
Moreover these Member States also put in place a significant number of youth-related
ALMP reforms between 2013 and 2016 only outpaced by cluster C In terms of design
and implementation all of these countries chose to target youth under 30 and most put
particular emphasis on long-term unemployed individuals The degree of outreach efforts
through the PES is of average magnitude but the involvement of social partners and
youth organisations is highest among countries in this cluster This may indicate a cer-
tain degree of mismatch regarding outreach activities and the efforts likely to be re-
quired to activate the substantial share of discouraged NEETs in the youth population
However this cluster is the only in which all the Member States have YG-specific staff at
the PES and where all of them increased PES staff in recent years Due to the relatively
well-qualified nature of the NEET population Member States in this cluster concentrated
mostly on employment-type offers
34 Conclusion of second-step clusters
Breaking down the differences between clusters in a simple way is evidently challenging
due to the many aspects considered and highlighted in the cluster-specific characterisa-
tions This section therefore only provides a short conclusion to the findings in the final
cluster analysis indicating several sorts of Youth Guarantee models in place in the Euro-
pean Union It shows three clusters with comparatively low initial NEET rates at the out-
set of the YG Cluster A Cluster B and Cluster D What distinguishes these clusters from
one another among other issues is that Member States in Cluster A already had a long-
er experience of YG-related schemes they observed fewer youth-related challenges and
hence they received less additional funds from the EU
In contrast to this most Member States with the most pressing NEET challenges in 2012
are found in the other two clusters Cluster C and Cluster E include Member States with
particular NEET challenges mostly related to the financial crisis and recession for coun-
tries in Cluster C Member States in Cluster E also had a particular structural NEET chal-
lenge partially stemming from the transitional STW regime and they all received signifi-
cant funding from the EU
35 Measures of performance
Before investigating the correlation between the types of European YG models identified
and the performance of the YG implementation the analysis needs to define the relevant
outcome measures employed for this last step of the empirical analysis The correlation
analysis will make substantive use of information from the YG monitoring data The most
recent data available at the time of writing are from 2016 and they include information
on the main dimensions of the Recommendation
i ldquoCoveragerdquo rate provides an estimation of the degree to which the NEET popula-
tion was reached by the YG (the estimated proportion of the NEET population
aged 15-24 that was enrolled in the YG scheme at any point during the reference
year)28
28 These figures are based on the indicator average annual stock of young people in the YG pre-
paratory phase NEET population (annual average) included in the Indicator Framework for Moni-
toring the Youth Guarantee This indicator combines administrative and survey data Whilst this is not ideal the indicator is useful to give an approximate indication of the proportion of NEETs regis-tered in the YG scheme at any point during the year Results should therefore be interpreted as an estimation rather than a definitive measurement of the extent to which YG schemes achieve the objective of reaching all young people that become or are already NEET
The Youth Guarantee in light of changes in the world of work Youth Guarantee Intervention Models Sustainability and Relevance
42
ii The share beyond the four-month target the share of young people in the pre-
paratory phase beyond the four-month goal measured as a percentage of the
average annual stock of participants
iii Positive and timely exits the share of positive and timely exits shows how suc-
cessful Member States were at providing offers within the envisaged four-month
preparatory phase measured in percentage of all exits
iv Positive situations after six months this measure gives the percentage of YG par-
ticipants being in a positive situation at six months after exiting the programme -
the share of individuals either in education training or employment as a percent-
age of all exits
These performance indicators provide the most comprehensive and direct evidence on
the performance of the YG However there are some data limitations regarding the de-
gree to which the entire NEET population can be identified relevant for the comparability
of the coverage rate across Member States The quality of information on positive and
timely exits as well as the share of participants in a positive situation after exiting the YG
depends on the degree to which the destination of exits is known and how well individu-
als can be followed up Again to a certain degree this limits comparability across coun-
tries The distribution of these indicators across Member States is depicted in Figure 6 For the interested reader a separate cluster analysis solely based on the measures of YG
performance in Table 4 is included in the Annex
The Youth Guarantee in light of changes in the world of work Youth Guarantee Intervention Models Sustainability and Relevance
43
Figure 6 YG-monitoring data performance indicators by Member States 2016
Source YG monitoring data
0
10
20
30
40
50
60
70
80
90
100M
T
HU
UK
BG IT RO CY LV LU EE ES LT IE EL SE SK NL
CZ
HR PL
DK PT SI DE
FR BE FI AT
Coverage rate Share beyond the 4 month target
0
10
20
30
40
50
60
70
80
90
100
CY UK RO FR EL SI HR SK IE BG PT NL LV SE ES LU LT BE PL FI AT EE DE CZ IT DK HU MT
Positive and timely exits Positive situations after 6 months
The Youth Guarantee in light of changes in the world of work Youth Guarantee Intervention Models Sustainability and Relevance
44
To account for measuring issues in the monitoring data and because the main goal of
the YG was to lower youth unemployment and the prevalence of NEETs in general the
reduction from 2012 to 2017 in NEET rates and youth unemployment rates based on
Eurostat indicators is used as additional outcome measures
v Youth unemployment this measure gives the percentage of the 15-24 year old
young people in the labour force that are unemployed
vi NEET rates the NEET rate indicator is defined as the share of the youth popula-
tion (active or inactive) aged 15-24 that is not in employment education or
training
The distribution of these indicators is shown in Figure 7
Figure 7 Eurostat performance indicators by Member States 2012-2017
Source Eurostat (une_rt_a lfsi_neet_a)
36 Assessing the correlation between Youth Guarantee models
and performance
The goal of this section is to compare the performance of the YG as implemented in each
Member State across the clusters identified in section 34 and then to assess emerging
patterns This will be done by using box plots shown for each of the performance indica-
tors separately Box plots allow the comparison of the distribution of indicators across
clusters The median ie the observation in the middle in terms of outcomes (for in-
stance the middle value of all coverage rates within a cluster Figure 8 upper left panel)
is shown by the horizontal lines within each box Furthermore the size of the box shows
the location of the 50 closest observations to the median Observations outside this
box are shown in the graph by the so-called lsquowhiskersrsquo Extreme values that are far away
from the box are displayed as dots Figure 8 shows the distribution of performance
measures for the YG monitoring data
-5
0
5
10
15
20
FI AT
BE IT DE
FR LU NL
CY
DK
MT
RO SE EE UK SI LV CZ EL PL LT PT ES HR SK BG IE
HU
Reduction in youth unemployment Reduction in NEET rates
The Youth Guarantee in light of changes in the world of work Youth Guarantee Intervention Models Sustainability and Relevance
45
Figure 8 YG monitoring data performance indicators by clusters
Source Own analysis
The graph for the coverage rate (upper left panel) shows that clusters A and D have the
highest median coverage rates among the five clusters This appears quite natural as
these countries have had the lowest NEET rates at the onset of the YG making it easier
to cover a large portion of vulnerable youth compared to other countries Clusters B C
and E perform relatively similarly in terms of coverage with median values in the range
of 20 to 40 coverage rate despite the fact that clusters C and E had considerably larg-
er NEET rates when the YG was first introduced Among other factors these two clusters
have in common is that they received substantial funds from the EU to support YG
measures and that countries from both clusters enacted a significant number of youth-
related ALMP reforms
The upper right panel displays results for the share of participants still being in the pre-
paratory phase beyond the envisaged four months in each of the clusters A B D and E
this share is in the range of 45 to 50 in terms of the median values in cluster C this
value is 60 Clusters B and D show considerably more variation than the other clus-
ters The figure indicates therefore that the countries in cluster C appear to have put in
comparatively lower effort to upscaling their PES to provide YG services in time reflected
in the fact that these countries have the highest share of individuals in the preparatory
phase beyond the four month target
With respect to positive and timely exits (bottom left panel) there is no pronounced vari-
ation in terms of median outcomes across the clusters All of the clusters have positive
and timely exit rates of around 40 or slightly higher Finally looking at the share of
positive situations for YG participants after 6 months of leaving the programme (bottom
right panel) one can see that the median outcomes are quite similar for all clusters ex-
cept cluster B which has substantially lower positive outcomes after 6 months In addi-
tion there appear to be substantial differences in the within-cluster variation of this out-
The Youth Guarantee in light of changes in the world of work Youth Guarantee Intervention Models Sustainability and Relevance
46
come however this finding is probably due to the lack of data since for some Member
States these figures are not available (and coded as zero in the monitoring data) A simi-
lar reasoning can be used to explain the large variation between clusters A and D
Figure 9 Aggregate performance measures
Source Own analysis
Figure 9 investigates the reductions in youth unemployment rates and NEET rates from
2012 to 2017 respectively Both graphs display a similar pattern although the reduction
in youth unemployment is generally larger implying that a larger reduction was
achieved among those youth closer to the labour market Focusing on the cluster medi-
ans the figure indicates that cluster A ndash the cluster with the lowest initial NEET and un-
employment rates ndash shows the smallest decline Clusters B C and D show relatively
similar reductions in youth unemployment cluster E being at the top of the distribution
The picture is slightly different when looking at the reduction of NEET rates Here cluster
C has the largest median reduction in NEETs and clusters B D and E display similar per-
formance despite differences in variability Thus cluster E ndash the cluster with a combina-
tion of high initial NEET rates and more structural issues (such as a high share of dis-
couraged NEETs) ndash was more successful in reducing youth unemployment while clus-
ter C (with similarly high NEET rates for 2012 but lower educated NEETs and the highest
apprenticeship take-up rate in terms of timely exits among all clusters) was more suc-
cessful in reducing its NEET rates
4 Summary and conclusions
This report provides an updated overview of the implementation of the YG across EU
Member States based on the recent literature and data on the YG and European labour
markets On this basis six aspects of the Youth Guarantee implementation are dis-
cussed (1) financial resources for implementing the YG (2) the YG as part of national
policy making (3) youth labour market challenges (4) the heterogeneity of the NEET
population (5) the design and implementation features of the YG and (6) the role of the
apprenticeship system in the YG
The overall findings of the desk research and data analysis can be summarised as fol-
lows EU funding initiatives via the Youth Employment Initiative (YEI) and the European
Structural Fund (ESF) played a key role in supporting YG measures financially especially
for those countries suffering from high NEET rates and a significant economic downturn
or structural challenges Many of these countries increased spending on active labour
market policy which may be cautiously interpreted as an indirect effect of the YG In
some Member States the YG also fostered introduction of reforms of national youth poli-
The Youth Guarantee in light of changes in the world of work Youth Guarantee Intervention Models Sustainability and Relevance
47
cies improvements in monitoring systems for activation policies among young people
and the building of partnerships These changes are likely to outlast the YG initiative and
therefore provide sustained and ongoing benefits
Whereas these are substantive positive changes brought about by the YG not all of its
objectives were achieved First neither reducing labour market segmentation through
quality offers nor providing a remedy for imperfectly performing education systems was
fully achieved One reason was a prevalence of employment offers compared to relative-
ly few education or apprenticeship offers The low share of apprenticeship offers in some
Member States appears to be related to the existing institutional setup and STW transi-
tion regime increasing the prominence of the apprenticeship system would need to be
accompanied by broader institutional change Second several Member States were not
able to fully address the heterogeneity of the NEET population ndash especially those furthest
away from the labour market In contrast countries that performed well generally im-
proved the capacity of their Public Employment Services (PES) and developed partner-
ships to implement strong outreach programmes
Based on desk research of the six key aspects that are likely to influence the perfor-
mance of the YG as delivered by Member States a set of empirical indicators was de-
fined to measure the components of these six aspects using available quantitative and
qualitative data These empirical indicators feed into the main part of the analysis that
identifies the YG typology in terms of the key aspects specifically this approach groups
together Member States that share similar outputs across all the features included in the
analysis In practice the typology is derived from a two-step cluster analysis using an
agglomerative clustering algorithm
The first step of the typology discusses the similarity between Member States regarding
implementation-related and contextual features within six pre-defined sets of indicators
each corresponding to one of the six key aspects of the YG The cluster analysis gener-
ates different group compositions regarding Member States for each of the sets of empir-
ical indicators defined so a low-dimensional analysis is only partially informative This
result indicates that many aspects of the YG ndash and their interrelation ndash need to be con-
sidered in a comprehensive typology The second-step cluster analysis therefore simul-
taneously takes into account all of the 76 empirical indicators and identifies five final
clusters
Cluster A Member States with previous YG experience lower initial NEET rates ambi-
tious implementation and improved PES capacity low educated NEETs and diversified
offers (AT DK DE FI IE NL SE)
Cluster B Member States with intermediate NEET challenges strong outreach efforts by
the PES relatively poor monitoring data quality high NEET rates due to family responsi-
bilities and strong focus on employment offers (CZ EE FR HU RO UK)
Cluster C Member States hit by the economic recession with highest initial NEET rates
severe long-term unemployment large support via EU funding highest reform efforts
and highest entry rates into apprenticeship offers (CY EL ES IT PT)
Cluster D Member States characterised by relatively low initial NEET rates and short-
term unemployed rather than inactive NEETs some funding under YEI strong outreach
efforts through the PES and partnership approach and diversified offers with a stronger
focus on education offers (BE MT LT LU PL SI)
Cluster E Member States that joined the EU relatively recently with lsquotransitionalrsquo STW
regimes high initial NEET rates structural challenges and substantial EU funding focus
on employment offers rather high reform efforts (BG HR LV SK)
The Youth Guarantee in light of changes in the world of work Youth Guarantee Intervention Models Sustainability and Relevance
48
Obviously these explicit labels for the clusters tend to simplify the other factors of het-
erogeneity across Member States that determine the typology However some conclu-
sions can be drawn regarding the fit of underlying challenges to be addressed with the
policy response observed In particular it appears that countries in Cluster A C and D
reflected the challenges observed in the design and implementation of the YG to a higher
degree compared to cluster B and E as policies implemented ndash for example regarding
outreach efforts the extent of partnerships and the offer mix introduced ndash seem to bet-
ter match key factors of heterogeneity in the NEET population
Based on these insights the analysis continues with a correlation analysis relating the
identified YG models to basic performance indicators The findings highlight that there is
no evident pattern regarding the clustersrsquo performance in general Cluster A performs
well in terms of the NEET ldquocoveragerdquo rate but less well regarding the reduction in NEET
and unemployment rates over time Clusters B and D perform relatively similar across all
outcome measures although there is some variation that probably stems from meas-
urement issues in the monitoring data Cluster C shows the largest share of youth in the
preparatory phase beyond the envisaged four months but also the largest median de-
cline in NEET rates Cluster E has the lowest share of positive and timely exits but the
largest decline in youth unemployment out of all clusters
While the evidence is thus far from conclusive partly due to the number and complex
inter-relation of the aspects in which clusters differ the reportrsquos findings nonetheless
indicate that not only initial conditions but also the way Member States implement the
YG has affected its success
The Youth Guarantee in light of changes in the world of work Youth Guarantee Intervention Models Sustainability and Relevance
49
References
Andor L and Veselyacute L (2018) The EUrsquos Youth Guarantee a broadly accepted reform in
need of full implementation OSE paper series No 19
ANPAL (2017) Rapporto sullrsquoattuazione della Garanzia Giovani in Italia Rapporto
trimestrale n 4 Roma
ANPAL (2018) Monitoraggio sulla struttura e il funzionamento dei servizi per il lavoro
2017 Roma
Council of the European Union (2013) Council Recommendation of 22 April 2013 on es-
tablishing a Youth Guarantee Official Journal of the European Union Brussels
Department of Education and Skills (2016) Evaluation of the operation of the Youth Em-
ployment Initiative (YEI) element of the European Social Fund (ESF) Programme for Em-
ployability Inclusion and Learning (PEIL) 2014-2020
Department of Social Protection (DSP) (2014a) Pathways to Work - The Implementation
of the EU Council Recommendation for a Youth Guarantee
Department of Social Protection (DSP) (2016a) Member Statesrsquo response to 2013 Coun-
cil Recommendation on establishing a Youth Guarantee [Ireland]
Dheacuteret C and Roden J (2016) Towards a Europeanisation of Youth Employment Poli-
cies ndash A Comparative Analysis of Regional Youth Guarantee Policy Designs EPC Issue
Paper Ndeg81
Dheacuteret C and Morosi M (2015) lsquoOne Year After the Youth Guarantee Policy Fatigue or
Signs of Actionrsquo EPC Policy Brief Brussels European Policy Centre (EPC)
Doherty R (2018) lsquoWritten answer ndash Youth Guaranteersquo Daacuteil Eacuteireann Debate 22 March
2018
Eichhorst W Hinte H and Rinne U (2013) Youth Unemployment in Europe What to
Do about It IZA Policy Paper No 65 July httpftpizaorgpp65pdf
Employment Committee (EMCO) (2017) Ireland - 2017 EMCO Review on the Youth
Guarantee ndash Self-Assessment Questionnaire
Escudero V and E Loacutepez Mourelo (2017) The European Youth Guarantee A systematic
review of its implementation across countries Research Department Working Paper No
21 ILO Geneva
Eurofound (2013a) Young People and Temporary Employment in Europe Publications
Office of the European Union Luxembourg
Eurofound (2013b) Working Conditions of Young Entrants to the Labour Market Publica-
tions Office of the European Union Luxembourg
Eurofound (2014) Mapping Youth Transitions in Europe 2372014 Publications Office
of the European Union Luxembourg
Eurofound (2015a) Beyond the Youth Guarantee - Lessons Learned in the First Year of
Implementation Background Document prepared by Eurofound as a contribution to the
informal EPSCO meeting of 16-17 July 2015 Publications Office of the European Union
Luxembourg
Eurofound (2015b) Social Inclusion of Young People Publications Office of the European
Union Luxembourg
Eurofound (2016) Exploring the diversity of NEETs Publications Office of the European
Union Luxembourg
Eurofound (2017) Long-term unemployed youth Characteristics and policy responses
Publications Office of the European Union Luxembourg
The Youth Guarantee in light of changes in the world of work Youth Guarantee Intervention Models Sustainability and Relevance
50
European Alliance for Apprenticeship (2013) ldquoDeclaration of the European Social Part-
ners the European Commission and the Lithuanian Presidency of the Council of the Eu-
ropean Unionrdquo Brussels
European Commission (2011) Youth Opportunities Initiative ndash Communication From The
Commission To The European Parliament The Council The European Economic And So-
cial Committee And The Committee Of The Regions Brussels
European Commission (2013) Guidebook for Policy Planners and Practitioners on Ap-
prenticeship and Traineeship Schemes in EU27 December
European Commission (2016a) The Youth Guarantee and Youth Employment Initiative
three years on European Commission Directorate-General for Employment Social Af-
fairs and Inclusion Brussels
European Commission (2016b) Staff working documents 1 on ldquoThe Youth Guarantee
and Youth Employment Initiative three years onrdquo European Commission Directorate-
General for Employment Social Affairs and Inclusion Brussels
European Commission (2016c) Member Statesrsquo response to 2013 Council Recommenda-
tion on establishing a Youth Guarantee survey results unpublished
European Commission (2016d) Youth Guarantee Country by Country March 2016
European Commission (2017a) Report on PES Implementation of the Youth Guarantee
European Commission Directorate-General for Employment Social Affairs and Inclusion
Publications Office of the European Union Luxembourg
European Commission (2017b) Assessment Report on PES Capacity European Commis-
sion and Directorate-General for Employment Social Affairs and Inclusion Publications
Office of the European Union Luxembourg
European Commission (2017c) Education amp Training Monitor 2017 Comparative Report
European Commission (2017d) JobsPlus Youth
European Commission (2017e) Youth Guarantee Country by Country March 2017
European Commission (2017f) Draft Joint Employment Report from the Commission and
the Council accompanying the Communication from the Commission on the Annual
Growth Survey 2018 COM (2017) 674 final Brussels
European Commission (2017g) Employment and Social Developments in Europe 2017
European Commission (2017h) European Semester Thematic Factsheet ndash Employment
Protection Legislation
European Commission (2018a) The Youth Guarantee Country by Country Brussels
European Commission (2018b) Data collection for monitoring of Youth Guarantee
schemes Employment Social Affairs amp Inclusion
European Commission (2018c) Continued Education Offers in the Youth Guarantee -
Experience from the ground
European Commission (2018d) Traineeship offers under the Youth Guarantee
European Commission (2018e) Activation measures for young people in vulnerable situ-
ations - Experience from the ground
European Commission (2018f) Effective outreach to NEETs - Experience from the
ground
European Commission (2018g) Youth Guarantee amp Youth Employment Initiative Fact-
sheet 2762018
European Commission (2018h) Employment and entrepreneurship under the Youth
Guarantee ndash Experiences from the ground
The Youth Guarantee in light of changes in the world of work Youth Guarantee Intervention Models Sustainability and Relevance
51
European Commission (2018i) Employment and Social Developments in Europe 2018
European Commission (2018j) data on national commitments regarding the European
Alliance for Apprenticeships httpeceuropaeusocialmainjspcatId=1148amplangId=en
European Commission (2018k) ESF and YEI financial data by end 2017 submitted
through SFC2014 by Member States ndash Note EU amounts have been calculated on the
basis of the applicable co-financing rates
European Commission (2018l) Continued Education Offers under the Youth Guarantee ndash
Experience from the ground Brussels
European Court of Auditors (2017) Youth unemployment ndash have EU policies made a dif-
ference An assessment of the Youth Guarantee and the Youth Employment Initiative
Publications Office of the European Union Luxembourg
European Employment Policy Observatory (EEPO) (2015) EEPO Country Reports ndash Ire-
land Implementation of the 2013 Recommendation on establishing a Youth Guarantee
European Parliament (2015) Differential Treatment of Workers under 25 with a view to
their Access to the Labour Market Directorate General for Internal Policies Policy De-
partment A Economic and Scientific Policy
European Parliament (2017a) Workshop Summary Report Youth Guarantee and Youth
Employment Initiative Lessons from implementation Policy Department A Economy
and Scientific Policy European Parliament Brussels
European Parliament (2017b) Youth Employment Initiative Lessons from implementa-
tion Policy Department A Economy and Scientific Policy European Parliament Brussels
European Parliament (2017c) Youth Guarantee Lessons from implementation Policy
Department A Economy and Scientific Policy European Parliament Brussels
European Parliament (2018) Ensuring high-quality job creation from EU funding pro-
grammes How can the best practice of Horizon 2020 be better integrated into other
programmes (ESF Youth Guarantee Globalisation Fund) Policy Department for Budget-
ary Affairs Directorate General for Internal Policies of the Union
European Trade Union Confederation (2018) Boosting Unionsrsquo Participation to Guarantee
Quality Transitions and Employment to Young People in Europe
European Youth Forum (2017) Excluding youth a threat to our future
European Youth Forum (2018) Updated position on the Implementation of the Youth
Guarantee Brussels Belgium
Eurostat (2015) Being Young in Europe Today
Eurostat (2018) How common is temporary employment in your country
Ghirelli C E Havari G Santangelo and M Scettri (2019) ldquoDoes on-the-job Training
Help Graduates Find a Job Evidence from an Italian Regionrdquo forthcoming in the Inter-
national Journal of Manpower 40(1)
Gower J C (1971) A general coefficient of similarity and some of its properties in
Biometrics Vol 27 Nr 4 S 857ndash872
Gregg P and Tominey E (2005) The wage scar from male youth unemployment La-
bour Economics 12 487ndash509
Indecon (2016) Indecon Evaluation of JobBridge Activation Programme Report pre-
pared by Indecon International Research Economists and submitted to the Department
of Social Protection
International Labour Organisation and European Commission (2017) National Outreach
Strategy for non-registered young unemployed and inactive young people in Portugal
The Youth Guarantee in light of changes in the world of work Youth Guarantee Intervention Models Sustainability and Relevance
52
Leigh-Doyle S (2014) Can subsidised employment and work-first measures assist the
labour market integration of low-skilled unemployed youth Peer Country Comments
paper ndash Ireland EU Peer Review on lsquoEmplois drsquoavenirrsquo ndash Jobs with a futurersquo Scheme Par-
is (France) 10-11 February 2014
Milligan G W and Cooper M C (1985) An examination of procedures for determining
the number of clusters in a dataset Psychometrika 50 159-179
OrsquoReilly J Eichhorst W Gaacutebos A Hadjivassiliou K Lain D Leschke J McGuin-
ness S Kurekovaacute L M Nazio T Ortlieb R Russell H and Villa P (2015) lsquoFive
Characteristics of Youth Unemployment in Europe Flexibility Education Migration
Family Legacies and EU Policyrsquo SAGE Open January-March 2015 1ndash19
Pastore F (2018) Why is youth unemployment so high and different across countries
IZA World of Labor 2018 420 doi 1015185izawol420
Pastore F (2015) The Youth Experience Gap Explaining National Differences in the
School-to-Work Transition Heidelberg Springer International Publishing AG 2015
Pohl A and Walther A (2005) Tackling Disadvantage in Youth Transitions - A Themat-
ic Study on Policy Measures Concerning Disadvantaged Youth Report funded by the EU
Action Programme to combat Social Exclusion October
Pohl A and Walther A (2007) Activating the Disadvantaged ndash Variations in Address-
ing Youth Transitions across Europe International Journal of Lifelong Education 265
pp533-553
Quintini G and Martin S (2014) lsquoSame Same but Different School-to-Work Transi-
tions in Emerging and Advanced Economiesrsquo OECD Social Employment and Migration
Working Papers No 154 OECD Publishing
Quintini Glenda and Martin John P and Martin Seacutebastien (2007) The Changing Nature
of the School-to-Work Transition Process in OECD Countries WDA-HSG Discussion Paper
No 2007-2
Scarpetta S A Sonnet and Manfredi T (2010) lsquoRising Youth Unemployment During
The Crisis How to Prevent Negative Long-term Consequences on a Generationrsquo OECD
Social Employment and Migration Working Papers No 106
Stokes D (2016) Opening gateways to work for youth But can success be guaran-
teed Peer Country Comments Paper ndash Ireland EU Peer Review on The Guarantee for
Youth (a particular measure within the broader context of the Youth Guarantee) Paris
(France) 7-8 April 2016
Tosun J Unt M and Wadensjouml E (2017) Youth‐oriented Active Labour Market Poli-
cies Explaining Policy Effort in the Nordic and the Baltic States Social Policy amp Admin-
istration 51 598ndash616
Treadwell Shine K (2016) lsquoYouth Guarantee in Irelandrsquo Department of Social Protec-
tion presentation Youth Opportunities at EU Level Cork
Walther A (2006) Regimes of Youth Transitions Choice Flexibility and Security in
Young Peoples Experiences across different European Contexts Young Vol 14 No 2
pp119ndash139
Ward J H Jr (1963) Hierarchical Grouping to Optimize an Objective Function Journal
of the American Statistical Association 58 236ndash244
The Youth Guarantee in light of changes in the world of work Youth Guarantee Intervention Models Sustainability and Relevance
53
Annex
Table 3 List of indicators
Indicator name and time of measurement
Source Explanation
Financial resources for implementing the Youth Guarantee
Initial YEI allocation (2014-2017)
EC (2016b) Euros-tat (nama_10_gdp)
YEI allocation in of GDP
YEI+ESF EU eligible cost
(2017)
EC (2018k) Euros-
tat (nama_10_gdp) YEI+ESF eligible cost in of GDP
Other ESF eligible cost (2017)
EC (2018k) Euros-tat (nama_10_gdp)
Other ESF eligible cost in of GDP
Share of declared YEI+ESF funds (2017)
EC (2018k) Declared YEI+ESF funds as a share of eligible cost
Estimated cost of the YG (2015)
Eurofound (2015)
Binary indicator for medium cost (03-06 of
GDP) reference category low cost
Binary indicator for high cost (gt06 of GDP) reference category low cost
Change in ALMP expenditure (2012 to 2015)
Eurostat (lmp_expsumm)
Difference in ALMP expenditure in of GDP
YG as part of national policy-making
Number of youth-related ALMP reforms (2013-2016)
LABREF database Absolute number of reforms
Number of additional measures beyond Recom-mendation implemented in the context of the YG (2016)
EC (2016c)
Sum of binary indicators for additional measures regarding school dropout social and welfare policies volunteering social economy and oth-er
Share of YG exits with un-known destination (2016)
EC (2018b)
Binary indicator for an unknown share of 10-30 reference category 0-10
Binary indicator for an unknown share of more than 30 reference category 0-10
Share of unknown situations in the six month follow up
(2016)
EC (2018b)
Binary indicator for an unknown share of 40-99 reference category 0-39
Binary indicator for an unknown share of 100 reference category 0-39
Involvement of social part-ners (2016)
EC (2016c) Sum of binary indicators for the involvement of social partners in design implementation and evaluationmonitoring
Involvement of youth organi-sations (2016)
EC (2016c) Sum of binary indicators for the involvement of social partners in design implementation and
evaluationmonitoring
PES involvement of youth in design of YG (2017)
EC (2017a) Binary indicator
PES involvement of youth organisations in design of YG (2017)
EC (2017a) Binary indicator
Partnerships formed by PES (2017)
EC (2017a)
Sum of binary indicators for PES partnerships aimed at increasing information availability increasing workeducation opportunities and easing the transition into employment from educationunemployment
The Youth Guarantee in light of changes in the world of work Youth Guarantee Intervention Models Sustainability and Relevance
54
Indicator name and time of measurement
Source Explanation
Youth labour market challenges
Youth share of total popula-tion (2012)
Eurostat (lfsa_pgaed)
Number of youth (15-24) expressed as of total population
Youth-to-adult unemploy-ment ratio (2012)
Eurostat (une_rt_a) Youth (15-24) unemployment rate divided by adult unemployment rate (25-74)
NEET rate among 15-29 year
olds (2012)
Eurostat
(edat_lfse_21)
Total number of NEETs aged between 15 and 29
in of total youth population
Difference in temporary em-ployment shares (2012)
Eurostat (lfsi_pt_a) Difference in temporary employment rates be-tween youth (15-24) and adults (25-54)
Share of early school-leavers (2012)
Eurostat (edat_lfse_14)
Share of early school-leavers as of youth population (18-24)
Share of low-educated NEETs
(2012) Eurostat (edat_lfse_21)
Number of NEETs with low education back-
ground divided by total number of NEETs (15-24)
Share of medium-educated NEETs (2012)
Number of NEETs with medium education back-ground divided by total number of NEETs (15-24)
Share of employment offers (2016)
European Commis-sion (2018b)
Number of employment offers as of total offers typically made to participants
Share of timely exits into employment (2016)
European Commis-sion (2018b)
Number of exits into employment as of total timely exits from the YG
Share of education offers (2016)
European Commis-sion (2018b)
Number of education offers ias of total offers typically made to participants
Share of timely exits into education (2016)
European Commis-sion (2018b)
Number of exits into education as of total timely exits from the YG
The heterogeneity of the NEET population
Share of re-entrants among NEET (2013)
Eurofound (2016) Number of individuals in the respective group in of total NEET population
Share of short-term unem-ployed among NEET (2013)
Share of long-term unem-ployed among NEET (2013)
Share of individuals with illnessesdisabilities among NEET (2013)
Share of individuals with family responsibilities among NEET (2013)
Share of discouraged workers among NEET (2013)
PES responsibility regarding paying of unemployment benefits (2017)
European Commis-sion (2017b)
Binary indicator for the PES responsibility
PES responsibility regarding administering unemployment benefits (2017)
PES responsibility regarding other types of benefits
(2017)
The Youth Guarantee in light of changes in the world of work Youth Guarantee Intervention Models Sustainability and Relevance
55
Indicator name and time of measurement
Source Explanation
Number of responsibilities of the PES within the YG (2017)
European Commis-sion (2017a)
Sum of binary indicators for the PES being re-sponsible for managing the YG scheme regis-tering unemployed youth providing (placement) services to youth coordinating partners out-reach to NEETs follow-up of participants and design and maintenance of the monitoring scheme
PES outreach activities
(2017)
European Commis-
sion (2017a)
Binary indicator for the PES having awareness raising initiatives
Binary indicator for the PES having outreach programmes for pro-active work with schools
Binary indicator for the PES to cooperate with NGOs and youth organisations for outreach
Binary indicator for the PES to have specific outreach caseworkers
Binary indicator for the PES to have new points of entry (via new media)
Binary indicator for the PES to provide single-point servicesone-stop shops
Binary indicator for the PES to have mobile PES initiatives
Binary indicator for the PES to have follow-up programmes to reach out to YG drop-outs
PES programme for prevent-ing high school dropout (2017)
European Commis-sion (2017a)
Binary indicator
Design and implementation features of the Youth Guarantee
Eligible age group (2016) European Commis-sion (2016c)
Binary indicator for YG eligible age group being under 25 year and recent graduates reference category under 25
Binary indicator for YG eligible age group being under 26 reference category under 25
Binary indicator for YG eligible age group being
under 27 reference category under 25
Binary indicator for YG eligible age group being under 30 reference category under 25
Envisaged time-frame of intervention (2016)
European Commis-sion (2016c)
Binary indicator for the target time frame being below 4 months reference category 4 months
Binary indicator for the target time frame being above 4 months reference category 4 months
YG scheme specifically tar-geting long-term unemployed (2016)
Escudero and Mourelo (2017)
Binary indicator
Main YG provider (2016) European Commis-sion (2016c)
Binary indicator for the YG to be provided main-ly by the PES and other institutions reference category only PES
Binary indicator for the YG to be provided main-
ly by other institutions reference category only PES
The Youth Guarantee in light of changes in the world of work Youth Guarantee Intervention Models Sustainability and Relevance
56
Indicator name and time of measurement
Source Explanation
Degree to which online regis-
tration for the YG is possible (2016)
European Commis-sion (2016c)
Binary indicator for online registration being partly possible reference category not at all
Binary indicator for online registration being
possible everywhere reference category not at all
Legal entitlement to offer (2016)
European Commis-sion (2016c)
Binary indicator for whether there exists an entitlement for young people to receive an offer in line with or similar to the Youth Guarantee
Previous experience with a
YG-type of framework (2014)
European Commis-
sion (2016c)
Binary indicator for having recent experience with a YG-type of framework reference catego-ry none
Binary indicator for having longer experience with a YG-type of framework reference catego-ry none
Formal definition of quality
offer (2016)
European Commis-
sion (2016c)
Binary indicator having formally defined offer
quality
National quality guidelines (2017)
European Commis-sion (2017a)
Binary indicator having national quality guide-lines from the national administration to all PES officesother organisations involved in the YG
PES has YG-specific staff (2017)
European Commis-sion (2017a)
Binary indicator for having YG-specific staff
PES training (2017) European Commis-sion (2017a)
Binary indicator for the PES providing training specifically tailored working with youth
PES staff increase (2014-2017)
European Commis-sion (2017a)
Binary indicator for the PES having in-creasedunchanged staff from 2014-2017
PES has youth-specific tar-
gets (2017)
European Commis-
sion (2017a)
Binary indicator for the PES having youth-
specific targets
The role of the apprenticeship system in the YG
Share of firms with IVET participants (2010)
Eurostat (trng_cvt_34s)
Share of firms hiring initial vocational training participants expressed as a of all firms
Share of apprenticeship of-fers (2016)
European Commis-sion (2018b)
Number of offers of apprenticeships as of total offers typically made to participants
Share of timely exits into apprenticeships (2016)
European Commis-sion (2018b)
Number of exits into apprenticeships as of total timely exits from the YG
School-to-work transition cluster (2005)
PohlWalther (2005)
Binary indicator for STW being of type transi-tionalpost-socialist reference category miss-ing
Binary indicator for STW being of type sub-protective reference category missing
Binary indicator for STW being of type univer-salistic reference category missing
Binary indicator for STW being of type liberal reference category missing
Binary indicator for STW being of type employ-ment-centred reference category missing
Number of EAfA pledges (2018)
European Commis-sion (2018j)
Number of pledges to increase apprenticeships by firms or organisations normalised by the share of firms hiring IVETs
The Youth Guarantee in light of changes in the world of work Youth Guarantee Intervention Models Sustainability and Relevance
57
Table 4 Outcome cluster means
Cluster A Cluster B Cluster C Cluster D
ldquoCoveragerdquo rate (in ) 488 76 479 448
Share in preparatory phase beyond four
months (in )
433 284 606 519
Share of positive and timely exits (in ) 511 740 366 372
Share with positive situation after six
months (in )
576 521 562 60
Reduction in youth unemployment (in
-points)
37 121 145 62
Reduction in NEET rates (in -points) 11 42 43 18
Note This table shows cluster means (averages) for a cluster analysis solely based on the authorsrsquo measures
of performance (see section 35 for their description) The analysis creates Cluster A (AT BE DK IT LT LU
and SE) Cluster B (BG HU and MT) Cluster C (EL ES HR IE PT and SK) and cluster D (CY CZ DE EE FI
FR LV NL PL RO SI and UK)
The Youth Guarantee in light of changes in the world of work Youth Guarantee Intervention Models Sustainability and Relevance
58
HOW TO OBTAIN EU PUBLICATIONS
Free publications
bull one copy
via EU Bookshop (httpbookshopeuropaeu)
bull more than one copy or postersmaps
from the European Unionrsquos representations (httpeceuropaeurepresent_enhtm)
from the delegations in non-EU countries
(httpeeaseuropaeudelegationsindex_enhtm)
by contacting the Europe Direct service
(httpeuropaeueuropedirectindex_enhtm) or calling 00 800 6 7 8 9 10 11 (free-
phone number from anywhere in the EU) () () The information given is free as are most calls (though some operators phone boxes or hotels may charge you)
Priced publications
bull via EU Bookshop (httpbookshopeuropaeu)
Priced subscriptions
bull via one of the sales agents of the Publications Office of the European Union
(httppublicationseuropaeuothersagentsindex_enhtm)
doi 102767371432
KE-0
1-1
9-1
28-E
N-N

The Youth Guarantee in light of changes in the world of work Youth Guarantee Intervention Models Sustainability and Relevance
8
Figure 2 Rates of young people (15-24 years old) not in employment educa-
tion or training (NEET) in EU Member States 2015 2017
Source Authorsrsquo illustration based on latest available Eurostat data annual averages Countries are in order of
the 2015 rates
In addition to these aggregate statistics the difficulties for youth in the STW transition
can be related to several structural challenges or market failures In particular these
concern (a) Labour market segmentation ndash a labour market pattern in which young
people are over-represented in temporary part-time non-permanent work (b) (under-)
performance of the education and training system ndash the low achievement of a substantial
section of youth in basic and lsquotransversalrsquo (transferable) skills (c) the limited availability
of lsquoqualityrsquo work experience and (d) insufficient capacity of the Public Employment Ser-
vice (PES) to ensure effective provision of tailored services and support for young people
(see European Commission 2017a)
12 The Youth Guarantee
The significant challenges that young people face in relation to fast smooth and effec-
tive STW transitions were exacerbated during and after the recession Since then they
have also acted as a catalyst for policy change in many Member States Accordingly a
YG was introduced following the 2013 Council Recommendation (Council of the European
Union 2013) Together with associated structural reforms of vocational education and
training (VET) and activation policies that are implemented across the EU its aim is to
address these challenges More specifically following a proposal from the European
Commission all Member States adhered to the establishment of the YG committing
themselves to giving every young person a good-quality offer of employment continuing
education or an apprenticeship or a traineeship within a period of four months of be-
coming unemployed or leaving formal education (Council of the European Union 2013)
The idea of YG style policies originated in the Nordic countries where such initiatives
were first implemented in Sweden in 1984 and then elsewhere in the 1990s (Norway in
1993 Denmark and Finland in 1996 see for example Escudero and Loacutepez Mourelo
2017)
In a Communication published three years after the launch of the YG by the European
Commission (2016a) it was observed that the YG had become a reality across the EU
Starting from January 2014 14 million young people had already registered in YG
schemes by 2016 Around nine million young people had taken up an offer the majority
0
5
10
15
20
25N
L
DK
DE
LU SE CZ
AT LT SI
MT LV FI EE PL
UK PT
HU
EU2
8 FR BE SK IE CY ES EL HR
RO
BG IT
2015 2017
The Youth Guarantee in light of changes in the world of work Youth Guarantee Intervention Models Sustainability and Relevance
9
of which were offers of employment almost two thirds of young people who left the YG
in 2015 took up an offer of employment education traineeship or apprenticeship While
the Commission Communication also concluded that the YG has significantly facilitated
structural reforms and innovation in policy design across Member States it also asserted
that nonetheless youth unemployment remained unacceptably high and many chal-
lenges still need to be addressed by Member States
13 Outline of the project and the present report
The main objective of this project is to undertake an up-to-date review of the current
approaches and implementation of the YG especially in view of new challenges for youth
in the changing world of work thereby providing the basis for a future YG model that is
both robust and dynamic
This report constitutes the first phase of the research project In the first phase a com-
prehensive desk review of existing documents and data was undertaken together with
the construction of a database of indicators for a cluster analysis as well as supplemen-
tary country case studies This approach is explained and implemented throughout this
report Aspects that guide the analysis are 1) the degree to which EU financing helped
to implement the YG 2) whether the YG became a sustainable part of national policy
making 3) the main challenges faced by young people in their transition into the labour
market 4) the heterogeneity of the NEET population 5) the design and implementation
features of the YG and 6) the role of apprenticeships in the YG Based on these insights
a typology of YG models is developed and the correlation of these types is assessed re-
garding measures of performance
The second phase of the research project will address the emerging challenges for young
peoplersquos transition into the world of work drawing extensively on consultation with
stakeholders both through an online survey and more importantly through a stakehold-
er seminar held in Brussels on Oct 1 2018 during which experiences with the YG were
exchanged and future challenges identified and discussed The results of this second
phase will be published in a separate report2 Together these two reports should inform
reflection on further developments of the YG
The report at hand is structured as follows Section 2 has two parts the first part identi-
fies the main characteristics of YG implementation in context while the second part de-
fines empirical indicators for these characteristics and their sub-dimensions In section 3
these indicators are used for constructing a typology of YG models also showing how the
different types of models differ regarding performance indicators Section 4 presents the
conclusions of the analysis
2 European Commission (forthcoming) The Youth Guarantee in light of changes in the world of work Emerging challenges related to young peoplersquos transition in the labour market
The Youth Guarantee in light of changes in the world of work Youth Guarantee Intervention Models Sustainability and Relevance
10
2 Implementation features of the YG and related indica-
tors
This section provides a comprehensive overview of the main features that characterise
YG implementation and assess the main features that are likely to determine its success
in Member States It has two steps first section 21 gives an overview of the relevant
dimensions of YG implementation along the six guiding aspects outlined above Based on
this characterisation section 22 discusses the ways in which each of these aspects can
be represented by a set of empirical indicators and which will be used in chapter 3 for a
YG typology The list of indicators for each of the six aspects comprise key contextual
characteristics for each Member State as well as implementation-related features such as
partnerships created as a result of YG implementation or the types of interventions
used In particular indicators that characterise Member States at the outset of the YG
(measured in 2012 or 2013) as well as the way the YG was implemented (mostly meas-
ured up until 2016) inform the typology Indicators of YG performance such as for ex-
ample the estimated proportion of the NEET population reached by the YG (the so-called
YG ldquocoverage raterdquo) are considered outcomes of the way Member States implemented
the YG
The presentation and discussion of intervention features and corresponding empirical
indicators in section 2 is complemented by selected information from five brief country
case studies The case studies are a supplementary element in the review exercise that
feeds into this chapter and they are meant to illustrate the intervention features dis-
cussed throughout the chapter in more detail for selected countries Based on an lsquoex
ante assessmentrsquo of a set of qualitative and quantitative country indicators the following
five countries were selected for case studies Austria Denmark Ireland Italy and Lat-
via The countries were selected firstly to cover (to the extent that is possible) the ex-
isting types of STW regimes and secondly to reflect the heterogeneity of the NEET popu-
lation NEET implementation is characterised by high and low NEET and youth unem-
ployment rates high and low YG coverage and the financial resources put into its im-
plementation3
21 Features of Youth Guarantee implementation
211 Financial resources for implementing the Youth Guarantee
The YG is not a funding programme in itself It is instead a political commitment sup-
ported among other ways by financial contributions from the EU and national budgets
as well as contributions from the private and non-profit sectors This section on the first
YG implementation aspect financial resources briefly outlines the relevance of these
different sources Specific focus will be given to the Youth Employment Initiative (YEI)
and the European Social Fund (ESF) as the main EU sources to financially underpin the
implementation of the YG
Youth Employment Initiative The YEI was established during three informal summits of
EU Heads of State in 2013-14 and then given euro32 billion for the 2014-15 period Eligi-
bility for measures funded through the YEI is confined to young people aged 16-254 who
3 It is important to emphasise the lsquoex-antersquo nature of case study selection they were chosen based on a preliminary set of indicators at the outset of the study whereas the full in-depth identi-fication and discussion of indicators ndash as presented in this chapter ndash and their analysis in Chapter 3
becomes a key element of the study itself 4 The upper age band is 29 in some Member States
The Youth Guarantee in light of changes in the world of work Youth Guarantee Intervention Models Sustainability and Relevance
11
are not in employment education or training (lsquoNEETsrsquo) Funding from the YEI was only
allocated to regions in those Member States where youth unemployment was higher than
25 in 20125 Since national allocations are based on the number of unemployed young
people in 2012 in these regions YEI funds were allocated to a varying extent to each
Member State based on their (regional) unemployment rates (European Commission
2016a) Spain was the largest recipient of the initial YEI specific allocation receiving
euro9435 million and Slovenia the smallest receiving euro92 million In 2015 in view of the
immensity of the youth-employment challenge the European Commission took steps to
ensure a quick mobilisation of its funds6 Specifically a higher pre-financing rate for the
euro32 billion YEI specific allocation in 2015 than for other ESF allocations (30 instead of
the original 1-15 of the specific allocation for other ESF funds) was introduced
This led to an amount of around euro1 billion in additional pre-financing to Member States
in 2015 (European Commission 2016a) In the summer of 2017 during the mid-term
review of the EUrsquos seven-year budget the YEI was extended until 2020 and it received
an additional financial allocation of euro12 billion In addition it was targeted at regions
where youth unemployment still exceeded 25 in 2016 (Andor and Veselyacute 2018) Ac-
cording to the Commissionrsquos report in October 2016 the YEI is seen by Member States
as a key mechanism through which to operationalise national Youth Guarantee schemes
ldquoIn some cases the YEI is being used to support most or all measures planned under the
YG schemes while in others it is one funding source amongst others Countries where
large shares of YG funding comes from the YEI include Lithuania ndash where 23 of all YG
actions are supported by the YEI Poland ndash where 34 of all YG actions YEI funded and
Spain ndash where 80 of all YG actions are funded through the YEIrdquo (European Commis-
sion 2016b p89)
YEI funds were provided from the EU budget as a top-up to the already available ESF
funds for 2014-2020 to provide additional support for programmes with a specific focus
on NEETs (European Court of Auditors 2017) However the funding allocated to each
Member State under the YEI has to be matched by an equal amount from the respective
Member State allocations in the ESF 2014-20 budget This holds for the initial allocation
in 2013 as well as the additional funds in 2017 Hence the total budget of the YEI (for
all eligible EU Member States) now totals euro88 billion for the period 2014-2020
European Social Fund In addition to ESF funds that were directly used to match the YEI
contributions (see above) some Member States also utilised additional funds from the
ESF for further employment-related programmes7 directly or indirectly benefiting youth
but with no specific focus on NEETs In contrast to YEI funds which are intended to di-
rectly support NEETs ESF funds may also be used to support structural reforms In total
Andor and Veselyacute (2018) estimate that approximately euro14-15 billion from the EU budget
over the period 2014-20 financed the implementation of the YG through the YEI and ESF
5 The exact methodology for allocating Youth Employment Initiative funds among Member States is set out in Annexe VIII to the lsquoCommon Provisions Regulationrsquo ie Regulation (EU) No 13032013 of 17 December 2013 OJ L 347 20122013 p 320ndash469
6 An additional reason was that many Member States ldquoraised the issue that they dont have the national budget necessary to pay advance funding to projects working with young peoplerdquo (source httpeuropaeurapidpress-release_MEMO-15-5020_enhtm)
7 The ESF is Europersquos main instrument for supporting jobs helping people get better jobs and en-suring fairer job opportunities for all EU citizens (European Parliament 2018)
The Youth Guarantee in light of changes in the world of work Youth Guarantee Intervention Models Sustainability and Relevance
12
funds8 This is a significant share of the total ESF funding of euro864 billion available to MS
for the 2014-2020 period (including the YEI)
Country case study Austria
Young people in Austria were already benefiting from special attention before the intro-
duction of the YG Several measures were set up to facilitate the transition from educa-
tion to the labour market in particular through a well-established apprenticeship sys-
tem Reducing the age for early school-leaving existed before the 2013 Council Recom-
mendation The long-standing existence of policy measures for young people is reflected
in Austriarsquos relatively successful performance as regards youth employment and STW
transition The labour market situation of young people in Austria is better than the EU
average and it continues to improve The rate of youth unemployment (15-24 years old)
went down from 106 in 2015 to 98 in 2017 which is significantly below the EU
average (168) This good performance is also reflected in the number of NEETs The
NEET rate in Austria was at 65 in 2017 well below the EU average (109)
In addition evidence shows that Austria is performing better than the rest of the EU as
regards its YG implementation (European Commission 2018a) It is acknowledged that
Austria has established a comprehensive Youth Guarantee based on effective partner-
ships targeted policy measures and a robust monitoring system with interconnected
administrative data (European Commission 2016a) The countryrsquos performance is par-
ticularly outstanding in two dimensions the NEET coverage and the delivery of a good
quality offer
Data for 2016 shows that an estimated 829 of NEETs in Austria are reached by the
YG which is the highest figure amongst Member States and almost double the EU aver-
age (425)9 In addition this ldquocoverage indicatorrdquo has been at consistently high levels
since the start of the YG A second more suggestive but somewhat less reliable way of
looking at the performance of a YG scheme is trying to estimate the rate of recycling
ie the percentage of NEETS entering the YG with previous YG experience10 This recy-
cling rate is rather high in Austria (739 compared to 341 for EU 28) suggesting
that employment services have little difficulty in lsquostaying in touchrsquo with young people
who already had a YG experience
The Austrian YG provides a wide range of offers (European Commission 2016d) It
comprises apprenticeship traineeship education and employment offers that are tar-
geted specifically at young people such as for example supra-company apprentice-
ships or production schools Additionally the general education training apprenticeship
and employment offers are open to young people
At the same time it is to be noted that Austria still faces difficulties in integrating cer-
tain sub-groups into the labour market in particular women migrants and young peo-
8 This figure is slightly higher than the euro127 billion stated by the Commission in its October 2016 report which YEI and the ESF are directly investing in ldquolabour market integration measures for young people in the programming period 2014-2020rdquo (European Commission 2016a p 12)
9 These figures are based on the indicator average annual stock of young people in the YG pre-paratory phase NEET population (annual average) included in the Indicator Framework for Moni-toring the Youth Guarantee This indicator combines administrative and survey data Whilst this is
not ideal the indicator is useful to give an approximate indication of the proportion of NEETs regis-tered in the YG scheme at any point during the year Results should therefore be interpreted as an estimation rather than a definitive measurement of the extent to which YG schemes achieve the objective of reaching all young people that become or are already NEET
10 The recycling rate is only experimental data and not officially part of the YG monitoring dataset
The Youth Guarantee in light of changes in the world of work Youth Guarantee Intervention Models Sustainability and Relevance
13
ple with low skills (European Commission 2018a) Ongoing efforts for these target
groups need to be intensified as recent measures have not led to sufficient results yet
Other EU sources Several other EU budget lines support employment- and education-
related programmes in Member States including the European Regional Development
Fund (ERDF) the ERASMUS programme as well as Horizon 2020 and the European Glob-
alisation Adjustment Fund (EGF) For an analysis of their job-creation potential and their
relation to the ESFYEI see European Parliament (2018) In addition a range of smaller
EU programmes finance employment-related measures for (young) people such as the
European Solidarity Corps or the EU Programme for Employment and Social Innovation
(EaSI)11
Three aspects deserve to be highlighted regarding differences across Member States in
financing the implementation of YG activities
First as the 2017 European Court of Auditors report on ldquoYouth unemployment ndash have EU
policies made a differencerdquo highlights the level of YEIESF funding available would only
address a small proportion of the required amount for the full implementation of a YG
Member States therefore need to leverage significant additional resources from national
budgets to achieve this goal However so far there has been ldquono assessment of cost
and available funding by Member Statesrdquo (European Court of Auditors 2017)
Second the extent to which the YEIESF funds simply financed youth-related schemes
that already existed prior to the YG is unclear They may be funded either by other EU
schemes or Member State national budgets The European Court of Auditors states that
YEIESF should ldquonot replace public or equivalent expenditure by the Member Statesrdquo
(ibid) However the Commission notes in its reply to the report that the YEI provisions
do not deny to Member States finance for measures previously supported by the national
budget or measures that require Member States to increase public spending regarding
certain types of measures or target groups At the same time the European Court of
Auditors analysis of seven Member Statesrsquo Operational Plans for the YEIESF showed that
ldquo[hellip] the majority of the measures which were to receive YEI financing already existed
prior to the introduction of the Youth Guarantee [hellip]rdquo (ibid p 54) In fact even in 2011
the Youth Opportunities Initiative proposed by the European Commission (2011) allowed
the governments of Member States to make increased use of the ESF for promoting
youth employment (Tosun et al 2017) The degree to which additional funds under the
YEIESF actually presented additional funds for Member States may therefore vary
greatly and there is without doubt also some variation in Member States as to whether
this caused them to step up their efforts regarding youth employment
Third despite the frontloading of the YEI in 2017 take-up of the YEI developed slowly in
its early phases of implementation (European Parliament 2017b) According to Andor
and Veselyacute (2018) two aspects delayed the implementation of the YG in the start from a
financial perspective firstly it took Member States and the Commission time to design
and review the lsquoOperational Programmesrsquo (OPs) specifying how YEI and ESF money
would be used Most of the Operational Programmes were only approved in late 2014 or
even in 2015 Secondly several Member States had accumulated delays in absorbing EU
structural funds for 2007-13 Hence they focused their efforts on implementing these
schemes in order not to lose these allocations (due to the so-called de-commitment
11 For instance one of the aims of the EaSI programme is to enhance mobility via the ldquoYour first Eures jobrdquo As these programmes are rather small in scale and not directly linked to the YG the study does not provide a detailed overview (see European Parliamentary Research Service 2017)
The Youth Guarantee in light of changes in the world of work Youth Guarantee Intervention Models Sustainability and Relevance
14
rule) Only afterwards did they move on to use YEI funding An assessment commis-
sioned by the European Parliament concluded that most delays that limited the impact of
the increased pre-financing were due to procedural rather than financial problems (Euro-
pean Parliament 2017b)
212 The Youth Guarantee as part of national policy-making
A variety of aspects may be used to determine the degree to which the YG has become a
part of national policy making and hence whether the changes introduced by the YG are
likely to be sustained over time The following discussion focuses on three measurable
factors related to the sustainability of YG-related policy changes Firstly whether the
Council Recommendation has spurred on Member States to introduce youth-related la-
bour-market reforms rather than merely set up an additional offer of active labour mar-
ket measures Secondly whether Member States have introduced monitoring and evalu-
ation systems to assess the effectiveness of YG-related measures Thirdly to find the
degree to which Member States have attempted to build up (lasting) partnerships be-
tween all relevant stakeholders (such as public and private employment services gov-
ernment authorities education and training institutions and so on)
The introduction of youth-related labour-market reforms the first key factor reflects
whether Member States have attempted to embed the main guidelines of the Council
Recommendation in their national policies In particular whether Member States have
used the political momentum created by the YG to introduce structural reforms to mod-
ernise their overall labour market policies in support of young people Such reforms con-
cern the functioning of the labour market (its institutional and regulatory framework)
and are aimed at better matching supply with demand The implementation of structural
reforms can be considered a key determinant as to whether the YG can have a long-
term sustainable impact in Member States beyond the YEI and the ESF funding associ-
ated with the YG
Information on the nature and intensity of youth-related active labour market policy re-
forms provided in the LABREF database indicates that EU Member States are imple-
menting the Recommendationrsquos policy guidelines unevenly Figure 3 displays the number
of active labour market policy reforms between 2013 and 2016 across Member States
The figure indicates for instance that virtually all Member States implemented addition-
al ALMP reforms for youth and that several Member States ndash such as Bulgaria France
Latvia Lithuania and Greece ndash have a relatively broad scope of reforms
Figure 3 Absolute number of youth-related active labour market reforms be-
tween 2013 and 2016
Note This figure shows the absolute number of youth-related active labour market policy reforms in the EU
Member States between 2013 and 2016 Identification of youth-related reforms is done via the indicator ldquoIs
the measure targeted at young peoplerdquo in the LABREF database
0
2
4
6
8
10
NL SI CZ
DE
LU FI HR
DK IE UK
AT PL
BE EE MT
RO SK ES HU CY IT PT SE BG FR LV LT EL
The Youth Guarantee in light of changes in the world of work Youth Guarantee Intervention Models Sustainability and Relevance
15
The introduction of monitoring and evaluation systems the fifth principal element in the
Council Recommendation on the YG and the strict reporting guidelines were aimed at
fostering a culture of policy analysis Despite the additional administrative burden asso-
ciated with reporting activities requiring Member States to obtain administrative data on
in- and outflows from the YG as well as follow-up data the creation of a monitoring and
evaluation system is one of the effects that people in charge of implementing the YG at
the country level have recognised as being positive12 In fact many Member States did
not have specialised monitoring systems allowing to track youth on the labour market
and in education and evaluate activation measures for youth before the Council Rec-
ommendation
At the same time the capacity of countries to monitor what happens to young people
after leaving the YG and the corresponding data quality varies in fact a substantial
share of Member States do not know about young peoplersquos reasons for exiting either the
YG or the labour market nor do they register the educational status of previous partici-
pants after they exited This issue is most likely due to a pre-YG lack of policy evaluation
culture or a lack of capacity to collect data An additional aspect to consider in this re-
gard is whether Member States attempted to evaluate the effectiveness of specific
measures under the YG using rigorous impact evaluations The EU helps Member States
conduct impact evaluations on interventions funded by the European Commission name-
ly the ESF and the YEI for example by setting up the Centre for Research on Impact
Evaluation (CRIE) which provides scientific expertise and methodological support to
Member States conducting an impact evaluation (see European Commission (2016b) for
details) Escudero and Murelo (2017) provide an overview of various impact evaluations
of pilot programmes that were set up within the context of the European YG However
there does not so far seem to be a systematic account of ongoing or completed impact
evaluations of YG instruments
Partnership approach Most Member States make a reference to the partnership ap-
proach in their YG Implementation Plan (YGIP) Table 1 shows the clear differences
based on an assessment of ten selected Member States conducted by Eurofound
(2015) In addition to the differences within countries the findings based on this sample
of ten countries also indicate that cooperation with some stakeholders seems to be more
widespread than it is with others For instance cooperation between ministries particu-
larly the ones dealing with employment and education policies is rather well developed
In comparison cooperation is less frequent with non-institutional stakeholders such as
the third sector notably NGOs social partners and youth organisations In 2016 the
European Commissionrsquos three-year assessment came to the conclusion that ldquowhile many
Member States have taken steps to support the involvement of a wide range of actors
and established institutional frameworks for partnerships the functioning of these part-
nerships remains a challenge due to problems of design which affects their ability to
deliverrdquo (European Commission 2016b p24)
In addition previous studies (eg Dheacuteret and Roden 2016) highlight the strong path-
dependency in how countries or regions apply the partnership approach While some
countries have put new structures in place to monitor the progress of the YG implemen-
tation and coordinate the work of relevant stakeholders other countries tend to have
consolidated partnerships that existed before the YG was established
12 Information collected through the interviews organised in the context of the EPC Task Force on Youth Employment The results of these interviews are further presented and developed in Dheacuteret and Roden (2016)
The Youth Guarantee in light of changes in the world of work Youth Guarantee Intervention Models Sustainability and Relevance
16
There also seems to be some discrepancy between the involvement of stakeholders in
the design implementation and monitoring of the YG In some Member States stake-
holders in the third sector particularly youth organisations reported that they were only
consulted in the design phase and never again (European Youth Forum 2018)13 Recent-
ly more positive evidence is provided by ETUC (2018) showing that the great majority
of interviewed representatives of unions was at least `somewhat satisfiedrsquo with their
degree of participation in the YG
Table 1 Overview of actors involved in implementing the YG in 10 Member
States
Min
istr
y
of
Em
plo
ym
ent
(or
equiv
ale
nt)
Min
istr
y
responsib
le
for
socia
l benefits
Min
istr
yo
rganis
ation
re-
sponsib
le for
ESFY
EI
Min
istr
y o
f Education
Min
istr
y
responsib
le
for
youth
work
Oth
er
min
istr
y
(justice
defe
nce
inte
rior
health
housin
g)
PES
(either
at
national
regio
nal or
local le
vel)
Youth
org
anis
ation (r
epre
-
senta
tive)
Local
youth
org
anis
ation
(im
ple
menta
tion)
Socia
l part
ners
Education s
ecto
r
BE XX XX X XX X XXX X X XX
BG XXX XX XX XX XX XX XX XX XX XX
EE XX X XX XXX XXX X XX XX XX X X
EL XXX X X XX X X
ES XXX
XXX
(em-ploy-ment)
XX XX XX XX XX X XX X
FR XXX
XXX (em-ploy-
ment)
XX (em-ploy-
ment)
XX XX X XX X
IE XX XXX XX XX XX XX X X X
IT XXX XXX XX XX XX XX X X XXX X
PL XX X XXX X XX X
UK XX XX (LEP)
X X XX X X
Source Eurofound (2015a)
Note XXX means authoritycoordinator XX means principal partner-stakeholders and X means associated
partnerstakeholder A distinction needs to be made in Belgium between the federal and local authori-
tyregional level social benefits are (still) the responsibility of the federal government while education and
PES are the responsibility of the regionslocal authorities Similar to Belgium in Spain many responsibilities
are delegated to the regional level LEPs - Local Enterprise Partnerships
13 Some more evidence from the European Youth Forum on involvement for a sub-set of countries can be found under httptoolsyouthforumorgyouth-guarantee
The Youth Guarantee in light of changes in the world of work Youth Guarantee Intervention Models Sustainability and Relevance
17
213 Youth labour market challenges
The third key factor of YG implementation is its contribution to and targeting of the
young peoplersquos labour market challenges Given that the recession of the late 2000s (the
lsquoGreat Recessionrsquo) and its aftermath exacerbated the difficulties that young people face
in their STW transition and labour market career this section presents a brief discussion
of these challenges and how YG interventions have sought to address them
Challenge 1 ndash Youth unemployment long-term unemployment and inactivity The Great
Recession and its immediate effects on youth unemployment ndash highlighted in section 1 ndash
also resulted in an increase in youth long-term unemployment which although gradual-
ly falling from its peak of 8 in 2013 has remained high (European Parliament 2015
European Commission 2017a) Long-term unemployment can result in well-documented
lifelong consequences and lsquoscarringrsquo effects on those young people who remain unem-
ployed for some time (Eurofound 2015b Eurostat 2015) In addition a considerable
proportion of the EUrsquos youth remain economically inactive Whereas a large share of
them are in education or training many are discouraged and have become detached
from the labour market or they have not entered it after leaving education
The macroeconomic state of the economy also affects the level of demand for young
people where employer absorption capacity in providing training places (such as appren-
ticeships) and jobs for young people may be limited (Eurofound 2015a) In addition the
highly variable youth labour market performance across the EU before during and after
the Great Recession has been attributed to many factors These include differences in
the institutional and structural set-up of Member States regarding the education and
training systems (initial) education and vocational training (IVET) labour market insti-
tutions and labour market policy (such as employment protection legislation - EPL) and
active labour market policies (ALMPs) and social welfare systems (Eichhorst et al 2013
OrsquoReilly et al 2015 Pohl and Walther 2005 Pohl and Walther 2007)
The introduction of the YG ndash and its underlying philosophy of early intervention with a
personalised approach ndash across the EU sought to address the issue of rising youth un-
employment including long-term unemployment and inactivity (Eurofound 2015a Eu-
ropean Commission 2016a) The YG approach precisely addresses these challenges
providing unemployed inactive youth with a short-term activation and a perspective in
employment or education
In the five years since the launch of the YG youth unemployment rates have improved
considerably as highlighted in section 1 (see also for example the European Commis-
sion 2018g Eurostat 2018) Although this development is partially attributable to the
recovery from the Great Recession according to the European Commission this is also
partially due to the YG together with the effect of the Youth Employment Initiative (YEI)
(European Commission 2018g)
Challenge 2 ndash Labour market segmentation A key challenge facing youth is labour mar-
ket segmentation often resulting in young people being over-represented in temporary
or part-time forms employment in particular involuntary part-time casual a-typical or
precarious work (European Commission 2017a 2017g and 2018i Eurostat 2015 and
2018) Although such non-standard forms of employment have increased for all age
groups the more recent cohorts of younger workers have been particularly adversely
affected (European Commission 2017g) Specifically although in 1995 23 of younger
workers in the then EU 15 were on non-standard contracts by 2016 this proportion had
increased to 32 for the same age group (European Commission 2017g)
This trend is reflected across the EU 28 where over the last decade non-standard forms
of employment among younger workers rose from 26 to 29 with 35 million fewer
The Youth Guarantee in light of changes in the world of work Youth Guarantee Intervention Models Sustainability and Relevance
18
employees on permanent full-time contracts and 12 million more on non-standard con-
tracts (European Commission 2017g) Moreover younger workers in 2016 were still
more than twice as likely to be working full-time on temporary contracts (12) than
workers in their prime and older workers (5) (European Commission 2017g)
In general young people are more likely to find themselves as labour market lsquooutsidersrsquo
with little access to permanent contracts with high levels of employment protection and
workersrsquo rights especially compared to their older counterparts (European Parliament
2015 European Commission 2017a 2017g and 2018j) Since access to stable employ-
ment with positive career prospects matters young peoplersquos successful transition into
fully independent lives is one of the primary objectives of the YG (Council of the Europe-
an Union 2013 Eurofound 2014)
The degree of lsquodualismrsquo of labour markets varies across Member States recent analysis
suggests that four in ten European young people are on temporary contracts rising to
over 60 in many Southern and Eastern European countries (European Court of Audi-
tors 2017) While temporary employment can either be a lsquostepping stonersquo or a lsquotraprsquo in
terms of STW transitions recent data suggests that the former is rarely the case (Euro-
pean Commission 2015 2017a and 2017g) the average proportion of temporary work-
ers transitioning into permanent employment fell from 28 in 2007 to 23 in 2013
This however masks major country variations ranging from 10 in France to for ex-
ample 65 in Estonia (ibid)
Predictably when studying age groups the probability of moving from temporary to
permanent contracts over one year is lowest for young people aged 15-24 (European
Commission 2016g) However it is worth noting that transition rates from temporary to
permanent contracts among young people have recently either increased or remained
stable in most Member States where data are available (European Commission 2017g)
In most Member States these rates are still lower than 20 and in countries such as
Poland and Greece temporary employment lsquohas almost no stepping-stone functionrsquo (Eu-
ropean Commission 2017g) Countries such as France and Spain with highly segmented
labour markets and high shares of (young) workers on fixed-term contracts have been
also characterised by low transition rates towards permanent employment (European
Commission 2017h Eurofound 2013a and 2013b)
Country case study Ireland
Ireland was one of the EU countries most adversely affected by the Great Recession
which resulted in high levels of youth unemployment As a result addressing youth
unemployment especially long-term unemployment has been a key challenge (EEPO
2015) The youth unemployment rate more than tripled from about 10 in 2008-09 to
a peak of just over 33 in mid-2012 (DSP 2014a) Likewise the NEET rate for those
aged 15-24 was 18 in 2014 although the picture is more nuanced especially in re-
lation to inactive NEETs (DSP 2014a) Specifically excluding students and the young
unemployed inactive NEETs account for a relatively small proportion (about 3) of
the youth population (DSP 2014a EEPO 2015) Most tend to be lone parentscarers
(60) and people with a disability (20) (DSP 2014a EEPO 2015) Thanks to Ire-
landrsquos universal means-tested unemployment benefit system for those aged over 18
the vast majority of young NEETs are registered with the benefitsemployment service
(EMCO 2017)
Against this background the Youth Guarantee (YG) has two target groups (i) poorly
qualified young people aged under 18 who are in turn provided with a quality second-
chance educationaltraining pathway outside the school system (for example
Youthreach) or are supported in re-entering the school system and (ii) unemployed
The Youth Guarantee in light of changes in the world of work Youth Guarantee Intervention Models Sustainability and Relevance
19
young people aged 18-24 with a particular focus on long-term unemployed youth
(EEPO 2015 Stokes 2016) To this end the YG offer is quite comprehensive and
comprises a number of programmes ndash some pre-existing (for example the JobBridge
internship programme) and others such as the First Steps Youth Developmental In-
ternship Programme (for the most disadvantaged young people) and JobsPlus Youth
(an employer subsidy scheme) introduced as part of the YG (DSP 2014a Leigh-Doyle
2014 Treadwell Shine 2016)
The delivery of the Irish YG seems to be integrated within the overall policy approach
towards youth employment with most measures aimed at young jobseekers predating
its introduction (DSP 2016a) This embedding of the YG within the existing youth em-
ployment policy framework means there is a close alignment between the two Indeed
Irelandrsquos YG builds upon existing services and programmes but it crucially entails ear-
lier intervention for and a tailored approach to the young unemployed with a strong
focus on enhancing processespolicies to help the young unemployed enter sustainable
employment receive appropriate training andor gain relevant work experience (DSP
2014a Treadwell Shine 2016 DohertyDSP 2018) YG-related partnership arrange-
ments are also situated within the main policy making process which in turn means
that the implementation of the YG is policy based as opposed to project based
(ESFYEI) (EMCO 2017) As such the YG and associated measures are likely to be
sustained over time
Ireland has made notable progress in implementing the YG with a substantial reduc-
tion in the number of unemployed youth In general there has been intensified en-
gagement with young people while access to different programmes has been enhanced
and partnerships strengthened (European Commission 2018a) Evaluations of YG-
related programmes such as the Tuacutes and Job-Bridge work placementinternship pro-
grammes have shown positive outcomes (Leigh-Doyle 2014 Indecon 2016 Depart-
ment of Education and Skills 2016) The Irish YG seems to be quite successful in de-
livering sustainable outcomes which indicates that the offers provided are of good
quality (European Commission 2018a)
However a number of challenges remain For example the uptake of key measures
such as JobsPlus Youth and the First Steps Youth Development Internship has not
been as extensive as it could in view of the youth cohort concerned and there is also
a lack of sufficient training places (DSP 2016a European Commission 2017f) Em-
ployer engagement particularly in the provision of employment opportunities for the
most disadvantaged youth also remains a challenge as does the timeliness of YG of-
fers (European Commission 2017f and 2018a EMCO 2017)
In principle one response to the challenge of labour market segmentation would be
structural reforms such as for example the reforms Spain implemented in the aftermath
of the crisis Given that the YG was implemented at the height of the recession most
Member States focused on a ldquowork firstrdquo approach to give short-term relief to unem-
ployed young people specifically the implementation of subsidised employment pro-
grammes many specifically targeted at young people at risk has been quite common
across the EU and hiring incentives have featured prominently in many YG plans (Euro-
pean Commission 2018h) Many of these programmes involve incentives such as wage
subsidies aimed at encouraging employers to offer employment to young people
In general countries promoting employment offers under the YG use a form of employ-
ment subsidy which typically involves supplementing the individual labour costs of the
person employed over a fixed period whilst the majority of the labour costs remain cov-
ered by the employer (European Commission 2018h - See Annex Points 9 and 10)
The Youth Guarantee in light of changes in the world of work Youth Guarantee Intervention Models Sustainability and Relevance
20
These wage subsidies also play a crucial role in many countries (including Belgium
France Estonia Greece the Netherlands Poland Spain Sweden and Denmark) in facili-
tating the acquisition of work experience andor entry in their first job by young people
and this especially helps young people from disadvantaged backgrounds (Eurofound
2013b 2016 and 2017 European Commission 2018d and 2018h) In addition the
broader set of labour market reforms accompanying the YG (see previous subsections)
has contributed to addressing labour market dualism in many Member States
Challenge 3 ndash Poor performance of education and training systems (including skills mis-
matches and the limited availability of quality work experience) Another key structural
challenge is given by an unsatisfactory performance in the education and training sys-
tems including VET this means that young people do not have appropriate education
when they graduate and when they enter the labour market which in turn exacerbates
skills mismatches and adversely affects their employability (for example Quintini et al
2007 Quintini and Martin 2014) Indeed the mismatch between (youth) labour supply
and demand seems to be a growing challenge for instance there is growing concern
about graduate under-utilisation and the fact that that higher education graduates expe-
rience considerable and persistent occupational vertical skills mismatch (234 in 2016)
by working in jobs typically requiring a lower level qualification (European Commission
2017c) However it is also worth pointing out that higher education graduates have bet-
ter employment rates (828) than young people with upper secondary education quali-
fications (726) (European Commission 2017c)
Another major challenge in light of rapid and constant technological change relates to
the need for effective skills anticipation against the largely unknown future evolution of
work and work organisation This is in turn is closely related to the need to ensure that
the education and training systems across the EU respond accordingly by being lsquoagilersquo
and by equipping young people with relevant skills including lsquodynamicrsquo skills such as
adaptability resilience and career management skills This concern was also reflected in
the latest European Commissionrsquos report on Employment and Social Developments in
Europe according to which ldquomuch will depend on whether or not education and training
systems are agile enough to respond appropriately to fast-changing technological oppor-
tunitiesrdquo (European Commission 2018g)
In recent years there has been a concerted effort to reform or strengthen education and
training systems including vocational education and trainingapprenticeships and their
role in STW transitions Indeed extensive VET reforms are currently being implemented
in many EU countries (for example Croatia Cyprus Estonia Greece Finland France
Ireland Italy Poland Spain Sweden and the United Kingdom) ndash instigated to some ex-
tent by the YG These reforms seek to improve the labour market relevance quality and
attractiveness of VET together with an effort to develop a VET system often along the
lines of the German dual training system which combines time spent at school with time
spent in the workplace In addition many reforms of VET systems often associated with
the YG have sought to create closer links with the labour market (European Commis-
sion 2018c)
In addition a range of other educational measures offered under the YG has aimed to
bring young people with low levels of skills and qualifications back to education and
training These measures are summarised by the term lsquocontinued education offersrsquo (Eu-
ropean Commission 2018l) These continued education offers are set up to provide
young people with the chance to re-enter the regular education and training system to
move on to a higher-level qualification Alternatively ALMPs bridging courses or second
chance education programmes can also equip early school-leavers and low-skilled youth
The Youth Guarantee in light of changes in the world of work Youth Guarantee Intervention Models Sustainability and Relevance
21
with the skills and qualifications needed for an initial (and targeted sustainable) labour
market integration
214 The heterogeneity of the NEET population
The fourth key aspect of YG implementation assessed in this report concerns the way in
which the YG has addressed the heterogeneity of the NEET population Due to its diversi-
ty the NEET population in the EU can be divided into sub-groups According to Euro-
found (2016) the NEET can be categorised firstly by their activity status ndash those who
are available to the labour market or educational opportunities are counted as active
while the rest is classified as inactive The former group consists of short- and long-term
unemployed individuals and those soon to return to education or employment the latter
group includes people with illness or disability individuals with family responsibilities and
lsquodiscouragedrsquo workers Throughout this report the phrase lsquodiscouraged workersrsquo refers to
people who simply stopped searching for employment or education opportunities
Data from the EU Labour Force Survey from 2013 (also used in Eurofound 2016) pro-
vides an indication about the labour-market attachment of NEETs in Europe before the
YG was implemented Among the active NEETs the largest proportion of 15-24-year-old
NEETs were short-term unemployed (298) Long-term unemployed youth made up
about 22 of the NEET population while returnees into work or education accounted for
roughly 8 of NEETs Among those considered inactive the largest share corresponds to
individuals with family care responsibilities (154) Individuals with illness or disability
made up 8 of the NEET population Discouraged workers accounted for almost 6 of
NEETs and 125 were NEETs for other reasons Consequently around 60 of the
NEET population were neither in education employment nor training for labour market
related reasons (the unemployed the discouraged workers and the returnees) and
around 40 were NEETs for other reasons
Furthermore NEETs can be categorised by their educational attainment as subgroups
with lower education are at a much higher risk of being in a vulnerable position This can
be seen by the fact that less educated youth are overrepresented among the NEETs As
of 2014 44 of NEETs aged 15-24 had completed an lsquoupper secondaryrsquo education
closely followed by 43 with a lsquolower secondaryrsquo education and only 8 of NEETs had
tertiary education or a degree (Eurofound 2016)
These sub-groups have diverse needs and are therefore likely to benefit from different
types of policy responses regarding interventions and they may require additional out-
reach efforts Most importantly those furthest away from the labour market are most
likely to be in substantial need of outreach activities One important factor here is their
point of access to the YG While other entry points exist access is often governed by
PES In all EU countries except Malta the PES plays a role in registering people for the
YG Among other determinants the extent to which the PES are able to actually reach
the NEET population also depends on their responsibilities for administering and paying
(unemployment) benefits According to European Commission (2017b) only three PES
are responsible for administering other types of benefits aside from (mostly insurance-
based) unemployment benefits (Lithuania Luxemburg and Slovakia) These types of
benefits tend to exclude youth due to their limited length of work experience reducing
the scope for outreach without further intervention Indeed the registration of NEETs
with the PES was somewhat limited at the onset of the YG (Eurofound 2016) However
many PES have launched substantial outreach activities to make up for this EC (2017a)
shows that roughly 46 of PES make use of new media for their outreach work 39
provide mobile services and about 43 have specific outreach caseworkers Moreover
The Youth Guarantee in light of changes in the world of work Youth Guarantee Intervention Models Sustainability and Relevance
22
46 of PES have created a one-stop-shop type of framework to enhance their degree of
outreach (eg this includes Belgium Finland and the United Kingdom ibid)
Country case study Italy
Italy is a country with a relatively rigid labour market despite the recent reforms aimed
at increasing the degree of labour market flexibility Moreover the Italian education
system endows youth with a relatively high level of general education but with few
work-related skills which dramatically slows down their transition to a job (Pastore
2018) Along with their relatively large number of early school-leavers this helps ex-
plain their 347 youth unemployment rate in 2017
The lack of previous experience with the YG framework and the dramatically low rate of
job-finding ndash ranging from 11 to 18 in the 2010s ndash represented another obstacle to
successfully implementing the YG According to Pastore (2015) macro- and micro-
economic obstacles should have been overcome to make the programme work at its
best Economic growth has been sluggish at least from the early 1990s which would
normally have reduced the pace of job creation and forced young people into more edu-
cation and training rather than employment Moreover public and private employment
services could count only on human resources which were scant in both quantitative and
qualitative terms as they had a low share of university graduates (ANPAL 2018)
The number of ANPAL staff has been reduced in recent years and as financial resources
for paying for an increase in the number of staff are scarce improvement has been
sought by implementing important reforms such as the `legislative decree 1502015rsquo of
the so-called Jobs Act package (ANPAL 2018) This reform introduced lsquoquasi-marketsrsquo
in the management of employment services the NEETs are profiled by PES and then
assigned a voucher for a different amount according to their lsquoneed bandrsquo NEETs can
spend vouchers in the PES andor with private (for profit or non-profit) employment
agencies to buy the services they need However so far the reform has not been fully
implemented partly due to the lack of financial resources (ibid)
Further problems with the implementation of the YG has been due to the reallocation of
competences in the PES from provinces to regions and the establishment of a national
agency (ANPAL) to coordinate the work of regional entities which detracted from the
full implementation of the YG (ANPAL 2018)
The Italian YG scheme has also managed to improve its monitoring system of the indi-
viduals involved the activities done and their level of absorption into the labour market
when the programme is completed The last monitoring report available shows that of
about 15 million registered NEETs 13 million had the prescribed requirements About
one million were actually profiled of which about a half were given some completed
form of assistance About 60 underwent on-the-job training 23 benefited from sub-
sidised employment 123 received off-the-job training 23 received some form of
placement services 16 did voluntary service in the third sector and a small number
received support for self-employment About six months before completion of the pro-
gramme 479 of recipients were in work and 692 had experienced at least one
employment spell (ANPAL 2017)
A few recent evaluation studies provide a full assessment of regional programmes and
show that on-the-job training is effective in confirming the importance of providing
young people with work-related competences (for example see Ghirelli et al 2019)
Despite these efforts monitoring data on the Youth Guarantee for 2016 shows that in
the EU as a whole an estimated 385 of the NEET population were registered in YG
schemes in the year 2016 Although some Member States are doing much better (cover-
The Youth Guarantee in light of changes in the world of work Youth Guarantee Intervention Models Sustainability and Relevance
23
age rates are higher than 50 in 12 Member States - in Belgium Finland and Austria
the corresponding rate is even above 70) Moreover the YG currently does not suffi-
ciently cover inactive NEETs (European Youth Forum 2018) as this problem is less se-
vere in countries with minimum income support systems where less strict entry require-
ments are usually applied This is the case in Ireland for example (see European Court
of Auditors 2017) This under-coverage of inactive NEETs is reflected in Figure 4 which
shows that the decline in NEET rates since the introduction of the YG is mostly due to
reductions in long-term and short-term unemployment
Figure 4 Composition of the EU NEET population (percentage of the population
of young people)
Source Eurofound (2017)
Thus it seems that the YG so far has benefitted youth closer to the labour market which
may be partly reflect the high prevalence of employment offers within the YG framework
(in 2016 around 67 of all the offers taken up within the four-month time limit set by
the YG were employment offers) Low-skilled individuals lsquodiscouragedrsquo workers and indi-
viduals without work experience are likely to benefit more from offers that combine gain-
ing job experience and building (job-specific) skills However as of 2016 these types of
offer only make up a minority of all the offers taken up within the four-month time limit
Furthermore the 2013 Council Recommendation on the YG insufficiently addressed the
needs of those among the youth that are NEETs for reasons other than labour market
related factors as these individuals had other constraints keeping them from the labour
market Among this group are mainly individuals with family care responsibilities and
youth with illnesses or disabilities For individuals with family responsibilities the Euro-
pean Quality of Life Survey shows that 11 of young fathers and 35 of young mothers
are inactive This is despite the fact that the majority of them would like to work under
flexible work and with adequate care arrangements (European Youth Forum 2017)
Nonetheless some Member States introduced additional reforms beyond the YG recom-
mendations to decrease high school dropout or aimed at improving social and welfare
policies
The Youth Guarantee in light of changes in the world of work Youth Guarantee Intervention Models Sustainability and Relevance
24
215 Design and implementation features of the Youth Guarantee
The fifth key aspect of the YG concerns design and implementation-related factors af-
fecting its capacity to address the main objectives ndash does it provide a broad set of young
people with a quality offer within a short period of time Specifically the Council of the
European Union (EU) recommended providing a quality offer to all young people under
25 within a four-month period of their becoming unemployed or having left the education
system
Substantial variation between Member States can be observed in the way the national
YG was designed and implemented previous experience implementing a YG-type of
framework is also important For example Denmark and Sweden are among countries
that had a relatively long history of this sort of framework even before the introduction
of the YG Furthermore at the very fundamental level of design some Member States
opted for different target time-frames as well as different age cut offs for YG eligibility
Some countries chose a shorter time-frame than the four months envisaged by the
Council of the European Union others opted for a longer duration (European Commis-
sion 2016a) Regarding the age range a substantial number of Member States chose
youth aged under 30 as a target rather than the suggested age of 25 as the cut off This
included for example Bulgaria Denmark Italy and Poland Depending on the size of
these cohorts this may represent a considerably more ambitious approach which - if it
is not supported by sufficient financial and human resources - is more likely to fall short
of expectations Furthermore some countries put specific emphasis on targeting the
long-term unemployed youth (Escudero and Mourelo 2017) Among others this includes
Hungary Poland and the United Kingdom
In order to support the target of reaching every NEET in a timely manner some PES
have also introduced YG-specific staff hired additional caseworkers or at least main-
tained their staff level since the introduction of the YG (European Commission 2017a)
On the issue of the quality of offers 17 PES formally defined their criteria for a quality
offer or distributed national quality management guidelines regarding offers being made
within the YG framework (5 countries)14 Many Member States have chosen an outcome-
based approach for their definition of offer quality meaning they define an offer as being
of high quality when individuals have favourable education or employment outcomes
after leaving one of the YG programmes (European Commission 2016a) In addition
some PES also introduced youth-specific targets (European Commission 2017a)
There is also cross-country variation in terms of the main YG providers Almost all coun-
tries rely to some extent on their national PES for providing YG services while some do
so exclusively This is the case for example in Austria the Czech Republic and Greece
Most Member States however chose some combination of the PES and other institutions
as their main providers (European Commission 2016a) Aside from the institutions
through which YG services can be obtained online access to the programmes may be an
important driver of success In 18 EU countries potential participants can register online
for the YG at least in some regions of the country This is not the case in for example
Bulgaria France or Luxembourg
14 See European Commission 2017a
The Youth Guarantee in light of changes in the world of work Youth Guarantee Intervention Models Sustainability and Relevance
25
Country case study Latvia
Young people in Latvia were very adversely affected by the lsquoGreat Recessionrsquo of
20082009 In the years before the recession youth unemployment had been relatively
low standing at 105 in mid-2008 but then it more than tripled to more than 35
within a two year period In a parallel development the NEET rate for 15-24 year old
Latvians rose from 108 in 2008 to 178 in 2010 Both youth unemployment and the
NEET rate effectively peaked in 2010 in Latvia and since then they have steadily de-
clined reaching pre-crisis levels by 2015 One specific challenge of the Latvian labour
market is the variation in employment outcomes by educational level as the high-
skilled face very low unemployment rates (clearly below the EU average) whereas un-
employment among the low-skilled is much higher than EU average
Following the Council Recommendation the Latvian YG Implementation Plan was pre-
sented in December 2013 (updated in April 2014) and implementation started in 2014
targeting young people aged 15-29 not in employment education or training (European
Commission 2018c) The Ministry of Welfare is in charge of establishing and managing
the YG while the Latvian PES (the lsquoState Employment Agencyrsquo) and the State Education
Development Agency (SEDA) are responsible for its implementation Other main imple-
menting actors include the Ministry of Science and Education the local authorities (the
municipalities) and youth organisations The Latvian Youth Guarantee is fully funded by
the Youth Employment Initiative (ibid)
The immediate strengths of YG implementation in Latvia are the rapid formal adoption
of the YG the adaptability of existing institutions and structures (which also enabled the
creation of new institutions such as a YG Advisory Board) and the emergence of part-
nership as a key component for implementing the YG This active inclusion of a broad
set of partnerships remains a particular strength of the Latvian YG implementation (EM-
CO 2017)
The Latvian YG scheme exclusively provides employment and education offers so that
apprenticeships and traineeships are not provided The employment offers are mostly
subsidised employment in the regular labour market such as first work experience for
labour market entrants and subsidised jobs for the disadvantaged Young people receive
fixed term contracts that range in duration from six months to two years and there is
also financial support for up to two years for young people wanting to become self-
employed or to start a business
The education system includes several vocational elements typically between 480 and
960 hours and up to 15 years in one specific programme Additionally the Latvian YG
provides ldquoyouth workshopsrdquo as part of the preparatory phase which provide training in
three different areas (up to three weeks each) to help young people with their career
choices
In 2016 just over a quarter (271 of the total entrants) of those entering the YG
scheme were re-entrants of which nearly half (127) had previously taken up an of-
fer These re-entry rates are below the EU average but the rates may be understated
as data for participants applying via the SEDA data on previous experience are not
available (European Commission 2018a)
The Youth Guarantee in light of changes in the world of work Youth Guarantee Intervention Models Sustainability and Relevance
26
216 The role of the apprenticeship system in the Youth Guarantee
The sixth main aspect of YG implementation addressed in this study specifically concerns
the role of apprenticeships indeed one of the greatest problems for young peoplersquos
transition into the labour market is their lack of work-related competences especially in
the countries with sequential STW transition systems that focus on general education
rather than building lsquoall-round human capitalrsquo as in lsquodualrsquo STW transition systems where
school and work are linked at the same time (Austria Denmark and Germany) An ap-
prenticeship is therefore one of the key elements of the dual system as it traditionally
involves off-the-job in-class education together with on-the-job training of different
lengths
According to comparative evidence provided by the European Commission (2013) based
on the European Labour Force Survey in most EU Member States the share of appren-
ticeships in any cohort of young people (15-29 years old) is between 15 and 5 with
the only exception being Germany Austria and Denmark where young people who un-
dertake an apprenticeship amount to above 5 All other EU countries are below 15
The EU average share was 37
This general tendency is also partly reflected in the usage of apprenticeships in the con-
text of the YG as they correspond to important cultural and institutional factors within
Member States15 The monitoring data shows that in 2016 some of the countries with the
highest share of apprenticeship offers within the YG programme have a dual STW sys-
tem Portugal is one major exception from this rule this may be related to its general
shortage of employment opportunities and therefore the tendency of apprenticeships to
occupy a higher than average share among participants of the YG Overall however
only 34 of timely exits from the YG were the result of apprenticeship offers a share
not far away from the share in the overall population of young people mentioned above
For a large number of countries the share was close to zero It should be noted howev-
er that due to data limitations some countries may record entries into apprenticeship
offers as entries into employment (European Commission 2016b)
Apart from data-related issues one reason why apprenticeship offers remain rather ex-
ceptional within the YG is that they require employersrsquo commitment to providing training
places and to designing curricula in cooperation with schools This can be a big constraint
in the development of apprenticeships especially in sequential SWT systems In 2013
the European Alliance for Apprenticeship (EAFA) was therefore launched to boost ap-
prenticeships in the EU The EAFA gave guidelines for the implementation of apprentice-
ships in all Member States and encouraged sharing experiences and good practices and
provided strategic expert support from the European Centre for the Development of Vo-
cational Training (CEDEFOP) and through the European Training Foundation Within the
context of the EAFA all member countries signed a declaration of commitments on ac-
tions to spread the use of apprenticeships as the main port of entry to the labour market
15 Note that the Commissionrsquos definition of apprenticeships (European Commission 2013) may differ from Member Statesrsquo definitions A recent Council Recommendation (Council of the European Union 2018) intends to harmonise the definition by saying that apprenticeships are understood as formal vocational education and training schemes that a) combine learning in education or training institutions with substantial work-based learning in companies and other workplaces b) lead to
nationally recognised qualifications c) are based on an agreement defining the rights and obliga-tions of the apprentice the employer and where appropriate the vocational education and train-ing institution and d) with the apprentice being paid or otherwise compensated for the work-based component Despite this recommendation varying national definitions still exist across Member States
The Youth Guarantee in light of changes in the world of work Youth Guarantee Intervention Models Sustainability and Relevance
27
for young people16 Moreover in their declarations each country committed itself to im-
plement the dual principle in their STW transition
Country case study Denmark
Denmark is among those EU countries that even before the introduction of the YG in
2013 (European Commission 2016a) already had a particularly well-functioning labour
market and educational system to help NEETs In fact Denmark already had some ex-
perience of a YG-like framework for a relatively long period before it was proposed by
the Council of the European Union The situation for Denmarkrsquos youth was therefore
more favourable than the EU average in 2012 The share of young people between 15
and 25 that were NEETs was only 66 - significantly below the proportion of NEETs in
many other EU countries Furthermore the majority of those individuals that were clas-
sified as NEETs were relatively close to the labour market and were therefore easier to
reach For example only 53 of Danish NEETs belonged to the group of long-term
unemployed or discouraged workers (Eurofound 2016)
Due to these circumstances the case for additional reforms within the YG was limited
Therefore along with reform efforts regarding active labour market policies concerning
youth and the educational system17 the implementation of the YG mostly required the
updating of existing policies This is exemplified by a strong increase in ALMP spending
from roughly 13 of GDP in 2012 to about 14 in 2015 despite declining rates of
youth unemployment and therefore a decrease in ALMP expenditure in other countries
over the same time period Denmark chose a particularly ambitious implementation by
focusing on youth under the age of 30 with a target window of less than four months so
as to offer their NEET population a quality measure In contrast to many other Member
States Denmark focuses on increasing the employability of NEETs via (continued) edu-
cation measures resulting in a share of apprenticeship take ups of over 50 relative to
the total number of timely exits from the YG This approach also matches the relatively
large proportion of low and medium educated youth among the NEETs
Two of the main pillars in the original 2014 Danish implementation plan were the ldquore-
tention task forcerdquo and the ldquoBridge Building to Educationrdquo programmes Both types of
initiatives were well-founded in regional and inter-organisational partnerships (for ex-
ample people involved include job centres municipalities educational facilities youth
organisations and others) While the aim of the first programme was to decrease high
school drop-out rates the latter took place at a vocational school in close cooperation
with the jobcentres and it focuses on helping youth to find their right path to success
through making the transition to vocational education This was done by assigning men-
tors to the NEET and giving them access to basic literacy and numeracy courses if they
needed them as well as further professional courses and traineeships The evaluation of
the ldquoBridge Building to Educationrdquo initiative yielded positive effects for youngsters par-
ticipating in the intervention compared to the control group (with a similar profile) which
did not participate in the intervention As a result two additional initiatives were set up
Firstly funds were made available to support the further implementation of ldquoBridge
Building to Educationrdquo initiatives Secondly ldquoJob-Bridge to Educationrdquo a randomised
controlled trial building on the core elements of ldquoBridge Building to Educationrdquo and tar-
geting the most vulnerable youth under 30 years without an education was also set up
16 Declarations of national commitment are downloadable from the EAFA website httpeceuropaeuapprenticeships-alliance
17 For more information see httpsuvmdkreform-af-de-forberedende-tilbudforberedende-grunduddannelseopbygning-og-maalgruppe
The Youth Guarantee in light of changes in the world of work Youth Guarantee Intervention Models Sustainability and Relevance
28
The project is set to end in mid-2020 where it will be followed by an evaluation of the
results
The Danish YG has also managed to set up a high-quality monitoring system with only
relatively few cases of missing information on YG participantsrsquo exit destinations (Euro-
pean Commission 2018a) Together with the relatively large share of NEETs who are
registered with the PES and the development of ldquoyouth guidance centresrdquo to reach out
to those who are not the Danish YG model is able to cover a substantial portion of
NEETs For instance in 2016 the YG coverage rate reached almost 60 of the NEET
population compared to the EU YG scheme average of 425 Thus despite more fa-
vourable initial conditions in Denmark the YG helped put a focus on the most vulnera-
ble youth and spur on a further integration of policies into national policymaking for
example through additional reforms aimed at improving active labour market policies
for young people Youth unemployment rates are currently trending downwards even
further in Denmark However there remain some issues especially with regard to the
integration of migrants given that youth unemployment is a much more pervasive issue
among them compared to native Danes (European Commission 2018a)
22 Empirical indicators of Youth Guarantee features
Section 21 has presented the key aspects that reflect how Members States implemented
the Youth Guarantee following the Recommendation In order to prepare the systematic
analysis of the YG in section 3 which develops a YG typology it is necessary to build
empirical indicators for each of these key aspects That is to say that this section dis-
cusses how information on each of these aspects can be measured and expressed in da-
ta18 These empirical indicators are therefore grouped into the corresponding six sets
1 Financial resources for implementing the Youth Guarantee
2 The Youth Guarantee as part of national policy-making
3 Youth labour market challenges
4 The heterogeneity of the NEET population
5 Design and implementation features of the Youth Guarantee
6 The role of the apprenticeship system in the Youth Guarantee
221 Indicator set 1 Financial resources for implementing the Youth
Guarantee
The set of indicators below represents the level and composition of financial resources
that Member States employed to support the Youth Guarantees implementation
i The size of ESFYEI transfers to match the respective NEET challenge is measured
by the ratio of initial YEI allocations as well as the YEI+ESF matching funds EU el-
igible cost both relative to Member Statesrsquo GDP in 2012 In addition a categori-
18 For each group of contextual and implementation features of the Youth Guarantee discussed in Section 21 an overview of potential quantitative or qualitative indicators was established which could represent these constructs Through a desk research of the available literature and online databases the availability of the respective indicators at the Member State level was assessed for a sufficiently large set of countries Unfortunately for a subset of potential indicators it was not possible to retrieve sufficient andor adequate information for a large enough sample of Member
States In some cases where several potential indicators were available to represent the same dimension or construct the available indicators that best represent the specific feature were iden-tified while also taking data quality into account In some cases single combined indicators were constructed to reduce the lsquodimensionalityrsquo of the database underlying the cluster analysis in sec-tion 3 See appendix A for more details on the exact indicators used and their source
The Youth Guarantee in light of changes in the world of work Youth Guarantee Intervention Models Sustainability and Relevance
29
cal variable for the estimated yearly costs relative to GDP for offering interven-
tions to all NEETs is included derived from Eurofound (2015a) The comparison of
both allows judgement of the importance of EU transfers in financing the YG
ii The degree to which Member States allocated additional funding from the ESF to
fund measures related to youth employment is measured in data about ldquoOther
ESF EU eligible costsrdquo (European Commission 2018k)
iii To proxy whether Member States dedicated additional funding from national
budgets to finance YG-related measures the evolution of overall active labour
market spending from 2012 to 2015 is used (Eurostat lmp_expsumm)19
iv Finally the degree to which Member States were able to absorb the additional
funding from the YEI in a timely manner is measured by the share of EU eligible
costs among YEI+ESF funds that were actually declared YEI+ESF funds based on
data from European Commission (2018k)
222 Indicator set 2 The Youth Guarantee as part of national policy-
making
The second set of indicators reflects the degree to which Member States made efforts to
introduce elements of the YG into national policy making and started partnerships
Regarding reform efforts the following indicators are included
i The degree to which the YG spurred wider longer-term reforms in Member States
is quantified by the total number of youth-related active labour market policy re-
forms between 2013-2016 based on LABREF information (the European Commis-
sionrsquos labour database)20
ii In addition the degree to which Member States were committed to the policy
change is approximated by the number of areas in which additional measures
were taken in the context of YG beyond the scope of the Recommendation (based
on European Commission 2016c)21
iii Finally the degree to which Member States were able to set up an effective YG
monitoring and follow-up system is taken into account as an indication of whether
they were committed to delivering the YG This means including 2016 data for the
proportion of YG exits with unknown destinations and the proportion of unknown
situations in the six-month follow-up data (European Commission 2018a)
The degree of partnerships built in each Member State is measured using the following
indicators
iv The degree to which partnerships were an element of the initial YG design is in-
cluded using the Member Statesrsquo self-reported involvement of social partners and
19 At the time of writing this report more recent data was only available for relatively small subset of EU countries
20 The authors refrain from using 2017 data on labour market reforms from the LABREF database as the objective is to measure the degree to which the YG was a driver of reforms in Member States That is this link becomes weaker over time such that the added value of more recent data
for the analysis is questionable
21 Due to their high correlation with LABREFrsquos own variations indicators of receipt and implemen-tation of country-specific recommendation between 2013-2017 and the qualitative classification by the Commission for the extent to which YG has acted as a driver of reform (European Commission 2016a) are not included in the set of indicators used
The Youth Guarantee in light of changes in the world of work Youth Guarantee Intervention Models Sustainability and Relevance
30
youth organisations in the design implementation and monitoring of the YG
(based on European Commission 2016c)22
v Furthermore the involvement of partners is approximated using the number of
areas where the PES is declared to have formed partnerships (based on European
Commission 2017a)23 In addition indicators are included for national PES re-
ported as having involved youth organisations and young people in the design of
YG services (based on European Commission 2017a)
223 Indicator set 3 Youth labour market challenges
To reflect how the challenges faced by young people in their transition from STW differ
across Member States the following empirical indicators are considered
i A set of indicators that reflect the significance of the youth unemployment chal-
lenge at the time when the YG was designed and rolled out These include the ra-
tio of unemployment rates for youth (age 15-24) and adults (age 25-74) the
share of people aged 15-24 of the total population (age 15-74) and the NEET
rate among youth aged 15-29 to obtain a measure of the size of the NEET chal-
lenge also for Member States that target individuals up to 29 years of age (Euro-
stat lfsa_pgaed une_rt_a edat_lfse_14 all indicators were measured in 2012)
ii To measure the initial degree of labour market segmentation and the quality of
entry-level jobs available to youth in each Member State the absolute difference
in the share of youth (15-24) to adults (25-54) in terms of the number on tempo-
rary employment contracts in 2012 (Eurostat lfsi_pt_a)
iii To address Member Statesrsquo response to these conditions several indicators are
included on the degree to which employment offers were favoured possibly re-
flecting a ldquowork-firstrdquo approach specifically the number of offers of employment
relative to the total number of all types of offers that are typically made to young
people registered in YG schemes (based on European Commission 2018b) In ad-
dition this includes a measure for the employment intensity of timely exits in
2016 (the share of all timely exits that were employment offers based on Euro-
pean Commission 2018b)
iv Lastly two indicators approximate the performance of education and training sys-
tems from which youth enter into the labour market and the potential severity of
the skills mismatch first the share of early school-leavers from education and
training among the youth population (age 18-24) in 2012 (Eurostat
edat_lfse_14) and second the share of NEETs with low and medium educational
attainment in 2012 To approximate the YG implementation with respect to skills
mismatches the number of offers of education relative to the total number of all
types of offers that are typically made to young people registered in YG schemes
is used (based on European Commission 2018b) In addition a measure is in-
cluded for the education intensity of timely exits in 2016 ie the share of all
timely exits that were education offers (based on European Commission 2018b)
22 An alternative source for partnership information is provided by ETUC (2018) Their data is ndash in
contrast to the data employed ndash not self-reported by the Member States However the ETUC (2018) report contains substantial missing information and hence was not used
23 Namely PES partnerships aimed at (i) ensuring that young people have full information and support available (ii) increasing employment apprenticeship and traineeship opportunities and (iii) supporting transitions from unemployment inactivity or education into work
The Youth Guarantee in light of changes in the world of work Youth Guarantee Intervention Models Sustainability and Relevance
31
224 Indicator set 4 The heterogeneity of the NEET population
The next set of indicators aims to reflect the diversity of the NEET population While
some indicators have already been introduced in the indicators above (for example NEET
rates by educational attainment) this additionally integrates the following
i The composition of NEETs as measured by the share of NEETs that are short-term
or long-term unemployed individuals about to re-enter education or employment
discouraged NEETs youth with illnesses or disabilities and the share of NEETs
with family responsibilities This gives an indication of the NEETsrsquo activity status
the potential reasons for their NEET status and their degree of closeness to the
labour market (Eurofound 2016 all indicators measured in 2013)24
ii Indicators describing the links between the PES for the YG This includes the
number of responsibilities of the PES in the YG as well as their main outreach
tools based on European Commission (2017a) Furthermore it includes indicators
on whether the PES is the main body responsible for the administration and pay-
ment of unemployment andor other types of benefits (based on European Com-
mission 2017a)
iii An indicator from European Commission (2017a) that reflects whether the re-
spective PES is reported to have taken any additional measures with respect to
preventing school drop-out
225 Indicator set 5 Design and implementation features of the Youth Guarantee
This set covers further design and implementation indicators that are likely to affect the
performance of the YG as implemented by the Member States
i Indicators on the envisaged length of the preparatory phase the eligible age
group the main YG provider whether online registration is possible for potential
YG participants as well as whether Member States created a legal entitlement to
receive an offer (all based on European Commission 2016c) In addition there is
an indicator measuring whether Member States specifically target the long-term
unemployed (Escudero and Mourelo 2017)
ii A categorical indicator providing information on whether a YG-related scheme was
already in place (in the long-term or recently) before the Recommendation
(based on European Commission 2016c)
iii Information on whether the Member States established a formal definition of a
good quality offer within the YG scheme (European Commission 2016a) and
whether quality management guidelines exist from the national administration to
organisations involved in YG (based on European Commission 2017a)
iv Indicators to reflect the relevance and potential upscaling of national PES capacity
since the YG Recommendation (all reflecting 2017 responses of PES based on
European Commission 2017a) These include whether the PES has dedicated YG
staff whether the PES provides training for YG staff whether the PES staff in-
creased or remained the same from 2014-2017 and whether the PES has specific
targets for youth (ibid)
24 Optionally the use of a more general measure of the NEET Cluster Type was tested which is a composite indicator on different levels reflecting the STW transition system and the composition of NEET in 2012 (Eurofound 2016) However as the clustering is based on the share and STW transition type data already employed the indicator is not used in the analysis
The Youth Guarantee in light of changes in the world of work Youth Guarantee Intervention Models Sustainability and Relevance
32
226 Indicator set 6 The role of the apprenticeship system in the Youth Guarantee
The final set of indicators represents the relevance and the set-up of apprenticeships in
the national education and training system as well as their role in the YGs implementa-
tion
i To provide information on the STW transition types of Member States indicators
are included based on the classification by Pohl and Walther (2005 2007) Fur-
thermore an indicator on the share of firms employing initial vocational training
participants in 2010 is used (Ireland 2015) (Eurostat trng_cvt_34s)
ii To reflect the relevance of apprenticeships in the YG implementation indicators
on the number of offers of apprenticeships relative to the total number of all
types of offers that are typically made to young people registered in YG schemes
(based on European Commission 2018b) In addition a measure for the appren-
ticeship-intensity of timely exits in 2016 ie the share of all timely exits that
were apprenticeship offers (based on European Commission 2018b)
iii The normalised number of pledges from firms and institutions to the European Al-
liance for Apprenticeships between the outset of the YG in 2013 and 2018 (based
on the national commitments database25)
23 Conclusion
This chapter has provided a comprehensive overview of the main aspects of the YG im-
plementation in context Specifically subsection 21 discussed a) the main financial re-
sources for implementing the YG b) the YGrsquos integration within national policy-making
c) the YG and youthrsquos labour market challenges d) the diversity of the NEET population
e) design and implementation features of the YG and f) the role of the apprenticeship
system in the YG Section 22 proceeded to identify and map six sets of empirical indica-
tors to each of these six implementation aspects In total 76 empirical indicators were
identified which will form the basis of the systematic analysis of a YG typology in the
next section Figure 5 gives a graphic overview of the number of indicators included in
each of the six indicator sets representing the key implementation aspects
25 The national commitments database available at httpeceuropaeusocialmainjspcatId=1148amplangId=en as of September 17 2018 This data-base also provides information on the number of pledges made by firms and institutions For the analysis the number of pledges is normalised by the share of firms employing IVET participants in each Member State to account for the relevance of the VET system
The Youth Guarantee in light of changes in the world of work Youth Guarantee Intervention Models Sustainability and Relevance
33
Figure 5 Number of indicators identified by variable set
Source Own analysis
Figure 5 illustrates that for example indicator set (5) ndash which represents the design and
implementation features of the YG ndash is the largest set comprising 20 indicators Whereas
the indicator sets (1) on financial resources for implementing the YG and (6) on the role
of the apprenticeship system (6) are somewhat smaller they still contain seven and nine
indicators respectively
3 Typology of Youth Guarantee models
This section is the empirical part of the analysis Based on the identification of the set of
relevant implementation aspects and the corresponding empirical indicators in the previ-
ous section Chapter 3 intends to systematise the main models that are currently in
place for delivering the YG in Member States It is an empirical attempt at establishing a
typology of different intervention models based on cluster analysis This section also
explores whether a correlation between specific types of intervention models and per-
formance in delivering the YG can be identified
31 Empirical approach to establishing Youth Guarantee models
To address the question about which main models are currently in place for delivering
the YG the analysis groups Member States according to their similarity across the em-
pirical indicators presented in section 22 Since both contextual features and implemen-
tation-related factors are included this procedure identifies types of countries that are
similar in both dimensions
To detect these types cluster analysis techniques are used in which the goal is to find
groups of observations in the data ndash that is groups of Member States ndash that are most
similar within clusters while being as dissimilar as possible across clusters In this study
hierarchical agglomerative clustering methods are employed These methods start out by
specifying each Member State as one individual cluster The cluster approach then grad-
ually combines Member States into clusters The choice of which clusters are to be com-
bined is determined by comparing their (dis-) similarity In the empirical application an
adequate measure of dissimilarity is the coefficient by Gower (1971) as it allows for the
combination of binary indicators and multivalued variables The choice of the linkage
method (the way the clustering algorithm combines similar observations into clusters) is
of similar importance in this case the Ward method (1963) is chosen which combines
groups or observations if they increase the within-group variance of the chosen indica-
tors by the least amount possible in the data Lastly the authors needed to choose the
7
11
11
18
20
9 (1) Financial resources for implementing the YG
(2) YG as part of national policy-making
(3) Youth labour market challenges
(4) Heterogeneity of NEET population
(5) Design and implementation features of the YG
(6) Role of the apprenticeship system in the YG
The Youth Guarantee in light of changes in the world of work Youth Guarantee Intervention Models Sustainability and Relevance
34
number of clusters to be generated Since this is not obvious in the application at hand
the Duda-Hart optimality criterion as described by Milligan and Cooper (1985) was ap-
plied This means that intuitively the index computes the added value of increasing the
number of clusters by one so a low Duda-Hart index indicates an optimal number of
clusters In the YG case the comparison is restricted to between three and seven clus-
ters as fewer clusters provide too little information while too many clusters hamper the
interpretability of results
The empirical application follows a two-step procedure In the first step a cluster analy-
sis for each set of the empirical indicators defined in section 22 determines sets of coun-
tries that are similar within each of these six conceptual sets For example the set on
financial resources puts countries with magnitudes of expected and realised costs for
implementing the YG based on the available information together In the second step
the main cluster analysis based on all indicators determines a final cluster analysis which
also allows the authors to analyse their correspondence to the sub-clusters from the first
stage Readers should note that the quality of the cluster groups depends ndash among other
factors- on the data quality of available indicators as well as the number of indicators
used The more indicators are required for meaningful results the more difficult it is to
obtain clusters that differ sharply with respect to all the chosen indicators Thus it may
be that one country differs quite substantially in terms of one indicator from the rest of
the countries in a particular cluster if the other indicators show similar realisations
Hence for the description of clusters attention is restricted to those indicators that
summarise the cluster differences the best presenting the general tendencies of the
cluster analysis necessarily simplifying to a certain degree Furthermore readers should
also note that the groupings following from this exercise do generally not imply any
qualitative ranking
32 Description of first-step clusters
321 Indicator set 1 Financial resources
Cluster A (AT DK FI DE LU NL and SE) is a set of countries with a low estimated cost
of fully implementing the YG that received relatively little financial support from EU
funds both via the YEI and the ESF On average these states show very little changes in
active labour market policy (ALMP) spending between 2012 and 2015
Cluster B (BE CZ EE FR IE IT MT RO SI and UK) and Cluster C (ES LT LV PL and
PT) are countries with costs estimated to be of medium magnitude to fully implement
the YG Country cluster C received more EU funds from the YEI and the ESF matching
funds - and other ESF eligible youth-related projects - compared to cluster B Both clus-
ters showed only a small change in ALMP expenditure
Cluster D (BG CY EL HU HR and SK) has high estimated YG costs and they received
substantial monetary support from the EU to support the implementation of the YG
through the YEI through the ESF matching funds and through financing of other eligible
youth-related projects Cluster D is also the only one in the analysis that shows a sub-
stantial increase in ALMP spending between 2012 and 2015 despite declining (youth)
unemployment rates
322 Indicator set 2 Youth Guarantee as part of national policy-
making
Cluster A (DK ES FR HU IE SE and SK) has a large average number of youth-related
ALMP reforms and additional measures implemented beyond the scope of the Recom-
mendation These Member States also tend to enforce comparatively effective YG moni-
The Youth Guarantee in light of changes in the world of work Youth Guarantee Intervention Models Sustainability and Relevance
35
toring and follow-up systems which may be interpreted as an indication that they are
committed to deliver on the YG However on average these Member States did not pri-
oritise partnerships as much as other clusters
Cluster B (AT CZ DE EE EL NL RO and UK) is mostly defined by the lack of effective
monitoring and follow-up systems and also fewer reforms were put in place compared to
Member States in other clusters Nonetheless on average they put more emphasis on
involving social partners and youth organisations and built more partnerships than coun-
tries in cluster A
Cluster C (BE BG CY FI HR IT LV LT LU MT PL PT and SI) implemented many
youth-related reforms and additional measures as part of the implementation of YG rec-
ommendations However in contrast with cluster A these Member States also included
partnerships with social partners and youth organisations as a central element of the
initial YG design Consequently the PES in these Member States often said that they had
formed partnerships and that they regularly involve youth and youth organisations into
their work Nonetheless their monitoring systems are still underperforming compared to
countries in Cluster A
323 Indicator set 3 Youth labour market challenges
Cluster A (BG CY EL HR PL and SK) includes Member States that had the highest
NEET rate amongst 15-29 year olds in 2012 before the YG was rolled out Moreover
they show the largest difference in shares of temporary employment contracts between
the youth and adults Countries in this cluster have the best educated NEETs on average
This also reflects the point that the issue was not so much the education system as the
figures also show a comparatively low average shares of school drop-outs Correspond-
ingly Member States in cluster A usually responded by focusing on employment-related
measures under the YG rather than offers of education
Cluster B (AT DE DK ES LV and MT) relates to the contrasting cases These Member
States tend to have comparatively low NEET shares with most of them having a poor
level of education and the lowest average youth-to-adult unemployment ratio In addi-
tion these countries appear to have a rather well-functioning educational system with
similarly low average shares of early school-leavers compared to cluster A Most of
these Member States responded to this setting with a strong focus on educational offers
under the YG
Cluster C (BE CZ EE FI FR HU IE IT LT LU NL PT RO SI SE and UK) ranks in
between cluster two and three on many indicators including the prevalence of low edu-
cated NEETs education and employment offers In general this cluster has the lowest
difference in temporary employment shares between adults and the youth
324 Indicator set 4 The heterogeneity of the NEET population
Cluster A (BE BG FI MT and NL) consists of countries that have a particularly high
share of NEETs in short-term unemployment illness or disability and lsquodiscouragement
from workingrsquo The policy response of these countries is characterised by the highest
average outreach efforts on the part of the national PES
Cluster B (CZ DE EE EL FR HU HR LT LU PL SI and UK) has the highest share of
short-term unemployed and individuals with family responsibilities among the NEETs
Similar to cluster A countries from cluster B display strong average outreach efforts and
a large degree of involvement of the PES in delivering the YG
The Youth Guarantee in light of changes in the world of work Youth Guarantee Intervention Models Sustainability and Relevance
36
Cluster C (AT CY DK ES IE IT LV PT RO SK and SE) is the most diverse for this
indicator set and shows the highest share of long-term unemployed and relatively high
rates of discouraged youth among the NEET population compared to other clusters The
governance structure shows a lower degree of PES having responsibility for administer-
ing and paying (unemployment) benefits as well as regarding the implementation and
delivery of the YG in general Compared to clusters A and B Member States from cluster
C tend to show fewer outreach efforts
325 Indicator set 5 Design and implementation features of the Youth Guarantee
Cluster A (AT CY DE DK EL FI HR IE LU and SE) includes many Member States
which set the age target as under-25 years old26 These countries also tend to define
very few other eligibility criteria or target groups Importantly all Member States includ-
ed in this category have a relatively long experience of YG-type schemes prior to 2013
However only very few of them defined a legal entitlement to receive an offer These
are also countries that mostly allowed individuals to register online set a definition for a
quality offer and also provided national quality guidelines for all actors involved in the
YG Many of the Member States in this cluster also primarily rely on their PES in the YG
implementation and have strengthened their PES capacities since the YG rollout
Cluster B (BG CZ ES FR MT NL PT and RO) includes a relatively diverse set of coun-
tries Most countries in this cluster have no prior experience of a YG-type of scheme
relatively low availability of online registration and a low prevalence of the definition of
quality offers While some countries additionally target NEETs under 30 years old in
general they neither upgraded the capacity of nor relied strongly on their PES in its im-
plementation
Cluster C (BE EE HU IT LV LT PL SI SK and UK) primarily consists of countries that
set the target for youth aged under 30 In addition many of these countries set addi-
tional target groups beyond the general criteria (such as a specific focus on long-term
unemployed) or defined specific sub-groups within the broad target population Similar
to cluster A some Member States with previous YG-related experience are included in
this cluster In addition they tend to have upgraded their PES capacity for YG implemen-
tation (but they also rely on other providers) These are also mainly countries that im-
plemented a legal entitlement and also a definition of a quality offer (without however
providing national guidelines)
326 Indicator set 6 The apprenticeship system
Cluster A (AT BE DE FR LU and NL) consists of countries with an employment-centred
STW transition type27 that is characterised by high levels of employer involvement in
education and training system and the largest share of firms employing initial vocational
and educational training (IVET) participants On average Member States in this group
show the largest share of timely exits from apprenticeships Relative to the share of
firms employing IVET participants the number of pledges within the EAFA framework is
26 It is important to note that most implementation-related indicators for example information on eligible age groups were measured in 2016 For a few countries these conditions have changed recently However in the analysis it was decided to stick to the initial implementation features to focus on the way Member States initially aimed to combat youth unemployment
27 See Pohl and Walther (2005) for details
The Youth Guarantee in light of changes in the world of work Youth Guarantee Intervention Models Sustainability and Relevance
37
the lowest in this group potentially reflecting the already high importance of apprentice-
ships in these countries
Cluster B (BG CZ EE HU LT LV RO SK and SI) is made up of Member States that
joined the EU relatively recently with a lsquotransitionalrsquo STW transition type and the lowest
share of firms employing IVETs Their share of apprenticeships is lowest among the
timely exits and their number for EAFA pledges is relatively the largest
Compared to cluster A and B cluster C (CY DK EL ES FI HR IE IT MT PL PT SE
and UK) also consists of a mixture of STW types and a medium share of firms hiring
IVETs Apprenticeship offers are of medium importance relative to the other two clus-
ters
327 Summary of first-step cluster analysis
The analysis of Member Statesrsquo similarities within the indicator sets shows that the re-
sulting country clusters tend to be different depending on the set of indicators although
certain tendencies are already apparent For instance countries that are included in the
same cluster for the YG design and implementation indicators tend to also be grouped
into the same finance cluster meaning that some countries with a low estimated cost of
implementing the YG tend to also be countries that show implementation patterns that
closely followed the Recommendation Similarly countries in the same apprenticeship
cluster tend to be in the same ldquoyouth labour market challengesrdquo cluster While this al-
ready provides some suggestions for the final grouping of Member States with respect to
all indicators chosen the overlap across clusters for the different indicator sets is not
complete so a more in-depth analysis is needed Specifically some clusters remain rela-
tively heterogeneous in terms of the underlying empirical indicators indicating that the
cluster analysis has some difficulties if Member Statesrsquo realisations of indicators do not
follow a simple pattern making the interpretation of some cluster results more difficult
than others For these reasons and to further reduce the dimensionality of the problem
the next section groups Member States based on all the chosen indicators To make the
connection between the first-step analysis and the ensuing second step the association
of first-step clusters with the final cluster results is also shown
The Youth Guarantee in light of changes in the world of work Youth Guarantee Intervention Models Sustainability and Relevance
38
33 Results and discussion of second-step clusters
The final cluster analysis uses all the indicators described in the previous section and
performs the clustering procedure for all variables in a combined step thereby arriving
at clusters that take the individual sub-clusters as well as the interaction between them
into account Table 2 shows the results by Member States including their association
with the clusters uncovered in the first stage of the analysis all ordered by the final re-
sults Being in the same first-step cluster is visualised as having the same shade of the
colour in the respective column It is important to note that the colours chosen imply no
qualitative or quantitative judgement apart from the cluster membership
Table 2 Summary of Results of Cluster Analysis
Country
Financial resources for implementing the YG
YG as part of national policymaking
Youth labour market chal-lenges
Heterogenei-ty of the NEET population
Design and implementa-tion features of the YG
Role of the apprentice-ship system in the YG
Overall cluster
Austria
A
Denmark
Finland
Germany
Ireland
The Netherlands
Sweden
The Czech Republic
B
Estonia
France
Hungary
Romania
The United Kingdom
Cyprus
C
Greece
Italy
Portugal
Spain
Belgium
D
Lithuania
Luxembourg
Malta
Poland
Slovenia
Bulgaria
E Croatia
Latvia
Slovakia
Source Own analysis
Note Countries that share the same first-stage cluster have the same shade of the colour in the respective
column Note that the colour shades imply no qualitative or quantitative ranking of Member States
The Youth Guarantee in light of changes in the world of work Youth Guarantee Intervention Models Sustainability and Relevance
39
Cluster A Member States with previous YG experience lower initial NEET rates
ambitious implementation and improved PES capacity low educated NEETs and
diversified offers (AT DK DE FI IE NL SE)
The first cluster is a set of Member States that are mostly countries which already had
longer experience with YG-related schemes On average YG implementation in these
countries was quite ambitious many of these Member States undercut the recommend-
ed four-month target for the preparatory phase and formally defined their offer quality
and quality guidelines Countries in this cluster tend to rely relatively strongly on their
PES for the YG while upscaling their PES capacity through hiring additional staff At the
same time they also experienced the lowest average NEET rates in 2012 for all clusters
and they consequently had comparatively low estimated costs and therefore low levels of
funding allocated under the YEI However the clusterrsquos NEET population has the highest
share of individuals with low educational background and youth with a disability Follow-
ing this NEET challenge they diversified their offers under the YG across types the most
compared to other clusters with the lowest focus on employment-type offers Involve-
ment and integration of partners within the YG framework in these countries was about
average compared to the other clusters
Cluster B Member States with intermediate NEET challenges strong outreach
efforts by the PES relatively poor monitoring data quality high NEET rates due
to family responsibilities and strong focus on employment offers (CZ EE FR HU
RO UK)
On average these Member States mostly observed a NEET challenge of intermediate
magnitude relative to other clusters at the time of the YG roll-out The labour markets
for youth in this cluster were under more stress and characterised by high rates of short-
term unemployment among their youth ndash for some of them also as a consequence of the
great recession Furthermore this cluster also had by far the highest share of youth that
were NEETs due to family responsibilities and the largest gap between youth and adult
unemployment rates As a result most of them received some funding under the YEI It
is also notable that countries in this cluster showed the largest increase in ALMP ex-
penditure between 2012 and 2015 However compared to the other clusters countries
in this cluster showed particularly poor monitoring data quality so their information has
a high degree of unknown destinations and situations for previous YG participants On
implementation a significant fraction of Member States from cluster B chose slightly
different targets (for example through targeting long-term unemployed introducing a
legal entitlement to a YG offer and extending the age limit up to age 29) They could
build on a comparatively advanced outreach system through the PES which they also
relied on in their YG implementation Furthermore four of the seven countries in this
cluster follow the post-socialisttransitional STW model (the Czech Republic Estonia
Hungary and Romania) On average these countries showed the lowest level of in-
volvement of the social partners and youth organisations and relatively few efforts at
reform On average countries in this cluster had the highest rate of timely exits into
employment indicating a tendency towards an ldquoemployment-firstrdquo approach
Cluster C Member States hit by the economic recession with highest initial
NEET rates severe long-term unemployment large support via EU funding
highest reform efforts and highest entry rates into apprenticeship offers (CY EL
ES IT PT)
The third cluster consists mainly of Member States that were hit particularly hard by the
economic recession following the financial crisis in the years after 2008 and they were
struggling to revive their labour markets in the ensuing recovery As a consequence
most countries had a severe problem with long-term youth unemployment into 2012
The Youth Guarantee in light of changes in the world of work Youth Guarantee Intervention Models Sustainability and Relevance
40
Moreover countries in this cluster had on average the highest rate of early school-
leavers Almost all these Member States received significant funds from the EU to sup-
port the YG implementation and delivery In contrast to Member States in Clusters A and
B none of the countries in cluster C had any kind of experience of a YG type of frame-
work before the Recommendation making its implementation even more difficult in
these countries However in terms of policy integration these Member States rank at
the top of youth-related ALMP reform efforts At the same time most of these countries
still have monitoring systems with relatively poor data quality and their PES used rela-
tively few channels for outreach activities compared to countries in the other clusters
Regarding partnerships built countries in this cluster show an average degree of effort
While the share of low educated NEET is comparable to those in Cluster B and average
exits rates into education are only slightly smaller than among countries from Cluster B
the share of individuals entering apprenticeships is highest among these countries sug-
gesting a stronger focus on the provision of both training and work experience to combat
the NEET challenge
Cluster D Member States characterised by relatively low initial NEET rates and
short-term unemployed rather than inactive NEETs some funding under YEI
strong outreach efforts through the PES and partnership approach and diversi-
fied offers with a stronger focus on education offers (BE MT LT LU PL SI)
The challenge for most Member States in this cluster was the high proportion of youth in
unemployment rather than a structural NEET challenge as most of their NEETs are
short term unemployed rather than discouraged NEETs or inactive for other reasons
Most of the countries in cluster D have medium-level estimated costs of fully implement-
ing the YG Consequently most of these Member States did not receive particularly large
amounts of funding from the EU (except Lithuania and Poland) At the same time these
are mainly Member States that put the most weight on building partnerships involving
social partners and youth organisations as well as outreach efforts including through the
PES Many of the Member States in this cluster followed the Recommendation quite
closely in terms of the time-frame for the YG but they did not establish strong monitor-
ing systems and they did not carry out many youth-related reforms in recent years
relative to other Member States In terms of the offer distribution these countries gen-
erally showed diversified offers with the strongest focus on education measures shown
by the largest share of timely exits from the YG into education and the lowest focus on
employment offers This is despite the fact that on average clusters B C and D had
very similar shares of low and medium educated NEETs at the onset of the YG suggest-
ing a very different policy response
Cluster E Member States that joined the EU relatively recently with lsquotransi-
tionalrsquo STW regimes high initial NEET rates structural challenges and substan-
tial EU funding focus on employment offers rather high reform efforts (BG HR
LV SK)
This cluster consists entirely of countries that joined the EU relatively recently compared
to the other Member States They are countries with a lsquotransitionalrsquo STW regime and
without prior experience in YG-type of frameworks before the Recommendation While
these countries have the lowest rate of early school-leavers and a substantially lower
share of low educated individuals among the NEETs compared to the other clusters this
cluster has the second largest share of NEETs with family responsibilities and the largest
share of discouraged youth This suggests that they struggled with more significant
structural NEET challenges compared to the other clusters The high NEET rates resulted
in high estimated costs for implementing the YG and consequently these Member States
also received substantial funding from the EU
The Youth Guarantee in light of changes in the world of work Youth Guarantee Intervention Models Sustainability and Relevance
41
Moreover these Member States also put in place a significant number of youth-related
ALMP reforms between 2013 and 2016 only outpaced by cluster C In terms of design
and implementation all of these countries chose to target youth under 30 and most put
particular emphasis on long-term unemployed individuals The degree of outreach efforts
through the PES is of average magnitude but the involvement of social partners and
youth organisations is highest among countries in this cluster This may indicate a cer-
tain degree of mismatch regarding outreach activities and the efforts likely to be re-
quired to activate the substantial share of discouraged NEETs in the youth population
However this cluster is the only in which all the Member States have YG-specific staff at
the PES and where all of them increased PES staff in recent years Due to the relatively
well-qualified nature of the NEET population Member States in this cluster concentrated
mostly on employment-type offers
34 Conclusion of second-step clusters
Breaking down the differences between clusters in a simple way is evidently challenging
due to the many aspects considered and highlighted in the cluster-specific characterisa-
tions This section therefore only provides a short conclusion to the findings in the final
cluster analysis indicating several sorts of Youth Guarantee models in place in the Euro-
pean Union It shows three clusters with comparatively low initial NEET rates at the out-
set of the YG Cluster A Cluster B and Cluster D What distinguishes these clusters from
one another among other issues is that Member States in Cluster A already had a long-
er experience of YG-related schemes they observed fewer youth-related challenges and
hence they received less additional funds from the EU
In contrast to this most Member States with the most pressing NEET challenges in 2012
are found in the other two clusters Cluster C and Cluster E include Member States with
particular NEET challenges mostly related to the financial crisis and recession for coun-
tries in Cluster C Member States in Cluster E also had a particular structural NEET chal-
lenge partially stemming from the transitional STW regime and they all received signifi-
cant funding from the EU
35 Measures of performance
Before investigating the correlation between the types of European YG models identified
and the performance of the YG implementation the analysis needs to define the relevant
outcome measures employed for this last step of the empirical analysis The correlation
analysis will make substantive use of information from the YG monitoring data The most
recent data available at the time of writing are from 2016 and they include information
on the main dimensions of the Recommendation
i ldquoCoveragerdquo rate provides an estimation of the degree to which the NEET popula-
tion was reached by the YG (the estimated proportion of the NEET population
aged 15-24 that was enrolled in the YG scheme at any point during the reference
year)28
28 These figures are based on the indicator average annual stock of young people in the YG pre-
paratory phase NEET population (annual average) included in the Indicator Framework for Moni-
toring the Youth Guarantee This indicator combines administrative and survey data Whilst this is not ideal the indicator is useful to give an approximate indication of the proportion of NEETs regis-tered in the YG scheme at any point during the year Results should therefore be interpreted as an estimation rather than a definitive measurement of the extent to which YG schemes achieve the objective of reaching all young people that become or are already NEET
The Youth Guarantee in light of changes in the world of work Youth Guarantee Intervention Models Sustainability and Relevance
42
ii The share beyond the four-month target the share of young people in the pre-
paratory phase beyond the four-month goal measured as a percentage of the
average annual stock of participants
iii Positive and timely exits the share of positive and timely exits shows how suc-
cessful Member States were at providing offers within the envisaged four-month
preparatory phase measured in percentage of all exits
iv Positive situations after six months this measure gives the percentage of YG par-
ticipants being in a positive situation at six months after exiting the programme -
the share of individuals either in education training or employment as a percent-
age of all exits
These performance indicators provide the most comprehensive and direct evidence on
the performance of the YG However there are some data limitations regarding the de-
gree to which the entire NEET population can be identified relevant for the comparability
of the coverage rate across Member States The quality of information on positive and
timely exits as well as the share of participants in a positive situation after exiting the YG
depends on the degree to which the destination of exits is known and how well individu-
als can be followed up Again to a certain degree this limits comparability across coun-
tries The distribution of these indicators across Member States is depicted in Figure 6 For the interested reader a separate cluster analysis solely based on the measures of YG
performance in Table 4 is included in the Annex
The Youth Guarantee in light of changes in the world of work Youth Guarantee Intervention Models Sustainability and Relevance
43
Figure 6 YG-monitoring data performance indicators by Member States 2016
Source YG monitoring data
0
10
20
30
40
50
60
70
80
90
100M
T
HU
UK
BG IT RO CY LV LU EE ES LT IE EL SE SK NL
CZ
HR PL
DK PT SI DE
FR BE FI AT
Coverage rate Share beyond the 4 month target
0
10
20
30
40
50
60
70
80
90
100
CY UK RO FR EL SI HR SK IE BG PT NL LV SE ES LU LT BE PL FI AT EE DE CZ IT DK HU MT
Positive and timely exits Positive situations after 6 months
The Youth Guarantee in light of changes in the world of work Youth Guarantee Intervention Models Sustainability and Relevance
44
To account for measuring issues in the monitoring data and because the main goal of
the YG was to lower youth unemployment and the prevalence of NEETs in general the
reduction from 2012 to 2017 in NEET rates and youth unemployment rates based on
Eurostat indicators is used as additional outcome measures
v Youth unemployment this measure gives the percentage of the 15-24 year old
young people in the labour force that are unemployed
vi NEET rates the NEET rate indicator is defined as the share of the youth popula-
tion (active or inactive) aged 15-24 that is not in employment education or
training
The distribution of these indicators is shown in Figure 7
Figure 7 Eurostat performance indicators by Member States 2012-2017
Source Eurostat (une_rt_a lfsi_neet_a)
36 Assessing the correlation between Youth Guarantee models
and performance
The goal of this section is to compare the performance of the YG as implemented in each
Member State across the clusters identified in section 34 and then to assess emerging
patterns This will be done by using box plots shown for each of the performance indica-
tors separately Box plots allow the comparison of the distribution of indicators across
clusters The median ie the observation in the middle in terms of outcomes (for in-
stance the middle value of all coverage rates within a cluster Figure 8 upper left panel)
is shown by the horizontal lines within each box Furthermore the size of the box shows
the location of the 50 closest observations to the median Observations outside this
box are shown in the graph by the so-called lsquowhiskersrsquo Extreme values that are far away
from the box are displayed as dots Figure 8 shows the distribution of performance
measures for the YG monitoring data
-5
0
5
10
15
20
FI AT
BE IT DE
FR LU NL
CY
DK
MT
RO SE EE UK SI LV CZ EL PL LT PT ES HR SK BG IE
HU
Reduction in youth unemployment Reduction in NEET rates
The Youth Guarantee in light of changes in the world of work Youth Guarantee Intervention Models Sustainability and Relevance
45
Figure 8 YG monitoring data performance indicators by clusters
Source Own analysis
The graph for the coverage rate (upper left panel) shows that clusters A and D have the
highest median coverage rates among the five clusters This appears quite natural as
these countries have had the lowest NEET rates at the onset of the YG making it easier
to cover a large portion of vulnerable youth compared to other countries Clusters B C
and E perform relatively similarly in terms of coverage with median values in the range
of 20 to 40 coverage rate despite the fact that clusters C and E had considerably larg-
er NEET rates when the YG was first introduced Among other factors these two clusters
have in common is that they received substantial funds from the EU to support YG
measures and that countries from both clusters enacted a significant number of youth-
related ALMP reforms
The upper right panel displays results for the share of participants still being in the pre-
paratory phase beyond the envisaged four months in each of the clusters A B D and E
this share is in the range of 45 to 50 in terms of the median values in cluster C this
value is 60 Clusters B and D show considerably more variation than the other clus-
ters The figure indicates therefore that the countries in cluster C appear to have put in
comparatively lower effort to upscaling their PES to provide YG services in time reflected
in the fact that these countries have the highest share of individuals in the preparatory
phase beyond the four month target
With respect to positive and timely exits (bottom left panel) there is no pronounced vari-
ation in terms of median outcomes across the clusters All of the clusters have positive
and timely exit rates of around 40 or slightly higher Finally looking at the share of
positive situations for YG participants after 6 months of leaving the programme (bottom
right panel) one can see that the median outcomes are quite similar for all clusters ex-
cept cluster B which has substantially lower positive outcomes after 6 months In addi-
tion there appear to be substantial differences in the within-cluster variation of this out-
The Youth Guarantee in light of changes in the world of work Youth Guarantee Intervention Models Sustainability and Relevance
46
come however this finding is probably due to the lack of data since for some Member
States these figures are not available (and coded as zero in the monitoring data) A simi-
lar reasoning can be used to explain the large variation between clusters A and D
Figure 9 Aggregate performance measures
Source Own analysis
Figure 9 investigates the reductions in youth unemployment rates and NEET rates from
2012 to 2017 respectively Both graphs display a similar pattern although the reduction
in youth unemployment is generally larger implying that a larger reduction was
achieved among those youth closer to the labour market Focusing on the cluster medi-
ans the figure indicates that cluster A ndash the cluster with the lowest initial NEET and un-
employment rates ndash shows the smallest decline Clusters B C and D show relatively
similar reductions in youth unemployment cluster E being at the top of the distribution
The picture is slightly different when looking at the reduction of NEET rates Here cluster
C has the largest median reduction in NEETs and clusters B D and E display similar per-
formance despite differences in variability Thus cluster E ndash the cluster with a combina-
tion of high initial NEET rates and more structural issues (such as a high share of dis-
couraged NEETs) ndash was more successful in reducing youth unemployment while clus-
ter C (with similarly high NEET rates for 2012 but lower educated NEETs and the highest
apprenticeship take-up rate in terms of timely exits among all clusters) was more suc-
cessful in reducing its NEET rates
4 Summary and conclusions
This report provides an updated overview of the implementation of the YG across EU
Member States based on the recent literature and data on the YG and European labour
markets On this basis six aspects of the Youth Guarantee implementation are dis-
cussed (1) financial resources for implementing the YG (2) the YG as part of national
policy making (3) youth labour market challenges (4) the heterogeneity of the NEET
population (5) the design and implementation features of the YG and (6) the role of the
apprenticeship system in the YG
The overall findings of the desk research and data analysis can be summarised as fol-
lows EU funding initiatives via the Youth Employment Initiative (YEI) and the European
Structural Fund (ESF) played a key role in supporting YG measures financially especially
for those countries suffering from high NEET rates and a significant economic downturn
or structural challenges Many of these countries increased spending on active labour
market policy which may be cautiously interpreted as an indirect effect of the YG In
some Member States the YG also fostered introduction of reforms of national youth poli-
The Youth Guarantee in light of changes in the world of work Youth Guarantee Intervention Models Sustainability and Relevance
47
cies improvements in monitoring systems for activation policies among young people
and the building of partnerships These changes are likely to outlast the YG initiative and
therefore provide sustained and ongoing benefits
Whereas these are substantive positive changes brought about by the YG not all of its
objectives were achieved First neither reducing labour market segmentation through
quality offers nor providing a remedy for imperfectly performing education systems was
fully achieved One reason was a prevalence of employment offers compared to relative-
ly few education or apprenticeship offers The low share of apprenticeship offers in some
Member States appears to be related to the existing institutional setup and STW transi-
tion regime increasing the prominence of the apprenticeship system would need to be
accompanied by broader institutional change Second several Member States were not
able to fully address the heterogeneity of the NEET population ndash especially those furthest
away from the labour market In contrast countries that performed well generally im-
proved the capacity of their Public Employment Services (PES) and developed partner-
ships to implement strong outreach programmes
Based on desk research of the six key aspects that are likely to influence the perfor-
mance of the YG as delivered by Member States a set of empirical indicators was de-
fined to measure the components of these six aspects using available quantitative and
qualitative data These empirical indicators feed into the main part of the analysis that
identifies the YG typology in terms of the key aspects specifically this approach groups
together Member States that share similar outputs across all the features included in the
analysis In practice the typology is derived from a two-step cluster analysis using an
agglomerative clustering algorithm
The first step of the typology discusses the similarity between Member States regarding
implementation-related and contextual features within six pre-defined sets of indicators
each corresponding to one of the six key aspects of the YG The cluster analysis gener-
ates different group compositions regarding Member States for each of the sets of empir-
ical indicators defined so a low-dimensional analysis is only partially informative This
result indicates that many aspects of the YG ndash and their interrelation ndash need to be con-
sidered in a comprehensive typology The second-step cluster analysis therefore simul-
taneously takes into account all of the 76 empirical indicators and identifies five final
clusters
Cluster A Member States with previous YG experience lower initial NEET rates ambi-
tious implementation and improved PES capacity low educated NEETs and diversified
offers (AT DK DE FI IE NL SE)
Cluster B Member States with intermediate NEET challenges strong outreach efforts by
the PES relatively poor monitoring data quality high NEET rates due to family responsi-
bilities and strong focus on employment offers (CZ EE FR HU RO UK)
Cluster C Member States hit by the economic recession with highest initial NEET rates
severe long-term unemployment large support via EU funding highest reform efforts
and highest entry rates into apprenticeship offers (CY EL ES IT PT)
Cluster D Member States characterised by relatively low initial NEET rates and short-
term unemployed rather than inactive NEETs some funding under YEI strong outreach
efforts through the PES and partnership approach and diversified offers with a stronger
focus on education offers (BE MT LT LU PL SI)
Cluster E Member States that joined the EU relatively recently with lsquotransitionalrsquo STW
regimes high initial NEET rates structural challenges and substantial EU funding focus
on employment offers rather high reform efforts (BG HR LV SK)
The Youth Guarantee in light of changes in the world of work Youth Guarantee Intervention Models Sustainability and Relevance
48
Obviously these explicit labels for the clusters tend to simplify the other factors of het-
erogeneity across Member States that determine the typology However some conclu-
sions can be drawn regarding the fit of underlying challenges to be addressed with the
policy response observed In particular it appears that countries in Cluster A C and D
reflected the challenges observed in the design and implementation of the YG to a higher
degree compared to cluster B and E as policies implemented ndash for example regarding
outreach efforts the extent of partnerships and the offer mix introduced ndash seem to bet-
ter match key factors of heterogeneity in the NEET population
Based on these insights the analysis continues with a correlation analysis relating the
identified YG models to basic performance indicators The findings highlight that there is
no evident pattern regarding the clustersrsquo performance in general Cluster A performs
well in terms of the NEET ldquocoveragerdquo rate but less well regarding the reduction in NEET
and unemployment rates over time Clusters B and D perform relatively similar across all
outcome measures although there is some variation that probably stems from meas-
urement issues in the monitoring data Cluster C shows the largest share of youth in the
preparatory phase beyond the envisaged four months but also the largest median de-
cline in NEET rates Cluster E has the lowest share of positive and timely exits but the
largest decline in youth unemployment out of all clusters
While the evidence is thus far from conclusive partly due to the number and complex
inter-relation of the aspects in which clusters differ the reportrsquos findings nonetheless
indicate that not only initial conditions but also the way Member States implement the
YG has affected its success
The Youth Guarantee in light of changes in the world of work Youth Guarantee Intervention Models Sustainability and Relevance
49
References
Andor L and Veselyacute L (2018) The EUrsquos Youth Guarantee a broadly accepted reform in
need of full implementation OSE paper series No 19
ANPAL (2017) Rapporto sullrsquoattuazione della Garanzia Giovani in Italia Rapporto
trimestrale n 4 Roma
ANPAL (2018) Monitoraggio sulla struttura e il funzionamento dei servizi per il lavoro
2017 Roma
Council of the European Union (2013) Council Recommendation of 22 April 2013 on es-
tablishing a Youth Guarantee Official Journal of the European Union Brussels
Department of Education and Skills (2016) Evaluation of the operation of the Youth Em-
ployment Initiative (YEI) element of the European Social Fund (ESF) Programme for Em-
ployability Inclusion and Learning (PEIL) 2014-2020
Department of Social Protection (DSP) (2014a) Pathways to Work - The Implementation
of the EU Council Recommendation for a Youth Guarantee
Department of Social Protection (DSP) (2016a) Member Statesrsquo response to 2013 Coun-
cil Recommendation on establishing a Youth Guarantee [Ireland]
Dheacuteret C and Roden J (2016) Towards a Europeanisation of Youth Employment Poli-
cies ndash A Comparative Analysis of Regional Youth Guarantee Policy Designs EPC Issue
Paper Ndeg81
Dheacuteret C and Morosi M (2015) lsquoOne Year After the Youth Guarantee Policy Fatigue or
Signs of Actionrsquo EPC Policy Brief Brussels European Policy Centre (EPC)
Doherty R (2018) lsquoWritten answer ndash Youth Guaranteersquo Daacuteil Eacuteireann Debate 22 March
2018
Eichhorst W Hinte H and Rinne U (2013) Youth Unemployment in Europe What to
Do about It IZA Policy Paper No 65 July httpftpizaorgpp65pdf
Employment Committee (EMCO) (2017) Ireland - 2017 EMCO Review on the Youth
Guarantee ndash Self-Assessment Questionnaire
Escudero V and E Loacutepez Mourelo (2017) The European Youth Guarantee A systematic
review of its implementation across countries Research Department Working Paper No
21 ILO Geneva
Eurofound (2013a) Young People and Temporary Employment in Europe Publications
Office of the European Union Luxembourg
Eurofound (2013b) Working Conditions of Young Entrants to the Labour Market Publica-
tions Office of the European Union Luxembourg
Eurofound (2014) Mapping Youth Transitions in Europe 2372014 Publications Office
of the European Union Luxembourg
Eurofound (2015a) Beyond the Youth Guarantee - Lessons Learned in the First Year of
Implementation Background Document prepared by Eurofound as a contribution to the
informal EPSCO meeting of 16-17 July 2015 Publications Office of the European Union
Luxembourg
Eurofound (2015b) Social Inclusion of Young People Publications Office of the European
Union Luxembourg
Eurofound (2016) Exploring the diversity of NEETs Publications Office of the European
Union Luxembourg
Eurofound (2017) Long-term unemployed youth Characteristics and policy responses
Publications Office of the European Union Luxembourg
The Youth Guarantee in light of changes in the world of work Youth Guarantee Intervention Models Sustainability and Relevance
50
European Alliance for Apprenticeship (2013) ldquoDeclaration of the European Social Part-
ners the European Commission and the Lithuanian Presidency of the Council of the Eu-
ropean Unionrdquo Brussels
European Commission (2011) Youth Opportunities Initiative ndash Communication From The
Commission To The European Parliament The Council The European Economic And So-
cial Committee And The Committee Of The Regions Brussels
European Commission (2013) Guidebook for Policy Planners and Practitioners on Ap-
prenticeship and Traineeship Schemes in EU27 December
European Commission (2016a) The Youth Guarantee and Youth Employment Initiative
three years on European Commission Directorate-General for Employment Social Af-
fairs and Inclusion Brussels
European Commission (2016b) Staff working documents 1 on ldquoThe Youth Guarantee
and Youth Employment Initiative three years onrdquo European Commission Directorate-
General for Employment Social Affairs and Inclusion Brussels
European Commission (2016c) Member Statesrsquo response to 2013 Council Recommenda-
tion on establishing a Youth Guarantee survey results unpublished
European Commission (2016d) Youth Guarantee Country by Country March 2016
European Commission (2017a) Report on PES Implementation of the Youth Guarantee
European Commission Directorate-General for Employment Social Affairs and Inclusion
Publications Office of the European Union Luxembourg
European Commission (2017b) Assessment Report on PES Capacity European Commis-
sion and Directorate-General for Employment Social Affairs and Inclusion Publications
Office of the European Union Luxembourg
European Commission (2017c) Education amp Training Monitor 2017 Comparative Report
European Commission (2017d) JobsPlus Youth
European Commission (2017e) Youth Guarantee Country by Country March 2017
European Commission (2017f) Draft Joint Employment Report from the Commission and
the Council accompanying the Communication from the Commission on the Annual
Growth Survey 2018 COM (2017) 674 final Brussels
European Commission (2017g) Employment and Social Developments in Europe 2017
European Commission (2017h) European Semester Thematic Factsheet ndash Employment
Protection Legislation
European Commission (2018a) The Youth Guarantee Country by Country Brussels
European Commission (2018b) Data collection for monitoring of Youth Guarantee
schemes Employment Social Affairs amp Inclusion
European Commission (2018c) Continued Education Offers in the Youth Guarantee -
Experience from the ground
European Commission (2018d) Traineeship offers under the Youth Guarantee
European Commission (2018e) Activation measures for young people in vulnerable situ-
ations - Experience from the ground
European Commission (2018f) Effective outreach to NEETs - Experience from the
ground
European Commission (2018g) Youth Guarantee amp Youth Employment Initiative Fact-
sheet 2762018
European Commission (2018h) Employment and entrepreneurship under the Youth
Guarantee ndash Experiences from the ground
The Youth Guarantee in light of changes in the world of work Youth Guarantee Intervention Models Sustainability and Relevance
51
European Commission (2018i) Employment and Social Developments in Europe 2018
European Commission (2018j) data on national commitments regarding the European
Alliance for Apprenticeships httpeceuropaeusocialmainjspcatId=1148amplangId=en
European Commission (2018k) ESF and YEI financial data by end 2017 submitted
through SFC2014 by Member States ndash Note EU amounts have been calculated on the
basis of the applicable co-financing rates
European Commission (2018l) Continued Education Offers under the Youth Guarantee ndash
Experience from the ground Brussels
European Court of Auditors (2017) Youth unemployment ndash have EU policies made a dif-
ference An assessment of the Youth Guarantee and the Youth Employment Initiative
Publications Office of the European Union Luxembourg
European Employment Policy Observatory (EEPO) (2015) EEPO Country Reports ndash Ire-
land Implementation of the 2013 Recommendation on establishing a Youth Guarantee
European Parliament (2015) Differential Treatment of Workers under 25 with a view to
their Access to the Labour Market Directorate General for Internal Policies Policy De-
partment A Economic and Scientific Policy
European Parliament (2017a) Workshop Summary Report Youth Guarantee and Youth
Employment Initiative Lessons from implementation Policy Department A Economy
and Scientific Policy European Parliament Brussels
European Parliament (2017b) Youth Employment Initiative Lessons from implementa-
tion Policy Department A Economy and Scientific Policy European Parliament Brussels
European Parliament (2017c) Youth Guarantee Lessons from implementation Policy
Department A Economy and Scientific Policy European Parliament Brussels
European Parliament (2018) Ensuring high-quality job creation from EU funding pro-
grammes How can the best practice of Horizon 2020 be better integrated into other
programmes (ESF Youth Guarantee Globalisation Fund) Policy Department for Budget-
ary Affairs Directorate General for Internal Policies of the Union
European Trade Union Confederation (2018) Boosting Unionsrsquo Participation to Guarantee
Quality Transitions and Employment to Young People in Europe
European Youth Forum (2017) Excluding youth a threat to our future
European Youth Forum (2018) Updated position on the Implementation of the Youth
Guarantee Brussels Belgium
Eurostat (2015) Being Young in Europe Today
Eurostat (2018) How common is temporary employment in your country
Ghirelli C E Havari G Santangelo and M Scettri (2019) ldquoDoes on-the-job Training
Help Graduates Find a Job Evidence from an Italian Regionrdquo forthcoming in the Inter-
national Journal of Manpower 40(1)
Gower J C (1971) A general coefficient of similarity and some of its properties in
Biometrics Vol 27 Nr 4 S 857ndash872
Gregg P and Tominey E (2005) The wage scar from male youth unemployment La-
bour Economics 12 487ndash509
Indecon (2016) Indecon Evaluation of JobBridge Activation Programme Report pre-
pared by Indecon International Research Economists and submitted to the Department
of Social Protection
International Labour Organisation and European Commission (2017) National Outreach
Strategy for non-registered young unemployed and inactive young people in Portugal
The Youth Guarantee in light of changes in the world of work Youth Guarantee Intervention Models Sustainability and Relevance
52
Leigh-Doyle S (2014) Can subsidised employment and work-first measures assist the
labour market integration of low-skilled unemployed youth Peer Country Comments
paper ndash Ireland EU Peer Review on lsquoEmplois drsquoavenirrsquo ndash Jobs with a futurersquo Scheme Par-
is (France) 10-11 February 2014
Milligan G W and Cooper M C (1985) An examination of procedures for determining
the number of clusters in a dataset Psychometrika 50 159-179
OrsquoReilly J Eichhorst W Gaacutebos A Hadjivassiliou K Lain D Leschke J McGuin-
ness S Kurekovaacute L M Nazio T Ortlieb R Russell H and Villa P (2015) lsquoFive
Characteristics of Youth Unemployment in Europe Flexibility Education Migration
Family Legacies and EU Policyrsquo SAGE Open January-March 2015 1ndash19
Pastore F (2018) Why is youth unemployment so high and different across countries
IZA World of Labor 2018 420 doi 1015185izawol420
Pastore F (2015) The Youth Experience Gap Explaining National Differences in the
School-to-Work Transition Heidelberg Springer International Publishing AG 2015
Pohl A and Walther A (2005) Tackling Disadvantage in Youth Transitions - A Themat-
ic Study on Policy Measures Concerning Disadvantaged Youth Report funded by the EU
Action Programme to combat Social Exclusion October
Pohl A and Walther A (2007) Activating the Disadvantaged ndash Variations in Address-
ing Youth Transitions across Europe International Journal of Lifelong Education 265
pp533-553
Quintini G and Martin S (2014) lsquoSame Same but Different School-to-Work Transi-
tions in Emerging and Advanced Economiesrsquo OECD Social Employment and Migration
Working Papers No 154 OECD Publishing
Quintini Glenda and Martin John P and Martin Seacutebastien (2007) The Changing Nature
of the School-to-Work Transition Process in OECD Countries WDA-HSG Discussion Paper
No 2007-2
Scarpetta S A Sonnet and Manfredi T (2010) lsquoRising Youth Unemployment During
The Crisis How to Prevent Negative Long-term Consequences on a Generationrsquo OECD
Social Employment and Migration Working Papers No 106
Stokes D (2016) Opening gateways to work for youth But can success be guaran-
teed Peer Country Comments Paper ndash Ireland EU Peer Review on The Guarantee for
Youth (a particular measure within the broader context of the Youth Guarantee) Paris
(France) 7-8 April 2016
Tosun J Unt M and Wadensjouml E (2017) Youth‐oriented Active Labour Market Poli-
cies Explaining Policy Effort in the Nordic and the Baltic States Social Policy amp Admin-
istration 51 598ndash616
Treadwell Shine K (2016) lsquoYouth Guarantee in Irelandrsquo Department of Social Protec-
tion presentation Youth Opportunities at EU Level Cork
Walther A (2006) Regimes of Youth Transitions Choice Flexibility and Security in
Young Peoples Experiences across different European Contexts Young Vol 14 No 2
pp119ndash139
Ward J H Jr (1963) Hierarchical Grouping to Optimize an Objective Function Journal
of the American Statistical Association 58 236ndash244
The Youth Guarantee in light of changes in the world of work Youth Guarantee Intervention Models Sustainability and Relevance
53
Annex
Table 3 List of indicators
Indicator name and time of measurement
Source Explanation
Financial resources for implementing the Youth Guarantee
Initial YEI allocation (2014-2017)
EC (2016b) Euros-tat (nama_10_gdp)
YEI allocation in of GDP
YEI+ESF EU eligible cost
(2017)
EC (2018k) Euros-
tat (nama_10_gdp) YEI+ESF eligible cost in of GDP
Other ESF eligible cost (2017)
EC (2018k) Euros-tat (nama_10_gdp)
Other ESF eligible cost in of GDP
Share of declared YEI+ESF funds (2017)
EC (2018k) Declared YEI+ESF funds as a share of eligible cost
Estimated cost of the YG (2015)
Eurofound (2015)
Binary indicator for medium cost (03-06 of
GDP) reference category low cost
Binary indicator for high cost (gt06 of GDP) reference category low cost
Change in ALMP expenditure (2012 to 2015)
Eurostat (lmp_expsumm)
Difference in ALMP expenditure in of GDP
YG as part of national policy-making
Number of youth-related ALMP reforms (2013-2016)
LABREF database Absolute number of reforms
Number of additional measures beyond Recom-mendation implemented in the context of the YG (2016)
EC (2016c)
Sum of binary indicators for additional measures regarding school dropout social and welfare policies volunteering social economy and oth-er
Share of YG exits with un-known destination (2016)
EC (2018b)
Binary indicator for an unknown share of 10-30 reference category 0-10
Binary indicator for an unknown share of more than 30 reference category 0-10
Share of unknown situations in the six month follow up
(2016)
EC (2018b)
Binary indicator for an unknown share of 40-99 reference category 0-39
Binary indicator for an unknown share of 100 reference category 0-39
Involvement of social part-ners (2016)
EC (2016c) Sum of binary indicators for the involvement of social partners in design implementation and evaluationmonitoring
Involvement of youth organi-sations (2016)
EC (2016c) Sum of binary indicators for the involvement of social partners in design implementation and
evaluationmonitoring
PES involvement of youth in design of YG (2017)
EC (2017a) Binary indicator
PES involvement of youth organisations in design of YG (2017)
EC (2017a) Binary indicator
Partnerships formed by PES (2017)
EC (2017a)
Sum of binary indicators for PES partnerships aimed at increasing information availability increasing workeducation opportunities and easing the transition into employment from educationunemployment
The Youth Guarantee in light of changes in the world of work Youth Guarantee Intervention Models Sustainability and Relevance
54
Indicator name and time of measurement
Source Explanation
Youth labour market challenges
Youth share of total popula-tion (2012)
Eurostat (lfsa_pgaed)
Number of youth (15-24) expressed as of total population
Youth-to-adult unemploy-ment ratio (2012)
Eurostat (une_rt_a) Youth (15-24) unemployment rate divided by adult unemployment rate (25-74)
NEET rate among 15-29 year
olds (2012)
Eurostat
(edat_lfse_21)
Total number of NEETs aged between 15 and 29
in of total youth population
Difference in temporary em-ployment shares (2012)
Eurostat (lfsi_pt_a) Difference in temporary employment rates be-tween youth (15-24) and adults (25-54)
Share of early school-leavers (2012)
Eurostat (edat_lfse_14)
Share of early school-leavers as of youth population (18-24)
Share of low-educated NEETs
(2012) Eurostat (edat_lfse_21)
Number of NEETs with low education back-
ground divided by total number of NEETs (15-24)
Share of medium-educated NEETs (2012)
Number of NEETs with medium education back-ground divided by total number of NEETs (15-24)
Share of employment offers (2016)
European Commis-sion (2018b)
Number of employment offers as of total offers typically made to participants
Share of timely exits into employment (2016)
European Commis-sion (2018b)
Number of exits into employment as of total timely exits from the YG
Share of education offers (2016)
European Commis-sion (2018b)
Number of education offers ias of total offers typically made to participants
Share of timely exits into education (2016)
European Commis-sion (2018b)
Number of exits into education as of total timely exits from the YG
The heterogeneity of the NEET population
Share of re-entrants among NEET (2013)
Eurofound (2016) Number of individuals in the respective group in of total NEET population
Share of short-term unem-ployed among NEET (2013)
Share of long-term unem-ployed among NEET (2013)
Share of individuals with illnessesdisabilities among NEET (2013)
Share of individuals with family responsibilities among NEET (2013)
Share of discouraged workers among NEET (2013)
PES responsibility regarding paying of unemployment benefits (2017)
European Commis-sion (2017b)
Binary indicator for the PES responsibility
PES responsibility regarding administering unemployment benefits (2017)
PES responsibility regarding other types of benefits
(2017)
The Youth Guarantee in light of changes in the world of work Youth Guarantee Intervention Models Sustainability and Relevance
55
Indicator name and time of measurement
Source Explanation
Number of responsibilities of the PES within the YG (2017)
European Commis-sion (2017a)
Sum of binary indicators for the PES being re-sponsible for managing the YG scheme regis-tering unemployed youth providing (placement) services to youth coordinating partners out-reach to NEETs follow-up of participants and design and maintenance of the monitoring scheme
PES outreach activities
(2017)
European Commis-
sion (2017a)
Binary indicator for the PES having awareness raising initiatives
Binary indicator for the PES having outreach programmes for pro-active work with schools
Binary indicator for the PES to cooperate with NGOs and youth organisations for outreach
Binary indicator for the PES to have specific outreach caseworkers
Binary indicator for the PES to have new points of entry (via new media)
Binary indicator for the PES to provide single-point servicesone-stop shops
Binary indicator for the PES to have mobile PES initiatives
Binary indicator for the PES to have follow-up programmes to reach out to YG drop-outs
PES programme for prevent-ing high school dropout (2017)
European Commis-sion (2017a)
Binary indicator
Design and implementation features of the Youth Guarantee
Eligible age group (2016) European Commis-sion (2016c)
Binary indicator for YG eligible age group being under 25 year and recent graduates reference category under 25
Binary indicator for YG eligible age group being under 26 reference category under 25
Binary indicator for YG eligible age group being
under 27 reference category under 25
Binary indicator for YG eligible age group being under 30 reference category under 25
Envisaged time-frame of intervention (2016)
European Commis-sion (2016c)
Binary indicator for the target time frame being below 4 months reference category 4 months
Binary indicator for the target time frame being above 4 months reference category 4 months
YG scheme specifically tar-geting long-term unemployed (2016)
Escudero and Mourelo (2017)
Binary indicator
Main YG provider (2016) European Commis-sion (2016c)
Binary indicator for the YG to be provided main-ly by the PES and other institutions reference category only PES
Binary indicator for the YG to be provided main-
ly by other institutions reference category only PES
The Youth Guarantee in light of changes in the world of work Youth Guarantee Intervention Models Sustainability and Relevance
56
Indicator name and time of measurement
Source Explanation
Degree to which online regis-
tration for the YG is possible (2016)
European Commis-sion (2016c)
Binary indicator for online registration being partly possible reference category not at all
Binary indicator for online registration being
possible everywhere reference category not at all
Legal entitlement to offer (2016)
European Commis-sion (2016c)
Binary indicator for whether there exists an entitlement for young people to receive an offer in line with or similar to the Youth Guarantee
Previous experience with a
YG-type of framework (2014)
European Commis-
sion (2016c)
Binary indicator for having recent experience with a YG-type of framework reference catego-ry none
Binary indicator for having longer experience with a YG-type of framework reference catego-ry none
Formal definition of quality
offer (2016)
European Commis-
sion (2016c)
Binary indicator having formally defined offer
quality
National quality guidelines (2017)
European Commis-sion (2017a)
Binary indicator having national quality guide-lines from the national administration to all PES officesother organisations involved in the YG
PES has YG-specific staff (2017)
European Commis-sion (2017a)
Binary indicator for having YG-specific staff
PES training (2017) European Commis-sion (2017a)
Binary indicator for the PES providing training specifically tailored working with youth
PES staff increase (2014-2017)
European Commis-sion (2017a)
Binary indicator for the PES having in-creasedunchanged staff from 2014-2017
PES has youth-specific tar-
gets (2017)
European Commis-
sion (2017a)
Binary indicator for the PES having youth-
specific targets
The role of the apprenticeship system in the YG
Share of firms with IVET participants (2010)
Eurostat (trng_cvt_34s)
Share of firms hiring initial vocational training participants expressed as a of all firms
Share of apprenticeship of-fers (2016)
European Commis-sion (2018b)
Number of offers of apprenticeships as of total offers typically made to participants
Share of timely exits into apprenticeships (2016)
European Commis-sion (2018b)
Number of exits into apprenticeships as of total timely exits from the YG
School-to-work transition cluster (2005)
PohlWalther (2005)
Binary indicator for STW being of type transi-tionalpost-socialist reference category miss-ing
Binary indicator for STW being of type sub-protective reference category missing
Binary indicator for STW being of type univer-salistic reference category missing
Binary indicator for STW being of type liberal reference category missing
Binary indicator for STW being of type employ-ment-centred reference category missing
Number of EAfA pledges (2018)
European Commis-sion (2018j)
Number of pledges to increase apprenticeships by firms or organisations normalised by the share of firms hiring IVETs
The Youth Guarantee in light of changes in the world of work Youth Guarantee Intervention Models Sustainability and Relevance
57
Table 4 Outcome cluster means
Cluster A Cluster B Cluster C Cluster D
ldquoCoveragerdquo rate (in ) 488 76 479 448
Share in preparatory phase beyond four
months (in )
433 284 606 519
Share of positive and timely exits (in ) 511 740 366 372
Share with positive situation after six
months (in )
576 521 562 60
Reduction in youth unemployment (in
-points)
37 121 145 62
Reduction in NEET rates (in -points) 11 42 43 18
Note This table shows cluster means (averages) for a cluster analysis solely based on the authorsrsquo measures
of performance (see section 35 for their description) The analysis creates Cluster A (AT BE DK IT LT LU
and SE) Cluster B (BG HU and MT) Cluster C (EL ES HR IE PT and SK) and cluster D (CY CZ DE EE FI
FR LV NL PL RO SI and UK)
The Youth Guarantee in light of changes in the world of work Youth Guarantee Intervention Models Sustainability and Relevance
58
HOW TO OBTAIN EU PUBLICATIONS
Free publications
bull one copy
via EU Bookshop (httpbookshopeuropaeu)
bull more than one copy or postersmaps
from the European Unionrsquos representations (httpeceuropaeurepresent_enhtm)
from the delegations in non-EU countries
(httpeeaseuropaeudelegationsindex_enhtm)
by contacting the Europe Direct service
(httpeuropaeueuropedirectindex_enhtm) or calling 00 800 6 7 8 9 10 11 (free-
phone number from anywhere in the EU) () () The information given is free as are most calls (though some operators phone boxes or hotels may charge you)
Priced publications
bull via EU Bookshop (httpbookshopeuropaeu)
Priced subscriptions
bull via one of the sales agents of the Publications Office of the European Union
(httppublicationseuropaeuothersagentsindex_enhtm)
doi 102767371432
KE-0
1-1
9-1
28-E
N-N


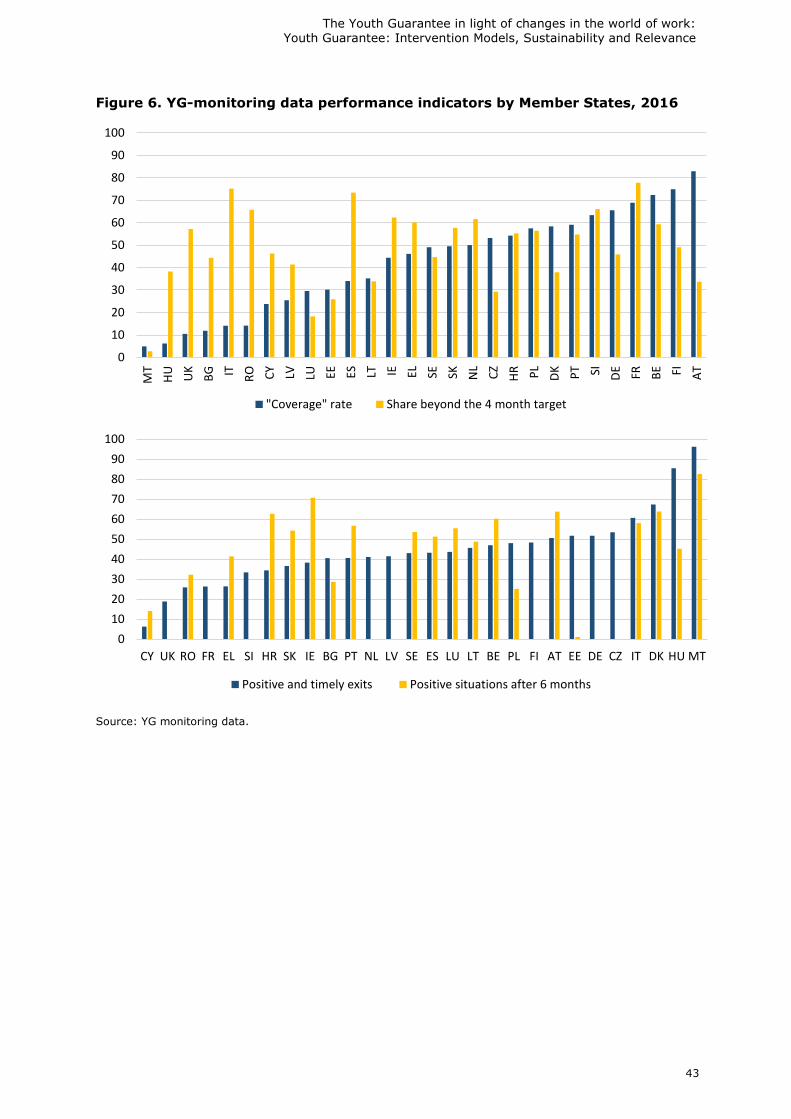


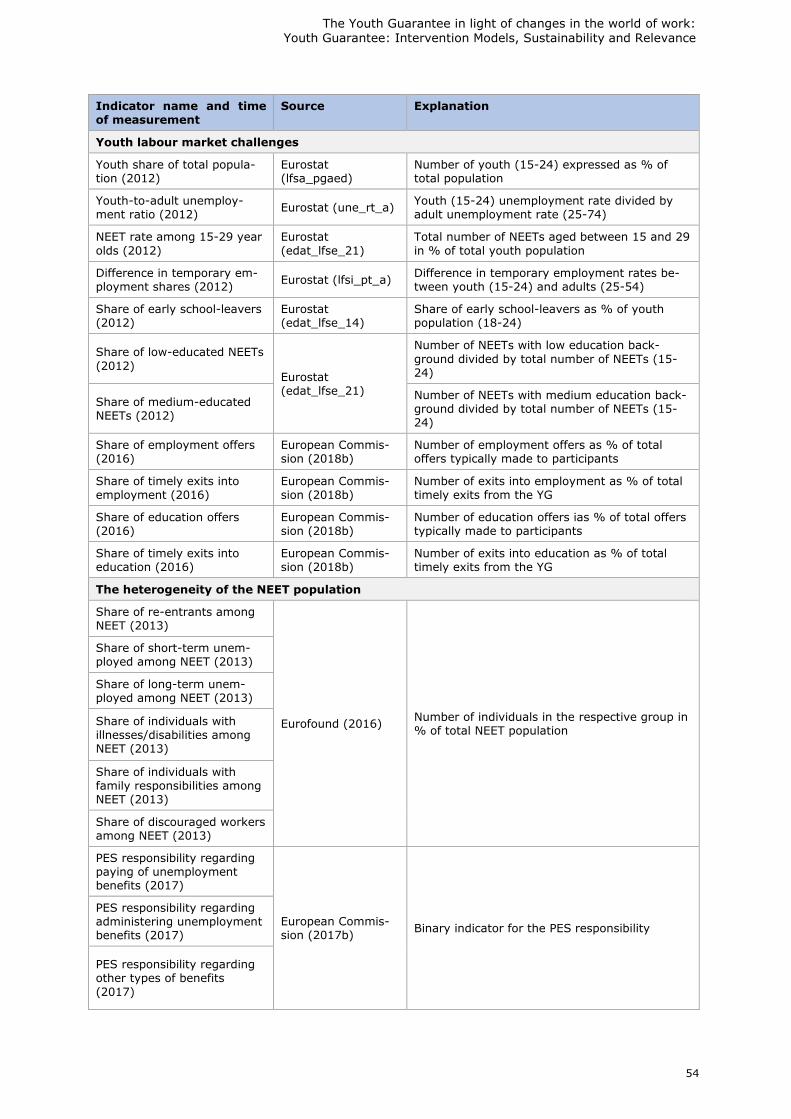

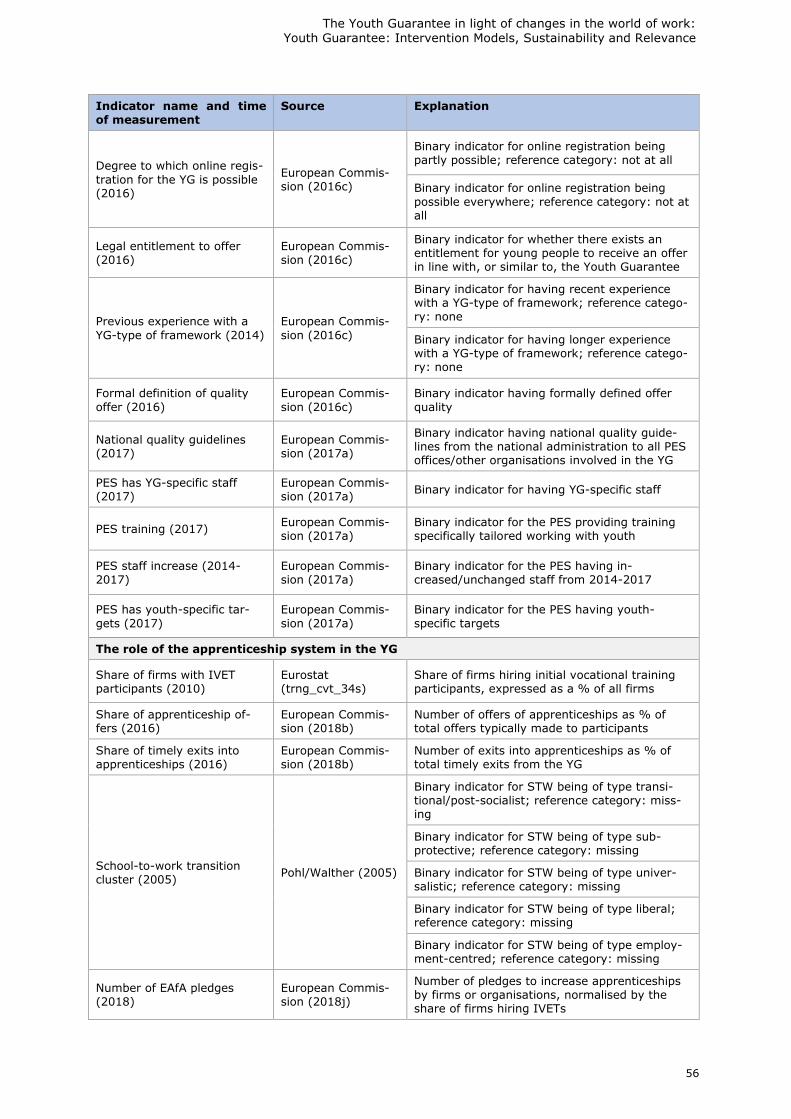
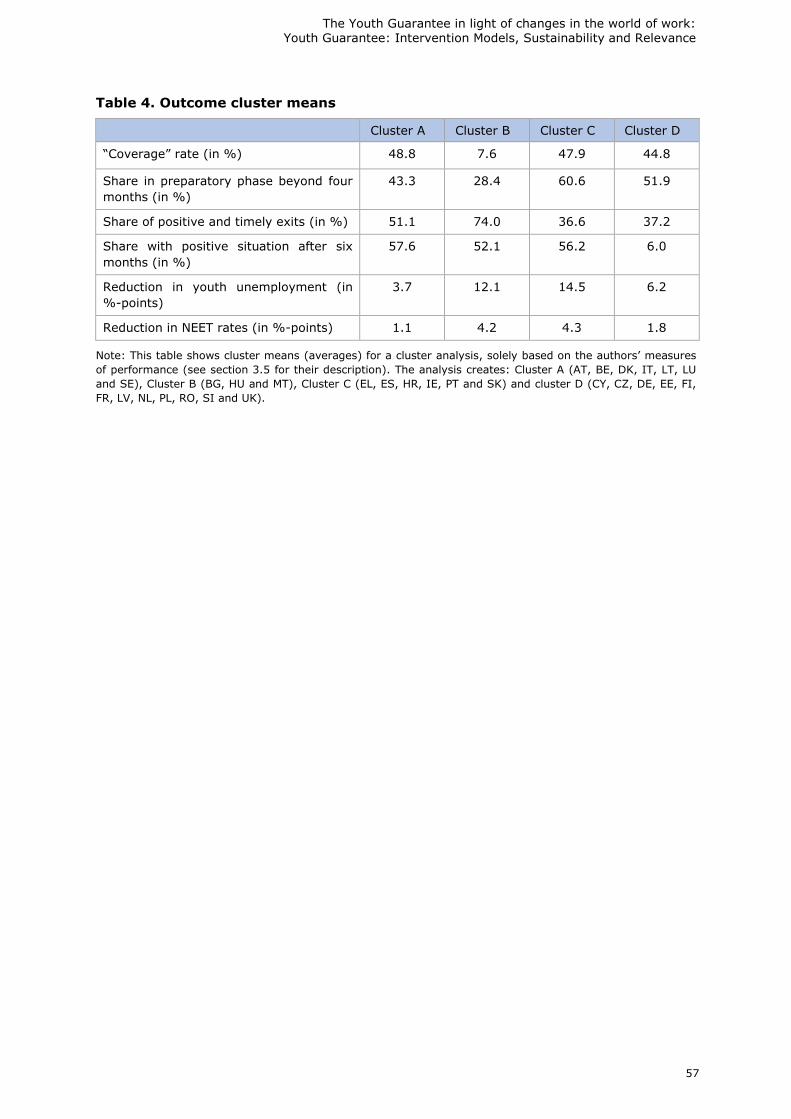


Related Documents