water Article Study on the Staged Operation of a Multi-Purpose Reservoir in Flood Season and Its Effect Evaluation Chongxun Mo 1,2,3 , Can Zhu 1,2,3 , Yuli Ruan 1,2,3, * , Xingbi Lei 1,2,3 , Zhenxiang Xing 4 and Guikai Sun 1,2,3 Citation: Mo, C.; Zhu, C.; Ruan, Y.; Lei, X.; Xing, Z.; Sun, G. Study on the Staged Operation of a Multi-Purpose Reservoir in Flood Season and Its Effect Evaluation. Water 2021, 13, 2563. https://doi.org/10.3390/ w13182563 Academic Editor: Momcilo Markus Received: 10 August 2021 Accepted: 15 September 2021 Published: 17 September 2021 Publisher’s Note: MDPI stays neutral with regard to jurisdictional claims in published maps and institutional affil- iations. Copyright: © 2021 by the authors. Licensee MDPI, Basel, Switzerland. This article is an open access article distributed under the terms and conditions of the Creative Commons Attribution (CC BY) license (https:// creativecommons.org/licenses/by/ 4.0/). 1 College of Architecture and Civil Engineering, Guangxi University, Nanning 530004, China; [email protected] (C.M.); [email protected] (C.Z.); [email protected] (X.L.); [email protected] (G.S.) 2 Key Laboratory of Disaster Prevention and Structural Safety of the Ministry of Education, Nanning 530004, China 3 Guangxi Key Laboratories of Disaster Prevention and Engineering Safety, Nanning 530004, China 4 School of Water Conservancy and Civil Engineering, Northeast Agricultural University, Harbin 150006, China; [email protected] * Correspondence: [email protected] Abstract: A reasonable analysis of flood season staging is significant to the management of floods and the alleviation of water shortage. For this paper, the case of the Chengbi River Reservoir in China was selected for study. Based on fractal theory, the flood season is divided into several sub-seasons by using four indexes (multi-year average daily rainfall, multi-year maximum rainfall, multi-year average daily runoff, and multi-year maximum daily runoff) in this study. Also the Benefit-Risk theory is applied to evaluate the effects of staged dispatching. The results show that the flood season of the Chengbi River basin should be divided into the pre-flood season (13 April–6 June), the main flood season (7 June–9 September) and the post-flood season (10 September–31 October). After adjusting the flood limit water level for sub-season and benefit assessment, the probability of exceedance after reservoir flood season operation increases by 0.13 × 10 -5 , the average annual expected risk is 0.2264 million RMB, and the average annual benefit increases by 0.88–1.62 million RMB. The benefits obtained far outweigh the risks, indicating the importance of staging the flood season. Keywords: effect evaluation; fractal method; flood season staging; multi-purpose reservoir; probabil- ity of exceedance; staged operation 1. Introduction According to the statistics of the United Nations Environment Program, compared to the past 100 years, the global annual water resources per capita have reduced from 40,000 m 3 to 6840 m 3 . Additionally, it is expected that by 2030, nearly 50% of the world’s population will have less than 1000 m 3 of annual per capita water resources and will be in a state of severe water shortage [1]. With the development of society and growing populations, water shortages are becoming more and more prominent. However, large amounts of water have been discharged during the flood season, resulting in a huge waste of water resources. Nowadays, the use of floods has become more and more important in most areas [2]. Reservoir scheduling is an effective way to utilize flood resources and has been studied by a large number of scholars [3–6]. In most of the countries, floods have seasonal patterns of change, and it is necessary to study the flood season and stage it rationally to raise the FLWL (flood limit water level) of the reservoir appropriately. In this way, flood resources can be used to a greater degree, which is one of the important issues that needs to be studied and solved today. There have been many studies on the seasonal patterns and staging of floods during the flood season [7–12]. Different staging methods have been used to segment the flood season, such as the probabilistic change-point analysis technique [13], the vector statistic and relative frequency method [14–17], and the fuzzy set method [18–21]. As for the Water 2021, 13, 2563. https://doi.org/10.3390/w13182563 https://www.mdpi.com/journal/water

Welcome message from author
This document is posted to help you gain knowledge. Please leave a comment to let me know what you think about it! Share it to your friends and learn new things together.
Transcript
water
Article
Study on the Staged Operation of a Multi-Purpose Reservoir inFlood Season and Its Effect Evaluation
Chongxun Mo 1,2,3, Can Zhu 1,2,3, Yuli Ruan 1,2,3,* , Xingbi Lei 1,2,3, Zhenxiang Xing 4 and Guikai Sun 1,2,3
�����������������
Citation: Mo, C.; Zhu, C.; Ruan, Y.;
Lei, X.; Xing, Z.; Sun, G. Study on the
Staged Operation of a Multi-Purpose
Reservoir in Flood Season and Its
Effect Evaluation. Water 2021, 13,
2563. https://doi.org/10.3390/
w13182563
Academic Editor: Momcilo Markus
Received: 10 August 2021
Accepted: 15 September 2021
Published: 17 September 2021
Publisher’s Note: MDPI stays neutral
with regard to jurisdictional claims in
published maps and institutional affil-
iations.
Copyright: © 2021 by the authors.
Licensee MDPI, Basel, Switzerland.
This article is an open access article
distributed under the terms and
conditions of the Creative Commons
Attribution (CC BY) license (https://
creativecommons.org/licenses/by/
4.0/).
1 College of Architecture and Civil Engineering, Guangxi University, Nanning 530004, China;[email protected] (C.M.); [email protected] (C.Z.); [email protected] (X.L.);[email protected] (G.S.)
2 Key Laboratory of Disaster Prevention and Structural Safety of the Ministry of Education,Nanning 530004, China
3 Guangxi Key Laboratories of Disaster Prevention and Engineering Safety, Nanning 530004, China4 School of Water Conservancy and Civil Engineering, Northeast Agricultural University,
Harbin 150006, China; [email protected]* Correspondence: [email protected]
Abstract: A reasonable analysis of flood season staging is significant to the management of floodsand the alleviation of water shortage. For this paper, the case of the Chengbi River Reservoir in Chinawas selected for study. Based on fractal theory, the flood season is divided into several sub-seasonsby using four indexes (multi-year average daily rainfall, multi-year maximum rainfall, multi-yearaverage daily runoff, and multi-year maximum daily runoff) in this study. Also the Benefit-Risk theoryis applied to evaluate the effects of staged dispatching. The results show that the flood season of theChengbi River basin should be divided into the pre-flood season (13 April–6 June), the main floodseason (7 June–9 September) and the post-flood season (10 September–31 October). After adjustingthe flood limit water level for sub-season and benefit assessment, the probability of exceedanceafter reservoir flood season operation increases by 0.13× 10⁻⁵, the average annual expected risk is0.2264 million RMB, and the average annual benefit increases by 0.88–1.62 million RMB. The benefitsobtained far outweigh the risks, indicating the importance of staging the flood season.
Keywords: effect evaluation; fractal method; flood season staging; multi-purpose reservoir; probabil-ity of exceedance; staged operation
1. Introduction
According to the statistics of the United Nations Environment Program, comparedto the past 100 years, the global annual water resources per capita have reduced from40,000 m3 to 6840 m3. Additionally, it is expected that by 2030, nearly 50% of the world’spopulation will have less than 1000 m3 of annual per capita water resources and will bein a state of severe water shortage [1]. With the development of society and growingpopulations, water shortages are becoming more and more prominent. However, largeamounts of water have been discharged during the flood season, resulting in a huge wasteof water resources. Nowadays, the use of floods has become more and more importantin most areas [2]. Reservoir scheduling is an effective way to utilize flood resources andhas been studied by a large number of scholars [3–6]. In most of the countries, floodshave seasonal patterns of change, and it is necessary to study the flood season and stage itrationally to raise the FLWL (flood limit water level) of the reservoir appropriately. In thisway, flood resources can be used to a greater degree, which is one of the important issuesthat needs to be studied and solved today.
There have been many studies on the seasonal patterns and staging of floods duringthe flood season [7–12]. Different staging methods have been used to segment the floodseason, such as the probabilistic change-point analysis technique [13], the vector statisticand relative frequency method [14–17], and the fuzzy set method [18–21]. As for the
Water 2021, 13, 2563. https://doi.org/10.3390/w13182563 https://www.mdpi.com/journal/water
Water 2021, 13, 2563 2 of 11
selection of indicator factors for staging, most previous studies have used a single factor tostage the flood season. For example, peak flow [22] or average daily maximum flow [23]are used as a single indicator factor for flood staging studies, causing the staging results tonot be mutually verified. A reasonable determination of the FLWL is the key to coordinateflood risk and reservoir benefit [24]. Therefore, many scholars have carried out extensiveresearch on the optimization of FLWL. An FLWL model dynamic control was applied toreservoirs with indeterminate flood process lines, which effectively improved hydropowergeneration and flood utilization [25]. Liu et al. [26] optimized the design of staged floodlimit levels, and a framework for optimal reservoir scheduling based on flood stagingresults was proposed [27].
In summary, most previous studies have used a single indicator factor for flood stagingleading to uncertainty in the results. In addition, there is less involvement in the calculationof FLWLs for each phase and the evaluation of the benefits of the flood staging. Therefore,the objective of this study is to stage the flood season by selecting multiple indicatorfactors and then evaluate the benefits of the staging results. The Chengbi River reservoir isselected as the object of this study. Multi-year average daily rainfall time series, multi-yearmaximum rainfall time series, multi-year average daily runoff time series, and multi-yearmaximum daily runoff time series are used as index factors to divide flood season by fractalmethod. The benefit-risk theory is applied to evaluate the effects of staged dispatching.
2. Methodology2.1. Fractal Method
According to fractal theory, hydrological processes that exhibit periodic changes overa certain period of time (influenced by deterministic factors) can be considered to be self-similar [28]. The occurrence of seasonality and timing of floods can be considered to havesimilar mechanisms, and so the fractal theory has been used in flood staging [29]. Thefractal feature is described by capacity dimension. Assuming F is a bounded subset of thed-dimensional Euclid space and N(ε) is the least number of closures covering F of radius ε,then the capacity dimension Db is defined as follows [30].
Db = limε→0
(log N(ε)/ log(1/ε)) (1)
The capacity dimension is calculated as follows:
(1) Take the sample point series x1, x2, · · · , xn in the flood season, and determine theperiod length T according to the start length and step span of the sample period, thenselect the flood season segmentation level Y in period T to reflect its sample.
(2) Take the time scale ε = {1d, 2d, . . . , 10d} and count the number of periods N(ε) inwhich the sample xi exceeds the segmentation level Y. Calculate the correspondingrelative time scales NT(ε) and relative measures NN(ε) from Equation (2) and Equa-tion (3) based on T and ε, and a linear fit to ln(ε) and ln NN(ε) to find the slope b ofthe correlation. The capacity dimension Db is obtained from Equation (4).
NT(ε) = T/ε (2)
NN(ε) = N(ε)/NT(ε) (3)
Db = 2− b (4)
(3) Change the period length T and repeat the above steps. If the Db obtained is basicallyequal, then T at this time is the same stage.
Water 2021, 13, 2563 3 of 11
2.2. Risk and Benefit Analysis Methodology2.2.1. Probability of Exceedance
Considering only the effect of flooding factors, the reservoir staging dispatch probabil-ity of exceedance calculation model is as follows.
P = P(q ≥ Q) (5)
where q represents a random variable. P-III (Pearson type III) curve is generally used inflood peak discharge frequency curve. Then its density function can be expressed as
f (q) =βα
Γ(α)(q− a0)
α−1e−β(q−a0) (6)
Γ(α)—The gamma function of α.α, β, a0—Three parameters characterizing the shape, scale and location of P-III distri-
bution. α > 0, β > 0.The cumulative distribution function can be expressed as
P = P(q ≥ Q) =∫ ∞
Qf (q)dq (7)
2.2.2. Benefit Analysis
In the benefit analysis, the reservoir capacity should be calculated according to theactual situation. The increased capacity will not only bring direct benefits in terms of powergeneration and water supply, but also generate indirect economic benefits such as irrigation,farming, tourism, etc. Water supply and power generation benefits are calculated using thefollowing formula.
W = V × η (8)
where W is the economic benefit from water supply or electricity generation, V is theadditional storage capacity after adjusting the FLWL, and η is the economic efficiency forone cubic meter of water.
3. Study Area and Data
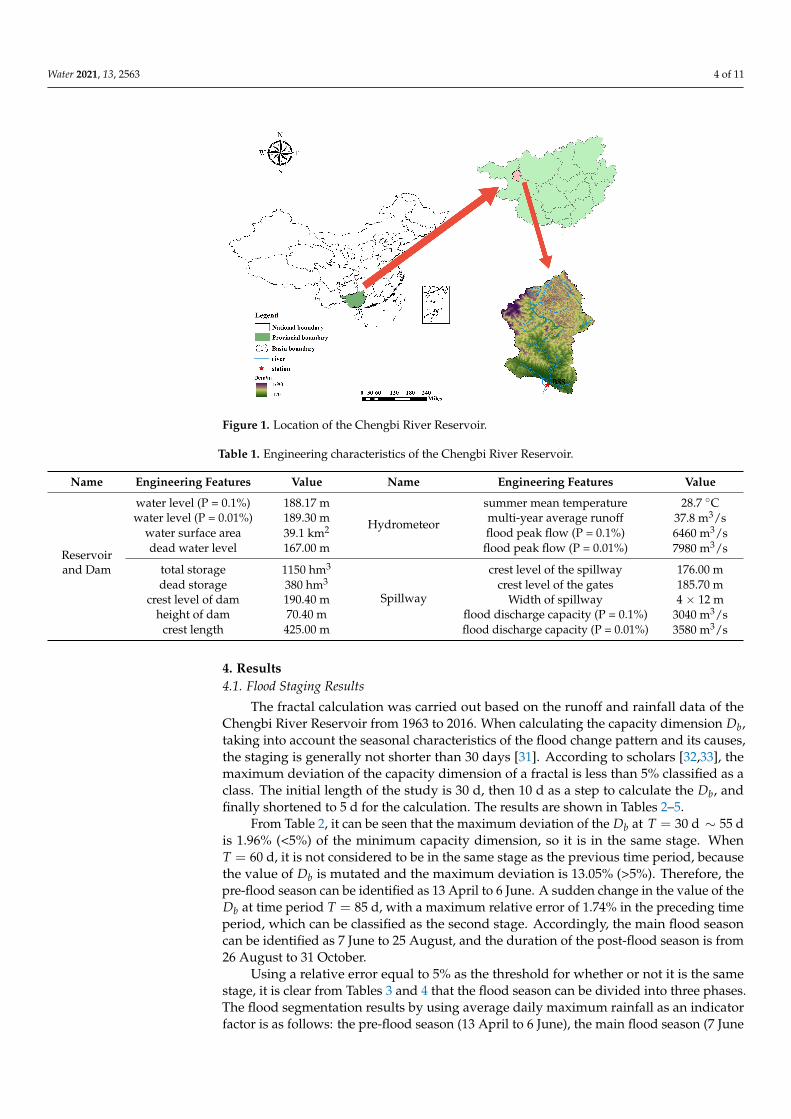
The Chengbi River Reservoir is located in Baise City, Guangxi Province, downstreamof Chengbi River, (106◦21′ E–106◦48′ E, and 23◦50′ N–24◦45′ N) (Figure 1). It is the second-largest earth-rock fill dam reservoir project in China, with a total storage capacity of1.15 billion m3 and a normal storage level of 185 m. The engineering characteristicsparameters of the reservoir are shown in Table 1. It operates under the rule of a singleFLWL for the entire flood season, resulting in a low storage rate after floods and a largewaste of flood resources. The average precipitation of the watershed over the years is1560 mm, and the rainfall is unevenly distributed during the year, mostly concentratedin April to September, accounting for more than 85% of the annual rainfall. The floodseason of the Chengbi River is from 13 April to 31 October with a low storage rate afterflood season. The data selected in this paper are the daily precipitation and daily measuredrunoff from Ba Shou Station (BSS) from 1963 to 2016, and the four index factors (averagedaily rainfall, maximum daily rainfall, average daily runoff, and maximum daily runoff)which reflect the characteristics of the flooding period are used as the basic data of staging.
Water 2021, 13, 2563 4 of 11
Water 2021, 13, x FOR PEER REVIEW 4 of 11
maximum daily rainfall, average daily runoff, and maximum daily runoff) which reflect the characteristics of the flooding period are used as the basic data of staging.
Figure 1. Location of the Chengbi River Reservoir.
Table 1. Engineering characteristics of the Chengbi River Reservoir.
Name Engineering Features Value Name Engineering Features Value
Reservoir and Dam
water level (P = 0.1%) 188.17 m
Hydrometeor
summer mean temperature 28.7 °C water level (P = 0.01%) 189.30 m multi-year average runoff 37.8 m3/s
water surface area 39.1 km2 flood peak flow (P = 0.1%) 6460 m3/s dead water level 167.00 m flood peak flow (P = 0.01%) 7980 m3/s
total storage 1150 hm3
Spillway
crest level of the spillway 176.00 m dead storage 380 hm3 crest level of the gates 185.70 m
crest level of dam 190.40 m Width of spillway 4 × 12 m height of dam 70.40 m flood discharge capacity (P = 0.1%) 3040 m3/s
crest length 425.00 m flood discharge capacity (P = 0.01%) 3580 m3/s
4. Results 4.1. Flood Staging Results
The fractal calculation was carried out based on the runoff and rainfall data of the
Chengbi River Reservoir from 1963 to 2016. When calculating the capacity dimension bD
, taking into account the seasonal characteristics of the flood change pattern and its causes, the staging is generally not shorter than 30 days [31]. According to scholars [32,33], the maximum deviation of the capacity dimension of a fractal is less than 5% classified as a
class. The initial length of the study is 30 d, then 10 d as a step to calculate the bD , and finally shortened to 5 d for the calculation. The results are shown in Tables 2–5.
From Table 2, it can be seen that the maximum deviation of the bD at 30 ~ 55T d d= is 1.96% (<5%) of the minimum capacity dimension, so it is in the same stage. When
60T d= , it is not considered to be in the same stage as the previous time period, because
the value of bD is mutated and the maximum deviation is 13.05% (>5%). Therefore, the pre-flood season can be identified as 13 April to 6 June. A sudden change in the value of
Figure 1. Location of the Chengbi River Reservoir.
Table 1. Engineering characteristics of the Chengbi River Reservoir.
Name Engineering Features Value Name Engineering Features Value
Reservoirand Dam
water level (P = 0.1%) 188.17 m
Hydrometeor
summer mean temperature 28.7 ◦Cwater level (P = 0.01%) 189.30 m multi-year average runoff 37.8 m3/s
water surface area 39.1 km2 flood peak flow (P = 0.1%) 6460 m3/sdead water level 167.00 m flood peak flow (P = 0.01%) 7980 m3/s
total storage 1150 hm3
Spillway
crest level of the spillway 176.00 mdead storage 380 hm3 crest level of the gates 185.70 m
crest level of dam 190.40 m Width of spillway 4 × 12 mheight of dam 70.40 m flood discharge capacity (P = 0.1%) 3040 m3/s
crest length 425.00 m flood discharge capacity (P = 0.01%) 3580 m3/s
4. Results4.1. Flood Staging Results
The fractal calculation was carried out based on the runoff and rainfall data of theChengbi River Reservoir from 1963 to 2016. When calculating the capacity dimension Db,taking into account the seasonal characteristics of the flood change pattern and its causes,the staging is generally not shorter than 30 days [31]. According to scholars [32,33], themaximum deviation of the capacity dimension of a fractal is less than 5% classified as aclass. The initial length of the study is 30 d, then 10 d as a step to calculate the Db, andfinally shortened to 5 d for the calculation. The results are shown in Tables 2–5.
From Table 2, it can be seen that the maximum deviation of the Db at T = 30 d ∼ 55 dis 1.96% (<5%) of the minimum capacity dimension, so it is in the same stage. WhenT = 60 d, it is not considered to be in the same stage as the previous time period, becausethe value of Db is mutated and the maximum deviation is 13.05% (>5%). Therefore, thepre-flood season can be identified as 13 April to 6 June. A sudden change in the value of theDb at time period T = 85 d, with a maximum relative error of 1.74% in the preceding timeperiod, which can be classified as the second stage. Accordingly, the main flood seasoncan be identified as 7 June to 25 August, and the duration of the post-flood season is from26 August to 31 October.
Using a relative error equal to 5% as the threshold for whether or not it is the samestage, it is clear from Tables 3 and 4 that the flood season can be divided into three phases.The flood segmentation results by using average daily maximum rainfall as an indicatorfactor is as follows: the pre-flood season (13 April to 6 June), the main flood season (7 June
Water 2021, 13, 2563 5 of 11
to 30 August), the post-flood season (31 August to 31 October). The flood segmentationresults by using average daily maximum rainfall as an index factor is as follows: thepre-flood season (13 April to 11 June), the main flood season (12 June to 30 August), and thepost-flood season (31 August to 31 October). As shown in Table 5, the flood segmentationusing multi-year average daily maximum runoff can be divided into four phases, butaccording to the Code for Hydraulic Calculations for Water Projects, a flood should notbe divided into more than three sub-flood seasons. Therefore, based on the multi-yearrunoff characteristics of the Chengbi River basin, combining the first and second phasesinto one as the pre-flood season. Then, the pre-flood season is from 13 April to 16 June,the main flood season is from 17 June to 9 September, and the post-flood season is from10 September to 31 October.
Table 2. Staging results of multi-year average daily rainfall.
Stages Duration T (d) Threshold Levels (mm) Staged Period Slope b Db Relative Error (%)
The firststage
30 65 13 April–12 May 0.547 1.453 —40 71 13 April–22 May 0.575 1.425 1.9650 75 13 April–1 June 0.569 1.431 1.9655 74 13 April–6 June 0.563 1.437 1.9660 75 13 April–11 June 0.389 1.611 13.05
Thesecondstage
30 113 7 June–6 July 0.499 1.501 —40 105 7 June–16 July 0.493 1.507 0.4050 100 7 June–26 July 0.509 1.491 1.0760 101 7 June–5 August 0.49 1.51 1.2770 104 7 June–15 August 0.483 1.517 1.7480 98 7 June–25 August 0.489 1.511 1.7485 97 7 June–30 August 0.342 1.658 11.2
The thirdstage
30 65 26 August–24 September 0.529 1.471 —40 64 26 August–4 October 0.519 1.481 0.6850 65 26 August–14 October 0.523 1.477 0.6860 62 26 August–24 October 0.523 1.477 0.6867 62 26 August–31 October 0.501 1.499 0.68
Table 3. Staging results of multi-year maximum daily rainfall.
Stages Duration T (d) Threshold Levels (mm) Staged Period Slope b Db Relative Error (%)
The firststage
30 65 13 April–12 May 0.568 1.432 —40 71 13 April–22 May 0.575 1.425 0.4950 75 13 April–1 June 0.568 1.432 0.4955 74 13 April–6 June 0.562 1.438 0.9160 75 13 April–11 June 0.489 1.511 6.04
Thesecondstage
30 113 7 June–6 July 0.580 1.42 —40 104 7 June–16 July 0.581 1.419 0.8550 100 7 June–26 July 0.569 1.431 0.8560 100 7 June–5 August 0.561 1.439 1.4170 103 7 June–15 August 0.585 1.415 1.7080 98 7 June–25 August 0.585 1.415 1.7085 97 7 June–30 August 0.571 1.429 1.7090 96 7 June–4 September 0.469 1.531 8.20
The thirdstage
30 61 31 August–29 September 0.423 1.577 —40 58 31 August–9 October 0.461 1.539 2.4750 62 31 August–19 October 0.453 1.547 2.4762 60 31 August–31 October 0.473 1.527 3.27
Water 2021, 13, 2563 6 of 11
Table 4. Staging results of multi-year average daily runoff.
Stages Duration T (d) Threshold Levels (m3/s) Staged Period Slope b Db Relative Error (%)
The firststage
30 10 13 April–12 May 0.185 1.815 —40 15 13 April–22 May 0.183 1.817 0.1150 24 13 April–1 June 0.207 1.793 1.3460 32 13 April–11 June 0.184 1.816 1.3465 36 13 April–16 June 0.115 1.885 5.1370 40 13 April–21 June 0.047 1.953 8.92
Thesecondstage
30 105 12 June–11 July 0.568 1.432 —40 106 12 June–21 July 0.581 1.419 0.9250 109 12 June–31 July 0.540 1.460 2.8960 110 12 June–10 August 0.585 1.415 3.1870 111 12 June–20 August 0.557 1.443 3.1880 108 12 June–30 August 0.568 1.432 3.1885 107 12 June–4 September 0.449 1.551 9.61
The thirdstage
30 53 31 August–29 September 0.097 1.903 —40 47 31 August–9 October 0.096 1.904 0.0550 43 31 August–19 October 0.110 1.890 0.7562 39 31 August–31 October 0.132 1.868 1.93
Table 5. Staging results of multi-year maximum daily runoff.
Stages Duration T (d) Threshold Levels (m3/s) Staged Period Slope b Db Relative Error (%)
The firststage
30 60 13 April–12 May 0.434 1.566 —35 73 13 April–17 May 0.432 1.568 0.1340 84 13 April–22 May 0.267 1.733 10.66
Thesecondstage
30 216 18 May–16 June 0.573 1.427 —35 258 18 May–21 June 0.492 1.508 5.6740 238 18 May–26 June 0.435 1.565 9.67
The thirdstage
30 318 17 June–16 July 0.523 1.477 —40 321 17 June–26 July 0.528 1.472 0.3450 307 17 June–5 August 0.506 1.494 1.4960 307 17 June–15 August 0.502 1.498 1.7770 294 17 June–25 August 0.537 1.463 2.3980 284 17 June–4 September 0.504 1.496 2.3985 280 17 June–9 September 0.490 1.510 3.2090 275 17 June–14 September 0.419 1.581 8.07
The fourthstage
30 164 10 September–9 October 0.385 1.615 —40 164 10 September–19 October 0.423 1.577 2.4152 159 10 September–31 October 0.417 1.583 2.41
The results of the above calculations are summarized in the Table 6. Taking intoconsideration and based on the principle of extending the main flood season as much aspossible, the results of the phasing were revised as follows: the pre-flood season is from 13April to 6 June, the main flood season is from 7 June to 9 September, and the post-floodseason is from 10 September to 31 October.
Table 6. Flood staging results for the Chengbi River Reservoir.
Indicator Factors The Pre-Flood Season The Main Flood Season The Post-Flood Season
Average daily rainfall 13 April–6 June 7 June–25 August 26 August–31 OctoberMaximum rainfall 13 April–6 June 7 June–30 August 31 August–31 October
Average daily runoff 13 April–11 June 12 June–30 August 31 August–31 OctoberMaximum daily runoff 13 April–16 June 17 June–9 September 10 September–31 October
Water 2021, 13, 2563 7 of 11
4.2. Results of Flood Diversion Calculation4.2.1. Control Water Level
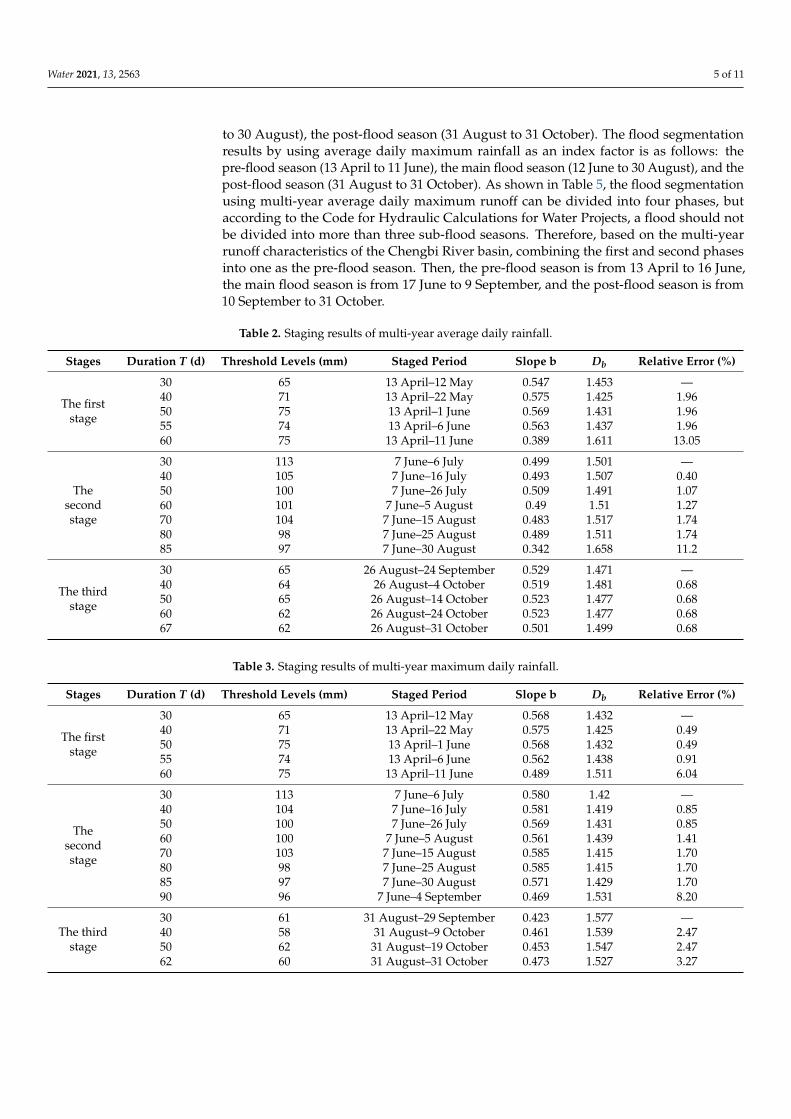
The maximum water level obtained from the flood regulation calculation in the mainflood season is used as the control water level to raise the FLWL in other stages. Floodregulation calculations for the 1000-year and 10,000-year flood process lines in the mainflood season starting at 185 m. The reservoir operation policy of flood regulation is thatwhen the reservoir inflow is less than the rated storage outflow at the FLWL (1800 m3/s),gates are used to control the outflow is equal to the incoming flow so that the water levelin the reservoir could maintain the FLWL. When the reservoir inflow is greater than 1800m3/s, the gates are fully open to discharge flow. When the reservoir water level falls backto the FLWL, the discharge is controlled by the gates to keep the water level unchanged.The change of water level in the flood regulation calculation is shown in Figure 2. Then,the highest water level in the 1000-year flood regulation calculation in the Chengbi RiverReservoir during the main flood season is 187.85 m, and the highest water level in the10,000-year flood is 189.13 m, which are used as the control levels in the flood regulationcalculation during the pre-flood season and post-flood season.
Water 2021, 13, x FOR PEER REVIEW 6 of 11
gates are used to control the outflow is equal to the incoming flow so that the water level in the reservoir could maintain the FLWL. When the reservoir inflow is greater than 1800 m3/s, the gates are fully open to discharge flow. When the reservoir water level falls back to the FLWL, the discharge is controlled by the gates to keep the water level unchanged. The change of water level in the flood regulation calculation is shown in Figure 2. Then, the highest water level in the 1000-year flood regulation calculation in the Chengbi River Reservoir during the main flood season is 187.85 m, and the highest water level in the 10,000-year flood is 189.13 m, which are used as the control levels in the flood regulation calculation during the pre-flood season and post-flood season.
Figure 2. Variation of water level in flood regulation calculation of characteristic floods.
4.2.2. Flood Limit Water Level Since raising the FLWL during the main flood season is not considered, only the dif-
ferent starting levels for the pre-flood season and the post-flood season are trialed. The initial water level is adjusted from 185 m and trialed in steps of 0.5 m. The results are summarized in Table 7. It can be seen that the maximum water level will not exceed the control level of 187.85 m when the FLWL is between 185.0 and 187.5 during the flood regulating calculation at the 1000-year flood process line in the pre-flood season. In the 10,000-year flood process line flood adjustment calculation, when the FLWL is 185.0 to 188.0 m, the maximum water level will not exceed the control level of 189.13 m. Therefore, the FLWL of the pre-flood season is set between 185.0 and 187.5 m without reducing the flood control standard of the reservoir. Correspondingly, the FLWL in the post-flood sea-son is set between 185.0 and 187.5 m.
To sum up, the FLWL of Chengbi River reservoir in the pre-flood season and the post-flood season can be increased to some extent. However, for the pre-flood season in April and May, it makes little sense to raise the FLWL. Firstly, it is the time when agriculture in Baise City needs a lot of water, so it becomes impractical to raise the FLWL of the reservoir by reducing the water supply. Secondly, the interval between the beginning and end of the pre-flood season is only 54 days, and the main flood season still maintains the FLWL un-changed. Based on the above considerations, only the FLWL of the post-flood season is raised.
4.3. Risks and Benefits The paper calculates the FLWL for the post-flood season in 0.5 m increments to obtain
probability of exceedance and its increases for different starting water levels (Figure 3), and the expected risk and expected risk increases (Figure 4). When the FLWL is set at 187.5 m in the post-flood season, the maximum probability of exceedance is
52.52 10−× , which is less than the reservoir calibration flood of
41 10−× . Compared to the original flood level, the probability of exceedance increases by
52.34 10−× . From Figure 3, it can be seen that when the FLWL is 185 m~186 m, the probability of exceedance changes very little and the
Figure 2. Variation of water level in flood regulation calculation of characteristic floods.
4.2.2. Flood Limit Water Level
Since raising the FLWL during the main flood season is not considered, only thedifferent starting levels for the pre-flood season and the post-flood season are trialed. Theinitial water level is adjusted from 185 m and trialed in steps of 0.5 m. The results aresummarized in Table 7. It can be seen that the maximum water level will not exceed thecontrol level of 187.85 m when the FLWL is between 185.0 and 187.5 during the floodregulating calculation at the 1000-year flood process line in the pre-flood season. In the10,000-year flood process line flood adjustment calculation, when the FLWL is 185.0 to188.0 m, the maximum water level will not exceed the control level of 189.13 m. Therefore,the FLWL of the pre-flood season is set between 185.0 and 187.5 m without reducing theflood control standard of the reservoir. Correspondingly, the FLWL in the post-flood seasonis set between 185.0 and 187.5 m.
To sum up, the FLWL of Chengbi River reservoir in the pre-flood season and the post-flood season can be increased to some extent. However, for the pre-flood season in Apriland May, it makes little sense to raise the FLWL. Firstly, it is the time when agriculture inBaise City needs a lot of water, so it becomes impractical to raise the FLWL of the reservoirby reducing the water supply. Secondly, the interval between the beginning and end ofthe pre-flood season is only 54 days, and the main flood season still maintains the FLWLunchanged. Based on the above considerations, only the FLWL of the post-flood seasonis raised.
Water 2021, 13, 2563 8 of 11
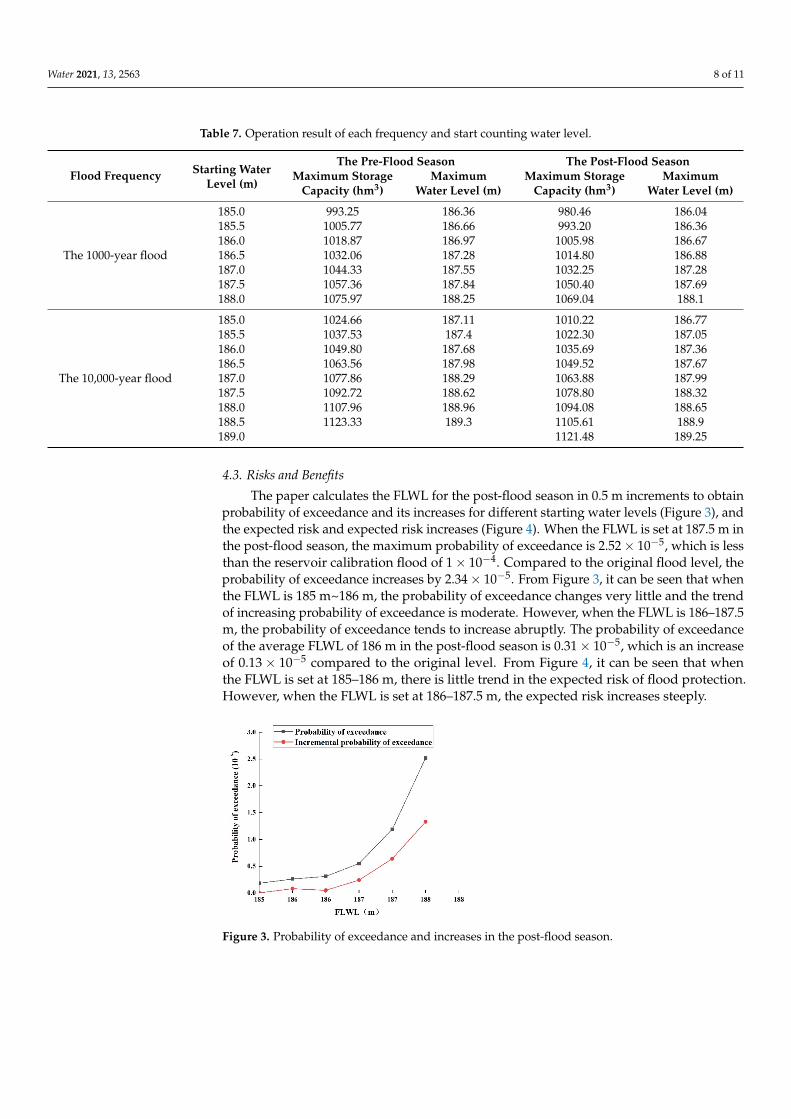
Table 7. Operation result of each frequency and start counting water level.
Flood Frequency Starting WaterLevel (m)
The Pre-Flood Season The Post-Flood SeasonMaximum Storage
Capacity (hm3)Maximum
Water Level (m)Maximum Storage
Capacity (hm3)Maximum
Water Level (m)
185.0 993.25 186.36 980.46 186.04185.5 1005.77 186.66 993.20 186.36186.0 1018.87 186.97 1005.98 186.67
The 1000-year flood 186.5 1032.06 187.28 1014.80 186.88187.0 1044.33 187.55 1032.25 187.28187.5 1057.36 187.84 1050.40 187.69188.0 1075.97 188.25 1069.04 188.1
185.0 1024.66 187.11 1010.22 186.77185.5 1037.53 187.4 1022.30 187.05186.0 1049.80 187.68 1035.69 187.36186.5 1063.56 187.98 1049.52 187.67
The 10,000-year flood 187.0 1077.86 188.29 1063.88 187.99187.5 1092.72 188.62 1078.80 188.32188.0 1107.96 188.96 1094.08 188.65188.5 1123.33 189.3 1105.61 188.9189.0 1121.48 189.25
4.3. Risks and Benefits
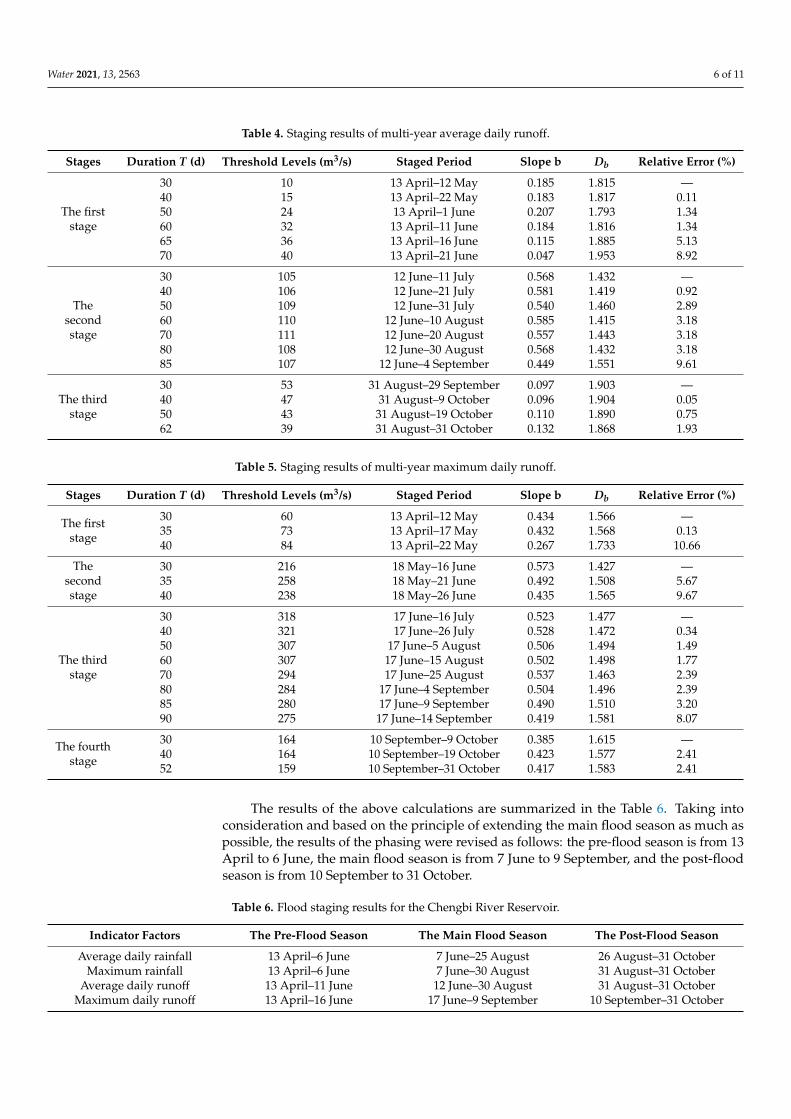
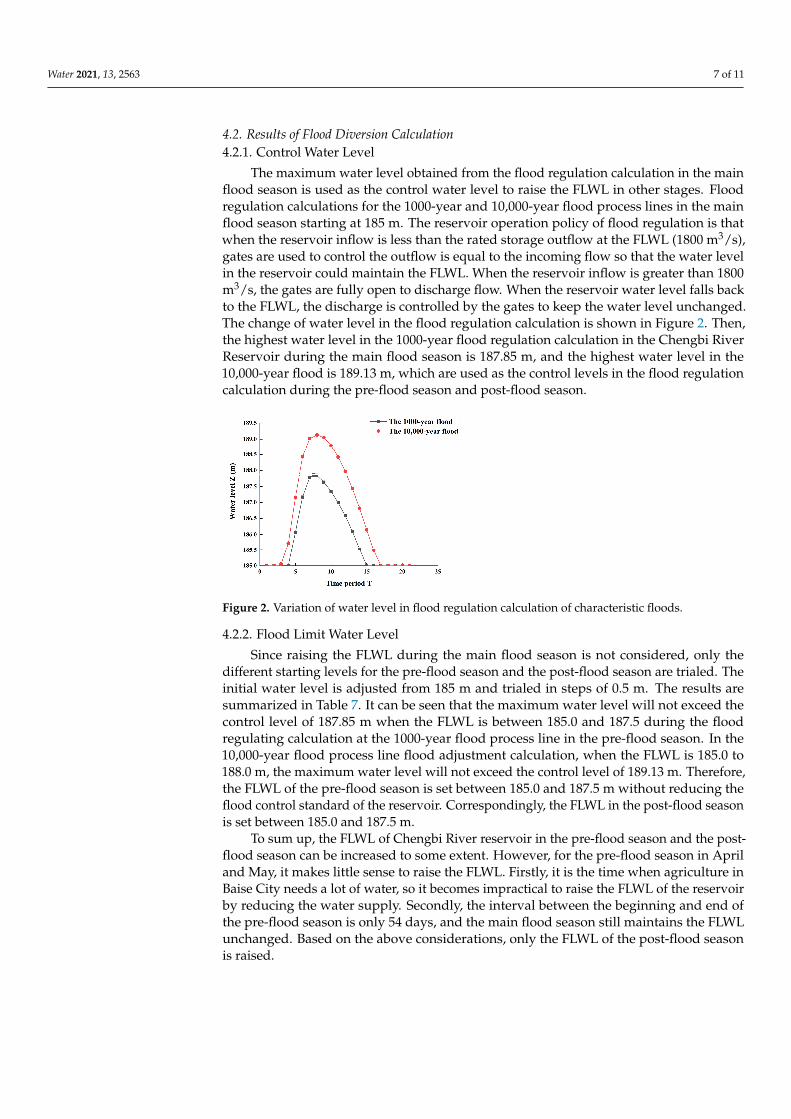
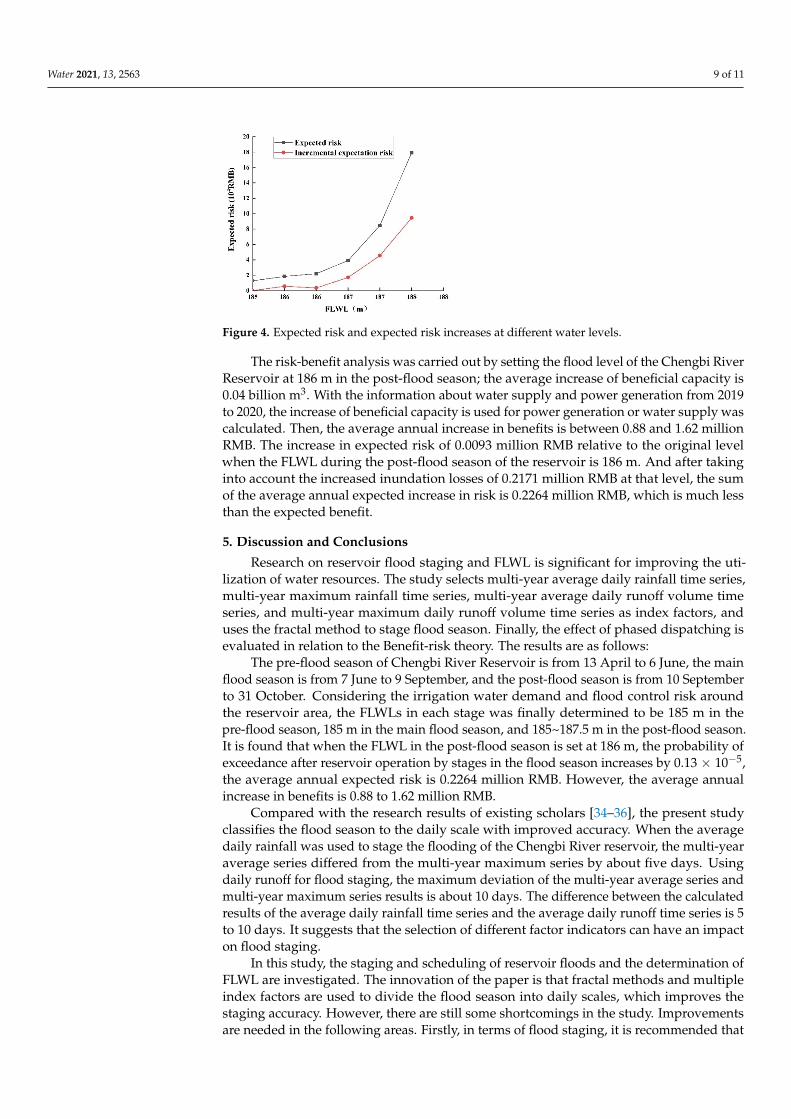
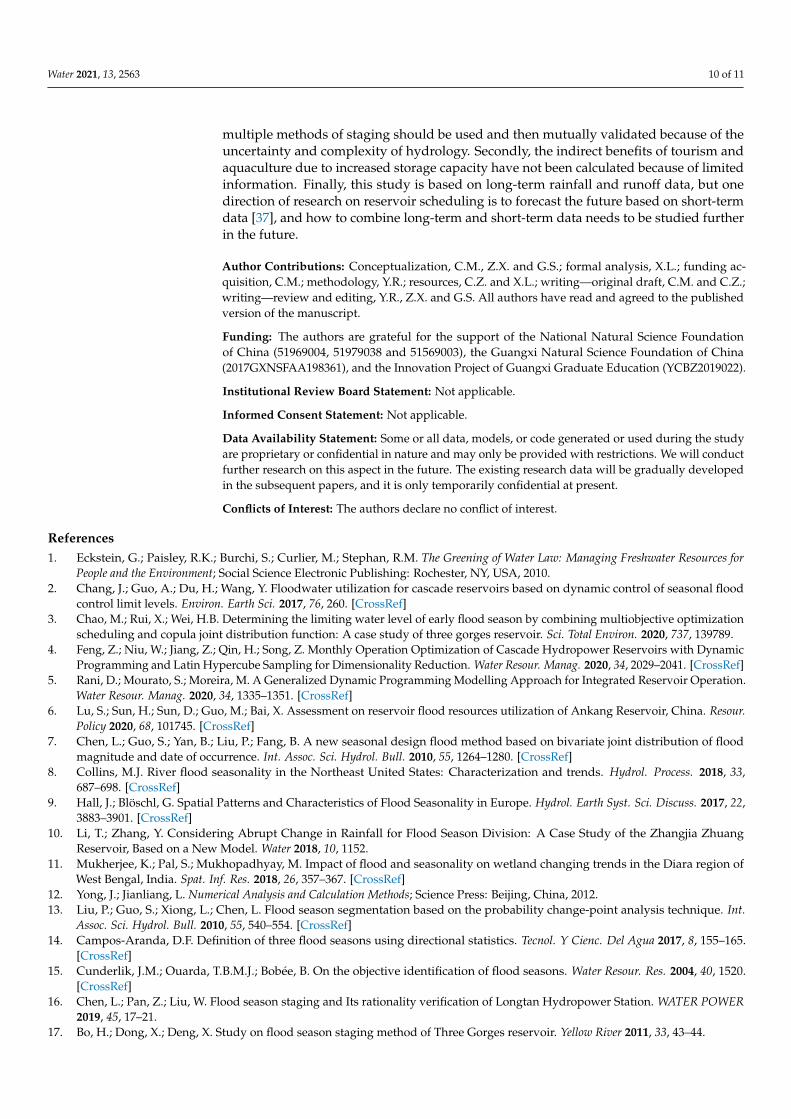
The paper calculates the FLWL for the post-flood season in 0.5 m increments to obtainprobability of exceedance and its increases for different starting water levels (Figure 3), andthe expected risk and expected risk increases (Figure 4). When the FLWL is set at 187.5 m inthe post-flood season, the maximum probability of exceedance is 2.52× 10⁻⁵, which is lessthan the reservoir calibration flood of 1× 10⁻⁴. Compared to the original flood level, theprobability of exceedance increases by 2.34× 10⁻⁵. From Figure 3, it can be seen that whenthe FLWL is 185 m~186 m, the probability of exceedance changes very little and the trendof increasing probability of exceedance is moderate. However, when the FLWL is 186–187.5m, the probability of exceedance tends to increase abruptly. The probability of exceedanceof the average FLWL of 186 m in the post-flood season is 0.31× 10⁻⁵, which is an increaseof 0.13× 10⁻⁵ compared to the original level. From Figure 4, it can be seen that whenthe FLWL is set at 185–186 m, there is little trend in the expected risk of flood protection.However, when the FLWL is set at 186–187.5 m, the expected risk increases steeply.
Water 2021, 13, x FOR PEER REVIEW 9 of 11
level when the FLWL during the post-flood season of the reservoir is 186 m. And after taking into account the increased inundation losses of 0.2171 million RMB at that level, the sum of the average annual expected increase in risk is 0.2264 million RMB, which is much less than the expected benefit.
Figure 3. Probability of exceedance and increases in the post-flood season.
Figure 4. Expected risk and expected risk increases at different water levels.
5. Discussion and Conclusions Research on reservoir flood staging and FLWL is significant for improving the utili-
zation of water resources. The study selects multi-year average daily rainfall time series, multi-year maximum rainfall time series, multi-year average daily runoff volume time series, and multi-year maximum daily runoff volume time series as index factors, and uses the fractal method to stage flood season. Finally, the effect of phased dispatching is eval-uated in relation to the Benefit-risk theory. The results are as follows:
The pre-flood season of Chengbi River Reservoir is from 13 April to 6 June, the main flood season is from 7 June to 9 September, and the post-flood season is from 10 September to 31 October. Considering the irrigation water demand and flood control risk around the reservoir area, the FLWLs in each stage was finally determined to be 185 m in the pre-flood season, 185 m in the main flood season, and 185~187.5 m in the post-flood season. It is found that when the FLWL in the post-flood season is set at 186 m, the probability of exceedance after reservoir operation by stages in the flood season increases by 0.13 × 10⁻⁵, the average annual expected risk is 0.2264 million RMB. However, the average annual increase in benefits is 0.88 to 1.62 million RMB.
Compared with the research results of existing scholars [34–36], the present study classifies the flood season to the daily scale with improved accuracy. When the average daily rainfall was used to stage the flooding of the Chengbi River reservoir, the multi-year average series differed from the multi-year maximum series by about five days. Using daily runoff for flood staging, the maximum deviation of the multi-year average series
Figure 3. Probability of exceedance and increases in the post-flood season.
Water 2021, 13, 2563 9 of 11
Water 2021, 13, x FOR PEER REVIEW 9 of 11
level when the FLWL during the post-flood season of the reservoir is 186 m. And after taking into account the increased inundation losses of 0.2171 million RMB at that level, the sum of the average annual expected increase in risk is 0.2264 million RMB, which is much less than the expected benefit.
Figure 3. Probability of exceedance and increases in the post-flood season.
Figure 4. Expected risk and expected risk increases at different water levels.
5. Discussion and Conclusions Research on reservoir flood staging and FLWL is significant for improving the utili-
zation of water resources. The study selects multi-year average daily rainfall time series, multi-year maximum rainfall time series, multi-year average daily runoff volume time series, and multi-year maximum daily runoff volume time series as index factors, and uses the fractal method to stage flood season. Finally, the effect of phased dispatching is eval-uated in relation to the Benefit-risk theory. The results are as follows:
The pre-flood season of Chengbi River Reservoir is from 13 April to 6 June, the main flood season is from 7 June to 9 September, and the post-flood season is from 10 September to 31 October. Considering the irrigation water demand and flood control risk around the reservoir area, the FLWLs in each stage was finally determined to be 185 m in the pre-flood season, 185 m in the main flood season, and 185~187.5 m in the post-flood season. It is found that when the FLWL in the post-flood season is set at 186 m, the probability of exceedance after reservoir operation by stages in the flood season increases by 0.13 × 10⁻⁵, the average annual expected risk is 0.2264 million RMB. However, the average annual increase in benefits is 0.88 to 1.62 million RMB.
Compared with the research results of existing scholars [34–36], the present study classifies the flood season to the daily scale with improved accuracy. When the average daily rainfall was used to stage the flooding of the Chengbi River reservoir, the multi-year average series differed from the multi-year maximum series by about five days. Using daily runoff for flood staging, the maximum deviation of the multi-year average series
Figure 4. Expected risk and expected risk increases at different water levels.
The risk-benefit analysis was carried out by setting the flood level of the Chengbi RiverReservoir at 186 m in the post-flood season; the average increase of beneficial capacity is0.04 billion m3. With the information about water supply and power generation from 2019to 2020, the increase of beneficial capacity is used for power generation or water supply wascalculated. Then, the average annual increase in benefits is between 0.88 and 1.62 millionRMB. The increase in expected risk of 0.0093 million RMB relative to the original levelwhen the FLWL during the post-flood season of the reservoir is 186 m. And after takinginto account the increased inundation losses of 0.2171 million RMB at that level, the sumof the average annual expected increase in risk is 0.2264 million RMB, which is much lessthan the expected benefit.
5. Discussion and Conclusions
Research on reservoir flood staging and FLWL is significant for improving the uti-lization of water resources. The study selects multi-year average daily rainfall time series,multi-year maximum rainfall time series, multi-year average daily runoff volume timeseries, and multi-year maximum daily runoff volume time series as index factors, anduses the fractal method to stage flood season. Finally, the effect of phased dispatching isevaluated in relation to the Benefit-risk theory. The results are as follows:
The pre-flood season of Chengbi River Reservoir is from 13 April to 6 June, the mainflood season is from 7 June to 9 September, and the post-flood season is from 10 Septemberto 31 October. Considering the irrigation water demand and flood control risk aroundthe reservoir area, the FLWLs in each stage was finally determined to be 185 m in thepre-flood season, 185 m in the main flood season, and 185~187.5 m in the post-flood season.It is found that when the FLWL in the post-flood season is set at 186 m, the probability ofexceedance after reservoir operation by stages in the flood season increases by 0.13 × 10⁻⁵,the average annual expected risk is 0.2264 million RMB. However, the average annualincrease in benefits is 0.88 to 1.62 million RMB.
Compared with the research results of existing scholars [34–36], the present studyclassifies the flood season to the daily scale with improved accuracy. When the averagedaily rainfall was used to stage the flooding of the Chengbi River reservoir, the multi-yearaverage series differed from the multi-year maximum series by about five days. Usingdaily runoff for flood staging, the maximum deviation of the multi-year average series andmulti-year maximum series results is about 10 days. The difference between the calculatedresults of the average daily rainfall time series and the average daily runoff time series is 5to 10 days. It suggests that the selection of different factor indicators can have an impacton flood staging.
In this study, the staging and scheduling of reservoir floods and the determination ofFLWL are investigated. The innovation of the paper is that fractal methods and multipleindex factors are used to divide the flood season into daily scales, which improves thestaging accuracy. However, there are still some shortcomings in the study. Improvementsare needed in the following areas. Firstly, in terms of flood staging, it is recommended that
Water 2021, 13, 2563 10 of 11
multiple methods of staging should be used and then mutually validated because of theuncertainty and complexity of hydrology. Secondly, the indirect benefits of tourism andaquaculture due to increased storage capacity have not been calculated because of limitedinformation. Finally, this study is based on long-term rainfall and runoff data, but onedirection of research on reservoir scheduling is to forecast the future based on short-termdata [37], and how to combine long-term and short-term data needs to be studied furtherin the future.
Author Contributions: Conceptualization, C.M., Z.X. and G.S.; formal analysis, X.L.; funding ac-quisition, C.M.; methodology, Y.R.; resources, C.Z. and X.L.; writing—original draft, C.M. and C.Z.;writing—review and editing, Y.R., Z.X. and G.S. All authors have read and agreed to the publishedversion of the manuscript.
Funding: The authors are grateful for the support of the National Natural Science Foundationof China (51969004, 51979038 and 51569003), the Guangxi Natural Science Foundation of China(2017GXNSFAA198361), and the Innovation Project of Guangxi Graduate Education (YCBZ2019022).
Institutional Review Board Statement: Not applicable.
Informed Consent Statement: Not applicable.
Data Availability Statement: Some or all data, models, or code generated or used during the studyare proprietary or confidential in nature and may only be provided with restrictions. We will conductfurther research on this aspect in the future. The existing research data will be gradually developedin the subsequent papers, and it is only temporarily confidential at present.
Conflicts of Interest: The authors declare no conflict of interest.
References1. Eckstein, G.; Paisley, R.K.; Burchi, S.; Curlier, M.; Stephan, R.M. The Greening of Water Law: Managing Freshwater Resources for
People and the Environment; Social Science Electronic Publishing: Rochester, NY, USA, 2010.2. Chang, J.; Guo, A.; Du, H.; Wang, Y. Floodwater utilization for cascade reservoirs based on dynamic control of seasonal flood
control limit levels. Environ. Earth Sci. 2017, 76, 260. [CrossRef]3. Chao, M.; Rui, X.; Wei, H.B. Determining the limiting water level of early flood season by combining multiobjective optimization
scheduling and copula joint distribution function: A case study of three gorges reservoir. Sci. Total Environ. 2020, 737, 139789.4. Feng, Z.; Niu, W.; Jiang, Z.; Qin, H.; Song, Z. Monthly Operation Optimization of Cascade Hydropower Reservoirs with Dynamic
Programming and Latin Hypercube Sampling for Dimensionality Reduction. Water Resour. Manag. 2020, 34, 2029–2041. [CrossRef]5. Rani, D.; Mourato, S.; Moreira, M. A Generalized Dynamic Programming Modelling Approach for Integrated Reservoir Operation.
Water Resour. Manag. 2020, 34, 1335–1351. [CrossRef]6. Lu, S.; Sun, H.; Sun, D.; Guo, M.; Bai, X. Assessment on reservoir flood resources utilization of Ankang Reservoir, China. Resour.
Policy 2020, 68, 101745. [CrossRef]7. Chen, L.; Guo, S.; Yan, B.; Liu, P.; Fang, B. A new seasonal design flood method based on bivariate joint distribution of flood
magnitude and date of occurrence. Int. Assoc. Sci. Hydrol. Bull. 2010, 55, 1264–1280. [CrossRef]8. Collins, M.J. River flood seasonality in the Northeast United States: Characterization and trends. Hydrol. Process. 2018, 33,
687–698. [CrossRef]9. Hall, J.; Blöschl, G. Spatial Patterns and Characteristics of Flood Seasonality in Europe. Hydrol. Earth Syst. Sci. Discuss. 2017, 22,
3883–3901. [CrossRef]10. Li, T.; Zhang, Y. Considering Abrupt Change in Rainfall for Flood Season Division: A Case Study of the Zhangjia Zhuang
Reservoir, Based on a New Model. Water 2018, 10, 1152.11. Mukherjee, K.; Pal, S.; Mukhopadhyay, M. Impact of flood and seasonality on wetland changing trends in the Diara region of
West Bengal, India. Spat. Inf. Res. 2018, 26, 357–367. [CrossRef]12. Yong, J.; Jianliang, L. Numerical Analysis and Calculation Methods; Science Press: Beijing, China, 2012.13. Liu, P.; Guo, S.; Xiong, L.; Chen, L. Flood season segmentation based on the probability change-point analysis technique. Int.
Assoc. Sci. Hydrol. Bull. 2010, 55, 540–554. [CrossRef]14. Campos-Aranda, D.F. Definition of three flood seasons using directional statistics. Tecnol. Y Cienc. Del Agua 2017, 8, 155–165.
[CrossRef]15. Cunderlik, J.M.; Ouarda, T.B.M.J.; Bobée, B. On the objective identification of flood seasons. Water Resour. Res. 2004, 40, 1520.
[CrossRef]16. Chen, L.; Pan, Z.; Liu, W. Flood season staging and Its rationality verification of Longtan Hydropower Station. WATER POWER
2019, 45, 17–21.17. Bo, H.; Dong, X.; Deng, X. Study on flood season staging method of Three Gorges reservoir. Yellow River 2011, 33, 43–44.
Water 2021, 13, 2563 11 of 11
18. Beurton, S.; Thieken, A.H. Seasonality of floods in Germany. Int. Assoc. Entific Hydrol. Bull. 2009, 54, 62–76. [CrossRef]19. Shu, Z.; Liu, J.; Dong, X. Study on extreme value distribution of precipitation by stages in flood season based on fuzzy set analysis.
J. Hydroeletric Eng. 2017, 36, 55–64.20. Jia, M.; Mu, X. Application of fuzzy set analysis method in reservoir flood season staging. J. Water Resour. Water Eng. 2015, 26,
178–181.21. Li, X.; Zhou, Y.; Wang, Y. Discussion on the limited water level of Xiaolangdi Reservoir by stages based on fuzzy set analysis
method. In Proceedings of the New Development of International Roller Compacted Concrete Dam Technology and HighQuality Construction Management of Reservoir Dam–2019 Academic Annual Meeting of China Association of Dam Engineering,Kunming, China, 11–12 November 2019.
22. Ma, R.; Song, L.; Xia, L. Dynamic control of flood limit water level of Baise reservoir based on design flood hydrograph method.Hydropower Energy Sci. 2017, 35, 38–41+34.
23. Zhang, D.; Zhao, L.; Xu, X. Flood Stage of Large-scale Water Conservancy Project in Mountainous Area of South China Based onFractal Theory. Water Resour. Power 2019, 37, 46–49.
24. Eum, H.-I.; Simonovic, S.P. Integrated Reservoir Management System for Adaptation to Climate Change: The Nakdong RiverBasin in Korea. Water Resour. Manag. 2010, 24, 3397–3417. [CrossRef]
25. Xiang, L.; Guo, S.; Pan, L.; Chen, G. Dynamic control of flood limited water level for reservoir operation by considering inflowuncertainty. J. Hydrol. 2010, 391, 124–132.
26. Liu, P.; Li, L.; Guo, S.; Xiong, L.; Zhang, W.; Zhang, J.; Xu, C.Y. Optimal design of seasonal flood limited water levels and itsapplication for the Three Gorges Reservoir. J. Hydrol. 2015, 527, 1045–1053. [CrossRef]
27. Jiang, H.; Yu, Z.; Mo, C. Reservoir Flood Season Segmentation and Optimal Operation of Flood-Limiting Water Levels. J. Hydrol.Eng. 2014, 20, 05014035. [CrossRef]
28. Tian, F.; Yuan, X.; Wang, X.; Geng, Q. Review on disaster prevention fractal theory of nonlinear dynamic system in rivers(networks) at home and abroad. J. Hydraul. Eng. 2018, 49, 926–936.
29. Li, J.; Li, R.; Li, J.; Xie, K.; Miao, Y. Separating reservoir flood season into sub-seasons based on fractal theory. Desalination WaterTreat. 2018, 125, 310–318. [CrossRef]
30. Fang, C.; Guo, S.; Duan, Y.; Duong, D. Two new approaches to dividing flood sub-seasons in flood season using the fractal theory.Chin. Sci. Bull. 2010, 55, 105–110. [CrossRef]
31. MWR. Regulation for Calculating Design Flood of Water Resources and Hydropower Projects (SL 2006); China Water & Power Press:Beijing, China, 2006.
32. Liu, Z.; Yan, A.; Wu, X. Flood staging based on fractal dimension. Yellow River 2010, 32, 49–51.33. Qian, J.; Zheng, M. Research on the Classification of Seasonal Flood Periods. China Rural. Water Hydropower 2012, 1, 89–90+94.34. Ma, R. Risk Analysis Methods and Applications for Earth and Rock Dams; Science Press: Beijing, China, 2004.35. Wei, W.; Mo, C.; Liu, L.; Jiang, Q.; Sun, G.; Jiang, H. Application of Watershed Rainfall Fractal Theory in Reservoir Flood Season
Staging. Yellow River 2014, 36, 39–41.36. Huang, Z.; Jiang, H.; Mo, C. Countermeasures for Problems existing in operation regulation of Chengbihe Reservoir. Guangxi
Water Resour. Hydropower Eng. 2013, 2, 89–92.37. Ramaswamy, V.; Saleh, F. Ensemble Based Forecasting and Optimization Framework to Optimize Releases from Water Supply
Reservoirs for Flood Control. Water Resour. Manag. 2020, 34, 989–1004. [CrossRef]
Related Documents