Study on the Performance and St Algal-bacterial Aerobic Granul Wastewater Treatment Using Cont Reactors 著者 Ahmad Johan Syafri Mahathir year 2018 その他のタイトル 連続式リアクターを用いた排水処理における好気性 藻類-細菌グラニュール汚泥の性能と安定性に関す る研究 学位授与大学 筑波大学 (University of Tsukuba) 学位授与年度 2017 報告番号 12102甲第8627号 URL http://doi.org/10.15068/00152291

Welcome message from author
This document is posted to help you gain knowledge. Please leave a comment to let me know what you think about it! Share it to your friends and learn new things together.
Transcript

Study on the Performance and Stability ofAlgal-bacterial Aerobic Granular Sludge inWastewater Treatment Using Continuous-flowReactors
著者 Ahmad Johan Syafri Mahathiryear 2018その他のタイトル 連続式リアクターを用いた排水処理における好気性
藻類-細菌グラニュール汚泥の性能と安定性に関する研究
学位授与大学 筑波大学 (University of Tsukuba)学位授与年度 2017報告番号 12102甲第8627号URL http://doi.org/10.15068/00152291

Study on the Performance and Stability of Algal-
bacterial Aerobic Granular Sludge in Wastewater
Treatment Using Continuous-flow Reactors
January 2018
Johan Syafri Mahathir Ahmad

Study on the Performance and Stability of Algal-
bacterial Aerobic Granular Sludge in Wastewater
Treatment Using Continuous-flow Reactors
A Dissertation Submitted to
the Graduate School of Life and Environmental Sciences,
University of Tsukuba
in Partial Fulfillment of the Requirements
for the Degree of Doctor of Philosophy in Environmental Studies
(Doctoral Program in Sustainable Environmental Studies)
Johan Syafri Mahathir Ahmad

i
Abstract
Aerobic granular sludge (AGS) is gaining more interest and becoming a promising
technology in wastewater treatment since it possesses incomparable advantages over
conventional activated sludge (AS) systems, such as excellent settleability, strong and dense
microbial structure, and withstand to higher pollutants loading and toxicants. Previous works
mainly focused on the essential factors like organic loading, shear force, hydraulic selection
pressure and wastewater composition which influence the granulation process. Most of these
studies were conducted in sequencing batch reactors (SBRs) which are regarded as the most
successful ones. While from an engineer’s viewpoint, continuous-flow reactors are more
advantageous for large-scale application. During the operation of AGS, algae has been found
to naturally grow in AGS systems which possess the ability to produce oxygen and at the same
time bacteria can utilize the produced oxygen for organics degradation. This could provide a
new opportunity for energy saving in wastewater treatment plants. Up to the present, however,
little information is available on algal-bacterial granules, especially their stability in
continuous-flow reactors. Therefore, this study aimed to explore various operation strategies
to provide optimum reactor design and performance (in terms of pollutants removal and
granules stability). The kinetics of reactions involved were also explored to assist the design
and evaluation of the process, especially for future large-scale applications.
(1) One single reactor (R1) and two identical reactors in series (R2=R2-1+R2-2) were tested
on algal-bacterial AGS for approximately 120 days’ operation by seeding mature AGS at a
ratio of 1:1 (general AGS/algal-bacterial AGS, w/w). Both R1 and R2 demonstrated almost
similar organics and nutrients removal, and the two algal-bacterial AGS systems showed
excellent performance even operated at double increased organic and nutrient loadings.
Moreover, when double increased strength influent fed to R1, a better denitrification
performance was achieved, in which total nitrogen (TN) removal increased from 29% to 80%.
The two systems well maintained their granular stability, and all granules became algal-
bacterial ones after 120 days’ operation. Additionally, the mechanisms were proposed
regarding the formation and enhanced stability of the new algal-bacterial granules in
continuous-flow reactors.
(2) With the aim to provide a modest technique for kinetics development that could
transform the sophisticated biological reaction mechanisms into an understandable approach,
a novel kinetic development method was proposed. In this study, cycle test experimental data

ii
were used as the basis for the determination of related reaction rates. With the purpose to check
its validity and applicability, the developed model was tested by using the same reactor system
(continuous-flow reactor) under different aeration strategies and a different reactor system
(SBR) under different seed sludge, reactor dimension, and influent compositions. The proposed
model was successfully applied to predict the reactor performance with good accuracy (R2 >
0.98 and relative error < 10%) for both tested reactor systems. Furthermore, the model was
implemented in decision making on aeration strategy for optimum organics and nutrient
removals along with energy requirement.
(3) Instead of aeration, effluent recirculation was employed to two continuous-flow reactor
systems seeded with general AGS and algal-bacterial AGS, respectively. The results suggest
that the algal-bacterial AGS possesses better overall performance and stability. A long-term
operation of algal-bacterial AGS was also conducted by varying the effluent recirculation ratios,
reflecting stable pollutants removal ability while deteriorated settleability and stability to some
extent. More importantly, after being switched from no aeration to intermittent aeration, the
algal-bacterial AGS could quickly adapt to the change in operation conditions, which was
obviously indicated by its recovered removals of dissolved organic carbon (DOC) from 40%
to 100%, TN from 61% to 98%, and total phosphorus (TP) from 14% to 64% along with
improved sludge settleability and stability.
It is expected that results from this study could provide important and scientific data for the
development of algal-bacterial AGS, especially for continuous-flow reactor systems.
Key words: Algal-bacterial aerobic granular sludge; Continuous-flow reactor; Stability;
Kinetic modeling

iii
Contents
Abstract ............................................................................................................................... i
Contents ............................................................................................................................ iii
List of tables............................................................................................................................. vi
List of figures ......................................................................................................................... vii
Abbreviations ....................................................................................................................... viii
Chapter 1 Introduction ........................................................................................................ 1
1.1 An overview on aerobic granular sludge systems ............................................................ 1
1.2 Aerobic granular sludge in continuous-flow reactors ...................................................... 2
1.3 Algal-bacterial symbiosis in wastewater treatment ......................................................... 3
1.4 Algae growth in aerobic granular sludge ......................................................................... 3
1.5 Kinetic modeling of aerobic granular sludge ................................................................... 4
1.6 Research objective and structure of the thesis ................................................................. 5
Chapter 2 Stability of algal-bacterial aerobic granules in continuous-flow reactors to
treat varying strength of domestic wastewater ................................................ 8
2.1 Introduction ...................................................................................................................... 8
2.2 Materials and methods ..................................................................................................... 8
2.2.2 Analytical methods ................................................................................................... 9
2.2.3 Calculations ............................................................................................................. 10
2.2.4 Statistical analysis ................................................................................................... 10
2.3 Results and discussion ................................................................................................... 11
2.3.1 Performance of the two reactor systems ................................................................. 11
2.3.2 Characteristics of algal-bacterial granules .............................................................. 14
2.3.3 Preliminary analysis on mechanism involved ......................................................... 16
2.4 Summary ........................................................................................................................ 17
Chapter 3 Novel approach for kinetics prediction on algal-bacterial aerobic granular
sludge in a continuous-flow reactor and its application in decision on
aeration strategy ............................................................................................... 25
3.1 Introduction .................................................................................................................... 25

iv
3.2 Materials and methods ................................................................................................... 25
3.2.1 Reactor configuration, synthetic wastewater and seed sludge ................................ 25
3.2.2 Cycle test experiments ............................................................................................ 26
3.2.3 Kinetic models ........................................................................................................ 26
3.2.4 Applicability of the proposed method ..................................................................... 27
3.2.5 Model implementation ............................................................................................ 28
3.2.6 Analytical methods ................................................................................................. 28
3.2.7 Calculations ............................................................................................................. 28
3.2.8 Model accuracy and statistical analysis .................................................................. 28
3.3 Results and discussion ................................................................................................... 28
3.3.1 Experiment results from cycle tests ........................................................................ 28
3.3.2 Kinetic evaluation and model verification .............................................................. 30
3.3.3 Validity and applicability of the proposed method ................................................. 31
3.3.4 Practical application ................................................................................................ 31
3.4 Summary ........................................................................................................................ 32
Chapter 4 Stability of algal-bacterial aerobic granules in a continuous-flow reactor
with effluent recirculation instead of aeration ............................................... 43
4.1 Introduction .................................................................................................................... 43
4.2 Materials and methods ................................................................................................... 43
4.2.1 Experimental set-up and operation conditions ........................................................ 43
4.2.2 Synthetic wastewater and seed sludge .................................................................... 44
4.2.3 Analytical methods ................................................................................................. 44
4.2.4 Calculations ............................................................................................................. 45
4.3 Results and discussion ................................................................................................... 45
4.3.1 Granule characteristics ............................................................................................ 45
4.3.2 DOC, N and P removals .......................................................................................... 47
4.4 Summary ........................................................................................................................ 48
Chapter 5 Conclusions and future research perspectives ............................................... 54
5.1 Conclusions .................................................................................................................... 54
5.2 Future research perspectives .......................................................................................... 55
Acknowledgements ................................................................................................................ 56

v
References ............................................................................................................................ 57
Appendix ............................................................................................................................ 63

vi
List of tables
Table 3-1 Composition of synthetic wastewater used in this study ......................................... 33
Table 3-2 Aeration scenarios in the simulation set-up ............................................................. 34
Table 3-3 Water quality indicators: removal or accumulation rates ........................................ 35
Table 3-4 Combination of order of reactions used to test the related models ......................... 36
Table 3-5 All the selected kinetic reactions for CFR and SBR ............................................... 37
Table 3-6 Summary of reactors’ performance from experimental and simulated results ........ 38
Table 4-1 Operation strategies of the reactors ......................................................................... 49
Table 4-2 Performance of AGS and algal-bacterial AGS during operation of Stage 1 ........... 50

vii
List of figures
Figure 1-1 Structure of the thesis. .......................................................................................... 7
Figure 2-2 Changes in granular settleability and organics removal during 120 days’ operation.
............................................................................................................................ 20
Figure 2-3 N and P removal profiles for the two reactor systems during 120 days’ operation..
............................................................................................................................ 21
Figure 2-4 Dynamic changes of algal-bacterial granular size and distribution in R1, R2-1, and
R2-2. ..................................................................................................................... 22
Figure 2-5 Changes in average granular strength of algal-bacterial AGS from the two reactor
systems during 120 days’ operation. .................................................................. 23
Figure 2-6 Schematic of proposed mechanisms of algal-bacterial AGS formation and
enhancement. ...................................................................................................... 24
Figure 3-1 Profiles of DO and water quality indicators in the CFR reactor during a typical
cycle test. ............................................................................................................ 39
Figure 3-2 Experimental and simulated data for the determination of kinetic models. ....... 40
Figure 3-3 Comparison of reactor performance between the experimental results and model
predictions under the aeration/non-aeration duration ratio of 2:1 and 1:1,
respectively. ........................................................................................................ 41
Figure 3-4 Effect of aeration duration on DOC, TN and TP removal efficiencies and required
energy for P removal .......................................................................................... 42
Figure 4-1 Schematic diagram of R1 and R2 and R3.. ......................................................... 51
Figure 4-2 The profiles of loading rates, settling performance, granular stability and algae
content of algal-bacterial AGS during the operation of Stages 1 to 4. ............... 52
Figure 4-3 Changes in removal capacities and rates of algal-bacterial AGS from Stages 1 to
4 during the test. ................................................................................................. 53

viii
Abbreviations
AGS Aerobic granular sludge
AOB Ammonia oxidizing bacteria
AS Activated sludge
ASM Activated sludge model
CFR Continuous-flow reactor
CMBR Continuous-flow membrane bio-reactor
COD Chemical oxygen demand
DO Dissolved oxygen
DOC Dissolved organic carbon
EBPR Enhanced biological phosphorus removal
EPS Extracellular polymeric substances
HRT Hydraulic retention time
MLSS Mixed liquor suspended solids
MLVSS Mixed liquor volatile suspended solids
N Nitrogen
NOB Nitrate oxidizing bacteria
OLR Organic loading rate
P Phosphorus
PAO Phosphorus accumulating organism
PHA Poly-hydroxyalkanoate
PN Proteins
PS Polysaccharides
RMSE Root-mean-square error
SBR Sequencing batch reactor
SRT Solids retention time
SVI Sludge volume index
TN Total nitrogen
TOC Total organic carbon
TP Total phosphorus

ix
TS Total solids
VS Volatile solids

1
Chapter 1 Introduction
1.1 An overview on aerobic granular sludge systems
The most common suspended growth process for domestic wastewater treatment is
the activated sludge (AS) process [1]. Aside from its effective removal of organics, AS
process has several drawbacks such as high energy requirement and large land area
occupation for secondary settling tank(s) due to poor sludge settling ability. As a result,
innovative technologies are demanding for wastewater treatment with good performance
at low investment and operation costs.
Aerobic granular sludge (AGS) is a compact, dense aggregates composed of self-
immobilized cells which is a novel and promising technology for wastewater treatment
and can solve several problems in the AS process. The aerobic granules are recognized
to have the attributes of dense and strong structure, excellent settling ability and the ability
to treat toxic pollutants [2, 3].
In the past two decades, AGS systems have attracted the attentions of many
researchers in wastewater treatment field. Previous studies explored the influence of
various factors on aerobic granulation, such as shear force (aeration intensity), settling
time, wastewater composition, and organic loading [4–8]. Most of these studies were
carried out in sequencing batch reactors (SBRs), the most successful systems for AGS
[9].
Aerobic granulation is a process which involves self-aggregation of bacteria
forming compact structure with size bigger than 0.1 mm [10]. Wastewater characteristics
and reactor operation conditions are crucial for the granulation process. In SBR operation,
suitable settling time and hydraulic retention time (HRT) controlled by cycle time could
provide hydraulic selection pressure for aerobic granulation, which is regarded as the
most important factor [11]. The bigger and denser particles are retained in the reactor
with smaller particles being discharged. However, if strong hydraulic selection pressure
is used (short settling time and HRT), much biomass would be washed out. Organic
loading rate (OLR) also plays a major role in the aerobic granulation process. High OLR
can provide suitable conditions for fast-growing bacteria resulting in filamentous
overgrowth and unstable reactor performance [12, 13], leading to instability of AGS [14].

2
From the above literature review, two major aspects have been focused in previous
studies of AGS: (1) exploration of shortening granules formation, and (2) investigation
on the operation strategy that is able to maintain granular stability. Liu and Tay [10]
suggested that the factors affecting granules formation and long-term operation stability
are different. A strong hydraulic selection pressure or a high OLR during granules’
formation period is believed to shorten granules’ formation. On the other hand, a lower
OLR or a stronger aeration rate could maintain the long-term stability of aerobic granules.
1.2 Aerobic granular sludge in continuous-flow reactors
The study on aerobic granular sludge for pilot- or large- scale application is still
very limited. In other words, most of AGS studies were conducted in SBRs. A typical
SBR operation for an AGS system consists of feeding, idling, aeration, settling and
effluent discharge. Each period contributes some essential condition for aerobic
granulation. The above sequential processes in the SBR are usually controlled through a
sophisticated control mechanism. The more complicated operation in SBR is a hindrance
for its application for large-scale systems. In an engineering prospective, continuous-flow
reactors (CFRs) are preferable over SBR systems due to its lower installation cost, and
easier operation, control and maintenance. However, CFRs lack several important factors
for granule development such as hydraulic selection pressure and alternation of feast-
famine period. Hydraulic selection pressure is important for granules’ formation to retain
dense and bigger biomass, and discharge loose and filamentous biomass [10, 15]. As
explained in a previous study [10], hydraulic selection pressure may be prerequisite for
granules’ formation that determines the length of granulation time. A previous study
reported that aerobic granules developed in a CFR lost their stability faster than those in
a SBR [16].
The absence of feast-famine condition in a continuous-flow membrane bio-reactor
(CMBR) led to microbial competition with resultant accumulation of filaments in the
reactor [17]. In addition, the absence of hydraulic selection pressure in a continuous-flow
reactor is also regarded as the cause for filamentous accumulation and thus granules’
disintegration [17, 18]. Aerobic granules cultivated in a column-type continuous-flow
reactor with external settling tank gradually lost their stability during 140 days of
operation due to the growth of filaments in the reactors [19–21].

3
Previous works indicate that the realization of granulation and maintenance of
granular stability are the two major challenges for the large-scale application of AGS
technology. The current bottleneck emphasizes the need for further study on granular
stability in continuous-flow reactors as a base for practical application purposes.
1.3 Algal-bacterial symbiosis in wastewater treatment
Excess nutrients in water body can bring about environmental issues such as
eutrophication that leads to algal bloom phenomenon. If the excess nutrient(s) or
substance(s) enter wastewater treatment facilities in a proper quantity, with the help of
sunlight exposure algae growth will occur in the wastewater treatment plants. Algae-
activated sludge systems for wastewater treatment have aroused much interests in
academic fields due to the ability of algae to produce oxygen [22] that is required for the
aerobic degradation of organic substrates, and their ability to uptake and remove P and N
simultaneously. This could open some new opportunity for energy saving in the
wastewater treatment plant with optimum performance. Previous studies reported that the
co-existence of algae with activated sludge could have good performance on nutrients
uptake [23–25].
1.4 Algae growth in aerobic granular sludge
Symbiotic algal-bacterial granular sludge could be very attractive for municipal
wastewater treatment. It has the advantages of algae-activated sludge system in addition
to the extra benefits from AGS (excellent settling ability, able to withstand toxic
pollutants, high removal efficiency), which could also become a possible solution for
effective separation of algal-bacterial biomass from the wastewater.
Algae have been found naturally grown and co-existed with AGS in a SBR reactor
treating 600 mg/L of chemical oxygen demand (COD) (with COD/NH4-N/PO4-P ratio of
60/10/1) under natural sunlight exposure [26, 27], yielding deteriorated N and P removal.
In another report [28] algae-bacteria granular consortia was successfully developed by
seeding specific algae (Chlorella and Scenedesmus) and aerobic granules, which didn’t
show better N and P removals than that from Huang et al. [26]. However, other report
stated that algal-bacterial granular symbiosis seeded by activated algae inoculum
composed of microalgae (Chlorella)-bacteria flocs treating low-strength wastewater in

4
sequencing batch mode showed good performance on N and P removals without
introducing external aeration [29].
These previous works indicate that there is still limited information about
bioactivity and stability of algal-bacterial granules, especially in continuous-flow systems
which could be very useful for practical application of AGS technology. This suggests
the need for further research on algal-bacterial granules’ stability and bioactivity in a
continuous-flow system.
1.5 Kinetic modeling of aerobic granular sludge
Mathematical kinetic models can be used as means to aid environmental engineers
to evaluate the design, operation and optimization of a treatment system. The
mathematical simulation can provide a fundamental information for reactor design and
operation, which is essential for describing the treatment performance. Various kinetic
models have been applied to study the performance of bioreactors, particularly on the
COD and N removals. The popular and essential models that can be used to predict the
individual substrate removal rate in a simple approach are zero-order, first-order and Grau
second-order kinetic models [30–32]. While other popular models applied for describing
aerobic biological treatment processes are generally adopted from the activated sludge
models (ASMs) [33] including ASM1, ASM2, ASM2d, and ASM3 [34–36]. As a matter
of fact, the actual reactions occurred in the biological process are complex. The original
ASMs need to be modified to predict the closest reaction pathway to provide accurate
results, and the modifications could be varying from one system to another. In addition,
the ASM3 neglects nitrite as the intermediate product due to its assumption that both
nitrification and denitrification happen as a single step process. Therefore, some
modification has been tried to include nitrite which is essential in nitrification and
denitrification processes [34, 37–40]. On the other hand, ASMs can be used effectively
only if all the parameters are known. Even though most of the model parameters can be
obtained from experiments, some of them still need to be obtained from model calibration.
Calibration is still required even for the model parameters derived from literature to
acquire good consistence between simulation and experimental results due to the
differences in reactor configuration, influent characteristics, operation condition, and
reaction mechanisms involved in the processes.

5
Previous researches demonstrate that the major hindrance in the model
development for AGS process is the complex biological reaction mechanisms that could
affect model development, modification or selection of model parameter values.
Although the kinetic model of AGS has already been studied in detail with satisfactory
simulation results [34], there is yet no information about kinetic parameters and
mathematical models which could be used for continuous-flow reactor (CFR) based algal-
bacterial AGS system. In the present work, organics and nutrient removals were estimated
using the kinetics models developed from typical cycle tests on the algal-bacterial AGS.
This study tried to transform sophisticated reaction mechanisms involved into
simplified individual substrate removal expression. The implemented model was able to
show organics, N and P removals, in addition to both nitrite and nitrate accumulation in
the system, and incorporation of aeration and non-aeration conditions in a typical cycle
operation. Moreover, the model was implemented to study the effect of aeration/non-
aeration duration on organics and nutrients removal regarding energy requirement to
optimize the operation conditions that contribute to the maximum organics and nutrients
removal. It is expected that the findings from this work could provide some simple and
applicable means to predict reactor performance which benefits the optimization of
reactor design and operation conditions for the algal-bacterial AGS system in large-scale
applications.
1.6 Research objective and structure of the thesis
This study aims to explore various operation conditions for algal-bacterial AGS in
continuous-flow reactors that could provide good pollutants removal and stable granules.
The successful results of this thesis are expected to shed light on the long-term stable
operation of algal-bacterial AGS in large-scale applications. To achieve these objectives,
this thesis is divided into four chapters with the major points illustrated in Figure 1-1.
Chapter 1 introduced the recent achievements of AGS systems and its problems related
during operation. The extensive research works on AGS were focused on the factors
effecting granulation, and most importantly, very less information could be found on AGS
operation in continuous-flow reactors. While during operation, occasionally algae growth
occurs in the system, which may have effect on the reactor performance. With the aim of
realization of successful large-scale applications of AGS (or algal-bacterial AGS),
6
mathematical models were claimed as a useful mean to assist the development of AGS.
The objectives of this study were also arrived in this chapter.
Chapter 2 focused on the investigation on the stability of algal-bacterial AGS in two
different reactor configurations (single and two series reactors) for approximately 120
days of operation. In the Stage I of operation (days 0 – 60) both systems were operated
under the same influent concentrations. During the subsequent 60 days, the influent
concentration of single reactor was elevated to twofold of the previous stage with the
purpose to test the performance under a higher pollutant loading. Organics, N and P
removals, biomass settleability and stability of the two systems were compared and
discussed. In addition, the mechanisms regarding the formation and enhanced stability of
the new algal-bacterial granules in continuous-flow reactors were proposed.
Chapter 3 introduced the novel approach to predict kinetics to study the reactor
performance. Mathematical modeling could be useful for further investigation. The
kinetic model was developed by using experimental data during cycle tests on the algal-
bacterial AGS in a continuous-flow reactor, which was successfully applied to describe
the reactor performance with good accuracy. More importantly, the model was also
successful to be implemented for general AGS in a SBR reactor with good consistence.
At last, the model was implemented to study the effect of aeration strategy for N and P
removals with respect to energy consumption.
Chapter 4 investigated the potential and capability of algae co-existence in AGS
systems that could realize low energy consumption for wastewater treatment by testing
the performance of algal-bacterial AGS with effluent recirculation instead of aeration.
The performance of general AGS and algal-bacterial AGS were compared and then a
further test was conducted on algal-bacterial AGS. Eventually, to test the adaptability of
algal-bacterial AGS under different operation strategies and to recover its performance
and stability, the reactor operation was switched from non-aeration to intermittent
aeration.
Chapter 5 summarized the major conclusions of the thesis. For better understanding
on the continuous-flow algal-bacterial AGS, future studies were also proposed.

7
Figure 1-1. Structure of the thesis.
• Different reactor configuration • Different loading rate
CFR & SBR
Different aeration/non-aeration duration ratios
Aeration strategies
Long-term stability Pollutants removal performance Low cost treatment
Operation Cultivation
Non-aeration
Experiment Mathematical modeling
Continuous-flow algal-bacterial AGS
Chapter 2 Chapter 4
Chapter 3
Purpose: To explore various conditions involved resulting in stable operation of algal-bacterial AGS in continuous-flow reactors
Target: Stable performance (settling ability, granular strength and pollutants removal) of algal-bacterial AGS in continuous-flow systems for large-scale application

8
Chapter 2 Stability of algal-bacterial aerobic granules in continuous-flow
reactors to treat varying strength of domestic wastewater
2.1 Introduction
My lab previous work [26] found that algae could naturally grow in the AGS system
operated in SBR under natural sunlight exposure leading to decrease in N and P removals.
While other researcher [28] successfully cultured algal-bacterial consortia by seeding mature
AGS and microalgae (Chlorella (FACHB-31) and Scesdesmus (FACHB-416)). Up to present,
however, very limited information is available on algal-bacterial granules, especially on their
stability in continuous-flow reactors during long-term operation.
In a continuous-flow reactor, the reactor configuration such as single-, series-, or parallel-
reactor are regarded to have different effects on its performance. This study investigated the
stability of algal-bacterial AGS (in terms of organics and nutrients removal, granular settling
performance and stability) operated under two different reactor configurations (1 single and 2
reactors in series) for approximately 120 days. Besides, the mechanisms of algal-bacterial AGS
in the continuous-flow reactor regarding the formation and stability enhancement of new algal-
bacterial granules were also discussed.
2.2 Materials and methods
2.2.1 Experimental set-up and operation conditions
One single reactor (R1) and two reactors in series (R2), made of acrylic plastic, were used in
this study. R2 consisted of two identical reactors (R2-1 and R2-2) with automatically internal
recirculation from R2-2 to R2-1. Each system had the same total working volume of 1 L. The
structural diagram of the two reactor systems is shown in Figure 2-1.
A mixture of mature general AGS and algal-bacterial AGS with a ratio of 1:1 (w/w)
cultivated in SBRs in the laboratory was used for seed sludge. The general and algal-bacterial
AGS were obtained using the same cultivation method as described by Huang et al. [26] with
the main characteristics of synthetic wastewater for AGS cultivation as follows: 300 mg
chemical oxygen demand (COD)/L (50% of which was contributed by sodium acetate and
glucose, respectively),10 mg PO4-P/L (KH2PO4) and 100 mg NH4-N/L (NH4Cl). The initial
mixed liquor suspended solids (MLSS) and mixed liquor volatile suspended solids (MLVSS)
were 5.0 g/L and 4.0 g/L (MLVSS/MLSS = 0.8), respectively in each reactor in this study.

9
The two systems were operated for two stages (stage I and stage II) about 120 days. A
synthetic wastewater with sodium acetate as carbon source was used as influent. The
components of synthetic wastewater were prepared according to the characteristics of domestic
wastewater in Yogyakarta, Indonesia in stage I: 300 mg COD/L (sodium acetate), 10 mg PO4-
P/L (KH2PO4), 100 mg NH4-N/L (NH4Cl), 10 mg Ca2+/L (CaCl2·2H2O), 5 mg Mg2+/L
(MgSO4·7H2O), and 5 mg Fe2+/L (FeSO4·7H2O) (COD/N/P ratio = 30:10:1).
All the reactors were operated continuously at room temperature (25 ± 2°C) and hydraulic
retention time (HRT) of 6 h under alternative aeration (60 min) and non-aeration (30 min)
conditions, respectively. Only room light was provided for these reactors with no light control
throughout the experiments (light illumination intensity about 900 - 1100 lux with all lights
on). During aeration, air was supplied by an air pump (AK-30, KOSHIN, Japan) from the
bottom of reactors through air bubble diffusers at an air flow rate of 0.5 cm/s. The average
dissolved oxygen (DO) concentration was 7 - 8 mg/L and 2 - 5 mg/L during aeration and no
aeration periods, respectively. Reactor modification was done on day 50 by installing an
internal separator in each reactor to achieve better retention of granules in the reactors. As no
control was conducted on solids retention time (SRT) for the two reactor systems, SRT for both
R1 and R2 was estimated to be 30 ~ 70 days according to the total biomass amount and the
effluent condition (flowrate and solids concentration) during the 120 days’ operation.
From day 60 on (stage II), as the performance of the two reactor systems became relatively
stable, influent COD, NH4-N, and PO4-P concentrations to R1 were increased to 600, 200 and
20 mg/L (COD:N:P ratio = 30:10:1) by using the same chemicals as above respectively to test
the reactor stability when encountering higher strength wastewaters. The major difference in
influent for the two reactor systems during stage I and stage II is shown in Table 2-1.
2.2.2 Analytical methods
Influent and effluent samples were collected once every 10 days, and sampling was done at
12:00 pm (at the end of non-aeration period) and then filtered through 0.45 µm membrane prior
to analysis. Parameters related to reactor performance (PO4-P, NH4-N, NO3-N, and NO2-N
concentrations) in addition to sludge volume index (SVI5), MLSS and MLVSS were analyzed
in accordance with standard methods [41]. Algae content in granules was estimated based on
the extracted chlorophyll-a amount from the granules [41]. Dissolved organic carbon (DOC)
was measured by TOC analyzer (TOC-VCSN, SHIMADZU, Japan) equipped with an auto-
sampler (ASI-V, SHIMADZU, Japan). DO meter (HQ40d, HACH, USA) was used for
measuring DO level in the reactors. pH was monitored using a pH meter (Horiba, Japan). A

10
pocket digital lux meter (ANA-F11, Tokyo Photoelectric Co., Ltd., Japan) was used to measure
the light intensity around the reactors.
A stereo microscope (STZ-40TBa, SHIMADZU, Japan) with a program Motic Image Plus
2.35 (Version 2.3.0) was used to measure the granular size, and Leica M205 C Microscope
(Leica Microsystems, Switzerland) was used to observe granular morphology change.
The stability of granules was evaluated by the change of turbidity in sludge sample after
shaking at 200 rpm for 10 minutes [42]. Standard buffer solution was used to replace distilled
water in this work.
Extracellular polymeric substances (EPS) extraction from granules was carried out
according to the heating method [43]. EPS was the sum of protein (PN) and polysaccharides
(PS) in this study. PS content of the granules was measured using the phenol-sulfuric acid
method [44], and PN content of the granules was determined using the Bradford method with
bromine serum albumin (BSA) as standard [45].
All the determinations were performed in triplicate, and average values were used if there’s
no special indication.
2.2.3 Calculations
DOC, TN and TP removal efficiencies were calculated according to Cai et al. [5], while
their removal capacities were calculated by using Eq. (2-1), which can be used to compare the
reactor performance between the two reactor systems.
Removal capacity (X, mg/g-MLVSS/d) = 24 × (Cinf - Ceff)/(MLVSS × HRT) (2-1)
where X (mg/g-VSS/d) is the removal capacity of DOC, TN or TP, and Cinf (mg/L)and Ceff
(mg/L) are concentrations of DOC, TN or TP in the influent and effluent, respectively. MLVSS
(g/L) is the MLVSS concentration in the reactor, HRT (h) is the hydraulic retention time of
wastewater in the reactor, and 24 is the conversion unit from day to hour.
Increase in turbidity (∆Turbidity) used to indicate granular stability was calculated as
follows:
∆Turbidity (NTU) = Turb1 – Turb2 (2-2)
where Turb1 (NTU) and Turb2 (NTU) are the granular sample turbidity before and after shaking,
respectively. ∆Turbidity is defined herein as the change of turbidity in the supernatant before
and after shaking test. A lower ∆Turbidity denotes a greater strength of granules.
2.2.4 Statistical analysis
A statistical analysis of variance using one-way analysis of variance (ANOVA) was
conducted, not only to test the significance of change in granular stability and pollutants (DOC,

11
N and P) removal in each reactor during the two stages’ operation, but also to check the
significance of variance in granular stability and pollutants removal between the two reactor
systems when being fed the same strength influent (like stage I).Significant difference was
assumed at p < 0.05.
2.3 Results and discussion
2.3.1 Performance of the two reactor systems
To evaluate the performance of algal-bacterial AGS on organics and nutrients removal in
the continuous-flow reactor systems, biomass growth and its settleability were recorded along
with DOC, P, and N removals during the 120 days’ operation.
(1) Biomass growth and settleability of algal-bacterial AGS
MLSS and SVI5 were determined to evaluate biomass growth and granular settleability in
the continuous-flow reactors.
As seen from Figure 2-2a, it is clearly that MLSS was averagely decreased from initial 5.0
g/L to 3.5 and 3.4 g/L on day 50 in R1 and R2, respectively. This observation is most probably
attributable to the carry-out effect of effluent that flows from the algal-bacterial AGS systems
during the aeration period, leading to the significant decrease in MLSS in both reactor systems.
As it is known, a smaller SVI5 value reflects better settleability. During the first stage of
operation (stage I, days 0 – 60), the SVI5 value averagely increased to some extent from initial
52 to 67, 67 and 62 mL/g in R1, R2-1 and R2-2 on day 50, respectively, followed by detectable
decrease in biomass concentration in both reactor systems (Figure 2-2a). Filamentous bacteria
were also observed to grow in these two systems. This is possibly caused by different operation
strategies (as SBR was used for seed granules cultivation while continuous-flow reactors were
used for this test) and different wastewater characteristics used for seed granules cultivation
and this study, respectively, thus the granules might need a certain period for adaptation and
stabilization. Unlike SBR systems, continuous-flow reactors lack hydraulic selection pressure
which is helpful to discharge sludge with worse settleability. Filamentous bacteria are reported
to be a substantial element for granulation, which can serve as the backbone of granular sludge
[46]. However, excessive amount of filamentous bacteria can bring about the worsening of
granules and lead to sludge wash-out. Being similar to Chen et al. [18] and Corsino et al. [17],
it is also necessary to pay close attention to filamentous accumulation in the continuous-flow
algal-bacterial AGS system.

12
With the aim to retain algal-bacterial AGS in the reactor, a reverse funnel-shape internal
separator was installed in each reactor on day 50, which seems to effectively retain algal-
bacterial AGS in the reactor. After the installation of internal separator (stage II, days 60 – 120),
the average biomass concentration steadily increased from 3.5 to 4.8 g/L in R1 and from 3.4 to
4.3 g/L in R2, respectively. Zhou et al. [47] noticed that the internal separator could optimize
granular size distribution in SBR. Results from this work also indicate that the internal
separator could achieve hydraulic selection pressure in continuous-flow reactors, thus favoring
the selective discharge of biomass. Selective filamentous discharge successfully may help to
gain better granular settleability [48]. As shown in Figure 2-2a, after installation of the internal
separator, the SVI5 values in all reactors gradually decreased, showing better granular
settleability than their initial conditions (SVI5 = 44, 49, and 46 ml/g on day 120 for sludge in
R1, R2-1, and R2-2, respectively).
Algae content in the granules was found to be relatively stable in granules from the reactors,
varying from initial 1.64 mg/g to 1.69 mg/g, 1.65 mg/g, and 1.67 mg/g in AGS from R1, R2-1
and R2-2, respectively on day 120 under the tested conditions.
(2) DOC removal
The changes in DOC removal capacity and MLVSS concentration in both systems (R1 and
R2) are shown in Figure 2-2b. Steady increase in DOC removal capacity was observed in R1
and R2 during stage I, which remained relatively stable at ~150 mg DOC/g-MLVSS/d (or 0.5
kg COD/kg-MLVSS/d) in R2. However, in R1 this removal capacity was increased to ~ 290 mg
DOC/g-MLVSS/d (or 0.9 kg COD/kg-MLVSS/d) and then remained relatively stable during
stage II. As shown in Figure 2-2c, the average effluent DOCs from R1 and R2 were around 4.5
and 4.0 mg/L, achieving average DOC removal efficiency of 96% and 95%, respectively.
During the 120 days’ operation, no significant difference in DOC removal efficiency was
detected between these two reactor systems (p = 0.106). Results show that these two
continuous-flow systems can be used to effectively remove organics, even for the treatment of
high strength domestic wastewater with high concentrations of organics and nutrients.
(3) N and P removals
Figure 2-3a shows the N profiles in the effluents from the three reactors during 120 days’
operation. Seen from the results, algal-bacterial AGS in both R1 and R2 systems exhibited
excellent performance in treating NH4-N wastewater with NH4-N removal rate > 99% from the
very beginning of this test. Nitritation and nitratation efficiencies were also calculated
according to Li et al. [27] (Figure 2-3b). Results reflect that both reactor systems demonstrated
excellent nitritation efficiency (99-100%). That is, in both systems NH4-N can be easily and

13
effectively converted into NO2-N. However, better nitratation (from NO2-N to NO3-N) was
always noticed in R2 than in R1 during the whole operation, possibly due to its relatively lower
DOC concentration (Figure 2-2c). In addition, as shown in Figure 2-3c denitrification process
also occurred better in R2 system during the first stage under the same operation conditions of
R1. The effective denitrification in R2 might be resulted not only from the automatically internal
recirculation of treated water (with high level of NO3-N) from R2-2 to R2-1 (Figure 2-1b), but
also from the high organics level in the influent of R2-1 as both are prerequisite and beneficial
for denitrification.
In this study, total nitrogen (TN) concentration was calculated as the sum of NH4-N, NO2-
N and NO3-N in the reactor. Results show that TN removal efficiency was averagely 29% and
76% for R1 and R2, respectively during stage I of this test. Interestingly, during stage II the
nitratation efficiency in R1 was improved from 88% to 94%, even though this efficiency was
still a little bit lower than that in R2 (99%) (Figure 2-3b). Moreover, denitrification process
advanced better in R1 during stage II, resulting in increase of average TN removal efficiency
up to 80%. This observation might be attributable to the following two aspects. Firstly,
excessive organics concentration could function as carbon source essential for the growth of
denitrifiers. Secondly, anaerobic ammonium oxidation (ANAMMOX) to some extent might
also contribute to the enhanced denitrification in R1 during stage II as its influent NH4-N
concentration was also doubled, thus the produced NO2-N from nitritation could have more
chance to react with NH4-N, bettering the whole system’s denitrification performance. Still,
the real reason needs more detailed investigation.
In this work, the influent P in synthetic wastewater was prepared with KH2PO4, thus TP
removal can be reflected by PO4-P removal. Results show that the effluent PO4-P
concentrations from R1 and R2 were averagely 5.60 and 5.11 mg/L during stage I, which were
10.86 and 5.01 mg/L during stage II, respectively. Even though the effluent PO4-P
concentration from R1 increased to around 11 mg/L during stage II (when influent PO4-P
concentration was doubled from 10 to 20 mg/L), its PO4-P removal efficiency was almost
similar. In this study, the P removal efficiency was about 44% and 49% for R1 and R2 during
stage I, which relatively stabilized at 46% and 50% during stage II, respectively. Statistical
analysis indicates that under the same influent condition (like stage I), R2 performed slightly
better in TP removal efficiency than R1 (p = 0.002). For each reactor system, however, no
significant difference in TP removal efficiency was found between the operation of stage I and
stage II (p = 0.119 and 0.725 for R1 and R2, respectively). Results also show that algal-bacterial
AGS in this work exhibited lower P removal efficiency when compared to the general AGS

14
operated in continuous-flow enhanced biological P removal (EBPR) systems [19–21]. Two
aspects may contribute to the lower phosphorous removal in the algal-bacterial AGS systems
in this work. On one hand, no intentional biomass discharge from the reactors was performed
during the whole test period (or no SRT control) as the purpose of this work is to compare the
stability of algal-bacterial AGS in the two reactor systems, which is closely associated with P
removal efficiency in biological wastewater treatment systems. Biomass was lost or discharged
mainly by the carry-out effect of effluent. On the other hand, the organic loading applied for
the algal-bacterial AGS systems in this work is much higher than those for AGS EBPR
processes [19–21], which is not beneficial for enhanced P removal. The investigation is still
on-going with respect to further enhancement on nutrients (N and P) removal by optimizing
the operation strategies and organics and nutrients loadings to the continuous-flow algal-
bacterial AGS systems.
2.3.2 Characteristics of algal-bacterial granules
(1) Change in morphology
In this study, a mixture of mature AGS and algal-bacterial AGS was used for seed sludge
which was to mimic the startup of a new algal-bacterial AGS system. At the beginning, the
mature AGS was yellowish while the algal-bacterial AGS was green, and both AGS exhibited
irregular, compact and dense structure. During the operation, fluffy outer surface was observed
on the granules in both reactor systems, indicating the existence of filamentous bacteria. As
discussed previously, filamentous bacteria may cause worsen settleability and decreased
amount of biomass in the reactors. In this work, the installation of internal separator
successfully provided selective discharge of sludge from the reactors, resulting in effective
retaining of granules with larger size in the reactors. Restated, some filamentous bacteria were
still observed in the reactors till the end of experiments, which seemed to have little negative
effect on granular stability of algal-bacterial AGS.
(2) Granular size and distribution
Figure 2-4 shows the dynamic changes of granular size and its distribution. The average
diameter of granules in R1, R2-1 and R2-2 was determined to be 0.84, 0.89, and 1.31 mm
respectively on day 1. During stage I (days 0-60), the granules in all reactor systems showed
some increase in size to 1.09, 1.16 and 1.41 mm in R1, R2-1 and R2-2 on day 60, respectively.
The granular size of AGS in R2-2 remained relatively stable, possibly due to the lower organic
loading applied to R2-2 (the second reactor in the series reactor system) compared to the other
two reactors (R1 and R2-1). During the stage II, the granular size in all the tested reactors seemed
15
to be relatively stable most probably due to the existence of co-aggregation and compaction of
AGS at the same time [49], which is partially indicated by the increased biomass concentration
in R1, R2-1 and R2-2 (Figure 2-2a) and their relatively stable granular diameters. In addition,
very limited change in granular size distribution was observed for the granules in all the
reactors after internal separator installation, especially during stage II. This indicates that the
internal separator could not only retain biomass in the reactor but also maintain granular size
distribution. In addition, the change of organics and nutrients concentrations in influent exerted
limited effect on the granular size distribution as well.
(3) EPS and granular stability
EPS are secreted products from bacterial cells, which are regarded to have contribution to
granular structure [50] and granulation process [51]. PS and PN are essential constituents of
EPS and the characteristics of granules are usually related to PS/PN ratio [52] which may have
contribution to granular stability. Thus, PS, PN and PS/PN ratio during the 120 days’ operation
were also measured and recorded in this study. An increased average EPS content was noticed
in the granules from R1 after switching from stage I (47.1 mg EPS/g-MLSS) to stage II (63.0
mg EPS/g-MLSS), while EPS content in the granules from R2-1 and R2-2 seemed to be relatively
stable during the whole operation (averagely 54.5 mg EPS/g-MLSS and 44.6 mg EPS/g-MLSS
in R2-1 and R2-2, respectively). The increase of EPS content in R1 could be contributed by the
increase of organic loading to R1 from stage I to stage II, as higher organics feeding might
stimulate biomass to produce more EPS. However, very limited change was detected in PS/PN
ratio of granules from all the reactors during the 120 days’ operation, indicating that the algal-
bacterial granules could maintain their structural stability in continuous-flow reactors under
the tested conditions.
On the other hand, during the whole operation, no significant difference was found on the
change of ∆Turbidity for granule samples from the three reactors (p = 0.064, Fig. 5). As shown,
the three reactors could quickly and positively respond to the changes in operation strategy
(from SBR to continuous-flow) and influent wastewater characteristics, maintaining their
granular stability throughout this test. To some extent, R1 seems to have more potential for
stable operation as its granules could keep their stability even when its influent organic and
nutrient loadings were double increased during stage II. As the organic and nutrient loadings
to R2-1 and R2-2 were different from each other due to the configuration of series reactor system
itself, it’s understandable that some difference in granular stability could be noticed among the
granules from the three reactors. According to the results from the 120 days’ operation, algal-
bacterial AGS possesses excellent stability in continuous-flow reactor systems. Cai et al. [5]

16
examined the granular stability after feeding glucose/acetate and glucose/propionate
wastewater into two SBRs and found that the ∆Turbidity for general AGS samples were 3.59
and 6.74 NTU, respectively. In this work, the ∆Turbidity values on day 120 were 1.67, 1.85,
and 1.67 NTU for the algal-bacterial AGS samples from R1, R2-1 and R2-2, respectively. This
observation also indicates that algal-bacterial AGS could have better granular stability in
continuous-flow reactor systems.
2.3.3 Preliminary analysis on mechanism involved
Based on the microscopic images and the phenomenon observed during the 120 days’
operation, mechanisms involved in the development of new algal-bacterial AGS with higher
stability are proposed as illustrated in Figure 2-6.
The seed sludge used in this study was a mixture of general AGS and algal-bacterial AGS
where algae was initialed and grew naturally. Under the designed operation conditions
(including uncontrolled room light with illumination intensity about 900-1100 lux when all
lights were on), new algae appeared with fluffy outer surface that is similar to filamentous
bacteria. Probably due to aeration and resultant shear force, the fluffy algae could entrap the
suspended particles and form microbial co-aggregates, the small clusters for algal-bacterial
AGS. More specifically, the filamentous algae might also provide a nucleus for these
aggregates thus binding with smaller granules. The shear force from aeration may enhance
effective collision and then strengthen the binding effect between nucleus and aggregates [49,
53]. Consequently, compact algal-bacterial granules were generated in the continuous-flow
reactors.
Algal-bacterial granules usually grow up to a diameter of 1.0 – 1.5 mm with a solid or dense
structure and clear appearance of filamentous algae inside the granule body, which serves as
the backbone for the whole granule. Their cross-section images also confirm the role of algae
as the nucleus or backbone of algal-bacterial granules. Algae functioned as nucleus and
backbone along with the existence of EPS might contribute to the enhancement of granular
stability to a great extent [52]. In addition, with the help from shear force created by aeration,
the continuous-flow reactor systems used in this work could provide suitable conditions to
sustain algae-bacterial AGS with better stability.
In this work, most of the naturally growing algae were found to be Phormidium sp. Future
exploration will be conducted on the major functional algae species which provide the nucleus
or binding sites. During the 120 days’ operation, biomass wasn’t intentionally disposed from
the two systems as no control on SRT was applied in this study. Compared to general AGS,

17
less increase in MLVSS was detected in the algal-bacterial AGS systems (Figure 2-2), partially
attributable to some loss of biomass (which was not retained by the internal separator) with
lower settleability along with the discharge of effluent. On the other hand, the bacteria in the
initial seed sludge may be mainly composed of slow growing bacteria, to some extent resulting
in less increase in biomass concentration during the test period. In addition, some small animals
eating biomass appeared gradually in the reactors (data not shown), which may also contribute
to this phenomenon. Therefore, attention should also be paid to the changes in species of
bacteria, algae and small animals, and their functions during the long-term operation of algal-
bacterial AGS reactors.
2.4 Summary
Algal-bacterial AGS kept its stability during 120 days’ operation in the tested two
continuous-flow systems. Installation of internal separator successfully achieved effective
retention of granules facilitating biomass growth and maintenance of granular stability. Results
show that both systems exhibited almost similar efficiencies in overall organics and nutrients
removal, implying that algal-bacterial AGS possesses excellent stability in continuous-flow
reactors even operated at double increased organic and nutrient loadings. Future research is
necessary to shed light on the mechanisms of stable operation of algal-bacterial AGS, and
further optimization of continuous-flow systems could also pave the way for its application in
practice.

18
Table 2-1. Characteristics of synthetic wastewater used in this study.
Reactor Major parameters for influent Stage I
(Days 1-60)
Stage II
(Days 60-120)
R1 COD (mg COD/L) 300 600
NH4-N (mg NH4-N/L) 100 200
PO4-P (mg PO4-P/L) 10 20
R2 COD (mg COD/L) 300 300
NH4-N (mg NH4-N/L) 100 100
PO4-P (mg PO4-P/L) 10 10

19
(a)
(b)
Figure 2-1. Structural diagram of the reactors: single reactor (R1) (a) and series reactor (R2)
(b). 1-Influent, 2-Effluent, 3- Aeration line, 4-Internal separator for solid-liquid separation, 5-
recirculation pipe.
1
3
2 4
R1
H = 31 cm
D = 6.5 cm
1
3
4
R2-1
3
4
R2-2
2
D = 5.3 cm D = 5.3 cm
H = 23 cm

20
Figure 2-2. Changes in granular settleability and organics removal during 120 days’
operation. SVI5 and MLSS variations (a), DOC removal capacity and MLVSS variations (b),
and effluent DOC and DOC removal efficiencies (d) in the two reactor systems.
(a)
SVI 5(mL/g-MLSS)
0
20
40
60
80
MLSSconcen
tration(g/L)
0
2
4
6
8
10
Operationtime(day)0 20 40 60 80 100 120
SVI5(R1)
SVI5(R2-1)
SVI5(R2-2)
MLSS(R1)
MLSS(R2)
StageI StageII
Separatorinstallation
(b)
Rem
ovalcapacity
(mgDOC/g-M
LVSS)
0
100
200
300
400
500
600
MLVSSco
ncen
tration(g
/L)
0
1
2
3
4
5
Operationtime(day)0 20 40 60 80 100 120
Removalcapacity(R1)
Removalcapacity(R2)
MLVSS(R1)
MLVSS(R2)
StageI StageII
(c)
DOCconcentration(mg/L)
0
4
8
12
16
20
24
DOCrem
ovalefficien
cy(%
)
0
20
40
60
80
100
Operationtime(day)0 10 20 30 40 50 60 70 80 90 100 110 120
Effluent(R1)
Effluent(R2-1)
Effluent(R2-2)
Removal(R1)
Removal(R2)
StageI StageII

21
Figure 2-3. N and P removal profiles for the two reactor systems during 120 days’ operation.
N species (a), nitritation and nitratation efficiencies (b) according to Li et al. [27], and TP and
TN removals (c).
(a)
Concentration(mg/L)
0
20
40
60
80
100
Operationtime(day)20 40 60 80 100 120
NH4-N(R1)
NH4-N(R2-1)
NH4-N(R2-2)
NO2-N(R1)
NO2-N(R2-1)
NO2-N(R2-2)
NO3-N(R1)
NO3-N(R2-1)
NO3-N(R2-2)
StageI StageII
(b)
Efficiency(%)
75
80
85
90
95
100
Operationtime(day)20 40 60 80 100 120
Nitritation(R1)
Nitritation(R2)
Nitratation(R1)
Nitratation(R2)
StageI StageII
(c)
Removal(%)
0
20
40
60
80
100
Operationtime(day)20 40 60 80 100 120
TN(R1)
TN(R2)
TP(R1)
TP(R2)
StageI StageII

22
Figure 2-4. Dynamic changes of algal-bacterial granular size and distribution in R1 (a), R2-1
(b), and R2-2 (c).
(a)
Sizedistribution(%)
0
20
40
60
80
100
Averag
ediam
eter(mm)
0
0.4
0.8
1.2
1.6
Operationtime(day)0 20 40 60 80 100 120
>1.5
1.0-1.5
0.5-1.0
0.3-0.5
<0.3
Diameter
(b)
Sizedistribution(%)
0
20
40
60
80
100
Averag
ediam
eter(mm)
0
0.4
0.8
1.2
1.6
Operationtime(day)0 20 40 60 80 100 120
>1.5
1.0-1.5
0.5-1.0
0.3-0.5
<0.3
Diameter
(c)
Sizedistribution(%)
0
20
40
60
80
100
Averag
ediam
eter(mm)
0
0.4
0.8
1.2
1.6
Operationtime(day)0 20 40 60 80 100 120
>1.5
1.0-1.5
0.5-1.0
0.3-0.5
<0.3
Diameter

23
Figure 2-5. Changes in average granular strength of algal-bacterial AGS from the two reactor
systems during 120 days’ operation.
0
1
2
0 30 60 90 120
∆Tur
bidi
ty(N
TU)
Operation time (day)
R1 R2-1 R2-2R1 R2-1 R2-2

24
Figure 2-6. Schematic of proposed mechanisms of algal-bacterial AGS formation and
enhancement.

25
Chapter 3 Novel approach for kinetics prediction on algal-bacterial aerobic
granular sludge in a continuous-flow reactor and its application in decision
on aeration strategy
3.1 Introduction
Mathematical kinetic model can be utilized as a useful means to aid environmental engineers
to evaluate the design, operation and optimization of a treatment system. The mathematical
simulation can provide fundamental information for reactor design and operation, which are
essential for optimization of the whole treatment system. Various kinetic models have been
applied to study the performance of bioreactors, particularly on COD and N removals. Previous
research works demonstrate that the major hindrance in the model development for AGS
process is its complex biological reaction mechanisms that could affect model development
and modification or selection of the model parameter values. In addition, up to now, there is
no mathematical models that can be used for algal-bacterial AGS systems. This work for the
first time demonstrated a novel kinetic model development from typical cycle tests on the algal-
bacterial AGS, which is able to transform sophisticated reaction mechanisms involved into
some simplified individual substrate removal expressions with the incorporation of aeration
and non-aeration conditions in a typical cycle operation. The developed model successfully
predicted the organics, N and P removals in addition to both nitrite and nitrate accumulation in
the system. Furthermore, the effect of aeration/non-aeration duration on optimum organics and
nutrients removal with respect to energy requirement were explored by implementing this
model. The results from this work are expected to be able to provide some simple and accurate
means to predict reactor performance which benefits the reactor design and optimization of
operation conditions for algal-bacterial AGS systems in practice.
3.2 Materials and methods
3.2.1 Reactor configuration, synthetic wastewater and seed sludge
A cylindrical continuous-flow reactor with a working volume of 1 L equipped with internal
separator was used. The reactor operation conditions (HRT, aeration strategy, lighting, and air
flow rate) were the same as those in Chapter 2. During aeration, air was supplied from the
bottom of the reactor by an air pump (AK-40, KOHSIN, Japan). The average DO concentration
during aeration and non-aeration period was 5–6 mg/L and below 1 mg/L, respectively. The
operation of the reactor was conducted at room temperature (25±2˚C). A synthetic wastewater

26
was fed into the reactor with the composition as described in Table 3-1. Algal-bacterial AGS
cultivated from the previous study (Chapter 2) were used for seed sludge. The total suspended
solids (TSS) concentration was maintained at approximately 3 g/L during the reactor operation.
The volatile suspended solids to total suspended solids ratio (VSS/TSS) during the whole
operation was almost constant at 65%. Algae content in the sludge was around 2.5 mg/g-TSS
during the test period.
3.2.2 Cycle test experiments
On day 30 after the start-up, a batch experiment for the typical cycle operation was
conducted. The cycle test experiment was performed to observe the bioactivity of the biomass
(indicated by specific uptake rate) and as a basic approach for kinetic development.
Approximately 250 mL of mixed liquor was transferred to an Erlenmeyer flask and washed
with distilled water for several times to remove background substrates. After the complete
sedimentation of granules, fresh influent was introduced for the batch test for one cycle period
(90 minutes) with aeration and non-aeration time of 60 and 30 min, respectively. Sampling was
done every 10 minutes to measure the concentration evolution of substrates (DOC, NH4-N,
NO2-N, NO3-N and PO4-P). Triplicate samples were analyzed with their average values being
used for further calculations. The dynamic change in DO concentration during cycle test was
also monitored (once in 1 minute) to confirm whether the DO concentration in the reactor was
sufficient or not for the required biological process. The data of cycle test experiment were
collected for the calculations of specific removal and accumulation rates and for the
development of the proposed kinetic model.
The specific removal and accumulation rates of substrates during aeration and non-aeration
periods could be calculated from the slope of the change in the specific substrate concentration
versus duration of aeration or non-aeration period divided by VSS concentration in the reactor.
A negative value of this specific rate indicates removal while a positive one denotes the
occurrence of accumulation.
3.2.3 Kinetic models
This work presented different methods to predict kinetics by utilizing experimental data
from cycle tests to describe overall treatment removal with a similar approach. The overall
reactor performance was assumed to follow individual removal or accumulation occurred in
the reactor during one cycle of operation, described by the evolution of individual substrate
(COD, NH4-N, NO2-N, NO3-N and PO4-P) concentration. From the experimental results of
cycle tests, the removal and accumulation of substrates were noticed to occur in one cycle.

27
Thus, each substrate removal and accumulation kinetics were discussed in the context of the
real reactor operation.
(1) Substrate removal model
The substrate removal rate during aeration or non-aeration periods was determined using
zero-order, first-order and modified Grau second-order kinetic models.
The expressions of zero-, first- and modified Grau second-order removal rates are given by
Eqs. (3-1) to (3-3).
where "# (mg/g-VSS/min), $% (1/min) and $& (mg/L/min) are the zero-, first- and second-
order kinetic coefficients, and "# also indicates the specific substrate removal rate. '( (mg/L)
is VSS concentration in the reactor, and ) (mg/L) and )*+, (mg/L) are the substrate
concentration in the reactor and the influent, respectively.
(2) Substrate accumulation model
Substrate accumulation rate was determined by using zero-order or modified first-order
kinetic models. The expressions of zero- and modified first- order accumulation rates are given
by Eqs. (3-4) and (3-5). -.-/ = "1×'( (3-4)
-.-/ = $×(4 − )) (3-5)
where "1 (mg/g-VSS/min) and $ (1/min) are considered as zero- and first-order kinetic
coefficient, respectively, and "1 is also known as specific substrate accumulation rate. 4
(mg/L) is the equilibrium substrate concentration in the reactor.
3.2.4 Applicability of the proposed method
With the purpose to check the applicability of the proposed kinetic development method by
using the cycle test data, an additional test on general AGS in a sequencing batch reactor (SBR)
was also conducted. The SBR with a working volume of 15 L (D´H=20 cm ´ 46 cm) seeded
with general AGS was operated under 6 h of cycle time consisting of 3 min feeding, 60 min
non-aeration, 290 min aeration, 3 min settling and 4 min discharge. The average TSS
concentration and VSS/TSS ratio in the SBR during the whole operation period were
approximately 2.8 g/L and 65%, respectively.
−-.-/ = "#×'( (3-1)
−-.-/ = $%×) (3-2)
−-.-/ = $&× .
.789
&
(3-3)

28
3.2.5 Model implementation
Scilab ver. 6.0.0 platform (Scilab Enterprises, France) was used for the simulation. The
proposed model was applied to study different aeration strategies (Table 3-2) under the same
cycle time of 90 min in a continuous-flow reactor. The effects of aeration scenarios on organics,
N and P removal efficiency, and energy requirement were also discussed.
3.2.6 Analytical methods
Influent and effluent samples were collected once every day then filtered through 0.22 µm
membrane prior to analysis. The concentrations of NH4-N, NO3-N, NO2-N, PO4-P, TSS, and
VSS were determined according to Standard Methods [41]. Organics concentration was
determined as dissolved organic carbon (DOC) by TOC analyzer (TOC-VCSN, SHIMADZU,
Japan. DO concentration in the reactor was measured using DO meter (HQ40d, HACH, USA).
Chlorophyll-a was measured to indicate algae content in the granules according to Standard
Method [41].
3.2.7 Calculations
The overall pollutant removal efficiency was calculated according to Eq. (3-6).
:;<=>4?(%) = 100×(1 − )C,,/)*+,) (3-6)
in which )*+, (mg/L) and )C,, (mg/L) are the influent and effluent concentrations for the
designated pollutant, respectively.
3.2.8 Model accuracy and statistical analysis
The coefficient of determination (R2) and root-mean-square error (RMSE) were used to
evaluate the goodness between the experimental and simulation data. A model with an R2 of
greater than 0.75 indicates a good model while those with R2 of 0.25 or less are considered as
not-usable, and those with R2 between 0.25-0.75 are regarded as fair models [54]. At the same
time, a model with a smaller RMSE indicates a better fit. In this study, one-way ANOVA was
also conducted to test the significance of changes in DOC, TN and TP removals, and energy
requirement under different aeration scenarios, and p<0.05 was considered as statistically
significant.
3.3 Results and discussion
3.3.1 Experimental results from cycle tests
In this study, the CFR was operated under an alternative aeration and non-aeration period
of 60 min and 30 min, respectively. The change in DO concentration during the cycle operation

29
was monitored, which is imperative due to its particular implication for TN and TP removals.
As illustrated in Figure 3-1, the DO level reached a relatively constant value at 5.23 mg/L
during aeration and dropped to below 1 mg/L (near to anoxic/anaerobic condition) after 10
minutes of non-aeration period started. This DO level information during non-aeration period
is vital to ensure that both the nitrification-denitrification process and P removal could be well
realized in the tested reactor.
Based on the evolution of substrates concentration in the cycle test (Figure 3-1), substrate
removal and accumulation rates were calculated (Table 3-3). The removal and accumulation
rates could be used as an indicator of biomass bioactivity in the reactor [55, 56]. It was observed
that the DOC uptake rate (1.920 mg/g-VSS/min) during aeration was higher than that in non-
aeration period (0.159 mg/g-VSS/min), resulting in higher DOC removal during the aeration
period (43% and 3% in the aeration and non-aeration period, respectively). A similar activity
was observed on NH4-N removal (45% and 11% during aeration and non-aeration period,
respectively). A higher NH4-N removal achieved during aeration period indicated that NH4-N
removal mainly occurred from nitrification by ammonia oxidizing bacteria (AOBs) and a very
low DO level during non-aeration period might inhibit the activity of AOBs. During the
aeration period, nitrite was produced from NH4-N oxidization, which can further be oxidized
into nitrate by nitrite oxidizing bacteria (NOBs) (indicated by nitrate accumulation). The nitrite
accumulation was possibly due to a faster nitrite production rate than the nitrite oxidation rate.
The accumulation of NO2-N and NO3-N could also suggest the occurrence of two-step
nitrification (nitritation and nitratation) during the aeration period. On the other hand,
denitrification successfully happened during the non-aeration period (indicated by NO3-N
removal), while the NO2-N accumulation during non-aeration period might be resulted from
the byproducts of denitrification or from NH4-N oxidation. The results suggest that the applied
aeration and non-aeration period can successfully provide the desirable conditions for both
nitrification and denitrification.
Phosphorus uptake was detectable during the aeration period while phosphorus release was
observed during the non-aeration period. The increased TP concentration during the non-
aeration period might be attributable to the phosphorus release by phosphorus accumulating
organisms (PAOs) [57]. Under anaerobic conditions PAOs can release phosphorus to produce
carbon storage compounds like poly-hydroxyalkanoates (PHAs), while under aerobic
conditions PAOs consume organics or the stored PHAs are used for cell growth. A similar TP
release phenomenon was reported for general AGS in a SBR during non-aeration period [5]
and also detected in the cycle test experiment in the SBR in this study.

30
The cycle test results imply that the aeration and non-aeration periods could affect DOC, N
and P removals. Most notably, the aeration operation benefits P removal and non-aeration
operation could provide denitrification condition with resultant better TN removal.
3.3.2 Kinetic evaluation and model verification
Kinetic and mathematical modeling has been employed to predict the reactor performance.
Three substrates removal models and two substrates accumulation models were applied to
investigate the performance of the continuous-flow algal-bacterial AGS reactor in the present
work. Since the actual reactor operation involves consecutive aeration and non-aeration periods,
the overall kinetics applied would be a kinetic combination between the aeration and non-
aeration periods. As for the model development, when the zero-order removal reaction rate was
applied for DOC and NH4-N, negative substrate concentrations was always obtained in the
effluent either during aeration or non-aeration periods. Thus, the zero-order removal reaction
rates for DOC and NH4-N were excluded from the combination attempt. All the simulation
data were then plotted and compared with the experimental data (Figure 3-2). Finally, the
combination of reaction kinetics got the best fit, indicating by the highest R2 and minimum
RMSE, which was selected for further model implementation (Table 3-3).
The results show that the reaction kinetics for NH4-N concentration followed the first-order
removal rate (during both aeration and non-aeration) with R2 and RMSE of 0.994 and 2.37,
respectively. As for NO2-N, the reaction kinetics has the best fit to the zero-order accumulation
rate (aeration) and first-order accumulation rate (non-aeration) (R2 and RMSE of 0.993 and
0.20, respectively). The best consistence between the simulation and experimental data of NO3-
N concentration are given by the zero-order accumulation rate for both aeration and non-
aeration periods (with R2 and RMSE of 0.994 and 0.16, respectively). The PO4-P concentration
evolution followed the zero-order kinetic model during uptake or removal (aeration) and
release or accumulation (non-aeration) (R2 and RMSE of 0.996 and 0.07, respectively). The
overall reaction kinetics for DOC removal followed the first-order model during aeration and
non-aeration periods (with R2 and RMSE of 0.981 and 6.77, respectively).
Furthermore, the simulated effluent quality for 10 days’ operation also fitted very well to
the experimental data as shown in Figure 3-3a, giving the R2 value for all substrates greater
than 0.95. The above results indicate that the mathematical model developed from the cycle
test data could accurately predict the performance of the continuous-flow reactor used in this
study.

31
3.3.3 Validity and applicability of the proposed method
With the purpose to check the validity of the developed model in this study, aeration and
non-aeration durations were changed from 60 min and 30 min to 45 min and 45 min,
respectively while the total cycle duration was kept at 90 min for the subsequent 10 days’
operation. Further analysis on the applicability of the proposed kinetic model was also
conducted by applying the same procedure for a SBR reactor. The SBR has been continuously
and stably operated for approximately 110 days, and the effluent sampling was done every ten
days. The cycle test data used in this study was obtained on day 60. This test was intended to
check the applicability of the proposed kinetic development method on different types of
reactors, wastewater composition and seed sludge by using the cycle test experimental results.
A summary of the selected kinetic parameters that provide the best fit of simulation to
experimental data for both CFR and SBR operations are given in Table 3-5.
Figure 3-3b shows the measured and simulated results of the effluent quality parameters for
10 days of CFR operation when both aeration and non-aeration periods lasted 45 min. A very
good consistence between the experimental and simulation data was obtained with respect to
the concentrations and removal efficiencies of DOC, NH4-N, NO2-N, NO3-N and PO4-P,
respectively. Most importantly, the simulated effluent concentrations and removal efficiencies
of the effluent quality indicators from the SBR also fitted very well with the experimental data.
Table 3-6 summarizes the simulated and measured effluent quality indicators from the CFR
and the SBR, respectively.
Therefore, the above results prove that the developed mathematical model based on cycle
test data is applicable for both types of reactors (batch and continuous-flow), varying seed AGS
sludge and different influent characteristics.
3.3.4 Practical application
The obtained kinetic models were then implemented to study the effect of different aeration
strategies (Table 3-2) on DOC, TN and TP removals taking energy consumption into
consideration. The same influent characteristics as the CFR, cycle time of 90 minutes and
reactor volume were used for the model input. The composition of the influent used for
simulation in this section was 115 mg DOC/L, 100 mg NH4-N/L, and 10 mg PO4-P/L. Then,
the effluent quality indicators (DOC, NH4-N/L, and PO4-P), their removal efficiency and
energy consumption were estimated from the developed model.
The simulation results show that variation in aeration duration does not have contribution
to DOC removal, while influences TN and TP removals (Figure 3-4a). It is noticeable that a

32
longer aeration duration could enhance TP removal but reduce TN removal. However, the
change of TN removal by varying aeration duration was found not significant (p = 0.161). On
the other hand, change in aeration duration has significant influence on TP removal (p = 0.003).
Thus, the selection of optimum aeration duration would be dependent on TP removal.
The above results suggest that a longer aeration duration is beneficial for TP removal. In
addition, it is known that extending aeration period requires higher energy consumption.
However, the required energy for TP removal might decrease with the prolonging of aeration
due to a higher TP removal efficiency achieved at a longer aeration duration. On the other hand,
a longer aeration duration would contribute to a higher energy consumption for TN removal
since a lower TN removal was achieved under a prolonging aeration duration (Figure 3-4b).
Although a lower energy requirement for specific pollutant removal is desirable, the increase
in total energy requirement should also be considered. From the above results, with the aim to
get the optimum TP removal, it is suggested that the aeration duration should be longer than
non-aeration. As shown, increase in aeration/non-aeration duration ratio greater than 2 does
not contribute to a significant reduction of energy requirement for TP removal.
When considering all pollutants removal together with energy requirement, an aeration to
non-aeration duration ratio of 2:1 is considered as the optimum aeration strategy. When TP
removal is the major target regardless of energy requirement, the aeration to non-aeration
duration ratio of 8:1 is regarded as the optimum condition.
3.4 Summary
This work presented that kinetic model for a sophisticated biological treatment process by
applying algal-bacterial AGS and general AGS in CFR and SBR reactors respectively could
be simplified by using experimental data from cycle tests. The proposed model was proven to
accurately predict reactor performance under different aeration strategies. Moreover, the
proposed kinetic model was also proven to be applicable for different types of reactors operated
by using different influent compositions and seed AGS. Results from the aeration strategy
study suggest that an aeration/non-aeration duration ratio of 2:1 could balance the optimum
pollutants removal performance and energy consumption. The proposed kinetic development
approach could be used as a helpful tool for process design and evaluation.

33
Table 3-1. Composition of synthetic wastewater used in this study.
Component Concentration Unit
CH3COONa 300 mg COD/L
NH4Cl 100 mg NH4-N/L
KH2PO4 10 mg PO4-P/L
CaCl2·2H2O 10 mg Ca2+/L
MgSO4·7H2O 5 mg Mg2+/L
FeSO4·7H2O 5 mg Fe2+/L

34
Table 3-2. Aeration scenarios in the simulation set-up.
Note: The total cycle duration was kept at 90 min.
Set scenarios
1 2 3 4 5 6
Aeration / non-aeration ratio 1 2 3 4 5 8
Aeration duration (min) 45 60 68 72 75 80

35
Table 3-3. Water quality indicators: removal or accumulation rates.
Note: The positive (+) values denote accumulation; The negative (-) ones denote removal.
Substrate Unit Removal or accumulation rate
Aeration Non-aeration
DOC mg DOC/g-VS/min -0.640 -0.053
NH4-N mg NH4-N/g-VS/min -0.386 -0.105
NO2-N mg NO2-N/g-VS/min +0.007 +0.004
NO3-N mg NO3-N/g-VS/min +0.048 -0.014
PO4-P mg PO4-P/g-VS/min -0.014 +0.006

36
Table 3-4. Combination of order of reactions used to test the related models.
Note: ¢S¢ denotes scenario; ¢r¢ denotes removal; ¢a¢ denotes accumulation. The number before ¢r¢ or ¢a¢ indicates the order of reaction, i.e. 1r-1r describes the first-order removal during aeration and the first-order removal during non-aeration.
Parameter Order of reaction during consecutive aeration – non-aeration period
S-1 S-2 S-3 S-4 S-5 S-6
NH4-N 1r-1r* 1r-2r 2r-1r 2r-2r - -
R2 0.994 0.986 0.984 0.974 - -
RMSE 2.37 3.72 4.44 5.82 - -
NO2-N 0a-0a 0a-1a 1a-0a 1a-1a - -
R2 0.989 0.993 0.992 0.995 - -
RMSE 0.10 0.08 0.20 0.22 - -
NO3-N 0a-0r 1a-0r 0a-1r 0a-2r 1a-1r 1a-2r
R2 0.994 0.994 0.994 0.591 0.990 0.581
RMSE 0.16 0.16 0.16 1.48 0.35 1.57
PO4-P 0r-0a 0r-1a 1r-0a 1r-1a 2r-0a 2r-1a
R2 0.996 0.995 0.995 0.993 0.992 0.985
RMSE 0.07 0.06 0.07 0.07 0.10 0.12
DOC 1r-1r 1r-2r 2r-1r 2r-2r - -
R2 0.981 0.977 0.911 0.899 - -
RMSE 6.77 9.27 12.46 14.81 - -

37
Table 3-5. All the selected kinetic reactions for CFR and SBR.
Note: 1CFR - Continuous-flow Reactor; SBR - Sequencing Batch Reactor. 2 ¢r¢ denotes removal; ¢a¢ denotes accumulation. The number before ¢r¢ or ¢a¢ indicates the order of reaction, i.e. 1r-1r describes the first-order removal during aeration in CFR (or non-aeration in SBR) and the first-order removal during non-aeration in CFR (or aeration in SBR).
NH4-N NO2-N NO3-N PO4-P DOC
Aeration – Non-aeration
CFR 1r-1r 0a-1a 0a-1r 0r-0a 1r-1r
Non-aeration – Aeration
SBR 2r-1r 1a-1r 1r-1a 2a-1r 1r-2r

38
Table 3-6 Summary of reactors’ performance from experimental and simulated results
Note: 1CFR - Continuous-flow Reactor; SBR = Sequencing Batch Reactor. 2CFR-1 = CFR under 60 min of aeration and 30 min of non-aeration; CFR-2 = CFR under 45 min of aeration and 45 min of non-aeration. 3The relative error ∆x = (experimental value – simulation value)/experimental value.
CFR-1 CFR-2 SBR
Exp Sim ∆x Exp Sim ∆x Exp Sim ∆x
Effluent (mg/L)
NH4-N 29.06 31.29 0.08 31.44 33.47 0.06 0.21 1.65 6.83
NO2-N 5.05 3.68 0.27 3.61 3.29 0.08 0.01 0.18 0.98
NO3-N 20.41 18.82 0.08 12.05 11.38 0.06 28.05 25.29 0.10
PO4-P 5.06 5.43 0.07 7.58 7.75 0.02 0.38 0.55 0.44
DOC 15.81 17.25 0.09 15.67 17.46 0.13 65.08 67.04 0.03
Removal (%)
TN 49.42 50.58 0.01 55.76 54.77 0.02 43.12 46.12 0.07
TP 50.57 46.90 0.07 25.24 23.57 0.07 92.32 88.91 0.04
DOC 85.86 84.38 0.02 86.12 84.38 0.02 80.72 80.13 0.01

39
Figure 3-1. Profiles of DO and water quality indicators in the CFR reactor during a typical
cycle test.
DOCorN-compoundsconcentration(mg/L)
0
20
40
60
80
100
120
140
160
180
200
PO4 -PorD
Oconcen
tration(m
g/L)
-2
0
2
4
6
8
10
12
Time(min)
0 10 20 30 40 50 60 70 80 90
DO
DOC
NH4-N
NO2-N
NO3-N
PO4-P
Aeration Non-aeration
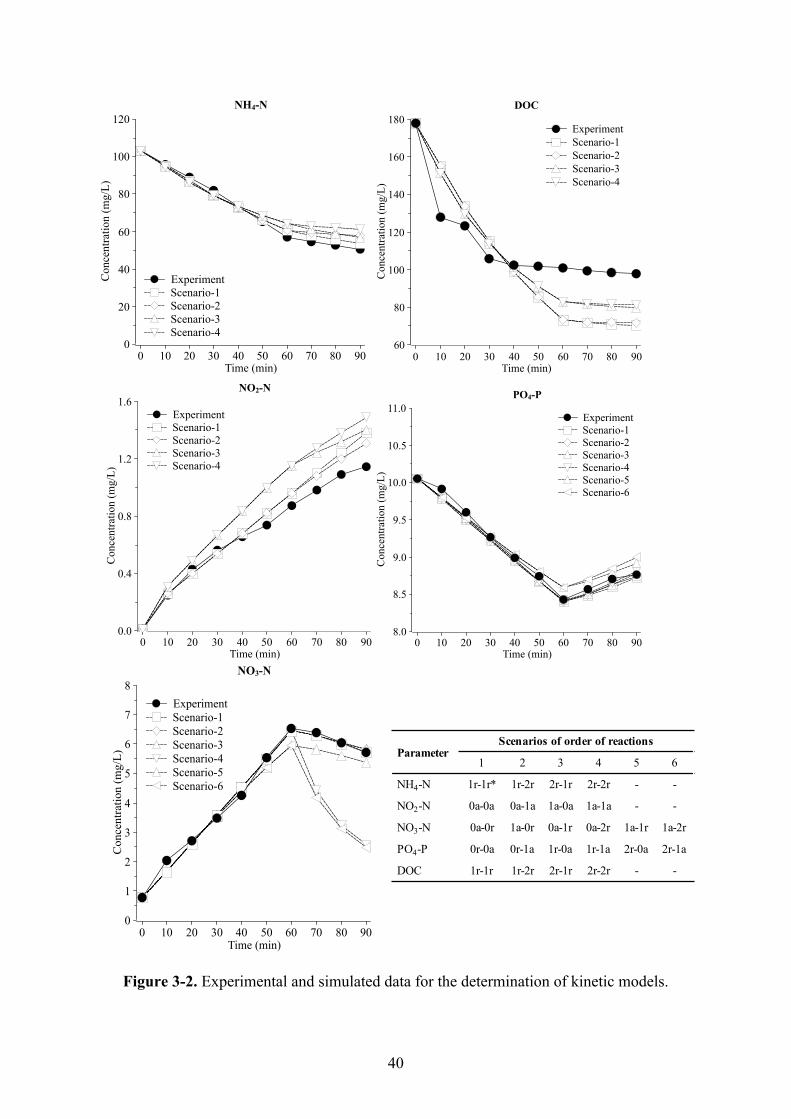
40
Figure 3-2. Experimental and simulated data for the determination of kinetic models.
PO4-P
Concentration(mg/L)
8.0
8.5
9.0
9.5
10.0
10.5
11.0
Time(min)0 10 20 30 40 50 60 70 80 90
Experiment
Scenario-1
Scenario-2
Scenario-3
Scenario-4
Scenario-5
Scenario-6
DOC
Conce
ntrat
ion(m
g/L
)
60
80
100
120
140
160
180
Time(min)0 10 20 30 40 50 60 70 80 90
Experiment
Scenario-1
Scenario-2
Scenario-3
Scenario-4
NO2-N
Concentration(mg/L)
0.0
0.4
0.8
1.2
1.6
Time(min)0 10 20 30 40 50 60 70 80 90
Experiment
Scenario-1
Scenario-2
Scenario-3
Scenario-4
NH4-NC
once
ntrat
ion(m
g/L
)
0
20
40
60
80
100
120
Time(min)0 10 20 30 40 50 60 70 80 90
Experiment
Scenario-1
Scenario-2
Scenario-3
Scenario-4
NO3-N
Conce
ntrat
ion(m
g/L
)
0
1
2
3
4
5
6
7
8
Time(min)0 10 20 30 40 50 60 70 80 90
Experiment
Scenario-1
Scenario-2
Scenario-3
Scenario-4
Scenario-5
Scenario-6
ParameterScenarios of order of reactions
1 2 3 4 5 6
NH4-N 1r-1r* 1r-2r 2r-1r 2r-2r - -
NO2-N 0a-0a 0a-1a 1a-0a 1a-1a - -
NO3-N 0a-0r 1a-0r 0a-1r 0a-2r 1a-1r 1a-2r
PO4-P 0r-0a 0r-1a 1r-0a 1r-1a 2r-0a 2r-1a
DOC 1r-1r 1r-2r 2r-1r 2r-2r - -

41
(a) Aeration/non-aeration ratio = 2:1
(b) Aeration/non-aeration ratio = 1:1
Figure 3-3. Comparison of reactor performance between the experimental results and model
predictions under the aeration/non-aeration duration ratio of 2:1 (a) and 1:1 (b), respectively.
Effluentconcentration(mg/L)
0
10
20
30
40
50
60
Operationtime(day)0 1 2 3 4 5 6 7 8 9 10
Simulation
DOC
NH4-N
NO2-N
NO3-N
PO4-P
Experiment
DOC
NH4-N
NO2-N
NO3-N
PO4-P
Removalefficiency(%)
0
20
40
60
80
100
Operationtime(day)0 1 2 3 4 5 6 7 8 9 10
Experiment
DOC
TN
TP
Simulation
DOC
TN
TP
Effluentconcentration(mg/L)
0
10
20
30
40
50
60
Operationtime(day)0 1 2 3 4 5 6 7 8 9 10
Simulation
DOC
NH4-N
NO2-N
NO3-N
PO4-P
Experiment
DOC
NH4-N
NO2-N
NO3-N
PO4-P
Removalefficiency(%)
0
20
40
60
80
100
Operationtime(day)0 1 2 3 4 5 6 7 8 9 10
Experiment
DOC
TN
TP
Simulation
DOC
TN
TP

42
Figure 3-4. Effect of aeration duration on DOC, TN and TP removal efficiencies (a) and
energy required for P removal (b).
(a)
Rem
ovaleff
icie
ncy(
%)
0
20
40
60
80
100 Energ
yre
quire
ment(k
WH
/m3)
2.0
2.5
3.0
3.5
4.0
4.5
Aerationdurationpercycle(min)40 45 50 55 60 65 70 75 80 85
DOCremoval
TNremoval
TPremoval
Energyrequirement
(b)
DailyTPrem
oval(mg)
5
10
15
20
25
Energ
yfo
rTPrem
voval
(kWh/g-Prem
oved)
0.8
1
1.2
1.4
1.6
1.8
Energyrequirement(kWh/m3)2.0 2.5 3.0 3.5 4.0 4.5
TPremoval
Energy
43
Chapter 4 Stability of algal-bacterial aerobic granules in a continuous-flow
reactor with effluent recirculation instead of aeration
4.1 Introduction
With the potential capability of nutrients uptake and oxygen production by algae [22, 23],
the co-existence of algae and bacteria in wastewater treatment units is beneficial for enhanced
nutrients removal efficiency at lower operational cost. Moreover, algae combined with AGS
may become more attractive. It has the advantage of algae potential in addition to the extra
benefits by AGS (excellent settling ability and higher removal efficiency). It is expected that
oxygen production by algae could assist aerobic degradation by bacteria and reduce energy
requirement for aeration during the aerobic biological process. Previous studies found that
algae could naturally grow and co-exist with AGS in a SBR under natural sunlight exposure
but yet resulted in lower TN and TP removals [26, 27]. Results from Chapter 2 demonstrated
that a new algal-bacterial granular system could be established by seeding 50% of algal-
bacterial AGS in a continuous-flow reactor system with intermittent aeration and non-aeration
periods of 60 min and 30 min, respectively, and this system exhibited excellent granular
stability as well. Still, very limited information is available in algal-bacterial AGS, especially
in continuous-flow reactors with lower or without aeration to explore the potential benefit of
algae co-existed.
This study aimed to investigate the performance of algal-bacterial AGS in a continuous-flow
reactor with effluent recirculation instead of aeration to treat domestic wastewater. Organics
and nutrients removal along with granules stability and settling ability was also recorded during
the operation. The results from this work is expected to provide some basic information that
could help to further apply this symbiotic algal-bacterial AGS system at lower energy
consumption.
4.2 Materials and methods
4.2.1 Experimental set-up and operation conditions
The experiment was conducted in 4 stages of operation, namely stages 1 – 4. In the stage 1
(day 0 – 6), two continuous-flow reactors at a recycle ratio of 1:1 were used to compare the
performance of general AGS (R1) and algal-bacterial AGS (R2). Each reactor had the same
working volume of 1 L. After the operation of stage 1, R1 was stopped and only R2 was
continued to operate for the left experimental stages. During stage 2 (day 7 – 18) and stage 3

44
(day 19 – 30), the R2 was operated at different recycle ratios of 5 and 10, respectively. All the
operation from stages 1 – 3 were conducted without aeration. In the stage 4 (day 31 –42), the
biomass from R2 were moved to R3 (with a working volume of 500 mL) due to insufficient
biomass amount left from the stage 3. The R3 was operated under an intermittent aeration for
60 min and non-aeration for 30 min. All the reactors were operated under room temperature
(25±2˚C) and HRT of 6 h without light control throughout the experiment (900–1100 lux with
all lights on). SRT during the whole period was maintained at 12 days. During aeration in the
stage 4, air was supplied from the bottom of the reactor by an air pump (AK-40, KOHSIN,
Japan) through air bubble diffuser at an air flow rate of 0.5 cm/s. All the reactors were equipped
with an internal filter (with an average pore size of 0.3 mm) installed at the effluent port inside
the reactor, which could function as retaining biomass larger than its pore size in the reactor.
The detailed information about the operational conditions is presented in Table 4-1. During the
operation, an additional mixing was provided by magnetic stirrer at 120 rpm. And the
schematic diagram of the reactor is shown in Figure 4-1.
4.2.2 Synthetic wastewater and seed sludge
During all the stages of experiment (Stages 1 to 4), a synthetic wastewater with sodium
acetate as carbon source was used as influent with its compositions as follows: 300 mg COD/L
(sodium acetate), 10 mg PO4-P/L (KH2PO4), 100 mg NH4-N/L (NH4Cl), 10 mg Ca2+/L
(CaCl2·2H2O), 5 mg Mg2+/L (MgSO4·7H2O), and 5 mg Fe2+/L (FeSO4·7H2O).
General AGS and algal-bacterial AGS were seeded for R1 and R2, respectively with an
initial MLSS concentration in each reactor of approximately 2.5 g/L and MLVSS to MLSS
ratio (MLVSS/MLSS) of 0.75. The initial algae content in the seed algal-bacterial AGS was
2.556 mg/g-TS. Both AGS and algal-bacterial AGS were cultivated in the laboratory in the
continuous-flow reactor under alternative aeration (60 min) and non-aeration (30 min)
condition with the same influent characteristics used in this study.
4.2.3 Analytical methods
The concentrations of water quality in the influent and effluent (NH4-N, NO2-N, NO3-N and
PO4-P) in addition to sludge volume index (SVI5), MLSS and MLVSS were analyzed
according to Standard Methods [41]. Dissolved organic carbon (DOC) was measured by TOC
analyzer (TOC-VCSN, SHIMADZU, Japan) equipped with auto-sampler (ASI-V, SHIMADZU,
Japan). Chlorophyll-a amount was analyzed and used to estimate algae content in the granules
[41]. Dissolved oxygen (DO) concentration in the reactors was measured using a DO meter
(HQ40d, HACH, USA). A pH meter (Horiba, Japan) was used to monitor pH in the reactors.

45
Light intensity around the reactors was measured by a pocket digital lux meter (ANA-F11,
Tokyo Photo-electric Co., Ltd., Japan). The granular size was measured by a stereo microscope
(STZ-40TBa, SHIMADZU, Japan) connected to computer by software Motic Image Plus 2.35
(version 2.3.0). The stability of the granules was evaluated with the same method used in
Chapter 2.
4.2.4 Calculations
In this work, TN concentrations in the influent and effluent were calculated as the sum of
NH4-N, NO2-N and NO3-N concentrations, and TP removal was reflected by PO4-P removal
since only KH2PO4 was used as the P source in the influent. Thus, DOC, TN and TP removal
efficiencies were calculated according to Cai et al. [5] and the removal capacities were
calculated according to Chapter 2. The parameter used to indicate granular stability (∆Turb)
was determined and calculated as in Chapter 2.
4.3 Results and discussion
The organics and nutrients concentrations in the influent and effluent were monitored to
evaluate the performance of algal-bacterial AGS in the continuous-flow reactor under effluent
recirculation without aeration. In addition, the granular strength, size and settling ability were
also determined to evaluate the stability of the granules.
4.3.1 Granule characteristics
The experiment at Stage 1 aimed to test the performance and stability behavior of general
AGS and algal-bacterial AGS operated in a continuous-flow reactor with effluent recirculation
and no aeration. The following tests from Stage 2 and 3 were designed to investigate the effect
of different recycle ratio, and the Stage 4 aimed to recover biomass settleability and
performance, and then test the adaptability of the biomass to different operation conditions.
During Stage 4, R2 was operated under an alternative aeration and non-aeration periods of 60
min and 30 min, respectively, with no effluent recirculation applied to the reactor.
During the test of Stage 1, both R1 and R2 were operated with effluent recirculation at a
recirculation ratio of 1:1 (effluent/fresh influent, flowrate/flowrate). The average DO
concentrations in R1 and R2 during the whole operation of no aeration was almost stable at
0.37 mg/L. With the aim to provide shear force to the granules, which is essential for granule
formation and stability [6, 49, 50], an additional mixing by using magnetic stirrer with rotation
speed of 120 rpm was provided. An obvious granular breakage into aggregates size was
observed since the first day of Stage 1, as shown in Table 4-2, and more noticeable breakage
46
was seen on algal-bacterial AGS. Only after 6 days’ operation, the average granule diameter
of algal-bacterial AGS in R2 was sharply decreased from 0.78 mm to 0.38 mm. This result
might be attributable to the consequence of using stirrer along with the low DO concentration
in the reactor. As mentioned before, during the whole period of Stages 1 to 3, DO concentration
was almost constant at 0.37 mg/L. In agreement with a previous report [15], granular instability
under limited DO concentration also occurred. Low DO concentration in the reactor may cause
the formation of anaerobic core in the granules leading to granules’ breakage [7]. Under the
stirring by the magnetic stirrer, it could amplify the influence on granular breakage. However,
granule breakage didn’t seem to influence granular settleability and stability (indicated by
∆Turbidity). SVI5 of both AGS and algal-bacterial AGS was almost constant during this test
period (averagely 54 mL/g and 52 mL/g for AGS and algal-bacterial AGS, respectively). Both
AGS and algal-bacterial AGS showed little change in ∆Turb (from 2.1 to 2.8 NTU and 2.1 to
2.4 NTU, respectively). In general, algal-bacterial AGS exhibited better performance in terms
of settleability and stability in the continuous-flow reactor system with effluent recirculation
and non-aeration.
After Stage 1, R2 was continued to operate with different effluent recirculation ratios with
the aim to check its effect on the reactor performance. A noticeable decrease in MLSS
concentration and settleability were detected after increasing the recirculation ratio from 1:1
(SVI5 = 52 mL/g) to 5:1 (SVI5 = 92 mL/g) and 10:1 (114 mL/g) (Figure 4-2b). This is probably
attributable to the failure of the installed 0.3 mm filter to retain granules which thus were
washed out from the reactor. The average granule diameter decreased from 0.38 mm during
Stage 1 to 0.25 mm in Stage 2 and to 0.24 mm in Stage 3, respectively. In addition, due to use
of the lower biomass to treat the same strength of influent (higher organic loading), filamentous
growth could easily occur in the reactor (Figure 4-2a). It may also contribute to the worsening
of granular settleability and stability as shown in Figure 4-2(b-c). The granular strength
decreased along with the operation of Stages 2 and 3 (indicated by increased ∆Turb). The
results seem to suggest that a steady increasing algae concentration in the granules (Figure 4-
2d) has limited contribution to the granular stability.
With the aim to recover granular performance as the granule properties worsened because
of the operation from Stages 1 to 3, from day 42 on, the reactor operation was switched to
alternative aeration and non-aeration as that before these tests. The operation conditions of
Stage 4 appear to successfully recover the granular properties. SVI5 was decreased from 114
mL/g (at the end of Stage 3) to 65 mL/g (after 12 days’ operation of Stage 4), and then to 48
mL/g (after 24 days’ operation of Stage 4). At the end of Stage 4 operation, a lower SVI5 than

47
its initial condition was achieved, indicating a better granular settleability. Simultaneously, the
granular strength was recovered almost to its initial condition. The biomass growth was also
noticed in the reactor, reflecting an increased MLSS concentration and granular size as shown
in Figure 4-2c. As the granules size grew to greater than 0.3 mm, the installed filter could
successfully retain the biomass in the reactor, minimizing the washout of granules with a
resultant increase in MLSS concentration in the reactor.
4.3.2 DOC, N and P removals
Influent and effluent samples were collected one every two days, and then filtered through
0.22 µm membrane prior to analysis. However, since there were almost similar results for each
sampling time during every stage, the results would be summarized into average influent and
effluent concentrations during the same stage operation.
During the operation of stage 1, R2 always showed better performance than R1 on DOC,
TN and TP removals (Table 4-2), although both AGS and algal-bacterial AGS reflected poor
DOC removal efficiency (32% and 40% in R1 and R2, respectively). This could be brought
about by the very low DO concentration which is not suitable for the growth of aerobic bacteria.
On the other hand, a better TN removal was achieved in the algal-bacterial AGS during Stage
1 (65% in R2 and 35% in R1, respectively). The low DO concentration in the reactor may
inhibit AOBs growth resulting in a lower NH4-N utilization. However, the low DO
concentration condition might contribute to an excellent denitrification process for both general
AGS and algal-bacterial AGS indicated by the very low NO3-N concentration in their effluents
(Table 4-2). Meanwhile, TP removal in R2 was also higher than in R1. The better TN and TP
removals in R2 may be also contributed by the additional nutrients uptake by algae. Still,
further research is necessary to shed light on the real mechanisms involved.
The experiments from Stage 2 to Stage 3 investigated the effect of effluent recirculation
ratio on the performance of algal-bacterial AGS under no aeration. As seen in Figure 4-2a,
during Stages 1 to 3, the biomass concentration in the reactor decreased noticeably, while the
MLVSS/MLSS ratio was constant at 0.75 during the whole experiment period. Restated, during
the operation of Stages 1 to 3, the organic and nutrient loading rates to the reactor was
noticeably increasing due to the additional organics and nutrients from the recycled effluent
and decreased biomass concentration in the reactor. Although the settleability and stability of
algal-bacterial AGS was deteriorated along with the operation of Stages 1 to 3, the organics
and nutrients removal rates were improved as shown in Figure 4-3a, resulting in stable removal
efficiencies (Figure 4-3b). The algal-bacterial AGS could maintain their performance on

48
pollutants removal while their settleability and stability were worsened. The above results
imply the stable performance (in terms of pollutants removal) of algal-bacterial AGS even
being operated at higher organic and nutrient loading rates.
During Stage 4, the switching operation from no aeration to intermittent aeration could not
only restore granular stability and settleability of algal-bacterial AGS, but also improve their
DOC, TN and TP removal rates and removal efficiencies. The measured DO concentration in
the reactor during aeration and non-aeration period was 6.2 mg/L and 0.37 mg/L, respectively.
A higher DO concentration during aeration period may provide suitable conditions for bacteria
who are mainly responsible for DOC, NH4-N and PO4-P removals. During the first 12 days’
operation of Stage 4, an obvious improvement on DOC (from 40% to 100%) and TP (from
14% to 64%) removals was achieved with slight enhancement on TN removal efficiency
detected during this period (from 61% to 67%). However, after prolonging the Stage 4
operation for another 12 days, the TN removal efficiency was improved to 98% and at the same
time the DOC removal efficiency remained at around 100%.
Another factor relating to the improved granular performance was probably due to the seed
AGS was cultivated under the same operation condition of Stage 4, thus it could have quick
positive response to the change of operation conditions from Stages 1-3 to Stage 4.
4.4 Summary
Algal-bacterial AGS exhibited better overall performance in terms of granular settleability,
stability and pollutants removal compared to general AGS when both were operated under
completely no aeration (with effluent recirculation) condition. A higher effluent recirculation
ratio applied may deteriorate the granular properties of algal-bacterial AGS while its pollutants
removal could keep stable. Most importantly, the properties and performance of algal-bacterial
AGS could be quickly recovered after the operation condition was switched from no aeration
to intermittent aeration (the conditions before these tests).

49
Table 4-1. Operation strategies of the reactors.
AGS: aerobic granular sludge; AB-AGS: algal-bacterial AGS; Recirculation ratio=
recirculated effluent/ fresh-influent (flowrate/flowrate).
Stage 1 Stage 2 Stage 3 Stage 4
Days 0 – 6 7 – 18 19 – 30 31 – 55
Aeration No No No On–off
(60-30 min)
Seed sludge R1=AGS
R2=AB-AGS
R2=AB-AGS R2=AB-AGS R3=AB-AGS
Recirculation ratio 1 5 10 –

50
Table 4-2. Performance of AGS and algal-bacterial AGS during operation of Stage 1.
AGS: aerobic granular sludge; AB-AGS: algal-bacterial AGS.
AGS (R1) AB-AGS (R2)
Day 0 Day 6 Day 0 Day 6
Biomass properties
Algae content, mg/g-VS 0 0 2.56 2.70
MLSS, g/L 2.5 2.5 2.5 2.5
MLSS/MLVSS 0.75 0.75 0.75 0.75
SVI5, mL/g 54 54 52 52
∆Turb, NTU 2.1 2.8 2.1 2.4
Average diameter, mm 0.45 0.37 0.78 0.38
Concentration in effluent, mg/L
DOC - 69.96 - 61.54
NH4-N - 66.63 - 41.02
NO2-N - 0 - 0
NO3-N - 0.18 - 0.13
PO4-P - 66.81 - 41.15
Removal efficiencies, %
DOC - 32 - 40
TN - 35 - 60
TP - 10 - 15

51
Figure 4-1. Schematic diagram of R1 and R2 (a) and R3 (b). Fresh influent (1); magnetic
stirrer (2); effluent recirculation (3); effluent (4); internal filter (5); aeration line (6).
(1)
(4)
(3)
(2)
(5)
(1)
(4)
(5)
(6)
(a)
(b)

52
Figure 4-2. The profiles of loading rates (a), settling performance (b), granular stability (c)
and algae content (d) of algal-bacterial AGS during the operation of Stages 1 to 4.
Loadingrates(mg/g-VS/d)
0.0
0.4
0.8
1.2
1.6
2.0
2.4
Stage1 2 3 4(12d) 4(24d)
DOC
TN
TP
Non-aeration Intermittentaeration
MLSSc
once
ntrat
ion(g/L
)
0.0
0.8
1.6
2.4
3.2
4.0
SV
I5 (m
L/g
)
0
20
40
60
80
100
120
StageInitial 1 2 3 4(12d) 4(24d)
MLSS
SVI5
R2=1L R3=0.5L
Non-aeration Intermittentaeration
∆Turbidity(NTU)
0.0
0.8
1.6
2.4
3.2
4.0
Averag
egran
ulesd
iameter(m
m)
0.0
0.2
0.4
0.6
0.8
1.0
StageInitial 1 2 3 4(12d) 4(24d)
Diameter
∆Turbidity
Non-aeration Intermittentaeration
Algaecontents(mg/g-TS)
0
1
2
3
4
StageInitial 1 2 3 4(12d) 4(24d)
IntermittentaerationNon-aeration
(a) (b)
(c) (d)

53
Figure 4-3. Changes in removal capacities (a) and rates (b) of algal-bacterial AGS from
Stages 1 to 4 during the test.
(a)Rem
ovalcapacities(mg/g-VS)
0
20
40
60
80
100
Stage1 2 3 4(12d) 4(24d)
DOC
TN
TP
Non-aeration Intermittentaeration
(b)
Rem
oval
rat
es(%
)
0
20
40
60
80
100
Stage1 2 3 4(12d) 4(24d)
DOC
TN
TP
Non-aeration Intermittentaeration

54
Chapter 5 Conclusions and future research perspectives
5.1 Conclusions
This study explored various operation strategies for algal-bacterial AGS in continuous-flow
reactors and analyzed the resulted performance in terms of pollutants removal and granular
stability. Kinetic models and its further study on the effect of aeration strategy on pollutants
removal and energy consumption were also conducted. The main results can be summarized
as follows:
(1) Both single- and series- reactors systems exhibited similar efficiencies in DOC (~95%)
and TP removal (~46%). Moreover, it kept stable even after double increased the organic
loading rate in the single-reactor system. When operated under a smaller loading rate, series-
reactor performed better TN removal (29 % and 76% in R1 and R2, respectively). However,
after double increased organic and nutrient loadings, TN removal in the single-reactor system
was improved up to 80%. This possibly due to the excessive organics concentration in the
reactor could function as carbon source that is essential for denitrifiers.
(2) Algal-bacterial AGS demonstrated excellent stability (in terms of pollutants removal and
granules strength) in the continuous-flow reactor even operated at double increased organic
and nutrient loadings. And the new algal-bacterial AGS systems can be established by seeding
50% algal-bacterial AGS.
(3) The installed internal separator acted as hydraulic selection pressure thus could retain
biomass with good settling ability resulting in increased granular settleability and stability.
(4) Kinetic reactions were successfully developed from cycle test experiments and proven
applicable to simulate reactor performance for AGS in the SBR reactor and algal-bacterial AGS
in the continuous-flow reactor with good accuracy (with R2 > 0.98 and relative error <10%).
(4) Simulation study suggested that aeration to non-aeration duration ratio of 2 could
provide desirable organics and nutrients removal and energy consumption.
(5) Algal-bacterial AGS exhibited better overall performance and stability over general
AGS when operated under effluent recirculation and no aeration condition in the CFR system,
achieving DOC, TN and TP removals of 40%, 60%, and 15% (algal-bacterial AGS) in
comparison to 32%, 35%, and 10% (general AGS), respectively.
(6) For a longer-term operation under no aeration condition, algal-bacterial AGS could
maintain good pollutant removal performance even at higher loading rates. More importantly,
after being switched from no aeration to intermittent aeration, the algal-bacterial AGS could

55
quickly adapt to the change in operation conditions, which was obviously indicated by its
recovered removals of DOC from 40% to 100%, TN from 61% to 98%, and TP from 14% to
64% along with the improved sludge settleability and stability.
It is expected that results from this study could provide important and scientific data for the
development of algal-bacterial AGS, especially for the continuous-flow reactor systems.
5.2 Future research perspectives
In the present study, a symbiotic algal-bacterial AGS demonstrated excellent performance
in the continuous-flow reactor. With the aim to optimize the reactor performance and minimize
energy requirement, further explorations are still necessary, especially on the algae potential
ability to produce oxygen that is expected to be able to assist aerobic process of bacterial
degradation. The following aspects should be considered in the future research.
(1) Exploration on the reactor configuration that could provide required shear force without
external mixing and aeration.
(2) Further examination on the change in microbial communities and species to better
understand the effect of operation conditions in continuous-flow reactors
.

56
Acknowledgements
First and foremost, I would like to deliver my greatest gratitude to my Supervisor, Prof.
Zhongfang Lei, and all co-supervisors, Prof. Motoo Utsumi, Prof. Yasuhisa Adachi and Prof.
Helmut Yabar, for their valuable and never-ending guidance not only for experiments, but also
for priceless experiences sharing during the past three years. Because of their inspiring
guidance, kindness and patience, I could have completed my thesis.
Secondly, I want to convey my deepest appreciation to my Thesis Review Committee
Members, Prof. Zhongfang Lei, Prof. Zhenya Zhang, Prof. Kazuya Shimizu and Prof. Motoo
Utsumi, who have been willing to take time and made priceless inputs, contributions and
comments that make this thesis into its perfection. Furthermore, I shall extent my gratefulness
to Prof. Keiko Yamaji for her valuable comments for my research during the past three years.
I would also like to thank all the water group member for the guidance, assistance, and make
my life more colorful and pleasant. Furthermore, I shall extend my thanks to Hitachi
Scholarship Foundation for giving me the opportunity to pursue doctoral degree in Japan. The
scholarship guaranteed and provided comfortable study life during my study period.
Finally, I would also like to thank my wife, son and my big family for all the supports, joys
and happiness and always make me stronger so that I am able to finish my study.

57
References
[1] R. Hreiz, M.A. Latifi, N. Roche, Optimal design and operation of activated sludge
processes: State-of-the-art, Chem. Eng. J. 281 (2015) 900–920.
doi:10.1016/j.cej.2015.06.125.
[2] S.S. Adav, D-J. Lee, J.Y. Lai, Effects of aeration intensity on formation of phenol-fed
aerobic granules and extracellular polymeric substances, Appl. Microbiol. Biotechnol.
77 (2007) 175–182. doi:10.1007/s00253-007-1125-3.
[3] M. Gao, M-H. Diao, S. Yuan, Y-K. Wang, H. Xu, X-H. Wang, Effects of phenol on
physicochemical properties and treatment performances of partial nitrifying granules in
sequencing batch reactors, Biotechnol. Reports. 13 (2017) 13–18.
doi:10.1016/j.btre.2016.12.002.
[4] S.S. Adav, D-J. Lee, J-Y. Lai, Aerobic granulation in sequencing batch reactors at
different settling times, Bioresour. Technol. 100 (2009) 5359–5361.
doi:10.1016/j.biortech.2009.05.058.
[5] W. Cai, W. Huang, H. Li, B. Sun, H. Xiao, Z. Zhang, Z. Lei, Acetate favors more
phosphorus accumulation into aerobic granular sludge than propionate during the
treatment of synthetic fermentation liquor, Bioresour. Technol. 214 (2016) 596–603.
doi:10.1016/j.biortech.2016.05.015.
[6] Y-Q. Liu, J-H. Tay, Variable aeration in sequencing batch reactor with aerobic granular
sludge, J. Biotechnol. 124 (2006) 338–346. doi:10.1016/j.jbiotec.2005.12.037.
[7] B. Long, C-z. Yang, W-h. Pu, J-k. Yang, F-b. Liu, L. Zhang, J. Zhang, K. Cheng,
Tolerance to organic loading rate by aerobic granular sludge in a cyclic aerobic granular
reactor, Bioresour. Technol. 182 (2015) 314–322. doi:10.1016/j.biortech.2015.02.029.
[8] J. Luo, T. Hao, L. Wei, H.R. Mackey, Z. Lin, G.H. Chen, Impact of influent COD/N
ratio on disintegration of aerobic granular sludge, Water Res. 62 (2014) 127–135.
doi:10.1016/j.watres.2014.05.037.
[9] D-J. Lee, Y-Y. Chen, K-Y. Show, C.G. Whiteley, J-H. Tay, Advances in aerobic granule
formation and granule stability in the course of storage and reactor operation, Biotechnol.
Adv. 28 (2010) 919–934. doi:10.1016/j.biotechadv.2010.08.007.
[10] Y-Q. Liu, J-H. Tay, Fast formation of aerobic granules by combining strong hydraulic
selection pressure with overstressed organic loading rate, Water Res. 80 (2015) 256–
266. doi:10.1016/j.watres.2015.05.015.

58
[11] L. Qin, J-H. Tay, Y. Liu, Selection pressure is a driving force of aerobic granulation in
sequencing batch reactors, Process Biochem. 39 (2004) 579–584. doi:10.1016/S0032-
9592(03)00125-0.
[12] J.J. Beun, A. Hendriks, M.C.M. van Loosdrecht, E. Morgenroth, P.A. Wilderer, J.J.
Heijnen, Aerobic granulation in a sequencing batch reactor, Water Res. 33 (1999) 2283–
2290. doi:10.1016/S0043-1354(98)00463-1.
[13] M.K. de Kreuk, J.J. Heijnen, M.C.M. van Loosdrecht, Simultaneous COD, nitrogen, and
phosphate removal by aerobic granular sludge, Biotechnol. Bioeng. 90 (2005) 761–769.
doi:10.1002/bit.20470.
[14] Y-M. Zheng, H-Q. Yu, S-J. Liu, X-Z. Liu, Formation and instability of aerobic granules
under high organic loading conditions, Chemosphere 63 (2006) 1791–1800.
doi:10.1016/j.chemosphere.2005.08.055.
[15] M.K. de Kreuk, M.C.M. van Loosdrecht, Selection of slow growing organisms as a
means for improving aerobic granular sludge stability, Water Sci. Technol. 49 (2004)
9–17.
[16] Y-C. Chen, C-J. Lin, H-L. Chen, S-Y. Fu, H-Y. Zhan, Cultivation of biogranules in a
continuous flow reactor at low dissolved oxygen, Water Air Soil Pollut: Focus. 9 (2009)
213–221. doi:10.1007/s11267-009-9216-z.
[17] S.F. Corsino, R. Campo, G. Di Bella, M. Torregrossa, G. Viviani, Study of aerobic
granular sludge stability in a continuous-flow membrane bioreactor, Bioresour. Technol.
200 (2016) 1055–1059. doi:10.1016/j.biortech.2015.10.065.
[18] C. Chen, L. Bin, B. Tang, S. Huang, F. Fu, Q. Chen, L. Wu, C. Wu, Cultivating granular
sludge directly in a continuous-flow membrane bioreactor with internal circulation,
Chem. Eng. J. 309 (2017) 108–117. doi:10.1016/j.cej.2016.10.034.
[19] D. Li, Y. Lv, H. Zeng, J. Zhang, Effect of sludge retention time on continuous-flow
system with enhanced biological phosphorus removal granules at different COD loading,
Bioresour. Technol. 219 (2016) 14–20. doi:10.1016/j.biortech.2016.07.093.
[20] D. Li, Y. Lv, H. Zeng, J. Zhang, Long term operation of continuous-flow system with
enhanced biological phosphorus removal granules at different COD loading, Bioresour.
Technol. 216 (2016) 761–767. doi:10.1016/j.biortech.2016.06.022.
[21] D. Li, Y. Lv, H. Zeng, J. Zhang, Startup and long term operation of enhanced biological
phosphorus removal in continuous-flow reactor with granules, Bioresour. Technol. 212
(2016) 92–99. doi:10.1016/j.biortech.2016.04.008.
[22] N.C. Boelee, H. Temmink, M. Janssen, C.J.N. Buisman, R.H. Wijffels, Scenario

59
analysis of nutrient removal from municipal wastewater by microalgal biofilms, Water
4 (2012) 460–473. doi:10.3390/w4020460.
[23] N. Abdel-Raouf, A.A. Al-Homaidan, I.B.M. Ibraheem, Microalgae and wastewater
treatment, Saudi J. Biol. Sci. 19 (2012) 257–275. doi:10.1016/j.sjbs.2012.04.005.
[24] N.C. Boelee, H. Temmink, M. Janssen, C.J.N. Buisman, R.H. Wijffels, Balancing the
organic load and light supply in symbiotic microalgal-bacterial biofilm reactors treating
synthetic municipal wastewater, Ecol. Eng. 64 (2014) 213–221.
doi:10.1016/j.ecoleng.2013.12.035.
[25] I. de Godos, C. Gonzalez, E. Becares, P.A. Garcia-Encina, R. Munoz, Simultaneous
nutrients and carbon removal during pretreated swine slurry degradation in a tubular
biofilm photobioreactor, Appl. Microbiol. Biotechnol. 82 (2009) 187–194.
doi:10.1007/s00253-008-1825-3.
[26] W. Huang, B. Li, C. Zhang, Z. Zhang, Z. Lei, B. Lu, B. Zhou, Effect of algae growth on
aerobic granulation and nutrients removal from synthetic wastewater by using
sequencing batch reactors, Bioresour. Technol. 179 (2015) 187–192.
doi:10.1016/j.biortech.2014.12.024.
[27] B. Li, W. Huang, C. Zhang, S. Feng, Z. Zhang, Z. Lei, N. Sugiura, Effect of TiO2
nanoparticles on aerobic granulation of algal-bacterial symbiosis system and nutrients
removal from synthetic wastewater, Bioresour. Technol. 187 (2015) 214–220.
doi:10.1016/j.biortech.2015.03.118.
[28] L. Liu, H. Fan, Y. Liu, C. Liu, X. Huang, Development of algae-bacteria granular
consortia in photo-sequencing batch reactor, Bioresour. Technol. 232 (2017) 64–71.
doi:10.1016/j.biortech.2017.02.025.
[29] O. Tiron, C. Bumbac, I. V. Patroescu, V.R. Badescu, C. Postolache, Granular activated
algae for wastewater treatment, Water Sci. Technol. 71 (2015) 832–839.
doi:10.2166/wst.2015.010.
[30] H. Abyar, H. Younesi, N. Bahramifar, A.A. Zinatizadeh, M. Amini, Kinetic evaluation
and process analysis of COD and nitrogen removal in UAASB bioreactor, J. Taiwan
Inst. Chem. Eng. 78 (2017) 272–281. doi:10.1016/j.jtice.2017.06.014.
[31] H-H. Chou, J-S. Huang, S-K. Chen, M-C. Lee, Process kinetics of an expanded granular
sludge bed reactor treating sulfate-containing wastewater, Chem. Eng. J. 170 (2011)
233–240. doi:10.1016/j.cej.2011.03.061.
[32] J. Kaewsuk, W. Thorasampan, M. Thanuttamavong, G.T. Seo, Kinetic development and
evaluation of membrane sequencing batch reactor (MSBR) with mixed cultures

60
photosynthetic bacteria for dairy wastewater treatment, J. Environ. Manage. 91 (2010)
1161–1168. doi:10.1016/j.jenvman.2010.01.012.
[33] M. Henze, W. Gujer, T. Mino, M.C.M. van Loosdrecht, Activated Sludge Models ASM1,
ASM2, ASM2d and ASM3, IWA Publ. (2000) 121. doi:10.1007/s13398-014-0173-7.2.
[34] M. Zhou, J. Gong, C. Yang, W. Pu, Simulation of the performance of aerobic granular
sludge SBR using modified ASM3 model, Bioresour. Technol. 127 (2013) 473–481.
doi:10.1016/j.biortech.2012.09.076.
[35] S. Bahar, A.S. Ciggin, A simple kinetic modeling approach for aerobic stabilization of
real waste activated sludge, Chem. Eng. J. 303 (2016) 194–201.
doi:10.1016/j.cej.2016.05.149.
[36] K-Z. Su, H-Q. Yu, A Generalized model for aerobic granule-based sequencing batch
reactor. 1. Model development, Environ. Sci. Technol. 40 (2006) 4703–4708.
doi:10.1021/es060141m.
[37] D. Kaelin, R. Manser, L. Rieger, J. Eugster, K. Rottermann, H. Siegrist, Extension of
ASM3 for two-step nitrification and denitrification and its calibration and validation
with batch tests and pilot scale data, Water Res. 43 (2009) 1680–1692.
doi:10.1016/j.watres.2008.12.039.
[38] M.S. Moussa, C.M. Hooijmans, H.J. Lubberding, H.J. Gijzen, M.C.M. van Loosdrecht,
Modelling nitrification, heterotrophic growth and predation in activated sludge, Water
Res. 39 (2005) 5080–5098. doi:10.1016/j.watres.2005.09.038.
[39] I. Iacopozzi, V. Innocenti, S. Marsili-Libelli, E. Giusti, A modified Activated Sludge
Model No. 3 (ASM3) with two-step nitrification-denitrification, Environ. Model. Softw.
22 (2007) 847–861. doi:10.1016/j.envsoft.2006.05.009.
[40] J. Zhao, J. Huang, M. Guan, Y. Zhao, G. Chen, X. Tian, Mathematical simulating the
process of aerobic granular sludge treating high carbon and nitrogen concentration
wastewater, Chem. Eng. J. 306 (2016) 676–684. doi:10.1016/j.cej.2016.07.098.
[41] APHA, Standard Methods for The Examination of Water and Wastewater. American
Public Health Association/American Water Work Association/Water Environment
Federation, Washington, D.C., USA, 2012.
[42] K-C. Teo, H-L. Xu, J-H. Tay, Molecular mechanism of granulation. II: Proton
translocating activity, J. Environ. Eng. 126 (2000) 411–418.
[43] P. Le-Clech, V. Chen, T.A.G. Fane, Fouling in membrane bioreactors used in
wastewater treatment, J. Memb. Sci. 284 (2006) 17–53.
doi:10.1016/j.memsci.2006.08.019.

61
[44] M. Dubois, K. Gilles, J. Hamilton, P. Rebers, F. Smith, Colorimetric method for
determination of sugars and related substances, Anal. Chem. 28 (1956) 350–356.
doi:10.1021/ac60111a017.
[45] M.M. Bradford, A rapid and sensitive method for the quantitation of microgram
quantities of protein utilizing the principle of protein-dye binding, Anal. Biochem. 72
(1976) 248–254. doi:10.1016/0003-2697(76)90527-3.
[46] M. Figueroa, A. Val Del Rio, J.L. Campos, R. Mendez, A. Mosquera-Corral,
Filamentous bacteria existence in aerobic granular reactors, Bioprocess Biosyst. Eng. 38
(2015) 841–851. doi:10.1007/s00449-014-1327-x.
[47] J-h. Zhou, Z-m. Zhang, H. Zhao, H-t. Yu, P.J.J. Alvarez, X-y Xu, L. Zhu, Optimizing
granules size distribution for aerobic granular sludge stability: Effect of a novel funnel-
shaped internals on hydraulic shear stress, Bioresour. Technol. 216 (2016) 562–570.
doi:10.1016/j.biortech.2016.05.079.
[48] A-j. Li, X-y. Li, H-q. Yu, Granular activated carbon for aerobic sludge granulation in a
bioreactor with a low-strength wastewater influent, Sep. Purif. Technol. 80 (2011) 276–
283. doi:10.1016/j.seppur.2011.05.006.
[49] J. Tao, L. Qin, X. Liu, B. Li, J. Chen, J. You, Y. Shen, X. Chen, Effect of granular
activated carbon on the aerobic granulation of sludge and its mechanism, Bioresour.
Technol. 236 (2017) 60–67. doi:10.1016/j.biortech.2017.03.106.
[50] C. Caudan, A. Filali, M. Spérandio, E. Girbal-Neuhauser, Multiple EPS interactions
involved in the cohesion and structure of aerobic granules, Chemosphere 117 (2014)
262–270. doi:10.1016/j.chemosphere.2014.07.020.
[51] J. Fang, B. Su, P. Sun, J. Lou, J. Han, Long-term effect of low concentration Cr(VI) on
P removal in granule-based enhanced biological phosphorus removal (EBPR) system,
Chemosphere 121 (2015) 76–83. doi:10.1016/j.chemosphere.2014.11.024.
[52] Y. Liu, S-F. Yang, L. Qin, J-H. Tay, A thermodynamic interpretation of cell
hydrophobicity in aerobic granulation, Appl. Microbiol. Biotechnol. 64 (2004) 410–415.
doi:10.1007/s00253-003-1462-9.
[53] C-Y. Wu, Y-Z. Peng, R-D. Wang, Y-X. Zhou, Understanding the granulation process
of activated sludge in a biological phosphorus removal sequencing batch reactor,
Chemosphere 86 (2012) 767–773. doi:10.1016/j.chemosphere.2011.11.002.
[54] C-F. Mandenius, A. Brundin, Bioprocess optimization using design-of-experiments
methodology, Biotechnol. Prog. 24 (2008) 1191–1203. doi:10.1021/bp.67.
[55] Y-Q. Liu, J-H. Tay, Influence of cycle time on kinetic behaviors of steady-state aerobic

62
granules in sequencing batch reactors, Enzyme Microb. Technol. 41 (2007) 516–522.
doi:10.1016/j.enzmictec.2007.04.005.
[56] T. Panswad, C. Anan, Specific oxygen, ammonia, and nitrate uptake rates of a biliogical
nutrient removal process treatment elevated salinity wastewater, Bioresour. Technol. 70
(1999) 237–243.
[57] M. Pijuan, A. Guisasola, J.A. Baeza, J. Carrera, C. Casas, J. Lafuente, Aerobic
phosphorus release linked to acetate uptake: Influence of PAO intracellular storage
compounds, Biochem. Eng. J. (2005). doi:10.1016/j.bej.2005.04.014.

63
Appendix The following publications are related to this thesis.
1. Johan Syafri Mahathir Ahmad, Wei Cai, Ziwen Zhao, Zhenya Zhang, Kazuya Shimidzu,
Zhongfang Lei, Duu-jong Lee, 2017, Stability of algal-bacterial granules in continuous-
flow reactors to treat varying strength domestic wastewater. Bioresource Technology, 244,
225-233.
2. Johan Syafri Mahathir Ahmad, Ziwen Zhao, Haniif Prasetiawan, Wei Cai, Kazuya
Shimizu, Zenya Zhang, Zhongfang Lei, Motoo Ustumi, 2018. Novel approach for kinetics
prediction from cycle tests on algal-bacterial granular sludge in a continuous-flow reactor
and its application in decision on aeration strategy for optimal organics and nutrients
removal from wastewater. Environmental Science & Technology (under preparation).
3. Johan Syafri Mahathir Ahmad, Ziwen Zhao, Kazuya Shimizu, Zenya Zhang, Zhongfang
Lei, Motoo Utsumi, 2018. Stability of algal-bacterial granules in a continuous-flow reactor
with effluent recirculation instead of aeration to effectively treat domestic wastewater.
Bioresource Technology (under preparation).
Related Documents


![Stability of bacteriophages in burn wound care products · sidered is phage therapy [6–8], i.e. the use of bacterial viruses named bacteriophages (phages for short) to treat bacterial](https://static.cupdf.com/doc/110x72/5ecd79c66a5b361e1e24365d/stability-of-bacteriophages-in-burn-wound-care-products-sidered-is-phage-therapy.jpg)


