Study on the Conception of Learning Problems of Students by Combining the Misconception Domain and Structural Analysis Methods Tian-Wei Sheu Graduate Institute of Educational Measurement and Statistics, National Taichung University of Education, Taichung, Taiwan Email: [email protected] Tzu-Liang Chen, Jian-Wei Tzeng, Ching-Pin Tsai and Masatake Nagai Graduate Institute of Educational Measurement and Statistics, National Taichung University of Education, Taichung, Taiwan Email: [email protected], [email protected], [email protected], [email protected] Abstract—The purpose of this paper was to analyze the structure of difficult concepts learning within the classroom. The sample of the study was 18 fourth grade students in Central Taiwan, and the exam tools were produced by teachers for math exams. In this paper, a combination of the Rasch Model GSP chart analysis theory, the misconception domain, the Interpretive Structural Modeling (ISM) and Grey Structural Model (GSM) was used. The results are as follows: (1) Based on the change in students’ average grade and the difficulty between problems of Rasch Line = 0.5, the effect of the remedial teaching will be known. (2) Through the GSM structural graphs, the misconception domain structure of students can be identified. (3) The problem- concept relationship of misconception domain can reveal the structure of misconceptions through the GSM structural graph. This structure is capable of identifying the learning sequence of the difficult concepts. (4) Upon comparing the GSM structural graph of misconception domain before and after remedial teaching, it became clear which concepts made learning more effective, and which concepts needed to be developed more. (5) The research method for a small amount of people and problems can still systematic point out the structure of concepts which need in this class. Index Terms—Rasch Model GSP chart, Misconception Domain, ISM, GSM, the structure of conceptions I. INTRODUCTION A number of scholars have shown that before a formal education, students have possessed systematic structure of science phenomena. There is a basic difference between systematic structure and learning knowledge structure. Some previous researches in science education [1-2] referred this difference to the “Misconception,” the “Alternative Conception,” or the “Alternative Frame”. Brown and Burton found that there are many kind of misconception in solving math problems which consequently has caused the difficulties in learning for students [3]. Hewson and Hewson suggested that in order to change the misconception of student, it is necessary to identify misconceptions before adjusting teaching strategies [4]. As early as 1995, Min-Ning Yu proposed that cognitive diagnostic assessment derives from student’s individual difference and adaptive learning program, aim to draw examinee’s knowledge structure from testing [5]. Knowledge structure and cognitive diagnostic information has attracted less attention in paper –pencil test and educational assessment [6]. In Grade 1-9 curriculum, the Ministry of Education also emphasized that teachers should identify the mistake which student easily make and implement the diagnostic teaching [7]. The importance of diagnostic teaching has been generally affirmed in numerous academic findings both at home and abroad [8-13]. Cognitive diagnoses are commonly conducted as a qualitative interview process, but other methods also persist. Although the effectiveness of diagnostic interviews has been apparent for quite some time, teachers at the elementary stage are often unable to perform them because of staffing concerns or large classroom sizes. In order to deal with this, quantitative approaches, like the Item Response Theory, have been utilized. Methods like the Item Response Approach are often criticized. The Item Response Theory requires a large sample size, and is therefore not as relevant today. Teachers cannot receive feedback from the diagnostic exams in a timely enough manner. In addition, other research designed various kinds of diagnostic tests to identify misconceptions in learning [14-15]. Credible results rest upon the ability to conduct proper interviews, design written pre-tests, and perform a rigorous correction process. Frequently, teachers fail to reach these standards because of their labor intensive and time- consuming. Thus, the difference of this study from some previous psychometric researches is that this study used mathematical analysis based on structural graph to resolve the misconception in learning. In 2012, misconcept order was be defined by Sheu, Tzeng, Tsai and Chen who combined the concepts of misconceptions as hierarchical degree of intensity [16]. In strictly limited class sizes, exam analysis can only reveal the misconceptions and not their hierarchical degrees of JOURNAL OF COMPUTERS, VOL. 8, NO. 5, MAY 2013 1255 © 2013 ACADEMY PUBLISHER doi:10.4304/jcp.8.5.1255-1266

Study on the Conception of Learning Problems of … [email protected], [email protected], [email protected], [email protected] Abstract—The purpose of this
Apr 25, 2018
Welcome message from author
This document is posted to help you gain knowledge. Please leave a comment to let me know what you think about it! Share it to your friends and learn new things together.
Transcript
Study on the Conception of Learning Problems of Students by Combining the Misconception Domain and Structural Analysis Methods
Tian-Wei Sheu
Graduate Institute of Educational Measurement and Statistics, National Taichung University of Education, Taichung, Taiwan
Email: [email protected]
Tzu-Liang Chen, Jian-Wei Tzeng, Ching-Pin Tsai and Masatake Nagai Graduate Institute of Educational Measurement and Statistics, National Taichung University of Education, Taichung,
Taiwan Email: [email protected], [email protected], [email protected], [email protected]
Abstract—The purpose of this paper was to analyze the structure of difficult concepts learning within the classroom. The sample of the study was 18 fourth grade students in Central Taiwan, and the exam tools were produced by teachers for math exams. In this paper, a combination of the Rasch Model GSP chart analysis theory, the misconception domain, the Interpretive Structural Modeling (ISM) and Grey Structural Model (GSM) was used. The results are as follows: (1) Based on the change in students’ average grade and the difficulty between problems of Rasch Line = 0.5, the effect of the remedial teaching will be known. (2) Through the GSM structural graphs, the misconception domain structure of students can be identified. (3) The problem-concept relationship of misconception domain can reveal the structure of misconceptions through the GSM structural graph. This structure is capable of identifying the learning sequence of the difficult concepts. (4) Upon comparing the GSM structural graph of misconception domain before and after remedial teaching, it became clear which concepts made learning more effective, and which concepts needed to be developed more. (5) The research method for a small amount of people and problems can still systematic point out the structure of concepts which need in this class. Index Terms—Rasch Model GSP chart, Misconception Domain, ISM, GSM, the structure of conceptions
I. INTRODUCTION
A number of scholars have shown that before a formal education, students have possessed systematic structure of science phenomena. There is a basic difference between systematic structure and learning knowledge structure. Some previous researches in science education [1-2] referred this difference to the “Misconception,” the “Alternative Conception,” or the “Alternative Frame”. Brown and Burton found that there are many kind of misconception in solving math problems which consequently has caused the difficulties in learning for students [3]. Hewson and Hewson suggested that in order to change the misconception of student, it is necessary to identify misconceptions before adjusting teaching
strategies [4]. As early as 1995, Min-Ning Yu proposed that cognitive diagnostic assessment derives from student’s individual difference and adaptive learning program, aim to draw examinee’s knowledge structure from testing [5]. Knowledge structure and cognitive diagnostic information has attracted less attention in paper –pencil test and educational assessment [6].
In Grade 1-9 curriculum, the Ministry of Education also emphasized that teachers should identify the mistake which student easily make and implement the diagnostic teaching [7]. The importance of diagnostic teaching has been generally affirmed in numerous academic findings both at home and abroad [8-13]. Cognitive diagnoses are commonly conducted as a qualitative interview process, but other methods also persist. Although the effectiveness of diagnostic interviews has been apparent for quite some time, teachers at the elementary stage are often unable to perform them because of staffing concerns or large classroom sizes. In order to deal with this, quantitative approaches, like the Item Response Theory, have been utilized. Methods like the Item Response Approach are often criticized. The Item Response Theory requires a large sample size, and is therefore not as relevant today. Teachers cannot receive feedback from the diagnostic exams in a timely enough manner. In addition, other research designed various kinds of diagnostic tests to identify misconceptions in learning [14-15]. Credible results rest upon the ability to conduct proper interviews, design written pre-tests, and perform a rigorous correction process. Frequently, teachers fail to reach these standards because of their labor intensive and time-consuming. Thus, the difference of this study from some previous psychometric researches is that this study used mathematical analysis based on structural graph to resolve the misconception in learning.
In 2012, misconcept order was be defined by Sheu, Tzeng, Tsai and Chen who combined the concepts of misconceptions as hierarchical degree of intensity [16]. In strictly limited class sizes, exam analysis can only reveal the misconceptions and not their hierarchical degrees of
JOURNAL OF COMPUTERS, VOL. 8, NO. 5, MAY 2013 1255
© 2013 ACADEMY PUBLISHERdoi:10.4304/jcp.8.5.1255-1266
intensity. For these reasons, this research conducted the analysis on eighteen fourth-grade students, using the self perimeter and area of unit math test, and based on the Rasch GSP Model (Grey Student-Problem Chart) to determine change of the student ability before and after implementing remedial courses. Furthermore, based on the misconception domain of student, Interpretive Structural Modeling (ISM) and Grey Structure Model, the researchers analyze the concept structure. This method provides teachers both effective and objective tool for research in teaching.
II. BASIC THEORY
A. Interpretive Structural Modeling Interpretive Structural Modeling (ISM) is proposed in
1976 by J. N. Warfield. To analyze, using the Hierarchical Digraph in Graphic Theory describes the relationship between different types of elements. The mathematical analysis transforms the relationship between the different types of elements into the associated constructor class diagram in a complex system [17]. Using of the ISM in the determinant, the relationship between the various elements must be arranged. Binary data of "1" and "0" means that the elements of related or unrelated. As a result, ISM transform fragmental and abstractive elements into the specific and comprehensive associated constructor class diagram in a complex system to clarify the structure of the complex situations [18-19].
In education, a number of scholars all used the ISM proceed structural analysis of teaching content as a teaching reference [20-21]. In this study, ISM structural graph of concepts and the structure of misconceptions based on GSM correspond to each other. This method is an innovative method which can be clearly pointed out the learning sequence of the concepts and difficult concepts further carry out learning path of concepts.
B. S-P Chart Theory Takahiro Sato carried out S-P chart (Student-Problem
Chart) Theory [22]. Caution index is the other coefficient used for individual students and problems by S-P chart. Caution index is provided in caution index of student (CS) and caution index of item (CP). It is mainly used as an index to judge students or questions whether are anomalies in response patterns [23-26].
Using this method analyzes and sorts according to students’ response pattern in the items can get item quality and the students' diagnostic messages for teachers’ effective learning [27-28]. Many scholars support identically that S-P chart theory can diagnose the learning situation and to enhance the effectiveness of teaching [27-29]. S-P chart can not only diagnose the learning evaluation, but also help to evaluate and to improve the efficiency of some classes [5, 30-31].
Sheu, et al. motioned the combination of caution index and Rasch Model GSP Chart defined the students’ misconception domain. Misconception domain is the intersection of students and problems of misconception
domain [32]. In Sheu’s study, only the structure of problems of misconception domain can be obtained according to the students’ misconception domain, the problem didn’t correspond to the respective concept. In this study, the researchers further take the problems of misconception domain correspond to the respective concepts to analyze the structure of misconception.
C. Grey Relational Analysis Professor Deng first introduced the grey system theory
in 1989. The system proceeds relational analysis for ambiguity or incompleteness of the system model [33]. Through the prediction and decision-making [34-35], the grey system theory combined with the mathematical methods to explore the overall system [36-37]. The GRA procedures are shown as follows. (1) Establishing the raw data analysis
To establish the reference vector 0x and comparative vector ix of the raw data, where ni ,,2,1 L= ; mk ,,2,1 L= . (2) Calculations of Grey Relational Grade
To calculate based on the grey relational grade formula proposed by Nagai [38-39], where local grey relation’s reference vector is 0x and comparative vector is ix .
When i0Γ is close to 1, the relationship between 0x and
ix is higher. Oppositely, when i0Γ is close to 0, it means that 0x and ix are low associated.
(a) The formula of the local grey relation:
minmax
0max00 ),(
Δ−ΔΔ−Δ
=Γ=Γ iii xx (1)
, where 1
0 0 01
( [ ( )] )m
i i ik
x x k ρ ρρ
=
Δ = − = Δ∑ .
0iΔ is the absolute difference form two sequences.
maxΔ and minΔ is the maximum and minimum of i0Δ , respectively. When ∞≤≤ ρ1 , it means Minkowski’s grey relation; when 2=ρ , it means Euclidean grey relation.
(b) The formula of the global grey relation:
max
1),(ΔΔ
−=Γ=Γ ijjiij xx (2)
, where nji ,,1, L∈ ; 21
1
2 ))]([(∑=
Δ=Δm
kijij k .
(3) Grey Relational Ordinal The decision-making is based on the comparison of the
grey relation. Though ranking, we can find out an importance of the factors and then identify the maximum or minimum of impact factors. The factors become the associated principle of the system.
1256 JOURNAL OF COMPUTERS, VOL. 8, NO. 5, MAY 2013
© 2013 ACADEMY PUBLISHER

D. Rasch Model GSP Rasch Model GSP chart is a theory which is created by
Nagai in 2010. The combination of grey relational theory and the S-P chart can make the analysis of the problems more specific and is suitable for investigating various uncertain factors. Through the math, GSP chart can make the data of uncertainty, multivariate, discrete, incompleteness of the various things to process more effective graphic expression, interpretation of the weights and sort of transaction between the discrete sequences. Through the convey of complete chart, this information processing interpretation clarifies the problems and defines transparency. That is an effective way to deal with the complex factors and causal relationship between disposals [40-41].
A number of scholars provided the educational assessment and identified the difficulty of the courses based on a combination of grey relational theory and the S-P chart. They not only defined the results of curriculum assessment but also provided an identification method of the educational training and learning [40-42]. In the study, the researchers used GSP chart to analyze English writing skills of college students for evaluating the importance of vocabulary in English writing [41]. In addition, a number of scholars applied the GSP chart in math test to analyze students’ misconceptions in learning [21, 44-46].
E. Grey Structural Model This study was based on Nagai’s Grey Structural
Model analysis theory to establish the matrix [39]. After define original matrix, the matrix defined through Matlab software to carry out computing calculate to get the grey relational degree and sort [38]. According to the result of local GRA, the structure graph of GSM will be attained. Through GSM graph, the researcher would be analyzing the structure and order of research data to be applied for cluster analysis to find the hierarchical relationship [39]. Analysis and processing steps of GSM hierarchical structure are as follows.
(1) If C represents a hierarchical structure, the structure is composed by a group of structural elements shown as follows. The formula is }{ θε ≤= ijji xC , where
;,...,3,2,1, mji = θ is a hierarchical coefficient, 10 ≤≤θ ; and the matrix E is Eq. (3).
⎥⎥⎥⎥
⎦
⎤
⎢⎢⎢⎢
⎣
⎡
=
mmmm
m
m
E
εεε
εεεεεε
L
MOMM
L
L
21
22221
11211
(3)
For iC and jC , the multi-hierarchical cluster is
jiij CCQ ∩= and the number of error is 0 0ij i jr rε = − ,
10 ≤≤ ijε and 0=iiε . (2) The elements in hierarchical structure have homogeneity to each other. They also meet the following two conditions.
(a) For any i , select a minimum set of elements can from iC ,
iiCcard∀
= min}{ (4)
(b) For all j , ji CC ⊄ and ji ≠ . (3) Based on Nagai’s structural theory [39], the hierarchical structure in GSM is to combine several relative elements together. The formula is Eq. (5).
{( , ) , }i j ij oi ojP x x r r rψ= ≥ < (5)
, where ψ is the path coefficient, 10 ≤≤ψ . These two are related, represented as ),( ji xx . P can be the relationship composed from the relation from up to down.
III. RESEARCH PROCEDURES
The study combined misconception domain, the Rasch Model GSP Chart based on GRA, ISM and GSM structural graph applied in mathematics test of perimeter and area of fourth grade. The research structure was shown in Figure 1.
Figure 1. The research structure
Drawing GSM structural graph of conceptions of pretest problems
Analyze the structure of students and misconceptions of pretest based on misconception domain
Carry out remedial teaching and adjust pretest problems
Drawing GSM structural graph of conceptions of posttest problems
Analyze the structure of students and misconceptions of posttest based on misconception domain
Analyze the change of students and misconception of pretest and posttest based on misconception domain
Pointed out the concept of carry out remedial teaching again
Drawing ISM structural graph of concepts of course
JOURNAL OF COMPUTERS, VOL. 8, NO. 5, MAY 2013 1257
© 2013 ACADEMY PUBLISHER

IV. RESULTS AND DISCUSSION
A. Production and Analysis of the Structural Graph of Concepts based on ISM
This section uses the ISM model to build the problems’ structural graph of concepts. For example, eight concepts are contained within math perimeter and area of unit calculations in fourth grade math. It shows the relationship between concepts. The teachers judged the correlation between concepts through the two –phase way (TABLE I). If there is a connection between two concepts, then a corresponding column will reflect the number “1” and a lack of connection will show a “0”.
TABLE I. CONCEPT-CONCEPT RELATIONSHIP
Concept\Concept 1 2 3 4 5 6 7 81. Calculate the rectangular perimeter 0 1 0 0 0 1 0 12. Calculate the square perimeter 0 0 0 0 0 1 0 13. Calculate the rectangular area 0 0 0 1 1 0 1 14. Calculate the square area 0 0 0 0 1 0 1 15. Change square meter and square centimeter 0 0 0 0 0 0 0 16. Calculate complex graphics perimeter 0 0 0 0 0 0 0 17. Calculate complex graphics area 0 0 0 0 0 0 0 18. Solving problem 0 0 0 0 0 0 0 0
The researchers used ISM software to estimate a
matrix calculation to obtain the causal linking structure between concepts which was the ISM structural graph of concepts (Figure 2). From Figure 2, the structural graph of concepts has 4 layers, the lowest layer is the basic concept of this unit, and the top layer is the most difficult concept. When teachers use this unit, there are three distinct teaching sequences, including 1 → 2 → 6 → 8, 3 → 4 → 5 → 8, 3 → 4 → 7 → 8.
Figure 2. The structural graph of concepts
B. Production and Analysis of the GSM Structural Graph of Conceptions
It shows the relationship between problems and concepts. The teachers judged the correlation between problems and concepts (TABLE II). If there is a connection between problems and concepts, then a corresponding column will reflect the number “1” and a lack of connection will show a “0”.
TABLE II. PAPERS PROBLEM-CONCEPT RELATIONSHIP OF THE PRETEST
Problem\Concept 1 2 3 4 5 6 7 81 0 1 0 0 0 0 0 02 1 0 0 0 0 0 0 03 0 0 0 0 1 0 0 04 0 0 0 0 1 0 0 05 1 0 0 0 0 0 0 06 1 0 0 0 0 0 0 07 0 1 0 0 0 0 0 08 1 0 0 0 0 0 0 09 0 0 0 0 1 0 0 010 0 0 0 0 1 0 0 011 0 0 0 0 1 0 0 012 0 0 0 0 1 0 0 013 1 0 0 0 0 0 0 014 0 0 1 0 0 0 0 015 0 1 0 0 0 0 0 016 0 0 0 1 0 0 0 017 0 0 0 0 0 0 1 018 0 0 0 0 0 1 0 019 0 0 0 0 0 0 0 120 0 0 0 0 0 0 1 021 0 0 0 0 0 0 0 122 0 0 0 0 0 0 0 1
According to TABLE II, GSM structural Analysis is
run through a matrix using Matlab software to generate the GSM structural graph of conceptions (Figure 3). It shows the GSM structural graph of conceptions of the pretest problems has five layers, the lowest layer represents concepts that appeared the least, and the top layer represents concepts that appeared the most (Figure 3). From the bottom, respectively, the concept of layer 1 is 3, 4, and 6, the concept of layer 2 is 7, the concept of layer 3 is 2 and 8, the concept of layer 4 is 1, and the concept of layer 5 is 5.
Figure 3. GSM structural graph of conceptions of the pretest problems
Similarly, problem-concept relationship of post test (TABLE III) was established and the GSM structural graph of conceptions of post test problems (Figure 4) was drew. It shows the GSM structural graph of conceptions of post test problems has two layers, the lowest layer represents concepts that appeared the least, and the top layer represents concepts that appeared the most (Figure 4). From the bottom, respectively, the concept of layerl 1 is 1, 2, 3, 4, 6, and 8; the concept of layer 2 is 5 and 7.
1: Calculate the rectangular perimeter
2: Calculate the square perimeter
3: Calculate the rectangular area
4: Calculate the square area
5: Change square meter and square centimeter
6: Calculate complex graphics perimeter
7: Calculate complex graphics area
8: Solving problem
1258 JOURNAL OF COMPUTERS, VOL. 8, NO. 5, MAY 2013
© 2013 ACADEMY PUBLISHER

TABLE III. PROBLEM-CONCEPT RELATIONSHIP OF THE POSTTEST
Problem\Concept 1 2 3 4 5 6 7 81 0 0 0 1 0 0 0 02 1 0 0 0 0 0 0 03 0 0 0 0 1 0 0 04 0 0 0 0 1 0 0 05 0 0 1 0 0 0 0 06 0 1 0 0 0 0 0 07 0 0 0 0 1 0 0 08 0 0 0 0 1 0 0 09 0 0 0 0 0 0 1 010 0 0 0 0 0 0 1 011 0 0 0 0 0 0 1 012 0 0 0 0 0 1 0 013 0 0 0 0 0 0 1 014 0 0 0 0 0 0 0 1
Figure 4. GSM structural graph of conceptions of the posttest
problems
Upon comparison of the GSM structural graph of
conceptions of the pretest and posttest problems (Figure 3, Figure 4), the structure of the pretest consisted of five layers and the posttest consisted of only two layers. The structure of problems is reduced and has been adjusted due to the results of the pretest. Between concept 1, 2 have been omitted, prompting a change in percentage calculation for the posttest results. Concept 7 replaced the other layers at the top of structural graph, thereby increasing the proportion of difficult concepts.
C. The Analysis of the RASCH MODEL GSP Graph Analysis before and after Remedial Teaching
This section is based on the results of the RASCH MODEL GSP graph before and after the remedial teaching to analyze the effectiveness of the remedial teaching. The researchers used the S-P chart analysis to determine the caution index of the students and problems, combined with the RASCH MODEL GSP chart analysis theory to establish the RASCH MODEL GSP chart of the pretest (TABLE IV). It is the RASCH MODEL GSP graph of the pretest, the blue line represents the Gamma value of the problems, the red line represents the Gamma value of the students, and the green line is the Rasch Line (Figure 5).
Similarly, after remedial teaching, the RASCH MODEL GSP chart of posttest was established by using a combination of the S-P chart analysis and RASCH MODEL GSP chart analysis theory (TABLE V). It shows the RASCH MODEL GSP graph of posttest (Figure 6).
TABLE IV. RASCH MODEL GSP CHART OF THE PRETEST
Student\Problem 4 9 10 1 3 2 11 12 15 16 13 14 17 5 6 8 7 22 19 20 21 18 Total Gamma CS3 1 1 1 1 1 1 1 1 1 1 1 1 1 1 1 1 1 1 1 1 1 1 22 1.00 09 1 1 1 1 1 1 1 1 1 1 1 1 1 1 1 1 1 1 1 1 1 1 22 1.00 012 1 1 1 1 1 1 1 1 1 1 1 1 1 1 1 1 1 1 1 1 1 1 22 1.00 04 1 1 1 1 1 1 1 1 1 1 1 1 1 1 1 1 1 1 1 1 1 0 21 0.73 05 1 1 1 1 1 1 1 1 1 1 1 1 1 1 1 1 1 1 1 1 0 1 21 0.73 0.1415 1 1 1 1 1 1 1 1 1 1 1 1 1 1 1 1 1 1 1 1 0 1 21 0.73 0.148 1 1 1 1 1 1 1 1 1 1 1 1 0 1 1 1 1 0 1 1 1 1 20 0.62 0.8911 1 1 1 1 1 1 1 1 1 1 1 1 1 1 1 1 0 1 1 1 1 0 20 0.62 0.3710 1 1 1 1 1 1 1 1 1 1 1 1 1 1 1 1 1 0 0 0 0 0 17 0.40 016 1 1 1 1 1 1 1 1 1 1 1 1 1 1 1 1 1 0 0 0 0 0 17 0.40 013 1 1 1 1 0 1 0 0 1 1 1 1 1 1 1 1 1 1 0 0 1 0 16 0.35 0.582 1 1 1 1 1 1 1 1 1 1 1 1 1 0 0 0 0 1 1 0 0 0 15 0.29 0.226 1 1 1 1 1 1 1 1 1 1 1 1 1 0 0 0 0 1 1 0 0 0 15 0.29 0.2214 1 1 1 1 1 1 1 1 1 0 1 0 1 1 1 1 1 0 0 0 0 0 15 0.29 0.1417 1 1 1 1 1 1 1 0 1 1 1 1 0 1 1 1 1 0 0 0 0 0 15 0.29 0.1418 1 1 1 1 1 1 1 1 1 1 0 0 0 1 1 1 1 1 0 0 0 0 15 0.29 0.227 1 1 1 0 1 0 1 1 0 1 0 1 1 0 0 0 0 1 0 0 1 0 11 0.11 0.531 1 1 1 1 1 0 0 1 0 0 0 0 1 0 0 0 0 0 0 0 0 1 8 0.00 0.45
Total 18 18 18 17 17 16 16 16 16 16 15 15 15 14 14 14 13 12 10 8 8 7 313Gamma 1.00 1.00 1.00 0.70 0.70 0.57 0.57 0.57 0.57 0.57 0.48 0.48 0.48 0.40 0.40 0.40 0.33 0.26 0.15 0.05 0.05 0.00
CP 0 0 0 0.32 0.85 0 0.32 0.76 0 0.25 0 0.22 0.88 0 0 0 0.22 0.51 0.14 0 0.50 0.48
1: Calculate the rectangular perimeter
2: Calculate the square perimeter
3: Calculate the rectangular area
4: Calculate the square area
5: Change square meter and square centimeter
6: Calculate complex graphics perimeter
7: Calculate complex graphics area
8: Solving problem
JOURNAL OF COMPUTERS, VOL. 8, NO. 5, MAY 2013 1259
© 2013 ACADEMY PUBLISHER
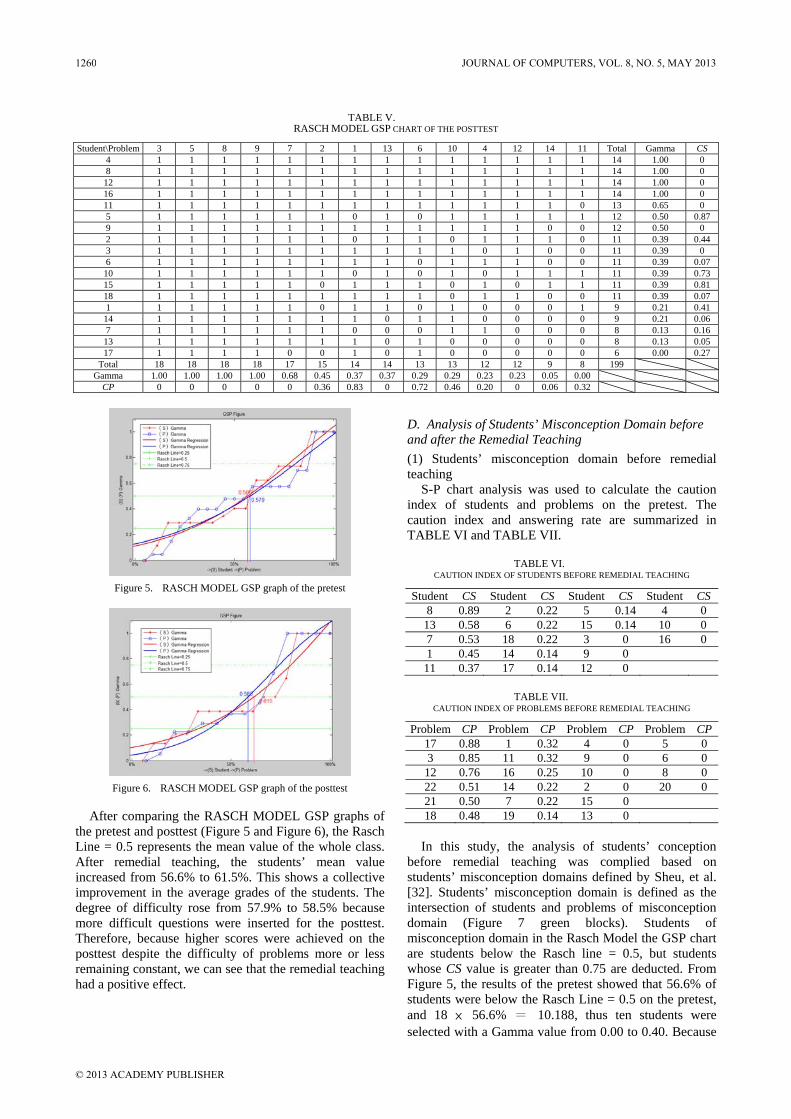
TABLE V. RASCH MODEL GSP CHART OF THE POSTTEST
Student\Problem 3 5 8 9 7 2 1 13 6 10 4 12 14 11 Total Gamma CS 4 1 1 1 1 1 1 1 1 1 1 1 1 1 1 14 1.00 0 8 1 1 1 1 1 1 1 1 1 1 1 1 1 1 14 1.00 0 12 1 1 1 1 1 1 1 1 1 1 1 1 1 1 14 1.00 0 16 1 1 1 1 1 1 1 1 1 1 1 1 1 1 14 1.00 0 11 1 1 1 1 1 1 1 1 1 1 1 1 1 0 13 0.65 0 5 1 1 1 1 1 1 0 1 0 1 1 1 1 1 12 0.50 0.87 9 1 1 1 1 1 1 1 1 1 1 1 1 0 0 12 0.50 0 2 1 1 1 1 1 1 0 1 1 0 1 1 1 0 11 0.39 0.44 3 1 1 1 1 1 1 1 1 1 1 0 1 0 0 11 0.39 0 6 1 1 1 1 1 1 1 1 0 1 1 1 0 0 11 0.39 0.07 10 1 1 1 1 1 1 0 1 0 1 0 1 1 1 11 0.39 0.73 15 1 1 1 1 1 0 1 1 1 0 1 0 1 1 11 0.39 0.81 18 1 1 1 1 1 1 1 1 1 0 1 1 0 0 11 0.39 0.07 1 1 1 1 1 1 0 1 1 0 1 0 0 0 1 9 0.21 0.41 14 1 1 1 1 1 1 1 0 1 1 0 0 0 0 9 0.21 0.06 7 1 1 1 1 1 1 0 0 0 1 1 0 0 0 8 0.13 0.16 13 1 1 1 1 1 1 1 0 1 0 0 0 0 0 8 0.13 0.05 17 1 1 1 1 0 0 1 0 1 0 0 0 0 0 6 0.00 0.27
Total 18 18 18 18 17 15 14 14 13 13 12 12 9 8 199 Gamma 1.00 1.00 1.00 1.00 0.68 0.45 0.37 0.37 0.29 0.29 0.23 0.23 0.05 0.00
CP 0 0 0 0 0 0.36 0.83 0 0.72 0.46 0.20 0 0.06 0.32
Figure 5. RASCH MODEL GSP graph of the pretest
Figure 6. RASCH MODEL GSP graph of the posttest
After comparing the RASCH MODEL GSP graphs of the pretest and posttest (Figure 5 and Figure 6), the Rasch Line = 0.5 represents the mean value of the whole class. After remedial teaching, the students’ mean value increased from 56.6% to 61.5%. This shows a collective improvement in the average grades of the students. The degree of difficulty rose from 57.9% to 58.5% because more difficult questions were inserted for the posttest. Therefore, because higher scores were achieved on the posttest despite the difficulty of problems more or less remaining constant, we can see that the remedial teaching had a positive effect.
D. Analysis of Students’ Misconception Domain before and after the Remedial Teaching (1) Students’ misconception domain before remedial teaching
S-P chart analysis was used to calculate the caution index of students and problems on the pretest. The caution index and answering rate are summarized in TABLE VI and TABLE VII.
TABLE VI. CAUTION INDEX OF STUDENTS BEFORE REMEDIAL TEACHING
Student CS Student CS Student CS Student CS8 0.89 2 0.22 5 0.14 4 0 13 0.58 6 0.22 15 0.14 10 0 7 0.53 18 0.22 3 0 16 0 1 0.45 14 0.14 9 0 11 0.37 17 0.14 12 0
TABLE VII. CAUTION INDEX OF PROBLEMS BEFORE REMEDIAL TEACHING
Problem CP Problem CP Problem CP Problem CP17 0.88 1 0.32 4 0 5 0 3 0.85 11 0.32 9 0 6 0 12 0.76 16 0.25 10 0 8 0 22 0.51 14 0.22 2 0 20 0 21 0.50 7 0.22 15 0 18 0.48 19 0.14 13 0 In this study, the analysis of students’ conception
before remedial teaching was complied based on students’ misconception domains defined by Sheu, et al. [32]. Students’ misconception domain is defined as the intersection of students and problems of misconception domain (Figure 7 green blocks). Students of misconception domain in the Rasch Model the GSP chart are students below the Rasch line = 0.5, but students whose CS value is greater than 0.75 are deducted. From Figure 5, the results of the pretest showed that 56.6% of students were below the Rasch Line = 0.5 on the pretest, and 18 × 56.6% = 10.188, thus ten students were selected with a Gamma value from 0.00 to 0.40. Because
1260 JOURNAL OF COMPUTERS, VOL. 8, NO. 5, MAY 2013
© 2013 ACADEMY PUBLISHER
there are no CS values of students greater than 0.75 in the domain, it will not be deducted (Figure 7 pink blocks). Problems of misconception domain in the Rasch Model the GSP chart are problems below the Rasch line = 0.5, but problems whose CP value is greater than 0.75 are deducted. It can be seen from Figure 5 that there are 57.9% of problems were below the Rasch Line = 0.5 on the pretest, and 22 × 57.9% = 12.738, thus twelve problems were selected with a Gamma value from 0.00 to 0.48. After deducting the problem whose CP value is greater than 0.75 (Problem 17), finally only eleven problems are taken and the Gamma value is from 0.00 to 0.48 (Figure 7 blue blocks).
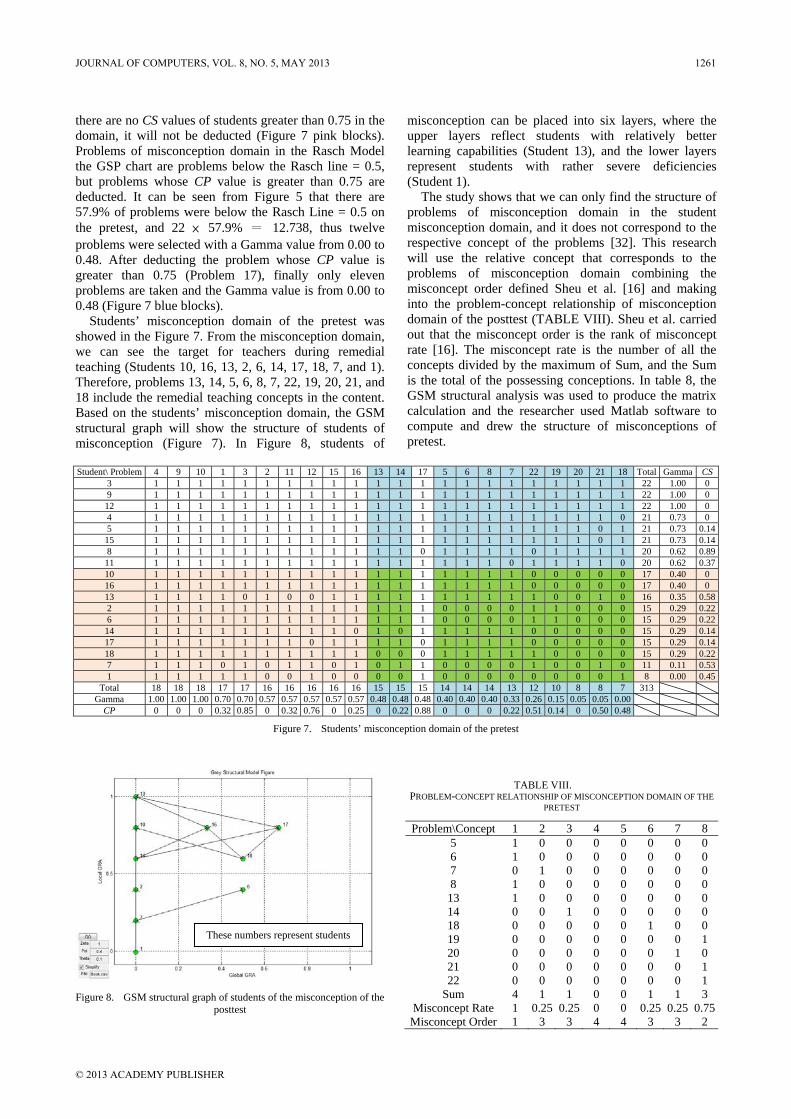
Students’ misconception domain of the pretest was showed in the Figure 7. From the misconception domain, we can see the target for teachers during remedial teaching (Students 10, 16, 13, 2, 6, 14, 17, 18, 7, and 1). Therefore, problems 13, 14, 5, 6, 8, 7, 22, 19, 20, 21, and 18 include the remedial teaching concepts in the content. Based on the students’ misconception domain, the GSM structural graph will show the structure of students of misconception (Figure 7). In Figure 8, students of
misconception can be placed into six layers, where the upper layers reflect students with relatively better learning capabilities (Student 13), and the lower layers represent students with rather severe deficiencies (Student 1).
The study shows that we can only find the structure of problems of misconception domain in the student misconception domain, and it does not correspond to the respective concept of the problems [32]. This research will use the relative concept that corresponds to the problems of misconception domain combining the misconcept order defined Sheu et al. [16] and making into the problem-concept relationship of misconception domain of the posttest (TABLE VIII). Sheu et al. carried out that the misconcept order is the rank of misconcept rate [16]. The misconcept rate is the number of all the concepts divided by the maximum of Sum, and the Sum is the total of the possessing conceptions. In table 8, the GSM structural analysis was used to produce the matrix calculation and the researcher used Matlab software to compute and drew the structure of misconceptions of pretest.
Student\ Problem 4 9 10 1 3 2 11 12 15 16 13 14 17 5 6 8 7 22 19 20 21 18 Total Gamma CS
3 1 1 1 1 1 1 1 1 1 1 1 1 1 1 1 1 1 1 1 1 1 1 22 1.00 09 1 1 1 1 1 1 1 1 1 1 1 1 1 1 1 1 1 1 1 1 1 1 22 1.00 012 1 1 1 1 1 1 1 1 1 1 1 1 1 1 1 1 1 1 1 1 1 1 22 1.00 0 4 1 1 1 1 1 1 1 1 1 1 1 1 1 1 1 1 1 1 1 1 1 0 21 0.73 0 5 1 1 1 1 1 1 1 1 1 1 1 1 1 1 1 1 1 1 1 1 0 1 21 0.73 0.14 15 1 1 1 1 1 1 1 1 1 1 1 1 1 1 1 1 1 1 1 1 0 1 21 0.73 0.14 8 1 1 1 1 1 1 1 1 1 1 1 1 0 1 1 1 1 0 1 1 1 1 20 0.62 0.89 11 1 1 1 1 1 1 1 1 1 1 1 1 1 1 1 1 0 1 1 1 1 0 20 0.62 0.37 10 1 1 1 1 1 1 1 1 1 1 1 1 1 1 1 1 1 0 0 0 0 0 17 0.40 0 16 1 1 1 1 1 1 1 1 1 1 1 1 1 1 1 1 1 0 0 0 0 0 17 0.40 0 13 1 1 1 1 0 1 0 0 1 1 1 1 1 1 1 1 1 1 0 0 1 0 16 0.35 0.58 2 1 1 1 1 1 1 1 1 1 1 1 1 1 0 0 0 0 1 1 0 0 0 15 0.29 0.22 6 1 1 1 1 1 1 1 1 1 1 1 1 1 0 0 0 0 1 1 0 0 0 15 0.29 0.22 14 1 1 1 1 1 1 1 1 1 0 1 0 1 1 1 1 1 0 0 0 0 0 15 0.29 0.14 17 1 1 1 1 1 1 1 0 1 1 1 1 0 1 1 1 1 0 0 0 0 0 15 0.29 0.14 18 1 1 1 1 1 1 1 1 1 1 0 0 0 1 1 1 1 1 0 0 0 0 15 0.29 0.22 7 1 1 1 0 1 0 1 1 0 1 0 1 1 0 0 0 0 1 0 0 1 0 11 0.11 0.53 1 1 1 1 1 1 0 0 1 0 0 0 0 1 0 0 0 0 0 0 0 0 1 8 0.00 0.45
Total 18 18 18 17 17 16 16 16 16 16 15 15 15 14 14 14 13 12 10 8 8 7 313 Gamma 1.00 1.00 1.00 0.70 0.70 0.57 0.57 0.57 0.57 0.57 0.48 0.48 0.48 0.40 0.40 0.40 0.33 0.26 0.15 0.05 0.05 0.00
CP 0 0 0 0.32 0.85 0 0.32 0.76 0 0.25 0 0.22 0.88 0 0 0 0.22 0.51 0.14 0 0.50 0.48
Figure 7. Students’ misconception domain of the pretest
Figure 8. GSM structural graph of students of the misconception of the
posttest
TABLE VIII. PROBLEM-CONCEPT RELATIONSHIP OF MISCONCEPTION DOMAIN OF THE
PRETEST
Problem\Concept 1 2 3 4 5 6 7 85 1 0 0 0 0 0 0 06 1 0 0 0 0 0 0 07 0 1 0 0 0 0 0 08 1 0 0 0 0 0 0 013 1 0 0 0 0 0 0 014 0 0 1 0 0 0 0 018 0 0 0 0 0 1 0 019 0 0 0 0 0 0 0 120 0 0 0 0 0 0 1 021 0 0 0 0 0 0 0 122 0 0 0 0 0 0 0 1
Sum 4 1 1 0 0 1 1 3Misconcept Rate 1 0.25 0.25 0 0 0.25 0.25 0.75
Misconcept Order 1 3 3 4 4 3 3 2
These numbers represent students
JOURNAL OF COMPUTERS, VOL. 8, NO. 5, MAY 2013 1261
© 2013 ACADEMY PUBLISHER
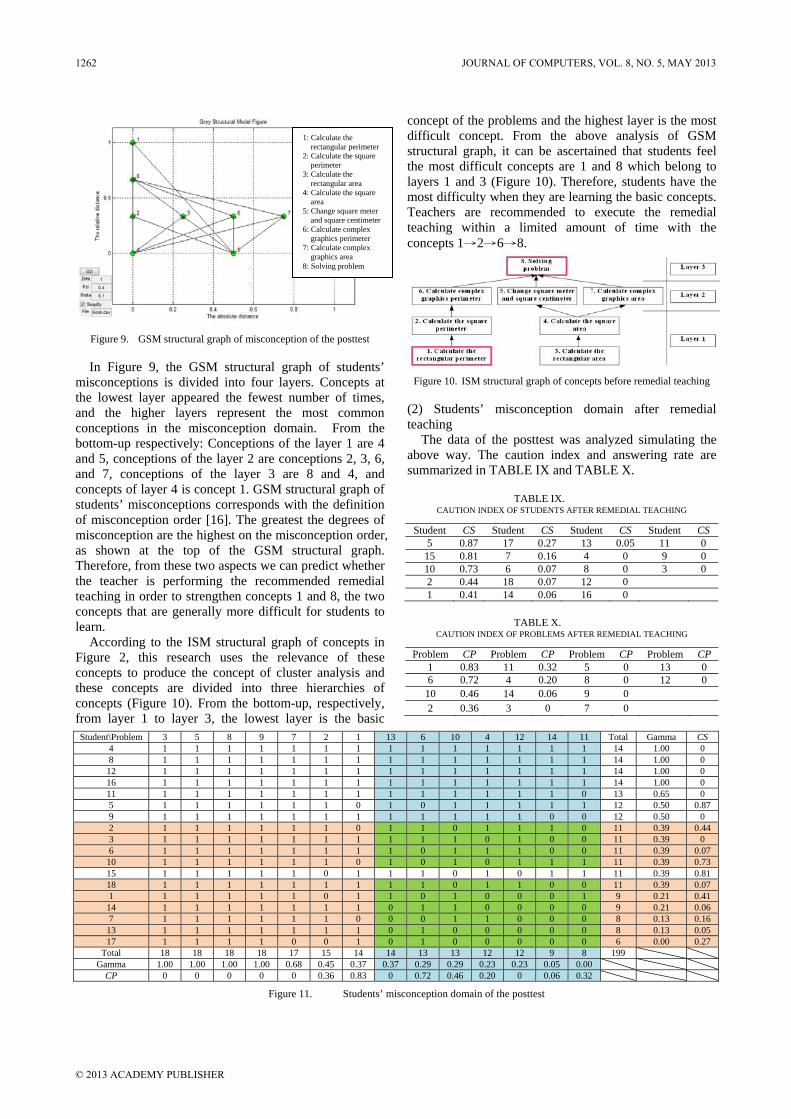
Figure 9. GSM structural graph of misconception of the posttest
In Figure 9, the GSM structural graph of students’ misconceptions is divided into four layers. Concepts at the lowest layer appeared the fewest number of times, and the higher layers represent the most common conceptions in the misconception domain. From the bottom-up respectively: Conceptions of the layer 1 are 4 and 5, conceptions of the layer 2 are conceptions 2, 3, 6, and 7, conceptions of the layer 3 are 8 and 4, and concepts of layer 4 is concept 1. GSM structural graph of students’ misconceptions corresponds with the definition of misconception order [16]. The greatest the degrees of misconception are the highest on the misconception order, as shown at the top of the GSM structural graph. Therefore, from these two aspects we can predict whether the teacher is performing the recommended remedial teaching in order to strengthen concepts 1 and 8, the two concepts that are generally more difficult for students to learn.
According to the ISM structural graph of concepts in Figure 2, this research uses the relevance of these concepts to produce the concept of cluster analysis and these concepts are divided into three hierarchies of concepts (Figure 10). From the bottom-up, respectively, from layer 1 to layer 3, the lowest layer is the basic
concept of the problems and the highest layer is the most difficult concept. From the above analysis of GSM structural graph, it can be ascertained that students feel the most difficult concepts are 1 and 8 which belong to layers 1 and 3 (Figure 10). Therefore, students have the most difficulty when they are learning the basic concepts. Teachers are recommended to execute the remedial teaching within a limited amount of time with the concepts 1→2→6→8.
Figure 10. ISM structural graph of concepts before remedial teaching
(2) Students’ misconception domain after remedial teaching
The data of the posttest was analyzed simulating the above way. The caution index and answering rate are summarized in TABLE IX and TABLE X.
TABLE IX. CAUTION INDEX OF STUDENTS AFTER REMEDIAL TEACHING
Student CS Student CS Student CS Student CS5 0.87 17 0.27 13 0.05 11 0 15 0.81 7 0.16 4 0 9 0 10 0.73 6 0.07 8 0 3 0 2 0.44 18 0.07 12 0 1 0.41 14 0.06 16 0
TABLE X. CAUTION INDEX OF PROBLEMS AFTER REMEDIAL TEACHING
Problem CP Problem CP Problem CP Problem CP1 0.83 11 0.32 5 0 13 06 0.72 4 0.20 8 0 12 010 0.46 14 0.06 9 0
2 0.36 3 0 7 0
Student\Problem 3 5 8 9 7 2 1 13 6 10 4 12 14 11 Total Gamma CS
4 1 1 1 1 1 1 1 1 1 1 1 1 1 1 14 1.00 0 8 1 1 1 1 1 1 1 1 1 1 1 1 1 1 14 1.00 0 12 1 1 1 1 1 1 1 1 1 1 1 1 1 1 14 1.00 0 16 1 1 1 1 1 1 1 1 1 1 1 1 1 1 14 1.00 0 11 1 1 1 1 1 1 1 1 1 1 1 1 1 0 13 0.65 0 5 1 1 1 1 1 1 0 1 0 1 1 1 1 1 12 0.50 0.87 9 1 1 1 1 1 1 1 1 1 1 1 1 0 0 12 0.50 0 2 1 1 1 1 1 1 0 1 1 0 1 1 1 0 11 0.39 0.44 3 1 1 1 1 1 1 1 1 1 1 0 1 0 0 11 0.39 0 6 1 1 1 1 1 1 1 1 0 1 1 1 0 0 11 0.39 0.07 10 1 1 1 1 1 1 0 1 0 1 0 1 1 1 11 0.39 0.73 15 1 1 1 1 1 0 1 1 1 0 1 0 1 1 11 0.39 0.81 18 1 1 1 1 1 1 1 1 1 0 1 1 0 0 11 0.39 0.07 1 1 1 1 1 1 0 1 1 0 1 0 0 0 1 9 0.21 0.41 14 1 1 1 1 1 1 1 0 1 1 0 0 0 0 9 0.21 0.06 7 1 1 1 1 1 1 0 0 0 1 1 0 0 0 8 0.13 0.16 13 1 1 1 1 1 1 1 0 1 0 0 0 0 0 8 0.13 0.05 17 1 1 1 1 0 0 1 0 1 0 0 0 0 0 6 0.00 0.27
Total 18 18 18 18 17 15 14 14 13 13 12 12 9 8 199 Gamma 1.00 1.00 1.00 1.00 0.68 0.45 0.37 0.37 0.29 0.29 0.23 0.23 0.05 0.00
CP 0 0 0 0 0 0.36 0.83 0 0.72 0.46 0.20 0 0.06 0.32
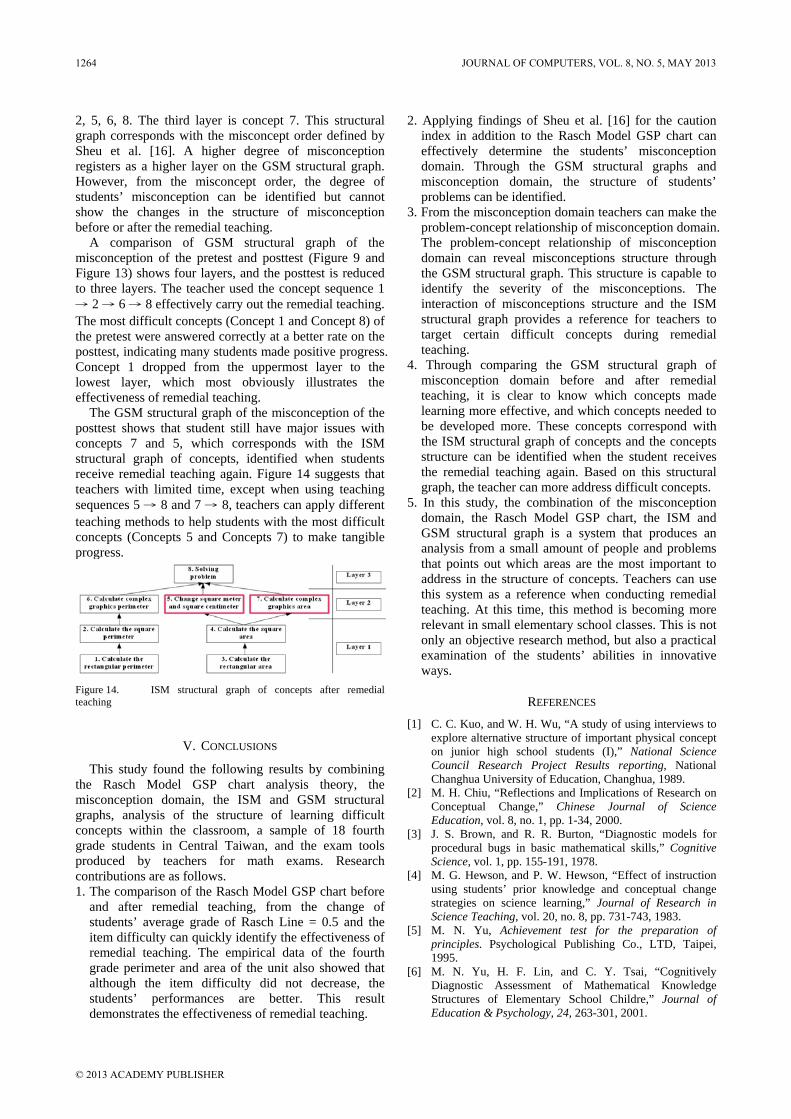
Figure 11. Students’ misconception domain of the posttest
1: Calculate the rectangular perimeter
2: Calculate the square perimeter
3: Calculate the rectangular area
4: Calculate the square area
5: Change square meter and square centimeter
6: Calculate complex graphics perimeter
7: Calculate complex graphics area
8: Solving problem
1262 JOURNAL OF COMPUTERS, VOL. 8, NO. 5, MAY 2013
© 2013 ACADEMY PUBLISHER

Similarly, the researcher analyzed conceptions based on students’ misconception domains (The intersection of students and problems of misconception domain) defined by Sheu, et al. after remedial teaching [32]. Students’ misconception domain is defined as the intersection of students and problems of misconception domain (Figure 11 green blocks). Students of misconception domain: From Figure 6, the results of the posttest showed that 61.5% of students were below the Rasch Line = 0.5 on the posttest, and 18 × 61.5% = 11.07, thus eleven students were selected with a Gamma value from 0.00 to 0.40. After deducting the student whose CS value is greater than 0.75 (Student 15), finally only ten students are taken and the Gamma value is from 0.00 to 0.39 (Figure 11 pink blocks). Problems of misconception domain: From Figure 6, there are 58.5% of problems were below the Rasch Line = 0.5 on the posttest, and 14 × 58.5% = 8.19, thus eight problems were selected with a Gamma value from 0.00 to 0.37. After deducting the problem whose CP value is greater than 0.75 (Problem 1), finally only eleven problems are taken and the Gamma value is from 0.00 to 0.37 (Figure 11 blue blocks).
Figure 11 shows the students’ misconception domain according to the posttest. From the misconception domain we find that students 2, 3, 6, 10, 18, 1, 14, 7, 13, 17 fallen into the misconception domain even after the remedial teaching. After remedial teaching, some of the students’ concepts still experience many misconceptions. These concepts were included in problems 13, 6, 10, 4, 12, 14, 11.
The structure of students of misconception domain can be mapped out using the GSM structural graph (Figure 12). From the GSM structural graph of the students, we can divide students of misconception into five layers. The highest layers represent higher layers of ability (Student 2 and Student 10), and the lower layers represent lower layers of ability (Student 13 and Student 17).
Figure 12. GSM structural graph of students of misconception of
the posttest
Upon comparison of structural graphs of the pretest and posttests, Student 16 has improved after taking the remedial teaching. In the analysis of the posttest, that student departed from the misconception domain. Student 3 fell originally tested out of the misconception domain for the pretest, but appears to have fallen into the
misconception upon review of the posttest results. The student’s conception is still not clear in this unit, which is why the student regressed according to the posttest results. Students 1, 2, 6, 7, 10, 13, 14, 17, and 18 remained inside the misconception domain before and after the remedial teaching. These nine students performed the worst in their class. Student 13 and Student 17 regressed from the pretest to the posttest, testing into the lowest layer of the structure of students of misconception. Moreover, six students, students 1, 2, 6, 10, 14, and 18, made incremental progress between tests. Even though these students still tested into the misconception domain, they were able to produce better results from the posttest. Therefore, further work with the remedial teaching is recommended.
Similarly, the problems of misconception domain corresponds to its concept and combined with Sheu et al. [16], pointed out the misconcept order and made the problem-concept relationship of misconception domain of the posttest (TABLE XI).The structural graph of misconception of the posttest on Table 11 used the GSM structural analysis to produce the matrix arrangement, calculated by the Matlab software (Figure 13).
TABLE XI. PROBLEM-CONCEPT RELATIONSHIP OF MISCONCEPTION DOMAIN OF THE
POSTTEST
Problem\Concept 1 2 3 4 5 6 7 84 0 0 0 0 1 0 0 06 0 1 0 0 0 0 0 010 0 0 0 0 0 0 1 011 0 0 0 0 0 0 1 012 0 0 0 0 0 1 0 013 0 0 0 0 0 0 1 014 0 0 0 0 0 0 0 1
Sum 0 1 0 0 1 1 3 1Misconcept Rate 0 0.33 0 0 0.33 0.33 1 0.33
Misconcept Order 3 2 3 3 2 2 1 2
Figure 13. GSM structural graph of the misconception of the
posttest
From Figure 13, we can see that the GSM structural graph of students’ misconception has three layers. The lowest layers represent concepts that appear the least amount of times; the uppermost layers represent concepts that have appeared more times in the misconception domain. In ascending order, concepts 1, 3, and 4 are in the first layer. The concepts of second layer are concepts
1: Calculate the rectangular perimeter
2: Calculate the square perimeter
3: Calculate the rectangular area
4: Calculate the square area
5: Change square meter and square centimeter
6: Calculate complex graphics perimeter
7: Calculate complex graphics area
8: Solving problem These numbers
represent students
JOURNAL OF COMPUTERS, VOL. 8, NO. 5, MAY 2013 1263
© 2013 ACADEMY PUBLISHER
2, 5, 6, 8. The third layer is concept 7. This structural graph corresponds with the misconcept order defined by Sheu et al. [16]. A higher degree of misconception registers as a higher layer on the GSM structural graph. However, from the misconcept order, the degree of students’ misconception can be identified but cannot show the changes in the structure of misconception before or after the remedial teaching.
A comparison of GSM structural graph of the misconception of the pretest and posttest (Figure 9 and Figure 13) shows four layers, and the posttest is reduced to three layers. The teacher used the concept sequence 1 → 2 → 6 → 8 effectively carry out the remedial teaching. The most difficult concepts (Concept 1 and Concept 8) of the pretest were answered correctly at a better rate on the posttest, indicating many students made positive progress. Concept 1 dropped from the uppermost layer to the lowest layer, which most obviously illustrates the effectiveness of remedial teaching.
The GSM structural graph of the misconception of the posttest shows that student still have major issues with concepts 7 and 5, which corresponds with the ISM structural graph of concepts, identified when students receive remedial teaching again. Figure 14 suggests that teachers with limited time, except when using teaching sequences 5 → 8 and 7 → 8, teachers can apply different teaching methods to help students with the most difficult concepts (Concepts 5 and Concepts 7) to make tangible progress.
Figure 14. ISM structural graph of concepts after remedial teaching
V. CONCLUSIONS
This study found the following results by combining the Rasch Model GSP chart analysis theory, the misconception domain, the ISM and GSM structural graphs, analysis of the structure of learning difficult concepts within the classroom, a sample of 18 fourth grade students in Central Taiwan, and the exam tools produced by teachers for math exams. Research contributions are as follows. 1. The comparison of the Rasch Model GSP chart before
and after remedial teaching, from the change of students’ average grade of Rasch Line = 0.5 and the item difficulty can quickly identify the effectiveness of remedial teaching. The empirical data of the fourth grade perimeter and area of the unit also showed that although the item difficulty did not decrease, the students’ performances are better. This result demonstrates the effectiveness of remedial teaching.
2. Applying findings of Sheu et al. [16] for the caution index in addition to the Rasch Model GSP chart can effectively determine the students’ misconception domain. Through the GSM structural graphs and misconception domain, the structure of students’ problems can be identified.
3. From the misconception domain teachers can make the problem-concept relationship of misconception domain. The problem-concept relationship of misconception domain can reveal misconceptions structure through the GSM structural graph. This structure is capable to identify the severity of the misconceptions. The interaction of misconceptions structure and the ISM structural graph provides a reference for teachers to target certain difficult concepts during remedial teaching.
4. Through comparing the GSM structural graph of misconception domain before and after remedial teaching, it is clear to know which concepts made learning more effective, and which concepts needed to be developed more. These concepts correspond with the ISM structural graph of concepts and the concepts structure can be identified when the student receives the remedial teaching again. Based on this structural graph, the teacher can more address difficult concepts.
5. In this study, the combination of the misconception domain, the Rasch Model GSP chart, the ISM and GSM structural graph is a system that produces an analysis from a small amount of people and problems that points out which areas are the most important to address in the structure of concepts. Teachers can use this system as a reference when conducting remedial teaching. At this time, this method is becoming more relevant in small elementary school classes. This is not only an objective research method, but also a practical examination of the students’ abilities in innovative ways.
REFERENCES
[1] C. C. Kuo, and W. H. Wu, “A study of using interviews to explore alternative structure of important physical concept on junior high school students (I),” National Science Council Research Project Results reporting, National Changhua University of Education, Changhua, 1989.
[2] M. H. Chiu, “Reflections and Implications of Research on Conceptual Change,” Chinese Journal of Science Education, vol. 8, no. 1, pp. 1-34, 2000.
[3] J. S. Brown, and R. R. Burton, “Diagnostic models for procedural bugs in basic mathematical skills,” Cognitive Science, vol. 1, pp. 155-191, 1978.
[4] M. G. Hewson, and P. W. Hewson, “Effect of instruction using students’ prior knowledge and conceptual change strategies on science learning,” Journal of Research in Science Teaching, vol. 20, no. 8, pp. 731-743, 1983.
[5] M. N. Yu, Achievement test for the preparation of principles. Psychological Publishing Co., LTD, Taipei, 1995.
[6] M. N. Yu, H. F. Lin, and C. Y. Tsai, “Cognitively Diagnostic Assessment of Mathematical Knowledge Structures of Elementary School Childre,” Journal of Education & Psychology, 24, 263-301, 2001.
1264 JOURNAL OF COMPUTERS, VOL. 8, NO. 5, MAY 2013
© 2013 ACADEMY PUBLISHER
[7] Ministry of Education, Grade 1-9 Curriculum Guidelines. Ministry of Education, Taipei, 2003.
[8] D. Kerslake, Fractions: Children’s strategies and errors. A report of the strategies and errors in secondary mathematics project, Windsor, England: NFER-NEL-SON, 1987.
[9] F. L. Lin, Understanding of the deep structure of the ratio concept Ⅱ: Understanding of complex ratio and nonlinear ratio on senior high school students (NSC-79-0111-S-003-13A). National Science Council, Taipei, 1990.
[10] A. W. Bell, “Some experiments in diagnostic teaching,” Educational Studies in Mathematics, vol. 24, no. 1, pp. 115-137, 1993.
[11] C. Y. Chen, “The Influence of Teaching Confrontation Style on Key Concepts of Elementary School Students,” Bulletin of Educational Psychology, vol. 36, no. 4, pp. 375-393, 2005.
[12] D. C. Yang, and S. M. Hung, “The Study of Remedial Instruction on Fraction,” Journal of Educational Research and Development, vol. 4, no. 2, pp. 85-118, 2008.
[13] S. C. Wen, “A Study of Integrated Diagnostic Teaching on Fractions for Elementary Fifth-Grade Students," Chinese Journal of Science Education, vol. 19, no. 5, pp. 383-408, 2011.
[14] Lee, C. C., & Hu, S. C. (2009). An On-Line Assessment and Misconception Correction Tool for Students Learning Fundamental Mathematics. Journal of National Taichung University: Mathematics, Science & Technology, 23(1), 1-28.
[15] H. K. Tsai, C. C. Chen, and H. P. Chang, “A Study of the Relationship between High School Students' Force Diagrams and Equation Representations in Problem Solving,” Chinese Journal of Science Education, 18(2), 155-175, 2010.
[16] T. W. Sheu, J. W. Tzeng, C. P. Tsai, and T. L. Chen, “Applying Problem-Concept Chart Combined with Structural Analysis to Investigate the Learning Misconcept-Simple Equation with One Variable for Example,” Journal of Grey System, vol. 15, no. 1, pp. 55-66, 2012.
[17] J. N. Warfield, Societal systems planning, policy and complexity, New York: Wiley, 1976.
[18] J. N. Warfield, Interpretive structural modeling (ISM) Group Planning & Problem Solving Methods in Engineering, New York: Wiley, 1982.
[19] L. Huang, J. Yu, and X. Huang, “Modeling Agricultural Logistics Distribution Center Location Based on ISM" Journal of Software, vol. 7, no. 3, pp. 638-643, 2012.
[20] Tsai, P. Y., & Chung, C. J. (2003). The Study of Applying Interpretive Structural Modeling in Instructional Structural Design. Educational Research & Information, 11(2), 1-40.
[21] T. W. Sheu, W. L. Liu, C. P. Tsai, J. C. Liang, T. L. Chen, and M. Nagai, Evaluating and Judging Learning Difficulties of the Course Content in Precalculus for College Students, Paper presented at 2012 International Symposium on Education and Psychology, SkyCity Marriott Hotel, Hong Kong, March 30-April 1 2012.
[22] T. Sato, “A method of analyzing data gathered by the Response Analyzer for diagnosis of student performance and the quality of instructional sequence,” Proceedings of IECE of Japan annual conference, S12-1, 1969.
[23] T. E. Dinero, and S. L. Blixt, “Information about Tests from Sato's S-P Chart,” College Teaching, vol. 36, no. 3, pp. 123-128, 1988.
[24] D. J. Chen, A. F. Lai, and I. C. Liu, “The Design and Implementation of a Diagnostic Test System based on the
Enhanced S-P Model,” Journal of Information Science and Engineering, vol. 21, pp. 1007-1030, 2005.
[25] Y. H. Lin, and S. M. Chen, ”The Integrated Analysis of S-P Chart and Ordering Theory on Equality Axiom Concepts Test for Sixth Graders,” WSEAS TRANSACTIONS ON MATHEMATICS, 5(12), 1303-1308, 2006.
[26] Y. H. Lin, and S. M. Chen, “The Investigation of S-P Chart Analysis on the Test Evaluations of Equality Axiom Concepts for Sixth Graders,” Proceedings of the 2nd WSEAS/IASME International Conference on Educational Technologies, Bucharest, Romania, October 16-17, 2006.
[27] Y. C. Ho, (1989). “An Experimental Study of the Effects of Mastery Learning Combined with the Diagnosis of Microcomputerized S-P Chart Analysis on Students' Learning,” Bulletin of Educational Psychology, vol. 22, pp. 191-214, 1989.
[28] S. C. Yu, and M. N. Yu,. “The Relationships among Indices of Diagnostic Assessments of Knowledge Structures and S-P Chart Analysis,” Journal of Education & Psychology, vol. 29, no. 1, pp. 183-208, 2006.
[29] T. Sato, and M. Kurata, “Basic S-P Score Table Characteristics,” NEC Research and Development, vol. 47, pp. 64-71, 1977.
[30] Yu, M. N. (2002). Educational testing and assessment - achievement test and teaching assessment. Psychological Publishing Co., LTD, Taipei.
[31] Yu, M. N. (2009). Item Response Theory and its Application. Psychological Publishing Co., LTD, Taipei.
[32] T. W. Sheu, T. L. Chen, C. P. Tsai, J. W. Tzeng, W. L. Liu, and M. Nagai, “A Study Of Combining Caution Index And GSP Chart To Identify The Misconception Domain,” Paper presented at 2012 Conference: Research & Development in Technology Education, National Kaohsiung Normal University, Kaohsiung, April 2012.
[33] C. Zhao, Y. Zhao, Y. Li, and L. Luo, “Fractional Correlation Distance Method on Course Evaluation" Journal of Software, vol. 6, no. 10, pp. 2016-2022, 2011.
[34] S. Gao, Z. Zhang, and C. Cao, “Road Traffic Freight Volume Forecast Using Support Vector Machine Combining Forecasting" Journal of Software, vol. 6, no. 9, pp. 1680-1687, 2011.
[35] C. Zhu, Q. Luan, Z. Hao, and Q. Ju, “Integration of Grey with Neural Network Model and Its Application in Data Mining" Journal of Software, vol. 6, no. 4, pp. 716-723, 2011.
[36] K. L. Wen, C. S. K. Chang, C. K. Yeh, C. W. Wang, and H. S. Lin, Apply MATLAB in Grey System Theory. Chuan Hwa Publishing Ltd., Taipei, 2006.
[37] K. L. Wen, C. S. Chou, H. C. Chang, X. Y. Chen, and H. C. Wen, Grey system and applications. Wu-Nan Book Inc. Taipei, 2009.
[38] D. Yamaguchi, G. D. Li, and M. Nagai, “New Grey Relational Analysis for Finding the Invariable Structure and Its Applications,” Journal of Grey System, vol. 8, no. 2, pp. 167-178, 2005.
[39] D. Yamaguchi, G. D. Li, and M. Nagai, “Verification of Effectiveness for Grey Relational Analysis Models,” Journal of Grey System, vol. 10, no. 3, pp. 169-181, 2007.
[40] T. W. Sheu, J. C. Liang, B. T. Wang, J. W. Tzeng, and M. “Nagai, Educational evaluation identification on professional industrial-design product modeling course. The 1st Academic Conference of Innovation and Application on Design, pp. 12-20, 2010.
[41] T. W. Sheu, J. C. Liang, B. T. Wang, J. W. Tzeng, and M. Nagai, “Evaluating and judging learning difficulties of the course content in professional product design,” The 15th
JOURNAL OF COMPUTERS, VOL. 8, NO. 5, MAY 2013 1265
© 2013 ACADEMY PUBLISHER
Conference on Grey System Theory and Applications, pp. A83-A92, 2010.
[42] J. C. Liang, “A study of combing Gray relational analysis method, GSP chart and GSM to identify model-making course” Ling Tung Journal, vol. 8, no. 1, pp. 1-34, 2011.
[43] T. W. Sheu, B. T. Wang, J. C. Liang, J. W. Tzeng, and M. Nagai, “Applying grey S-P chart to analyze the English listening performances among college students,” The 15th Conference on Grey System Theory and Applications, pp. A107-A114, Changhua, Taiwan, 2010.
[44] T. W. Sheu, J. W. Tzeng, C. P. Tsai, T. L. Chen, and M. Nagai, The Study on Using GSP Chart and ISM to Identify Learning Difficulties of Junior High School Linear Equation in One Variable, Paper presented at 2012 International Conference on Advanced Information Technologies and The Second National Conference on Web Intelligence and Applications, Chaoyang University of Technology, Taichung, April 2012.
[45] T. W. Sheu, J. W. Tzeng, C. P. Tsai, T. L. Chen, and M. Nagai, Combining Misconcept Order With Structural Analysis To Investigate The Learning Misconcept: An Example Of Simple Equation With One Variable, Paper presented at 2012 Conference: Research & Development in Technology Education, National Kaohsiung Normal University, Kaohsiung, April 2012.
[46] T. W. Sheu, J. W. Tzeng, C. P. Tsai, T. L. Chen, and M. Nagai, The Discussion of Item-Concept Chart on Identifying Learning Concept - Using Junior High School Linear Equation in One Variable as An Example, Paper presented at International Conference of Reflections on the Internationalization of Education, National Chi Nan University, Nantou, April 2012.
Tian-Wei Sheu received the Ph.D. degree in Mathematics from National Osaka University, Japan in 1990. He is the Dean of College of Education and a professor of Graduate Institute of Educational Measurement and Statistics, National Taichung University of Education, Taichung, Taiwan. His studies focus in IRT,
Educational Measurement, and e-Learning, etc. He is the director of TKIA (Taiwan Kansei Information Association).
Tzu-Liang Chen received her master degree in the Department of Mathematics Education at National Taichung University of Education in 2010. She is an elementary school teacher now. She is a Ph.D student in Graduate Institute of Educational Measurement and Statistics, National Taichung University of Education,
Taiwan now. Her research interests include grey system theory and mathematics education.
Jian-Wei Tzeng received his Master’s degree in Graduate Institute of e-Learning, National Changhua University of Education in 2008. He is the Ph.D candidate in Graduate Institute of Educational Measurement and Statistics, National Taichung University of Education, Taiwan now. His research interests include grey
system theory, design and evaluation of digital materials.
Ching-Pin Tsai received his Master’s degree in Department of Applied Mathematics, National Chiao Tung University of Taiwan in 1996. He is a Mathematics Teacher in Changhua County Hsiu Shui Junior High School, Taiwan now. He is also a Ph.D Student in Graduate Institute of Educational
Measurement and Statistics, National Taichung University of Education, Taiwan now. His research interests include numerical analysis, grey system theory, research of action teaching, mathematics education and chaotic behavior of electron tunneling.
Masatake Nagai received his Master’s degree in Engineering from Toukai University of Japan in 1969.He worked in Oki Electric Industry Co., Ltd. for 18 years and was mainly engaged in the design development of ME systems, communication network systems, OA systems, etc. He was also a researcher (Dr. Matsuo research) at the Tohoku
University while working toward his PhD in Engineering. From 1989, he worked at the Teikyo University Department of Science and Engineering as an assistant professor and eventually as an engineering professor. Chair professor in Graduate Institute of Educational Measurement and Statistics, National Taichung University, Taiwan now. His research interests include approximation, strategy system engineering, information communication network technology, agent, kansei information processing, grey system theory and engineering application. A regular of IEICE member.
1266 JOURNAL OF COMPUTERS, VOL. 8, NO. 5, MAY 2013
© 2013 ACADEMY PUBLISHER
Related Documents