Hart Energy Consulting 1616 S. Voss, Suite 1000 Houston, Texas 77057, USA Terrence Higgins Executive Director, Refining & Special Studies Hart Energy Consulting +1.703.891.4815 [email protected] Submitted by: Hart Energy Consulting Relative CO 2 Savings Comparing Ethanol and ETBE as a Gasoline Component • All rights reserved • Hart Energy Consulting www.hartenergy.com Study on Relative CO 2 Savings Comparing Ethanol and ETBE as a Gasoline Component Study on Relative CO 2 Savings Comparing Ethanol and ETBE as a Gasoline Component

Welcome message from author
This document is posted to help you gain knowledge. Please leave a comment to let me know what you think about it! Share it to your friends and learn new things together.
Transcript

Hart Energy Consulting1616 S. Voss, Suite 1000Houston, Texas 77057, USA
Terrence HigginsExecutive Director, Refining & Special StudiesHart Energy [email protected]
Submitted by:
Hart Energy Consulting
Relative CO2 Savings Comparing Ethanol and ETBE as a Gasoline Component • All rights reserved • Hart Energy Consulting www.hartenergy.com
Study on Relative CO2 SavingsComparing Ethanol and ETBE
as a Gasoline Component
Study on Relative CO2 SavingsComparing Ethanol and ETBE
as a Gasoline Component

Relative CO2 Savings Ethanol Vs. ETBE July 2007 Final Draft R02
© Copyright by Hart Energy Consulting
Page 1 of 30
Table of Contents
I. Executive Summary ................................................................................................................ 4
A. Background and Objectives ................................................................................................ 4
B. Summary of Results............................................................................................................ 4
II. Study Approach, Assumptions and Base Case ....................................................................... 6
A. Overview............................................................................................................................. 6
B. Assumptions........................................................................................................................ 7
C. Base Case ............................................................................................................................ 8
III. Ethanol and ETBE Case Supply, Demand and Model Results......................................... 12
VI. CO2 Impacts ...................................................................................................................... 23

Relative CO2 Savings Ethanol Vs. ETBE July 2007 Final Draft R02
© Copyright by Hart Energy Consulting
Page 2 of 30
Tables Table II.1: Western Europe Refined Product Demand: 2006-2010................................................ 8
Table II.2: Western Europe Refining Input/Output: 2010.............................................................. 9
Table II.3: Western Europe Refining Input: 2010 .......................................................................... 9
Table II.4: Base Case MTBE Purchases, Production and Blending ............................................... 9
Table II.5: Western Europe Refining Output: 2010...................................................................... 10
Table II.6: Base Case Gasoline Qualities ..................................................................................... 10
Table II.7: Base Case Gasoline Blend Composition..................................................................... 11
Table III.1: Gasoline Component Purchases, Production and Blending: Ethanol Cases.............. 12
Table III.2: Refinery Input: Ethanol Cases ................................................................................... 13
Table III.3: Refinery Output: Ethanol Cases ................................................................................ 13
Table III.4: Gasoline Energy Content: Ethanol Cases .................................................................. 14
Table III.5: Gasoline Qualities: Ethanol Cases............................................................................. 15
Table III.6: Gasoline Blend Composition: Ethanol Cases ............................................................ 16
Table III.7: Refinery Capacity Utilization: Ethanol Cases ........................................................... 17
Table III.8: Gasoline Component Purchases, Production and Blending: ETBE cases................ 18
Table III.9: Refinery Input: ETBE Cases .................................................................................... 19
Table III.10: Refinery Output: ETBE Cases................................................................................. 19
Table III.11: Gasoline Energy Content: ETBE Cases .................................................................. 20
Table III.12: Gasoline Qualities: ETBE Cases ............................................................................. 20
Table III.13: Gasoline Blend Composition: ETBE Cases ............................................................ 21
Table III.14: Refinery Capacity Utilization: ETBE Cases............................................................ 22
Table IV.1: Gasoline, Refinery Fuel and H2 Production CO2 Emissions: Ethanol Cases ........... 24
Table IV.2: Gasoline, Refinery Fuel and H2 Production CO2 Emissions: ETBE Cases .............. 24
Table IV.3: Merchant Plant Fuel and Byproduct-Related CO2 Emissions: Ethanol Cases .......... 25
Table IV.4: Merchant Plant Fuel and Byproduct-Related CO2 Emissions: ETBE Cases ............ 25
Table IV.5: Summary CO2 Emissions: Ethanol Cases ................................................................. 26
Table IV.6: Summary CO2 Emissions: ETBE Cases.................................................................... 26

Relative CO2 Savings Ethanol Vs. ETBE July 2007 Final Draft R02
© Copyright by Hart Energy Consulting
Page 3 of 30
Figures
Figure I.1: Reduction in CO2 Emissions Relative to 2010 Base Case 6 Figure IV.1: CO2 Emissions vs. Base Case Ethanol and ETBE Cases 27

Relative CO2 Savings Ethanol Vs. ETBE July 2007 Final Draft R02
© Copyright by Hart Energy Consulting
Page 4 of 30
STUDY ON RELATIVE CO2 SAVINGS COMPARING ETHANOL AND ETBE AS A GASOLINE COMPONENT
I. Executive Summary
A. Background and Objectives Introduction of ethanol into the gasoline market will impact the processing and blending of gasoline at refineries with associated changes in operating severities, fuel consumption, product slate and product carbon. The means of introducing ethanol into gasoline, i.e., direct blend or via ETBE, will also impact the refining and blending process and resulting CO2 effects. A number of studies have been conducted to address the issue of CO2 savings potential through the use of biofuels. Studies for the most part have focused on the CO2 impacts from the production and market use of biofuels. Studies have not addressed direct blending of ethanol or the use of ETBE and the resulting CO2 generation. These latter impacts warrant review in view of growing biofuel penetration and interest in low carbon fuels. The objective of this study was to quantify the impacts of ethanol blending on CO2 emissions from the refining and gasoline blending process. The study quantified CO2 emissions from gasoline blended with ethanol and blended with ETBE, and quantified the changes in CO2 emissions from the refinery and merchant ether plant fuel consumption. The analysis provided a relative comparison of CO2 savings between ethanol and ETBE blending for the same quantity of ethanol.
B. Summary of Results Gasoline Manufacturing and Blending
• A Base Case 2010 was established that included 4.4 million tons/year of MTBE
available for gasoline blending in Europe. Replacing the MTBE with 5.5 million tons/year ethanol (5% of EU gasoline demand), results in a small net change in refinery processing and gasoline blending operations. Crude oil requirements and refined product output are projected to undergo little change from the base case.
• The ethanol replacement case requires less refinery fuel due to the ethanol volume and octane contribution. The ethanol case also results in gasoline compositional changes. Both of these changes result in reduced CO2 emissions.
• Replacing the ethanol with 12.1 million tons of ETBE (the ethanol mole equivalent of 5% ethanol) reduces refinery crude oil requirements and processing intensity. The ETBE case requires less refinery fuel than the base case or the ethanol case.
• The ETBE replacement case also results in large gasoline compositional changes that reduce the gasoline carbon factor and results in CO2 emissions reductions.
• The ETBE case yields less refinery coke, which is assumed to be replaced by coal, with a small reduction in CO2 emissions.

Relative CO2 Savings Ethanol Vs. ETBE July 2007 Final Draft R02
© Copyright by Hart Energy Consulting
Page 5 of 30
• Additional ethanol cases were examined with alternate assumptions with regard to MTBE production (for export) and isooctene production. ETBE cases were also run with alternate assumptions regarding the amount of ethanol converted to ETBE. The net CO2 savings for the initial ethanol and ETBE cases and the alternate ethanol cases are shown in figure I.1.
Figure I.1: Reduction in CO2 Emissions Relative to 2010 Base Case
Thousand Tons/Year
0500
10001500200025003000350040004500
Ethanol +MTBEExport
Ethanol +Isooctane
ETBE w/Exist Cap
ETBE AvailIc4e
ETBE IncrIc4e
need source
• Replacing the MTBE with direct blended ethanol results in a reduction of 0.2 million
tons per year of CO2 emissions. Converting all the ethanol to ETBE results in a CO2 reduction of 4.4 million tons per year.
• The CO2 reduction will be impacted by alternative strategies of ethanol addition such as the volume of ethanol converted to ETBE, disposition of current MTBE production and production of isooctene. The net CO2 savings for various direct blend ethanol and ETBE cases are shown in figure I.1.

Relative CO2 Savings Ethanol Vs. ETBE July 2007 Final Draft R02
© Copyright by Hart Energy Consulting
Page 6 of 30
II. Study Approach, Assumptions and Base Case
A. Overview
The impacts of ethanol and ETBE blending on CO2 emissions were addressed with a refinery model utilized to simulate in detail Western Europe refinery processing and blending operations. The model characterized refinery processing and blending requirements for the 2010 Western European refined products market. Model results determined crude oil requirements, refined product production, processing operations, fuel consumption and product carbon content. The output of the refinery model simulations provided the basis for evaluating the impact of ethanol and ETBE on CO2 emissions. Emission changes were quantified by analyzing:
• changes in gasoline carbon content, • changes in gasoline volume (required to maintain equivalent gasoline energy between
cases), • changes in carbon content and volume of other refined products, • changes in byproduct production and disposition, • changes in refinery fuel consumption and composition (carbon content), • changes in hydrogen production, and • changes in fuel consumed for the production of merchant ethers.
A base case model was developed representing Western Europe refining and refined products market for 2010. The base case Western Europe model and market were defined as that representing the EU25 along with Iceland, Norway and Switzerland. Refinery capacities were established at levels representative of 2010. In the base case, refinery and merchant MTBE/ETBE capacity was assumed to produce MTBE. No ethanol, direct blend or via ETBE was used. Need to delete “via” or reword to make sense A series of ethanol cases were run with 5 vol% ethanol made available for gasoline blending. No MTBE or ETBE blending in EU gasoline was assumed in the ethanol cases. The initial ethanol case assumed that refinery MTBE facilities were shut down and merchant MTBE plants produce at the base case level (of refinery purchases) and export the MTBE product. Alternate ethanol cases were run with varying assumptions for merchant and refinery MTBE and/or isooctene production as follows.
• Base Ethanol Case with 5% ethanol available, no ether produced by refineries, merchant MTBE production at the base case level, and merchant ether production exported;
• Ethanol 2 Case with 5% ethanol available, refinery MTBE at the base case level, merchant MTBE production at the base case level, refinery MTBE production made available for blending in non-U.S. gasoline exports, and merchant ether production and the remaining refinery MTBE production exported;
• Ethanol 3 Case with 5% ethanol available, isooctene produced in refinery ether plants, and isooctene produced in converted merchant MTBE plants and made available for refinery gasoline blending.

Relative CO2 Savings Ethanol Vs. ETBE July 2007 Final Draft R02
© Copyright by Hart Energy Consulting
Page 7 of 30
A second series of ETBE cases were run with the same volume of ethanol available as in the ethanol cases and with the option of converting all or a portion of the ethanol to ETBE. The initial ETBE case assumed that all of the available ethanol was converted to ETBE. Alternate ETBE cases were then run with varying assumptions for capacity and conversion of ethanol to ETBE, defined as follows.
• Base ETBE Case with 5% ethanol available and all converted to ETBE, refinery MTBE production switched to ETBE and merchant plants converting the remaining ethanol available to ETBE;
• ETBE 2 Case with 5% ethanol available, available refinery and merchant isobutylene converted to ETBE, remaining ethanol available blended directly to gasoline;
• ETBE 3 Case with 5% ethanol available, existing refinery and merchant ether capacity utilized for ETBE production and remaining ethanol blended directly to gasoline.
The ethanol and ETBE cases held petrol and other major refinery products constant (on an energy equivalent basis). Liquefied petroleum gas (LPG) and refinery coke were allowed to vary as needed by refining simulations and model economics. Assumptions utilized for the study and the base case parameters and simulation results are presented under B and C of this Section. The component supply and demand and model results for the ethanol and ETBE cases are then summarized in section III. The CO2 impacts for these cases are presented in section IV.
B. Assumptions Major assumptions utilized for the study include:
• The study time frame focused on 2010. • Crude volume was permitted to vary. The base crude mix was representative of
crude processed in Europe and variations in crude were represented by incremental Urals crude.
• All oxygenate was assumed to be smart blended, i.e., final gasoline blends after oxygenate addition met finished gasoline specifications.
• A 60 Kpa gasoline was produced with no ethanol waiver. • Ethanol blending of 5 vol% was used. • European gasoline consisted of two grades (98 RON and 95 RON) with the 98
RON making up about 6% of the pool. • Gasoline export levels were set at estimated 2010 levels with U.S. exports oxygen
free and other exports allowed to use MTBE in cases where MTBE was produced. • The U.S. reformulated gasoline (RFG) exports were produced for final ethanol
addition in the U.S. A portion of U.S. conventional gasoline export was produced for ethanol addition and the remainder was finished conventional gasoline.
• No expansion of refinery capacity was allowed with the exception of alkylation capacity. Alkylation capacity was allowed to expand up to 5% in the base ethanol case, with a capital charge incurred for any expansion.

Relative CO2 Savings Ethanol Vs. ETBE July 2007 Final Draft R02
© Copyright by Hart Energy Consulting
Page 8 of 30
• Gasoline CO2 emissions were calculated as the product of gasoline carbon factor
and the CO2/carbon weight ratio (details are provided in Appendix 1). • Jet fuel and diesel CO2 changes were calculated in a similar fashion as discussed
in appendix 1. • Gasoline, jet fuel and diesel energy content was tracked and the models produced
a constant energy equivalent volume of these products between cases (details are provided in Appendix 1).
C. Base Case Table II.1 provides a projection of Western Europe refined product demand, showing demand trends between 2006 and 2010. Gasoline demand will continue to decline, falling by over 6% between 2006 and 2010. Much of the decline will be the result of further dieselization of the automotive fleet. Diesel demand will increase by 13%. Jet fuel will also grow by about 13%. There will be little change in other products.
Table II.1: Western Europe Refined Product Demand: 2006-2010 Million Tons/Year
2006 2010 Gasoline 111 104 Naphtha 46 48 Jet Fuel/Kerosene 55 61 Diesel 186 211 Other Distillate 110 97 Residual Fuel 94 93 LPG 23 23 Other 76 77 Total 698 716
Source: Hart analysis based on International Energy Agency (IEA) data Table II.2 presents the 2010 refined product supply and demand, showing imports and the amount of refined product demanded from refineries. Surplus gasoline will be produced, most of which will be exported to the U.S. The base case refinery input is summarized in table II.3, and an MTBE purchase, production and blending balance is provided in table II.4. Refinery output is summarized in table II.5.

Relative CO2 Savings Ethanol Vs. ETBE July 2007 Final Draft R02
© Copyright by Hart Energy Consulting
Page 9 of 30
Table II.2: Western Europe Refining Input/Output: 2010 Million Tons/Year
Demand Imports Refinery
Production Gasoline 104 -32 136 Naphtha 48 8 40 Jet Fuel/Kerosene 61 11 50 Diesel 211 23 188 Other Distillate 97 5 92 Residual Fuel 93 -3 96 LPG 23 23 Other 77 77 Source: Hart analysis based on International Energy Agency (IEA) data
Table II.3: Western Europe Refining Input: 2010
Million Tons/Year
Input Crude Oil Indigenous 176 API 37.3 % Sulfur 0.33 Imported 491 API 33.7 % Sulfur 1.21 Ethanol 0 MTBE 2.4 Methanol 0.7 Biodiesel 10.2 Gasoline Components 9.7 Other Unfinished Oils 10.9
Source: Hart analysis based on International Energy Agency (IEA) data
Table II.4: Base Case MTBE Purchases, Production and Blending Thousand Tons/Year
ThousandTons/Year Purchases Merchant MTBE 2450 Ethanol 0 Production MTBE 1990 Ethanol to ETBE 0 ETBE 0 Gasoline Blending MTBE 4440 Ethanol 0 ETBE 0
Source: Hart analysis based on International Energy Agency (IEA) data

Relative CO2 Savings Ethanol Vs. ETBE July 2007 Final Draft R02
© Copyright by Hart Energy Consulting
Page 10 of 30
Table II.5: Western Europe Refining Output: 2010
Million Tons/Year
Output
Gasoline 98 RON EU Grade 5.8 95 RON EU Grade 98.5 U.S. RFG Export 5.2 U.S. Conventional Export 18.3 Other Export 8.0 Naphtha 40.5 BTX Chemicals 10.9 Jet Fuel 49.9 Distillate Diesel 10 ppm 187.8 Other Distillate 92.4 Residual Fuel 96.2 Lube/Asphalt 24 MTBE(1) 2.0 TAME(1) 0.1
Note: (1) Refinery production for gasoline blending; included in gasoline production
Source: Hart analysis based on IEA data and model output
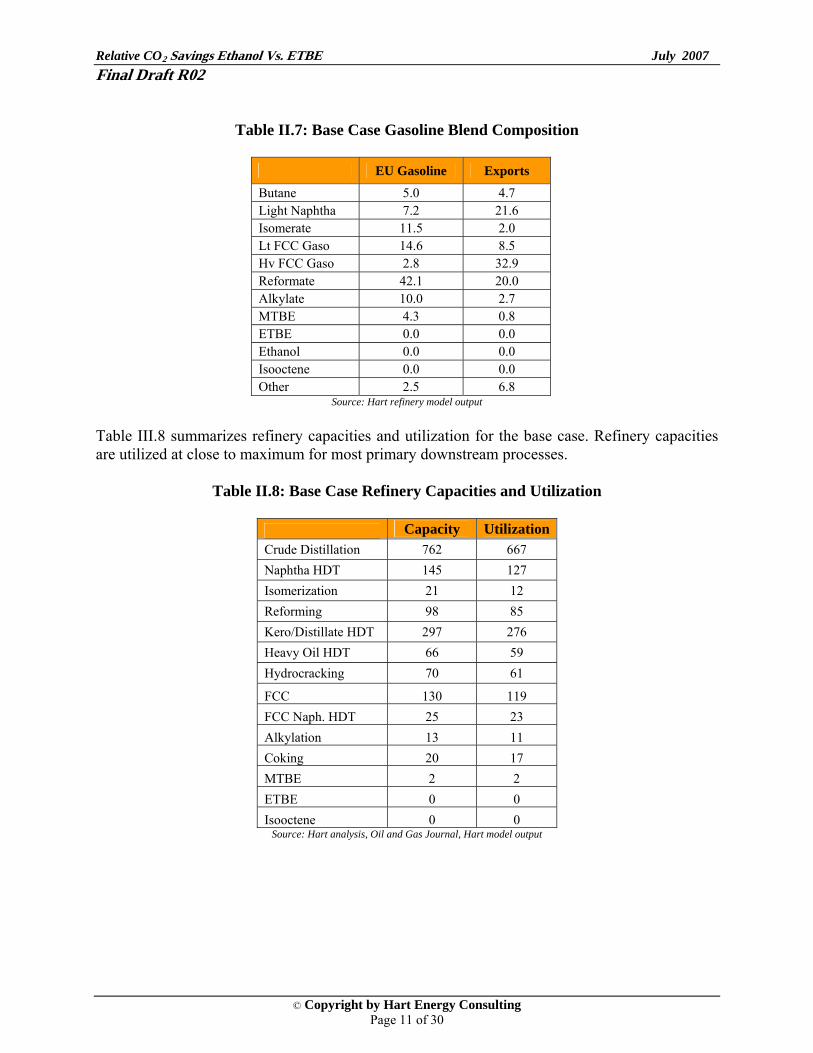
In the base case, 2,450 thousand tons per year of MTBE are produced from merchant ether plants and another 1,990 thousand tons per year are produced in the refinery. The total MTBE accounts for about 3% of the total gasoline production (EU gasoline plus exports). The MTBE blended into EU gasoline makes up about 4.3% of the EU gasoline. Gasoline qualities and blend compositions are provided in tables II.6 and II.7. The product qualities are at or close to the limits.
Table II.6: Base Case Gasoline Qualities
EU Gasoline Exports Specific Gravity 0.74 0.72 Sulfur (PPM) 10 10 RVP (Kpa) 60.0 60.0 Olefin (vol%) 6.5 15.0 Aromatics (vol%) 34.8 34.6 Benzene (vol%) 0.9 0.9 Research Octane 95.3 96.0 Motor Octane 85.9 86.3
Source: Hart refinery model output
Relative CO2 Savings Ethanol Vs. ETBE July 2007 Final Draft R02
© Copyright by Hart Energy Consulting
Page 11 of 30
Table II.7: Base Case Gasoline Blend Composition
EU Gasoline Exports
Butane 5.0 4.7 Light Naphtha 7.2 21.6 Isomerate 11.5 2.0 Lt FCC Gaso 14.6 8.5 Hv FCC Gaso 2.8 32.9 Reformate 42.1 20.0 Alkylate 10.0 2.7 MTBE 4.3 0.8 ETBE 0.0 0.0 Ethanol 0.0 0.0 Isooctene 0.0 0.0 Other 2.5 6.8
Source: Hart refinery model output
Table III.8 summarizes refinery capacities and utilization for the base case. Refinery capacities are utilized at close to maximum for most primary downstream processes.
Table II.8: Base Case Refinery Capacities and Utilization
Capacity UtilizationCrude Distillation 762 667 Naphtha HDT 145 127 Isomerization 21 12 Reforming 98 85 Kero/Distillate HDT 297 276 Heavy Oil HDT 66 59 Hydrocracking 70 61
FCC 130 119 FCC Naph. HDT 25 23 Alkylation 13 11 Coking 20 17 MTBE 2 2 ETBE 0 0 Isooctene 0 0
Source: Hart analysis, Oil and Gas Journal, Hart model output

Relative CO2 Savings Ethanol Vs. ETBE July 2007 Final Draft R02
© Copyright by Hart Energy Consulting
Page 12 of 30
III. Ethanol and ETBE Case Supply, Demand and Model Results Summary of Ethanol Cases The gasoline component supply and demand for the ethanol cases examined are summarized in table III.1. The table shows merchant ether, ethanol and isooctene production, refinery purchases, refinery production, components used in gasoline blending and the remaining volume exported. The base case and ethanol case definitions were provided in the previous section. Except for the ethanol 3 isooctane case, merchant MTBE production is held constant. In the base case the merchant MTBE is used for gasoline blending. In all other cases, merchant MTBE is assumed to be exported.
Table III.1: Gasoline Component Purchases, Production and Blending: Ethanol Cases Thousand Tons/Year
Base
Ethanol Base Case
Ethanol 2
Ethanol 3
Merchant Production MTBE 2450 2450 2450 0 Ethanol 0 5480 5480 5480 Ethanol to ETBE ETBE 0 0 0 0 Isooctene 0 0 0 1500 Purchases Merchant MTBE 2450 0 0 0 Ethanol 0 5480 5480 5480 Merchant ETBE 0 0 0 0 Isooctene 0 0 0 1500 Production MTBE 1990 0 1710 0 Ethanol to ETBE 0 0 0 0 ETBE 0 0 0 0 Isooctene 0 0 0 1090 Gasoline Blending MTBE 4440 0 870 0 Ethanol 0 5480 5480 5480 ETBE 0 0 0 0 Isooctene 0 0 0 2590 Exports Merchant MTBE 0 2450 2340 0 Refinery MTBE 0 0 840 0
Source: Hart analysis based on International Energy Agency (IEA) data Tables III.2 and III.3 summarize refinery input and output for the ethanol cases. Table III.3 also shows refinery ether and isooctene production and blending for each case.

Relative CO2 Savings Ethanol Vs. ETBE July 2007 Final Draft R02
© Copyright by Hart Energy Consulting
Page 13 of 30
Table III.2: Refinery Input: Ethanol Cases Million Tons/Year
Base
Ethanol Base Case
Ethanol 2
Ethanol 3
Crude Oil Indigenous 176 176 176 176 API 37.3 37.3 37.3 37.3 % Sulfur 0.33 0.33 0.33 0.33 Imported 491 491 491 490 API 33.7 33.7 33.7 33.7 % Sulfur 1.21 1.21 1.21 1.21 Ethanol 0 5.5 5.5 5.5 MTBE 2.4 0 0 0 ETBE 0 0 0 0 Isooctene 0 0 0 1.5 Methanol 0.7 0 0.7 0 Biodiesel 10.2 10.2 10.2 10.2 Gasoline Components 9.7 9.7 9.7 9.7 Other Unfinished Oils 10.9 10.9 10.9 10.9
Source: Hart analysis based on International Energy Agency (IEA) data
Table III.3: Refinery Output: Ethanol Cases Million Tons/Year
What does the superscript 1 in the highlight below refer to?
Base
Ethanol Base Case
Ethanol 2
Ethanol 3
Refinery Production/Sales Gasoline 98 RON EU Grade 5.8 5.9 5.9 5.9 95 RON EU Grade 98.7 99.9 998 99.7 U.S. RFG Export 5.2 5.2 5.2 5.2
U.S. Conventional Export 18.3 18.3 18.3 18.3
Other Export 8.0 8.0 8.0 8.0 Naphtha 40.5 40.5 40.5 40.5 BTX Chemicals 10.9 10.9 10.9 10.9 Jet Fuel 49.9 49.9 49.9 49.9 Distillate Diesel 10 ppm 187.8 187.8 187.8 187.8 Other Distillate 92.4 92.4 92.4 92.4 Residual Fuel 96.2 96.2 96.2 96.2 Lube/Asphalt 24 24 24 24 LPG 19 20 20 21 MTBE 0 0 0.9 0 Refinery Production/Blending1 MTBE 2.0 0 1.1 0 ETBE 0 0 0 0 Isooctene 0 0 0 1.3 TAME 0.1 0.1 0.1 0.1
Source: Hart analysis and Hart refinery model output

Relative CO2 Savings Ethanol Vs. ETBE July 2007 Final Draft R02
© Copyright by Hart Energy Consulting
Page 14 of 30
The EU gasoline production varies between the cases. The variation is due to variations in the per unit energy content of the gasoline produced. Volumes were adjusted between cases to maintain constant gasoline on an energy equivalent basis. Table III.4 provides calculated EU gasoline energy content and total gasoline energy for the ethanol cases. Variations in energy content for jet fuel and diesel were insignificant and no volume adjustments were made.
Table III.4: Gasoline Energy Content: Ethanol Cases
Base Ethanol
Base case
Ethanol 2
Ethanol 3
EU Gasoline - Million Tons/Year 104.5 105.8 105.7 105.6 Energy Content - MJ/kg 42.72 42.24 42.24 42.27 Gasoline Energy - PJ/Year 4470 4470 4470 4470
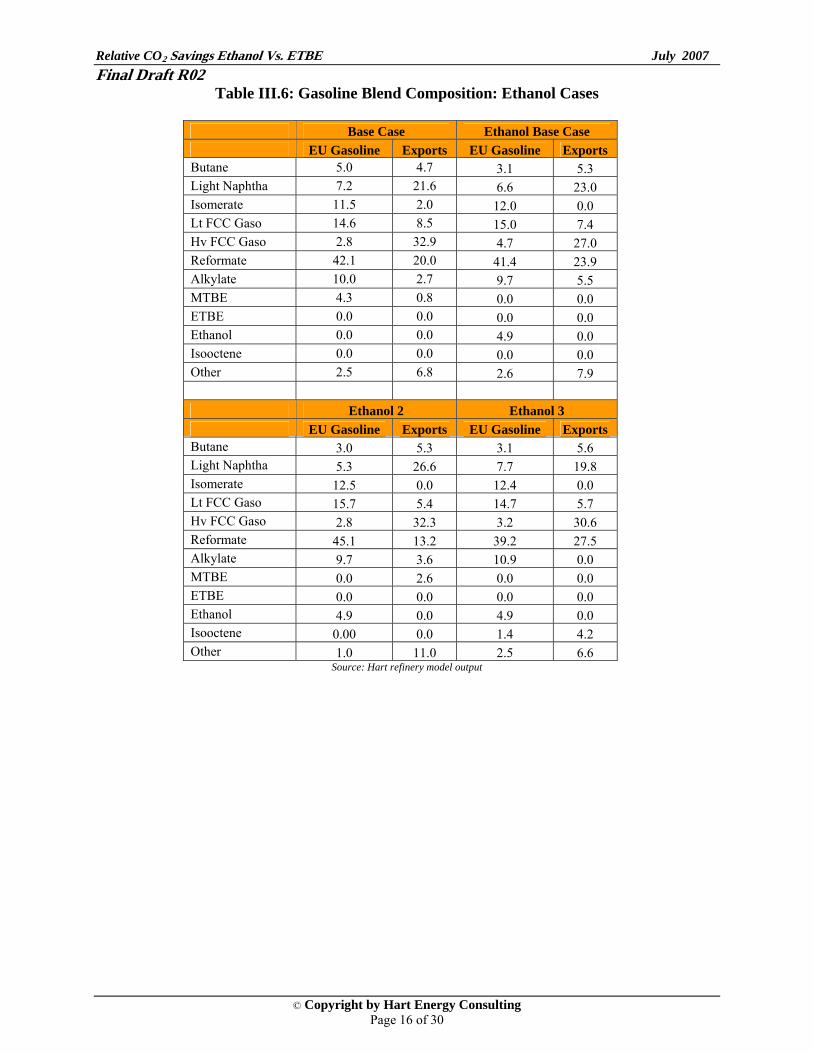
Source: Hart refinery model output The lower energy content of ethanol requires that additional gasoline be produced in the ethanol cases to maintain constant gasoline energy supply. Although ethanol is a low carbon fuel and will generate lower CO2 emissions than hydrocarbon gasoline, the higher gasoline demand required to maintain constant energy offsets the benefits of the low carbon characteristics of ethanol. The impacts are quantified in Section IV. Table III.5 and III.6 summarize the gasoline qualities and blend compositions for the ethanol cases. The most significant quality impact is on aromatics content (high carbon factor and thus higher contributor to CO2 emissions). The aromatics content in the ethanol cases is around 1% below the base case. The lower aromatic content will result in lower CO2 emissions per ton of gasoline. The gasoline compositions in table III.5 show a significant drop in butane for the ethanol cases. The higher ethanol volatility required that butane be backed out to meet RVP specification. Table III.7 summarizes refinery capacity utilization for the ethanol cases. The base case utilizations are also included for reference. In the base ethanol case, an additional 5% alkylation capacity was provided (as noted in the assumptions of Section II) and utilization was thus higher.

Relative CO2 Savings Ethanol Vs. ETBE July 2007 Final Draft R02
© Copyright by Hart Energy Consulting
Page 15 of 30
Table III.5: Gasoline Qualities: Ethanol Cases
Base Case Ethanol Base Case EU Gasoline Exports EU Gasoline Exports Specific Gravity 0.74 0.72 0.75 0.72 Sulfur (PPM) 10 10 10 10 RVP (Kpa) 60.0 60.0 60.0 60.0 Olefin (vol%) 6.5 15.0 6.9 15.0 Aromatics (vol%) 34.8 34.6 33.9 34.6 Benzene (vol%) 0.9 0.9 0.9 0.9 Research Octane 95.3 96.0 95.3 96.0 Motor Octane 85.9 86.3 85.3 86.3 Ethanol 2 Ethanol 3 EU Gasoline Exports EU Gasoline Exports Specific Gravity 0.75 0.72 0.75 0.72 Sulfur (PPM) 10 10 10 10 RVP (Kpa) 60.0 60.0 60.0 60.0 Olefin (vol%) 6.7 15.0 6.4 15.0 Aromatics (vol%) 33.9 34.6 32.9 34.6 Benzene (vol%) 0.9 0.9 0.9 0.9 Research Octane 95.3 96.0 95.3 96.0 Motor Octane 85.3 86.3 85.3 86.3
Source: Hart refinery model output
Relative CO2 Savings Ethanol Vs. ETBE July 2007 Final Draft R02
© Copyright by Hart Energy Consulting
Page 16 of 30
Table III.6: Gasoline Blend Composition: Ethanol Cases
Base Case Ethanol Base Case EU Gasoline Exports EU Gasoline Exports Butane 5.0 4.7 3.1 5.3 Light Naphtha 7.2 21.6 6.6 23.0 Isomerate 11.5 2.0 12.0 0.0 Lt FCC Gaso 14.6 8.5 15.0 7.4 Hv FCC Gaso 2.8 32.9 4.7 27.0 Reformate 42.1 20.0 41.4 23.9 Alkylate 10.0 2.7 9.7 5.5 MTBE 4.3 0.8 0.0 0.0 ETBE 0.0 0.0 0.0 0.0 Ethanol 0.0 0.0 4.9 0.0 Isooctene 0.0 0.0 0.0 0.0 Other 2.5 6.8 2.6 7.9 Ethanol 2 Ethanol 3 EU Gasoline Exports EU Gasoline Exports Butane 3.0 5.3 3.1 5.6 Light Naphtha 5.3 26.6 7.7 19.8 Isomerate 12.5 0.0 12.4 0.0 Lt FCC Gaso 15.7 5.4 14.7 5.7 Hv FCC Gaso 2.8 32.3 3.2 30.6 Reformate 45.1 13.2 39.2 27.5 Alkylate 9.7 3.6 10.9 0.0 MTBE 0.0 2.6 0.0 0.0 ETBE 0.0 0.0 0.0 0.0 Ethanol 4.9 0.0 4.9 0.0 Isooctene 0.00 0.0 1.4 4.2 Other 1.0 11.0 2.5 6.6
Source: Hart refinery model output

Relative CO2 Savings Ethanol Vs. ETBE July 2007 Final Draft R02
© Copyright by Hart Energy Consulting
Page 17 of 30
Table III.7: Refinery Capacity Utilization: Ethanol Cases Million Tons/Year
Base Ethanol Base Case Ethanol 2 Ethanol 3
Crude Distillation 667 667 667 666 Naphtha HDT 127 127 124 125 Isom (C5/C6) 12 11 12 12 Reforming 85 86 86 85 Kero/Distillate HDT 276 253 253 252 Heavy Oil HDT 59 59 59 59 Hydrocracking 61 61 61 61 FCC 119 119 119 119 FCC Naph. HDT 23 23 22 21 Alkylation 11 12 11 11 Coking 17 17 17 17 MTBE 2 0 2 0 ETBE 0 0 0 0 Isooctene 0 0 0 1
Source: Hart analysis, Oil and Gas Journal, Hart refinery model output Summary ETBE Cases The gasoline component supply and demand for the ETBE cases examined are summarized in Table III.8. As in the previous section, the table shows merchant ether and ethanol production, refinery purchases, refinery production, and components used in gasoline blending. For the ETBE cases there are no component exports or isooctene production. Tables III.9 and III.10 summarize refinery input and output for the ETBE cases. Table III.10 also shows refinery ether and isooctene production and blending for each case.

Relative CO2 Savings Ethanol Vs. ETBE July 2007 Final Draft R02
© Copyright by Hart Energy Consulting
Page 18 of 30
Table III.8: Gasoline Component Purchases, Production and Blending: ETBE cases
Thousand Tons/Year
Base
ETBE Base Case
ETBE 2 ETBE 3
Merchant Production MTBE 2450 0 0 0 Ethanol 0 5480 5480 5480 Ethanol to ETBE -4030 -1490 -1290 ETBE 0 8880 3290 2840 Isooctene 0 0 0 0 Purchases Merchant MTBE 2450 0 0 0 Ethanol 0 1450 3980 4190 Merchant ETBE 0 8880 3290 2840 Isooctene 0 0 0 0 Production MTBE 1990 0 0 0 Ethanol to ETBE 0 -1450 -1590 -1040 ETBE 0 3200 3510 2300 Isooctene 0 0 0 0 Gasoline Blending MTBE 4440 0 0 0 Ethanol 0 0 2390 3150 ETBE 0 12,080 6800 5140 Isooctene 0 0 0 0 Exports Merchant MTBE 0 0 0 0 Refinery MTBE 0 0 0 0
Source: Hart analysis based on International Energy Agency (IEA) data

Relative CO2 Savings Ethanol Vs. ETBE July 2007 Final Draft R02
© Copyright by Hart Energy Consulting
Page 19 of 30
Table III.9: Refinery Input: ETBE Cases
Million Tons/Year
Base ETBE Base Case
ETBE 2
ETBE 3
Crude Oil Indigenous 176 176 176 176 API 37.3 37.3 37.3 37.3 % Sulfur 0.33 0.33 0.33 0.33 Imported 491 485 486 487 API 33.7 33.7 33.7 33.7 % Sulfur 1.21 1.21 1.21 1.21 Ethanol 0 1.4 4.0 4.2 MTBE 2.4 0 0 0 ETBE 0 9.0 3.3 2.8 Isooctene 0 0 0 0 Methanol 0.7 0 0 0 Biodiesel 10.2 10.2 10.2 10.2 Gasoline Components 9.7 9.7 9.7 9.7 Other Unfinished Oils 10.9 10.9 10.9 10.9
Source: Hart analysis based on International Energy Agency (IEA) data
Table III.10: Refinery Output: ETBE Cases Million Tons/Year
Base ETBE Case ETBE
2 ETBE
3 Refinery Production/Sales Gasoline 98 RON EU Grade 5.8 5.9 5.9 5.9 95 RON EU Grade 98.5 99.3 99.5 99.6 U.S. RFG Export 5.2 5.2 5.2 5.2
U.S. Conventional Export 18.3 18.3 18.3 18.3
Other Export 8.0 8.0 8.0 8.0 Naphtha 40.5 40.5 40.5 40.5 BTX Chemicals 10.9 10.9 10.9 10.9 Jet Fuel 49.9 49.9 49.9 49.9 Distillate Diesel 10 ppm 187.8 187.8 187.8 187.8 Other Distillate 92.4 92.4 92.4 92.4 Residual Fuel 96.2 96.2 96.2 96.2 Lube/Asphalt 24 24 24 24 LPG 19 20 19 19 MTBE 0 0 0 0 Refinery Production/Blending1 MTBE 1.7 0 0 0 ETBE 0 3.2 3.5 2.3 Isooctene 0 0 0 0 TAME 0.1 0.1 0.1 0.1
Source: Hart analysis and model output

Relative CO2 Savings Ethanol Vs. ETBE July 2007 Final Draft R02
© Copyright by Hart Energy Consulting
Page 20 of 30
Table III.11 provides calculated EU gasoline energy content and total gasoline energy for the ETBE cases. As with the ethanol cases, lower energy content of ETBE results in lower energy ETBE blended gasoline and thus additional gasoline is required to maintain constant gasoline energy. Variations in energy content for jet fuel and diesel were insignificant and no volume adjustments were made.
Table III.11: Gasoline Energy Content: ETBE Cases
Base ETBE Base case
ETBE 2
ETBE 3
EU Gasoline - Million Tons/Year 104.5 105.2 105.4 105.5 Energy Content - MJ/kg 42.72 42.44 42.36 42.33 Gasoline Energy - PJ/Year 4470 4470 4470 4470
Source: Hart refinery model output Table III.12 and III.13 summarize the gasoline qualities and blend compositions for the ETBE cases. The most significant quality impact is on aromatics content (high carbon factor and thus higher contributor to CO2 emissions), as was seen in the ethanol cases. For ETBE, the aromatics change is far more significant than in the ethanol cases (3% to 5% reduction vs. about 1% for ethanol.) Table III.14 summarizes refinery capacity utilization for the ethanol cases. The base case utilizations are also included for reference.
Table III.12: Gasoline Qualities: ETBE Cases
Base Case ETBE Base Case EU Gasoline Exports EU Gasoline Exports Specific Gravity 0.74 0.72 0.74 0.72 Sulfur (PPM) 10 10 10 10 RVP (Kpa) 60.0 60.0 60.0 60.0 Olefin (vol%) 6.5 15.0 6.4 15.0 Aromatics (vol%) 34.8 34.6 29.1 34.6 Benzene (vol%) 0.9 0.9 0.9 0.9 Research Octane 95.3 96.0 95.3 96.0 Motor Octane 85.9 86.3 85.6 86.3 ETBE 2 ETBE 3 EU Gasoline Exports EU Gasoline Exports Specific Gravity 0.74 0.72 0.74 0.72 Sulfur (PPM) 10 10 10 10 RVP (Kpa) 60.0 60.0 60.0 60.0 Olefin (vol%) 7.0 15.0 7.0 15.0 Aromatics (vol%) 30.9 34.6 31.8 34.6 Benzene (vol%) 0.9 0.0 0.9 0.0 Research Octane 95.3 96.0 95.3 96.0 Motor Octane 85.3 86.3 85.3 86.3
Source: Hart refinery model output

Relative CO2 Savings Ethanol Vs. ETBE July 2007 Final Draft R02
© Copyright by Hart Energy Consulting
Page 21 of 30
Table III.13: Gasoline Blend Composition: ETBE Cases
Base Case ETBE Base Case EU Gasoline Exports EU Gasoline Exports Butane 5.0 4.7 4.4 4.6 Light Naphtha 7.2 21.6 7.5 20.1 Isomerate 11.5 2.0 13.2 0.0 Lt FCC Gaso 14.6 8.5 14.7 6.2 Hv FCC Gaso 2.8 32.9 2.5 26.7 Reformate 42.1 20.0 33.8 27.8 Alkylate 10.0 2.7 7.6 3.8 MTBE 4.3 0.8 0.0 0.0 ETBE 0.0 0.0 11.5 0.0 Ethanol 0.0 0.0 0.0 0.0 Isooctene 0.0 0.0 0.0 0.0 Other 2.5 6.8 4.8 10.8 ETBE 2 ETBE 3 EU Gasoline Exports EU Gasoline Exports Butane 3.9 5.1 3.6 5.3 Light Naphtha 7.1 20.1 7.6 20.1 Isomerate 13.1 0.4 13.2 0.0 Lt FCC Gaso 16.0 5.9 15.4 5.6 Hv FCC Gaso 1.4 28.6 1.8 31.5 Reformate 38.3 28.6 38.3 26.2 Alkylate 9.5 3.9 9.6 3.9 MTBE 0.0 0.0 0.0 0.0 ETBE 6.5 0.0 4.9 0.0 Ethanol 2.1 0.0 2.9 0.0 Isooctene 0.0 0.0 0.0 0.0 Other 2.1 7.4 2.7 7.4
Source: Hart refinery model output

Relative CO2 Savings Ethanol Vs. ETBE July 2007 Final Draft R02
© Copyright by Hart Energy Consulting
Page 22 of 30
Table III.14: Refinery Capacity Utilization: ETBE Cases Million Tons/Year
Base ETBE
Base Case ETBE 2 ETBE 3
Crude Distillation 667 661 662 664 Naphtha HDT 127 117 120 123 Isom (C5/C6) 12 13 13 12 Reforming 85 79 83 83 Kero/Distillate HDT 276 253 253 253 Heavy Oil HDT 59 59 59 59 Hydrocracking 61 61 61 61 FCC 119 119 119 119 FCC Naph. HDT 23 19 20 21 Alkylation 11 9 11 11 Coking 17 15 15 16 MTBE 2 0 0 0 ETBE 0 3 4 3 Isooctene 0 0 0 0
Source: Hart analysis, Oil and Gas Journal, Hart refinery model output

Relative CO2 Savings Ethanol Vs. ETBE July 2007 Final Draft R02
© Copyright by Hart Energy Consulting
Page 23 of 30
IV. CO2 Impacts Gasoline and Refinery CO2 Impacts Oxygenate addition will impact gasoline blending and quality and refinery processing requirements. These blending/refining impacts will result in increasing and decreasing CO2 emissions from various emission sources:
• Lower oxygenate carbon content will lower gasoline CO2 emissions. • Lower oxygenate energy content will increase gasoline volume requirements, increasing
gasoline CO2 emissions. • Oxygenate blending will result in other fuel composition changes (e.g., lower aromatics)
which will tend to lower gasoline carbon content. • Oxygenates lower refinery octane requirements, reducing refinery fuel requirements and
associated CO2 emissions. • Lower octane requirements will reduce gasoline reforming throughput. Additional
refinery hydrogen will be required from on-purpose hydrogen generation, increasing CO2 emissions.
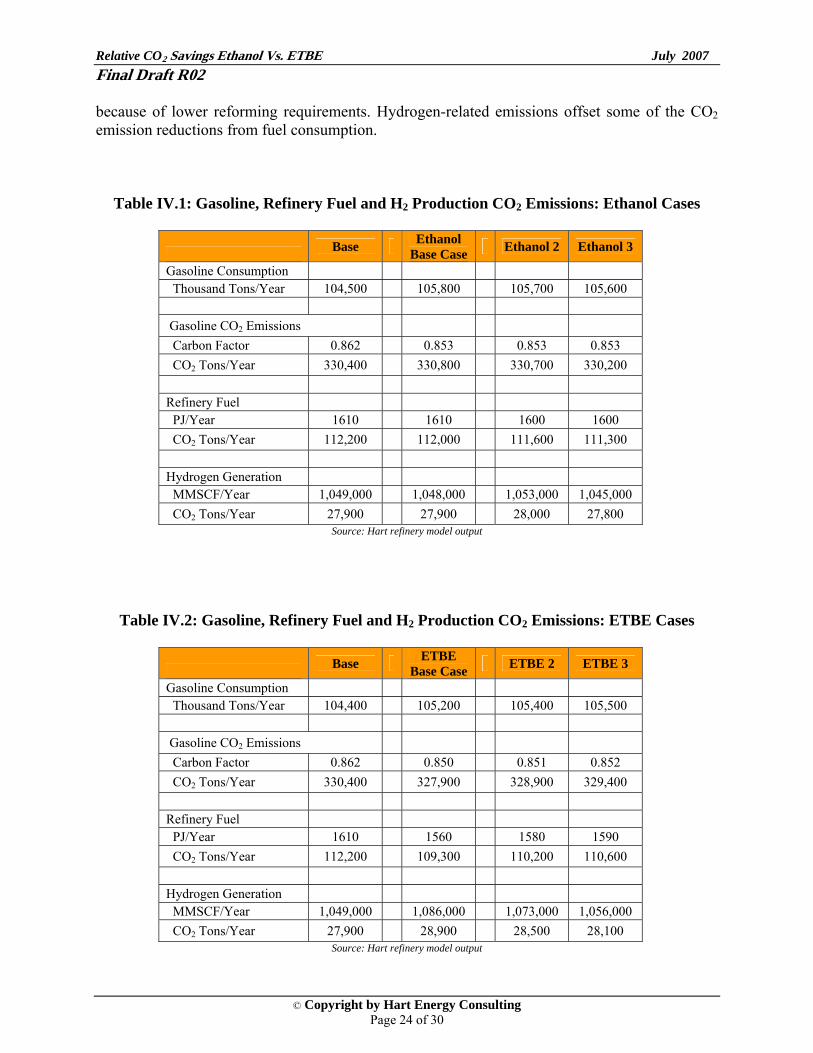
Tables IV.1 and IV.2 summarize refinery CO2 emission impacts for the ethanol and ETBE cases, respectively. Impacts are quantified for products or other refining activities where ethanol or ETBE use impacts CO2 emissions. The CO2 changes are shown for changes in gasoline production/quality, refinery fuel and incremental refinery hydrogen requirements. Gasoline production was held constant on an energy basis. This resulted in a small variation in production between cases as discussed previously and indicated in tables IV.1 and IV.2. In the ethanol cases, gasoline carbon content was reduced, while total gasoline volume increased to maintain constant gasoline energy supply. The result is a net increase in gasoline CO2 emissions in the Ethanol Base Case and Ethanol Case 2. Gasoline composition changes with the higher volume of isooctene in the last case (Ethanol 3) offset other increases from lower energy and higher gasoline volume. Refinery processing and fuel requirements are lower with the ethanol addition due to the additional ethanol volume and octane. Overall there is a net decrease in gasoline plus refinery CO2 emissions. In the ETBE cases (as with ethanol), gasoline carbon content was reduced, while total gasoline volume increased to maintain constant gasoline energy supply. For the ETBE cases, the change in carbon content is slightly higher than the ethanol cases because of the higher volume of oxygenate used (ETBE vs. ethanol). The ETBE cases also are slightly more favorable than ethanol in terms of energy content.
The refinery fuel requirement is significantly lower in the ETBE cases because of the additional volume and octane available. On the other hand, hydrogen production requirements increase
Relative CO2 Savings Ethanol Vs. ETBE July 2007 Final Draft R02
© Copyright by Hart Energy Consulting
Page 24 of 30
because of lower reforming requirements. Hydrogen-related emissions offset some of the CO2 emission reductions from fuel consumption.
Table IV.1: Gasoline, Refinery Fuel and H2 Production CO2 Emissions: Ethanol Cases
Base Ethanol Base Case Ethanol 2 Ethanol 3
Gasoline Consumption Thousand Tons/Year 104,500 105,800 105,700 105,600 Gasoline CO2 Emissions Carbon Factor 0.862 0.853 0.853 0.853 CO2 Tons/Year 330,400 330,800 330,700 330,200 Refinery Fuel PJ/Year 1610 1610 1600 1600 CO2 Tons/Year 112,200 112,000 111,600 111,300 Hydrogen Generation MMSCF/Year 1,049,000 1,048,000 1,053,000 1,045,000 CO2 Tons/Year 27,900 27,900 28,000 27,800
Source: Hart refinery model output
Table IV.2: Gasoline, Refinery Fuel and H2 Production CO2 Emissions: ETBE Cases
Base ETBE Base Case ETBE 2 ETBE 3
Gasoline Consumption Thousand Tons/Year 104,400 105,200 105,400 105,500 Gasoline CO2 Emissions Carbon Factor 0.862 0.850 0.851 0.852 CO2 Tons/Year 330,400 327,900 328,900 329,400 Refinery Fuel PJ/Year 1610 1560 1580 1590 CO2 Tons/Year 112,200 109,300 110,200 110,600 Hydrogen Generation MMSCF/Year 1,049,000 1,086,000 1,073,000 1,056,000 CO2 Tons/Year 27,900 28,900 28,500 28,100
Source: Hart refinery model output

Relative CO2 Savings Ethanol Vs. ETBE July 2007 Final Draft R02
© Copyright by Hart Energy Consulting
Page 25 of 30
CO2 Impacts of Merchant Component Production and Byproduct Variations There are also potential CO2 impacts outside the refinery. First, merchant MTBE, ETBE or isooctene production and methanol production will generate CO2 emissions from processing. There are also potential CO2 impacts due to refinery byproduct production. Increases in refinery coke production are assumed to supply the fuel market, replacing coal as the incremental fuel. The impact on CO2 emissions are calculated as the energy equivalent CO2 emission difference between coke and coal. Tables IV.3 and IV.4 summarizes other (outside the refinery) CO2 emission impacts for the ETBE and ethanol cases, respectively. For the ethanol cases, merchant process emissions from MTBE or isooctene production do not change. Methanol emissions are reduced in these cases where MTBE production is lowered and eliminated. There is no change in byproduct CO2 emissions. For the ETBE base case, there is a large increase in merchant process emissions due to higher ether production and fuel associated with production of incremental isobutylene from field butanes. For all the ETBE cases, a CO2 reduction is shown reflecting elimination of methanol (for MTBE) production. The ETBE cases also show a small reduction in CO2 emissions associated with byproduct coke production.
Table IV.3: Merchant Plant Fuel and Byproduct-Related CO2 Emissions: Ethanol Cases
Base Ethanol Base Case Ethanol
2 Ethanol
3 Process Fuel CO2 Emissions CO2 Thousand Tons/Year 230 230 230 230 Methanol Production CO2 Thousand Tons/Year 780 430 780 0 Byproduct Fuel Change CO2 Thousand Tons/Year 1,100 1,100 1,100 1,100
Source: Hart analysis
Table IV.4: Merchant Plant Fuel and Byproduct-Related CO2 Emissions: ETBE Cases
Base ETBE Base Case ETBE
2 ETBE
3 Process Fuel CO2 Emissions CO2 Thousand Tons/Year 230 1,060 250 220 Methanol Production CO2 Thousand Tons/Year 780 0 0 0 Byproduct Fuel Change CO2 Thousand Tons/Year 1,100 1,000 1,000 1,000
Source: Hart analysis The net CO2 emission impacts are summarized in tables IV.5 and IV.6. The emissions are broken down into the gasoline, refinery fuel, hydrogen production, merchant plant fuel and other byproduct fuel substitution impacts. The CO2 emissions in the base ethanol case are estimated to

Relative CO2 Savings Ethanol Vs. ETBE July 2007 Final Draft R02
© Copyright by Hart Energy Consulting
Page 26 of 30
be 0.2 million tons per year below the base case. The Ethanol 2 Case is similar to the Ethanol Base Case, with CO2 emissions 0.2 million tons per year below the base case. The final Ethanol 3 Case, with refinery and merchant isooctene production, results in CO2 emissions 2.0 million tons/year below the base case. The ETBE cases result in significantly greater reductions in CO2 emissions (orders of magnitude times greater than the Ethanol Base Case). The CO2 emission reductions are driven by the gasoline and refinery CO2 impacts of ETBE use.
Table IV.5: Summary CO2 Emissions: Ethanol Cases Thousand Tons/Year
Base Ethanol
Base Case Ethanol 2
Ethanol 4
Gasoline Consumption 330,400 330,800 330,700 330,200 Refinery Fuel 112,200 112,000 111,600 111,300 Hydrogen Production 27,900 27,900 28,000 27,800 Merchant Plant Fuel 230 230 230 230 Methanol 780 430 780 0 Other CO2 Impacts 1,100 1,100 1,100 1,100 Total 472,610 472,460 472,410 470,630 CO2 vs. Base Case -150 -200 -1,980
Source: Hart analysis and Hart refinery model output
Table IV.6: Summary CO2 Emissions: ETBE Cases Thousand Tons/Year
Base ETBE
Base Case ETBE 2 ETBE 3
Gasoline Consumption 330,400 327,900 328,900 329,400 Refinery Fuel 112,200 109,300 110,200 110,600 Hydrogen Production 27,900 28,900 28,500 28,100 Merchant Plant Fuel 230 1,060 250 220 Methanol 780 0 0 0 Other CO2 Impacts 1,100 1,000 1,000 1,000 Total 472,610 468,160 468,850 469,320 CO2 vs. Base Case -4,450 -3,760 -3,290
Source: Hart analysis and Hart refinery model output
Figure IV.1 displays CO2 impacts of ethanol and ETBE cases relative to the base case. The graph provides a comparison of ethanol vs. ETBE options. Again, the ETBE option results in significantly higher CO2 reductions as driven by gasoline and refinery CO2 emission reductions.

Relative CO2 Savings Ethanol Vs. ETBE July 2007 Final Draft R02
© Copyright by Hart Energy Consulting
Page 27 of 30
Figure IV.1: CO2 Emissions vs. Base Case Ethanol and ETBE Cases Thousand Tons/Year
0500
10001500200025003000350040004500
Ethanol +MTBEExport
Ethanol +Isooctane
ETBE w/Exist Cap
ETBE AvailIc4e
ETBE IncrIc4e

Relative CO2 Savings Ethanol Vs. ETBE July 2007 Final Draft R02
© Copyright by Hart Energy Consulting
Page 28 of 30
Appendix 1
This appendix provides detail on the data and methodology used to calculate gasoline and other product energy content, carbon factors and CO2 emissions. I. Gasoline and Gasoline Component Specific Gravity and Combustion Energy
a) General Calculation – Combustion Energy was determined as the weight average of
individual component combustion energy (Enthalpy of Combustion @ 770F). Combustion Energy = ∑ci*LHVi Where ci is component i LHVi is the combustion energy of component i or component category i (aromatics, other non aromatic/oxygenate)
b) Component Energy – For specific chemicals included in gasoline, reported enthalpy of
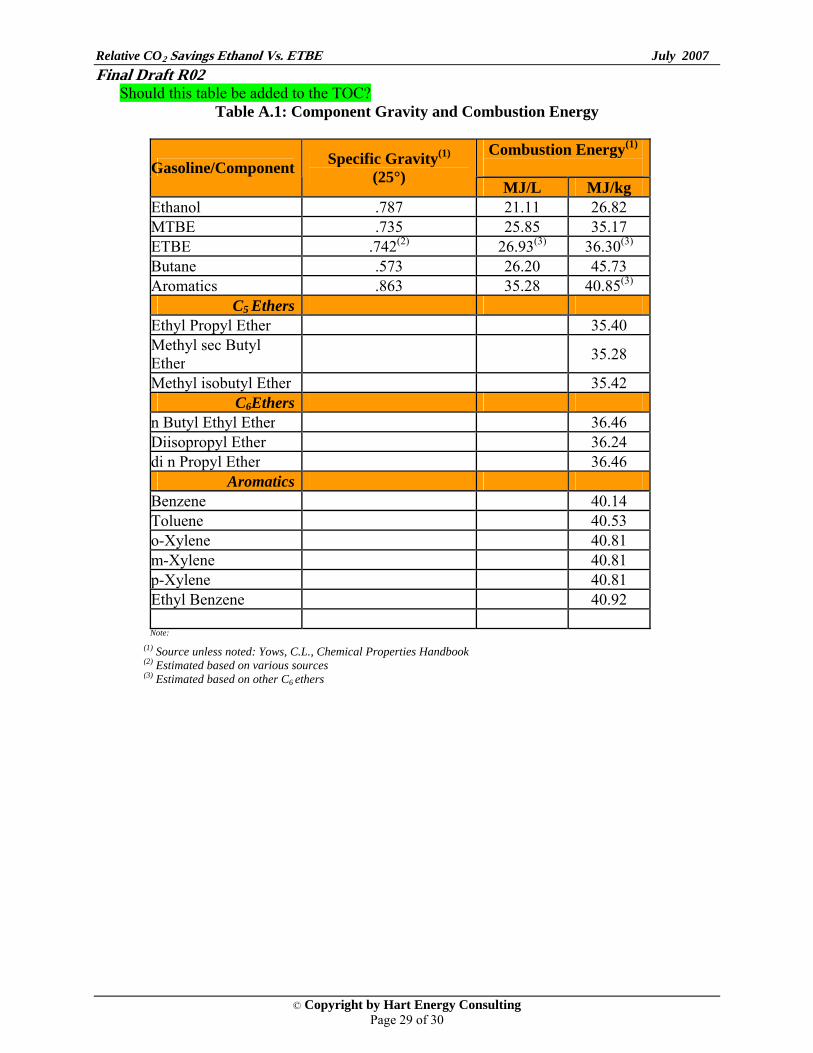
combustion used. These include ethanol, MTBE, butane and benzene. Component enthalpy values are shown in table A.1
c) ETBE Energy – The source data for energy values does not include ETBE. ETBE energy
was estimated from reported values for other C6 ethers. (Note from data below the energy content of MTBE is MJ/kg, which is close to that of other C5 ethers.)
d) Aromatics Energy – Aromatic energy assumed equivalent to a mix of C6-C9 aromatics.
e) Other (non-oxygenate, butane, aromatics) – Energy content adjusted based on specific
gravity of this portion of the gasoline. The specific gravity is calculated based on the refinery model gasoline specific gravity and the specific gravity of the above specific chemicals or chemical groups (aromatics). An energy relationship was developed based on a data base of component as follows (correlation R2=.996):
LHV (MJ/L) = 39.347 (sg) + 3.576
f) ETBE Energy – The source data for energy values does not include ETBE. ETBE energy
was estimated from reported values for other C6 ethers. (Note from data below the energy content of MTBE is MJ/kg, which is close to that of other C5 ethers.)
LHV (MJ/L) = 39.347 (sg) + 3.576
Relative CO2 Savings Ethanol Vs. ETBE July 2007 Final Draft R02
© Copyright by Hart Energy Consulting
Page 29 of 30
Should this table be added to the TOC? Table A.1: Component Gravity and Combustion Energy
Combustion Energy(1)
Gasoline/Component Specific Gravity(1) (25°)
MJ/L MJ/kg Ethanol .787 21.11 26.82 MTBE .735 25.85 35.17 ETBE .742(2) 26.93(3) 36.30(3) Butane .573 26.20 45.73 Aromatics .863 35.28 40.85(3)
C5 Ethers Ethyl Propyl Ether 35.40 Methyl sec Butyl Ether 35.28
Methyl isobutyl Ether 35.42 C6Ethers
n Butyl Ethyl Ether 36.46 Diisopropyl Ether 36.24 di n Propyl Ether 36.46
Aromatics Benzene 40.14 Toluene 40.53 o-Xylene 40.81 m-Xylene 40.81 p-Xylene 40.81 Ethyl Benzene 40.92
Note:
(1) Source unless noted: Yows, C.L., Chemical Properties Handbook (2) Estimated based on various sources (3) Estimated based on other C6 ethers

Relative CO2 Savings Ethanol Vs. ETBE July 2007 Final Draft R02
© Copyright by Hart Energy Consulting
Page 30 of 30
II. Calculation of Refined Product CO2 Emission Factors
a) General calculation – CO2 emission factors were determined based on the estimated carbon content of the individual product:
CO2 (Tons/Ton fuel) = CF*(44/12) Where CF is the fraction of fuel carbon in Ton C/Ton fuel (44/12) is the tons CO2 combustion product per ton fuel carbon
b) Gasoline carbon fraction
i. Gasoline was characterized by percent butane, percent benzene, percent of each oxygenate (MTBE, ETBE, ethanol), and all other components. Butane, benzene and oxygenate are calculated and reported by the model. Their carbon content will be determined directly based on the chemical carbon content.
ii. The remaining gasoline (all other components) were characterized as aromatics, olefin and other. The base case gasoline carbon fraction for this portion of the gasoline will be determined as: CF = A*.907+O*.857+P*85 Where A is the fraction of aromatics assumed to have an average carbon fraction of .905 O is the fraction of olefin assumed to have an average carbon fraction of .857 P is the fraction of paraffin, cycloparaffin and other compounds assumed to have an average carbon fraction of .85
c) Jet fuel and diesel CO2 emissions – Jet fuel and diesel qualities varied very little between
cases. Neither gravity nor aromatics content varied sufficiently to quantify a significant change in energy control.
Related Documents