STUDY ON MECHANICAL PROPERTIES OF REINFORCED CONCRETE FLEXURAL MEMBERS AT ELEVATED TEMPERATURES (Translation from Proceedings of JSCE, No.725/V-58, February 2003) Tsutomu KANAZU Reinforced concrete structures built for nuclear power plants, such as containment vessels, reactor support structures, piping systems, and facilities for storing high-level radioactive waste, are designed under the assumption that they will be exposed to high-temperature conditions. In a previous paper, the author elucidated the temperature dependence of the properties of concrete and reinforcement, and the influence of differential thermal expansion coefficient between concrete and reinforcement on the behavior of reinforced concrete beams, thus contributing to the rationalization of the design method. In this paper the influence of high-temperature conditions on the flexural behavior and strength of reinforced concrete flexural members is clarified and estimation methods are suggested. Key Words: high temperatures, reinforced concrete , flexural behavior, beam Tsutomu KANAZU is a Director of Materials Science and Structural Engineering Department at Abiko Research Laboratory of Central Research Institute of Electric Power Industry, Japan. He received his Master of Engineering Degree from Tokyo Institute of Technology in 1978. His research interests are the mechanical behavior of RC structures under high and low temperature and the performance-based seismic design of underground RC structures. Hi is a member of JSCE and JCI. 83

Welcome message from author
This document is posted to help you gain knowledge. Please leave a comment to let me know what you think about it! Share it to your friends and learn new things together.
Transcript

STUDY ON MECHANICAL PROPERTIES OF REINFORCED CONCRETE FLEXURAL MEMBERS
AT ELEVATED TEMPERATURES
(Translation from Proceedings of JSCE, No.725/V-58, February 2003)
Tsutomu KANAZU
Reinforced concrete structures built for nuclear power plants, such as containment vessels, reactor support structures, piping systems, and facilities for storing high-level radioactive waste, are designed under the assumption that they will be exposed to high-temperature conditions. In a previous paper, the author elucidated the temperature dependence of the properties of concrete and reinforcement, and the influence of differential thermal expansion coefficient between concrete and reinforcement on the behavior of reinforced concrete beams, thus contributing to the rationalization of the design method. In this paper the influence of high-temperature conditions on the flexural behavior and strength of reinforced concrete flexural members is clarified and estimation methods are suggested. Key Words: high temperatures, reinforced concrete , flexural behavior, beam Tsutomu KANAZU is a Director of Materials Science and Structural Engineering Department at Abiko Research Laboratory of Central Research Institute of Electric Power Industry, Japan. He received his Master of Engineering Degree from Tokyo Institute of Technology in 1978. His research interests are the mechanical behavior of RC structures under high and low temperature and the performance-based seismic design of underground RC structures. Hi is a member of JSCE and JCI.
83

1. INTRODUCTION The author has been carrying out research work on the basic properties of reinforced concrete at elevated temperatures, with the aim of rationalizing the design of reinforced concrete structures where exposure to such conditions is anticipated. The target structures include containment vessels and cooling water support structures in nuclear power plants, as well as structures for storing high-level radioactive waste. From the investigations so far, the mechanical properties of concrete, reinforcement, and reinforced concrete beams at elevated temperatures have been clarified [1]. At elevated temperatures (over 200˚C), Young’s modulus and the creep behavior of concrete as well as the mechanical properties of reinforcing steel (yield strength and tensile strength) are very different from those at normal temperature. Further, internal stresses are induced in reinforced concrete beams by differential thermal expansion strain between concrete and reinforcing steel, and these have an influence on the load-deformation relation [2]. In this study, the effects of such changes in the physical properties of concrete and reinforcement and the differential thermal expansion strain on the mechanical behavior of reinforced concrete (RC) flexural beams are elucidated experimentally. A method of estimating the deformational behavior of RC beams, covering the plastic range as well as the elastic range, is also proposed and validated. 2. OUTLINE OF FLEXURAL TESTS ON RC BEAMS AT ELEVATED TEMPERATURES (1) Test specimens The test specimens measure 380 cm in total length. The tested length is 220 cm and they have a cross section of 20 cm x 40 cm, as shown in Fig. 1 . Deformed bars of diameter 16 mm and 6 mm are used, respectively, as the tensile reinforcement and web reinforcement. The concrete mix proportion is listed in Table 1 and test specimens are cured for 2 to 6 months before heating. (2) Test method Test specimens were enclosed in a heating furnace as shown in Fig. 2 and a test area measuring 220 cm in length was heated. Temperature in the furnace was controlled by twelve electric heaters, spaced equally around the inner surface and controlled individually. For testing, a flexural moment was applied to the specimen using an actuator, which pulled together two steel frames attached rigidly to the ends of the specimen. This introduced an uniform flexural moment and a small axial force in the tested area; the axial force was ignored as negligible. Constant temperature was maintained for two days prior to loading. Measurement points for curvature deformation were arranged 3 cm distant from
Fig.2 Flexural loading and heating apparatus
insulation
electric furnace
RC specimen
stee
l fra
me
for l
oadi
ng
actuatorload cell
measured point for large deformation
cross section of furnace
spec
imen
elec
tric
heat
er
275c
m
stee
l fra
me
for l
oadi
ng
insulation
Fig.1 Reinforced concrete (RC) beam specimen
tensile reinf., web reinf. 30cm
400
350
300
300
NB-2D Hx00-2DNHx00-2D
H200-4D H200-7D H400-2DR H200-4DR(unit:mm)
measured points; 30 cm distance3800
400 4002200
200
400400
400
5cm from tensile fiber, 3 cm from compressive fiber
upperreinf.
lowerreinf.
84

Table 1 Mix proportion of concrete Uni t content (kg /m3 ) Compress ive
s t reng th (N/mm2 )
Max. s ize o f aggregate
(mm)
S lump
(cm)
Ai r
(%)
W/C
(%)
Fine aggrega tera t io (%)
Wate r Cement Fine aggregate
Coarse aggregate
AE agen t
40 20 8±2.5 3±1 43.2 43.1 160 370 789 1103 0.925
Table 2 Details of reinforced concrete beams and physical properties of concrete at normal temperature Temp. Max. Re inf . Depth o f Depth o f
No .
Name of spec imen
a t t e s t ( ˚C)
t emp. ( ˚C)
ra t io (%)
lower re inf .d 2 (cm)
upper re in f .d 1 (cm)
Comp. s t reng th
(N/mm2 )
Tens i l es t reng th(N/mm2 )
Young’s modulus
10 4 (N/mm2 )
Notes
1 NB-2D normal normal 0 .57 35 - - 50 .6 3 .82 3.41 2 NH200-2D normal 197.0 0 .57 35 - - 44 .4 3 .63 3.49 1 hea t ing cyc le 3 NH500-2D normal 477.5 0 .57 35 - - 43 .4 2 .86 3.43 3 hea t ing cyc les 4 H100-2D 101.5 101.5 0 .57 35 - - 44 .7 3 .19 3.51 5 H200-2D 204.7 204.7 0 .45 35 - - 48 .2 3 .74 3.60 6 H300-2D 295.8 295.8 0 .57 35 - - 45 .6 3 .18 3.52 7 H400-2D 401.3 401.3 0 .57 35 - - 45 .0 3 .45 3.45 8 H500-2D 506.2 506.2 0 .57 35 - - 37 .6 3 .47 3.21 9 H200-4D 207.0 207.0 1 .13 35 - - 48 .0 3 .47 3.59
10 H200-7D 205.2 205.2 2 .12 35 30 48 .6 3 .17 3.45 11 H400-2DR 400.0 400.0 0 .57 35 5 42 .9 3 .38 3.54 Comp. re inf . ; 2D1612 H200-4DR 207.0 207.0 1 .13 35 5 48 .3 3 .22 3.62 Comp. re inf . ; 2D16
the compressive fiber and 5 cm distant from the tensile fiber and at a spacing of 30 cm, as shown in Fig. 1 . Changes in the spacing between each pair of points on both sides of the beam were measured from outside the furnace using linear differential transducer gauges. This was a system newly developed for measuring the deformation of RC beams at elevated temperatures. Changes in spacing were converted to strains, and the average curvature was calculated from the strains. At large deformations, average curvature was also calculated from changes in the separation of the steel frames shown in Fig. 2 . Test specimen temperature was measured using C-C thermocouples embedded in the specimens, and the measured values were averaged for use as experimental data. The flexural moment was obtained from the load cell attached to the actuator. The heating rate was less than 10˚C /hr, and it took about a week to reach the experimental temperature of 500˚C. (3) Test parameters The main test parameters were temperature and reinforcement ratio. Details of the test specimens are listed in Table 2 . The yield strength and tensile strength of the tensile reinforcement were 384.2 N/mm2 and 564.5 N/mm2, respectively and its Young’s modulus was 2.03 105 N/mm2. 3. DEFORMATIONAL BEHAVIOR OF RC BEAMS AT ELEVATED TEMPERATURES 3.1 Thermal expansive deformation of unrestrained RC beams The relationships between amount of temperature rise and longitudinal expansion strain of the RC beams are shown in Fig. 3 and those between amount of temperature rise and curvature are shown in Fig. 4 . In Fig. 3 , the expansive strains of concrete and reinforcement due to temperature rise are also shown, while in Fig. 4 the curvatures calculated at the full (non-cracked) section and the cracked section are shown. Up to 100˚C, there is scarcely a difference between the longitudinal expansive behavior of the RC beams and the expansion of the concrete and reinforcement itself. However, above 100˚C, the longitudinal expansive behavior of the RC beams follows that of the concrete.
85

This is because the expansive behavior of concrete, which accounts for the larger cross-sectional area, governs expansion. It is thought that small internal stress cracks begin to occur around the reinforcement, as a result of differential thermal expansion between concrete and reinforcement, at around 100˚C point. The longitudinal expansive strain of the 2D specimens (that have two 16 mm deformed bars as tensile reinforcement, see Fig. 1) exceeds that of the concrete above 250˚C, and at higher temperatures the strain becomes intermediate between that of concrete and reinforcement; here the expansive strain of the reinforcement is influencing the behavior. Specimens H200-4D and H200-7D behave similarly, while the longitudinal expansive strains of specimens H400-2DR and H200-4DR are a little grater than those of the 2D specimens and specimen H200-4D, respectively because reinforcing steels are also distributed at the upper part of the cross section in those specimens. On the other hand, the curvature of the 2D specimens begins to diverge from the calculated results for the full section and approach those for the cracked section above 120˚C or so. This behavior results from the small cracks caused by differential expansive strain between concrete and steel. However, specimen H400-2DR exhibits longitudinal expansion but no curvature deformation with temperature rise because the steel reinforcement is symmetrically distributed over the section (see Fig. 1). As with other specimens, H200-4DR also shows longitudinal expansion and curvature deformation with temperature rise until cracking. After cracking (see a peak point of curvature of H200-4DR in Fig. 4(b)), the curvatures of H200-4D and H200-7D increase monotonically with temperature rise, whereas the curvature of H200-4DR falls when the temperature exceeds 150˚C. The position of the neutral axis of H200-4DR, when calculated at the full section, falls outside the cross section when internal stress is balanced due to the differential thermal expansion strain. As a result, tensile stress occurs over the full section and cracks penetrate the section after initiation. Curvature at cracked sections becomes zero, and while curvature at non-cracked sections is close to the value calculated at the full
86

section. This means that the curvature of H200-4DR approximates that calculated for the full section (the solid line in Fig. 4(b)). Namely, the average curvature of H200-4DR decreases with temperature rise after cracking. Whether a crack penetrates the section after initiation is theoretically determined from the position of the neutral axis whether it falls within the section or not at the full section. 3.2 Flexural behavior of RC beams Relationships between the flexural moment and curvature of RC beams (the M-φ relation) under various temperature conditions are shown in Fig. 5 . Calculated M-φ relations at both full and cracked sections, taking into account the effects of the temperature dependence of
87

the physical properties of concrete and reinforcement, are also superimposed in this figure. The following features of these relationships at elevated temperatures are particularly noteworthy: (i) Initial flexural rigidity of beams at elevated temperatures is much lower than at normal
temperature. (ii) No sharp change in flexural rigidity due to cracking is observed, even at relatively high
temperatures. (iii) RC beam curvature at yielding is a little higher than calculated for the cracked section,
when the calculation takes into account the effects of temperature on the physical properties of the concrete and reinforcement but not the effects of the differential thermal expansion strain.
These deformational features can be easily explained. First, (i) results from the considerable drop in Young’s modulus of concrete as temperature rises. (ii) is possible because cracks occur before flexural loading at the temperatures over 200˚C. And (iii) results from the release of accumulated strain (compressive strain in the reinforcement) due to the differential thermal expansion strain between concrete and reinforcement as the flexural moment increases; this contributes to the higher overall flexural curvature. The behavior described in (iii) can be easily understood by comparing the M-φ relations of specimens H200-2D and NH200-2D. Specimen H200-2D was tested at a temperature of 200˚C, whereas NH200-2D was tested at normal temperature after temperature cycling up to 200˚C. Young’s modulus of both specimens is considered to be almost the same, and micro cracks had already occurred before flexural loading. Thus the difference in the testing conditions is that internal stress due to differential thermal expansion strain exists in H200-2D and that the volume of tensile steel in H200-2D is a little lower. The latter factor can be excluded from the discussion because the calculated M-φ relation at the cracked section is shown in the figures. The flexural rigidity of NH200-2D after cracking is a little less than that of NB-2D, but is considerably larger than that of H200-2D. The difference in flexural rigidity results from the release of accumulated reinforcement strain induced by the differential thermal expansion strain as the flexural moment increases. This release of accumulated reinforcement strain is observed in all specimens at elevated temperatures, and the amount of strain released depends on temperature and the reinforcement ratio. The features of this released strain can be understood qualitatively from the M-φ relations of all specimens, as shown in Fig. 5 . The higher the temperature, the greater the differential thermal expansion strain; however, more cracks occur at higher temperatures, so bond performance declines. Consequently, the accumulated strain in the reinforcement is small at high temperatures, so the amount released is low. On the other hand, the accumulated strain is naturally small at low temperatures and amount of strain released is also low. The accumulated strain only becomes large at a particular temperature. Cracking occurs in RC beams with a larger reinforcement ratio at relatively lower temperatures, and the total number of cracks is greater. Consequently, the larger the reinforcement ratio, the smaller the accumulated strain due to temperature rise, and the lower the amount of released strain under flexural loading (see Fig. 5(c)). That is, large strain accumulations depend on reinforcement ratio as well as temperature. From the above discussion, it is clear that large strains accumulate in RC beam specimens at temperatures from 100˚C to 300˚C when the reinforcement ratio is relatively low. In these tests, the specimens matching those conditions were H100-2D, H200-2D, and H300-2D. Specimen H200-7D has a large reinforcement ratio and develops more cracks during heating, so its accumulated strain is released before flexural loading. The M-φ relation for H200-7D is therefore consistent with the curve calculated for the cracked section, which does not take into account the differential thermal expansion strain.
88

The concrete compressive strain and the reinforcement tensile strain within the elastic range of the RC specimen are discussed next. Results are shown in Fig. 6 . The solid lines show the results calculated at the cracked section taking into account the differential thermal expansion strain (refer to Section 4.(1).b). The following behavior is observed: (i) The concrete compressive strain is close to or smaller than the value calculated at the cracked section, so no creep behavior develops during flexural loading. (ii) The measured tensile strain is smaller than the value calculated at the cracked section when the differential thermal expansion strain between concrete and reinforcement is taken into consideration. The latter behavior is the same as observed at normal temperature. It is concluded that changes in creep behavior at high temperatures can be ignored when the loading is for a short period, while the influence of differential thermal expansion strain on the flexural behavior of RC beams is considerable. 4. ESTIMATION METHOD FOR DEFORMATIONAL BEHAVIOR UNDER DIFFERENTIAL THERMAL EXPANSION STRAIN AND FLEXURAL MOMENT 4.1 Calculation of strain at full and cracked sections The fundamental equations for calculating stresses and strains at the full and cracked sections of an RC beam are derived below. The required condition, that strain is proportional to distance between the neutral axis depth and the strain position, is satisfied even at elevated temperatures given the discussion in Section 3 above. (1) Full section The strain distribution in an RC beam with double reinforcement at a full section under high-temperature conditions is shown in Fig. 7(a). The equilibrium of sectional forces and the strain compatibility condition are applied in solving the equations, and then the depth of the neutral axis, the strain values, curvature, etc. are estimated as shown by the following expressions. Here, the flexural moment is considered and concrete creep is ignored. In Equation (1), if R2 related to flexural moment is zero, the depth of the neutral axis after heating and before flexural loading is obtained.
xn = 2(αs-αc)∆T(β1+β2)h3-3{(αs-αc)∆T(β1d1+β2d2)+R2}h2+6{(αs-αc)∆Tβ1β2(d1-d2)2-6R2(β1d1+β2d2)3(αs-αc)∆T(β1+β2)h2-6{(αs-αc)∆T(β1d1+β2d2)+R2}h-6R2(β1+β2)
(1)
εc = 2(αs-αc)∆T(β1+β2)xn
h(h-2xn) - 2(β1+β2)xn + 2(β1d1+β2d2) (2) ε t = h-xn
xnεc (3) εs1 = (d1−xn)
xnεc−(αs−αc)∆Τ (4 a)
εs2 = (d2−xn)xn
εc−(αs−αc)∆Τ (4 b) ε l,g = αc∆T-εc+(εc+ε t)xg
h (5) φg = (εc+ε t)
h (6)
Here, β1 = np1d1 β2 = np2d2 R2 = Mex
bEc b: breadth of RC beam; h: height of RC beam; di : depth of i-th reinforcing bar; Asi: cross-sectional area of i-th reinforcing bar; αc: thermal expansion coefficient of concrete; αs: thermal expansion coefficient of reinforcement; ∆T: amount of temperature rise; εc: stressed
b
d1 d2
xn
εs1
εs2αc∆T
αsΔT
εtu
hc
εc
h
b
d1 d2
εc
xn
εs1εs2
αcΔT
αsΔT εt
h
M
M
As1 As2
As1 As2
(a) at full section
(b) at cracked section
Fig.7 Strain distributions in the sections
89

strain of concrete at the compressive fiber of RC beam (>0 = compression); ε t: stressed strain of concrete at the tensile fiber of RC beam (>0 = tension); εsi: stressed strain of i-th reinforcing bar (>0 = tension); Ec: Young’s modulus of concrete at elevated temperature; Es: Young’s modulus of reinforcement at elevated temperature; xn: depth of neutral axis; pi: reinforcement ratio of i-th reinforcing bar (Asi/bdi); n; Young’s modulus ratio (Es/Ec); xg: depth of centroidal axis; ε l ,g: longitudinal deformation of RC beam considered along centroidal axis; φg: curvature of RC beam; and Mex: flexural moment. (2) Cracked section The strain distribution of an RC beam with double reinforcement at a cracked section under high-temperature conditions is shown in Fig. 7(b). Eqs. (7) and (8) are the equilibrium conditions for sectional forces and Eqs. (9), (10), and (11) give the compatibility conditions for strain. The depth of the neutral axis, strains, flexural moment, etc. are determined by solving these simultaneous equations. Explicit expressions of hc and xn can not be obtained, so these equations are solved numerically. 12
xnbEcεc-12
(hc-xn)bEcε tu-As1Esεs1-As2Esεs2 = 0 (7)
13
xn2bEcεc-1
3(hc-xn)2bEcε tu-As1Esεs1(d1-xn)-As2Esεs2(d2-xn) = Mex (8)
εc = xn
hc-xnε tu (9) εs1 = d1-xn
hc-xnε tu-(αs-αc)∆T (10a) εs2 = d2-xn
hc-xnε tu-(αs-αc)∆T (10b)
xn = hc2ε tu 2(β1d1+β2d2)ε tu-2hc(β1+β2)(αs-αc)∆T
2[hcε tu+(β1+β2){ε tu-(αs-αc)∆T}] (11)
ε l,cr = αc∆T+{(αs-αc)∆T+εs2}xg-xn
d2-xn (12) φcr = εc + ε tu
hc (13)
Here, ε tu: ultimate tensile strain of concrete; hc: distance between compressive and tensile fibers at cracked section; ε l , c r: longitudinal deformation of RC beam considered along centroidal axis; and φcr: curvature of RC beam.
Stresses and strains of RC beam at the full and cracked sections are calculated using the equations. Drying shrinkage strain should be added to the differential thermal expansion strain if it is to be taken into consideration. 4.2 Estimation method for deformation of RC beam based on ACI method of average flexural rigidity (1) Unrestrained deformation during heating The M-φ relations for RC beams after cracking and subjected to a flexural moment are obtained using the following formula as adopted in the ACI code[3] for the average flexural rigidity.
EcIeff = EcIg(Mcr
M)
3 + EcIcr{1 - (Mcr
M)3} (14)
Here, Ec: Young’s modulus of concrete; Ig and Icr: moments of inertia at full and cracked sections; Mcr: flexural moment at cracking; and M: flexural moment considered. This formula is suggested by ACI on the basis of the experimental finding that the flexural rigidity of RC beams after cracking begins to diverge from the full sectional rigidity and approaches that of the cracked section as the flexural moment increases. It was shown in a previous paper [2] that the differential thermal expansion strain has an influence on the cracking and deformation of RC beams in a similar way. Hence, the basic
90

concept of the ACI method might be applied in estimating unrestrained deformation during heating. The differential thermal expansion strain, (αs-αc)∆T, is taken into consideration instead of the flexural moment and (similarly to the ACI formula) the following formula for estimating the unrestrained deformation during heating is suggested:
Keff = Kgηm+Kcr(1-ηm) (15a)
η = (αs,cr-αc,cr)∆Tcr
(αs-αc)∆T (15b)
Here, modulus K corresponding to the flexural rigidity is defined (see Fig. 8(a)). Modulus K including Kg, Kcr, and Keff is substituted for the fundamental quantities at the section of the RC beam under consideration, and then the following formula is obtained:
φT,ave = φT,gφT,cr
φT,crηm+φT,g(1-ηm) (16)
Formula (17) expresses the unrestrained curvature induced by the differential thermal expansion strain under high-temperature condition, and the difference between φT,cr and φT,ave can be treated as the latent curvature released with flexural loading. This latent curvature results in the same deformation as the release of accumulated strain described in Section 3. The unrestrained longitudinal deformation during heating can also be estimated using a similar approach. It is defined along the centroidal axis at the full section of a RC beam (see Eqs. (5) and (13)) because of the strain gradient at the cross section. The experimental results of longitudinal deformation are given for the location of the centroidal axis.
ε lT,ave = αc∆T+ (ε lT,g-αc∆T)(ε lT,cr-αc∆T)(ε lT,cr-αc∆T)ηm + (ε lT,g-αc∆T)(1-ηm)
(17)
The above derivation of the formulas has been done for RC beams with a non-symmetrical arrangement of reinforcement, so both curvature and longitudinal deformation with temperature rise were considered. On the other hand, no curvature occurred in the RC beam with a symmetrical cross-sectional reinforcement arrangement (see H400-2DR in Fig. 1), while longitudinal deformation did occur as the temperature rose. A concept similar to the ACI’s was applied to estimate the unrestrained longitudinal deformation, leading to derivation of the following formula:
ε lT,ave = αc∆T+ (αs-αc)∆Tε t
(αs-αc)∆Tηm+ε t(1-ηm) (18)
Here, αc ,c r and αs ,c r: thermal expansive coefficients of concrete and reinforcement at the temperature when initial cracking occurs, respectively; ∆Tcr: amount of temperature rise from normal temperature at initial cracking; φT,ave and ε lT ,ave: average curvature and average
91

longitudinal deformation of RC beam with heating; φT,g and φT,cr : Eqs. (6) and (14) derived under the condition that the flexural moment is zero, respectively; ε lT ,g and ε lT ,c r: Eqs. (5) and (13) derived under the condition that the flexural moment is zero, respectively; ε t : tensile strain of concrete calculated for the full section; m: power constant (=2 for RC beams with non-symmetrical arrangement of reinforcement and =3 for symmetrical reinforcement arrangement). The power constant, “m” (explained later) is determined based on comparing the calculated results with the experimental ones. In doing this, a number of considerations were necessary. First, since strain due to differential thermal expansion, including drying shrinkage strain, can cause cracks and has a self- restraining property, less energy is released under initial cracking and continuous crack propagation. Accordingly, less deformation occurs as compared with deformation caused by a flexural moment. Therefore, power constant m is set at 2 in formulas (17) and (18), while power constant m in the ACI formula for estimating average flexural rigidity is set at 3. However, this value of m equal to 3 gives better estimation with formula (19), which estimates the longitudinal unrestrained deformation of RC beams with a symmetrical reinforcement arrangement. Symmetrical and non-symmetrical reinforcement arrangements lead to different cracking patterns: cracks that penetrate and do not penetrate the cross section. Different power constants should be applied to these cases. (2) Curvature due to flexural moment a) Estimation formula for average flexural rigidity The ACI method might also be extended to cases where a flexural moment is applied at elevated temperature. In this case, two special factors have also to be considered: (i) The differential thermal expansion strain between concrete and reinforcement. (ii) Internal stress or cracks induced by the differential thermal expansion strain before
flexural loading. Here, (i) is the part of the accumulated compressive strain of the reinforcement induced as a result of the differential thermal expansion that remains after cracking during heating. Figure 8(b) shows the basic concept underlying the estimation of the M-φ relation for a RC beam at elevated temperature, including the effects of the strain released during flexural loading. The average flexural rigidity under high-temperature conditions is introduced using the following procedure: (i) Calculate the curvature of the RC beam at the cracked section when the yield flexural
moment is acting, taking into account the temperature dependence of physical properties and the differential thermal expansion strain, φy,cr.
(ii) Subtract the unrestrained curvature during heating (φT,ave) from the curvature at the cracked section: φy,cr- φT,ave.
(iii) Define the secant modulus between yield flexural moment and (φy,c r- φT,ave). (iv) Take the secant modulus to be the flexural rigidity at the cracked section: Ec(T)・Icr ,h. The release of accumulated strain begins at initial cracking during heating, so the difference between φy,cr and φT,ave can be considered the released deformation due to flexural loading as described in Section 4.(2)a) (see Fig. 8(c)). The effect of internal stresses or cracks prior to flexural loading can be estimated from the equivalent moment, M0, under the temperature condition of interest. The average flexural rigidity of an RC beam at elevated temperature can then be expressed using the following formula based on the above discussion:
[EI]eff,h = Ec(T)Ig( McrM+M0
)3+Ec(T)Icr,h{1-( Mcr
M+M0)3} (19)
Here, [EI]eff ,h: average flexural rigidity of RC beam at elevated temperature; Ec(T)・ Ig: flexural rigidity at full section considering only temperature dependence of physical properties; Ec(T)・ Icr,h: flexural rigidity at the cracked section as discussed above; Mcr: cracking moment at temperature when initial cracking occurs during heating as calculated by the conventional method; M0: equivalent moment estimated using Eq. (21), which is
92

introduced to account for the influence of internal stress during heating, ; at initial flexural cracking; φy: yield curvature of RC beam calculated at the cracked section at the loading stage, {My/(Ec(T)・Icr,h)-φT,ave}. b) Estimation of M0 Since stresses or cracks occurred during heating prior to flexural loading, the equivalent moment, Mo, is estimated using Eq. (21), in which the influence of internal stresses or cracks is considered.
M0 = Mcr - MT,cr normal temp.=<T< Tcr (20a) M0 = Mcr Tcr =<T {when T=Tcr, MT,cr=0}
(20b)
Mcr = Ec(T)Igε tu
y (21)
Here, Mcr: cracking moment calculated by the conventional method; ε tu: ultimate tensile strain of concrete; y: depth of neutral axis calculated at the full section considering the temperature condition at initial cracking but not considering the differential thermal expansion strain; MT,cr: cracking moment; Mex in Eq. (3) when ε t is equal to ε tu, considering the differential thermal expansion strain; Tcr: temperature condition at cracking (MT,cr is calculated at this temperature.); and T: temperature in question.
Cracking during both heating and loading stages is judged according to the criterion that the strain at the tensile fiber estimated using Eq. (3) exceeds the ultimate tensile strain of the concrete at the temperature in question. Here, a value of 100 10-6 is adopted for the heating stage, while during loading the value is taken to be the tensile strength of the concrete divided by Young’s modulus at the temperature in question. 4.3 Applicability of estimation method (1) Unrestrained deformation during heating The applicability of the proposed formulas for an RC beam with a non-symmetrical reinforcement arrangement was investigated by estimating two cases of unrestrained deformation during heating: (i) longitudinal deformation and, (ii) curvature. The drying shrinkage strain before heating, εsh=200 10-6, was take into account in the calculations. The results are plotted in the figures. The temperature dependence of the physical properties of the concrete and reinforcement material used was as given in the appendix. a) Unrestrained longitudinal deformation The unrestrained longitudinal deformation of RC beams at the centroidal axis as estimated using formula (18) is given in Fig. 9 , in comparison with measured values. The power constant, m, is set at 2 in formula (18) because these RC beams have non-symmetrical reinforcement arrangements. The estimates agree with the experimental results at various high temperatures and with a number of different reinforcement ratios, so the validity of the proposed method is confirmed. Drying shrinkage has a tendency to promote cracking at an earlier stage of heating and thus cause an increase in longitudinal deformation, but this effect is minor. A comparison of the measured longitudinal deformation for H400-2DR with an estimate
0
400
800
1200
1600
0 50 100 150 200 250 300 350 400Expa
nsiv
e st
rain
(x10
-6)
Amount of temperature change ( ℃)(a) H200-2D,H200-4D,H1200-7D
calculated measured―: εsh= 0μ …: εsh=200μ
H200-2D
H200-4DH1200-7D
●
0 50 100 150 200 250 300 0 50 100 150 200
0
1000
2000
3000
4000
5000
0 100 200 300 400 500 600 700
(b) H300-2D,H400-2D,H500-2D,H400-2DR
calculated
―: εsh= 0μ
…: εsh=200μ
H300-2D
H400-2D
H500-2Dmeasured
H400-2DR
steel
concrete
Fig.9 Comparison between measured and calculated strain at heating stage
Amount of temperature change ( ℃)
Expa
nsiv
e st
rain
(x10
-6)
●
0 100 200 300 400 500 600 0 100 200 300 400 500
0 100 200 300 400
93

obtained using formula (19) is shown in Fig. 9(b). The power constant, m, is set at 3 in formula (19) because H400-2DR has a symmetrical reinforcement arrangement. The estimated results agree fairly well and the validity of formula (19) is confirmed. It is concluded that the proposed methods are effective for estimating the unrestrained deformation of RC beams during heating, and that the value of the power constant in the formulas should be adjusted for the cases of RC beams with symmetrical and non-symmetrical reinforcement arrangements. b) Curvature The curvature of RC beams with single reinforcement arrangement as calculated using formula (17) is shown in Fig. 10 in comparison with the experimental results. The power constant, m, is set at 2 here also. The calculated results agree with the experimental ones except for the cases of H300-2D, and the validity of the proposed formula is confirmed. Initial cracking occurred at an earlier stage of heating in the cases of specimen H300-2D, and the calculated results are much smaller than the experimental results. Specimen H300-2D seems to be under conditions that make it susceptible to cracking. (2) Deformation due to flexural moment a) RC beams with single reinforcement arrangement The M-φ relations calculated using formula (20) are shown in Fig. 11(a), Fig. 11(b) , and Fig. 11(c) in comparison with the experimental results. Curvature due to flexural loading is shown, being connected to those during heating (see Fig. 8(c)). This means the starting points of all specimens are not zero, therefore the measured and calculated values of curvature under no flexural moment are not consistent. The power constant, m, is set at 3 in formula (20) because the flexural loading stage is being considered. On the whole, it is judged that the proposed formula gives good estimates of the experimental result. From a more detailed perspective, some differences can be seen. For example, the calculated results for H500-2D are over-estimates compared with the experimental results, and the calculated curvatures of H300-2D and H400-2D when the flexural moment is zero are different from the measured values. However, the yield curvatures are estimated well. The proposed formula thus provides good estimates of total curvature from the heating to the loading stages. The proposed formula includes a special provision related to how flexural rigidity is estimated at the cracked section: the accumulated compressive reinforcement strain between c racks , wh ich i s caused by d i ff e r en t i a l the rma l expans ion be tween conc re t e and reinforcement, is released as f lexural loading increases and contributes to increased curvature. This knowledge is introduced into the estimation formula for flexural rigidity at the cracked section (refer to Section 4.(2)b); the difference between φT,cr and φT,ave , which is the latent deformation released as flexural loading rises, is used to estimate the average flexural rigidity). The influence of this latent deformation should be considered in cases where the reinforcement ratio is relatively low and the temperature is around 200˚C. However, there may be no need to consider it in cases where temperatures are over 300˚C or where there is a relatively large reinforcement ratio even at a temperature of 200˚C, because
0
50
100
150
200
0 10 20 30 40 50 60
Curvature (x10-4/m)(a) H200-2D,H200-4D,H200-7D
calculated : sh= : sh=200A
mou
nt o
f tem
pera
ture
ch
ange
()
crackedsection
full section
measured
H200-2DH200-4DH200-7D
0 10 20 30 40 0 10 20
0
100
200
300
400
500
0 20 40 60 80 100
(b) H300-2D,H400-2D,H500-2D
: sh= 0
crackedsection
: measuredcalculated
H300-2DH400-2DH500-2D
Fig.10 Relationship between curvature and amount of temperature change
Curvature (x10-4/m)
full section
: sh=200
Am
ount
of t
empe
ratu
re
chan
ge (
)
0 20 40 60 800 20 40
94

Fig. 11 Relationship between curvature and flexural moment most latent deformation is released during heating. Consequently, the flexural rigidity calculated at the cracked section in consideration only of the temperature dependence of the physical properties might be suitable for calculating the average flexural rigidity during the loading stage. b) RC beams with double reinforcement arrangement The M-φ relations for H400-2DR and H200-4DR are shown in Fig. 11(d); in these specimens, the cracks penetrate the cross section during heating. As a result, the curvature of these specimens before flexural loading is assumed to be zero. The curvature of specimen H200-4DR before flexural loading is not zero in the strict sense because of the non-symmetrical reinforcement arrangement, but it can be considered close to zero. In this study, the unrestrained curvature of the specimen, which increases as the temperature rises before cracking and decreases as the crack penetrates the cross section, has not been considered, so it cannot be estimated (see Fig. 4(b)). However, it might be possible to estimate the M-φ relation using a method similar to that described in Section 4.(2)b). First, the curvature of the beam at yielding is calculated considering the differential thermal expansion and the dependence of physical properties on temperature.Secondly, the secant modulus is defined as the flexural rigidity at the cracked section using the yielding flexural moment and the yielding curvature, and thirdly, formula (20) is applied. The crucial point is how the influence of cracks penetrating the cross section on the curvature after cracking is incorporated into the estimation formula. Here, the flexural rigidity at the cracked section is calculated as mentioned earlier, and the condition giving the maximum curvature (that is, no release of latent curvature during heating) is adopted.
The calculated results of H400-2DR agree with the experimental ones very well (see Fig. 11(d) and this confirms the validity of the above approach. On the other hand, the latent curvature of H200-4DR is fully released during heating because of its relatively large reinforcement ratio, and the measured results agree with those calculated from the flexural rigidity at the cracked section when only the temperature dependence of physical properties
0
10
20
30
40
50
60
0 20 40 60 80 100 120 140
Flex
ural
mom
ent (
kN-m
)
Curvature (x10 -4/m)(a) NB-2D,H100-2D,H200-2D
calculated
… :εsh=200μ― :εsh= 0μ
full section
crackedsection
NB-2DH100-2D
H200-2D
0 20 40 60 80 100 120 0 20 40 60 80 100
: measured: yield point
○●
0
10
20
30
40
50
20 40 60 80 100 120 140 160 1800 40 60 80 100 120 140 160
0 40 60 80 100 120 140
H300-2D
H400-2D
H500-2D
(b) H300-2D,H400-2D,H500-2D
crackedsection
full section
Curvature (x10 -4/m)
Flex
ural
mom
ent (
kN-m
)
calculated
… :εsh=200μ― :εsh= 0μ
: measured: yield point
○●
0
20
40
60
80
100
120
140
20 40 60 80 100 120 140 160 180
(c) H200-4D,H200-7D
H200-4D
H200-7D
0 30 50 70 90 110 130 150
Flex
ural
mom
ent (
kN-m
)
Curvature (x10 -4/m)
crackedsection
full section
: measured: yield point
○
●
calculated
… :εsh=200μ― :εsh= 0μ
0
20
40
60
80
100
0 20 40 60 80 100 120 140 160
(d) H400-2DR,H200-4DR
H400-2DR
H200-4DR
0 20 40 60 80 100 120 140
Flex
ural
mom
ent (
kN-m
)
Curvature (x10 -4/m)
crackedsection
full section
calculated
… :εsh=200μ― :εsh= 0μ
: measured: yield point
○●
95
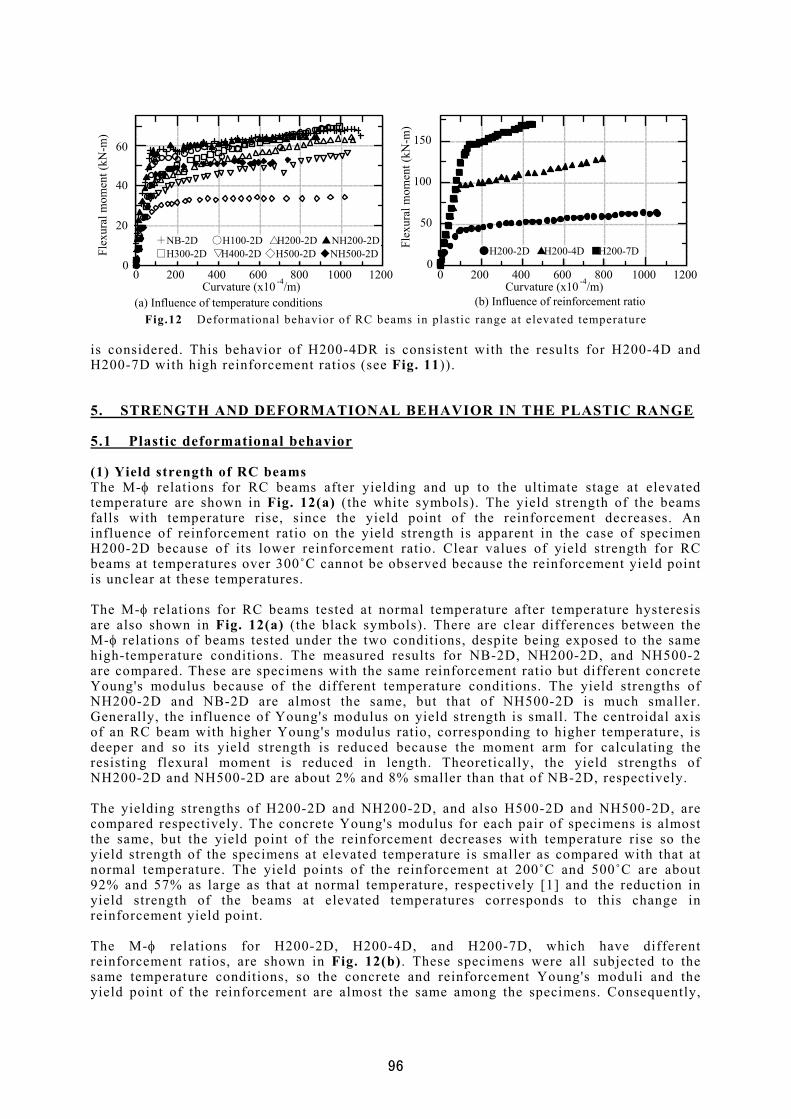
Fig.12 Deformational behavior of RC beams in plastic range at elevated temperature is considered. This behavior of H200-4DR is consistent with the results for H200-4D and H200-7D with high reinforcement ratios (see Fig. 11)).
5. STRENGTH AND DEFORMATIONAL BEHAVIOR IN THE PLASTIC RANGE 5.1 Plastic deformational behavior (1) Yield strength of RC beams The M-φ relations for RC beams after yielding and up to the ultimate stage at elevated temperature are shown in Fig. 12(a) (the white symbols). The yield strength of the beams falls with temperature rise, since the yield point of the reinforcement decreases. An influence of reinforcement ratio on the yield strength is apparent in the case of specimen H200-2D because of its lower reinforcement ratio. Clear values of yield strength for RC beams at temperatures over 300˚C cannot be observed because the reinforcement yield point is unclear at these temperatures. The M-φ relations for RC beams tested at normal temperature after temperature hysteresis are also shown in Fig. 12(a) (the black symbols). There are clear differences between the M-φ relations of beams tested under the two conditions, despite being exposed to the same high-temperature conditions. The measured results for NB-2D, NH200-2D, and NH500-2 are compared. These are specimens with the same reinforcement ratio but different concrete Young's modulus because of the different temperature conditions. The yield strengths of NH200-2D and NB-2D are almost the same, but that of NH500-2D is much smaller. Generally, the influence of Young's modulus on yield strength is small. The centroidal axis of an RC beam with higher Young's modulus ratio, corresponding to higher temperature, is deeper and so its yield strength is reduced because the moment arm for calculating the resisting flexural moment is reduced in length. Theoretically, the yield strengths of NH200-2D and NH500-2D are about 2% and 8% smaller than that of NB-2D, respectively. The yielding strengths of H200-2D and NH200-2D, and also H500-2D and NH500-2D, are compared respectively. The concrete Young's modulus for each pair of specimens is almost the same, but the yield point of the reinforcement decreases with temperature rise so the yield strength of the specimens at elevated temperature is smaller as compared with that at normal temperature. The yield points of the reinforcement at 200˚C and 500˚C are about 92% and 57% as large as that at normal temperature, respectively [1] and the reduction in yield strength of the beams at elevated temperatures corresponds to this change in reinforcement yield point. The M-φ relations for H200-2D, H200-4D, and H200-7D, which have different reinforcement ratios, are shown in Fig. 12(b) . These specimens were all subjected to the same temperature conditions, so the concrete and reinforcement Young's moduli and the yield point of the reinforcement are almost the same among the specimens. Consequently,
0
20
40
60
0 200 400 600 800 1000 1200
(a) Influence of temperature conditions
+NB-2D ○H100-2D △H200-2D ▲NH200-2D□H300-2D ▽H400-2D ◇H500-2D ◆NH500-2DFl
exur
al m
omen
t (kN
-m)
Curvature (x10 -4/m)
0
50
100
150
0 200 400 600 800 1000 1200
(b) Influence of reinforcement ratio
●H200-2D ▲H200-4D ■H200-7DFlex
ural
mom
ent (
kN-m
)
Curvature (x10 -4/m)
96

the yield strength of the beams corresponds to the reinforcement ratio. (2) Ultimate strength and deformational capacity In the case of some specimens, flexural failure was not clearly confirmed in the tests at high temperature. For these specimens, consisting of 200-2D, H300-2D, H400-2D, H500-2D, and H400-2DR, the ultimate state was reconfirmed at normal temperature after temperature hysteresis (see Table 3). Except in the case of H400-2DR, these beams reached flexural failure at the same ultimate deformation as observed in the tests at elevated temperatures. It is concluded that flexural failure of the beams was in fact attained in the high-temperature tests taking into account the temperature dependence of the physical properties of concrete and reinforcement. A larger ultimate deformation was observed in specimen H400-2DR when tested at normal temperature as compared with that at 400˚C, and it is concluded that flexural failure of H400-2DR was not attained at 400˚C. The ultimate flexural deformation of H400-2DR at high-temperature is expected to be at least that at normal temperature, and the ultimate capacity can not be estimated definitely. It might be taken as a little larger than that measured in the test at high temperature because a slightly larger ultimate deformation is expected. a) Ultimate deformational capacity of RC beams under various temperature conditions The ultimate curvature of all specimens tested under various temperature conditions was about 1000 10-4 1/m (see Fig. 12(a)) and there is scarcely any difference in ultimate curvature of the RC beams. The ultimate compressive deformational capacity of concrete increases with rising temperature, and this contributes to the increased ultimate deformational capacity of an RC beam. However, the compressive area of the cross section of the RC beam resisting the ultimate flexural moment also increases because of the reduced compressive strength of the concrete. Consequently, the reinforcement tensile strain at the ultimate state, when the concrete compressive strain reaches the limit strain, falls to a small value and this contributes to the lower ultimate deformational capacity. It appears that the factors influencing the ultimate deformational capacity offset each other. b) Ultimate strength In the plastic range, the flexural moment resisted by specimens H200-2D and H300-2D increased considerably after yielding and large ultimate strength developed. This is because the stress-strain characteristics of the reinforcement at elevated temperatures influence the ultimate capacity of the RC beam. The tensile reinforcement strain in RC beams with a reinforcement ratio of 0.57% is judged to be about 3%-4%, and the stresses corresponding to this tensile strain rank in the order H300-2D, H200-2D, NB-2D, H100-2D, H400-2D, and H500-2D [1]. The deformational behavior of RC beams in the plastic range was observed to correspond to the characteristics of the stress-strain relation of the reinforcement at elevated temperatures. Concrete compressive strength is inclined to decrease with rising temperature, but this has less effect on the ultimate strength of the RC beam than the stress-strain characteristics of the reinforcement. c) Effects of varying reinforcement ratio The effects of different reinforcement ratios on the deformational behavior of RC beams tested at 200˚C are investigated (see Fig. 12(b)). The ultimate strength of the RC beams rises as the reinforcement ratio is increased, and the ultimate deformational capacity becomes small. This is the same tendency as observed at normal temperature. 5.2 Estimation method for ultimate strength and deformational capacity (1) Stress-strain relation of concrete The concrete stress-strain relation shown in Fig. 13 is adopted; the relation is expressed by parabolic and straight lines [4]. Compressive strength at high-temperature is estimated using Eq. (1) in the appendix, and the characteristics of the stress-strain curve, ε0 and εu, are estimated using the equations below, as proposed in a previous paper [1]. (i) ε0: Strain at maximum compressive stress ε0(T)ε0,n
= 2.5x10⁻³T + 0.95 normal temp.=<T=<500 oC (22)
(ii) εu ; Ultimate compressive strain
97

h
b
As1 As2
d1 d2
xnM
y
αcΔT
εs1
εs2
εc
σs1
σs2
σc
αsΔTεcεo
0.85 f'c
εu
σc
σ(εc)=0.85f'c{2(εc/ε0) - (εc/ε0)2}
0≦εc≦ε0
σ(εc)=0.85f'cε0<εc≦εu
Fig. 13 Stress-strain relation of concrete Fig.14 Stress and strain distribution of RC beam at
the ultimate state εuε0
= 1.10~1.75 (23)
The ratio of εu to ε0 (the strain ratio) is generally made 1.75 for normal temperature; that is, ε0 is 2,000 10-6 and εu is 3,500 10-6. Here, strain ratios of 1.10 through 1.75 were substituted in the calculation to investigate the effects of strain ratio on ultimate capacity. A value of ε0 equal to 1,800 10-6 was adopted based on experimental stress-strain relations obtained at normal temperature, so εu was made 3,150 10-6 to obtain a strain ratio of 1.75. (2) Stress-strain relation of reinforcement The stress-strain relations for normal temperature, 100˚C,200˚C,300˚C,400˚C, and 500˚C, as given in a previous paper are applied (as referenced in the appendix). The stress-strain relation at normal temperature is applied to the calculations for NH200-2D and NH500-2D because the experimental results showed that the mechanical properties of the reinforcement at normal temperature after high-temperature hysteresis to about 600˚C never change [5]. (3) Calculation of ultimate strength and deformational capacity The ultimate assumed stresses and strains in the cross section of the RC beam are illustrated in Fig. 14 . The differential thermal expansion between concrete and reinforcement was considered and the assumption that a plane remains a plane was also adopted in the calculation. The ultimate strength and deformational capacity can then be obtained based on the equilibrium condition of longitudinal forces at the cross section. An iterative method of calculation was necessary because the measured stress-strain relations of the reinforcement were applied. 5.3 Investigation of calculated results The calculated results of yield strength, deformation at yielding, ultimate strength, and ultimate deformational capacity for the RC beams are listed along with the measured results in Table 3 . The yielding curvature was obtained by subtracting the curvature when the flexutral moment was zero, that is the curvature due to heating only, from the calculated result at yielding considering the differential thermal expansion as well as the temperature dependence of the physical properties. The curvature due to heating is ignored in the calculation of ultimate capacity because of its minor influence. (1) Calculation of yield strength and curvature at yielding The yield point of an RC beam under high-temperature conditons is judged to be the state when the tensile strain in the reinforcement, as shown in Fig. 7(b) reaches the yield strength of the reinforcment. The yield strength of the RC beam is then calculated using Eq. (10). The curavature at yielding at normal temperature is obtained conventionally from the yield flexural moment and the average flexural rigidity expressed by formula (15) considering the contribution of concrete to the tensile resistesnce. The same approach can be applied to high-temperature conditions. The curvature at yielding is obtained from the yield flexural moment and the average flexural rigidity expressed by formula (20), in which the effects of tensile resistance of the concrete and the differential thermal expansion on curvature are
98

Table 3 Calculated results of curvatures of RC beams at yielding and ultimate states Yie ld ing s t reng th
(kN-m) Curva ture a t yie ld po in t
φ y ( 10 - 4 /m) * 4
Ul t imar te s t reng th (kN-m)
Curva ture a t u l t imateφu ( 10 - 4 /m)
Spec imen
Compress ive s t reng th * 1
(N/mm2 )
ε 0
* 2
ε u* 3
ε u ε 0
Exp . Ca l . ra t io Exp . Cal . ra t io Exp . Cal . ra t io Exp . Ca l . ra t ioNB-2D 50.6 1800 3150 1.75 57.5 49.3 1.17 73 56 1.30 68.6 70.3 0.98 1066 1054 1.01NH200-2D 38.5(87%) 2600 3640 1.40 57.5 48.2 1.19 78 65 1.20 64.0 66.8 0.96 883 908 0.97
28.3(65%) 4400 1.10 45.4 1.00 99 97 1.02 62.8 0.84 771 0.9721.7(50%) 5200 1.30 60.9 0.87 758 0.97
NH500-2D
17.3(40%)
4000
5900 1.48
45.5
52.8
58.6 0.90
737
730 1.01H100-2D 42.1(94%) 2150 3220 1.50 53.6 46.7 1.15 87 67 1.30 69.6 63.0 1.10 933 958 0.97
41.6(87%) 2600 3640 1.40 42.8 36.5 1.17 97 89 1.09 63.2 58.6 1.08 1058 1126 0.94H200-2D tested at normal tenmp. * 5 65.4 1076
35.5(78%) 3000 4500 1.50 42.8 34.1 1.26 90 76 1.18 69.5 71.3 0.97 992 981 1.01H300-2D tested at normal tenmp. * 5 69.8 1036
32.0(71%) 4900 1.40 31.9 1.07 78 73 1.07 65.1 0.86 1035 1.0027.0(60%) 5600 1.60 64.1 0.88 1038 1.0022.5(50% )
3500
6125 1.75
34.2
56.2
62.1 0.90
1033
992 1.04
H400-2D
tested at normal tenmp. * 5 50.4 1034 23.7(63%) 5200 1.30 27.5 0.97 77 72 1.07 48.5 0.71 1063 0.9618.8(50%) 6000 1.50 47.3 0.72 1032 0.9915.1(40%)
4000
7000 1.75
26.7
34.2
46.0 0.74
1017
1015 1.00
H500-2D
tested at normal tenmp. * 5 41.7 1024 H200-4D 41.4(86%) 2600 4550 1.75 97.0 88.2 1.10 97 94 1.03 128.4 122.4 1.05 791 682 1.16H200-7D 41.9(86%) 2600 4160 1.60 136.7 140.0 0.98 121 113 1.07 170.9 156.4 1.09 447 435 1.03
30.6(71%) 4550 1.30 32.9 0.94 107 97 1.10 66.7 0.88 1193 1.0125.8(60%) 4900 1.40 66.3 0.89 1220 0.9921.5(50%)
3500
5250 1.50
30.8
58.8
65.6 0.90
1210 (1005)
* 6 1216 1.00
H400-2DR
tested at normal tenmp. * 5 65.1 1210 H200-4DR 41.6(48.3) 2600 4550 1.75 91.3 87.8 1.04 108 113 0.96 133.8 129.9 1.03 1030 869 1.19
*1) Strength at high temp. is calculated by Eq.(1) in the appendix. Value in( ) is ratio of strength at high temp. to that at normal temp.. *2) Strain at maximum stress on stress-strain curve *3) Ultimate strain on stress-strain curve *4) Values calculated by the suggested method. Drying shrinkage is not considered. *5) Since flexural failure of RC beam was not confirmed at high temp., failure test was performed after cooling. Using the data for H200-2D,H300-2
D,H400-2D, and H500-2D, measured data at high temp. are judged to be ultimate curvatures. *6) Maximum curvature obtained from the test of H400-2DR at normal temp. is considered to be the ultimate curvature under high-temp.conditions.
Value in ( ) is measured data at high temp.. taken into account. The calculated values of yield strength and curvature at yielding as listed in Table 3 show the good agreement with the experimental results, though they are generally a little small. Under-estimation of the yield flexural moment leads to the rather small curvature. The calculated M-φ relations for most of the RC beams are consistent with the experimental ones, as shown in Fig. 11 , so it is deduced that the effects of differential thermal expansion strain as well as the temperature dependence of the physical properties of the concrete and reinforcement on curvature under flexural loading need to be taken into account in the curvature estimation method at yielding. (2) Calculation of ultimate strength and deformatonal capacity Calculated values of ultimate strenth and deformaional capacity for the RC beams were investigated by considering three test parameters. Concrete creep at elevated temperatures was ignored, since the results of short-term loading given in Section 3.(2) indicate that the effects are minor. a) Test temperature The ultimate strength of H500-2D and NH500-2D is considerably underestimated as compared with the experimental results, as Table 3 shows, but the calculated ultimate strength and deformational capacity of other specimens are estimated well as long as suitable strain ratios are selected. The strain ratio is inclined to be lower as temperature rises, and it is judged from the experimental results that the strain ratio is 1.75 at normal temperature, from 1.40 to 1.50 at 200˚C -400˚C, and from 1.10 to 1.20 at 500˚C. b) Compressive strength of concrete
99

The formula for estimating compressive strength at elevated temperatures is a regression equation derived from experimental data [6], a part of which include experiments performed at 400˚C and 500˚C at 28 days. The age of the RC beams at testing was two to six months, so it might be expected that the estimation formula will over-estimate the residual compressive strength as compared with the actual value. Moreover, the calculated ultimate strength of H400-2D and 500-2D is considerably overestimated, so the influence of estimated compressive strength at elevated temperatures on the ultimate strength of RC beams was investigated. A concrete compressive strength lower than that estimated using Eq. (1) in the appendix was adopted. Namely, in the case of H400-2D, compressive strength was calculated from the strength at normal temperature using ratio(strength ratio) of 0.6 and 0.5. Strength ratios of 0.5 and 0.4 were used for the calculation in the cases of H500-2D and NH500-2D. The accuracy of the estimated ultimate strength and deformational capacity remains unchanged even when these reduced compressive strengths are used, so strain ratios of 1.5 and 1.75, corresponding to the good estimate, are selected. c) Arrangement of reinforcement The RC beams with reinforcement in the compressive area, specimens H200-2DR and H400-2DR, develop greater ultimate curvature than those without compressive reinforcement because the reinforcement shares the compressive stress. The caculation reflects this tendency. When compressive strength is calculated using Eq. (1) in the appendix, the strain ratios corresponding to the good estimate of ultimate capacity are around 1.3 for H400-2DR tested under high-temperature conditions and 1.75 for H200-2DR, the results of which are consistent with the results so far. The application of the reduced compressive strength to the calculation of H400-2DR was also investigated. The strain ratio corresponding to the good estimate for the ultimate capacities increases and that of 1.4 through 1.5 was selected. (3) Consideration of ultimate compressive strain The ultimate compressive strain derived from the strain ratio discussed above; corresponding to the good estimate of ultimate capacity for RC beams at elevated temperatures, is investigated in relation to temperature. Here, the ratio of concrete ultimate compressive strain at elevated temperature to that at normal temperature is the factor investigated. The ultimate compressive strain discussed above is plotted in Fig. 15 against temperature. The investigated results concerning the reduced compressive strengths for spcimens tested at 400˚C and 500˚C are also plotted. Though there is some dispersion in the plotted data, the trend is for concrete ultimate compressive strain at elevated temperatures to increase with temperature, and this behavior is considered to be valid qualitatively. These estimates of concrete ultimate compressive strain at elevated temperature (see Eq. (25)) cannot be expected to be as accurate as estimates of the temperature dependence of strain at maximum compressive stress (as expressed by Eq. (23)). However, Eq. (25) does provide a rough guide to the temperature dependence of ultimate compressive strain at elevated temperatures. The gradient of ultimate compressive strain against temperature is a little less than that of the strain at maximum compressive stress against temperature. εu(T)εu,n
= 1.7x10⁻³T + 0.97 normal temp.=<T=<500 oC (24)
3000
4000
5000
6000
7000
0 100 200 300 400 500
Ulti
mat
e co
mpr
essi
ve st
rain
(x10
-6)
Temperature (℃)Fig.15 Relationship betweem temperature and ultimate compressive strain
εu(T)/ε
u,n=1.7x10⁻³ T+0.97
(r=0.95)
H200-0DNH000-2DH000-2D H000-2D f'c decreased
NH000-2D f'c decreased○
△
●
▲
■
H000-0DRH400-2DR f'c decreased
◆
◇
100

These investigation clarify that, in order to estimate the ultimate strength and deformational capacity of RC beams at elevated temperatures, the temperature dependence of the physical properties of the concrete and reinforcement, and especially the stress-strain relations of the reinforcement in the plastic range, must be taken into account. It is concluded that the calculation using the temperature dependence of physical properties, the strain at maxumum compressive stress, and the ultimate compressive strain suggested in this paper (see Eq. (25)) leads to the good estimation of ultimate strength and deformational capacity. 6. CONCLUSIONS The following conclusions are derived from this study: 6.1 Strength and deformational behavior of RC beams at elevated temperatures (1) The internal stresses caused by differential thermal expansion strain between concrete and reinforcement result in unrestrained deformation of RC beams at elevated temperatures, with the deformtion depending on the reinforcement arrangement. When the tensile stress in the concrete exceeds the tensile limit, cracks occur. RC beams with single reinforcement arrangement develop flexural cracks, while those with symmetrical double reinforcement develop cracks that penetrate the cross section. (2) The M-φ relations of RC beams at elevated temperatures exhibit certain special features. ・ Lower flexural rigidity under high-temperature conditions than at normal temperature
becausee of the drop in Young's modulus of the concrete and cracking during heating. ・ Release of accumulated compressive strain resulting from differential thermal expansion
contributes to curvature when loaded. (3) The yield strength of RC beams at elevated temperatures depends mainly on the yield point of the reinforcement, and both deformational behavior in the plastic range and ultimate strength are dependent on the stress-strain relation of the reinforcement. However, ultimate deformational capacity barely changes with temperature and is almost the same as at normal temperature. 6.2 Estimation of deformational behavior considering differential thermal expansion strain (1) Equations expessing stress and strain at the full and cracked sections of RC beams were introduced. These equations take into acount the temperature dependence of the physical properties of the concrete and reinforcement, as well as the differential thermal expansion strain. (2) An estimation method for the deformational behavior of RC beams at elevated temperatures was proposed, following the basic concept of average flexural rigidity used by the ACI. This method also takes into consideration differential thermal expansion and the temperature dependence of the physical properties of the concrete and reinforcement. The proposed method was confirmed to be valid through comparison with experimental results obtained for beams subjected to heating and flexural loading. 6.3 Estimation of ultimate strength and deformational capacity (1) An estimation method for the ultimate strengh and deformatinal capacity of the RC beams at elevated temperatures was proposed. This method takes into account the temperature dependence of compresion strain capacity, the stress-strain relation of the reinforcement in the plastic range, and the differential thermal expansion strain. The validity of the method was verified by comparison with experimental results. (2) The temperature dependence of ultimate compressive strain as well as the strain at maximum concrete compressive stress at elevated temperatures must be taken into account when estimating the ultimate strength and deformational capacity of RC beams using the conventinal stress-strain relation consisting of parabolic and straight lines. The equation for estimating the temperature dependence of concrete strain at maxumum compressive
101

stress was proposed by the author in a previous paper [1] and that of ultimate compressive strain is also propsed by the author for the first time in this paper. Appendix Physical properties of concrete and reinforcement The temperature dependence of the physical properties of the concrete and reinforcement, as used in calculating the strength and deformation of the RC test specimens, was estimated on the basis of results obtained in previous studies by the author [1],[6],[7]. The various dependencies are outlined below. 1. Temperature dependence of physical properties of concrete (1) Compressive strength {f’c(T): high temp.; f’c ,n: normal. Temp.}
f'c(T)f'c,n
=-7.69x10⁻⁴T+1.02 normal temp.=<T=<500 oC (1)
(2) Young’s modulus {Ec (T): high temp.; Ec,n: normal temp.}
Ec(T)Ec,n
=-4.03x10⁻³T+1.08 normal temp.=<T=<100 oC (2a)
Ec(T)Ec,n
=-1.24x10⁻³T+0.802 100 oC<T=<500
oC (2b)
(3) Tensile strength {ft(T): high temp.; ft ,n: normal temp.}
ft(T)ft,n
=-5.42x10⁻⁴T+1.01 normal temp.=<T=<280 oC (3a)
ft(T)ft,n
=-1.82x10⁻³T+1.36 280 oC<T=<500
oC (3b)
(4) Thermal expansion coefficient {αc(T); defined as secant modulus}
αc(T)=(12.4-0.330x10⁻¹T)x10-6/ oC normal temp.=<T=<207 oC (4a)
αc(T)=(3.73+0.895x10⁻²T)x10-6/ oC 207 oC<T=<500oC (4b)
2. Temperature dependence of physical properties of reinforcement (1) Yield and tensile strengths described as ratios (high temp. value to normal temp. value) Temp.( ˚C) 100 200 300 400 500
f ’y(T) 0.95 0.92 0.69 0.65 0.57 f ’u(T) 0.98 1.15 1.14 0.96 0.70
Yield s t rength: 384.2 N/mm2 ; tensi le s t rength: 564.5 N/mm2 at normal temp. (2) Young’s modulus {Es(T): high temp.; Es,n: normal temp.}
Es(T)Es,n
= -3.30x10⁻⁴(T-20)+1.0 normal temp.=<T=<500 oC (5)
(3) Thermal expansion coefficient {αs(T); defined as secant modulus}
αs(T) = αs,T0 + 6.25x 10⁻⁹(T-T0) normal temp.=<T=< 500oC (6)
102

(4) Stress-strain relationship of reinforcement [1] See Fig. 1 in the appendix References [1] T. Kanazu: A study on physical properties of concrete and reinforcement at elevated temperatures,
Proceedings of Japan Society of Civil Engineers (JSCE), No.697/V-54, pp.13-24, February 2002, in Japanese
[2] T. Kanazu: A study on the estimation method of internal stresses caused by the differential thermal expansion coefficients between concrete and reinforcemant at elevated temperatures, Proceedings of JSCE, No.585/ V-38, pp.113-125, February 1998, in Japanese
[3] ACI Committee 318: Building Code Requirements for Reinforced Concrete, 318-89 [4] Japan Society of Civil Engineers: Standard Specifications for Concrete Structures, Structural Design,
1996, in Japanese [5] Technical Committee of Japanese Society of Steel Construction (JSSC) : Mechanical properties of
structural steel at elevated temperatures and at normal temperature after high-temperature hysteresis,
JSSC, Vol.4, No.33, pp.39-44, 1968, in Japanese
[6] T. Kanazu, Y. Aoyagi, T. Nakano, T. Endoh, and T. Kuriyama: Strength properties of concrete at elevated temperatures over 100˚C — No.2: strength and deformational properties under high-temperature conditions and at normal temperature after high-temperature hysteresis, CRIEPI Report, No.384022, January 1985, in Japanese
[7] T.Kanazu and H. Ishida: Creep of concrete at elevated temperatures, Proceedings of the Japan Concrete Inst itute, Vol.16, No.1, pp.621-626, 1994, in Japanese
0
100
200
300
400
500
600
700
0 0.05 0.1 0.15 0.2 0.25
Stre
ss (N
/mm
2 )
StrainFig.1 Stress-strain curves of reinforcement at elevated temperatures
○◇△
●◆▲
normal temp.100℃200℃
300℃400℃500℃
103
Related Documents