AACL Bioflux, 2021, Volume 14, Issue 1. http://www.bioflux.com.ro/aacl 546 Study on different salinities and diets for the survival and growth of newly introduced Penaeus merguiensis larvae culture 1 Mostafa I. Ighwerb, 2 Johannes Hutabarat, 3 Ervia Yudiati, 3 Rudhi Pribadi 1 Doctoral Program, Faculty of Fisheries and Marine Sciences, Diponegoro University, Semarang, Indonesia; 2 Department of Aquaculture, Faculty of Fisheries and Marine Sciences, Diponegoro University, Semarang, Indonesia; 3 Department of Marine Science, Faculty of Fisheries and Marine Sciences, Diponegoro University, Semarang, Indonesia. Corresponding author: M. I. Ighwerb, [email protected] Abstract. Salinity is one of the leading environmental determinants affecting the survival, growth, and distribution of aquatic animals. Although various crustaceans have general euryhalinity standards, optimal salinity for certain species is unequivocal. In tropical areas with periodical changes in the rainy and dry seasons, salinity fluctuations are obvious. This study aims to analyze the effect of variations in salinity (28 ppt; 32 ppt; 36 ppt) and the feeding types (Diet A: 100% live feed; Diet B: 100% FRIPPAK; Diet C: a combination of FRIPPAK and live feed 50% each) on the survival and growth of the newly introduced Penaeus merguiensis larvae. The results showed that artificial feed significantly succeeded in replacing natural feed for the survival and growth of Zoea-1 to Zoea-3 at a salinity of 28 ppt. In the Mysis stage (Mysis-1 to Mysis-3), Diet A is preferred in the 32 and 36 ppt salinities. The relationships between larva length and days of life at a salinity of 28 ppt were: (Diet A) YA=0.5623x+0.632, with R 2 =0.921; (Diet B) YB=0.4389x+0.8807, with R 2 =0.9484; (Diet C) YC=0.5694x+0.6287, with R 2 =0.9469. The relationship between larva length and day of life at a salinity of 32 ppt were: (Diet A) YA=0.4017x+0.9573, with R 2 =0.8343; (Diet B) YB=0.3646x+0.884, with R 2 =0.9242; (Diet C) YC=0.38x+0.77, where R 2 =0.9403. Finally, The relationship between larva length and day of life at a salinity of 36 ppt: (Diet A) YA=0.3914x+0.9, with R 2 =0.9081; (Diet B) YB=0.2566x+0.1187, with R 2 =0.7624; (Diet C) YC=0.3343x+1.0233, with R 2 =0.7833. The larval length significance to the variation of days was positive, the larva length increasing with increasing day number. Key Words: euryhalinity, feed, larvae length, Penaeus merguiensis. Introduction. Salinity is one of the most important abiotic factors affecting the survival and growth of banana prawn (Fenneropenaeus merguiensis) farming (Anand et al 2014) and profoundly influences many aquatic organisms. Although various crustaceans have different degrees of euryhalinity, salinity for growth, survival, and production for specific species has certain optimal levels (Kumlu & Jones 1995). Therefore, determining the optimal salinity level to meet the viability and performance of each commercial shrimp species necessary (Labrador et al 2016). In tropical areas characterized by rainy and dry seasons, salinity fluctuations are apparent. However, sea-level rise, coastal flooding, and tropical cyclones in recent years have caused salinity imbalances in freshwater fisheries worldwide and are threatening the sector of aquaculture. As salinity intrusion happens in freshwater aquaculture, many freshwater species experience severe salinity stress; some species even become extinct due to their inability to cope with these extreme conditions. Therefore, it is essential to determine the salinity tolerance for freshwater-cultured species; this information can determine some freshwater species that can be cultivated in saline water areas. Shrimp in low salinities tend to have low immunity and are susceptible to pathogens such as yellow head virus, white spot syndrome virus, or Vibrio alginolyticus infection. Low salinity stress can increase the oxygen consumption of brine shrimp. Consequently, shrimp needs more food to compensate for the extra energy used in the osmoregulation system to improve the growth performance (Li et al 2015).

Welcome message from author
This document is posted to help you gain knowledge. Please leave a comment to let me know what you think about it! Share it to your friends and learn new things together.
Transcript

AACL Bioflux, 2021, Volume 14, Issue 1.
http://www.bioflux.com.ro/aacl 546
Study on different salinities and diets for the
survival and growth of newly introduced Penaeus
merguiensis larvae culture 1Mostafa I. Ighwerb, 2Johannes Hutabarat, 3Ervia Yudiati, 3Rudhi Pribadi
1 Doctoral Program, Faculty of Fisheries and Marine Sciences, Diponegoro University,
Semarang, Indonesia; 2 Department of Aquaculture, Faculty of Fisheries and Marine
Sciences, Diponegoro University, Semarang, Indonesia; 3 Department of Marine Science,
Faculty of Fisheries and Marine Sciences, Diponegoro University, Semarang, Indonesia.
Corresponding author: M. I. Ighwerb, [email protected]
Abstract. Salinity is one of the leading environmental determinants affecting the survival, growth, and distribution of aquatic animals. Although various crustaceans have general euryhalinity standards, optimal salinity for certain species is unequivocal. In tropical areas with periodical changes in the rainy and dry seasons, salinity fluctuations are obvious. This study aims to analyze the effect of variations in salinity (28 ppt; 32 ppt; 36 ppt) and the feeding types (Diet A: 100% live feed; Diet B: 100% FRIPPAK; Diet C: a combination of FRIPPAK and live feed 50% each) on the survival and growth of the newly introduced Penaeus merguiensis larvae. The results showed that artificial feed significantly succeeded in replacing natural feed for the survival and growth of Zoea-1 to Zoea-3 at a salinity of 28 ppt. In the Mysis stage (Mysis-1 to Mysis-3), Diet A is preferred in the 32 and 36 ppt salinities. The relationships between larva length and days of life at a salinity of 28 ppt were: (Diet A) YA=0.5623x+0.632, with R2=0.921; (Diet B) YB=0.4389x+0.8807, with R2=0.9484; (Diet C) YC=0.5694x+0.6287, with R2=0.9469. The relationship between larva length and day of life at a salinity of 32 ppt were: (Diet A) YA=0.4017x+0.9573, with R2=0.8343; (Diet B) YB=0.3646x+0.884, with R2=0.9242; (Diet C) YC=0.38x+0.77, where R2=0.9403. Finally, The relationship between larva length and day of life at a salinity of 36 ppt: (Diet A) YA=0.3914x+0.9, with R2=0.9081; (Diet B) YB=0.2566x+0.1187, with R2=0.7624; (Diet C) YC=0.3343x+1.0233, with R2=0.7833. The larval length significance to the variation of days was positive, the larva length increasing with increasing day number. Key Words: euryhalinity, feed, larvae length, Penaeus merguiensis.
Introduction. Salinity is one of the most important abiotic factors affecting the survival
and growth of banana prawn (Fenneropenaeus merguiensis) farming (Anand et al 2014)
and profoundly influences many aquatic organisms. Although various crustaceans have
different degrees of euryhalinity, salinity for growth, survival, and production for specific
species has certain optimal levels (Kumlu & Jones 1995). Therefore, determining the
optimal salinity level to meet the viability and performance of each commercial shrimp
species necessary (Labrador et al 2016).
In tropical areas characterized by rainy and dry seasons, salinity fluctuations are
apparent. However, sea-level rise, coastal flooding, and tropical cyclones in recent years
have caused salinity imbalances in freshwater fisheries worldwide and are threatening the
sector of aquaculture. As salinity intrusion happens in freshwater aquaculture, many
freshwater species experience severe salinity stress; some species even become extinct
due to their inability to cope with these extreme conditions. Therefore, it is essential to
determine the salinity tolerance for freshwater-cultured species; this information can
determine some freshwater species that can be cultivated in saline water areas.
Shrimp in low salinities tend to have low immunity and are susceptible to
pathogens such as yellow head virus, white spot syndrome virus, or Vibrio alginolyticus
infection. Low salinity stress can increase the oxygen consumption of brine shrimp.
Consequently, shrimp needs more food to compensate for the extra energy used in the
osmoregulation system to improve the growth performance (Li et al 2015).

AACL Bioflux, 2021, Volume 14, Issue 1.
http://www.bioflux.com.ro/aacl 547
Several studies on the Penaeus merguiensis diet have been conducted. Based on a
study of gastric content from 35 specimens with a carapace length between 17-33 mm, it
was found that P. merguiensis ate other crustaceans, vegetables, phytoplankton, and
benthic foraminifera. However, studies of penaeid shrimp diets show that they eat a wide
variety of foods (Nehru et al 2018). In the offshore of the Madras Coast of India, the
morphospecies of Penaeus indicus were fed with vegetables and crustaceans, mollusks,
foraminifera, polychaetes, hydroids, trematodes, and echinoderm larvae (Liao et al
2020).
In the farming practice of P. merguiensis larvae, the community has applied
several artificial and natural feeds. However, no detailed information regarding optimal
diet, bowel evacuation time, trypsin analysis, and the diet's particle size was found
(Bojórquez-Mascareño & Soto-Jiménez 2013). In shrimp farming, various environmental
stimuli such as pH (Han et al 2018), salinity (Wang et al 2016), dissolved oxygen (Han et
al 2018), temperature (Madeira al 2015), and pollutants such as nitrates, ammonia, and
sulfides (Duan et al 2018) affect growth (Bu et al 2017; Valenzuela-Madrigal et al 2017),
physiological performance (Xu et al 2012; Khanjani et al 2016), and shrimp survival
(Ayaz et al 2015). In addition, it is also known that temperature changes with more than
13°C can lead to cessation of feeding, swimming ability, and shrimp mortality (Xu et al
2012; Zhang et al 2017). Generally, penaeid shrimp are categorized as heterosexual (dioecious) so that the
male and female genitals can be distinguished morphologically (sexual dimorphism)
(Sakas 2016). At the same age, the overall size of the female shrimp is larger than the
male one, especially their abdomens. The male reproductive organs consist of a pair of
testes, vas deferens, petasma, and masculine appendixes. Petasma is found in the first
pair of pleopods, while the genital canal hole is located between the bases of the fifth
walking legs (Sentosa et al 2017). Salinity is defined as the total concentration of dissolved ions in seawater
expressed in units per million (‰) or ppt (units per thousand) or gr L-1. Salinity is
composed of seven significant ions: sodium, potassium, calcium, magnesium, chloride,
sulfate, bicarbonate. Although other water substances do not directly influence salinity
(Marlina & Panjaitan 2020), they are also crucial for ecological functions. If the salinity is
too high, the conversion ratio will be higher for continuous air circulation. In marine
animals, glycine betaine is one of the main osmolytes that expands under osmotic stress
conditions; however, little information is known about the course involved in glycine
betaine's biosynthesis (Mizanur & Bai 2014; Valle et al 2015).
In animal cells, glycine betaine is synthesized by the enzyme Betaine Aldehyde
Dehydrogenase (BADH) (Gao et al 2016). The effect of salinity and glycine concentration
of betaine on white shrimp Litopenaeus vannamei has been studied, the shrimp being
treated with salinities of 10, 20, 35, 40, 50, and 60 ppt for seven days. Another result
found that increased BADH activity occurred in the hepatopancreas and gills of shrimp in
salinity above 35 ppt (Muhammad et al 2016). The BADH activity in muscle decreased at
35 ppt salinity, but in the hepatopancreas, it increased by 1.1 and 1.7 at 50 and 60 ppt,
respectively. Then, at a salinity of 60 ppt, the gills' BADH activity increased 1.5 times
compared to the salinity of 35 ppt. Increased glycine betaine concentrations in the
hepatopancreas, gills, and shrimp muscle occurred at salinity above 35 ppt. However, the
glycine concentration of betaine also increased at a salinity of 20 ppt (Yang et al 2020)
but was not detected at a salinity of 10 ppt. Betaine glycine most likely occurs to avoid
the denaturalization of protein. Ammonia concentration in the air only increased at a
salinity of 20 ppt and 10 ppt (1.1-fold compared to 35 ppt). Salinity regulates BADH and
glycine content, specifically in L. vannamei tissues (Delgado-Gaytán et al 2020).
Live food used for some larval production can increase cannibal behavior in the
cultured shrimp species (Chand et al 2015). Live feed in cultured larvae is considered
necessary because of its high nutritional value; later, they can balance their diet
according to their natural habitat (de Lourdes Cobo et al 2014). However, when
cultivation is carried out in captivity, live food must be chosen to meet the best dietary
pattern (Liu et al 2020). Once the temperature and salinity of farming are established,
they can be used to predict larval survival and growth rates for future planning (Crisp et

AACL Bioflux, 2021, Volume 14, Issue 1.
http://www.bioflux.com.ro/aacl 548
al 2017). Food and salinity are believed to cause stress in the cultured system, impacting
gut morphology and nutrient digestion (Tran-Ngoc et al 2017).
By analyzing the effect of variations in salinity (28, 32, and 36 ppt) and the
feeding types (100% live feed, 100% FRIPPAK, and a combination of FRIPPAK and live
feed 50% each), the survival and growth of the newly introduced P. merguiensis larvae
can be objectively assessed for better farming configuration. This study's authenticity lies
in the research object, P. merguiensis, as a native species from Indonesia that can be
introduced to various parts of the world. Research novelty consists of three aspects:
material, location, and methodology. The materials used in this study were P.
merguiensis larvae from the Jepara Government Marine Research Institute's hatcheries.
The research was conducted in the Maritime Research and Development Center for the
Government of Jepara, Indonesia, and this research is new to this location. The research
on salinity and feed on P. merguiensis larvae is new, and P. merguiensis is a native
Indonesian giant prawn.
Material and Method
Salinity experiment. Nine beaker glasses were used, being placed in aquariums
containing 20 L of saline water. Each beaker glass was placed in an aquarium with a
water heater to adjust the water temperature to 31°C. The beaker glasses were filled
with water with different salinities (28, 32, and 36 ppt up to 2.5 L). Later, filtered
seawater with salinities of 28, 32, and 36 ppt was added. For this experiment, 250 nauplii
of P. merguiensis were allocated per beaker glass before it was placed into the specified
salinity.
Diet experiment. The diet experiment was carried out for 10 days, by giving live
microalgae and FRIPPAK (consisting of fishmeal, vitamins, and minerals) in the form of
microencapsulated diet (MED). Considering zoea was the successor of the nauplius stage
where its digestive system was not yet fully developed, we treated Zoea 1 to Zoea 3 with
Diet A containing 2000 cells mL-1 of Skeletonema costatum. However, we increased the
number of Skeletonema costatum to 7500 cells mL-1 for the mysis stage. For Diet B
containing FRIPPAK MED, we served 4 mg L-1 for Z1 to Z3 and 6 mg L-1 for M1 to M3.
Lastly, Diet C containing 50% of Diet A and 50% of Diet B was administered for Z1 to Z3
and M1-M3 with the same feeding pattern (4 mg L-1 for Z1 to Z3 and 6 mg L-1 for M1 to
M3). Zoea stage was fed once a day at 8 am to avoid overeating that can cause death.
The Mysis stage was administered feed 5 times a day at 8.00, 11.00, 16.00, 23.00, and
04.00.
Stages of shrimp. The used stages included zoea and mysis phases. Larvae were
stocked in beaker glasses at a density of 100 individuals L-1 (250 individuals in each 2.5 L
beaker glass). Each treatment consisted of 3 repetitions. The assessments were carried
out at different salinity levels (28, 32, and 36 ppt).
Water quality standard. Temperature, oxygen, ammonia, acidity, and alkalinity were
measured once per day in the morning with a DO meter (YSI550A-25). Temperature,
oxygen, ammonia, acidity, and pH were measured once a day from 6.00-16.00.
Length and survival rate. The calculation was carried out at the beginning and end of
the experiment. The survival rate and length were measured daily for 10 days. Three
samples were extracted daily for inspection and measurement. After ten days, the
survival rate and daily development were calculated.
The daily development calculation (length) was done by measuring the difference
in length:
LZ=Lx-Ly

AACL Bioflux, 2021, Volume 14, Issue 1.
http://www.bioflux.com.ro/aacl 549
Where: Ly is the length before the treatment; Lx is the length where the particular
treatment was done. The product difference between the two lengths was the
development (LZ).
The survival rate was calculated using the following formula:
Survival Rate = (total number of living larvae at the end of the experiment/the initial
number of larvae) x 100%
Source of larvae. The material used in this research was shrimp larvae (P.
merguiensis). Larvae, as raw material, were produced by the government at the
Hatchery Marine Research Center. Larvae at the zoea stage were brought from the
Marine Cultivation Research Center. The stages for shrimp include zoea to mysis. Larvae
were stored in beaker glasses. With 250 samples per glass (2.5 L), each treatment
consisted of 750 animals (three repetitions).
Statistical analysis. The data obtained were analyzed using the analysis of variance by
looking at the interaction of each factor. If the analysis of variance results showed a
significant difference, then further examination using the Duncan's Multiple Range Test
(DMRT) was conducted to determine the significance and interaction between treatments
with a 95% confidence level (p<0.05). Experimental data were analyzed by two-way
analysis of variance using SPSS v.16.
Results and Discussion
Stages of cultured larva from zoea to mysis. The stages from zoea to mysis are
presented in Figure 1.
Figure 1. The development observation of Penaeus merguiensis larvae: a - zoea; b -
mysis. Images were captured using a stereo microscope with high-magnification
objectives (100x).
From Figure 1, it can be seen that the larvae in the zoea stage were fully developed, and
reach the shape of shrimp. At the mysis stage, the shrimp development continued. The

AACL Bioflux, 2021, Volume 14, Issue 1.
http://www.bioflux.com.ro/aacl 550
phases of Z1 to Z3 took one day each (day 1 to day 3) and the phases of M1-M3 also
took one day each (day 4 to day 6), as presented in the following figures.
Correlation between larvae lengths and days in salinity of 28 ppt. Figure 2
presents the correlation between larvae length and days of life for Zoea and Mysis.
Figure 2. Correlation between Penaeus merguiensis larvae lengths and days (days 1-3:
Z1-Z3; days 4-6: M1-M3) at a salinity of 28 ppt.
As presented in Figure 2, the equations obtained are: YA=0.5623x+0.632, with
R2=0.921, for Diet A; YB=0.4389x+0.8807, with R2=0.9484, for Diet B;
YC=0.5694x+0.6287, with R2=0.9469, for Diet C.
Correlation between larvae lengths and days in salinity of 32 ppt. Figure 3
presents the correlation between larvae length and days for zoea and mysis.
Figure 3. Correlation between Penaeus merguiensis larvae lengths and days (days 1-3:
Z1-Z3; days 4-6: M1-M3) at a salinity of 32 ppt.

AACL Bioflux, 2021, Volume 14, Issue 1.
http://www.bioflux.com.ro/aacl 551
As presented in Figure 3, the equations obtained were: YA=0.4017x+0.9573, with
R2=0.8343, for Diet A; YB=0.3646x+0.884, with R2=0.9242, for Diet B; YC=0.38x+0.77,
with R2=0.9403, for Diet C.
Correlation between larvae lengths and days in salinity of 36 ppt. Figure 4
presents the correlation between larvae length and days for Zoea and Mysis.
Figure 4. Correlation between Penaeus merguiensis larvae lengths and days (days 1-3:
Z1-Z3; days 4-6: M1-M3) at a salinity of 36 ppt.
As presented in Figure 4, the equations obtained were: YA=0.3914x+0.9, with
R2=0.9081, for Diet A; YB=0.2566x+1.1187, with R2=0.7624, for Diet B;
YC=0.3343x+1.0233, with R2=0.7833, for Diet C.
Tests of between-subjects effects for Zoea-1. The test results of the average length
of Zoea-1 in different salinities and feed can be seen in Table 1.
Table 1
Tests of between-subjects effects for Penaeus merguiensis larvae of Zoea-1
Source Type III Sum of
Squares df Mean Square F Sig.
Corrected model 0.204a 8 0.026 1512 0.221
Intercept 27462 1 27462 1624000 0.000
Salinity 0.095 2 0.047 2799 0.087
Feed 0.055 2 0.028 1633 0.223
Salinity x Feed 0.055 4 0.014 0.807 0.537
Error 0.304 18 0.017
Total 27971 27
Corrected Total 0.509 26
Note: a - R Squared=0.402 (Adjusted R Squared=0.136); df - degrees of freedom.
From Table 1, it can be concluded that there is no significant connection between the
length of Zoea-1 with variations in the salinity and composition of the diets. Also, the
interaction between salinity and feed composition that affected the mean length of Zoea-
1 was not significant (p>0.05). With the adjusted R Square value of 0.402, the
independent variable affects the dependent variable by 40.2%, while other variables
influence the remaining 59.8%.

AACL Bioflux, 2021, Volume 14, Issue 1.
http://www.bioflux.com.ro/aacl 552
Tests of between-subjects effects for Zoea-2. The test results of the average length
of Zoea-2 in different salinities and feed can be seen in Table 2.
Table 2
Tests of between-subjects effects for Penaeus merguiensis larvae of Zoea-2
Source Type III Sum of
Squares df
Mean
Square F Sig.
Corrected model 0.501a 8 0.063 2582 0.045
Intercept 101121 1 101121 4171000 0.000
Salinity 0.043 2 0.022 0.891 0.427
Feed 0.021 2 0.011 0.434 0.655
Salinity x Feed 0.436 4 0.109 4501 0.011
Error 0.436 18 0.024
Total 102058 27
Corrected Total 0.937 26
Note: a - R Squared=0.534 (Adjusted R Squared=0.327); df - degrees of freedom.
From Table 2, it can be concluded that there is no significant correlation between Zoea-2
length and variations in salinity and feed composition. However, the interaction between
salinity and feed composition in influencing the length of Zoea-2 was significant
(p<0.05). The adjusted R Square value of 0.534 means that the independent variable
affects the dependent variable by 53.4%, while other variables influence the remaining
46.6%.
Tests of between-subjects effects for Zoea-3. The test results of the average length
of Zoea-3 in different salinities and feed are presented in Table 3.
Table 3
Tests of between-subjects effects for Penaeus merguiensis larvae of Zoea-3
Source Type III Sum
of Squares df
Mean
Square F Sig.
Corrected model 0.226a 8 0.028 0.940 0.509
Intercept 117509 1 117509 3912000 0.000
Salinity 0.001 2 0.000 0.010 0.990
Feed 0.014 2 0.007 0.234 0.794
Salinity x Feed 0.211 4 0.053 1759 0.181
Error 0.541 18 0.030
Total 118275 27
Corrected Total 0.767 26
Note: a - R Squared=0.295 (adjusted R Squared=-0.019); df - degrees of freedom.
From Table 3, it can be concluded that there is no significant correlation between Zoea-3
length on variations in salinity and feed composition. Also, the interaction between
salinity and feed composition in influencing Zoea-3 length was not significant (p>0.05).
With the adjusted R Square value of 0.295, the independent variable affects the
dependent variable by 29.5%, while other variables influence the remaining 70.5%.
Tests of between-subjects effects for Mysis-1. The test results of the average length
of Mysis-1 in different salinities and feed are presented in Table 4.
From Table 4, it can be concluded that there is a significant association between
the length of Mysis-1 on variations in salinity and the diet composition (p<0.05).
However, the interaction between salinity and feed composition that affects the length of
Mysis-1 was not significant (p>0.05). With an adjusted R Square value of 0.656, the
independent variable affects the dependent variable by 65.6%, while other variables
influence the remaining 34.4%.

AACL Bioflux, 2021, Volume 14, Issue 1.
http://www.bioflux.com.ro/aacl 553
Table 4
Tests of between-subjects effects for Penaeus merguiensis larvae of Mysis-1
Source Type III Sum of
Squares df
Mean
Square F Sig.
Corrected
model 2.549a 8 0.319 4289 0.005
Intercept 206112 1 206112 2774000 0.000
Salinity 1537 2 0.769 10346 0.001
Feed 0.862 2 0.431 5799 0.011
Salinity x Feed 0.150 4 0.038 0.505 0.732
Error 1337 18 0.074
Total 209998 27
Corrected Total 3886 26
Note: a - R Squared=0.656 (adjusted R Squared=0.503); df - degrees of freedom.
Tests of between-subjects effects for Mysis-2. The test results of the average length
of Mysis-2 in different salinities and feed can be seen in Table 5.
Table 5
Tests of between-subjects effects for Penaeus merguiensis larvae of Mysis-2
Source Type III Sum of
Squares df
Mean
Square F Sig.
Corrected model 4.312a 8 0.539 7318 0.000
Intercept 210148 1 210148 2853000 0.000
Salinity 2579 2 1290 17511 0.000
Feed 0.377 2 0.188 2559 0.105
Salinity * Feed 1356 4 0.339 4601 0.010
Error 1326 18 0.074
Total 215786 27
Corrected Total 5638 26
Note: a - R Squared=0.765 (adjusted R Squared=0.660); df - degrees of freedom.
From Table 5, it can be concluded that there was a significant association between the
length of Mysis-2 with salinity variations (p<0.05) but not with the composition of the
feed. The test results also found that the interaction between salinity and feed
composition affecting the length of Mysis-2 was significant (p<0.05). With an adjusted R
Square value of 0.756, the independent variable affects the dependent variable by
75.6%, while other variables influence the remaining 24.4%.
Tests of between-subjects effects for Mysis-3. The test results of the average length
of Mysis-3 in different salinities and feed can be seen in Table 6.
Table 6
Tests of between-subjects effects for Penaeus merguiensis larvae of Mysis-3
Source Type III Sum of
Squares df Mean Square F Sig.
Corrected model 6.013a 8 0.752 4099 0.006 Intercept 282684 1 282684 1541000 0.000 Salinity 4631 2 2315 12626 0.000 Feed 1127 2 0.564 3074 0.071
Salinity x Feed 0.255 4 0.064 0.348 0.842
Error 3301 18 0.183
Total 291998 27
Corrected Total 9314 26
Note: a - R Squared=0.646 (adjusted R Squared=0.488); df - degrees of freedom.

AACL Bioflux, 2021, Volume 14, Issue 1.
http://www.bioflux.com.ro/aacl 554
From Table 6, it can be concluded that there is a significant correlation between the
length of Mysis-3 with salinity variations (p<0.05) but not with the composition of the
feed. The test results also found that the interaction between salinity and feed
composition affecting the length of Mysis-3 was not significant (p>0.05). With an
adjusted R Square value of 0.646, the independent variable affects the dependent
variable by 64.6%, while other variables influence the remaining 35.4%.
The polynomial regression of time development in different salinity and diet for
zoea. Figure 5 presents the polynomial graph of the development period from Zoea-1 to
Zoea-3 in different salinities and diets.
Figure 5. The polynomial regression of time development of Penaeus merguiensis larvae
from Zoea-1 to Zoea-3 in different salinity and diet.
Figure 5 shows the variation of the polynomial graph: time of development in Diet A with
a salinity of 28 ppt fell from 54 to 53 hours at a salinity of 36 ppt; time of development in
Diet B with a salinity of 28 ppt decreased from 54.5 to 53.8 hours at a salinity of 36 ppt;
time of development of Diet C with a salinity of 28 ppt increased from 53.6 to 54.1 hours
at a salinity of 36 ppt.
The linear regression of time development in different salinities and diets for
zoea. Figure 6 shows the polynomial graph of time development from Zoea-1 to Zoea-3
in different salinities and diets.
Figure 6. The linear regression of time of development of Penaeus merguiensis larvae
from Zoea-1 to Zoea-3 in different salinity and diet.

AACL Bioflux, 2021, Volume 14, Issue 1.
http://www.bioflux.com.ro/aacl 555
Based on Figure 6, the equations obtained were: YA=-0.125x+57.522, with R2=0.8744,
for Diet A; YB=-0.0917x+57.078, with R2=0.8383, for Diet B; YC=0.0583x+51.922, with
R2=0.5034, for Diet C. Thus, Diet C is the best feed for Zoea, being marked with a
positive line.
The polynomial regression of time development in different salinities and diets
for mysis. Figure 7 shows the polynomial graph of time development from Mysis-1 to
Mysis-3 in different salinities and diets.
Figure 7. The polynomial regression of time development of Penaeus merguiensis larvae
from Mysis-1 to Mysis-3 in different salinities and diets.
Figure 7 shows the variation of the polynomial graph: the time of development of P.
merguiensis larvae for Diet A at a salinity of 28 ppt increased from 60 to 60.5 hours at a
salinity of 36 ppt; the time of development for Diet B at a salinity of 28 ppt decreased
from 61.5 to 60.5 hours at a salinity of 36 ppt; the time of development for Diet C at a
salinity of 28 ppt decreased from 62 to 61.5 hours at a salinity of 36 ppt.
The linear regression of time development in different salinities and diets for
mysis. Figure 8 shows the polynomial graph of time development from Mysis-1 to Mysis-
3 in different salinities and diets.
Figure 8. The linear regression of time of development of Penaeus merguiensis larvae
from Mysis-1 to Mysis-3 in different salinities and diets.

AACL Bioflux, 2021, Volume 14, Issue 1.
http://www.bioflux.com.ro/aacl 556
From Figure 8, the equations obtained were: YA=0.0708x+58.067, with R2=0.4152, for
Diet A; YB=-0.1208x+65.222, with R2=0.3086, for Diet B; YC=-0.0625x+64.011, with
R2=0.1596, for Diet C. Thus, Diet A is the best feed for Mysis, being is marked with a
positive line.
Figure 9 shows the survival rate of P. merguiensis larvae, showing that the best
survival rates were found in the salinity of 28 ppt, with diet A.
Figure 9. Survival rate based on different salinities and diets.
This study observed that different salinities and types of diets do not significantly alter
the length of Zoea 1-3. However, the interaction of salinity and feed was significant for
Zoea-2 but not for Zoea-1 and Zoea-3. However, there were significant differences in the
length of Mysis 1-3, with different salinities (p<0.05), the feed composition influenced
Mysis-1 and Mysis-3 only. Also, the interaction between salinity and feed combination
only affected the mean length of Mysis-2. Figures 2 to 4 showed a growth trend for zoea
and mysis in different salinities and diets, which is supported by Susanto et al (2020),
who stated that differences in time development based on salinities and diets for juvenile
larvae of P. merguiensis varied.
The majority of shrimp larvae were not accustomed to receiving the artificial feed,
even though this aspect is important in increasing hatchery intensity. However, based on
the polynomial graphs, this study found that artificial diets were positive for Zoea-1 to
Zoea-3, and live feed was best for Mysis-1 to Mysis-3. These findings are in line with a
study of de Lourdes Cobo et al (2014) on L. vannamei larvae, who stated that nutritious-
manufactured feed for early cultured larva was considered necessary because of its high
nutritional value; later, larvae can balance their diet according to their natural habitat.
Salinity in the waters affects the osmoregulatory balance of the body, and the
energetic processes further affect growth (Thi Thu et al 2019). Thus, aquatic organisms
have to expend large amounts of energy to adjust to the salinity of their environment.
Salinity is a significant environmental parameter that influences crustaceans' survival,
distribution, abundance, and physiology (Zhang et al 2009; Antony et al 2019). Although
variations in salinity and different dietary patterns affect the growth and survival of
cultured larvae (Praveen & Krishna 2015), the unsuitable feed can lead to higher
mortality due to inappropriate larval phase duration (Qian et al 2015). Hyposalinity can
reduce salt diffusion, and water absorbed from the environment can lead to swollen cells
(Chen et al 2015). Accordingly, the present study shows that larvae (zoea to mysis) grew
better at lower salinity (28 ppt) than at higher salinity (32 ppt).
AACL Bioflux, 2021, Volume 14, Issue 1.
http://www.bioflux.com.ro/aacl 557
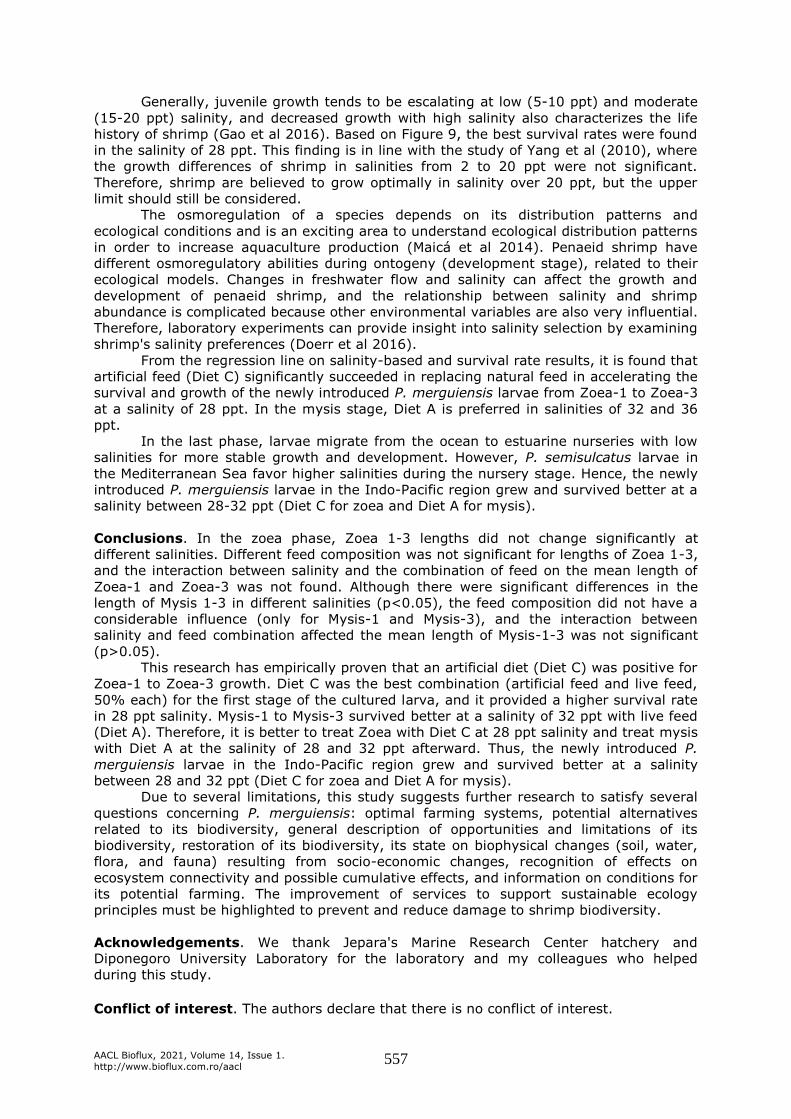
Generally, juvenile growth tends to be escalating at low (5-10 ppt) and moderate
(15-20 ppt) salinity, and decreased growth with high salinity also characterizes the life
history of shrimp (Gao et al 2016). Based on Figure 9, the best survival rates were found
in the salinity of 28 ppt. This finding is in line with the study of Yang et al (2010), where
the growth differences of shrimp in salinities from 2 to 20 ppt were not significant.
Therefore, shrimp are believed to grow optimally in salinity over 20 ppt, but the upper
limit should still be considered.
The osmoregulation of a species depends on its distribution patterns and
ecological conditions and is an exciting area to understand ecological distribution patterns
in order to increase aquaculture production (Maicá et al 2014). Penaeid shrimp have
different osmoregulatory abilities during ontogeny (development stage), related to their
ecological models. Changes in freshwater flow and salinity can affect the growth and
development of penaeid shrimp, and the relationship between salinity and shrimp
abundance is complicated because other environmental variables are also very influential.
Therefore, laboratory experiments can provide insight into salinity selection by examining
shrimp's salinity preferences (Doerr et al 2016).
From the regression line on salinity-based and survival rate results, it is found that
artificial feed (Diet C) significantly succeeded in replacing natural feed in accelerating the
survival and growth of the newly introduced P. merguiensis larvae from Zoea-1 to Zoea-3
at a salinity of 28 ppt. In the mysis stage, Diet A is preferred in salinities of 32 and 36
ppt.
In the last phase, larvae migrate from the ocean to estuarine nurseries with low
salinities for more stable growth and development. However, P. semisulcatus larvae in
the Mediterranean Sea favor higher salinities during the nursery stage. Hence, the newly
introduced P. merguiensis larvae in the Indo-Pacific region grew and survived better at a
salinity between 28-32 ppt (Diet C for zoea and Diet A for mysis).
Conclusions. In the zoea phase, Zoea 1-3 lengths did not change significantly at
different salinities. Different feed composition was not significant for lengths of Zoea 1-3,
and the interaction between salinity and the combination of feed on the mean length of
Zoea-1 and Zoea-3 was not found. Although there were significant differences in the
length of Mysis 1-3 in different salinities (p<0.05), the feed composition did not have a
considerable influence (only for Mysis-1 and Mysis-3), and the interaction between
salinity and feed combination affected the mean length of Mysis-1-3 was not significant
(p>0.05).
This research has empirically proven that an artificial diet (Diet C) was positive for
Zoea-1 to Zoea-3 growth. Diet C was the best combination (artificial feed and live feed,
50% each) for the first stage of the cultured larva, and it provided a higher survival rate
in 28 ppt salinity. Mysis-1 to Mysis-3 survived better at a salinity of 32 ppt with live feed
(Diet A). Therefore, it is better to treat Zoea with Diet C at 28 ppt salinity and treat mysis
with Diet A at the salinity of 28 and 32 ppt afterward. Thus, the newly introduced P.
merguiensis larvae in the Indo-Pacific region grew and survived better at a salinity
between 28 and 32 ppt (Diet C for zoea and Diet A for mysis).
Due to several limitations, this study suggests further research to satisfy several
questions concerning P. merguiensis: optimal farming systems, potential alternatives
related to its biodiversity, general description of opportunities and limitations of its
biodiversity, restoration of its biodiversity, its state on biophysical changes (soil, water,
flora, and fauna) resulting from socio-economic changes, recognition of effects on
ecosystem connectivity and possible cumulative effects, and information on conditions for
its potential farming. The improvement of services to support sustainable ecology
principles must be highlighted to prevent and reduce damage to shrimp biodiversity.
Acknowledgements. We thank Jepara's Marine Research Center hatchery and
Diponegoro University Laboratory for the laboratory and my colleagues who helped
during this study.
Conflict of interest. The authors declare that there is no conflict of interest.

AACL Bioflux, 2021, Volume 14, Issue 1.
http://www.bioflux.com.ro/aacl 558
References
Anand P. S., Pillai S. M., Kumar S., Panigrahi A., Ravichandran P., Ponniah A. G., Ghoshal
T. K., 2014 Growth, survival and length-weight relationship of Fenneropenaeus
merguiensis at two different stocking densities in low saline zero water exchange
brackishwater ponds. Indian Journal of Geo-Marine Science 43(10):1956-1964.
Antony J., Sandeep K. P., Aravind R., Panigrahi A., Balasubramanian C. P., 2019 Growth,
survival, and osmoregulation of Indian white shrimp Penaeus indicus juveniles
reared in low salinity amended inland saline groundwater and seawater. Journal of
Coastal Research 86(sp1):21-31.
Ayaz M., Sumara K., Vadher K. H., Ishakani A. H., 2015 Effect of higher salinities on
growth and survival of Pacific white shrimp, Litopenaeus vannamei (Boone, 1931).
Journal of Applied and Natural Science 7(2):885-888.
Bojórquez-Mascareño E. I., Soto-Jiménez M. F., 2013 Effects of natural diet on growth on
white-leg shrimp Litopenaeus vannamei under experimental mesocosms emulating
an intensive culture system. Journal of Aquaculture Research and Development
4(1):163-163.
Bu X., Lian X., Zhang Y., Yang C., Cui C., Che J., Tang B., Su B., Zhou Q., Yang Y., 2017
Effects of feeding rates on growth, feed utilization, and body composition of juvenile
Pseudobagrus ussuriensis. Aquaculture International 25(5):1821-1831.
Chand B. K., Trivedi R. K., Dubey S. K., Rout S. K., Beg M. M., Das U. K., 2015 Effect of
salinity on survival and growth of giant freshwater prawn Macrobrachium
rosenbergii (de Man). Aquaculture Reports 2:26-33.
Chen K., Li E., Xu C., Wang X., Lin H., Qin J. G., Chen L., 2015 Evaluation of different
lipid sources in the diet of Pacific white shrimp Litopenaeus vannamei at low
salinity. Aquaculture Reports 2:163-168.
Crisp J. A., Partridge G. J., D'Souza F. M., Tweedley J. R., Moheimani N. R., 2017 Effects
of temperature and salinity on larval survival and development of the western
school prawn Metapenaeus dalli. International Aquatic Research 9(1):1-10.
de Lourdes Cobo M., Sonnenholzner S., Wille M., Sorgeloos P., 2014 Ammonia tolerance
of Litopenaeus vannamei (Boone) larvae. Aquaculture Research 45(3):470-475.
Delgado-Gaytán M. F., Gómez-Jiménez S., Gámez-Alejo L. A., Rosas-Rodríguez J. A.,
Figueroa-Soto C. G., Valenzuela-Soto E. M., 2020 Effect of salinity on the synthesis
and concentration of glycine betaine in osmoregulatory tissues from juvenile
shrimps Litopenaeus vannamei. Comparative Biochemistry and Physiology Part A:
Molecular & Integrative Physiology 240:110628, 6 p.
Doerr J. C., Liu H., Minello T. J., 2016 Salinity selection by juvenile brown shrimp
(Farfantepenaeus aztecus) and white shrimp (Litopenaeus setiferus) in a gradient
tank. Estuaries and Coasts 39(3):829-838.
Duan Y., Liu Q., Wang Y., Zhang J., Xiong D., 2018 Impairment of the intestine barrier
function in Litopenaeus vannamei exposed to ammonia and nitrite stress. Fish &
Shellfish Immunology 78:279-288.
Gao W., Tian L., Huang T., Yao M., Hu W., Xu Q., 2016 Effect of salinity on the growth
performance, osmolarity, and metabolism-related gene expression in white shrimp
Litopenaeus vannamei. Aquaculture Reports 4:125-129.
Han S. Y., Wang B. J., Liu M., Wang M. Q., Jiang K. Y., Liu X. W., Wang L., 2018
Adaptation of the white shrimp Litopenaeus vannamei to gradual changes to a low-
pH environment. Ecotoxicology and Environmental Safety 149:203-210.
Khanjani M. H., Sajjadi M. M., Alizadeh M., Sourinejad I., 2016 Study on nursery growth
performance of Pacific white shrimp (Litopenaeus vannamei) (Boone 1931) under
different feeding levels in zero water exchange system. Aquaculture Research
15(4):1465-1484.
Kumlu M., Jones D. A., 1995 Salinity tolerance of hatchery-reared postlarvae of Penaeus
indicus (H. Milne Edwards) originating from India. Aquaculture 130(2-3):287-296.
Labrador J. R. P., Guiñares R. C., Hontiveros G. J. S., 2016 Effect of garlic powder-
supplemented diets on the growth and survival of Pacific white leg shrimp
(Litopenaeus vannamei). Cogent Food & Agriculture 2:1210066, 8 p.

AACL Bioflux, 2021, Volume 14, Issue 1.
http://www.bioflux.com.ro/aacl 559
Li E., Wang X., Chen K., Xu C., Qin J. G., Chen L., 2015 Physiological change and
nutritional requirement of Pacific white shrimp Litopenaeus vannamei at low
salinity. Reviews in Aquaculture 9(1):57-75.
Liao X. Z., Wang C. G., Wang B., Qin H. P., Hu S. K., Zhao J. C., Zhang S., 2020
Research into the hemocyte immune response of Fenneropenaeus merguiensis
under decapod iridescent virus 1 (DIV1) challenge using transcriptome analysis.
Fish & Shellfish Immunology 104:8-17.
Liu W. C., Zhou S. H., Balasubramanian B., Zeng F. Y., Sun C. B., Pang H. Y., 2020
Dietary seaweed (Enteromorpha) polysaccharides improve growth performance
involved in the regulation of immune responses, intestinal morphology and
microbial community in banana shrimp Fenneropenaeus merguiensis. Fish &
Shellfish Immunology 104:202-212.
Madeira D., Mendonça V., Dias M., Roma J., Costa P. M., Larguinho M., Diniz M. S., 2015
Physiological, cellular and biochemical thermal stress response of intertidal shrimps
with different vertical distributions: Palaemon elegans and Palaemon serratus.
Comparative Biochemistry and Physiology Part A: Molecular & Integrative
Physiology 183:107-115.
Maicá P. F., Borba M. R. D., Martins T. G., Wasielesky Jr. W., 2014 Effect of salinity on
performance and body composition of Pacific white shrimp juveniles reared in a
super-intensive system. Revista Brasileira de Zootecnia 43(7):343-350.
Marlina E., Panjaitan I., 2020 Retraction: Optimal stocking density of vannamei shrimp
Litopenaeus vannamei at low salinity using spherical tarpaulin pond. IOP
Conference Series: Earth and Environmental Science 537:012048.
Mizanur R. M., Bai S. C., 2014 The optimum feeding frequency in growing Korean
rockfish (Sebastes schlegeli) rearing at the temperature of 15°C and 19°C. Asian-
Australasian Journal of Animal Sciences 27(9):1319-1327.
Muhammad H., Situmorang M. L., Djohan Y. A., Aditiawati P., Suantika G., 2016
Biological, technical, and financial feasibilities study of zero water discharge (ZWD)
system application in low salinity white shrimp (Litopenaeus vannamei Boone)
urban aquaculture, study case: Gresik District, East Java, Indonesia. Journal of
Fisheries & Livestock Production 4(4):1000197, 11 p.
Nehru E., Rao A. C., Pamanna D., Ranjith P., Lokesh B., 2018 Effect of aqueous minerals
supplementation on growth and survival of Litopenaeus vannamei in low salinity
water. International Journal of Current Microbiology and Applied Sciences
7(1):1706-1713.
Praveen K. D., Krishna P. V., 2015 Survival and growth performance of Pacific white
shrimp Litopenaeus Vannamei (Boone1931) under different stocking densities.
Journal of Agriculture and Veterinary Science 8(5):17-19.
Qian J. H., Li Z. M., Ye N., Liu J. Y., Hu Z. G., Zheng K. J., 2015 Combined effects of
temperature and salinity on the growth and survival of Fenneropenaeus
merguiensis. Progress in Fishery Science 36(3):62-67.
Sakas A., 2016 Evaluation of whiteleg shrimp (Litopenaeus vannamei) growth and
survival in three salinities under RAS conditions. Master Thesis, The University of
Michigan, USA, 29 p.
Sentosa A. A., Hedianto D. A., Suryandari A., 2017 [Food habits and trophic interactions
of penaeid shrimp communities in the waters of East Aceh]. BAWAL Widya Riset
Perikanan Tangkap 9(3):197-206. [In Indonesian].
Susanto A., Hutabarat J., Anggoro S., 2020 The effects of dietary carbohydrate level on
the growth performance, body composition, and feed utilization of juvenile Kelabau
(Osteochilus melanopleurus). AACL Bioflux 13(4):2061-2070.
Thi Thu E. V., Rahman M., Phoo W. W., Kim C. H., 2019 Salinity effects on growth and
survival of the polychaete rockworm Marphysa sanguinea (Montagu, 1813)
juveniles and adults. Journal of Aquaculture Research and Development
10(2):1000562, 7 p.
Tran-Ngoc K. T., Schrama J. W., Le M. T. T., Nguyen T. H., Roem A. J., Verreth J. A.,
2017 Salinity and diet composition affect digestibility and intestinal morphology in
Nile tilapia (Oreochromis niloticus). Aquaculture 469:36-43.

AACL Bioflux, 2021, Volume 14, Issue 1.
http://www.bioflux.com.ro/aacl 560
Valenzuela-Madrigal I. E., Valenzuela-Quiñónez W., Esparza-Leal H. M., Rodríguez-Quiroz
G., Aragón-Noriega E. A., 2017 Effects of ionic composition on growth and survival
of white shrimp Litopenaeus vannamei culture at low-salinity well water. Revista de
Biología Marina y Oceanografía 52(1):103-112.
Valle B. C. S., Dantas Jr. E. M., Silva J. F. X., Bezerra R. S., Correia E. S., Peixoto S. R.
M., Soares R. B., 2015 Replacement of fishmeal by fish protein hydrolysate and
biofloc in the diets of Litopenaeus vannamei postlarvae. Aquaculture Nutrition
21(1):105-112.
Wang X., Li E., Xu C., Qin J. G., Wang S., Chen X., Cai Y., Chen K., Gan L., Yu N., Du Z.
Y., Chen L., 2016 Growth, body composition, ammonia tolerance and
hepatopancreas histology of white shrimp Litopenaeus vannamei fed diets
containing different carbohydrate sources at low salinity. Aquaculture Research
47(6):1932-1943.
Xu W. J., Pan L. Q., Sun X. H., Huang J., 2012 Effects of bioflocs on water quality,
survival, growth, and digestive enzyme activities of Litopenaeus vannamei (Boone)
in zero‐water exchange culture tanks. Aquaculture Research 44(7):1093-1102.
Yang S. P., Liu H. L., Guo W. J., Wang C. G., Sun C. B., Chan S. F., Li S. C., Tan Z. H.,
2020 Effects of salinity and temperature on the metabolic and immune parameters
of the banana shrimp Fenneropenaeus merguiensis (De Man, 1988). Iranian Journal
of Fisheries Sciences 19(4):2010-2023.
Yang S. P., Wu Z. H., Jian J. C., Zhang X. Z., 2010 Effect of marine red yeast
Rhodosporidium paludigenum on growth and antioxidant competence of
Litopenaeus vannamei. Aquaculture 309(1-4):62-65.
Zhang P., Zhang X., Li J., Gao T., 2009 Effect of salinity on survival, growth, oxygen
consumption, and ammonia‐N excretion of juvenile whiteleg shrimp, Litopenaeus
vannamei. Aquaculture Research 40(12):1419-1427.
Zhang Q., Liu S., Yang H., Zhu L., Wan X., Li X., Huang J., 2017 Reverse transcription
loop-mediated isothermal amplification for rapid and quantitative assay of covert
mortality nodavirus in shrimp. Journal of Invertebrate Pathology 150:130-135.
Received: 19 November 2020. Accepted: 28 December 2020. Published online: 28 February 2021. Authors: Mostafa Imhmed Ighwerb, Doctoral Program, Faculty of Fisheries and Marine Science, Diponegoro University, 50275 Tembalang, Semarang, Indonesia, e-mail: [email protected] Johannes Hutabarat, Department of Aquaculture, Faculty of Fisheries and Marine Science, Diponegoro University, 50275 Tembalang, Semarang, Indonesia, e-mail: [email protected] Ervia Yudiati, Department of Marine Science, Faculty of Fisheries and Marine Science, Diponegoro University, 50275 Tembalang, Semarang, Indonesia, e-mail: [email protected] Rudhi Pribadi, Department of Marine Science, Faculty of Fisheries and Marine Science, Diponegoro University, 50275 Tembalang, Semarang, Indonesia, e-mail: [email protected] This is an open-access article distributed under the terms of the Creative Commons Attribution License, which permits unrestricted use, distribution and reproduction in any medium, provided the original author and source are credited. How to cite this article: Ighwerb M. I., Hutabarat J., Yudiati E., Pribadi R., 2021 Study on different salinities and diets for the survival and growth of newly introduced Penaeus merguiensis larvae culture. AACL Bioflux 14(1):546-560.
Related Documents