STUDY ON APOLIPOPROTEIN E (APOE) GENE POLYMORPHISM AND CORONARY ARTERY DISEASE BIOMARKER IN DIABETIC PATIENTS ATHIRAH BINTI ABDUL SANI UNIVERSITI SAINS MALAYSIA 2016

Welcome message from author
This document is posted to help you gain knowledge. Please leave a comment to let me know what you think about it! Share it to your friends and learn new things together.
Transcript

STUDY ON APOLIPOPROTEIN E (APOE) GENEPOLYMORPHISM AND CORONARY ARTERY
DISEASE BIOMARKER IN DIABETIC PATIENTS
ATHIRAH BINTI ABDUL SANI
UNIVERSITI SAINS MALAYSIA2016

STUDY ON APOLIPOPROTEIN E (APOE) GENEPOLYMORPHISM AND CORONARY ARTERY
DISEASE BIOMARKER IN DIABETIC PATIENTS
by
ATHIRAH BINTI ABDUL SANI
Dissertation Submitted in Partial Fulfillment Of The Requirements
For The Degree OfMaster of Science
UNIVERSITI SAINS MALAYSIA2016

ii
ACKNOWLEDGEMENT
I thank Allah SWT for His blessing and mercy until I accomplish my dissertation
as the requirement for the degree of Master Science. First and foremost I would like to
express my very great appreciation to my supervisor, Dr. Shahrul Bariyah Sahul Hamid,
who had supported me throughout my research and dissertation with her expertise and
advice. One simply could not wish for a better or friendlier supervisor. I would also like
to thank my co-supervisor, Dr. Nor Hazwani Ahmad for her guide and encouragement in
carrying out this research. Without their support, this dissertation would not have been
possible.
Secondly, the biggest thanks for my beloved parents Mr. Abdul Sani Ibat and Mrs.
Nazriah Ahmad for their infinite supports, prayers and love. May both of them always
blessed by Allah SWT. I am particularly grateful for the kindness of my classmates whose
always gave moral support and for the assistance given by all the staffs and friends in
Oncology Lab. I would like to acknowledge with gratitude to my beloved best friends
whose always there for me whenever I need them, my colleagues and superiors for their
thoughtful and to Ministry of Health for granting me study leave and scholarship for
graduate studies.
I would also like to extend my thanks to AMDI Student Research Fund for
providing the funding for this research. Last but not least, many thanks to all those who
are indirectly involved in helping me and inspired me to complete this research. Indeed,
their help means a lot to me.

iii
TABLE OF CONTENTS
Page
Acknowledgement ………………………………………………………………….. ii
Table of Contents …………………………………………………………………… iii
List of Tables ……………………………………………………………………….. vi
List of Figures ………………………………………………………………………. vii
List of abbreviations and symbols ………………………………………………….. viii
Abstrak ………………………………………………………………………………. x
Abstract ……………………………………………………………………………… xii
CHAPTER 1: INTRODUCTION
1.1 Diabetes and coronary artery disease …………………………………………….. 1
1.2 Epidemiology of T2DM and CAD ……………….................................................. 3
1.3 Lipid profile ………………………………………………………………………. 8
1.4 Apolipoprotein E gene ……………………………………………………………. 9
1.5 Apo E polymorphism and disease …………………………………………………12
1.6 Frequency of Apo E polymorphism ……………………………………………….15
1.7 Restriction Fragment Length Polymorphism ……………………………………...16
1.8 Problem statement ………………………………………………………………….17
1.9 General objective …………………………………………………………………...18
2.0 Specific objectives ………………………………………………………………….18

iv
CHAPTER 2: MATERIALS AND METHODS
2.1 Subjects ……………………………………………………………………………
2.1.1 Sample size determination ……………………………………………….19
2.1.2 Subjects …………………………………………………………………. 20
2.2 Biochemical analysis ………………………………………………………………20
2.3 APOE genotyping
2.3.1 PCR-RFLP ……………………………………………………………… 21
2.3.2 Restriction isotyping of amplified Apo E sequences with HhaI …………22
2.3.3 Electrophoresis of restriction fragment ………………………………….. 22
2.3.4 Preparation of TAE 50X stock buffer …………………………………… 22
2.4 APOE genotype and allele frequencies …………………………………………… 24
2.5 Statistical Analysis ……………………………………………………………….. 24
CHAPTER 3: RESULTS
3.1 Clinical and laboratory characteristic …………………………………………….. 27
3.2 APOE genotype and allele frequencies …………………………………………… 28
3.3 APOE gene polymorphism and lipid profile ……………………………………… 28
CHAPTER 4: DISCUSSION …………………………………………………………. 35
CHAPTER 5: CONCLUSION
5.1 Conclusion of the study …………………………………………………… 44

v
5.2 Limitations ………………………………………………………………… 44
5.3 Recommendations for future studies ……………………………………… 45
REFERENCES ………………………………………………………………………... 46
APPENDIX ………………………………………………………………………….... 56

vi
LIST OF TABLES
Page
Table 2.1 Polymerase chain reaction master mix 22
Table 2.2 Thermocycling conditions for PCR cycle 22
Table 3.1 Clinical and laboratory characteristics of T2DM with and 30
without CAD
Table 3.2 Genotypes and allelic frequency of Apo E in T2DM with and 32
without CAD
Table 3.3 The association between APOE genotypes and lipid profile 33
in both groups
Table 3.4 The association between APOE alleles and lipid profile 34
among T2DM with and without CAD.

vii
LIST OF FIGURES
Page
Figure 1.1 Estimated number of people with diabetes worldwide
and per region in 2015 and 2040 (20 – 70 years) 6
Figure 1.2 Prevalence of diabetes ≥ 18 years old in Malaysia, 6
By age groups (1996, 2006, 2011)
Figure 1.3 Age-adjusted death rates for coronary heart disease (CHD),
stroke, lung and breast cancer for white and black females 7
(United States: 2013)
Figure 1.4 Estimated average 10-year cardiovascular disease risk in adults
50 to 54 years of age according to levels of various risk factors 7
Figure 1.5 Structure of chylomicron as a representative structure of typical 11
lipoprotein particle
Figure 1.6 Summary of the general pathway of lipoprotein metabolism 11
Figure 1.7 Schematic representation of the metabolism of Apo E 14
containing lipoproteins in humans with different genotypes
Figure 2.1 Amino acid arrangement in Apo E gene sequence 26
Figure 2.2 Cleavage maps of HhaI for each isoform 26
Figure 3.1 Electrophoresis separation of HhaI for each isoform 31
Figure 3.2 APOE genotypes and alleles frequency in both groups of patients 33

viii
LIST OF ABBREVIATIONS AND SYMBOLS
APOE Apolipoprotein E
BAS Bile acid sequestrants
BMI Body mass index
CAD Coronary artery disease
CHD Coronary heart disease
EDTA Ethylenediaminetetraacetic acid
HbA1c Haemoglobin A1c
HDL-C High density lipoprotein cholesterol
HKL Hospital Kuala Lumpur
hs-CRP High sensitive C- reactive protein
IDF International Diabetes Federation
LDL-C Low density lipoprotein cholesterol
LRP LDL-receptor related protein
MI Myocardial infarction
NCD Non-communicable disease
PCR Polymerase chain reaction
RFLP Restriction fragment length polymorphism
SD Standard deviation

ix
T2DM Type 2 diabetes mellitus
TAE Tris-acetate-EDTA
TC Total cholesterol
TG Triglycerides
VLDL-C Very low density lipoprotein cholesterol
WHO World Health Organization

x
KAJIAN TENTANG POLIMORFISME GEN APOLIPOPROTEIN E (APOE)
DAN BIOMARKER PENYAKIT ARTERI KORONARI DI KALANGAN
PESAKIT DIABETES
ABSTRAK
Gen apolipoprotein E (APOE) memainkan peranan yang penting dalam
metabolisme lipoprotein dan pengangkutan lipid. Pelbagai kajian tentang kaitan antara
polimorfisme gen APOE di kalangan pesakit diabetes yang menghidap arteri koronari
(CAD) telah dijalankan dalam beberapa tahun kebelakangan ini. Walau bagaimanapun,
tiada kajian yang dijalankan di kalangan populasi Malaysia berkenaan kaitan antara
polimorfisme gen APOE di kalangan pesakit diabetes yang menghidap CAD. Oleh itu,
objektif kajian ini dijalankan adalah untuk mengkaji peranan polimorfisme gen APOE
dalam mempengaruhi CAD di kalangan pesakit diabetes mellitus jenis 2 (T2DM) di
Hospital Kuala Lumpur (HKL). Sejumlah 45 orang pesakit T2DM (21 lelaki dan 23
wanita) telah dikaji yang mana 11 orang daripadanya adalah penghidap CAD. Analisis
biokimia termasuk glukosa, HbA1c dan profil lipid yang merangkumi kolesterol (TC),
trigliserida (TG), lipoprotein berketumpatan rendah (LDL-C) dan lipoprotein
berketumpatan tinggi (HDL-C). Maklumat diperoleh dari pangkalan data Makmal
Patologi Hospital Kuala Lumpur. Kajian penjenisan gen APOE telah dijalankan dengan
menggunakan teknik polimerfisme panjang fragmen restriksi (RFLP). Produk PCR
dicernakan dengan enzim restriksi. Fragmen dipisahkan dengan menggunakan
elektroforesis gel agarosa. Pesakit T2DM dengan dan tanpa CAD mempunyai perbezaan
signifikan terhadap glukosa dan TG dalam plasma (p = 0.048 and p = 0.019). Genotip
APOE yang dikesan dalam kajian ini ialah 3/ε3, ε3/ε4, ε2/ε3, ε2/ε4 and ε4/ε4 kecuali

xi
genotip ε2/ε2. Hasil kajian menunjukkan, frekuensi genotip ε3/ε4 adalah lebih tinggi di
kalangan T2DM dengan CAD berbanding T2DM tanpa CAD. Walau bagaimanapun,
tiada perbezaan signifikan dalam taburan genotip dan alel APOE antara kedua-dua
kumpulan pesakit. Kajian menunjukkan perbezaan signifikan antara HDL-C dan genotip
(p = 0.004) serta alel (p = 0.001) APOE. Didapati hanya pesakit T2DM tanpa CAD yang
terkesan dengan variasi alel dan HDL-C. Analisis selanjutnya tentang kaitan antara
polimorfisme gen APOE dan profil lipid menunjukkan tiada perbezaan signifikan
terhadap TC, TG dan LDL-C untuk kedua-dua genotip dan alel. Konklusinya, alel ε4
adalah tinggi di kalangan CAD dan rendah HDL-C.

xii
STUDY ON APOLIPOPROTEIN E (APOE) GENE POLYMORPHISM AND
CORONARY ARTERY DISEASE BIOMARKER IN DIABETIC PATIENTS
ABSTRACT
Apolipoproteion E (APOE) gene plays a major role in lipoprotein metabolism and
lipid transport. Various studies on the association of the APOE gene polymorphism
among diabetes patients with coronary artery disease (CAD) also has been investigated
in the last few years. However, there is no report among the Malaysian population in
regard to the association of APOE gene polymorphism among patients with T2DM and
CAD patients. Thus, the objective was to study role of APOE gene polymorphisms in
development of CAD among type 2 diabetes mellitus (T2DM) patients in Hospital Kuala
Lumpur (HKL). Total of 45 T2DM patients (21 men and 23 women) was investigated in
which 11 of them had complications with CAD. Biochemical analyses included glucose,
HbA1c and lipid profile which consists of total cholesterol (TC), triglycerides (TG), low
density lipoprotein (LDL-C) and high density lipoprotein (HDL-C). Data were obtained
from the Hospital Kuala Lumpur Pathology Laboratory database. Genotyping of APOE
was done by using polymerase chain reaction-restriction fragment length polymorphism
(PCR-RFLP). The PCR product was digested with restriction enzymes. Fragments were
separated using agarose gel electrophoresis. The T2DM with and without CAD subjects
had significant differences in glucose and TG plasma levels (p = 0.048 and p = 0.019).
The APOE genotypes detected in this study were of ε3/ε3, ε3/ε4, ε2/ε3, ε2/ε4 and ε4/ε4
except for ε2/ε2 genotype. Research finding showed, frequency of ε3/ε4 genotype was
higher among T2DM with CAD compared to T2DM no CAD. However, there was no
significant difference in distribution of the APOE genotype and alleles among both

xiii
groups. Study showed there was a significant difference of HDL-C level between APOE
genotype (p = 0.004) and alleles (p = 0.001). It was noted only T2DM patients with no
CAD were affected with allele’s variation and HDL-C levels. Further analysis on the
association of the APOE gene polymorphism and lipid profile showed there were no
significant difference for TC, TG and LDL-C with genotypes and alleles. In conclusion
ε4 higher in CAD and reduces HDL-C.

1
CHAPTER 1
INTRODUCTION
1.1 Diabetes and coronary artery disease
Non-communicable disease (NCD) such as diabetes, cardiovascular diseases,
cancers and chronic respiratory diseases are responsible for 82 % of all deaths worldwide
which are expected to increase to 52 million by 2030 (WHO, 2016). Diabetes mellitus is
one of the most common metabolic disorders and the prevalence of diabetes in adults
continue to increase due to the lifestyles which lead to reduced physical activity and
increased obesity (Guariguata et al., 2014). This metabolic disorder affected 415 million
people worldwide in 2015, which had been expected increase to 642 million in 2040
(International Diabetes Federation, 2016).
One of the main reasons of premature illness and death was due to diabetes with
a higher chance of developing Coronary Artery Disease (CAD). CAD is a cause for
around 50 % to 80 % of deaths among diabetics. The American Association Heart
Association also reported that CAD is the one main reason of mortality among diabetes
patients. Approximately between two to four-fold increase in risk of CAD compared to
those without diabetes (Eckel et al., 2006). Type 2 Diabetes Mellitus (T2DM) patients
with CAD have a worse prognosis for survival compared those CAD patient without
diabetic (Grundy et al., 1999).
Previous studies showed that T2DM is also related to sudden cardiac death
(Kucharska-Newton et al., 2010, Siscovick et al., 2010). Furthermore, cohort study done
by Shah et al. (2015) concluded that the higher risk of cardiac arrest with T2DM is caused

2
by atherosclerotic coronary disease as studied on most common initial cardiovascular
disease such as stable angina, heart failure or peripheral arterial disease. Besides that, the
study showed there was an association between the Hemoglobin A1c (HbA1c)
concentration and risk of cardiovascular diseases. Even though the concentration of
HbA1c less than 48 mmol/mol (6.5 %), this major factor could resulting the person to
develop peripheral arterial disease.
The risk of diabetic patients to have CAD is about 2 to 4 higher than non-diabetic
patients. Moreover, diabetic patients may have different type and degree of the effect of
CAD risk factors compared with non-diabetic patients (Chamnan et al., 2009). A
retrospective cohort study among Chinese diabetic patients stated the incidence and
predictors of CAD, which include smoking, body mass index (BMI), HbA1c, systolic
blood pressure, diastolic blood pressure, Total Cholesterol-High Density Lipoprotein
(TC-HDL) ratio and albumin/creatinine ratio. These factors also contributed to the
development of CAD among T2DM patients. This can be used as a guideline for the
tertiary preventive interventions (Wan et al., 2016).
T2DM patients that have a complication with cardiovascular were considered as
experienced a severe complication since it was affected by their quality of life and
survival. Garcia-Fontana et. al (2016) reported that phospholipids (PLs) are important
metabolites involved in T2DM and CAD. They suggested that metabolomics approach
was benefited in giving information about the changes in the metabolomics pathways
involved in CAD associated with T2DM. This is beneficial in order to develop strategies
for the new prevention of metabolic disorders.

3
1.2 Epidemiology of T2DM and CAD
Global estimates of diabetes prevalence have shown increases over the past 15
years. King et. al (1998) predicted the prevalence of diabetes would reach 300 million by
2025 whereas, WHO estimated that this would exceed to 366 million by the year of 2030.
Furthermore, there were also an increase in the estimation of diabetes prevalence by
International Diabetes Federation (IDF) from 151 million in 2000 (IDF, 2000); 194
million in 2003 (IDF, 2003); 246 million in 2006 (IDF, 2006); 285 million in 2010 (IDF,
2010); 366 million in 2011 (IDF, 2011) and most recently 415 in 2015 (IDF Diabetes
Atlas, 2016).
In Malaysia, there is also an increasing of the prevalence of T2DM among adult
aged ≥ 18 years old over the past decade. The 5th Malaysian National Health and
Morbidity Survey (NHMS V) in 2015, reported that the prevalence of T2DM increased
to 17.5 % equal to 3.5 million, compared to previous National Health and Morbidity
Survey (NHMS IV) in 2011, which is only 15.2 % reported (MOH, 2016).
As for comparison among Malaysian, the Indian ethnic group had the highest
prevalence of T2DM (24.9 % in 2011 and 19.9 % in 2006), followed by Malays (16.9 %
in 2011 and 11.9 % in 2006), and Chinese ethnic group (13.8 % in 2011 and 11.4 % in
2006) (Mafauzy et al., 2011, Mohamed, 2008). These statistics was correlated with the
ongoing cohort patient registry by Audit of Diabetes Control and Management (ADCM)
which concentrated on control and management of diabetes in Malaysia. It showed ethnic
differences in glycemic control, whereby Chinese with T2DM had the lowest mean of
HbA1c levels (7.8 %) compared to Indians had the highest (8.5 %) (Chew et al., 2011).

4
Fox et. al (2004) suggested that the increasing prevalence of T2DM is leading to
an increasing rate of CAD because T2DM have similar risk factors of developing CAD.
Cardiovascular is the leading global cause of NCD deaths in 2012 with approximately of
17.5 million deaths describing 31 % of global deaths or 46 % of NCD deaths. WHO
reported that heart attack disease could cause an estimation about 7.4 million of deaths.
The prevalence is expected to increase to more than 23.6 million by 2030. Statistics from
WHO and United Nations stated that CAD mortality rates between countries were varied
by more than twenty-fold. The previous study reported that the highest in the CAD
mortality rate was in Eastern Europe and Central Asia. Furthermore, countries with the
low and middle income were higher CAD mortality compared to countries with high
income. More than 80 % of global CAD deaths came from the low and middle-income
countries (Finegold et al., 2013).
In the year of 2010, CAD which is also the leading cause of death in Malaysia
was estimated to cause almost 24.5 % of death in government hospitals (MOH, 2011). In
Malaysia the prevalence of risk factors for cardiovascular are physical inactivity 60 %,
smoking 26 %, obesity 49 %, hypertension 26 %, raised blood glucose 11 % and
hypercholesterolemia 54 % (Chang et al., 2012, Song et al., 2004, Mustapha et al., 2014).
Fifth National Health and Morbidity Survey in 2015 reported a prevalence of 47.7 %
hypercholesterolemia adults (MOH, 2016).

5
Yussof K. (1996) reported that risk factors for CAD were noted among the rural
and semirural population in Peninsular Malaysia. A study done in a rural population in
Sarawak showed that there was a lower prevalence of risk factors which include smoking,
hypercholesterolemia, elevated blood glucose and hypertension in the rural community
but a higher prevalence of overweight (Ching Thon et al., 2012). Bloom et al. (2011)
stated that cardiovascular disease is one of the diseases that is the dominant contributor
to the global economic burden of NCDs.
6
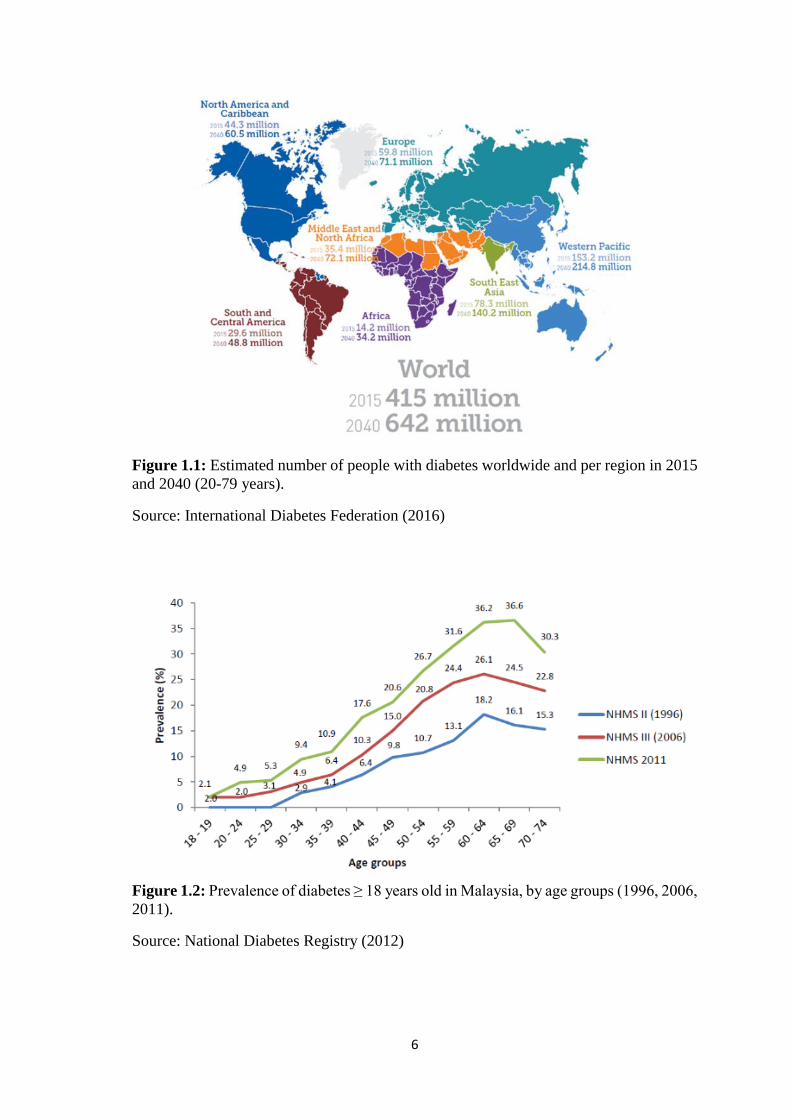
Figure 1.1: Estimated number of people with diabetes worldwide and per region in 2015
and 2040 (20-79 years).
Source: International Diabetes Federation (2016)
Figure 1.2: Prevalence of diabetes ≥ 18 years old in Malaysia, by age groups (1996, 2006,
2011).
Source: National Diabetes Registry (2012)
7
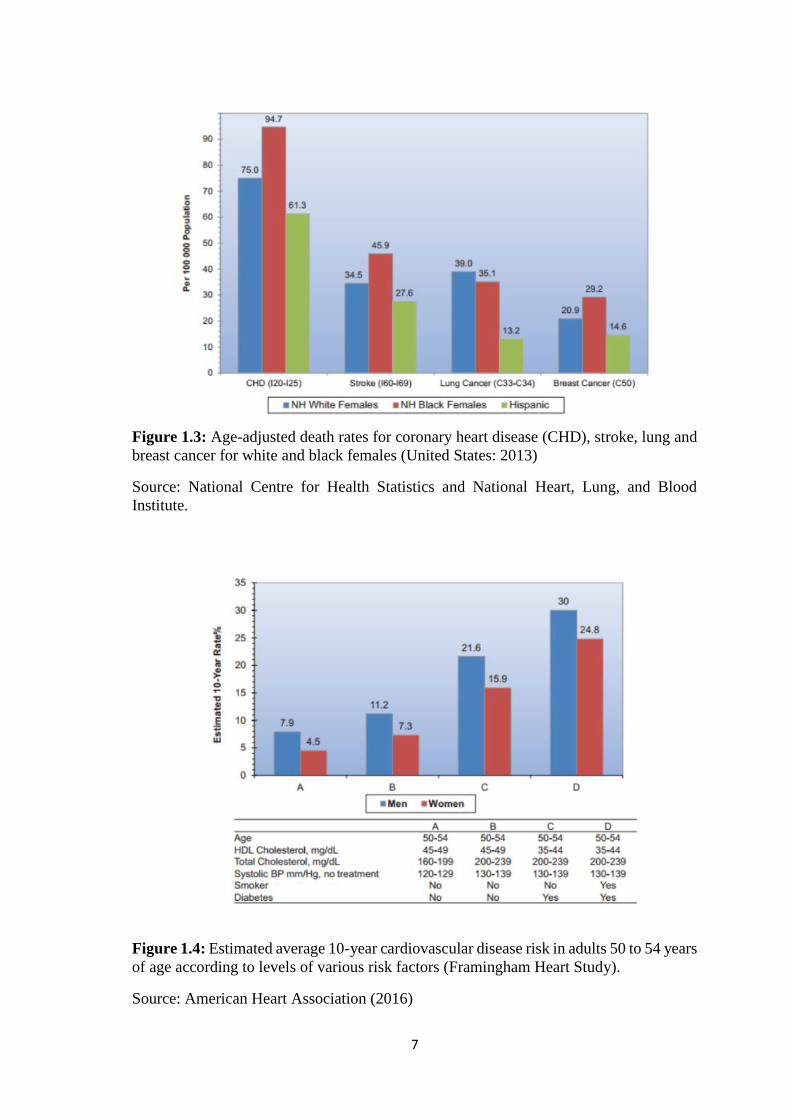
Figure 1.3: Age-adjusted death rates for coronary heart disease (CHD), stroke, lung and
breast cancer for white and black females (United States: 2013)
Source: National Centre for Health Statistics and National Heart, Lung, and Blood
Institute.
Figure 1.4: Estimated average 10-year cardiovascular disease risk in adults 50 to 54 years
of age according to levels of various risk factors (Framingham Heart Study).
Source: American Heart Association (2016)

8
1.3 Lipid profile
T2DM patients who had tight control of glycemia and CAD with hypertension
and dyslipidemia were reported to have less CAD morbidity and mortality (Turnbull et
al., 2005). To monitor the association of cardiovascular risk and lipid-lowering therapies
in patients with and without diabetes, serum concentration of lipids are used. Lipid profile
consist of total cholesterol (TC), high density lipoprotein (HDL-C), low density
lipoprotein (LDL-C) and triglyceride (TG). The ratios of TC/HDL-C and LDL-C/HDL-
C also are referred. Besides that, recent guidelines have recommended that non-HDL-C
as one of the parameter to predict the cardiovascular risk (Perk et al., 2013). T2DM
patients have abnormal levels of serum lipid profile including a lower concentration of
HDL-C, elevated LDL-C as well as TG. Individual with no diabetes but had an
abnormality in their lipid profile also potentially to develop CAD (Grundy et al., 2002).
Metabolic syndrome with obesity, diabetes and history of insulin resistance
commonly have high TG level and low HDL-C level (Kannel and Vasan, 2009). Since
cholesterol is transferred from HDL-C to TG-rich very low density lipoprotein (VLDL),
TG and HDL-C have a close contrary relationship (Feingold and Grunfeld, 2000). The
lipid profile is a marker for the presence of the high atherogenic small dense LDL-C
particles that penetrate the intima (Rajman et al., 1999) and are subject to oxidation
(Tribble et al., 1992). The latest study by Hirakawa et. al (2016) also reported the positive
association of risk of CAD with increased TC and decreased HDLC. They reported
although BMI does not affect total and HDL cholesterol, but high BMI exacerbates the
effects of TG on CAD. There was an association in the effects of TG on CHD with BMI,
which was still evident after adjusting for HDL-C and TC. Furthermore, their study
indicates that one of the factors to reduce the burden of CAD is by the body weight control
together with management of dyslipidemia.

9
For the treatment of hyperlipidemia, statin had been used since their introduction
in the 1980s (Endo, 2008). Besides that, bile acid sequestrants (BASs) also have been
used to reduce the cholesterol level. The second generation of BAS, colesevelam was
introduced in the early 2000s and was proven had a higher potency in binding bile acids
and better tolerability (Sandhu et al., 2016). Colesevelam benefit for those statin
intolerance and needed the second-line LDL-lowering agents. It also effective in lowering
glucose level especially among adults older than 65 years (Gavin et al., 2014).
1.4 Apolipoprotein E gene
Apolipoprotein gene family consists of Apolipoprotein E (Apo E) gene apart of
others Apo (A-I), Apo (A-II), Apo (A-IV), Apo (C-1), Apo (C-II) and Apo (C-III) (Luo
et al., 1986). Apo E gene has four exons and three introns involving 3597 nucleotides that
encode 299 amino acid polypeptides. It is present on chromosome 19q13.2 and related to
the Apo C-I/C-II gene complex. It is a type of plasma glycoprotein of 34 kDa that is linked
to HDL, VLDL and chylomicrons. Apo E is synthesized and secreted from different
organs and cells including liver, brain, spleen, kidneys, gonads, adrenals and
macrophages. It is also rich in the plasma, interstitial fluid and lymph (Huang and Mahley,
2014).
Apo E also functioned as a ligand for the removal of the VLDL and HDL from
the circulation (Winkler et al., 2010). Apo E is important for the plasma lipid levels and
involves in the regulation of plasma and tissue lipid content because Apo E has binding
affinity for lipoprotein receptors. It interacts with the Apo E-containing lipoproteins to
the LDL receptor, the LDL receptor-related protein (LRP), the VLDL receptor, the Apo
E receptor-2, and glycoprotein 330. However, each isoform of the Apo E has differents
in their interaction with these receptors (Mahley and Huang, 1999).

10
Besides that, each Apo E isoforms also differ in binding affinity to cell surface
heparin sulfate proteoglycans (HSPGs). The interaction between Apo E and HSPGs could
attract and sequester Apo E-containing lipoproteins and assist their interaction with the
LRP. HSPGs mediate the internationalization of the Apo E-containing lipoprotein
(Mahley and Huang, 2007). The differences in structural and binding of Apo E2, Apo E3
and Apo E4 to the lipid is associated with the distribution of isoform-specific Apo E
among the different lipoprotein (Mahley and Huang, 1999).

11
Figure 1.5: Structure of a chylomicron as a representative structure of a typical
lipoprotein particle.
Source: The Medical Biochemistry Page (2016)
Figure 1.6: Summary of the general pathway of lipoprotein metabolism.
Source: Journal of Internal Medicine
12
1.5 Apo E polymorphism and disease
There is an association between the lipoprotein-related mechanisms with an
abnormality of the cardiovascular system among diabetic patients (Jenkins et al., 2004).
A study conducted among the 53 Turkish patients also suggested that Apo E gene
polymorphism is linked with atherosclerosis and play a critical role in lipid metabolism
(Arslan Ince et al., 2010). According to Grundy et. al (2006), various Apo E gene studies
were conducted in regard to determine the development of CAD since it is important for
lipoprotein transportation and metabolism. Polymorphism of the Apo E also responsible
for about 7 % of the cholesterol variation in the population (Davignon et al., 1988).
Single nucleotide polymorphisms (SNPs) of the Apo E gene at position 112 and
158 of the gene resulting in three major alleles which are known as ε2, ε3 and ε4. These
alleles are coding for three isoforms which are Apo E2 consists of (Cys112/Cys158), Apo
E3 consists of (Cys112/Arg158) and Apo E4 consists of (Arg112/Arg158). There are 6
possible genotypes of Apo E that are of ε2/ε2, ε2/ε3, ε3/ε3, ε4/ε4 and ε2/ε4 (El-Lebedy
et al., 2016b).
Apo E alleles affect the lipid metabolism. Apo ε2 allele is associated with elevated
levels of Apo E, reduction in LDL-C and lowering risk of CAD. Apo ε4 is associated
with low level of Apo E but higher levels of TC, LDL-C, VLDL-C and greater risk of
CAD compared to Apo E3 homozygotes (Siest et al., 1995). Populations studies have
constantly shown that ε4 subjects have higher serum concentration of TC and LDL-C, ε3
subjects have an average concentration of TC and LDL-C while ε2 subjects have the
lowest concentration of TC and LDL-C (Corella et al., 2001, Wilson et al., 1994). Since
Apo ε4 has a higher affinity towards LDL-R it contributes to the impaired lipid clearance
and causes to increase of LDL particles. This condition will inhibit the LDL-R synthesis.

13
This will result in delayed clearance of lipoproteins (Knouff et al., 1999). Guang-da et. al
(2004) also reported that Apo ε4 allele is associated with CAD.
The cardiovascular role of Apo ε2 is, however, uncertain according to meta-
analysis study by Wilson et. al (1996). It has been related to high TG concentration
(Dallongeville et al., 1992). The combination of Apo ε2 homozygote with other disorders
may develop type III familial hyperlipidaemia and premature atherosclerosis. While Apo
ε3 and Apo ε4 binding affinity are similar, Apo ε2 has only 2 % of this binding affinity
resulting in dysfunctional lipoprotein metabolism producing atherosclerosis (Clark et al.,
2009).
Since Apo E gene is able to regulate lipid levels it is not surprising that the
mutations and polymorphisms of the Apo E gene can affect protein function owing to the
complexity of the Apo E structure-function. This is because the receptor binding
properties of Apo E are strongly influenced by isoform-specific amino acid differences
as well as the state of the protein modification by lipid (Hauser et al., 2011).
14
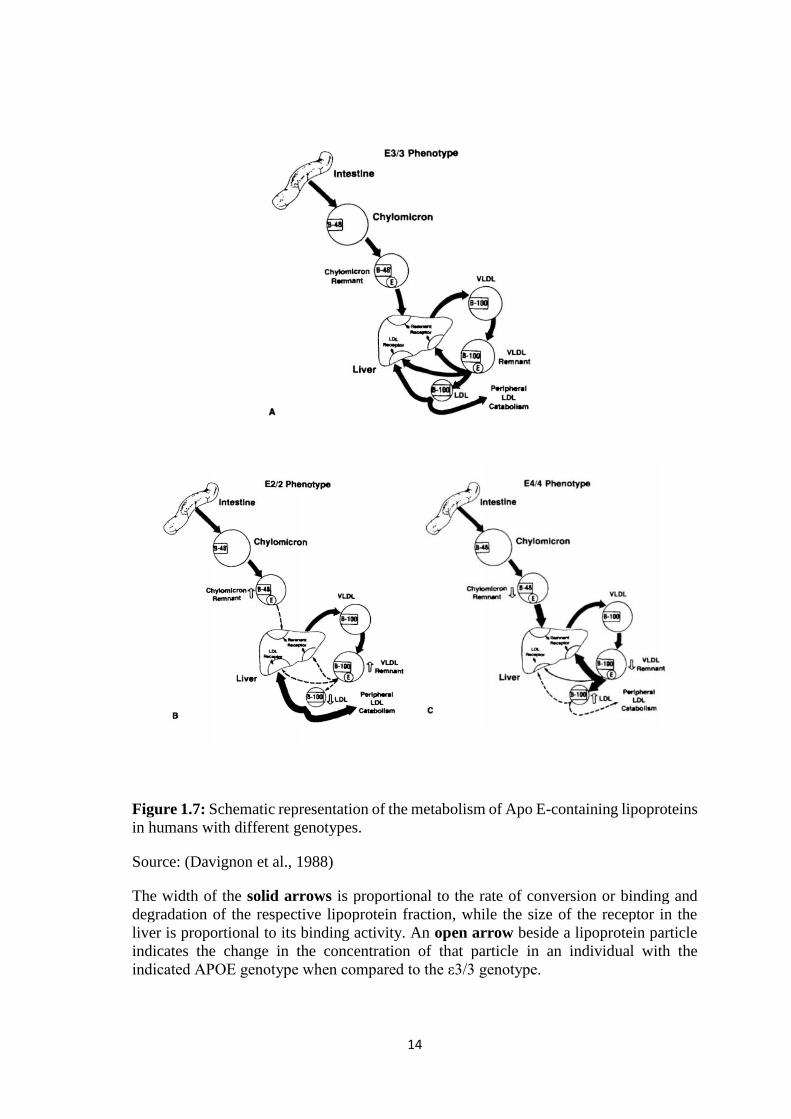
Figure 1.7: Schematic representation of the metabolism of Apo E-containing lipoproteins
in humans with different genotypes.
Source: (Davignon et al., 1988)
The width of the solid arrows is proportional to the rate of conversion or binding and
degradation of the respective lipoprotein fraction, while the size of the receptor in the
liver is proportional to its binding activity. An open arrow beside a lipoprotein particle
indicates the change in the concentration of that particle in an individual with the
indicated APOE genotype when compared to the ε3/3 genotype.

15
1.6 Frequency of APOE polymorphism
Frequency of the common polymorphism at the Apo E locus (ε2, ε3 and ε4) are
different between populations and these can effect on plasma lipids and cardiovascular
disease in the populations (Hallman et al., 1991), thus several studies on Apo E gene
polymorphisms was conducted in varies of populations particularly (Bennet et al., 2007).
A cardiovascular cohort study in Singapore showed the highest rate of CAD among Asian
Indians and followed by Malays and Chinese (Lee et al., 2001). Furthermore, Asian
Indians also exhibited the lowest concentration of HDL-C and highest concentration of
LDL-C compared to those observed in Chinese (Tan et al., 1999). Both Apo E genotypes
and environmental factors can influence the lipid profile and CAD risks among all the
ethnic groups in Singapore (Tan et al., 2003). Another study carried out by Seet et. al
(2004) showed the most frequent genotype and allele among Malaysians were ε3/ε3 and
ε3 respectively. Indians had a high frequency of the ε4 and ε3 allele compared to the other
two ethnic groups. Chinese had a high frequency of the ε2 allele and lowest frequency of
ε4 allele. Their finding also similar to (Hallman et al., 1991) that Indians subjects had
significantly higher frequency of ε4 and lower frequency of ε2 compared to other ethnic
groups. It is corresponds to which Indian diabetes patients are more possibility to have
CAD complication.
A previous study among South Asian population by Sapkota et. al (2015) suggests
a modest impact of Apo E genetic variation for increasing cardiometabolic susceptibility
in patients with and without T2DM. Their results also suggest significantly improved
cardiometabolic outcomes among high-risk Apo ε4 carriers in response to antidiabetic
therapy. In general, Apo E gene is associated with lipoprotein concentration neither in
diabetic nor in non-diabetic individuals (Kataoka et al., 1996). Apo E polymorphism and
differences in serum lipid level are also dependent on ethnicity factor (Jemaa et al., 2006).

16
1.7 Restriction fragment length polymorphism (RFLP)
There are a variety of methods used in the analysis of APOE polymorphism
(Davignon et al., 1988). Earlier isoelectric focusing technique on genotyping analysis is
based on charge differences between proteins limits was used for the detection of rare
variants that can present the same charge as common isoforms. Although there have been
improvements in this technique, false results may occur due to the variability of
sialylation. This happened especially in abnormal conditions such as diabetes mellitus
(Snowden et al., 1991). Several polymerase chain reaction (PCR) techniques can be used
for Apo E genotyping. The weakness of PCR and allele-specific oligonucleotide (ASO)
hybridization are involved numerous and very cautious hybridization procedures.
Moreover, sometimes false genotype was produced. Because of that the molecular
technique of Apo E genotyping has been developed (Richard et al., 1994)
In the clinical laboratory, Apo E genotyping was done by digestion of polymerase
chain reaction (PCR) product by restriction endonucleases and separation of the
fragmented genomic product by electrophoresis analysis. This is referred as restriction
fragment length polymorphism (RFLP) (Bolla et al., 1995, Guo et al., 1993, Hixson and
Vernier, 1990, Kontula et al., 1990, Zivelin et al., 1997). This technique has advantages
such as can be performed on multiple samples simultaneously and the fragment patterns
can be visualized. It is time-consuming without hybridization and sequencing steps.
Besides that, in vitro amplified DNA is not methylated, thus a wide variety of restriction
enzymes can be used (Hixson and Vernier, 1990). The major advantage of this technique
is the simplicity of the detection method by using polyacrylamide gel electrophoresis,
which is no radioactive materials are required (Kontula et al., 1990). In addition, it is less
costly because it does not involve use of advanced instruments and extensive staff
training.
17
However, some disadvantages of this technique are not suitable for high-
throughput analysis and the exact genotyping cannot be achieved when there is more than
one nucleotide variation in a restriction enzyme recognition site. Several variants of
RFLP-PCR have been developed including the techniques using a gel-free method such
as PCR combined with restriction fragment melting temperature (PCR-RFMT), amplified
fragment length polymorphism (AFLP), terminal restriction fragment length
polymorphism (T-RFLP) and inverse PCR-based amplified restriction fragment length
polymorphism (iFLP) (Henrik 2012).
1.8 Problem statement
APOE gene polymorphism is associated with atherosclerosis and plays critical
roles in lipid metabolism. The effects of the APOE polymorphism on lipid profile has
been shown among healthy individuals and diabetes population. Various studies on the
association of the APOE gene polymorphism among diabetes patients with coronary
artery disease (CAD) also has been investigated in the last few years.
However, there is no report among the Malaysian population in regard to the association
of APOE gene polymorphism among patients with T2DM and CAD patients. Thus, this
study was conducted in order to determine the distribution of APOE polymorphism
among T2DM and CAD patients and the association of APOE polymorphism with lipid
profile.

18
1.9 General objective
To study the association of APOE gene polymorphisms with lipid profile among diabetic
patient with and without coronary artery disease.
1.10 Specific objectives
To determine the APOE gene polymorphism among diabetic patients with and
without CAD.
To correlate the APOE gene polymorphism with lipid profile.

19
CHAPTER 2
MATERIALS AND METHODS
2.1 Sample
2.1.1 Sampel size determination
Sample size was determined by dichotomous test and calculated using PS
Software as shown below:
Level of significance, α = 0.05
Power of the study = 0.8
Probability of exposure among controls, P0 = 0.69
Probability of exposure among cases, P1 = 0.95 (probability in cases is higher by 25%).
Ratio of control group to T2DM patient, m = 2
Thus, sample size:
= 58 + 25% drop out of T2DM patients without CAD = 78 control patients
= 29 + 25% drop out of T2DM patients with CAD = 38 case-patients
From this calculation, a total of 78 subjects were needed for T2DM without CAD group
and 38 patients were needed in T2DM with CAD group. Total samples that had been
collected were 159 samples.

20
2.1.2 Subjects
A total of 45 adult patients aged 30 – 60 years from 159 samples collected, were
selected among the T2DM patients attending Diabetic Clinic at the Hospital Kuala
Lumpur (HKL). The patients that fulfil the inclusion and exclusion criteria were selected
from the patient’s record. The inclusion criteria for the patient with T2DM is either fasting
glucose serum level > 7.0 mmol/L, modified oral glucose tolerance test > 11.1 mmol/L
or HbA1c > 6.5%. The second group studied was those with T2DM and had any of the
following conditions: (1) stable angina (2) acute coronary syndromes (ACS) with
unstable angina, (3) non-ST elevation myocardial infarction (NSTEMI) and (4) ST
elevation myocardial infarction (STEMI). These symptoms were diagnosed by clinician
and recorded. Patients who smoke, consume alcohol, pregnant and with hyperthyroidism
were excluded from the study. Informed written consent was obtained from each
individual before participation. The study was approved by the Ethics Committee of
Ministry of Health Malaysia and Universiti Sains Malaysia.
2.2 Biochemical analysis
A total of 3 ml blood sample was collected in an EDTA tube for genotyping
analysis. The biochemical analyses results were obtained from the Laboratory Database
at HKL. They include: (1) fasting glucose (2) glycosylated haemoglobin (HbA1c) (3)
fasting lipid profile (total cholesterol, triglycerides, low density lipoprotein cholesterol
and high density lipoprotein cholesterol). Biochemistry assays were performed on Cobas
8000 modular analyser (Roche Diagnostic, USA). Serum glucose was measured with the
enzymatic colorimetric assay (Glucose GOD-PAP, Roche Diagnostic, USA). Total serum
cholesterol was measured with the enzymatic colorimetric assay (Cholesterol Chod-PAP,
Roche Diagnostic, USA). HDL-C was determined enzymatically by cholesterol esterase
Related Documents
![RESEARCH Open Access Predictors of long-term cognitive ... · age or higher education [15,16], being a carrier of the apolipoprotein E (APOE) ε4 allele [17], or moderate-to-severe](https://static.cupdf.com/doc/110x72/61007264d8591d5abf4a1f45/research-open-access-predictors-of-long-term-cognitive-age-or-higher-education.jpg)