Please cite this article in press as: Haneef T, et al. Study of the tensile behavior of AISI type 316 stainless steel using acoustic emission and infrared thermography techniques. J Mater Res Technol. 2015. http://dx.doi.org/10.1016/j.jmrt.2014.12.008 ARTICLE IN PRESS JMRTEC-137; No. of Pages 13 j m a t e r r e s t e c h n o l . 2 0 1 5; x x x(x x) :xxx–xxx Available online at www.sciencedirect.com www.jmrt.com.br Original Article Study of the tensile behavior of AISI type 316 stainless steel using acoustic emission and infrared thermography techniques Thodamrakandy Haneef, Barid Baran Lahiri, Subramaniam Bagavathiappan, Chandan Kumar Mukhopadhyay ∗ , John Philip, Bhagi Purna Chandra Rao, Tamanna Jayakumar Non Destructive Evaluation Division, Metallurgy and Materials Group, Indira Gandhi Center for Atomic Research, Kalpakkam, Tamil Nadu, India a r t i c l e i n f o Article history: Received 20 June 2014 Accepted 15 December 2014 Available online xxx Keywords: Tensile testing AISI type 316 stainless steel Acoustic emission and infrared thermography a b s t r a c t Acoustic emission (AE) and infrared thermography technique (IRT) have been used to study the tensile behavior of AISI type 316 stainless steel. Strain rates of tensile testing were varied from 1.4 × 10 −3 s −1 to 1.4 × 10 −2 s −1 . AE root mean square voltage increases with increase in strain rate due to the increase in source activation. Dominant frequency of the AE signals generated during different regions of tensile deformation has also been used to compare the results for different strain rates. The dominant frequency increases from elastic region to around 590 kHz during work hardening and 710 kHz around ultimate tensile strength (UTS) for all the strain rates. Temperature changes during different regions of deformation are monitored using infrared thermography. The temperature rise in the work hardening region is found to approximately increase linearly with time and from the slopes of the lin- ear regression analyses the rate of temperature rise in the work-hardening region is obtained which is found to be very sensitive to strain rates. From the experimental results an empirical equation that relates the rate of temperature increase with strain rate and thermal harden- ing coefficient is obtained. The correlation between the variation of AE dominant frequency and temperature rise during different deformation regions provided better insight into the tensile behavior of AISI type 316 SS for different strain rates. © 2014 Brazilian Metallurgical, Materials and Mining Association. Published by Elsevier Editora Ltda. All rights reserved. 1. Introduction Acoustic emission and infrared thermography are potential nondestructive evaluation (NDE) techniques and they can ∗ Corresponding author. E-mail: [email protected] (C.K. Mukhopadhyay). be effectively used for structural integrity monitoring appli- cations and characterizing damages in materials [1–3]. AE is defined as the class of phenomenon whereby transient elastic waves are generated by rapid release of energy from http://dx.doi.org/10.1016/j.jmrt.2014.12.008 2238-7854/© 2014 Brazilian Metallurgical, Materials and Mining Association. Published by Elsevier Editora Ltda. All rights reserved.

Welcome message from author
This document is posted to help you gain knowledge. Please leave a comment to let me know what you think about it! Share it to your friends and learn new things together.
Transcript
J
O
Ssi
TCT
NN
a
A
R
A
A
K
T
A
A
t
1
An
h2
ARTICLE IN PRESSMRTEC-137; No. of Pages 13
j m a t e r r e s t e c h n o l . 2 0 1 5;x x x(x x):xxx–xxx
Available online at www.sciencedirect.com
www. jmrt .com.br
riginal Article
tudy of the tensile behavior of AISI type 316tainless steel using acoustic emission andnfrared thermography techniques
hodamrakandy Haneef, Barid Baran Lahiri, Subramaniam Bagavathiappan,handan Kumar Mukhopadhyay ∗, John Philip, Bhagi Purna Chandra Rao,amanna Jayakumar
on Destructive Evaluation Division, Metallurgy and Materials Group, Indira Gandhi Center for Atomic Research, Kalpakkam, Tamiladu, India
r t i c l e i n f o
rticle history:
eceived 20 June 2014
ccepted 15 December 2014
vailable online xxx
eywords:
ensile testing
ISI type 316 stainless steel
coustic emission and infrared
hermography
a b s t r a c t
Acoustic emission (AE) and infrared thermography technique (IRT) have been used to study
the tensile behavior of AISI type 316 stainless steel. Strain rates of tensile testing were varied
from 1.4 × 10⁻³ s−1 to 1.4 × 10⁻² s−1. AE root mean square voltage increases with increase in
strain rate due to the increase in source activation. Dominant frequency of the AE signals
generated during different regions of tensile deformation has also been used to compare
the results for different strain rates. The dominant frequency increases from elastic region
to around 590 kHz during work hardening and 710 kHz around ultimate tensile strength
(UTS) for all the strain rates. Temperature changes during different regions of deformation
are monitored using infrared thermography. The temperature rise in the work hardening
region is found to approximately increase linearly with time and from the slopes of the lin-
ear regression analyses the rate of temperature rise in the work-hardening region is obtained
which is found to be very sensitive to strain rates. From the experimental results an empirical
equation that relates the rate of temperature increase with strain rate and thermal harden-
ing coefficient is obtained. The correlation between the variation of AE dominant frequency
and temperature rise during different deformation regions provided better insight into the
tensile behavior of AISI type 316 SS for different strain rates.
© 2014 Brazilian Metallurgical, Materials and Mining Association. Published by Elsevier
Editora Ltda. All rights reserved.
be effectively used for structural integrity monitoring appli-
. IntroductionPlease cite this article in press as: Haneef T, et al. Study of the tensile beinfrared thermography techniques. J Mater Res Technol. 2015. http://dx.do
coustic emission and infrared thermography are potentialondestructive evaluation (NDE) techniques and they can
∗ Corresponding author.E-mail: [email protected] (C.K. Mukhopadhyay).
ttp://dx.doi.org/10.1016/j.jmrt.2014.12.008238-7854/© 2014 Brazilian Metallurgical, Materials and Mining Associa
havior of AISI type 316 stainless steel using acoustic emission andi.org/10.1016/j.jmrt.2014.12.008
cations and characterizing damages in materials [1–3]. AEis defined as the class of phenomenon whereby transientelastic waves are generated by rapid release of energy from
tion. Published by Elsevier Editora Ltda. All rights reserved.
ARTICLE IN PRESSJMRTEC-137; No. of Pages 13
o l . 2
2 j m a t e r r e s t e c h nlocalized sources in a material [4]. Many of the deformationrelated microscopic processes involve some stress relaxation.Monitoring acoustic emission from a deforming material cangive significant information about the microscopic mecha-nisms involved, because magnitude of this stress relaxationis dependent upon the particular process.
Acoustic emission during tensile deformation depends onvarious microstructural features including grain size, carboncontent, cooling rate, etc. Investigations carried out indicatethat higher grain size of a material usually leads to higherAE generation and explained by changes in slip incrementaccompanying changes in grain size [5,6]. Wadley and Scruby[7] investigated the AE generated during tensile deformationof low alloy steels with carbon content varying between 0.06and 0.49 wt.% and as a function of cooling rate. It was reportedthat specimens with (a) slowly cooled microstructures (with≥10 �m ferrite dimension), (b) low initial dislocation den-sity and (c) very widely spaced precipitates, generate highestAE activity. This was attributed to higher glide distance andhigher velocity of dislocations in the ferrite phase [7]. Carpen-ter and Pfleiderer [8] reported that the magnitude of the peakrms voltage at yield increases with increasing yield strengthin AISI 4340 steel, tempered at different conditions. This wasattributed to the increase in difficulty in initiating and propa-gating Luder’s band with increasing strength levels [8].
AE technique has been effectively used to study themicro-mechanistic aspects of tensile deformation and frac-ture behavior in different materials [9–11]. These studies haveshown that dislocation kinetics, dynamic strain aging andfracture/decohesion of inclusions give rise to specific char-acteristic AE signals. Khamedi et al. [9] studied the effect ofvolume fractions of martensite on the AE behavior of dualphase steel under tensile loading. AE dominant frequencywas used to find different failure modes i.e. ferrite–martensiteinterface decohesion or martensite phase fracture. Haneefet al. [10] studied the effect of heat treatment on the Lüdersband formation in medium carbon steel using acoustic emis-sion technique. Characteristic dominant AE frequencies areobserved during Luders deformation of water quenched andtempered specimens of medium carbon steel [10]. AET hasbeen used to monitor low temperature tensile deformationof AISI type 304LN stainless steel and a mechanism basedmodel is proposed from cumulative AE counts for evolution ofmartensite during low temperature test [11]. AE during tensiledeformation and fracture of AISI type 316 stainless steel wasstudied [12,13]. In commercial grade 316 stainless steel, bursttype AE signals occur due to decohesion and/or fracture ofinclusions [12,13], whereas in nuclear grade 316 stainless steel,AE is mainly generated by dislocation activity. As comparedto ambient temperature, deformation at higher temperatures(473–973 K) results in higher AE generation in 316 stainlesssteel and this is due to serrated flow by the occurrence ofdynamic strain ageing [12]. The uniqueness of AE techniquefor characterization of various deformation processes such asparticle shearing, Orowan looping and decohesion of carbides,during the tensile deformation of a nickel base superalloy
Please cite this article in press as: Haneef T, et al. Study of the tensile beinfrared thermography techniques. J Mater Res Technol. 2015. http://dx.do
Nimonic PE16, was also shown [12].Studies have been carried out to find the influence of
extent of plastic deformation on the frequency of AE signalsgenerated during tensile deformation [12,14]. These studies
0 1 5;x x x(x x):xxx–xxx
indicated that the predominant frequency of the AE signal lin-early increases from 0.475 to 0.66 MHz with increase in plasticstrain from 2% to onset of necking in 316 stainless steel. AEThas been used to detect the micro plastic yielding occurringduring macroscopic plastic deformation in 316 stainless steel[15]. The approximate frequency range of AE signals gener-ated from dislocation sources operating during pre-yield andnear-yield tensile deformation in this steel was predicted [15].For 316 stainless steel with grain size of 45 �m and testedat a strain rate of 5.2 × 10⁻⁴ s−1, the expected frequency ofAE corresponding to the generation of Frank-Reed and grain-boundary sources during yielding was theoretically predictedto be 133 kHz and experimentally verified as 170 kHz [15].
Many studies have been reported on AE during tensiledeformation of different materials for different strain rates[16–18]. Pattnaik et al. [16] have shown that AE signal gen-erated during deformation of �-brass is strain rate sensitiveand intensity of the AE signals increases with strain rate. Theyhave attributed the increase in intensity of AE with increase instrain rate to dislocation motion and twinning. Zhiyuan et al.[17] studied the effect of strain rate on AE during deforma-tion of discontinuous yielding materials and have successfullyclassified different deformation stages with the help of AEwaveforms. AET was also used to study the effect of strain rateon tensile deformation of 316 stainless steel [18]. Increase inAE generation with increase in strain rate was attributed toincrease in the activation of AE sources during tensile defor-mation [18].
Infrared thermography is a non-contact temperature mea-surement methodology where the infrared radiations emittedby an object is recorded using an infrared camera and thetemperature of the object is measured from the intensity ofthe infrared radiations using Stefan–Boltzmann’s law, whichis described below.
q
A= �εT4 (1)
Here, q is the rate of energy emission (W), A is the area of theemitting surface (m2), � is the Stefan–Boltzmann’s constant(� = 5.676 × 10⁻⁸ Wm−2 K−4) and ε is the emissivity of the sur-face. For a perfect black-body, ε = 1 and for real surfaces, ε < 1.Detailed discussion on various IRT based experimental tech-niques and data analysis procedures can be found elsewhere[19]. IRT is routinely used for non-destructive evaluation ofmetallic and composite specimens [20,21], detection of welddefects [22] and condition monitoring applications [2].
AISI type 316 austenitic stainless steel is an importantstructural material for fast breeder reactor applications.Venkataraman et al. [18] used acoustic emission and infraredthermography (IRT) techniques simultaneously to study theeffect of strain rate on tensile deformation of 316 stainlesssteel. The techniques were selected based on the fact thatdissipated energy during tensile deformation has both heatenergy and elastic wave energy components. However, thisstudy was based on time domain analysis of AE signals and the
havior of AISI type 316 stainless steel using acoustic emission andi.org/10.1016/j.jmrt.2014.12.008
AE count rate was correlated with the strain rate. The objectiveof the present study is to use AE frequency analysis to char-acterize the sources of AE during tensile deformation of 316stainless steel. Compared to time domain, frequency domain
ARTICLE IN PRESSJMRTEC-137; No. of Pages 13
l . 2 0
aptib[droooNt
2
TtNFo3ta
mPmh4tmftass[s
j m a t e r r e s t e c h n o
nalysis of AE has an advantage since the dominant frequencyresent in the frequency spectrum should be inversely propor-ional to the duration of the dynamic event. This can providenformation on the time scale of the AE process and can thuse used to characterize the evolution of dynamic source event
14]. Moreover, an attempt has been made to correlate AEominant frequency generated during different deformationegions with temperature rise, measured using IRT, for vari-us strain rates. A new empirical relation between the ratef temperature increase and strain rate is proposed. Anotherbjective is to show the complementary nature of these twoDE techniques for their effective use for online characteriza-
ion of deformation processes.
. Experimental
he chemical composition of AISI 316 type stainless steel usedo prepare tensile specimens is as follows (in wt.%): Cr/17.1,i/12.1, Mn/1.66, Mo/2.4, C/0.04, Si/0.67, Co/0.27,Cu/0.10, ande/Balance. Flat tensile specimens having gauge dimensionsf 30 mm × 6 mm × 5 mm were solution annealed at 1323 K for0 min. These specimens were subjected to tensile deforma-ion at strain rates 1.4 × 10⁻³ s−1, 2.8 × 10⁻³ s−1, 6.9 × 10⁻³ s−1
nd 1.4 × 10⁻² s−1 at ambient temperature (∼298 K).Acoustic emission signals generated during tensile defor-
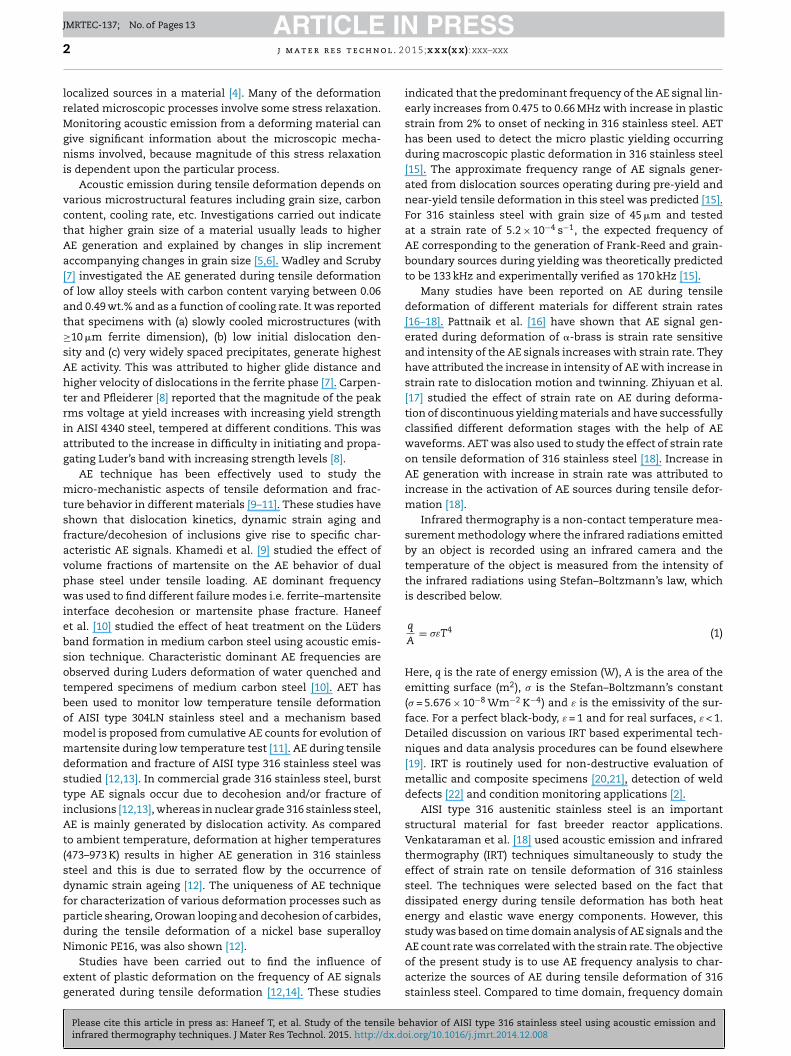
ation were recorded using AE DiSP system supplied byhysical Acoustic Corporation, USA. Schematic of the experi-ental setup used is shown in Fig. 1. A piezoelectric sensor
aving resonant frequency at 150 kHz, a preamplifier with0 dB gain and a band pass filter (100–300 kHz) were usedo record the AE signals. The total gain and threshold were
aintained at 80 and 37 dB, respectively. In order to study therequency characteristics of AE signal, a broadband piezoelec-ric sensor (100 kHz–1 MHz) was used. The sensors were fixedt shoulder to gauge transition regions of the specimens using
Please cite this article in press as: Haneef T, et al. Study of the tensile beinfrared thermography techniques. J Mater Res Technol. 2015. http://dx.do
ilicon grease as couplant. The gain and threshold were soelected that no external noise was recorded during the test23]. The AE signals were digitized at a sampling rate of 5 Megaamples per second.
Disp AE system
Preamplifier
Preamplifier
Specimen
Fig. 1 – Schematic of the e
1 5;x x x(x x):xxx–xxx 3
Infrared thermography measurements were performedusing FLIR SC 5000 infrared camera. The camera has indiumantimonide (InSb) focal plane array (320 × 256) detector. Thespectral range of the camera is 2.0–5.1 �m. The detectorelements are cooled using a Stirling cycle and the thermal sen-sitivity of the camera is better than 25 mK (i.e. NETD < 0.025 K,where NETD is noise equivalent temperature difference). Foravoiding viewing angle effects, the camera was oriented insuch a way that the camera axis is perpendicular to thespecimen surface. The camera to specimen distance wasmaintained at 500 mm for all the cases. Thermal images werecontinuously acquired at 25 frames per second during ten-sile deformation and digitally stored in a personal computer.The acquired images were later analyzed using Altair soft-ware. The tensile specimens were black painted for enhancingthe surface emissivity. Constant ambient temperature wasmaintained during the experiments. During analysis of theacquired infrared images, a region of interest was selected foreach frame and the average temperature of the pixels in theregion was used for further analysis. This technique essen-tially reduces the experimental variations as temperature ismeasured over a large number of pixels simultaneously in realtime and the average temperature is also computed in realtime using Altair software [24,25].
3. Results and discussion
3.1. Acoustic emission
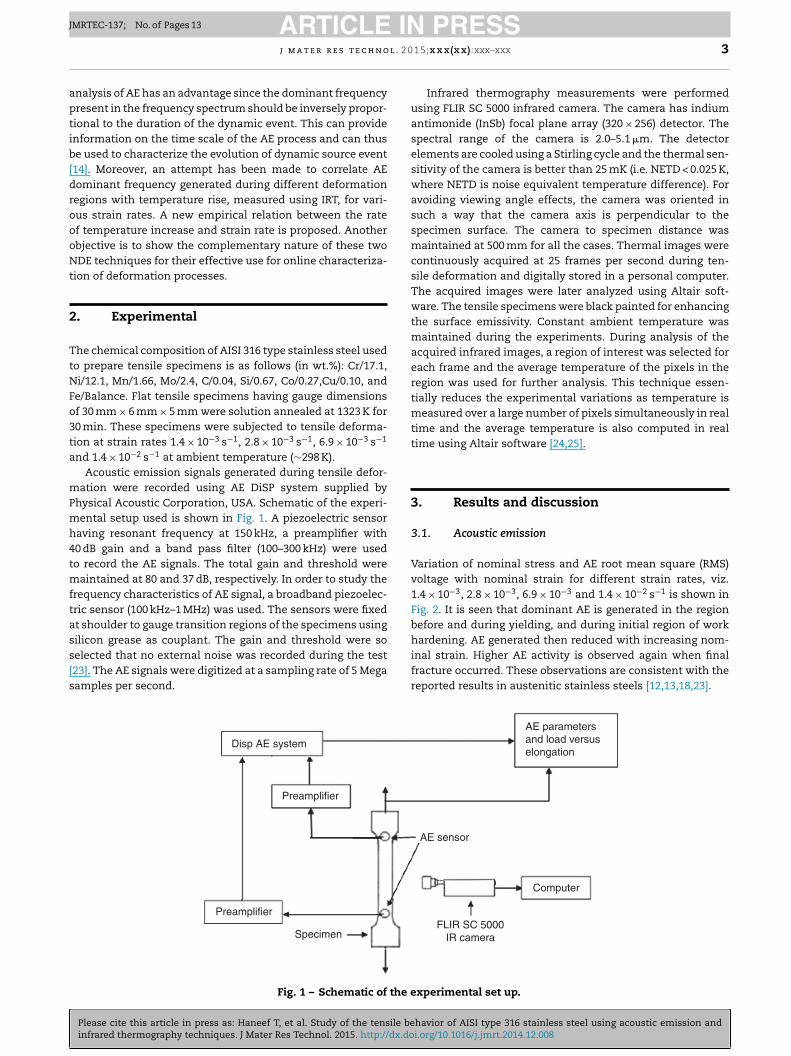
Variation of nominal stress and AE root mean square (RMS)voltage with nominal strain for different strain rates, viz.1.4 × 10−3, 2.8 × 10⁻³, 6.9 × 10⁻³ and 1.4 × 10⁻² s−1 is shown inFig. 2. It is seen that dominant AE is generated in the regionbefore and during yielding, and during initial region of work
havior of AISI type 316 stainless steel using acoustic emission andi.org/10.1016/j.jmrt.2014.12.008
hardening. AE generated then reduced with increasing nom-inal strain. Higher AE activity is observed again when finalfracture occurred. These observations are consistent with thereported results in austenitic stainless steels [12,13,18,23].
FLIR SC 5000IR camera
Computer
AE sensor
AE parametersand load versuselongation
xperimental set up.
ARTICLE IN PRESSJMRTEC-137; No. of Pages 13
4 j m a t e r r e s t e c h n o l . 2 0 1 5;x x x(x x):xxx–xxx
800
600
400
200
00.0 0.2 0.4 0.6 0.8
Strain0.0 0.2 0.4 0.6 0.8
Strain
1.4x10⁻³ S–1 2.8x10⁻³ S–1
6.9x10⁻³ S–1 1.4x10⁻² S–1
Str
ess
(Mpa
)800
600
400
200
0
Str
ess
(Mpa
)
AE
rm
s vo
ltage
(m
v)
AE
rm
s vo
ltage
(m
v)
0.00
0.05
0.10
0.15
0.20
800
600
400
200
00.0 0.2 0.4 0.6 0.8
Strain
Str
ess
(Mpa
)
AE
rm
s vo
ltage
(m
v)
0.00
0.05
0.10
0.15
0.20
0.00
0.05
0.10
0.15
0.20
0.0 0.2 0.4 0.6 0.8Strain
800
600
400
200
0
Str
ess
(Mpa
)
AE
rm
s vo
ltage
(m
v)
0.00
0.05
0.10
0.15
0.20
olta
Fig. 2 – Variation of nominal stress and AE rms vThe extent of acoustic activity generated during deforma-tion of a material depends on a number of factors such astype of material and its metallurgical history, level of plas-tic strain and presence of any inclusions or second phase.AE generated during tensile deformation of metallic materialsindicated that for materials having a single-phase microstruc-ture, a peak in AE occurs at initial strain levels correspondingto the phenomenon of macroyielding [26,28]. The AE resultsobtained in this investigation for different strain rates arein agreement with the normally observed AE activity duringtensile deformation of metallic materials having essentially asingle-phase microstructure. It is also known that in nucleargrade stainless steel, AE is mainly generated by dislocationactivity [12]. AE generated during deformation decreases withincrease in strain and this is due to decrease in the glidedistance for moving dislocations and the reduced rate of for-mation of dislocation avalanche [12].
It can be seen from Fig. 2 that the AE generated during dif-ferent deformation regions increases with increase in strainrate. This is due to the increase in source activation withincrease in the strain rate. These results are in agreementwith the results reported earlier for 316 stainless steel [14,18].Increase in AE generation with increasing strain rate is also inagreement with the results in �-brass [16], where AE is gener-
Please cite this article in press as: Haneef T, et al. Study of the tensile beinfrared thermography techniques. J Mater Res Technol. 2015. http://dx.do
ated by both dislocation motion and twinning. It is also seenfrom Fig. 2 that the graphs for the strain rates 6.9 × 10⁻³ s−1
and 1.4 × 10⁻² s−1 show a peak on the final part of the AE curve
ge with nominal strain for different strain rates.
as compared to the graphs of the lower strain rates. This isdue to higher AE RMS voltage before final fracture and can beseen just after necking. The occurrence of high AE peak afternecking is due to faster crack propagation and faster fractureprocess in higher strain rate tests as compared to the tests atlower strain rates.
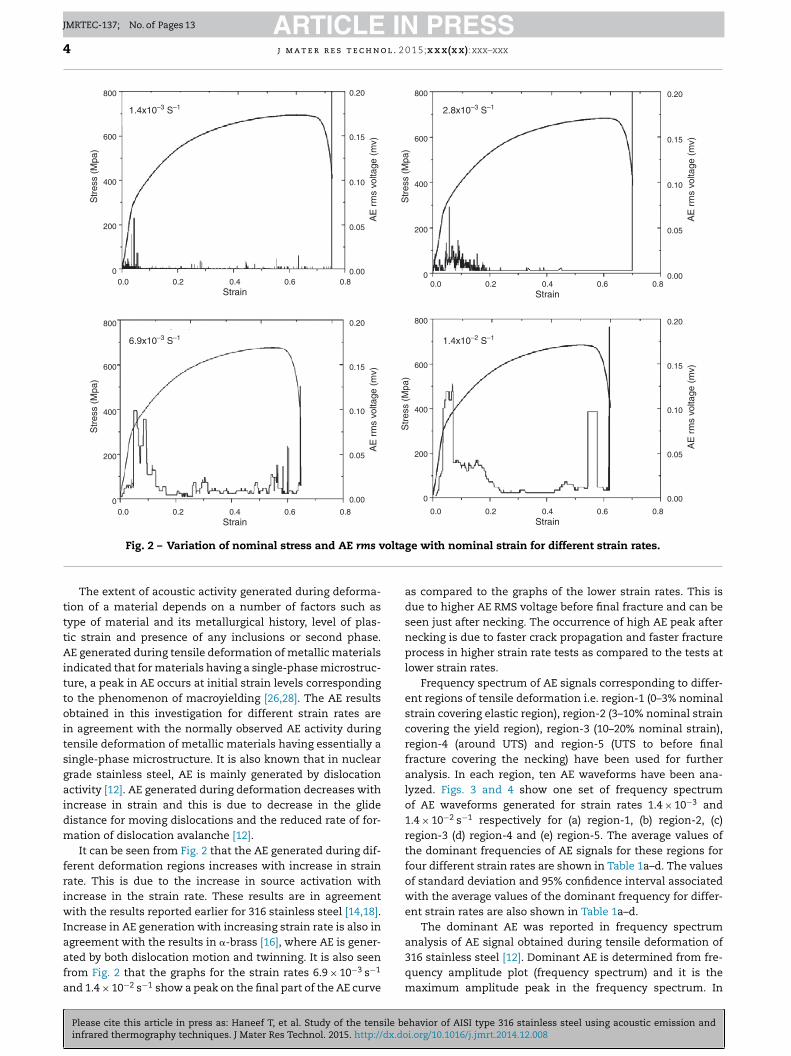
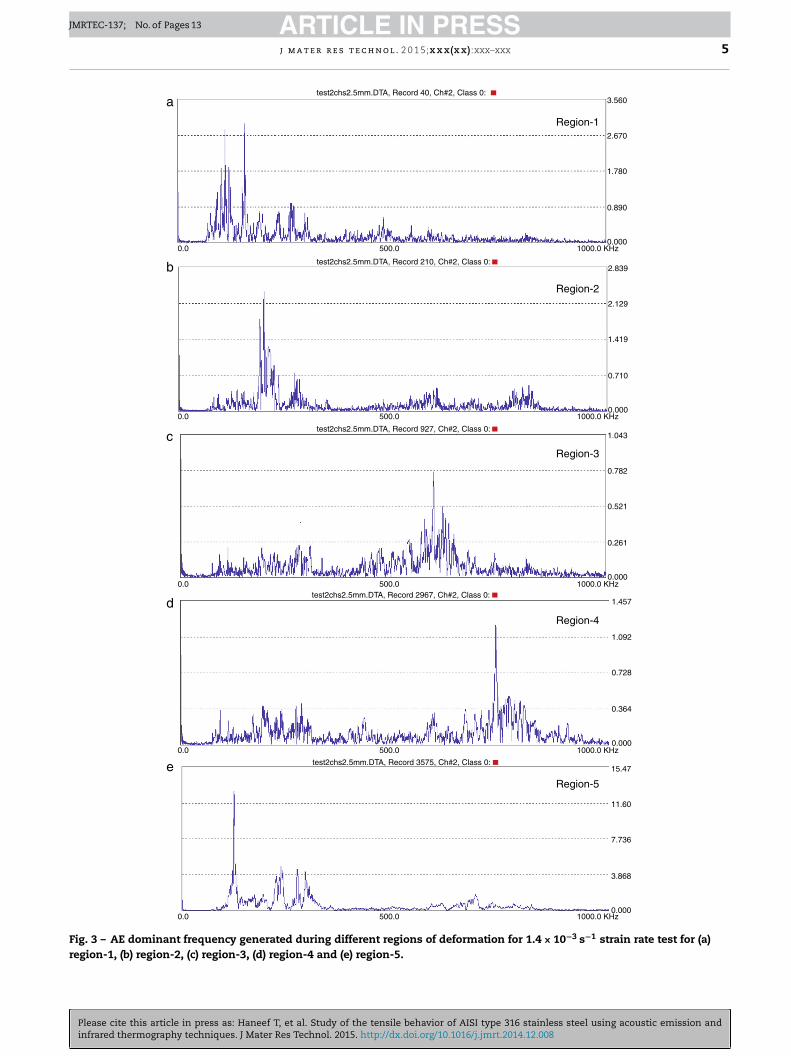
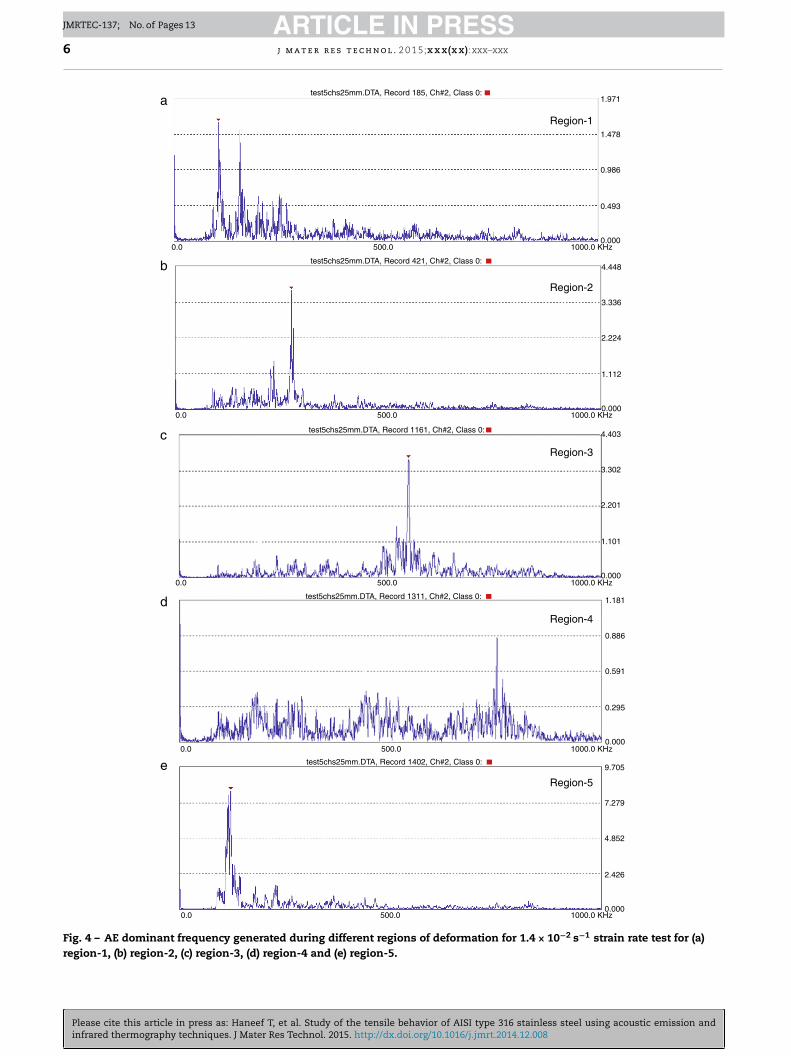
Frequency spectrum of AE signals corresponding to differ-ent regions of tensile deformation i.e. region-1 (0–3% nominalstrain covering elastic region), region-2 (3–10% nominal straincovering the yield region), region-3 (10–20% nominal strain),region-4 (around UTS) and region-5 (UTS to before finalfracture covering the necking) have been used for furtheranalysis. In each region, ten AE waveforms have been ana-lyzed. Figs. 3 and 4 show one set of frequency spectrumof AE waveforms generated for strain rates 1.4 × 10⁻³ and1.4 × 10−2 s−1 respectively for (a) region-1, (b) region-2, (c)region-3 (d) region-4 and (e) region-5. The average values ofthe dominant frequencies of AE signals for these regions forfour different strain rates are shown in Table 1a–d. The valuesof standard deviation and 95% confidence interval associatedwith the average values of the dominant frequency for differ-ent strain rates are also shown in Table 1a–d.
The dominant AE was reported in frequency spectrumanalysis of AE signal obtained during tensile deformation of
havior of AISI type 316 stainless steel using acoustic emission andi.org/10.1016/j.jmrt.2014.12.008
316 stainless steel [12]. Dominant AE is determined from fre-quency amplitude plot (frequency spectrum) and it is themaximum amplitude peak in the frequency spectrum. In
Please cite this article in press as: Haneef T, et al. Study of the tensile behavior of AISI type 316 stainless steel using acoustic emission andinfrared thermography techniques. J Mater Res Technol. 2015. http://dx.doi.org/10.1016/j.jmrt.2014.12.008
ARTICLE IN PRESSJMRTEC-137; No. of Pages 13
j m a t e r r e s t e c h n o l . 2 0 1 5;x x x(x x):xxx–xxx 5
test2chs2.5mm.DTA, Record 40, Ch#2, Class 0:a
b
Region-1
Region-2
cRegion-3
dRegion-4
eRegion-5
3.560
2.670
1.780
0.890
0.000
2.839
2.129
1.419
0.710
0.000
1.043
0.782
0.521
0.261
0.000
1.457
1.092
0.728
0.364
0.000
15.47
11.60
7.736
3.868
0.000
0.0 500.0 1000.0 KHz
0.0 500.0 1000.0 KHz
0.0 500.0 1000.0 KHz
0.0 500.0 1000.0 KHz
0.0 500.0 1000.0 KHz
test2chs2.5mm.DTA, Record 210, Ch#2, Class 0:
test2chs2.5mm.DTA, Record 927, Ch#2, Class 0:
test2chs2.5mm.DTA, Record 2967, Ch#2, Class 0:
test2chs2.5mm.DTA, Record 3575, Ch#2, Class 0:
Fig. 3 – AE dominant frequency generated during different regions of deformation for 1.4 × 10⁻³ s−1 strain rate test for (a)region-1, (b) region-2, (c) region-3, (d) region-4 and (e) region-5.
Please cite this article in press as: Haneef T, et al. Study of the tensile behavior of AISI type 316 stainless steel using acoustic emission andinfrared thermography techniques. J Mater Res Technol. 2015. http://dx.doi.org/10.1016/j.jmrt.2014.12.008
ARTICLE IN PRESSJMRTEC-137; No. of Pages 13
6 j m a t e r r e s t e c h n o l . 2 0 1 5;x x x(x x):xxx–xxx
test5chs25mm.DTA, Record 185, Ch#2, Class 0:a
b
Region-1
Region-2
cRegion-3
dRegion-4
eRegion-5
1.971
1.478
0.986
0.493
0.000
4.448
3.336
2.224
1.112
0.000
4.403
3.302
2.201
1.101
0.000
1.181
0.886
0.591
0.295
0.000
9.705
7.279
4.852
2.426
0.000
0.0 500.0 1000.0 KHz
0.0 500.0 1000.0 KHz
0.0 500.0 1000.0 KHz
0.0 500.0 1000.0 KHz
0.0 500.0 1000.0 KHz
test5chs25mm.DTA, Record 421, Ch#2, Class 0:
test5chs25mm.DTA, Record 1161, Ch#2, Class 0:
test5chs25mm.DTA, Record 1311, Ch#2, Class 0:
test5chs25mm.DTA, Record 1402, Ch#2, Class 0:
Fig. 4 – AE dominant frequency generated during different regions of deformation for 1.4 × 10⁻² s−1 strain rate test for (a)region-1, (b) region-2, (c) region-3, (d) region-4 and (e) region-5.
ARTICLE IN PRESSJMRTEC-137; No. of Pages 13
j m a t e r r e s t e c h n o l . 2 0 1 5;x x x(x x):xxx–xxx 7
Table 1 – AE dominant frequency generated during different regions of deformation for different strain rates.
(a)
Strain rate 1.4 × 10⁻³
Region-1 Region-2 Region-3 Region-4 Region-5
Peak-1 Peak-2
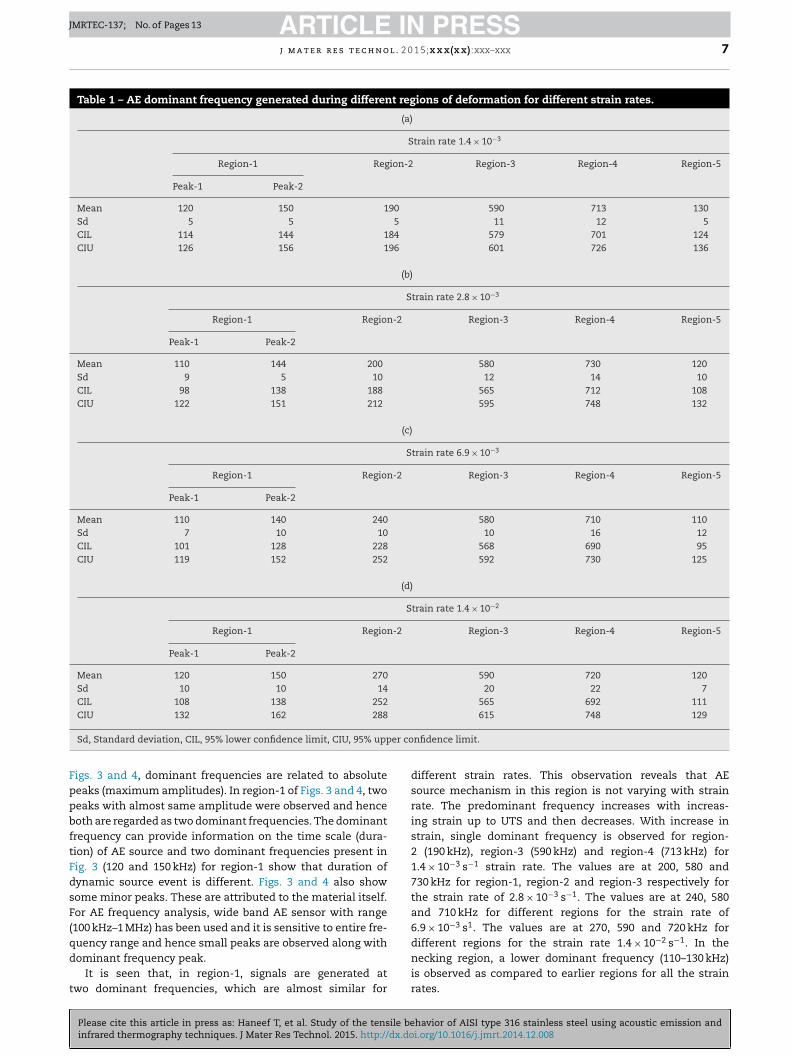
Mean 120 150 190 590 713 130Sd 5 5 5 11 12 5CIL 114 144 184 579 701 124CIU 126 156 196 601 726 136
(b)
Strain rate 2.8 × 10⁻³
Region-1 Region-2 Region-3 Region-4 Region-5
Peak-1 Peak-2
Mean 110 144 200 580 730 120Sd 9 5 10 12 14 10CIL 98 138 188 565 712 108CIU 122 151 212 595 748 132
(c)
Strain rate 6.9 × 10⁻³
Region-1 Region-2 Region-3 Region-4 Region-5
Peak-1 Peak-2
Mean 110 140 240 580 710 110Sd 7 10 10 10 16 12CIL 101 128 228 568 690 95CIU 119 152 252 592 730 125
(d)
Strain rate 1.4 × 10⁻²
Region-1 Region-2 Region-3 Region-4 Region-5
Peak-1 Peak-2
Mean 120 150 270 590 720 120Sd 10 10 14 20 22 7CIL 108 138 252 565 692 111CIU 132 162 288 615 748 129
er co
FppbftFdsF(qd
t
Sd, Standard deviation, CIL, 95% lower confidence limit, CIU, 95% upp
igs. 3 and 4, dominant frequencies are related to absoluteeaks (maximum amplitudes). In region-1 of Figs. 3 and 4, twoeaks with almost same amplitude were observed and henceoth are regarded as two dominant frequencies. The dominantrequency can provide information on the time scale (dura-ion) of AE source and two dominant frequencies present inig. 3 (120 and 150 kHz) for region-1 show that duration ofynamic source event is different. Figs. 3 and 4 also showome minor peaks. These are attributed to the material itself.or AE frequency analysis, wide band AE sensor with range100 kHz–1 MHz) has been used and it is sensitive to entire fre-uency range and hence small peaks are observed along with
Please cite this article in press as: Haneef T, et al. Study of the tensile beinfrared thermography techniques. J Mater Res Technol. 2015. http://dx.do
ominant frequency peak.It is seen that, in region-1, signals are generated at
wo dominant frequencies, which are almost similar for
nfidence limit.
different strain rates. This observation reveals that AEsource mechanism in this region is not varying with strainrate. The predominant frequency increases with increas-ing strain up to UTS and then decreases. With increase instrain, single dominant frequency is observed for region-2 (190 kHz), region-3 (590 kHz) and region-4 (713 kHz) for1.4 × 10−3 s−1 strain rate. The values are at 200, 580 and730 kHz for region-1, region-2 and region-3 respectively forthe strain rate of 2.8 × 10⁻³ s−1. The values are at 240, 580and 710 kHz for different regions for the strain rate of6.9 × 10−3 s1. The values are at 270, 590 and 720 kHz fordifferent regions for the strain rate 1.4 × 10⁻² s−1. In the
havior of AISI type 316 stainless steel using acoustic emission andi.org/10.1016/j.jmrt.2014.12.008
necking region, a lower dominant frequency (110–130 kHz)is observed as compared to earlier regions for all the strainrates.
ARTICLE IN PRESSJMRTEC-137; No. of Pages 13
8 j m a t e r r e s t e c h n o l . 2 0 1 5;x x x(x x):xxx–xxx
115.85113.55
111.17
108.70
106.13
103.45
100.64
97.70
94.60
91.33
87.86
84.16
80.19
75.90
71.23
66.07
60.29
53.70
45.97
36.50
24.01
4.60a b c d e f g
0ºC
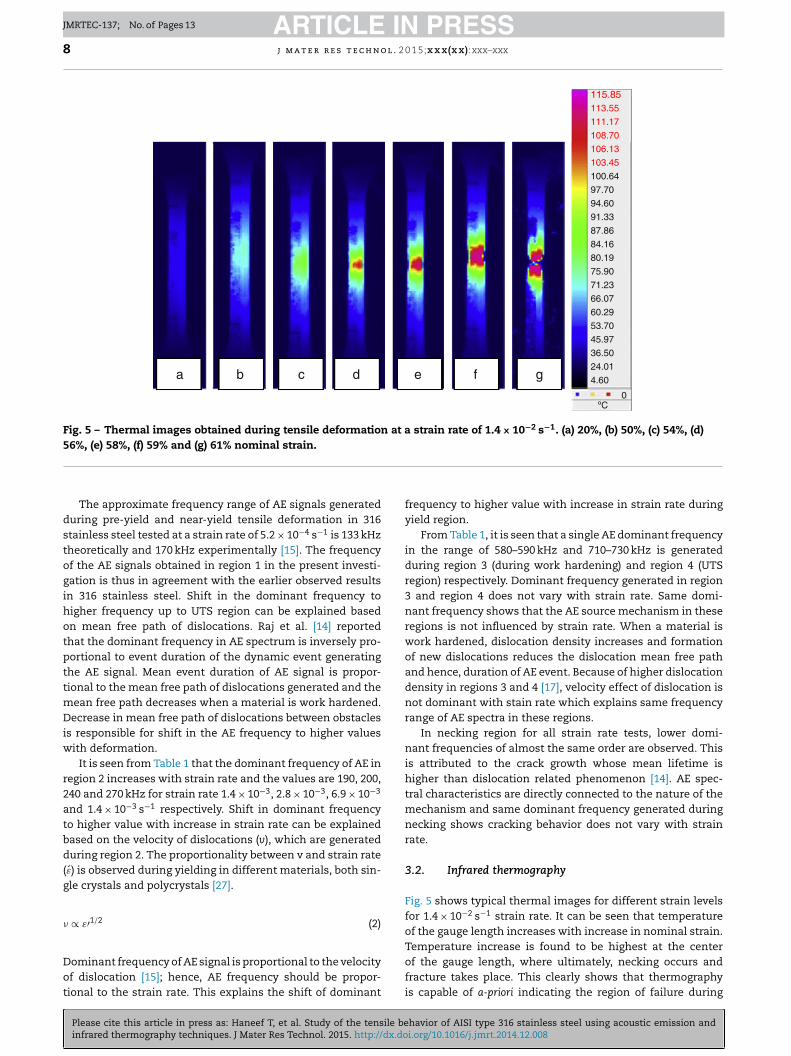
Fig. 5 – Thermal images obtained during tensile deformation at a strain rate of 1.4 × 10⁻² s−1. (a) 20%, (b) 50%, (c) 54%, (d)56%, (e) 58%, (f) 59% and (g) 61% nominal strain.
The approximate frequency range of AE signals generatedduring pre-yield and near-yield tensile deformation in 316stainless steel tested at a strain rate of 5.2 × 10⁻⁴ s−1 is 133 kHztheoretically and 170 kHz experimentally [15]. The frequencyof the AE signals obtained in region 1 in the present investi-gation is thus in agreement with the earlier observed resultsin 316 stainless steel. Shift in the dominant frequency tohigher frequency up to UTS region can be explained basedon mean free path of dislocations. Raj et al. [14] reportedthat the dominant frequency in AE spectrum is inversely pro-portional to event duration of the dynamic event generatingthe AE signal. Mean event duration of AE signal is propor-tional to the mean free path of dislocations generated and themean free path decreases when a material is work hardened.Decrease in mean free path of dislocations between obstaclesis responsible for shift in the AE frequency to higher valueswith deformation.
It is seen from Table 1 that the dominant frequency of AE inregion 2 increases with strain rate and the values are 190, 200,240 and 270 kHz for strain rate 1.4 × 10⁻³, 2.8 × 10⁻³, 6.9 × 10⁻³
and 1.4 × 10⁻³ s−1 respectively. Shift in dominant frequencyto higher value with increase in strain rate can be explainedbased on the velocity of dislocations (v), which are generatedduring region 2. The proportionality between v and strain rate(ε) is observed during yielding in different materials, both sin-gle crystals and polycrystals [27].
� ∝ ε′1/2 (2)
Please cite this article in press as: Haneef T, et al. Study of the tensile beinfrared thermography techniques. J Mater Res Technol. 2015. http://dx.do
Dominant frequency of AE signal is proportional to the velocityof dislocation [15]; hence, AE frequency should be propor-tional to the strain rate. This explains the shift of dominant
frequency to higher value with increase in strain rate duringyield region.
From Table 1, it is seen that a single AE dominant frequencyin the range of 580–590 kHz and 710–730 kHz is generatedduring region 3 (during work hardening) and region 4 (UTSregion) respectively. Dominant frequency generated in region3 and region 4 does not vary with strain rate. Same domi-nant frequency shows that the AE source mechanism in theseregions is not influenced by strain rate. When a material iswork hardened, dislocation density increases and formationof new dislocations reduces the dislocation mean free pathand hence, duration of AE event. Because of higher dislocationdensity in regions 3 and 4 [17], velocity effect of dislocation isnot dominant with stain rate which explains same frequencyrange of AE spectra in these regions.
In necking region for all strain rate tests, lower domi-nant frequencies of almost the same order are observed. Thisis attributed to the crack growth whose mean lifetime ishigher than dislocation related phenomenon [14]. AE spec-tral characteristics are directly connected to the nature of themechanism and same dominant frequency generated duringnecking shows cracking behavior does not vary with strainrate.
3.2. Infrared thermography
Fig. 5 shows typical thermal images for different strain levelsfor 1.4 × 10⁻² s−1 strain rate. It can be seen that temperatureof the gauge length increases with increase in nominal strain.
havior of AISI type 316 stainless steel using acoustic emission andi.org/10.1016/j.jmrt.2014.12.008
Temperature increase is found to be highest at the centerof the gauge length, where ultimately, necking occurs andfracture takes place. This clearly shows that thermographyis capable of a-priori indicating the region of failure during
ARTICLE IN PRESSJMRTEC-137; No. of Pages 13
j m a t e r r e s t e c h n o l . 2 0 1 5;x x x(x x):xxx–xxx 9
800
600
400
200
00.0 0.1 0.2 0.3 0.4 0.5 0.6 0.7 0.8
Strain
0.0 0.1 0.2 0.3 0.4 0.5 0.6 0.7 0.8
Strain
25 mm/mina b
1.4 × 10⁻³ s–1 1.4 × 10⁻² s–1S
tres
s (M
pa)
Ris
e in
tem
pera
ture
(ºC
)
800100
80
60
40
20
0
Ris
e in
tem
pera
ture
(ºC
)
100
80
60
40
20
0
600
400
200
0
Str
ess
(Mpa
)
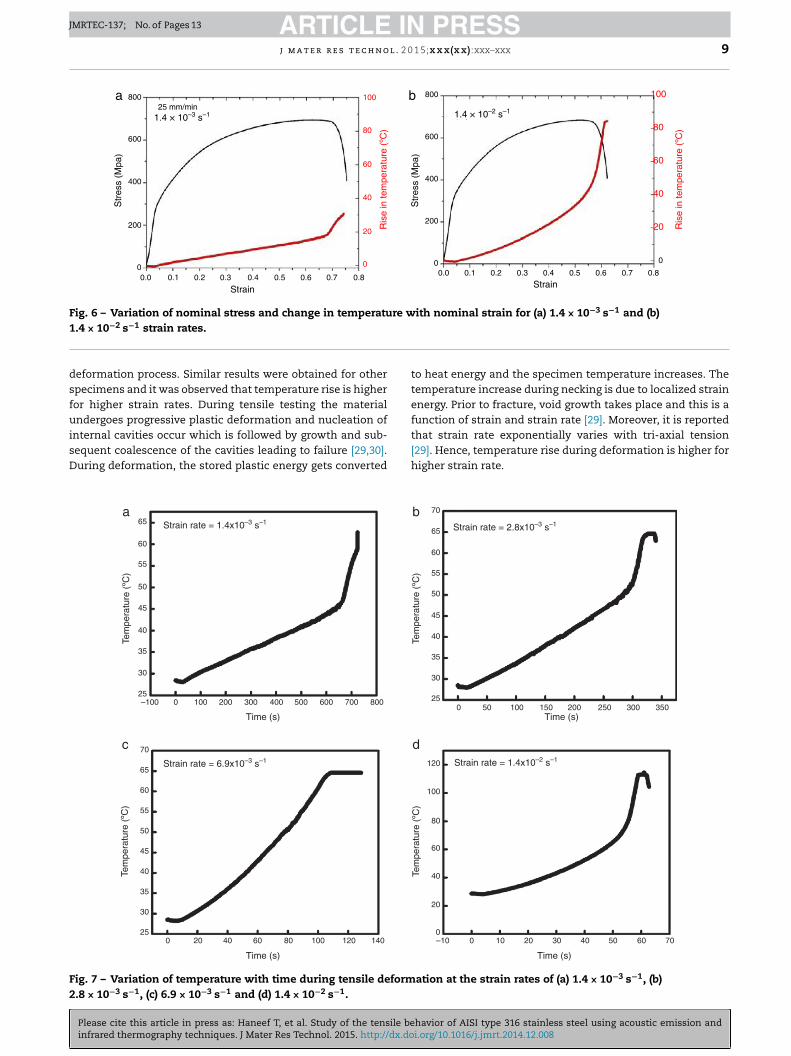
Fig. 6 – Variation of nominal stress and change in temperature with nominal strain for (a) 1.4 × 10⁻³ s−1 and (b)1
dsfuisD
F2
.4 × 10−2 s−1 strain rates.
eformation process. Similar results were obtained for otherpecimens and it was observed that temperature rise is higheror higher strain rates. During tensile testing the materialndergoes progressive plastic deformation and nucleation of
Please cite this article in press as: Haneef T, et al. Study of the tensile beinfrared thermography techniques. J Mater Res Technol. 2015. http://dx.do
nternal cavities occur which is followed by growth and sub-equent coalescence of the cavities leading to failure [29,30].uring deformation, the stored plastic energy gets converted
25
30
35
40
45
50
55
60
65a
–100 0
0 20 40 60 80 100 120 140
100 200 300 400 500 600 700 800
Time (s)
Time (s)
Strain rate = 1.4x10⁻³ s–1
Strain rate = 6.9x10⁻³ s–1
Tem
pera
ture
(ºC
)
c
25
30
35
40
50
60
70
65
45
55
Tem
pera
ture
(ºC
)
ig. 7 – Variation of temperature with time during tensile deform.8 × 10−3 s−1, (c) 6.9 × 10⁻³ s−1 and (d) 1.4 × 10⁻² s−1.
to heat energy and the specimen temperature increases. Thetemperature increase during necking is due to localized strainenergy. Prior to fracture, void growth takes place and this is afunction of strain and strain rate [29]. Moreover, it is reported
havior of AISI type 316 stainless steel using acoustic emission andi.org/10.1016/j.jmrt.2014.12.008
that strain rate exponentially varies with tri-axial tension[29]. Hence, temperature rise during deformation is higher forhigher strain rate.
b
Time (s)
25
30
35
40
50
60
70
65
45
55
0 50 100 150 200 250 300 350
Strain rate = 2.8x10⁻³ s–1
Tem
pera
ture
(ºC
)
–10 0 10 20 30 40 50 60 70
Time (s)
Strain rate = 1.4x10⁻² s–1
d
0
20
40
60
80
100
120
Tem
pera
ture
(ºC
)
ation at the strain rates of (a) 1.4 × 10⁻³ s−1, (b)
ARTICLE IN PRESSJMRTEC-137; No. of Pages 13
10 j m a t e r r e s t e c h n o l . 2 0 1 5;x x x(x x):xxx–xxx
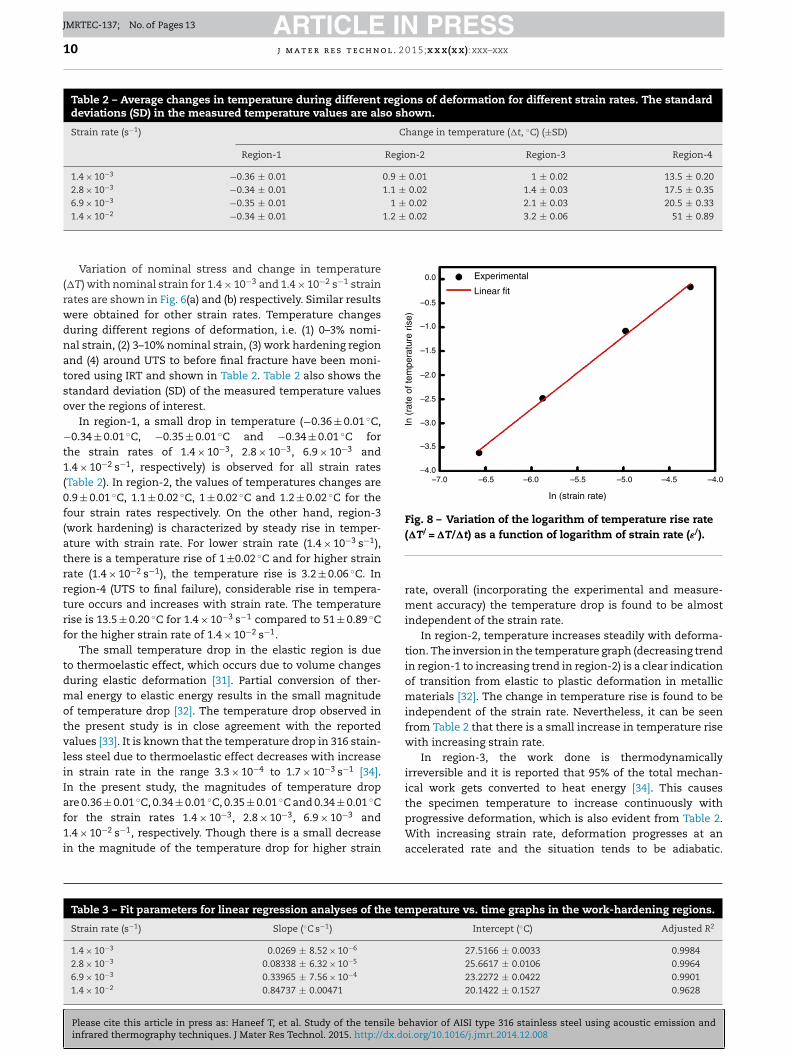
Table 2 – Average changes in temperature during different regions of deformation for different strain rates. The standarddeviations (SD) in the measured temperature values are also shown.
Strain rate (s−1) Change in temperature (�t, ◦C) (±SD)
Region-1 Region-2 Region-3 Region-4
1.4 × 10⁻³ −0.36 ± 0.01 0.9 ± 0.01 1 ± 0.02 13.5 ± 0.202.8 × 10−3 −0.34 ± 0.01 1.1 ± 0.02 1.4 ± 0.03 17.5 ± 0.356.9 × 10−3 −0.35 ± 0.01 1 ± 0.02 2.1 ± 0.03 20.5 ± 0.33
−2 1.2 ± 0.02 3.2 ± 0.06 51 ± 0.89
–7.0 –6.5 –5.5 –4.5–5.0 –4.0–6.0
In (strain rate)
Experimental
Linear fit
–4.0
–3.0
–2.0
–1.0
–3.5
–2.5
–1.5
–0.5
0.0
In (
rate
of t
empe
ratu
re r
ise)
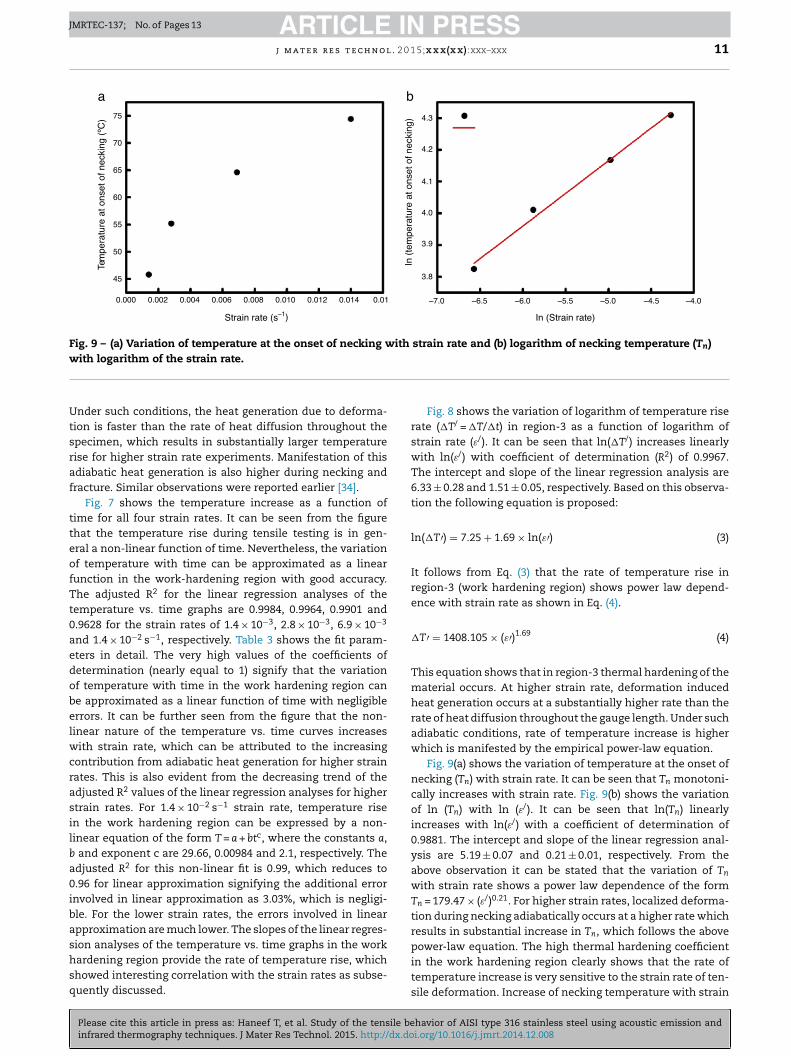
Fig. 8 – Variation of the logarithm of temperature rise rate/ /
1.4 × 10 −0.34 ± 0.01
Variation of nominal stress and change in temperature(�T) with nominal strain for 1.4 × 10⁻³ and 1.4 × 10⁻² s−1 strainrates are shown in Fig. 6(a) and (b) respectively. Similar resultswere obtained for other strain rates. Temperature changesduring different regions of deformation, i.e. (1) 0–3% nomi-nal strain, (2) 3–10% nominal strain, (3) work hardening regionand (4) around UTS to before final fracture have been moni-tored using IRT and shown in Table 2. Table 2 also shows thestandard deviation (SD) of the measured temperature valuesover the regions of interest.
In region-1, a small drop in temperature (−0.36 ± 0.01 ◦C,−0.34 ± 0.01 ◦C, −0.35 ± 0.01 ◦C and −0.34 ± 0.01 ◦C forthe strain rates of 1.4 × 10⁻³, 2.8 × 10⁻³, 6.9 × 10⁻³ and1.4 × 10−2 s−1, respectively) is observed for all strain rates(Table 2). In region-2, the values of temperatures changes are0.9 ± 0.01 ◦C, 1.1 ± 0.02 ◦C, 1 ± 0.02 ◦C and 1.2 ± 0.02 ◦C for thefour strain rates respectively. On the other hand, region-3(work hardening) is characterized by steady rise in temper-ature with strain rate. For lower strain rate (1.4 × 10⁻³ s−1),there is a temperature rise of 1 ±0.02 ◦C and for higher strainrate (1.4 × 10⁻² s−1), the temperature rise is 3.2 ± 0.06 ◦C. Inregion-4 (UTS to final failure), considerable rise in tempera-ture occurs and increases with strain rate. The temperaturerise is 13.5 ± 0.20 ◦C for 1.4 × 10⁻³ s−1 compared to 51 ± 0.89 ◦Cfor the higher strain rate of 1.4 × 10⁻² s−1.
The small temperature drop in the elastic region is dueto thermoelastic effect, which occurs due to volume changesduring elastic deformation [31]. Partial conversion of ther-mal energy to elastic energy results in the small magnitudeof temperature drop [32]. The temperature drop observed inthe present study is in close agreement with the reportedvalues [33]. It is known that the temperature drop in 316 stain-less steel due to thermoelastic effect decreases with increasein strain rate in the range 3.3 × 10⁻⁴ to 1.7 × 10⁻³ s−1 [34].In the present study, the magnitudes of temperature drop
◦ ◦ ◦ ◦
Please cite this article in press as: Haneef T, et al. Study of the tensile beinfrared thermography techniques. J Mater Res Technol. 2015. http://dx.do
are 0.36 ± 0.01 C, 0.34 ± 0.01 C, 0.35 ± 0.01 C and 0.34 ± 0.01 Cfor the strain rates 1.4 × 10⁻³, 2.8 × 10⁻³, 6.9 × 10⁻³ and1.4 × 10−2 s−1, respectively. Though there is a small decreasein the magnitude of the temperature drop for higher strain
Table 3 – Fit parameters for linear regression analyses of the tem
Strain rate (s−1) Slope (◦C s−1)
1.4 × 10⁻³ 0.0269 ± 8.52 × 10⁻⁶
2.8 × 10⁻³ 0.08338 ± 6.32 × 10⁻⁵
6.9 × 10⁻³ 0.33965 ± 7.56 × 10⁻⁴
1.4 × 10⁻² 0.84737 ± 0.00471
(�T = �T/�t) as a function of logarithm of strain rate (ε ).
rate, overall (incorporating the experimental and measure-ment accuracy) the temperature drop is found to be almostindependent of the strain rate.
In region-2, temperature increases steadily with deforma-tion. The inversion in the temperature graph (decreasing trendin region-1 to increasing trend in region-2) is a clear indicationof transition from elastic to plastic deformation in metallicmaterials [32]. The change in temperature rise is found to beindependent of the strain rate. Nevertheless, it can be seenfrom Table 2 that there is a small increase in temperature risewith increasing strain rate.
In region-3, the work done is thermodynamicallyirreversible and it is reported that 95% of the total mechan-ical work gets converted to heat energy [34]. This causesthe specimen temperature to increase continuously with
havior of AISI type 316 stainless steel using acoustic emission andi.org/10.1016/j.jmrt.2014.12.008
progressive deformation, which is also evident from Table 2.With increasing strain rate, deformation progresses at anaccelerated rate and the situation tends to be adiabatic.
perature vs. time graphs in the work-hardening regions.
Intercept (◦C) Adjusted R2
27.5166 ± 0.0033 0.998425.6617 ± 0.0106 0.996423.2272 ± 0.0422 0.990120.1422 ± 0.1527 0.9628
ARTICLE IN PRESSJMRTEC-137; No. of Pages 13
j m a t e r r e s t e c h n o l . 2 0 1 5;x x x(x x):xxx–xxx 11
0.000 0.002 0.004 0.006 0.008 0.010 0.012 0.014 0.01
Strain rate (s In (Strain rate)–1)
50
60
65
45
55
70
75
a b
4.3
4.2
4.1
4.0
3.9
3.8
–7.0 –6.5 –5.5 –4.5 –4.0–6.0 –5.0
Tem
pera
ture
at o
nset
of n
ecki
ng (
ºC)
In (
tem
pera
ture
at o
nset
of n
ecki
ng)
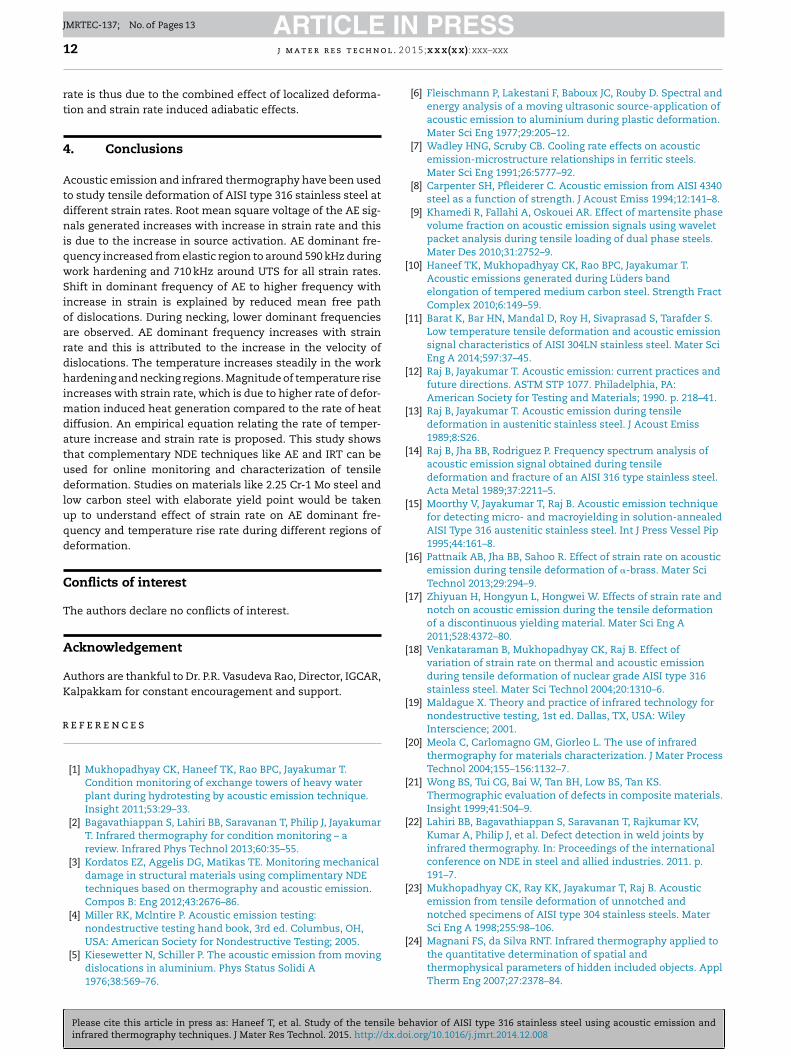
Fig. 9 – (a) Variation of temperature at the onset of necking with strain rate and (b) logarithm of necking temperature (Tn)w
Utsraf
tteofTt0aedobelwcrasilba0ibashsq
ith logarithm of the strain rate.
nder such conditions, the heat generation due to deforma-ion is faster than the rate of heat diffusion throughout thepecimen, which results in substantially larger temperatureise for higher strain rate experiments. Manifestation of thisdiabatic heat generation is also higher during necking andracture. Similar observations were reported earlier [34].
Fig. 7 shows the temperature increase as a function ofime for all four strain rates. It can be seen from the figurehat the temperature rise during tensile testing is in gen-ral a non-linear function of time. Nevertheless, the variationf temperature with time can be approximated as a linearunction in the work-hardening region with good accuracy.he adjusted R2 for the linear regression analyses of the
emperature vs. time graphs are 0.9984, 0.9964, 0.9901 and.9628 for the strain rates of 1.4 × 10⁻³, 2.8 × 10⁻³, 6.9 × 10⁻³
nd 1.4 × 10⁻² s−1, respectively. Table 3 shows the fit param-ters in detail. The very high values of the coefficients ofetermination (nearly equal to 1) signify that the variationf temperature with time in the work hardening region cane approximated as a linear function of time with negligiblerrors. It can be further seen from the figure that the non-inear nature of the temperature vs. time curves increases
ith strain rate, which can be attributed to the increasingontribution from adiabatic heat generation for higher strainates. This is also evident from the decreasing trend of thedjusted R2 values of the linear regression analyses for highertrain rates. For 1.4 × 10⁻² s−1 strain rate, temperature risen the work hardening region can be expressed by a non-inear equation of the form T = a + btc, where the constants a,
and exponent c are 29.66, 0.00984 and 2.1, respectively. Thedjusted R2 for this non-linear fit is 0.99, which reduces to.96 for linear approximation signifying the additional errornvolved in linear approximation as 3.03%, which is negligi-le. For the lower strain rates, the errors involved in linearpproximation are much lower. The slopes of the linear regres-
Please cite this article in press as: Haneef T, et al. Study of the tensile beinfrared thermography techniques. J Mater Res Technol. 2015. http://dx.do
ion analyses of the temperature vs. time graphs in the workardening region provide the rate of temperature rise, whichhowed interesting correlation with the strain rates as subse-uently discussed.
Fig. 8 shows the variation of logarithm of temperature riserate (�T/ = �T/�t) in region-3 as a function of logarithm ofstrain rate (ε/). It can be seen that ln(�T/) increases linearlywith ln(ε/) with coefficient of determination (R2) of 0.9967.The intercept and slope of the linear regression analysis are6.33 ± 0.28 and 1.51 ± 0.05, respectively. Based on this observa-tion the following equation is proposed:
ln(�T′) = 7.25 + 1.69 × ln(ε′) (3)
It follows from Eq. (3) that the rate of temperature rise inregion-3 (work hardening region) shows power law depend-ence with strain rate as shown in Eq. (4).
�T′ = 1408.105 × (ε′)1.69 (4)
This equation shows that in region-3 thermal hardening of thematerial occurs. At higher strain rate, deformation inducedheat generation occurs at a substantially higher rate than therate of heat diffusion throughout the gauge length. Under suchadiabatic conditions, rate of temperature increase is higherwhich is manifested by the empirical power-law equation.
Fig. 9(a) shows the variation of temperature at the onset ofnecking (Tn) with strain rate. It can be seen that Tn monotoni-cally increases with strain rate. Fig. 9(b) shows the variationof ln (Tn) with ln (ε/). It can be seen that ln(Tn) linearlyincreases with ln(ε/) with a coefficient of determination of0.9881. The intercept and slope of the linear regression anal-ysis are 5.19 ± 0.07 and 0.21 ± 0.01, respectively. From theabove observation it can be stated that the variation of Tn
with strain rate shows a power law dependence of the formTn = 179.47 × (ε/)0.21. For higher strain rates, localized deforma-tion during necking adiabatically occurs at a higher rate whichresults in substantial increase in Tn, which follows the above
havior of AISI type 316 stainless steel using acoustic emission andi.org/10.1016/j.jmrt.2014.12.008
power-law equation. The high thermal hardening coefficientin the work hardening region clearly shows that the rate oftemperature increase is very sensitive to the strain rate of ten-sile deformation. Increase of necking temperature with strain
ARTICLE IN PRESSJMRTEC-137; No. of Pages 13
o l . 2
r
12 j m a t e r r e s t e c h n
rate is thus due to the combined effect of localized deforma-tion and strain rate induced adiabatic effects.
4. Conclusions
Acoustic emission and infrared thermography have been usedto study tensile deformation of AISI type 316 stainless steel atdifferent strain rates. Root mean square voltage of the AE sig-nals generated increases with increase in strain rate and thisis due to the increase in source activation. AE dominant fre-quency increased from elastic region to around 590 kHz duringwork hardening and 710 kHz around UTS for all strain rates.Shift in dominant frequency of AE to higher frequency withincrease in strain is explained by reduced mean free pathof dislocations. During necking, lower dominant frequenciesare observed. AE dominant frequency increases with strainrate and this is attributed to the increase in the velocity ofdislocations. The temperature increases steadily in the workhardening and necking regions. Magnitude of temperature riseincreases with strain rate, which is due to higher rate of defor-mation induced heat generation compared to the rate of heatdiffusion. An empirical equation relating the rate of temper-ature increase and strain rate is proposed. This study showsthat complementary NDE techniques like AE and IRT can beused for online monitoring and characterization of tensiledeformation. Studies on materials like 2.25 Cr-1 Mo steel andlow carbon steel with elaborate yield point would be takenup to understand effect of strain rate on AE dominant fre-quency and temperature rise rate during different regions ofdeformation.
Conflicts of interest
The authors declare no conflicts of interest.
Acknowledgement
Authors are thankful to Dr. P.R. Vasudeva Rao, Director, IGCAR,Kalpakkam for constant encouragement and support.
e f e r e n c e s
[1] Mukhopadhyay CK, Haneef TK, Rao BPC, Jayakumar T.Condition monitoring of exchange towers of heavy waterplant during hydrotesting by acoustic emission technique.Insight 2011;53:29–33.
[2] Bagavathiappan S, Lahiri BB, Saravanan T, Philip J, JayakumarT. Infrared thermography for condition monitoring – areview. Infrared Phys Technol 2013;60:35–55.
[3] Kordatos EZ, Aggelis DG, Matikas TE. Monitoring mechanicaldamage in structural materials using complimentary NDEtechniques based on thermography and acoustic emission.Compos B: Eng 2012;43:2676–86.
[4] Miller RK, Mclntire P. Acoustic emission testing:nondestructive testing hand book, 3rd ed. Columbus, OH,
Please cite this article in press as: Haneef T, et al. Study of the tensile beinfrared thermography techniques. J Mater Res Technol. 2015. http://dx.do
USA: American Society for Nondestructive Testing; 2005.[5] Kiesewetter N, Schiller P. The acoustic emission from moving
dislocations in aluminium. Phys Status Solidi A1976;38:569–76.
0 1 5;x x x(x x):xxx–xxx
[6] Fleischmann P, Lakestani F, Baboux JC, Rouby D. Spectral andenergy analysis of a moving ultrasonic source-application ofacoustic emission to aluminium during plastic deformation.Mater Sci Eng 1977;29:205–12.
[7] Wadley HNG, Scruby CB. Cooling rate effects on acousticemission-microstructure relationships in ferritic steels.Mater Sci Eng 1991;26:5777–92.
[8] Carpenter SH, Pfleiderer C. Acoustic emission from AISI 4340steel as a function of strength. J Acoust Emiss 1994;12:141–8.
[9] Khamedi R, Fallahi A, Oskouei AR. Effect of martensite phasevolume fraction on acoustic emission signals using waveletpacket analysis during tensile loading of dual phase steels.Mater Des 2010;31:2752–9.
[10] Haneef TK, Mukhopadhyay CK, Rao BPC, Jayakumar T.Acoustic emissions generated during Lüders bandelongation of tempered medium carbon steel. Strength FractComplex 2010;6:149–59.
[11] Barat K, Bar HN, Mandal D, Roy H, Sivaprasad S, Tarafder S.Low temperature tensile deformation and acoustic emissionsignal characteristics of AISI 304LN stainless steel. Mater SciEng A 2014;597:37–45.
[12] Raj B, Jayakumar T. Acoustic emission: current practices andfuture directions. ASTM STP 1077. Philadelphia, PA:American Society for Testing and Materials; 1990. p. 218–41.
[13] Raj B, Jayakumar T. Acoustic emission during tensiledeformation in austenitic stainless steel. J Acoust Emiss1989;8:S26.
[14] Raj B, Jha BB, Rodriguez P. Frequency spectrum analysis ofacoustic emission signal obtained during tensiledeformation and fracture of an AISI 316 type stainless steel.Acta Metal 1989;37:2211–5.
[15] Moorthy V, Jayakumar T, Raj B. Acoustic emission techniquefor detecting micro- and macroyielding in solution-annealedAISI Type 316 austenitic stainless steel. Int J Press Vessel Pip1995;44:161–8.
[16] Pattnaik AB, Jha BB, Sahoo R. Effect of strain rate on acousticemission during tensile deformation of �-brass. Mater SciTechnol 2013;29:294–9.
[17] Zhiyuan H, Hongyun L, Hongwei W. Effects of strain rate andnotch on acoustic emission during the tensile deformationof a discontinuous yielding material. Mater Sci Eng A2011;528:4372–80.
[18] Venkataraman B, Mukhopadhyay CK, Raj B. Effect ofvariation of strain rate on thermal and acoustic emissionduring tensile deformation of nuclear grade AISI type 316stainless steel. Mater Sci Technol 2004;20:1310–6.
[19] Maldague X. Theory and practice of infrared technology fornondestructive testing, 1st ed. Dallas, TX, USA: WileyInterscience; 2001.
[20] Meola C, Carlomagno GM, Giorleo L. The use of infraredthermography for materials characterization. J Mater ProcessTechnol 2004;155–156:1132–7.
[21] Wong BS, Tui CG, Bai W, Tan BH, Low BS, Tan KS.Thermographic evaluation of defects in composite materials.Insight 1999;41:504–9.
[22] Lahiri BB, Bagavathiappan S, Saravanan T, Rajkumar KV,Kumar A, Philip J, et al. Defect detection in weld joints byinfrared thermography. In: Proceedings of the internationalconference on NDE in steel and allied industries. 2011. p.191–7.
[23] Mukhopadhyay CK, Ray KK, Jayakumar T, Raj B. Acousticemission from tensile deformation of unnotched andnotched specimens of AISI type 304 stainless steels. MaterSci Eng A 1998;255:98–106.
[24] Magnani FS, da Silva RNT. Infrared thermography applied to
havior of AISI type 316 stainless steel using acoustic emission andi.org/10.1016/j.jmrt.2014.12.008
the quantitative determination of spatial andthermophysical parameters of hidden included objects. ApplTherm Eng 2007;27:2378–84.
ARTICLE IN PRESSJMRTEC-137; No. of Pages 13
. 2 0 1
j m a t e r r e s t e c h n o l[25] Lahiri BB, Bagavathiappan S, Soumya C, Mahendran V, PillaiVPM, Philip J, et al. Infrared thermography based defectdetection in ferromagnetic specimens using a low frequencyalternating magnetic field. Infrared Phys Technol2014;64:125–33.
[26] Imeda H, Kuganagi K, Kimura H, Nakasa H.Proceedings ofthe third acoustic emission symposium. 1976. p. 492.
[27] Heiple CR, Carpenter SH. Acoustic emission produced bydeformation of metals and alloys – a review: Part I. J AcoustEmiss 1987;6:177–205.
[28] Heiple CR, Carpenter SH. Acoustic emission produced bydeformation of metals and alloys – a review: Part II. J Acoust
Please cite this article in press as: Haneef T, et al. Study of the tensile beinfrared thermography techniques. J Mater Res Technol. 2015. http://dx.do
Emiss 1987;6:215–37.[29] Venkatraman B, Mukhophadyay CK, Raj B. Prediction of
tensile failure of 316 stainless steel using infraredthermography. Exp Tech 2004;28:35–8.
5;x x x(x x):xxx–xxx 13
[30] Vanstone RH, Cox TB, Low JR, Psioda JA. Microstructuralaspects of fracture by dimpled rupture. Int Met Rev1985;30:157–79.
[31] Jalaj K, Baby S, Vikas K. Thermographic studies on IMI-834titanium alloy during tensile loading. Mater Sci Eng A2008;496:303–7.
[32] Ferron G. The effect of the interruption of straining onnon-uniform plastic flow in tension. Mater Sci Eng1982;52:133–8.
[33] Elzbieta P. Thermoelastic effect in austenitic steel referred toits hardening. J Theor Appl Mech 1999;2:349–68.
[34] Venkataraman B, Raj B, Mukhopadhyay CK, Jayakumar T.
havior of AISI type 316 stainless steel using acoustic emission andi.org/10.1016/j.jmrt.2014.12.008
Correlation of infrared thermographic patterns and acousticemission signals with tensile deformation and fractureprocesses. Rev Prog Quant Nondestr Eval 2001;20:1443–50.
Related Documents