Ultramicroscopy42-44 (1992) 1329-1336 North-Holland Study of the surface roughness of Co-based amorphous alloys by STM M. Aguilar, M. Pancorbo, F. V~zquez, F. Gdmez Instituto Ciencia de Materiales, Sede B (CSIC), Universidad Aut6noma de Madrid (C-Ill), 28049 Madrid, Spain E. Anguiano IBM Scientific Center, Universidad Aut6noma Madrid (C-XVI), 28049 Madrid, Spare J.M. Gonzfilez, M. Vfizquez and F. Cebollada Instituto Ciencia de Materiales, Sede A (CSIC), c /Serrano 144, 28006 Madrid, Spain Received 12 August 1991 Since the STM gives the vertical dimension of surfaces, it allows us a quantitative evaluation of the surface roughness by analyzing the STM images. This kind of evaluation is of importance in Co-based alloys because the surface roughness is related to magnetic properties in low and medium magnetostriction. This paper presents a study of the surface roughnessof Co-based alloys obtaining the fractal dimensionality, the amplitude of the superficial features as well as the mean size of those features and its relation to magnetic properties. 1. Introduction The scanning tunneling microscope (STM) is the only microscope that affords knowledge of the vertical dimension, i.e., it yields a 3D repre- sentation of the surface. Regardless of this ad- vantage the first work on the use of the STM to study the fractal character of a surface [1] utilizes Richardson's plot [2] - i.e., a log-log plot of the surface area versus the length scale or yardstick - on the structures that appear in the projection of the surface on a plane. However, the STM capa- bility to obtain three-dimensional images allows the application of Mandelbrot's method [3] which consists of filling with water up to a given height and then calculating the fractal dimension from the lakes that appear in the image by using the relationship P otA 0'/2 where A is the area of a lake, P its perimeter and D = D' + 1 the fractal dimension. This approach was used in the second work published on this subject [4]. In this case the growth of gold deposits was characterized by do- ing the log P vs. log A plot of lakes generated by a single intersection of a plane with the surface. We have shown that this method can yield erro- neous results in estimating the D value [5]. As far as we know, those two papers are the only ones published on this subject although several groups are working on this line. Study of fractal dimen- sionality may also be of importance in the case of electrodeposition. When an electrochemical reac- tion is taking place, the fractal dimensionality of the electrode may be correlated to the macro- scopic dissipation factors that govern the reaction when the dissipation is controlled by the phenom- ena that occur at the liquid-electrode interface. Because the STM gives the vertical dimension, it allows us a quantitative evaluation of the sur- face roughness by analyzing the STM images (see, e.g., ref. [6]). This kind of evaluation is of impor- tance in CoP because the surface roughness is related to magnetic properties in low and medium magnetostriction [7]. In fact, magnetic coupling of the magnetization with the poles appearing at the 0304-3991/92/$05.00 © 1992 - Elsevier Science Publishers B.V. All rights reserved

Welcome message from author
This document is posted to help you gain knowledge. Please leave a comment to let me know what you think about it! Share it to your friends and learn new things together.
Transcript
Ultramicroscopy 42-44 (1992) 1329-1336 North-Holland
Study of the surface roughness of Co-based amorphous alloys by STM
M. Aguilar, M. Pancorbo, F. V~zquez, F. G d m e z
Instituto Ciencia de Materiales, Sede B (CSIC), Universidad Aut6noma de Madrid (C-Ill), 28049 Madrid, Spain
E. A n g u i a n o
IBM Scientific Center, Universidad Aut6noma Madrid (C-XVI), 28049 Madrid, Spare
J.M. Gonzfi lez, M. Vfizquez and F. Cebo l l ada
Instituto Ciencia de Materiales, Sede A (CSIC), c /Serrano 144, 28006 Madrid, Spain
Received 12 August 1991
Since the STM gives the vertical dimension of surfaces, it allows us a quantitative evaluation of the surface roughness by analyzing the STM images. This kind of evaluation is of importance in Co-based alloys because the surface roughness is related to magnetic properties in low and medium magnetostriction. This paper presents a study of the surface roughness of Co-based alloys obtaining the fractal dimensionality, the amplitude of the superficial features as well as the mean size of those features and its relation to magnetic properties.
1. Introduction
The scanning tunneling microscope (STM) is the only microscope that affords knowledge of the vertical dimension, i.e., it yields a 3D repre- sentation of the surface. Regardless of this ad- vantage the first work on the use of the STM to study the fractal character of a surface [1] utilizes Richardson's plot [2] - i.e., a log-log plot of the surface area versus the length scale or yardstick - on the structures that appear in the projection of the surface on a plane. However, the STM capa- bility to obtain three-dimensional images allows the application of Mandelbrot 's method [3] which consists of filling with water up to a given height and then calculating the fractal dimension from the lakes that appear in the image by using the relationship P otA 0'/2 where A is the area of a lake, P its perimeter and D = D ' + 1 the fractal dimension. This approach was used in the second work published on this subject [4]. In this case the growth of gold deposits was characterized by do-
ing the log P vs. log A plot of lakes generated by a single intersection of a plane with the surface. We have shown that this method can yield erro- neous results in estimating the D value [5]. As far as we know, those two papers are the only ones published on this subject although several groups are working on this line. Study of fractal dimen- sionality may also be of importance in the case of electrodeposition. When an electrochemical reac- tion is taking place, the fractal dimensionality of the electrode may be correlated to the macro- scopic dissipation factors that govern the reaction when the dissipation is controlled by the phenom- ena that occur at the liquid-electrode interface.
Because the STM gives the vertical dimension, it allows us a quantitative evaluation of the sur- face roughness by analyzing the STM images (see, e.g., ref. [6]). This kind of evaluation is of impor- tance in CoP because the surface roughness is related to magnetic properties in low and medium magnetostriction [7]. In fact, magnetic coupling of the magnetization with the poles appearing at the
0304-3991/92/$05.00 © 1992 - Elsevier Science Publishers B.V. All rights reserved
1330 M. Aguilar / Surface roughness of Co-based amorphous alloys
surface may influence the behaviour of thin flat samples in the region approaching saturation [8] because the perfect alignment of the magnetiza- tion parallel to the sample plane is precluded by the antiparallel field created by the poles just mentioned. Thus, surface roughness plays an im- portant role in the approach to saturation in low and medium magnetostriction samples [8] through the factor RZ/Ld (R and L being, respectively, the mean amplitude and wavelength of the sur- face undulations and d the sample thickness). This factor is a parameter used for the correla- tion of the surface roughness to the coefficients that are usually employed for the approach to saturation analysis. It is clear that STM can be a good technique that allows us to obtain both R and L from the analysis of the surface roughness in a very easy and direct way.
2. Experiment: materials and methods
In order to be sure that the substrates where the films are grown have no influence on the characteristics - roughness and fractal dimension - of the CoP alloys surface, we have been very careful in the preparation of those substrates and films. Thus the CoP samples used in this study were obtained by electrodeposition on Cu sub- strates previously polished. During electrodeposi- tion the temperature is maintained constant (75°C), the bath is stirred for homogenization and the substrate is forced to oscillate at 20 kHz. The employed anode was of Co. The substrate is made of polycrystalline Cu, whose thickness is less than 30 Ixm and a surface of 1.5 cm 2. The substrates are cleaned and polished previously to their use because they showed a clearly rough and undulated surface. First they are cleaned with acetone and then with dilute SO4H 2. After- wards they are electrolytically polished in a bath (buthanol plus POaH3). After this treatment the surface is nearly smooth but still showing traces of undulations. A mechanical polishing is carried out with alumina powder (0.2 /xm diameter) that produces the disappearance of those traces. Fi- nally, another electrolytical polishing is carried out in order to smooth all possible scratches and
marks as well as to release most of the tensions present in the surface. Current densities em- ployed for the electrolytical polishing are of the order of 50 m A / c m 2, for times of the order of 10-30 rain and the employed anode is made of Cu.
The electrodeposition bath has acid character with pH in the range 0.5-1. The current density used for sample preparation was between 100 and 800 mA/cm 2, the deposition rate was in the range 1-12 txm/min and the deposition time in the range 3-40 min depending on current. The last range was chosen so as to get 45 txm thick- ness samples. Composition of the samples is COl00_xP x with x in the range 10-21, the value of x depending on the electrodeposition current. The sample composition was examined by plasma spectroscopy (mean composition) and EDX anal- ysis (local composition with 0.5 txm resolution). During deposition, the current density on regions close to the sample edges is higher than that of the central part, giving rise in that regions to a higher Co content. To avoid this type of inhomo- geneity a special design of the substrate geometry was used that allows us to obtain very homoge- neous samples. In fact, the composition analysis showed homogeneity within 1%, throughout most of the samples length. No other elements, differ- ent from Co and P, were present in our samples above 0.1%.
These samples show uniaxial magnet ic anisotropy, with the easy axis perpendicular to the sample plane. Domains, as observed by means of Bitter's technique, show a stripe-type structure which is characteristic of this type of anisotropy. Hysteresis loops confirm the existence of such an anisotropy perpendicular to the plane, yielding values for the anisotropy field of the order of 100 Oe. This behavior [9] is characteristic of CoP amorphous samples, and the origin of this anisotropy is magnetostatic and is due to the formation during the growth of the sample of a columnar structure with regions of the samples with a Co content higher than the average. Small-angle X-ray diffraction experiments [10] also show the columnar growth in the form of elongated structures with a concentration of Co higher than the average and oriented perpendicu-
M. Aguilar / Surface roughness of Co-based amorphous alloys 1331
lar to the sample surface. The dimensions of these agglomerates are of a few hundred ,& width (in the plane of the samples) and two to five thousand ,& length [10,11]. This columnar mi- crostructure has been observed also in other ma- terials where its fractal character has been shown [12].
Characterization of the samples was made by X-ray diffractograms and calorimetric and mag- netic measurements. Concerning X-ray diffrac- tograms, as-deposited samples showed no traces of diffraction peaks down to the resolution of the technique. Calorimetric measurements carried out in an Ar atmosphere shoWed two exothermic stages yielding enthalpies of the order of 60 J i g which are of the order of magnitude of those corresponding to the crystallization of amorphous alloys [13]. Magnetic characterization of the sam- ples was carried out at RT by means of a vibrat- ing sample magnetometer up to a maximum field of 10 kOe and an extraction device based on a superconducting coil [7,14].
In a previous work we have seen that the C o - P "as-prepared" samples have a very rough surface [15]. Treating the surface by chemical etching produces a smoothing of the surface [15]. The STM images presented in this paper corre- spond to "as -prepared" samples without any chemical etching of the surface. These CoP alloys are very inert, and no appreciable oxidation of the surface occurs for long times, which makes them very well suited for STM studies.
The STM used works in ultrahigh vacuum (UHV) at pressures below 10 -9 Torr. Measure- ments were made in vacuum, although when done on air there are no differences in the images obtained (except for those due to the noise). The STM head used was from W.A. Technology (UHV compatible; first mechanical resonance at 12 kHz,
o
thermal drift of 3 A/min . ) . The feedback circuit was developed in collaboration with the electron- ics depar tment of our institute and the STM automation, data acquisition and image process- ing was made in collaboration with the IBM Scientific Center in Madrid, by means of an IBM PS/2-80 and a display IBM 8514. The study of the fractal character was made on an IBM 6150- 135 (RT) with an IBM 5081 display. The images
presented in this paper are taken from this last display. The main characteristics of our STM are the high speed of image acquisition (up to 100 000 pixels/s) and high resolution (16 bits). The tunnel current is detected by measuring the voltage drop in a series resistor by using a PARC Model 113 low-noise preamplif ier (300 kHz cutoff frequen- cy). The data acquisition was performed by using a Hewlett Packard 3458A Multimeter which sends the data to the computer via a high-speed GPIB in D M A mode.
The bias voltage used was 50 mV (sample positive) and the tunnel current around 4 nA. The smaller images were digitized as 256 lines of 256 points and the larger of 1024 x 1024. With regard to o physical size, images are between 500 /~ × 500 A and the maximum 7000 ,& × 7000 ,~.
The method that we will use to characterize the fractal nature of a surface is the one pro- posed by Mandelbrot for earth coastlines [3]. It consists of filling with water up to a certain level and then making a log-log plot of the perimeter of the lakes that appear versus their area. The slope is D'/2 where D ' = D - 1. The water fill- ing and lake patterns were generated by a com- puter simulation of the filling up to a certain height of the surface. Then a threshold detection is made, followed by a border-detection algorithm which isolates individual lakes. To do this an algorithm that makes a checking for optimal con- nectivity is run. After lakes are detected the perimeter and area of every one is calculated. A study of this method in STM, its errors, limita- tions and possibilities, was made previously and is published elsewhere [5]. To calculate the perime- ter we use the method of Sankar and Krishna- murthy [16] that yields the best results. The calcu- lation of the area is made by adding to the number of pixels inside the boundary (i.e., exclud- ing the pixels that form the border) the number of pixels that form the border divided by two. The reason we do this is because of consistency with the method of calculating the border. This method allows us to include lakes with area larger than 10t~ 2 (t~ is the pixel size).
The function that characterizes the distribu- tion of roughness of the surface is similar to that described by Reiss et al. [6] without the shifting in
1332 M. Aguilar / Surface roughness of Co-based amorphous alloys
x-axis and, instead of calculating the ratio of areas with heights between h and h + dh, we calculate the number of pixels N(h) that in the image have heights between h and h + dh. The resolution in height that we have is 16 bits, which means 65 536 different heights. This large resolu- tion corresponds to the whole range of the ADC, which is not used in most of the images. Then the difference between maximum and minimum height in each image is divided into 256 different levels. Then the range that is used in an image is divided in 256 different levels, and that is the value of dh used, i.e., this value depends on the image and the only constant parameter is the number of points in the plot of N(h) versus h, i.e., 256.
We also calculate the autocorrelation function of the images in order to obtain information about the mean size of the features that are observed. The calculation is made with the origi- nal images without any filtering. The result is a large peak with exponential behaviour in the cen- ter with some small lobes on the sides. The distance between the first two small lobes [6] is an estimate of the mean size of the image fea- tures. The main difference from the Reiss method [6] is that we obtain the autocorrelation function of the whole image, i.e., a 3D function, instead of using a single scan.
10 ~
D' = ~
. .?' . . . . , , . .
I 0 "' "~'' '"
10" 10 ~ 10 ~ 10 7 AREA ( A x A )
,< v 10
z
,<
z
10 ~ O' = 144 (0.04)
. .- . . ~
I '
o. , • ° i
' , l o ° . . " ' •
i I i b / Io' I o ' 1o'
AREA ( ~ x A )
, ( b )
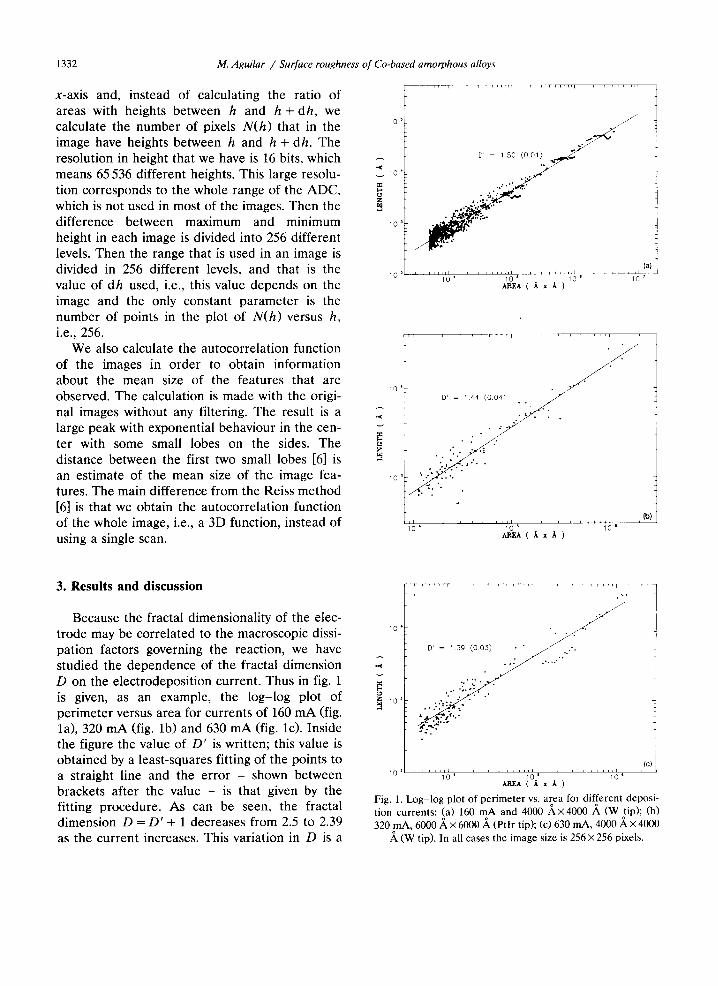
3. Results and discussion
Because the fractal dimensionality of the elec- trode may be correlated to the macroscopic dissi- pation factors governing the reaction, we have studied the dependence of the fractal dimension D on the electrodeposition current. Thus in fig. 1 is given, as an example, the log-log plot of per imeter versus area for currents of 160 mA (fig. la), 320 mA (fig. lb) and 630 mA (fig. lc). Inside the figure the value of D ' is written; this value is obtained by a least-squares fitting of the points to a straight line and the error - shown between brackets after the value - is that given by the fitting procedure. As can be seen, the fractal dimension D = D ' + 1 decreases from 2.5 to 2.39 as the current increases. This variation in D is a
1 0 "
~ 10 3
O' : 1.59 (OO3) . . "
]
, ( c ) 10 2 h , ,~,~ , , J , ,,,,i
10 6 I0 S , L , J , ,,I,~
AREA ( A x A )
Fig. 1. Log-log plot of perimeter vs. area for different deposi- tion currents: (a) 160 mA and 4000 ,~x4000 ,~ (W tip); (b) 320 mA, 6000 ,~ x 6000 ,~ (Ptlr tip); (c) 630 mA, 4000 A x 4000
(W tip). In all cases the image size is 256X 256 pixels.
M. Aguilar / Surface roughness of Co-based amorphous alloys 1333
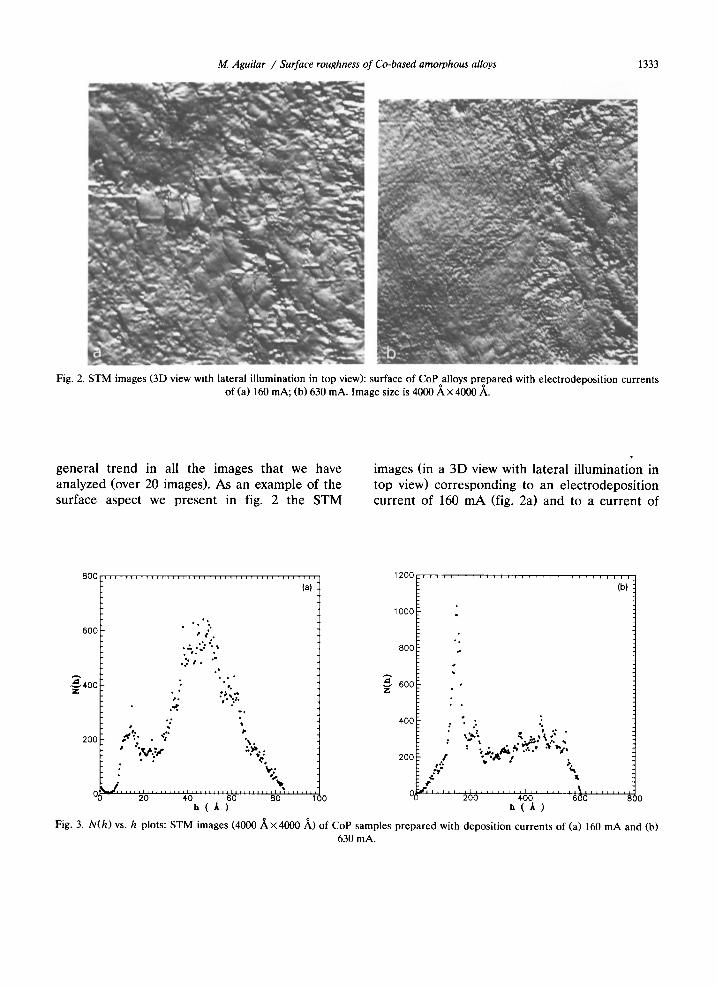
Fig. 2. STM images (3D view with lateral illumination in top view): surface of CoP alloys prepared with electrodeposition currents of (a) 160 mA; (b) 630 mA. Image size is 4000 ,~ × 4000 A.
general trend in all the images that we have analyzed (over 20 images). As an example of the surface aspect we present in fig. 2 the STM
images (in a 3D view with lateral illumination in top view) corresponding to an electrodeposition current of 160 mA (fig. 2a) and to a current of
8 0 0 , , , , , , , , , , , , , , , , , , , , , , , , , , , , , , , , , , , , , , , , ,
(a)
600
m~. 400 Z
200
.-.~.. '. ~
°~'I.
°~ °.
,. ,'.~:.
°; •
• " % .
• ";V'.:'," ".~¢: ¢,
: %,:
. . . . . i . . . . . . . . . , , , i , ~ ' , ~, , , , , , , , , , , , , , , , . . . . . .
20 40 60 80 100 h(A)
1200 ,,,,, , , , .., , , ,, ,,, , ,, .., ,, , ,, .
(b)
1000
8OO
E 6001
400
200
• o
- . . . "; . . . % ~ . ,% i
t %, , . ~ ".
200 400 600 800 h ( / L )
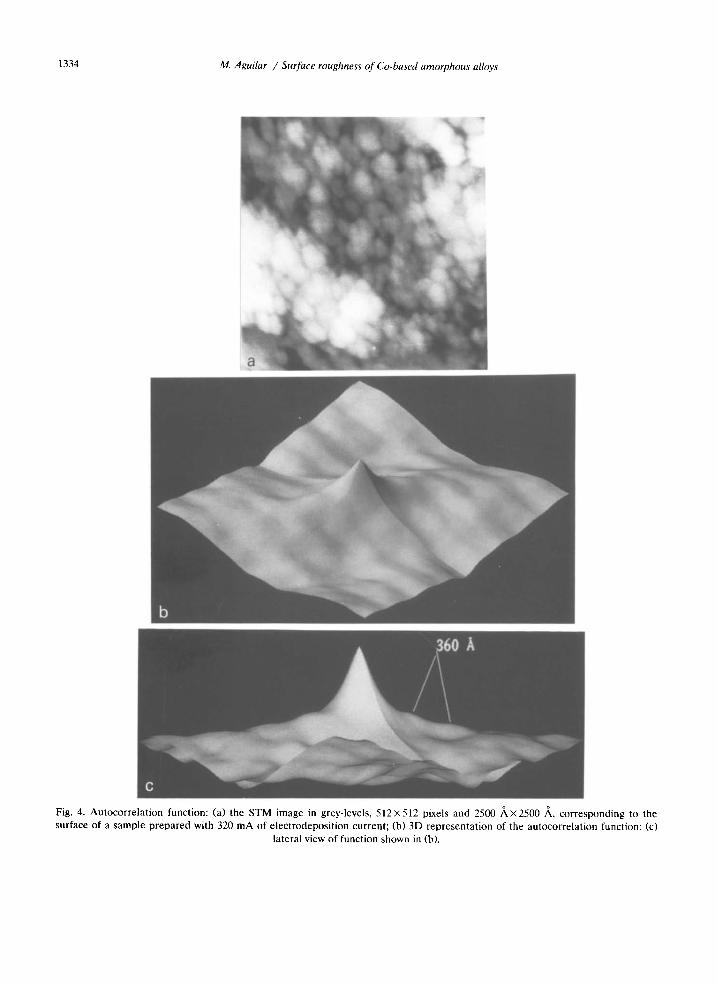
Fig. 3. N(h) vs. h plots: STM images (4000 ./ ,x4000 A) of CoP samples prepared with deposition currents of (a) 160 mA a n d (b) 630 mA.
1334 M. Aguilar / Surface roughness of Co-based amorphous alloys
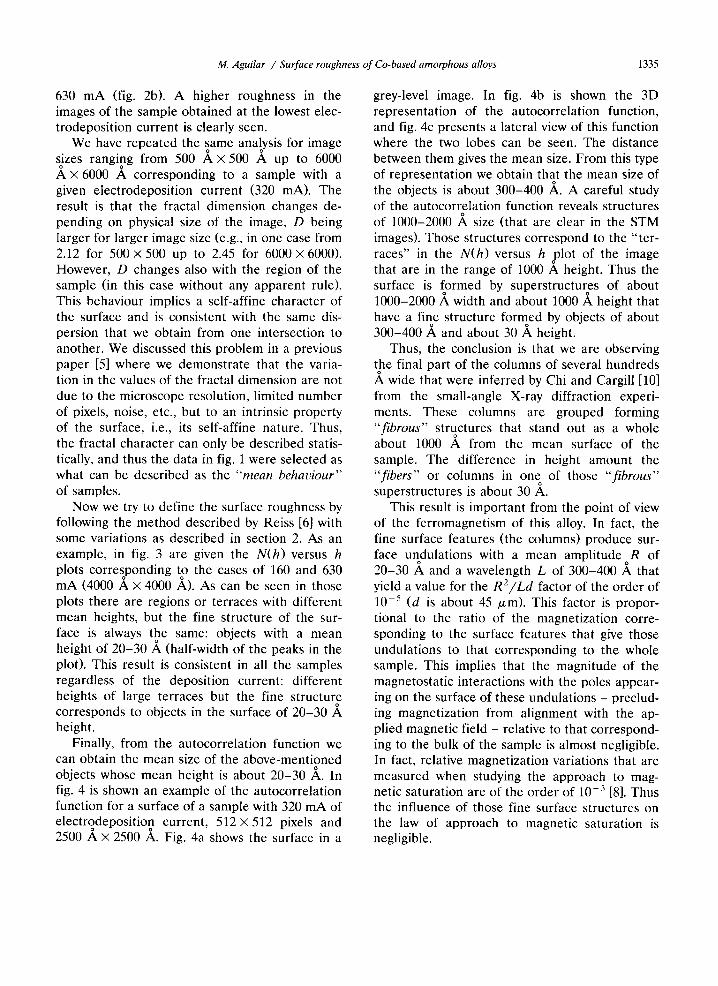
Fig. 4. Autocorrelation function: (a) the STM image in grey-levels, 512 x512 pixels and 2500 /~x 2500 A, corresponding to the surface of a sample prepared with 320 mA of electrodeposition current; (b) 3D representation of the autocorrelation function; (c)
lateral view of function shown in (b).
M. Aguilar / Surface roughness of Co-based amorphous alloys 1335
630 mA (fig. 2b). A higher roughness in the images of the sample obtained at the lowest elec- trodeposition current is clearly seen.
We have repeated the same analoysis for image sizes ranging from 500 A x 500 A up to 6000 A, x 6000 A corresponding to a sample with a given electrodeposition current (320 mA). The result is that the fractal dimension changes de- pending on physical size of the image, D being larger for larger image size (e.g., in one case from 2.12 for 500 x 500 up to 2.45 for 6000 X 6000). However, D changes also with the region of the sample (in this case without any apparent rule). This behaviour implies a self-affine character of the surface and is consistent with the same dis- persion that we obtain from one intersection to another. We discussed this problem in a previous paper [5] where we demonstrate that the varia- tion in the values of the fractal dimension are not due to the microscope resolution, limited number of pixels, noise, etc., but to an intrinsic property of the surface, i.e., its self-affine nature. Thus, the fractal character can only be described statis- tically, and thus the data in fig. 1 were selected as what can be described as the "mean behauiour" of samples.
Now we try to define the surface roughness by following the method described by Reiss [6] with some variations as described in section 2. As an example, in fig. 3 are given the N(h) versus h plots corresponding to the cases of 160 and 630 mA (4000 A x 4000 ,~). As can be seen in those plots there are regions or terraces with different mean heights, but the fine structure of the sur- face is always the same: objects with a mean height of 20-30 .A (half-width of the peaks in the plot). This result is consistent in all the samples regardless of the deposition current: different heights of large terraces but the fine structure corresponds to objects in the surface of 20-30 ,~ height.
Finally, from the autocorrelation function we can obtain the mean size of the above-mentioned objects whose mean height is about 20-30 ,~. In fig. 4 is shown an example of the autocorrelation function for a surface of a sample with 320 mA of electrodeposition current, 512 x 512 pixels and 2500 ,~ x 2500 ~,. Fig. 4a shows the surface in a
grey-level image. In fig. 4b is shown the 3D representat ion of the autocorrelation function, and fig. 4c presents a lateral view of this function where the two lobes can be seen. The distance between them gives the mean size. From this type of representation we obtain that the mean size of
o
the objects is about 300-400 A. A careful study of the autocorrelation function reveals structures of 1000-2000 ,~ size (that are clear in the STM images). Those structures correspond to the " ter- races" in the N(h) versus h ~lot of the image that are in the range of 1000 A height. Thus the surface is formed by superstructures of about 1000-2000 A width and about 1000 ,~ height that have a fine structure formed by objects of about 300-400 A, and about 30 A, height.
Thus, the conclusion is that we are observing the final part of the columns of several hundreds A, wide that were inferred by Chi and Cargill [10] from the small-angle X-ray diffraction experi- ments. These columns are grouped forming "fibrous" structures that stand out as a whole about 1000 ~, from the mean surface of the sample. The difference in height amount the "fibers" or columns in one of those "fibrous"
o
superstructures is about 30 A. This result is important from the point of view
of the ferromagnetism of this alloy. In fact, the fine surface features (the columns) produce sur- face undulations with a mean amplitude R of 20-30 ,~ and a wavelength L of 300-400 ,~ that yield a value for the R2/Ld factor of the order of 10 5 (d is about 45 tzm). This factor is propor- tional to the ratio of the magnetization corre- sponding to the surface features that give those undulations to that corresponding to the whole sample. This implies that the magnitude of the magnetostatic interactions with the poles appear- ing on the surface of these undulations - preclud- ing magnetization from alignment with the ap- plied magnetic field - relative to that correspond- ing to the bulk of the sample is almost negligible. In fact, relative magnetization variations that are measured when studying the approach to mag- netic saturation are of the order of 10 -3 [8]. Thus the influence of those fine surface structures on the law of approach to magnetic saturation is negligible.
1336 M. Aguilar / Surface roughness of Co-based amorphous alloys
On the other hand, the superstructures of 1000-2000 ,~ size give a " rough" surface undula- tion with a value for the RZ/Ld factor of about 2 × 10 -3. In this case the effect on the law of approach to saturation could be observed.
Acknowledgements
Sponsoring from the Spanish CICYT (MAT91- 0804), the IBM Scientific Center in Madrid and the ACIS department of IBM Spain is acknowl- edged. We want to thank the Electronic Labora- tory of our institute, especially N. Denisenko and A. Blanco, for their technical assistance.
References
[1] D.R. Denley, Ultramicroscopy 33 (1990) 83. [2] L.F. Richardson, General Systems Yearbook 6 (1961)
139. [3] B.B. Mandelbrot, The Fractal Geometry of Nature
(Freeman, New York, 1983). [4] J.M. G6mez and A.M. Bar6, J. Vac. Sci. Technol. B 9
(1990) 495.
[5] M. Aguilar, E. Anguiano, F. Vazquez and M. Pancorbo, J. Microscopy, in press.
[6] G. Reiss, H. Briickl, J. Vancea, R. Lecheler and E. Hastreiter, J. Appl. Phys. 70 (1991) 523.
[7] F. Cebollada, J.M. Gonzalez, M. Vazquez, M. Aguilar, M. Pancorbo and E. Anguiano, J. Magn. Magn. Mater. 101 (1991) 199.
[8] G. Herzer, An. Fis. (b) 86 (1990) 64. [9] G. Dietz and K. Klett, J. Magn. Magn. Mater. 8 (1978)
57. [10] G.C. Chi and G.S. Cargill Ili, Mater. Sci. Eng. 23 (1976)
155. [11] J.M. Riveiro and M.C. Sanchez-Trujillo, IEEE Trans.
Magn. MAG-16 (1980) 1426. [12] R. Messier and J.E. Yehoda, J. Appl. Phys. 58 (1986)
3739; J.E. Yehoda and R. Messier, Appl. Surf. Sci. 22/23 (1985) 590.
[13] F.E. Luborsky, Ed., Amorphous Metallic Alloys (But- terworths, London, 1983).
[14] F. Cebollada et al., in: Basic Features of the Glassy State, Eds. J. Colmenero and A. Alegrla (World Scientific, Singapore, 1990) pp. 529-533.
[15] M. Aguilar, M. Pancorbo, E. Anguiano, F. Cebollada, J.M. Gonzfilez and M. V~zquez, presented at: l l t h Eur. Conf. on Surface Science (ECOSS-11), Salamanca, Spain, 2-5 October 1990; and Surf. Sci., submitted.
[16] P.V. Sankar and E.V. Krishnamurthy, Comput. Graphics Image Process. 8 (1978) 136.
Related Documents