arXiv:0806.4251v1 [nucl-ex] 26 Jun 2008 EPJ manuscript No. (will be inserted by the editor) Study of the reaction γp → pπ 0 η The CB-ELSA Collaboration I. Horn 1 , A.V. Anisovich 1,2 , G. Anton 3 , R. Bantes 4 , O. Bartholomy 1 , R. Beck 1 , Y. Beloglazov 2 , R. Bogend¨ orfer 3 , R. Castelijns 5 , V. Cred´ e 6 , A. Ehmanns 1 , J. Ernst 1 , I. Fabry 1 , H. Flemming 7,a ,A.F¨osel 3 , M. Fuchs 1 , Ch. Funke 1 , R. Gothe 4,b , A. Gridnev 2 , E. Gutz 1 , S. H¨ offgen 4 , J. H¨ oßl 3 , J. Junkersfeld 1 , H. Kalinowsky 1 , F. Klein 4 , E. Klempt 1 , H. Koch 7 , M. Konrad 4 , B. Kopf 7 , B. Krusche 8 , J. Langheinrich 4,b , H. L¨ ohner 5 , I. Lopatin 2 , J. Lotz 1 ,H.Matth¨ay 7 , D. Menze 4 , J. Messchendorp 9,c , V. Metag 9 , V.A. Nikonov 1,2 , D. Novinski 2 , M. Ostrick 4,d , H. van Pee 1 , A. Radkov 2 , A.V. Sarantsev 1,2 , C. Schmidt 1 , H. Schmieden 4 , B. Schoch 4 , G. Suft 3 , V. Sumachev 2 , T. Szczepanek 1 , U. Thoma 1 , D. Walther 1 , and Ch. Weinheimer 1,e 1 Helmholtz-Institut f¨ ur Strahlen- und Kernphysik, Universit¨ at Bonn, Germany 2 Petersburg Nuclear Physics Institute, Gatchina, Russia 3 Physikalisches Institut, Universit¨ at Erlangen, Germany 4 Physikalisches Institut, Universit¨ at Bonn, Germany 5 Kernfysisch Versneller Instituut, Groningen, The Netherlands 6 Department of Physics, Florida State University, Tallahassee, FL, USA 7 Institut f¨ ur Experimentalphysik I, Universit¨ at Bochum, Germany 8 Institut f¨ ur Physik, Universit¨ at Basel, Switzerland 9 II. Physikalisches Institut, Universit¨ at Gießen, Germany a Present address: GSI, Darmstadt, Germany b Present address: University of South Carolina, Columbia, SC, USA c Present address: Kernfysisch Versneller Instituut, Groningen, The Netherlands d Present address: Institut f¨ ur Kernphysik, Universit¨ at Mainz, Germany e Present address: Institut f¨ ur Kernphysik, Universit¨ at M¨ unster, Germany Received: August 15, 2019/ Revised version: Abstract. The reaction γp → pπ 0 η has been studied with the CBELSA detector at the tagged photon beam of the Bonn electron stretcher facility. The reaction shows contributions from Δ + (1232)η, N (1535) + π 0 and pa0(980) as intermediate states. A partial wave analysis suggests that the reaction proceeds via formation of six Δ resonances, Δ(1600)P33 , Δ(1920)P33 , Δ(1700)D33 , Δ(1940)D33 , Δ(1905)F35 , Δ(2360)D33 , and two nucleon resonances N (1880)P11 and N (2200)P13 , for which pole positions and decay branching ratios are given. PACS: 13.30.-a Decays of baryons, 13.60.Le Meson production 14.20.Gk Baryon resonances with S =0 1 Introduction The study of baryon resonances has found renewed in- terest as evidenced by new experimental facilities provid- ing continuous photon beams like Jefferson Lab, SPring-8, MAMI at Mainz, and ELSA at Bonn. For nucleon res- onances up to ≈ 1.7 GeV/c 2 , their abundance and most masses are reasonably well explained in quark models even though the models use very different assumptions on the nature of long-range quark-quark interactions, like effec- tive gluon exchange [1], instanton induced interactions [2], or exchange of Goldstone bosons [3]. At higher masses, the models differ in important details of their predictions but agree in predicting the existence of many more states than Correspondence to : [email protected] have been found experimentally. Diquark models [4] have a reduced number of degrees of freedom and expect fewer states [5,6]. Models based on a conformal approximation of QCD exploit the correspondence [7] between string the- ories on an Anti-de-Sitter (AdS) space and gauge theories on its space-time boundary [8,9]. Apparently, AdS/QCD predicts a smaller number of states [10,11,12,13] but, to our knowledge, the problem of missing resonances, of res- onances predicted in quark models but not in AdS/QCD, has not yet been discussed. Lattice gauge calculations aim at simulating full QCD; substantial progress has been achieved [14], however, the calculations do not yet help to validate or reject specific quark models. In the past, knowledge on nucleon resonances was de- rived mostly from partial wave analyses of elastic πN scattering experiments. This method exploits the coupling

Welcome message from author
This document is posted to help you gain knowledge. Please leave a comment to let me know what you think about it! Share it to your friends and learn new things together.
Transcript
arX
iv:0
806.
4251
v1 [
nucl
-ex]
26
Jun
2008
EPJ manuscript No.(will be inserted by the editor)
Study of the reaction γp → pπ0η
The CB-ELSA Collaboration
I. Horn 1, A.V. Anisovich 1,2, G. Anton 3, R. Bantes 4, O. Bartholomy 1, R. Beck 1, Y. Beloglazov 2, R. Bogendorfer 3,R. Castelijns 5, V. Crede 6, A. Ehmanns 1, J. Ernst 1, I. Fabry 1, H. Flemming 7,a, A. Fosel 3, M. Fuchs 1, Ch. Funke 1,R. Gothe 4,b, A. Gridnev 2, E. Gutz 1, S. Hoffgen 4, J. Hoßl 3, J. Junkersfeld 1, H. Kalinowsky 1, F. Klein 4, E. Klempt 1,H. Koch 7, M. Konrad 4, B. Kopf 7, B. Krusche 8, J. Langheinrich 4,b, H. Lohner 5, I. Lopatin 2, J. Lotz 1, H. Matthay 7,D. Menze 4, J. Messchendorp 9,c, V. Metag 9, V.A. Nikonov 1,2, D. Novinski 2, M. Ostrick 4,d, H. van Pee 1, A. Radkov 2,A.V. Sarantsev 1,2, C. Schmidt 1, H. Schmieden 4, B. Schoch 4, G. Suft 3, V. Sumachev 2, T. Szczepanek 1, U. Thoma 1,D. Walther 1, and Ch. Weinheimer 1,e
1 Helmholtz-Institut fur Strahlen- und Kernphysik, Universitat Bonn, Germany2 Petersburg Nuclear Physics Institute, Gatchina, Russia3 Physikalisches Institut, Universitat Erlangen, Germany4 Physikalisches Institut, Universitat Bonn, Germany5 Kernfysisch Versneller Instituut, Groningen, The Netherlands6 Department of Physics, Florida State University, Tallahassee, FL, USA7 Institut fur Experimentalphysik I, Universitat Bochum, Germany8 Institut fur Physik, Universitat Basel, Switzerland9 II. Physikalisches Institut, Universitat Gießen, Germanya Present address: GSI, Darmstadt, Germanyb Present address: University of South Carolina, Columbia, SC, USAc Present address: Kernfysisch Versneller Instituut, Groningen, The Netherlandsd Present address: Institut fur Kernphysik, Universitat Mainz, Germanye Present address: Institut fur Kernphysik, Universitat Munster, Germany
Received: August 15, 2019/ Revised version:
Abstract. The reaction γp → pπ0η has been studied with the CBELSA detector at the tagged photon beamof the Bonn electron stretcher facility. The reaction shows contributions from ∆+(1232)η, N(1535)+π0 andpa0(980) as intermediate states. A partial wave analysis suggests that the reaction proceeds via formationof six ∆ resonances, ∆(1600)P33, ∆(1920)P33, ∆(1700)D33 , ∆(1940)D33 , ∆(1905)F35, ∆(2360)D33 , andtwo nucleon resonances N(1880)P11 and N(2200)P13 , for which pole positions and decay branching ratiosare given.
PACS: 13.30.-a Decays of baryons, 13.60.Le Meson production 14.20.Gk Baryon resonances with S = 0
1 Introduction
The study of baryon resonances has found renewed in-terest as evidenced by new experimental facilities provid-ing continuous photon beams like Jefferson Lab, SPring-8,MAMI at Mainz, and ELSA at Bonn. For nucleon res-onances up to ≈ 1.7GeV/c2, their abundance and mostmasses are reasonably well explained in quark models eventhough the models use very different assumptions on thenature of long-range quark-quark interactions, like effec-tive gluon exchange [1], instanton induced interactions [2],or exchange of Goldstone bosons [3]. At higher masses, themodels differ in important details of their predictions butagree in predicting the existence of many more states than
Correspondence to: [email protected]
have been found experimentally. Diquark models [4] havea reduced number of degrees of freedom and expect fewerstates [5,6]. Models based on a conformal approximationof QCD exploit the correspondence [7] between string the-ories on an Anti-de-Sitter (AdS) space and gauge theorieson its space-time boundary [8,9]. Apparently, AdS/QCDpredicts a smaller number of states [10,11,12,13] but, toour knowledge, the problem of missing resonances, of res-onances predicted in quark models but not in AdS/QCD,has not yet been discussed. Lattice gauge calculationsaim at simulating full QCD; substantial progress has beenachieved [14], however, the calculations do not yet help tovalidate or reject specific quark models.
In the past, knowledge on nucleon resonances was de-rived mostly from partial wave analyses of elastic πNscattering experiments. This method exploits the coupling
2 The CB-ELSA Collaboration: Study of the reaction γp → pπ0η
−e
H2 −liquefierradiator inner detector
beam γ beam
6.6m
Crystal barrel
target
dipole magnet
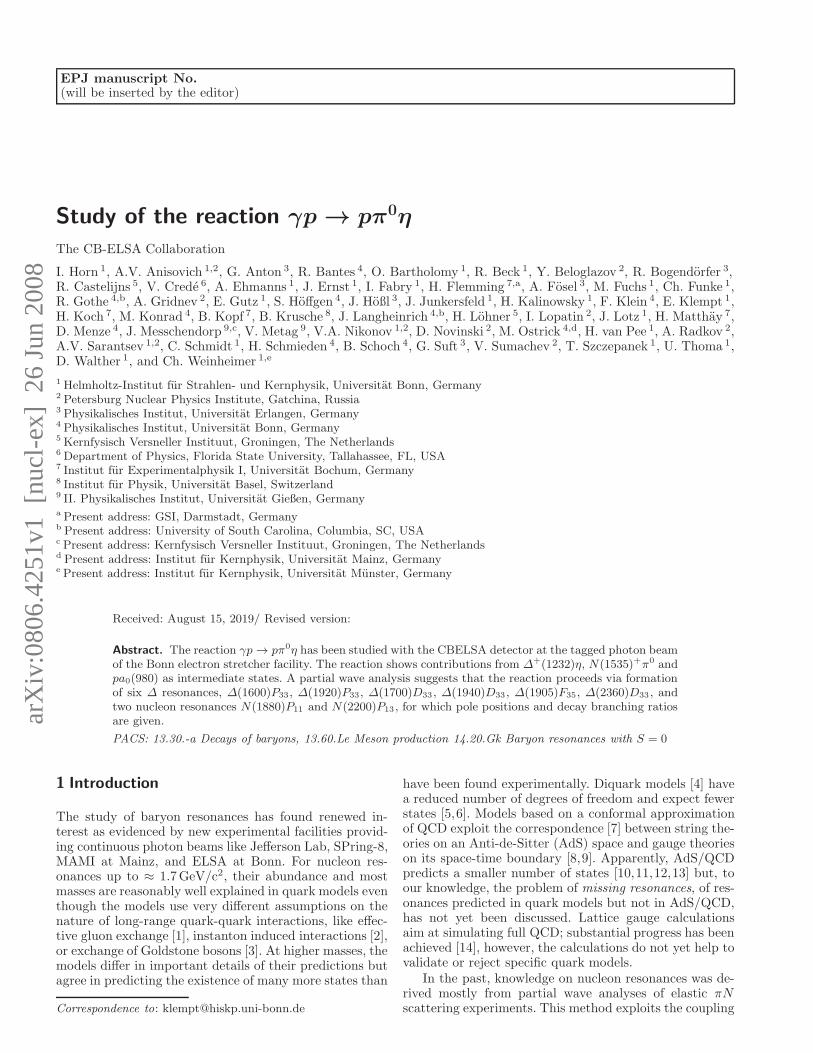
Fig. 1. Experimental setup at ELSA in Bonn: Electrons delivered by the accelerator ELSA enter the experimental area fromthe left. They hit a radiator and produce a wide-band photon beam. The photon energy is tagged by measuring the electrondeflecting angle in a dipole magnet. The photons hit protons of a liquid H2 target. Particles, in particular photons, emergingfrom the reaction are detected in the Crystal barrel detector. A scintillation fiber (scifi) detector measures the direction ofcharged particles. A total absorption lead mineral oil Cerenkov counter installed further downstream to monitor the photonbeam intensity is not shown in the figure.
of resonances to the Nπ channel; resonances for whichthis coupling is weak are not detectable. The ParticleData Listings [15] teach us that at high pion momenta,above 2GeV, high-spin states are formed while formationof high-mass states with low angular momenta seems to besuppressed. Due to this limitation, only few resonances areknown so far. Even worse, the evidence for a large fractionof them has recently been questioned in a careful analysis[16] of a large body of Nπ elastic and charge-exchangescattering data.
The new facilities give access to photo-induced pro-duction of resonances; detectors with large solid angle al-low one to study decays of resonances into complex finalstates. Thus Nπ is avoided in the entrance and in theexit channel. Quark model calculations [17] and first re-sults [18,19] seem to support our conjecture that in pho-toproduction, excitation of radially excited states mightbe preferred over excitations of high-angular momentumstates.
In this paper we present a study of the reaction
γp → pπ0η (1)
for photon energies covering the resonance region fromthe pπ0η production threshold at W = 1.63GeV/c2 up to2.5 GeV/c2. In this reaction, decays of ∆ resonances into∆(1232)η can be studied: the η acts as an isospin filterand resonances decaying into ∆(1232)η must have isospinI = 3/2. For low photon energies phase space is limited,and∆(1232) and η should be in a relative S-wave. We thusmay expect a high sensitivity for baryon resonances withisospin I = 3/2 and spin J = 3/2 and negative parity.If such resonances decay into Nπ, they need L = 2 be-tween N and π; resonances with these quantum numbers
are characterized by L2I,2J = D33. The lowest mass res-onance with these quantum numbers is ∆(1700)D33. Thepossibility that it may couple to the ∆(1232)η channelwas already discussed by Nefkens [20]; his conjecture wasconfirmed recently by the GRAAL collaboration [21]. Theaim of this paper is to report evidence for ∆ resonancesabove ∆(1700)D33, in particular for a JP = 3/2± paritydoublet consisting of the two resonances ∆(1920)P33 and∆(1940)D33.
2 Experimental setup and data reconstruction
The experiment was carried out at the tagged photonbeam of the ELectron Stretcher Accelerator ELSA atBonn [22], using the Crystal Barrel detector [23]. A shortdescription of the experiment, data reconstruction andanalysis methods can be found in a recent letter on 2π0
photoproduction [24]; further details are given in [25]. Aschematic drawing of the experimental setup is shown inFig. 1. For the data presented here, ELSA delivered - viaslow extraction - a continuous electron beam of 3.2GeV.The electrons hit a radiator target of 0.003XR (i.e. radi-ation length) thickness.
The energies of photons produced in the radiator tar-get were tagged in energy by a measurement of the de-flection angle of scattered electrons passing the field ofa dipole magnet. For singly scattered electrons, the pho-ton energy is Eγ = E0 − Ee− . The tagging detector con-sisted of 2 Multi-Wire Proportional Chambers (MWPCs)and 14 plastic scintillator bars. The position resolution ofthe MWPCs determined the photon energy resolution of0.5MeV at the highest Eγ and 30MeV at the lowest Eγ ,whereas the scintillation counters enabled fast timing. The
The CB-ELSA Collaboration: Study of the reaction γp → pπ0η 3
0
100
200
300
400
500
] 2
[MeV/cγγM400 450 500 550 600 650 700
2N/1MeV/c =17469η0πpN
ση =17.1 MeV/c2
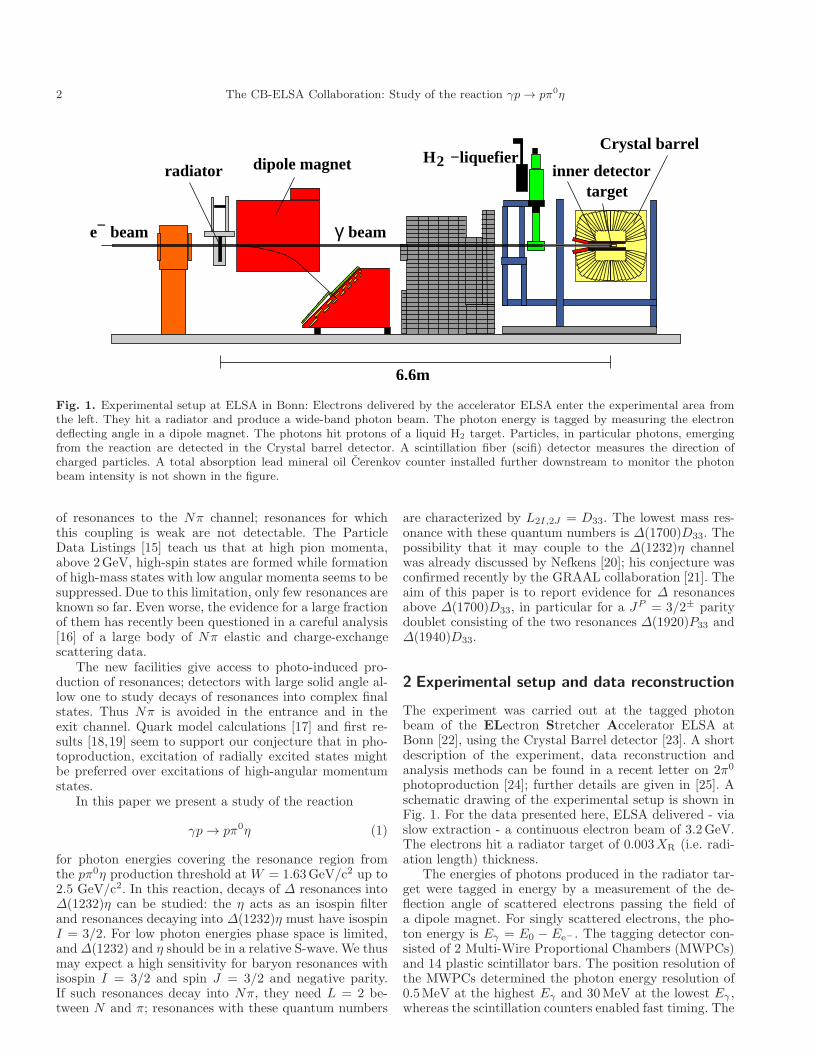
Fig. 2. Left: The distribution of γγ invariant masses after a kinematic fit to γp → p4γ (with c.l.> 0.1%). There are six entriesper event. The distribution shows a large peak due to the reaction γp → pπ0π0 and two smaller peaks due to γp → pπ0η.Right: The γγ invariant mass distribution after a kinematic fit to γp → pπ0γγ (with c.l.> 10%) and a cut rejecting γp → pπ0π0
events (with c.l.> 1%). In the 460-620MeV/c2 mass interval there are 18589 events, 1120 of them are below the backgroundline derived from a linear fit. The fit to γp → pπ0η (with c.l.> 1%) accepts 18379 events and rejects 210 background eventsleading to 910 background events (grey-shaded area).
energy calibration of the tagger was performed by directinjection of the electron beam.
The photon beam hit a liquid H2 target (length: l =52.84mm, diameter: d = 30mm); charged reaction prod-ucts were detected in an inner three–layer scintillating–fiber detector surrounding the target and positioned atmean radii of 5.81 cm, 6.17 cm and 6.45 cm, respectively.The 2mm fibers are partly bent to helical shapes (−25◦,+25◦, 0◦ from the inner to the outer layer) to provide anunambiguous impact point when a charged particle crossesthe detector [26].
The Crystal–Barrel calorimeter consisted of 1380 16-radiation-length CsI(Tl) crystals. The crystals are of trape-zoidal shape and point to the center of the target; theyprovide an excellent photon detection efficiency and a highgranularity. The setup covered about 98% of 4π (full φcoverage, 12◦ ≤ θ ≤ 168◦). Its large solid–angle coverageallowed for reconstruction of multi–photon final states.
The first-level trigger was derived from a coincidencebetween the tagging system and the fiber detector. Inthe second-level trigger, a FAst Cluster Encoder (FACE)based on cellular logic, provided the number of chargedand neutral particles detected in the Crystal Barrel. Datawere taken triggering on events with two (partly three)or more particles in the cluster logic. A segmented total-absorption oil Cerenkov counter determined the total pho-ton flux.
Events due to reaction (1) were selected by requir-ing five clusters of energy deposits in the Crystal Bar-rel calorimeter. One of the clusters was required to matchwith the charged particle emerging from the liquid H2 tar-get and hitting the scintillation fiber detector. The lattercluster was identified as proton, the other four as pho-tons. The proton and the four photons were assumed to
be produced in the target center. More details on eventreconstruction can be found in [25].
These events were subjected to a kinematic fit to theγp → p4γ hypothesis imposing energy and momentumconservation. The distribution of the γγ invariant mass ofone pair against the second pair of surviving events (with6 entries per event) is shown in Fig. 2, left panel. Then, theγp → p π0γγ hypothesis was tested and events with a con-fidence level (c.l.) exceeding 10% were retained. In a nextstep, events compatible at a c.l.>1% with the γp → p 2π0
hypothesis were rejected. The resulting γγ invariant massof the second photon-pair is shown in Fig. 2, right panel.These events passed a final kinematic fit to the γp → p π0ηhypothesis requiring a probability exceeding 1%. The fi-nal event sample contains 17469 events due to reaction(1) and 910 background events. Events which are likelydue to the background are identified (and subtracted) byselecting those 910 events which are closest in phase spaceto the events falling into the η side bins (380-440MeV/c2;640-700MeV/c2).
3 Mass and angular distributions
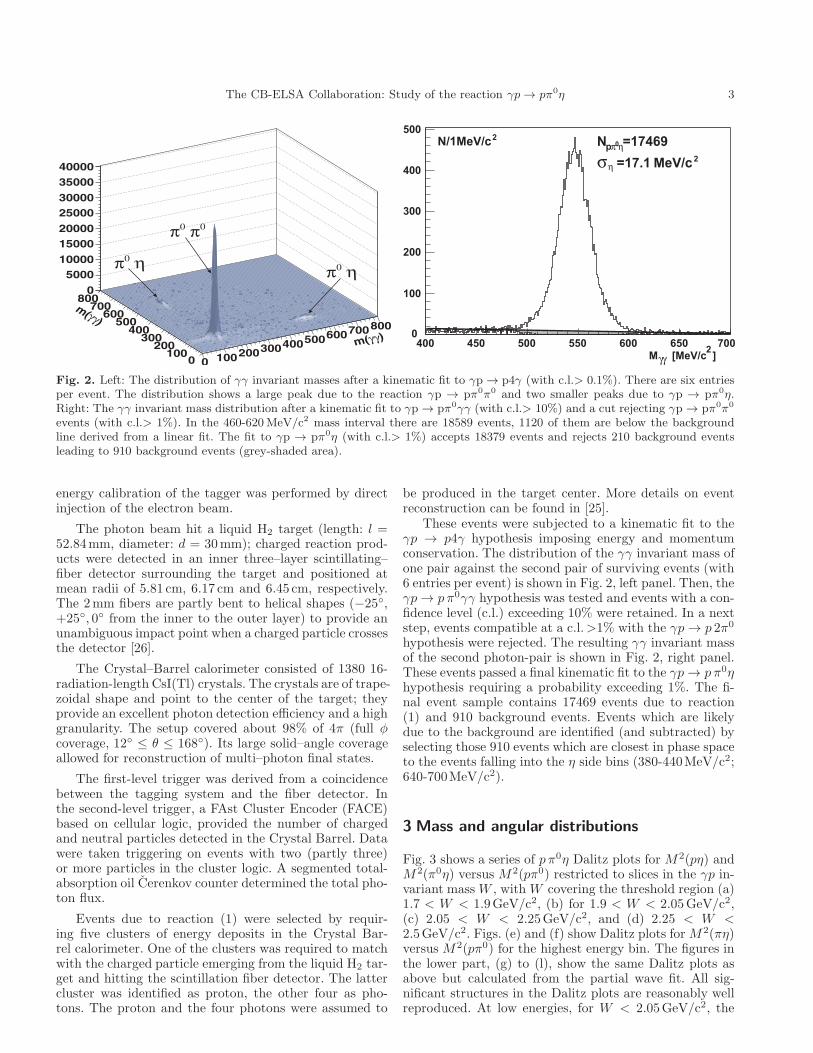
Fig. 3 shows a series of p π0η Dalitz plots for M2(pη) andM2(π0η) versus M2(pπ0) restricted to slices in the γp in-variant mass W , with W covering the threshold region (a)1.7 < W < 1.9GeV/c2, (b) for 1.9 < W < 2.05GeV/c2,(c) 2.05 < W < 2.25GeV/c2, and (d) 2.25 < W <2.5GeV/c2. Figs. (e) and (f) show Dalitz plots for M2(πη)versus M2(pπ0) for the highest energy bin. The figures inthe lower part, (g) to (l), show the same Dalitz plots asabove but calculated from the partial wave fit. All sig-nificant structures in the Dalitz plots are reasonably wellreproduced. At low energies, for W < 2.05GeV/c2, the
4 The CB-ELSA Collaboration: Study of the reaction γp → pπ0η
2
2.2
2.4
2.6
2.8
3
3.2
1 1.2 1.4 1.6 1.8 2
W < 1.9 GeV
a)
m2(pπ0), GeV2
m2 (p
η), G
eV2
N(1535)
∆(1232)
2
2.2
2.4
2.6
2.8
3
3.2
3.4
3.6
3.8
1 1.2 1.4 1.6 1.8 2 2.2 2.4
1.9 < W < 2.05 GeV
b)
m2(pπ0), GeV2m
2 (pη)
, GeV
2
N(1535)∆(1232)
2
2.5
3
3.5
4
4.5
1 1.25 1.5 1.75 2 2.25 2.5 2.75 3
2.05 < W < 2.25 GeV
c)
m2(pπ0), GeV2
m2 (p
η), G
eV2
N(1535)∆(1232)
2
2.5
3
3.5
4
4.5
5
5.5
1 1.5 2 2.5 3 3.5 4
W > 2.25 GeV
d)
m2(pπ0), GeV2
m2 (p
η), G
eV2
N(1535)
∆(1232)0.4
0.6
0.8
1
1.2
1.4
1.6
1 1.25 1.5 1.75 2 2.25 2.5 2.75 3
2.05 < W < 2.25 GeV
e)
m2(pπ0), GeV2
m2 (π
η), G
eV2
a 0(98
0)
∆(1232)0.4
0.6
0.8
1
1.2
1.4
1.6
1.8
2
2.2
1 1.5 2 2.5 3 3.5 4
W > 2.25 GeV
f)
m2(pπ0), GeV2m
2 (πη)
, GeV
2
a 0(98
0)
∆(1232)
2
2.2
2.4
2.6
2.8
3
3.2
1 1.2 1.4 1.6 1.8 2
W < 1.9 GeV
g)
m2(pπ0), GeV2
m2 (p
η), G
eV2
N(1535)
∆(1232)
2
2.2
2.4
2.6
2.8
3
3.2
3.4
3.6
3.8
1 1.2 1.4 1.6 1.8 2 2.2 2.4
1.9 < W < 2.05 GeV
h)
m2(pπ0), GeV2
m2 (p
η), G
eV2
N(1535)∆(1232)
2
2.5
3
3.5
4
4.5
1 1.25 1.5 1.75 2 2.25 2.5 2.75 3
2.05 < W < 2.25 GeV
i)
m2(pπ0), GeV2
m2 (p
η), G
eV2
N(1535)∆(1232)
2
2.5
3
3.5
4
4.5
5
5.5
1 1.5 2 2.5 3 3.5 4
W > 2.25 GeV
j)
m2(pπ0), GeV2
m2 (p
η), G
eV2
N(1535)
∆(1232)0.4
0.6
0.8
1
1.2
1.4
1.6
1 1.25 1.5 1.75 2 2.25 2.5 2.75 3
2.05 < W < 2.25 GeV
k)
m2(pπ0), GeV2
m2 (π
η), G
eV2
a 0(98
0)
∆(1232)0.4
0.6
0.8
1
1.2
1.4
1.6
1.8
2
2.2
1 1.5 2 2.5 3 3.5 4
W > 2.25 GeV
l)
m2(pπ0), GeV2
m2 (π
η), G
eV2
a 0(98
0)
∆(1232)
Fig. 3. Dalitz plot for the reaction γp → p π0η for various ranges of the total energy, data (a-f). The plots (a-d) show M2(pη)versus M2(pπ0), (e,f) M2(π0η) versus M2(pπ0). With increasing energy, ∆(1232)η and N(1535)π production fill differentkinematical regions and are well separated. N(1535)π is visible only for high photon energies even though the N(1535)πproduction threshold (∼ 1.0GeV) is lower than the ∆(1232)η production threshold (∼ 1.2GeV). The lower part (g-f) showresults of the event-based likelihood fit.
The CB-ELSA Collaboration: Study of the reaction γp → pπ0η 5
0
200
400
600
1.4 1.5 1.6 1.7 1.8 1.9 2 2.1 2.2 2.3 2.4
N /
25 M
eV/c
2
200
400
6001.7< M(γp)< 1.9 GeV/c2
a)
0
200
400
600
1 1.1 1.2 1.3 1.4 1.5 1.6 1.7 1.8 1.9 2
b)
0
200
400
600
0.6 0.7 0.8 0.9 1 1.1 1.2 1.3 1.4 1.5
c)
0
200
400
600
800
1.4 1.5 1.6 1.7 1.8 1.9 2 2.1 2.2 2.3 2.4
200
400
6001.9< M(γp)< 2.1 GeV/c2
d)
0
200
400
600
800
1 1.1 1.2 1.3 1.4 1.5 1.6 1.7 1.8 1.9 2
e)
0
200
400
600
800
0.6 0.7 0.8 0.9 1 1.1 1.2 1.3 1.4 1.5
f)
0
200
400
600
800
1.4 1.5 1.6 1.7 1.8 1.9 2 2.1 2.2 2.3 2.4
M(pη), GeV/c2
0
200
400
6002.1< M(γp)< 2.5 GeV/c2
g)
1.5 20
200
400
600
800
1 1.1 1.2 1.3 1.4 1.5 1.6 1.7 1.8 1.9 2
M(pπ0), GeV/c2
1 1.5
h)
0
200
400
600
800
0.6 0.7 0.8 0.9 1 1.1 1.2 1.3 1.4 1.5
M(π0η), GeV/c2
1 1.5
i)
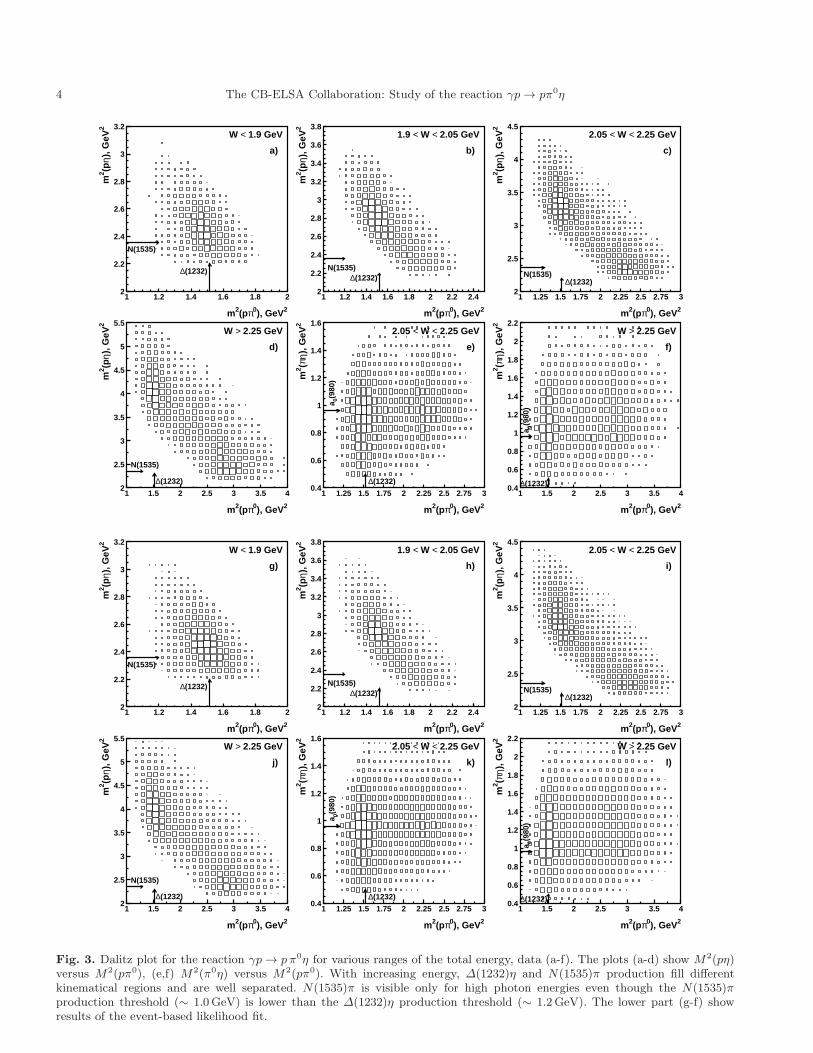
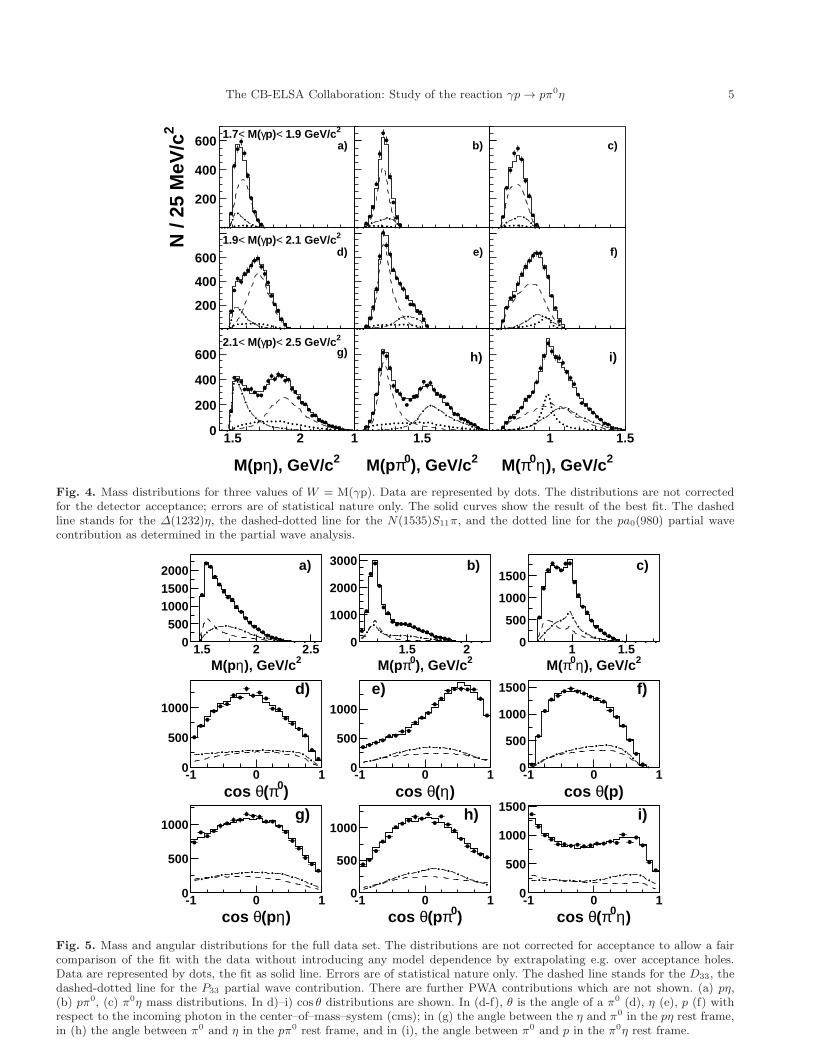
Fig. 4. Mass distributions for three values of W = M(γp). Data are represented by dots. The distributions are not correctedfor the detector acceptance; errors are of statistical nature only. The solid curves show the result of the best fit. The dashedline stands for the ∆(1232)η, the dashed-dotted line for the N(1535)S11π, and the dotted line for the pa0(980) partial wavecontribution as determined in the partial wave analysis.
0500
100015002000
1.5 2 2.5
a)
M(pη), GeV/c2
0
1000
2000
3000
1.5 2
b)
M(pπ0), GeV/c2
0
500
1000
1500
1 1.5
c)
M(π0η), GeV/c2
0
500
1000
-1 0 1
d)
cos θ(π0)
0
500
1000
-1 0 1
e)
cos θ(η)
0
500
1000
1500
-1 0 1
f)
cos θ(p)
0
500
1000
-1 0 1
g)
cos θ(pη)
0
500
1000
-1 0 1
h)
cos θ(pπ0)
0
500
1000
1500
-1 0 1
i)
cos θ(π0η)
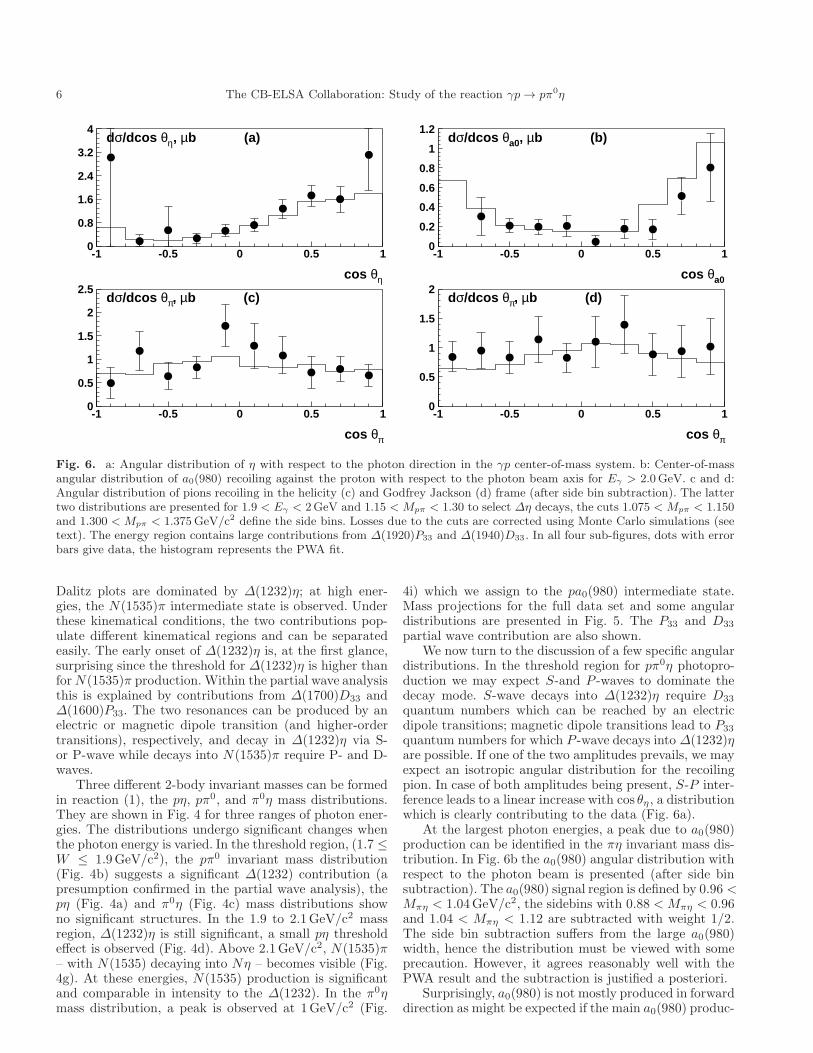
Fig. 5. Mass and angular distributions for the full data set. The distributions are not corrected for acceptance to allow a faircomparison of the fit with the data without introducing any model dependence by extrapolating e.g. over acceptance holes.Data are represented by dots, the fit as solid line. Errors are of statistical nature only. The dashed line stands for the D33, thedashed-dotted line for the P33 partial wave contribution. There are further PWA contributions which are not shown. (a) pη,(b) pπ0, (c) π0η mass distributions. In d)–i) cos θ distributions are shown. In (d-f), θ is the angle of a π0 (d), η (e), p (f) withrespect to the incoming photon in the center–of–mass–system (cms); in (g) the angle between the η and π0 in the pη rest frame,in (h) the angle between π0 and η in the pπ0 rest frame, and in (i), the angle between π0 and p in the π0η rest frame.
6 The CB-ELSA Collaboration: Study of the reaction γp → pπ0η
0
0.8
1.6
2.4
3.2
4
-1 -0.5 0 0.5 1
cos θη
dσ/dcos θη, µb (a)
0
0.2
0.4
0.6
0.8
1
1.2
-1 -0.5 0 0.5 1
cos θa0
dσ/dcos θa0, µb (b)
0
0.5
1
1.5
2
2.5
-1 -0.5 0 0.5 1
cos θπ
dσ/dcos θπ, µb (c)
0
0.5
1
1.5
2
-1 -0.5 0 0.5 1
cos θπ
dσ/dcos θπ, µb (d)
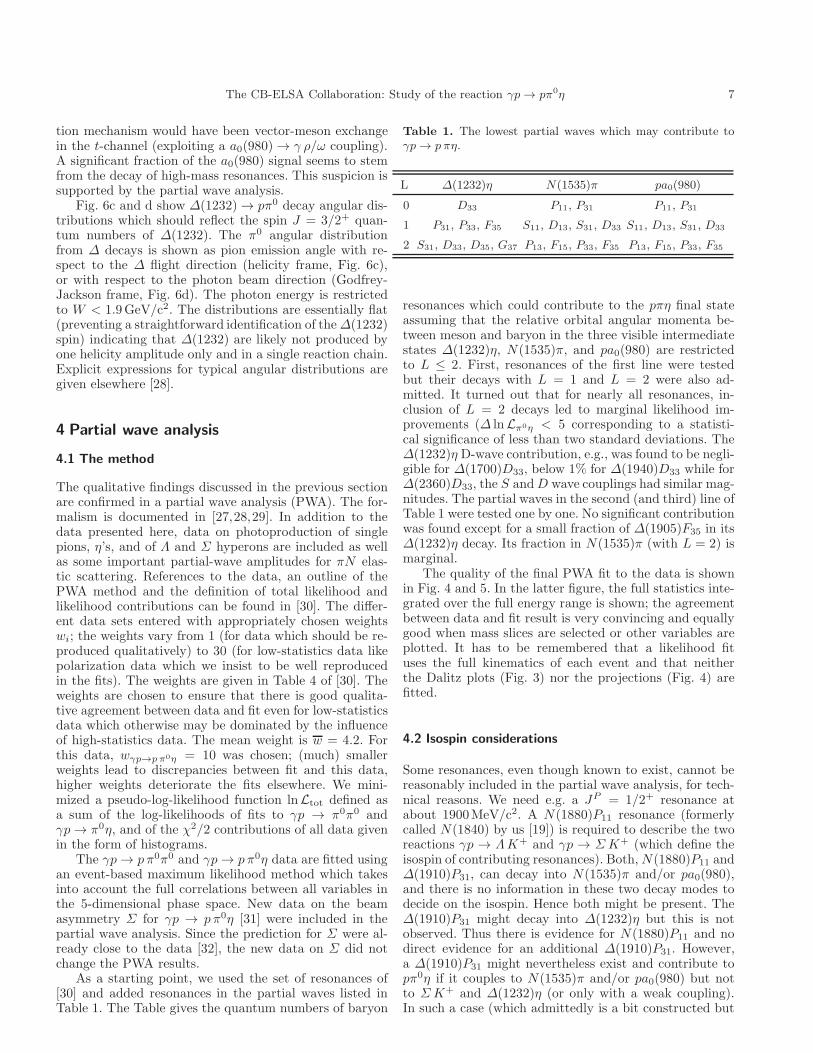
Fig. 6. a: Angular distribution of η with respect to the photon direction in the γp center-of-mass system. b: Center-of-massangular distribution of a0(980) recoiling against the proton with respect to the photon beam axis for Eγ > 2.0GeV. c and d:Angular distribution of pions recoiling in the helicity (c) and Godfrey Jackson (d) frame (after side bin subtraction). The lattertwo distributions are presented for 1.9 < Eγ < 2GeV and 1.15 < Mpπ < 1.30 to select ∆η decays, the cuts 1.075 < Mpπ < 1.150and 1.300 < Mpπ < 1.375GeV/c2 define the side bins. Losses due to the cuts are corrected using Monte Carlo simulations (seetext). The energy region contains large contributions from ∆(1920)P33 and ∆(1940)D33 . In all four sub-figures, dots with errorbars give data, the histogram represents the PWA fit.
Dalitz plots are dominated by ∆(1232)η; at high ener-gies, the N(1535)π intermediate state is observed. Underthese kinematical conditions, the two contributions pop-ulate different kinematical regions and can be separatedeasily. The early onset of ∆(1232)η is, at the first glance,surprising since the threshold for ∆(1232)η is higher thanforN(1535)π production. Within the partial wave analysisthis is explained by contributions from ∆(1700)D33 and∆(1600)P33. The two resonances can be produced by anelectric or magnetic dipole transition (and higher-ordertransitions), respectively, and decay in ∆(1232)η via S-or P-wave while decays into N(1535)π require P- and D-waves.
Three different 2-body invariant masses can be formedin reaction (1), the pη, pπ0, and π0η mass distributions.They are shown in Fig. 4 for three ranges of photon ener-gies. The distributions undergo significant changes whenthe photon energy is varied. In the threshold region, (1.7 ≤W ≤ 1.9GeV/c2), the pπ0 invariant mass distribution(Fig. 4b) suggests a significant ∆(1232) contribution (apresumption confirmed in the partial wave analysis), thepη (Fig. 4a) and π0η (Fig. 4c) mass distributions showno significant structures. In the 1.9 to 2.1GeV/c2 massregion, ∆(1232)η is still significant, a small pη thresholdeffect is observed (Fig. 4d). Above 2.1GeV/c2, N(1535)π– with N(1535) decaying into Nη – becomes visible (Fig.4g). At these energies, N(1535) production is significantand comparable in intensity to the ∆(1232). In the π0ηmass distribution, a peak is observed at 1GeV/c2 (Fig.
4i) which we assign to the pa0(980) intermediate state.Mass projections for the full data set and some angulardistributions are presented in Fig. 5. The P33 and D33
partial wave contribution are also shown.We now turn to the discussion of a few specific angular
distributions. In the threshold region for pπ0η photopro-duction we may expect S-and P -waves to dominate thedecay mode. S-wave decays into ∆(1232)η require D33
quantum numbers which can be reached by an electricdipole transitions; magnetic dipole transitions lead to P33
quantum numbers for which P -wave decays into ∆(1232)ηare possible. If one of the two amplitudes prevails, we mayexpect an isotropic angular distribution for the recoilingpion. In case of both amplitudes being present, S-P inter-ference leads to a linear increase with cos θη, a distributionwhich is clearly contributing to the data (Fig. 6a).
At the largest photon energies, a peak due to a0(980)production can be identified in the πη invariant mass dis-tribution. In Fig. 6b the a0(980) angular distribution withrespect to the photon beam is presented (after side binsubtraction). The a0(980) signal region is defined by 0.96 <Mπη < 1.04GeV/c2, the sidebins with 0.88 < Mπη < 0.96and 1.04 < Mπη < 1.12 are subtracted with weight 1/2.The side bin subtraction suffers from the large a0(980)width, hence the distribution must be viewed with someprecaution. However, it agrees reasonably well with thePWA result and the subtraction is justified a posteriori.
Surprisingly, a0(980) is not mostly produced in forwarddirection as might be expected if the main a0(980) produc-
The CB-ELSA Collaboration: Study of the reaction γp → pπ0η 7
tion mechanism would have been vector-meson exchangein the t-channel (exploiting a a0(980) → γ ρ/ω coupling).A significant fraction of the a0(980) signal seems to stemfrom the decay of high-mass resonances. This suspicion issupported by the partial wave analysis.
Fig. 6c and d show ∆(1232) → pπ0 decay angular dis-tributions which should reflect the spin J = 3/2+ quan-tum numbers of ∆(1232). The π0 angular distributionfrom ∆ decays is shown as pion emission angle with re-spect to the ∆ flight direction (helicity frame, Fig. 6c),or with respect to the photon beam direction (Godfrey-Jackson frame, Fig. 6d). The photon energy is restrictedto W < 1.9GeV/c2. The distributions are essentially flat(preventing a straightforward identification of the∆(1232)spin) indicating that ∆(1232) are likely not produced byone helicity amplitude only and in a single reaction chain.Explicit expressions for typical angular distributions aregiven elsewhere [28].
4 Partial wave analysis
4.1 The method
The qualitative findings discussed in the previous sectionare confirmed in a partial wave analysis (PWA). The for-malism is documented in [27,28,29]. In addition to thedata presented here, data on photoproduction of singlepions, η’s, and of Λ and Σ hyperons are included as wellas some important partial-wave amplitudes for πN elas-tic scattering. References to the data, an outline of thePWA method and the definition of total likelihood andlikelihood contributions can be found in [30]. The differ-ent data sets entered with appropriately chosen weightswi; the weights vary from 1 (for data which should be re-produced qualitatively) to 30 (for low-statistics data likepolarization data which we insist to be well reproducedin the fits). The weights are given in Table 4 of [30]. Theweights are chosen to ensure that there is good qualita-tive agreement between data and fit even for low-statisticsdata which otherwise may be dominated by the influenceof high-statistics data. The mean weight is w = 4.2. Forthis data, wγp→p π0η = 10 was chosen; (much) smallerweights lead to discrepancies between fit and this data,higher weights deteriorate the fits elsewhere. We mini-mized a pseudo-log-likelihood function lnLtot defined asa sum of the log-likelihoods of fits to γp → π0π0 andγp → π0η, and of the χ2/2 contributions of all data givenin the form of histograms.
The γp → p π0π0 and γp → p π0η data are fitted usingan event-based maximum likelihood method which takesinto account the full correlations between all variables inthe 5-dimensional phase space. New data on the beamasymmetry Σ for γp → p π0η [31] were included in thepartial wave analysis. Since the prediction for Σ were al-ready close to the data [32], the new data on Σ did notchange the PWA results.
As a starting point, we used the set of resonances of[30] and added resonances in the partial waves listed inTable 1. The Table gives the quantum numbers of baryon
Table 1. The lowest partial waves which may contribute toγp → p πη.
L ∆(1232)η N(1535)π pa0(980)
0 D33 P11, P31 P11, P31
1 P31, P33, F35 S11, D13, S31, D33 S11, D13, S31, D33
2 S31, D33, D35, G37 P13, F15, P33, F35 P13, F15, P33, F35
resonances which could contribute to the pπη final stateassuming that the relative orbital angular momenta be-tween meson and baryon in the three visible intermediatestates ∆(1232)η, N(1535)π, and pa0(980) are restrictedto L ≤ 2. First, resonances of the first line were testedbut their decays with L = 1 and L = 2 were also ad-mitted. It turned out that for nearly all resonances, in-clusion of L = 2 decays led to marginal likelihood im-provements (∆ lnLπ0η < 5 corresponding to a statisti-cal significance of less than two standard deviations. The∆(1232)η D-wave contribution, e.g., was found to be negli-gible for ∆(1700)D33, below 1% for ∆(1940)D33 while for∆(2360)D33, the S andD wave couplings had similar mag-nitudes. The partial waves in the second (and third) line ofTable 1 were tested one by one. No significant contributionwas found except for a small fraction of ∆(1905)F35 in its∆(1232)η decay. Its fraction in N(1535)π (with L = 2) ismarginal.
The quality of the final PWA fit to the data is shownin Fig. 4 and 5. In the latter figure, the full statistics inte-grated over the full energy range is shown; the agreementbetween data and fit result is very convincing and equallygood when mass slices are selected or other variables areplotted. It has to be remembered that a likelihood fituses the full kinematics of each event and that neitherthe Dalitz plots (Fig. 3) nor the projections (Fig. 4) arefitted.
4.2 Isospin considerations
Some resonances, even though known to exist, cannot bereasonably included in the partial wave analysis, for tech-nical reasons. We need e.g. a JP = 1/2+ resonance atabout 1900MeV/c2. A N(1880)P11 resonance (formerlycalled N(1840) by us [19]) is required to describe the tworeactions γp → ΛK+ and γp → ΣK+ (which define theisospin of contributing resonances). Both,N(1880)P11 and∆(1910)P31, can decay into N(1535)π and/or pa0(980),and there is no information in these two decay modes todecide on the isospin. Hence both might be present. The∆(1910)P31 might decay into ∆(1232)η but this is notobserved. Thus there is evidence for N(1880)P11 and nodirect evidence for an additional ∆(1910)P31. However,a ∆(1910)P31 might nevertheless exist and contribute topπ0η if it couples to N(1535)π and/or pa0(980) but notto ΣK+ and ∆(1232)η (or only with a weak coupling).In such a case (which admittedly is a bit constructed but
8 The CB-ELSA Collaboration: Study of the reaction γp → pπ0η
0
1
2
3
4
5
1.6 1.8 2 2.2 2.4 1.6M(γp), GeV/c2
σ tot ,
µb
a)
1
23
1.6 1.8 2 2.2 2.4 2.6M(γp), GeV/c2
b)
4 5
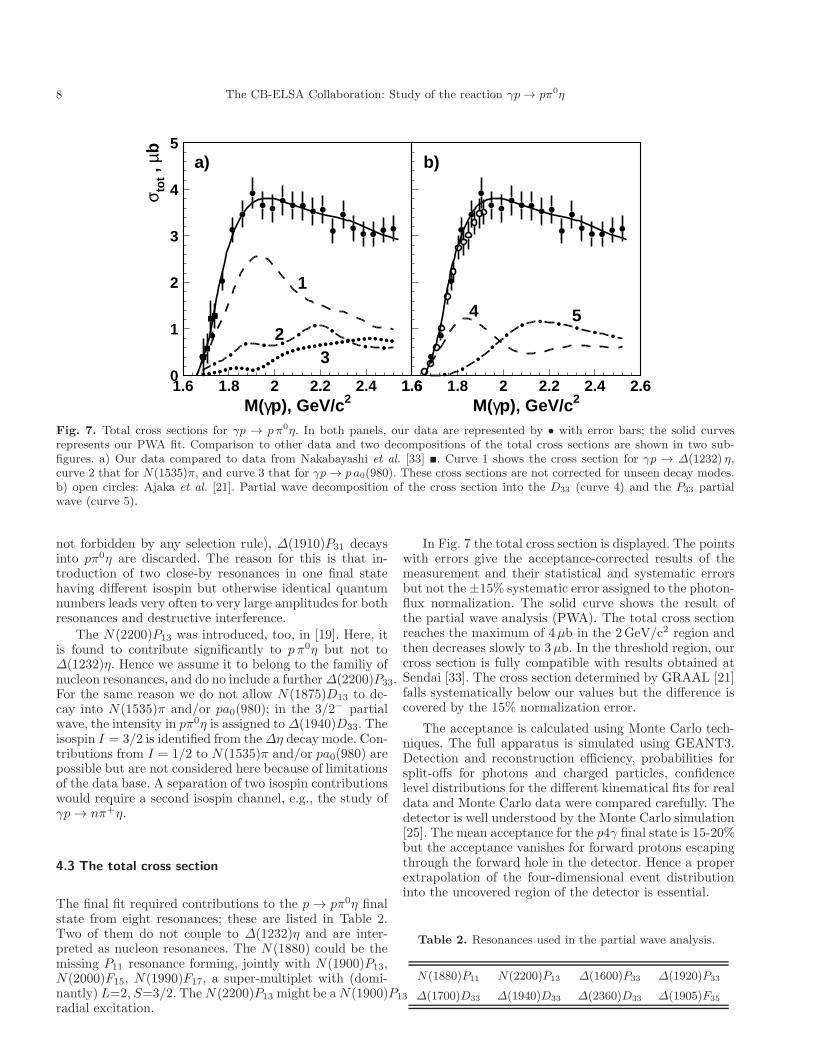
Fig. 7. Total cross sections for γp → p π0η. In both panels, our data are represented by • with error bars; the solid curvesrepresents our PWA fit. Comparison to other data and two decompositions of the total cross sections are shown in two sub-figures. a) Our data compared to data from Nakabayashi et al. [33] �. Curve 1 shows the cross section for γp → ∆(1232) η,curve 2 that for N(1535)π, and curve 3 that for γp → p a0(980). These cross sections are not corrected for unseen decay modes.b) open circles: Ajaka et al. [21]. Partial wave decomposition of the cross section into the D33 (curve 4) and the P33 partialwave (curve 5).
not forbidden by any selection rule), ∆(1910)P31 decaysinto pπ0η are discarded. The reason for this is that in-troduction of two close-by resonances in one final statehaving different isospin but otherwise identical quantumnumbers leads very often to very large amplitudes for bothresonances and destructive interference.
The N(2200)P13 was introduced, too, in [19]. Here, itis found to contribute significantly to p π0η but not to∆(1232)η. Hence we assume it to belong to the familiy ofnucleon resonances, and do no include a further∆(2200)P33.For the same reason we do not allow N(1875)D13 to de-cay into N(1535)π and/or pa0(980); in the 3/2− partialwave, the intensity in pπ0η is assigned to∆(1940)D33. Theisospin I = 3/2 is identified from the∆η decay mode. Con-tributions from I = 1/2 to N(1535)π and/or pa0(980) arepossible but are not considered here because of limitationsof the data base. A separation of two isospin contributionswould require a second isospin channel, e.g., the study ofγp → nπ+η.
4.3 The total cross section
The final fit required contributions to the p → pπ0η finalstate from eight resonances; these are listed in Table 2.Two of them do not couple to ∆(1232)η and are inter-preted as nucleon resonances. The N(1880) could be themissing P11 resonance forming, jointly with N(1900)P13,N(2000)F15, N(1990)F17, a super-multiplet with (domi-nantly) L=2, S=3/2. TheN(2200)P13 might be aN(1900)P13
radial excitation.
In Fig. 7 the total cross section is displayed. The pointswith errors give the acceptance-corrected results of themeasurement and their statistical and systematic errorsbut not the ±15% systematic error assigned to the photon-flux normalization. The solid curve shows the result ofthe partial wave analysis (PWA). The total cross sectionreaches the maximum of 4µb in the 2GeV/c2 region andthen decreases slowly to 3µb. In the threshold region, ourcross section is fully compatible with results obtained atSendai [33]. The cross section determined by GRAAL [21]falls systematically below our values but the difference iscovered by the 15% normalization error.
The acceptance is calculated using Monte Carlo tech-niques. The full apparatus is simulated using GEANT3.Detection and reconstruction efficiency, probabilities forsplit-offs for photons and charged particles, confidencelevel distributions for the different kinematical fits for realdata and Monte Carlo data were compared carefully. Thedetector is well understood by the Monte Carlo simulation[25]. The mean acceptance for the p4γ final state is 15-20%but the acceptance vanishes for forward protons escapingthrough the forward hole in the detector. Hence a properextrapolation of the four-dimensional event distributioninto the uncovered region of the detector is essential.
Table 2. Resonances used in the partial wave analysis.
N(1880)P11 N(2200)P13 ∆(1600)P33 ∆(1920)P33
∆(1700)D33 ∆(1940)D33 ∆(2360)D33 ∆(1905)F35
The CB-ELSA Collaboration: Study of the reaction γp → pπ0η 9
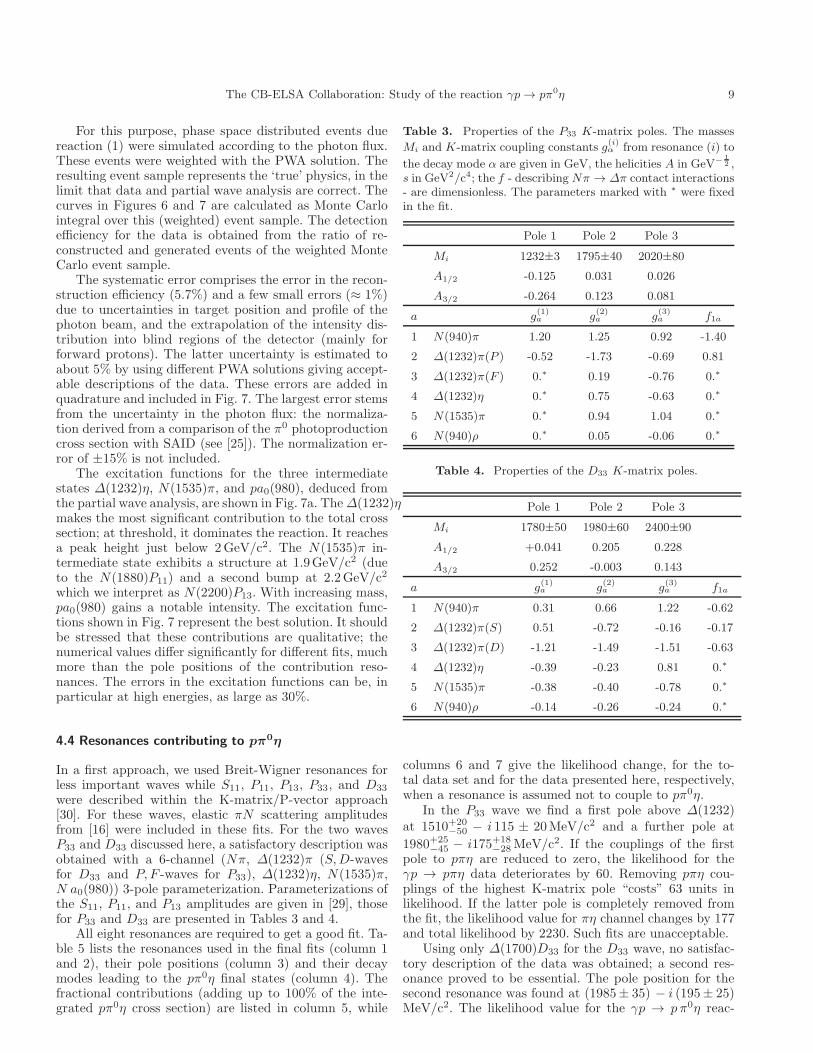
For this purpose, phase space distributed events duereaction (1) were simulated according to the photon flux.These events were weighted with the PWA solution. Theresulting event sample represents the ‘true’ physics, in thelimit that data and partial wave analysis are correct. Thecurves in Figures 6 and 7 are calculated as Monte Carlointegral over this (weighted) event sample. The detectionefficiency for the data is obtained from the ratio of re-constructed and generated events of the weighted MonteCarlo event sample.
The systematic error comprises the error in the recon-struction efficiency (5.7%) and a few small errors (≈ 1%)due to uncertainties in target position and profile of thephoton beam, and the extrapolation of the intensity dis-tribution into blind regions of the detector (mainly forforward protons). The latter uncertainty is estimated toabout 5% by using different PWA solutions giving accept-able descriptions of the data. These errors are added inquadrature and included in Fig. 7. The largest error stemsfrom the uncertainty in the photon flux: the normaliza-tion derived from a comparison of the π0 photoproductioncross section with SAID (see [25]). The normalization er-ror of ±15% is not included.
The excitation functions for the three intermediatestates ∆(1232)η, N(1535)π, and pa0(980), deduced fromthe partial wave analysis, are shown in Fig. 7a. The∆(1232)ηmakes the most significant contribution to the total crosssection; at threshold, it dominates the reaction. It reachesa peak height just below 2GeV/c2. The N(1535)π in-termediate state exhibits a structure at 1.9GeV/c2 (dueto the N(1880)P11) and a second bump at 2.2GeV/c2
which we interpret as N(2200)P13. With increasing mass,pa0(980) gains a notable intensity. The excitation func-tions shown in Fig. 7 represent the best solution. It shouldbe stressed that these contributions are qualitative; thenumerical values differ significantly for different fits, muchmore than the pole positions of the contribution reso-nances. The errors in the excitation functions can be, inparticular at high energies, as large as 30%.
4.4 Resonances contributing to pπ0η
In a first approach, we used Breit-Wigner resonances forless important waves while S11, P11, P13, P33, and D33
were described within the K-matrix/P-vector approach[30]. For these waves, elastic πN scattering amplitudesfrom [16] were included in these fits. For the two wavesP33 and D33 discussed here, a satisfactory description wasobtained with a 6-channel (Nπ, ∆(1232)π (S,D-wavesfor D33 and P, F -waves for P33), ∆(1232)η, N(1535)π,N a0(980)) 3-pole parameterization. Parameterizations ofthe S11, P11, and P13 amplitudes are given in [29], thosefor P33 and D33 are presented in Tables 3 and 4.
All eight resonances are required to get a good fit. Ta-ble 5 lists the resonances used in the final fits (column 1and 2), their pole positions (column 3) and their decaymodes leading to the pπ0η final states (column 4). Thefractional contributions (adding up to 100% of the inte-grated pπ0η cross section) are listed in column 5, while
Table 3. Properties of the P33 K-matrix poles. The masses
Mi and K-matrix coupling constants g(i)α from resonance (i) to
the decay mode α are given in GeV, the helicities A in GeV−1
2 ,s in GeV2/c4; the f - describing Nπ → ∆π contact interactions- are dimensionless. The parameters marked with ∗ were fixedin the fit.
Pole 1 Pole 2 Pole 3
Mi 1232±3 1795±40 2020±80
A1/2 -0.125 0.031 0.026
A3/2 -0.264 0.123 0.081
a g(1)a g
(2)a g
(3)a f1a
1 N(940)π 1.20 1.25 0.92 -1.40
2 ∆(1232)π(P ) -0.52 -1.73 -0.69 0.81
3 ∆(1232)π(F ) 0.∗ 0.19 -0.76 0.∗
4 ∆(1232)η 0.∗ 0.75 -0.63 0.∗
5 N(1535)π 0.∗ 0.94 1.04 0.∗
6 N(940)ρ 0.∗ 0.05 -0.06 0.∗
Table 4. Properties of the D33 K-matrix poles.
Pole 1 Pole 2 Pole 3
Mi 1780±50 1980±60 2400±90
A1/2 +0.041 0.205 0.228
A3/2 0.252 -0.003 0.143
a g(1)a g
(2)a g
(3)a f1a
1 N(940)π 0.31 0.66 1.22 -0.62
2 ∆(1232)π(S) 0.51 -0.72 -0.16 -0.17
3 ∆(1232)π(D) -1.21 -1.49 -1.51 -0.63
4 ∆(1232)η -0.39 -0.23 0.81 0.∗
5 N(1535)π -0.38 -0.40 -0.78 0.∗
6 N(940)ρ -0.14 -0.26 -0.24 0.∗
columns 6 and 7 give the likelihood change, for the to-tal data set and for the data presented here, respectively,when a resonance is assumed not to couple to pπ0η.
In the P33 wave we find a first pole above ∆(1232)at 1510+20
−50 − i 115 ± 20MeV/c2 and a further pole at
1980+25−45 − i175+18
−28MeV/c2. If the couplings of the firstpole to pπη are reduced to zero, the likelihood for theγp → pπη data deteriorates by 60. Removing pπη cou-plings of the highest K-matrix pole “costs” 63 units inlikelihood. If the latter pole is completely removed fromthe fit, the likelihood value for πη channel changes by 177and total likelihood by 2230. Such fits are unacceptable.
Using only ∆(1700)D33 for the D33 wave, no satisfac-tory description of the data was obtained; a second res-onance proved to be essential. The pole position for thesecond resonance was found at (1985± 35) − i (195± 25)MeV/c2. The likelihood value for the γp → p π0η reac-
10 The CB-ELSA Collaboration: Study of the reaction γp → pπ0η
-0.6
-0.4
-0.2
0
0.2
0.4
0.6
1 1.5 2
P33 Re T
-0.2
0
0.2
0.4
0.6
0.8
1
1 1.5 2
P33 Im T
-0.3
-0.2
-0.1
0
0.1
1 1.5 2
D33 Re T
-0.1
0
0.1
0.2
0.3
0.4
1 1.5 2
M(πN), GeV/c2
D33 Im T
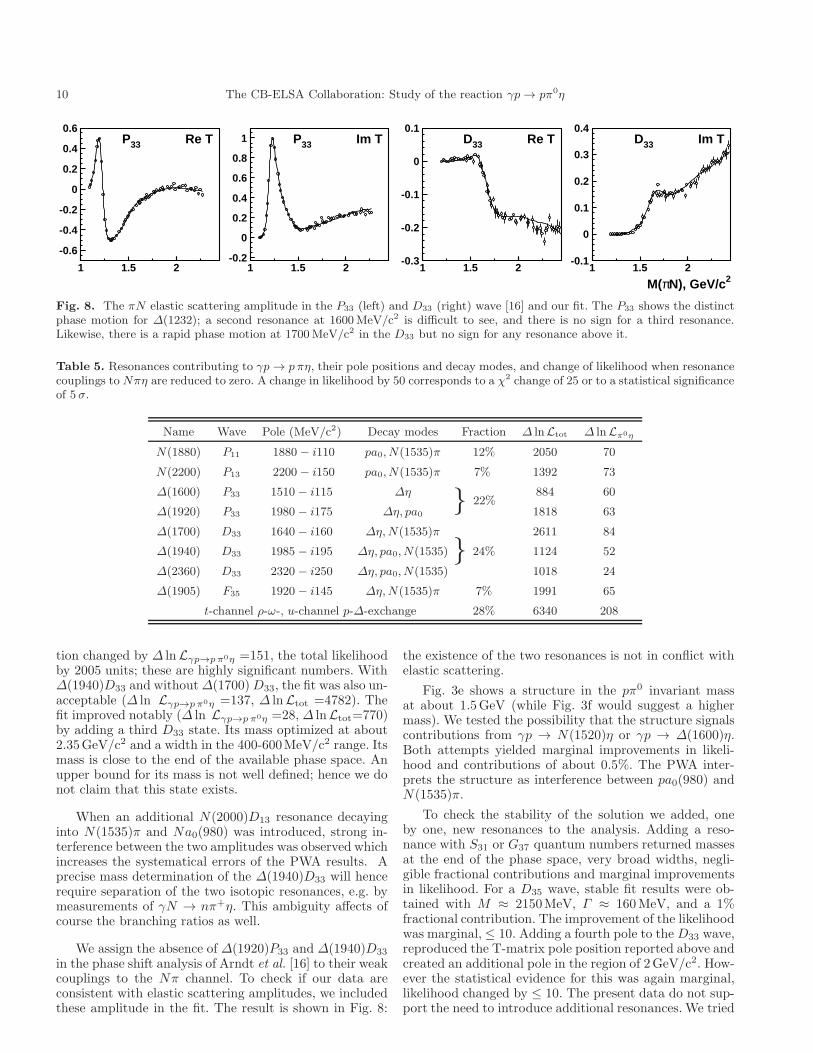
Fig. 8. The πN elastic scattering amplitude in the P33 (left) and D33 (right) wave [16] and our fit. The P33 shows the distinctphase motion for ∆(1232); a second resonance at 1600MeV/c2 is difficult to see, and there is no sign for a third resonance.Likewise, there is a rapid phase motion at 1700MeV/c2 in the D33 but no sign for any resonance above it.
Table 5. Resonances contributing to γp → p πη, their pole positions and decay modes, and change of likelihood when resonancecouplings to Nπη are reduced to zero. A change in likelihood by 50 corresponds to a χ2 change of 25 or to a statistical significanceof 5 σ.
Name Wave Pole (MeV/c2) Decay modes Fraction ∆ lnLtot ∆ lnLπ0η
N(1880) P11 1880 − i110 pa0, N(1535)π 12% 2050 70
N(2200) P13 2200 − i150 pa0, N(1535)π 7% 1392 73
∆(1600) P33 1510 − i115 ∆η } 22%884 60
∆(1920) P33 1980 − i175 ∆η, pa0 1818 63
∆(1700) D33 1640 − i160 ∆η,N(1535)π
}2611 84
∆(1940) D33 1985 − i195 ∆η, pa0, N(1535) 24% 1124 52
∆(2360) D33 2320 − i250 ∆η, pa0, N(1535) 1018 24
∆(1905) F35 1920 − i145 ∆η,N(1535)π 7% 1991 65
t-channel ρ-ω-, u-channel p-∆-exchange 28% 6340 208
tion changed by ∆ lnLγp→pπ0η =151, the total likelihoodby 2005 units; these are highly significant numbers. With∆(1940)D33 and without∆(1700)D33, the fit was also un-acceptable (∆ ln Lγp→pπ0η =137, ∆ lnLtot =4782). Thefit improved notably (∆ ln Lγp→p π0η =28, ∆ lnLtot=770)by adding a third D33 state. Its mass optimized at about2.35GeV/c2 and a width in the 400-600MeV/c2 range. Itsmass is close to the end of the available phase space. Anupper bound for its mass is not well defined; hence we donot claim that this state exists.
When an additional N(2000)D13 resonance decayinginto N(1535)π and Na0(980) was introduced, strong in-terference between the two amplitudes was observed whichincreases the systematical errors of the PWA results. Aprecise mass determination of the ∆(1940)D33 will hencerequire separation of the two isotopic resonances, e.g. bymeasurements of γN → nπ+η. This ambiguity affects ofcourse the branching ratios as well.
We assign the absence of ∆(1920)P33 and ∆(1940)D33
in the phase shift analysis of Arndt et al. [16] to their weakcouplings to the Nπ channel. To check if our data areconsistent with elastic scattering amplitudes, we includedthese amplitude in the fit. The result is shown in Fig. 8:
the existence of the two resonances is not in conflict withelastic scattering.
Fig. 3e shows a structure in the pπ0 invariant massat about 1.5GeV (while Fig. 3f would suggest a highermass). We tested the possibility that the structure signalscontributions from γp → N(1520)η or γp → ∆(1600)η.Both attempts yielded marginal improvements in likeli-hood and contributions of about 0.5%. The PWA inter-prets the structure as interference between pa0(980) andN(1535)π.
To check the stability of the solution we added, oneby one, new resonances to the analysis. Adding a reso-nance with S31 or G37 quantum numbers returned massesat the end of the phase space, very broad widths, negli-gible fractional contributions and marginal improvementsin likelihood. For a D35 wave, stable fit results were ob-tained with M ≈ 2150MeV, Γ ≈ 160MeV, and a 1%fractional contribution. The improvement of the likelihoodwas marginal,≤ 10. Adding a fourth pole to the D33 wave,reproduced the T-matrix pole position reported above andcreated an additional pole in the region of 2GeV/c2. How-ever the statistical evidence for this was again marginal,likelihood changed by ≤ 10. The present data do not sup-port the need to introduce additional resonances. We tried
The CB-ELSA Collaboration: Study of the reaction γp → pπ0η 11
to improve the fits by adding decays of ∆(2360)D33 into∆(1600)P33η or N(2200)P13 → N(1710)η. The statisticalsignificance for these transition was weak, and the frac-tional contribution to the data stayed below 0.5%.
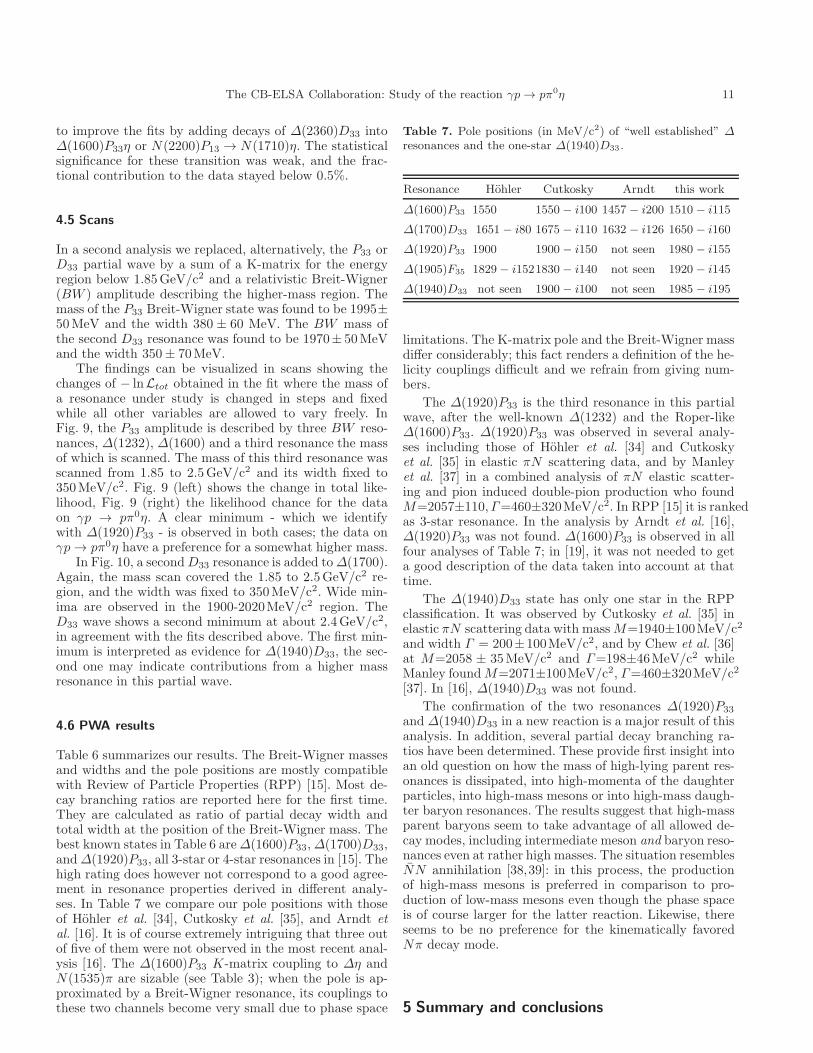
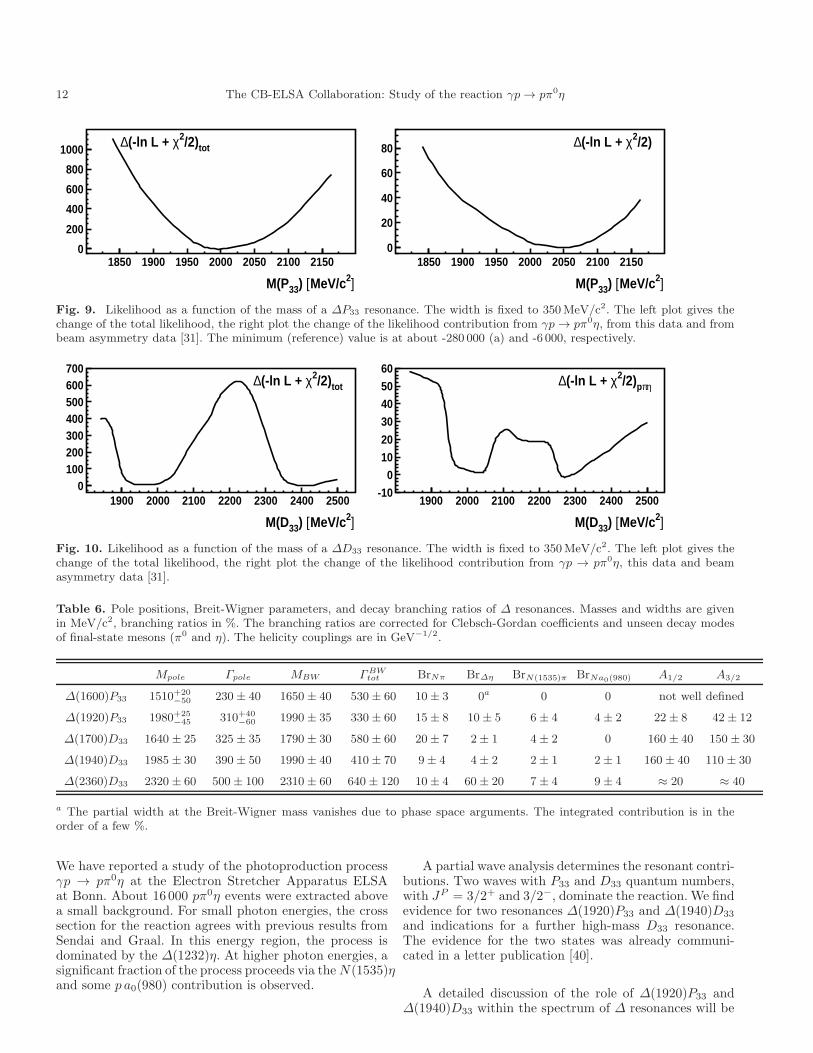
4.5 Scans
In a second analysis we replaced, alternatively, the P33 orD33 partial wave by a sum of a K-matrix for the energyregion below 1.85GeV/c2 and a relativistic Breit-Wigner(BW ) amplitude describing the higher-mass region. Themass of the P33 Breit-Wigner state was found to be 1995±50MeV and the width 380 ± 60 MeV. The BW mass ofthe second D33 resonance was found to be 1970± 50MeVand the width 350± 70MeV.
The findings can be visualized in scans showing thechanges of − lnLtot obtained in the fit where the mass ofa resonance under study is changed in steps and fixedwhile all other variables are allowed to vary freely. InFig. 9, the P33 amplitude is described by three BW reso-nances, ∆(1232), ∆(1600) and a third resonance the massof which is scanned. The mass of this third resonance wasscanned from 1.85 to 2.5GeV/c2 and its width fixed to350MeV/c2. Fig. 9 (left) shows the change in total like-lihood, Fig. 9 (right) the likelihood chance for the dataon γp → pπ0η. A clear minimum - which we identifywith ∆(1920)P33 - is observed in both cases; the data onγp → pπ0η have a preference for a somewhat higher mass.
In Fig. 10, a secondD33 resonance is added to∆(1700).Again, the mass scan covered the 1.85 to 2.5GeV/c2 re-gion, and the width was fixed to 350MeV/c2. Wide min-ima are observed in the 1900-2020MeV/c2 region. TheD33 wave shows a second minimum at about 2.4GeV/c2,in agreement with the fits described above. The first min-imum is interpreted as evidence for ∆(1940)D33, the sec-ond one may indicate contributions from a higher massresonance in this partial wave.
4.6 PWA results
Table 6 summarizes our results. The Breit-Wigner massesand widths and the pole positions are mostly compatiblewith Review of Particle Properties (RPP) [15]. Most de-cay branching ratios are reported here for the first time.They are calculated as ratio of partial decay width andtotal width at the position of the Breit-Wigner mass. Thebest known states in Table 6 are∆(1600)P33,∆(1700)D33,and∆(1920)P33, all 3-star or 4-star resonances in [15]. Thehigh rating does however not correspond to a good agree-ment in resonance properties derived in different analy-ses. In Table 7 we compare our pole positions with thoseof Hohler et al. [34], Cutkosky et al. [35], and Arndt etal. [16]. It is of course extremely intriguing that three outof five of them were not observed in the most recent anal-ysis [16]. The ∆(1600)P33 K-matrix coupling to ∆η andN(1535)π are sizable (see Table 3); when the pole is ap-proximated by a Breit-Wigner resonance, its couplings tothese two channels become very small due to phase space
Table 7. Pole positions (in MeV/c2) of “well established” ∆
resonances and the one-star ∆(1940)D33 .
Resonance Hohler Cutkosky Arndt this work
∆(1600)P33 1550 1550− i100 1457 − i200 1510 − i115
∆(1700)D33 1651− i80 1675− i110 1632 − i126 1650 − i160
∆(1920)P33 1900 1900− i150 not seen 1980 − i155
∆(1905)F35 1829− i1521830− i140 not seen 1920 − i145
∆(1940)D33 not seen 1900− i100 not seen 1985 − i195
limitations. The K-matrix pole and the Breit-Wigner massdiffer considerably; this fact renders a definition of the he-licity couplings difficult and we refrain from giving num-bers.
The ∆(1920)P33 is the third resonance in this partialwave, after the well-known ∆(1232) and the Roper-like∆(1600)P33. ∆(1920)P33 was observed in several analy-ses including those of Hohler et al. [34] and Cutkoskyet al. [35] in elastic πN scattering data, and by Manleyet al. [37] in a combined analysis of πN elastic scatter-ing and pion induced double-pion production who foundM=2057±110,Γ=460±320MeV/c2. In RPP [15] it is rankedas 3-star resonance. In the analysis by Arndt et al. [16],∆(1920)P33 was not found. ∆(1600)P33 is observed in allfour analyses of Table 7; in [19], it was not needed to geta good description of the data taken into account at thattime.
The ∆(1940)D33 state has only one star in the RPPclassification. It was observed by Cutkosky et al. [35] inelastic πN scattering data with massM=1940±100MeV/c2
and width Γ = 200±100MeV/c2, and by Chew et al. [36]at M=2058 ± 35MeV/c2 and Γ=198±46MeV/c2 whileManley foundM=2071±100MeV/c2, Γ=460±320MeV/c2
[37]. In [16], ∆(1940)D33 was not found.
The confirmation of the two resonances ∆(1920)P33
and ∆(1940)D33 in a new reaction is a major result of thisanalysis. In addition, several partial decay branching ra-tios have been determined. These provide first insight intoan old question on how the mass of high-lying parent res-onances is dissipated, into high-momenta of the daughterparticles, into high-mass mesons or into high-mass daugh-ter baryon resonances. The results suggest that high-massparent baryons seem to take advantage of all allowed de-cay modes, including intermediate meson and baryon reso-nances even at rather high masses. The situation resemblesNN annihilation [38,39]: in this process, the productionof high-mass mesons is preferred in comparison to pro-duction of low-mass mesons even though the phase spaceis of course larger for the latter reaction. Likewise, thereseems to be no preference for the kinematically favoredNπ decay mode.
5 Summary and conclusions
12 The CB-ELSA Collaboration: Study of the reaction γp → pπ0η
0
200
400
600
800
1000
1850 1900 1950 2000 2050 2100 2150
M(P33) [MeV/c2]
∆(-ln L + χ2/2)tot
0
20
40
60
80
1850 1900 1950 2000 2050 2100 2150
M(P33) [MeV/c2]
∆(-ln L + χ2/2)
Fig. 9. Likelihood as a function of the mass of a ∆P33 resonance. The width is fixed to 350MeV/c2. The left plot gives thechange of the total likelihood, the right plot the change of the likelihood contribution from γp → pπ0η, from this data and frombeam asymmetry data [31]. The minimum (reference) value is at about -280 000 (a) and -6 000, respectively.
0100200300400500600700
1900 2000 2100 2200 2300 2400 2500
M(D33) [MeV/c2]
∆(-ln L + χ2/2)tot
-100
1020
30405060
1900 2000 2100 2200 2300 2400 2500
M(D33) [MeV/c2]
∆(-ln L + χ2/2)pπη
Fig. 10. Likelihood as a function of the mass of a ∆D33 resonance. The width is fixed to 350MeV/c2. The left plot gives thechange of the total likelihood, the right plot the change of the likelihood contribution from γp → pπ0η, this data and beamasymmetry data [31].
Table 6. Pole positions, Breit-Wigner parameters, and decay branching ratios of ∆ resonances. Masses and widths are givenin MeV/c2, branching ratios in %. The branching ratios are corrected for Clebsch-Gordan coefficients and unseen decay modesof final-state mesons (π0 and η). The helicity couplings are in GeV−1/2.
Mpole Γpole MBW ΓBWtot BrNπ Br∆η BrN(1535)π BrNa0(980) A1/2 A3/2
∆(1600)P33 1510+20−50 230± 40 1650± 40 530± 60 10± 3 0a 0 0 not well defined
∆(1920)P33 1980+25−45 310+40
−60 1990± 35 330± 60 15± 8 10± 5 6± 4 4± 2 22± 8 42± 12
∆(1700)D33 1640 ± 25 325± 35 1790± 30 580± 60 20± 7 2± 1 4± 2 0 160 ± 40 150± 30
∆(1940)D33 1985 ± 30 390± 50 1990± 40 410± 70 9± 4 4± 2 2± 1 2± 1 160± 40 110± 30
∆(2360)D33 2320 ± 60 500± 100 2310± 60 640± 120 10± 4 60± 20 7± 4 9± 4 ≈ 20 ≈ 40
a The partial width at the Breit-Wigner mass vanishes due to phase space arguments. The integrated contribution is in theorder of a few %.
We have reported a study of the photoproduction processγp → pπ0η at the Electron Stretcher Apparatus ELSAat Bonn. About 16 000 pπ0η events were extracted abovea small background. For small photon energies, the crosssection for the reaction agrees with previous results fromSendai and Graal. In this energy region, the process isdominated by the ∆(1232)η. At higher photon energies, asignificant fraction of the process proceeds via theN(1535)ηand some p a0(980) contribution is observed.
A partial wave analysis determines the resonant contri-butions. Two waves with P33 and D33 quantum numbers,with JP = 3/2+ and 3/2−, dominate the reaction. We findevidence for two resonances ∆(1920)P33 and ∆(1940)D33
and indications for a further high-mass D33 resonance.The evidence for the two states was already communi-cated in a letter publication [40].
A detailed discussion of the role of ∆(1920)P33 and∆(1940)D33 within the spectrum of ∆ resonances will be
The CB-ELSA Collaboration: Study of the reaction γp → pπ0η 13
given elsewhere [41]. Here we just mention the main re-sults.
1. In [41], the 3 negative parity resonances ∆(1900)S31,∆(1940)D33, and∆(1930)D35 are interpreted as tripletof resonances with L = 1, S = 3/2, N = 1 coupling toJ = 1/2, 3/2, 5/2 and belonging to the (D,LP
N)S =(56, 1−3 ) 3/2 supermultiplet. Alternatively, ∆(1900)S31
and ∆(1940)D33 could be a L = 1, S = 1/2, N =1 doublet, and ∆(1930)D35 and ∆(2200)G37 a L =3, S = 1/2 doublet. The mass of the triplet is ratherlow compared to quark model predictions [1,2] whilethe ∆(2200)G37 mass is perfectly compatible with themodels.
2. The two resonances∆(1920)P33 and ∆(1940)D33 forma parity doublet [42]. Parity doublets are of topical in-terests, we refer the reader to two recent reviews [44,45]. In the latter review, there is a written requestto search for the doublet reported here. The conjec-ture that the reason for the mass degeneracy is due toa restoration of chiral symmetry in high-mass baryonstates falls of course outside of experimental observ-ability, and the interpretation is controversially dis-cussed [46,47,48].
3. All masses in the ∆ spectrum are perfectly compatiblewith models based on AdS/QCD when confinement ismodeled by a soft wall in the holographic variable [12].The hard wall approximation [11] gives a good generalsurvey but fails in important details.
Acknowledgement
We would like to thank the technical staff of ELSA and ofthe participating institutions for their invaluable contri-butions to the success of the experiment. We acknowledgefinancial support from the Deutsche Forschungsgemein-schaft (DFG-TR16) and the Schweizerische Nationalfond.The collaboration with St. Petersburg received funds fromDFG and RFBR. This work comprises part of the thesisof I. Horn.
References
1. S. Capstick, N. Isgur, Phys. Rev. D 34 (1986) 2809.2. U. Loring, B. C. Metsch and H. R. Petry, Eur. Phys. J. A
10 (2001) 395, 447.3. L. Y. Glozman, W. Plessas, K. Varga and R. F. Wagen-
brunn, Phys. Rev. D 58 (1998) 094030.4. M. Anselmino, E. Predazzi, S. Ekelin, S. Fredriksson and
D.B. Lichtenberg, Rev. Mod. Phys. 65 (1993) 1199.5. M. Kirchbach, M. Moshinsky and Yu. F. Smirnov, Phys.
Rev. D 64 (2001) 114005.6. E. Santopinto, Phys. Rev. C 72 (2005) 022201.7. J. M. Maldacena, Adv. Theor. Math. Phys. 2 (1998) 231
[Int. J. Theor. Phys. 38 (1999) 1113].8. E. Witten, Adv. Theor. Math. Phys. 2 (1998) 253.9. I.R. Klebanov, arXiv:hep-th/0009139.
10. A. Karch, E. Katz, D. T. Son and M. A. Stephanov, Phys.Rev. D 74 (2006) 015005.
11. S.J. Brodsky, Eur. Phys. J. A 31 (2007) 638.12. H. Forkel, M. Beyer and T. Frederico, JHEP 0707 (2007)
077.13. H. Forkel, M. Beyer and T. Frederico, Int. J. Mod. Phys.
E 16 (2007) 2794.14. S. Basak et al., Phys. Rev. D 76 (2007) 074504.15. W.M. Yao et al., J. Phys. G 33 (2006) 1 and 2007 partial
update for the 2008 edition.16. R. A. Arndt, W.J. Briscoe, I.I. Strakovsky and R.L. Work-
man, Phys. Rev. C 74 (2006) 045205.17. B. Metsch, private communication, 2007.18. A. V. Anisovich, A. Sarantsev, O. Bartholomy, E. Klempt,
V. A. Nikonov and U. Thoma, Eur. Phys. J. A 25 (2005)427.
19. A. V. Sarantsev, V. A. Nikonov, A. V. Anisovich,E. Klempt and U. Thoma, Eur. Phys. J. A 25 (2005) 441.
20. B.M.K. Nefkens, PiN Newslett. 13 (1997) 270.21. J. Ajaka et al., Phys. Rev. Lett. 100 (2008) 052003.22. W. Hillert, Eur. Phys. J. A 28S1 (2006) 139.23. E. Aker et al., Nucl. Instrum. Meth. A 321 (1992) 69.24. U. Thoma et al., Phys. Lett. B 659 (2008) 87.25. H. van Pee et al. [CB-ELSA Collaboration], Eur. Phys. J.
A 31 (2007) 61 [arXiv:0704.1776 [nucl-ex]].26. G. Suft et al., Nucl. Instrum. Meth. A 538 (2005) 416.27. A.V. Anisovich, E. Klempt, A.V. Sarantsev and U. Thoma,
Eur. Phys. J. A 24 (2005) 111.28. A.V. Anisovich and A.V. Sarantsev, Eur. Phys. J. A 30
(2006) 427.29. A.V. Anisovich, V.V. Anisovich, E. Klempt, V.A. Nikonov
and A.V. Sarantsev, Eur. Phys. J. A 34 (2007) 129152.30. A.V. Anisovich, V. Kleber, E. Klempt, V.A. Nikonov,
A.V. Sarantsev and U. Thoma, Eur. Phys. J. A 34 (2007)243.
31. E. Gutz et al., “The photon beam asymmetry for the re-action γp → pπ0η”, in preparation.
32. E. Gutz et al., Eur. Phys. J. A 35 (2008) 291.33. T. Nakabayashi et al., Phys. Rev. C 74 (2006) 035202.34. G. Hohler, F. Kaiser, R. Koch and E. Pietarinen, “Hand-
book Of Pion Nucleon Scattering,” Published by Fachin-form. Zentr. Karlsruhe 1979, 440 P. (Physics Data, No.12-1(1979)).
35. R.E. Cutkosky , C.P. Forsyth, J.B. Babcock, R.L. Kellyand R.E. Hendrick, “Pion - Nucleon Partial Wave Anal-ysis,” 4th Int. Conf. on Baryon Resonances, Toronto,Canada, July 14-16, 1980. QCD161:C45:1980.
36. D.M. Chew, “New∆ Parameters From A Simpler, CheaperAnd More Reliable πN Partial Wave Analysis”, 4th Int.Conf. on Baryon Resonances, Toronto, Canada, July 14-16, 1980. QCD161:C45:1980.
37. D.M. Manley, E.M. Saleski, Phys. Rev. D 45 (1992) 4002.38. J. Vandermeulen, Z. Phys. C 37 (1988) 563.39. E. Klempt, C. Batty and J.M. Richard, Phys. Rept. 413
(2005) 197.40. I. Horn et al., “Evidence for a parity doublet ∆(1920)P33
and ∆(1940)D33 from γp → pπ0η”, submitted to PRL.41. E. Klempt, “∆ resonances: quark models, chiral symmetry
and AdS/QCD”, accompanying paper.42. L.Y. Glozman, Phys. Lett. B 475 (2000) 329.43. T. D. Cohen and L. Y. Glozman, Phys. Rev. D 65 (2002)
016006 [arXiv:hep-ph/0102206].
14 The CB-ELSA Collaboration: Study of the reaction γp → pπ0η
44. R.L. Jaffe, D. Pirjol and A. Scardicchio, Phys. Rept. 435(2006) 157.
45. See, e.g., L.Y. Glozman, Phys. Rev. Lett. 99 (2007)191602, and references therein.
46. E. Klempt, Phys. Lett. B 559 (2003) 144.47. E. Klempt and A. Zaitsev, Phys. Rept. 454 (2007) 1.48. M. Shifman and A. Vainshtein, PR D 77 (2008) 034002.
Related Documents