Study of the NF3 plasma cleaning of reactors for amorphous silicon deposition G. Bruno, P. Capezzuto, G. Cicala, and P. Manodoro Citation: J. Vac. Sci. Technol. A 12, 690 (1994); doi: 10.1116/1.578854 View online: http://dx.doi.org/10.1116/1.578854 View Table of Contents: http://avspublications.org/resource/1/JVTAD6/v12/i3 Published by the AVS: Science & Technology of Materials, Interfaces, and Processing Related Articles Simple Si(111) surface preparation by thin wafer cleavage J. Vac. Sci. Technol. A 31, 023201 (2013) Novel techniques for modifying microtube surfaces with various periodic structures ranging from nano to microscale J. Vac. Sci. Technol. B 31, 011806 (2013) Decomposition and phase transformation in TiCrAlN thin coatings J. Vac. Sci. Technol. A 30, 061506 (2012) Surface modification of gold–carbon nanotube nanohybrids under the influence of near-infrared laser exposure J. Vac. Sci. Technol. B 30, 03D119 (2012) Quantification of cesium surface contamination on silicon resulting from SIMS analysis J. Vac. Sci. Technol. B 30, 031203 (2012) Additional information on J. Vac. Sci. Technol. A Journal Homepage: http://avspublications.org/jvsta Journal Information: http://avspublications.org/jvsta/about/about_the_journal Top downloads: http://avspublications.org/jvsta/top_20_most_downloaded Information for Authors: http://avspublications.org/jvsta/authors/information_for_contributors Downloaded 28 Mar 2013 to 150.146.205.185. Redistribution subject to AVS license or copyright; see http://avspublications.org/jvsta/about/rights_and_permissions

Welcome message from author
This document is posted to help you gain knowledge. Please leave a comment to let me know what you think about it! Share it to your friends and learn new things together.
Transcript
Study of the NF3 plasma cleaning of reactors for amorphous silicondepositionG. Bruno, P. Capezzuto, G. Cicala, and P. Manodoro Citation: J. Vac. Sci. Technol. A 12, 690 (1994); doi: 10.1116/1.578854 View online: http://dx.doi.org/10.1116/1.578854 View Table of Contents: http://avspublications.org/resource/1/JVTAD6/v12/i3 Published by the AVS: Science & Technology of Materials, Interfaces, and Processing Related ArticlesSimple Si(111) surface preparation by thin wafer cleavage J. Vac. Sci. Technol. A 31, 023201 (2013) Novel techniques for modifying microtube surfaces with various periodic structures ranging from nano tomicroscale J. Vac. Sci. Technol. B 31, 011806 (2013) Decomposition and phase transformation in TiCrAlN thin coatings J. Vac. Sci. Technol. A 30, 061506 (2012) Surface modification of gold–carbon nanotube nanohybrids under the influence of near-infrared laser exposure J. Vac. Sci. Technol. B 30, 03D119 (2012) Quantification of cesium surface contamination on silicon resulting from SIMS analysis J. Vac. Sci. Technol. B 30, 031203 (2012) Additional information on J. Vac. Sci. Technol. AJournal Homepage: http://avspublications.org/jvsta Journal Information: http://avspublications.org/jvsta/about/about_the_journal Top downloads: http://avspublications.org/jvsta/top_20_most_downloaded Information for Authors: http://avspublications.org/jvsta/authors/information_for_contributors
Downloaded 28 Mar 2013 to 150.146.205.185. Redistribution subject to AVS license or copyright; see http://avspublications.org/jvsta/about/rights_and_permissions
----------~--------------------------------- ------
Study of the NF3 plasma cleaning of reactors for amorphous silicon deposition
G. Bruno, P. Capezzuto, G. Cicala, and P. Manodoro Centro di Studio per la Chimica dei Plasmi. CNR Dipartimento di Chimica. Universita di Bari Via G. Amendola. 173. 70126 Bari. Italy
(Received 19 January 1994; accepted 12 February 1994)
NF3 plasmas have been investigated for the cleaning of reactors for amorphous silicon (a-Si:H) deposition from silane. Optical emission spectroscopy, also time resolved, has been used to measure F*, NT ' NF*, and SiF* emitting species in the plasma phase. Measurements of mass spectrometry, etching rate and dc self-bias voltage at the rf powered electrode have also been used for process diagnostics. The a-Si:H etching process by F atoms is shown to occur under loading conditions: the etching rate does not correlate with F atom density. The recombination processes NFx+F~NFx+I(X=2,I) and NF+NF~N2+2F together with the NF3 electron impact dissociation into NFx + F have been found to be significant for the NF3 plasma chemistry as well as the fluorine conversion into SiF4,
I. INTRODUCTION
Radio-frequency (rt) glow discharge (gd) deposition processes are widely used for producing thin films of amorphous silicon (a-Si:H) as well as its alloys with other elements (a-Si:Ge, a-Si:C, a-Si:N, a-Si:O, a-Si:N,O). This technology, better known as plasma-enhanced chemical vapor deposition (PECVD), has achieved its full development since the above silicon-based materials have been found to have optoelectronic properties of interest in the manufacturing of photovoltaic solar cells and other electronic devices. I In particular, the manufacturing of large-area photovoltaic panels has required the development of PECVD reactors on industrial scale.
An important feature of the PECVD process for amorphous silicon deposition is that the reactors should work under very clean conditions and, normally, the exposure of the reactor chamber to air must be avoided. This is assured, during the manipulation of the substrate, by the presence of a load-lock chamber. However, after some deposition cycles, the reactor chamber needs to be cleaned, because of the film deposition on the walls.
In many laboratories, the cleaning is done by utilizing a wet chemical process of the disassembled plasma chamber. In others, dry chemical etching by plasma in fluorinated gases is used. Typically SF6 ,2 CF4,3 and NF3
4-6 gases are used to produce F atoms which are the active species for the ablation of silicon
Si+4F~SiF4' (1)
The optimization of the etching process requires, in some cases, the addition of O2 (Ref. 7) to maximize the density of the F atoms and, hence, the etching rate. Nevertheless, the rate-limiting step in the etching of silicon during the cleaning process is the supply of F atoms to the surface, because of the loading effect.8 In this case the overall rate of the etching process is entirely determined by the rate of the F atoms diffusion to the walls.
Although CF4+02 and SF6+02 are the most investigated systems for Si etching, NF3 seems to be, though expensive, a
preferable gas for the cleaning of reactors after a-Si film deposition.9 The most important feature of NF3 with respect to CF4 and SF6 is that it does not release any foreign species such as C or S, which are contaminants for the subsequent a-Si deposition process.
In these last years, studies on NF3 plasmas have been undertaken by many workers who tried to obtain, for obvious reasons, fast etch rates and anisotropic etch profiles for the etching of silicon and other materials as we11.5,6 Despite this, some fundamental aspects regarding the chemistry of NF3 rf discharges are still unsolved.
Recently, Perrin et at. 10 have investigated the NF3 plasma chemistry by means of mass spectroscopy in an industrial large-scale PECVD reactor for a-Si:H deposition. Besides technological considerations, the role of NF2 radicals in limiting the etch rate is emphasized.
In this article we discuss in details the experimental investigations of NF3 plasmas produced in a reactor used for the deposition of good quality a-Si:H films. The plasma diagnostics has been performed by optical emission spectroscopy (OES), also time resolved (TR-OES), and mass spectrometry (MS), together with measurements of self-bias potential of the rf electrode, and of the etch rate by laser reflectance interferometry (LRI). The produced data highlight the plasma chemistry of NF3 also in presence of a-Si:H and hence the control of the a-Si:H cleaning process.
II. EXPERIMENT
The investigation has been performed in a typical parallelplate plasma reactor used for the deposition of good quality a-Si:H films. The reactor consists, briefly, of an UHV stainless-steel plasma chamber, equipped with a load-lock chamber, evacuated by a turbomolecular pump to a base pressure of better than 10-7 Torr. During deposition and etching processes, the pressure inside the chamber is maintained by a roots-rotative pumping group. The area and distance of the electrodes are 100 cm2 and 3.5 cm, respectively.
690 J. Vee. Sci. Technol. A 12(3), May/Jun 1994 0734-2101194112(3)1690191$1.00 01994 American Vacuum Society 690
Downloaded 28 Mar 2013 to 150.146.205.185. Redistribution subject to AVS license or copyright; see http://avspublications.org/jvsta/about/rights_and_permissions
691 Bruno et III.: Study of the NF3 plasma cleaning of reactors
TA.BLE 1. Experimental parameters for cleaning process.
Pressure rfpower NF3 flow rate Set (Torr) (W) (seem)
I 0.1 5-40 7 2 0.1 20 1.5-15 3 0.1-0.7 40 7
The discharge is driven by a 13.56 MHz rf generator, coupled to the plasma with an automatic matching impedance network.
Prior to the cleaning process, many runs of a-Si:H films are performed under standard procedure including: (a) the loading of the substrates (Coming 7059 glass, c-Si, molybdenum) on the grounded electrode under UHV conditions (p<1O-7 Torr), by means of the load-lock chamber, (b) the heating of the substrate at 300 °C, (c) the feeding of SiH4 :H2 (1:10) mixture at the right flow rate and pressure and, (d) the ignition of the plasma at 5-25 W. These conditions give a-Si:H films at a deposition rate of about 1 Als, with a phototo-dark conductivity ratio, uptiuD' ranging between 5 and 6 orders of magnitude. After 6-8 deposition runs, giving about 4 JoLm thick film on the chamber walls and electrodes, a cleaning process with NF3 etching gas is performed for the silicon film removal.
The principal sets of cleaning experiments have been made under conditions reported in Table I.
Few experiments at 27 MHz have also been performed under continuous wave (cw) and square wave modulation conditions (MW). The period and duty cycle, which are the typical parameters controlling the square wave plasma modulation, range between 5 and 500 ms and 10%-75%,
~ ,I ,,1 , ,
I ,
J' ,
SiF
691
respectively. Details on the configuration of the reactor for modulated glow discharge experiments can be found in Ref. 11.
The monitoring of the plasma phase with optical emission spectroscopy (OES), also time resolved (TROES), has been performed by using an OMA III spectroscope with gateable detector (PAR-EG&G). The analysis of the stable gases outcoming from the reactor is carried out, through a leak valve, by means of a quadrupolar mass spectrometer (QMS 311 Balzers). Measurements of dc self-bias voltage of the rf electrode, and in situ measurements of the etching rate of predeposited a-Si:H film with laser reflectance interferometer (He-Ne laser at 6328 A), have also been done during the cleaning process.
III. RESULTS AND DISCUSSION
A. Optical emission spectroscopy (OES)
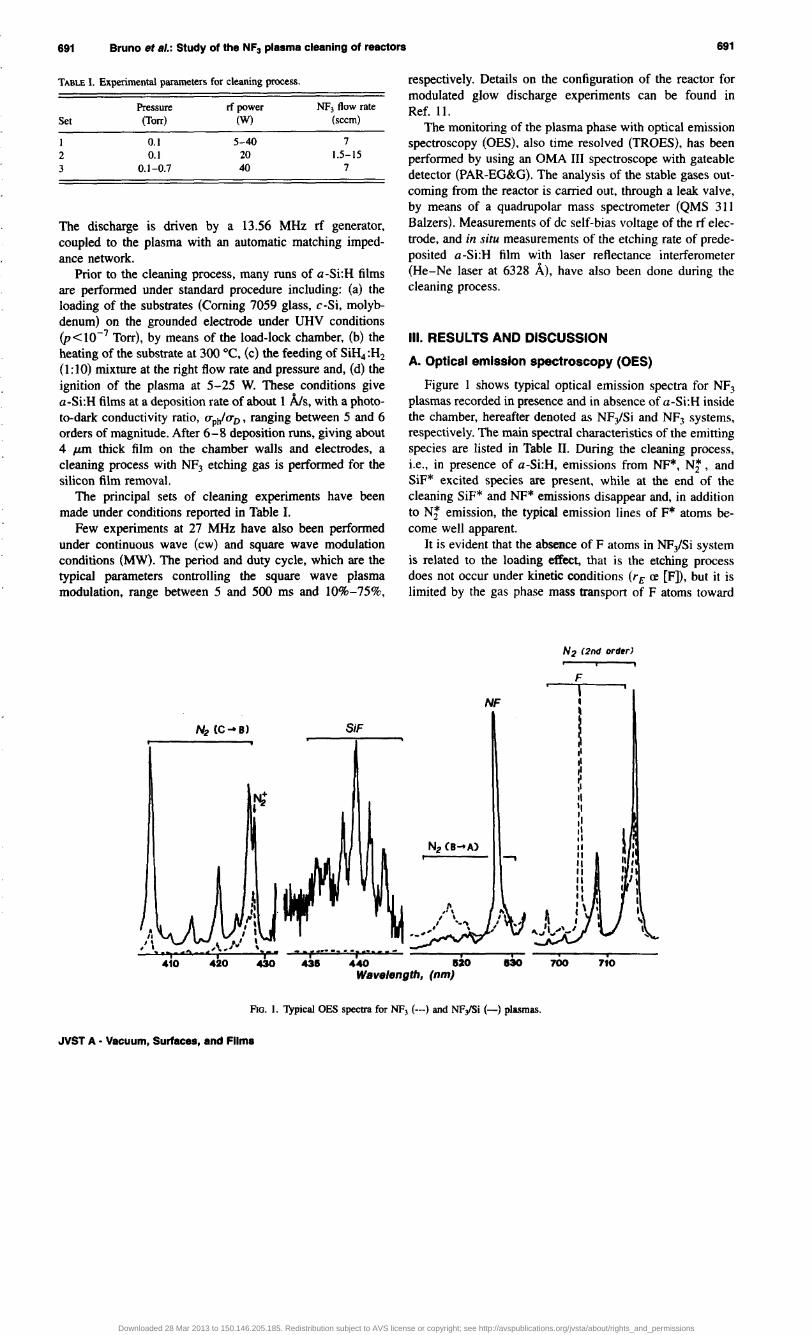
Figure I shows typical optical emission spectra for NF3 plasmas recorded in presence and in absence of a-Si:H inside the chamber, hereafter denoted as NF/Si and NF3 systems, respectively. The main spectral characteristics of the emitting species are listed in Table II. During the cleaning process, i.e., in presence of a-Si:H, emissions from NF*, Nt, and SiF* excited species are present, while at the end of the cleaning SiF* and NF* emissions disappear and, in addition to Nt emission, the typical emission lines of F* atoms become well apparent.
It is evident that the absence of F atoms in NF/Si system is related to the loading effect, that is the etching process does not occur under kinetic conditions (rE ce [F]), but it is limited by the gas phase mass transport of F atoms toward
N2 (2nd order)
NF
c'\'" '_.-i , 420 430 -;&r" . ~~~-«. - ---S"i-O---ST'30- --700 .... ·---7.""'0---
Wavelength, (nm)
FIG. 1. Typieal OES spectra for NF3 (---) and NFfSi (-) plasmas.
JVST A • Vacuum, Surfaces, and Filma
Downloaded 28 Mar 2013 to 150.146.205.185. Redistribution subject to AVS license or copyright; see http://avspublications.org/jvsta/about/rights_and_permissions
692 Bruno et sl.: Study of the NF3 plasma cleaning of reactors
TABLE II. Principal spectral systems observed in NF3 and in NF3/Si plasmas.
Emission Energy of emitting state wavelength above ground state
Species (nm) Transition" (eV)
N2 1051-503.08 FPS many bands B 3n._A 3~:
497.64-281.43 SPS 11.1 many bands C 3n -8 3n
• g
N; 427.81 FNS
NF 528.8 8 2~: -X 2~; b 1~+_X3~- 2.34
F 696.63 3p 2po_3s 2p 14.7Sb 703.75 712.79
SiF 439.83-456.95 Sistema a 2.82<
many bands A 21 + -X 2n Ar 750.38d 4[1'( 112)-4s'( 112)0 13.4gb
aFPS=first positive system, SPS=second positive system, FNS=first negative system.
bCalculated values. cExperimental values. dActinometer emission line.
the a-Si:H covered walls. Also, the absence of NF* emission in NF3 plasmas is certainly due to the occurrence of the recombination process
NF+F->NF2 (2)
which strongly reduces NF radicals and hence the excited NF* species.
The above arguments simply suggest that NF2 radical predominates in NF3 plasma system, whereas in NFiSi system the NF is the most abundant radical in the plasma phase. However, this last aspect will be quantitatively discussed in the below.
For the quantitative analysis of the OES data, the actinometric approach has been used and, for this, a small amount of Ar has been added to the gas feeding mixture. From this point of view, fluorine and nitrogen excited species (lines at 703.8 and 420.1 nm) are the most suitable, since their excitation thresholds are quite similar (14.75 and 11.1 eV) to that of excited Ar (line at 750.4 nm, 13.5 eV). However, the emission intensity of Nt and F* is representative of the concentration of the same species in the ground state, provided that they originate from a direct excitation process. This is undoubtedly true for Nt and can be easily argued for F*, since processes like
NF3+e- ->NF2+F*+e- (3)
are negligible, when conSidering the high energy required to produce F*. Moreover, the fact that Nt and F* originate from a direct excitation of N2 and F in their ground state is also confirmed from TROES data (see Sec. III B).
B. TROES in modulated plasmas
Plasma modulation experiments, coupled with measurements of TROES, have been utilized to study the formation and decay rates of the emitting species (NF*, F*, Nt) and, hence, to get information on the kinetics of the active species present in the plasma phase. In a previous article, II the mor-
J. Vac. Sci. Technol. A, Vol. 12, No.3, May/Jun 1994
692
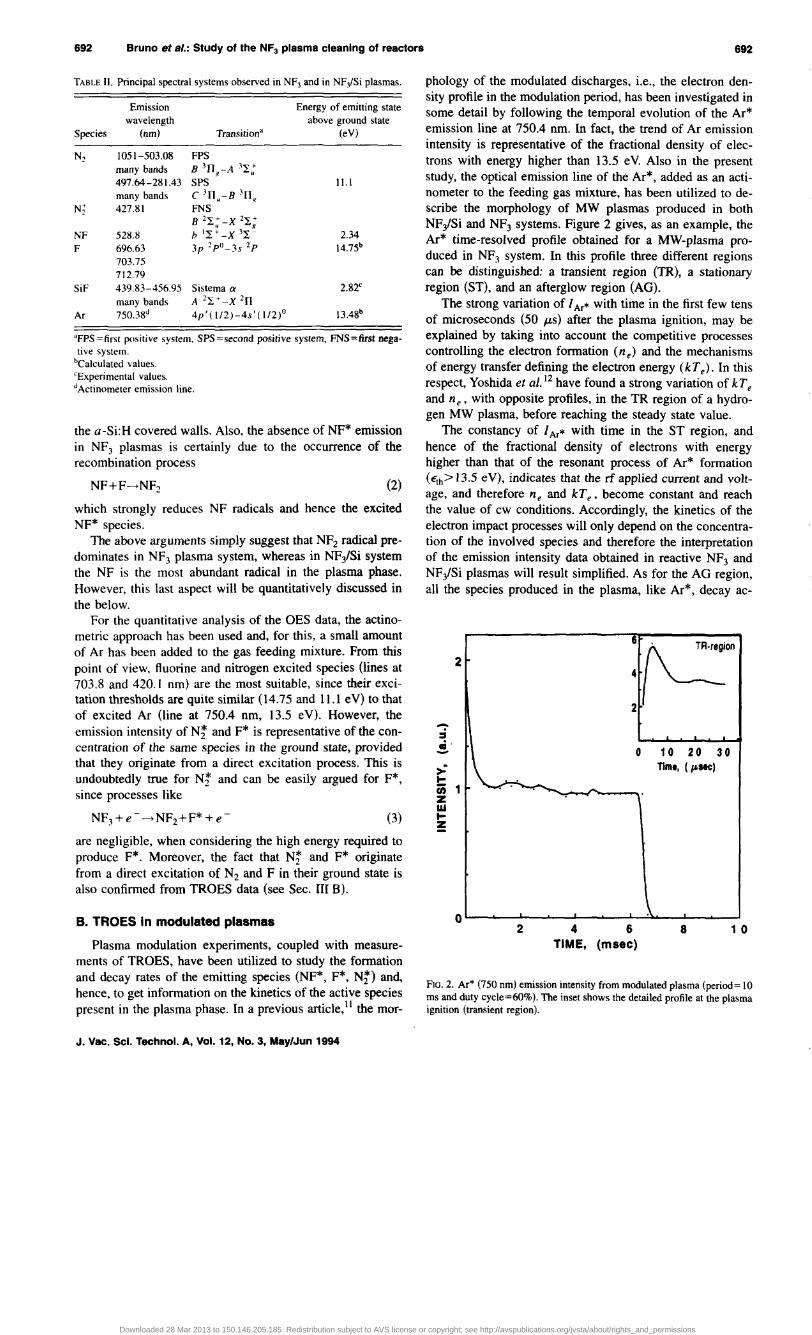
phology of the modulated discharges, i.e., the electron density profile in the modulation period, has been investigated in some detail by following the temporal evolution of the Ar* emission line at 750.4 nm. In fact, the trend of Ar emission intensity is representative of the fractional density of electrons with energy higher than 13.5 e V. Also in the present study, the optical emission line of the Ar*, added as an actinometer to the feeding gas mixture, has been utilized to describe the morphology of MW plasmas produced in both NF3/Si and NF3 systems. Figure 2 gives, as an example, the Ar* time-resolved profile obtained for a MW-plasma produced in NF3 system. In this profile three different regions can be distinguished: a transient region (TR), a stationary region (ST), and an afterglow region (AG).
The strong variation of I Ar* with time in the first few tens of microseconds (50 J-Ls) after the plasma ignition, may be explained by taking into account the competitive processes controlling the electron formation (n e) and the mechanisms of energy transfer defining the electron energy (kTe). In this respect, Yoshida et al. 12 have found a strong variation of kTe and ne , with opposite profiles, in the TR region of a hydrogen MW plasma, before reaching the steady state value.
The constancy of I Ar* with time in the ST region, and hence of the fractional density of electrons with energy higher than that of the resonant process of Ar* formation (Eth> 13.5 eV), indicates that the rf applied current and voltage, and therefore ne and kTe, become constant and reach the value of cw conditions. Accordingly, the kinetics of the electron impact processes will only depend on the concentration of the involved species and therefore the interpretation of the emission intensity data obtained in reactive NF3 and NFiSi plasmas will result simplified. As for the AG region, all the species produced in the plasma, like Ar*, decay ac-
,: l-
2
e;; 1 z W I-Z
o 2
Ii
4
2
0
-,..-r-
4 6 TIME, (msec)
~oo
10 20 30 TIm., ("ItC)
\. 8 10
FIG. 2. Ar* (750 nm) emission intensity from modulated plasma (period = 10 ms and duty cycle=60%). The inset shows the detailed profile at the plasma ignition (transient region).
Downloaded 28 Mar 2013 to 150.146.205.185. Redistribution subject to AVS license or copyright; see http://avspublications.org/jvsta/about/rights_and_permissions
693 Bruno et .,.: Study of the NF3 plasma cleaning of reactors 693
8 -. --.. .. c = 0 u
C'f 0 9""
4 ->" ~
iii z w ... ! 2
1 2 3 4
TIME, (maec)
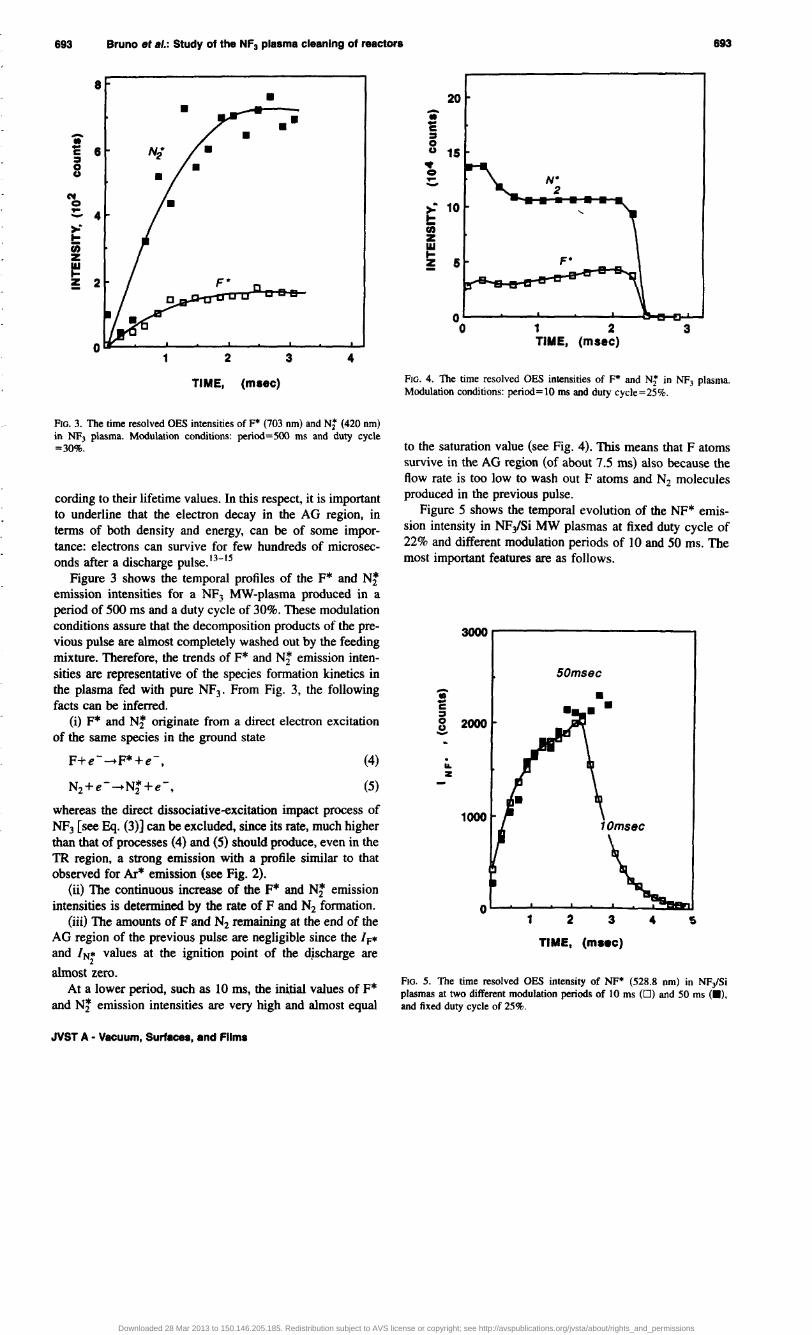
FIG. 3. The time resolved DES intensities of F* (703 nm) and Nt (420 om) in NF) plasma. Modulation conditions: period = 500 ms and duty cycle =30%.
cording to their lifetime values. In this respect, it is important to underline that the electron decay in the AG region, in terms of both density and energy, can be of some importance: electrons can survive for few hundreds of microseconds after a discharge pulseY-15
Figure 3 shows the temporal profiles of the F* and Nt emission intensities for a NF3 MW-plasma produced in a period of 500 ms and a duty cycle of 30%. These modulation conditions assure that the decomposition products of the previous pulse are almost completely washed out by the feeding mixture. Therefore, the trends of F* and Nt emission intensities are representative of the species formation kinetics in the plasma fed with pure NF3 . From Fig. 3, the following facts can be inferred.
(i) F* and Nt originate from a direct electron excitation of the same species in the ground state
F+e- -+F*+e-,
N2 +e- -+Ni+e-,
(4)
(5)
whereas the direct dissociative-excitation impact process of NF3 [see Eq. (3)] can be excluded, since its rate, much higher than that of processes (4) and (5) should produce, even in the TR region, a strong emission with a profile similar to that observed for Ar* emission (see Fig. 2).
(ii) The continuous increase of the F* and Nt emission intensities is determined by the rate of F and N2 formation.
(iii) The amounts of F and N2 remaining at the end of the AG region of the previous pulse are negligible since the IF* and I Nt values at the ignition point of the djscharge are
almost zero. At a lower period, such as 10 IDS, the initial values of F*
and Nt emission intensities are very high and almost equal
JVST A " Vacuum, Surfaces, and Films
20 -.. .. c = 0 u 15 .. 0 9"" N-- 2
>= 10 -.. t: (I) z w ~
~ 5 F-
1 2 3 TIME, (msec)
FIG. 4. The time resolved DES intensities of F* and Nt in NF3 plasma. Modulation conditions: period = 10 ms and duty cyc1e=25%.
to the saturation value (see Fig. 4). This means that F atoms survive in the AG region (of about 7.5 ms) also because the flow rate is too low to wash out F atoms and N2 molecules produced in the previous pulse.
Figure 5 shows the temporal evolution of the NF* emission intensity in NFiSi MW plasmas at fixed duty cycle of 22% and different modulation periods of 10 and 50 ms. The most important features are as follows.
3000
50msec
-• .. c = 0 2000 u -. ... z
1000 10mS6c
1 2
TIME, (m •• c)
FIG. 5. The time resolved DES intensity of NF* (528.8 nm) in NF/Si plasmas at two different modulation periods of 10 ms (0) and 50 ms (_), and fixed duty cycle of 25%.
Downloaded 28 Mar 2013 to 150.146.205.185. Redistribution subject to AVS license or copyright; see http://avspublications.org/jvsta/about/rights_and_permissions
694 Bruno et sl.: Study of the NF3 plasma cleaning of reactors
..... •
8
L 6 z ....
5
4
o 1 2 3
TIME, (msec)
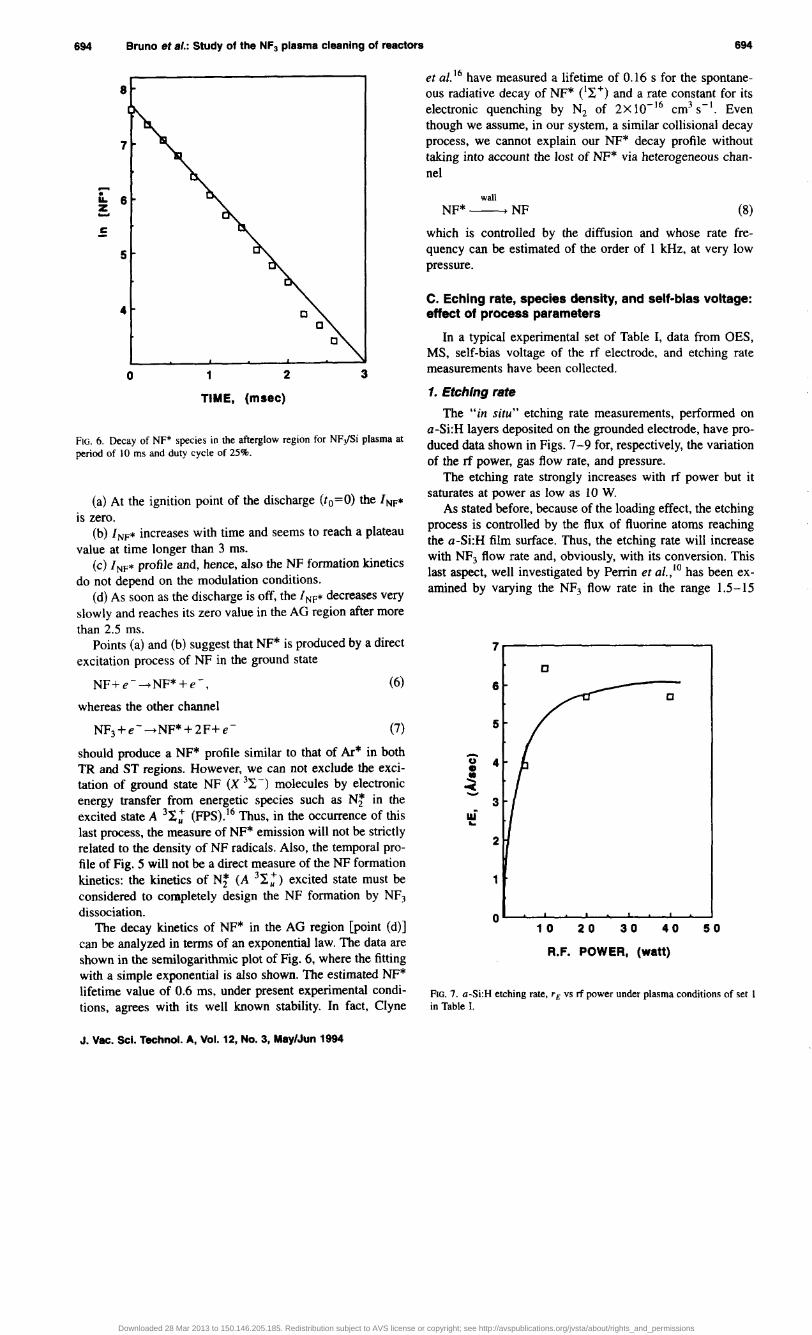
FIG. 6. Decay of NF* species in the afterglow region for NFfSi plasma at period of 10 ms and duty cycle of 25%.
(a) At the ignition point of the discharge (to=O) the INF*
is zero. (b) INF* increases with time and seems to reach a plateau
value at time longer than 3 ms. (c) INF* profile and, hence, also the NF formation kinetics
do not depend on the modulation conditions. (d) As soon as the discharge is off, the I NF* decreases very
slowly and reaches its zero value in the AG region after more than 2.5 ms.
Points (a) and (b) suggest that NF* is produced by a direct excitation process of NF in the ground state
NF+e- ~NF*+e-,
whereas the other channel
NF3+e-~NF*+2F+e-
(6)
(7)
should produce a NF* profile similar to that of Ar* in both TR and ST regions. However, we can not exclude the excitation of ground state NF (X 3~ -) molecules by electronic energy transfer from energetic species such as N~ in the excited state A 3~ ~ (FPS).16 Thus, in the occurrence of this last process, the measure of NF* emission will not be strictly related to the density of NF radicals. Also, the temporal profile of Fig. 5 will not be a direct measure of the NF formation kinetics: the kinetics of N! (A 3~~) excited state must be considered to completely design the NF formation by NF3 dissociation.
The decay kinetics of NF* in the AG region [point (d)] can be analyzed in terms of an exponential law. The data are shown in the semilogarithmic plot of Fig. 6, where the fitting with a simple exponential is also shown. The estimated NF* lifetime value of 0.6 ms, under present experimental conditions, agrees with its well known stability. In fact, Clyne
J. Vac. Sci. Techno!. A, Vol. 12, No.3, May/Jun 1994
694
et al. 16 have measured a lifetime of 0.16 s for the spontaneous radiative decay of NF* e~+) and a rate constant for its electronic quenching by N2 of 2X 10- 16 cm3 s -I. Even though we assume, in our system, a similar collisional decay process, we cannot explain our NF* decay profile without taking into account the lost of NF* via heterogeneous channel
wall
NF*----. NF (8)
which is controlled by the diffusion and whose rate frequency can be estimated of the order of 1 kHz, at very low pressure.
C. Echlng rate, species denSity, and self-bias voltage: effect of process parameters
In a typical experimental set of Table I, data from OES, MS, self-bias voltage of the rf electrode, and etching rate measurements have been collected.
1. Etching rate
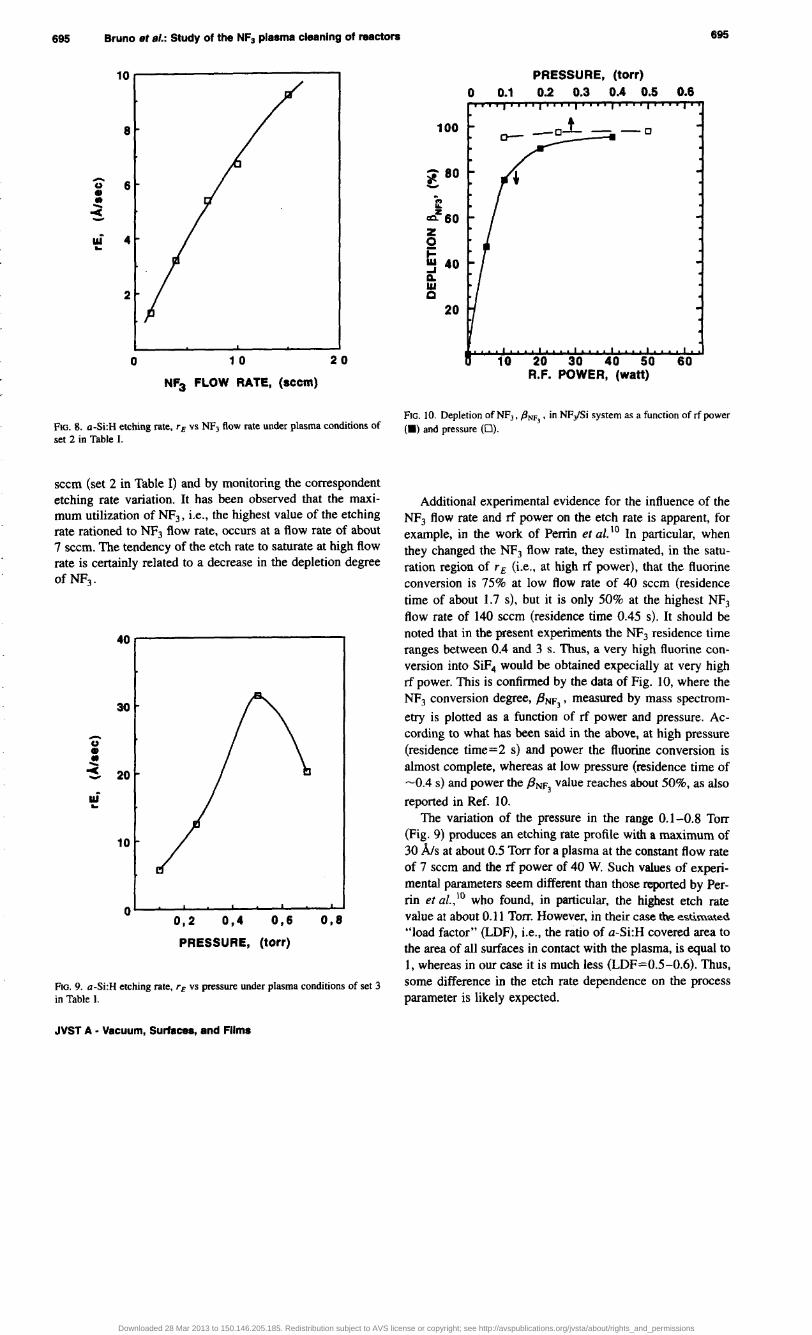
The "in situ" etching rate measurements, performed on a-Si:H layers deposited on the grounded electrode, have produced data shown in Figs. 7-9 for, respectively, the variation of the rf power, gas flow rate, and pressure.
The etching rate strongly increases with rf power but it saturates at power as low as lOW.
As stated before, because of the loading effect, the etching process is controlled by the flux of fluorine atoms reaching the a-Si:H film surface. Thus, the etching rate will increase with NF3 flow rate and, obviously, with its conversion. This last aspect, well investigated by Perrin et al., 10 has been exami ned by varying the NF3 flow rate in the range 1.5-15
7
[]
6 c
5
-C> 4 • • .... 0lIl( ......
3 W ..
2
1
0 10 20 30 40 50
R.F. POWER, (watt)
FIG. 7. a-Si:H etching rate, rE vs rf power under plasma conditions of set I in Table 1.
Downloaded 28 Mar 2013 to 150.146.205.185. Redistribution subject to AVS license or copyright; see http://avspublications.org/jvsta/about/rights_and_permissions
695 Bruno et 81.: Study of the NF3 plasma cleanIng of reactors
10-------------------------,
8
'0 6 • .. < -ui 4 ..
2
o 10 20
NF3 FLOW RATE, (seem)
FIG. 8. a-Si:H etching rate, rE vs NF) flow rate under plasma conditions of set 2 in Table I.
secm (set 2 in Table I) and by monitoring the correspondent etching rate variation. It has been observed that the maximum utilization of NF3, i.e., the highest value of the etching rate rationed to NF3 flow rate, occurs at a flow rate of about 7 secm. The tendency of the etch rate to saturate at high flow rate is certainly related to a decrease in the depletion degree of NF3 .
40~----------------------,
30
-u • .. .... -C 20 ......
ui .. 10
oL---~--~~~~~~--~
0,2 0,4 0,6 0,8
PRESSURE, (torr)
FIo.9. a-Si:H etching rate, rE vs pressure under plasma conditions of set 3 in Table I.
JVST A • Vacuum, Surfaces, and Films
695
PRESSURE, (torr)
0 0.1 0.2 0.3 0.4 0.5 0.6
100 _01- --0
- 80 ~ -~
a:?= 60 z 0
t 40 -' ~ W c
20
10 20 30 40 50 60 R.F. POWER, (watt)
FIG. 10. Depletion of NFJ • f3NF, ' in NFy'Si system as a function of rf power (_) and pressure (0).
Additional experimental evidence for the influence of the NF3 flow rate and rf power on the etch rate is apparent, for example, in the work of Perrin et al. 10 In particular, when they changed the NF3 flow rate, they estimated, in the saturation region of rE (i.e., at high rf power), that the fluorine conversion is 75% at low flow rate of 40 sccm (residence time of about 1.7 s), but it is only 50% at the highest NF3 flow rate of 140 sccm (residence time 0.45 s). It should be noted that in the present experiments the NF3 residence time ranges between 0.4 and 3 s. Thus, a very high fluorine conversion into SiF4 would be obtained expeciaUy at very high rf power. This is confirmed by the data of Fig. 10, where the NF3 conversion degree, f3NF) , measured by mass spectrom
etry is plotted as a function of rf power and pressure. According to what has been said in the above, at high pressure (residence time=2 s) and power the fluorine conversion is almost complete. whereas at low pressure (residence time of ~0.4 s) and power the f3NF
3 value reaches about 50%, as also
reported in Ref. 10 . The variation of the pressure in the range 0.1-0.8 Torr
(Fig. 9) produces an etching rate profile with a maximum of 30 Als at about 0.5 Torr for a plasma at the constant flow rate of 7 sccm and the rf power of 40 W. Such values of experimental parameters seem different than those reported by Perrin et at., 10 who found, in particular, the highest etch rate value at about 0.11 Torr. However, in their case the e~timated "load factor" (LDF), i.e., the ratio of a-Si:H covered area to the area of all surfaces in contact with the plasma, is equal to 1. whereas in our case it is much less (LDF=0.5-0.6). Thus, some difference in the etch rate dependence on the process parameter is likely expected.
Downloaded 28 Mar 2013 to 150.146.205.185. Redistribution subject to AVS license or copyright; see http://avspublications.org/jvsta/about/rights_and_permissions
696 Bruno et sl.: Study 01 the NF3 plasma cleaning 01 reactors
5 (a)
4
~ 3 til Z W t- 2 ~ Z 0 1 en tn i w Q A r· (b) UI N :; C 3 =e a: 0 z
2
1
SIF·
0 30 40 50 10 20
R.F. POWER, (watt)
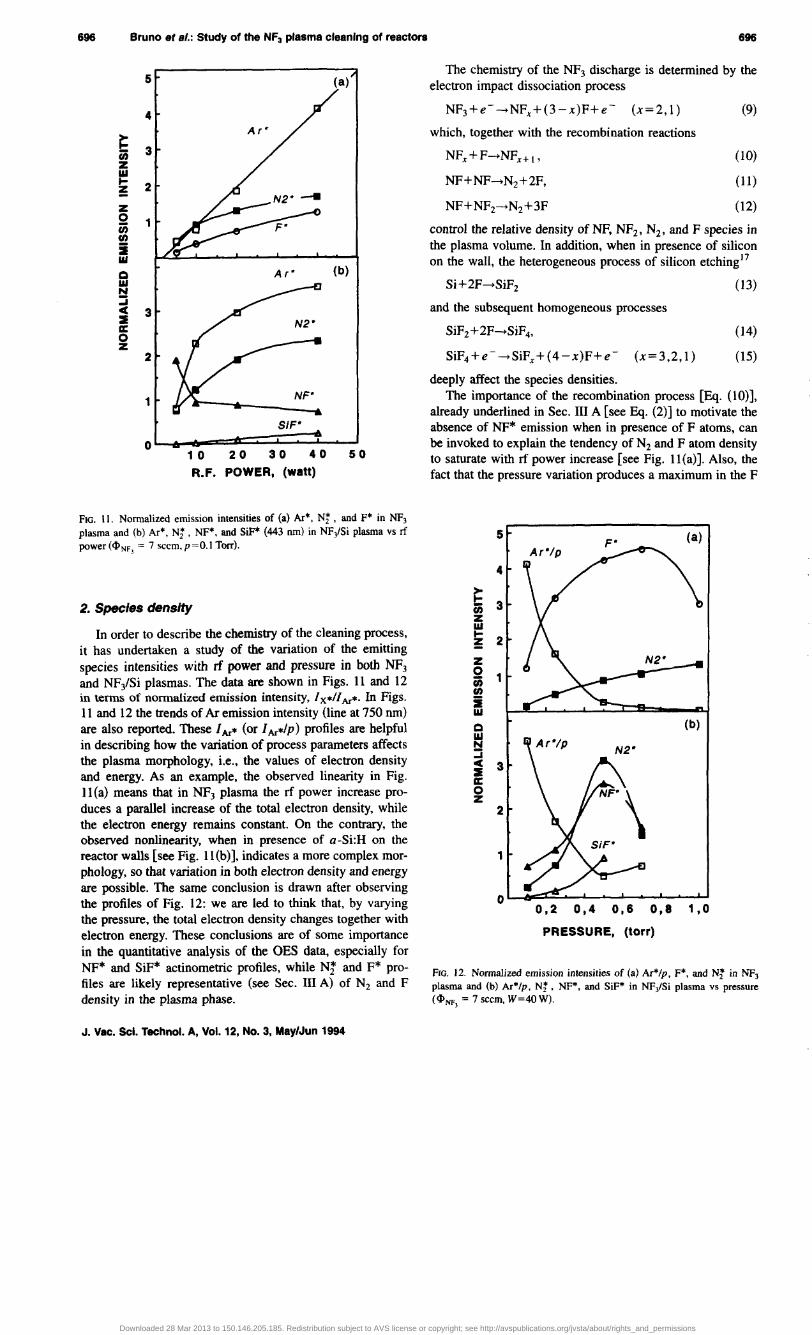
FIG. II. Normalized emission intensities of (a) AI"', Ni ' and F'" in NF3 plasma and (b) Ar*, Nj, NF*, and SiP'" (443 nm) in NFiSi plasma vs rf power(<I>NF, = 7 sccm,p=O.1 Torr).
2. Species density
In order to describe the chemistry of the cleaning process, it has undertaken a study of the variation of the emitting species intensities with rf power and pressure in both NF3 and NF/Si plasmas. The data are shown in Figs. 11 and 12 in terms of nonnalized emission intensity, I x",/l Ar"" In Figs. 11 and 12 the trends of Ar emission intensity (line at 750 nm) are also reported. These I Ar* (or I Ar*' p) profiles are helpful in describing how the variation of process parameters affects the plasma morphology, i.e., the values of electron density and energy. As an example, the observed linearity in Fig. 11 (a) means that in NF3 plasma the rf power increase produces a parallel increase of the total electron density, while the electron energy remains constant. On the contrary, the observed nonlinearity, when in presence of a-Si:H on the reactor walls [see Fig. 11 (b)], indicates a more complex morphology, so that variation in both electron density and energy are possible. The same conclusion is drawn after observing the profiles of Fig. 12: we are led to think that, by varying the pressure, the total electron density changes together with electron energy. These conclusions are of some importance in the quantitative analysis of the OES data, especially for NF* and SiF* actinometric profiles, while N~ and F* profiles are likely representative (see Sec. III A) of N2 and F density in the plasma phase.
J. Vac. ScI. Technol. A, Vol. 12, No.3, May/Jun 1994
696
The chemistry of the NF3 discharge is detennined by the electron impact dissociation process
NF3+e- ........ NFx+(3-x)F+e- (x=2,l)
which, together with the recombination reactions
NFx + F ........ NFx+ I,
NF+NF ........ N2+2F,
NF+NF2 ........ N2+3F
(9)
(10)
(11)
(12)
control the relative density of NF, NF2 , N2 , and F species in the plasma volume. In addition, when in presence of silicon on the wall, the heterogeneous process of silicon etching17
Si+2F ........ SiF2
and the subsequent homogeneous processes
SiF2 + 2F ........ SiF 4,
(13)
(14)
SiF4 +e- ........ SiFx+(4-x)F+e- (x=3,2,1) (IS)
deeply affect the species densities. The importance of the recombination process [Eq. (10)],
already underlined in Sec. III A [see Eq. (2)] to motivate the absence of NF* emission when in presence of F atoms, can be invoked to explain the tendency of N2 and F atom density to saturate with rf power increase [see Fig. Il(a)]. Also, the fact that the pressure variation produces a maximum in the F
~ til Z UI t-~ z 0 en tn i w Q w N :; c =e a: 0 z
5 (a)
4
3
2
1
(b)
3
2
1
o~~~~~~~~~~~
0,2 0,4 0,6 0,8 1,0
PRESSURE, (torr)
FIG. 12. Normalized emission intensities of (a) Ar*lp, F*, and Nf in NFl plasma and (b) Ar*lp, Nr, NF*, and SiF* in NFiSi plasma vs pressure (<I>NF, = 7 seem, W=40W).
Downloaded 28 Mar 2013 to 150.146.205.185. Redistribution subject to AVS license or copyright; see http://avspublications.org/jvsta/about/rights_and_permissions
697 Bruno et al.: Study of the NF3 plasma cleaning of reactors
PRESSURE. (torr)
0.1 0.2 0.3 0.4 0.5 0.8 0.7 103
+ , 102 \ -= \ .; -.....
"-... "-II. ---z t - 101 e El
o 10 20 30 40 50 80 70 R.F. POWER, (watt)
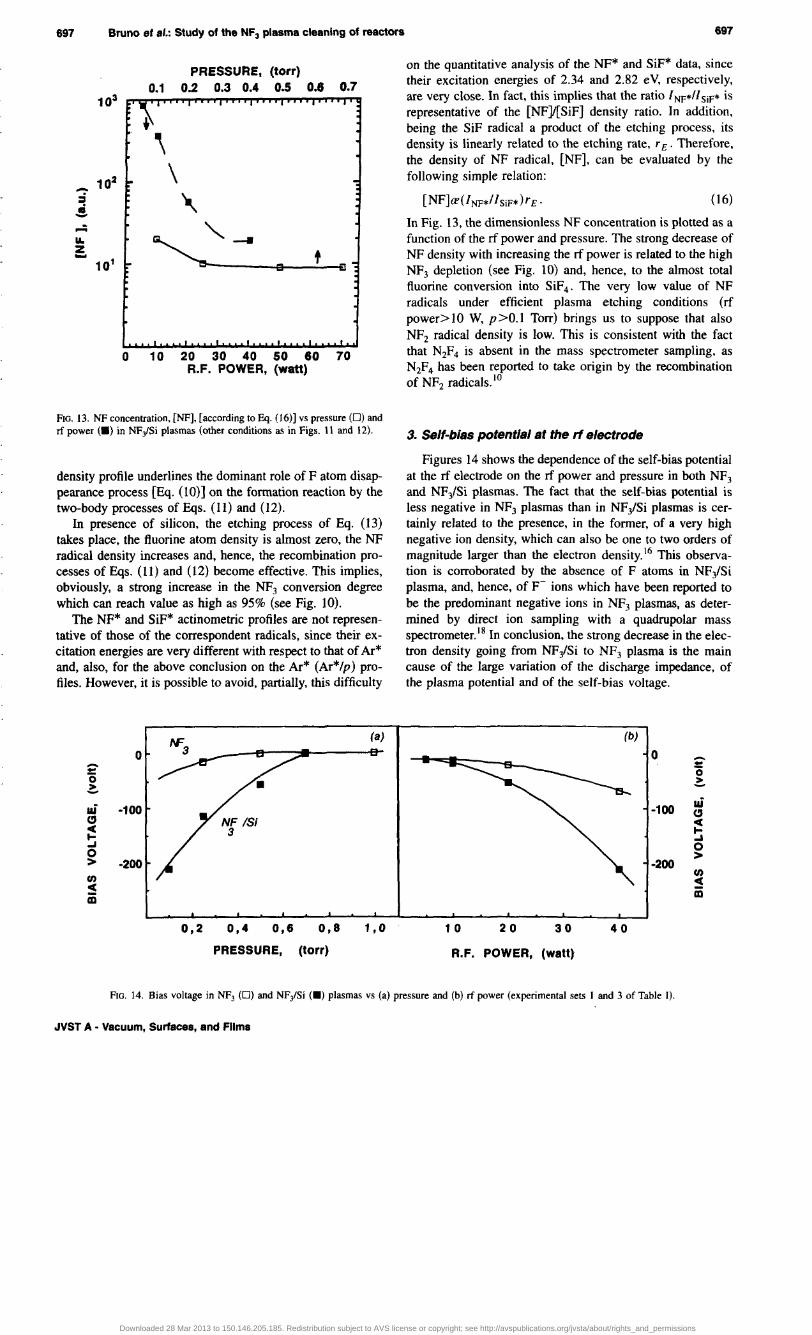
FIG. 13. NF concentration, [NF], [according to Eq. (16)] vs pressure (0) and rf power (_) in NFf5i plasmas (other conditions as in Figs. 11 and 12).
density profile underlines the dominant role of F atom disappearance process [Eq. (10)] on the formation reaction by the two-body processes of Eqs. (11) and (12).
In presence of silicon, the etching process of Eq. (13) takes place, the fluorine atom density is almost zero, the NF radical density increases and, hence, the recombination processes of Eqs. (11) and (12) become effective. This implies, obviously, a strong increase in the NF3 conversion degree which can reach value as high as 95% (see Fig. 10).
The NF* and SiF* actinometric profiles are not representative of those of the correspondent radicals, since their excitation energies are very different with respect to that of Ar* and, also, for the above conclusion on the Ar* (Ar*lp) profiles. However, it is possible to avoid, partially, this difficulty
(8)
0 ..... .. 0 ~
iii -100 CJ 00( ... ..J 0 > -200 U)
S m
0,2 0,4 0,6 0,8 1,0
PRESSURE, (torr)
697
on the quantitative analysis of the NF* and SiF* data, since their excitation energies of 2.34 and 2.82 eV, respectively, are very close. In fact, this implies that the ratio I NF*II SiF* is representative of the [NF]J[SiF] density ratio. In addition, being the SiF radical a product of the etching process, its density is linearly related to the etching rate, r E' Therefore, the density of NF radical, [NF], can be evaluated by the following simple relation:
(16)
In Fig. 13, the dimensionless NF concentration is plotted as a function of the rf power and pressure. The strong decrease of NF density with increasing the rf power is related to the high NF3 depletion (see Fig. 10) and, hence, to the almost total fluorine conversion into SiF4 , The very low value of NF radicals under efficient plasma etching conditions (rf power> 10 W, p >0.1 Torr) brings us to suppose that also NF2 radical density is low. This is consistent with the fact that N2F4 is absent in the mass spectrometer sampling, as N2F 4 has been reported to take origin by the recombination of NF2 radicals. IO
3. Self-bias potential at the rf electrode
Figures 14 shows the dependence of the self-bias potential at the rf electrode on the rf power and pressure in both NF3 and NFiSi plasmas. The fact that the self-bias potential is less negative in NF3 plasmas than in NFfSi plasmas is certainly related to the presence, in the former, of a very high negative ion density, which can also be one to two orders of magnitude larger than the electron density.16 This observation is corroborated by the absence of F atoms in NF3/Si plasma, and, hence, of F- ions which have been reported to be the predominant negative ions in NF3 plasmas, as determined by direct ion sampling with a quadrupolar mass spectrometer. I 8 In conclusion, the strong decrease in the electron density going from NF3/Si to NF3 plasma is the main cause of the large variation of the discharge impedance, of the plasma potential and of the self-bias voltage.
(b)
0 ...... .. 0 ~
-100 iii CJ 00( ... ..J 0 >
-200 U) 00(
iii
10 20 30 40
R.F. POWER, (watt)
FIG. 14. Bias voltage in NF3 (0) and NF/Si (_) plasmas vs (a) pressure and (b) rf power (experimental sets I and 3 of Table I).
JVST A - Vacuum, Surfaces, and Films
Downloaded 28 Mar 2013 to 150.146.205.185. Redistribution subject to AVS license or copyright; see http://avspublications.org/jvsta/about/rights_and_permissions
698 Bruno et 81.: Study of the NFa plasma cleaning of reactors
-60 10
-- -70 8 ::: 0 --~
0 0 0
iii ....
40t 6 >C
" 10 -< c ... ;:, ...I 0 0 u > 4 ---90
• (I)
< )(
in -100 2
10 20 30 40
TIME, (min)
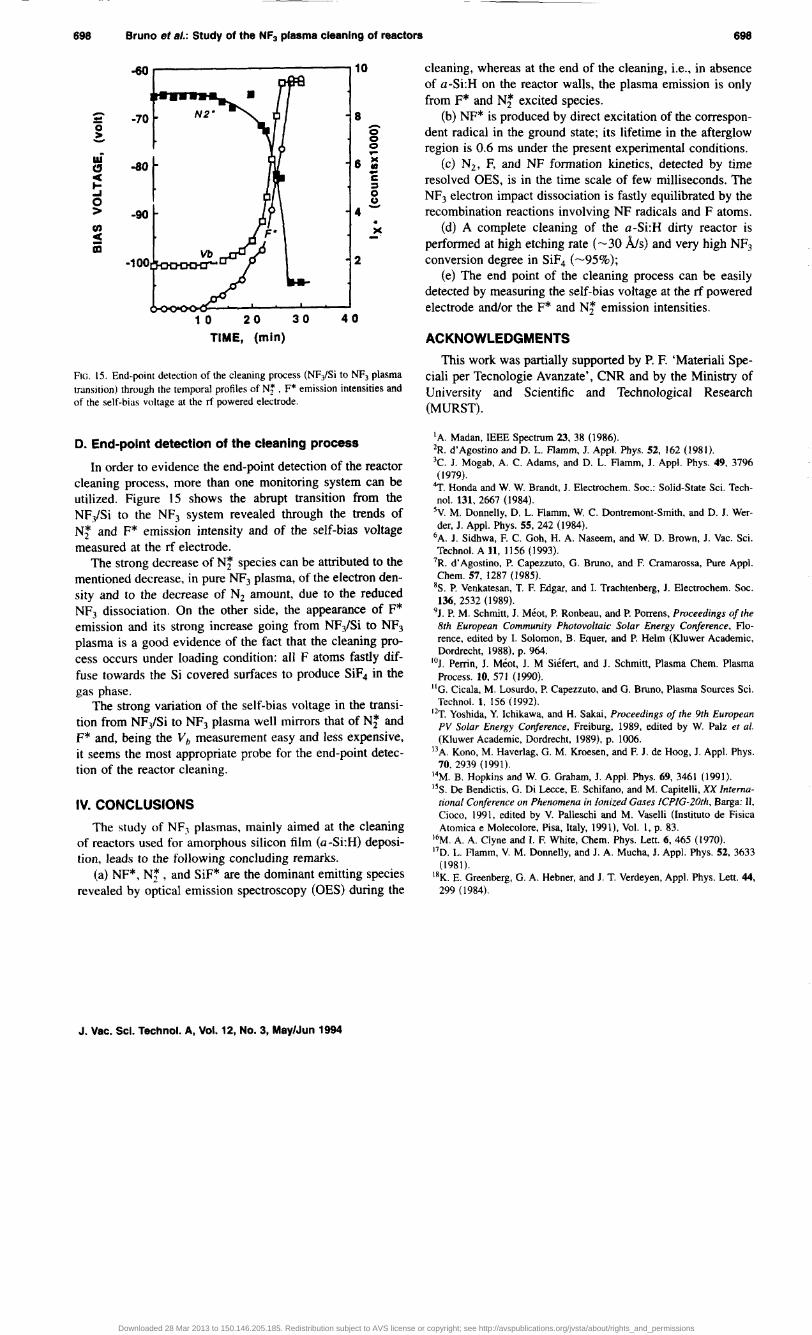
FIG. 15. End-point detection of the cleaning process (NFiSi to NF3 plasma transition) through the temporal profiles of Ni ' F* emission intensities and of the self-bias voltage at the rf powered electrode.
D. End-point detection of the cleaning process
In order to evidence the end-point detection of the reactor cleaning process, more than one monitoring system can be utilized. Figure 15 shows the abrupt transition from the NFiSi to the NF3 system revealed through the trends of Nt and F* emission intensity and of the self-bias voltage measured at the rf electrode.
The strong decrease of Ni species can be attributed to the mentioned decrease, in pure NF3 plasma, of the electron density and to the decrease of Nz amount, due to the reduced NFl dissociation. On the other side, the appearance of F* emission and its strong increase going from NFiSi to NF3 plasma is a good evidence of the fact that the cleaning process occurs under loading condition: all F atoms fastly diffuse towards the Si covered surfaces to produce SiF4 in the gas phase.
The strong variation of the self-bias voltage in the transition from NF3/Si to NF3 plasma well mirrors that of N! and F* and, being the Vb measurement easy and less expensive, it seems the most appropriate probe for the end-point detection of the reactor cleaning.
IV. CONCLUSIONS
The study of NF} plasmas, mainly aimed at the cleaning of reactors used for amorphous silicon film (a-Si:H) deposition, leads to the following concluding remarks.
(a) NF*, Nt ' and SiF* are the dominant emitting species revealed by optical emission spectroscopy (OES) during the
J. Vac. Sci. Technol. A, Vol. 12, No.3, May/Jun 1994
698
cleaning, whereas at the end of the cleaning, i.e., in absence of a-Si:H on the reactor walls, the plasma emission is only from F* and Ni excited species.
(b) NF* is produced by direct excitation of the correspondent radical in the ground state; its lifetime in the afterglow region is 0.6 ms under the present experimental conditions.
(c) N2, F, and NF formation kinetics, detected by time resolved OES, is in the time scale of few milliseconds. The NF3 electron impact dissociation is fastly equilibrated by the recombination reactions involving NF radicals and F atoms.
(d) A complete cleaning of the a-Si:H dirty reactor is performed at high etching rate (~30 Ats) and very high NF3 conversion degree in SiF4 (~95%);
(e) The end point of the cleaning process can be easily detected by measuring the self-bias voltage at the rf powered electrode and/or the F* and Ni emission intensities.
ACKNOWLEDGMENTS
This work was partially supported by P. F. 'Materiali Speciali per Tecnologie Avanzate', CNR and by the Ministry of University and Scientific and Technological Research (MURST).
IA. Madan, IEEE Spectrum 23,38 (1986). 2R. d'Agostino and D. L. Flamm, J. Appl. Phys. 52, 162 (1981). 3C. J. Mogab, A. C. Adams, and D. L. Flamm, J. AppL Phys. 49, 3796 (1979).
"T. Honda and W. W. Brandt, J. Electrochem. Soc.: Solid-State Sci. Technol. 131, 2667 (1984).
Sv. M. Donnelly, D. L. Flamm, W. C. Dontremont-Smith, and D. J. Werder, J. Appl. Phys. 55, 242 (1984).
6A. J. Sidhwa, F. C. Goh, H. A. Naseem, and W. D. Brown, J. Vac. Sci. Technol. A 11, 1156 (1993).
7R. d' Agostino, P. Capezzuto, G. Bruno, and F. Cramarossa, Pure Appl. Chern. 57, 1287 (1985).
8S. P. Venkatesan, T. F. Edgar, and I. Trachtenberg, J. Electrochem. Soc. 136, 2532 (1989).
9J. P. M. Schmitt, 1. Meot, P. Ronbeau, and P. Porrens, Proceedings of the 8th European Community Photovoltaic Solar Energy Conference, Florence, edited by I. Solomon, B. Equer, and P. Helm (Kluwer Academic, Dordrecht, 1988), p. 964.
101. Perrin, J. Meot, 1. M Siefert, and J. Schmitt, Plasma Chern. Plasma Process. 10,571 (1990).
IIG. Cicala, M. Losurdo, P. Capezzuto, and G. Bruno, Plasma Sources Sci. Techno!. 1, 156 (1992).
12T. Yoshida, Y. Ichikawa, and H. Sakai, Proceedings of the 9th European PV Solar Energy Conference, Freiburg, 1989, edited by W. Palz et at. (Kluwer Academic, Dordrecht, 1989), p. 1006.
13 A. Kono, M. Haverlag, G. M. Kroesen, and F. J. de Hoog, J. Appl. Phys. 70. 2939 (199 I).
14M. B. Hopkins and W. G. Graham, J. Appl. Phys. 69, 3461 (1991). ISS. De Bendictis, G. Di Leece, E. Schifano, and M. Capitelli, XX Interna
tional Conference on Phenomena in Ionized Cases {CPIC-20th, Barga: II, Cioco, 1991, edited by V. Palleschi and M. Vaselli (Instituto de Fisica Atomica e Molecolore, Pisa, Italy, 1991), Vol. I, p. 83.
16M. A. A. Clyne and I. F. White, Chern. Phys. Lett. 6, 465 (1970). 17D. L. Flamm, V. M. Donnelly, and J. A. Mucha, J. Appl. Phys. 52, 3633
(1981). 18K. E. Greenberg, G. A. Hebner, and J. T. Verdeyen, App!. Phys. Lett. 44,
299 (1984).
Downloaded 28 Mar 2013 to 150.146.205.185. Redistribution subject to AVS license or copyright; see http://avspublications.org/jvsta/about/rights_and_permissions
Related Documents