arXiv:1004.4996v1 [physics.ins-det] 28 Apr 2010 Preprint typeset in JINST style - HYPER VERSION Study of the interactions of pions in the CALICE silicon-tungsten calorimeter prototype The CALICE Collaboration C. Adloff, Y. Karyotakis Laboratoire d’Annecy-le-Vieux de Physique des Particules, Université de Savoie, CNRS/IN2P3, 9 Chemin de Bellevue BP110, F-74941 Annecy-le-Vieux Cedex, France J. Repond Argonne National Laboratory, 9700 S. Cass Avenue, Argonne, IL 60439-4815, USA J. Yu Department of Physics, SH108, University of Texas, Arlington, TX 76019, USA G. Eigen University of Bergen, Inst. of Physics, Allegaten 55, N-5007 Bergen, Norway Y. Mikami, N. K. Watson, J. A. Wilson University of Birmingham, School of Physics and Astronomy, Edgbaston, Birmingham B15 2TT, UK T. Goto, G. Mavromanolakis * , M. A. Thomson, D. R. Ward, W. Yan † University of Cambridge, Cavendish Laboratory, J J Thomson Avenue, CB3 0HE, UK D. Benchekroun, A. Hoummada, Y. Khoulaki Université Hassan II Aïn Chock, Faculté des sciences. B.P. 5366 Maarif, Casablanca, Morocco J. Apostolakis, A. Ribon, V. Uzhinskiy CERN, 1211 Genève 23, Switzerland M. Benyamna, C. Cârloganu, F. Fehr, P. Gay Laboratoire de Physique Corpusculaire de Clermont-Ferrand (LPC), Université Blaise Pascal, CNRS/IN2P3, 24 avenue des Landais, 63177 Aubière CEDEX, France G. C. Blazey, D. Chakraborty, A. Dyshkant, K. Francis, D. Hedin, J. G. Lima, V. Zutshi NICADD, Northern Illinois University, Department of Physics, DeKalb, IL 60115, USA J. -Y. Hostachy, K. Krastev, L. Morin Laboratoire de Physique Subatomique et de Cosmologie - Université Joseph Fourier Grenoble 1 - CNRS/IN2P3 - Institut Polytechnique de Grenoble, 53, rue des Martyrs, 38026 Grenoble CEDEX, France –1–

Welcome message from author
This document is posted to help you gain knowledge. Please leave a comment to let me know what you think about it! Share it to your friends and learn new things together.
Transcript
arX
iv:1
004.
4996
v1 [
phys
ics.
ins-
det]
28
Apr
201
0
Preprint typeset in JINST style - HYPER VERSION
Study of the interactions of pions in the CALICEsilicon-tungsten calorimeter prototype
The CALICE CollaborationC. Adloff, Y. Karyotakis
Laboratoire d’Annecy-le-Vieux de Physique des Particules, Université de Savoie, CNRS/IN2P3,9 Chemin de Bellevue BP110, F-74941 Annecy-le-Vieux Cedex,France
J. RepondArgonne National Laboratory, 9700 S. Cass Avenue, Argonne,IL 60439-4815, USA
J. YuDepartment of Physics, SH108, University of Texas, Arlington, TX 76019, USA
G. EigenUniversity of Bergen, Inst. of Physics, Allegaten 55, N-5007 Bergen, Norway
Y. Mikami, N. K. Watson, J. A. WilsonUniversity of Birmingham, School of Physics and Astronomy,Edgbaston, Birmingham B15 2TT,
UK
T. Goto, G. Mavromanolakis ∗, M. A. Thomson, D. R. Ward, W. Yan †
University of Cambridge, Cavendish Laboratory, J J ThomsonAvenue, CB3 0HE, UK
D. Benchekroun, A. Hoummada, Y. KhoulakiUniversité Hassan II Aïn Chock, Faculté des sciences. B.P. 5366 Maarif, Casablanca, Morocco
J. Apostolakis, A. Ribon, V. UzhinskiyCERN, 1211 Genève 23, Switzerland
M. Benyamna, C. Cârloganu, F. Fehr, P. GayLaboratoire de Physique Corpusculaire de Clermont-Ferrand (LPC), Université Blaise Pascal,
CNRS/IN2P3, 24 avenue des Landais, 63177 Aubière CEDEX, France
G. C. Blazey, D. Chakraborty, A. Dyshkant, K. Francis, D. Hed in, J. G. Lima, V. ZutshiNICADD, Northern Illinois University, Department of Physics, DeKalb, IL 60115, USA
J. -Y. Hostachy, K. Krastev, L. MorinLaboratoire de Physique Subatomique et de Cosmologie - Université Joseph Fourier Grenoble 1 -CNRS/IN2P3 - Institut Polytechnique de Grenoble, 53, rue des Martyrs, 38026 Grenoble CEDEX,
France
– 1 –
N. D’Ascenzo, U. Cornett, D. David, R. Fabbri, G. Falley, K. G adow, E. Garutti,P. Göttlicher, T. Jung, S. Karstensen, A. -I. Lucaci-Timoce , B. Lutz, N. Meyer,
V. Morgunov, M. Reinecke, F. Sefkow, P. Smirnov, A. Vargas-T revino, N. Wattimena,O. Wendt
DESY, Notkestrasse 85, D-22603 Hamburg, Germany
N. Feege, M. Groll, J. Haller, R. -D. Heuer, S. Morozov, S. Ric hter, J. SamsonUniv. Hamburg, Physics Department, Institut für Experimentalphysik, Luruper Chaussee 149,
22761 Hamburg, Germany
A. Kaplan, H. -Ch. Schultz-Coulon, W. Shen, A. TaddayUniversity of Heidelberg, Fakultat fur Physik und Astronomie, Albert Uberle Str. 3-5 2.OG Ost,
D-69120 Heidelberg, Germany
B. Bilki, E. Norbeck, Y. OnelUniversity of Iowa, Dept. of Physics and Astronomy, 203 Van Allen Hall, Iowa City,
IA 52242-1479, USA
E. J. KimChonbuk National University, Jeonju, 561-756, South Korea
G. Kim, D-W. Kim, K. Lee, S. C. LeeKangnung National University, HEP/PD, Kangnung, South Korea
K. Kawagoe, Y. TamuraDepartment of Physics, Kobe University, Kobe, 657-8501, Japan
P. D. Dauncey, A. -M. Magnan, H. Yilmaz, O. ZorbaImperial College, Blackett Laboratory, Department of Physics, Prince Consort Road, London
SW7 2AZ, UK
V. Bartsch ‡, M. Postranecky, M. Warren, M. WingDepartment of Physics and Astronomy, University College London, Gower Street,
London WC1E 6BT, UK
M. G. Green, F. Salvatore ‡
Royal Holloway University of London, Dept. of Physics, Egham, Surrey TW20 0EX, UK
M. Bedjidian, R. Kieffer, I. LaktinehUniversité de Lyon, F-69622, Lyon, France ; Université de Lyon 1, Villeurbanne ; CNRS/IN2P3,
Institut de Physique Nucléaire de Lyon
M.-C. FouzCIEMAT, Centro de Investigaciones Energeticas, Medioambientales y Tecnologicas, Madrid.
Spain
D. S. Bailey, R. J. Barlow, M. Kelly, R. J. ThompsonThe University of Manchester, School of Physics and Astronomy, Schuster Lab,
Manchester M13 9PL, UK
M. Danilov, E. TarkovskyInstitute of Theoretical and Experimental Physics, B. Cheremushkinskaya ul. 25, RU-117218
Moscow, Russia
– 2 –
N. Baranova, D. Karmanov, M. Korolev, M. Merkin, A. VoroninM.V.Lomonosov Moscow State University, D.V.Skobeltsyn Institute of Nuclear Physics
(SINP MSU), 1/2 Leninskiye Gory, Moscow, 119991, Russia
A. Frey §, S. Lu¶, K. Seidel, F. Simon, C. Soldner, L. WeusteMax Planck Inst. für Physik, Föhringer Ring 6, D-80805 Munich, Germany
J. Bonis, B. Bouquet, S. Callier, P. Cornebise, Ph. Doublet, M. Faucci Giannelli,J. Fleury, H. Li, G. Martin-Chassard, F. Richard, Ch. de la Ta ille, R. Poeschl, L. Raux,
N. Seguin-Moreau, F. WicekLaboratoire de L’accélerateur Linéaire, Centre d’Orsay, Université de Paris-Sud XI, BP 34,
Bâtiment 200, F-91898 Orsay CEDEX, France
M. Anduze, V. Boudry, J-C. Brient, G. Gaycken, D. Jeans, P. Mo ra de Freitas,G. Musat, M. Reinhard, A. Rougé, M. Ruan, J-Ch. Vanel, H. Vide au
Laboratoire Leprince-Ringuet (LLR) – École Polytechnique, CNRS/IN2P3, Palaiseau, F-91128France
K-H. ParkPohang Accelerator Laboratory, Pohang 790-784, South Korea
J. ZacekCharles University, Institute of Particle & Nuclear Physics, V Holesovickach 2, CZ-18000
Prague 8, Czech Republic
J. Cvach, P. Gallus, M. Havranek, M. Janata, M. Marcisovsky, I. Polak, J. Popule,L. Tomasek, M. Tomasek, P. Ruzicka, P. Sicho, J. Smolik, V. Vr ba, J. Zalesak
Institute of Physics, Academy of Sciences of the Czech Republic, Na Slovance 2, CZ-18221Prague 8, Czech Republic
B. Belhorma, M. BelmirCentre National de l’Energie, des Sciences et des Techniques Nucléaires, B.P. 1382, R.P. 10001,
Rabat, Morocco
S. W. Nam, I. H. Park, J. YangEwha Womans University, Dept. of Physics, Seoul 120, South Korea
Jong-Seo Chai, Jong-Tae Kim, Geun-Bum KimSungkyunkwan University, 300 Cheoncheon-dong, Jangan-gu, Suwon, Gyeonggi-do 440-746,
South Korea
J. Kang, Y. -J. KwonYonsei University, Dept. of Physics, 134 Sinchon-dong, Sudaemoon-gu, Seoul 120-749,
South Korea
– 3 –
ABSTRACT: A prototype silicon-tungsten electromagnetic calorimeter for an ILC detector wastested in 2007 at the CERN SPS test beam. Data were collected with electron and hadron beamsin the energy range 8 to 80 GeV. The analysis described here focuses on the interactions of pionsin the calorimeter. One of the main objectives of the CALICE program is to validate the MonteCarlo tools available for the design of a full-sized detector. The interactions of pions in the Si-Wcalorimeter are therefore confronted with the predictionsof various physical models implementedin theGEANT4 simulation framework.
KEYWORDS: Detector physics: concepts, processes, methods, modelling and simulations;Calorimeter methods; Detector modelling and simulations I(interaction of radiation with matter,interaction of photons with matter, interaction of hadronswith matter, etc.) .
∗Now at CERN†Now at Dept. of Modern Physics, Univ. of Science and Technology of China, 96 Jinzhai Road, Hefei, Anhui,
230026, P. R. China‡Now at University of Sussex, Physics and Astronomy Department, Brighton, Sussex, BN1 9QH, UK§Now at Univ. of Göttingen¶Now at DESY
Contents
1. Introduction 1
2. The CALICE Si-W ECAL prototype 2
3. The test beam 3
4. Monte Carlo simulation 3
5. Selection of hadronic showers 7
6. Comparison between data and simulation 96.1 Total ECAL energy 96.2 Transverse energy profile 116.3 Longitudinal distribution of interaction point 136.4 Longitudinal energy profile 156.5 Physics lists under development 18
7. Summary 18
1. Introduction
The current designs of the calorimetry for detectors at the ILC are in large part driven by thedemands of jet energy reconstruction. A key aim is to achievea relative energy resolution of∼ 30%/
√
E/GeV; this precision would for example permit the reconstruction of the hadronicdecays of the W and Z bosons with a precision comparable with their natural widths, and wouldthus allow the W and Z to be distinguished in their hadronic (two-jet) decay modes.
This target for jet energy resolution is roughly a factor twobetter than achieved in previ-ous detectors. The most promising way to achieve it is believed to be through the “particleflow”approach [1]. The idea is that particles of different typesin jets should be reconstructed inthe different parts of the detector where they can be measured most precisely: the charged particlesin the tracking system, photons in the electromagnetic calorimeter (ECAL) and neutral hadrons ina combination of the ECAL and the hadronic calorimeter (HCAL). The key to this concept is tominimise confusion in the pattern recognition in the calorimeters, and to achieve this, high spatialgranularity is required. The optimum design of the ILC detectors can be addressed by Monte Carlosimulation, but in order to do this, it is crucial first to validate the Monte Carlo tools against data.
A first round of beam tests was performed at DESY and CERN in summer 2006, followed bymore complete tests in 2007. These tests were performed witha combined system of a silicon-tungsten (Si-W) ECAL, followed by a hadronic calorimeter and then a coarser tail catcher, the
– 1 –
latter two both built from a scintillator-iron sandwich structure. Since the ECAL has a length∼ 1.0λint., it will seldom fully contain a hadronic shower. However, more than half of hadronicshowers will start their development in the ECAL, so it is important to investigate the propertiesof hadronic showers initiated in the (mainly tungsten) material of the ECAL. The ECAL also hassome advantages for the study of hadronic shower properties. For example, the interaction pointcan be identified with good precision. The small ratio ofX0/λint. (a factor∼ 3 smaller for tungstenthan for iron) means that the electromagnetic products of the first interaction can be expected toshower rapidly after the interaction point, and we can hope to exploit the fine granularity of thedetector to separate them from the hadronic products. This means that the longitudinal showerdevelopment after the interaction point is potentially a particularly interesting quantity.
In Sect. 2 we briefly describe the main features of the Si-W calorimeter and in Sect. 3 weoutline the test beam setup at CERN. Then in Sect. 4 we review the Monte Carlo models withwhich the data are confronted. In Sect. 5 we explain the selection of data for comparison withsimulation in Sect. 6.
2. The CALICE Si-W ECAL prototype
The ECAL prototype used in this study is a silicon-tungsten sampling calorimeter, made of 30readout layers [2] . The active detectors were silicon wafers segmented into a 6×6 array of diodepads, each with a size of 1×1 cm2. The mechanical structure was built from tungsten sheetswrapped in carbon fibre. Between each sheet of tungsten, the structure contained alveolar slots,into which detector slabs were inserted, each consisting ofa further tungsten sheet sandwichedbetween two layers of sensors. The prototype was constructed from three stacks, each composed often layers of alternating tungsten and silicon, and each stack having a different tungsten thickness:1.4 mm or 0.4X0 per layer in the first stack, 2.8 mm or 0.8X0 per layer in the second stack and4.2 mm or 1.2X0 per layer in the rear stack. In terms of interaction lengths,these tungsten layerseach contribute∼ 1.4%λint., ∼ 2.7%λint. and∼ 4.1%λint. respectively. Other materials (mainlythe carbon-fibre–epoxy mechanical structure, PCBs and the silicon itself) contribute alternately∼ 0.2%λint. and∼ 1.0%λint. between successive samplings. The overall thickness is about 20 cm,corresponding to∼ 24.6X0 or∼ 1.0λint. at normal incidence.
A detailed description of the prototype’s hardware and of its commissioning in test beams atDESY and CERN in 2006, can be found in ref. [2], to which the reader is referred for much fullerdetails.
The full prototype consists of a 3×3 array of wafers (i.e. an 18×18 array of 1 cm2 pads) ineach layer. The version of the prototype tested at CERN in 2007 consisted of 30 layers, of whichinitially the first twelve were instrumented with a 3×2 array of wafers, and the remaining eighteenwere fully equipped with a 3×3 array. Later in the 2007 run six more layers were completed,leaving only the first six in a 3×2 configuration.
In offline analysis, the raw hit energies in each cell have their pedestals subtracted, and areconverted from raw ADC counts into Minimum Ionising Particle equivalents (MIPs), as explainedin ref. [2]. This gain correction is derived by finding the most probable energy deposition in eachcell in data recorded with a high energy muon beam [2], with a typical relative precision of∼ 0.5%per pad.
– 2 –
Mc1 is 1000x1000Sc1 and Sc3 are 100x100Sc2 is 200x200
Veto is 1000x1000, with a hole of 200x200 mm
11000
TOP
All distances are in mmFRONT
−2572 −847
−6991587.5
0−29−2272.5−2417.5
−2631
4018 4812−33135
2327.5
DC1,2,3
100
100
25000 35028
8 58 58 58
ECAL
201
HCAL1223
TCatcher1458
Mc19.5Cerenkov Sc1 DC2
26 118
Sc215
Veto29
123 612
DC3 DC1Sc3
8
115
14871407 60
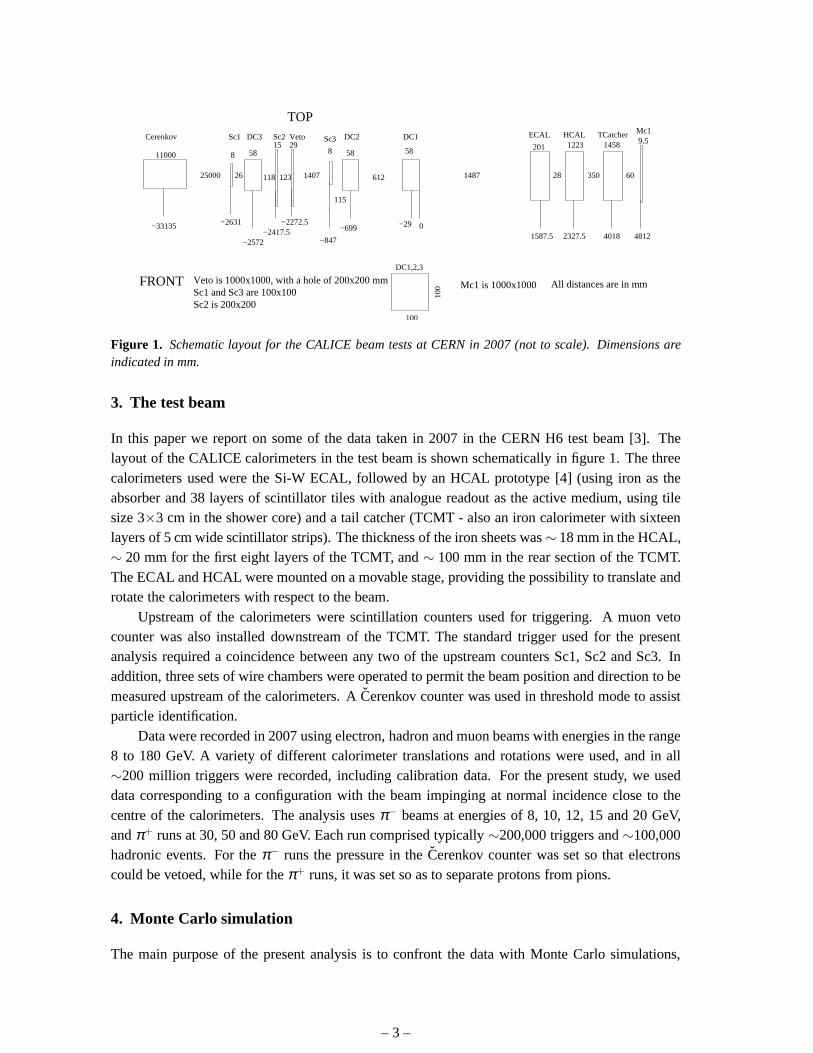
Figure 1. Schematic layout for the CALICE beam tests at CERN in 2007 (not to scale). Dimensions areindicated in mm.
3. The test beam
In this paper we report on some of the data taken in 2007 in the CERN H6 test beam [3]. Thelayout of the CALICE calorimeters in the test beam is shown schematically in figure 1. The threecalorimeters used were the Si-W ECAL, followed by an HCAL prototype [4] (using iron as theabsorber and 38 layers of scintillator tiles with analogue readout as the active medium, using tilesize 3×3 cm in the shower core) and a tail catcher (TCMT - also an iron calorimeter with sixteenlayers of 5 cm wide scintillator strips). The thickness of the iron sheets was∼ 18 mm in the HCAL,∼ 20 mm for the first eight layers of the TCMT, and∼ 100 mm in the rear section of the TCMT.The ECAL and HCAL were mounted on a movable stage, providing the possibility to translate androtate the calorimeters with respect to the beam.
Upstream of the calorimeters were scintillation counters used for triggering. A muon vetocounter was also installed downstream of the TCMT. The standard trigger used for the presentanalysis required a coincidence between any two of the upstream counters Sc1, Sc2 and Sc3. Inaddition, three sets of wire chambers were operated to permit the beam position and direction to bemeasured upstream of the calorimeters. ACerenkov counter was used in threshold mode to assistparticle identification.
Data were recorded in 2007 using electron, hadron and muon beams with energies in the range8 to 180 GeV. A variety of different calorimeter translations and rotations were used, and in all∼200 million triggers were recorded, including calibrationdata. For the present study, we useddata corresponding to a configuration with the beam impinging at normal incidence close to thecentre of the calorimeters. The analysis usesπ− beams at energies of 8, 10, 12, 15 and 20 GeV,andπ+ runs at 30, 50 and 80 GeV. Each run comprised typically∼200,000 triggers and∼100,000hadronic events. For theπ− runs the pressure in theCerenkov counter was set so that electronscould be vetoed, while for theπ+ runs, it was set so as to separate protons from pions.
4. Monte Carlo simulation
The main purpose of the present analysis is to confront the data with Monte Carlo simulations,
– 3 –
and specifically to test the different physical models available. These simulations were carried outin the framework ofGEANT4 [5], using version 4.9.3, released in December 2009. The resultspresented are based on samples of typically 50000 simulatedevents.
In order to describe the geometry of the CALICE prototypes within GEANT4we used the pro-gram Mokka [6], which is also capable of simulating full ILC detector geometries. For the currentstudy, the simulation of the ECAL is the most important. Individual silicon sensors, with their padstructure and guard rings, are represented in Mokka, as wellas the tungsten radiator, and otherpassive materials such as the carbon-fibre and epoxy of the support structure and the PCBs used forreadout. The layer-by-layer staggering of the wafer positions is simulated. Similar representationsof the HCAL and TCMT are also included. The detectors upstream of the calorimeter systems(Cerenkov, scintillators and tracking chambers) are also modelled by Mokka.
During particle transport inGEANT4, Mokka records the ionisation energy deposited in sen-sitive detectors (Silicon pads, scintillators etc.). A simple simulation of the noise contribution ineach cell is performed, as outlined in ref. [7]. At the end of the simulation, the summed energydeposits in each cell are finally converted into MIPs. The conversion factor is based on matchingthe minimum ionising energy peak in data and simulation. This procedure is estimated to lead toa∼ 1% systematic uncertainty in the relative energy scales of the data and simulation. As a firststep in the analysis, a hit energy cut of 0.6 MIPs is imposed inboth simulation and data, in orderto eliminate most noise-only hits. The hits are also required to occur within 150 ns of the beamarrival time at the trigger counters, in order to emulate thebehaviour of the readout electronics.
In the simulation, pions are simulated starting with a Gaussian transverse profile inx andy,1
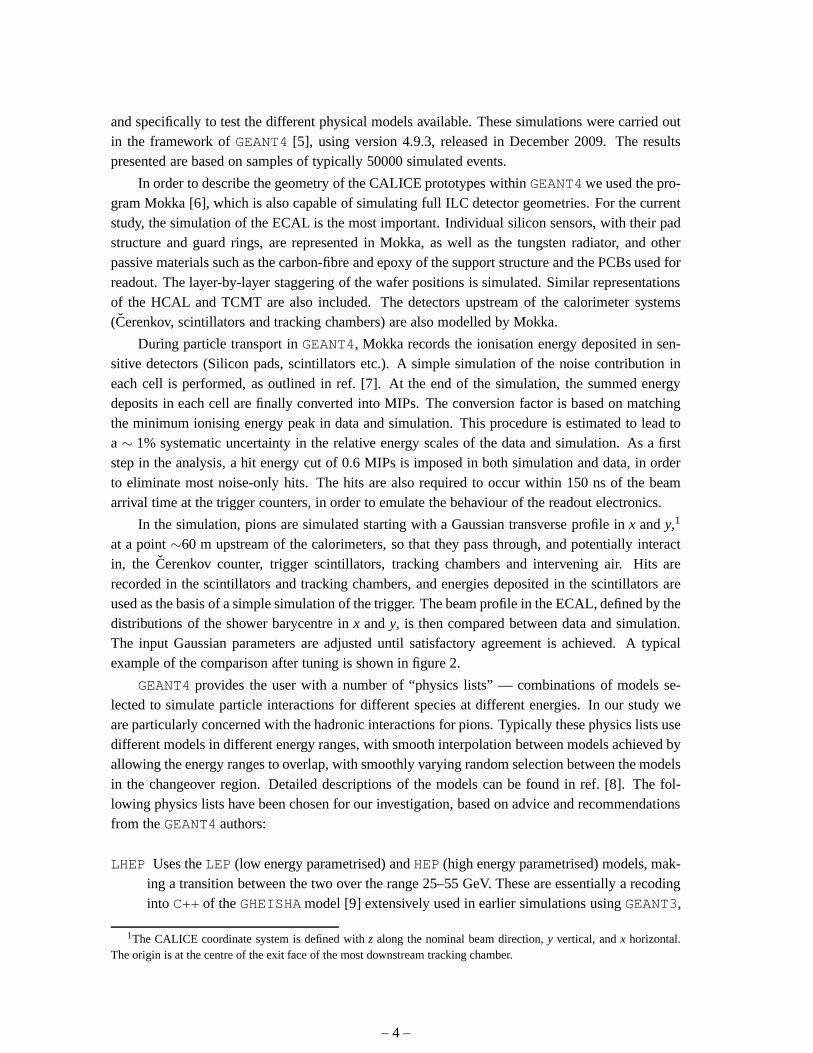
at a point∼60 m upstream of the calorimeters, so that they pass through,and potentially interactin, the Cerenkov counter, trigger scintillators, tracking chambers and intervening air. Hits arerecorded in the scintillators and tracking chambers, and energies deposited in the scintillators areused as the basis of a simple simulation of the trigger. The beam profile in the ECAL, defined by thedistributions of the shower barycentre inx andy, is then compared between data and simulation.The input Gaussian parameters are adjusted until satisfactory agreement is achieved. A typicalexample of the comparison after tuning is shown in figure 2.
GEANT4 provides the user with a number of “physics lists” — combinations of models se-lected to simulate particle interactions for different species at different energies. In our study weare particularly concerned with the hadronic interactionsfor pions. Typically these physics lists usedifferent models in different energy ranges, with smooth interpolation between models achieved byallowing the energy ranges to overlap, with smoothly varying random selection between the modelsin the changeover region. Detailed descriptions of the models can be found in ref. [8]. The fol-lowing physics lists have been chosen for our investigation, based on advice and recommendationsfrom theGEANT4 authors:
LHEP Uses theLEP (low energy parametrised) andHEP (high energy parametrised) models, mak-ing a transition between the two over the range 25–55 GeV. These are essentially a recodinginto C++ of theGHEISHAmodel [9] extensively used in earlier simulations usingGEANT3,
1The CALICE coordinate system is defined withz along the nominal beam direction,y vertical, andx horizontal.The origin is at the centre of the exit face of the most downstream tracking chamber.
– 4 –
<x> /mm-60 -40 -20 0 20 40 60
Eve
nts
0
1000
2000
3000
4000
5000
<y> /mm-60 -40 -20 0 20 40 60
Eve
nts
0
2000
4000
6000
8000
10000
12000
14000
16000CALICE
Figure 2. Example of the beam profiles in x and y (based on the shower centroid reconstructed in the ECAL)observed with a 20 GeVπ− beam. Data (points with error bars) are compared with the tuned simulation(solid histogram). The distributions are normalised to thesame numbers of events.
for example. It is still widely used, even though it is not regarded as the state-of-the-artchoice.
FTFP_BERT Uses theGEANT4 implementation of the Bertini cascade model2 [10] for low ener-gies, making a transition to theFTFP model, based on theGEANT4 implementation of theFritiof diffractive string model [11], at pion energies between 4 and 5 GeV. We have alsostudied theFTFP_BERT_TRV list, which has the same model content asFTFP_BERT, butwith a higher transition energy, in the region 6–8 GeV. In practice, for the data presentedhere, we find no significant differences between these two physics lists, so we only showFTFP_BERT here.
QGSP_BERT Uses the Bertini model [10] at low energies, making a transition to theLEP (GHEISHA)model between 9.5 and 9.9 GeV, and a further transition to theQGSP model between 12 and25 GeV.QGSP uses aGEANT4 implementation of a string model [12] for the high energyinteraction, supplemented by theGEANT4 precompound model[13] describing deexcitationof the nucleus. We have also studied theQGSP_BERT_HP list, which has the same modelcontent asQGSP_BERT, combined with a more accurate treatment of low energy neutronscattering. For the distributions presented in this paper we find no significant benefit in usingtheQGSP_BERT_HP list, and hence we only presentQGSP_BERT.
QGSP_BERT_TRV has the same model content asQGSP_BERT, but with the transition betweenLHEP andQGSP occurring at lower energy, in the region 10–15 GeV, in order to reduce thereliance onLHEP.
QGSP_FTFP_BERT Similar toQGSP_BERT, with different transition energies, and usingFTFPinstead ofLEP in the intermediate region.
QGS_BIC Uses theGEANT4 binary cascade model (BIC) [14] at the lowest energies, thenLEPin the intermediate region, andQGS at high energies. TheBIC model is also used for the
2This model incorporates the Bertini intra-nuclear cascademodel with excitons, a pre-equilibrium model, a nucleusexplosion model, a fission model, and an evaporation model.
– 5 –
rescattering of secondaries in this case (denotedQGSB below) and theGEANT4 precom-pound model is used to describe deexcitation of the nucleus.
QGSP_BIC In this case theBIC model is not used for pions (only for neutrons and protons), andthere is no rescattering of secondaries.LEP is used in the low energy region, andQGSP athigh energies.
FTF_BIC Uses theBIC model at low energies, with a transition to Fritiof between 4and 5 GeV.TheBIC model is again used for the rescattering of secondaries in this case (denotedFTFBbelow) and theGEANT4 precompound model is used to describe deexcitation of the nucleus.
The physics content of these models for pions is summarised in table 1. TheQGSP_BERT physicslist is generally favoured by the LHC general purpose detectors for calorimetry applications [15],based mainly on data from test beams of higher energies than those relevant for CALICE. In ouranalysis, we expect to be particularly sensitive to the model(s) used for the primary interaction atthe energy of the incident beam. This is indicated for each physics list in table 2.
Table 1. The table shows the physics models invoked for pion inelastic interactions in each physics list.Where ranges overlap,GEANT4 chooses randomly between models, with probabilities varying linearly withenergy over the range of overlap.
Physics List Model content (forπ±)
FTFP_BERT Bertini (0–5 GeV);FTFP (>4 GeV)QGSP_BERT Bertini (0–9.9 GeV);LEP (9.5–25 GeV);QGSP (>12 GeV)QGSP_BERT_TRV Bertini (0–9.9 GeV);LEP (9.5–15 GeV);QGSP (>10 GeV)QGSP_FTFP_BERT Bertini (0–8 GeV);FTFP (6–25 GeV);QGSP (>12 GeV)QGS_BIC BIC (0–1.3 GeV);LEP (1.2–25 GeV);QGSB (>12 GeV)QGSP_BIC LEP (<25 GeV);QGSP (>12 GeV)FTF_BIC BIC (0–5 GeV);FTFB (>4 GeV)LHEP LEP (0–55 GeV);HEP (>25 GeV)
Table 2. Indicates the physics model(s) which will be used for the primary pion interaction at each of thebeam energies considered here. Where two models are indicated with a solidus, an appropriate randomchoice is made byGEANT4.
Physics List 8 GeV 10 GeV 12 GeV 15 GeV 20 GeV 30 GeV 50 GeV 80 GeVFTFP_BERT FTFP FTFP FTFP FTFP FTFP FTFP FTFP FTFPQGSP_BERT BERT LEP LEP LEP/QGSP LEP/QGSP QGSP QGSP QGSP
QGSP_BERT_TRV BERT LEP LEP/QGSP QGSP QGSP QGSP QGSP QGSP
QGSP_FTFP_BERT FTFP FTFP FTFP FTFP/QGSP FTFP/QGSP QGSP QGSP QGSPQGS_BIC LEP LEP LEP LEP/QGSB LEP/QGSB QGSB QGSB QGSB
QGSP_BIC LEP LEP LEP LEP/QGSP LEP/QGSP QGSP QGSP QGSPFTF_BIC FTFB FTFB FTFB FTFB FTFB FTFB FTFB FTFB
LHEP LEP LEP LEP LEP LEP LEP/HEP LEP/HEP HEP
GEANT4 also provides several interesting physics lists based wholly or in part on theCHIPSmodel [16]. In this picture, the result of a hadronic or nuclear interaction is the creation of a quas-mon (essentially an intermediate state of excited hadronicmatter) which can dissipate energy byradiating particles statistically or by quark exchange with surrounding nucleons or clusters of nu-cleons. We have made studies of severalCHIPS-based physics lists, but we choose not to present
– 6 –
/MIPsHcalE
01002003004005006007008009001000 /MIPs
Ecal
E
01000
20003000
40005000
60007000
/MIP
sT
cmt
E
0
100
200
300
400
500
600
700
800-πCALICE 20 GeV
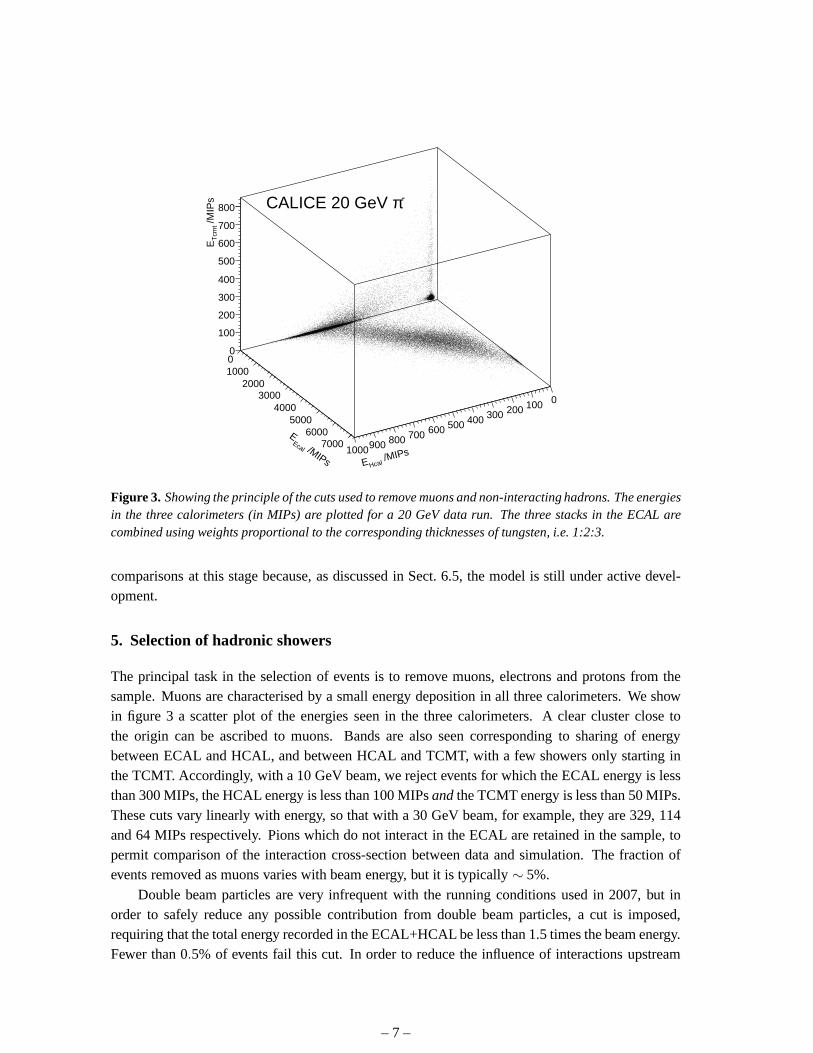
Figure 3. Showing the principle of the cuts used to remove muons and non-interacting hadrons. The energiesin the three calorimeters (in MIPs) are plotted for a 20 GeV data run. The three stacks in the ECAL arecombined using weights proportional to the corresponding thicknesses of tungsten, i.e. 1:2:3.
comparisons at this stage because, as discussed in Sect. 6.5, the model is still under active devel-opment.
5. Selection of hadronic showers
The principal task in the selection of events is to remove muons, electrons and protons from thesample. Muons are characterised by a small energy deposition in all three calorimeters. We showin figure 3 a scatter plot of the energies seen in the three calorimeters. A clear cluster close tothe origin can be ascribed to muons. Bands are also seen corresponding to sharing of energybetween ECAL and HCAL, and between HCAL and TCMT, with a few showers only starting inthe TCMT. Accordingly, with a 10 GeV beam, we reject events for which the ECAL energy is lessthan 300 MIPs, the HCAL energy is less than 100 MIPsandthe TCMT energy is less than 50 MIPs.These cuts vary linearly with energy, so that with a 30 GeV beam, for example, they are 329, 114and 64 MIPs respectively. Pions which do not interact in the ECAL are retained in the sample, topermit comparison of the interaction cross-section between data and simulation. The fraction ofevents removed as muons varies with beam energy, but it is typically ∼ 5%.
Double beam particles are very infrequent with the running conditions used in 2007, but inorder to safely reduce any possible contribution from double beam particles, a cut is imposed,requiring that the total energy recorded in the ECAL+HCAL beless than 1.5 times the beam energy.Fewer than 0.5% of events fail this cut. In order to reduce the influence of interactions upstream
– 7 –
/GeVEcalE0 2 4 6 8 10 12 14 16
Eve
nts
1000
2000
3000
4000
5000CALICE (a)
/GeVEcalE0 5 10 15 20 25 30 35
Eve
nts
0
500
1000
1500
2000
2500
3000
3500
CALICE (b)
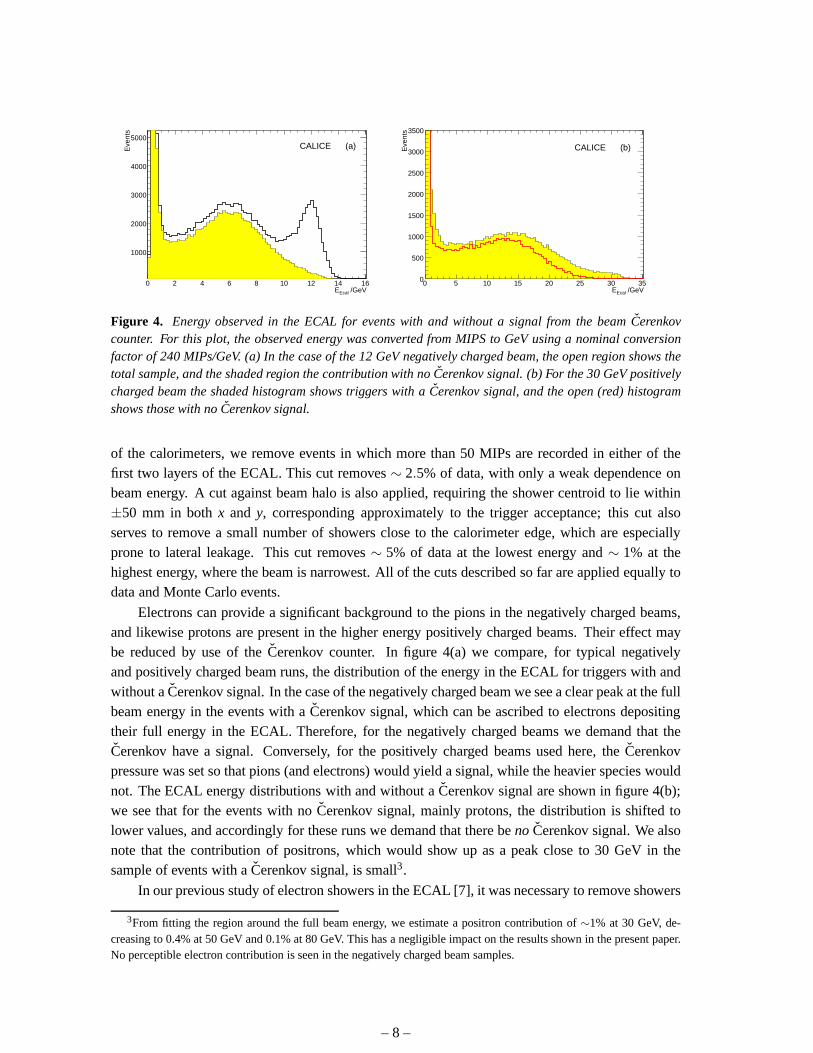
Figure 4. Energy observed in the ECAL for events with and without a signal from the beamCerenkovcounter. For this plot, the observed energy was converted from MIPS to GeV using a nominal conversionfactor of 240 MIPs/GeV. (a) In the case of the 12 GeV negatively charged beam, the open region shows thetotal sample, and the shaded region the contribution with noCerenkov signal. (b) For the 30 GeV positivelycharged beam the shaded histogram shows triggers with aCerenkov signal, and the open (red) histogramshows those with noCerenkov signal.
of the calorimeters, we remove events in which more than 50 MIPs are recorded in either of thefirst two layers of the ECAL. This cut removes∼ 2.5% of data, with only a weak dependence onbeam energy. A cut against beam halo is also applied, requiring the shower centroid to lie within±50 mm in bothx and y, corresponding approximately to the trigger acceptance; this cut alsoserves to remove a small number of showers close to the calorimeter edge, which are especiallyprone to lateral leakage. This cut removes∼ 5% of data at the lowest energy and∼ 1% at thehighest energy, where the beam is narrowest. All of the cuts described so far are applied equally todata and Monte Carlo events.
Electrons can provide a significant background to the pions in the negatively charged beams,and likewise protons are present in the higher energy positively charged beams. Their effect maybe reduced by use of theCerenkov counter. In figure 4(a) we compare, for typical negativelyand positively charged beam runs, the distribution of the energy in the ECAL for triggers with andwithout aCerenkov signal. In the case of the negatively charged beam we see a clear peak at the fullbeam energy in the events with aCerenkov signal, which can be ascribed to electrons depositingtheir full energy in the ECAL. Therefore, for the negativelycharged beams we demand that theCerenkov have a signal. Conversely, for the positively charged beams used here, theCerenkovpressure was set so that pions (and electrons) would yield a signal, while the heavier species wouldnot. The ECAL energy distributions with and without aCerenkov signal are shown in figure 4(b);we see that for the events with noCerenkov signal, mainly protons, the distribution is shifted tolower values, and accordingly for these runs we demand that there beno Cerenkov signal. We alsonote that the contribution of positrons, which would show upas a peak close to 30 GeV in thesample of events with aCerenkov signal, is small3.
In our previous study of electron showers in the ECAL [7], it was necessary to remove showers
3From fitting the region around the full beam energy, we estimate a positron contribution of∼1% at 30 GeV, de-creasing to 0.4% at 50 GeV and 0.1% at 80 GeV. This has a negligible impact on the results shown in the present paper.No perceptible electron contribution is seen in the negatively charged beam samples.
– 8 –
/GeVbeamE0 10 20 30 40 50 60 70 80
Non
-inte
ract
ing
frac
tion
0.36
0.38
0.4
0.42
0.44
0.46
0.48
0.5
QGSP_BERT QGSP_BERT_TRV
QGSP_FTFP_BERT FTFP_BERT
/GeVbeamE0 10 20 30 40 50 60 70 80
Non
-inte
ract
ing
frac
tion
0.36
0.38
0.4
0.42
0.44
0.46
0.48
0.5
CALICE FTF_BIC QGS_BIC
QGSP_BIC LHEP
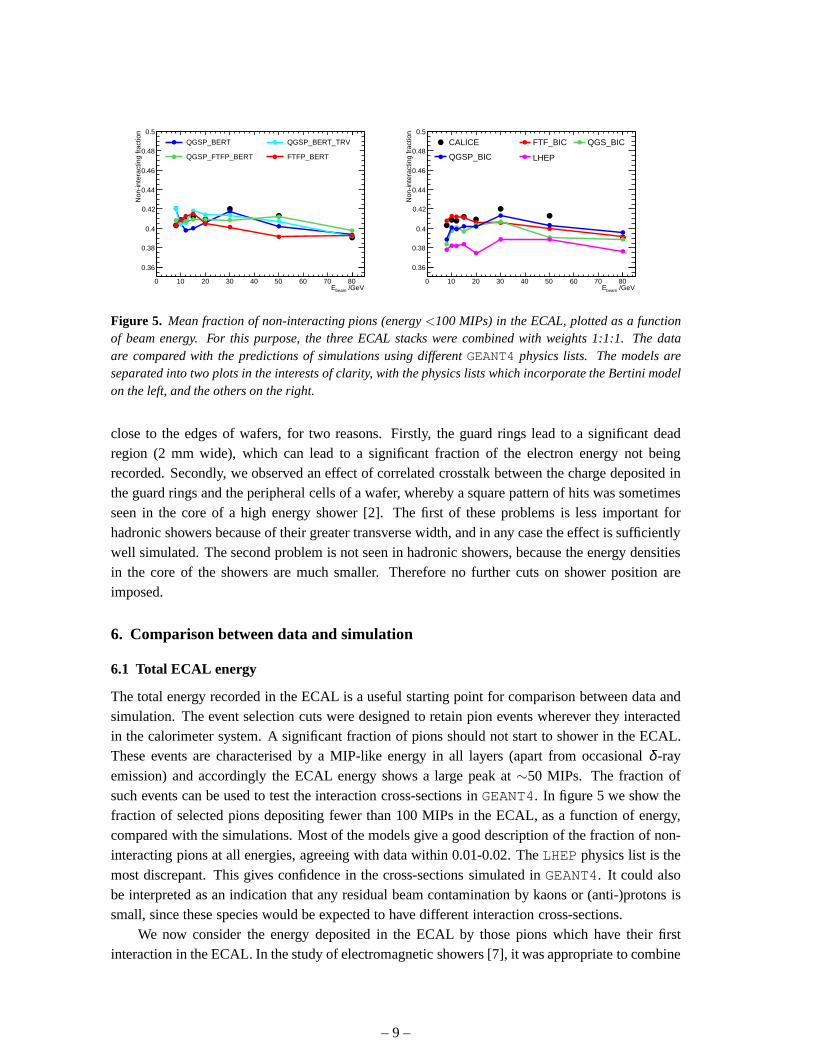
Figure 5. Mean fraction of non-interacting pions (energy<100 MIPs) in the ECAL, plotted as a functionof beam energy. For this purpose, the three ECAL stacks were combined with weights 1:1:1. The dataare compared with the predictions of simulations using differentGEANT4 physics lists. The models areseparated into two plots in the interests of clarity, with the physics lists which incorporate the Bertini modelon the left, and the others on the right.
close to the edges of wafers, for two reasons. Firstly, the guard rings lead to a significant deadregion (2 mm wide), which can lead to a significant fraction ofthe electron energy not beingrecorded. Secondly, we observed an effect of correlated crosstalk between the charge deposited inthe guard rings and the peripheral cells of a wafer, whereby asquare pattern of hits was sometimesseen in the core of a high energy shower [2]. The first of these problems is less important forhadronic showers because of their greater transverse width, and in any case the effect is sufficientlywell simulated. The second problem is not seen in hadronic showers, because the energy densitiesin the core of the showers are much smaller. Therefore no further cuts on shower position areimposed.
6. Comparison between data and simulation
6.1 Total ECAL energy
The total energy recorded in the ECAL is a useful starting point for comparison between data andsimulation. The event selection cuts were designed to retain pion events wherever they interactedin the calorimeter system. A significant fraction of pions should not start to shower in the ECAL.These events are characterised by a MIP-like energy in all layers (apart from occasionalδ -rayemission) and accordingly the ECAL energy shows a large peakat ∼50 MIPs. The fraction ofsuch events can be used to test the interaction cross-sections inGEANT4. In figure 5 we show thefraction of selected pions depositing fewer than 100 MIPs inthe ECAL, as a function of energy,compared with the simulations. Most of the models give a gooddescription of the fraction of non-interacting pions at all energies, agreeing with data within 0.01-0.02. TheLHEP physics list is themost discrepant. This gives confidence in the cross-sections simulated inGEANT4. It could alsobe interpreted as an indication that any residual beam contamination by kaons or (anti-)protons issmall, since these species would be expected to have different interaction cross-sections.
We now consider the energy deposited in the ECAL by those pions which have their firstinteraction in the ECAL. In the study of electromagnetic showers [7], it was appropriate to combine
– 9 –
/MIPs ECAL E500 1000 1500 2000 2500 3000
Eve
nts
0
500
1000
1500
2000
2500
-πCALICE 8 GeV
/MIPs ECAL E500 1000 1500 2000 2500 3000 3500 4000 4500 50000
200
400
600
800
1000
1200
1400
1600
1800
2000
2200 -πCALICE 15 GeV
/MIPs ECAL E1000 2000 3000 4000 5000 6000 7000 8000 9000
Eve
nts
0
200
400
600
800
1000
1200
1400
1600
1800+πCALICE 30 GeV
/MIPs ECAL E5000 10000 15000 20000
Eve
nts
0
200
400
600
800
1000
1200
1400
1600
1800
2000
2200
2400
+πCALICE 80 GeV
Figure 6. Distributions of total energy recorded in the ECAL at 8, 15, 30 and 80 GeV (points with errorbars), compared with Monte Carlo predictions using the QGSP_BERT physics list (solid histograms). Thedistributions are normalised to the same numbers of selected events (including the non-interacting peak).
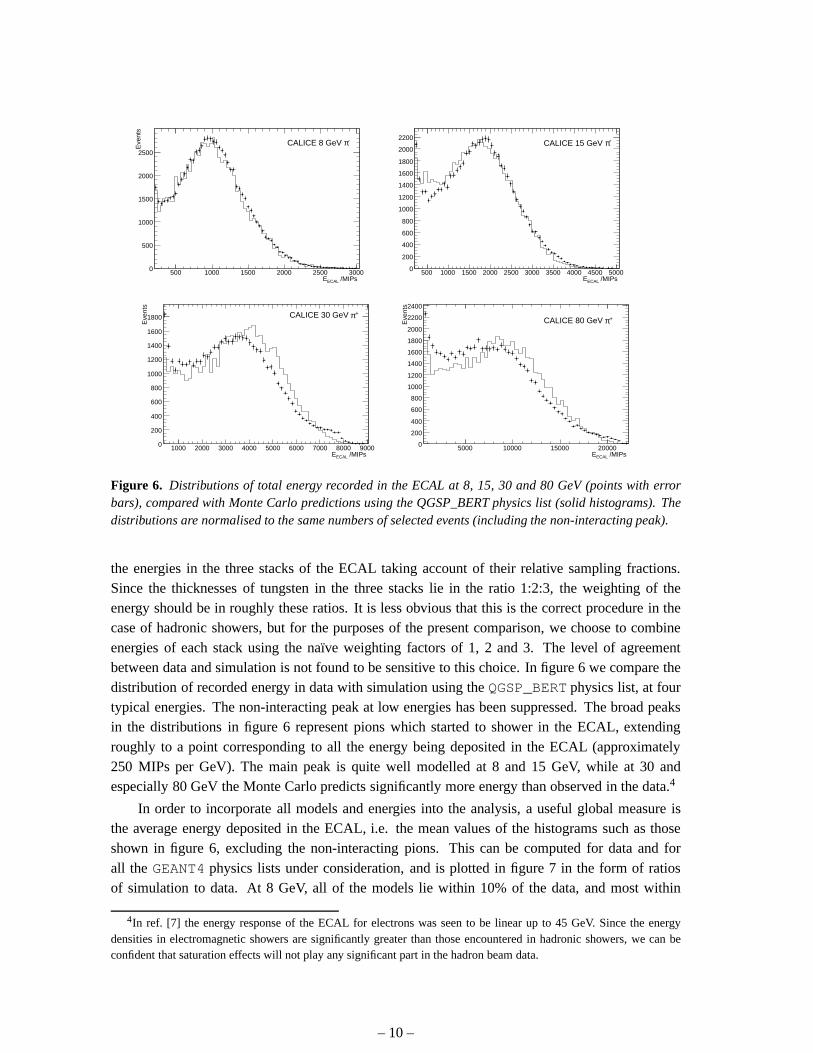
the energies in the three stacks of the ECAL taking account oftheir relative sampling fractions.Since the thicknesses of tungsten in the three stacks lie in the ratio 1:2:3, the weighting of theenergy should be in roughly these ratios. It is less obvious that this is the correct procedure in thecase of hadronic showers, but for the purposes of the presentcomparison, we choose to combineenergies of each stack using the naïve weighting factors of 1, 2 and 3. The level of agreementbetween data and simulation is not found to be sensitive to this choice. In figure 6 we compare thedistribution of recorded energy in data with simulation using theQGSP_BERT physics list, at fourtypical energies. The non-interacting peak at low energieshas been suppressed. The broad peaksin the distributions in figure 6 represent pions which started to shower in the ECAL, extendingroughly to a point corresponding to all the energy being deposited in the ECAL (approximately250 MIPs per GeV). The main peak is quite well modelled at 8 and15 GeV, while at 30 andespecially 80 GeV the Monte Carlo predicts significantly more energy than observed in the data.4
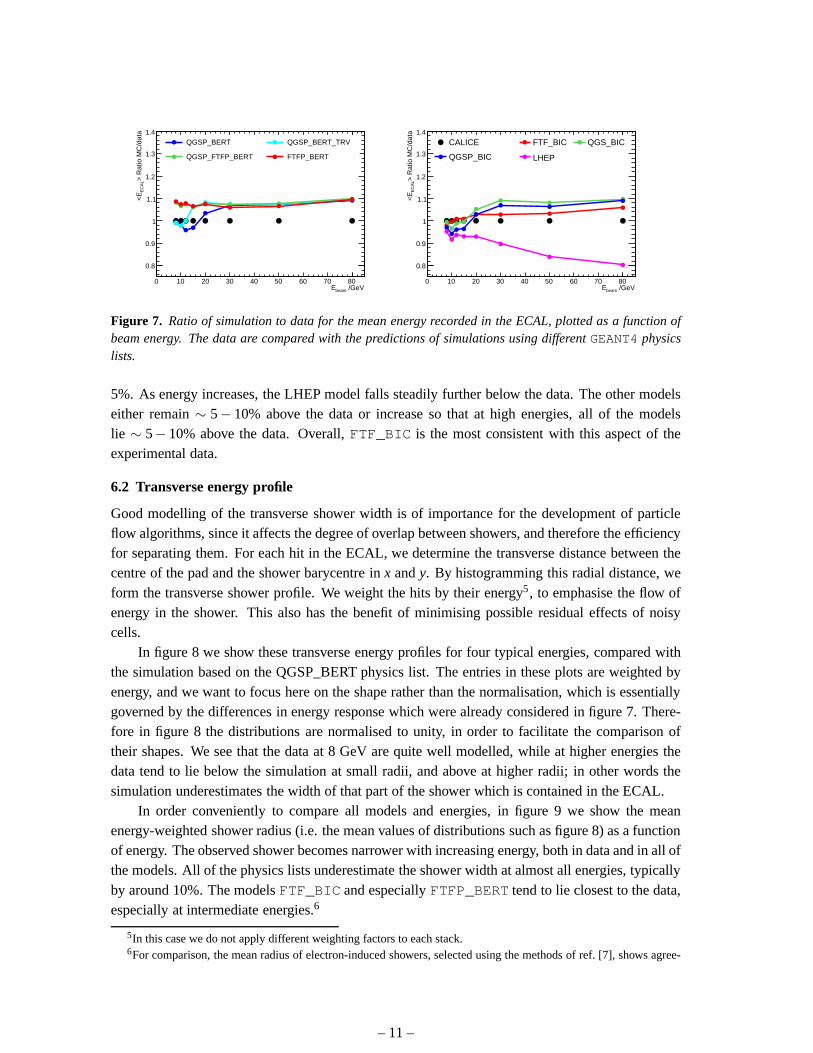
In order to incorporate all models and energies into the analysis, a useful global measure isthe average energy deposited in the ECAL, i.e. the mean values of the histograms such as thoseshown in figure 6, excluding the non-interacting pions. Thiscan be computed for data and forall theGEANT4 physics lists under consideration, and is plotted in figure 7in the form of ratiosof simulation to data. At 8 GeV, all of the models lie within 10% of the data, and most within
4In ref. [7] the energy response of the ECAL for electrons was seen to be linear up to 45 GeV. Since the energydensities in electromagnetic showers are significantly greater than those encountered in hadronic showers, we can beconfident that saturation effects will not play any significant part in the hadron beam data.
– 10 –
/GeVbeamE0 10 20 30 40 50 60 70 80
> R
atio
MC
/dat
aE
CA
L<
E
0.8
0.9
1
1.1
1.2
1.3
1.4
QGSP_BERT QGSP_BERT_TRV
QGSP_FTFP_BERT FTFP_BERT
/GeVbeamE0 10 20 30 40 50 60 70 80
> R
atio
MC
/dat
aE
CA
L<
E
0.8
0.9
1
1.1
1.2
1.3
1.4
CALICE FTF_BIC QGS_BIC
QGSP_BIC LHEP
Figure 7. Ratio of simulation to data for the mean energy recorded in the ECAL, plotted as a function ofbeam energy. The data are compared with the predictions of simulations using differentGEANT4 physicslists.
5%. As energy increases, the LHEP model falls steadily further below the data. The other modelseither remain∼ 5− 10% above the data or increase so that at high energies, all ofthe modelslie ∼ 5− 10% above the data. Overall,FTF_BIC is the most consistent with this aspect of theexperimental data.
6.2 Transverse energy profile
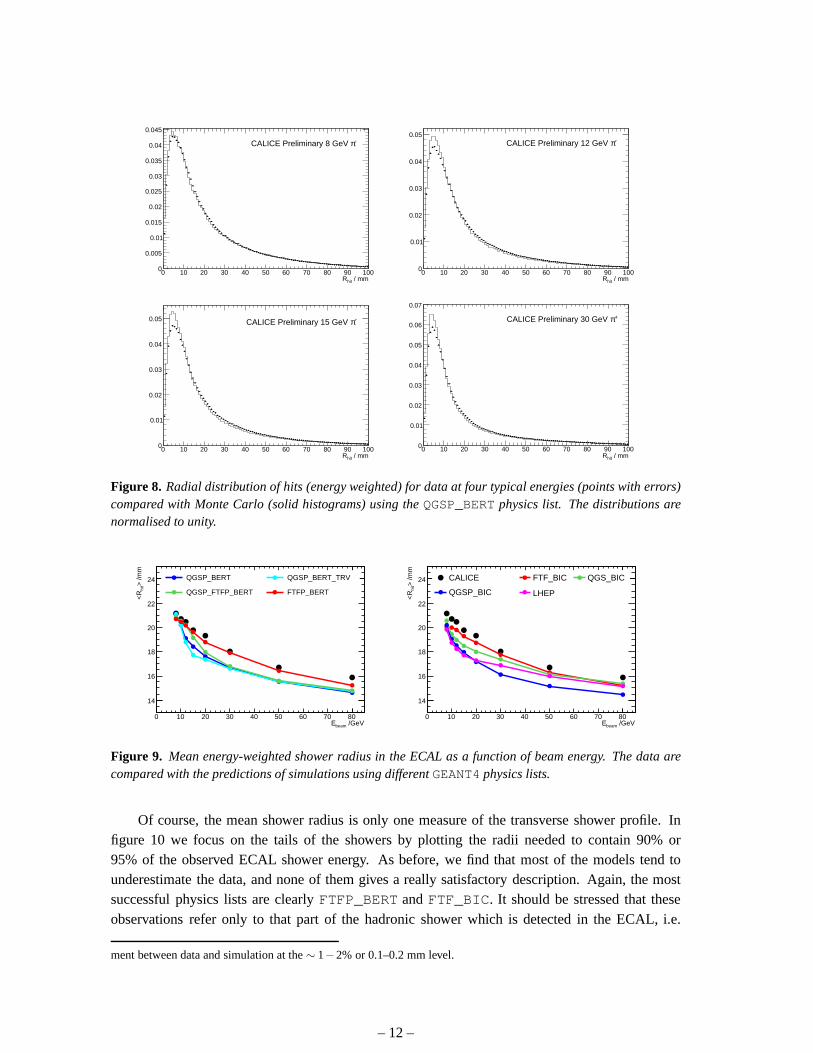
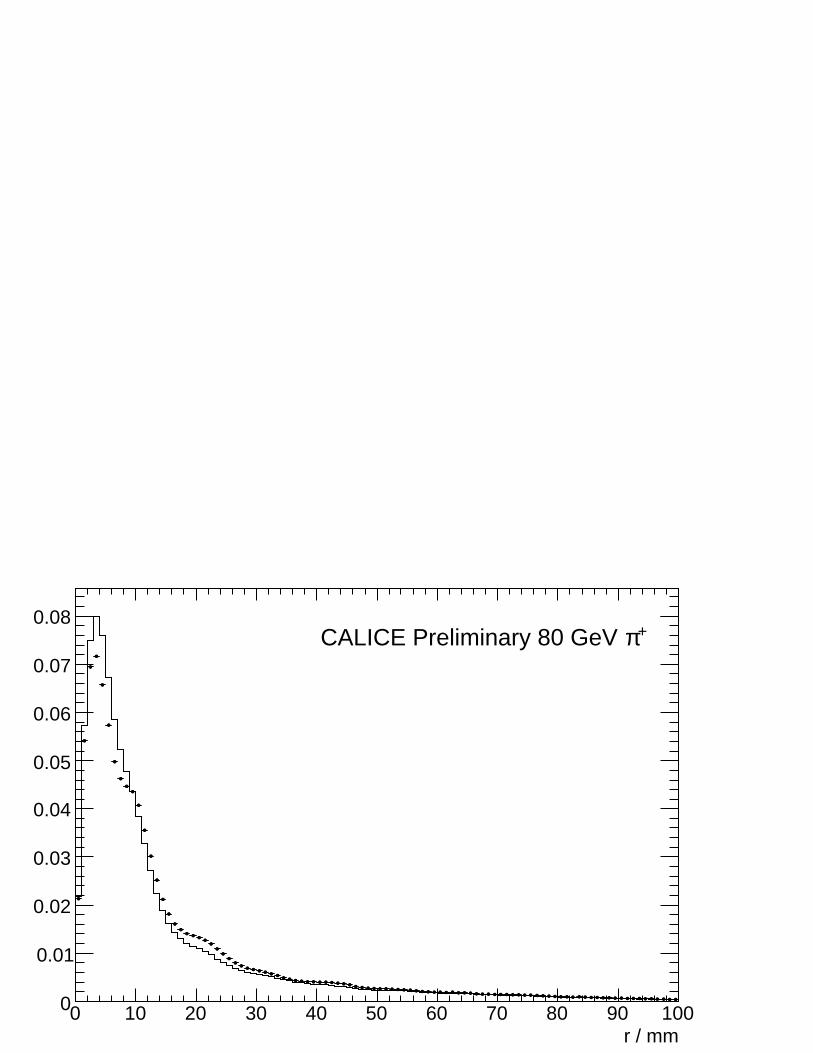
Good modelling of the transverse shower width is of importance for the development of particleflow algorithms, since it affects the degree of overlap between showers, and therefore the efficiencyfor separating them. For each hit in the ECAL, we determine the transverse distance between thecentre of the pad and the shower barycentre inx andy. By histogramming this radial distance, weform the transverse shower profile. We weight the hits by their energy5, to emphasise the flow ofenergy in the shower. This also has the benefit of minimising possible residual effects of noisycells.
In figure 8 we show these transverse energy profiles for four typical energies, compared withthe simulation based on the QGSP_BERT physics list. The entries in these plots are weighted byenergy, and we want to focus here on the shape rather than the normalisation, which is essentiallygoverned by the differences in energy response which were already considered in figure 7. There-fore in figure 8 the distributions are normalised to unity, inorder to facilitate the comparison oftheir shapes. We see that the data at 8 GeV are quite well modelled, while at higher energies thedata tend to lie below the simulation at small radii, and above at higher radii; in other words thesimulation underestimates the width of that part of the shower which is contained in the ECAL.
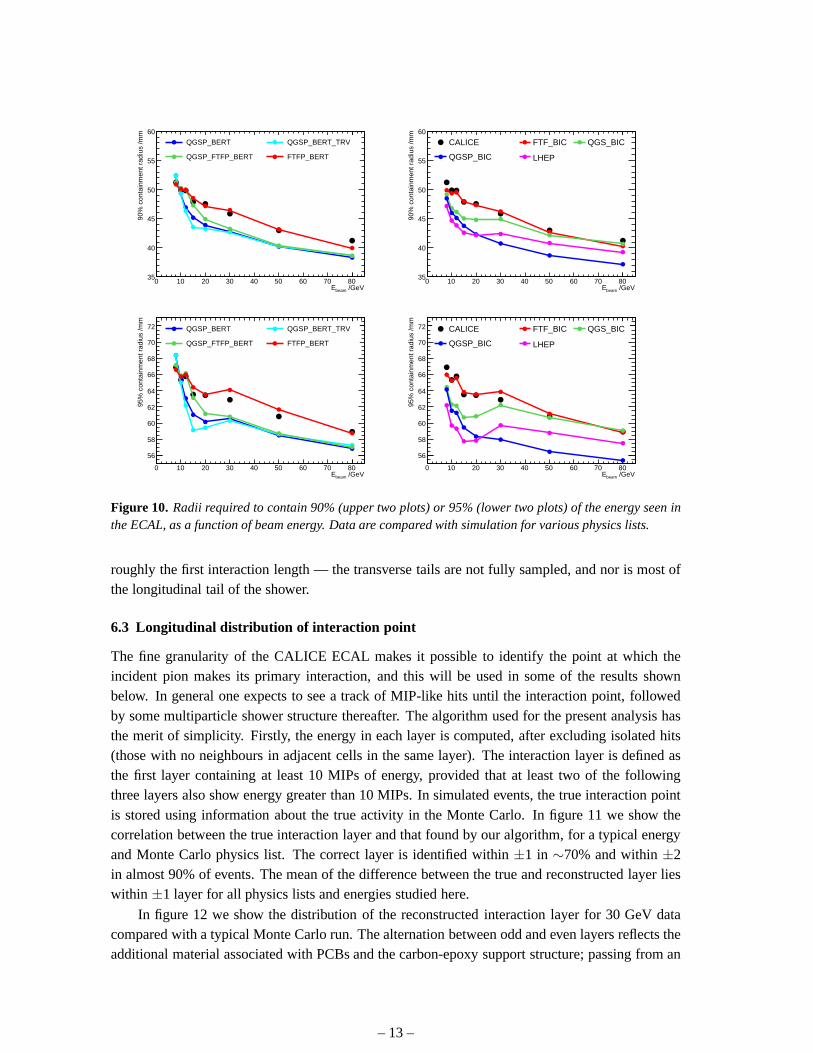
In order conveniently to compare all models and energies, infigure 9 we show the meanenergy-weighted shower radius (i.e. the mean values of distributions such as figure 8) as a functionof energy. The observed shower becomes narrower with increasing energy, both in data and in all ofthe models. All of the physics lists underestimate the shower width at almost all energies, typicallyby around 10%. The modelsFTF_BIC and especiallyFTFP_BERT tend to lie closest to the data,especially at intermediate energies.6
5In this case we do not apply different weighting factors to each stack.6For comparison, the mean radius of electron-induced showers, selected using the methods of ref. [7], shows agree-
– 11 –
/ mmhit R0 10 20 30 40 50 60 70 80 90 1000
0.005
0.01
0.015
0.02
0.025
0.03
0.035
0.04
0.045
-πCALICE Preliminary 8 GeV
/ mmhit R0 10 20 30 40 50 60 70 80 90 1000
0.01
0.02
0.03
0.04
0.05-πCALICE Preliminary 12 GeV
/ mmhit R0 10 20 30 40 50 60 70 80 90 1000
0.01
0.02
0.03
0.04
0.05 -πCALICE Preliminary 15 GeV
/ mmhit R0 10 20 30 40 50 60 70 80 90 1000
0.01
0.02
0.03
0.04
0.05
0.06
0.07
+πCALICE Preliminary 30 GeV
Figure 8. Radial distribution of hits (energy weighted) for data at four typical energies (points with errors)compared with Monte Carlo (solid histograms) using theQGSP_BERT physics list. The distributions arenormalised to unity.
/GeVbeamE0 10 20 30 40 50 60 70 80
> /m
mhi
t<
R
14
16
18
20
22
24 QGSP_BERT QGSP_BERT_TRV
QGSP_FTFP_BERT FTFP_BERT
/GeVbeamE0 10 20 30 40 50 60 70 80
> /m
mhi
t<
R
14
16
18
20
22
24 CALICE FTF_BIC QGS_BIC
QGSP_BIC LHEP
Figure 9. Mean energy-weighted shower radius in the ECAL as a functionof beam energy. The data arecompared with the predictions of simulations using different GEANT4 physics lists.
Of course, the mean shower radius is only one measure of the transverse shower profile. Infigure 10 we focus on the tails of the showers by plotting the radii needed to contain 90% or95% of the observed ECAL shower energy. As before, we find thatmost of the models tend tounderestimate the data, and none of them gives a really satisfactory description. Again, the mostsuccessful physics lists are clearlyFTFP_BERT andFTF_BIC. It should be stressed that theseobservations refer only to that part of the hadronic shower which is detected in the ECAL, i.e.
ment between data and simulation at the∼ 1−2% or 0.1–0.2 mm level.
– 12 –
/GeVbeamE0 10 20 30 40 50 60 70 80
90%
con
tain
men
t rad
ius
/mm
35
40
45
50
55
60
QGSP_BERT QGSP_BERT_TRV
QGSP_FTFP_BERT FTFP_BERT
/GeVbeamE0 10 20 30 40 50 60 70 80
90%
con
tain
men
t rad
ius
/mm
35
40
45
50
55
60
CALICE FTF_BIC QGS_BIC
QGSP_BIC LHEP
/GeVbeamE0 10 20 30 40 50 60 70 80
95%
con
tain
men
t rad
ius
/mm
56
58
60
62
64
66
68
70
72 QGSP_BERT QGSP_BERT_TRV
QGSP_FTFP_BERT FTFP_BERT
/GeVbeamE0 10 20 30 40 50 60 70 80
95%
con
tain
men
t rad
ius
/mm
56
58
60
62
64
66
68
70
72 CALICE FTF_BIC QGS_BIC
QGSP_BIC LHEP
Figure 10. Radii required to contain 90% (upper two plots) or 95% (lowertwo plots) of the energy seen inthe ECAL, as a function of beam energy. Data are compared withsimulation for various physics lists.
roughly the first interaction length — the transverse tails are not fully sampled, and nor is most ofthe longitudinal tail of the shower.
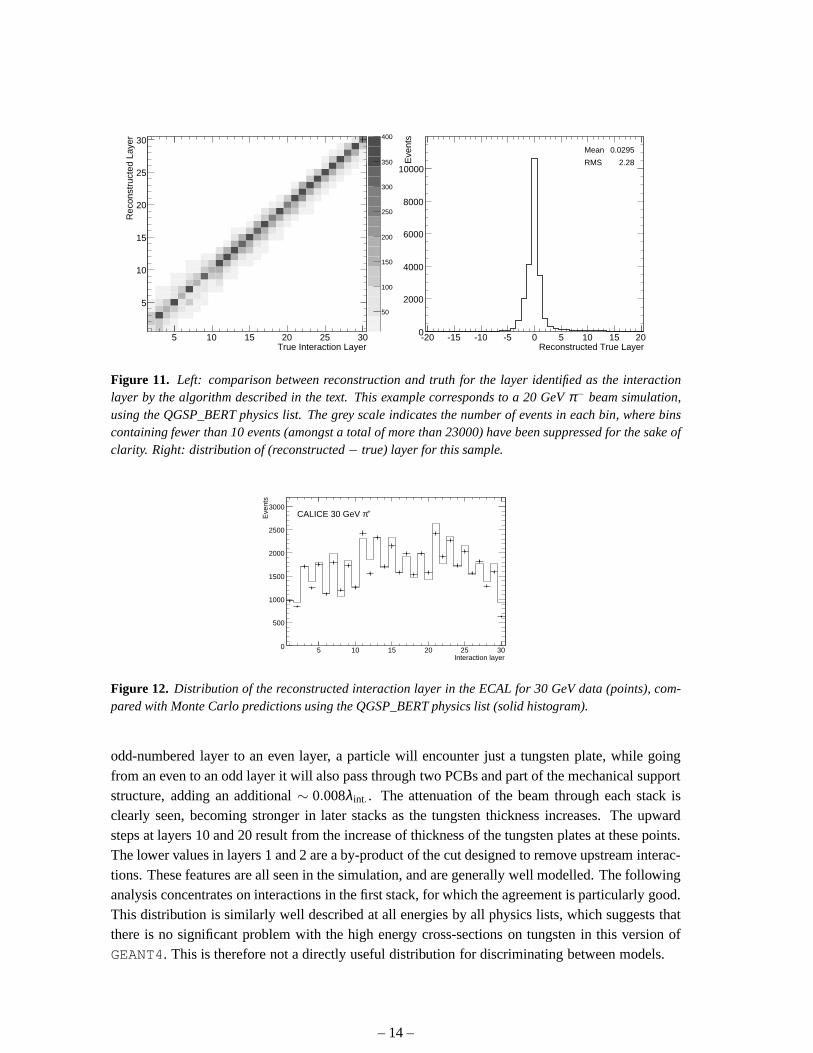
6.3 Longitudinal distribution of interaction point
The fine granularity of the CALICE ECAL makes it possible to identify the point at which theincident pion makes its primary interaction, and this will be used in some of the results shownbelow. In general one expects to see a track of MIP-like hits until the interaction point, followedby some multiparticle shower structure thereafter. The algorithm used for the present analysis hasthe merit of simplicity. Firstly, the energy in each layer iscomputed, after excluding isolated hits(those with no neighbours in adjacent cells in the same layer). The interaction layer is defined asthe first layer containing at least 10 MIPs of energy, provided that at least two of the followingthree layers also show energy greater than 10 MIPs. In simulated events, the true interaction pointis stored using information about the true activity in the Monte Carlo. In figure 11 we show thecorrelation between the true interaction layer and that found by our algorithm, for a typical energyand Monte Carlo physics list. The correct layer is identifiedwithin ±1 in ∼70% and within±2in almost 90% of events. The mean of the difference between the true and reconstructed layer lieswithin ±1 layer for all physics lists and energies studied here.
In figure 12 we show the distribution of the reconstructed interaction layer for 30 GeV datacompared with a typical Monte Carlo run. The alternation between odd and even layers reflects theadditional material associated with PCBs and the carbon-epoxy support structure; passing from an
– 13 –
True Interaction Layer5 10 15 20 25 30
Rec
onst
ruct
ed L
ayer
5
10
15
20
25
30
50
100
150
200
250
300
350
400
Mean 0.0295
RMS 2.28
Reconstructed True Layer-20 -15 -10 -5 0 5 10 15 20
Eve
nts
0
2000
4000
6000
8000
10000
Mean 0.0295
RMS 2.28
Figure 11. Left: comparison between reconstruction and truth for the layer identified as the interactionlayer by the algorithm described in the text. This example corresponds to a 20 GeVπ− beam simulation,using the QGSP_BERT physics list. The grey scale indicates the number of events in each bin, where binscontaining fewer than 10 events (amongst a total of more than23000) have been suppressed for the sake ofclarity. Right: distribution of (reconstructed− true) layer for this sample.
Interaction layer5 10 15 20 25 30
Eve
nts
0
500
1000
1500
2000
2500
3000+πCALICE 30 GeV
Figure 12. Distribution of the reconstructed interaction layer in theECAL for 30 GeV data (points), com-pared with Monte Carlo predictions using the QGSP_BERT physics list (solid histogram).
odd-numbered layer to an even layer, a particle will encounter just a tungsten plate, while goingfrom an even to an odd layer it will also pass through two PCBs and part of the mechanical supportstructure, adding an additional∼ 0.008λint.. The attenuation of the beam through each stack isclearly seen, becoming stronger in later stacks as the tungsten thickness increases. The upwardsteps at layers 10 and 20 result from the increase of thickness of the tungsten plates at these points.The lower values in layers 1 and 2 are a by-product of the cut designed to remove upstream interac-tions. These features are all seen in the simulation, and aregenerally well modelled. The followinganalysis concentrates on interactions in the first stack, for which the agreement is particularly good.This distribution is similarly well described at all energies by all physics lists, which suggests thatthere is no significant problem with the high energy cross-sections on tungsten in this version ofGEANT4. This is therefore not a directly useful distribution for discriminating between models.
– 14 –
Layer no.0 5 10 15 20 25 30
<E
nerg
y> /
MIP
s
0
20
40
60
80
100
120-
CALICE 10 GeV e
Figure 13. Energy per layer in the ECAL for 10 GeV electron data (points), compared with Monte Carlopredictions (solid histogram).
6.4 Longitudinal energy profile
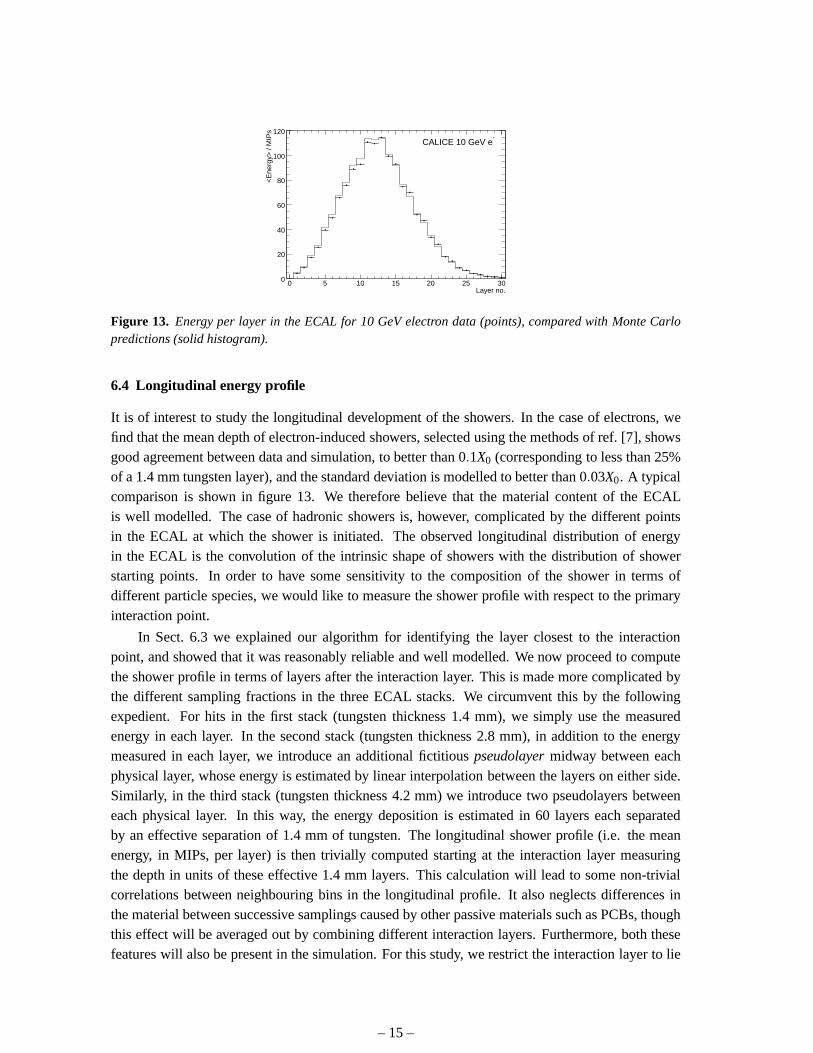
It is of interest to study the longitudinal development of the showers. In the case of electrons, wefind that the mean depth of electron-induced showers, selected using the methods of ref. [7], showsgood agreement between data and simulation, to better than 0.1X0 (corresponding to less than 25%of a 1.4 mm tungsten layer), and the standard deviation is modelled to better than 0.03X0. A typicalcomparison is shown in figure 13. We therefore believe that the material content of the ECALis well modelled. The case of hadronic showers is, however, complicated by the different pointsin the ECAL at which the shower is initiated. The observed longitudinal distribution of energyin the ECAL is the convolution of the intrinsic shape of showers with the distribution of showerstarting points. In order to have some sensitivity to the composition of the shower in terms ofdifferent particle species, we would like to measure the shower profile with respect to the primaryinteraction point.
In Sect. 6.3 we explained our algorithm for identifying the layer closest to the interactionpoint, and showed that it was reasonably reliable and well modelled. We now proceed to computethe shower profile in terms of layers after the interaction layer. This is made more complicated bythe different sampling fractions in the three ECAL stacks. We circumvent this by the followingexpedient. For hits in the first stack (tungsten thickness 1.4 mm), we simply use the measuredenergy in each layer. In the second stack (tungsten thickness 2.8 mm), in addition to the energymeasured in each layer, we introduce an additional fictitious pseudolayermidway between eachphysical layer, whose energy is estimated by linear interpolation between the layers on either side.Similarly, in the third stack (tungsten thickness 4.2 mm) weintroduce two pseudolayers betweeneach physical layer. In this way, the energy deposition is estimated in 60 layers each separatedby an effective separation of 1.4 mm of tungsten. The longitudinal shower profile (i.e. the meanenergy, in MIPs, per layer) is then trivially computed starting at the interaction layer measuringthe depth in units of these effective 1.4 mm layers. This calculation will lead to some non-trivialcorrelations between neighbouring bins in the longitudinal profile. It also neglects differences inthe material between successive samplings caused by other passive materials such as PCBs, thoughthis effect will be averaged out by combining different interaction layers. Furthermore, both thesefeatures will also be present in the simulation. For this study, we restrict the interaction layer to lie
– 15 –
in the first stack, so that at least 50 effective layers are available for observation the shower profile,corresponding to∼ 20X0 or 0.8 λint..
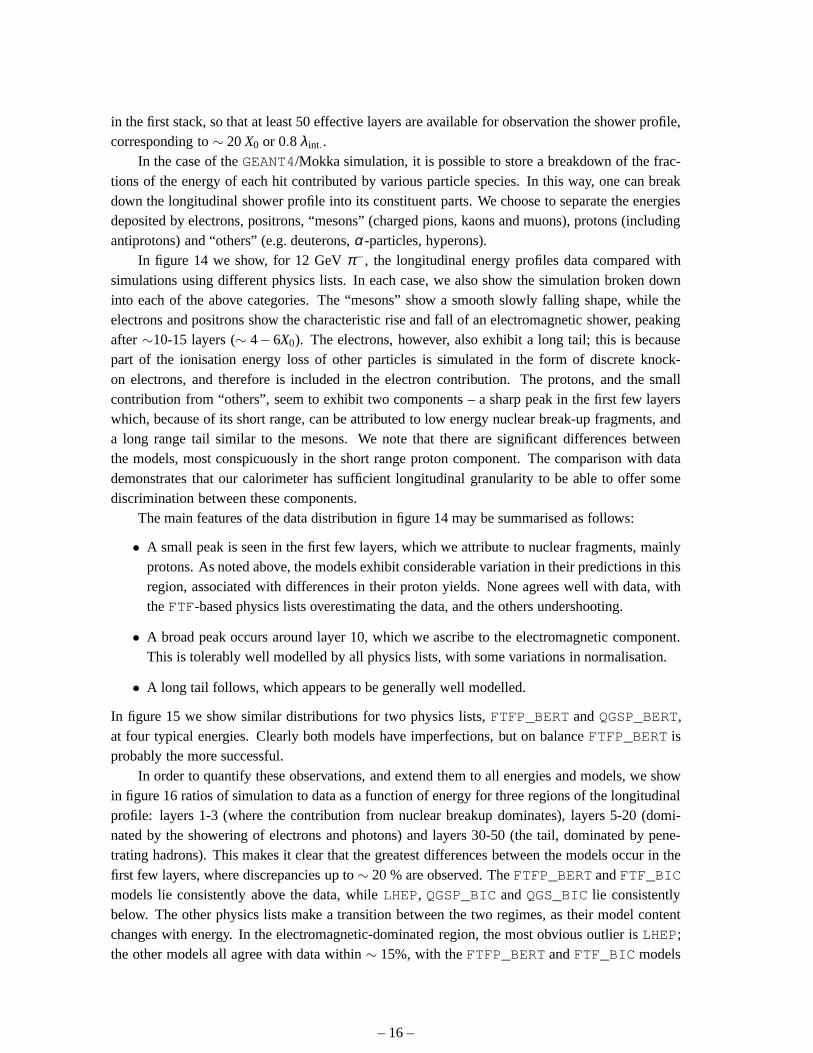
In the case of theGEANT4/Mokka simulation, it is possible to store a breakdown of thefrac-tions of the energy of each hit contributed by various particle species. In this way, one can breakdown the longitudinal shower profile into its constituent parts. We choose to separate the energiesdeposited by electrons, positrons, “mesons” (charged pions, kaons and muons), protons (includingantiprotons) and “others” (e.g. deuterons,α-particles, hyperons).
In figure 14 we show, for 12 GeVπ−, the longitudinal energy profiles data compared withsimulations using different physics lists. In each case, wealso show the simulation broken downinto each of the above categories. The “mesons” show a smoothslowly falling shape, while theelectrons and positrons show the characteristic rise and fall of an electromagnetic shower, peakingafter∼10-15 layers (∼ 4−6X0). The electrons, however, also exhibit a long tail; this is becausepart of the ionisation energy loss of other particles is simulated in the form of discrete knock-on electrons, and therefore is included in the electron contribution. The protons, and the smallcontribution from “others”, seem to exhibit two components– a sharp peak in the first few layerswhich, because of its short range, can be attributed to low energy nuclear break-up fragments, anda long range tail similar to the mesons. We note that there aresignificant differences betweenthe models, most conspicuously in the short range proton component. The comparison with datademonstrates that our calorimeter has sufficient longitudinal granularity to be able to offer somediscrimination between these components.
The main features of the data distribution in figure 14 may be summarised as follows:
• A small peak is seen in the first few layers, which we attributeto nuclear fragments, mainlyprotons. As noted above, the models exhibit considerable variation in their predictions in thisregion, associated with differences in their proton yields. None agrees well with data, withtheFTF-based physics lists overestimating the data, and the others undershooting.
• A broad peak occurs around layer 10, which we ascribe to the electromagnetic component.This is tolerably well modelled by all physics lists, with some variations in normalisation.
• A long tail follows, which appears to be generally well modelled.
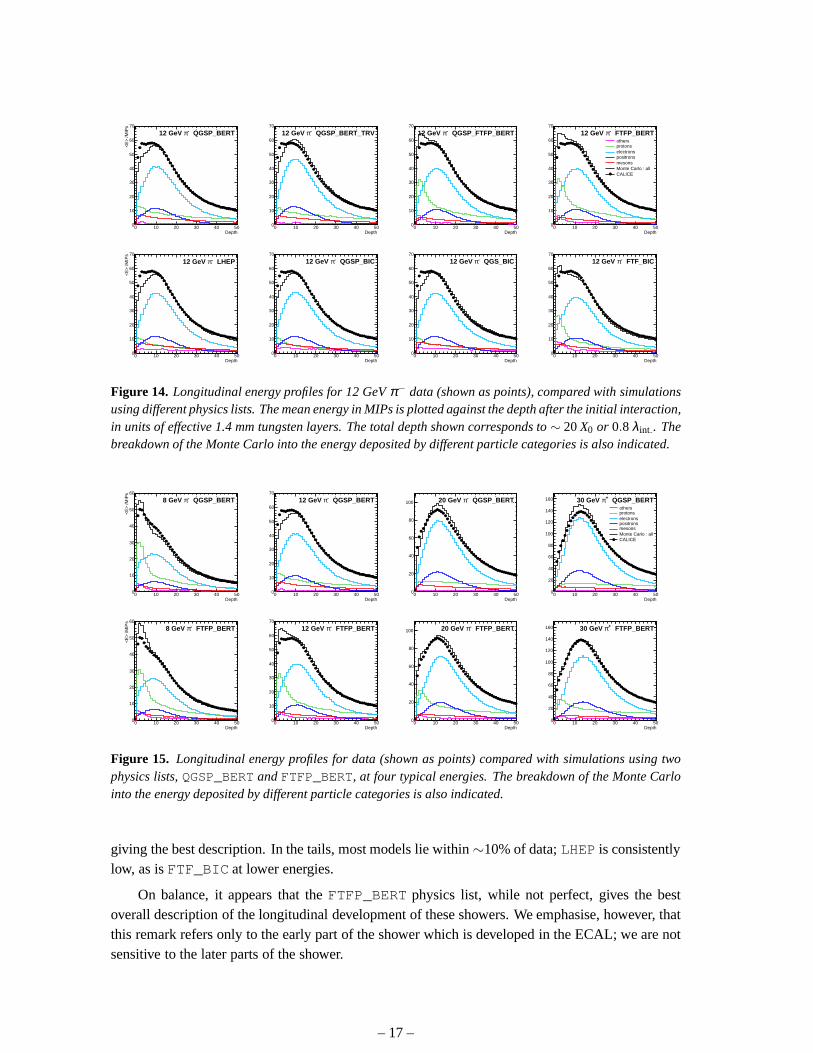
In figure 15 we show similar distributions for two physics lists, FTFP_BERT andQGSP_BERT,at four typical energies. Clearly both models have imperfections, but on balanceFTFP_BERT isprobably the more successful.
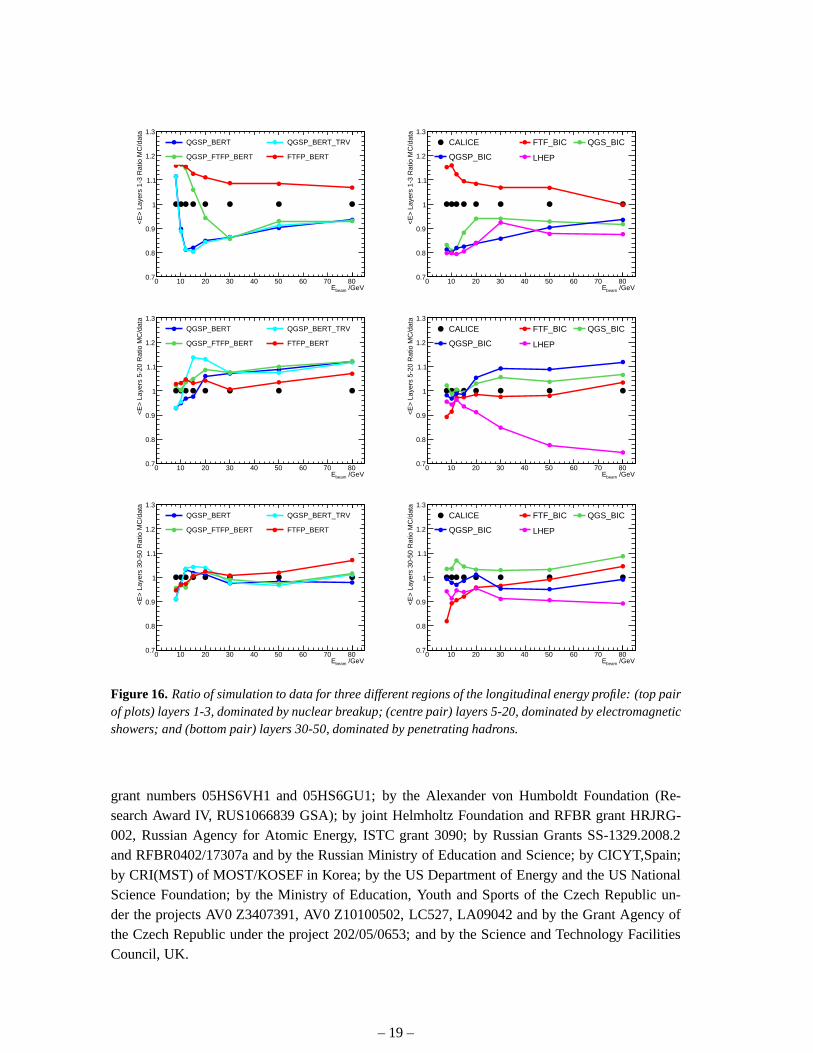
In order to quantify these observations, and extend them to all energies and models, we showin figure 16 ratios of simulation to data as a function of energy for three regions of the longitudinalprofile: layers 1-3 (where the contribution from nuclear breakup dominates), layers 5-20 (domi-nated by the showering of electrons and photons) and layers 30-50 (the tail, dominated by pene-trating hadrons). This makes it clear that the greatest differences between the models occur in thefirst few layers, where discrepancies up to∼ 20 % are observed. TheFTFP_BERT andFTF_BICmodels lie consistently above the data, whileLHEP, QGSP_BIC andQGS_BIC lie consistentlybelow. The other physics lists make a transition between thetwo regimes, as their model contentchanges with energy. In the electromagnetic-dominated region, the most obvious outlier isLHEP;the other models all agree with data within∼ 15%, with theFTFP_BERT andFTF_BIC models
– 16 –
Depth0 10 20 30 40 50
<E
> /M
IPs
0
10
20
30
40
50
60
70
QGSP_BERT-π12 GeV
Depth0 10 20 30 40 500
10
20
30
40
50
60
70
QGSP_BERT_TRV-π12 GeV
Depth0 10 20 30 40 500
10
20
30
40
50
60
70
QGSP_FTFP_BERT-π12 GeV
Depth0 10 20 30 40 500
10
20
30
40
50
60
70
FTFP_BERT-π12 GeV othersprotonselectronspositronsmesonsMonte Carlo : allCALICE
Depth0 10 20 30 40 50
<E
> /M
IPs
0
10
20
30
40
50
60
70
LHEP-π12 GeV
Depth0 10 20 30 40 500
10
20
30
40
50
60
70
QGSP_BIC-π12 GeV
Depth0 10 20 30 40 500
10
20
30
40
50
60
70
QGS_BIC-π12 GeV
Depth0 10 20 30 40 500
10
20
30
40
50
60
70
FTF_BIC-π12 GeV
Figure 14. Longitudinal energy profiles for 12 GeVπ− data (shown as points), compared with simulationsusing different physics lists. The mean energy in MIPs is plotted against the depth after the initial interaction,in units of effective 1.4 mm tungsten layers. The total depthshown corresponds to∼ 20X0 or 0.8 λint.. Thebreakdown of the Monte Carlo into the energy deposited by different particle categories is also indicated.
Depth0 10 20 30 40 50
<E
> /M
IPs
0
10
20
30
40
50
60
QGSP_BERT-π8 GeV
Depth0 10 20 30 40 500
10
20
30
40
50
60
70
QGSP_BERT-π12 GeV
Depth0 10 20 30 40 500
20
40
60
80
100 QGSP_BERT-π20 GeV
Depth0 10 20 30 40 500
20
40
60
80
100
120
140
160 QGSP_BERT+π30 GeV othersprotonselectronspositronsmesonsMonte Carlo : allCALICE
Depth0 10 20 30 40 50
<E
> /M
IPs
0
10
20
30
40
50
60
FTFP_BERT-π8 GeV
Depth0 10 20 30 40 500
10
20
30
40
50
60
70
FTFP_BERT-π12 GeV
Depth0 10 20 30 40 500
20
40
60
80
100 FTFP_BERT-π20 GeV
Depth0 10 20 30 40 500
20
40
60
80
100
120
140
160 FTFP_BERT+π30 GeV
Figure 15. Longitudinal energy profiles for data (shown as points) compared with simulations using twophysics lists,QGSP_BERT andFTFP_BERT, at four typical energies. The breakdown of the Monte Carlointo the energy deposited by different particle categoriesis also indicated.
giving the best description. In the tails, most models lie within∼10% of data;LHEP is consistentlylow, as isFTF_BIC at lower energies.
On balance, it appears that theFTFP_BERT physics list, while not perfect, gives the bestoverall description of the longitudinal development of these showers. We emphasise, however, thatthis remark refers only to the early part of the shower which is developed in the ECAL; we are notsensitive to the later parts of the shower.
– 17 –
6.5 Physics lists under development
There are several physics lists inGEANT 4.9.3 which use theCHIPS model [16] alone or in con-junction with other models. This model has undergone substantial development recently, and isnow capable of modelling all parts of the hadronic interaction process. We made a number ofstudies of these physics lists using aβ -test version 4.9.3.b01 ofGEANT. The results were very en-couraging, and one of the physics lists tested,QGSC_CHIPS, gave a better description of our datathan any of the physics lists discussed here. However, theCHIPSmodel is still being tuned, and inthe released version ofGEANT 4.9.3, theCHIPS-based models are less successful when confrontedwith our data. It would be premature to show results and draw conclusions while development isongoing, but theCHIPS-based models seem to be an interesting and promising new avenue, and itis clear that our data have the power to discriminate betweentunings of such models.
7. Summary
We have studied showers induced by charged pions in the CALICE silicon-tungsten ECAL. Thecalorimeter has high transverse and longitudinal granularity, which allows us to study the early partof the shower development in unprecedented detail. Using pions in the energy range 8–80 GeV,we have compared the data withGEANT4 simulations using eight different physics lists. Severalobservables were examined – the total energy deposited in the ECAL, the distribution of interac-tion points, the transverse shower energy profile, and the longitudinal profile with respect to theinteraction point. The most sensitive observables seem to be the shower profiles. The data tend toshow a greater shower width than the simulation for most energies and physics lists. The closestdescription of the transverse profiles is provided by theFTFP_BERT andFTF_BIC physics lists.
The longitudinal profile seems the most interesting observable, because the three main compo-nents of the shower induced by the primary interaction (energetic hadrons, photons and low energynuclear fragments) can be, to some extent, distinguished through their different rates of shower de-velopment. An ECAL using tungsten is particularly useful inthis regard, because of its small ratioof X0/λint., which amplifies the differences in shower development between various components ofthe shower. It would be naïve to expect any of the physics lists to give a perfect description of thedata, but it seems clear from our study that theLHEP physics list has serious deficiencies, and that,in the framework of the current version 4.9.3 ofGEANT4, FTFP_BERT list is the most successful.It is to be hoped that these observations will provide usefulguidance to theGEANT4 developers.
Acknowledgements
We would like to thank the technicians and the engineers who contributed to the design and con-struction of the prototypes. We also gratefully acknowledge the DESY and CERN managementsfor their support and hospitality, and their accelerator staff for the reliable and efficient beam op-eration. We would like to thank the HEP group of the University of Tsukuba for the loan of driftchambers for the DESY test-beam. The authors would like to thank the RIMST (Zelenograd)group for their help and sensors manufacturing. This work was supported by the Bundesminis-terium für Bildung und Forschung, Germany; by the DFG cluster of excellence “Origin and Struc-ture of the Universe”; by the Helmholtz-Nachwuchsgruppen grant VH-NG-206; by the BMBF,
– 18 –
/GeVbeamE0 10 20 30 40 50 60 70 80
<E
> L
ayer
s 1-
3 R
atio
MC
/dat
a
0.7
0.8
0.9
1
1.1
1.2
1.3
QGSP_BERT QGSP_BERT_TRV
QGSP_FTFP_BERT FTFP_BERT
/GeVbeamE0 10 20 30 40 50 60 70 80
<E
> L
ayer
s 1-
3 R
atio
MC
/dat
a
0.7
0.8
0.9
1
1.1
1.2
1.3
CALICE FTF_BIC QGS_BIC
QGSP_BIC LHEP
/GeVbeamE0 10 20 30 40 50 60 70 80
<E
> L
ayer
s 5-
20 R
atio
MC
/dat
a
0.7
0.8
0.9
1
1.1
1.2
1.3
QGSP_BERT QGSP_BERT_TRV
QGSP_FTFP_BERT FTFP_BERT
/GeVbeamE0 10 20 30 40 50 60 70 80
<E
> L
ayer
s 5-
20 R
atio
MC
/dat
a
0.7
0.8
0.9
1
1.1
1.2
1.3
CALICE FTF_BIC QGS_BIC
QGSP_BIC LHEP
/GeVbeamE0 10 20 30 40 50 60 70 80
<E
> L
ayer
s 30
-50
Rat
io M
C/d
ata
0.7
0.8
0.9
1
1.1
1.2
1.3
QGSP_BERT QGSP_BERT_TRV
QGSP_FTFP_BERT FTFP_BERT
/GeVbeamE0 10 20 30 40 50 60 70 80
<E
> L
ayer
s 30
-50
Rat
io M
C/d
ata
0.7
0.8
0.9
1
1.1
1.2
1.3
CALICE FTF_BIC QGS_BIC
QGSP_BIC LHEP
Figure 16. Ratio of simulation to data for three different regions of the longitudinal energy profile: (top pairof plots) layers 1-3, dominated by nuclear breakup; (centrepair) layers 5-20, dominated by electromagneticshowers; and (bottom pair) layers 30-50, dominated by penetrating hadrons.
grant numbers 05HS6VH1 and 05HS6GU1; by the Alexander von Humboldt Foundation (Re-search Award IV, RUS1066839 GSA); by joint Helmholtz Foundation and RFBR grant HRJRG-002, Russian Agency for Atomic Energy, ISTC grant 3090; by Russian Grants SS-1329.2008.2and RFBR0402/17307a and by the Russian Ministry of Education and Science; by CICYT,Spain;by CRI(MST) of MOST/KOSEF in Korea; by the US Department of Energy and the US NationalScience Foundation; by the Ministry of Education, Youth andSports of the Czech Republic un-der the projects AV0 Z3407391, AV0 Z10100502, LC527, LA09042 and by the Grant Agency ofthe Czech Republic under the project 202/05/0653; and by theScience and Technology FacilitiesCouncil, UK.
– 19 –
References
[1] J.-C. Brient and H. Videau arXiv:hep-ex/0202004v1 (2002);V.L. Morgunov, in 10th International Conference on Calorimetry in High Energy Physics (CALOR2002), Pasadena, CA, Mar. 2002.M.A. Thomson, Nucl. Instrum. and MethodsA611 (2009) 25-40.
[2] J. Repond et al., JINST3 (2008) P08001.
[3] http://ab-div-atb-ea.web.cern.ch/ab-div-atb-ea/BeamsAndAreas/H6
[4] C. Adloff et al.,arXiv:1003.2662, to be published in JINST.
[5] S.Agostinelli et al., Nucl. Instrum. and MethodsA506 (2003) 250;J.Allison et al., IEEE Transactions on Nuclear Science53 No. 1(2006) 270.
[6] Mokka home page,http://polzope.in2p3.fr:8081/MOKKA;P. Mora de Freitas and H. Videau, “Detector simulation with MOKKA / GEANT4: Present andfuture”, International Workshop on Linear Colliders (LCWS2002), Jeju Island, Korea, 26-30 Aug2002.
[7] C. Adloff et al., Nucl. Instrum. and MethodsA608 (2009) 372.
[8] GEANT4 Physics Reference Manual,http://geant4.web.cern.ch/geant4/UserDocumentation/
/UsersGuides/PhysicsReferenceManual/fo/PhysicsReferenceManual.pdf
[9] H. FesefeldtSimulation of Hadronic Showers, Physics and Applications.Technical Report PITHA85-02, (1985).
[10] M. P. Guthrie, R. G. Alsmiller, H. W. Bertini, Nucl. Instrum. and MethodsA66 (1968) 29;A. Heikkinen, N. Stepanov and J.-P. Wellisch, Proc. Computing in High Energy and Nuclear Physics,vol. MOMT008, La Jolla, CA, 2003.
[11] B. Andersson et al., Nucl. Phys.B281(1987) 289;B. Nillson-Almquist and E. Stenlund, Comp. Phys. Commun.43 (1987) 387.
[12] G. Folger, J.-P. Wellisch, arXiv:nucl-th/0306007 (2003);N. S. Amelin, et al.,Phys.Rev.Lett.67 (1991) 1523;L. V. Bravina, et al., Phys.Rev.Lett.344(1995) 49.
[13] V. Lara, J.-P. Wellisch, Proceedings of the CHEP 2000 Conference, Padova, Italy, February 2000
[14] G. Folger, V. N. Ivanchenko and J.-P. Wellisch Eur. Phys. J.A21 (2004) 404
[15] See, for example, presentations by S. Banerjee and M. Asai at the 14th GEANT4 Users Workshop,October 2009;http://indico.cern.ch/conferenceDisplay.py?confId=44566
[16] P. V. Degtyarenko, M. V. Kossov, H.-P. Wellisch, Eur. Phys. J.A8 (2000) 217; Eur. Phys. J.A9 (2000)411; Eur. Phys. J.A9 (2000) 421.
– 20 –
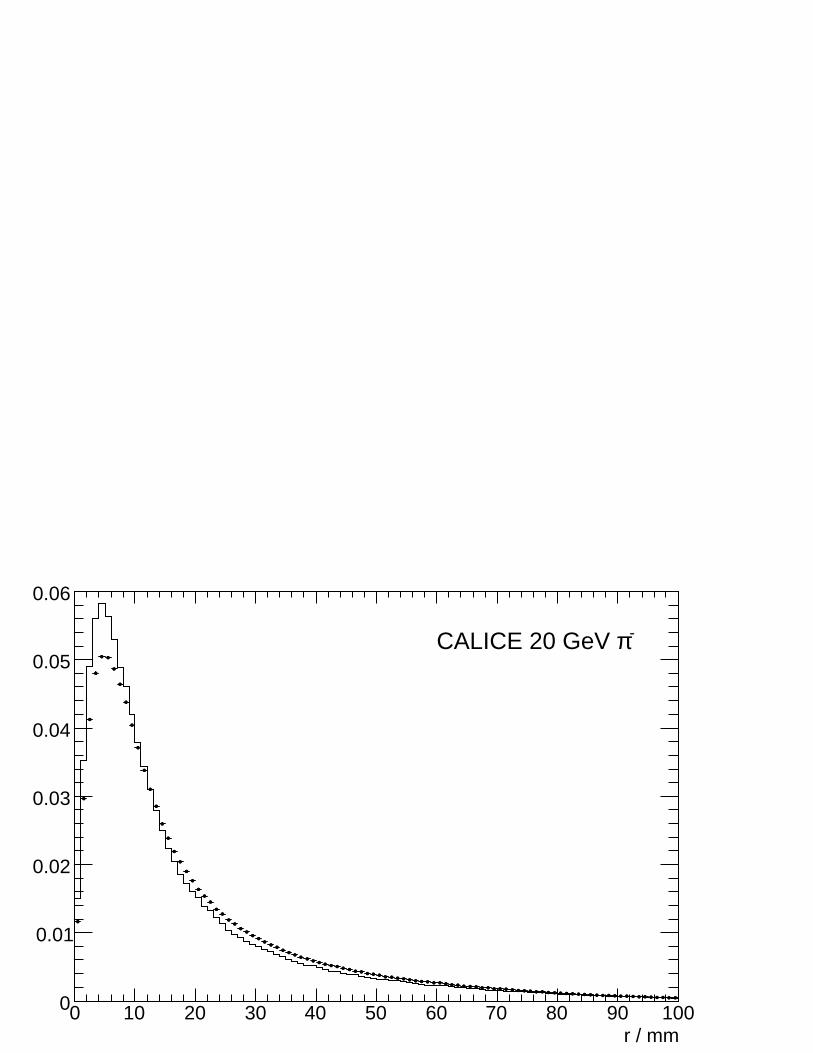
r / mm0 10 20 30 40 50 60 70 80 90 1000
0.01
0.02
0.03
0.04
0.05
0.06
-πCALICE 20 GeV
r / mm0 10 20 30 40 50 60 70 80 90 1000
0.01
0.02
0.03
0.04
0.05
0.06
0.07
0.08+πCALICE Preliminary 80 GeV
Related Documents