arXiv:1212.3101v1 [astro-ph.CO] 13 Dec 2012 Study of the chemical evolution and spectral signatures of some interstellar precursor molecules of adenine, glycine & alanine Liton Majumdar a , Ankan Das a , Sandip K. Chakrabarti b,a , Sonali Chakrabarti c,a a Indian Centre For Space Physics, 43 Chalantika, Garia Station Road, Kolkata 700084, India b S.N. Bose National Center for Basic Sciences, JD-Block, Salt Lake, Kolkata,700098, India c Maharaja Manindra Chandra College, 20 Ramakanto Bose Street, Kolkata, 700003,India Abstract We carry out a quantum chemical calculation to obtain the infrared and electronic ab- sorption spectra of several complex molecules of the interstellar medium (ISM). These molecules are the precursors of adenine, glycine & alanine. They could be produced in the gas phase as well as in the ice phase. We carried out a hydro-chemical simula- tion to predict the abundances of these species in the gas as well as in the ice phase. Gas and grains are assumed to be interacting through the accretion of various species from the gas phase on to the grain surface and desorption (thermal evaporation and photo-evaporation) from the grain surface to the gas phase. Depending on the phys- ical properties of the cloud, the calculated abundances varies. The influence of ice on vibrational frequencies of different pre-biotic molecules was obtained using Polar- izable Continuum Model (PCM) model with the integral equation formalism variant (IEFPCM) as default SCRF method with a dielectric constant of 78.5. Time dependent density functional theory (TDDFT) is used to study the electronic absorption spectrum of complex molecules which are biologically important such as, formamide and pre- cursors of adenine, alanine and glycine. We notice a significant difference between the 1

Welcome message from author
This document is posted to help you gain knowledge. Please leave a comment to let me know what you think about it! Share it to your friends and learn new things together.
Transcript

arX
iv:1
212.
3101
v1 [
astr
o-ph
.CO
] 13
Dec
201
2
Study of the chemical evolution and spectral signaturesof some interstellar precursor molecules of adenine,
glycine & alanine
Liton Majumdar a, Ankan Dasa, Sandip K. Chakrabarti b,a, Sonali Chakrabartic,a
aIndian Centre For Space Physics, 43 Chalantika, Garia Station Road, Kolkata 700084, IndiabS.N. Bose National Center for Basic Sciences, JD-Block, Salt Lake, Kolkata,700098, IndiacMaharaja Manindra Chandra College, 20 Ramakanto Bose Street, Kolkata, 700003,India
Abstract
We carry out a quantum chemical calculation to obtain the infrared and electronic ab-
sorption spectra of several complex molecules of the interstellar medium (ISM). These
molecules are the precursors of adenine, glycine & alanine.They could be produced
in the gas phase as well as in the ice phase. We carried out a hydro-chemical simula-
tion to predict the abundances of these species in the gas as well as in the ice phase.
Gas and grains are assumed to be interacting through the accretion of various species
from the gas phase on to the grain surface and desorption (thermal evaporation and
photo-evaporation) from the grain surface to the gas phase.Depending on the phys-
ical properties of the cloud, the calculated abundances varies. The influence of ice
on vibrational frequencies of different pre-biotic molecules was obtained using Polar-
izable Continuum Model (PCM) model with the integral equation formalism variant
(IEFPCM) as default SCRF method with a dielectric constant of 78.5. Time dependent
density functional theory (TDDFT) is used to study the electronic absorption spectrum
of complex molecules which are biologically important suchas, formamide and pre-
cursors of adenine, alanine and glycine. We notice a significant difference between the
1
spectra of the gas and ice phase (water ice). The ice could be mixed instead of simple
water ice. We have varied the ice composition to find out the effects of solvent on the
spectrum. We expect that our study could set the guidelines for observing the precursor
of some bio-molecules in the interstellar space.
Keywords: Molecular clouds, Interstellar medium, chemical evolution, Star formation
1. Introduction
Presence of interstellar dust towards the formation of complex interstellar molecules
is taken for granted especially after the discovery of more than twenty molecules
around the star forming region in the interstellar ice. Altogether, according to the
CDMS catalog (http://www.astro.uni-koeln.de/cdms/molecules), one hundred and sev-
enty molecules have been detected in the interstellar medium or circumstellar shells.
To model the formation of complex molecules, and especiallythrough interstellar grain
chemistry, several attempts were made by various workers (Chakrabarti et al., 2006ab;
Das et al., 2008b; Das, Acharyya & Chakrabarti 2010; Cuppen et al., 2007; Cuppen et
al., 2009 etc.) over the years. Interstellar dust grains arethought to be consisting of
amorphous silicate or carbonaceous core surrounded by molecular ice layer (Draine et
al., 2003; Gibb et al., 2004). It has been clear from the experimental and observational
results that almost 90% of the grain mantle is covered with H2O, CH3OH, CO2 (Keane
et al., 2001, Das et al., 2011 and references therein). Presence of HCN, CN, CS and
H2O in space were identified by anomalous absorption (Omont 1993 & Bujarrabal et
Email addresses: [email protected] (Liton Majumdar),[email protected] (Ankan Das),[email protected] (Sandip K. Chakrabarti),[email protected] (Sonali Chakrabarti)
Preprint submitted to Elsevier December 14, 2012

al., 1994). But a complete understanding of the chemical andphysical processes which
take place on a grain surface is still missing.
The origin of amino acids through the pre-biotic chemistry of the early earth has
been a topic of long standing interest. However, complex pre-biotic molecules might
also be formed due to very complex and rich chemical processes inside a molecular
cloud. The production of amino acids, nucleobases, carbohydrates and other basic
compounds can possibly start from the molecules like HCN, cyno compounds, alde-
hyde, and ketones (Orgel 2004; Abelson 1966), which could lead to the origin of life
in the primitive earth conditions. However, even with the present observational tools,
it is hard to confirm the presence of any bio-molecules in the ISM. So it may suffice, if
we can identify a few precursor molecules which eventually form bio-molecules in the
interstellar space. Quantum chemical simulations could beused to find out the spectral
properties of these complex molecules. It is observed and experimentally verified that
the spectral signature of a species significantly deviates between the gas phase and the
ice phase. So a theoretical study of the spectral propertiesof the precursors of some
important bio-molecules in both the gas and ice phases couldserve as benchmarks for
the observations.
In this Paper, we consider a large gas-grain network coupledwith a hydrodynamic
simulation to obtain the abundances of various complex molecules, which could lead
to the formations of adenine, alanine & glycine. We also discuss the production of
formamide which is an important precursor in the process of the abiotic synthesis of
amino acids. In the literature, there are several observational studies on glycine (Kuan
et al., 2003, Hollis et al. 2003, Snyder et al. 2005, etc.). But its existence in a molecular
3

cloud, till date, is not verified without a reasonable doubt.In case of adenine, we find
that though its abundance in our theoretical model is well under the observation limit,
its precursor molecules are heavily abundant. It is also true for the alanine and glycine.
These prompted us to find out the spectral signatures of the precursor molecules of
these three molecules around the different astrophysical environment, from which one
could roughly anticipate the abundances of adenine, glycine & alanine. All possible
reaction pathways are included in the gas as well as in the grain phase network. Armed
with the chemical abundances of these precursor molecules,we compute the infrared
and electronic absorption spectra in the gas as well as for the icy grains.
The plan of this paper is the following. In Section 2, the models used and the
computational details are presented. Implications of the results are discussed in Section
3. Finally, in Section 4, we draw our conclusions.
2. Computational details
2.1. Hydro-chemical Model
The process of formation of complex molecules in the interstellar space is very
much uncertain. There could be a number of pathways available for the formation of
a complex molecule. However, depending on the chemical abundances of the reactive
species and the reaction cross section, the rate of formation varies. Formation routes
of several interstellar bio-molecules are already reported in Majumdar et al., (2012).
They pointed out that despite of the huge abundances of the neutral species, radical-
molecular/radical-radical reaction pathways dominates towards the formation of some
pre-biotic species. Normally such reactions are barrier less and exothermic in nature.
4

To study the chemical evolution of various complex radicals, ions, molecules which
are very much important for the prebiotic synthesis of different bases of amino acids,
we have constructed a hydro-chemical model to mimic the interstellar scenario.
The evolution of the chemical species is strongly dependenton the physical prop-
erties of the medium. So the dynamic nature of the medium at any particular instant
could influence the chemical composition of the medium. Das et al., (2008b) & Das
et al., (2010) considered a spherically symmetric isothermal (10K) collapsing cloud,
whose outer boundary was assumed to be located at one parsec and the inner boundary
was assume to be located at 10−4 parsec. They used a finite difference Eulerian scheme
(upwind scheme) to solve the Eulerian equations of hydrodynamics in spherical polar
coordinates. Since they were interested in the spherical case, they only considered ra-
dial motion and ignored any dependency upon theθ & φ coordinates. By solving the
hydrodynamic equations they studied fully time-dependentbehaviour of the spherical
flow.
To have a realistic condition, we have considered this density distribution as an in-
put for our chemical model. The gas phase chemical network ismainly adopted from
the UMIST 2006 database (Woodall et al., 2007). Here, we havechosen the initial
elemental abundances according to the Woodall et al., (2007), these are the typical
low-metal abundances often adopted for TMC-1 cloud. We add afew new reactions
following Chakrabarti et al., (2000ab), Woon et al., (2002), Quan & Herbst (2007),
Gupta et al., (2011) and references therein. Recently, Majumdar et al., (2012), cal-
culated the rate coefficients for the reaction pathways described in Chakrabarti et al.,
2000ab. They used Bates (1983) semi-empirical formula to find out the rate coefficients
5

of any chemical reactions. Gupta et al.(2011) also followedthe same prescription to
find out the reaction rates for the adenine formation in interstellar space.
To show the importance of grains towards the chemical enrichment of the ISM,
we have also included a detailed grain chemistry network following Hasegawa, Herbst
& Leung (1992), Das et al., (2008a), Das et al., (2010), Cuppen et al., (2007), Jones
et al., (2011), Garrod et al., (2008) and Das & Chakrabarti (2011) into our reaction
network. We therefore have the most updated chemical network to study the chemical
evolution of several interstellar species. In order to perform a self-consistent study, we
assume that the gas and the grains are coupled through the accretion and the thermal
evaporation processes. We assume that the species are physisorbed onto the dust grain
(classical size grain∼ 1000 A◦) having the grain number density 1.33× 10⁻¹²n, where
n is the concentration of H nuclei in all forms. Thus, in principle, we have a complete
interstellar model, which could be used to follow the hydro-chemical properties of a
collapsing cloud.
2.2. Quantum chemical calculation
First of all, we have optimized the geometry of the molecules, which are the pre-
cursors of various bio-molecules in space. In order to have an idea for the stability
of these molecules, B3LYP/6-311++G** level is used. Gas phase vibrational frequen-
cies of these precursor molecules are also calculated by theB3LYP/6-311++G** level.
Observational evidences suggest that grain mantles aroundthe dense clouds are
mainly covered by H2O (> 60%), CH 3OH (2-30% with respect to solid water) and
CO2 (2-20 % with respect to solid water). To find out the effects of the solvent
on the spectrum, we have chosen three types of ice. (i) Unlessotherwise stated,
6

we use pure water ice. (ii) We use methanol ice also to mimic the ice composition
around the methanol rich environment and finally, (iii) Based on the observational
results, we construct an ice, which consists of 70% water 20%methanol and 10%
carbon-di oxide and call is as the ‘mixed ice’.
In order to find out the vibrational frequencies of these molecules in the ice phase,
we have optimized the geometry of these molecules in ice at B3LYP/6-311++G**
level. Here, the Polarizable Continuum Model (PCM) model isused with the integral
equation formalism variant (IEFPCM) as the default SCRF method. We have chosen
IEFPCM model as a convenient one, since the second energy derivative is available for
this model and also it is analytic in nature. Vibrational frequencies given here are not
exactly for the ice phase since the dielectric constant of ice (85.5) is slightly higher
than that of water (78.5). We have calculated also the electronic absorption spectrum
of these molecules using the time dependent density functional theory (TDDFT study).
3. Result and Discussion
Till date, due to the constraints on the observational sensitivity, it is quite chal-
lenging to directly identify interstellar bio-molecules.For instance, the observational
report on glycine by Kuan et al., (2003) was not supported by Hollis et al. (2003) and
Snyder et al. (2005). Chemical models (Chakrabarti & Chakrabarti 2000ab, Das et al.,
2008b, Majumdar et al., 2012) predict that the trace amount of bio-molecules could be
produced during the collapsing phase of a proto-star. Sincethe abundances of these
molecules are very low, it is possible that they are not directly observable with the
present day technology. However, if we concentrate on the pathways through which
7
these molecules form in the ISM and identify the precursor molecules, it could be much
easier to predict their abundances. This is what is done in our work. We compute their
chemical abundances after considering the gas-grain interaction in our chemical model
and present the spectral signatures of the precursor molecules in the gas phase as well
as in the grain phase. Water is found to be the most abundant molecule followed by
Methanol and Carbon-di-oxide in the ice phase. We have concentrated on the changes
of the spectral signature between the gas phase and ice phase. The spectral changes
with the changes of solvents are also highlighted.
3.1. Precursor molecules of adenine
There are a few studies related to the formation of adenine. Chakrabarti et al.,
(2000ab) proposed a neutral-neutral pathways for the formation of adenine. According
to them, the adenine could be produced by the following reactions:
HCN + HCN → CH(NH)CN (1)
CH(NH)CN + HCN → NH2CH(CN)2 (2)
NH2CH(CN)2 + HCN → NH2(CN)C = C(CN)NH2 (3)
NH2(CN)C = C(CN)NH2 + HCN → Adenine (4)
Recently Gupta et al. (2011) proposed that the following radical-molecular reaction
network, which could lead to the adenine formation.
HCCN + HCN → C3H2N2 (1, 2 dihydro imidazole) (5)
8
1e+02 1e+03 1e+04 1e+05 1e+06 1e+07log (Time) year
1e-60
1e-50
1e-40
1e-30
1e-20
1e-10
log
(n
x/n
H)
HCCNNH2CN
Adenine
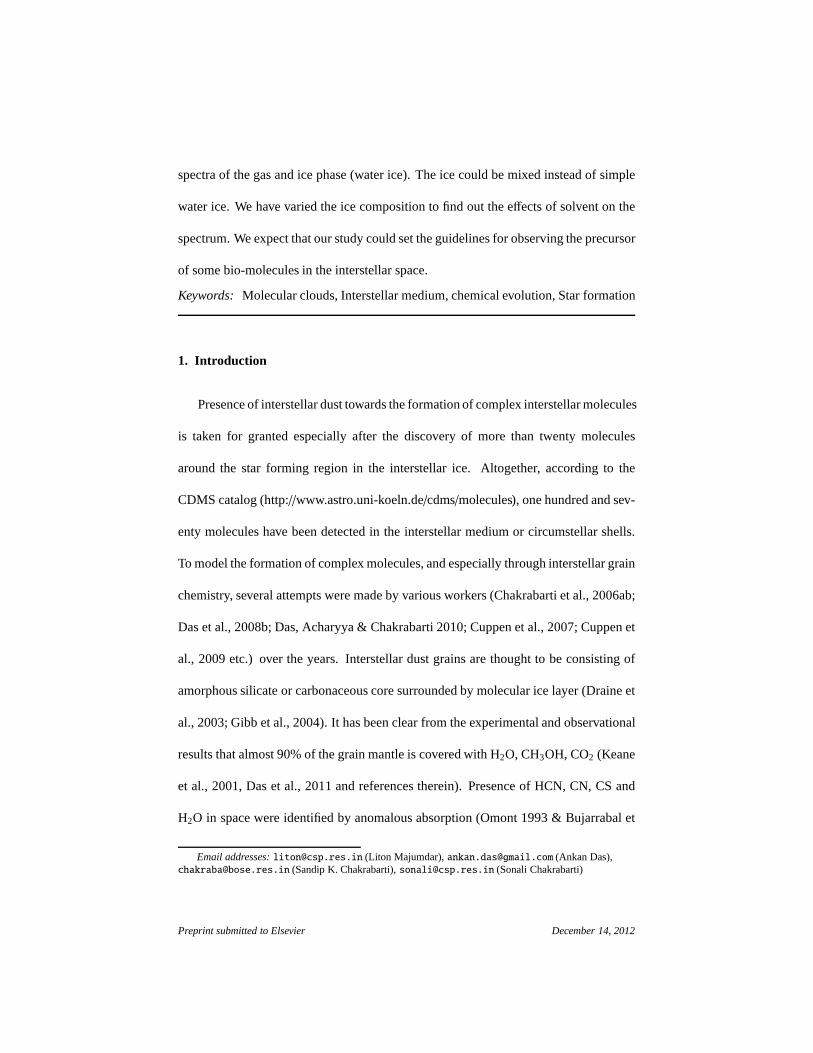
Figure 1: Time evolution of adenine with its two precursor molecules. Since the precursors are several ordersof magnitude higher, the probability of their detection is higher.
9
C3H2N2 + H → C3H3N2 (2, 3 dihydro − 1H − imidazole) (6)
C3H3N2 + NH2CN → C4H5N4 (4 carboxaimidine − 1H − imidazole) (7)
C4H5N4 +CN → C5H5N5 (2, 4 dihydro − 3H − purine − 6− amine) (8)
C5H5N5 + H → C5H6N5 (6 amino − 3H − purine) (9)
C5H5N5 +CN → Adenine + HNC (10)
C5H5N5 +CN → Adenine + HCN (11)
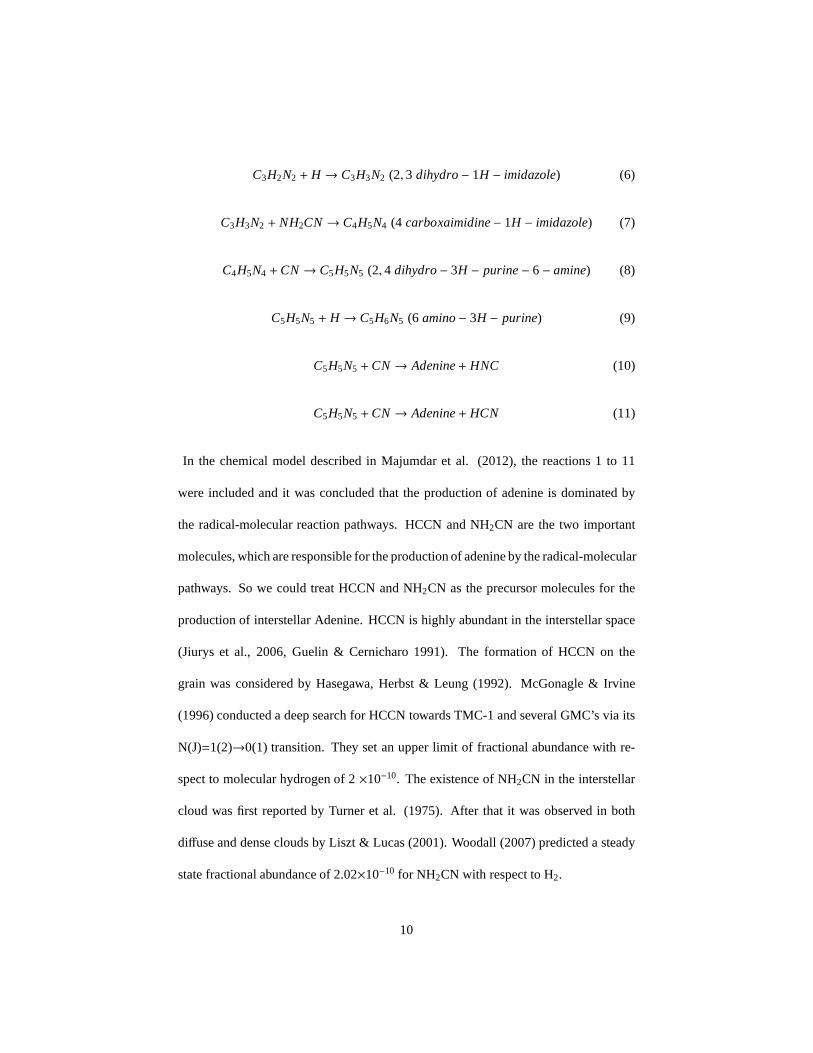
In the chemical model described in Majumdar et al. (2012), the reactions 1 to 11
were included and it was concluded that the production of adenine is dominated by
the radical-molecular reaction pathways. HCCN and NH2CN are the two important
molecules, which are responsible for the production of adenine by the radical-molecular
pathways. So we could treat HCCN and NH2CN as the precursor molecules for the
production of interstellar Adenine. HCCN is highly abundant in the interstellar space
(Jiurys et al., 2006, Guelin & Cernicharo 1991). The formation of HCCN on the
grain was considered by Hasegawa, Herbst & Leung (1992). McGonagle & Irvine
(1996) conducted a deep search for HCCN towards TMC-1 and several GMC’s via its
N(J)=1(2)→0(1) transition. They set an upper limit of fractional abundance with re-
spect to molecular hydrogen of 2×10⁻¹⁰. The existence of NH2CN in the interstellar
cloud was first reported by Turner et al. (1975). After that itwas observed in both
diffuse and dense clouds by Liszt & Lucas (2001). Woodall (2007) predicted a steady
state fractional abundance of 2.02×10⁻¹⁰ for NH2CN with respect to H2.
10

0 1000 2000 3000 4000
Wavenumber (cm-1
)
0
500
1000
1500
2000
Ab
so
rba
nce
Gas phase NH2CN
Ice phase NH2CN
Figure 2: Infrared spectrum of NH2CN in gas as well as in H2O ice. The line strength in the ice phase isgenerally several times higher.
11

We already mentioned that we are using the density distribution of our hydrody-
namical model as an input of our chemical model. Since production of complex species
in the intermediate region of the cloud is favourable, we consider the density distribu-
tion of intermediate region as an input of our chemical model. In Fig. 1, we present
the chemical evolution of adenine in gas phase along with itstwo precursor molecules,
namely, HCCN & NH2CN. We find that the abundance of NH2CN is significantly
higher, having a peak abundance of 1.7×10⁻⁹ and a final abundance of NH2CN (after
∼ 5×10⁶ years) is 1.38×10⁻¹¹ with respect to total hydrogen nuclei.In our case, final
abundance of NH2CN appears to be slightly lower than the amount calculated by
Woodall et al., (2007). This is probably because Woodall et al., (2007) carried out
their simulation by assuming a constant density cloud (104 cm−3), whereas in our
case, we consider a realistic density distribution obtained from the isothermal hy-
drodynamic model. Moreover, our chemical network consistsof a large gas-grain
network whereas the grain-surface network is missing in Woodall et al., (2007).
Peak value of the HCCN abundance is found to be 4.1×10⁻¹⁴ and finally it turns out
to be 1.14×10⁻¹⁷. With these two significantly abundant molecules, adenine could
be produced with an abundance of 4.4×10⁻²⁵. In our hydrodynamic model, density
around the inner grid locations started to increase rapidlyafter 105 years. The reason
behind this is that after one dynamical time scale (∼ free fall time∼ 105 years), there
are the smooth transport of matter from the outer envelope tothe inner envelope. After
some dynamical times (i.e., around 106 years), core mass gets heavier and induce more
matter from the cloud than the matter actually accreting to the cloud through the outer
envelope. Finally, the cloud relaxes to a steady state density distribution. Since there
12
was a sharp rise in density between 105-106 years for our hydrodynamical model, our
chemical evolution also shows (Fig. 1) sharp rise in the abundances during that pe-
riod. Since we chose the initial elemental abundances following Woodall et al. (2007),
basically, we started with zero abundance of any complex species.
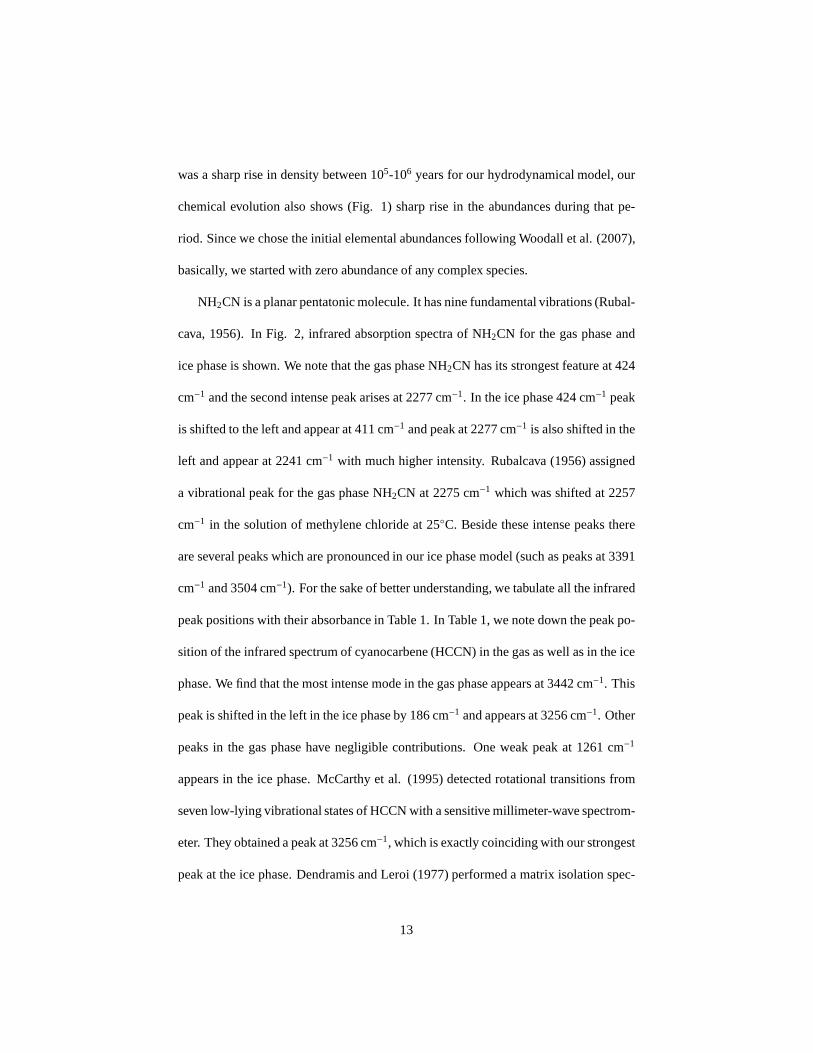
NH2CN is a planar pentatonic molecule. It has nine fundamental vibrations (Rubal-
cava, 1956). In Fig. 2, infrared absorption spectra of NH2CN for the gas phase and
ice phase is shown. We note that the gas phase NH2CN has its strongest feature at 424
cm−1 and the second intense peak arises at 2277 cm−1. In the ice phase 424 cm−1 peak
is shifted to the left and appear at 411 cm−1 and peak at 2277 cm−1 is also shifted in the
left and appear at 2241 cm−1 with much higher intensity. Rubalcava (1956) assigned
a vibrational peak for the gas phase NH2CN at 2275 cm−1 which was shifted at 2257
cm−1 in the solution of methylene chloride at 25◦C. Beside these intense peaks there
are several peaks which are pronounced in our ice phase model(such as peaks at 3391
cm−1 and 3504 cm−1). For the sake of better understanding, we tabulate all the infrared
peak positions with their absorbance in Table 1. In Table 1, we note down the peak po-
sition of the infrared spectrum of cyanocarbene (HCCN) in the gas as well as in the ice
phase. We find that the most intense mode in the gas phase appears at 3442 cm−1. This
peak is shifted in the left in the ice phase by 186 cm−1 and appears at 3256 cm−1. Other
peaks in the gas phase have negligible contributions. One weak peak at 1261 cm−1
appears in the ice phase. McCarthy et al. (1995) detected rotational transitions from
seven low-lying vibrational states of HCCN with a sensitivemillimeter-wave spectrom-
eter. They obtained a peak at 3256 cm−1, which is exactly coinciding with our strongest
peak at the ice phase. Dendramis and Leroi (1977) performed amatrix isolation spec-
13

Table 1: Vibrational frequencies of different complex molecules in gas phase, H2O ice and methanol con-taining grains at B3LYP/6-311G++** level
Species Peak positions Absorbance Peak positions Absorbance Peak positions Absorbance(Gas phase) (H2O ice) (Methanol ice)
(Wavenumber in cm−1) (Wavenumber in cm−1) (Wavenumber in cm−1)361.81 0.02 365.76 .001 365.66 0.002472.51 0.48 476.23 1.84 476.15 1.78
HCCN 953.94 2.43 962.29 3.9 962.2 3.851264.15 3.11 1261.21 20.78 1261.32 19.791837.77 1.67 1842.18 .33 1842 0.363442.74 72.88 3256.78 296.99 3264.26 285.76399.44 1.18 411.2 558.25 411.91 549.69424.58 331.27 419.28 0.64 418.19 1.36506.79 78.52 511.60 21.81 511.20 23.531106.5 11.24 1129.17 14.95 1128.48 14.9
NH2CN 1182.24 5.81 1167.57 15.23 1168.24 14.821674.56 68.34 1606.43 144.79 1609.51 141.852277.03 142.76 2241.40 486.82 2242.75 471.13601.35 49.83 3391.73 300.21 3400.13 287.593722.54 64.62 3504.14 232.97 3512.95 225.09318.67 500.63 395.86 381.58 399.5 392.74906.57 7.79 454.78 36.29 433.45 36.961247.51 43.21 484.98 287.53 496.42 262.891295.04 9.11 927.74 5.58 929.13 5.21488.33 0.03 1232.40 54.84 1233.35 54.551697.65 61.9 1305.44 11.38 1306.49 11.11
CH2NH2 3175.48 11.04 1482.85 2.88 1484.23 2.923302.9 13.91 1658.80 105.1 1660.7 103.693618.37 18.34 3121.60 19.78 3120.02 19.943744.57 20.4 3244.2 22.13 3241.7 22.41
- - 3454.87 83.77 3463.3 79.24- - 3574.02 87.41 3582.74 83.04
563.02 174.43 527.91 274.95 525.87 270.55564.06 37.16 576.96 88.35 576.21 85.09
COOH 971.71 185.63 1004.45 360.38 1005.32 353.261246.79 2.28 1238.63 12.42 1242.43 11.591719.72 337.79 1661.63 634.66 1663.93 619.873427.26 1.56 2759.29 339.39 2808.53 311.4293.80 73.46 227.10 24.35 219.98 24.79227.28 12.91 236.09 21.97 235.28 21.72654.85 5.11 659.67 12.28 659.02 11.85679.23 105.13 698.25 142.52 696.02 141.02933.22 9.24 932.94 1.37 932.81 1.331133 357.05 1086.56 948.30 1086.95 923.82
C2H3ON 1187.76 184.8 1187.07 176.63 1187.21 178.391453.73 1.06 1443.51 4.87 1443.04 4.981476.31 0.67 1484.93 0.19 1484.08 0.162127.17 299.17 2131.47 734.61 2133.49 720.193229.69 2.38 3205.66 1.28 3209.03 1.323384.87 7.47 3365.84 11.18 3369.44 113505.82 84.71 3474.5 180.74 3479.12 177.75191.8 3.32 191.32 15.01 194.43 10.05218.57 21.96 222.92 3.13 224.96 4.01267.93 27.05 263.17 186.82 265.86 78.55290.27 130.59 278.65 134.51 298.21 198.11387.79 19.01 392.16 18.82 394.74 19.99570.49 11.56 573.19 6.55 573.64 7.09584.91 4.19 596.31 2.59 596.93 2.57788.74 16.30 802.39 8.91 893.81 80.95902.23 31.88 894.69 79.43 1032.76 89.021033.80 83.20 1031.17 108.92 1089.89 11.371094.69 10.61 1085.35 12.45 1137.77 44.921135.26 47.07 1133.81 48.79 1273.41 22.11
C3H5ON 1278.81 10.48 1260.6 63.62 1373.41 22.111356.76 3.7 1363.86 18.47 1390.68 5.871400.34 23.91 1378.94 11.81 1447.1 13.891449.81 9.51 1443.03 12.52 1509.23 13.091523.18 10.39 1509.64 11.54 1520.34 10.941526.22 7.22 1521.19 9.31 2272 11.982277.03 0.9 2270.35 19.92 3042.14 13.613027.25 10.75 2972.02 2.17 3048.99 9.083079.31 0.37 3032.65 11.22 3122.11 22.683104.22 22.68 3112.9 16.33 3130.03 23.593121.81 13.86 3121.92 16.47 3659.5 46.273646.01 20.12 3243.97 248.16 - -
14
0 50 100 150 200 250 300wavelength (nm)
0
10000
20000
30000
Ab
so
rba
nce
Gas phase NH2CN
Ice phase NH2CN
Figure 3: Electronic absorption spectra of NH2CN in gas as well as in H2O ice
troscopy to find out the infrared signatures of the vibrational modes of HCCN. They
obtained this peak at around 3229 cm−1.
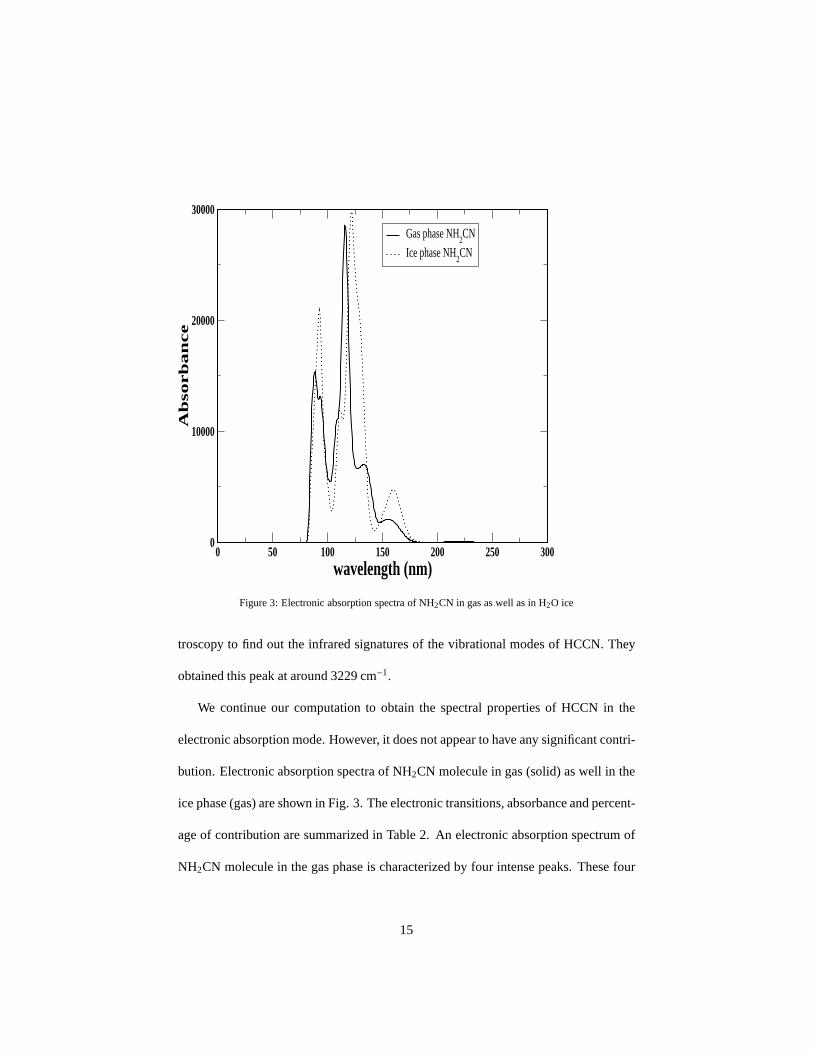
We continue our computation to obtain the spectral properties of HCCN in the
electronic absorption mode. However, it does not appear to have any significant contri-
bution. Electronic absorption spectra of NH2CN molecule in gas (solid) as well in the
ice phase (gas) are shown in Fig. 3. The electronic transitions, absorbance and percent-
age of contribution are summarized in Table 2. An electronicabsorption spectrum of
NH2CN molecule in the gas phase is characterized by four intensepeaks. These four
15

Table 2: Electronic transitions of different complex molecules at B3LYP/6-311++G** level theory in gasphase and H2O ice
Species Wavelength Absorbance Oscillator strength Transitions Contribution Wave length Absorbance Oscillator strength Transitions Contribution(gas phase) (%) (H2O ice) (%)
(in nm) (in nm)156.2 2058 0.0202 H-0→ L+5 38 159.2 4713 0.0837 H-0→ L+4 73133.7 7003 0 H-1→ L+5 86 121.9 10761 0.0002 H-0→ L+8 93
NH2CN 114.83 25998 0.0272 H-2→ L+5 81 111.6 11870 0 H-0→ L+12 9188.9 15378 0.1128 H-3→ L+9 72 92.2 20896 0.0168 H-1→ L+12 97397.4 656 0.0162 H-0→ L+1 201 365.9 734 0.0176 H-0→ L+1 201279.6 1560 0.0376 H-0→ L+4 199 285.7 2255 0.0548 H-0→ L+3 198
CH2NH2 187.6 4774 0.0066 H-0→ L+10 103 203.0 2505 0.1055 H-1→ L+1 161122.0 9633 0.011 H-2→ L+2 134 151.0 9357 0.0459 H-1→ L+0 166104.0 6197 0.0066 H-1→ L+12 151 121.2 8975 0.0009 H-1→ L+4 195262.9 540 0.0120 H-1→ L+1 191 259.2 738 0.0174 H-2→ L+1 192219.2 2777 0.0683 H-0→ L+1 194 200.2 1747 0.0363 H-0→ L+1 192
COOH 158.4 4349 0.0037 H-2→ L+0 120 169.2 6085 0.0936 H-0→ L+3 119126.4 5938 0.0002 H-3→ L+0 122 124.1 11461 0.0162 H-1→ L+2 130123.2 5887 0.0662 H-0→ L+7 149 101.0 6861 0.0086 H-1→ L+6 90114.4 5581 0.00005 H-2→ L+3 86 - - - - -101.0 3678 0.0121 H-0→ L+10 173 - - - - -306.8 6245 0.1448 H-0→ L+2 93 309.0 8194 0.0108 H-0→ L+3 98
C2H3ON 190.0 10132 0.0002 H-0→ L+9 88 204.4 4352 0.0063 H-0→ L+7 88113.0 12982 .0287 H-0→ L+20 96 106.3 20307.56 0.0095 H-2→ L+9 71144.73 6098 0.0317 H-1→ L+2 24 - - - - -
C3H5ON 118.0 19512 0.0178 H-1→ L+8 59 118.9 26299 0.0518 H-3→ L+5 61
transitions occurred at 156, 133, 114, 89nm with major contributions from H-0→ L+4,
H-0→ L+8, H-0→ L+12, H-1→ L+12 transitions respectively. Here, H represents the
highest occupied molecular orbital (HOMO) and L representsthe lowest unoccupied
molecular orbital (LUMO). Peaks at 156nm and 89nm are shifted to the right in the ice
phase and appear at 159nm and 92nm respectively with a bit high intensities. The peak
at 133nm is shifted to 121nm and has a high intensity. The peakat 114nm is shifted to
111nm and has a lower intensity. All the peak locations in electronic absorption spectra
with their respective absorbance and oscillator strengthsare highlighted in Table 2.
3.2. Precursor molecules of glycine
Observations of glycine are highly debated till date. Several chemical modeling as
well as experiments were performed during the past years. Chakrabarti et al. (2000a)
16

1e+02 1e+03 1e+04 1e+05 1e+06 1e+07log (Time) year
1e-60
1e-50
1e-40
1e-30
1e-20
1e-10
log
(n x
/nH) Glycine
C2H3ON
Figure 4: Time evolution of glycine with its precursor molecule, C2H3ON. The abundance of the precursormolecule is much higher and could be observed.
17

proposed the following pathways for the glycine production;
H2CO + HCN → C2H3ON (12)
C2H3ON + H2O→ C2H5NO2. (13)
Woon et al., (2002) performed quantum chemical calculations to evaluate the viability
of various pathways to the formation of glycine, They considered following pathway:
HCN + H → HCNH (14)
HCNH + H → CH2NH (15)
CH2NH + H → CH2NH2 (16)
CO + OH → COOH (17)
CH2NH2 +COOH → C2H5NO2. (18)
According to Woon (2002) glycine formation by this method ismost likely to happen
in such kind of interstellar ices which could have experienced thermal shocks or could
have formed in comets that could have passed through warmer regions of the solar sys-
tem. Since in our model calculations, we are restricted to the temperature 10K, this
network does not influence our glycine production at all. So,in our case, glycine is
mainly produced by the neutral-neutral pathways, as first discussed by Chakrabarti
et al. (2000a). In Fig. 4, the time evolution of glycine alongwith its precursor
18

molecule (C2H3ON) is shown. Peak abundance of C2H3ON and glycine are found
to be 7.3×10⁻¹³ and 1.96×10⁻¹⁷ respectively. According to Chakrabarti et al. (2000a)
and Majumdar et al. (2012), glycine could react with H2O to form glycolic acid as the
following;
C2H5NO2 + H2O→ C2H4O3 + NH3. (19)
We have included this reaction in our network. Peak abundance of glycolic acid is
calculated to be 1.36×10⁻²¹. As in Fig. 1, here also a sharp rise in the abundances are
observed due to the same reason as discussed in Fig. 1.
Though the pathways proposed by Woon (2002) which does not influence the pro-
duction of glycine at this low temperature, for the sake of completeness, we have iden-
tified CH2NH2 and COOH as precursor molecules for the production of glycine by this
route. Infrared peak positions with their absorbance in thegas phase as well as in the
ice phase is pointed for the species CH2NH2 in Table 1. We find that the most intense
mode in the gas phase appears nearly at 318 cm−1. This peak is shifted to the right in
the ice phase by 77 cm−1 and is appearing at 395 cm−1. It is interesting to note that one
strong peak appears at 484 cm−1 in the ice phase and its corresponding peak in the gas
phase spectrum is missing. Several new peaks are significantly pronounced in the ice
phase. Similarly, for COOH, we have presented similar parameters in Table 1. The gas
phase infrared spectrum of COOH mainly consists of three strong peaks. The strongest
peak in the gas phase arises at 1719 cm−1 (giving an excellent agreement with Chen
et al., 1998) followed by two moderate sized peaks at 971 cm−1 and 563 cm−1 respec-
tively. The strongest peak is shifted to the left in the ice phase and appears at around
1661 cm−1 followed by one right shifted peak at around 1004 cm−1 and one left shifted
19

peak at around 527 cm−1 respectively. One more prominent peak in the ice phase is
pronounced at 2759 cm−1, which is absent in the gas phase. All the ice phase peaks
are more intense in comparison to those of the gas phase. Infrared spectral parameters
of C2H3ON in gas phase as well as in the ice phase are noted in Table 1. We find that
gas phase IR spectra of C2H3ON contains two major peaks, one at 1133 cm−1 and the
other at 2127.17 cm−1. From Table 1 , it is clear that most of the peaks in gas phase are
shifted towards the left for the ice phase spectrum.
Different electronic absorption spectral parameters of CH2NH2 in the gas phase and
in the ice phase are given in Table 2. In the gas phase, the spectrum is characterized by
five intense peaks at 397.4, 279.4, 187.6, 122.0 and 104.0 nm. These intense peaks are
assigned due to the H-0→ L+1, H-0→ L+4, H-0→ L+10, H-2→ L+2, H-1→ L+12
HOMO-LUMO transitions. Peak positions are slightly shifted in the ice phase. In case
of COOH also, several intense peaks are prominent in the gas phase at 262.9, 219.2,
158.4, 126.4, 123.2, 114.4 and 101.0 nm. Few of these peaks disappear in the ice
phase (Table 2). It is to be noted that most of the peak intensities in the ice phase are
considerably higher. Similarly, the electronic absorption spectra of C2H3ON in the gas
and ice phases are given in Table 2. In the gas phase, it is characterized by three intense
peaks at 306.8, 190.0, and 113.0 nm. These intense peaks are assigned due to the H-
0→ L+2, H-0→ L+9, H-0→ L+20 HOMO-LUMO transitions. These peak positions
are slightly shifted in the ice phase.
20

1e+02 1e+03 1e+04 1e+05 1e+06 1e+07log (Time) year
1e-60
1e-50
1e-40
1e-30
1e-20
1e-10
log
(n
x/n
H)
C3H5ON
Alanine
Figure 5: Time evolution of alanine with its precursor molecule, C3H5ON.
21
3.3. Precursor molecules of alanine
According to Chakrabarti et al., 2000a, the alanine formation could be due to the
following reactions:
CH3CHO + HCN → C3H5ON (20)
C3H5ON + H2O→ C3H7NO2. (21)
According to Woon et al., (2002) production could follow thefollowing route;
NH2CH2 +COOH → NH2CHCOOH + H (22)
NH2CHCOOH +CH3 → C3H7NO2. (23)
Woon et al., (2002) discussed the production of Alanine in the UV irradiated ice, which
are much warmer. So this pathway is not relevant in the present situation. So the
neutral-neutral pathways as described by Chakrabarti et al. (2000a) could be very
useful. In the neutral-neutral reaction pathway, C3H5ON reacts with highly abundant
gas phase H2O to form alanine. Similar to the chemical evolution of adenine and
glycine shown in Fig. 1 & Fig. 4 respectively, chemical evolution of this precursor
molecule along with the alanine is shown in Fig. 5. Hydro-chemical modeling suggests
that C3H5ON having a peak abundance of 5.3×10⁻¹³ could produce alanine with a peak
abundance of 8.9×10⁻¹⁸. Here too, the precursors are several orders of magnitude more
abundant and they would be more easily detectable.
Infrared peak positions along with the absorbance of C3H5ON in the gas as well as
in the ice phase are highlighted in Table 1. The gas phase spectrum consists of several
22

intense peaks. There are two strong peaks located at 290 cm−1 and 1033 cm−1 respec-
tively. In the ice phase, several new peaks appear which havemuch higher intensity.
The strongest peaks in the ice phase appear at 3243 cm−1, 278 cm−1 and 263 cm−1
respectively. All other peak locations are given in Table 1.
The electronic absorption spectrum of C3H5ON molecule in gas phase is character-
ized by two intense peaks arising due to the H-1→ L+2, H-1→ L+8 HOMO-LUMO
transitions. The ice phase electronic absorption spectrumis followed by only one peak
(Table 2) at the wavelength 118.9 nm. The peak positions along with all the details of
the electronic absorption spectra are given in Table 2.
3.4. Formamide: An important precursor in the abiotic synthesis of amino acids
Formamide is the simplest amide containing peptide bond. Itis very abundant in
the ISM and could be an important precursor in the abiotic synthesis of amino acids
and thus significant to further prebiotic chemistry in the interstellar space. Formamide
was discovered in the interstellar space in the early 1970s.It has been identified by one
of the gas phase molecules in the past (Millar, 2004). It is also highly abundant in the
ice phase (Garrod et al., 2008). Formamide in the ISM could beproduced by several
pathways. Here we have mainly followed Quan & Herbst (2007) for its production in
the gas phase.
H2CO + NH+4 → NH4CH2O + +hν (24)
NH4CH2O + e− → HCONH2 + H + H2. (25)
23

5e+05 1e+06 2e+06 2e+06Time (year)
1e-49
1e-42
1e-35
1e-28
1e-21
1e-14
1e-07
log
(nX/n
H)
Gas phaseGrain phase
Figure 6: Time evolution of formamide in the gas phase as wellas in the ice phase.
24

For the production of Formamide in the ice phase we follow Jones et al., (2011) who
suggested the pathway below:
NH3 → NH2 + H (26)
H +CO → HCO (27)
HCO + NH2→ HCONH2, (28)
and Garrod et al., (2008) who suggested the pathway as given below:
OCN + H → HNCO (29)
HNCO + H → HNCHO (30)
HNCHO + H → HCONH2 (31)
Since reaction number 28 could also be possible in the gas phase, we include this reac-
tion in our gas phase network as well. Following the same technique used in Majumdar
et al., (2012), the reaction energy for this reaction is calculated to be−4.12 eV and the
rate coefficient calculated to be 2.73×10⁻¹¹ cm3S −1. In Fig. 6, we have shown the
time evolution of the formamide in the gas phase as well as in the ice phase. The peak
abundance of the gas phase formamide is calculated to be 1.33× 10⁻¹³, whereas the
grain phase formamide appears to be highly abundant (9.45×10⁻⁹).
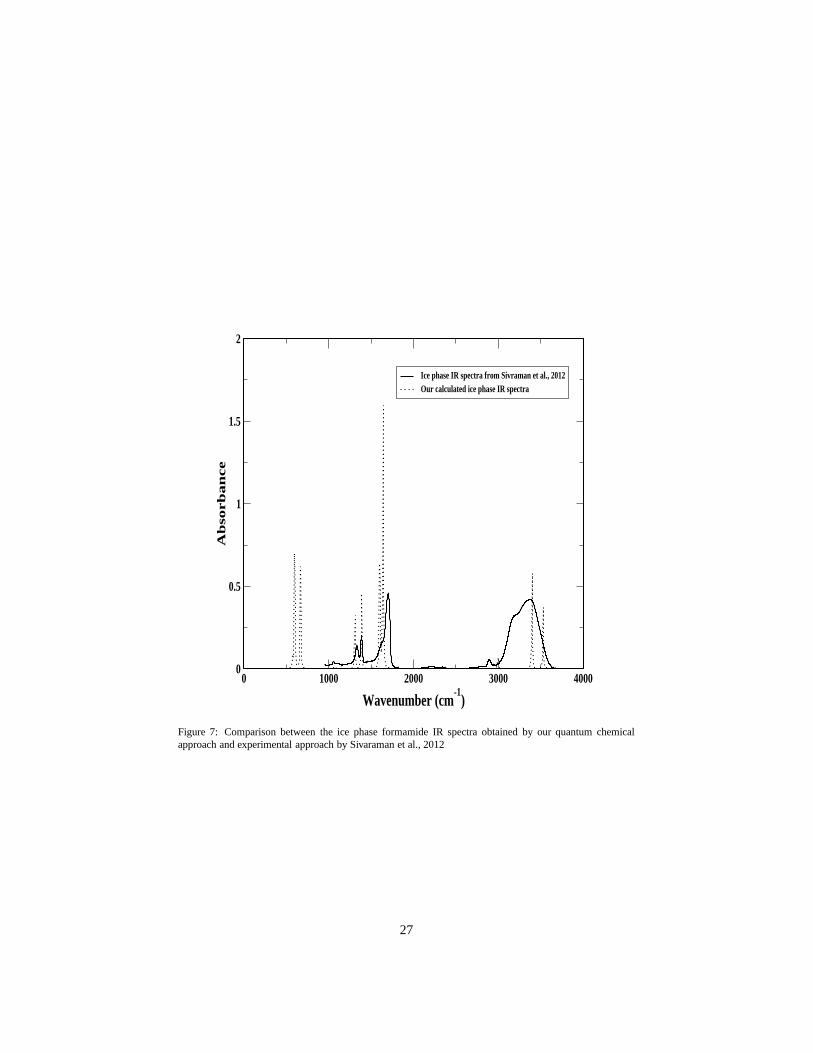
Recently Sivaraman et al. (2012), performed an experiment to obtain the IR spec-
tra of the formamide in the ice phase. They used experimentalsetup based at The
25

Table 3: Vibrational frequencies of Formamide in gas phase,H2O ice and methanol containing grains atB3LYP/6-311G++** level of theorySpecies Peak positions Absorbance Peak positions Absorbance Peak positions Absorbance Peak position Absorbance Peak positions
(Gas phase) (H2O ice) (Methanol ice) (Mixed ice) by Experiment(Wavenumber in cm−1) (Wavenumber in cm−1) (Wavenumber in cm−1) (Wavenumber in cm−1) (Wavenumber in cm−1)
535.27 217.71 574.75 24.36 574.72 23.96 574.72 24.34 -566.2 11.04 600.39 202.88 598.11 297.18 598.25 305.54 -656.9 134.94 668.7 202.88 669.25 200.41 670.22 198.46 -
1035.82 2.7188 1053.77 5.21 1053.25 5.2 1055.15 5.18 10221067.82 3.46 1082.36 2.24 1082.29 2 1083.01 2.16 1056
- - - - - - - - 1117- - - - - - - - 1172
1280.07 115.04 1309.74 134.26 1308.97 135.88 1309.8 134.71 1226- - - - - - - - 1334
H2NCHO 1416.33 27.68 1387.4 168.36 1388.86 158.32 1388.84 167.9 13861654.2 44.98 1602.01 311.72 1604.49 300.78 1603.19 293.25 16281697.36 405.23 1641.11 504.78 1643.25 503.21 1640.75 523.72 16983000.13 88.48 2996.46 32.04 2997.12 33.95 2991.10 32.51 2895
- - - - - - - - 31793569.63 27.22 3398.15 183.5 3405.10 175.06 3396.87 182.07 33723715.58 27.94 3528.69 156.17 3536.57 149.65 3529.07 157.64 -
Open University, UK (Sivaraman et al., 2008) to simulate astrochemical ices and their
irradiation environments. The instrument was operated at base pressure of the order
of 10−10Torr, and it could go down up to the temperature 28K. Low temperature was
achieved by using a closed cycle helium cryostat. A CaF2 substrate was placed at the
end of the cryostat onto which the molecular gases were directly deposited to form
multilayer targets. Sample temperature measurements werecarried out using a silicon
(Si) diode sensor calibrated using the calibration curve provided by the Scientific In-
struments. Formamide samples 99.5 % pure (from Sigma Aldrich), were used. Before
introducing the formamide vapour into the chamber, the liquid sample was processed
by three freeze-pump-thaw cycles to degas any absorbed impurities. The sample was
then allowed to return to room temperature before extracting the vapours to form the
ice on the CaF2 substrate.
We compare our theoretical result with this recent experiment. Figure 7 shows the
normalized infrared spectra of formamide molecule in the ice phase (where H2O was
used as a solvent) which we calculate along with the experimentally obtained infrared
26
0 1000 2000 3000 4000
Wavenumber (cm-1
)
0
0.5
1
1.5
2
Ab
so
rba
nce
Ice phase IR spectra from Sivraman et al., 2012Our calculated ice phase IR spectra
Figure 7: Comparison between the ice phase formamide IR spectra obtained by our quantum chemicalapproach and experimental approach by Sivaraman et al., 2012
27

spectra of formamide at 30K before irradiation. Peak positions are given in Table 3.
It is clear from Table 3 that some of the calculated peaks are very close to the experi-
mental values. For example, our calculated peak position isat 1387.40 cm−1, whereas
the experimentally obtained peak location is at 1386 cm−1. Beside this, there are a few
more peaks which are close to the experimental values (Table3). To have an idea
about the effect of solvent upon the spectrum, we considered different kind of ice
as a solvent. In general, we have considered the water ice butdepending upon the
properties around the molecular cloud, ice composition maybe different (Das et
al., 2010). Keeping this, first we consider pure methanol iceinstead of pure water
ice and study the changes in the peak positions and intensities (Table 3). Second,
based on the observational results, we consider a mixed ice,which consists of 70%
water, 20% methanol and 10% CO2 molecules and noted down the spectral prop-
erties in Table 3. From Table 3, it is evident that the peak positions of formamide
in methanol containing ice and mixed ice are slightly shifted in compare to the
formamide in pure water ice. Though some peak positions are closely coinciding
with our theoretical calculations, some observed peaks arewell above our values. Our
quantum chemical calculations are based upon the Ab initio methods in GAUSSIAN
09, which employ the Born-Openhiemer approximation in generating the energy ex-
pressions. It then allows us to separate the nuclear and electronic degrees of freedom.
The energy is the electronic energy parameterized by the frozen locations of the nuclei
and because they are frozen, the model simulates at 0K, whereas the experiment was
performed at 30K. Moreover, here we are not considering the clusters of formamide
for calculating the spectra. Rather, we are including one formamide molecule in a
28
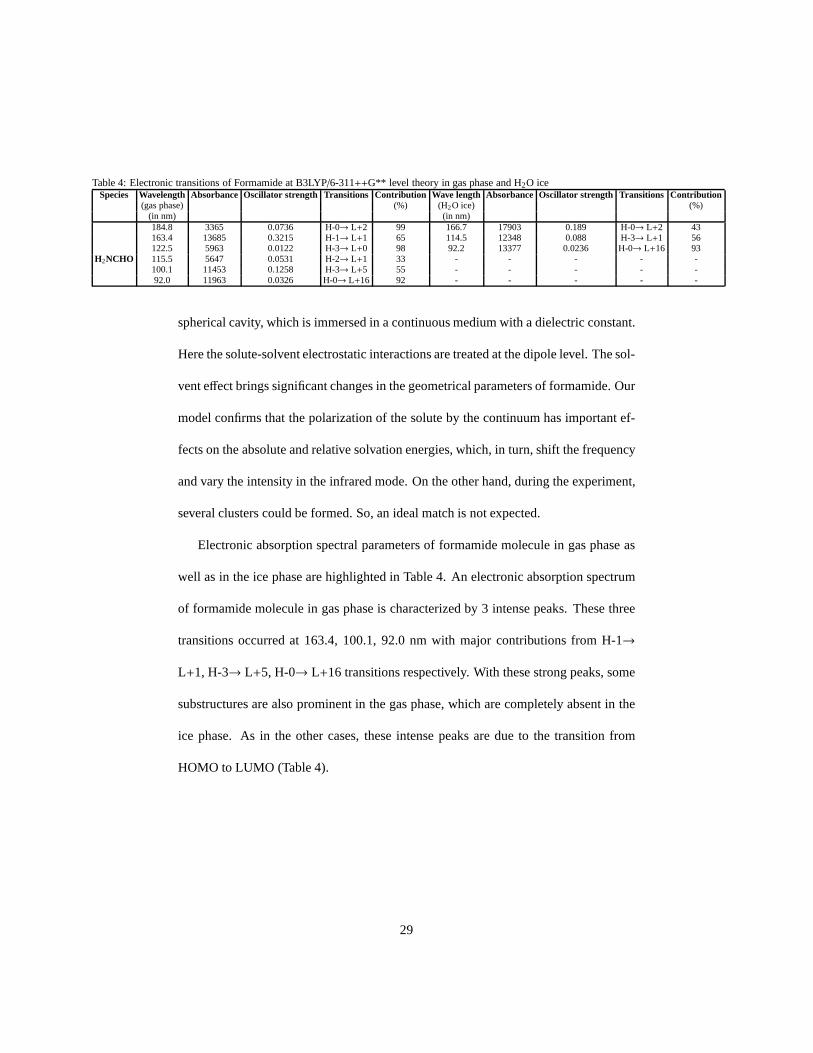
Table 4: Electronic transitions of Formamide at B3LYP/6-311++G** level theory in gas phase and H2O iceSpecies Wavelength Absorbance Oscillator strength Transitions Contribution Wave length Absorbance Oscillator strength Transitions Contribution
(gas phase) (%) (H2O ice) (%)(in nm) (in nm)184.8 3365 0.0736 H-0→ L+2 99 166.7 17903 0.189 H-0→ L+2 43163.4 13685 0.3215 H-1→ L+1 65 114.5 12348 0.088 H-3→ L+1 56122.5 5963 0.0122 H-3→ L+0 98 92.2 13377 0.0236 H-0→ L+16 93
H2NCHO 115.5 5647 0.0531 H-2→ L+1 33 - - - - -100.1 11453 0.1258 H-3→ L+5 55 - - - - -92.0 11963 0.0326 H-0→ L+16 92 - - - - -
spherical cavity, which is immersed in a continuous medium with a dielectric constant.
Here the solute-solvent electrostatic interactions are treated at the dipole level. The sol-
vent effect brings significant changes in the geometrical parameters of formamide. Our
model confirms that the polarization of the solute by the continuum has important ef-
fects on the absolute and relative solvation energies, which, in turn, shift the frequency
and vary the intensity in the infrared mode. On the other hand, during the experiment,
several clusters could be formed. So, an ideal match is not expected.
Electronic absorption spectral parameters of formamide molecule in gas phase as
well as in the ice phase are highlighted in Table 4. An electronic absorption spectrum
of formamide molecule in gas phase is characterized by 3 intense peaks. These three
transitions occurred at 163.4, 100.1, 92.0 nm with major contributions from H-1→
L+1, H-3→ L+5, H-0→ L+16 transitions respectively. With these strong peaks, some
substructures are also prominent in the gas phase, which arecompletely absent in the
ice phase. As in the other cases, these intense peaks are due to the transition from
HOMO to LUMO (Table 4).
29

4. Conclusion
In this paper, we have explored the infrared and electronic absorption spectra of var-
ious complex molecules, which could be treated as the precursors of adenine, glycine
and alanine in several astronomical situations.Since we use a realistic scenario with
hydro-chemical evolutions with accurate rate coefficients (Majumdar et al. 2012)
our results could be significant for future observations.
In comparison with the gas phase spectra, the spectral properties in the ice phase are
significantly different. Various peak positions are shifted and some peaks completely
disappeared. Some substructures became pronounced also inthe ice phase.Based on
the observational results, we simulated our grain mantle differently which have
different ice compositions. We considered the ice to be that of pure water or pure
Methanol or even mixed (70% water 20% methanol and 10% CO2) in nature. We
have highlighted the dependence of the spectral changes on the solvent types
We computed the chemical evolution of adenine, alanine & glycine along with their
precursor molecules. We pointed out that the computed abundances of the precursor
molecules are within the observational limits and could be detected in future. Based
on the abundances of these precursor molecules, one could estimate the abundances of
the molecules of our interest. We made a comparison between our calculated infrared
spectra of formamide and experimentally obtained infraredspectra. Some of the peak
locations are found to coincide while a few others do not match. We presented possible
reasons behind this.
There are ample debates on whether alanine, glycine or adenine has been seen in
interstellar medium or not, It is possible that the abundances of these molecules are very
30
small and the present day equipments lack sufficient sensitivities. However, our paper
probes the feasibility of observing the precursors of thesevery important molecules
and computed abundances seem to indicate that they are observable, in principle. We
have also computed the spectral features, i.e., the wavelengths where the characteristic
peaks would be observed. We anticipate that these results would be appreciated by
observers.
5. Acknowledgment
We acknowledge the help of Dr. B. Sivaraman, INSPIRE Faculty(IFA-11CH -11),
Indian Institute of Science, B. N. Raja Sekhar of AMPD, BARC at RRCAT Indore and
N. J. Mason of The Open University for supplying us with the experimental IR data
for Formamide. LM, SKC & SC are grateful to DST for the nancialsupport through a
project (Grant No. SR/S2/HEP-40/2008) and AD thanks ISRO respond project (Grant
No. ISRO/RES/2/372/11-12).
References
[1] Abelson, P. H., 1966, Proc. Natl. Acad. Sci., 55, 1365
[2] Bates, D. R, 1983, ApJ 270, 564
[3] Bujarrabal, V., Fuente, A., Omont, A., 1994, A&A, 285, 247
[4] Chakrabarti, S.K., Das, A., Acharyya, K., Chakrabarti,S., 2006, A&A, 457, 167
[5] Chakrabarti, S.K., Das, A., Acharyya, K., Chakrabarti,S., 2006, BASI, 34, 299
31
[6] Chen, J., Hamon, M. A., Yongsheng Chen, H. H.,Rao, A. M., Eklund, P. C., Had-
don, R. C., 1998, Science, 282, 95
[7] Cuppen, H. M., Herbst, E., 2007, APJ, 668, 294
[8] Cuppen, H. M., Van Dishoeck E., F., Herbst, E., Tielens, A. G. G. M., 2009, A&A,
508, 275
[9] Das, A., Chakrabarti, S. K., Acharyya K. & Chakrabarti, S., 2008a, NEWA, 13,
457
[10] Das, A., Acharyya, K., Chakrabarti, S. & Chakrabarti, S. K.,2008b, A & A, 486,
209
[11] Das, A., Acharyya, K. & Chakrabarti, S. K., 2010, MNRAS 409, 789
[12] Das, A. & Chakrabarti, S. K., 2011, 418. 545, MNRAS
[13] Das, A. Majumdar, L., Chakrabarti, S. K., & ChakrabartiS., 2012, NEWA (sub-
mitted)
[14] Dendramis, A., Leroi, G. E., 1977, JCP, 66, 4334
[15] Draine, B. T., 2003, ApJ 598, 1017
[16] Garrod, T, Weaver, S. L. W., Herbat, E., 2008, APJ, 682,283
[17] Gibb, E. L., Whittet, D. C. B., Boogert, A. C. A., & Tielens, A. G. G. M. 2004,
ApJS, 151, 35
[18] Gupta, V.R., Tandon, P., Rawat, P., Singh, R.N. & Singh,A.,A&A, 528, A129
32
[19] Guelin, M., & Cemicharo, J. 1991, A&A, 244, L21
[20] Hasegawa, T., Herbst, E., Leung, C.M., 1992, APJ, 82, 167
[21] Hollis, J.M. et al., 2003, ApJ 588, 353
[22] Jiurys, L. M. 2006, Proc. Nat. Acad. Sci., 103, 12274
[23] Jones, B. M., Bennett, C., Kaiser, R., 2011, APJ, 734, 78
[24] Keane, J. V., Boogert, A. C. A., Tielens, A. G. G. M., Ehrenfreund, P., Schutte,
W. A., 2001, A&A, 375L, 43
[25] Kuan, Y.J., Charnley, S.B., Huang, H.C., Tseng, W.L., Kisiel, Z., 2003. ApJ 593,
848.
[26] Liszt, H., & Lucas, R. 2001, A&A, 370, 1
[27] Majumdar, L., Das, A., Chakrabarti, S.K., Chakrabarti, S., 2012, RAA (accepted)
[28] McCarthy, M. C., Gottlieb, C. A., Coosky, A. L., Thasseus, P., 1995, JCP, 103,
7779
[29] McGonagale, D., Irvine, W. M., 1996, A&A, 310, 970
[30] Millar, T.J. 2004, Organic molecules in the interstellar medium. In Astrobiology:
future perspectives, Kluwer Academic Publisher vol. 305, 17
[31] Orgel, L. E., 2004, Biochem Mol. Biol., 39, 99
[32] Omont, A., 1993, J. Chem. Soc. Faraday Trans, 89, 2137
33

[33] Rubalcava, Hector, 1956, Ph.D. thesis, California Institute of Technology.
http://resolver.caltech.edu/CaltechETD:etd-06242004-155629
[34] Sivaraman, B., Ptasinska, S., Jheeta, S., Mason, N.J.,2008. Chem. Phys. Lett.
460 (1-3),108
[35] Sivaraman, B., Raja Sekhar B. N., Nair, B. G., Hatode, V., Mason, N. J.,2012,
Spectrochimica Acta: part A-molecular and biomolecular spectroscopy (submitted)
[36] Quan, D., Herbst, E., 2007, A&A, 474, 521
[37] Snyder, L.E. et al., 2005,. ApJ 619, 914.
[38] Turner, V. E., List, H. S., Kaifu, N., & Kisliakov, A. G. 1975, ApJ, 201, L149
[39] Woodall, J., Agndez, M., Markwick-Kemper, A.J., Millar, T.J., 2007, A&A, 466,
1197
[40] Woon, D.E., 2002, APJ, 571, L177
34
Related Documents


![27/2/2019 Sistema Electrónico de Comunicación con emisoras ... · [700003] Datos informativos- Estado de resultados 12 meses ... importantes recintos de exposiciones y convenciones](https://static.cupdf.com/doc/110x72/5e8ca9c57a1e067cb36b937c/2722019-sistema-electrnico-de-comunicacin-con-emisoras-700003-datos.jpg)