i STUDY OF SLEEP-WAKE PROPERTIES OF α-ASARONE, AN ACTIVE PRINCIPLE OF ACORUS CALAMUS LINN, IN ANIMAL INSOMNIA MODEL A THESIS PRESENTED BY ARATHI R. TO SREE CHITRA TIRUNAL INSTITUTE FOR MEDICAL SCIENCES AND TECHNOLOGY, TRIVANDRUM IN PARTIAL FULFILMENT OF THE REQUIREMENTS FOR THE AWARD OF DOCTOR OF PHILOSOPHY 2017

Welcome message from author
This document is posted to help you gain knowledge. Please leave a comment to let me know what you think about it! Share it to your friends and learn new things together.
Transcript
i
STUDY OF SLEEP-WAKE PROPERTIES OF
α-ASARONE, AN ACTIVE PRINCIPLE OF
ACORUS CALAMUS LINN, IN ANIMAL
INSOMNIA MODEL
A THESIS PRESENTED BY
ARATHI R.
TO
SREE CHITRA TIRUNAL INSTITUTE FOR
MEDICAL SCIENCES AND TECHNOLOGY,
TRIVANDRUM
IN PARTIAL FULFILMENT OF THE REQUIREMENTS FOR THE AWARD OF
DOCTOR OF PHILOSOPHY
2017
ii
DECLARATION BY THE STUDENT
I, Arathi R, hereby certify that I had personally carried out the work depicted in the
thesis entitled, “study of sleep-wake properties of α-Asarone, an active principle
of acorus calamus linn, in animal insomnia model”. No part of the thesis has been
submitted for the award of any other degree or diploma prior to this date.
29.11.2017 Arathi R.
Division of Sleep Research
Biomedical Technology wing
Sree Chitra Tirunal Institute for Medical Sciences and Technology
Trivandrum 695012, India
iii
CERTIFICATE OF THE GUIDE
Dr. Kamalesh K. Gulia
Division of Sleep Research
Division of Applied Biology, Biomedical Technology wing
Sree Chitra Tirunal Institute for Medical Sciences and Technology
Trivandrum 695012, India
This is to certify that Arathi R of the Division of Sleep Research of this Institute has
fulfilled the requirements prescribed for the Ph.D degree of the Sree Chitra Tirunal
Institute for Medical Sciences and Technology, Trivandrum. The thesis entitled,
“study of sleep-wake properties of α-Asarone, an active principle of acorus
calamus linn, in animal insomnia model” was carried out under my direct
supervision. No part of the thesis was submitted for the award of any degree or
diploma prior to this date.
Clearance was obtained from the Institutional Animal Ethics Committee for carrying
out the study.
Dr. Kamalesh K. Gulia
iv
STUDY OF SLEEP-WAKE PROPERTIES OF
α-ASARONE, AN ACTIVE PRINCIPLE OF
ACORUS CALAMUS LINN, IN ANIMAL
INSOMNIA MODEL
Submitted by
ARATHI R.
for the degree of Doctor of Philosophy
of
SREE CHITRA TIRUNAL INSTITUTE FOR
MEDICAL SCIENCES AND TECHNOLOGY,
TRIVANDRUM
is evaluated and approved by
Dr. Kamalesh K. Gulia
(Guide) (Examiner)
v
ACKNOWLEDGEMENT
From the bottom of my heart I would like to convey my sincere gratitude to all the people who
have contributed in assorted ways in my journey of doing good scientific research.
I consider myself fortunate to be a part of Sree Chitra family and would like to thank the former
and the present Directors of SCTIMST and the present Head and the previous Heads, BMT Wing
for all support provided during the course of my work. I would also like to thank the former and
present Deans and Associate Deans of SCTIMST for their support and encouragement.
I would like to express my heartfelt gratitude and respect to my supervisor, Dr. Kamalesh K.
Gulia for her continued encouragement and constant support in my research program, which has
helped me greatly in the successful completion of my thesis. Her guidance not only improved my
knowledge but also increased my confidence and dedication in work. I consider it as a great
opportunity to do my doctoral programme under her guidance and to learn from her research
expertise.
I would like to thank my DAC members Dr. V. Mohan Kumar, Dr. Jayakumari N. and Dr.
Oommen V. Oommen who were activley involved in my research work. Without their passionate
participation and input, the work could not have been successfully conducted.
I am thankful to the Deputy Registrar, Dr. Santhosh Kumar and all the members of Academic
Division for their support.
A very special gratitude goes out to all at Council of Scienitific and Industrial Research (CSIR)
for providing fellowship and for funding the research work.
I sincerely thank Dr. Jayakumari N for her constant support and encouragment in this pursuit of
knowledge. I am also thankful to all the members of Department of Biochemistry, Dr. Deepa, Dr.
Reema and Dr. Sini, for their valuable inputs and support provided for learning Biochemical
estimations.
vi
I am thankful to Dr. Harikrishnan and all members of Division of Laboratory Animal Sciences
(DLAS), SCTIMST, for providing healthy animals for my research work and also helping me to
improve my animal handling skills. I also acknowledge Dr. Sachin Shenoy, Division of In-Vivo
Models and Techniques, for giving tips in animal handling.
I would like to thank all my colleagues and friends Dr. Lakshmi R., Mrs. Aswathy BS, Ms.
Shanaz Sharaf, Ms. Neelima S, Ms. Johnsy Mary, Mr. Niraj Patel, and Dr. Baskaran for all
their support and cooperation along the way. Special thanks to Dr. Lakshmi for teaching me
basics of Biochemical estimations.
I acknowledge all my friends and room mates at Sree Chitra and friends outside the campus, for
adding fun to my PhD life.
Words fail to express my love and respect to my parents Mr. R. Radhakrishnan and Mrs.
Radhika Devi M.K. for all their prayers, blessings and multi dimentional support in my life. They
are undoubtedly my role models. I am also grateful to my sister Mrs. Keerthi R for being my
inspiration and my niece Cucu for loving her ‘mema’ so much. I also acknowledge my
grandfather Mr. M. K. Menon for admiring my research career and motivating me to do much
better. My special thanks to my in-laws for their understanding and patience.
The biggest blessing God has ever given me in my life is my husband and my best freind Mr.
Prashant P. Nair. I don’t have words to express my love and respect for all that unconditional
trust he has on me. His persistent mental support, patience and constructive criticism have
always boosted my confidence and helped me in making decisions during those critical times in
my PhD life.
Last but not the least; I am nothing without the Supreme power that has always been a driving
force and strength inside me.
vii
TABLE OF CONTENT
Page No
DECLARATION BY STUDENT ii
CERTIFICATE OF GUIDE iii
APPROVAL OF THESIS iv
ACKNOWLEDGEMENT v
TABLE OF CONTENTS vii
LIST OF FIGURES xii
LIST OF TABLES xvi
LIST OF ABBREVIATIONS xvii
SYNOPSIS xviii
I INTRODUCTION 1
II REVIEW OF LITERATURE 10
1. Sleep and Wakefulness (S-W) 11
2. Sleep and thermoregulation 17
3. Sleep disorders 22
4. Insomnia 24
4.1. Epidemiology of insomnia 25
4.2. Pathophysiology of insomnia 28
4.3. Causes and consequences of insomnia 31
4.4. Methods to assess insomnia 34
4.5. Animal models of insomnia 34
4.6. Insomnia and thermoregulation 37
4.7. Insomnia and anxiety 38
4.8. Insomnia and oxidative stress 40
5. Various therapeutic approach to insomnia 41
5.1. Pharmacological treatment 41
viii
5.2. Non-pharmacological treatment 45
5.3. Traditional/ Herbal treatment 46
6. Acorus calamus Linn. 53
6.1. Features and distribution 53
6.2. Chemical compositions 54
6.3. Pharmacological properties 55
6.4. Effect of A. calamus on central nervous system 58
6.5. Dose in Ayurvedic literature 60
6.6. Toxicity 61
7. α-Asarone 62
7.1. Pharmacokinetics of α-Asarone 63
7.2. Toxicity of α-Asarone 63
7.3. Effect of α-Asarone on central nervous system 64
8. Lacunae 67
9. Aim and Objectives 68
III MATERIALS AND METHODS 70
1. Animal model 71
2. Sampling 71
3. Procedures to assess S-W, Thy and Tbody 72
3.1. Chemicals and instruments used 72
3.2. Surgical Procedure 73
3.3. Post-surgical procedures 77
4. Acquisition and analysis of S-W, Thy and Tbody signals 77
4.1. Instruments and software‟s used 77
4.2. Procedure 80
5. Acquisition and analysis of anxiety data 81
5.1. Instruments and software‟s used 81
5.2. Procedure 82
ix
6. Brain antioxidant estimation 83
6.1. Chemicals and instruments used 83
6.2. Procedure 84
7. SD procedure 90
8. Positive control for SD studies 92
9. Experimental design 92
9.1. Objective 1: To evaluate the effect of administration of various
doses of α-Asarone on S-W, Thy and Tbody in normal rats. 92
9.2.
Objective 2: To investigate the effect of chronic administration
(21 days) of optimal dose of α-Asarone on S-W, Thy and Tbody in
normal rats.
94
9.3.
Objective 3.1: To investigate the effect of optimal dose of α-
Asarone on S-W, Thy and Tbody in rats acutely sleep deprived by
gentle handling (5 h/ 5 days).
96
9.4.
Objective 3.2: To investigate the effects of optimal dose of α-
Asarone on anxiety in rats acutely sleep deprived by gentle
handling (5 h/ 5 days).
98
9.5.
Objective 3.3: To investigate the effect of optimal dose of α-
Asarone on antioxidant levels in the brain of rats acutely sleep
deprived by gentle handling (5 h/ 5 days).
99
9.6.
Objective 4: To investigate the effect of optimal dose of α-
Asarone on S-W, Thy, Tbody, anxiety and brain antioxidant levels
in rats chronically sleep deprived in rotating wheel (5 h/ 21
days).
101
9.7.
Objective 5: To understand the mechanism of action of α-
Asarone by examining the relationship of Thy and Tbody with
NREM and REM sleep.
104
IV RESULTS 105
x
1. Objective 1: To evaluate the effect of administration of various
doses of α-Asarone on S-W, Thy and Tbody in normal rats. 106
2.
Objective 2: To investigate the effect of chronic administration
(21 days) of optimal dose of α-Asarone on S-W, Thy and Tbody in
normal rats.
114
3.
Objective 3.1: To investigate the effect of optimal dose of α-
Asarone on S-W, Thy and Tbody in rats acutely sleep deprived by
gentle handling (5 h/ 5 days)
119
4.
Objective 3.2: To investigate the effects of optimal dose of α-
Asarone on anxiety in rats acutely sleep deprived by gentle
handling (5 h/ 5 days).
126
5.
Objective 3.3: To investigate the effect of optimal dose of α-
Asarone on antioxidant levels in the brain of rats acutely sleep
deprived by gentle handling (5 h/ 5 days).
131
6.
Objective 4: To investigate the effect of optimal dose of α-
Asarone on S-W, Thy, Tbody, anxiety and brain antioxidant levels
in rats chronically sleep deprived in rotating wheel (5 h/ 21
days).
134
6.1. Effect of optimal dose of α-Asarone on S-W, Thy and Tbody after
chronic SD in rotating wheel. 134
6.2. Effect of optimal dose of α-Asarone on anxiety after chronic SD
in rotating wheel 144
6.3. Effect of optimal dose of α-Asarone on antioxidant levels in
brain after chronic SD in rotating wheel 147
7.
Objective 5: To understand the mechanism of action of α-
Asarone by examining the relationship of Thy and Tbody with
sleep.
150
7.1. Relationship of Thy and Tbody with S-W after administration of
various doses of α-Asarone 150
xi
7.2. Relationship of Thy and Tbody with S-W after chronic
administration of optimum dose of α-Asarone 155
7.3.
Relationship of Thy and Tbody with S-W in vehicle-, α-Asarone-
and midazolam-treated rats acutely sleep deprived by gentle
handling
158
7.4.
Relationship of Thy and Tbody with S-W in vehicle-, α-Asarone-
and midazolam-treated rats chronically sleep deprived in
rotating wheel
158
V DISCUSSION 164
1. Effects of the optimal dose of α-Asarone on S-W, Thy and Tbody 165
2.
Effects of optimal dose of α-Asarone on SD-induced changes in
S-W, Thy and Tbody
167
3. Effect of α-Asarone on SD-induced changes in anxiety levels 170
4.
Effect of α-Asarone on SD-induced changes in brain antioxidant
levels
171
5. Mechanism of action of α-Asarone 173
6. Clinical significance of the study 178
7. Future directions 178
VI CONCLUSION 179
VII BIBLIOGRAPHY 181
VIII ANNEXURES 198
1. List of publications 199

xii
LIST OF FIGURES
xiii
Figure
No.
Caption Page
No.
1. Representative EEG and EMG traces during W, NREM and REM
sleep in rats 15
2. Acorus calamus Linn. 54
3. Chemical structure of α-Asarone 62
4. Schematic representation showing objective-wise distribution of rats 71
5. Stereotaxic instrument 73
6. Implantation of EEG and EMG electrodes and thermocouple to
measure S-W and Thy respectively in rats 75
7. Implantation of radio-transmitter to measure Tbody in rats 76
8. Implanted rat singly housed in polystyrene cage with food and water
provided ad libitum 77
9. Schematic representation of experimental set up and acquisition 79
10. EPM and OFT for anxiety measurement in rats 82
11. Custom made rotating wheel for conducting chronic SD in rats 91
12. Schematic representation of the objective 1 experimental schedule 93
13. Schematic representation of the objective 2 experimental schedule 95
14. Schematic representation of the objective 3.1 experimental schedule 96
15. Schematic representation of the objective 3.2 experimental schedule 98
16. Schematic representation of the objective 3.3 experimental schedule 100
17. Schematic representation of the objective 4 experimental schedule 102
18. Effect of various doses of α-Asarone on the percentage S-W time 106
19. Changes in the average duration and frequency of NREM sleep bouts
after administration of 10 mg/kg α-Asarone and vehicle 108
20. Effect of various doses of α-Asarone on EEG power spectra of
NREM and REM sleep 111
21. Paroxysmal activity in EEG after administering 120 mg/kg α-Asarone 112
xiv
22. Effect of chronic administration of 10 mg/kg α-Asarone on S-W
quality parameters 116
23. Effect of chronic administration of 10 mg/kg α-Asarone on EEG
power spectra of NREM and REM sleep 117
24. Effect of acute SD by gentle handling on S-W quality parameters
after administration of vehicle, α-Asarone and midazolam 121
25.
Effect of acute SD by gentle handling on EEG power spectra of
NREM and REM sleep after administration of vehicle, α-Asarone and
midazolam
123
26. EEG power spectra of NREM sleep after 23 h of fourth injection of
vehicle, α-Asarone and midazolam: Withdrawal effect 124
27. Effect of acute SD by gentle handling on Thy and Tbody profile after
administration of vehicle, α-Asarone and midazolam 125
28. Effect of acute SD by gentle handling on EPM test parameters after
administration of vehicle, α-Asarone and midazolam 127
29. Effect of acute SD by gentle handling on OFT parameters after
administration of vehicle, α-Asarone and midazolam 128
30. Effect of chronic SD in rotating wheel on latency to sleep after
administration of vehicle, α-Asarone and midazolam 134
31. Effect of chronic SD in rotating wheel on S-W quality parameters
after administration of vehicle, α-Asarone and midazolam 137
32.
Effect of chronic SD in rotating wheel on EEG power spectra of
NREM sleep after administration of vehicle, α-Asarone and
midazolam
139
33. Effect of chronic SD in rotating wheel on Thy and Tbody profile after
administration of vehicle, α-Asarone and midazolam 140
34. Changes in EEG spectrum of NREM and REM sleep 24, 48 and 72 h
after chronic SD in rotating wheel for 21 days 143
35. Effect of chronic SD in rotating wheel on EPM test parameters after 145
xv
administration of vehicle, α-Asarone and midazolam for 20 day.
36. Effect of chronic SD in rotating wheel on OFT parameters after
administration of vehicle, α-Asarone and midazolam for 21 days 146
37.
Scatter plot showing correlation between the NREM sleep bout
duration and the Thy and Tbody during NREM sleep after
administration of various doses of α-Asarone
152
38. Thy and Tbody profile for various NREM sleep bout durations after
administration of vehicle, 10 and 120 mg/kg α-Asarone 153
39.
Scatter plot showing correlation between the REM bout duration and
the Thy and Tbody during REM sleep after administration of various
doses of α-Asarone
154
40.
Scatter plot showing correlation between the NREM sleep bout
duration and the Thy and Tbody during NREM sleep after chronic
administration of 10 mg/kg α-Asarone
156
41. Thy and Tbody profile for various NREM sleep bout durations after
administration of 10 mg/kg α-Asarone for 7 and 21 days 157
42.
Scatter plot showing relationship of Thy and Tbody with NREM sleep
in vehicle-, α-Asarone- and midazolam-treated rats acutely sleep
deprived by gentle handling
160
43.
Scatter plot showing relationship of Thy and Tbody with REM sleep in
vehicle-, α-Asarone- and midazolam-treated rats acutely sleep
deprived by gentle handling
161
44.
Scatter plot showing relationship of Thy and Tbody with NREM sleep
in vehicle-, α-Asarone- and midazolam-treated rats chronically sleep
deprived in rotating wheel
162
45.
Scatter plot showing relationship of Thy and Tbody with REM sleep in
vehicle-, α-Asarone- and midazolam-treated rats chronically sleep
deprived in rotating wheel
163
46. Changes observed during sleep deprivation 176

xvi
LIST OF TABLES
47. Mechanism of action of α-Asarone 177
xvii
LIST OF IMPORTANT ABBREVIATIONS
Table
No.
Title Page
No.
1. Effect of different doses of α-Asarone on the percentage
NREM and REM sleep in hourly bin 107
2. Effect of various doses of α-Asarone on S-W quality parameters 110
3. Effect of various doses of α-Asarone on Thy and Tbody profile 113
4. Effect of chronic administration of 10 mg/kg α-Asarone on
percentage S-W time 115
5. Effect of chronic administration of 10 mg/kg α-Asarone on Thy and
Tbody profile
118
6. Effect of acute SD by gentle handling on percentage S-W time after
administration of vehicle, α-Asarone and midazolam 120
7. Values of all parameters of EPM after administration of α-Asarone,
midazolam and vehicle in acutely SD rats 129
8. Values of all parameters of OFT after administration of α-Asarone,
midazolam and vehicle in acutely SD rats 130
9. Effect of acute SD by gentle handling on antioxidant levels after
administration of vehicle and α-Asarone 133
10. Effect of chronic SD in rotating wheel on percentage S-W time after
administration of vehicle, α-Asarone and midazolam 135
11. Changes in S-W parameters 24, 48 and 72 h after chronic SD in
rotating wheel for 21 days 142
12. Effect of chronic SD in rotating wheel on antioxidant levels after
administration of vehicle and α-Asarone 149
xviii
α-Asarone Alpha-Asarone
AP Antero-Posterior
CAT Catalase
DV Dorso-Ventral
EEG Electroencephalogram
EMG Electromyogram
EPM Elevated Plus Maze
GSH Glutathione
GSH-Px Glutathione peroxidase
GSH-R Glutathione reductase
i.p. Intra-peritoneum
i.m. Intra-muscular
MDA Malondialdehyde
ML Medio-Lateral
NREM Non-Rapid Eye Movement
OFT Open Field Test
REM Rapid Eye Movement
SD Sleep Deprivation
SOD Superoxide dismutase
S-W Sleep-Wakefulness
Tbody Body temperature
Thy
Veh
Hypothalamic temperature
Vehicle

xix
SYNOPSIS
xx
This thesis includes seven chapters. An overview of the purpose and significance
of the study is described in Introduction as Chapter 1. Detailed Review of
Literature is the provided in the Chapter 2. Summary and comparison of the main
developments and the current debates in the field related to the topic of thesis are
described along with the research problem, and the proposal to solve the problem
containing the aim and the objectives set for validating the hypotheses are given
below.
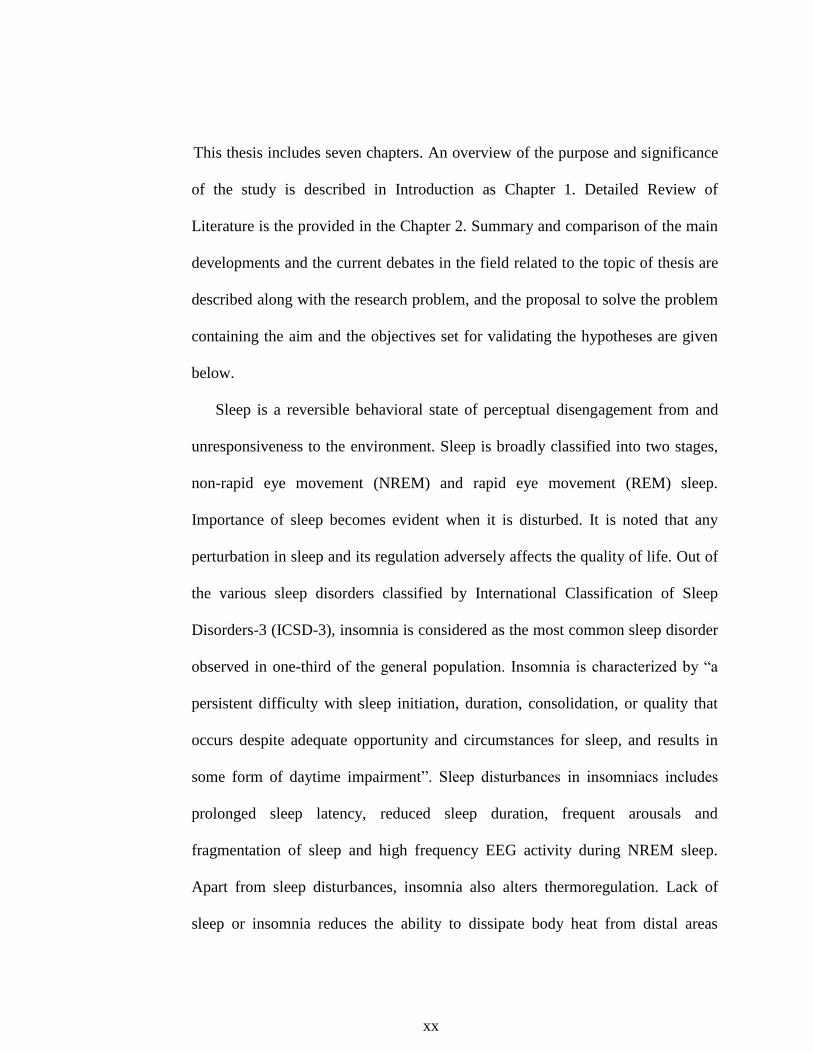
Sleep is a reversible behavioral state of perceptual disengagement from and
unresponsiveness to the environment. Sleep is broadly classified into two stages,
non-rapid eye movement (NREM) and rapid eye movement (REM) sleep.
Importance of sleep becomes evident when it is disturbed. It is noted that any
perturbation in sleep and its regulation adversely affects the quality of life. Out of
the various sleep disorders classified by International Classification of Sleep
Disorders-3 (ICSD-3), insomnia is considered as the most common sleep disorder
observed in one-third of the general population. Insomnia is characterized by “a
persistent difficulty with sleep initiation, duration, consolidation, or quality that
occurs despite adequate opportunity and circumstances for sleep, and results in
some form of daytime impairment”. Sleep disturbances in insomniacs includes
prolonged sleep latency, reduced sleep duration, frequent arousals and
fragmentation of sleep and high frequency EEG activity during NREM sleep.
Apart from sleep disturbances, insomnia also alters thermoregulation. Lack of
sleep or insomnia reduces the ability to dissipate body heat from distal areas
xxi
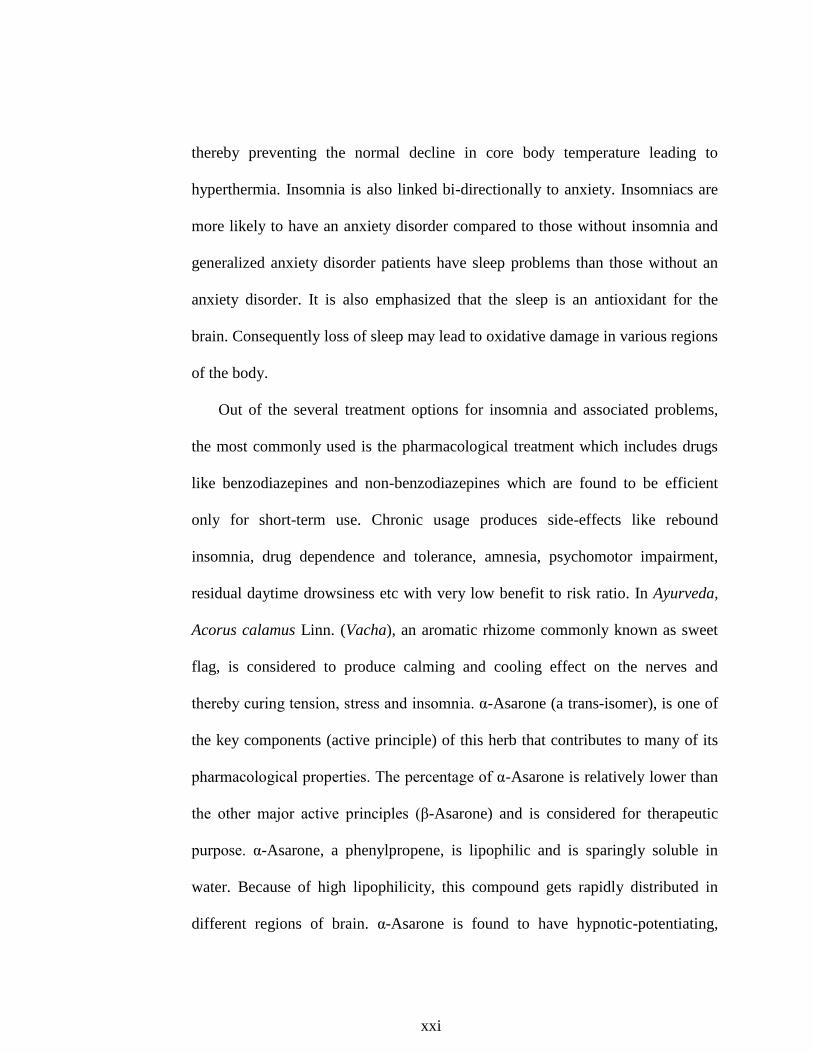
thereby preventing the normal decline in core body temperature leading to
hyperthermia. Insomnia is also linked bi-directionally to anxiety. Insomniacs are
more likely to have an anxiety disorder compared to those without insomnia and
generalized anxiety disorder patients have sleep problems than those without an
anxiety disorder. It is also emphasized that the sleep is an antioxidant for the
brain. Consequently loss of sleep may lead to oxidative damage in various regions
of the body.
Out of the several treatment options for insomnia and associated problems,
the most commonly used is the pharmacological treatment which includes drugs
like benzodiazepines and non-benzodiazepines which are found to be efficient
only for short-term use. Chronic usage produces side-effects like rebound
insomnia, drug dependence and tolerance, amnesia, psychomotor impairment,
residual daytime drowsiness etc with very low benefit to risk ratio. In Ayurveda,
Acorus calamus Linn. (Vacha), an aromatic rhizome commonly known as sweet
flag, is considered to produce calming and cooling effect on the nerves and
thereby curing tension, stress and insomnia. α-Asarone (a trans-isomer), is one of
the key components (active principle) of this herb that contributes to many of its
pharmacological properties. The percentage of α-Asarone is relatively lower than
the other major active principles (β-Asarone) and is considered for therapeutic
purpose. α-Asarone, a phenylpropene, is lipophilic and is sparingly soluble in
water. Because of high lipophilicity, this compound gets rapidly distributed in
different regions of brain. α-Asarone is found to have hypnotic-potentiating,
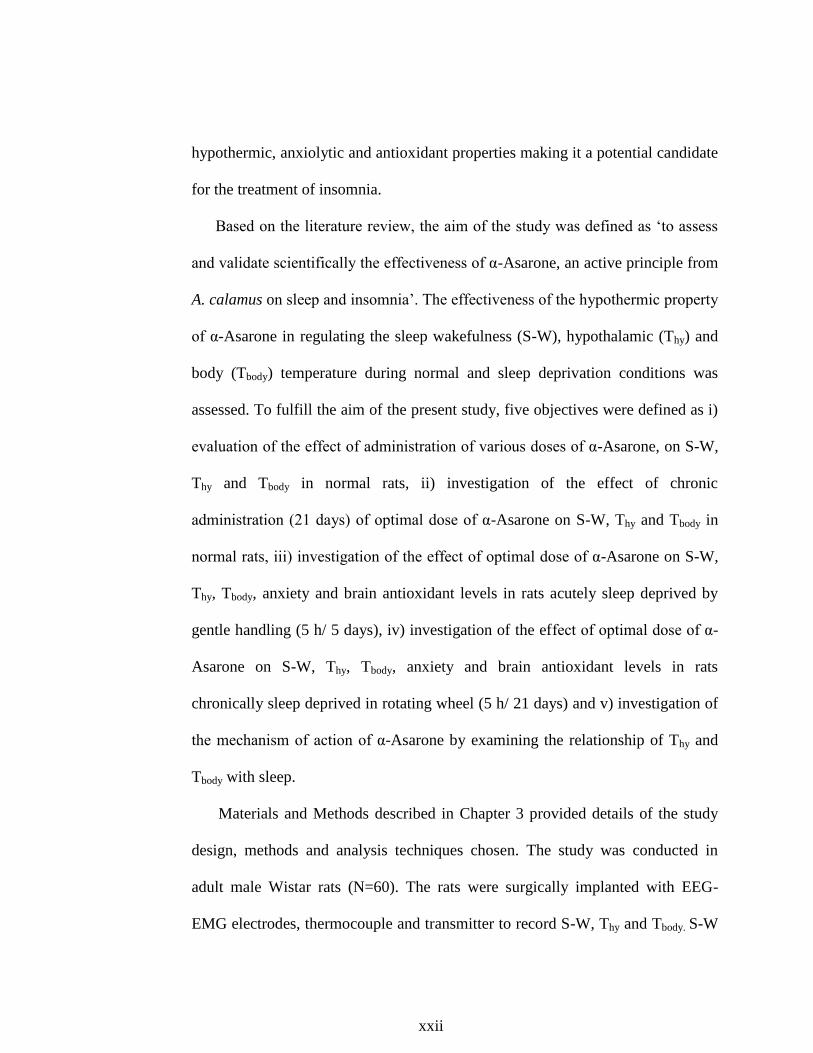
xxii
hypothermic, anxiolytic and antioxidant properties making it a potential candidate
for the treatment of insomnia.
Based on the literature review, the aim of the study was defined as „to assess
and validate scientifically the effectiveness of α-Asarone, an active principle from
A. calamus on sleep and insomnia‟. The effectiveness of the hypothermic property
of α-Asarone in regulating the sleep wakefulness (S-W), hypothalamic (Thy) and
body (Tbody) temperature during normal and sleep deprivation conditions was
assessed. To fulfill the aim of the present study, five objectives were defined as i)
evaluation of the effect of administration of various doses of α-Asarone, on S-W,
Thy and Tbody in normal rats, ii) investigation of the effect of chronic
administration (21 days) of optimal dose of α-Asarone on S-W, Thy and Tbody in
normal rats, iii) investigation of the effect of optimal dose of α-Asarone on S-W,
Thy, Tbody, anxiety and brain antioxidant levels in rats acutely sleep deprived by
gentle handling (5 h/ 5 days), iv) investigation of the effect of optimal dose of α-
Asarone on S-W, Thy, Tbody, anxiety and brain antioxidant levels in rats
chronically sleep deprived in rotating wheel (5 h/ 21 days) and v) investigation of
the mechanism of action of α-Asarone by examining the relationship of Thy and
Tbody with sleep.
Materials and Methods described in Chapter 3 provided details of the study
design, methods and analysis techniques chosen. The study was conducted in
adult male Wistar rats (N=60). The rats were surgically implanted with EEG-
EMG electrodes, thermocouple and transmitter to record S-W, Thy and Tbody. S-W
xxiii
was recorded using Biopac systems, Thy using Fluke multimeter and Tbody using
DSI telemetric systems simultaneously. Quantity of S-W was analyzed by
calculating the duration of these stages in percentage. Improvement in the quality
of sleep is defined on the basis of increase in NREM bout duration, decrease in
NREM bout frequency and arousal index (marker of sleep fragmentation),
increase in delta power and decrease in high frequency beta activity during
NREM sleep and increased theta power during REM sleep. Change in Thy and
Tbody and their association with stages of sleep was also assessed. Anxiety-like
behavior was measured using elevated plus maze (EPM) and open field tests.
Antioxidant markers like malondialdehyde (MDA) and glutathione (GSH) levels
and catalase (CAT), superoxide dismutase (SOD), glutathione reductase (GSH-R)
and glutathione peroxidase (GSH-Px) activities were also measured.
Results (Chapter 4) provided the objective-wise actual statements of
observations, including statistics, tables and graph. Results as per the Objective 1,
pertains to dose-response study, wherein the effect of administration of various
doses of α-Asarone on S-W, Thy and Tbody in normal rats were investigated. Out of
2, 10, 40, 80 and 120 mg/kg α-Asarone given intra-peritoneally, dose 10 mg/kg
improved the quality and depth of NREM sleep without much alteration in the
duration of sleep. Slight reduction in Thy and Tbody (<0.5 ˚C) was observed at this
dose. Higher doses (40, 80 and 120 mg/kg) not just reduced the quality but also
the quantity of sleep. Severe hypothermia was observed at doses 80 and 120
xxiv
mg/kg (>1 ˚C). The results obtained from objective 1 proved that 10 mg/kg α-
Asarone was the optimum dose for sleep and thermoregulation.
The effect of chronic administration (21 days) of optimal dose of α-Asarone
i.e. 10 mg/kg on S-W, Thy and Tbody in normal rats was investigated as per
Objective 2. The effect was measured on day 7 and 21. The quality of sleep was
improved for 21 days without any change in the quantity. Increase in the depth of
NREM sleep was observed for 21 days. Slight lowering of Thy and Tbody was
observed only till day 7. The results obtained from objective 2 proved that 10
mg/kg α-Asarone given chronically was optimum and safe for sleep and
thermoregulation.
In objective 3, the effect of optimal dose of α-Asarone i.e. 10 mg/kg on S-W,
Thy, Tbody, anxiety and antioxidant levels in acutely sleep deprived (SD) rats was
investigated. Acute SD was done using gentle handling methods for 5 h for 5
consecutive days. The effect was compared with a positive control midazolam (2
mg/kg). Sleep rebound was observed in all the groups. REM sleep was reduced
only in the midazolam group. Sleep quality and depth was improved and
fragmentation was lowered only in the α-Asarone-treated SD rats. No withdrawal
effect was observed in the α-Asarone group unlike midazolam group. Thy and
Tbody was quickly normalized in the α-Asarone group after SD and the difference
between Thy and Tbody was less than <0.2 ˚C unlike midazolam-treated rats in
which the difference was >0.5 ˚C. Anxiety was lowered in the α-Asarone-treated
xxv
rats and the antioxidant level did not change much since there was an adaptive
response observed after acute SD.
As per objective 4, the effect of optimal dose of α-Asarone i.e. 10 mg/kg on S-
W, Thy, Tbody, anxiety and antioxidant levels in chronically SD rats was
investigated. Chronic SD was done in rotating wheel for 5 h for 21 consecutive
days. The effect was compared with a positive control midazolam (2 mg/kg).
Sleep rebound was observed in the α-Asarone group for 21 days. REM sleep was
reduced only in the midazolam group. Improvement in the quality of sleep and the
effect on Thy and Tbody was similar to what was observed in the acute model. No
withdrawal effect was observed 24, 48 and 72 h post 21 days SD in the α-Asarone
group unlike midazolam group. Anxiety was lowered in the α-Asarone-treated
rats and the antioxidant levels were improved in the α-Asarone group after
chronic SD. As per the objective 5, the association of NREM and REM sleep with
Thy and Tbody was assessed by linear regression analysis.
In the Discussion (Chapter 5) interpretation and comparison of the results are
carried out in terms of the already existing knowledge in the area to provide
plausible mechanism of actions of α-Asarone. α-Asarone 10 mg/kg improved the
association of NREM and REM sleep with both Thy and Tbody in normal and SD
rats. Higher doses of α-Asarone and midazolam reduced the association of sleep
with Thy and Tbody. It was observed that the longer bouts of sleep occurred only
when Thy and Tbody was moderately reduced and the difference between Thy and
Tbody was ≤0.1 ˚C. Higher doses of α-Asarone resulted in >1˚C reduction of Thy
xxvi
and Tbody and the difference between Thy and Tbody was >0.3 ˚C. α-Asarone 10
mg/kg moderately reduced Thy and Tbody and the difference between Thy and Tbody
was ≤0.1 ˚C. This resulted in the improvement in the quality of sleep and
increased association of sleep with Thy and Tbody.
Conclusion of the study (Chapter 6) summarized the highlight of the study.
This study confirmed that α-Asarone at dose 10 mg/kg improved the quality and
depth of sleep without producing withdrawal effect through its hypothermic,
anxiolytic and antioxidant properties. This compound may be a potential
candidate for the treatment of insomnia and associated problems.
Bibliography is given as last chapter (Chapter 7). This chapter includes the
references cited in the thesis.

1
Chapter I: Introduction
2
Sleep is a reversible behavioral state of perceptual disengagement from
and unresponsiveness to the environment (Carskadon & Dement, 2005). Sleep
is indispensable and is found to be heterogeneous across the animal kingdom.
It is an active process with multiple brain regions involved in its generation,
maintenance and regulation. It is proposed that sleep is an auto-regulated
global phenomenon (Kumar, 2012). Based on electrophysiological measures
mainly electroencephalogram (EEG), the electromyogram (EMG) and the
electrooculogram (EOG), sleep is broadly classified into two stages, non-rapid
eye movement (NREM) and rapid eye movement (REM) sleep. Human
NREM sleep is further subdivided in to three stages based on various
electrophysiological markers. Both NREM and REM sleep are unique in all
aspects which include the electrophysiological and physiological changes
observed during these stages, the areas involved in their generation,
maintenance and regulation, their functions and their ontogeny and
phylogeny.
Importance of sleep becomes evident when it is disturbed. It is noted that
any perturbation in sleep and its regulation adversely affects the quality of
life. Disorders associated with sleep have become a very common life-style
related health issue in the current world. It is reported that about ten percent of
the studied population suffer from various sleep disorders (Ohayon, 2011).
Out of the various sleep disorders classified by International Classification of
Sleep Disorders-3 (ICSD-3), insomnia is considered as the most common
sleep disorder (AASM, 2014), observed in one-third of the general population
(Ohayon, 2011). Insomnia is characterized by “a persistent difficulty with
3
sleep initiation, duration, consolidation, or quality that occurs despite adequate
opportunity and circumstances for sleep, and results in some form of daytime
impairment” (AASM, 2014). Insomnia may be chronic, short-term or other
variant types according to the recent classification of ICSD-3 (AASM, 2014).
Insomnia is a disorder of hyperaousal which is explained by two models,
physiologic and cognitive (Perlis et al, 2005). The physiologic model suggests
that chronic insomnia may be understood as a condition in which the patient
has a trait level of arousal or a level of arousal prior to or during the preferred
sleep period that is incompatible with good sleep continuity (Perlis et al,
2005). On the other hand, cognitive model talks about three factors; the
cognitive arousal in the form of rumination and worry predisposes the
individual to insomnia, precipitates acute episodes and perpetuates the chronic
form of the disorder (Perlis et al, 2005).
Insomnia is also observed to be co-morbid with other chronic medical
conditions like cardiovascular diseases, metabolic disorders, musculoskeletal
disorders, gastro-intestinal problems, upper airway diseases, rheumatic
diseases, pain due to injuries, infection, obesity, allergy, autoimmune
disorders, psychiatric disorders and other sleep disorders (Ohayon, 2010). A
bi-directional relationship is observed between insomnia and various
psychiatric disorders like anxiety, depression, substance abuse and
schizophrenia. Poor sleep hygiene, shift work, irregular sleep-wake schedule,
lifestyle stress and use and abuse of psychoactive drugs (like sedatives,
anxiolytics, alcohol, caffeine etc) also increases the risk of insomnia (Ohayon,
2010).
4
Insomnia negatively affects the social life, task performance and daytime
functioning of an individual with increase in the chance of committing errors,
falls and accidents (Roth & Roehrs, 2003). It also increases the risk of obesity,
hypertension, altered metabolic/endocrine profile (such as diabetes), coronary
heart disease and increased risk of mortality (Roth & Roehrs, 2003; Ohayon,
2010). Insomnia impairs initiation and maintenance of sleep and reduces sleep
duration and quality. Insomnia makes an individual increasingly fatigue with
impaired psychomotor skills, memory problems, mood swings, irritability,
increased sensitivity to external stimuli etc (Roth & Roehrs, 2003).
Research on insomnia may be conducted in humans as well as in animal
models. Since there are limitations in using humans as a research model,
animal models mainly rodents may serve as a good candidate (Toth &
Bhargava, 2013). This model when subjected to various sleep deprivation
(SD) procedures and other stressful conditions shows sleep disturbance
similar to those observed in insomnia patients. Sleep disturbances includes
prolonged sleep latency, reduced sleep duration, frequent arousals and
fragmentation of sleep and high frequency EEG activity during NREM sleep
(Cano et al, 2008).
Apart from sleep disturbances, insomnia also alters several other
physiological processes taking place in the body namely thermoregulation. A
vast survey of literature has clearly indicated the association of sleep with
thermoregulation (Gilbert et al, 2004; Mallick & Kumar, 2012). Brain
mechanisms controlling sleep are anatomically and functionally coupled with
thermoregulatory mechanisms. In humans, sleep is initiated in the dark phase
5
when the core body temperature (CBT) is low and arousal is observed during
the light period when the CBT is high. In nocturnal animals like rats, CBT is
high during dark period and vice-versa. Sleep becomes deep during low CBT
and total duration of NREM sleep reduces when the CBT increases. Lack of
sleep or insomnia reduces the ability to dissipate body heat from distal areas
thereby preventing the normal decline in CBT (Lack et al, 2008; Van Den
Heuvel et al, 2004). Sleep loss leads to increase in CBT or hyperthermia
(Lack et al, 2008).
Insomnia is also linked bi-directionally to anxiety (Alvaro et al, 2013).
Insomniacs are more likely to have an anxiety disorder compared to those
without insomnia (Ford & Kamerow, 1989) and generalized anxiety disorder
(GAD) patients have more sleep problems than those without an anxiety
disorder (Monti & Monti, 2000). It is also suggested that the sleep functions
as an antioxidant for the brain (Reimund, 1994). Consequently loss of sleep
may lead to oxidative damage in various regions of the body (Gopalakrishnan
et al, 2004; Ramanathan et al, 2002; Reimund, 1994). These changes may lead
to several metabolic, hormonal, immunological and cognitive deficits (Cirelli,
2006; Durmer & Dinges, 2005).
There are several treatment options for insomnia and associated problems.
However, each of these approaches has their own disadvantages. For example,
the most commonly used pharmacological treatment in the clinical practice
i.e. use of drugs like benzodiazepines and non-benzodiazepines are found to
be efficient only for short-term use. Chronic usage produces side-effects like
rebound insomnia, drug dependence and tolerance, amnesia, psychomotor
6
impairment, residual daytime drowsiness etc with very low benefit to risk
ratio (Ashton, 1994; Chouinard, 2004; Gunja, 2013). Moreover, these drugs
produce poor quality sleep. Other drugs which include anti-depressants,
orexin antagonists (suvorexant) and anti-histamines are minimally effective in
treating insomnia. Alternative therapy using the hormone melatonin also has
been found to induce sedation, lower core body temperature, reduce sleep
latencies and increase total sleep time (Erman et al, 2006). However, mixed
outcome among the insomniac population has rendered it unreliable. Non-
pharmacological therapeutic techniques like sleep hygiene, cognitive
behavioral therapy, stimulus control therapy, sleep restriction therapy etc are
found to be effective for long-term results. These methods are more durable as
they address causes contributing to insomnia. They are safer in comparison to
pharmacological treatment. However, these methods require a lot of patience
and are time-consuming (Ebben & Spielman, 2009).
Traditional/Herbal treatment for insomnia made from herbs like valerian,
withania (Ashwagandha), hops, ginseng, chamomile, passion flower, kava
kava, skull cap etc or their combination have been used world-wide (Attele et
al, 2000; Cao et al, 2010; Davies et al, 1992; Kaushik et al, 2017; Mowrey,
1986; Ngan & Conduit, 2011; Perharic et al, 1994; Rhee et al, 1990; Schulz &
Jobert, 1994; Schulz et al, 1998). However, except for valerian, none of the
other herbs have undergone systematic clinical or scientific validation for their
sedative or hypnotic properties. Pre-clinical assessment of some herbs like
passion flower and withania is incomplete.
7
In traditional school of medicine Ayurveda, seven herbs Tagara,
Ashwagandha, Brahmi, Jatamanasi, Sarpagandha, Shankhupushpi and Vacha
are given alone and in combination to treat insomnia
(http://ayurvedanextdoor.com/herbs-for-insomnia/). Even though there are
reports on their effectiveness in humans, complete scientific studies are still
lacking. More studies are required to validate the sedative property of these
herbs along with the isolation of the active component contributing to this
property (Gulia et al, 2017).
In Ayurveda, Acorus calamus Linn. (Vacha), an aromatic rhizome
commonly known as sweet flag, is considered to produce calming and cooling
effect on the nerves and thereby curing tension, stress and insomnia. In
scientific terms, however, there are no reports on its effect on insomnia. There
are some studies reporting the A. calamus-induced potentiation of hypnotic
activity of various hypnotics like pentobarbital, hexobarbital and ethanol
(Dandiya et al, 1959b; Dandiya & Sharma, 1962; Menon & Dandiya, 1967).
Nevertheless, these studies do not have standard assessment procedures and
provide no information on the influence of herb or its active components on
normal or altered sleep.
Out of the many components isolated from A. calamus, there are two main
components α- and β-Asarone (trans- and cis-isomer), contributing to many of
the pharmacological properties of this herb (Dandiya et al, 1959a; Sharma et
al, 1961). Due to the toxicity observed in the animal studies, β-Asarone and β-
Asarone-containing herbs are banned by US Food and Drug Administration
(FDA) (Keller & Stahl, 1983; Taylor et al, 1967). However, the other potent
8
active component α-Asarone is less toxic and is still considered for therapeutic
purpose.
α-Asarone, a phenylpropene, is the second major component isolated from
A. calamus. This component is lipophilic and is sparingly soluble is water.
Because of high lipophilicity, this compound gets rapidly distributed in
different regions of brain and other vital organs (Lu et al, 2014). α-Asarone is
found to be short-acting (Kim et al, 2015) and doses above 300 mg/kg were
found to be lethal in rodents (www.caymanchem.com/product/11681).
Hypnotic-potentiating property of α-Asarone is similar to that observed in its
parent herb (Sharma et al, 1961). Moreover, this component also shows
hypothermic, anxiolytic and antioxidant properties, like its parent herb,
making it a potential candidate for the treatment of insomnia (Kumar et al,
2012; Limón et al, 2009; Liu et al, 2012; Pages et al, 2010; Shin et al, 2014).
Even though there are studies validating many of these properties in
various models, there are none which reports its effectiveness in sleep and
sleep disorders. Henceforth, the present study was aimed to assess the
effectiveness of α-Asarone on sleep and insomnia and the objectives defined
validated the hypnotic property of α-Asarone in the normal rats and in the
acute and chronic rat models of insomnia.
Firstly, the dose-response study was conducted to identify the optimal
dose facilitating sleep followed by tests evaluating the effects of
administration of optimal dose for short term and long term in normal and SD
animals. Finally the mechanism of action of α-Asarone with respect to sleep
and thermoregulation was identified.
9
In chapter 2 (Literature review) the main developments and the current
debates in the field of sleep, thermoregulation, insomnia and associated
problems, therapeutic interventions for insomnia, herbal interventions, works
on Acorus calamus Linn. (Vacha) and α-Asarone are summarized, evaluated
and compared. The lacunae and the objective of the study are discussed on the
basis of the second chapter. In chapter three (Materials and Methods) the
study design, methods and analysis techniques chosen for the study are
discussed. In the fourth chapter (Results) the actual statements of observation,
including statistics, tables and graph, are described objective-wise and in the
fifth chapter (Discussions), interpretation and comparison of the results are
done in terms of the already existing knowledge in the area. Chapter six
(Conclusions) summarizes the main observations of the study and chapter
seven (Bibliography) includes the references cited in the thesis.

10
Chapter II: Review of Literature
11
1. Sleep and Wakefulness (S-W)
Sleep is a behavioral state of perceptual disengagement from and
unresponsiveness to the environment (Carskadon & Dement, 2005). It is a
state of reversible unconsciousness which is a highly complex and organized
amalgam of physiologic and behavioral processes. Sleep is studied on the
basis of certain behavioral observations and also by identifying various
physiological and electrophysiological variables. Behavioral assessment of
sleep of an individual is attained by maintaining sleep diaries and logs that
gives preliminary details about the sleep profile of an individual which is
relatively less reliable due to subjective variations. Physiological monitoring
of sleep, on the other hand, is more reliable and quantifiable. It is defined
using polygraphic/ electrophysiological measures primarily the EEG, EMG
and EOG. These electrophysiological measures are found to more reliable and
are considered as the gold standard for sleep assessment. However, both
physiological and behavioral variables of sleep are highly correlated.
During S-W, EEG records the voltage variation of the neuronal
membrane, EMG records the movement of muscles and EOG records the
movement of eye. These three measures are simultaneously recorded and their
variations are noted to identify the states of vigilance. W is a state of
consciousness in which we can perceive and interact with the environment.
State of W is further divided in to active and quiet wakefulness.
In humans, during active W, EEG shows low voltage (20-40 µV) high
frequency (25-40 Hz) desynchronized brain waves, EMG is high due to
12
increased muscular tone and shows increased artifacts due to body movements
and EOG shows high amplitude spiky waves produced by eye movements.
During quiet W, the EEG shows desynchronized brain waves with slightly
increased voltage and decreased frequency (8-12 Hz). EEG also shows
increased alpha activity. EMG is still high with no movement artifacts and
spiky waves in EOG are absent.
Sleep, on the basis of various physiological parameters, is divided into 2
stages, REM and NREM sleep. Human NREM sleep is further differentiated
in to 3 stages (N) 1, 2 and 3 as per the new classification (AASM, 2007). The
major differences among the NREM sleep stages are identified based on the
EEG patterns. During NREM sleep, EMG fluctuates from moderate to low on
the basis of muscle tone and EOG remains low due to decreased eye
movements. Stage 1 (N1) is characterized by low voltage mixed frequency
activity with decreased alpha activity and stage 2 (N2) is characterized by
occurrence of 12-14 Hz sinusoidal waves called “sleep spindles” and “K-
complexes” (high amplitude negative sharp waves followed by positive slow
waves) along with brain waves of moderate voltage and mixed frequency.
Stage 3 (N3) known as deep sleep or slow wave sleep (SWS) is characterized
by high voltage (> 75 µV) low frequency (0.5-4 Hz) brain waves. Since the
frequency falls in the delta range, the waves are also called as delta wave. The
arousal threshold gradually falls from N 1 to 3.
REM sleep is characterized by bursts of eye movements visualized in the
EOG. EMG shows muscle atonia due to reversible muscle paralysis, however,
occasional muscle twitches are observed against the low background. EEG
13
shows desynchronized low voltage brain waves with mixed frequency (theta
predominance). In animals, EEG pattern during REM sleep shows apparent
similarity with the EEG observed during wakefulness; hence, this stage is also
called as the “paradoxical sleep”. REM sleep-specific physiological signs are
myoclonic twitches, pronounced fluctuations in cardio-respiratory rhythms
and core body temperature, penile erection (male) and clitoral tumescence
(females). Other characteristic features of REM sleep are theta rhythm in the
hippocampal EEG and spiky field potentials in the pons (P-waves), lateral
geniculate nucleus, and occipital cortex (called as ponto-geniculo-occipital or
PGO spikes). In addition, occurrence of vivid dreaming is an important mental
experience of REM sleep.
Sleep in humans is marked by alternations of NREM and REM sleep in
cycles of about 90 min which is repeated over 3 to 6 times. Duration of each
component varies across night. First onset of REM sleep occurs 80 min after
NREM sleep and it last for around 10 min. As night progresses, the proportion
of REM sleep increases and SWS decreases. Stages 1 and 2 constitute 55 %,
stage 3 cover 20 % and REM sleep makes for 25 % of total sleep time.
Apart from these electrophysiological measures, NREM and REM sleep
can also be differentiated based on some motor, metabolic and autonomic
correlates. Thermoregulation, for example, is intact during NREM sleep but is
found to be altered during REM sleep. Brain temperature decreases during
NREM sleep whereas it increases during REM sleep (Krueger & Takahashi,
1997). Muscle tone and the reflex activities are reduced during the NREM
sleep, whereas it is suppressed during the REM sleep. Heart rate, respiratory
14
rate and blood pressure fluctuates during REM sleep along with an increase in
the cerebral blood flow. Dreaming is found frequently during the REM sleep
and rarely during the NREM sleep.
Sleep is indispensable, but is found to vary phylogenetically across the
animal kingdom. Out of the various classes of animal kingdom, sleep of
mammals is extensively studied (Lesku et al, 2008). Behavioral and
electrophysiological studies indicate that mammals differ greatly in their sleep
duration, habits, habitats, postures, pattern etc.
Rodents are the most widely used model for sleep studies due to its
availability, cost and also ease in handling. However, the sleep profile of rats
is considerably different from that of humans. Rodents are predominantly
nocturnal and have a polyphasic sleep with shorter NREM-REM cycles
distributed around 24 h. They sleep less and are relatively more active during
night (dark period) and during day time (light period) they are less active and
sleep most of the time. It is suggested that they have increased NREM sleep
for energy conservation (Berger & Phillips, 1995). Unlike humans, the
recording of sleep in rodents is an invasive procedure which includes chronic
implantation of electrodes on the skull, nuchal muscles and external canthus
for recording EEG, EMG and EOG respectively. The electrophysiological
quantification of sleep and wakefulness is also slightly different in these
animals.
Figure 1 represents the EEG and EMG traces of S-W in rat. In rats,
NREM sleep is subdivided in to 2 stages: light slow wave sleep SWS (S1) and
deep SWS (S2). S1 is characterized by the presence of synchronized low
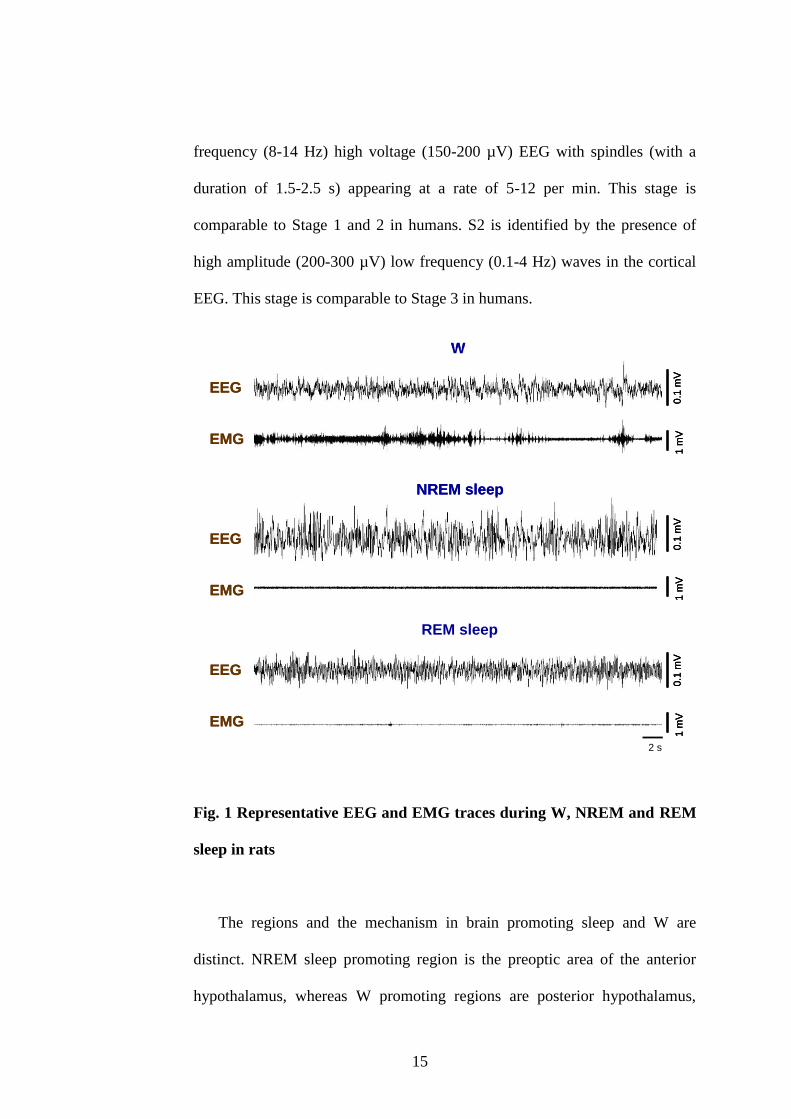
15
frequency (8-14 Hz) high voltage (150-200 µV) EEG with spindles (with a
duration of 1.5-2.5 s) appearing at a rate of 5-12 per min. This stage is
comparable to Stage 1 and 2 in humans. S2 is identified by the presence of
high amplitude (200-300 µV) low frequency (0.1-4 Hz) waves in the cortical
EEG. This stage is comparable to Stage 3 in humans.
Fig. 1 Representative EEG and EMG traces during W, NREM and REM
sleep in rats
The regions and the mechanism in brain promoting sleep and W are
distinct. NREM sleep promoting region is the preoptic area of the anterior
hypothalamus, whereas W promoting regions are posterior hypothalamus,
W
NREM sleep
REM sleep
0.1
mV
1 m
V0
.1 m
V1
mV
0.1
mV
1 m
V
2 s
EEG
EMG
EEG
EMG
EEG
EMG
W
NREM sleep
REM sleep
0.1
mV
1 m
V0
.1 m
V1
mV
0.1
mV
1 m
V0
.1 m
V1
mV
0.1
mV
1 m
V0
.1 m
V1
mV
2 s
EEG
EMG
EEG
EMG
EEG
EMG
16
basal forebrain, and mesopontine tegmentum (Nauta, 1946; Kumar et al,
1993; John et al, 1994; Kumar, 2004; Sakai & Crochet, 2003). Pontine
tegmentum and adjacent regions are involved in the generation of REM sleep.
The involvement of these regions was confirmed by several lines of animal
experiments, including stimulation, lesion, single-unit recording and the c-fos
method. A mutual inhibitory interaction is observed between these sleep and
W promoting regions (Saper et al, 2001). In addition, the inhibitions on the
sleep promoting region observed during W are removed for sleep onset and
maintenance.
Sleep is regulated as a result of the interaction between the homeostatic
drive (process S) and the circadian drive (process C) (Borbely & Tobler,
1989). Homeostatic drive is due to the accumulation of some chemical
substances during the process of wakefulness (Borbely & Tobler, 1989).
Adenosine, produced as a product of ATP metabolism, is the most well
studied substance that produces sleep drive (Porkka-Heiskanen et al, 2002).
Process C, however, is primarily driven by an endogenous hypothalamic
pacemaker suprachiasmatic nucleus which is independent of any
environmental cues (Borbely & Tobler, 1989). The light entrained circadian
cues from suprachiasmatic nucleus interact with the environmental time cues
(feeding, temperature, social cues etc) provided by the dorsomedial nucleus
and the subparaventricular zone to regulate the sleep-wake cycles (Borbely &
Tobler, 1989).
17
2. Sleep and thermoregulation
Brain mechanisms that control sleep are anatomically and functionally
coupled with thermoregulatory mechanisms. Thermoregulation is the process
of maintaining the core body temperature (CBT) at an optimal level for
normal physiological functioning. Like the regulation of sleep, there are two
key systems which control the process of thermoregulation; one is the
homeostatic system and the other is the circadian system. Studies in humans
have identified that the homeostatic thermoregulatory system controls the
behavior necessary to optimize and maintain the CBT with minimum
deviation (Rogers & Ferguson, 2009). This system is explained by a „core-
shell model‟ which emphasizes that the core always remain stable (37 C) in
contrast to the shell which varies over a much wider range of temperatures.
Temperature changes in shell maintain a stable core (Rogers & Ferguson,
2009). Thermoreceptors at the peripheral skin receptors (especially the hand,
feet and face) detect the change in the temperature and relay them to the spinal
cord through various ascending neural pathways. Final regulation of
temperature takes place in the brain regions mainly the pre-optic area of
anterior hypothalamus (involved in sleep generation), medial forebrain and
thalamus.
The core is maintained stable by both heat loss and production (Van
Someren et al, 2002). Heat loss mechanisms include radiation, convection,
conduction and evaporation. Vasodilation of tiny blood vessels arteriovenous
anastomoses in the distal skin sites carrying warm blood promotes heat loss
18
through radiation. In contrast, vasoconstriction prevents the loss of heat from
the body, thereby maintaining the core during cold temperature (Rogers &
Ferguson, 2009). Heat production occurs as a result of normal cellular
functions, shivering muscular activity, non-shivering thermogenesis in brown
adipose tissue and behavioral choices.
Like sleep, CBT is also regulated by an endogenous system known as
circadian rhythm which fluctuates over a period of approximately 24 h in the
absence of environmental cues. Suprachiasmatic nucleus is the central clock
controlling and regulating the bodily physiological functions and maintaining
a rhythm in the absence of external cues. In suprachiasmatic lesioned rodents,
24 h rhythm in both sleep and Tbody is abolished; however, the total amount of
sleep remains unchanged (Baker et al, 2005). The CBT is found to be higher
during the light period/day in comparison to the dark period/night. The CBT
rises in the morning till the midday and then plateau briefly and again peaks in
the evening. After entering in to the dark period, the CBT starts to lower
forming a trough till the next light period (Dijk et al, 2001). Loss of heat
through periphery reduces the CBT during dark period. Heat generation
during morning is due to the decrease in the shell temperature thus preventing
the heat loss (Campbell & Broughton, 1994).
Sleep and thermoregulation are closely linked (Gilbert et al, 2004; Mallick
& Kumar, 2012). In humans, sleep is initiated during the dark period when the
CBT is low and arousal is observed during the light period when the CBT is
high. In nocturnal animals like rats, CBT is high during dark period and vice-
versa (Rogers & Ferguson, 2009). Depth of the sleep becomes higher when it
19
occurs at the time when CBT is lower and the total duration of NREM sleep
reduces when CBT increases. The proximal skin temperature follows the CBT
pattern whereas the distal skin temperature follows an inverse time course. An
elevated distal to proximal skin temperature gradient during the onset of sleep
indicates an increase in the peripheral blood flow (vasodilation) and heat loss.
This is associated with short sleep latency, decreased arousals and increase in
the SWS (Kräuchi, 2007).
Sleep onset in mammals is associated with a fall in CBT which varies in
different species and is controlled by circadian rhythm and environmental
variables like ambient temperature. This lowering of thermal set point during
sleep onset is accompanied by decrease in metabolic heat production and
increase in heat loss by peripheral vasodilation and/or sweating (Rogers &
Ferguson, 2009). Any deviation from the set point is adjusted by
thermoregulatory responses. For instance, during fall in CBT, cold defense
mechanisms (shivering, piloerection, peripheral vasoconstriction) are
activated and when it goes above, heat defense response (sweating, panting,
peripheral vasodilation) is activated. The lowering of set point is also an
evidence for the energy conservation function of sleep. Lowering of CBT
leads to lower CBT-ambient temperature gradient which in turn results in
minimum heat loss. This is an important regulatory mechanism in small
mammals (rats) with high surface to volume ratio which are prone to
excessive heat loss (Rogers & Ferguson, 2009). During NREM sleep,
thermoregulation is relatively diminished in comparison to the W and during
REM sleep thermoregulatory responses are further reduced. So the
20
vulnerability to thermal stress is more during sleep especially the REM sleep
(prominent in infants and small animals). Even though the thermal set point
reduces during sleep, the animal tends to seek a warmer ambient temperature
(Ray et al. 2004). However, lowering of metabolic rate and Tbody during sleep
along with lowering of thermal set point is beneficial for energy conservation
(Rogers & Ferguson, 2009). Circadian phase relationship between sleep and
Tbody at sleep onset determines sleep amount and composition. The changes in
temperature that are normally under circadian control, act to reinforce the
direct effect of the circadian system on sleep initiation (Gilbert et al, 2004).
Sleep episodes initiated on the falling phase of the temperature rhythm are
associated with shorter sleep latencies, longer sleep episode durations and
increased slow wave sleep. Sleep episodes initiated on the rising phase of the
temperature rhythm are associated with longer sleep latencies, shorter sleep
episode duration and increased REM sleep. Sleep onset during the rising
phase of Tbody along with increased heat production and heat conservation
disrupts sleep and promote waking (Czeisler et al, 1980).
Temperature-sensing neurons in the preoptic and anterior hypothalamus
(POAH) are involved in thermoregulation. Warm-sensing neurons (WSN) are
activated by an increase in the temperature and inhibited by cooling whereas
the cold-sensing neurons (CSN) are excited by local decrease in temperature
and inhibited by local warming. These neurons receive inputs from their
corresponding thermoreceptors in the skin (McGinty & Szymusiak, 1990).
Skin temperature which is sensitive to the changes in the ambient temperature
sends signals to the central thermoregulatory system. The level of activation
21
of POAH WSN versus CSN determines the thermal set point. Excitation of
WSN and inhibition of CSN results in reduced metabolic heat production,
increased heat loss from the periphery and stable lowering of Tbody. Activation
of CSN will increase metabolic heat production and conservation and hence
Tbody. It is shown that central warm receptors can produce changes in sleep at
different ambient temoperature, even in absence of peripheral warm receptors
(Gulia et al., 2005). It is assumed that the circadian rhythm in Tbody is driven
by the relative activation of WSN and CSN regulated by the output of SCN,
with WSN activated on the descending phase of the rhythm and CSN
predominating on the rising phase (McGinty & Szymusiak, 1990). Activation
of POAH WSN is observed during sleep onset and NREM sleep and is as a
result of inhibition of wake-promoting neurons. The CSN are activated during
waking and exhibit decline during sleep onset and NREM sleep. These
changes follow the same pattern of thermoreceptor activity to lower the
thermal set point accompanying sleep onset.
Apart from this, subtle changes in the POAH/cortical temperature are also
observed in association with various stages of sleep. NREM sleep is
associated with decrease in POAH/cortical temperature and REM sleep
produces increase in the POAH/cortical temperature (Krueger & Takahashi,
1997). Decrease associated with the NREM sleep points towards the energy
conservation function of sleep whereas the increase associated with REM
sleep is due to hemodynamic changes. It is suggested that a decrease in the
common carotid artery blood flow and the associated increase in the cerebral
22
blood supply through the vertebral artery is the reason behind the increase in
the brain temperature during REM sleep (Calasso & Parmeggiani, 2008).
Henceforth, it is emphasized that the S-W is closely associated with
thermoregulation and any perturbation in one process invariable affects the
other.
3. Sleep disorders
Any alteration in sleep and its regulation adversely affects the quality of
life. In the present world, sleep is highly compromised and hence disorders
associated with sleep loss have become very common. It is reported that about
ten percent of the studied population suffer from various sleep disorders
clinically recognized. According to ICSD-3 (AASM, 2014), sleep disorders
are classified in to six major categories:
Insomnia: A persistent difficulty with sleep initiation, duration,
consolidation, or quality that occurs despite adequate opportunity and
circumstances for sleep, and results in some form of daytime impairment.
Sleep Related Breathing Disorders: Includes several conditions
characterized by disordered respiration during sleep which may be arising
from disorders of the respiratory apparatus and airway or due to inadequate
neural drive for breathing or both. These includes obstructive sleep apnoea
23
disorders, central sleep apnoea disorders, sleep related hypoventilation
disorders and sleep-related hypoxaemia disorder.
Central Disorders of Hypersomnolence: Daytime sleepiness, i.e. the
inability to stay awake and alert during the major episodes of wakefulness
during the day, resulting in periods of incoercible sleep or involuntary bouts
of drowsiness or sleep. Out of nine subcategories, narcolepsy, idiopathic
hypersomnia and Kleine-Levin syndrome are the most common.
Circadian Rhythm Sleep-Wake Disorders: Disorder caused by alterations
of the circadian time-keeping system, its entrainment mechanisms or a
misalignment of the endogenous circadian rhythm and the external
environment. This includes delayed sleep-wake phase disorder, advanced
sleep-wake phase disorder, irregular sleep-wake rhythm disorder, non-24 h
sleep-wake rhythm disorder, shift work disorder, jet lag disorder and circadian
sleep-wake disorder not otherwise specified.
Parasomnias: Disorders characterized by the occurrence of complex motor or
behavioral events or experiences at sleep onset, within sleep or during arousal
from sleep. Parasomnias may occur during any sleep stage, NREM, REM or
during transitions to and from sleep. During parasomnia events abnormal
sleep-related complex movements, behaviors, emotions, perceptions, dreams
and autonomic nervous system activity may occur which are potentially
24
harmful and can cause injuries, sleep disruption, adverse health consequences
and undesirable psychosocial effects.
Sleep Related Movement Disorders: Occurrence of stereotyped repetitive
movements during sleep or at its onset which may be brief, singular or even
myoclonic. Restless leg syndrome in association with periodic limb movement
disorder is one such disorder characterized by an urge to move the limbs with
or without unpleasant sensations.
Out of these categories, insomnia is the most common sleep disorders with
their prevalence increasing with age.
4. Insomnia
The three general traits of patients with insomnia is persistent sleep
difficulty, adequate sleep opportunity and associated daytime dysfunction.
Patients are usually tired, suffer poor concentration, and are more irritable and
exhausted. Insomnia has a significant negative impact on social life, task
performance and daytime functioning with higher odds of errors or accidents.
It has been linked to obesity, hypertension, altered metabolic/endocrine
profile, coronary heart disease and increased mortality risk. According to
ICSD-3 (AASM, 2014), insomnia is further categorized in to six diagnoses:
1. Chronic insomnia disorder
25
2. Short-term insomnia disorder
3. Other insomnia disorder
4. Isolated symptoms and normal variants
5. Excessive time in bed
6. Short sleeper
4.1. Epidemiology of insomnia
In the previous classifications like ICSD-1 & 2, DSM-IV (Diagnostic and
Statistical Manual of Mental Disorders-IV), ICD-10 (International
Classification of Diseases-10), diagnosis of insomnia was extensively sub
typed. Insomnia disorder was divided in to several nomenclatures for instance,
acute and chronic insomnia, primary and secondary/comorbid insomnia,
organic and inorganic insomnia etc. Primary insomnia was further
subcategorized in to psychophysiologic, idiopathic, and paradoxical insomnia.
However, due to overlapping symptoms and therapeutic approaches, lack of
proper diagnostic distinction, and due to uncertainty existing with respect to
the “nature of associations and the direction of causality, all the subtypes were
consolidated in to one chronic insomnia disorder (Macêdo et al, 2016). DSM-
V launched in 2013 is much like ICSD-3 with primary and secondary
insomnia replaced by insomnia disorders.
Prevalence of insomnia varies across different population due to
difference in the lifestyle. The prevalence rate also varies across different
studies due to differences in case definitions, assessment procedures, sample
characteristics and length of assessment intervals. When considering only one
26
insomnia symptom i.e. difficulty in initiating or maintaining sleep, about one-
third of adults (30-48 %) is found to be insomniacs as per the meta-analysis
performed on a population-based data. When frequency modifiers were
included, this rate went down to 12-16 %. This rate further reduced to 9-15 %
when daytime consequences are added to the case definition. Rates of
subjective sleep dissatisfaction without any sleep diagnosis, also vary widely
(10-25 %) in the adult population. Based on DSM and ICSD criteria,
prevalence rates of insomnia is between 6-10 % (Ohayon, 2002). Some of the
prominent epidemiological studies based on symptoms, complaints and
diagnoses of insomnia in the general population across the world are
extensively reviewed by Ohayon (2002).
In Indian scenario, acknowledgement of sleep disorders and its
consequences happened only in recent years. Recently Panda et al (2012)
reported that 18.6 % of apparently healthy adults from South Indian states
have insomnia out of which 18 % had difficulty initiating sleep, 18 % had
problem maintaining sleep and 7.9 % had early morning awakening. 2.5 %
had anxiety, 11.7 % had depression and 42.6 % had hypertension co-morbid
with insomnia. In North Indian population (2475 subjects of 30-60 yr), 28.1 %
of the subjects reported various insomnia complaints and in an elderly
population (1240 subjects), 59 % had problem with initiating and maintaining
sleep (Suri et al, 2009). A hospital-based study in North India reported that
32.5 % of the geriatric study population had insomnia which was co-morbid
with other health issues (Gambhir et al, 2014). A study conducted on school
children in Delhi (2475 subjects) reported that 17.3 % of them suffered
27
various insomnia-associated problems (Suri et al, 2008). In a retrospective
chart review-based study on patients seen over an 8 year period, 15.34 %
patients had difficulty in falling asleep and 22.73 % had frequent awakenings
after falling asleep in the first 4 years formed group. In the later 4 years
formed group 13.6 % had difficulty falling asleep and 31.4 % had frequent
awakenings due to other sleep disorders (Sharma et al, 2013). Insomnia is also
seen prevalent in shift workers and patients having circadian sleep disorders.
Shift workers from New Delhi was found to be sleepier and exhausted in
comparison to their control counterpart even after getting equal amount of
sleep. They had higher incidence of depression, anxiety, substance abuse and
sleep disturbance (Suri et al, 2007). Insomnia is also seen in people suffering
from metabolic disorders like diabetes mellitus and those undergoing chronic
hemodialysis (Bhattacharya et al, 2013). Demographic studies have shown
that insomnia is more prevalent among the females and the geriatric
population. Females especially in their third trimester pregnancy and post-
menopausal stage are pre-disposed to insomnia. The reports on the geriatric
population are mixed with few associating age with insomnia and few others
concluding that age per se does not contribute to insomnia. Factors like
occupations, socio-economic status, marital status and mental and physical
health have significant impact on the precipitation and perpetuation of
insomnia (Bhattacharya et al, 2013).
Highest prevalence of insomnia is found to be in people with other chronic
medical conditions. Many studies have shown bi-directional relationship of
28
insomnia with various psychiatric disorders mainly anxiety, depression,
substance abuse and schizophrenia.
4.2. Pathophysiology of insomnia
Insomnia is considered as a disorder of hyperarousal. This hyperarousal is
explained by four models, physiologic, cognitive, behavioral and
neurocognitive (Perlis et al, 2005). The physiologic model suggests that
chronic insomnia is a condition in which the patient has a trait level of arousal
or a level of arousal prior to or during the preferred sleep period that is
incompatible with good sleep continuity. This model assumes that physiologic
arousal and sleep are mutually exclusive (Perlis et al, 2005). On the basis of
measurements like whole body metabolic rate (measured by oxygen
consumption VO2), heart rate variability, neuroendocrine measures and
functional neuroimaging, physiological arousal is evaluated. Insomnia patients
exhibit higher metabolic rates, higher heart rate and lower heart rate
variability (Bonnet & Arand, 1998). Increased levels of plasma cortisol and
adrenocorticotropic hormone in the insomniacs suggest that the hypothalamic-
pituitary-adrenal axis is associated with the pathology (Vgontzas et al,
2001). Based on the positron emission tomography imaging, patients with
insomnia showed a greater cerebral glucose metabolism during W and NREM
sleep states (Nofzinger et al, 2004).
According to the cognitive model, the cognitive arousal in the form of
rumination and worry predisposes the individual to insomnia, precipitates
acute episodes, and perpetuates the chronic form of the disorder (Perlis et al,
29
2005). Patients with chronic insomnia report that their life stress events often
precede and precipitate their insomnia. Furthermore, these worries and
rumination strengthens and become perpetuating factor for insomnia (Perlis et
al, 2005).
Behavioral model of insomnia suggests that “although a variety of
biopsychosocial factors may precipitate acute insomnia, chronic insomnia
results from behaviors that disrupt sleep” (Perlis et al, 2005). There are three
behavioral models, sleep hygiene, stimulus control and the Spielman models.
Sleep hygiene models states that “specific kinds of behavior are conducive to
or incompatible with sleep and that modifying behavior may alleviate
insomnia”. These behaviors include sleep duration, bedtime rituals, sleep
surface, ambient temperature, sleep satiety and body position. Stimulus
control model “is based on the behavioral principle that one stimulus may
elicit a variety of responses, depending on the conditioning history”. In the
case of patients with insomnia, the normal cues associated with sleep (e.g.,
bed, bedroom, bedtime) are often paired with activities other than sleep which
lead to stimulus dyscontrol lowering the probability that sleep-related stimuli
will elicit the desired response of sleepiness and sleep (Perlis et al, 2005).
According to the Spielman‟s model or the three factor model or the three-P
model, “insomnia occurs acutely in relation to both traits (predisposing
factors) and life stresses (precipitating factors) and that the chronic form of the
disorder is maintained by maladaptive coping strategies (perpetuating
factors)” (Spielman et al, 1987). Predisposing factors may be biological,
psychological or social. Precipitating factors include the triggers like medical
30
and psychiatric illness and stressful life events. Perpetuating factors refer to
the strategies that the patient adopts to compensate for sleep loss like the
practice of staying in bed while awake and the tendency to extend sleep
opportunity. These lead to mismatch between sleep opportunities and sleep
ability (Spielman et al, 1987).
Neurocognitive model of insomnia states that “the acute insomnia occurs
in association with cognitive and behavioral factors and chronic insomnia is a
reversible central nervous system disorder that occurs in part in relation to
behavioral factors and in part as a result of classical conditioning” (Perlis et al,
2005). Unlike the cognitive model, neurocognitive model suggests that
rumination and worry are not responsible for extended wakefulness but the
vice-versa is true. Apart from somatic and cognitive arousals as mentioned in
the previous models, this model also includes a cortical arousal. Cortical
arousal leads to abnormal levels of sensory and information processing with
increased formation of long-term memory. This in turn is linked to sleep
continuity disturbance and sleep state misperception. Enhanced sensory
processing makes the individual vulnerable to perturbations by environmental
stimuli, which interferes with sleep. Enhanced information processing during
NREM sleep makes the distinction between sleep and wakefulness unclear
and enhanced long-term memory around sleep onset and during NREM sleep
may interfere with the subjective experience of sleep initiation and duration.
In patients with primary insomnia, cortical arousal occurs due to classical
conditioning and is observed as high-frequency EEG activity (14 Hz to 45 Hz)
at or around sleep onset and during NREM sleep. EEG during NREM sleep in
31
patients with insomnia exhibit more beta activity than good sleepers and beta
activity which is a marker of electrophysiological arousal is negatively
associated with the perception of sleep quality and is positively associated
with the degree of subjective-objective discrepancy (Perlis et al, 2005).
Till date, the neurocognitive model is considered to be the most valid of
all models since there are evidences substantiating the claims (Perlis et al,
2005) However, none of the models explaining the cause of insomnia have
studied the circadian and homeostatic regulation of sleep.
4.3. Causes and consequences of insomnia
Insomnia may be classified in to three categories based on its origin (Ohayon,
2010).
Comorbid with another physical and/or mental illness.
Induced by use of psychoactive substances.
Caused by lifestyle or without apparent cause.
Insomnia (4-11 %) is found to be comorbid with medical conditions like
upper airway diseases, rheumatic diseases, chronic pain due to injuries,
infection, gastro-intestinal problems, obesity, allergy, autoimmune disorders
and cardiovascular diseases. Neurological and psychological conditions like
Parkinson‟s disease, migraine, Alzheimer‟s disease, bipolar disorders, anxiety
disorders, depression, and psychotic disorders are also major contributors (30-
40 %) of insomnia. Other sleep disorders like sleep apnea, periodic limb
movement disorder, narcolepsy, circadian rhythm disorder and
32
hypoventilation also results in insomnia (5-15 %). Poor sleep hygiene, shift
work, irregular sleep-wake schedule and lifestyle stress are responsible for
10 % of the insomnia complaints and use and abuse of psychoactive drugs
(like sedatives, anxiolytics, alcohol, caffeine etc) are responsible for 3-7 % of
insomnia complaints (Ohayon, 2010).
Effect of sleep loss and fragmentation has been documented in various
studies and is found to affect the sleep pattern and the psychomotor skills of
an individual. Insomniacs have impairment in initiation and maintenance of
sleep, have reduced sleep duration and have associated poor quality sleep.
Effect of sleep on day time sleepiness is clearly demonstrated using multiple
sleep latency tests and in other sleepiness and mood scales. Also with an
increase in the degree of insomnia, progressively deteriorating psychomotor
skills (reaction time, attention, concentration, vigilance) are observed.
Increase in the number of lapse which is defined as a period of non-
responsiveness on the part of the subject, believed to be a manifestation of a
microsleep, is a daytime impairment observed after acute sleep loss. Increased
appearance of daytime fatigue along with impaired psychomotor skills is
observed in chronic insomniacs co-morbid with other medical conditions.
Memory problems, mood swings, irritability, increased sensitivity to external
stimuli etc are also observed in insomniacs. Insomniacs underestimate their
subjective sleep latency (increased latency to sleep) and have subjective
fatigue associated with it (Bonnet & Arand, 1998).
In patients with severe insomnia, sleep disturbance is the major problem
faced and it is reported that 88.2 % of patients have this issue for 5 yrs after
33
the onset of insomnia (Mendelson, 1995). Sleep disturbance has been shown
to last for 4 years (Chevalier et al, 1999) and 56 % of individuals have
remission after 10 years (Janson et al, 2001).
Insomniacs are reported to have decreased life quality as assessed by the
36-item Short Form Health Survey of the Medical Outcomes Study (SF-36).
SF-36 measures the quality of life under eight domains which includes
physical functioning, role limitation due to physical health problems (role
physical), bodily pain, general health perceptions, vitality, social functioning,
role limitations due to emotional health problems (role emotional) and mental
health (Katz & McHorney, 2002). Severe insomniac patients had more pain
and increased emotional and mental health problems in comparison to the
congestive heart failure patients. Insomniacs are more prone to accidents due
to their lack of attention. They show poor job performance, lower physical and
social functioning and an overall lower quality of life comparable to that of
individuals with chronic medical conditions (Katz & McHorney, 2002).
Insomnia is an important risk factor for several psychiatric disorders. Anxiety,
mood disorders and depression are the most commonly seen co-morbid
conditions with chronic insomnia (Roth, 2007). There are studies reporting
reciprocal relationship of these psychiatric disorders with insomnia. In
patients with depression, improvement in sleep is found to be positively
correlated with antidepressant response (Roth, 2007).
34
4.4. Methods to assess insomnia
Insomnia is diagnosed subjectively on the basis of patient history and
sleep diary maintenance and quantified using actigraphy and
polysomnography techniques. As a part of patient history evaluation,
clinicians enquire about the 24 h S-W pattern and habits, sleep environment,
medications taken, regularity and variability of sleeping hours, daytime
activities, bed partner‟s habit and presence of other disorders (Buysse et al,
2006). Actigraphy, a motion sensitive wrist-worn device, is also used to assess
the rest-activity pattern in a patient. For more precise measurement,
polysomnography which primarily uses EEG, EMG and EOG to assess S-W,
is a gold standard for identifying and quantifying sleep disturbances including
insomnia. Once the cause and the symptoms are identified, the patients are
categorized based on the various classifications.
4.5. Animal models of insomnia
An animal model which shows the four characteristic features
representing the pathophysiologic mechanism of insomnia may be considered
for studying insomnia. These features include disruption of sleep homeostatic
regulation, disruption of the circadian clock and intrinsic systems responsible
for the expression of sleep and enhancement of extrinsic systems that can alter
normal S-W regulation. Modeling insomnia in animals requires creating
situations in which the animals cannot initiate sleep at the appropriate
circadian phase, despite being given enough opportunity to sleep,
subsequently developing sleep debt and need for recuperative sleep (Toth &
35
Bhargava, 2013). Rat which is exposed to a stressful condition (for example,
immobilization, social stress, isolation, fear and fear conditioning, sensory
stimulation) is a good model to study insomnia as it shows sleep disturbances
observed in humans suffering from insomnia. These disturbances include
prolonged sleep latency, reduced sleep duration, frequent arousals and
fragmentation of sleep and high frequency EEG activity during NREM sleep
(Cano et al, 2008). Simultaneous activation of W and sleep promoting regions
in the brain is associated with the insomnia in rats (Cano et al, 2008). Rodent
genetic model for example DBA/2J mice spent relatively more time awake
with high fragmentation and low delta power which make it a good candidate
to study insomnia (Franken et al, 1999).
Other genetic models which include the Drosophila insomnia-like (ins-1)
flies may also be useful to identify the genes contributing to sleep and its
disorders (Seugnet et al, 2009). Caffeine also produces transient insomnia as
its intake increase arousal, prolong latency to sleep onset, reduce sleep
duration and sleep pressure and reduce sleep quality in animals and humans
(Bonnet & Arand, 1992). Animals with lesions in brain areas specific to sleep
also show temporary reduction in sleep.
To study insomnia in animals, various SD procedures are commonly used.
All SD procedures involve either partial or complete removal of sleep in
organism (Colavito et al, 2013). In partial SD, a specific sleep state (most
commonly the REM sleep or paradoxical SD) is selectively targeted for SD
and in total SD all the stages are prevented for a desired amount of time
(Colavito et al, 2013). To create insomnia in rodents there are 29 distinct
36
methods of SD (Revel et al, 2009). This includes stress-related models (cage
change, introduction of aversive odors, immobility etc), discomfort
(immobility, exposure to cold or hot temperatures, current or pain etc),
pharmacological models (administration of caffeine, psychostimulants etc),
and genetic models (DBA/2J mice, clock gene mutants, orexin overexpression
etc).
The present study mainly focuses on the total SD and its effects in rats.
Two procedures of total SD are used in this study. One is by gentle handling
method for creating acute insomnia model and the second using rotating
wheel for creating chronic insomnia model. Gentle handling method is the
most popular method for short term SD in rodents. It involves direct
interaction of rodents with the experimenter, who actively monitors the
animals with or without the support of EEG and EMG recordings. The
moment the animals become drowsy, the experimenter will stimulate the
animal either passively or actively. Passive stimulation includes making mild
noise, tapping or shaking the cage or directly contacting the animal with soft
bristled brush. Active stimulation includes introducing novel objects in to the
cage, changing the nesting materials etc. Gentle handling method is found to
be the least stressful out of all 29 SD protocols (Colavito et al, 2013;
Rechtschaffen et al, 1999) and is found to reduce an average of 92 % of
NREM sleep and 100 % of REM sleep (Franken et al, 1991). Continuously
moving rotating wheel (automated motor device which has a rotating drum
moving at a specified rotation per minute) produces total SD by forcing
specific patterns of locomotion in rats (Borbely & Neuhaus, 1979). Forced
37
locomotion using rotating wheel is found to be an additional stress factor
along with SD, however, one study has reported that the forced locomotion is
just a minor factor in comparison to the sleep deprivation and hence may not
contribute to the studies on sleep deprivation and its effects (Borbely &
Neuhaus, 1979). Also, this method is more efficient for chronic SD and it
provides standardized and equal stimulation to all experimental rats which
cannot be achieved using gentle handling method (Colavito et al, 2013).
4.6. Insomnia and thermoregulation
Sleep is most conducive in the minimum phase of temperature and is
inhibited before and after the minimum phase which represents the „wake
maintenance zone‟ (Lack et al, 2008). Different symptoms of insomnia and
abnormalities in thermoregulation are closely associated (Lack et al, 2008).
Sleep onset insomnia is associated with a delayed temperature rhythm for
more than 2 h, early morning awakening insomnia is associated with phase
advance temperature rhythm, sleep maintenance insomnia is associated with
nocturnally elevated CBT and combination of onset and maintenance
insomnia is associated with a 24 h elevation of CBT. Insomniacs attempt their
sleep within the „wake maintenance zone‟ when the CBT is close to maximum
(Lack et al, 2008). Moreover, insomniacs have difficulty sleeping in the night
due to reduced ability to dissipate body heat from distal areas thereby
preventing the normal decline in core temperature (Lack et al, 2008; Van Den
Heuvel et al, 2004).
38
Reduction in sleep quality, difficulty initiating and maintaining sleep,
increased W after sleep onset, longer latency to sleep, reduced slow wave
sleep and increased stage 1 sleep is associated with elevated Tbody minimum,
decreased responsiveness to thermal changes and decreased amplitude of the
temperature rhythm (Stepanski et al, 1988). Sleep deprivation reduces the
magnitude of the 24 h peak-trough difference in the Tbody (Czeisler et al,
1980). Total SD showed an initial rise and subsequent decline and partial SD
produced a decline in the intra-peritoneal temperature in the rats
(Rechtschaffen & Bergmann, 2002). An increase in the cortical temperature
was observed in rats subjected to 12 h and 24 h SD due to increased thermal
load as a result of enforced waking (Franken et al, 1991).
4.7. Insomnia and anxiety
Insomnia and anxiety have a complex bidirectional interaction with each
other (Alvaro et al, 2013; Taylor et al, 2005). 60 % of people with social
phobia and 68 % of people with panic disorder have been reported to have
insomnia (Stein et al, 1993). People with chronic insomnia were six times
more likely to have an anxiety disorder compared to those without insomnia
(Ford & Kamerow, 1989). Similarly, patients with generalized anxiety
disorder (GAD) have also reported difficulties with initiating and maintaining
sleep than people without an anxiety disorder (Monti & Monti, 2000).
Insomnia symptoms occurred prior to a first episode of an anxiety disorder
only 18 % of the time, while they occurred at the same time in 39 % of the
39
cases and insomnia symptoms occurred after the anxiety disorder in the
another 44 % of cases (Ohayon & Roth, 2003).
Polygraphic recordings of sleep in anxious patients have consistently
shown increased sleep latency and a reduced total sleep time, less slow-wave
sleep, a greater arousal index and an increased duration of wakefulness during
sleep (Bourdet & Goldenberg, 1994). People with insomnia and co-morbid
GAD also have higher levels of pre-sleep cognitive activity and sleep
problems like middle of the night insomnia, poor sleep quality and nightmares
than those without insomnia (Marcks et al, 2010). In children and adolescents
with anxiety disorders, 88 % of them had at least one sleep-related problem,
and over half had three or more sleep disturbances like insomnia, nightmares,
and reluctance/refusal to sleep alone (Alfano et al, 2007).
Normal reduction in arousal and alertness at bedtime is attenuated in
insomniacs leading to anxiety. Increased anxiety is linked to increase in
sympathetic nervous system activation, thereby lowering of distal temperature
in insomniacs thus contributing to increased sleeplessness (Lack et al, 2008).
Central nervous system hypervigilance and hyperarousal, which are found to
be the actual symptoms of GAD, lead to nocturnal insomnia, which in turn
may cause diurnal tiredness as a consequence of sleep pressure (Saletu-
Zyhlarz et al, 1997). Furthermore, GABAA (gamma amino butyric acid)
receptor deficits contribute to both insomnia and anxiety (Möhler, 2008).
40
4.8. Insomnia and oxidative stress
According to the free-radical flux theory by Reimund (1994), cerebral free
radicals accumulate during wakefulness and are removed during sleep.
Removal of excess free radicals during sleep is accomplished by decreased
rate of formation of free radicals and increased efficiency of endogenous
antioxidant mechanisms. Thus, sleep functions essentially as an antioxidant
for the brain (Reimund, 1994). Consequently loss of sleep or insomnia may
lead to oxidative damage in various regions of the body (Gopalakrishnan et al,
2004; Ramanathan et al, 2002; Reimund, 1994). These changes lead to several
metabolic, hormonal, immunological and cognitive deficits (Cirelli, 2006;
Durmer & Dinges, 2005). Patients with primary insomnia had significantly
lower glutathione peroxidase (GSH-Px) activity and higher malondialdehyde
(MDA) levels when compared with the controls (Gulec et al, 2012). Oxidative
damage associated with sleep loss may be caused by the generation of reactive
oxygen or nitrogen species and other oxidative stress markers and cellular
impairments in multiple organs. Brain is found to be the most susceptible area
for oxidative stress and cell damage because of the increased presence of
polyunsaturated fatty acid, increased utilization of oxygen and decreased
levels of antioxidants (Gutteridge & Halliwell, 2000). Oxidative stress as a
result of both total as well as partial/paradoxical SD in rodents is extensively
reviewed in Villafuerte et al (2015).
Importance of understanding and treating insomnia has still not received
its due respect in the current world. Research on various aspects of insomnia
41
has just started gaining momentum. Considering the severity of insomnia and
its after effects, more studies focusing on the treatment options are required.
5. Various therapeutic approach to insomnia
Conventional treatment for insomnia is broadly classified in two,
pharmacological and behavioral or psychological treatments. Apart from these
two, there are some alternative therapies which include the herbal and other
traditional treatment methods (Attele et al, 2000).
5.1. Pharmacological treatment
Contemporary FDA approved pharmacological treatment includes
GABAA receptor agonists (benzodiazepines and non-benzodiazepines),
sedating antidepressants and melatonin agonists.
5.1.1. Benzodiazepines (BDZ) and non-benzodiazepines (nBDZ)
BDZ and nBDZ are the most commonly prescribed medications for
insomnia, and have demonstrated efficacy in short-term treatment. The first
FDA approved drugs for insomnia were BDZ (estazolam, quazepam,
triazolam, flurazepam and temazepam) and nBDZ, also known as z-drugs
(zaleplon, zolpidem, and eszopiclone). All these drugs are effective for short
term usage except eszopiclone which has efficacy up to 6 months. Both drug
groups are GABAA receptor agonist with binding site located between α- and
γ-subunits of α- and γ-subunit containing GABAA receptors. While BDZ bind
42
to subunits of the α1, α2, α3, and α5 classes, nBDZ preferentially bind to the
α1 subclass. These drugs hyperpolarize the resting potential via GABA
activation, thus inhibiting or reducing the activity of neurons. The GABAA
channel opens quickly contributing to the early part of the inhibitory post-
synaptic potential (Equihua et al, 2013). These drugs produce several
unpleasant side-effects like altered sleep architecture, anterograde amnesia,
psychomotor impairment, withdrawal effect or rebound insomnia, drug
dependence, tolerance, residual daytime drowsiness, muscle relaxation,
respiratory distress, accidents etc (Ashton, 1994; Chouinard, 2004; Gunja,
2013). Furthermore, these drugs promote only stage 1 NREM sleep with very
little slow wave sleep and REM sleep. Even though these drugs decrease the
latency to sleep, the resultant sleep has very poor quality (Aeschbach et al,
1994; Lancel et al, 1996).
BDZ and nBDZ may be short, intermediate or long acting based on their
half-lives. For elderly and those with renal or hepatic problems, short half-life
drug (triazolam) which does not form active metabolites is preferable to avoid
oversedation and accumulation of active metabolites. A BDZ with a longer
half-life (flurazepam) is appropriate for patients with daytime anxiety. An
intermediate acting BDZ (temazepam or estazolam) may be a reasonable
compromise for patients with early morning awakenings (Ringdahl et al,
2004).
43
5.1.2. Tricyclic antidepressants
Tricyclic antidepressants are also prescribed for insomnia in doses sub-
threshold for the treatment of depression. In 2010, the FDA approved the
tricyclic antidepressant doxepin for the treatment of sleep maintenance
insomnia (frequent nighttime or early morning awakenings). Doxepin is
classified as a serotonin and norepinephrine reuptake inhibitor along with
antihistaminergic properties. Therapeutic effects of doxepin are observed at
very low dosages (3–6 mg/day), improving sleep maintenance without
rebound insomnia or physical dependence (Equihua et al, 2013). Side-effects
include anticholinergic effects (urinary retention, dry mouth, and
constipation), cardiac toxicity, orthostatic hypotension, sexual dysfunction
nasopharyngitis, gastrointestinal effects, and hypertension (Equihua et al,
2013).
5.1.3. Antihistamines and other over-the-counter medications
Antihistamines are active agents in many over-the-counter medications.
This drug antagonizes central histamine H1 receptors (Attele et al, 2000).
They are only minimally effective in inducing sleep, and may reduce sleep
quality. While these medications are generally safe, they may have
anticholinergic side-effects (dry mouth, blurred vision, constipation,
tachycardia, urinary retention and memory deficits) and daytime impairment.
Other over-the-counter medications include alcohol and L-tryptophan
(Equihua et al, 2013). L-tryptophan, though banned in 1989 because of its
association with eosinophilia-myalgia syndrome, is used as a sleep aid. The
44
safety and efficacy of the lower dose has not been studied. Alcohol is also
used to produce drowsiness. In one study 28 % used alcohol to help them
sleep, and 67 % found it effective. However, alcohol can act as a central
nervous system (CNS) stimulant leading to increased nocturnal awakenings
and has a potential to become substance abuse (Ringdahl et al, 2004).
5.1.4. Melatonin agonists
Melatonin is a neurohormone secreted by the pineal gland following a
circadian rhythm. The production of melatonin peaks when the lights go out,
which signals the organism that it is nighttime. In humans, melatonin has
sleep-promoting effects as it has been found to induce sedation, lower CBT,
reduce sleep latencies and increase total sleep time (Erman et al, 2006).
Ramelteon is an FDA approved melatonin agonist that acts upon MT1 and
MT2 receptors improving sleep-onset latency at a recommended dose of
8 mg/day. The side-effects observed include headache, somnolence, dizziness
and sore throat. However, ramelteon is well tolerated, and does not show
residual effects such as cognitive and psychomotor impairments (Equihua et
al, 2013).
5.1.5. Orexin antagonists
Orexin antagonist suvorexant (MK-4305) reduces active wake time by
increasing NEM and REM sleep in rats, dogs, and monkeys. Suvorexant is a
dual orexin receptor antagonist. This molecule is also in phase III clinical
trials and is currently under evaluation for approval by the FDA. In healthy
45
humans, the lowest dose (10 mg) reduced the number of awakenings after
sleep onset; and at higher doses (50 mg) it reduced sleep latency, while
increasing sleep efficiency and total sleep time. High doses (50 and 100 mg)
elicit narcoleptic symptoms such as an increase in reaction time, difficulty
waking up and reduced alertness following awakening. In addition it leads to
mild complaints of headaches, somnolence, dizziness and abnormal dreams,
all of which occurred in a dose dependent manner (Equihua et al, 2013).
5.2. Non-pharmacological treatment
Behavioral or psychological treatments, which address mechanisms
contributing to insomnia, are found to be as effective as sedative hypnotic
medications with benefits more durable. Sedative hypnotics do not presume
the mechanism responsible for insomnia, therefore symptoms typically return
once treatment is discontinued (Kales et al, 1974). Non-pharmacologic
treatment is less expensive and has fewer side effects compared with
pharmacologic treatment. Non-pharmacologic treatments for insomnia are
considered effective if they decrease sleep onset latency or increase total sleep
time by 30 minutes. Criteria used include total sleep time, sleep-onset latency
and number of nocturnal awakenings (Ringdahl et al, 2004). Behavioral
treatments for insomnia includes stimulus control, sleep restriction, cognitive-
behavior therapy, progressive muscle relaxation and paradoxical intention.
Sleep hygiene (used in conjunction with other techniques) and biofeedback
are other relatively less effective methods (Ebben & Speilman, 2009).
Furthermore, to treat sleep onset insomnia, morning bright light is used to
46
phase advance the circadian rhythms and to treat early morning awakening,
evening bright light therapy is often used (Lack et al, 2008). Phase advance
method is sometimes used in combination with melatonin (Ebben &
Spielman, 2009). However, the non-pharmacological methods are found to be
subjective, time-consuming and demands lot of patience in carrying out.
5.3. Traditional/Herbal treatment
Traditional and herbal therapies like Ayurveda have offered wide range of
medications reasonably giving relief from insomnia. Some of these are used as
a single drug or in combination with others. Some of them, for example
valerians, are available as over-the-counter drugs. Description on few of the
well established herbal hypnotics is given below. Except for valerian, none of
the other herbs have undergone systematic clinical or scientific validation for
their sedative or hypnotic properties.
5.3.1. Valeriana officinalis (valerian)
The root and the rhizome of the valerian have sedative and anxiolytic
properties. This herb is considered as safe by FDA. Sedation is produced by
valepotriates, valerenic acid and unidentified aqueous constituents of valerian
(Wagner et al, 1998). However, these active compounds do not produce
sedation when given alone. Clinically, valerian was found to improve sleep
quality and delta sleep and decrease stage 1 sleep and sleep latency and reduce
the number of night awakenings (Schulz et al, 1998). Interaction of valerian
constituents with central GABAA and adenosine A1 receptors leads to sedation
47
(Houghton, 1999). Long term usage of valerian produces withdrawal effects,
central nervous system depression, muscle relaxation, cytotoxicity, cardiac
complications and cancer (Houghton, 1999).
5.3.2. Withana somnifera (Withania)
Withania roots and leaves are considered to have mild hypnotic property.
Triethylene glycol is found to be the sleep-inducing component extracted
from leaves (Kaushik et al, 2017). Other potential components include
withanolide and withaferin. Withania has GABA mimetic activity and is also
found to be a good anxiolytic.
5.3.3. Matricaria recutita (German Chamomile)
Flower head of German Chamomile has sedative effects due to the
presence of benzodiazepine-like compound. Chamomile causes allergy and at
high dose produces vomiting. A reduction in anxiety was observed in 57
subjects after 8 weeks treatment with chamomile extract (Amsterdam et al,
2009).
5.3.4. Passiflora incarnata (passion flower)
Even though there is lack of strong evidence, passion flower is used for
the treatment of insomnia. Active components of passion flower include
harmala-type indole alkaloids, maltol and ethyl-maltol and flavonoids.
Subjective improvement in sleep quality was observed after having passion
flower tea for 3 weeks before sleep in a random control trial on 41 subjects
48
(Ngan & Conduit, 2011). Passion flower extract prolonged sleeping time in
rats.
5.3.5. Piper methysticum (kava kava)
Kava kava rhizome is used to treat anxiety, stress and restlessness
associated with insomnia. The sedative property of kava kava is due to a
group of resinous compounds known as kava lactones or kava pyrones which
induce sleep and muscle relaxation in animals. Kava kava is thought to act on
GABA and benzodiazepine binding sites in the brain (Davies et al, 1992).
CNS depressants potentiate the effects of kava.
5.3.6. Humulus lupulus (Hops)
The dried strobile of hops induces sleep (Attele et al, 2000). Active
ingredients in hops include a volatile oil, valerianic acid, estrogenic
substances, tannins and flavonoids. Hops in tea have a calming effect within
20-40 minutes of ingestion and is used as a treatment for insomnia (Mowrey,
1986). Hops modulate melatonin receptor M1 and M2. Allergy, hormonal
variation and potentiation of other sedatives and alcohol are some of the side-
effects (Attele et al, 2000).
5.3.7. Panax species (ginseng)
Panax ginseng (Korean or Asian ginseng), Panax quinquefolius (American
ginseng), and Panax vietnamensis (Vietnamese ginseng) are reported to have
sleep-modulating effects. Active component ginsenosides Rb1, Rb2 and Rc
49
mixture prolonged the duration of hexobarbital-induced hypnosis in mice.
Amount of slow wave sleep increased during light period after intake of
ginseng extract (Rhee et al, 1990). Ginsenosides compete with agonists for
binding to GABAA and GABAB receptors. Long term usage leads to side-
effects like nervousness, excitation and hormonal variation.
5.3.8. Hypericum perforatum (St John’s wort)
St John‟s wort is commonly used herb for psychiatric disorders. Hypericin
and pseudohypericin are the main active ingredients of St John‟s wort. The
extract and hypericin modulates deep and REM sleeps (Schulz & Jobert,
1994). They have high affinity for GABAA and GABAB receptors. Side-
effects include sedation, dry mouth, dizziness, gastrointestinal upset,
restlessness and hypersensitivity.
5.3.9. Scutellaria laterifolia (Skullcap)
Leaves and flowers of skullcap are found to be sleep-inducing. Clinical
studies on their effect on insomnia are lacking. Side effects include dizziness,
confusion and seizures, and hepatoxicity (Perharic et al, 1994).
5.3.10. Zizyphus jujube (Sour date)
Sour date active component jujubosides (saponin) increased total and
NREM sleep time in rats. Circadian rhythm and the serotonergic system
influence the hypnotic effect of jujubosides. Jujubosides inhibits glutamate-
50
mediated pathway in hippocampus modulation of central monoamines and
limbic system interaction (Cao et al, 2010).
According to Ayurveda, imbalances in the body lead to insomnia.
Insomnia or anidra is an imbalance in Tarpaka Kapha, Sadhaka Pitta and
Prana Vayu (Patil et al, 2014). Ayurveda evaluates these imbalances and
prescribes treatment to restore balance (https://www.banyanbotanicals.com/).
The imbalances broadly include:
1. Toxins accumulating in tissues and blocking circulation
2. Poor nutrition
3. Poor digestion
4. Imbalance of the nervous system
5. Accumulation of physical and mental stress
6. Lowering of natural resistance and immunity
7. Disruption of natural biological rhythms
Ayurveda mentions about few useful herbs and their combinations for the
treatment of insomnia (adapted from http://ayurvedanextdoor.com/herbs-for-
insomnia/).
Tagara (Valeriana wallichi): Tagara rejuvenates and relaxes nerves and
clear out toxins from blood, blood vessels, joints etc. Tagara, also known as
Indian Valerian is always used along with other herbs as it may have some
dulling effect when used alone.
51
Ashwagandha (Withania somnifera): Ashwagandha vitalizes mind and
improves memory. It is also good for insomnia as it refreshes nerves and
relaxes them.
Brahmi (Bacopa monnieri): Brahmi is a brain tonic which rejuvenates the
brain and brain cells. It provides vitality and longevity. Brahmi is an effective
herb in case of insomnia, tension, fatigue, depressions etc. For ages it has been
used as a tranquilizer to cure patients.
Jatamanasi (Nardostachys jatamansi): Jatamanasi is a sedative herb,
which is used to tranquilize a patient. It helps in relaxation of nervous system
and is very effective in case of neurosis. It increases neurotransmission and is
good for memory too.
Sarpagandha (Rauwolfia serpentina): Sarpagandha is used for curing
obesity, hypertension, insomnia, stress etc. It is a powerful tranquilizer and
induces sleep. It clears toxins from the blood, blood vessels, digestive system
and destroys poisons. It is also good for the heart and cures insanity.
Shankhupushpi (Convolvulus pluricaulis): Shankhupushpi is used for
brain rejuvenation for ages. The herb cures insomnia by clearing the nerve
cells of toxins and opening capillaries for better blood circulation. It prevents
mental fatigueness and gives rest to the brain. It boosts brain and cures
hypertension, insomnia and depression.
52
Vacha (Acorus calamus): Vacha is an efficient mind calming herb which
cures tension and insomnia. The herb has a coolant property which relaxes the
nerves thereby inducing sleep. Vacha has a speeding effect on human mind,
taking away tensions, emotional stress and depressions. It is a nervous tonic
for the mind and body.
Even though there are multiple treatment approaches to insomnia, there
still exist one or more disadvantages with respect to efficacy, safety, long term
usage, reliability and cost. Conventional and clinically approved
pharmacological treatment, even though efficient and cost effective, may not
be safe for long term usage. Non-pharmacological options, even though safe
for long term usage, have proven its efficiency only when given in
combination with other treatment approaches. Also, this method provides
subjective therapeutic results. One the other hand, the herbal treatment which
is reported to be safe, does not have enough scientific validation for use in
clinical practice. Moreover studies on few herbs, for example valerian, have
been found to produce only subjective improvement in insomniacs with low
reliability. More studies need to be conducted to validate the properties of
herbs commonly used in the traditional school of medicines.
In the present study, we have scientifically evaluated the hypnotic
potential of an active component from the herb Acorus calamus Linn (vacha).
We chose this herb on the basis of its calming and cooling effect on the
nervous system. Since insomnia leads to hyper-activation of brain along with
53
hyperthermia, this herb may be a good candidate for the treatment of
insomnia. We specifically chose α-Asarone, an active component from Acorus
calamus, for our study in view of developing a new drug for the treatment of
insomnia.
6. Acorus calamus Linn.
6.1. Features and distribution
A. calamus Linn. (vacha, vayambu) is an aromatic rhizome commonly
referred to as calamus, sweet flag, rat root or flag root. This perennial semi-
aquatic herb is a member of the family Araceae and is found in moist areas
such as swamps and marshes throughout North America, Europe and Asia. It
has sword-shaped leaves with small, yellowish-green flowers and may grow
to six feet (Fig. 2). Its leaves and rhizomes are scented (Fig. 2). The genus
Acorus comprises about 40 species, however, only few species like A.
calamus (Linn.), A. christophii, A. tatarinowii (Schott.) and A. gramineus
(Solandin Ait.) have been investigated for their chemical composition and
bioactivities. A. calamus is the most extensively studied species due to its
medicinal and pharmacological significance (Ganjewala & Srivastava, 2011).
A. calamus is a native of Central Asia and Eastern Europe, and is
indigenous to the marshes of the mountains of India. It is cultivated
throughout India, ascending to an altitude of about 2200 m. It is found and
cultivated in the states of Jammu Kashmir, Himachal Pradesh, Manipur,
Nagaland, Uttarakhand, Uttar Pradesh, Tamil Nadu, Andhra Pradesh,
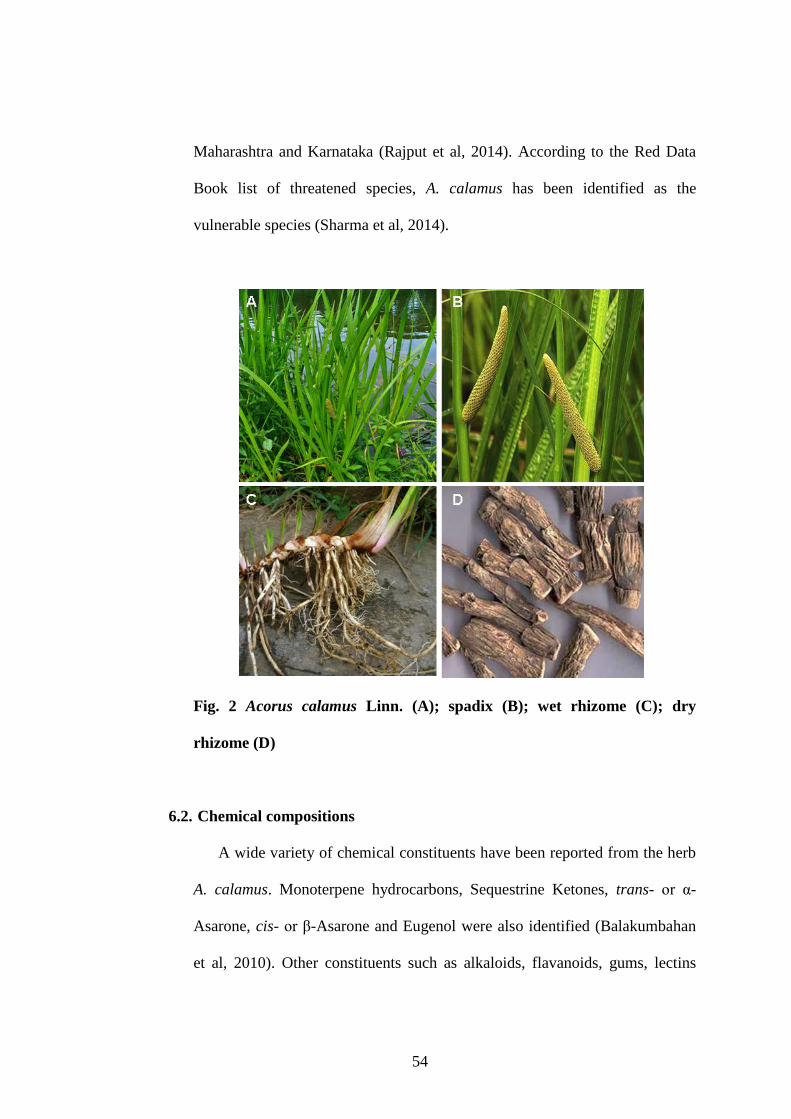
54
Maharashtra and Karnataka (Rajput et al, 2014). According to the Red Data
Book list of threatened species, A. calamus has been identified as the
vulnerable species (Sharma et al, 2014).
Fig. 2 Acorus calamus Linn. (A); spadix (B); wet rhizome (C); dry
rhizome (D)
6.2. Chemical compositions
A wide variety of chemical constituents have been reported from the herb
A. calamus. Monoterpene hydrocarbons, Sequestrine Ketones, trans- or α-
Asarone, cis- or β-Asarone and Eugenol were also identified (Balakumbahan
et al, 2010). Other constituents such as alkaloids, flavanoids, gums, lectins
55
mucilage, phenols, quinine, saponins, sugars, tannins and triterpenes are also
recorded from this plant.
From Indian A. calamus, 93 volatile compounds and some amino acids
were detected out of which α-Asarone, β-Asarone and γ-Asarone was found to
be the major components. The other constituents include Methyl-isoeugenol,
Isoeugenol, Eugenol, Calameone, Asaronaldehyde, Terpinolene, Camphor, α-
Caryophyllene, β-Pinene, Azulene, Diterpene, α-Pinene, Acoramone,
Isoshyobunone, Elemene, Esocalamendiol, Ehyobunone and Ecorone. The
major constituents in the rhizome and leaf essential oils of A. calamus are β-
Asarone (83.2 and 85.6 %). On the other hand, α-Asarone (9.7 %) was
recorded as the second major constituent in the rhizome oil, while it was
linalool (4.7 %) in the leaf oil (Raina et al, 2003).
Oil from dried rhizomes of an Indian specimen yielded 2.8 % oil that
contained 82 % Asarone, 5 % Calamenol, 4 % Calamene, 1 % Calameone,
1 % Methyl-eugenol and 0.3 % Eugenol. Two bitter principle compounds,
Acorin and Acoretin, are also reported (Sharma et al, 2014). Besides essential
oil, A. calamus rhizomes have also been examined for other chemical
constituents such as protein, carbohydrates, sugars, fatty acids, amino acids,
iron, fat and calcium. Various sugars such as maltose (0.2 %), glucose (20.7
%) and fructose (79.1 %) are reported (Balakumbahan et al, 2010).
6.3. Pharmacological properties
Sweet flag has a very long history of medicinal use in Chinese and Indian
herbal traditions. In China, the root is used as a restorative tonic for both body
56
and mind, while in Ayurveda, it is highly valued for its ability to bring clarity
to the consciousness and to counter the side-effects of all hallucinogens. In
Ayurveda, the use of sweet flag is effective against wide varieties of illnesses.
The word 'acorus' is originated from the Greek word 'acoron' used by the
Dioscorids which is derived from the word 'coreon' meaning „pupil‟ based on
its use in the treatment of eyes diseases and inflammation. Acorus is
considered as a lekhaniya-reducing herb, asthapanopaga (an adjunct to
decoction enemas), sitaprasamana (relieves cold sensation on the skin),
samjnathe sthapana (restores consciousness), vaya sthapana promotes
longevity), arsoghna (anti-hemorrhoidal) and siro virecana (cleansing nasal
therapy) (Singh et al, 2011).
Four types of A. calamus are used in herbal medicine: type I A. calamus L.
var. americanus, a diploid American var.; type II var. vulgaris L. (var.
calamus), a European triploid; type III and type IV var. augustatus Bess. and
var. versus L., subtropical tetraploids (Khare, 2007). A. calamus L. var.
calamus, syn. var. vulgaris L. is sterile distributed throughout Europe,
temperate India, and the Himalayan region. A. calamus var. angustatus Bess
variety is found in eastern and tropical Southern Asia.
Both roots and leaves have shown strong antioxidant, antimicrobial, anti-
asthmatic, antimutagenic, antispasmodic, anti-ulcer, antidiarrhoeal, anticancer,
anti-inflammatory, antidiabetic, antioxidant, antifungal, antibacterial
and insecticidal activities (Sharma et al, 2014). Sweet flag and its active
components have the following medicinal properties.
57
1. Antipyretic, i.e. it reduces fever.
2. Anodyne, i.e. it can relieve or soothe pain by lessening the sensitivity of
the brain or nervous system. Chewing the root alleviates toothache. Sweet
flag is also used externally to treat rheumatic pains and neuralgia.
3. Carminative, i.e. it prevents formation of gas in the gastrointestinal
tract or facilitates its expulsion, thereby combating flatulence.
4. Stomachic, i.e. it tones the stomach, improving its function and
normalizing the appetite. In small doses, it reduces stomach acidity, while
larger doses increase stomach secretions and is therefore recommended in
the treatment of anorexia nervosa, dyspepsia, disorders of the gall bladder,
and other digestive disorders, including dysentery in children.
5. Diaphoretic, i.e. it increases perspiration.
6. Sedative, i.e. it reduces irritability or excitement.
7. Antiseptic, i.e. it reduces the possibility of infection, sepsis (blood
poisoning), or putrefaction, and is used externally to treat skin eruptions.
8. Hypotensive, i.e. it reduces blood pressure.
9. Expectorant, i.e. it dissolves thick mucus and helps relieve respiratory
difficulties, and is used internally in the treatment of bronchitis, sinusitis,
and asthma.
10. Emmenagogue, i.e. it can stimulate blood flow in the pelvic area and is
used as an aphrodisiac. It is also used as an abortive herb.
11. Vermifuge, i.e. it expels parasitic worms from the body, by either
stunning or killing them.
58
12. Hypocholesterolemic and cholelitholytic, i.e. it is useful in reducing
total and serum-LDL (low density lipoprotein) cholesterol levels in the
body.
6.4. Effect of A. calamus on central nervous system
The volatile oil obtained from the roots and rhizomes of an Indian
indigenous plant A. calamus Linn possess sedative properties (Dandiya et al,
1959a; Dandiya et al, 1959b). The volatile fraction of the petroleum ether
extract potentiated the sedative activity with pentobarbital, hexobarbital and
ethanol in mice (Dandiya et al, 1959b). The essential oil showed sedative-
tranquilizing action in rats, mice and dogs and high dose of oil inhibited
monoamine oxidase activity (Dhalla & Bhattacharya, 1968). Doses 10, 25 and
50 mg/kg of herbal extract antagonized spontaneous motor activity, and also
exerted sedative and tranquilizing action (Panchal et al, 1989). The
100 mg/kg dose decreased both treadmill performance and locomotor activity,
caused hypothermia and potentiated pentobarbital-induced sleep (Pages et al,
2010). Ethanolic extract of A. calamus (0.5 ml/kg, i.p.) potentiated
pentobarbitone-induced sleeping time in rats and the time of loss of righting
reflex was prolonged in mice. Rats also exhibited hypothermia for 4 h at a
latency of 30 min with the peak effect after 60 min (Vohora et al, 1990).
Methanol extracts of A. calamus roots when administered orally at doses
of 100 and 200 mg/kg exhibited protective effect against the pain models in
mice (Jayaraman et al, 2010). Methanolic extract of A. calamus displayed
significant acetyl cholinesterase (AChE) inhibition at a concentration 200
59
µg/ml (Mukherjee et al, 2007). Because cognitive performance and memory
are related to acetylcholine levels, the AChE-inhibitory effect of the plant may
account for its traditional use.
The anticonvulsant effect against the pain models in mice was observed
when methanol extract of A. calamus root was administered orally at the doses
of the 100 and 200 mg/kg. This study suggested that the anticonvulsant effects
might be potentiated by the activity of GABA (Jayaraman et al, 2010). The
steam volatile fractions of rhizome of A. calamus exacerbated tonic seizures
provoked by metrazol in rats and also potentiated the action of reserpine in
reducing amphetamine toxicity in aggregated mice (Dandiya et al, 1959b).
70 % hydro-ethanolic extract of 500 mg/capsule twice a day given after
meals to 33 human adults (20 male and 13 female) attenuated anxiety related
disorders and reduced stress phenomenon and its correlated depression
investigated on the basis of standard questionnaires on different physiological
rating scale (Bhattacharyya et al, 2011). In models of depression, when the
animal was subjected to A. calamus administration, the behavioral deficit was
prevented as compared to stressed group (Tripathi & Singh, 2010). A. calamus
given for 6 weeks in 50 individuals with depression showed reduction in the
degree of severity and better rehabilitation and also a significant improvement
in assessment based on the rating of symptoms on the Hamilton depression
rating scale.
Ischemic rats treated with A. calamus (25 mg/kg/p.o. for 5 days) exhibited
a significant improvement in neuro-behavioral performance in Rota-Rod test
and grid walking as compared to the control group (Shukla et al, 2006).
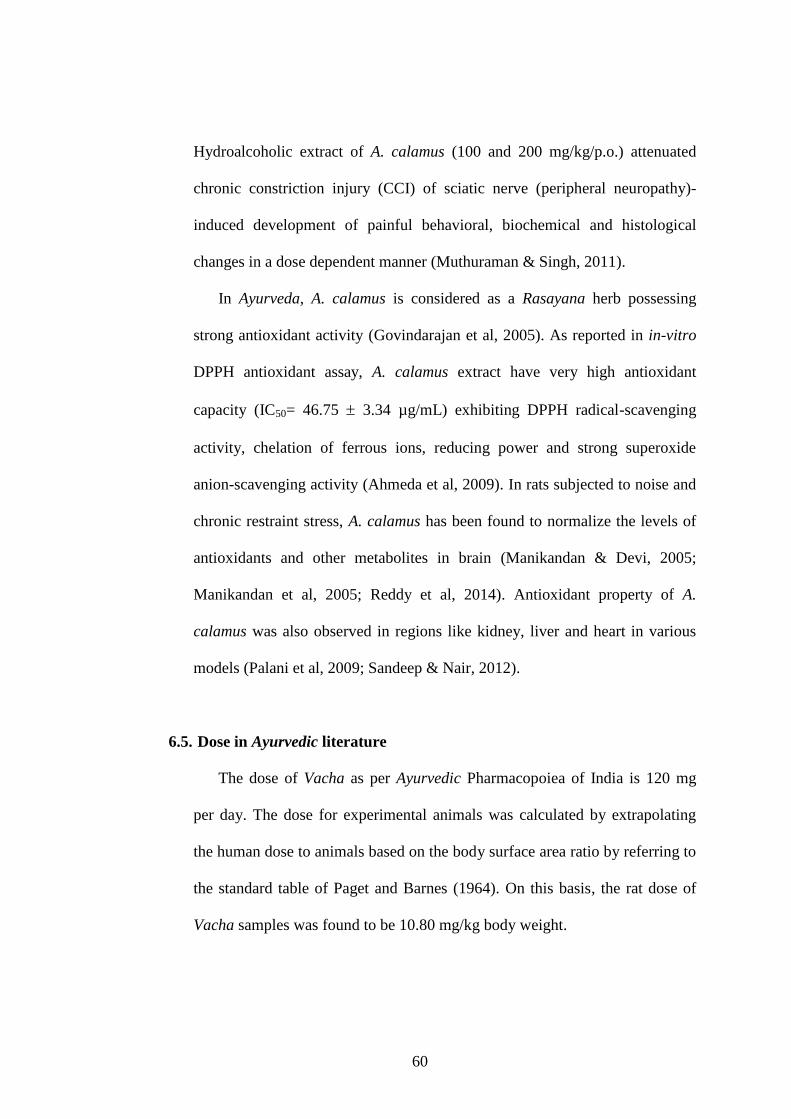
60
Hydroalcoholic extract of A. calamus (100 and 200 mg/kg/p.o.) attenuated
chronic constriction injury (CCI) of sciatic nerve (peripheral neuropathy)-
induced development of painful behavioral, biochemical and histological
changes in a dose dependent manner (Muthuraman & Singh, 2011).
In Ayurveda, A. calamus is considered as a Rasayana herb possessing
strong antioxidant activity (Govindarajan et al, 2005). As reported in in-vitro
DPPH antioxidant assay, A. calamus extract have very high antioxidant
capacity (IC50= 46.75 3.34 µg/mL) exhibiting DPPH radical-scavenging
activity, chelation of ferrous ions, reducing power and strong superoxide
anion-scavenging activity (Ahmeda et al, 2009). In rats subjected to noise and
chronic restraint stress, A. calamus has been found to normalize the levels of
antioxidants and other metabolites in brain (Manikandan & Devi, 2005;
Manikandan et al, 2005; Reddy et al, 2014). Antioxidant property of A.
calamus was also observed in regions like kidney, liver and heart in various
models (Palani et al, 2009; Sandeep & Nair, 2012).
6.5. Dose in Ayurvedic literature
The dose of Vacha as per Ayurvedic Pharmacopoiea of India is 120 mg
per day. The dose for experimental animals was calculated by extrapolating
the human dose to animals based on the body surface area ratio by referring to
the standard table of Paget and Barnes (1964). On this basis, the rat dose of
Vacha samples was found to be 10.80 mg/kg body weight.
61
6.6. Toxicity
Chemical isolation studies have led to the discovery of two stereoisomers,
α- and β-Asarone, which have psychoactive effects (Motley, 1994). These are
the major active components in the extracts of different plant parts and
essential oils. However, studies in rats of the active ingredient, -Asarone
isolated from the Indian Jammu strain of A. calamus demonstrated an increase
in malignant duodenal tumor. It is demonstrated that β-Asarone is potentially
toxic and carcinogenic (Taylor et al., 1967). In this study, rats were fed with
diets containing various concentrations of β-Asarone for two years. The
tumors were identified as leiomyosarcomas of the small intestine and were
found in 800 ppm (0.08 %) and 2000 ppm (0.2 %). Also thrombosis within the
chambers of the heart was observed in the 800 and 2000 ppm (Taylor et al.,
1967). This led to the removal of A. calamus as a food or food additive in the
US in 1968 by the FDA.
Later studies have demonstrated that the North American species of A.
calamus lacks the carcinogenic agent. A. calamus is poisonous under certain
conditions, causing disturbed digestion, gastroenteritis, persistent constipation,
followed by diarrhoea and passage of blood into the feces. The carcinogenic
agent, -Asarone, appears only to be present in the triploid and tetraploid
varieties of A. calamus. Due to the toxicity of -Asarone, attempts are being
made to reduce its concentration in herbal medicines. The diploid varieties
such as American diploid varieties lack -Asarone and are always preferred
for therapeutics and other industries.

62
In the present study, α-Asarone was chosen as the study material as it
exhibits all the major properties (hypnotic-potentiating, hypothermic,
anxiolytic and antioxidant) observed in the parent herb with relatively less
toxicity.
7. α-Asarone
Trans- or α-Asarone belongs to the family of phenylpropenes (Fig. 3).
These are compounds containing a phenylpropene moiety, which consists of
a propene substituent bound to a phenyl group. Molecular weight of α-
Asarone is 208.257 g/mol and the molecular formula is C12H16O3. IUPAC
name is trans-1,2,4-Trimethoxy-5-(1-propenyl)benzene. It is available in the
form of crystalline solid. α-Asarone is practically insoluble in water and
soluble in alcohol, ether, glacial acetic acid, carbon tetrachloride, chloroform
and petroleum ether.
Fig. 3 Chemical structure of α-Asarone
63
7.1. Pharmacokinetics of α-Asarone
Because of high lipophilicity, the oral bioavailability of α-Asarone in rats
is poor (Lu et al, 2014). However, the same property allows α-Asarone to get
rapidly distributed in to the brain regions by passing through blood-brain
barrier (Lu et al, 2014). This makes it a good drug candidate for various
central nervous system disorders. The plasma half-life of both α-and β-asarone
are short (1-1.5 h) with rapid distribution to vital organs such as liver, spleen,
heart, kidney, lung, and brain (Kim et al, 2015). The rate of metabolism of α-
Asarone is directly proportional to the CYP450 concentration (Cartus &
Schrenk, 2016).
7.2. Toxicity of α-Asarone
Studies on toxicity of α-Asarone have shown mixed observations. In mice
and rats, α-Asarone is found to be safe at lower doses (Chellian et al, 2017).
LD50 intra-peritoneum in mouse is found to be 310 mg/kg and LD50 oral in
mouse is 417.6 mg/kg (https://www.caymanchem.com/msdss/11681m.pdf).
Intravenous lethal dose low in man is found to be 66 mg/kg and
intraperitoneal toxic dose low in mouse is found to be 50 mg/kg
(https://www.caymanchem.com/msdss/11681m.pdf). Sub-chronic treatment of
α-Asarone (50 and 100 mg/kg for 28 days) produced no behavioral changes
and no loss of righting reflex (Chen et al, 2013). However, α-Asarone at a
higher dose (200 mg/kg, for 28 days) significantly decreased spontaneous
locomotor activity; but no mortality was observed (Chen et al, 2013).
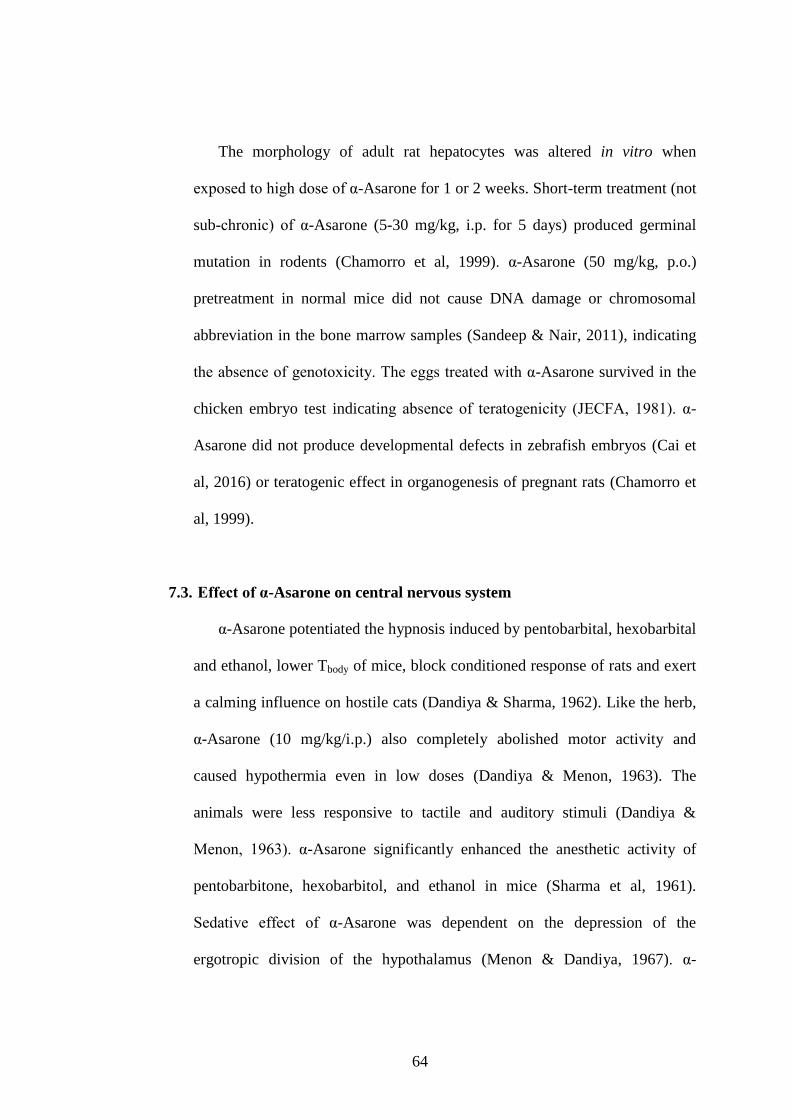
64
The morphology of adult rat hepatocytes was altered in vitro when
exposed to high dose of α-Asarone for 1 or 2 weeks. Short-term treatment (not
sub-chronic) of α-Asarone (5-30 mg/kg, i.p. for 5 days) produced germinal
mutation in rodents (Chamorro et al, 1999). α-Asarone (50 mg/kg, p.o.)
pretreatment in normal mice did not cause DNA damage or chromosomal
abbreviation in the bone marrow samples (Sandeep & Nair, 2011), indicating
the absence of genotoxicity. The eggs treated with α-Asarone survived in the
chicken embryo test indicating absence of teratogenicity (JECFA, 1981). α-
Asarone did not produce developmental defects in zebrafish embryos (Cai et
al, 2016) or teratogenic effect in organogenesis of pregnant rats (Chamorro et
al, 1999).
7.3. Effect of α-Asarone on central nervous system
α-Asarone potentiated the hypnosis induced by pentobarbital, hexobarbital
and ethanol, lower Tbody of mice, block conditioned response of rats and exert
a calming influence on hostile cats (Dandiya & Sharma, 1962). Like the herb,
α-Asarone (10 mg/kg/i.p.) also completely abolished motor activity and
caused hypothermia even in low doses (Dandiya & Menon, 1963). The
animals were less responsive to tactile and auditory stimuli (Dandiya &
Menon, 1963). α-Asarone significantly enhanced the anesthetic activity of
pentobarbitone, hexobarbitol, and ethanol in mice (Sharma et al, 1961).
Sedative effect of α-Asarone was dependent on the depression of the
ergotropic division of the hypothalamus (Menon & Dandiya, 1967). α-
65
Asarone also produced a prolonged calming effect in monkeys (Dandiya &
Menon, 1964).
Houghton et al, (2006) reported an in-vitro acetylcholinesterase inhibitory
effect of α-Asarone similar to the parent herb. Furthermore, α-Asarone
showed a tendency to protect against metrazol convulsions and modified
electroshocks (Sharma et al, 1961). Measurement of tonic GABA currents and
miniature spontaneous inhibitory postsynaptic currents indicated that α-
Asarone enhanced tonic GABAergic inhibition without affecting phasic
GABAergic inhibition (Huang et al, 2013). In both pentylenetetrazole and
kainate seizure models, α-Asarone suppressed epileptic activity of mice by
prolonging the latency to clonic and tonic seizures and reducing the mortality
as well as the susceptibility to seizure by activating GABAA receptors (Huang
et al, 2013).
In light dark test, α-Asarone 7 mg/kg increased the time spent in the light
area and the number of transitions between the two compartments (Liu et al,
2012). In the marble burying test also, α-Asarone inhibited marble burying at
doses of 14 and 28 mg/kg, as did diazepam. These observations indicated that
α-Asarone exhibits anxiolytic-like effect (Liu et al, 2012). Treatment with 30
mg/kg α-Asarone attenuated the loss of CA1 neurons, increased the TUNEL-
labeled cells, and upregulated BACE1 expression-induced by
lipopolysaccharide in the hippocampus (Shin et al, 2014). Behaviorally, α-
Asarone increased the number of target heading and memory score in the
Morris water maze (Shin et al, 2014). Treatment with α-Asarone (3, 10, 30
mg/kg/i.p.) also attenuated scopolamine-induced cognitive deficits (Kumar et
66
al, 2012). The memory impairment correlated with nitric oxide
overproduction and neuronal damage caused by the injection of amyloid beta
peptide (25-35) was reduced by the administration of α-Asarone
10 mg/kg orally for 16 days (Limón et al, 2009)
α-Asarone attenuated the activity of AchE, normalized MDA (lipid
peroxidation marker) levels and superoxide dismutase (SOD) activity in
hippocampus and cortex in the scopolamine-treated amnesic mice (Kumar et
al, 2012). In rats subjected to noise and chronic restraint stress, α-Asarone,
like the parent herb, normalized the levels of antioxidants and other
metabolites in brain (Manikandan & Devi, 2005; Reddy et al, 2014). A
reversal of increased nitrate levels in the hippocampus and temporal cortex
was observed in the rats injected with amyloid- (25-35) after 16 days
administration of 10 mg/kg α-Asarone (Limón et al, 2009). Furthermore, α-
Asarone was found to increase the levels of antioxidants in different brain
regions in various epileptic seizure models and was also observed in regions
like kidney, liver and heart in various models (Palani et al, 2009; Sandeep &
Nair, 2012).
67
8. Lacunae
Extensive literature search revealed the following lacunae in insomnia
research
The current interventions have multiple disadvantages and a therapeutic
intervention with minimum side-effects to cure insomnia is lacking.
Scientific evaluation of majority of apparently safe herbs or active
components used in traditional medicine is lacking.
No studies have investigated the sleep-inducing property of α-Asarone,
using objective measure of polysomnography.
There are no reports on effects of α-Asarone on sleep and
thermoregulation and their association under normal and sleep deprived
conditions (acute or chronic).
There are no studies on the anxiolytic and antioxidant properties of α-
Asarone under sleep deprived conditions (acute or chronic).
68
9. Aim and objectives
Henceforth the aim of the present study was “to assess and validate
scientifically the effectiveness of α-Asarone, active principle from A.
calamus on sleep and insomnia”. Since sleep is closely associated with
thermoregulation, we have simultaneously assessed the effectiveness of the
hypothermic property of α-Asarone in regulating the sleep wakefulness (S-
W), hypothalamic (Thy) and body (Tbody) temperature during normal and
altered sleep. This study aims to identify the sleep-promoting dose of α-
Asarone, the effect of chronic administration of α-Asarone on sleep in normal
rats, the effect of α-Asarone in acute insomnia, the effect of α-Asarone in
chronic insomnia and the mechanism of action of α-Asarone with respect to
sleep and thermoregulation.
To fulfill the aim of the present study, five objectives were formulated as
follows
1. To evaluate the effect of administration of various doses of α-Asarone, an
active principle of Acorus calamus on S-W, Thy and Tbody in normal rats.
2. To investigate the effect of chronic administration (21 days) of optimal
dose of α-Asarone on S-W, Thy and Tbody in normal rats.
69
3. To investigate the effect of optimal dose of α-Asarone on S-W, Thy, Tbody,
anxiety and brain antioxidant levels in rats acutely sleep deprived by
gentle handling (5 h/ 5 days).
4. To investigate the effect of optimal dose of α-Asarone on S-W, Thy, Tbody,
anxiety and brain antioxidant levels in rats chronically sleep deprived in
rotating wheel (5 h/ 21 days).
5. To understand the mechanism of action of α-Asarone by examining the
relationship of Thy and Tbody with sleep.
70
Chapter III: Materials and Methods
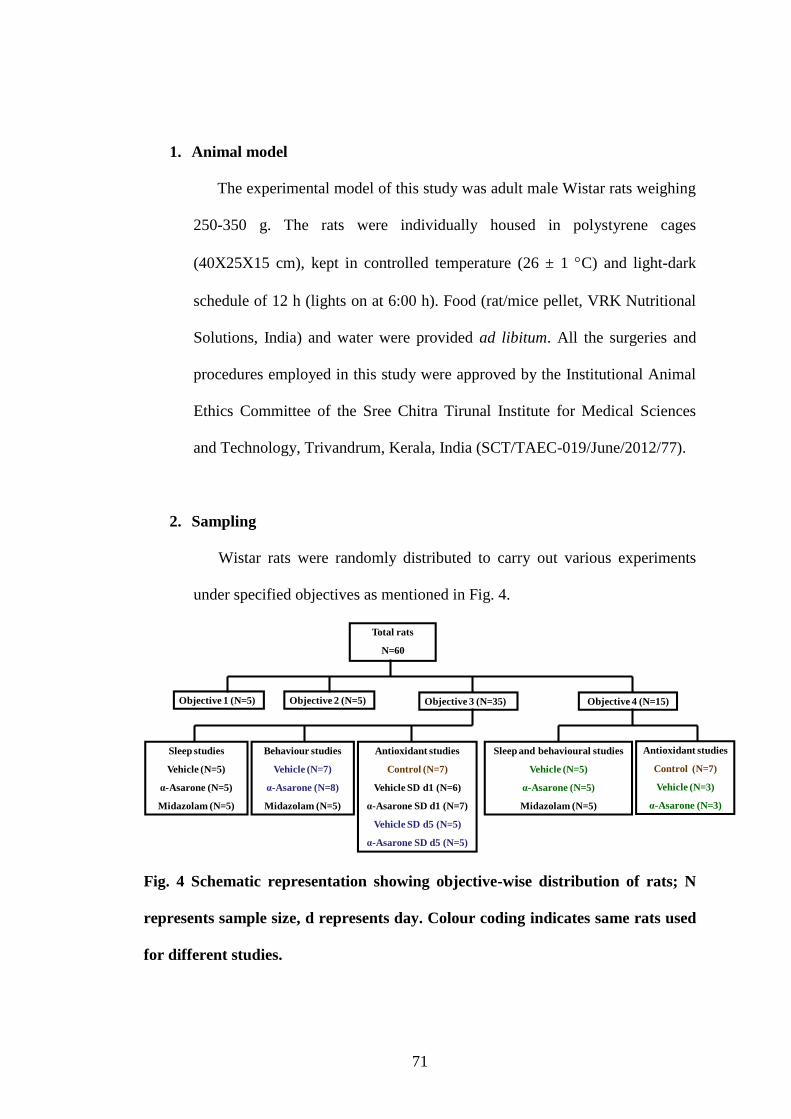
71
1. Animal model
The experimental model of this study was adult male Wistar rats weighing
250-350 g. The rats were individually housed in polystyrene cages
(40X25X15 cm), kept in controlled temperature (26 ± 1 C) and light-dark
schedule of 12 h (lights on at 6:00 h). Food (rat/mice pellet, VRK Nutritional
Solutions, India) and water were provided ad libitum. All the surgeries and
procedures employed in this study were approved by the Institutional Animal
Ethics Committee of the Sree Chitra Tirunal Institute for Medical Sciences
and Technology, Trivandrum, Kerala, India (SCT/TAEC-019/June/2012/77).
2. Sampling
Wistar rats were randomly distributed to carry out various experiments
under specified objectives as mentioned in Fig. 4.
Total rats
N=60
Objective 1 (N=5) Objective 2 (N=5) Objective 3 (N=35) Objective 4 (N=15)
Sleep and behavioural studies
Vehicle (N=5)
α-Asarone (N=5)
Midazolam (N=5)
Sleep studies
Vehicle (N=5)
α-Asarone (N=5)
Midazolam (N=5)
Antioxidant studies
Control (N=7)
Vehicle (N=3)
α-Asarone (N=3)
Behaviour studies
Vehicle (N=7)
α-Asarone (N=8)
Midazolam (N=5)
Antioxidant studies
Control (N=7)
Vehicle SD d1 (N=6)
α-Asarone SD d1 (N=7)
Vehicle SD d5 (N=5)
α-Asarone SD d5 (N=5)
Fig. 4 Schematic representation showing objective-wise distribution of rats; N
represents sample size, d represents day. Colour coding indicates same rats used
for different studies.
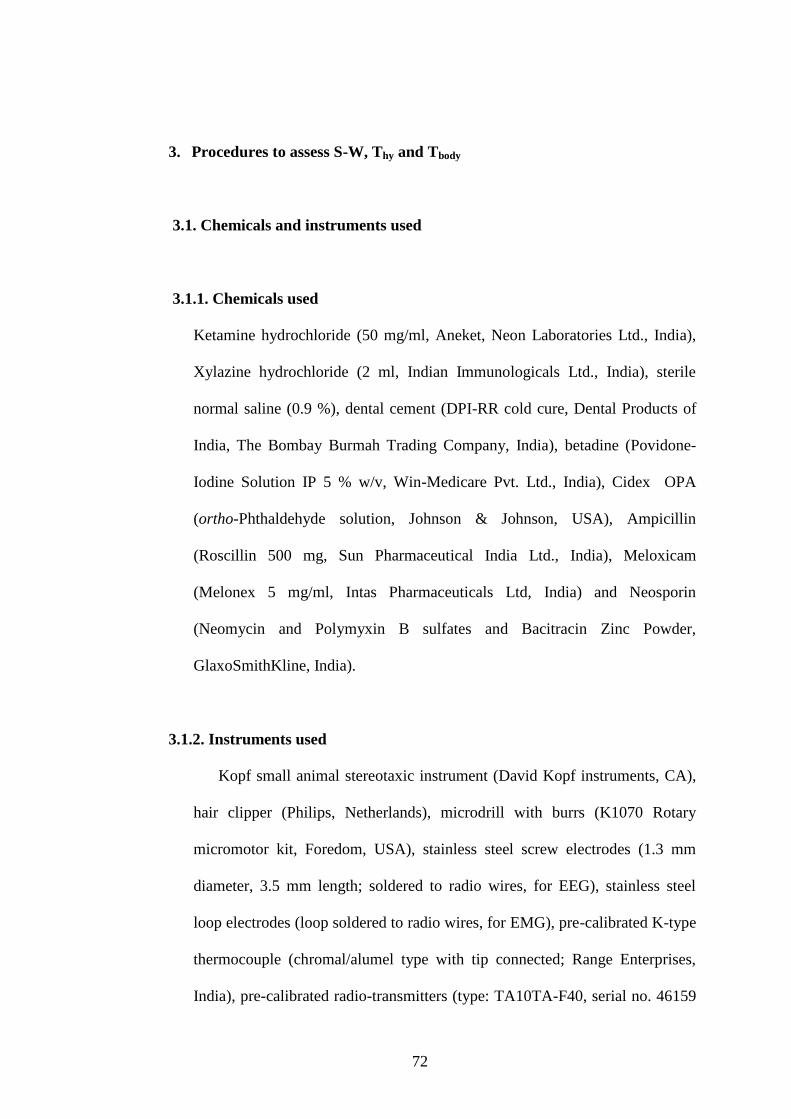
72
3. Procedures to assess S-W, Thy and Tbody
3.1. Chemicals and instruments used
3.1.1. Chemicals used
Ketamine hydrochloride (50 mg/ml, Aneket, Neon Laboratories Ltd., India),
Xylazine hydrochloride (2 ml, Indian Immunologicals Ltd., India), sterile
normal saline (0.9 %), dental cement (DPI-RR cold cure, Dental Products of
India, The Bombay Burmah Trading Company, India), betadine (Povidone-
Iodine Solution IP 5 % w/v, Win-Medicare Pvt. Ltd., India), Cidex OPA
(ortho-Phthaldehyde solution, Johnson & Johnson, USA), Ampicillin
(Roscillin 500 mg, Sun Pharmaceutical India Ltd., India), Meloxicam
(Melonex 5 mg/ml, Intas Pharmaceuticals Ltd, India) and Neosporin
(Neomycin and Polymyxin B sulfates and Bacitracin Zinc Powder,
GlaxoSmithKline, India).
3.1.2. Instruments used
Kopf small animal stereotaxic instrument (David Kopf instruments, CA),
hair clipper (Philips, Netherlands), microdrill with burrs (K1070 Rotary
micromotor kit, Foredom, USA), stainless steel screw electrodes (1.3 mm
diameter, 3.5 mm length; soldered to radio wires, for EEG), stainless steel
loop electrodes (loop soldered to radio wires, for EMG), pre-calibrated K-type
thermocouple (chromal/alumel type with tip connected; Range Enterprises,
India), pre-calibrated radio-transmitters (type: TA10TA-F40, serial no. 46159
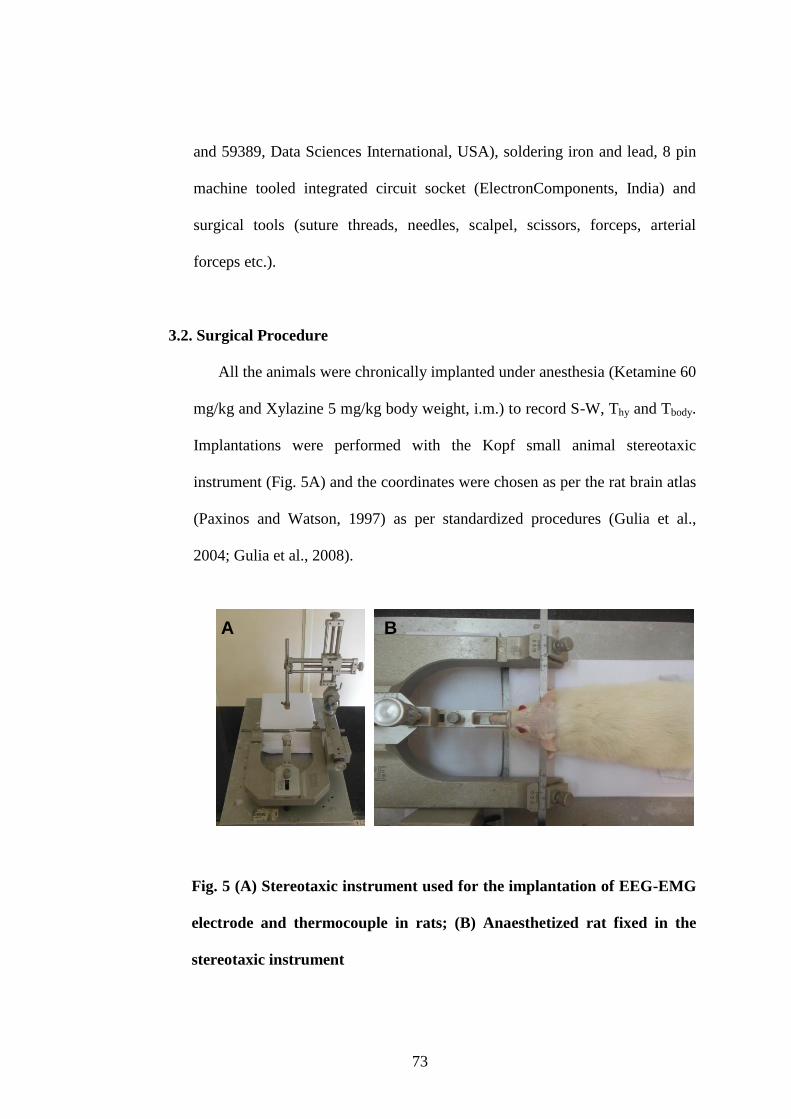
73
and 59389, Data Sciences International, USA), soldering iron and lead, 8 pin
machine tooled integrated circuit socket (ElectronComponents, India) and
surgical tools (suture threads, needles, scalpel, scissors, forceps, arterial
forceps etc.).
3.2. Surgical Procedure
All the animals were chronically implanted under anesthesia (Ketamine 60
mg/kg and Xylazine 5 mg/kg body weight, i.m.) to record S-W, Thy and Tbody.
Implantations were performed with the Kopf small animal stereotaxic
instrument (Fig. 5A) and the coordinates were chosen as per the rat brain atlas
(Paxinos and Watson, 1997) as per standardized procedures (Gulia et al.,
2004; Gulia et al., 2008).
Fig. 5 (A) Stereotaxic instrument used for the implantation of EEG-EMG
electrode and thermocouple in rats; (B) Anaesthetized rat fixed in the
stereotaxic instrument
A BA B
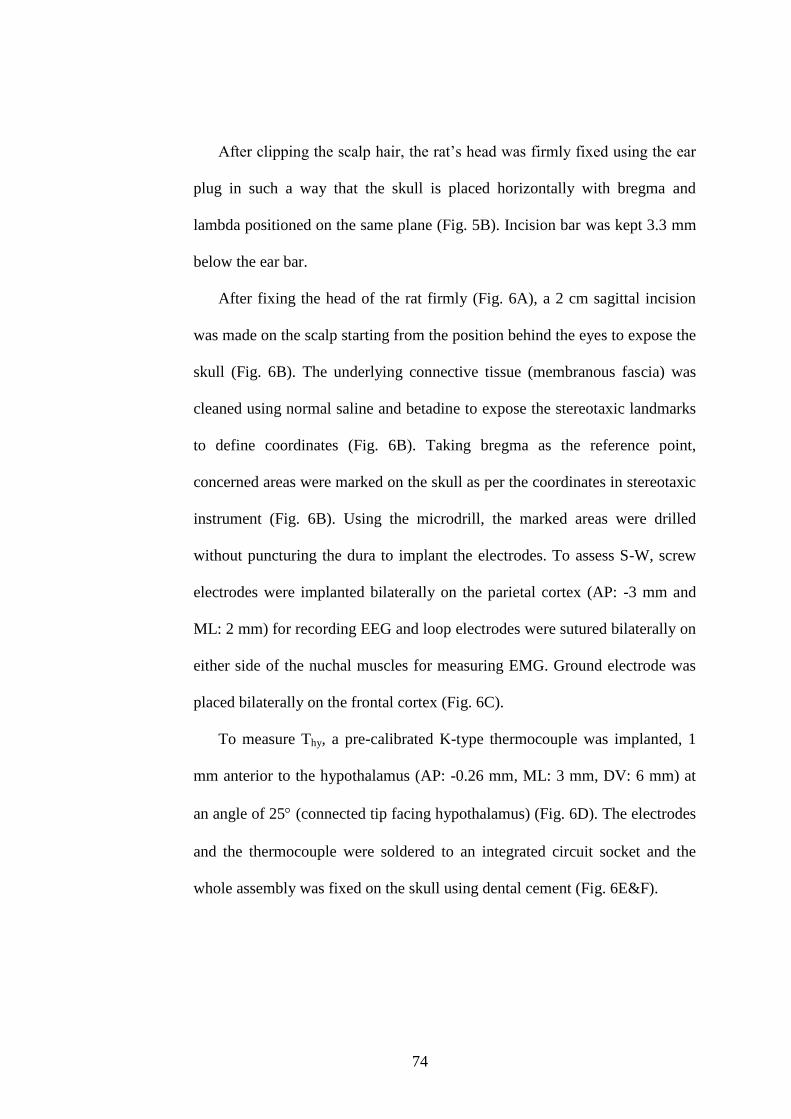
74
After clipping the scalp hair, the rat‟s head was firmly fixed using the ear
plug in such a way that the skull is placed horizontally with bregma and
lambda positioned on the same plane (Fig. 5B). Incision bar was kept 3.3 mm
below the ear bar.
After fixing the head of the rat firmly (Fig. 6A), a 2 cm sagittal incision
was made on the scalp starting from the position behind the eyes to expose the
skull (Fig. 6B). The underlying connective tissue (membranous fascia) was
cleaned using normal saline and betadine to expose the stereotaxic landmarks
to define coordinates (Fig. 6B). Taking bregma as the reference point,
concerned areas were marked on the skull as per the coordinates in stereotaxic
instrument (Fig. 6B). Using the microdrill, the marked areas were drilled
without puncturing the dura to implant the electrodes. To assess S-W, screw
electrodes were implanted bilaterally on the parietal cortex (AP: -3 mm and
ML: 2 mm) for recording EEG and loop electrodes were sutured bilaterally on
either side of the nuchal muscles for measuring EMG. Ground electrode was
placed bilaterally on the frontal cortex (Fig. 6C).
To measure Thy, a pre-calibrated K-type thermocouple was implanted, 1
mm anterior to the hypothalamus (AP: -0.26 mm, ML: 3 mm, DV: 6 mm) at
an angle of 25 (connected tip facing hypothalamus) (Fig. 6D). The electrodes
and the thermocouple were soldered to an integrated circuit socket and the
whole assembly was fixed on the skull using dental cement (Fig. 6E&F).
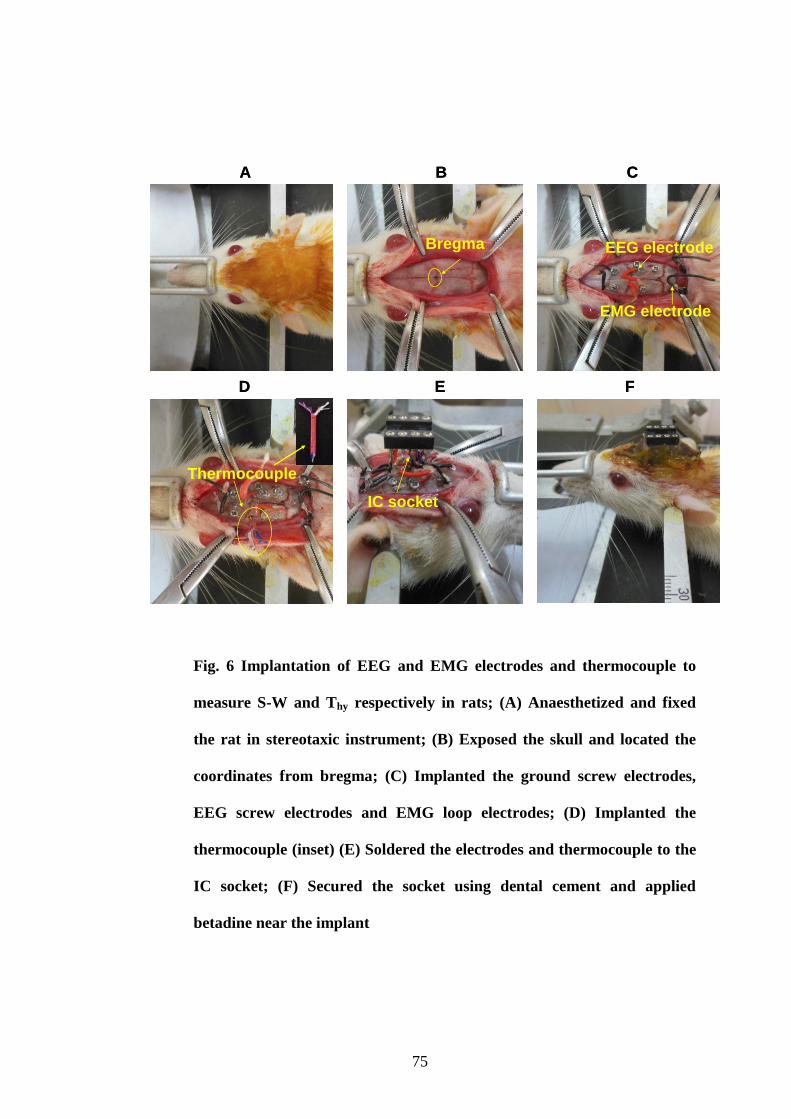
75
Fig. 6 Implantation of EEG and EMG electrodes and thermocouple to
measure S-W and Thy respectively in rats; (A) Anaesthetized and fixed
the rat in stereotaxic instrument; (B) Exposed the skull and located the
coordinates from bregma; (C) Implanted the ground screw electrodes,
EEG screw electrodes and EMG loop electrodes; (D) Implanted the
thermocouple (inset) (E) Soldered the electrodes and thermocouple to the
IC socket; (F) Secured the socket using dental cement and applied
betadine near the implant
Bregma EEG electrode
EMG electrode
Thermocouple
IC socket
A B C
D E F
Bregma EEG electrode
EMG electrode
Thermocouple
IC socket
A B C
D E F
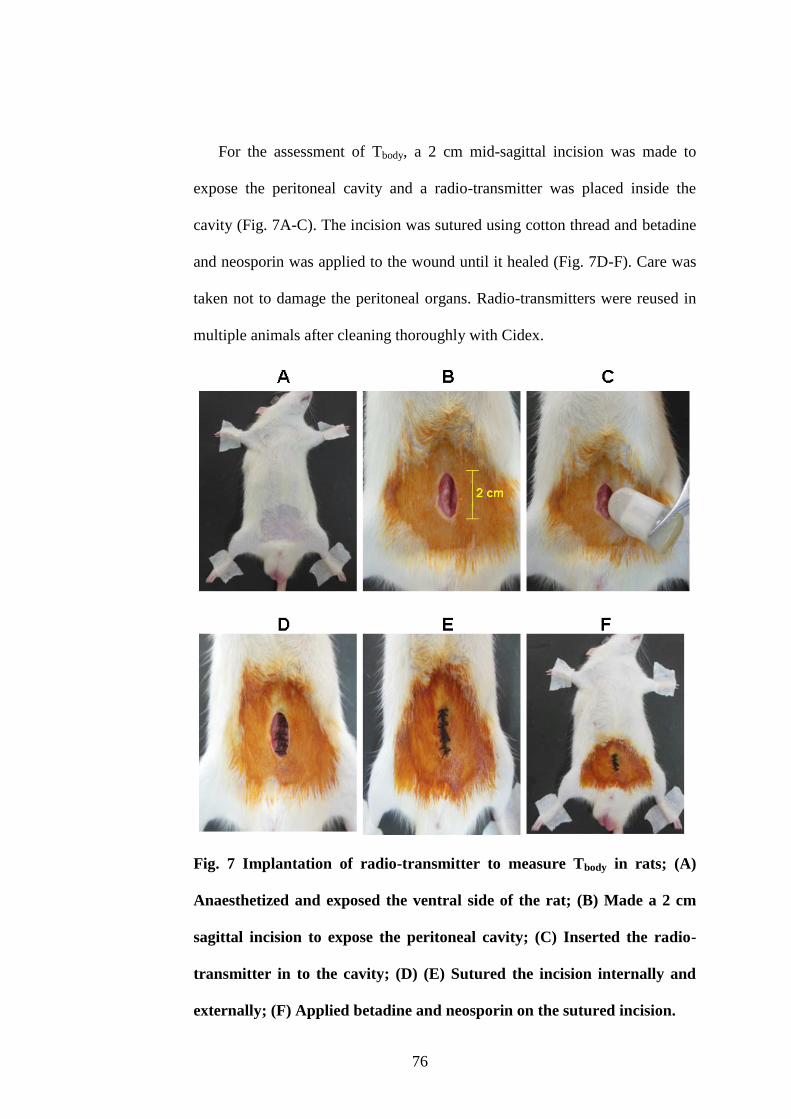
76
For the assessment of Tbody, a 2 cm mid-sagittal incision was made to
expose the peritoneal cavity and a radio-transmitter was placed inside the
cavity (Fig. 7A-C). The incision was sutured using cotton thread and betadine
and neosporin was applied to the wound until it healed (Fig. 7D-F). Care was
taken not to damage the peritoneal organs. Radio-transmitters were reused in
multiple animals after cleaning thoroughly with Cidex.
Fig. 7 Implantation of radio-transmitter to measure Tbody in rats; (A)
Anaesthetized and exposed the ventral side of the rat; (B) Made a 2 cm
sagittal incision to expose the peritoneal cavity; (C) Inserted the radio-
transmitter in to the cavity; (D) (E) Sutured the incision internally and
externally; (F) Applied betadine and neosporin on the sutured incision.
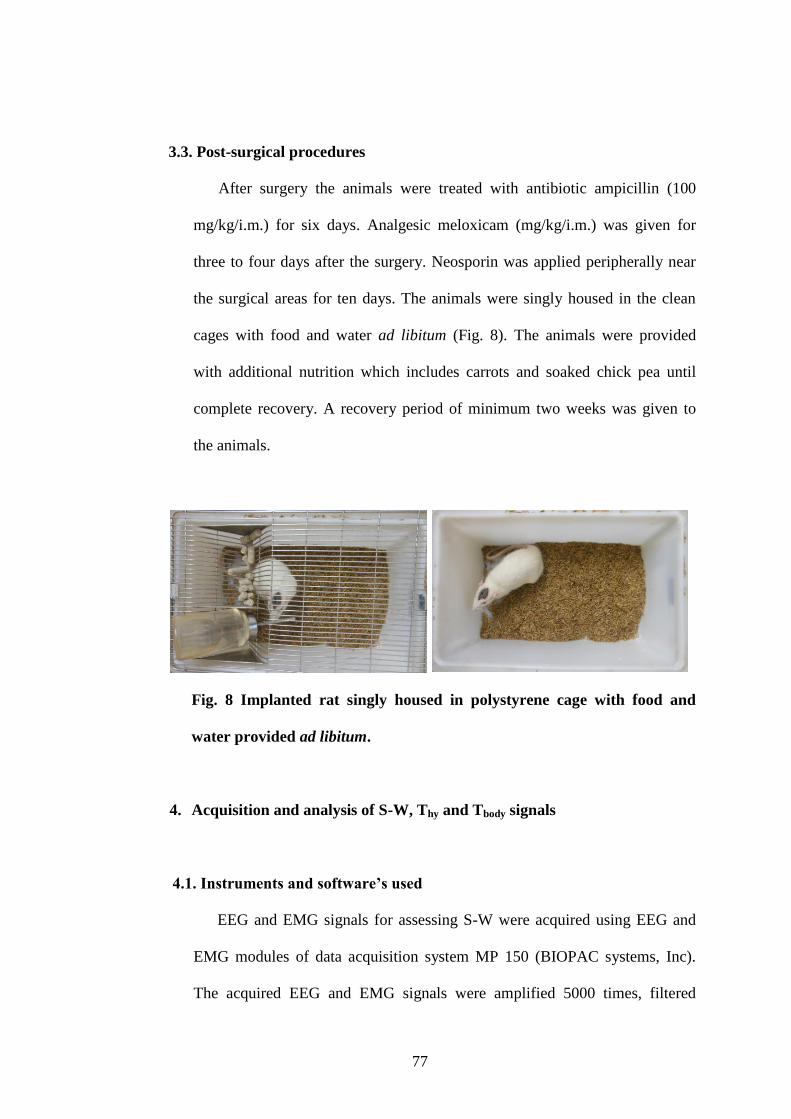
77
3.3. Post-surgical procedures
After surgery the animals were treated with antibiotic ampicillin (100
mg/kg/i.m.) for six days. Analgesic meloxicam (mg/kg/i.m.) was given for
three to four days after the surgery. Neosporin was applied peripherally near
the surgical areas for ten days. The animals were singly housed in the clean
cages with food and water ad libitum (Fig. 8). The animals were provided
with additional nutrition which includes carrots and soaked chick pea until
complete recovery. A recovery period of minimum two weeks was given to
the animals.
Fig. 8 Implanted rat singly housed in polystyrene cage with food and
water provided ad libitum.
4. Acquisition and analysis of S-W, Thy and Tbody signals
4.1. Instruments and software’s used
EEG and EMG signals for assessing S-W were acquired using EEG and
EMG modules of data acquisition system MP 150 (BIOPAC systems, Inc).
The acquired EEG and EMG signals were amplified 5000 times, filtered
78
(EEG: 0.1-35 Hz; EMG: 1-500 Hz) and digitized at 1 kHz. Acknowledge
software installed in the computer was used for the acquisition and analysis of
EEG and EMG signals.
Thy was acquired using a digital multimeter (True RMS Multimeter Model
287/289, FLUKE Technologies Pvt. Ltd.) which has an inbuilt memory to
store the data. Data acquisition cable (FLUKE Technologies Pvt. Ltd.) was
used to acquire the stored data. To acquire the Tbody, a telemetric DSI system
comprising of a receiver (PhysioTel Model RPC-1, serial number 021668 and
026462) and a computerized data acquisition system Dataquest via data
exchange matrix (Data Sciences International, USA). Radio waves transmitted
by the implanted transmitter were acquired using the receiver kept in the
vicinity. The Dataquest is meant for the conversion of received signals in to
Tbody data. DSI „acquisition‟ software installed in the computer was used to
acquire the data with online display and DSI „analysis‟ software was used to
analyze the Tbody data. Schematic representation of the experimental setup is
given in Fig. 9.
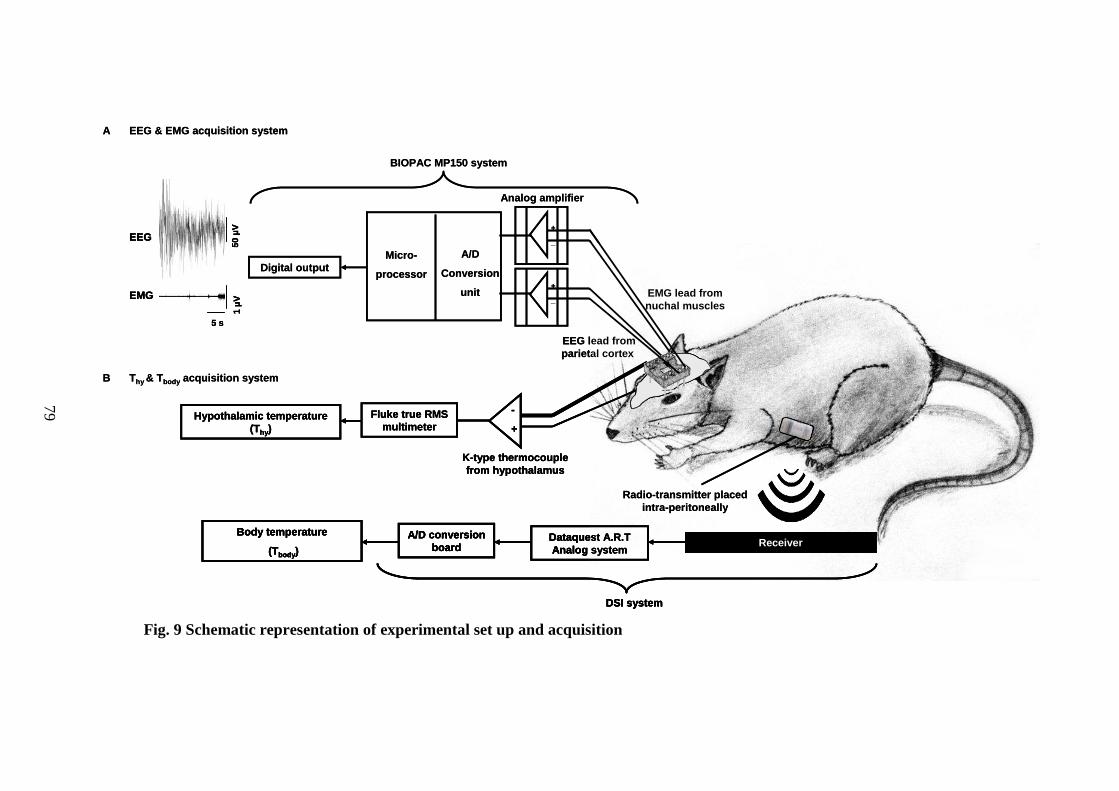
79
Fig. 9 Schematic representation of experimental set up and acquisition
EEG & EMG acquisition system
B
A
Thy & Tbody acquisition system
K-type thermocouple
from hypothalamus
-
+
Hypothalamic temperature
(Thy)
Fluke true RMS
multimeter
ReceiverDataquest A.R.T
Analog system
A/D conversion
board
Body temperature
(Tbody)
DSI system
Radio-transmitter placed
intra-peritoneally
EMG lead from
nuchal muscles
EEG lead from
parietal cortex
Digital output
A/D
Conversion
unit
Micro-
processor
Analog amplifier
BIOPAC MP150 system
50 µ
V1 µ
V
5 s
EEG
EMG+
_
+
_
G
G
EEG & EMG acquisition system
B
A
Thy & Tbody acquisition system
K-type thermocouple
from hypothalamus
-
+
Hypothalamic temperature
(Thy)
Fluke true RMS
multimeter
K-type thermocouple
from hypothalamus
-
+
Hypothalamic temperature
(Thy)
Fluke true RMS
multimeter
ReceiverDataquest A.R.T
Analog system
A/D conversion
board
Body temperature
(Tbody)
DSI system
Radio-transmitter placed
intra-peritoneally
ReceiverDataquest A.R.T
Analog system
A/D conversion
board
Body temperature
(Tbody)
DSI system
ReceiverDataquest A.R.T
Analog system
A/D conversion
board
Body temperature
(Tbody)
DSI system
Radio-transmitter placed
intra-peritoneally
EMG lead from
nuchal muscles
EEG lead from
parietal cortex
Digital output
A/D
Conversion
unit
Micro-
processor
Analog amplifier
BIOPAC MP150 system
50 µ
V1 µ
V
5 s
EEG
EMG
50 µ
V1 µ
V
5 s
EEG
EMG+
_
+
_
G
G
G
G
79
80
4.2. Procedure
After complete recovery from the surgical trauma, the rats were kept for
overnight habituation in the recording cage. A head cable made of 3 pairs of
insulated wires (1 pair for collecting EEG, 1 for EMG and 1 for grounding)
and a thermocouple compensatory wire was fixed in to the implanted socket
of the rats. This cable transfers the signals from the rats to the data acquisition
systems (FLUKE) via probes.
On the day of recording, the rats were connected to the data acquisition
systems via head cables to record S-W and Thy. To record Tbody, a magnet
(Data Sciences International, USA) was used to switch on the implanted
transmitter. After recording, the same process with the magnet switched off
the transmitter. Before all recordings in this study, the rats were given an
overnight habituation in the recording cage with the head cables connected to
prevent acclimatization issues. Before subjecting the rats to various
experiments under specified objectives, baseline or control recordings of S-W,
Thy and Tbody were taken on three days for 8 h (from 9:00 to 17:00 h).
Once acquired, the signals were subjected to offline analysis. S-W data
acquired were visually staged in the Acknowledge software, taking 10 s
epochs, and were classified into three stages, W, NREM sleep and REM sleep.
Thy and Tbody data were also acquired for every 10 s in such a way that every
stage of S-W was having a corresponding Thy and Tbody values. All signals
were time matched.
Quantity of S-W was assessed by measuring the percentage total time
spent in these stages and quality of sleep was assessed by measuring the
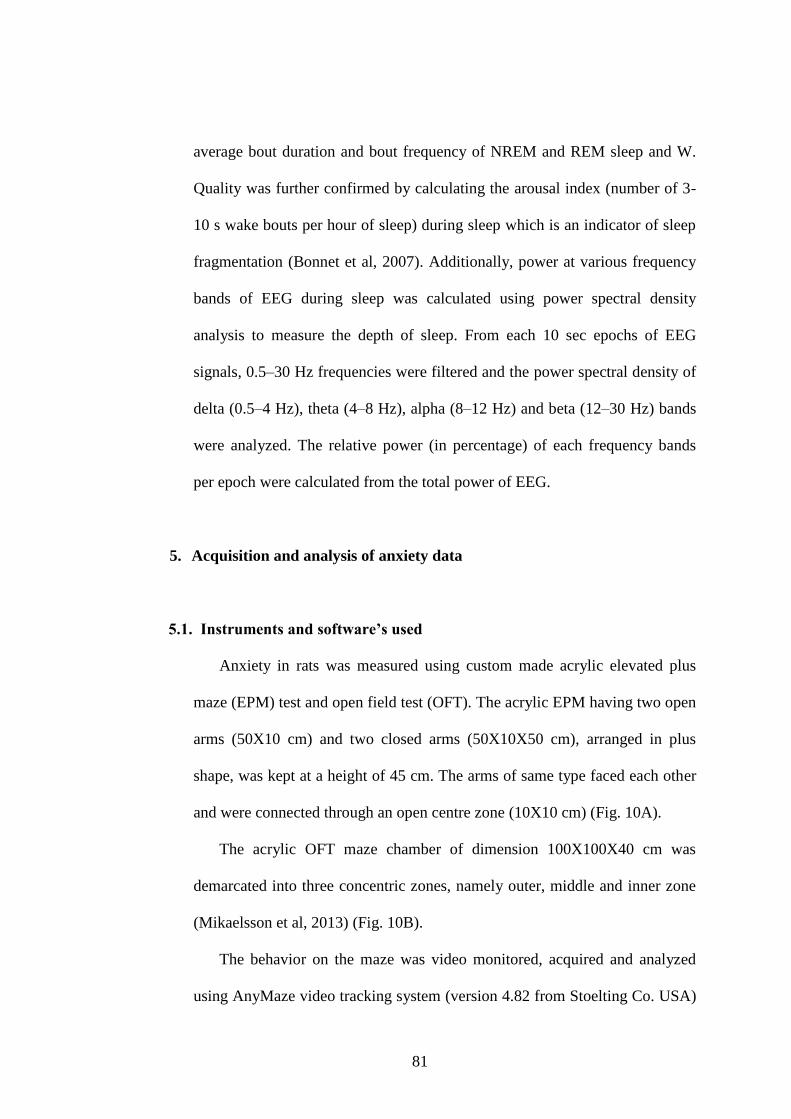
81
average bout duration and bout frequency of NREM and REM sleep and W.
Quality was further confirmed by calculating the arousal index (number of 3-
10 s wake bouts per hour of sleep) during sleep which is an indicator of sleep
fragmentation (Bonnet et al, 2007). Additionally, power at various frequency
bands of EEG during sleep was calculated using power spectral density
analysis to measure the depth of sleep. From each 10 sec epochs of EEG
signals, 0.5–30 Hz frequencies were filtered and the power spectral density of
delta (0.5–4 Hz), theta (4–8 Hz), alpha (8–12 Hz) and beta (12–30 Hz) bands
were analyzed. The relative power (in percentage) of each frequency bands
per epoch were calculated from the total power of EEG.
5. Acquisition and analysis of anxiety data
5.1. Instruments and software’s used
Anxiety in rats was measured using custom made acrylic elevated plus
maze (EPM) test and open field test (OFT). The acrylic EPM having two open
arms (50X10 cm) and two closed arms (50X10X50 cm), arranged in plus
shape, was kept at a height of 45 cm. The arms of same type faced each other
and were connected through an open centre zone (10X10 cm) (Fig. 10A).
The acrylic OFT maze chamber of dimension 100X100X40 cm was
demarcated into three concentric zones, namely outer, middle and inner zone
(Mikaelsson et al, 2013) (Fig. 10B).
The behavior on the maze was video monitored, acquired and analyzed
using AnyMaze video tracking system (version 4.82 from Stoelting Co. USA)
82
which is a system comprising of a camera/video source (FireWire with USB
cable) focusing the underlying maze (1.5 m below the camera) and a
software which detects the rat present on the maze and analyze and provide
output on various behavioral parameters as per the experimenter‟s input.
Fig. 10 EPM (A) and OFT (B) for anxiety measurement in rats
5.2. Procedure
Before starting the experiment, the rats were placed in transporting cage
for 5 min and taken in to the recording room with minimum disturbance. The
mazes were cleaned with 70 % rectified spirit 15-20 min before each
recording. After completion of test, the rats were placed back in to the
transporting cage and taken away from the recording room.
5.2.1. Elevated Plus maze (EPM)
At the beginning of the experiment the rats were placed in the centre zone
facing the opposite open arm and the behavior of rats on the maze was tested
83
for 5 min. The number of entries in to the open and closed arm, time spent in
the open and closed arm, total distance traveled on maze, average speed on
maze and total time mobile on the maze were assessed. Ethologically-derived
parameters which include head dipping, rearing and grooming were noted.
Fall from the open arm of the maze was counted and the rats were placed back
at the same spot from where it falls. If the animal falls more than 3 times, the
test was aborted and re-conducted after 24 h.
5.2.2. Open field test (OFT)
At the beginning of the experiment, the rats were placed in the centre zone
and allowed to explore the chamber for 5 min. Number of entries and time
spent in the inner and outer zones, duration of mobility on the maze, total
distance traveled, average speed and ethologically-derived parameters like
rearing and grooming were measured.
6. Brain antioxidant estimation
6.1. Chemicals and instruments used
6.1.1. Chemicals used
Normal saline (0.9 %), DTNB (5,5'-dithiobis-(2-nitrobenzoic acid)), GSH
(Glutathione), NADPH (Nicotinamide adenine dinucleotide phosphate),
GSSG (Glutathione disulfide), pyrogallol, Folin-Ciocalteau reagent and TBA
(Thiobarbituric acid) were obtained from Sigma-Aldrich Co. LLC. All other
84
chemicals were of analytical grade procured from reputed manufacturers
(Merck Millipore, Merck KGaA, Darmstadt, Germany and Sisco Research
Laboratories Pvt. Ltd., India).
6.1.2. Instruments used
Guillotine (Holmarc Opto-Mechatronics Pvt. Ltd, India), Motor homogenizer
(REMI High speed Homogenizer-RQ 127 A/D), centrifuge (R-8C, REMI
laboratory centrifuge), low temperature centrifuge (Eppendorf 5415R),
microcentrifuge (Eppendorf 5415R), UV spectrophotometer (Shimadzu UV-
1601PC), pH meter (Cyberscan 510 pH), -80 C freezer (U410 Premium,
Ultra-Low temperature Freezer, New Brunswick), water bath (Julabo SW22),
vortex mixer (REMI cyclomixer) and laboratory equipments (test tubes,
micro-pipettes, eppendorf‟s tube, beakers, flasks etc).
6.2. Procedure
6.2.1. Extraction of brain regions
The rats were decapitated using guillotine after the completion of various
experiments. Immediately after decapitation, the skull and dura were removed
without damaging the underlying brain. The brain was carefully removed
from the skull cavity till the region where the spinal cord begins by cutting the
optic chiasm mid-level. The brain was put in to ice-cold saline (0.9 %) and the
two hemispheres were separated from each other. Cerebellum was removed
from the brain tissue. From each hemisphere, the cortical layer was carefully
85
removed leaving the subcortex and brain stem intact. Then the brain stem
(which includes midbrain, pons and medulla) was carefully removed leaving
behind the subcortical layer intact (includes thalamus, hypothalamus, limbic
structures and basal forebrain). Each of these regions were separately weighed
and stored in Eppendorf‟s tube at -80 C until further processing. The entire
procedure till storing was performed in 10 min.
6.2.2. Preparation of tissue homogenates
Tissues were thawed to room temperature and homogenates (10% w/v)
were prepared in ice cold 0.1 M phosphate buffer (pH 7.4) in a motor
homogenizer and centrifuged in microcentrifuge at 10,000 rpm for 10 min at 4
°C. The supernatants were used for the biochemical analysis. Absorbance was
read using a UV spectrophotometer.
6.2.3. Analysis of total protein levels
Protein content in the tissue was determined according to the method of
Lowry et al, (1951). The tyrosine and tryptophan residues of proteins cause
reduction of the phosphomolybdate and phosphotungstate components of
Folin-Ciocalteau reagent in an alkaline medium to give a bluish purple color
with absorbance at 660 nm in spectrophotometer. Protein content was
calculated from the standard graph plotted using bovine serum albumin
(BSA).
0.1 ml homogenate was mixed and incubated for 10 min at room
temperature with 0.9 ml distilled water and 5 ml Lowry‟s reagent (solution A
86
containing 2 % sodium carbonate in 0.1 N sodium hydroxide solution mixed
with solution B containing 0.5 % copper sulphate in 1 % sodium potassium
tartarate). To this mixture, 0.5 ml Folin-Ciocalteau reagent was added, mixed
and incubated in dark for 30 min. OD was measured at 660 nm. Protein
content per sample was calculated from the standard graph.
6.2.4. Analysis of malondialdehyde (MDA) levels
The level of lipid peroxidation was measured as MDA according to the
method of Buege and Aust, (1978). MDA is formed mainly from the
peroxidation of polyunsaturated fatty acids. MDA is a Thiobarbituric acid
(TBA) reacting substance (TBARs) and the product formed between the
reaction of MDA and TBA is estimated at 532 nm in spectrophotometer. The
lipid peroxidation values are expressed as nanomoles MDA/ mg protein. 1, 1,
3, 3-tetraethoxypropane was used as the standard.
1 ml TBA agent (TBA + Trichloroacetic acid + Hydrochloric acid +
Ethylene diamine tetra acetic acid) was added to 100 μl homogenate. The
mixture was made up to a final volume of 2 ml with distilled water and kept in
boiling water bath for 30 min. The mixture was cooled and centrifuged for 15
min at 1800 rpm and the supernatant was read at 532 nm. MDA content per
sample was calculated from the standard graph.
6.2.5. Analysis of catalase (CAT) activity
CAT activity was assayed by measuring the decomposition of hydrogen
peroxide (H2O2) (Aebi, 1984). H2O2 has absorption maxima at 240 nm in
87
spectrophotometer and absorption decreases with the decomposition of H2O2.
One unit is defined as the amount of enzyme that decomposes 1 μ mol of
H2O2 per min at pH 7.0 at 25°C. The extinction was measured at 15 sec
intervals for 1 min immediately after adding 1 ml of 30 mM H2O2.
To 0.1 ml homogenate, 1.9 ml 0.1 M phosphate buffer (pH 7) was added.
H2O2 was immediately added to the mixture before taking the reading at 240
nm against the blank (without H2O2). OD was taken for every 15 sec interval
for 1 min at 240 nm.
6.2.6. Analysis of glutathione reductase (GSH-R) activity
GSH-R activity was determined following the procedures of Smith et al,
(1988) by measuring the disappearance of Nicotinamide adenine dinucleotide
phosphate (NADPH) at 340 nm in spectrophotometer at 1 min intervals for a
total time of 5 min. Enzyme activity (U) calculated as µmol NADPH
oxidized/min/mg protein using its molar extinction coefficient of 6.22 × 10³
M-1
cm-1
.
To 100 μl homogenate was added 500 μl ethylene diamine tetra acetic
acid (10 mM), 500 μl oxidised glutathione (12 mM) and 1 ml sodium
phosphate buffer (1 M, pH 7). The mixture was made up to a final volume of
3 ml using distilled water. 200 μl of NADPH (2 mM) was added just before
Activity (U/ml) = (∆ OD sample-∆ OD blank) X Total volume
0.0436 (extinction coefficient of H2O2) Sample volume
88
reading the absorbance at 340 nm. Absorbance was read for 5 min in 1 min
intervals.
6.2.7. Analysis of superoxide dismutase (SOD) activity
SOD activity was estimated by the method of Marklund and Marklund,
(1974). The degree of inhibition of autoxidation of pyrogallol at an alkaline
pH by SOD was used as a measure of the enzyme activity. Initially, the rate of
autoxidation of pyrogallol was noted at 1 min intervals for 3 min. The rate of
inhibition of pyrogallol autoxidation after the addition of the tissue
homogenate was noted at 420 nm in UV spectrophotometer. The enzyme
activity (U) was expressed in terms of units/mg protein in which one unit
corresponds to the amount of enzyme that inhibited the autoxidation reaction
by 50 %.
100 μl homogenate was mixed and centrifuged at 5000 g for 15 min with
25 μl ethanol and 15 μl chloroform. 50 μl supernatant was then mixed with
1 ml Tris-hydrochloric acid buffer with Diethylenetriaminepentaaceticacid
DETAPAC (pH 8.2). To this 250 μl of pyrogallol (2 mM) was added and the
∆ ODmin = OD @ 1 min - OD@ 5 min - OD @ 1 min - OD@ 5 min
4 min 4 min
blank sample
Activity (mU) = (∆ ODmin) X Total volume
6.22 X 10⁻³
ml/nmol Sample volume
(extinction coeffiecient of NADPH)
89
whole mixture was made up to a final volume of 2 ml using distilled water.
OD was read at 420 nm for 1 to 3 min at 1 min interval.
% inhibition = [1- (ODsample/ODblank)] X 100
6.2.8. Activity of glutathione peroxidase (GSH-Px) activity
GSH-Px activity was determined according to the method of Rotruck et al,
(1973). The absorbance of the yellow coloured complex was measured at
412 nm in spectrophotometer after incubation for 10 min at 37 °C. Enzyme
activity (U) was calculated as μ moles of glutathione utilized/min/mg protein.
To 25 μl homogenate was added 50 μl reduced glutathione (5 mM), 50 μl
sodium azide (25 mM), 250 μl hydrogen peroxide (2.5 mM), 0.1 M sodium
phosphate buffer (pH7) and 200 μl ethylene diamine tetra acetic acid
(0.8 mM). This mixture was incubated at 37 C for 6 min followed by
addition of 1 ml of 10 % trichloro acetic acid. The mixture was then
centrifuged for 15 min at 1500 g. To 1 ml supernatant, 1 ml sodium phosphate
buffer (0.4 M) and 0.5 ml DTNB (5,5'-dithio-bis-[2-nitrobenzoic acid] or
Ellman‟s reagent) was added and incubated at 37 C for 10 min. OD was read
at 412 nm.
Activity (U/ml) = % inhibition X Total volume
50 % Sample volume
90
6.2.9. Analysis of reduced glutathione (GSH) levels
GSH in tissue homogenate was determined by the method of Moron et al,
(1979). Reduced glutathione forms a yellow coloured complex with DTNB
with an absorbance at 412 nm in spectrophotometer. The GSH content of the
sample was arrived at from the standard graph and expressed as µmol/mg
protein.
To 100 μl homogenate, 900 μl distilled water and 2 ml trichloroacetic acid
(5 %) was added and incubated for 5 min. The mixture was centrifuged for
10 min at 1800 rpm. 100 μl supernatant was mixed with 900 μl sodium
phosphate buffer (0.2 M, pH 8) and 2 ml DTNB (0.6 mM). Absorbance was
read at 412 nm. GSH levels per sample were calculated from the standard
graph.
7. SD procedure
In the present study SD was performed using two methods. Method of
gentle handling was used to acutely deprive (5 h/5 days) the rats from sleep
and custom made rotating wheel was used to conduct chronic SD (5 h/21
days).
Gentle handling method was done by keeping the rats awake by
introducing new objects into the cage, making noise with and changing the
Activity (U/ml) = OD X sample dilution
14.15 X 10⁻³
ml/nmol (molar extinction coefficient of TNB)
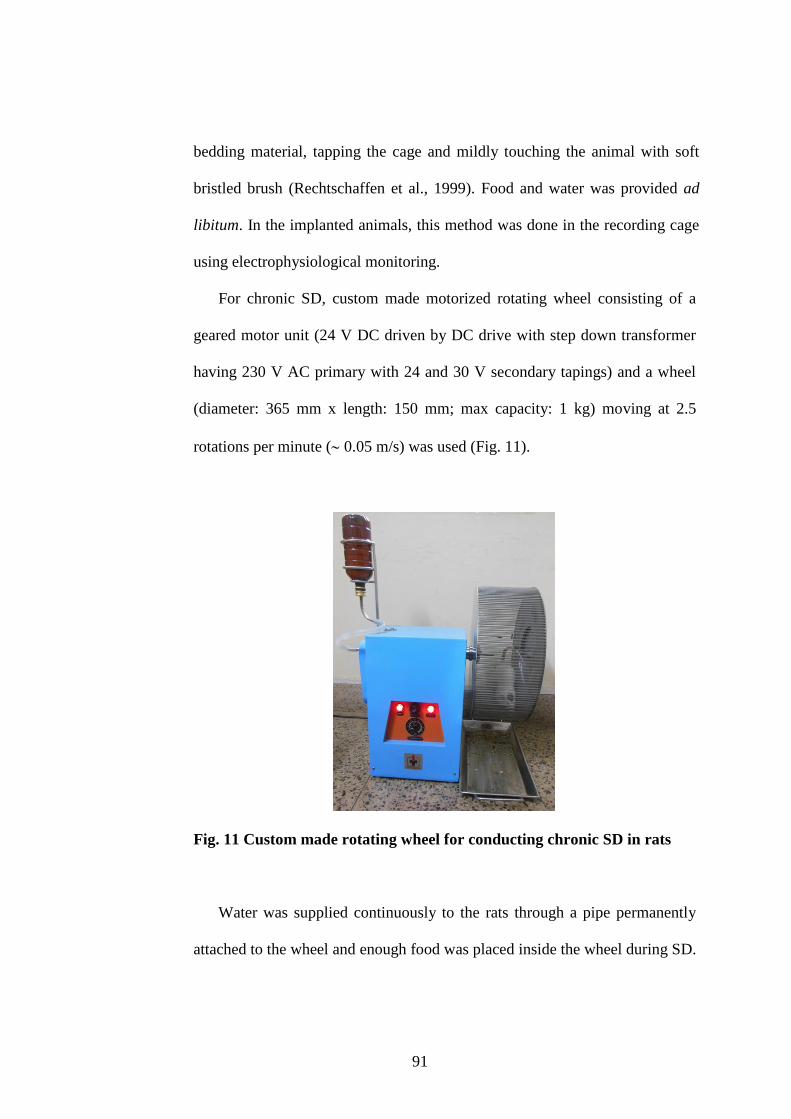
91
bedding material, tapping the cage and mildly touching the animal with soft
bristled brush (Rechtschaffen et al., 1999). Food and water was provided ad
libitum. In the implanted animals, this method was done in the recording cage
using electrophysiological monitoring.
For chronic SD, custom made motorized rotating wheel consisting of a
geared motor unit (24 V DC driven by DC drive with step down transformer
having 230 V AC primary with 24 and 30 V secondary tapings) and a wheel
(diameter: 365 mm x length: 150 mm; max capacity: 1 kg) moving at 2.5
rotations per minute ( 0.05 m/s) was used (Fig. 11).
Fig. 11 Custom made rotating wheel for conducting chronic SD in rats
Water was supplied continuously to the rats through a pipe permanently
attached to the wheel and enough food was placed inside the wheel during SD.
92
Fecal matter and urine was collected in a plate placed below the wheel (Fig.
11).
8. Positive control for SD studies
Sleep deprivation studies was conducted on three groups of rats, where the
hypnotic property of the optimal dose of α-Asarone, was compared with
vehicle and a positive control midazolam. Midazolam is a benzodiazepine
primarily used as a hypnotic-sedative and an anxiolytic drug, which enhances
the effect of the neurotransmitter gamma-aminobutyric acid (GABA) at the
GABAA receptor (Lancel et al, 1996).
9. Experimental design
9.1. Objective 1: To evaluate the effect of administration of various doses of
α-Asarone on S-W, Thy and Tbody in normal rats.
9.1.1. Chemicals used
α-Asarone (trans-1,2,4-Trimethoxy-5-(1-propenyl)benzene) and Tween80
(Polyoxyethylene (20) sorbitan monooleate) were obtained from Sigma-
Aldrich Co. LLC. α-Asarone was freshly prepared in the base containing 5 %
Tween80 and normal saline. The base containing 5 % Tween80 was taken as
the vehicle.
9.1.2. Procedure
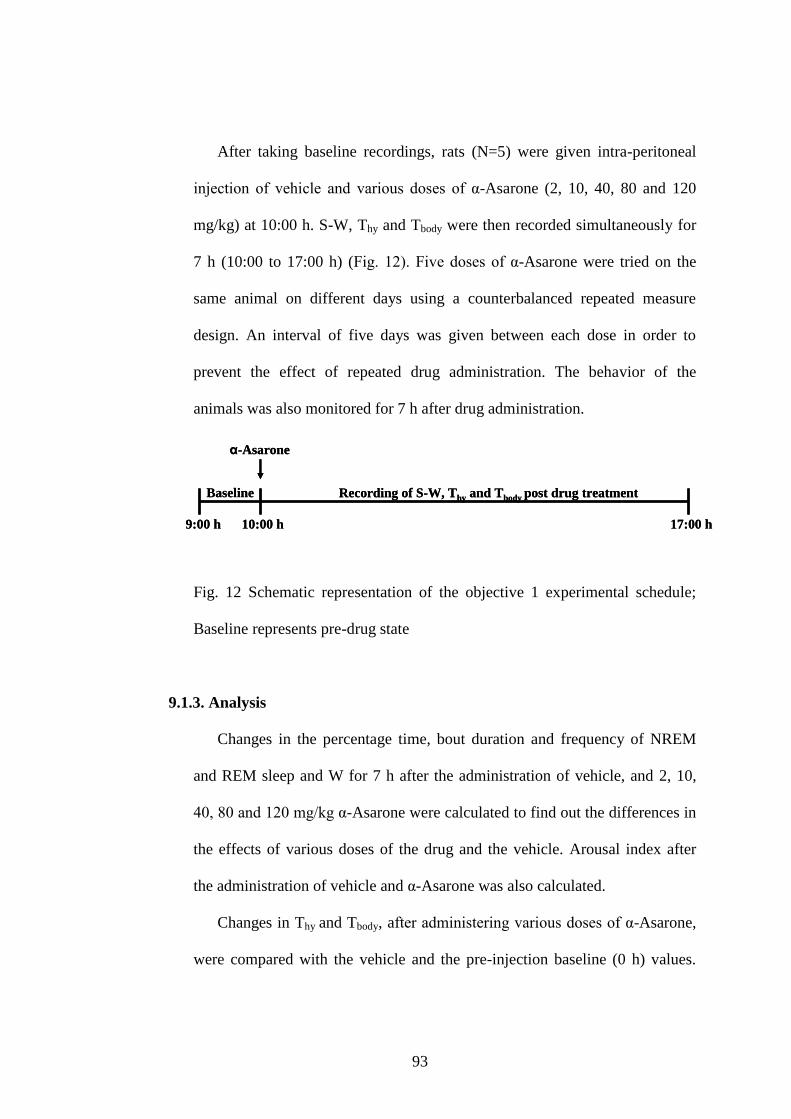
93
After taking baseline recordings, rats (N=5) were given intra-peritoneal
injection of vehicle and various doses of α-Asarone (2, 10, 40, 80 and 120
mg/kg) at 10:00 h. S-W, Thy and Tbody were then recorded simultaneously for
7 h (10:00 to 17:00 h) (Fig. 12). Five doses of α-Asarone were tried on the
same animal on different days using a counterbalanced repeated measure
design. An interval of five days was given between each dose in order to
prevent the effect of repeated drug administration. The behavior of the
animals was also monitored for 7 h after drug administration.
Fig. 12 Schematic representation of the objective 1 experimental schedule;
Baseline represents pre-drug state
9.1.3. Analysis
Changes in the percentage time, bout duration and frequency of NREM
and REM sleep and W for 7 h after the administration of vehicle, and 2, 10,
40, 80 and 120 mg/kg α-Asarone were calculated to find out the differences in
the effects of various doses of the drug and the vehicle. Arousal index after
the administration of vehicle and α-Asarone was also calculated.
Changes in Thy and Tbody, after administering various doses of α-Asarone,
were compared with the vehicle and the pre-injection baseline (0 h) values.
17:00 h9:00 h 10:00 h
Baseline
α-Asarone
Recording of S-W, Thy and Tbody post drug treatment
17:00 h9:00 h 10:00 h
Baseline
α-Asarone
Recording of S-W, Thy and Tbody post drug treatment
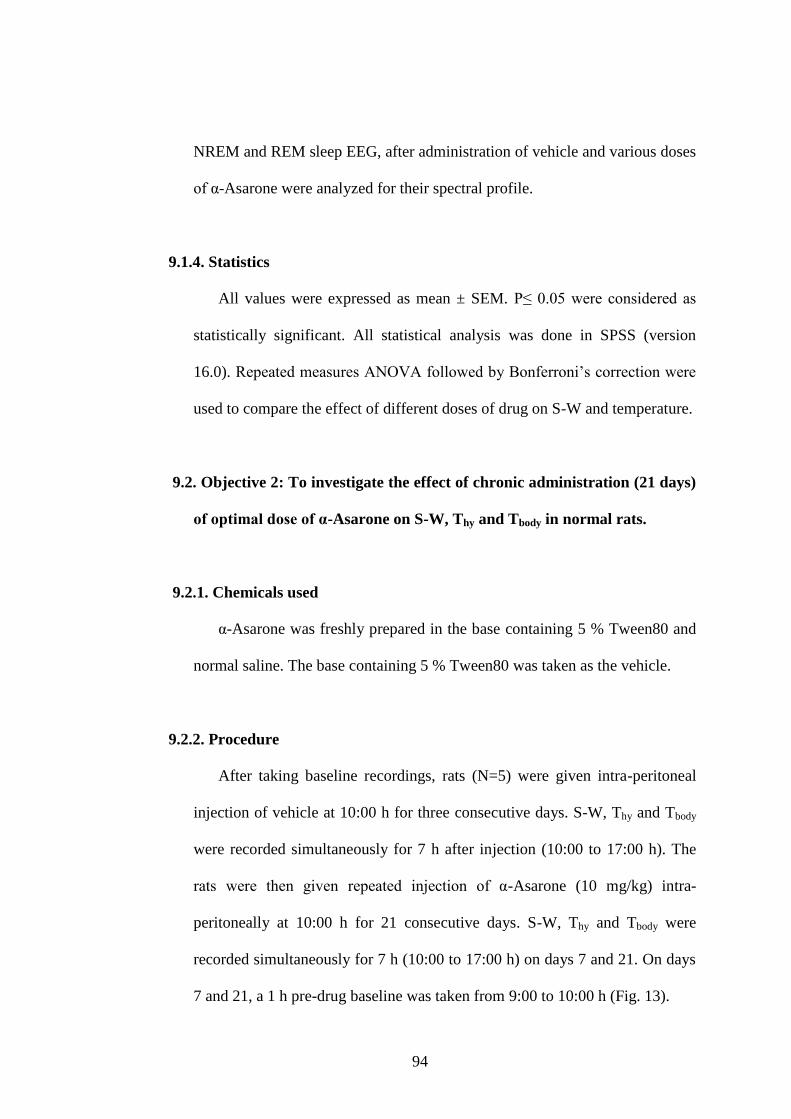
94
NREM and REM sleep EEG, after administration of vehicle and various doses
of α-Asarone were analyzed for their spectral profile.
9.1.4. Statistics
All values were expressed as mean ± SEM. P≤ 0.05 were considered as
statistically significant. All statistical analysis was done in SPSS (version
16.0). Repeated measures ANOVA followed by Bonferroni‟s correction were
used to compare the effect of different doses of drug on S-W and temperature.
9.2. Objective 2: To investigate the effect of chronic administration (21 days)
of optimal dose of α-Asarone on S-W, Thy and Tbody in normal rats.
9.2.1. Chemicals used
α-Asarone was freshly prepared in the base containing 5 % Tween80 and
normal saline. The base containing 5 % Tween80 was taken as the vehicle.
9.2.2. Procedure
After taking baseline recordings, rats (N=5) were given intra-peritoneal
injection of vehicle at 10:00 h for three consecutive days. S-W, Thy and Tbody
were recorded simultaneously for 7 h after injection (10:00 to 17:00 h). The
rats were then given repeated injection of α-Asarone (10 mg/kg) intra-
peritoneally at 10:00 h for 21 consecutive days. S-W, Thy and Tbody were
recorded simultaneously for 7 h (10:00 to 17:00 h) on days 7 and 21. On days
7 and 21, a 1 h pre-drug baseline was taken from 9:00 to 10:00 h (Fig. 13).
95
Fig. 13 Schematic representation of the objective 2 experimental schedule;
Baseline represents pre-drug state
9.2.3. Analysis
Changes in the percentage time, bout duration and frequency of NREM
and REM sleep and W for 7 h after the administration of vehicle and
10 mg/kg α-Asarone (day 7 and 21) were calculated to find out the effect of
chronic administration of the drug in normal rats. Arousal index after the
administration of vehicle and α-Asarone (day 7 and 21) was also calculated.
Changes in Thy and Tbody, were compared with the vehicle and the pre-
injection baseline (0 h) values. NREM and REM sleep EEG, after
administration of vehicle and 10 mg/kg α-Asarone (day 7 and 21) were
analyzed for their spectral profile.
9.2.4. Statistics
All values were expressed as mean ± SEM. P≤ 0.05 were considered as
statistically significant. All statistical analysis was done in SPSS (version
16.0). Repeated measures ANOVA followed by Bonferroni‟s correction were
used to compare the effect of drug on different days.
17:00 h9:00 h 10:00 h
Baseline
α-Asarone 10 mg/kg
Recording of S-W, Thy and Tbody post drug treatment on days 7 & 21
17:00 h9:00 h 10:00 h
Baseline
α-Asarone 10 mg/kg
Recording of S-W, Thy and Tbody post drug treatment on days 7 & 21
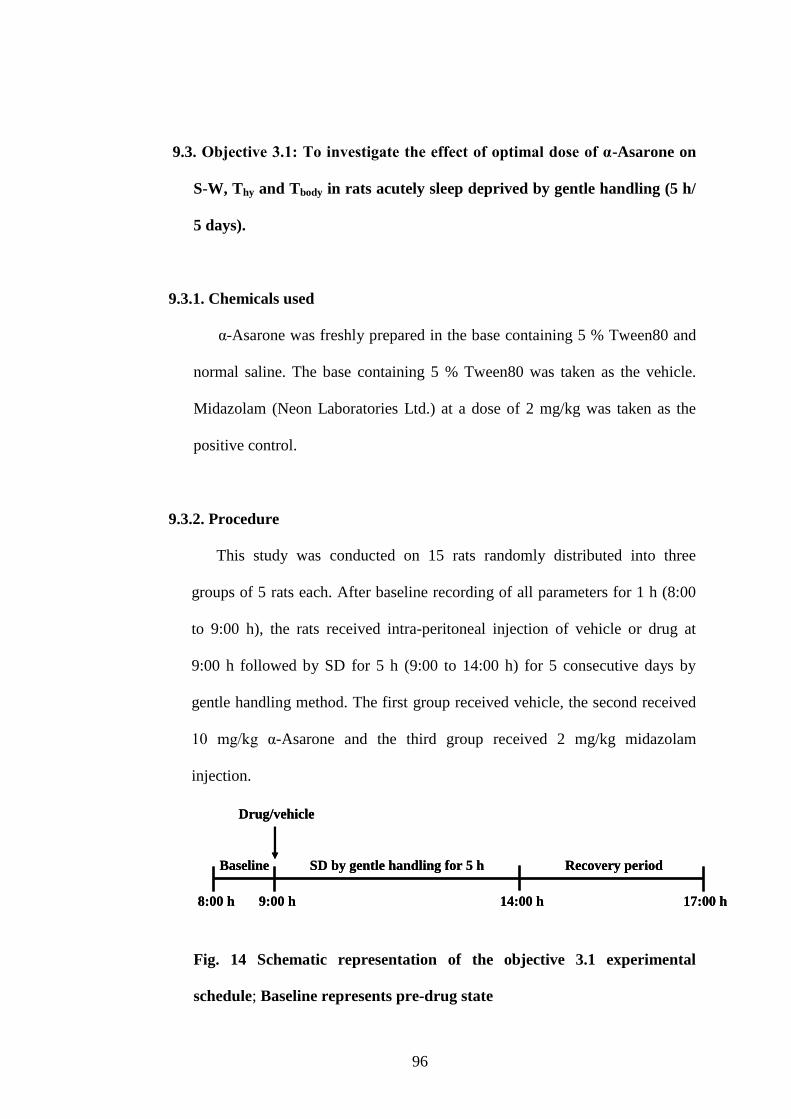
96
9.3. Objective 3.1: To investigate the effect of optimal dose of α-Asarone on
S-W, Thy and Tbody in rats acutely sleep deprived by gentle handling (5 h/
5 days).
9.3.1. Chemicals used
α-Asarone was freshly prepared in the base containing 5 % Tween80 and
normal saline. The base containing 5 % Tween80 was taken as the vehicle.
Midazolam (Neon Laboratories Ltd.) at a dose of 2 mg/kg was taken as the
positive control.
9.3.2. Procedure
This study was conducted on 15 rats randomly distributed into three
groups of 5 rats each. After baseline recording of all parameters for 1 h (8:00
to 9:00 h), the rats received intra-peritoneal injection of vehicle or drug at
9:00 h followed by SD for 5 h (9:00 to 14:00 h) for 5 consecutive days by
gentle handling method. The first group received vehicle, the second received
10 mg/kg α-Asarone and the third group received 2 mg/kg midazolam
injection.
Fig. 14 Schematic representation of the objective 3.1 experimental
schedule; Baseline represents pre-drug state
17:00 h8:00 h 9:00 h
Baseline
Drug/vehicle
14:00 h
SD by gentle handling for 5 h Recovery period
17:00 h8:00 h 9:00 h
Baseline
Drug/vehicle
14:00 h
SD by gentle handling for 5 h Recovery period
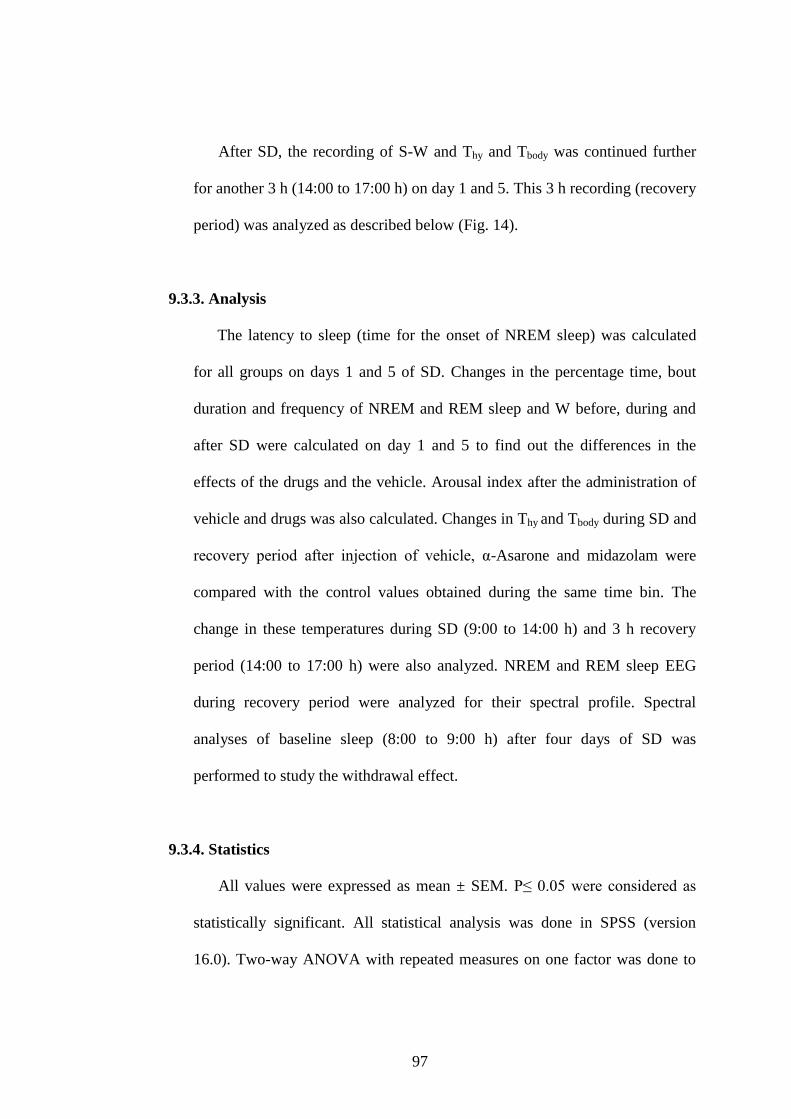
97
After SD, the recording of S-W and Thy and Tbody was continued further
for another 3 h (14:00 to 17:00 h) on day 1 and 5. This 3 h recording (recovery
period) was analyzed as described below (Fig. 14).
9.3.3. Analysis
The latency to sleep (time for the onset of NREM sleep) was calculated
for all groups on days 1 and 5 of SD. Changes in the percentage time, bout
duration and frequency of NREM and REM sleep and W before, during and
after SD were calculated on day 1 and 5 to find out the differences in the
effects of the drugs and the vehicle. Arousal index after the administration of
vehicle and drugs was also calculated. Changes in Thy and Tbody during SD and
recovery period after injection of vehicle, α-Asarone and midazolam were
compared with the control values obtained during the same time bin. The
change in these temperatures during SD (9:00 to 14:00 h) and 3 h recovery
period (14:00 to 17:00 h) were also analyzed. NREM and REM sleep EEG
during recovery period were analyzed for their spectral profile. Spectral
analyses of baseline sleep (8:00 to 9:00 h) after four days of SD was
performed to study the withdrawal effect.
9.3.4. Statistics
All values were expressed as mean ± SEM. P≤ 0.05 were considered as
statistically significant. All statistical analysis was done in SPSS (version
16.0). Two-way ANOVA with repeated measures on one factor was done to
98
compare across time bin (repeated measures) and among three groups
(independent).
9.4. Objective 3.2: To investigate the effect of optimal dose of α-Asarone on
anxiety in rats acutely sleep deprived by gentle handling (5 h/ 5 days).
9.4.1. Chemicals used
α-Asarone was freshly prepared in the base containing 5 % Tween80 and
normal saline. The base containing 5 % Tween80 was taken as the vehicle.
Midazolam at a dose of 2 mg/kg was taken as the positive control.
9.4.2. Procedure
After testing baseline anxiety levels, the un-implanted rats (N=20) were
randomly distributed into 3 groups. First group received vehicle (N=7),
second (N=8) received 10 mg/kg α-Asarone and the third (N=5) received 2
mg/kg midazolam (positive control) intra-peritoneally at 9:00 h for 5 days,
before 5 hours of SD by gentle handling method. EPM test was conducted on
days 1 and 4, and OFT on days 2 and 5 from 13:30 to 14:00 h (Fig. 15).
Fig. 15 Schematic representation of the objective 3.2 experimental
schedule; Baseline represents pre-drug state
8:00 h 9:00 h
Baseline
Drug/vehicle
14:00 h
SD by gentle handling for 5 h
EPM on days 1 & 4
OFT on days 2 & 5
8:00 h 9:00 h
Baseline
Drug/vehicle
14:00 h
SD by gentle handling for 5 h
EPM on days 1 & 4
OFT on days 2 & 5
99
For EPM test, the parameters such as entries to open and the closed arm,
average speed, time spent in the open and the closed arm, total distance
traveled, time spent in mobility and ethologically-derived parameters like head
dipping, rearing, grooming and stretch-attend posture were assessed.
For OFT, entries and time spent in the inner and outer zones were noted.
Parameters including average speed, time spent in moving around, total
distance traveled and ethologically-derived parameters like rearing and
grooming were also measured.
9.4.3. Statistics
Shapiro-Wilk test was done to check the normality of the data. All values
expressed as mean ± SEM. P≤0.05 were considered as statistically significant.
All statistical analyses were done in SPSS (version 16.0). For EPM and OFT
parameters, Kruskal Wallis test was done to compare among the groups and
Wilcoxon Sign Rank test was used for comparison with the baseline.
9.5. Objective 3.3: To investigate the effect of optimal dose of α-Asarone on
antioxidant levels in the brain of rats acutely sleep deprived by gentle
handling (5 h/ 5 days).
9.5.1. Chemicals used
α-Asarone was freshly prepared in the base containing 5 % Tween80 and
normal saline. The base containing 5 % Tween80 was taken as the vehicle.
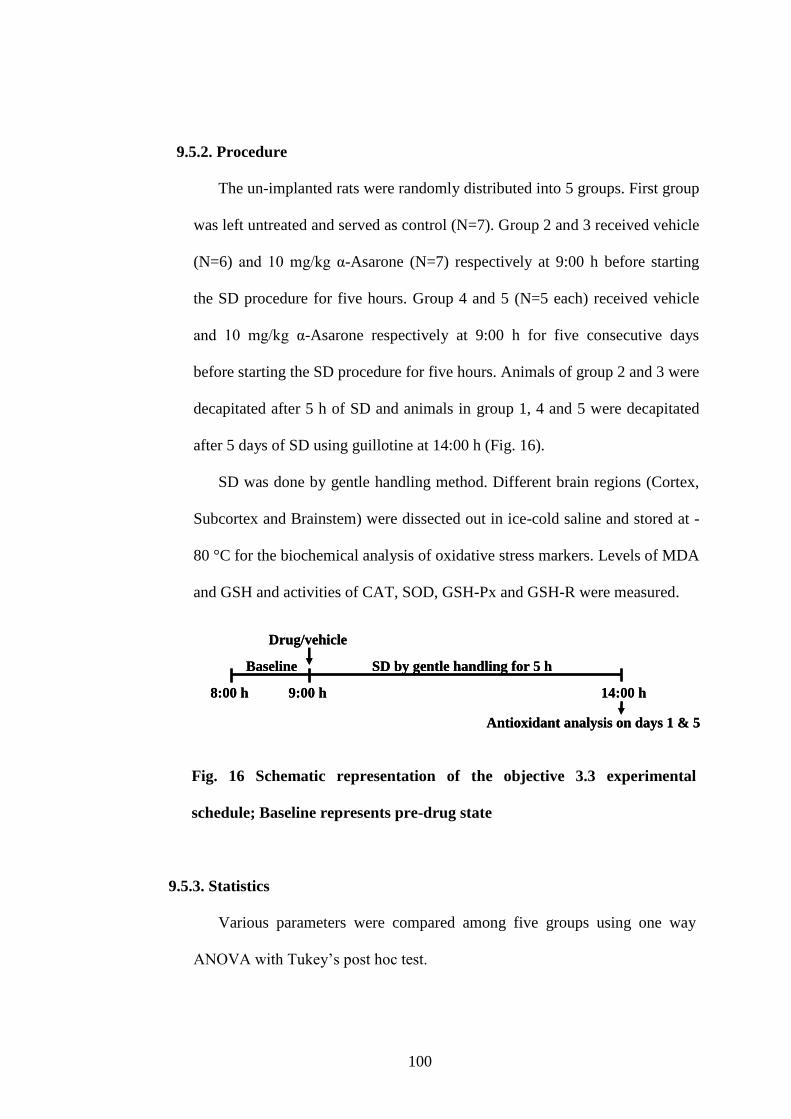
100
9.5.2. Procedure
The un-implanted rats were randomly distributed into 5 groups. First group
was left untreated and served as control (N=7). Group 2 and 3 received vehicle
(N=6) and 10 mg/kg α-Asarone (N=7) respectively at 9:00 h before starting
the SD procedure for five hours. Group 4 and 5 (N=5 each) received vehicle
and 10 mg/kg α-Asarone respectively at 9:00 h for five consecutive days
before starting the SD procedure for five hours. Animals of group 2 and 3 were
decapitated after 5 h of SD and animals in group 1, 4 and 5 were decapitated
after 5 days of SD using guillotine at 14:00 h (Fig. 16).
SD was done by gentle handling method. Different brain regions (Cortex,
Subcortex and Brainstem) were dissected out in ice-cold saline and stored at -
80 °C for the biochemical analysis of oxidative stress markers. Levels of MDA
and GSH and activities of CAT, SOD, GSH-Px and GSH-R were measured.
Fig. 16 Schematic representation of the objective 3.3 experimental
schedule; Baseline represents pre-drug state
9.5.3. Statistics
Various parameters were compared among five groups using one way
ANOVA with Tukey‟s post hoc test.
8:00 h 9:00 h
Baseline
Drug/vehicle
14:00 h
SD by gentle handling for 5 h
Antioxidant analysis on days 1 & 5
8:00 h 9:00 h
Baseline
Drug/vehicle
14:00 h
SD by gentle handling for 5 h
Antioxidant analysis on days 1 & 5
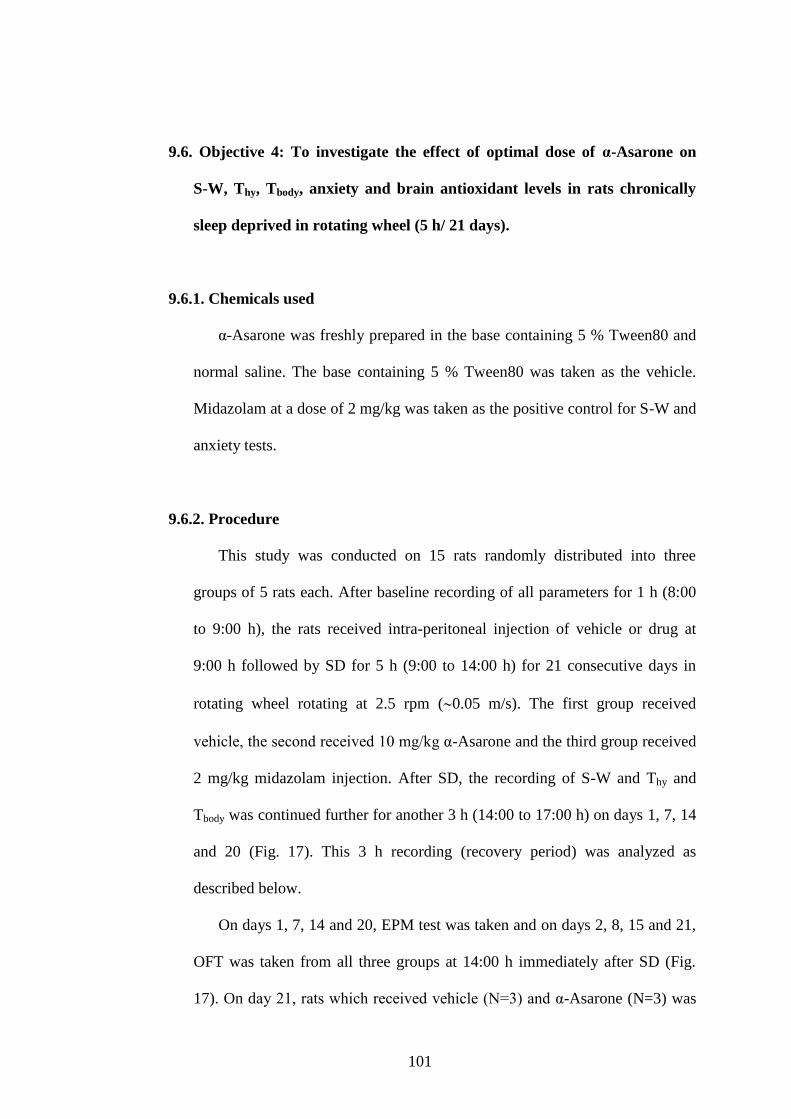
101
9.6. Objective 4: To investigate the effect of optimal dose of α-Asarone on
S-W, Thy, Tbody, anxiety and brain antioxidant levels in rats chronically
sleep deprived in rotating wheel (5 h/ 21 days).
9.6.1. Chemicals used
α-Asarone was freshly prepared in the base containing 5 % Tween80 and
normal saline. The base containing 5 % Tween80 was taken as the vehicle.
Midazolam at a dose of 2 mg/kg was taken as the positive control for S-W and
anxiety tests.
9.6.2. Procedure
This study was conducted on 15 rats randomly distributed into three
groups of 5 rats each. After baseline recording of all parameters for 1 h (8:00
to 9:00 h), the rats received intra-peritoneal injection of vehicle or drug at
9:00 h followed by SD for 5 h (9:00 to 14:00 h) for 21 consecutive days in
rotating wheel rotating at 2.5 rpm (0.05 m/s). The first group received
vehicle, the second received 10 mg/kg α-Asarone and the third group received
2 mg/kg midazolam injection. After SD, the recording of S-W and Thy and
Tbody was continued further for another 3 h (14:00 to 17:00 h) on days 1, 7, 14
and 20 (Fig. 17). This 3 h recording (recovery period) was analyzed as
described below.
On days 1, 7, 14 and 20, EPM test was taken and on days 2, 8, 15 and 21,
OFT was taken from all three groups at 14:00 h immediately after SD (Fig.
17). On day 21, rats which received vehicle (N=3) and α-Asarone (N=3) was
102
decapitated using guillotine; their brains were dissected in to 3 regions
(cortex, sub-cortex and brainstem) and stored at -80 C for antioxidant
estimation (Fig. 17). Levels of MDA and GSH and activities of CAT, SOD,
GSH-Px and GSH-R were measured.
Fig. 17 Schematic representation of the objective 4 experimental schedule;
Baseline represents pre-drug state
S-W of few rats which received vehicle (N=2), α-Asarone (N=2) and
midazolam (N=5) were taken 24, 48 and 72 h after 21 days SD. S-W was
recorded for 8 h (9:00-17:00 h) on all three days to study the withdrawal effect
of drugs.
9.6.3. Analysis
The latency to sleep (time for the onset of NREM sleep) was calculated
for all groups on days 1, 7, 14 and 20 of SD. Changes in the percentage time,
bout duration and frequency of NREM and REM sleep and W before, during
and after SD on days 1, 7, 14 and 20 were calculated to find out the
differences in the effects of the drugs and the vehicle. Arousal index after the
administration of vehicle and drugs were also calculated. S-W was also
17:00 h8:00 h 9:00 h
Baseline
Drug/vehicle
14:00 h
SD in rotating wheel for 5 h Recovery period
Antioxidant analysis on day 21EPM on days 1, 7, 14 & 20
OFT on days 2, 8, 15 & 21
17:00 h8:00 h 9:00 h
Baseline
Drug/vehicle
14:00 h
SD in rotating wheel for 5 h Recovery period
17:00 h8:00 h 9:00 h
Baseline
Drug/vehicle
14:00 h
SD in rotating wheel for 5 h Recovery period
Antioxidant analysis on day 21EPM on days 1, 7, 14 & 20
OFT on days 2, 8, 15 & 21
103
analyzed 24, 48 and 72 h after termination of SD to check the withdrawal
effect of drugs.
Changes in Thy and Tbody during SD and recovery period after injection of
vehicle, α-Asarone and midazolam were compared with the control values
obtained during the same time bin. NREM and REM sleep EEG during 3 h
recovery sleep were analyzed for their spectral profile. Spectral analysis was
also performed in NREM and REM sleep observed 24, 48 and 72 h after
termination of SD to check the withdrawal effect of drugs
For EPM test, the parameters such as entries to open and the closed arm,
average speed, time spent in the open and the closed arm, total distance
traveled, time spent in mobility and ethologically-derived parameters like head
dipping, rearing, grooming and stretch-attend posture were assessed. For OFT,
entries and time spent in the inner and outer zones were noted. Parameters
including average speed, time spent in moving around, total distance traveled
and ethologically-derived parameters like rearing and grooming were also
measured.
9.6.4. Statistics
All values were expressed as mean ± SEM. P≤ 0.05 were considered as
statistically significant. All statistical analysis was done in SPSS (version
16.0). For S-W, Thy and Tbody, two-way ANOVA with repeated measures on
one factor was done to compare across time bin (repeated measures) and
among three groups (independent). For EPM and OFT parameters, Kruskal
Wallis test was done to compare among the groups and Wilcoxon Sign Rank
104
test was used for comparison with the baseline. And for antioxidant analysis,
various parameters measured from vehicle and α-Asarone groups were
compared between and with control group using one way ANOVA with
Tukey‟s post hoc test.
9.7. Objective 5: To understand the mechanism of action of α-Asarone by
examining the relationship of Thy and Tbody with NREM and REM sleep.
Scatter plots were prepared to show the correlation between the sleep bout
durations and the Thy and Tbody. The correlation of Thy and Tbody with the bout
duration of NREM and REM sleep was assessed by taking bouts showing
clear transition to NREM stages from W and REM sleep, and to REM stages
from NREM sleep. Stages with minimum bout duration of 30 s, preceding and
succeeding the transition, were only taken for analysis. Thy and Tbody during
NREM and REM sleep was calculated as the percentage change from the
preceding stage (taken as 100 %). Linear regression analysis was done to
quantify the relationship between sleep duration and temperature after drug
administration.

105
Chapter IV: Results
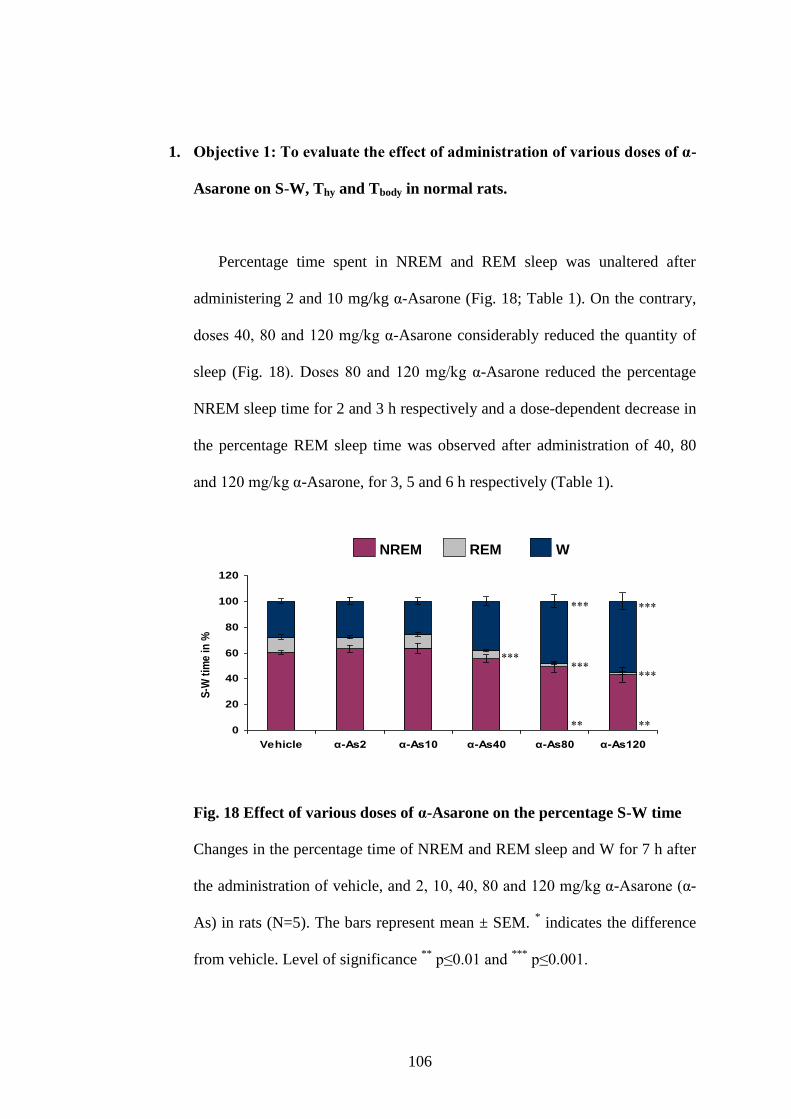
106
1. Objective 1: To evaluate the effect of administration of various doses of α-
Asarone on S-W, Thy and Tbody in normal rats.
Percentage time spent in NREM and REM sleep was unaltered after
administering 2 and 10 mg/kg α-Asarone (Fig. 18; Table 1). On the contrary,
doses 40, 80 and 120 mg/kg α-Asarone considerably reduced the quantity of
sleep (Fig. 18). Doses 80 and 120 mg/kg α-Asarone reduced the percentage
NREM sleep time for 2 and 3 h respectively and a dose-dependent decrease in
the percentage REM sleep time was observed after administration of 40, 80
and 120 mg/kg α-Asarone, for 3, 5 and 6 h respectively (Table 1).
Fig. 18 Effect of various doses of α-Asarone on the percentage S-W time
Changes in the percentage time of NREM and REM sleep and W for 7 h after
the administration of vehicle, and 2, 10, 40, 80 and 120 mg/kg α-Asarone (α-
As) in rats (N=5). The bars represent mean ± SEM. * indicates the difference
from vehicle. Level of significance **
p≤0.01 and ***
p≤0.001.
0
20
40
60
80
100
120
Vehicle α-As2 α-As10 α-As40 α-As80 α-As120
S-W
tim
e i
n %
NREM REM W
REMNREM W
0
20
40
60
80
100
120
Vehicle α-As2 α-As10 α-As40 α-As80 α-As120
S-W
tim
e i
n %
NREM REM W
0
20
40
60
80
100
120
Vehicle α-As2 α-As10 α-As40 α-As80 α-As120
S-W
tim
e i
n %
NREM REM W
REMNREM WREMNREM W
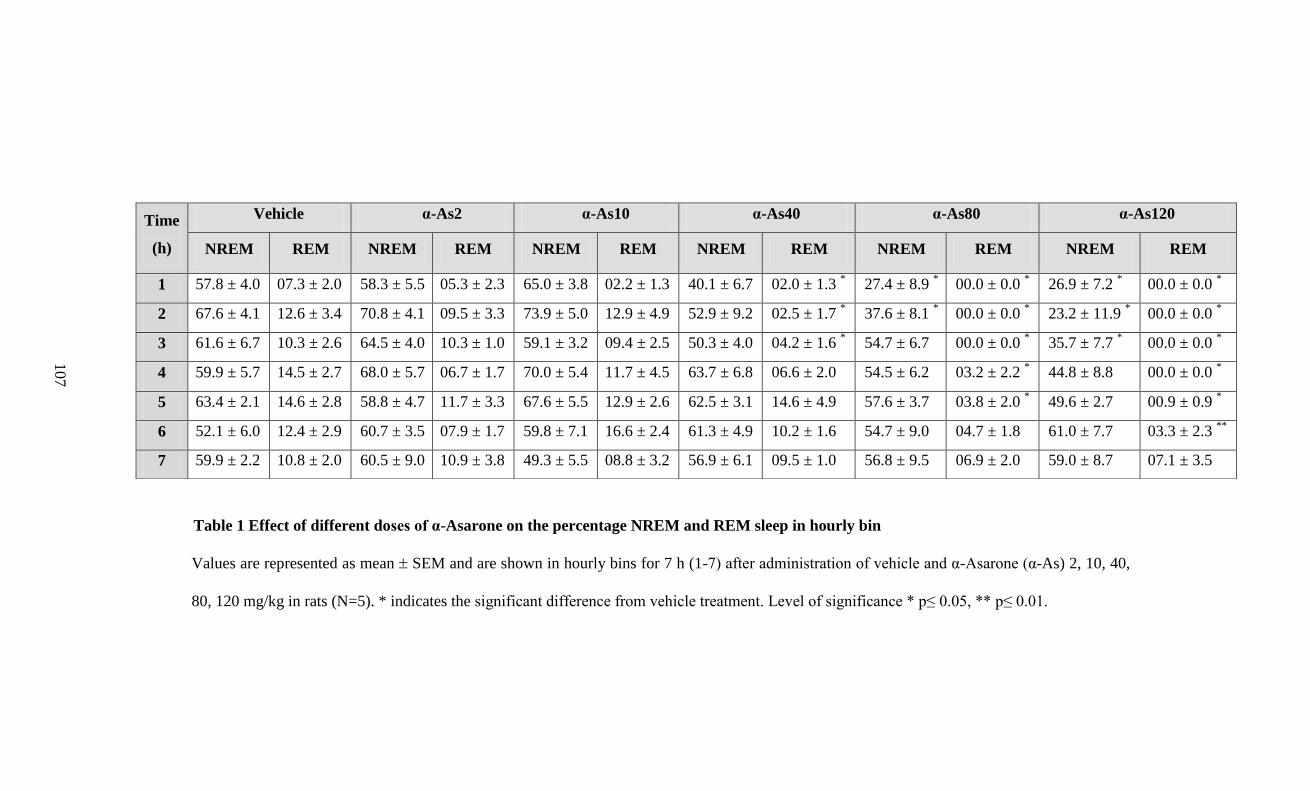
Table 1 Effect of different doses of α-Asarone on the percentage NREM and REM sleep in hourly bin
Values are represented as mean SEM and are shown in hourly bins for 7 h (1-7) after administration of vehicle and α-Asarone (α-As) 2, 10, 40,
80, 120 mg/kg in rats (N=5). * indicates the significant difference from vehicle treatment. Level of significance * p≤ 0.05, ** p≤ 0.01.
Time
(h)
Vehicle α-As2 α-As10 α-As40 α-As80 α-As120
NREM REM NREM REM NREM REM NREM REM NREM REM NREM REM
1 57.8 ± 4.0 07.3 ± 2.0 58.3 ± 5.5 05.3 ± 2.3 65.0 ± 3.8 02.2 ± 1.3 40.1 ± 6.7 02.0 ± 1.3 * 27.4 ± 8.9
* 00.0 ± 0.0
* 26.9 ± 7.2
* 00.0 ± 0.0
*
2 67.6 ± 4.1 12.6 ± 3.4 70.8 ± 4.1 09.5 ± 3.3 73.9 ± 5.0 12.9 ± 4.9 52.9 ± 9.2 02.5 ± 1.7 * 37.6 ± 8.1
* 00.0 ± 0.0
* 23.2 ± 11.9
* 00.0 ± 0.0
*
3 61.6 ± 6.7 10.3 ± 2.6 64.5 ± 4.0 10.3 ± 1.0 59.1 ± 3.2 09.4 ± 2.5 50.3 ± 4.0 04.2 ± 1.6 * 54.7 ± 6.7 00.0 ± 0.0
* 35.7 ± 7.7
* 00.0 ± 0.0
*
4 59.9 ± 5.7 14.5 ± 2.7 68.0 ± 5.7 06.7 ± 1.7 70.0 ± 5.4 11.7 ± 4.5 63.7 ± 6.8 06.6 ± 2.0 54.5 ± 6.2 03.2 ± 2.2 * 44.8 ± 8.8 00.0 ± 0.0
*
5 63.4 ± 2.1 14.6 ± 2.8 58.8 ± 4.7 11.7 ± 3.3 67.6 ± 5.5 12.9 ± 2.6 62.5 ± 3.1 14.6 ± 4.9 57.6 ± 3.7 03.8 ± 2.0 * 49.6 ± 2.7 00.9 ± 0.9
*
6 52.1 ± 6.0 12.4 ± 2.9 60.7 ± 3.5 07.9 ± 1.7 59.8 ± 7.1 16.6 ± 2.4 61.3 ± 4.9 10.2 ± 1.6 54.7 ± 9.0 04.7 ± 1.8 61.0 ± 7.7 03.3 ± 2.3 **
7 59.9 ± 2.2 10.8 ± 2.0 60.5 ± 9.0 10.9 ± 3.8 49.3 ± 5.5 08.8 ± 3.2 56.9 ± 6.1 09.5 ± 1.0 56.8 ± 9.5 06.9 ± 2.0 59.0 ± 8.7 07.1 ± 3.5
107
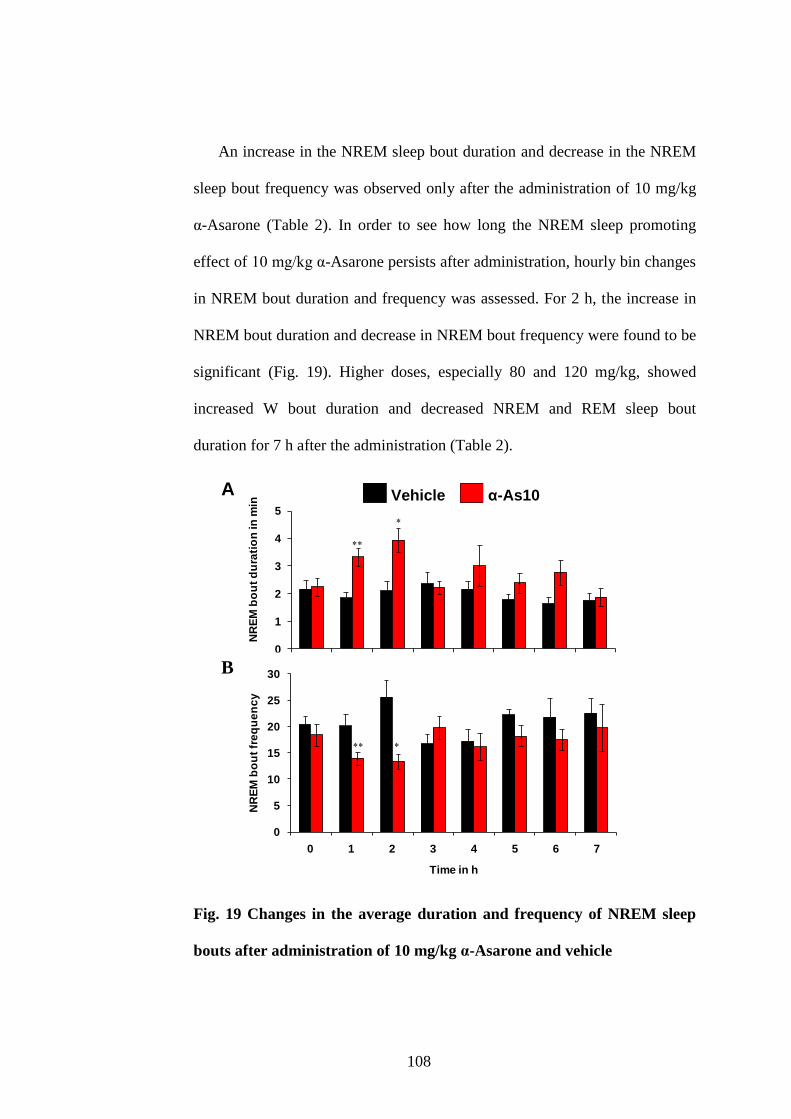
108
An increase in the NREM sleep bout duration and decrease in the NREM
sleep bout frequency was observed only after the administration of 10 mg/kg
α-Asarone (Table 2). In order to see how long the NREM sleep promoting
effect of 10 mg/kg α-Asarone persists after administration, hourly bin changes
in NREM bout duration and frequency was assessed. For 2 h, the increase in
NREM bout duration and decrease in NREM bout frequency were found to be
significant (Fig. 19). Higher doses, especially 80 and 120 mg/kg, showed
increased W bout duration and decreased NREM and REM sleep bout
duration for 7 h after the administration (Table 2).
0
1
2
3
4
5
0 1 2 3 4 5 6 7
NR
EM
bo
ut
du
rati
on
in
min
Time in h
Vehicle α-As10
0
5
10
15
20
25
30
0 1 2 3 4 5 6 7
NR
EM
bo
ut
fre
qu
en
cy
Time in h
A
B
Fig. 19 Changes in the average duration and frequency of NREM sleep
bouts after administration of 10 mg/kg α-Asarone and vehicle
0
1
2
3
4
5
0 1 2 3 4 5 6 7
Time in h
NR
EM
bo
ut
du
rati
on
in
min
Vehicle α-As10
0
5
10
15
20
25
30
0 1 2 3 4 5 6 7
Time in h
NR
EM
bo
ut
fre
qu
en
cy
Vehicle α-As10A
B
0
1
2
3
4
5
0 1 2 3 4 5 6 7
Time in h
NR
EM
bo
ut
du
rati
on
in
min
Vehicle α-As10
0
5
10
15
20
25
30
0 1 2 3 4 5 6 7
Time in h
NR
EM
bo
ut
fre
qu
en
cy
0
1
2
3
4
5
0 1 2 3 4 5 6 7
Time in h
NR
EM
bo
ut
du
rati
on
in
min
Vehicle α-As10
0
5
10
15
20
25
30
0 1 2 3 4 5 6 7
Time in h
NR
EM
bo
ut
fre
qu
en
cy
0
1
2
3
4
5
0 1 2 3 4 5 6 7
Time in h
NR
EM
bo
ut
du
rati
on
in
min
Vehicle α-As10
0
5
10
15
20
25
30
0 1 2 3 4 5 6 7
Time in h
NR
EM
bo
ut
fre
qu
en
cy
Vehicle α-As10Vehicle α-As10A
B
A
B
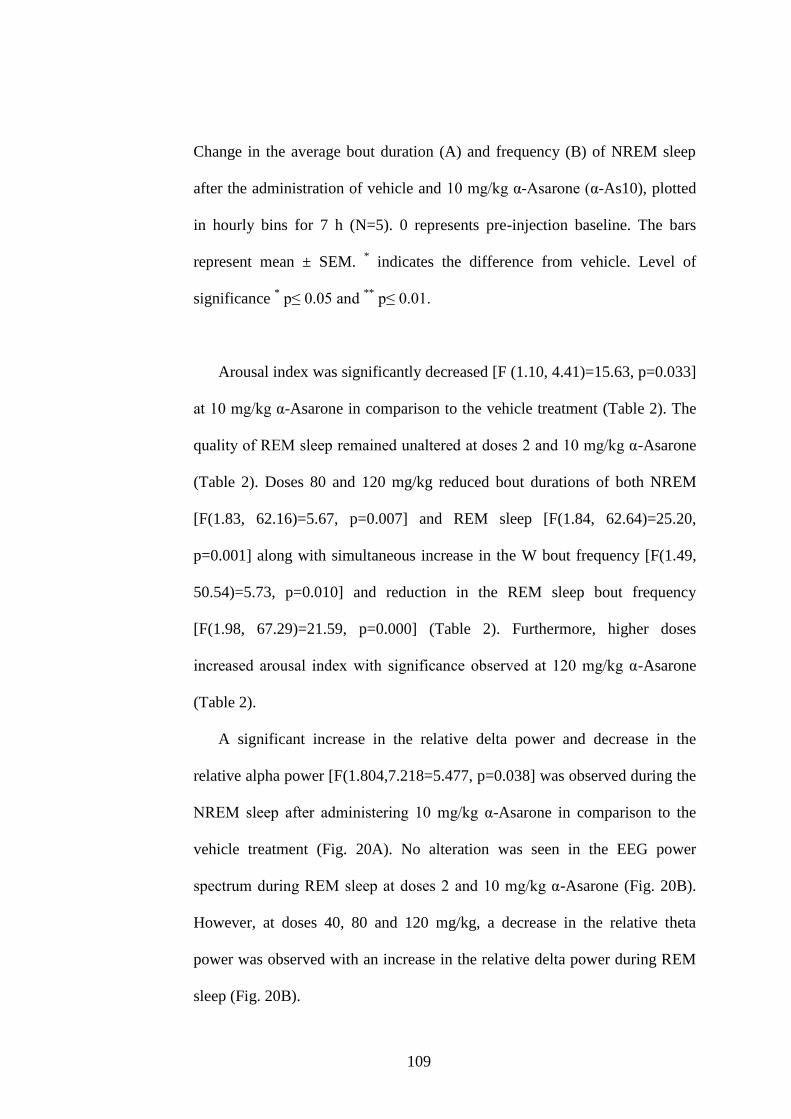
109
Change in the average bout duration (A) and frequency (B) of NREM sleep
after the administration of vehicle and 10 mg/kg α-Asarone (α-As10), plotted
in hourly bins for 7 h (N=5). 0 represents pre-injection baseline. The bars
represent mean ± SEM. * indicates the difference from vehicle. Level of
significance * p≤ 0.05 and
** p≤ 0.01.
Arousal index was significantly decreased [F (1.10, 4.41)=15.63, p=0.033]
at 10 mg/kg α-Asarone in comparison to the vehicle treatment (Table 2). The
quality of REM sleep remained unaltered at doses 2 and 10 mg/kg α-Asarone
(Table 2). Doses 80 and 120 mg/kg reduced bout durations of both NREM
[F(1.83, 62.16)=5.67, p=0.007] and REM sleep [F(1.84, 62.64)=25.20,
p=0.001] along with simultaneous increase in the W bout frequency [F(1.49,
50.54)=5.73, p=0.010] and reduction in the REM sleep bout frequency
[F(1.98, 67.29)=21.59, p=0.000] (Table 2). Furthermore, higher doses
increased arousal index with significance observed at 120 mg/kg α-Asarone
(Table 2).
A significant increase in the relative delta power and decrease in the
relative alpha power [F(1.804,7.218=5.477, p=0.038] was observed during the
NREM sleep after administering 10 mg/kg α-Asarone in comparison to the
vehicle treatment (Fig. 20A). No alteration was seen in the EEG power
spectrum during REM sleep at doses 2 and 10 mg/kg α-Asarone (Fig. 20B).
However, at doses 40, 80 and 120 mg/kg, a decrease in the relative theta
power was observed with an increase in the relative delta power during REM
sleep (Fig. 20B).
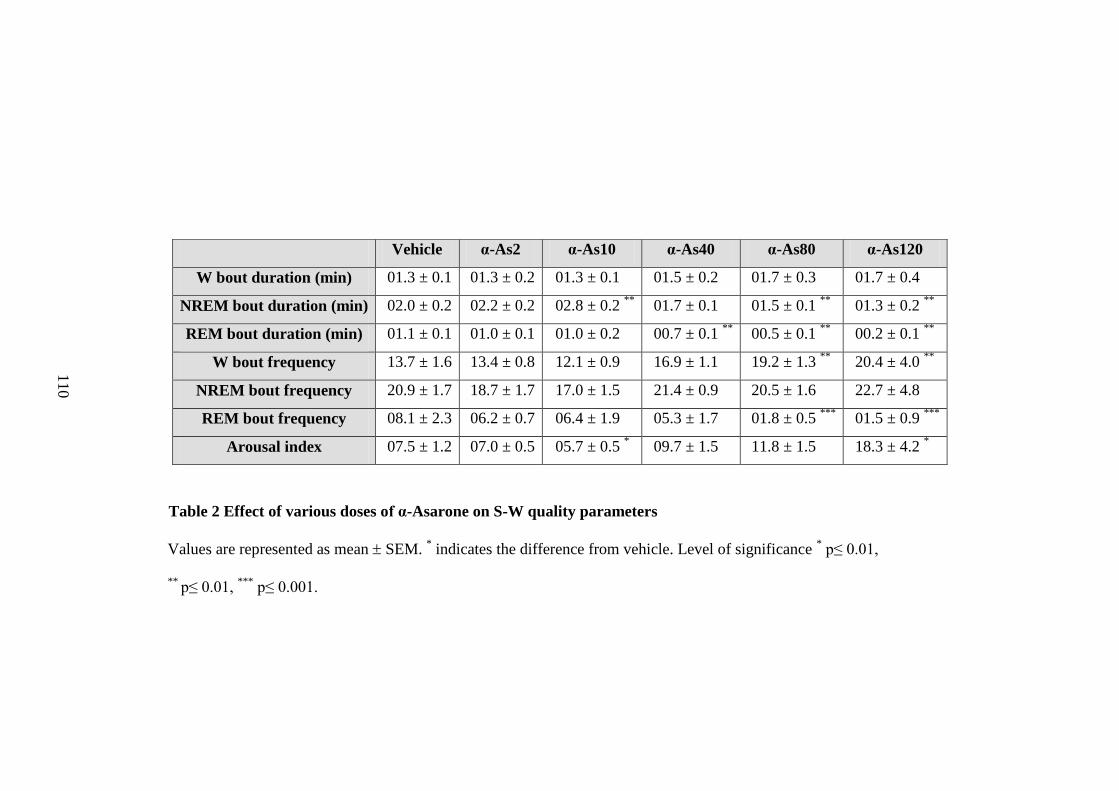
Table 2 Effect of various doses of α-Asarone on S-W quality parameters
Values are represented as mean SEM. * indicates the difference from vehicle. Level of significance
* p≤ 0.01,
** p≤ 0.01,
*** p≤ 0.001.
Vehicle α-As2 α-As10 α-As40 α-As80 α-As120
W bout duration (min) 01.3 ± 0.1 01.3 ± 0.2 01.3 ± 0.1 01.5 ± 0.2 01.7 ± 0.3 01.7 ± 0.4
NREM bout duration (min) 02.0 ± 0.2 02.2 ± 0.2 02.8 ± 0.2 **
01.7 ± 0.1 01.5 ± 0.1 **
01.3 ± 0.2 **
REM bout duration (min) 01.1 ± 0.1 01.0 ± 0.1 01.0 ± 0.2 00.7 ± 0.1 **
00.5 ± 0.1 **
00.2 ± 0.1 **
W bout frequency 13.7 ± 1.6 13.4 ± 0.8 12.1 ± 0.9 16.9 ± 1.1 19.2 ± 1.3 **
20.4 ± 4.0 **
NREM bout frequency 20.9 ± 1.7 18.7 ± 1.7 17.0 ± 1.5 21.4 ± 0.9 20.5 ± 1.6 22.7 ± 4.8
REM bout frequency 08.1 ± 2.3 06.2 ± 0.7 06.4 ± 1.9 05.3 ± 1.7 01.8 ± 0.5 ***
01.5 ± 0.9 ***
Arousal index 07.5 ± 1.2 07.0 ± 0.5 05.7 ± 0.5 * 09.7 ± 1.5 11.8 ± 1.5 18.3 ± 4.2
*
11
0
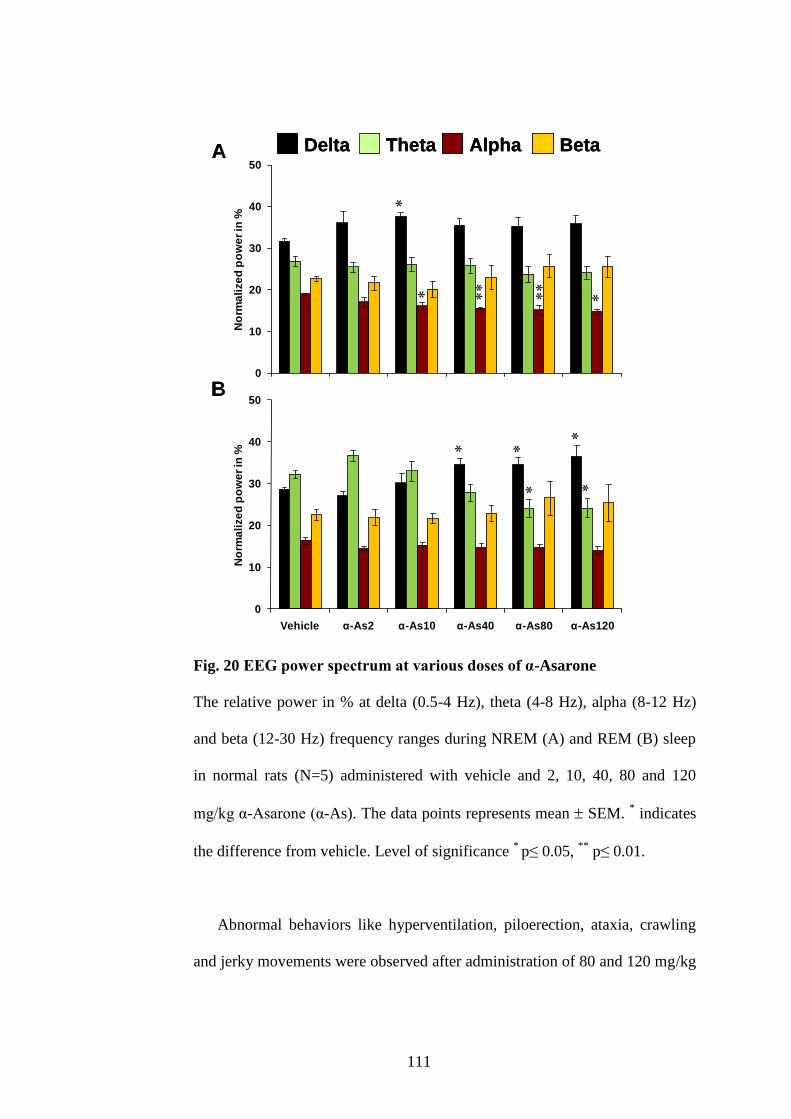
111
Fig. 20 EEG power spectrum at various doses of α-Asarone
The relative power in % at delta (0.5-4 Hz), theta (4-8 Hz), alpha (8-12 Hz)
and beta (12-30 Hz) frequency ranges during NREM (A) and REM (B) sleep
in normal rats (N=5) administered with vehicle and 2, 10, 40, 80 and 120
mg/kg α-Asarone (α-As). The data points represents mean SEM. * indicates
the difference from vehicle. Level of significance * p≤ 0.05,
** p≤ 0.01.
Abnormal behaviors like hyperventilation, piloerection, ataxia, crawling
and jerky movements were observed after administration of 80 and 120 mg/kg
0
10
20
30
40
50
Vehicle α-As2 α-As10 α-As40 α-As80 α-As120
No
rma
lize
d p
ow
er
in %
Delta Theta Alpha Beta
0
10
20
30
40
50
Vehicle α-As2 α-As10 α-As40 α-As80 α-As120
No
rma
lize
d p
ow
er
in %
A
B
Delta Theta Alpha Beta
0
10
20
30
40
50
Vehicle α-As2 α-As10 α-As40 α-As80 α-As120
No
rma
lize
d p
ow
er
in %
Delta Theta Alpha Beta
0
10
20
30
40
50
Vehicle α-As2 α-As10 α-As40 α-As80 α-As120
No
rma
lize
d p
ow
er
in %
A
B
Delta Theta Alpha BetaDelta Theta Alpha Beta
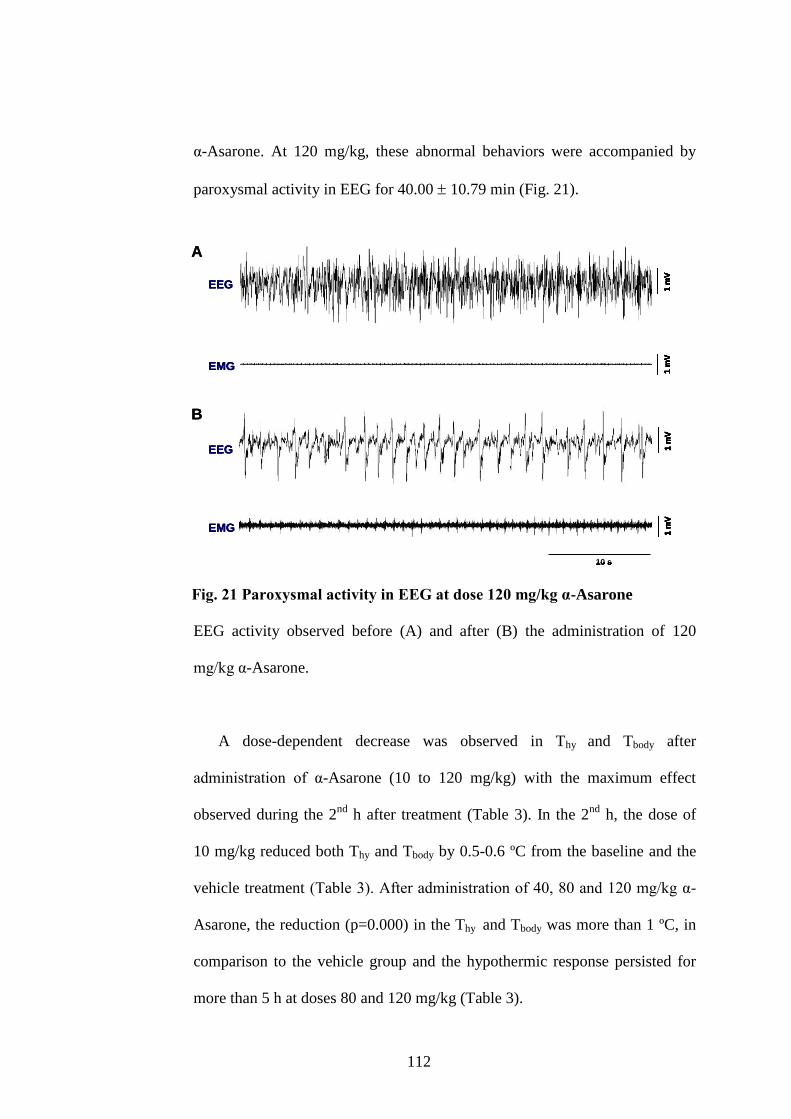
112
α-Asarone. At 120 mg/kg, these abnormal behaviors were accompanied by
paroxysmal activity in EEG for 40.00 10.79 min (Fig. 21).
Fig. 21 Paroxysmal activity in EEG at dose 120 mg/kg α-Asarone
EEG activity observed before (A) and after (B) the administration of 120
mg/kg α-Asarone.
A dose-dependent decrease was observed in Thy and Tbody after
administration of α-Asarone (10 to 120 mg/kg) with the maximum effect
observed during the 2nd
h after treatment (Table 3). In the 2nd
h, the dose of
10 mg/kg reduced both Thy and Tbody by 0.5-0.6 ºC from the baseline and the
vehicle treatment (Table 3). After administration of 40, 80 and 120 mg/kg α-
Asarone, the reduction (p=0.000) in the Thy and Tbody was more than 1 ºC, in
comparison to the vehicle group and the hypothermic response persisted for
more than 5 h at doses 80 and 120 mg/kg (Table 3).
1 m
V1
mV
10 s
1 m
V1
mV
1 m
V1
mV
10 s
1 m
V1
mV
EEG
EMG
EEG
EMG
A
B
1 m
V1
mV
10 s
1 m
V1
mV
1 m
V1
mV
10 s
1 m
V1
mV
EEG
EMG
EEG
EMG
1 m
V1
mV
10 s
1 m
V1
mV
1 m
V1
mV
10 s
1 m
V1
mV
EEG
EMG
EEG
EMG
A
B
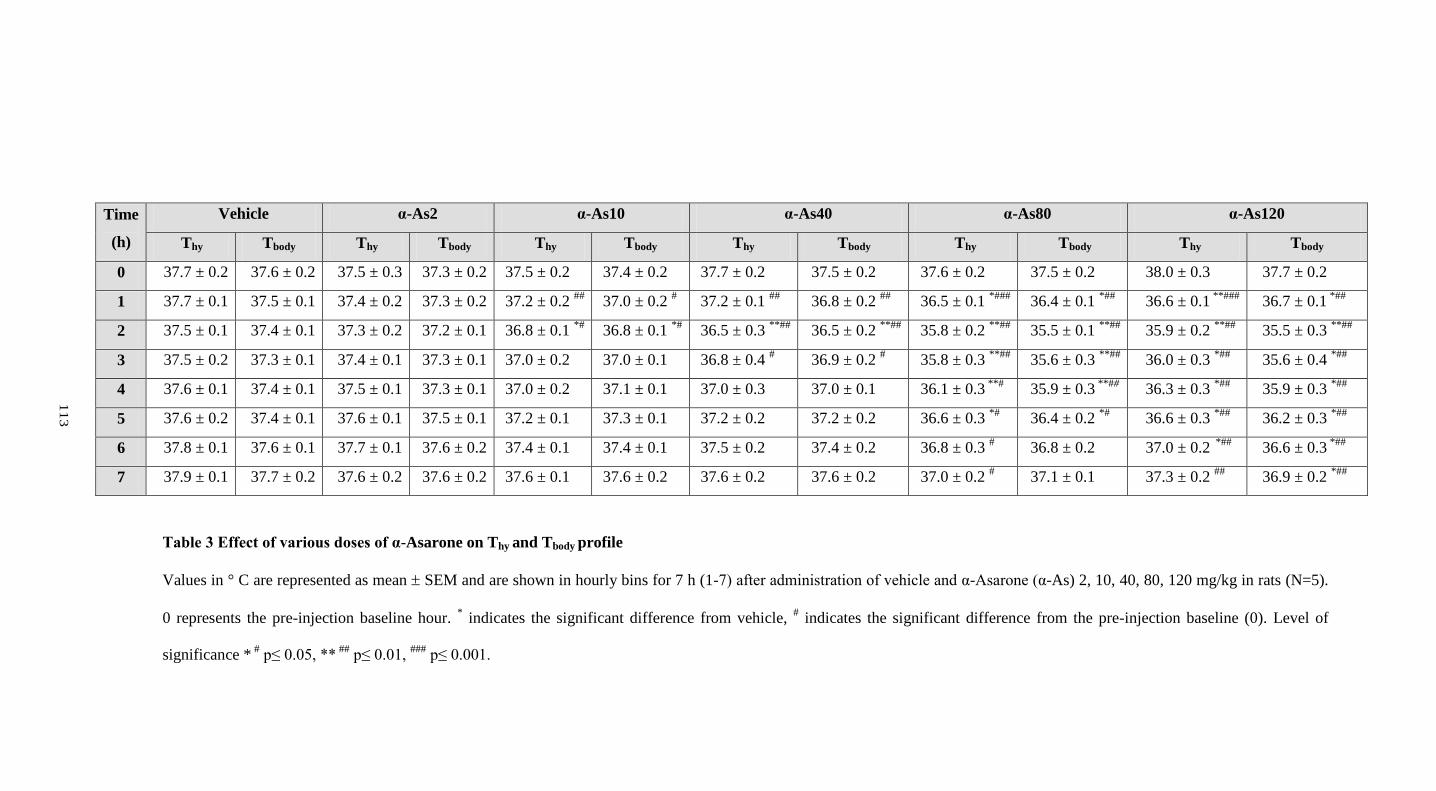
Table 3 Effect of various doses of α-Asarone on Thy and Tbody profile
Values in ° C are represented as mean SEM and are shown in hourly bins for 7 h (1-7) after administration of vehicle and α-Asarone (α-As) 2, 10, 40, 80, 120 mg/kg in rats (N=5).
0 represents the pre-injection baseline hour. * indicates the significant difference from vehicle,
# indicates the significant difference from the pre-injection baseline (0). Level of
significance * #
p≤ 0.05, ** ##
p≤ 0.01, ###
p≤ 0.001.
Time
(h)
Vehicle α-As2 α-As10 α-As40 α-As80 α-As120
Thy Tbody Thy Tbody Thy Tbody Thy Tbody Thy Tbody Thy Tbody
0 37.7 ± 0.2 37.6 ± 0.2 37.5 ± 0.3 37.3 ± 0.2 37.5 ± 0.2 37.4 ± 0.2 37.7 ± 0.2 37.5 ± 0.2 37.6 ± 0.2 37.5 ± 0.2 38.0 ± 0.3 37.7 ± 0.2
1 37.7 ± 0.1 37.5 ± 0.1 37.4 ± 0.2 37.3 ± 0.2 37.2 ± 0.2 ##
37.0 ± 0.2 # 37.2 ± 0.1
## 36.8 ± 0.2
## 36.5 ± 0.1
*### 36.4 ± 0.1
*## 36.6 ± 0.1
**### 36.7 ± 0.1
*##
2 37.5 ± 0.1 37.4 ± 0.1 37.3 ± 0.2 37.2 ± 0.1 36.8 ± 0.1 *#
36.8 ± 0.1 *#
36.5 ± 0.3 **##
36.5 ± 0.2 **##
35.8 ± 0.2 **##
35.5 ± 0.1 **##
35.9 ± 0.2 **##
35.5 ± 0.3 **##
3 37.5 ± 0.2 37.3 ± 0.1 37.4 ± 0.1 37.3 ± 0.1 37.0 ± 0.2 37.0 ± 0.1 36.8 ± 0.4 # 36.9 ± 0.2
# 35.8 ± 0.3
**## 35.6 ± 0.3
**## 36.0 ± 0.3
*## 35.6 ± 0.4
*##
4 37.6 ± 0.1 37.4 ± 0.1 37.5 ± 0.1 37.3 ± 0.1 37.0 ± 0.2 37.1 ± 0.1 37.0 ± 0.3 37.0 ± 0.1 36.1 ± 0.3 **#
35.9 ± 0.3 **##
36.3 ± 0.3 *##
35.9 ± 0.3 *##
5 37.6 ± 0.2 37.4 ± 0.1 37.6 ± 0.1 37.5 ± 0.1 37.2 ± 0.1 37.3 ± 0.1 37.2 ± 0.2 37.2 ± 0.2 36.6 ± 0.3 *#
36.4 ± 0.2 *#
36.6 ± 0.3 *##
36.2 ± 0.3 *##
6 37.8 ± 0.1 37.6 ± 0.1 37.7 ± 0.1 37.6 ± 0.2 37.4 ± 0.1 37.4 ± 0.1 37.5 ± 0.2 37.4 ± 0.2 36.8 ± 0.3 # 36.8 ± 0.2 37.0 ± 0.2
*## 36.6 ± 0.3
*##
7 37.9 ± 0.1 37.7 ± 0.2 37.6 ± 0.2 37.6 ± 0.2 37.6 ± 0.1 37.6 ± 0.2 37.6 ± 0.2 37.6 ± 0.2 37.0 ± 0.2 # 37.1 ± 0.1 37.3 ± 0.2
## 36.9 ± 0.2
*##
11
3
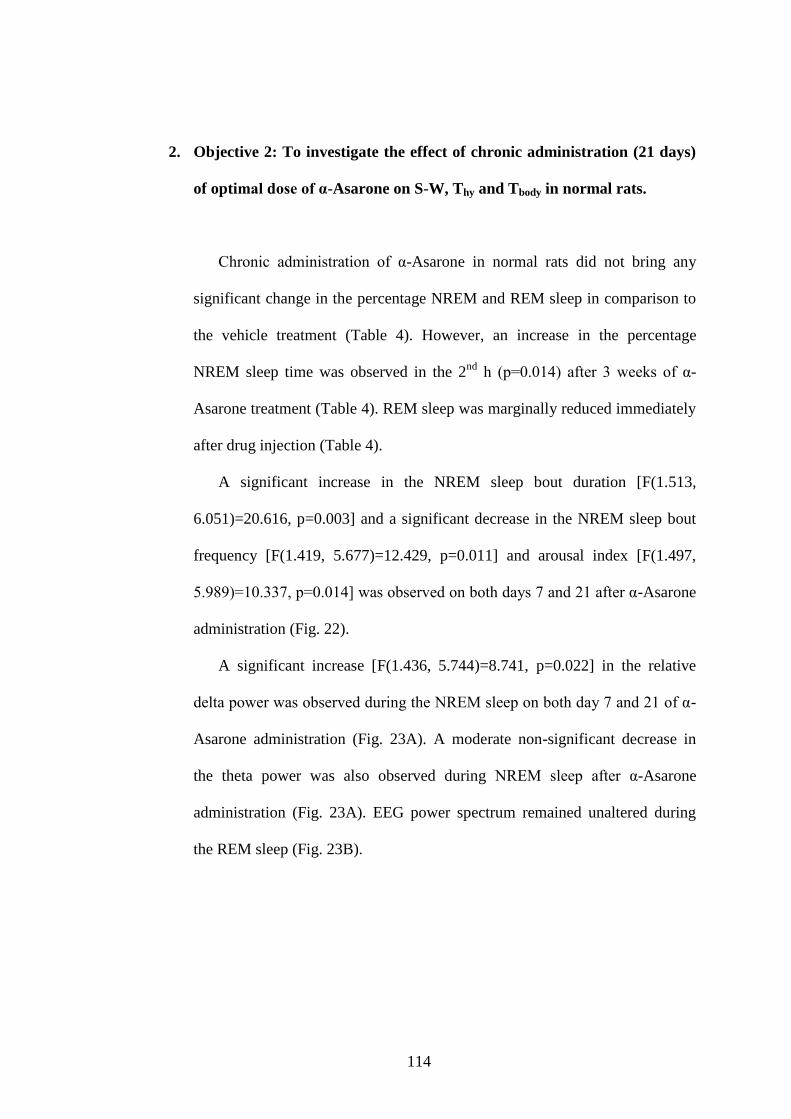
114
2. Objective 2: To investigate the effect of chronic administration (21 days)
of optimal dose of α-Asarone on S-W, Thy and Tbody in normal rats.
Chronic administration of α-Asarone in normal rats did not bring any
significant change in the percentage NREM and REM sleep in comparison to
the vehicle treatment (Table 4). However, an increase in the percentage
NREM sleep time was observed in the 2nd
h (p=0.014) after 3 weeks of α-
Asarone treatment (Table 4). REM sleep was marginally reduced immediately
after drug injection (Table 4).
A significant increase in the NREM sleep bout duration [F(1.513,
6.051)=20.616, p=0.003] and a significant decrease in the NREM sleep bout
frequency [F(1.419, 5.677)=12.429, p=0.011] and arousal index [F(1.497,
5.989)=10.337, p=0.014] was observed on both days 7 and 21 after α-Asarone
administration (Fig. 22).
A significant increase [F(1.436, 5.744)=8.741, p=0.022] in the relative
delta power was observed during the NREM sleep on both day 7 and 21 of α-
Asarone administration (Fig. 23A). A moderate non-significant decrease in
the theta power was also observed during NREM sleep after α-Asarone
administration (Fig. 23A). EEG power spectrum remained unaltered during
the REM sleep (Fig. 23B).
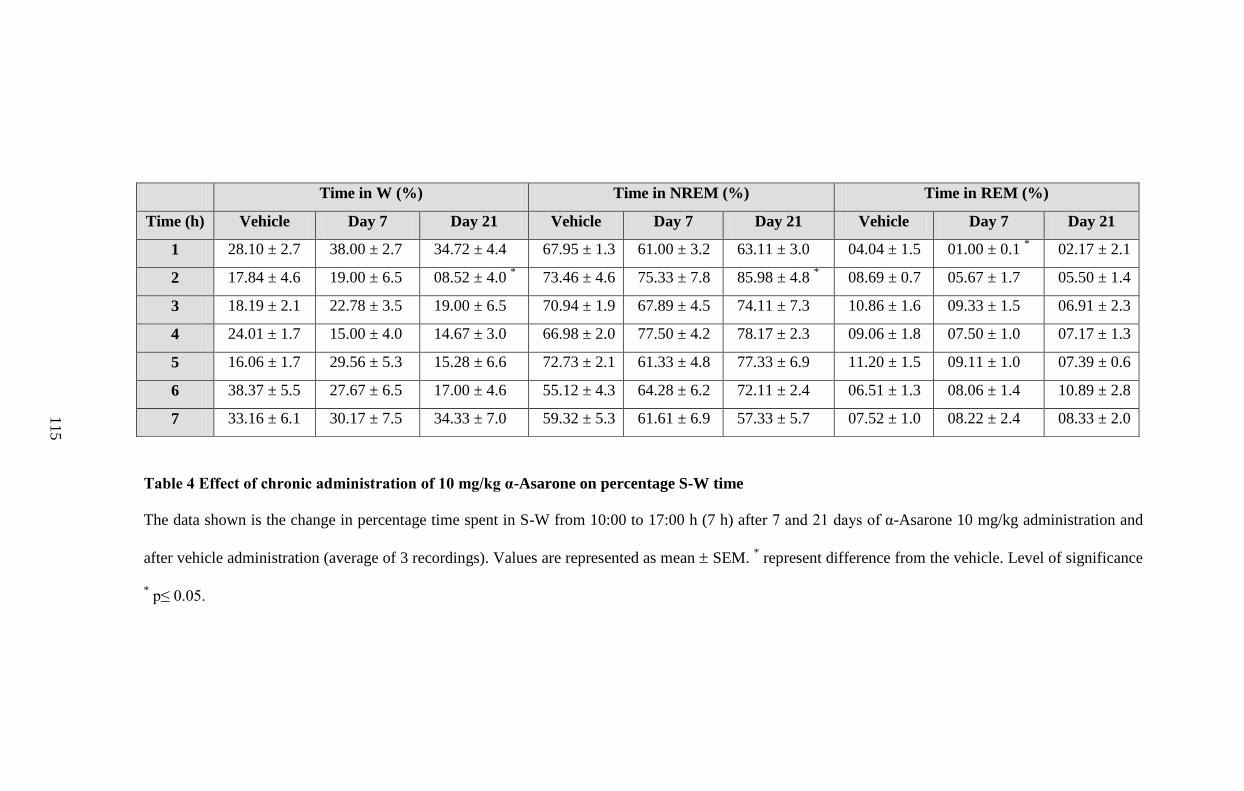
Table 4 Effect of chronic administration of 10 mg/kg α-Asarone on percentage S-W time
The data shown is the change in percentage time spent in S-W from 10:00 to 17:00 h (7 h) after 7 and 21 days of α-Asarone 10 mg/kg administration and
after vehicle administration (average of 3 recordings). Values are represented as mean SEM. * represent difference from the vehicle. Level of significance
* p≤ 0.05.
Time in W (%) Time in NREM (%) Time in REM (%)
Time (h) Vehicle Day 7 Day 21 Vehicle Day 7 Day 21 Vehicle Day 7 Day 21
1 28.10 ± 2.7 38.00 ± 2.7 34.72 ± 4.4 67.95 ± 1.3 61.00 ± 3.2 63.11 ± 3.0 04.04 ± 1.5 01.00 ± 0.1 * 02.17 ± 2.1
2 17.84 ± 4.6 19.00 ± 6.5 08.52 ± 4.0 * 73.46 ± 4.6 75.33 ± 7.8 85.98 ± 4.8
* 08.69 ± 0.7 05.67 ± 1.7 05.50 ± 1.4
3 18.19 ± 2.1 22.78 ± 3.5 19.00 ± 6.5 70.94 ± 1.9 67.89 ± 4.5 74.11 ± 7.3 10.86 ± 1.6 09.33 ± 1.5 06.91 ± 2.3
4 24.01 ± 1.7 15.00 ± 4.0 14.67 ± 3.0 66.98 ± 2.0 77.50 ± 4.2 78.17 ± 2.3 09.06 ± 1.8 07.50 ± 1.0 07.17 ± 1.3
5 16.06 ± 1.7 29.56 ± 5.3 15.28 ± 6.6 72.73 ± 2.1 61.33 ± 4.8 77.33 ± 6.9 11.20 ± 1.5 09.11 ± 1.0 07.39 ± 0.6
6 38.37 ± 5.5 27.67 ± 6.5 17.00 ± 4.6 55.12 ± 4.3 64.28 ± 6.2 72.11 ± 2.4 06.51 ± 1.3 08.06 ± 1.4 10.89 ± 2.8
7 33.16 ± 6.1 30.17 ± 7.5 34.33 ± 7.0 59.32 ± 5.3 61.61 ± 6.9 57.33 ± 5.7 07.52 ± 1.0 08.22 ± 2.4 08.33 ± 2.0 11
5
116
Fig. 22 Effect of chronic administration of 10 mg/kg α-Asarone on S-W
quality parameters
Average NREM sleep bout duration in min (A), average NREM sleep bout
frequency (B) and arousal index (C) in normal rats (N=5) administered with
10 mg/kg α-Asarone on days 7 and 21. The bars represents mean SEM. *
indicates the difference from the vehicle group. Level of significance * p≤ 0.05
and **
p≤ 0.01.
0
1
2
3
4
5
Vehicle Day 7 Day 21
NR
EM
bo
ut
du
rati
on
in m
in
0
5
10
15
20
Vehicle Day 7 Day 21
NR
EM
bo
ut
fre
qu
en
cy
0
2
4
6
8
10
12
Vehicle Day 7 Day 21
Aro
us
al i
nd
ex
A
B
C
0
1
2
3
4
5
Vehicle Day 7 Day 21
NR
EM
bo
ut
du
rati
on
in m
in
0
5
10
15
20
Vehicle Day 7 Day 21
NR
EM
bo
ut
fre
qu
en
cy
0
2
4
6
8
10
12
Vehicle Day 7 Day 21
Aro
us
al i
nd
ex
A
B
C
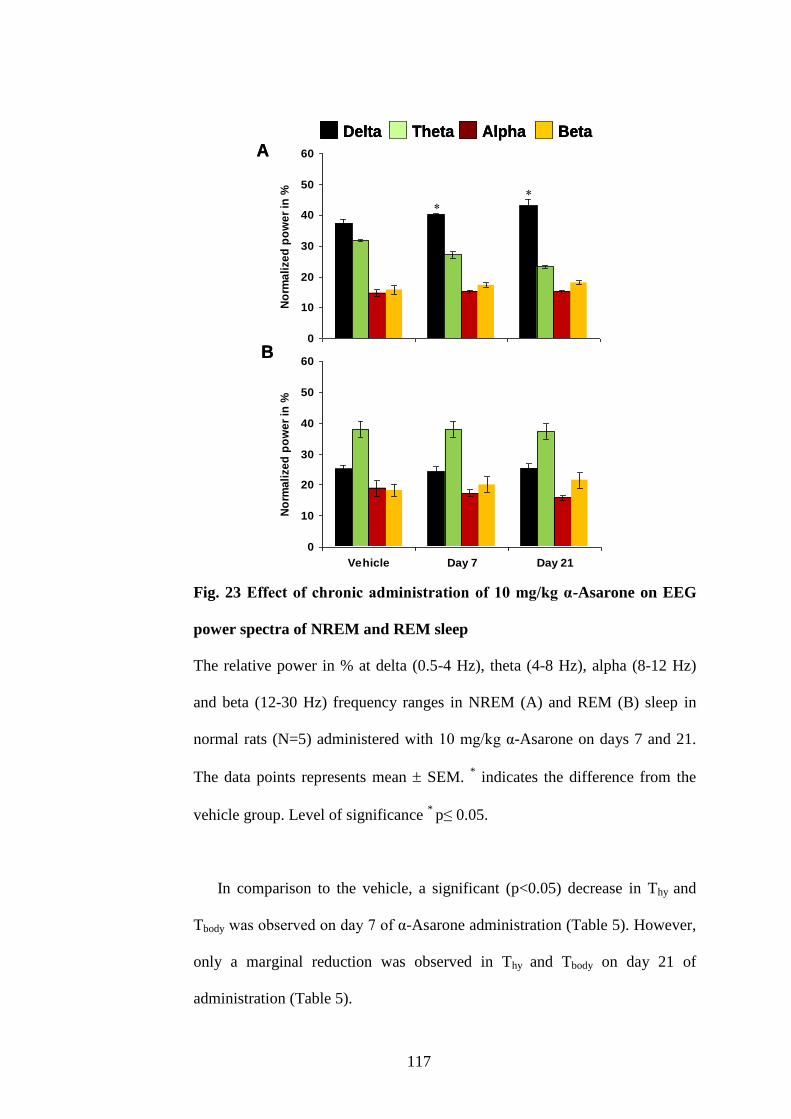
117
Fig. 23 Effect of chronic administration of 10 mg/kg α-Asarone on EEG
power spectra of NREM and REM sleep
The relative power in % at delta (0.5-4 Hz), theta (4-8 Hz), alpha (8-12 Hz)
and beta (12-30 Hz) frequency ranges in NREM (A) and REM (B) sleep in
normal rats (N=5) administered with 10 mg/kg α-Asarone on days 7 and 21.
The data points represents mean SEM. * indicates the difference from the
vehicle group. Level of significance * p≤ 0.05.
In comparison to the vehicle, a significant (p<0.05) decrease in Thy and
Tbody was observed on day 7 of α-Asarone administration (Table 5). However,
only a marginal reduction was observed in Thy and Tbody on day 21 of
administration (Table 5).
0
10
20
30
40
50
60
Vehicle Day 7 Day 21
No
rma
lize
d p
ow
er
in %
Delta Theta Alpha Beta
0
10
20
30
40
50
60
Vehicle Day 7 Day 21
No
rma
lize
d p
ow
er
in %
A
B
Delta Theta Alpha Beta
0
10
20
30
40
50
60
Vehicle Day 7 Day 21
No
rma
lize
d p
ow
er
in %
Delta Theta Alpha Beta
0
10
20
30
40
50
60
Vehicle Day 7 Day 21
No
rma
lize
d p
ow
er
in %
A
B
Delta Theta Alpha BetaDelta Theta Alpha Beta
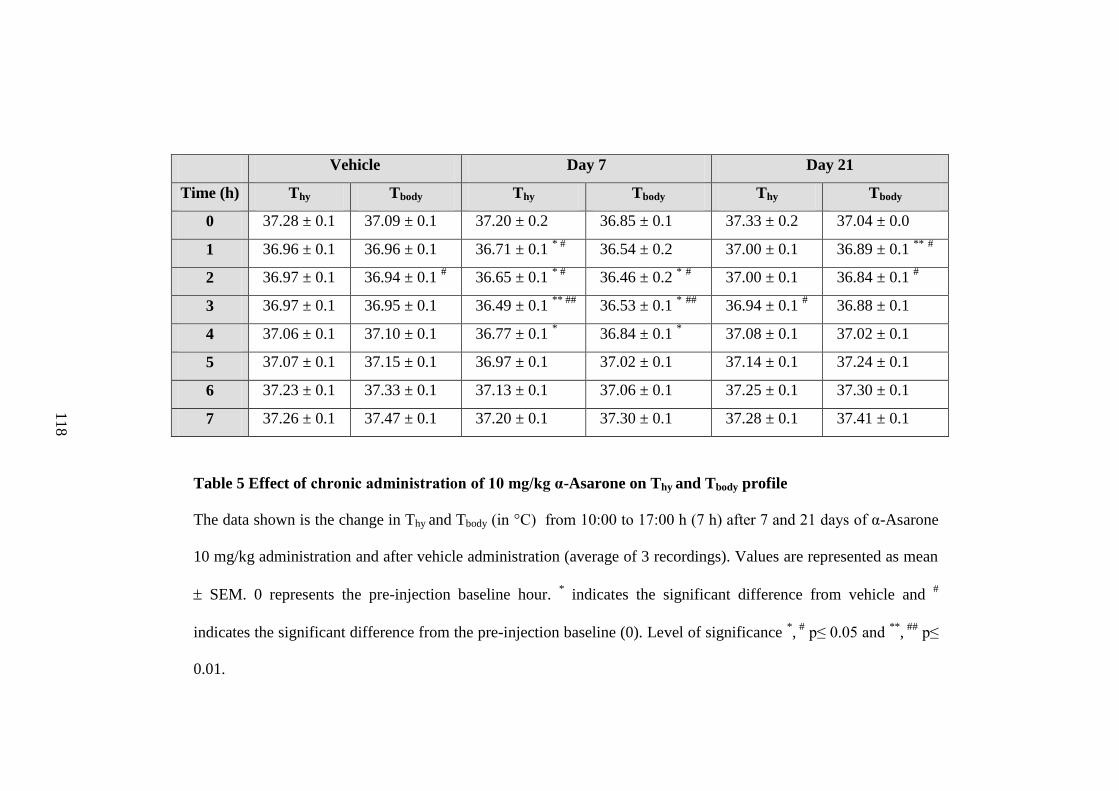
Table 5 Effect of chronic administration of 10 mg/kg α-Asarone on Thy and Tbody profile
The data shown is the change in Thy and Tbody (in °C) from 10:00 to 17:00 h (7 h) after 7 and 21 days of α-Asarone
10 mg/kg administration and after vehicle administration (average of 3 recordings). Values are represented as mean
SEM. 0 represents the pre-injection baseline hour. * indicates the significant difference from vehicle and
#
indicates the significant difference from the pre-injection baseline (0). Level of significance *, #
p≤ 0.05 and **
, ##
p≤
0.01.
Vehicle Day 7 Day 21
Time (h) Thy Tbody Thy Tbody Thy Tbody
0 37.28 ± 0.1 37.09 ± 0.1 37.20 ± 0.2 36.85 ± 0.1 37.33 ± 0.2 37.04 ± 0.0
1 36.96 ± 0.1 36.96 ± 0.1 36.71 ± 0.1 * #
36.54 ± 0.2 37.00 ± 0.1 36.89 ± 0.1 **
#
2 36.97 ± 0.1 36.94 ± 0.1 # 36.65 ± 0.1
* # 36.46 ± 0.2
* # 37.00 ± 0.1 36.84 ± 0.1
#
3 36.97 ± 0.1 36.95 ± 0.1 36.49 ± 0.1 ** ##
36.53 ± 0.1 * ##
36.94 ± 0.1 # 36.88 ± 0.1
4 37.06 ± 0.1 37.10 ± 0.1 36.77 ± 0.1 * 36.84 ± 0.1
* 37.08 ± 0.1 37.02 ± 0.1
5 37.07 ± 0.1 37.15 ± 0.1 36.97 ± 0.1 37.02 ± 0.1 37.14 ± 0.1 37.24 ± 0.1
6 37.23 ± 0.1 37.33 ± 0.1 37.13 ± 0.1 37.06 ± 0.1 37.25 ± 0.1 37.30 ± 0.1
7 37.26 ± 0.1 37.47 ± 0.1 37.20 ± 0.1 37.30 ± 0.1 37.28 ± 0.1 37.41 ± 0.1
11
8
119
3. Objective 3.1: To investigate the effect of optimal dose of α-Asarone on
S-W, Thy and Tbody in rats acutely sleep deprived by gentle handling (5 h/
5 days)
SD by gentle handling for 5 h reduced sleep by 96-97 %. A significant
reduction in the latency to sleep (p= 0.045) was observed in the α-Asarone
group (0.4 0.0 min) in comparison to the vehicle (3.5 1.3 min) and the
midazolam (3.4 1.5 min) group by day 5 of SD. Rebound NREM sleep
observed during the 3 h recovery period after SD was similar
[F(2,24)=26.658, p=0.000] in all three groups (Table 6). However, in the
midazolam group, REM sleep was marginally reduced [F(2,12)=3.693,
p=0.05] after SD (Table 6).
α-Asarone significantly increased the NREM sleep bout duration
[F(2,12)=21.809, p=0.000] simultaneously with a decrease in NREM sleep
bout frequency [F(2,12)=7.314, p=0.000] in SD rats (Fig. 24A & B). Quality
of REM sleep was unaltered after α-Asarone administration. Furthermore a
decrease in the arousal index during the recovery period [F(2,12)=15.427,
p=0.000] was observed in the α-Asarone-treated SD group in comparison to
both vehicle and midazolam group (Fig. 24C).
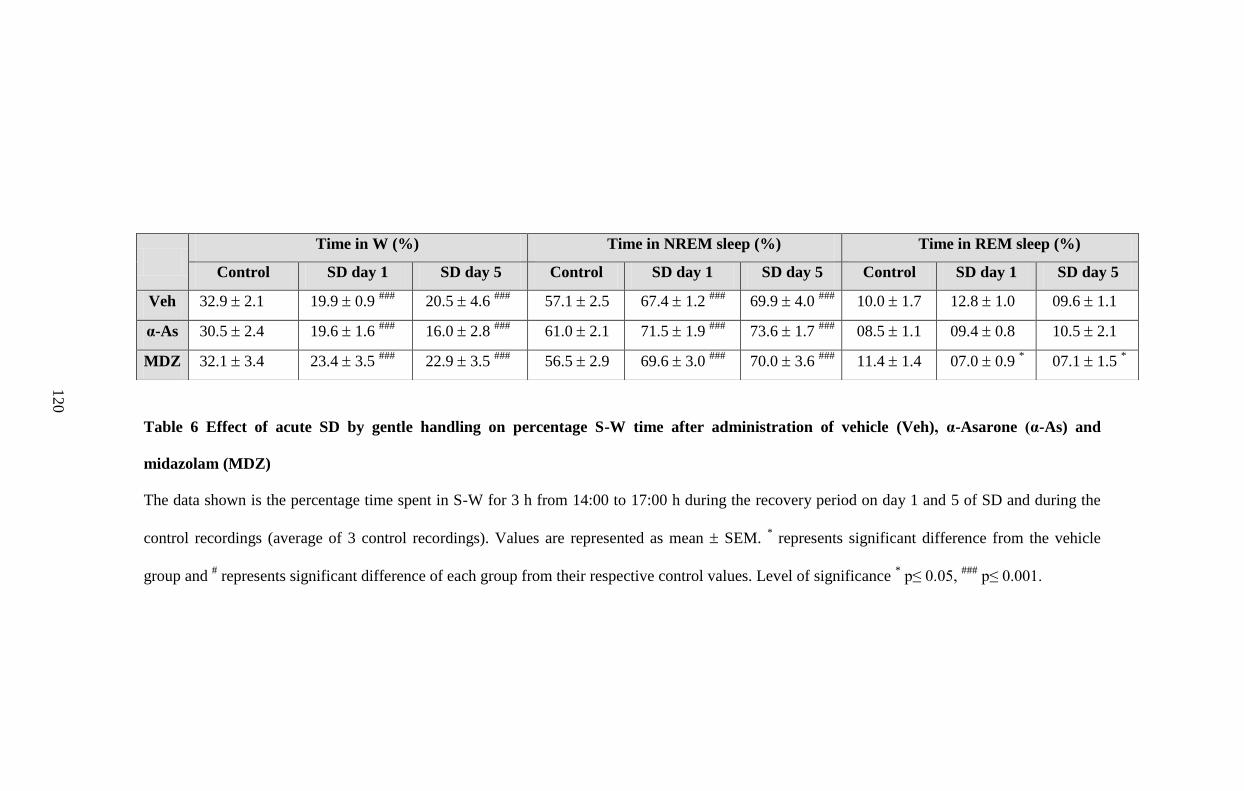
Table 6 Effect of acute SD by gentle handling on percentage S-W time after administration of vehicle (Veh), α-Asarone (α-As) and
midazolam (MDZ)
The data shown is the percentage time spent in S-W for 3 h from 14:00 to 17:00 h during the recovery period on day 1 and 5 of SD and during the
control recordings (average of 3 control recordings). Values are represented as mean SEM. * represents significant difference from the vehicle
group and # represents significant difference of each group from their respective control values. Level of significance
* p≤ 0.05,
### p≤ 0.001.
Time in W (%) Time in NREM sleep (%) Time in REM sleep (%)
Control SD day 1 SD day 5 Control SD day 1 SD day 5 Control SD day 1 SD day 5
Veh 32.9 2.1 19.9 0.9 ###
20.5 4.6 ###
57.1 2.5 67.4 1.2 ###
69.9 4.0 ###
10.0 1.7 12.8 1.0 09.6 1.1
α-As 30.5 2.4 19.6 1.6 ###
16.0 2.8 ###
61.0 2.1 71.5 1.9 ###
73.6 1.7 ###
08.5 1.1 09.4 0.8 10.5 2.1
MDZ 32.1 3.4 23.4 3.5 ###
22.9 3.5 ###
56.5 2.9 69.6 3.0 ###
70.0 3.6 ###
11.4 1.4 07.0 0.9 * 07.1 1.5
*
12
0
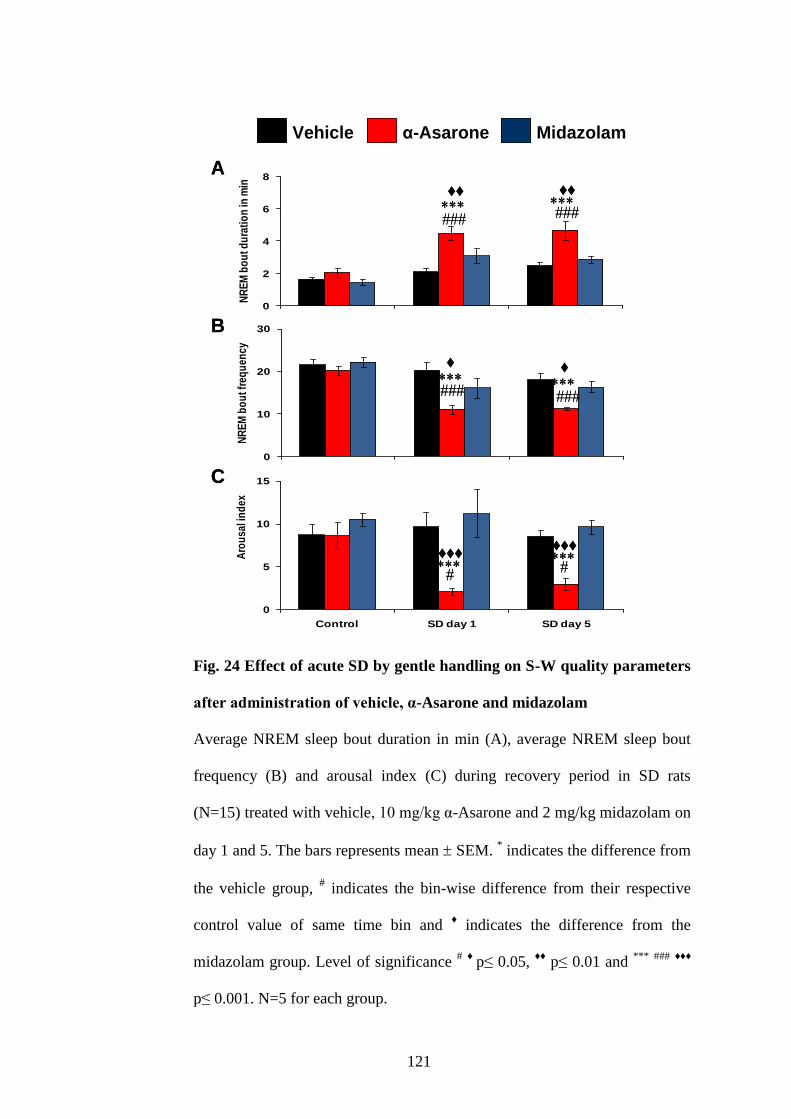
121
Fig. 24 Effect of acute SD by gentle handling on S-W quality parameters
after administration of vehicle, α-Asarone and midazolam
Average NREM sleep bout duration in min (A), average NREM sleep bout
frequency (B) and arousal index (C) during recovery period in SD rats
(N=15) treated with vehicle, 10 mg/kg α-Asarone and 2 mg/kg midazolam on
day 1 and 5. The bars represents mean SEM. * indicates the difference from
the vehicle group, # indicates the bin-wise difference from their respective
control value of same time bin and ♦ indicates the difference from the
midazolam group. Level of significance # ♦
p≤ 0.05, ♦♦
p≤ 0.01 and ***
###
♦♦♦
p≤ 0.001. N=5 for each group.
0
2
4
6
8
Control SD day 1 SD day 5
NR
EM
bo
ut d
ura
tio
n in
min Vehicle α-Asarone Midazolam
0
10
20
30
Control SD d1 SD d5
NR
EM
bo
ut f
req
uen
cy
0
5
10
15
Control SD day 1 SD day 5
Aro
usa
l in
dex
♦
♦
♦♦♦
A
B
C
♦♦♦
♦♦
♦♦
Midazolamα-AsaroneVehicle
0
2
4
6
8
Control SD day 1 SD day 5
NR
EM
bo
ut d
ura
tio
n in
min Vehicle α-Asarone Midazolam
0
10
20
30
Control SD d1 SD d5
NR
EM
bo
ut f
req
uen
cy
0
5
10
15
Control SD day 1 SD day 5
Aro
usa
l in
dex
♦
♦
♦
♦
♦♦♦
♦♦♦
A
B
C
♦♦♦
♦♦♦
♦♦
♦♦
♦♦
♦♦
Midazolamα-AsaroneVehicle Midazolamα-AsaroneVehicle α-AsaroneVehicle
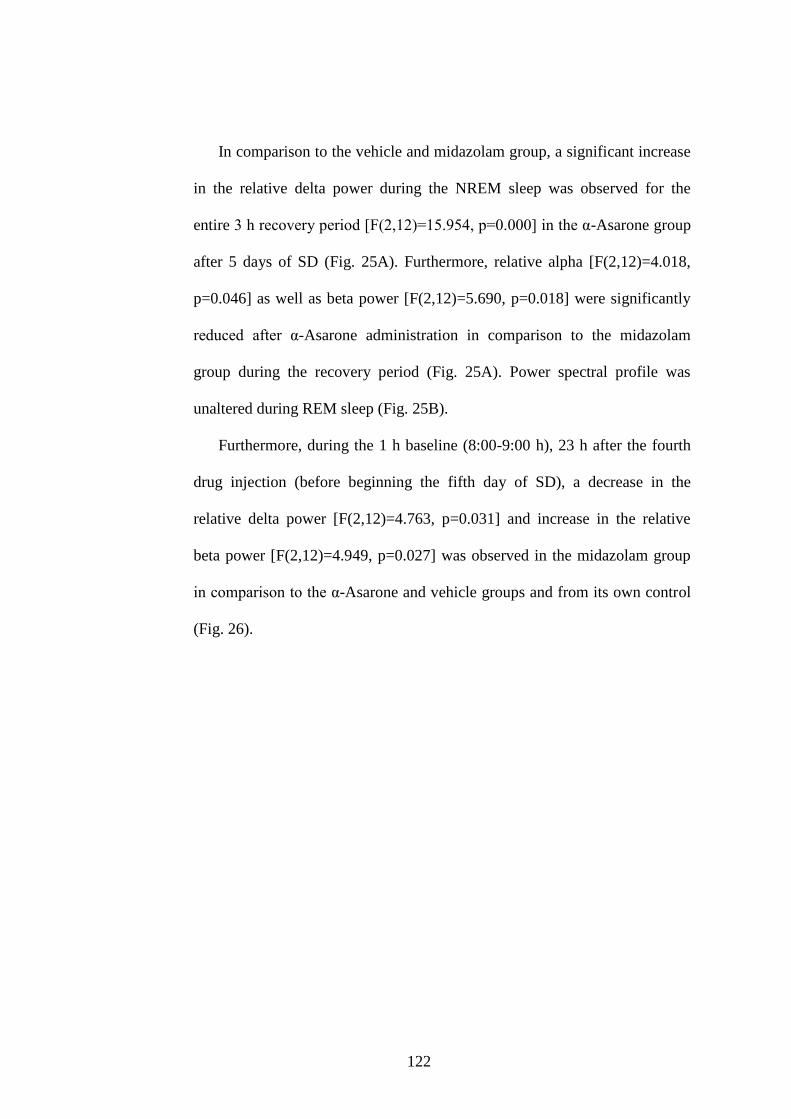
122
In comparison to the vehicle and midazolam group, a significant increase
in the relative delta power during the NREM sleep was observed for the
entire 3 h recovery period [F(2,12)=15.954, p=0.000] in the α-Asarone group
after 5 days of SD (Fig. 25A). Furthermore, relative alpha [F(2,12)=4.018,
p=0.046] as well as beta power [F(2,12)=5.690, p=0.018] were significantly
reduced after α-Asarone administration in comparison to the midazolam
group during the recovery period (Fig. 25A). Power spectral profile was
unaltered during REM sleep (Fig. 25B).
Furthermore, during the 1 h baseline (8:00-9:00 h), 23 h after the fourth
drug injection (before beginning the fifth day of SD), a decrease in the
relative delta power [F(2,12)=4.763, p=0.031] and increase in the relative
beta power [F(2,12)=4.949, p=0.027] was observed in the midazolam group
in comparison to the α-Asarone and vehicle groups and from its own control
(Fig. 26).
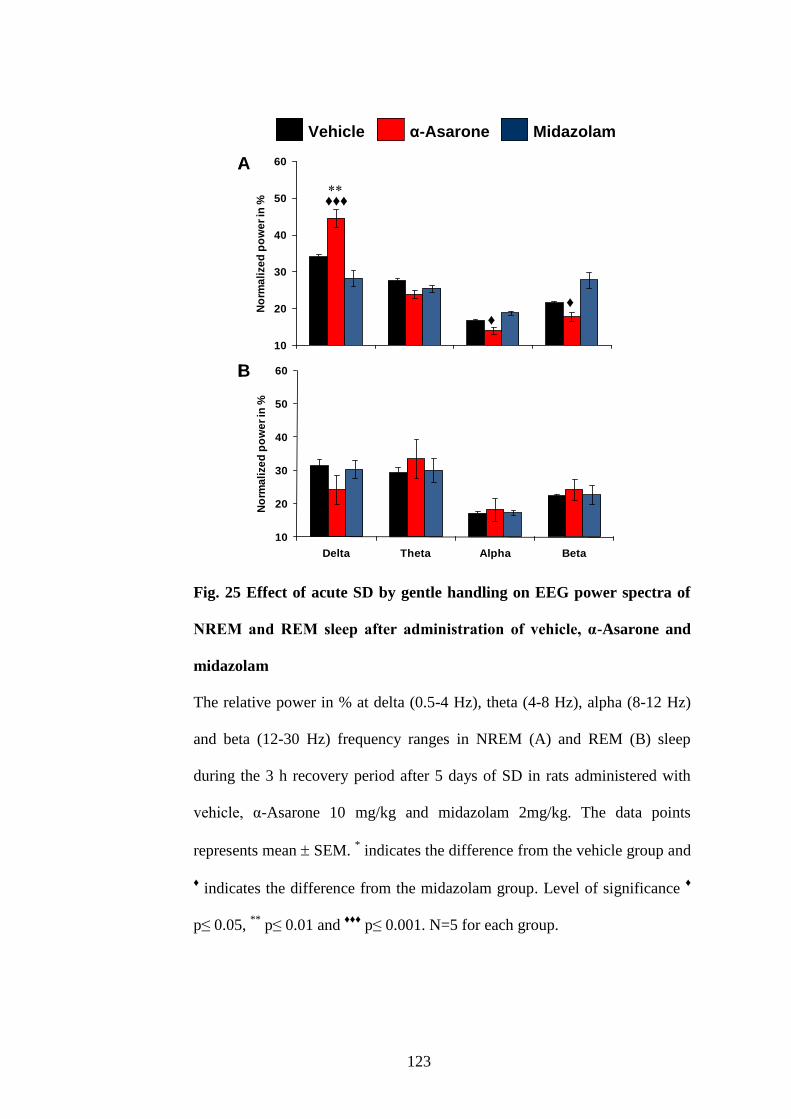
123
Fig. 25 Effect of acute SD by gentle handling on EEG power spectra of
NREM and REM sleep after administration of vehicle, α-Asarone and
midazolam
The relative power in % at delta (0.5-4 Hz), theta (4-8 Hz), alpha (8-12 Hz)
and beta (12-30 Hz) frequency ranges in NREM (A) and REM (B) sleep
during the 3 h recovery period after 5 days of SD in rats administered with
vehicle, α-Asarone 10 mg/kg and midazolam 2mg/kg. The data points
represents mean SEM. * indicates the difference from the vehicle group and
♦ indicates the difference from the midazolam group. Level of significance
♦
p≤ 0.05, **
p≤ 0.01 and ♦♦♦
p≤ 0.001. N=5 for each group.
10
20
30
40
50
60
Delta Theta Alpha Beta
No
rma
lize
d p
ow
er
in %
Vehicle α-Asarone Midazolam
10
20
30
40
50
60
Delta Theta Alpha Beta
No
rma
lize
d p
ow
er
in %
♦
♦
♦♦♦
A
B
Midazolamα-AsaroneVehicle
10
20
30
40
50
60
Delta Theta Alpha Beta
No
rma
lize
d p
ow
er
in %
Vehicle α-Asarone Midazolam
10
20
30
40
50
60
Delta Theta Alpha Beta
No
rma
lize
d p
ow
er
in %
♦
♦
♦♦♦
A
B
Midazolamα-AsaroneVehicle Midazolamα-AsaroneVehicle α-AsaroneVehicle
124
Fig. 26 EEG power spectra of NREM sleep after 23 h of fourth injection
of vehicle, α-Asarone and midazolam: Withdrawal effect
The relative power in % at delta (0.5-4 Hz), theta (4-8 Hz), alpha (8-12 Hz)
and beta (12-30 Hz) frequency ranges in NREM sleep during the 1 h (8:00-
9:00 h) after 23 h of fourth injection of vehicle, α-Asarone 10 mg/kg and
midazolam 2mg/kg. The data points represents mean SEM. * indicates the
difference from the vehicle group, # indicates the difference from their
respective control value and ♦ indicates the difference from the midazolam
group. Level of significance * # ♦
p≤ 0.05. N=5 for each group.
Thy and Tbody during SD on day 1 and 5 was consistently higher (p=0.000)
in all the three groups in comparison to control (Fig. 27). However, after SD,
during the recovery period, the Thy was lower (p=0.011) in α-Asarone and
midazolam groups. Tbody, on the other hand, still remained higher in the
midazolam group during the recovery period (Fig. 27). Also, Tbody was
significantly higher (p<0.01) than Thy in the midazolam-treated SD group
during the recovery period on day 1 and 5 (Fig. 27).
10
20
30
40
50
60
Delta Theta Alpha Beta
No
rma
lize
d p
ow
er
in %
Vehicle α-Asarone Midazolam
♦
♦
Midazolamα-AsaroneVehicle
10
20
30
40
50
60
Delta Theta Alpha Beta
No
rma
lize
d p
ow
er
in %
Vehicle α-Asarone Midazolam
♦
♦
10
20
30
40
50
60
Delta Theta Alpha Beta
No
rma
lize
d p
ow
er
in %
Vehicle α-Asarone Midazolam
♦
♦
10
20
30
40
50
60
Delta Theta Alpha Beta
No
rma
lize
d p
ow
er
in %
Vehicle α-Asarone Midazolam
♦
♦
Midazolamα-AsaroneVehicle Midazolamα-AsaroneVehicle
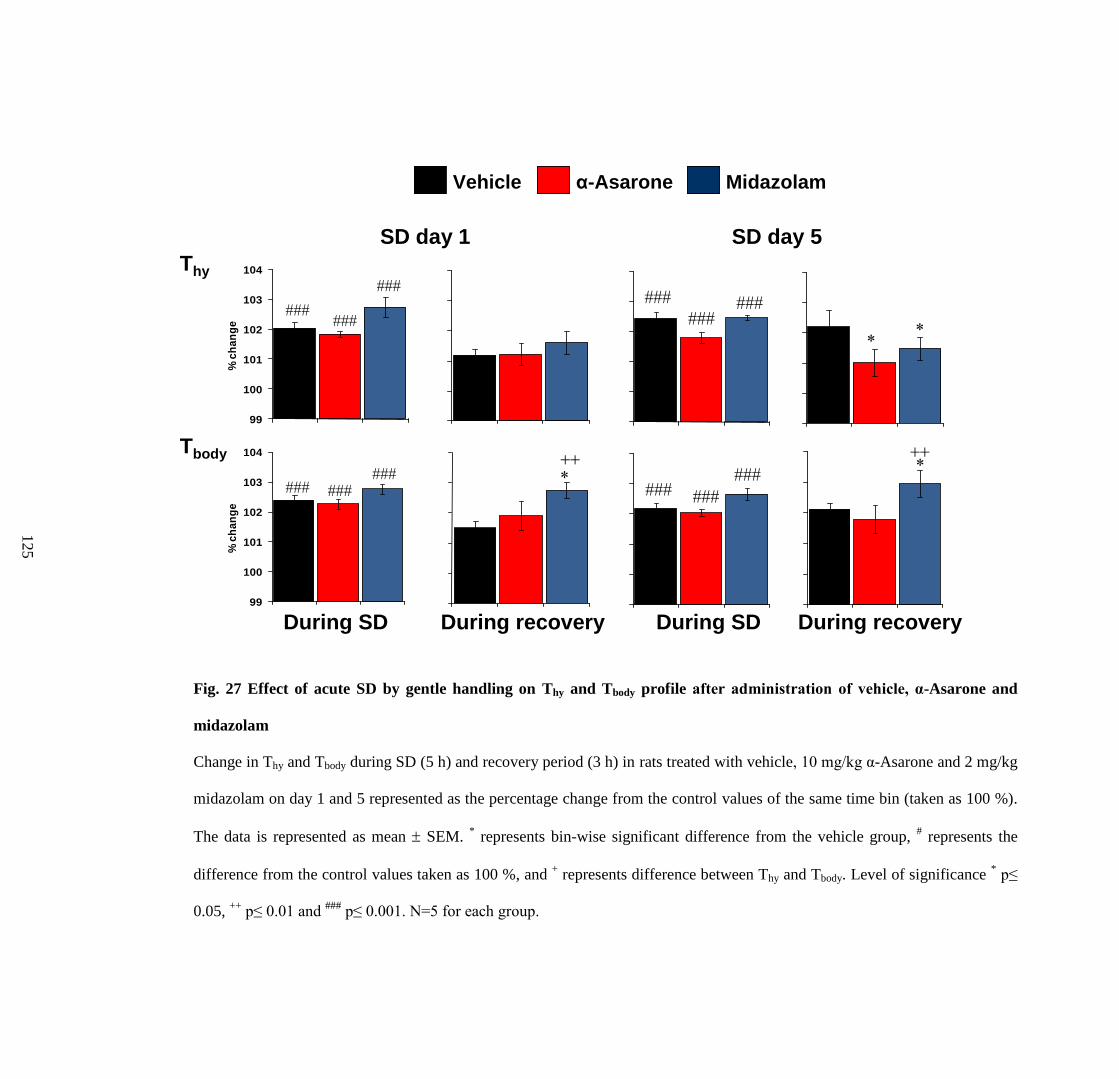
Fig. 27 Effect of acute SD by gentle handling on Thy and Tbody profile after administration of vehicle, α-Asarone and
midazolam
Change in Thy and Tbody during SD (5 h) and recovery period (3 h) in rats treated with vehicle, 10 mg/kg α-Asarone and 2 mg/kg
midazolam on day 1 and 5 represented as the percentage change from the control values of the same time bin (taken as 100 %).
The data is represented as mean SEM. * represents bin-wise significant difference from the vehicle group,
# represents the
difference from the control values taken as 100 %, and + represents difference between Thy and Tbody. Level of significance
* p≤
0.05, ++
p≤ 0.01 and ###
p≤ 0.001. N=5 for each group.
99
100
101
102
103
104
Te
mp
era
ture
in
'C
99
100
101
102
103
104
Te
mp
era
ture
in 'C
99
100
101
102
103
104
Te
mp
era
ture
in 'C
99
100
101
102
103
104
Te
mp
era
ture
in
'C99
100
101
102
103
104
% c
ha
ng
e
99
100
101
102
103
104
Te
mp
era
ture
in 'C
99
100
101
102
103
104
Te
mp
era
ture
in
'C
99
100
101
102
103
104
% c
ha
ng
e
During SD During SD During recoveryDuring recovery
Tbody
Thy
SD day 1 SD day 5
Midazolamα-AsaroneVehicle
99
100
101
102
103
104
Te
mp
era
ture
in
'C
99
100
101
102
103
104
Te
mp
era
ture
in 'C
99
100
101
102
103
104
Te
mp
era
ture
in 'C
99
100
101
102
103
104
Te
mp
era
ture
in
'C99
100
101
102
103
104
% c
ha
ng
e
99
100
101
102
103
104
Te
mp
era
ture
in 'C
99
100
101
102
103
104
Te
mp
era
ture
in
'C
99
100
101
102
103
104
% c
ha
ng
e
99
100
101
102
103
104
Te
mp
era
ture
in
'C
99
100
101
102
103
104
Te
mp
era
ture
in 'C
99
100
101
102
103
104
Te
mp
era
ture
in 'C
99
100
101
102
103
104
Te
mp
era
ture
in
'C99
100
101
102
103
104
% c
ha
ng
e
99
100
101
102
103
104
Te
mp
era
ture
in 'C
99
100
101
102
103
104
Te
mp
era
ture
in
'C
99
100
101
102
103
104
% c
ha
ng
e
During SD During SD During recoveryDuring recovery
Tbody
Thy
SD day 1 SD day 5
Midazolamα-AsaroneVehicle Midazolamα-AsaroneVehicle α-AsaroneVehicle
12
5
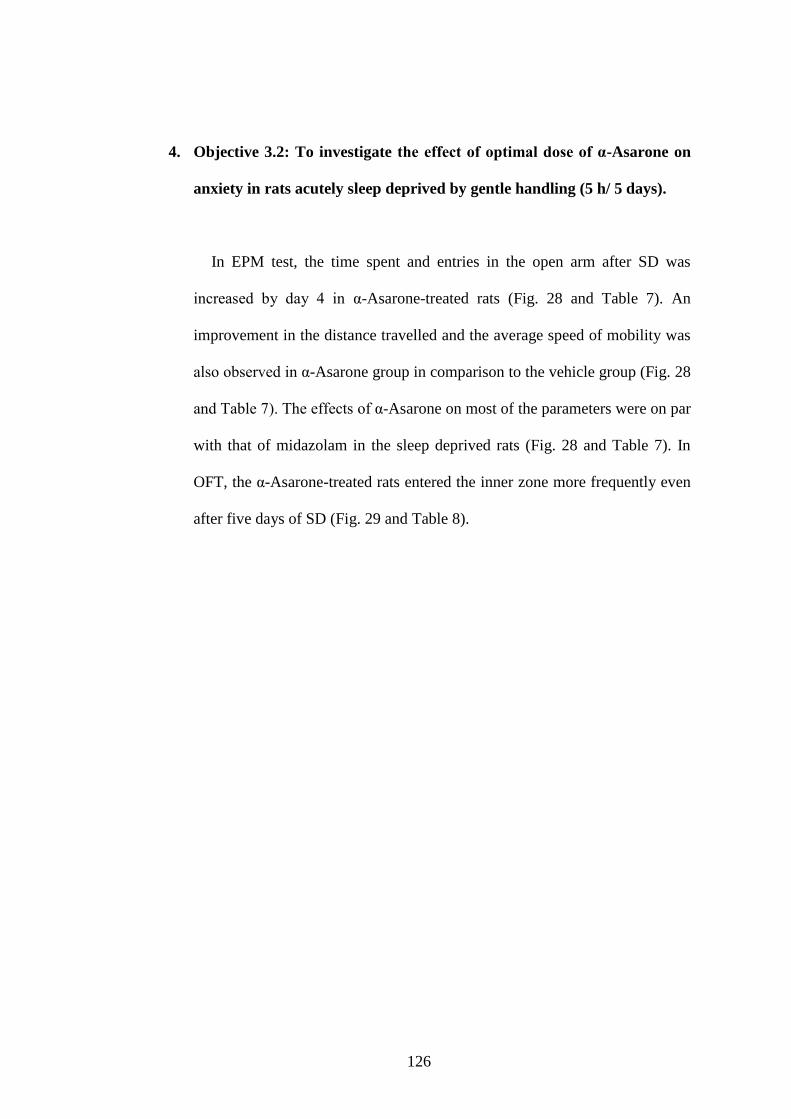
126
4. Objective 3.2: To investigate the effect of optimal dose of α-Asarone on
anxiety in rats acutely sleep deprived by gentle handling (5 h/ 5 days).
In EPM test, the time spent and entries in the open arm after SD was
increased by day 4 in α-Asarone-treated rats (Fig. 28 and Table 7). An
improvement in the distance travelled and the average speed of mobility was
also observed in α-Asarone group in comparison to the vehicle group (Fig. 28
and Table 7). The effects of α-Asarone on most of the parameters were on par
with that of midazolam in the sleep deprived rats (Fig. 28 and Table 7). In
OFT, the α-Asarone-treated rats entered the inner zone more frequently even
after five days of SD (Fig. 29 and Table 8).
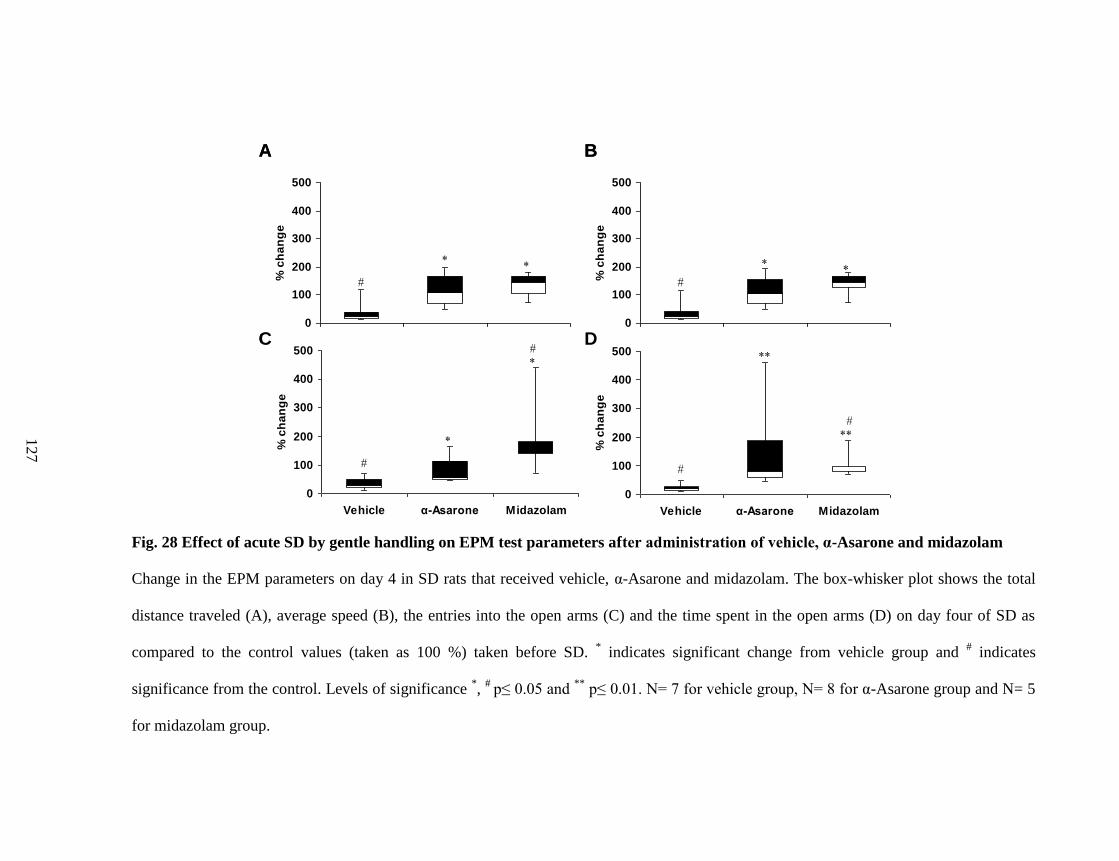
Fig. 28 Effect of acute SD by gentle handling on EPM test parameters after administration of vehicle, α-Asarone and midazolam
Change in the EPM parameters on day 4 in SD rats that received vehicle, α-Asarone and midazolam. The box-whisker plot shows the total
distance traveled (A), average speed (B), the entries into the open arms (C) and the time spent in the open arms (D) on day four of SD as
compared to the control values (taken as 100 %) taken before SD. * indicates significant change from vehicle group and
# indicates
significance from the control. Levels of significance *,
# p≤ 0.05 and
** p≤ 0.01. N= 7 for vehicle group, N= 8 for α-Asarone group and N= 5
for midazolam group.
0
100
200
300
400
500
Vehicle α-Asarone Midazolam
% c
ha
ng
e
0
100
200
300
400
500
Vehicle α-Asarone Midazolam
% c
ha
ng
e
0
100
200
300
400
500
Vehicle α-Asarone Midazolam
% c
ha
ng
e
0
100
200
300
400
500
Vehicle α-Asarone Midazolam
% c
ha
ng
e
A
C
B
D0
100
200
300
400
500
Vehicle α-Asarone Midazolam
% c
ha
ng
e
0
100
200
300
400
500
Vehicle α-Asarone Midazolam
% c
ha
ng
e
0
100
200
300
400
500
Vehicle α-Asarone Midazolam
% c
ha
ng
e
0
100
200
300
400
500
Vehicle α-Asarone Midazolam
% c
ha
ng
e
0
100
200
300
400
500
Vehicle α-Asarone Midazolam
% c
ha
ng
e
0
100
200
300
400
500
Vehicle α-Asarone Midazolam
% c
ha
ng
e
0
100
200
300
400
500
Vehicle α-Asarone Midazolam
% c
ha
ng
e
0
100
200
300
400
500
Vehicle α-Asarone Midazolam
% c
ha
ng
e
A
C
B
D
12
7
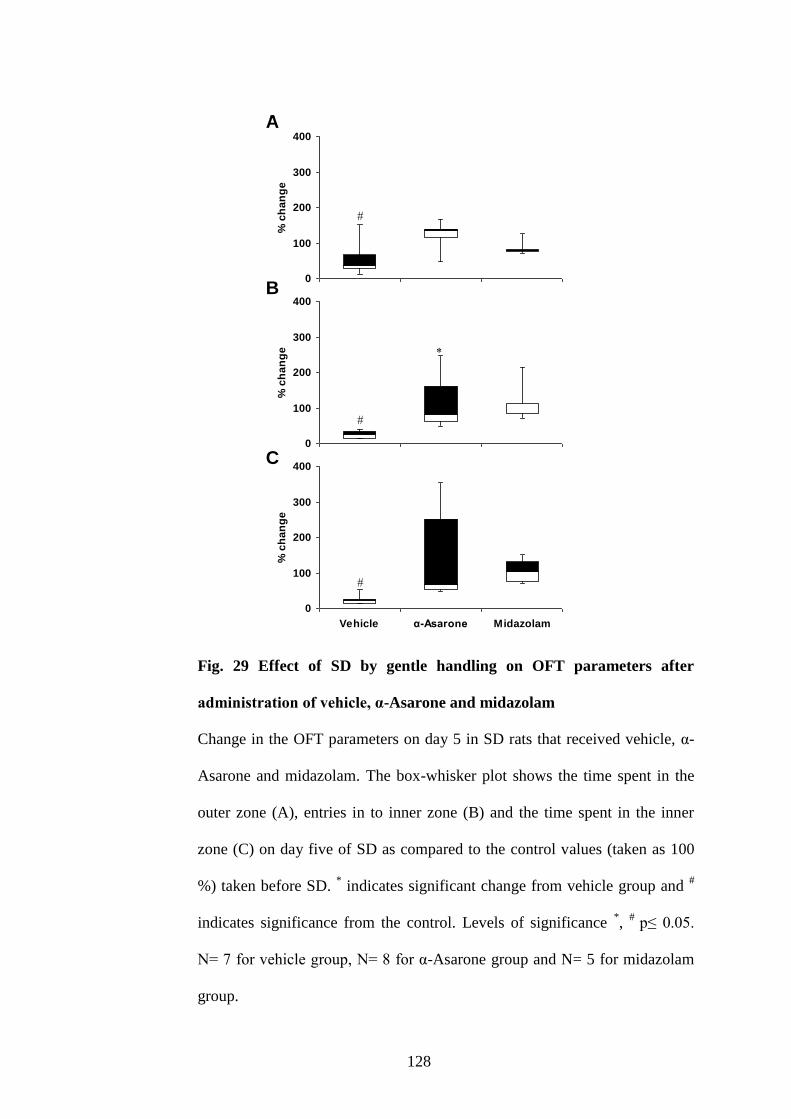
128
Fig. 29 Effect of SD by gentle handling on OFT parameters after
administration of vehicle, α-Asarone and midazolam
Change in the OFT parameters on day 5 in SD rats that received vehicle, α-
Asarone and midazolam. The box-whisker plot shows the time spent in the
outer zone (A), entries in to inner zone (B) and the time spent in the inner
zone (C) on day five of SD as compared to the control values (taken as 100
%) taken before SD. * indicates significant change from vehicle group and
#
indicates significance from the control. Levels of significance *,
# p≤ 0.05.
N= 7 for vehicle group, N= 8 for α-Asarone group and N= 5 for midazolam
group.
0
100
200
300
400
Vehicle α-Asarone Midazolam
% c
ha
ng
e
0
100
200
300
400
Vehicle α-Asarone Midazolam
% c
ha
ng
e
0
100
200
300
400
Vehicle α-Asarone Midazolam
% c
ha
ng
e
A
B
C
0
100
200
300
400
Vehicle α-Asarone Midazolam
% c
ha
ng
e
0
100
200
300
400
Vehicle α-Asarone Midazolam
% c
ha
ng
e
0
100
200
300
400
Vehicle α-Asarone Midazolam
% c
ha
ng
e0
100
200
300
400
Vehicle α-Asarone Midazolam
% c
ha
ng
e
0
100
200
300
400
Vehicle α-Asarone Midazolam
% c
ha
ng
e
0
100
200
300
400
Vehicle α-Asarone Midazolam
% c
ha
ng
e
A
B
C
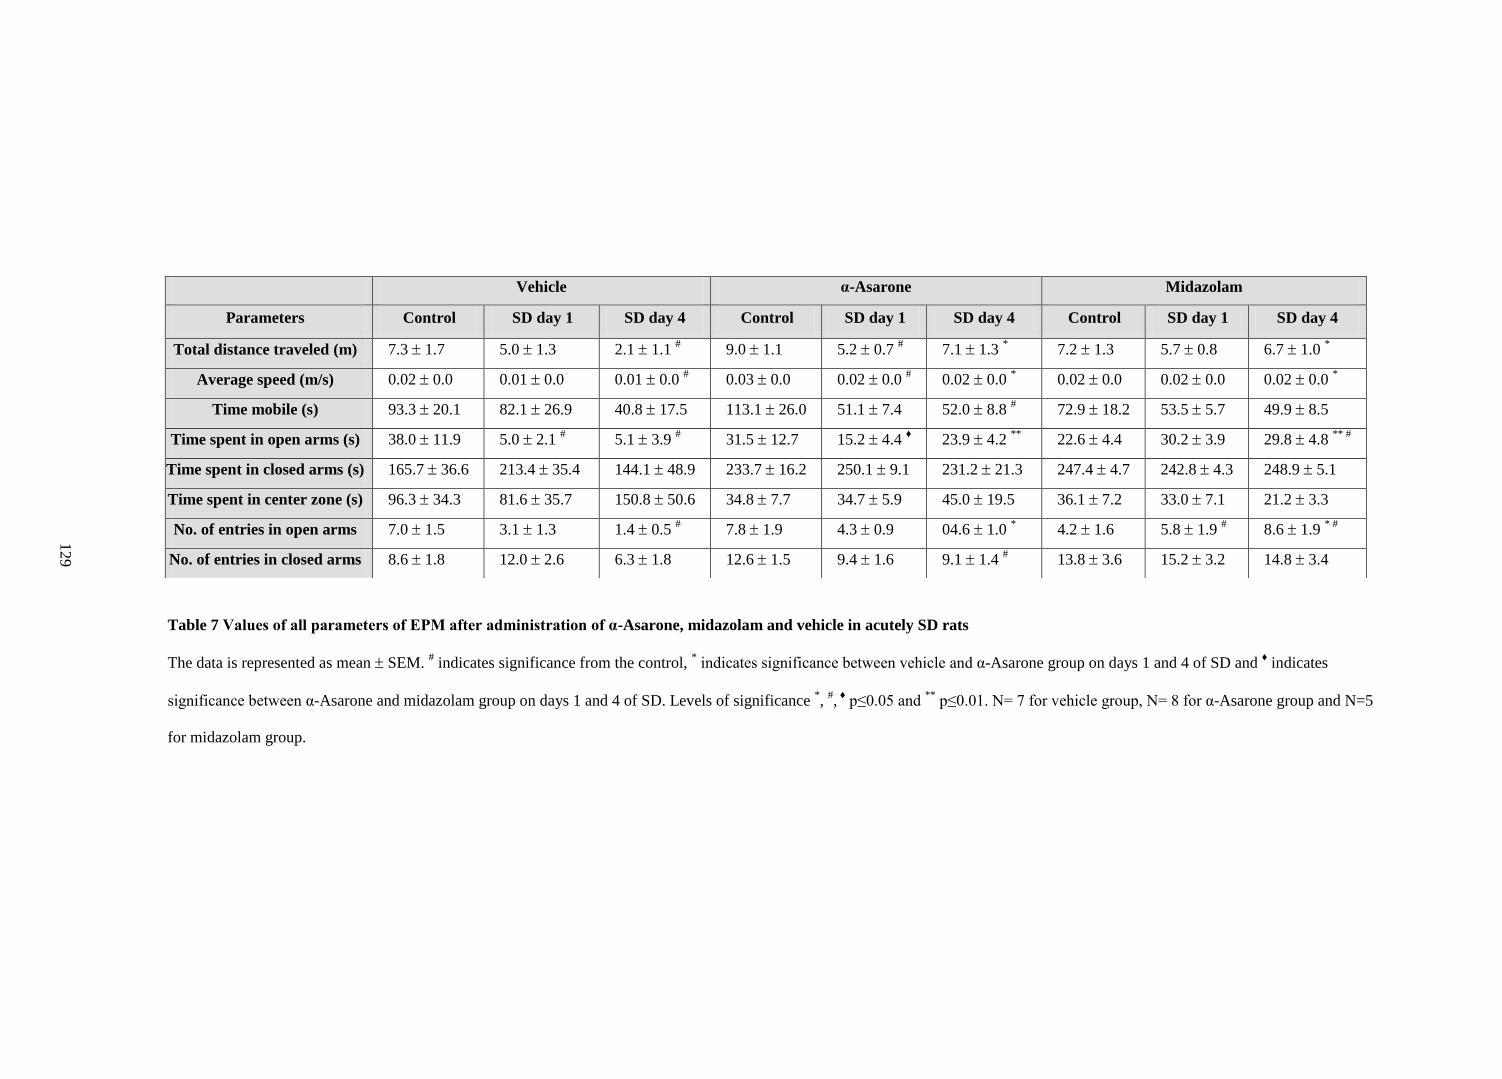
Table 7 Values of all parameters of EPM after administration of α-Asarone, midazolam and vehicle in acutely SD rats
The data is represented as mean SEM. # indicates significance from the control,
* indicates significance between vehicle and α-Asarone group on days 1 and 4 of SD and
♦ indicates
significance between α-Asarone and midazolam group on days 1 and 4 of SD. Levels of significance *,
#, ♦
p≤0.05 and **
p≤0.01. N= 7 for vehicle group, N= 8 for α-Asarone group and N=5
for midazolam group.
Vehicle α-Asarone Midazolam
Parameters Control SD day 1 SD day 4 Control SD day 1 SD day 4 Control SD day 1 SD day 4
Total distance traveled (m) 7.3 1.7 5.0 1.3 2.1 1.1 # 9.0 1.1 5.2 0.7
# 7.1 1.3
* 7.2 1.3 5.7 0.8 6.7 1.0
*
Average speed (m/s) 0.02 0.0 0.01 0.0 0.01 0.0 # 0.03 0.0 0.02 0.0
# 0.02 0.0
* 0.02 0.0 0.02 0.0 0.02 0.0
*
Time mobile (s) 93.3 20.1 82.1 26.9 40.8 17.5 113.1 26.0 51.1 7.4 52.0 8.8 # 72.9 18.2 53.5 5.7 49.9 8.5
Time spent in open arms (s) 38.0 11.9 5.0 2.1 # 5.1 3.9
# 31.5 12.7 15.2 4.4
♦ 23.9 4.2
** 22.6 4.4 30.2 3.9 29.8 4.8
** #
Time spent in closed arms (s) 165.7 36.6 213.4 35.4 144.1 48.9 233.7 16.2 250.1 9.1 231.2 21.3 247.4 4.7 242.8 4.3 248.9 5.1
Time spent in center zone (s) 96.3 34.3 81.6 35.7 150.8 50.6 34.8 7.7 34.7 5.9 45.0 19.5 36.1 7.2 33.0 7.1 21.2 3.3
No. of entries in open arms 7.0 1.5 3.1 1.3 1.4 0.5 # 7.8 1.9 4.3 0.9 04.6 1.0
* 4.2 1.6 5.8 1.9
# 8.6 1.9
* #
No. of entries in closed arms 8.6 1.8 12.0 2.6 6.3 1.8 12.6 1.5 9.4 1.6 9.1 1.4 # 13.8 3.6 15.2 3.2 14.8 3.4
12
9
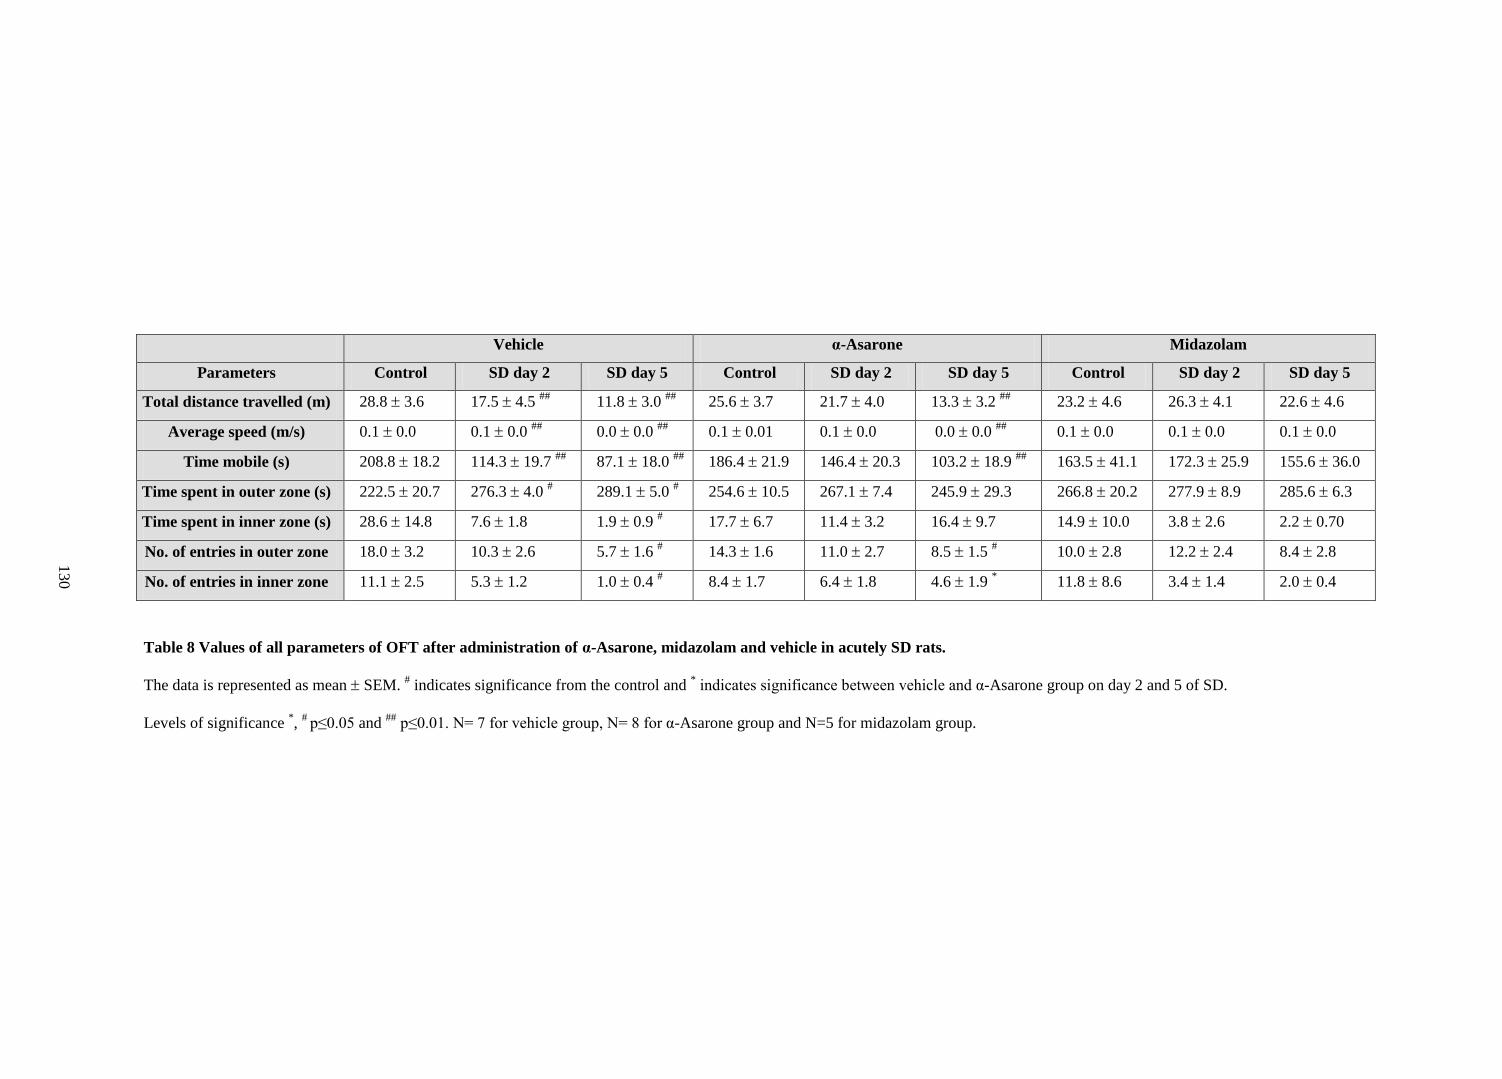
Table 8 Values of all parameters of OFT after administration of α-Asarone, midazolam and vehicle in acutely SD rats.
The data is represented as mean SEM. # indicates significance from the control and
* indicates significance between vehicle and α-Asarone group on day 2 and 5 of SD.
Levels of significance *,
# p≤0.05 and
## p≤0.01. N= 7 for vehicle group, N= 8 for α-Asarone group and N=5 for midazolam group.
Vehicle α-Asarone Midazolam
Parameters Control SD day 2 SD day 5 Control SD day 2 SD day 5 Control SD day 2 SD day 5
Total distance travelled (m) 28.8 3.6 17.5 4.5 ##
11.8 3.0 ##
25.6 3.7 21.7 4.0 13.3 3.2 ##
23.2 4.6 26.3 4.1 22.6 4.6
Average speed (m/s) 0.1 0.0 0.1 0.0 ##
0.0 0.0 ##
0.1 0.01 0.1 0.0 0.0 0.0 ##
0.1 0.0 0.1 0.0 0.1 0.0
Time mobile (s) 208.8 18.2 114.3 19.7 ##
87.1 18.0 ##
186.4 21.9 146.4 20.3 103.2 18.9 ##
163.5 41.1 172.3 25.9 155.6 36.0
Time spent in outer zone (s) 222.5 20.7 276.3 4.0 # 289.1 5.0
# 254.6 10.5 267.1 7.4 245.9 29.3 266.8 20.2 277.9 8.9 285.6 6.3
Time spent in inner zone (s) 28.6 14.8 7.6 1.8 1.9 0.9 # 17.7 6.7 11.4 3.2 16.4 9.7 14.9 10.0 3.8 2.6 2.2 0.70
No. of entries in outer zone 18.0 3.2 10.3 2.6 5.7 1.6 # 14.3 1.6 11.0 2.7 8.5 1.5
# 10.0 2.8 12.2 2.4 8.4 2.8
No. of entries in inner zone 11.1 2.5 5.3 1.2 1.0 0.4 # 8.4 1.7 6.4 1.8 4.6 1.9
* 11.8 8.6 3.4 1.4 2.0 0.4
13
0
131
5. Objective 3.3: To investigate the effect of optimal dose of α-Asarone on
antioxidant levels in the brain of rats acutely sleep deprived by gentle
handling (5 h/ 5 days).
5.1. MDA levels
The MDA levels in the brainstem as well as the subcortex lowered after 5
days of SD (Table 9). In comparison to the vehicle treated rats, the MDA
levels in the subcortex decreased on day 1 and 5 in SD rats when treated with
α-Asarone (Table 9). In brainstem, the MDA levels decreased in α-Asarone
treated group only after 5 days of SD (Table 9). No changes were observed in
the MDA levels in cortex in any groups after SD (Table 9).
5.2. CAT activity
CAT activity was significantly decreased in the cortex and subcortex of the
vehicle treated group after 5 days of SD in comparison to the control group
(Table 9). In comparison to the vehicle treated rats, the CAT activity in the
subcortex and the brainstem region increased on day 1 in SD rats when treated
with α-Asarone (Table 9). In cortex, no changes were observed in the CAT
activity in any groups after SD (Table 9).
5.3. GSH-R activity
GSH-R activity was significantly increased after 1 and 5 days of SD in the
cortex of vehicle treated group in comparison to the control (Table 9). In the
α-Asarone treated rats, GSH-R activity was increased only in the subcortical
132
region after 5 days of SD. GSH-R activity in none of the other areas was
affected by α-Asarone treatment.
5.4. SOD activity
In the subcortical region, a significant increase in the SOD activity was
observed after 5 h of SD in rats treated with vehicle in comparison to the
untreated control (Table 9). No change was observed in SOD activity after α-
Asarone administration in SD groups on day 1 or 5 (Table 9).
5.5. GSH-Px activity
In cortex and subcortex, in comparison to the untreated control, the GSH-
Px activity was decreased on day 1 and increased on day 5 of SD (Table 9). No
change was observed in GSH-Px activity after α-Asarone administration in SD
groups on day 1 or 5 (Table 9).
5.6. GSH levels
No changes were observed in the GSH levels after α-Asarone
administration in SD groups on day 1 or 5 (Table 9).
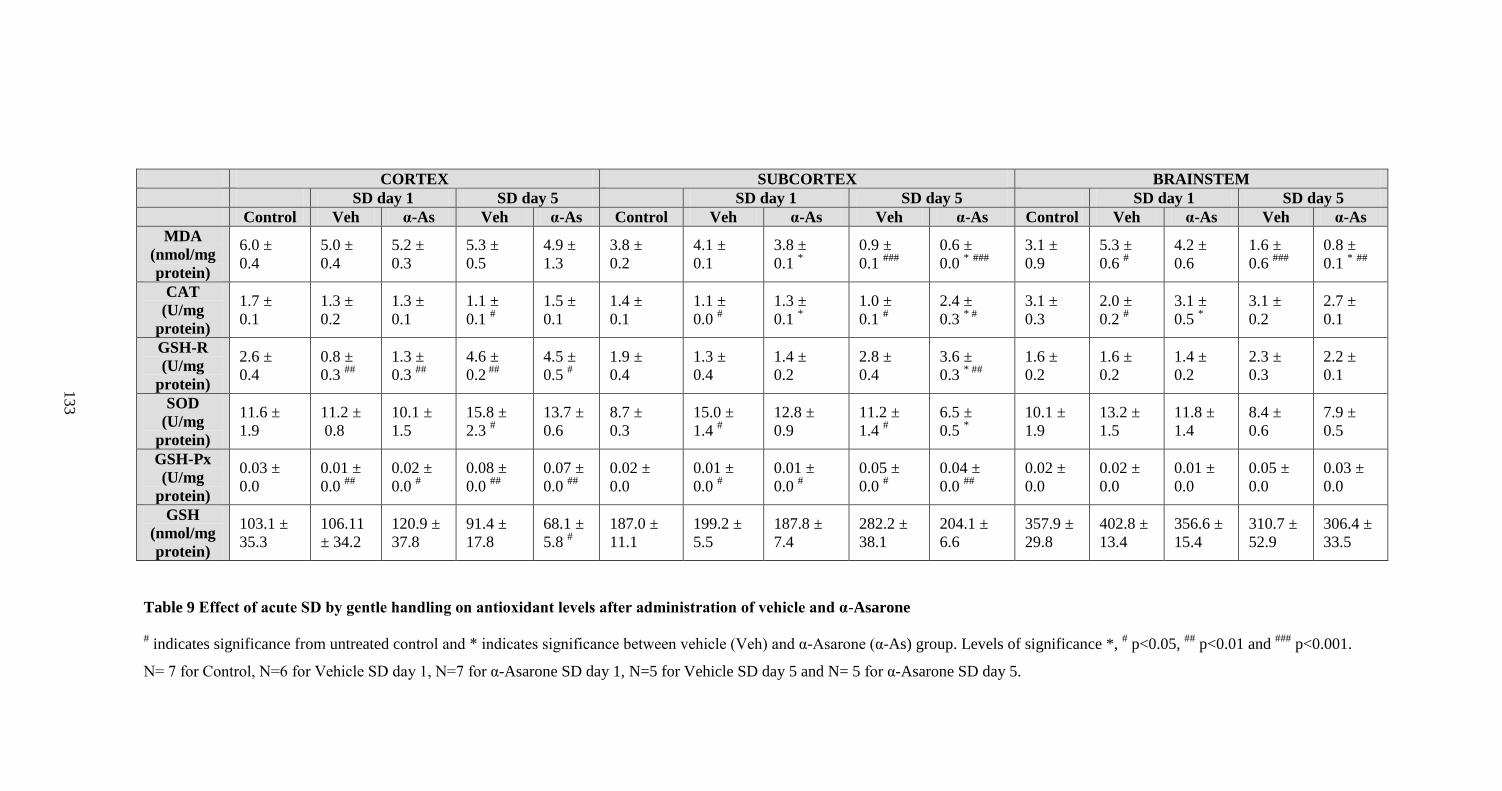
Table 9 Effect of acute SD by gentle handling on antioxidant levels after administration of vehicle and α-Asarone
# indicates significance from untreated control and * indicates significance between vehicle (Veh) and α-Asarone (α-As) group. Levels of significance *,
# p<0.05,
## p<0.01 and
### p<0.001.
N= 7 for Control, N=6 for Vehicle SD day 1, N=7 for α-Asarone SD day 1, N=5 for Vehicle SD day 5 and N= 5 for α-Asarone SD day 5.
CORTEX SUBCORTEX BRAINSTEM
SD day 1 SD day 5 SD day 1 SD day 5 SD day 1 SD day 5
Control Veh α-As Veh α-As Control Veh α-As Veh α-As Control Veh α-As Veh α-As
MDA
(nmol/mg
protein)
6.0 ±
0.4
5.0 ±
0.4
5.2 ±
0.3
5.3 ±
0.5
4.9 ±
1.3
3.8 ±
0.2
4.1 ±
0.1
3.8 ±
0.1 *
0.9 ±
0.1 ###
0.6 ±
0.0 * ###
3.1 ±
0.9
5.3 ±
0.6 #
4.2 ±
0.6
1.6 ±
0.6 ###
0.8 ±
0.1 * ##
CAT
(U/mg
protein)
1.7 ±
0.1
1.3 ±
0.2
1.3 ±
0.1
1.1 ±
0.1 #
1.5 ±
0.1
1.4 ±
0.1
1.1 ±
0.0 #
1.3 ±
0.1 *
1.0 ±
0.1 #
2.4 ±
0.3 * #
3.1 ±
0.3
2.0 ±
0.2 #
3.1 ±
0.5 *
3.1 ±
0.2
2.7 ±
0.1
GSH-R
(U/mg
protein)
2.6 ±
0.4
0.8 ±
0.3 ##
1.3 ±
0.3 ##
4.6 ±
0.2 ##
4.5 ±
0.5 #
1.9 ±
0.4
1.3 ±
0.4
1.4 ±
0.2
2.8 ±
0.4
3.6 ±
0.3 * ##
1.6 ±
0.2
1.6 ±
0.2
1.4 ±
0.2
2.3 ±
0.3
2.2 ±
0.1
SOD
(U/mg
protein)
11.6 ±
1.9
11.2 ±
0.8
10.1 ±
1.5
15.8 ±
2.3 #
13.7 ±
0.6
8.7 ±
0.3
15.0 ±
1.4 #
12.8 ±
0.9
11.2 ±
1.4 #
6.5 ±
0.5 *
10.1 ±
1.9
13.2 ±
1.5
11.8 ±
1.4
8.4 ±
0.6
7.9 ±
0.5
GSH-Px
(U/mg
protein)
0.03 ±
0.0
0.01 ±
0.0 ##
0.02 ±
0.0 #
0.08 ±
0.0 ##
0.07 ±
0.0 ##
0.02 ±
0.0
0.01 ±
0.0 #
0.01 ±
0.0 #
0.05 ±
0.0 #
0.04 ±
0.0 ##
0.02 ±
0.0
0.02 ±
0.0
0.01 ±
0.0
0.05 ±
0.0
0.03 ±
0.0
GSH
(nmol/mg
protein)
103.1 ±
35.3
106.11
± 34.2
120.9 ±
37.8
91.4 ±
17.8
68.1 ±
5.8 #
187.0 ±
11.1
199.2 ±
5.5
187.8 ±
7.4
282.2 ±
38.1
204.1 ±
6.6
357.9 ±
29.8
402.8 ±
13.4
356.6 ±
15.4
310.7 ±
52.9
306.4 ±
33.5
13
3
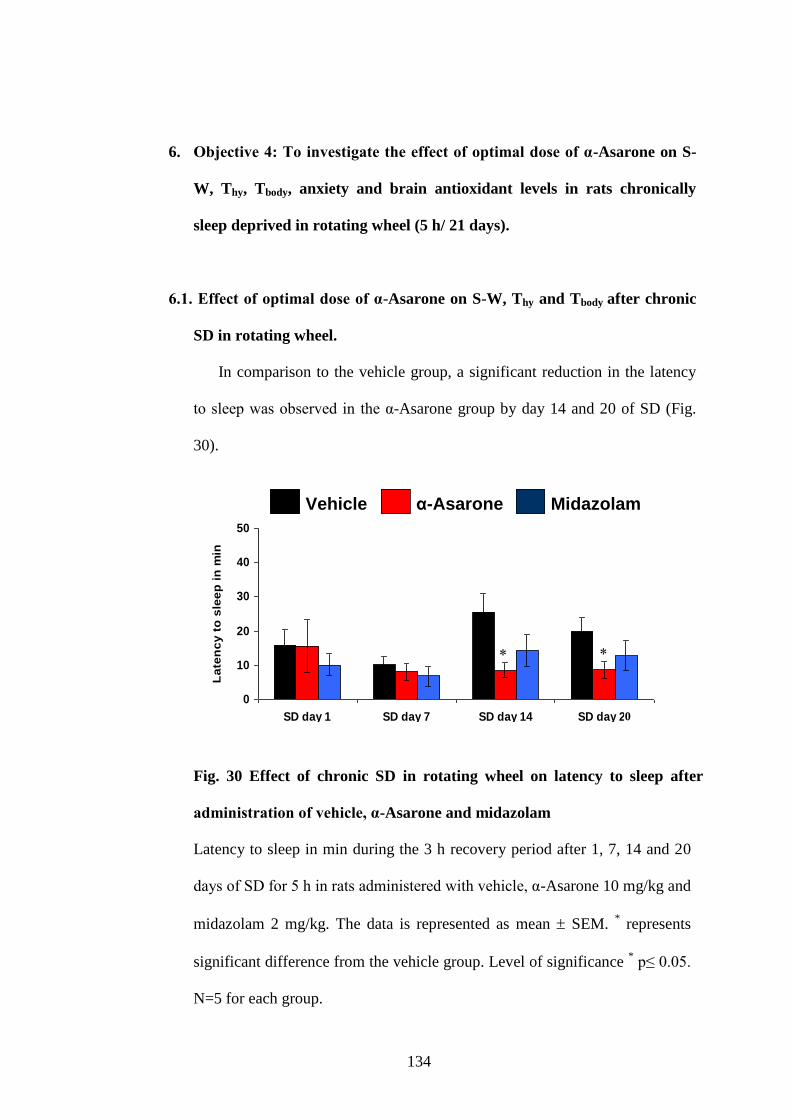
134
6. Objective 4: To investigate the effect of optimal dose of α-Asarone on S-
W, Thy, Tbody, anxiety and brain antioxidant levels in rats chronically
sleep deprived in rotating wheel (5 h/ 21 days).
6.1. Effect of optimal dose of α-Asarone on S-W, Thy and Tbody after chronic
SD in rotating wheel.
In comparison to the vehicle group, a significant reduction in the latency
to sleep was observed in the α-Asarone group by day 14 and 20 of SD (Fig.
30).
Fig. 30 Effect of chronic SD in rotating wheel on latency to sleep after
administration of vehicle, α-Asarone and midazolam
Latency to sleep in min during the 3 h recovery period after 1, 7, 14 and 20
days of SD for 5 h in rats administered with vehicle, α-Asarone 10 mg/kg and
midazolam 2 mg/kg. The data is represented as mean SEM. * represents
significant difference from the vehicle group. Level of significance * p≤ 0.05.
N=5 for each group.
0
10
20
30
40
50
SD day 1 SD day 7 SD day 14 SD day 21
La
ten
cy
to
sle
ep
in
min
Vehicle α-Asarone Midazolam
Midazolamα-AsaroneVehicle
0
10
20
30
40
50
SD day 1 SD day 7 SD day 14 SD day 21
La
ten
cy
to
sle
ep
in
min
Vehicle α-Asarone Midazolam
0
10
20
30
40
50
SD day 1 SD day 7 SD day 14 SD day 21
La
ten
cy
to
sle
ep
in
min
Vehicle α-Asarone Midazolam
Midazolamα-AsaroneVehicle Midazolamα-AsaroneVehicle α-AsaroneVehicle
0
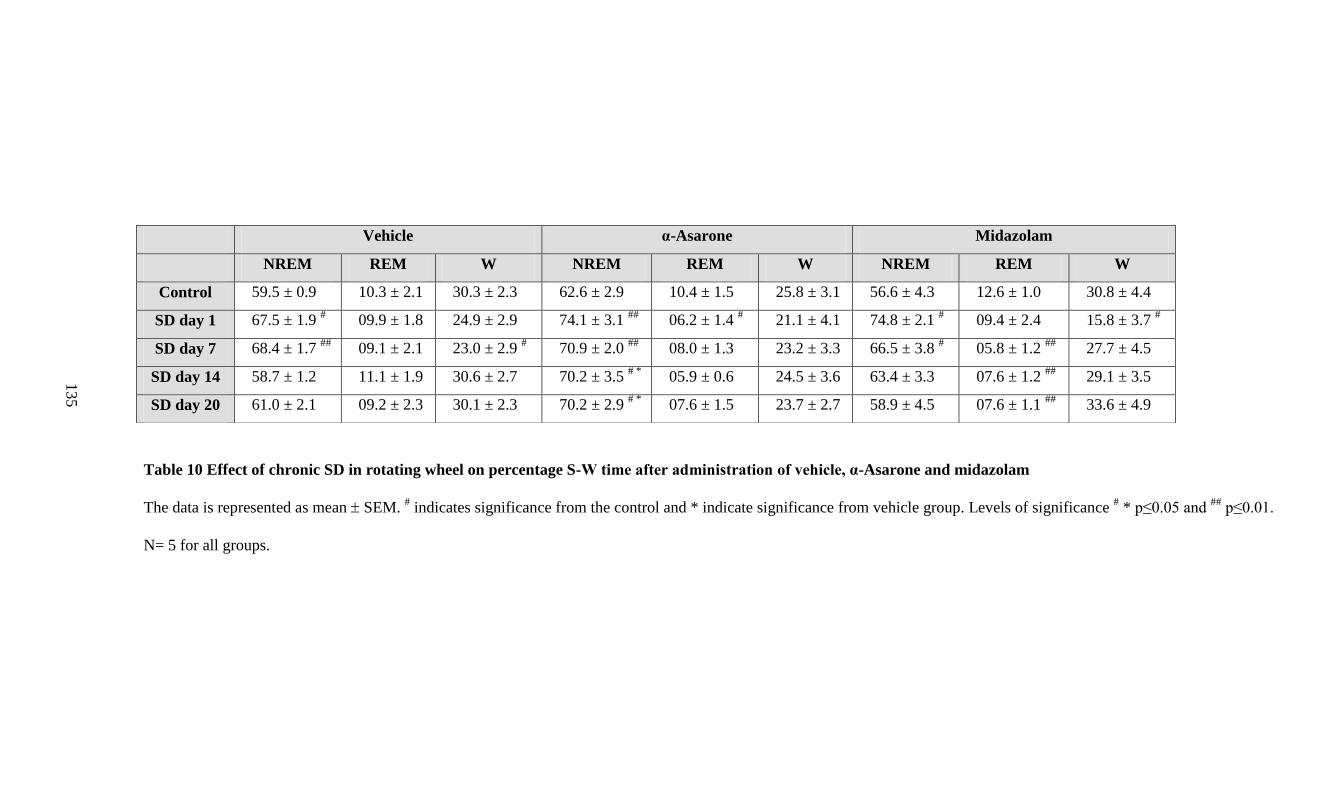
Table 10 Effect of chronic SD in rotating wheel on percentage S-W time after administration of vehicle, α-Asarone and midazolam
The data is represented as mean SEM. # indicates significance from the control and * indicate significance from vehicle group. Levels of significance
# * p≤0.05 and
## p≤0.01.
N= 5 for all groups.
Vehicle α-Asarone Midazolam
NREM REM W NREM REM W NREM REM W
Control 59.5 ± 0.9 10.3 ± 2.1 30.3 ± 2.3 62.6 ± 2.9 10.4 ± 1.5 25.8 ± 3.1 56.6 ± 4.3 12.6 ± 1.0 30.8 ± 4.4
SD day 1 67.5 ± 1.9 # 09.9 ± 1.8 24.9 ± 2.9 74.1 ± 3.1
## 06.2 ± 1.4
# 21.1 ± 4.1 74.8 ± 2.1
# 09.4 ± 2.4 15.8 ± 3.7
#
SD day 7 68.4 ± 1.7 ##
09.1 ± 2.1 23.0 ± 2.9 # 70.9 ± 2.0
## 08.0 ± 1.3 23.2 ± 3.3 66.5 ± 3.8
# 05.8 ± 1.2
## 27.7 ± 4.5
SD day 14 58.7 ± 1.2 11.1 ± 1.9 30.6 ± 2.7 70.2 ± 3.5 # *
05.9 ± 0.6 24.5 ± 3.6 63.4 ± 3.3 07.6 ± 1.2 ##
29.1 ± 3.5
SD day 20 61.0 ± 2.1 09.2 ± 2.3 30.1 ± 2.3 70.2 ± 2.9 # *
07.6 ± 1.5 23.7 ± 2.7 58.9 ± 4.5 07.6 ± 1.1 ##
33.6 ± 4.9
13
5
136
Table 10 shows the change in S-W in SD rats administered with vehicle,
α-Asarone and midazolam. In comparison to the vehicle and midazolam
group, α-Asarone significantly increased the NREM sleep bout duration
simultaneously with a decrease in NREM sleep bout frequency on all days of
SD (Fig. 31A & B). Quality of REM sleep was unaltered after α-Asarone
administration. Furthermore a decrease in the arousal index during the
recovery period was observed in the α-Asarone-treated SD group on days 7,
14 and 20 in comparison to both vehicle and midazolam group (Fig. 31C).
A significant increase in the relative delta power during the NREM sleep
was observed for the entire 3 weeks in the α-Asarone group (Fig. 32A).
Furthermore the relative delta power was significantly lower in the
midazolam group (Fig. 32A). Similar to the vehicle group, the relative theta
power during NREM sleep was reduced in the α-Asarone group (Fig. 32B).
Theta power during NREM sleep was always higher in the midazolam group
(Fig. 32B). By day 20, relative theta power in both α-Asarone and midazolam
group NREM sleep increased in comparison to the vehicle group (Fig. 32B).
Reduction in the relative alpha and beta power was also observed in the α-
Asarone group (Fig. 32C&D). However, in the midazolam group, both alpha
as well as beta power was significantly higher on all days of SD (Fig.
32C&D). REM sleep EEG spectrum remained unaltered after 3 weeks of SD.
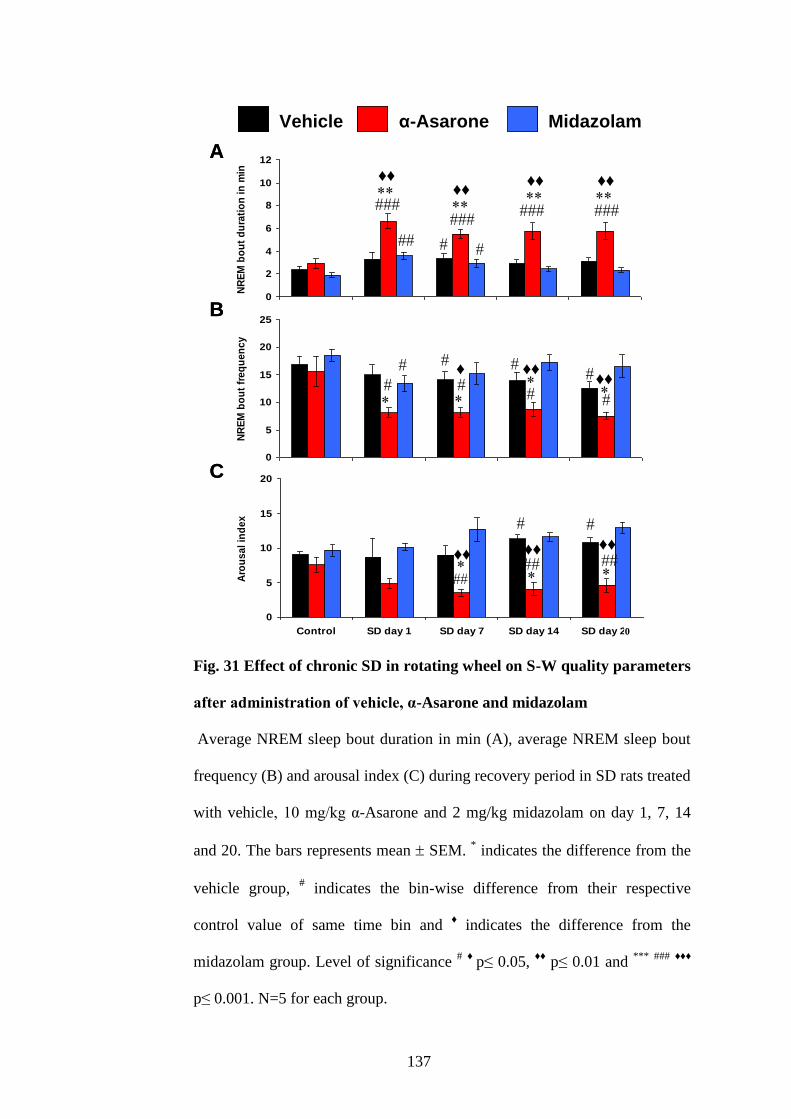
137
Fig. 31 Effect of chronic SD in rotating wheel on S-W quality parameters
after administration of vehicle, α-Asarone and midazolam
Average NREM sleep bout duration in min (A), average NREM sleep bout
frequency (B) and arousal index (C) during recovery period in SD rats treated
with vehicle, 10 mg/kg α-Asarone and 2 mg/kg midazolam on day 1, 7, 14
and 20. The bars represents mean SEM. * indicates the difference from the
vehicle group, # indicates the bin-wise difference from their respective
control value of same time bin and ♦ indicates the difference from the
midazolam group. Level of significance # ♦
p≤ 0.05, ♦♦
p≤ 0.01 and ***
###
♦♦♦
p≤ 0.001. N=5 for each group.
0
2
4
6
8
10
12
Control SD day 1 SD day 7 SD day 14 SD day 21
NR
EM
bo
ut
du
rati
on
in
min
Vehicle α-Asarone Midazolam
0
5
10
15
20
25
Control SD day 1 SD day 7 SD day 14 SD day 21
NR
EM
bo
ut
fre
qu
en
cy
0
5
10
15
20
Control SD day 1 SD day 7 SD day 14 SD day 21
Aro
us
al
ind
ex
♦♦
A
♦♦
♦♦
♦♦
♦
♦♦
♦♦
B
♦♦
♦♦
♦♦
C
Vehicle α-Asarone Midazolam
0
2
4
6
8
10
12
Control SD day 1 SD day 7 SD day 14 SD day 21
NR
EM
bo
ut
du
rati
on
in
min
Vehicle α-Asarone Midazolam
0
5
10
15
20
25
Control SD day 1 SD day 7 SD day 14 SD day 21
NR
EM
bo
ut
fre
qu
en
cy
0
5
10
15
20
Control SD day 1 SD day 7 SD day 14 SD day 21
Aro
us
al
ind
ex
♦♦
A
♦♦
♦♦
♦♦
♦
♦♦
♦♦
B
♦♦
♦♦
♦♦
C
Vehicle α-Asarone MidazolamVehicle α-Asarone Midazolam
0

138
During the 3 h recovery period, the Thy and Tbody remained high in both
vehicle and midazolam groups (Fig. 33A&B). However, in the α-Asarone
group, the Thy was on par with that of the control values and was significantly
lower than the vehicle SD group on all days (Fig. 33A). By day 20, the Tbody
also showed significant reduction (Fig. 33B).
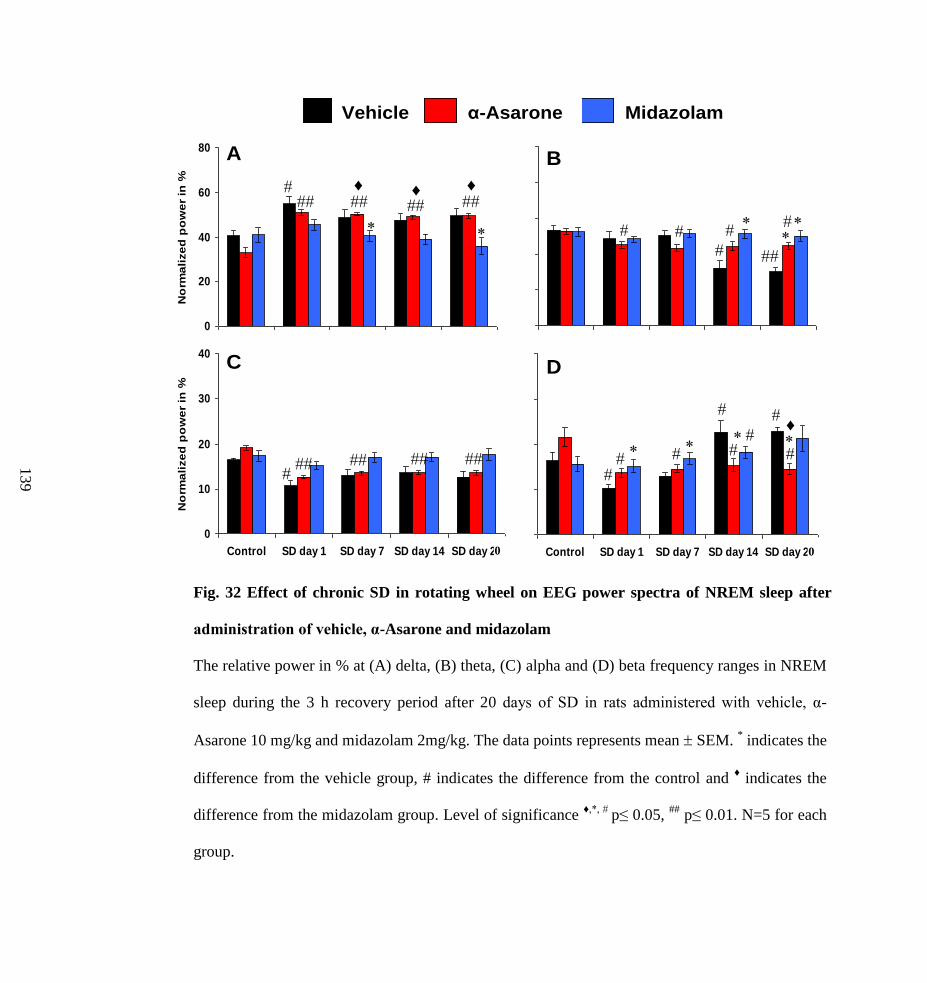
Fig. 32 Effect of chronic SD in rotating wheel on EEG power spectra of NREM sleep after
administration of vehicle, α-Asarone and midazolam
The relative power in % at (A) delta, (B) theta, (C) alpha and (D) beta frequency ranges in NREM
sleep during the 3 h recovery period after 20 days of SD in rats administered with vehicle, α-
Asarone 10 mg/kg and midazolam 2mg/kg. The data points represents mean SEM. * indicates the
difference from the vehicle group, # indicates the difference from the control and ♦ indicates the
difference from the midazolam group. Level of significance ♦,*, #
p≤ 0.05, ##
p≤ 0.01. N=5 for each
group.
13
9
0
10
20
30
40
50
Control SD day 1 SD day 7 SD day 14 SD day 21
No
rma
lize
d p
ow
er
in %
Vehicle
α-Asarone
Midazolam
0
10
20
30
40
Control SD day 1 SD day 7 SD day 14 SD day 21
No
rma
lize
d p
ow
er
in %
♦
0
20
40
60
80
Control SD day 1 SD day 7 SD day 14 SD day 21
No
rma
lize
d p
ow
er
in %
0
10
20
30
40
Control SD day 1 SD day 7 SD day 14 SD day 21
No
rma
lize
d p
ow
er
in %
♦♦♦
A B
C D
Vehicle α-Asarone Midazolam
0
10
20
30
40
50
Control SD day 1 SD day 7 SD day 14 SD day 21
No
rma
lize
d p
ow
er
in %
Vehicle
α-Asarone
Midazolam
0
10
20
30
40
Control SD day 1 SD day 7 SD day 14 SD day 21
No
rma
lize
d p
ow
er
in %
♦
0
20
40
60
80
Control SD day 1 SD day 7 SD day 14 SD day 21
No
rma
lize
d p
ow
er
in %
0
10
20
30
40
Control SD day 1 SD day 7 SD day 14 SD day 21
No
rma
lize
d p
ow
er
in %
♦♦♦
A B
C D
Vehicle α-Asarone MidazolamVehicle α-Asarone Midazolam
0
0
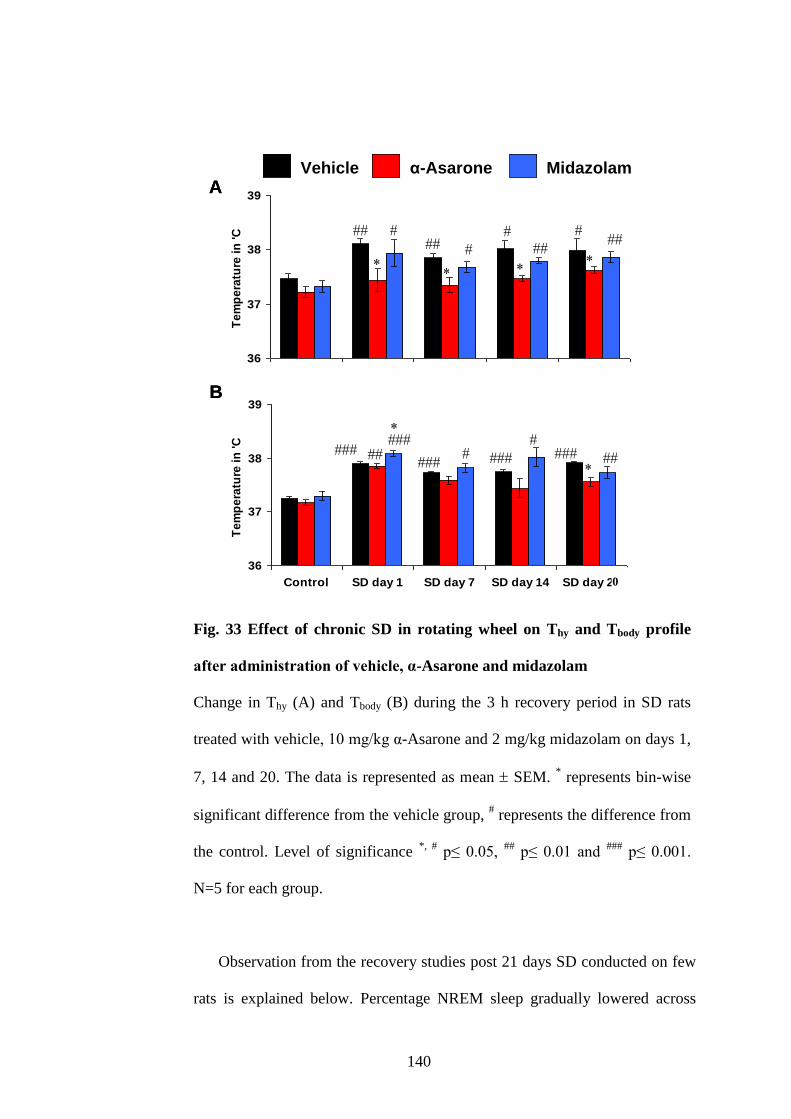
140
Fig. 33 Effect of chronic SD in rotating wheel on Thy and Tbody profile
after administration of vehicle, α-Asarone and midazolam
Change in Thy (A) and Tbody (B) during the 3 h recovery period in SD rats
treated with vehicle, 10 mg/kg α-Asarone and 2 mg/kg midazolam on days 1,
7, 14 and 20. The data is represented as mean SEM. * represents bin-wise
significant difference from the vehicle group, # represents the difference from
the control. Level of significance *, #
p≤ 0.05, ##
p≤ 0.01 and ###
p≤ 0.001.
N=5 for each group.
Observation from the recovery studies post 21 days SD conducted on few
rats is explained below. Percentage NREM sleep gradually lowered across
36
37
38
39
Control SD day 1 SD day 7 SD day 14 SD day 21
Te
mp
era
ture
in
'C
Vehicle α-Asarone Midazolam
36
37
38
39
Control SD day 1 SD day 7 SD day 14 SD day 21
Te
mp
era
ture
in
'C
A
B
Vehicle α-Asarone Midazolam
36
37
38
39
Control SD day 1 SD day 7 SD day 14 SD day 21
Te
mp
era
ture
in
'C
Vehicle α-Asarone Midazolam
36
37
38
39
Control SD day 1 SD day 7 SD day 14 SD day 21
Te
mp
era
ture
in
'C
A
B
Vehicle α-Asarone MidazolamVehicle α-Asarone Midazolam
0
141
72 h after SD in the vehicle group. Midazolam group also had a reduced
NREM sleep post 21 days SD (Table 11). However, NREM sleep percentage
in the α-Asarone group was on par with its control values (Table 11). REM
sleep duration was gradually increasing in all the three groups after SD for 21
days (Table 11). The NREM sleep bout duration remained unaltered and the
arousal index was still minimal in the α-Asarone group in comparison to the
vehicle and midazolam groups (Table 11).
EEG spectral profile was significantly modified in all the three groups
after 24, 48 and 72 h after SD (Fig. 34). During NREM sleep, the relative
delta power remained higher and relative beta power remained lower in the
α-Asarone groups for 72 h, in comparison to the vehicle and the midazolam
group (Fig. 34). During REM sleep, the relative theta power was higher and
relative delta and beta power was lower in the α-Asarone group in comparison
to the vehicle and the midazolam group (Fig. 34).
Thy and Tbody values observed 24 h after 21 days SD was on par with the
control values in all the three groups.
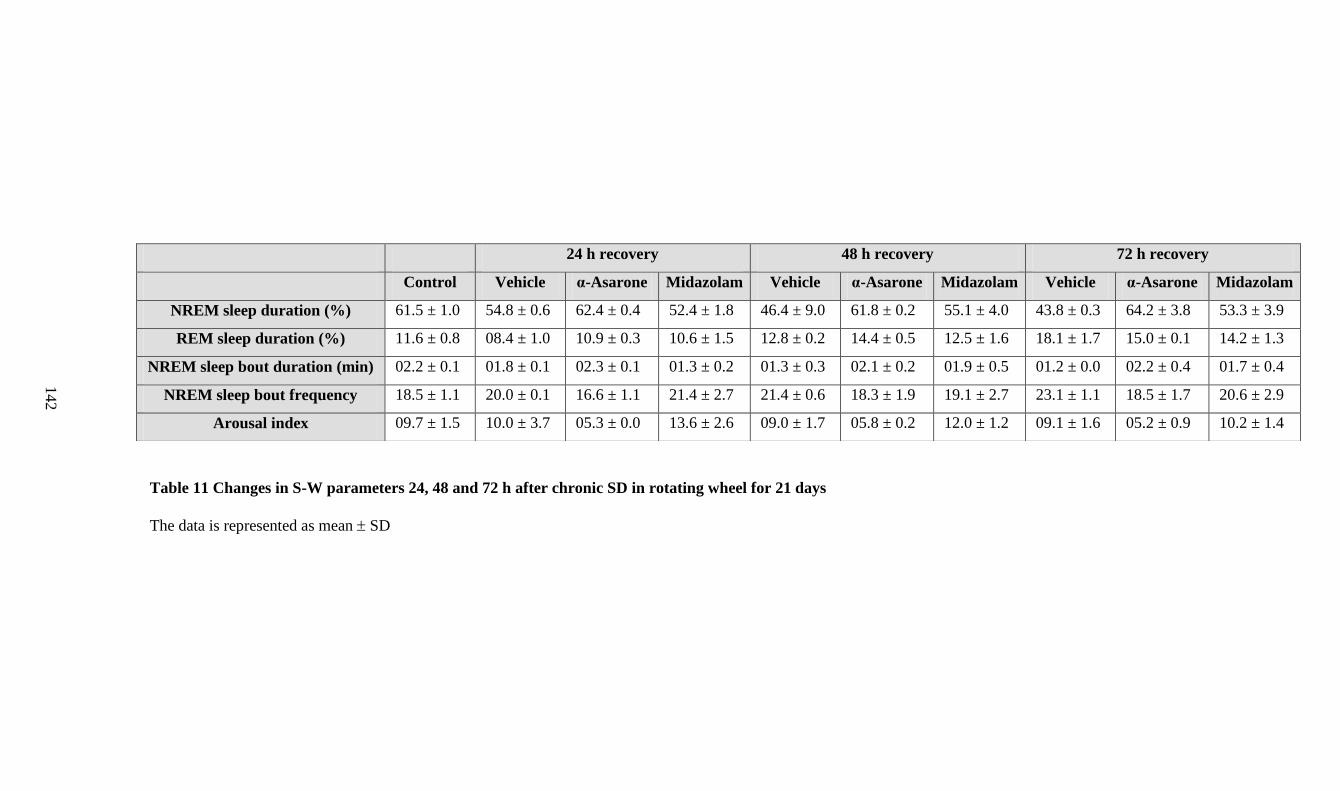
Table 11 Changes in S-W parameters 24, 48 and 72 h after chronic SD in rotating wheel for 21 days
The data is represented as mean SD
24 h recovery 48 h recovery 72 h recovery
Control Vehicle α-Asarone Midazolam Vehicle α-Asarone Midazolam Vehicle α-Asarone Midazolam
NREM sleep duration (%) 61.5 ± 1.0 54.8 ± 0.6 62.4 ± 0.4 52.4 ± 1.8 46.4 ± 9.0 61.8 ± 0.2 55.1 ± 4.0 43.8 ± 0.3 64.2 ± 3.8 53.3 ± 3.9
REM sleep duration (%) 11.6 ± 0.8 08.4 ± 1.0 10.9 ± 0.3 10.6 ± 1.5 12.8 ± 0.2 14.4 ± 0.5 12.5 ± 1.6 18.1 ± 1.7 15.0 ± 0.1 14.2 ± 1.3
NREM sleep bout duration (min) 02.2 ± 0.1 01.8 ± 0.1 02.3 ± 0.1 01.3 ± 0.2 01.3 ± 0.3 02.1 ± 0.2 01.9 ± 0.5 01.2 ± 0.0 02.2 ± 0.4 01.7 ± 0.4
NREM sleep bout frequency 18.5 ± 1.1 20.0 ± 0.1 16.6 ± 1.1 21.4 ± 2.7 21.4 ± 0.6 18.3 ± 1.9 19.1 ± 2.7 23.1 ± 1.1 18.5 ± 1.7 20.6 ± 2.9
Arousal index 09.7 ± 1.5 10.0 ± 3.7 05.3 ± 0.0 13.6 ± 2.6 09.0 ± 1.7 05.8 ± 0.2 12.0 ± 1.2 09.1 ± 1.6 05.2 ± 0.9 10.2 ± 1.4
14
2
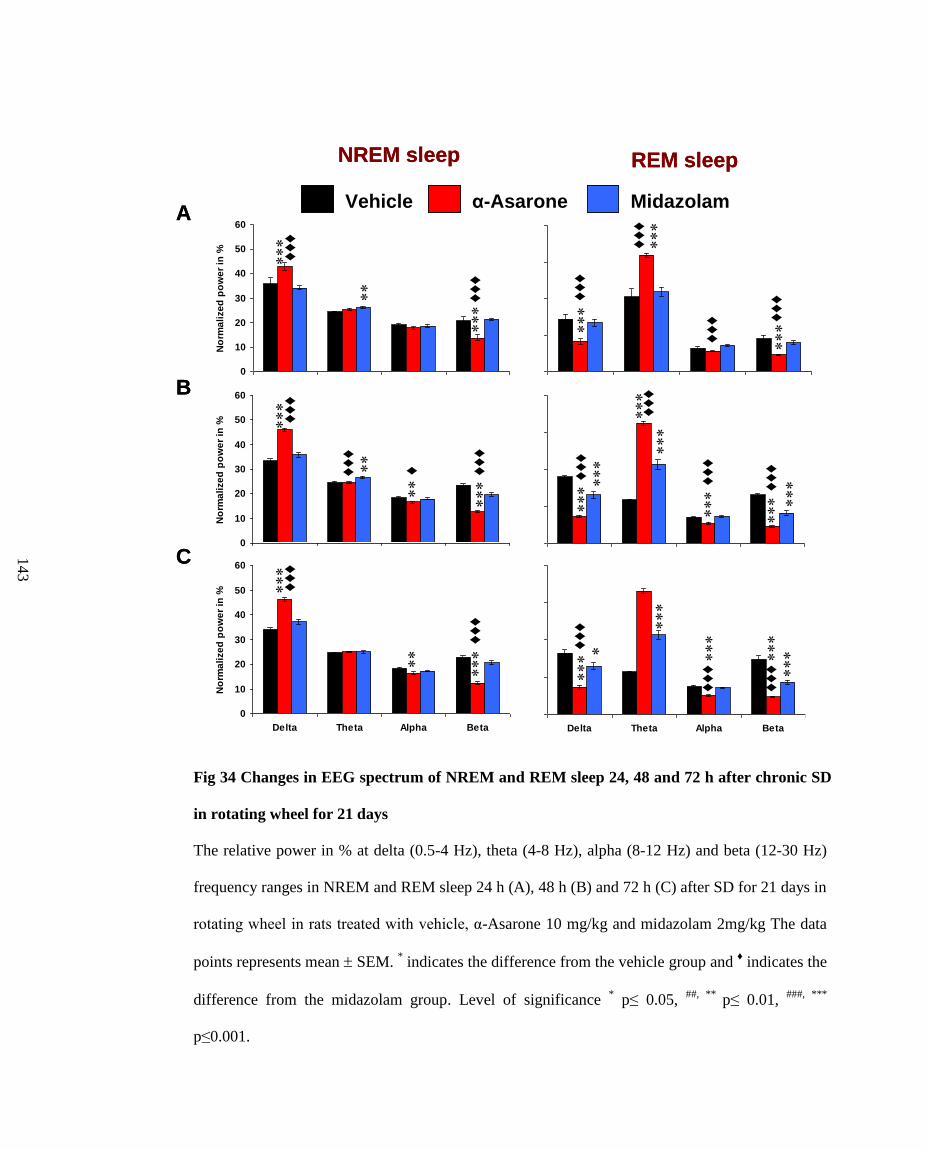
Fig 34 Changes in EEG spectrum of NREM and REM sleep 24, 48 and 72 h after chronic SD
in rotating wheel for 21 days
The relative power in % at delta (0.5-4 Hz), theta (4-8 Hz), alpha (8-12 Hz) and beta (12-30 Hz)
frequency ranges in NREM and REM sleep 24 h (A), 48 h (B) and 72 h (C) after SD for 21 days in
rotating wheel in rats treated with vehicle, α-Asarone 10 mg/kg and midazolam 2mg/kg The data
points represents mean SEM. * indicates the difference from the vehicle group and
♦ indicates the
difference from the midazolam group. Level of significance * p≤ 0.05,
##, ** p≤ 0.01,
###, ***
p≤0.001.
A
B
C
REM sleepNREM sleep
0
20
40
60
80
Delta Theta Alpha Beta
No
rma
lize
d p
ow
er
in %
Vehicle
α-Asarone
Midazolam
0
20
40
60
80
Delta Theta Alpha Beta
No
rma
lize
d p
ow
er
in %
♦♦
♦
♦♦
♦
♦♦
♦ ♦♦
♦
♦♦
♦
♦♦
♦
♦♦
♦
♦♦
♦
♦♦
♦
0
20
40
60
80
Delta Theta Alpha Beta
No
rma
lize
d p
ow
er
in %
♦♦
♦
♦♦
♦
♦♦
♦
0
10
20
30
40
50
60
Delta Theta Alpha Beta
No
rma
lize
d p
ow
er
in %
0
10
20
30
40
50
60
Delta Theta Alpha Beta
No
rma
lize
d p
ow
er
in %
0
10
20
30
40
50
60
Delta Theta Alpha Beta
No
rma
lize
d p
ow
er
in %
♦♦
♦
♦♦
♦
♦♦
♦
♦♦
♦
♦♦
♦
♦
♦♦
♦
♦♦
♦
Vehicle α-Asarone MidazolamA
B
C
REM sleepNREM sleep
0
20
40
60
80
Delta Theta Alpha Beta
No
rma
lize
d p
ow
er
in %
Vehicle
α-Asarone
Midazolam
0
20
40
60
80
Delta Theta Alpha Beta
No
rma
lize
d p
ow
er
in %
♦♦
♦
♦♦
♦
♦♦
♦ ♦♦
♦
♦♦
♦
♦♦
♦
♦♦
♦
♦♦
♦
♦♦
♦
0
20
40
60
80
Delta Theta Alpha Beta
No
rma
lize
d p
ow
er
in %
♦♦
♦
♦♦
♦
♦♦
♦
0
10
20
30
40
50
60
Delta Theta Alpha Beta
No
rma
lize
d p
ow
er
in %
0
10
20
30
40
50
60
Delta Theta Alpha Beta
No
rma
lize
d p
ow
er
in %
0
10
20
30
40
50
60
Delta Theta Alpha Beta
No
rma
lize
d p
ow
er
in %
♦♦
♦
♦♦
♦
♦♦
♦
♦♦
♦
♦♦
♦
♦
♦♦
♦
♦♦
♦
Vehicle α-Asarone MidazolamVehicle α-Asarone Midazolam
14
3
144
6.2. Effect of optimal dose of α-Asarone on anxiety after chronic SD in
rotating wheel
In EPM test, the time spent and entries in the open arm after SD was on
par with the control values by day 20 in α-Asarone-treated rats (Fig. 35).
Moreover, the time spent in the open arm was significantly higher than the
midazolam group (Fig. 35). No change was observed in the distance travelled
and the time mobile on the maze in α-Asarone group in comparison to the
vehicle group (Fig. 35). The effects of α-Asarone on most of the parameters
were on par with that of midazolam in the sleep deprived rats (Fig. 35).
In OFT, the α-Asarone group performance was on par with their control
values and the midazolam group unlike the vehicle group by day 21 of SD
(Fig. 36). Similar trends were observed on days 1, 7 and 14 in EPM test and
on days 2, 8 and 15 in OFT.
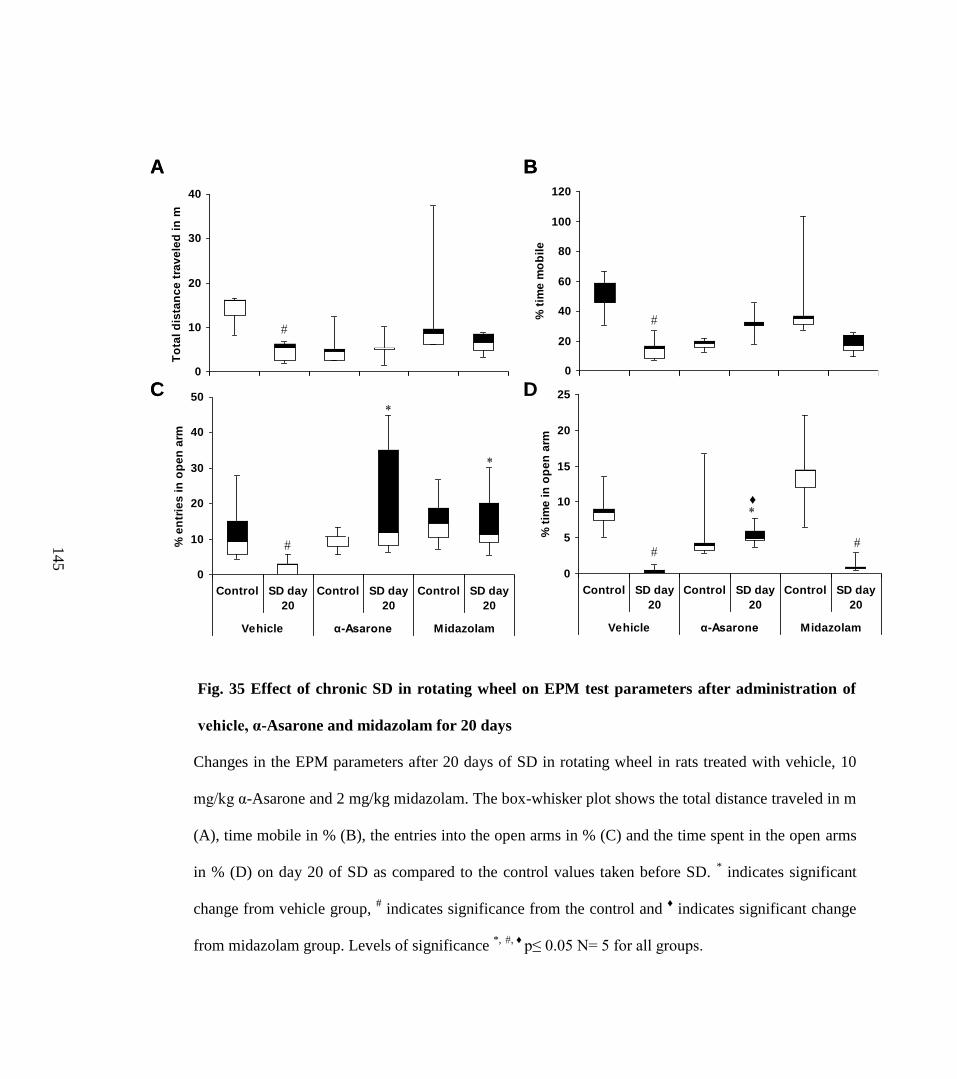
Fig. 35 Effect of chronic SD in rotating wheel on EPM test parameters after administration of
vehicle, α-Asarone and midazolam for 20 days
Changes in the EPM parameters after 20 days of SD in rotating wheel in rats treated with vehicle, 10
mg/kg α-Asarone and 2 mg/kg midazolam. The box-whisker plot shows the total distance traveled in m
(A), time mobile in % (B), the entries into the open arms in % (C) and the time spent in the open arms
in % (D) on day 20 of SD as compared to the control values taken before SD. * indicates significant
change from vehicle group, # indicates significance from the control and
♦ indicates significant change
from midazolam group. Levels of significance *,
#, ♦
p≤ 0.05 N= 5 for all groups.
0
10
20
30
40
Control SD day
20
Control SD day
20
Control SD day
20
Vehicle α-Asarone Midazolam
To
tal
dis
tan
ce
tra
ve
led
in
m
0
20
40
60
80
100
120
Control SD day
20
Control SD day
20
Control SD day
20
Vehicle α-Asarone Midazolam
% t
ime
mo
bil
e
0
10
20
30
40
50
Control SD day
20
Control SD day
20
Control SD day
20
Vehicle α-Asarone Midazolam
% e
ntr
ies
in
op
en
arm
0
5
10
15
20
25
Control SD day
20
Control SD day
20
Control SD day
20
Vehicle α-Asarone Midazolam
% t
ime
in
op
en
arm
♦
A B
C D0
10
20
30
40
Control SD day
20
Control SD day
20
Control SD day
20
Vehicle α-Asarone Midazolam
To
tal
dis
tan
ce
tra
ve
led
in
m
0
20
40
60
80
100
120
Control SD day
20
Control SD day
20
Control SD day
20
Vehicle α-Asarone Midazolam
% t
ime
mo
bil
e
0
10
20
30
40
50
Control SD day
20
Control SD day
20
Control SD day
20
Vehicle α-Asarone Midazolam
% e
ntr
ies
in
op
en
arm
0
10
20
30
40
50
Control SD day
20
Control SD day
20
Control SD day
20
Vehicle α-Asarone Midazolam
% e
ntr
ies
in
op
en
arm
0
5
10
15
20
25
Control SD day
20
Control SD day
20
Control SD day
20
Vehicle α-Asarone Midazolam
% t
ime
in
op
en
arm
♦
A B
C D
14
5
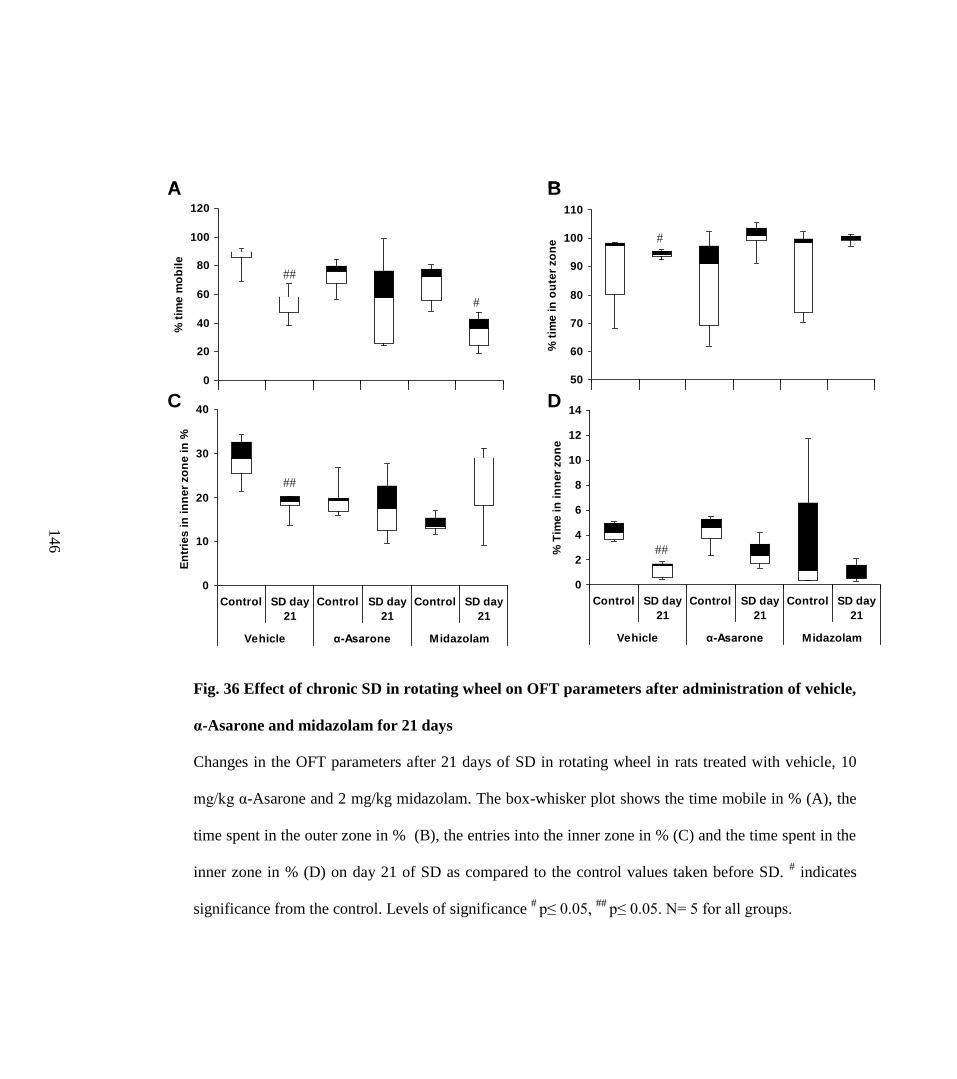
Fig. 36 Effect of chronic SD in rotating wheel on OFT parameters after administration of vehicle,
α-Asarone and midazolam for 21 days
Changes in the OFT parameters after 21 days of SD in rotating wheel in rats treated with vehicle, 10
mg/kg α-Asarone and 2 mg/kg midazolam. The box-whisker plot shows the time mobile in % (A), the
time spent in the outer zone in % (B), the entries into the inner zone in % (C) and the time spent in the
inner zone in % (D) on day 21 of SD as compared to the control values taken before SD. # indicates
significance from the control. Levels of significance #
p≤ 0.05, ##
p≤ 0.05. N= 5 for all groups.
0
20
40
60
80
100
120
Control SD day
21
Control SD day
21
Control SD day
21
Vehicle α-Asarone Midazolam
% t
ime
mo
bil
e
50
60
70
80
90
100
110
Control SD day
21
Control SD day
21
Control SD day
21
Vehicle α-Asarone Midazolam
% t
ime
in
ou
ter
zo
ne
0
10
20
30
40
Control SD day
21
Control SD day
21
Control SD day
21
Vehicle α-Asarone Midazolam
En
trie
s i
n i
nn
er
zo
ne
in
%
0
2
4
6
8
10
12
14
Control SD day
21
Control SD day
21
Control SD day
21
Vehicle α-Asarone Midazolam
% T
ime
in
in
ne
r zo
ne
A B
C D
0
20
40
60
80
100
120
Control SD day
21
Control SD day
21
Control SD day
21
Vehicle α-Asarone Midazolam
% t
ime
mo
bil
e
50
60
70
80
90
100
110
Control SD day
21
Control SD day
21
Control SD day
21
Vehicle α-Asarone Midazolam
% t
ime
in
ou
ter
zo
ne
0
10
20
30
40
Control SD day
21
Control SD day
21
Control SD day
21
Vehicle α-Asarone Midazolam
En
trie
s i
n i
nn
er
zo
ne
in
%
0
2
4
6
8
10
12
14
Control SD day
21
Control SD day
21
Control SD day
21
Vehicle α-Asarone Midazolam
% T
ime
in
in
ne
r zo
ne
0
20
40
60
80
100
120
Control SD day
21
Control SD day
21
Control SD day
21
Vehicle α-Asarone Midazolam
% t
ime
mo
bil
e
0
20
40
60
80
100
120
Control SD day
21
Control SD day
21
Control SD day
21
Vehicle α-Asarone Midazolam
% t
ime
mo
bil
e
50
60
70
80
90
100
110
Control SD day
21
Control SD day
21
Control SD day
21
Vehicle α-Asarone Midazolam
% t
ime
in
ou
ter
zo
ne
50
60
70
80
90
100
110
Control SD day
21
Control SD day
21
Control SD day
21
Vehicle α-Asarone Midazolam
% t
ime
in
ou
ter
zo
ne
0
10
20
30
40
Control SD day
21
Control SD day
21
Control SD day
21
Vehicle α-Asarone Midazolam
En
trie
s i
n i
nn
er
zo
ne
in
%
0
2
4
6
8
10
12
14
Control SD day
21
Control SD day
21
Control SD day
21
Vehicle α-Asarone Midazolam
% T
ime
in
in
ne
r zo
ne
A B
C D
14
6
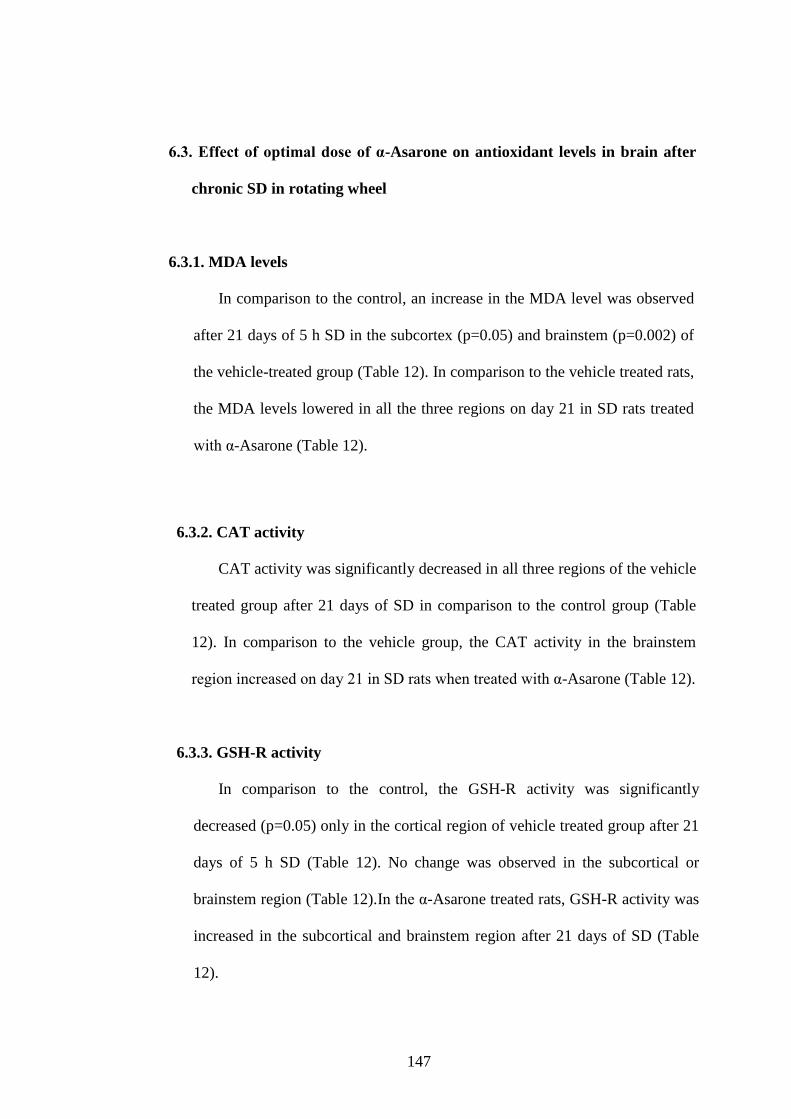
147
6.3. Effect of optimal dose of α-Asarone on antioxidant levels in brain after
chronic SD in rotating wheel
6.3.1. MDA levels
In comparison to the control, an increase in the MDA level was observed
after 21 days of 5 h SD in the subcortex (p=0.05) and brainstem (p=0.002) of
the vehicle-treated group (Table 12). In comparison to the vehicle treated rats,
the MDA levels lowered in all the three regions on day 21 in SD rats treated
with α-Asarone (Table 12).
6.3.2. CAT activity
CAT activity was significantly decreased in all three regions of the vehicle
treated group after 21 days of SD in comparison to the control group (Table
12). In comparison to the vehicle group, the CAT activity in the brainstem
region increased on day 21 in SD rats when treated with α-Asarone (Table 12).
6.3.3. GSH-R activity
In comparison to the control, the GSH-R activity was significantly
decreased (p=0.05) only in the cortical region of vehicle treated group after 21
days of 5 h SD (Table 12). No change was observed in the subcortical or
brainstem region (Table 12).In the α-Asarone treated rats, GSH-R activity was
increased in the subcortical and brainstem region after 21 days of SD (Table
12).

148
6.3.4. SOD activity
In all the three regions, the activity of SOD was significantly increased
after 21 days of 5 h SD in rats treated with vehicle in comparison to the
untreated control (Table 12). No change was observed in SOD activity after α-
Asarone administration in SD groups after 21 days (Table 12).
6.3.5. GSH-Px activity
In cortex and subcortex, in comparison to the untreated control, the GSH-
Px activity was slightly increased after 21 days of 5 h SD in vehicle treated
rats (Table 12). No change was observed in the brainstem region (Table 12).
No change was observed in GSH-Px activity after α-Asarone administration in
SD groups after 21 days (Table 12).
6.3.6. GSH levels
GSH levels were significantly lowered in all the three regions after 21
days of 5 h SD in vehicle treated rats (Table 12). In comparison to the vehicle
group, GSH level was increased in all the regions after 21 days in α-Asarone
group (Table 12).
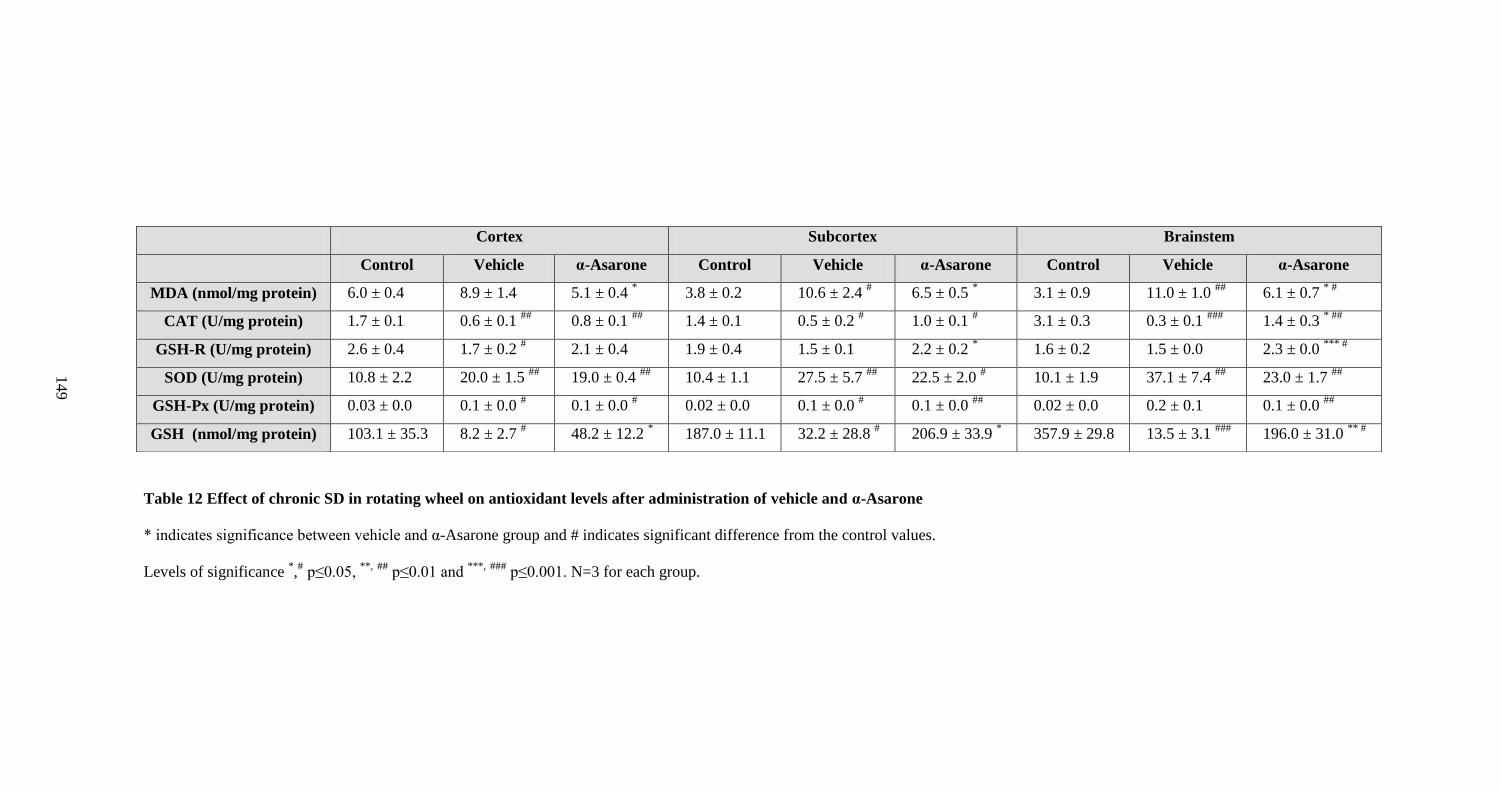
Table 12 Effect of chronic SD in rotating wheel on antioxidant levels after administration of vehicle and α-Asarone
* indicates significance between vehicle and α-Asarone group and # indicates significant difference from the control values.
Levels of significance *,# p≤0.05,
**, ##
p≤0.01 and ***,
###
p≤0.001. N=3 for each group.
Cortex Subcortex Brainstem
Control Vehicle α-Asarone Control Vehicle α-Asarone Control Vehicle α-Asarone
MDA (nmol/mg protein) 6.0 ± 0.4 8.9 ± 1.4 5.1 ± 0.4 * 3.8 ± 0.2 10.6 ± 2.4
# 6.5 ± 0.5
* 3.1 ± 0.9 11.0 ± 1.0
## 6.1 ± 0.7
* #
CAT (U/mg protein) 1.7 ± 0.1 0.6 ± 0.1 ##
0.8 ± 0.1 ##
1.4 ± 0.1 0.5 ± 0.2 # 1.0 ± 0.1
# 3.1 ± 0.3 0.3 ± 0.1
### 1.4 ± 0.3
* ##
GSH-R (U/mg protein) 2.6 ± 0.4 1.7 ± 0.2 # 2.1 ± 0.4 1.9 ± 0.4 1.5 ± 0.1 2.2 ± 0.2
* 1.6 ± 0.2 1.5 ± 0.0 2.3 ± 0.0
*** #
SOD (U/mg protein) 10.8 ± 2.2 20.0 ± 1.5 ##
19.0 ± 0.4 ##
10.4 ± 1.1 27.5 ± 5.7 ##
22.5 ± 2.0 # 10.1 ± 1.9 37.1 ± 7.4
## 23.0 ± 1.7
##
GSH-Px (U/mg protein) 0.03 ± 0.0 0.1 ± 0.0 # 0.1 ± 0.0
# 0.02 ± 0.0 0.1 ± 0.0
# 0.1 ± 0.0
## 0.02 ± 0.0 0.2 ± 0.1 0.1 ± 0.0
##
GSH (nmol/mg protein) 103.1 ± 35.3 8.2 ± 2.7 # 48.2 ± 12.2
* 187.0 ± 11.1 32.2 ± 28.8
# 206.9 ± 33.9
* 357.9 ± 29.8 13.5 ± 3.1
### 196.0 ± 31.0
** #
14
9
150
7. Objective 5: To understand the mechanism of action of α-Asarone by
examining the relationship of Thy and Tbody with sleep.
7.1. Relationship of Thy and Tbody with S-W after administration of various
doses of α-Asarone
A significant negative correlation was observed between the NREM sleep
bout duration and Thy after the administration of doses 2 and 10 mg/kg α-
Asarone and vehicle (Fig. 37). The strength of association of NREM sleep
bout duration with Thy was found to be higher (61 %) after administering 10
mg/kg of α-Asarone in comparison to the vehicle (Fig. 37). Similarly, the
correlation between the Tbody and NREM sleep bout duration was also
improved at this dose (Fig. 37). Moreover, NREM bouts of longer duration
were increased after administration of 10 mg/kg α-Asarone (Fig. 37).
A weak positive correlation was observed between the REM sleep bout
duration and Thy after administration of vehicle, and α-Asarone at doses of 2
and 10 mg/kg (Fig. 39). After administering 40 and 80 mg/kg α-Asarone, no
significant correlation was observed between the NREM and REM bout
duration and Thy and Tbody (Fig. 37 and 39). On the other hand, 120 mg/kg α-
Asarone restored the negative correlation between NREM bout duration and
Thy and Tbody, however, with an increase in the NREM sleep bouts of shorter
duration (Fig. 37 and 38A).
The average Thy and Tbody during the NREM bouts of longer duration were
37.010.2 and 36.930.1 ºC respectively after all treatments (Fig. 38B). Tbody
showed a greater fall at higher doses of α-Asarone. The average difference

151
between Thy and Tbody after administering 10 mg/kg α-Asarone was found to
be 0.070.03 ºC for 7 h. On the other hand, higher doses of α-Asarone
produced an increased difference between Thy and Tbody due to a larger drop in
Tbody reaching up to 0.360.04 ºC at 120 mg/kg α-Asarone.
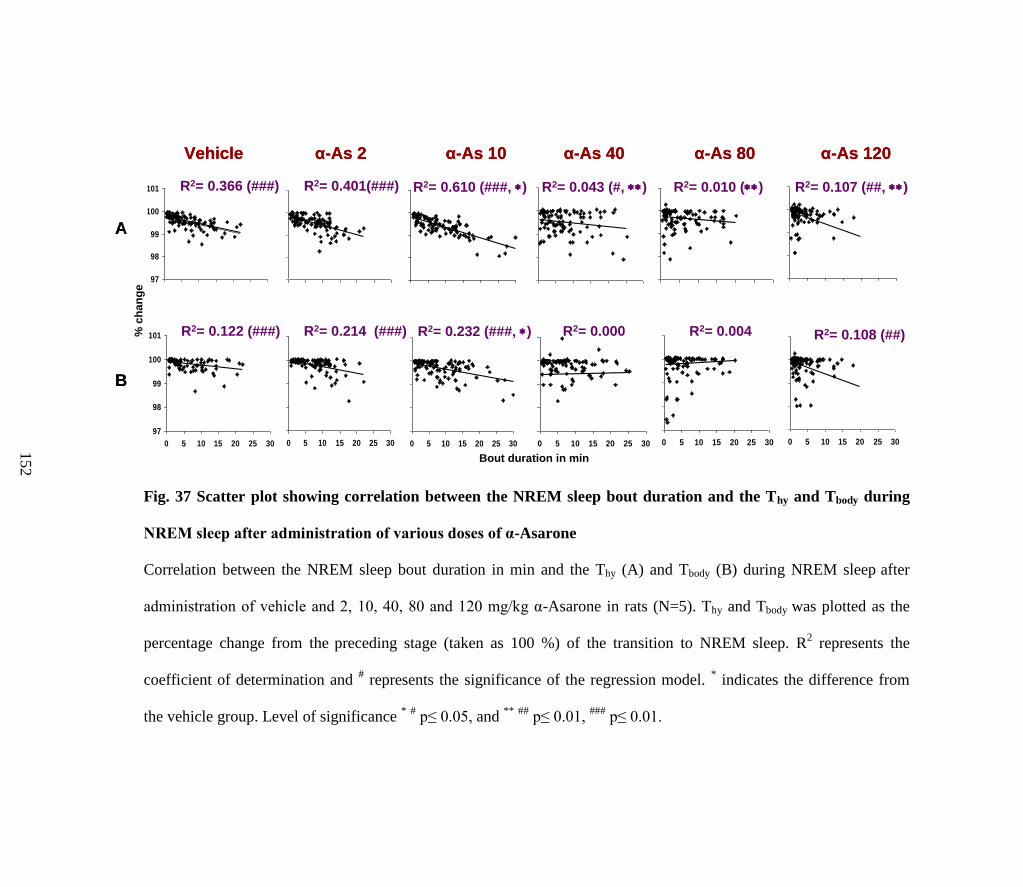
Fig. 37 Scatter plot showing correlation between the NREM sleep bout duration and the Thy and Tbody during
NREM sleep after administration of various doses of α-Asarone
Correlation between the NREM sleep bout duration in min and the Thy (A) and Tbody (B) during NREM sleep after
administration of vehicle and 2, 10, 40, 80 and 120 mg/kg α-Asarone in rats (N=5). Thy and Tbody was plotted as the
percentage change from the preceding stage (taken as 100 %) of the transition to NREM sleep. R2 represents the
coefficient of determination and # represents the significance of the regression model.
* indicates the difference from
the vehicle group. Level of significance * # p≤ 0.05, and
** ##
p≤ 0.01, ###
p≤ 0.01.
97
98
99
100
101
0 5 10 15 20 25 30
% c
ha
ng
e
97
98
99
100
101
0 5 10 15 20 25 30
% c
ha
ng
e
97
98
99
100
101
0 5 10 15 20 25 30
% c
ha
ng
e
97
98
99
100
101
0 5 10 15 20 25 30
% c
ha
ng
e
97
98
99
100
101
0 5 10 15 20 25 30
% c
ha
ng
e
97
98
99
100
101
0 5 10 15 20 25 30
% c
ha
ng
e
R2= 0.366 (###) R2= 0.401(###) R2= 0.610 (###, ) R2= 0.043 (#, ) R2= 0.010 () R2= 0.107 (##, )
Vehicle α-As 2 α-As 10 α-As 40 α-As 80 α-As 120
97
98
99
100
101
0 5 10 15 20 25 30
% c
ha
ng
e
97
98
99
100
101
0 5 10 15 20 25 30
% c
ha
ng
e
97
98
99
100
101
0 5 10 15 20 25 30
% c
ha
ng
e
97
98
99
100
101
0 5 10 15 20 25 30
% c
ha
ng
e
97
98
99
100
101
0 5 10 15 20 25 30
% c
ha
ng
e
97
98
99
100
101
0 5 10 15 20 25 30
% c
ha
ng
e
R2= 0.122 (###) R2= 0.214 (###) R2= 0.232 (###, ) R2= 0.000 R2= 0.004 R2= 0.108 (##)% c
ha
ng
e
A
B
Bout duration in min
97
98
99
100
101
0 5 10 15 20 25 30
% c
ha
ng
e
97
98
99
100
101
0 5 10 15 20 25 30
% c
ha
ng
e
97
98
99
100
101
0 5 10 15 20 25 30
% c
ha
ng
e
97
98
99
100
101
0 5 10 15 20 25 30
% c
ha
ng
e
97
98
99
100
101
0 5 10 15 20 25 30
% c
ha
ng
e
97
98
99
100
101
0 5 10 15 20 25 30
% c
ha
ng
e
R2= 0.366 (###) R2= 0.401(###) R2= 0.610 (###, ) R2= 0.043 (#, ) R2= 0.010 () R2= 0.107 (##, )
Vehicle α-As 2 α-As 10 α-As 40 α-As 80 α-As 120
97
98
99
100
101
0 5 10 15 20 25 30
% c
ha
ng
e
97
98
99
100
101
0 5 10 15 20 25 30
% c
ha
ng
e
97
98
99
100
101
0 5 10 15 20 25 30
% c
ha
ng
e
97
98
99
100
101
0 5 10 15 20 25 30
% c
ha
ng
e
97
98
99
100
101
0 5 10 15 20 25 30
% c
ha
ng
e
97
98
99
100
101
0 5 10 15 20 25 30
% c
ha
ng
e
R2= 0.122 (###) R2= 0.214 (###) R2= 0.232 (###, ) R2= 0.000 R2= 0.004 R2= 0.108 (##)% c
ha
ng
e
A
B
Bout duration in min
15
2
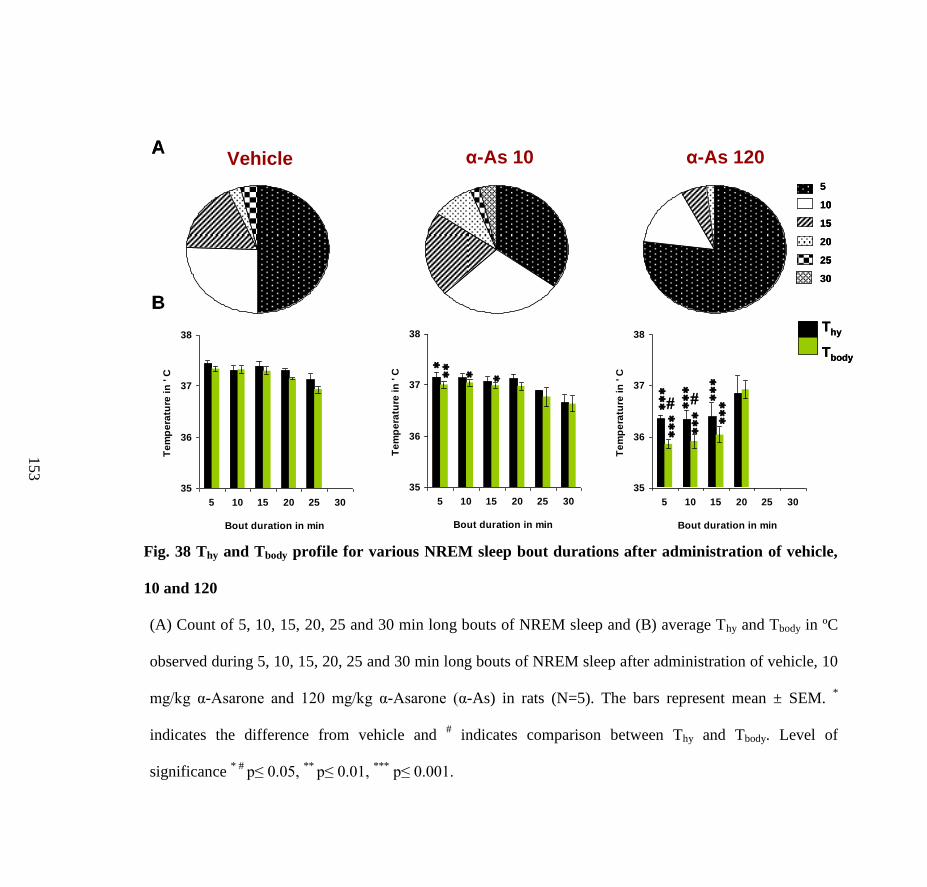
Fig. 38 Thy and Tbody profile for various NREM sleep bout durations after administration of vehicle,
10 and 120
(A) Count of 5, 10, 15, 20, 25 and 30 min long bouts of NREM sleep and (B) average Thy and Tbody in ºC
observed during 5, 10, 15, 20, 25 and 30 min long bouts of NREM sleep after administration of vehicle, 10
mg/kg α-Asarone and 120 mg/kg α-Asarone (α-As) in rats (N=5). The bars represent mean ± SEM. *
indicates the difference from vehicle and # indicates comparison between Thy and Tbody. Level of
significance * #
p≤ 0.05, **
p≤ 0.01, ***
p≤ 0.001.
5
10
15
20
25
30
Vehicle α-As 120α-As 10A
B
35
36
37
38
5 10 15 20 25 30
Bout duration in min
Te
mp
era
ture
in
' C
35
36
37
38
5 10 15 20 25 30
Bout duration in min
Te
mp
era
ture
in
' C
35
36
37
38
5 10 15 20 25 30
Bout duration in min
Te
mp
era
ture
in
' C
Thy
Tbody
5
10
15
20
25
30
5
10
15
20
25
30
Vehicle α-As 120α-As 10A
B
35
36
37
38
5 10 15 20 25 30
Bout duration in min
Te
mp
era
ture
in
' C
35
36
37
38
5 10 15 20 25 30
Bout duration in min
Te
mp
era
ture
in
' C
35
36
37
38
5 10 15 20 25 30
Bout duration in min
Te
mp
era
ture
in
' C
Thy
Tbody
Thy
Tbody
15
3
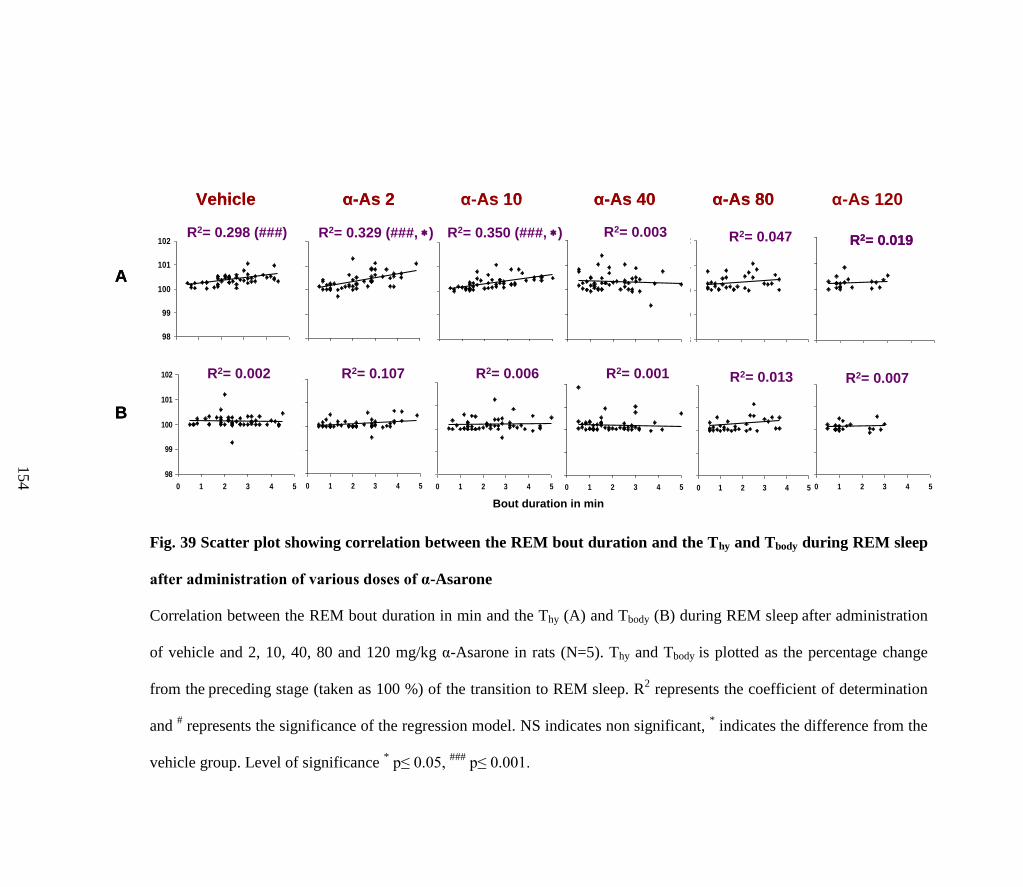
Fig. 39 Scatter plot showing correlation between the REM bout duration and the Thy and Tbody during REM sleep
after administration of various doses of α-Asarone
Correlation between the REM bout duration in min and the Thy (A) and Tbody (B) during REM sleep after administration
of vehicle and 2, 10, 40, 80 and 120 mg/kg α-Asarone in rats (N=5). Thy and Tbody is plotted as the percentage change
from the preceding stage (taken as 100 %) of the transition to REM sleep. R2 represents the coefficient of determination
and # represents the significance of the regression model. NS indicates non significant,
* indicates the difference from the
vehicle group. Level of significance * p≤ 0.05,
### p≤ 0.001.
98
99
100
101
102
0 1 2 3 4 5
98
99
100
101
102
0 1 2 3 4 5
98
99
100
101
102
0 1 2 3 4 5
98
99
100
101
102
0 1 2 3 4 5
98
99
100
101
102
0 1 2 3 4 5
98
99
100
101
102
0 1 2 3 4 5
R2= 0.298 (###) R2= 0.329 (###, ) R2= 0.350 (###, ) R2= 0.003 R2= 0.047 R2= 0.019
98
99
100
101
102
0 1 2 3 4 5
98
99
100
101
102
0 1 2 3 4 5
98
99
100
101
102
0 1 2 3 4 5
98
99
100
101
102
0 1 2 3 4 5
98
99
100
101
102
0 1 2 3 4 5
R2= 0.107 R2= 0.006 R2= 0.001 R2= 0.013 R2= 0.007
Bout duration in min
98
99
100
101
102
0 1 2 3 4 5
R2= 0.002
Vehicle α-As 2 α-As 10 α-As 40 α-As 80 α-As 120
A
B
98
99
100
101
102
0 1 2 3 4 5
98
99
100
101
102
0 1 2 3 4 5
98
99
100
101
102
0 1 2 3 4 5
98
99
100
101
102
0 1 2 3 4 5
98
99
100
101
102
0 1 2 3 4 5
98
99
100
101
102
0 1 2 3 4 5
R2= 0.298 (###) R2= 0.329 (###, ) R2= 0.350 (###, ) R2= 0.003 R2= 0.047 R2= 0.019
98
99
100
101
102
0 1 2 3 4 5
98
99
100
101
102
0 1 2 3 4 5
98
99
100
101
102
0 1 2 3 4 5
98
99
100
101
102
0 1 2 3 4 5
98
99
100
101
102
0 1 2 3 4 5
R2= 0.107 R2= 0.006 R2= 0.001 R2= 0.013 R2= 0.007
Bout duration in min
98
99
100
101
102
0 1 2 3 4 5
R2= 0.002
98
99
100
101
102
0 1 2 3 4 5
98
99
100
101
102
0 1 2 3 4 5
98
99
100
101
102
0 1 2 3 4 5
98
99
100
101
102
0 1 2 3 4 5
98
99
100
101
102
0 1 2 3 4 5
98
99
100
101
102
0 1 2 3 4 5
R2= 0.298 (###) R2= 0.329 (###, ) R2= 0.350 (###, ) R2= 0.003 R2= 0.047 R2= 0.019
98
99
100
101
102
0 1 2 3 4 5
98
99
100
101
102
0 1 2 3 4 5
98
99
100
101
102
0 1 2 3 4 5
98
99
100
101
102
0 1 2 3 4 5
98
99
100
101
102
0 1 2 3 4 5
R2= 0.107 R2= 0.006 R2= 0.001 R2= 0.013 R2= 0.007
Bout duration in min
98
99
100
101
102
0 1 2 3 4 5
R2= 0.002
98
99
100
101
102
0 1 2 3 4 5
98
99
100
101
102
0 1 2 3 4 5
98
99
100
101
102
0 1 2 3 4 5
98
99
100
101
102
0 1 2 3 4 5
98
99
100
101
102
0 1 2 3 4 5
R2= 0.298 (###) R2= 0.329 (###, ) R2= 0.350 (###, ) R2= 0.003 R2= 0.047 R2= 0.019
98
99
100
101
102
0 1 2 3 4 5
98
99
100
101
102
0 1 2 3 4 5
98
99
100
101
102
0 1 2 3 4 5
98
99
100
101
102
0 1 2 3 4 5
98
99
100
101
102
0 1 2 3 4 5
R2= 0.107 R2= 0.006 R2= 0.001 R2= 0.013 R2= 0.007
Bout duration in min
98
99
100
101
102
0 1 2 3 4 5
R2= 0.002
Vehicle α-As 2 α-As 10 α-As 40 α-As 80 α-As 120
A
B
15
4
155
7.2. Relationship of Thy and Tbody with S-W after chronic administration of
optimum dose of α-Asarone
A significant negative correlation was observed between the NREM sleep
bout duration and Thy after the administration of 10 mg/kg α-Asarone and
vehicle (Fig. 40). The strength of association of NREM sleep bout duration
with Thy was found to be higher after administering 10 mg/kg of α-Asarone on
days 7 (37 %) and 21 (40 %) in comparison to the vehicle (Fig. 40). Similarly,
the correlation between the Tbody and NREM sleep bout duration was also
marginally improved after α-Asarone administration (Fig. 40). Positive
correlation between REM bout duration and Thy remained unaltered for 3
weeks.
The number of NREM bouts of longer duration (>20 min) was increased
after the administration of 10 mg/kg α-Asarone (Fig. 41A). These bouts were
observed when the average Thy and Tbody were 36.910.1 and 36.940.1 ºC
respectively for both the treatments (Fig. 41B). During shorter bouts of NREM
sleep (<20 min), a significant difference was observed between Thy and Tbody
after administering vehicle. However, this difference was not significant under
α-Asarone treatment for 7 and 21 days (Fig. 41B). The average difference
between Thy and Tbody after administering 10 mg/kg α-Asarone was found to
be 0.050.01 ºC for 3 weeks and 0.130.02 ºC after vehicle treatment.
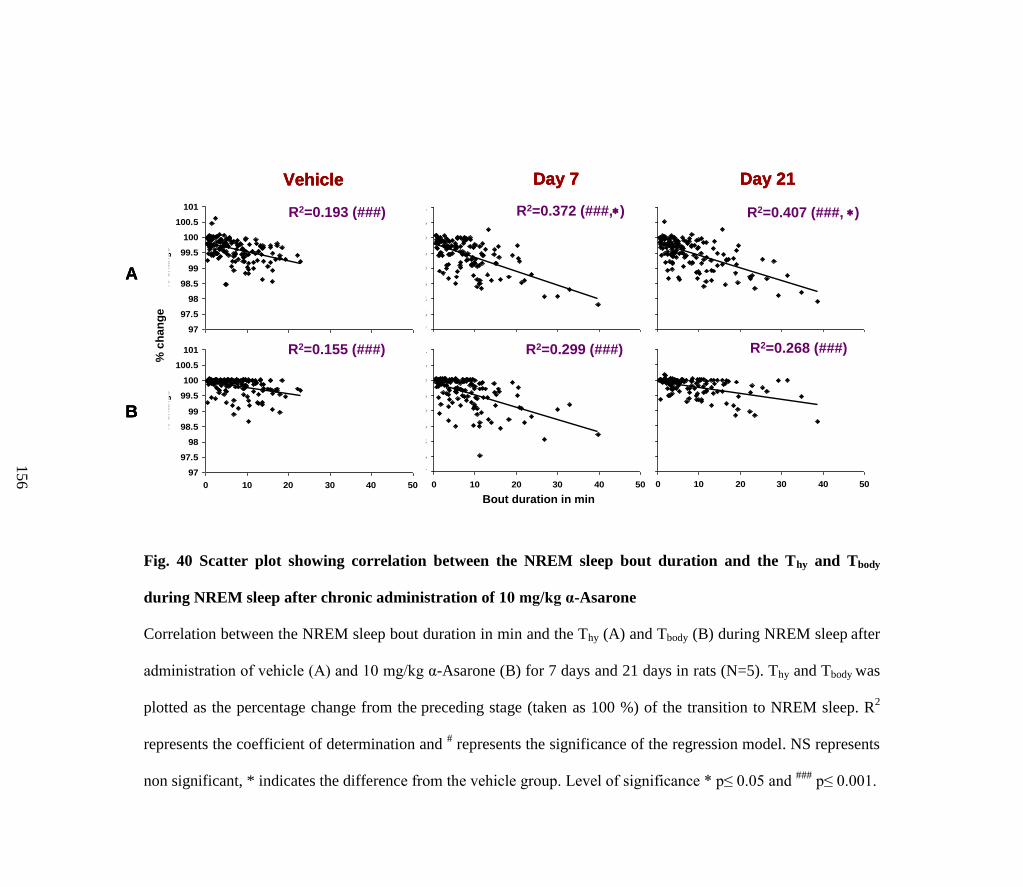
Fig. 40 Scatter plot showing correlation between the NREM sleep bout duration and the Thy and Tbody
during NREM sleep after chronic administration of 10 mg/kg α-Asarone
Correlation between the NREM sleep bout duration in min and the Thy (A) and Tbody (B) during NREM sleep after
administration of vehicle (A) and 10 mg/kg α-Asarone (B) for 7 days and 21 days in rats (N=5). Thy and Tbody was
plotted as the percentage change from the preceding stage (taken as 100 %) of the transition to NREM sleep. R2
represents the coefficient of determination and # represents the significance of the regression model. NS represents
non significant, * indicates the difference from the vehicle group. Level of significance * p≤ 0.05 and ###
p≤ 0.001.
97
97.5
98
98.5
99
99.5
100
100.5
101
0 10 20 30 40 50
NREM bout duration in min
% c
han
ge
97
97.5
98
98.5
99
99.5
100
100.5
101
0 10 20 30 40 50
NREM bout duration in min
% c
han
ge
97
97.5
98
98.5
99
99.5
100
100.5
101
0 10 20 30 40 50
NREM bout duration in min
% c
han
ge
97
97.5
98
98.5
99
99.5
100
100.5
101
0 10 20 30 40 50
NREM bout duration in min
% c
han
ge
97
97.5
98
98.5
99
99.5
100
100.5
101
0 10 20 30 40 50
NREM bout duration in min
% c
han
ge
97
97.5
98
98.5
99
99.5
100
100.5
101
0 10 20 30 40 50
NREM bout duration in min
% c
han
ge
R2=0.193 (###)
R2=0.155 (###)
R2=0.372 (###,)
R2=0.299 (###)
R2=0.407 (###, )
R2=0.268 (###)
Vehicle Day 7 Day 21
Bout duration in min
A
B
% c
ha
ng
e
97
97.5
98
98.5
99
99.5
100
100.5
101
0 10 20 30 40 50
NREM bout duration in min
% c
han
ge
97
97.5
98
98.5
99
99.5
100
100.5
101
0 10 20 30 40 50
NREM bout duration in min
% c
han
ge
97
97.5
98
98.5
99
99.5
100
100.5
101
0 10 20 30 40 50
NREM bout duration in min
% c
han
ge
97
97.5
98
98.5
99
99.5
100
100.5
101
0 10 20 30 40 50
NREM bout duration in min
% c
han
ge
97
97.5
98
98.5
99
99.5
100
100.5
101
0 10 20 30 40 50
NREM bout duration in min
% c
han
ge
97
97.5
98
98.5
99
99.5
100
100.5
101
0 10 20 30 40 50
NREM bout duration in min
% c
han
ge
R2=0.193 (###)
R2=0.155 (###)
R2=0.372 (###,)
R2=0.299 (###)
R2=0.407 (###, )
R2=0.268 (###)
Vehicle Day 7 Day 21
Bout duration in min
A
B
97
97.5
98
98.5
99
99.5
100
100.5
101
0 10 20 30 40 50
NREM bout duration in min
% c
han
ge
97
97.5
98
98.5
99
99.5
100
100.5
101
0 10 20 30 40 50
NREM bout duration in min
% c
han
ge
97
97.5
98
98.5
99
99.5
100
100.5
101
0 10 20 30 40 50
NREM bout duration in min
% c
han
ge
97
97.5
98
98.5
99
99.5
100
100.5
101
0 10 20 30 40 50
NREM bout duration in min
% c
han
ge
97
97.5
98
98.5
99
99.5
100
100.5
101
0 10 20 30 40 50
NREM bout duration in min
% c
han
ge
97
97.5
98
98.5
99
99.5
100
100.5
101
0 10 20 30 40 50
NREM bout duration in min
% c
han
ge
R2=0.193 (###)
R2=0.155 (###)
R2=0.372 (###,)
R2=0.299 (###)
R2=0.407 (###, )
R2=0.268 (###)
Vehicle Day 7 Day 21
Bout duration in min
A
B
% c
ha
ng
e
15
6
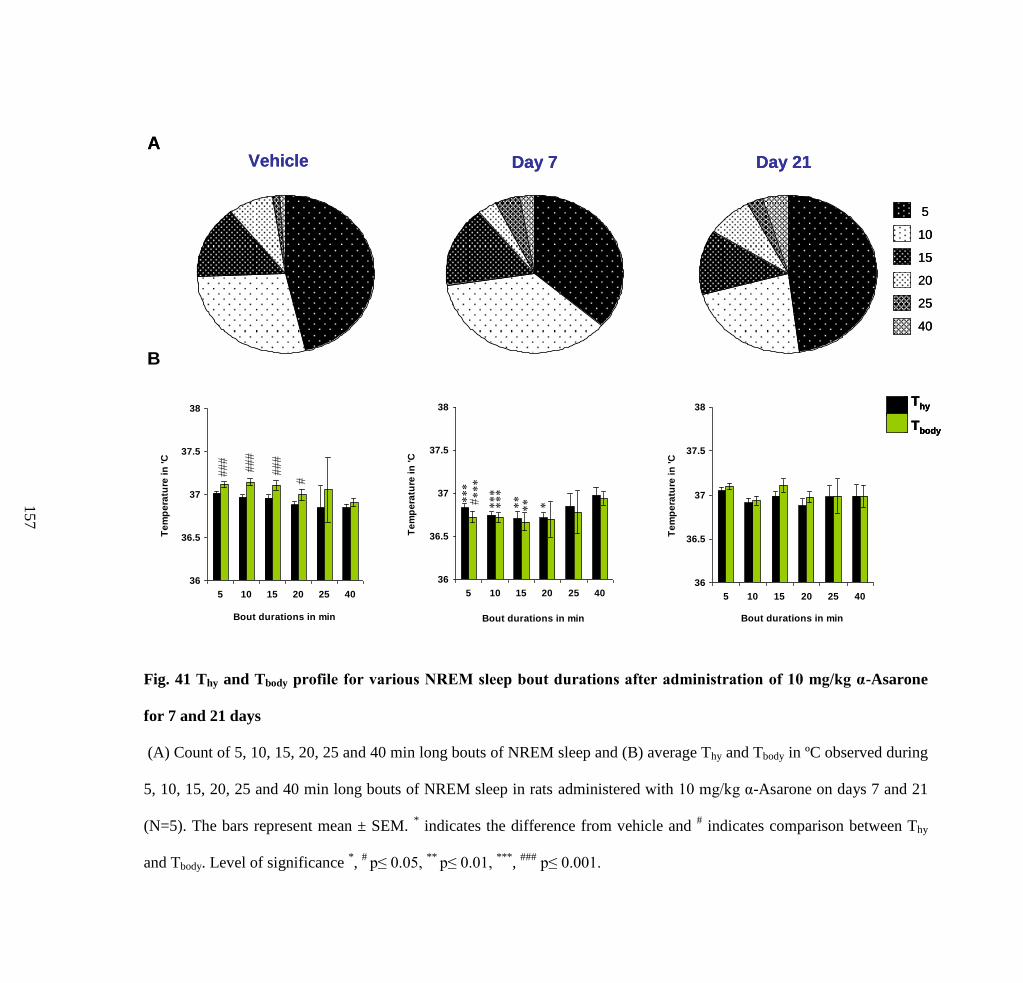
Fig. 41 Thy and Tbody profile for various NREM sleep bout durations after administration of 10 mg/kg α-Asarone
for 7 and 21 days
(A) Count of 5, 10, 15, 20, 25 and 40 min long bouts of NREM sleep and (B) average Thy and Tbody in ºC observed during
5, 10, 15, 20, 25 and 40 min long bouts of NREM sleep in rats administered with 10 mg/kg α-Asarone on days 7 and 21
(N=5). The bars represent mean ± SEM. * indicates the difference from vehicle and
# indicates comparison between Thy
and Tbody. Level of significance *,
# p≤ 0.05,
** p≤ 0.01,
***,
### p≤ 0.001.
Vehicle Day 7 Day 21
5
10
15
20
25
40
A
B
36
36.5
37
37.5
38
5 10 15 20 25 40
Bout durations in min
Te
mp
era
ture
in
'C
36
36.5
37
37.5
38
5 10 15 20 25 40
Bout durations in min
Te
mp
era
ture
in
'C
36
36.5
37
37.5
38
5 10 15 20 25 40
Bout durations in min
Te
mp
era
ture
in
'C
Thy
Tbody
Vehicle Day 7 Day 21
5
10
15
20
25
40
5
10
15
20
25
40
A
B
36
36.5
37
37.5
38
5 10 15 20 25 40
Bout durations in min
Te
mp
era
ture
in
'C
36
36.5
37
37.5
38
5 10 15 20 25 40
Bout durations in min
Te
mp
era
ture
in
'C
36
36.5
37
37.5
38
5 10 15 20 25 40
Bout durations in min
Te
mp
era
ture
in
'C
Thy
Tbody
Thy
Tbody
15
7
158
7.3. Relationship of Thy and Tbody with S-W in vehicle-, α-Asarone- and
midazolam-treated rats acutely sleep deprived by gentle handling
The negative correlation between the NREM sleep bout duration and Thy
during the recovery period was the highest (p< 0.05) in the α-Asarone group
on both days 1 (68 %) and 5 (62 %) of SD in comparison to the vehicle and
the midazolam group (Fig. 42). On the other hand a positive correlation (24
%) was observed between the REM sleep bout duration and Thy only in the α-
Asarone group during the recovery period on day 5 of SD (Fig. 43). The
average Thy and Tbody observed during the longer bouts (> 20 min) in the α-
Asarone-treated SD group was 36.7 0.2 and 36.7 0.2 ºC on days 1 and 36.9
0.2 and 37.1 0.1 ºC on day 5.
7.4. Relationship of Thy and Tbody with S-W in vehicle-, α-Asarone- and
midazolam-treated rats chronically sleep deprived in rotating wheel
The negative correlation between the NREM sleep bout duration and Thy
during the recovery period was higher in the α-Asarone group after 14 and 20
days of SD in comparison to both vehicle and midazolam group (Fig. 44).
Midazolam lowered the negative correlation between the NREM sleep bout
duration and Thy (Fig. 44). This persisted even after 21 days post SD (Fig. 44).
On the other hand a positive correlation between the REM sleep bout duration
and Thy was observed during the recovery period for 3 weeks of SD only in the
α-Asarone group (Fig. 45). Midazolam lowered the correlation by day 20 of
SD (Fig. 45). Post SD, the positive correlation between the REM sleep bout
duration and Thy was restored in all three groups (Fig. 45). The average Thy

159
and Tbody observed during the longer bouts (> 20 min) in the α-Asarone-treated
SD group was 37.4 0.5 and 37.5 0.5 ºC on day 1, 37.0 0.5 and 37.1 0.3
ºC on day 7, 36.9 0.6 and 37.0 0.1 ºC on day 14 and 37.4 0.3 and 37.5
0.3 ºC on day 20 of SD.
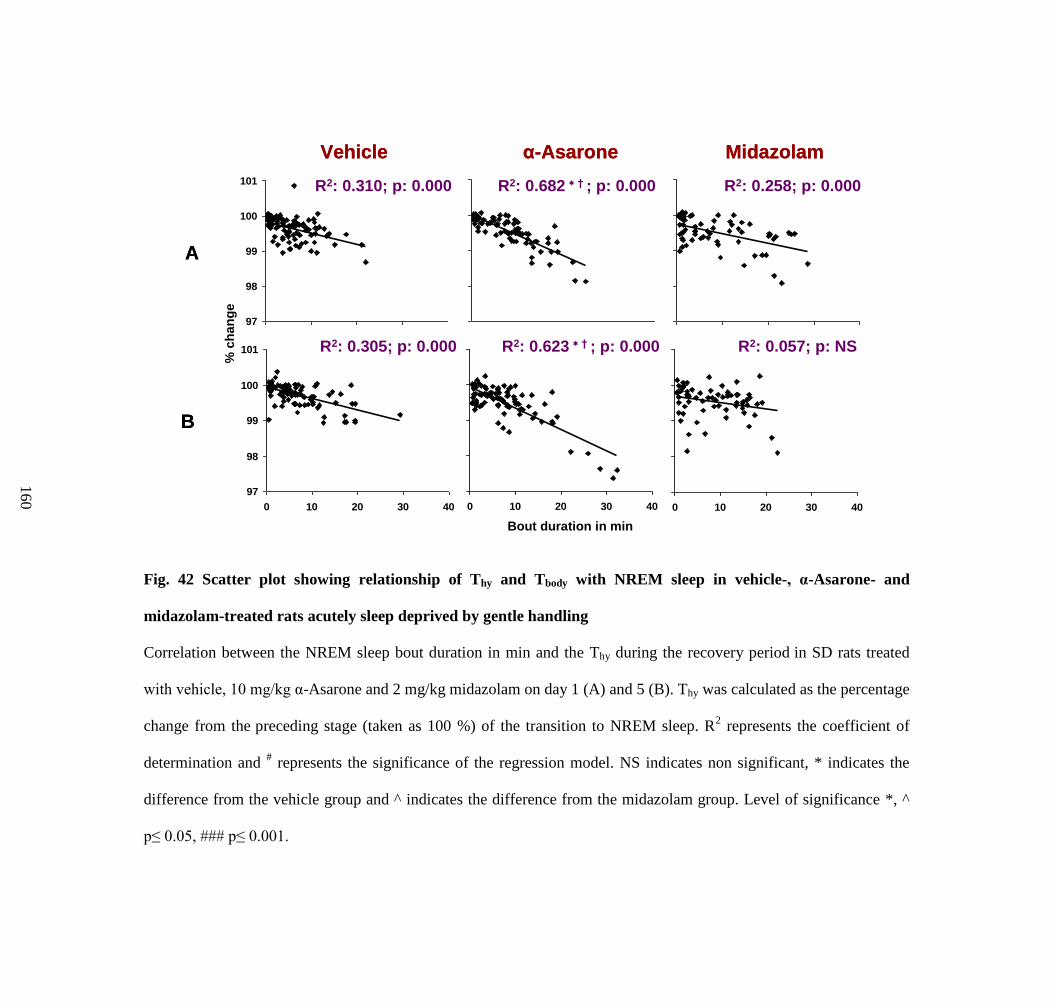
Fig. 42 Scatter plot showing relationship of Thy and Tbody with NREM sleep in vehicle-, α-Asarone- and
midazolam-treated rats acutely sleep deprived by gentle handling
Correlation between the NREM sleep bout duration in min and the Thy during the recovery period in SD rats treated
with vehicle, 10 mg/kg α-Asarone and 2 mg/kg midazolam on day 1 (A) and 5 (B). Thy was calculated as the percentage
change from the preceding stage (taken as 100 %) of the transition to NREM sleep. R2 represents the coefficient of
determination and # represents the significance of the regression model. NS indicates non significant, * indicates the
difference from the vehicle group and ^ indicates the difference from the midazolam group. Level of significance *, ^
p≤ 0.05, ### p≤ 0.001.
A
B
97
98
99
100
101
0 10 20 30 40
Bout duration in min
% c
han
ge
97
98
99
100
101
0 10 20 30 40
Bout duration in min
% c
han
ge
97
98
99
100
101
0 10 20 30 40
Bout duration in min
% c
han
ge
97
98
99
100
101
0 10 20 30 40
Bout duration in min
% c
han
ge
97
98
99
100
101
0 10 20 30 40
Bout duration in min
% c
han
ge
97
98
99
100
101
0 10 20 30 40
Bout duration in min
% c
han
ge
Vehicle α-Asarone Midazolam
R2: 0.310; p: 0.000 R2: 0.258; p: 0.000R2: 0.682 † ; p: 0.000
R2: 0.305; p: 0.000 R2: 0.623 † ; p: 0.000
Bout duration in min
% c
ha
ng
e
R2: 0.057; p: NS
A
B
97
98
99
100
101
0 10 20 30 40
Bout duration in min
% c
han
ge
97
98
99
100
101
0 10 20 30 40
Bout duration in min
% c
han
ge
97
98
99
100
101
0 10 20 30 40
Bout duration in min
% c
han
ge
97
98
99
100
101
0 10 20 30 40
Bout duration in min
% c
han
ge
97
98
99
100
101
0 10 20 30 40
Bout duration in min
% c
han
ge
97
98
99
100
101
0 10 20 30 40
Bout duration in min
% c
han
ge
97
98
99
100
101
0 10 20 30 40
Bout duration in min
% c
han
ge
97
98
99
100
101
0 10 20 30 40
Bout duration in min
% c
han
ge
97
98
99
100
101
0 10 20 30 40
Bout duration in min
% c
han
ge
97
98
99
100
101
0 10 20 30 40
Bout duration in min
% c
han
ge
97
98
99
100
101
0 10 20 30 40
Bout duration in min
% c
han
ge
97
98
99
100
101
0 10 20 30 40
Bout duration in min
% c
han
ge
Vehicle α-Asarone Midazolam
R2: 0.310; p: 0.000 R2: 0.258; p: 0.000R2: 0.682 † ; p: 0.000
R2: 0.305; p: 0.000 R2: 0.623 † ; p: 0.000
Bout duration in min
% c
ha
ng
e
R2: 0.057; p: NS
16
0
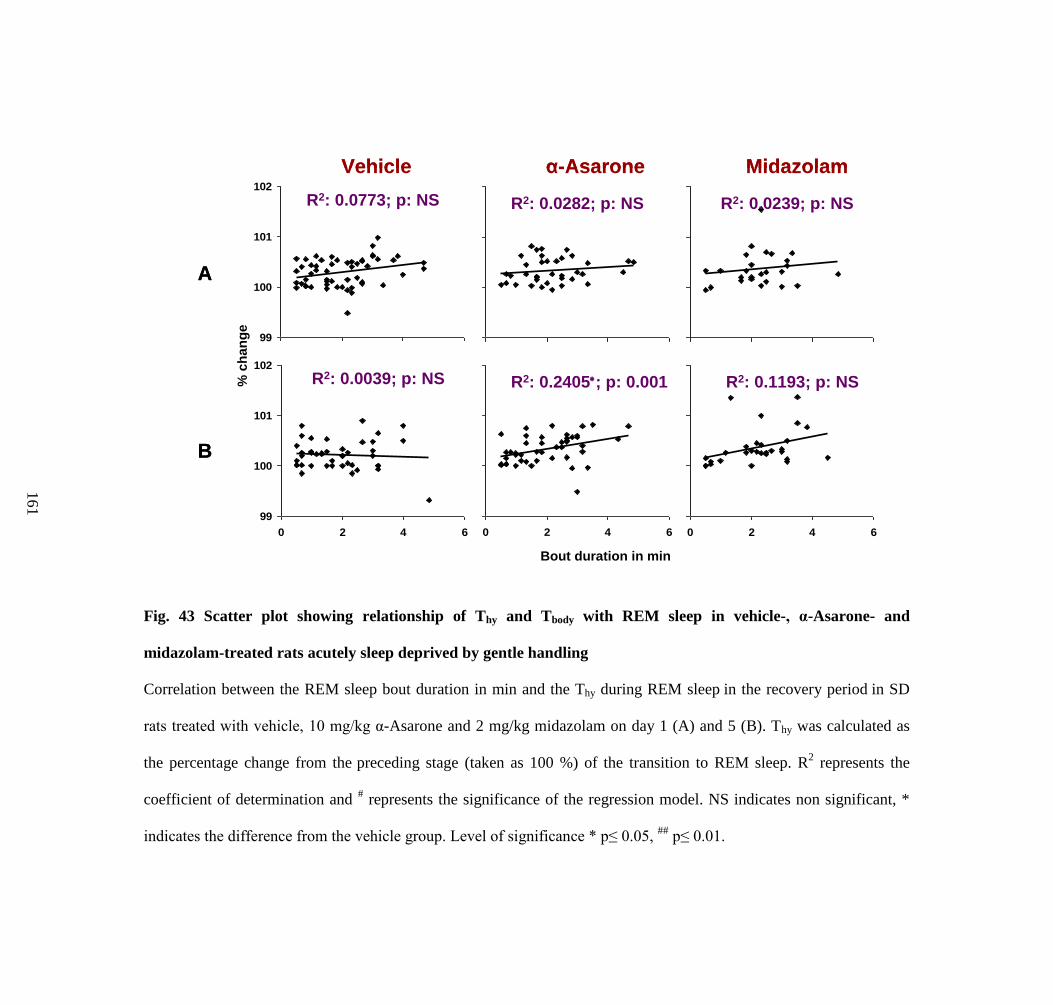
Fig. 43 Scatter plot showing relationship of Thy and Tbody with REM sleep in vehicle-, α-Asarone- and
midazolam-treated rats acutely sleep deprived by gentle handling
Correlation between the REM sleep bout duration in min and the Thy during REM sleep in the recovery period in SD
rats treated with vehicle, 10 mg/kg α-Asarone and 2 mg/kg midazolam on day 1 (A) and 5 (B). Thy was calculated as
the percentage change from the preceding stage (taken as 100 %) of the transition to REM sleep. R2 represents the
coefficient of determination and # represents the significance of the regression model. NS indicates non significant, *
indicates the difference from the vehicle group. Level of significance * p≤ 0.05, ##
p≤ 0.01.
99
100
101
102
0 2 4 6
Bout duration in min
% c
han
ge
99
100
101
102
0 2 4 6
Bout duration in min
% c
han
ge
99
100
101
102
0 2 4 6
Bout duration in min
% c
han
ge
99
100
101
102
0 2 4 6
Bout duration in min
% c
han
ge
99
100
101
102
0 2 4 6
Bout duration in min
% c
han
ge
99
100
101
102
0 2 4 6
Bout duration in min
% c
han
ge
R2: 0.0773; p: NS R2: 0.0282; p: NS R2: 0.0239; p: NS
R2: 0.0039; p: NS R2: 0.2405; p: 0.001 R2: 0.1193; p: NS
A
B
Vehicle α-Asarone Midazolam
Bout duration in min
% c
ha
ng
e
99
100
101
102
0 2 4 6
Bout duration in min
% c
han
ge
99
100
101
102
0 2 4 6
Bout duration in min
% c
han
ge
99
100
101
102
0 2 4 6
Bout duration in min
% c
han
ge
99
100
101
102
0 2 4 6
Bout duration in min
% c
han
ge
99
100
101
102
0 2 4 6
Bout duration in min
% c
han
ge
99
100
101
102
0 2 4 6
Bout duration in min
% c
han
ge
99
100
101
102
0 2 4 6
Bout duration in min
% c
han
ge
99
100
101
102
0 2 4 6
Bout duration in min
% c
han
ge
99
100
101
102
0 2 4 6
Bout duration in min
% c
han
ge
99
100
101
102
0 2 4 6
Bout duration in min
% c
han
ge
99
100
101
102
0 2 4 6
Bout duration in min
% c
han
ge
99
100
101
102
0 2 4 6
Bout duration in min
% c
han
ge
R2: 0.0773; p: NS R2: 0.0282; p: NS R2: 0.0239; p: NS
R2: 0.0039; p: NS R2: 0.2405; p: 0.001 R2: 0.1193; p: NS
A
B
Vehicle α-Asarone Midazolam
Bout duration in min
% c
ha
ng
e
16
1
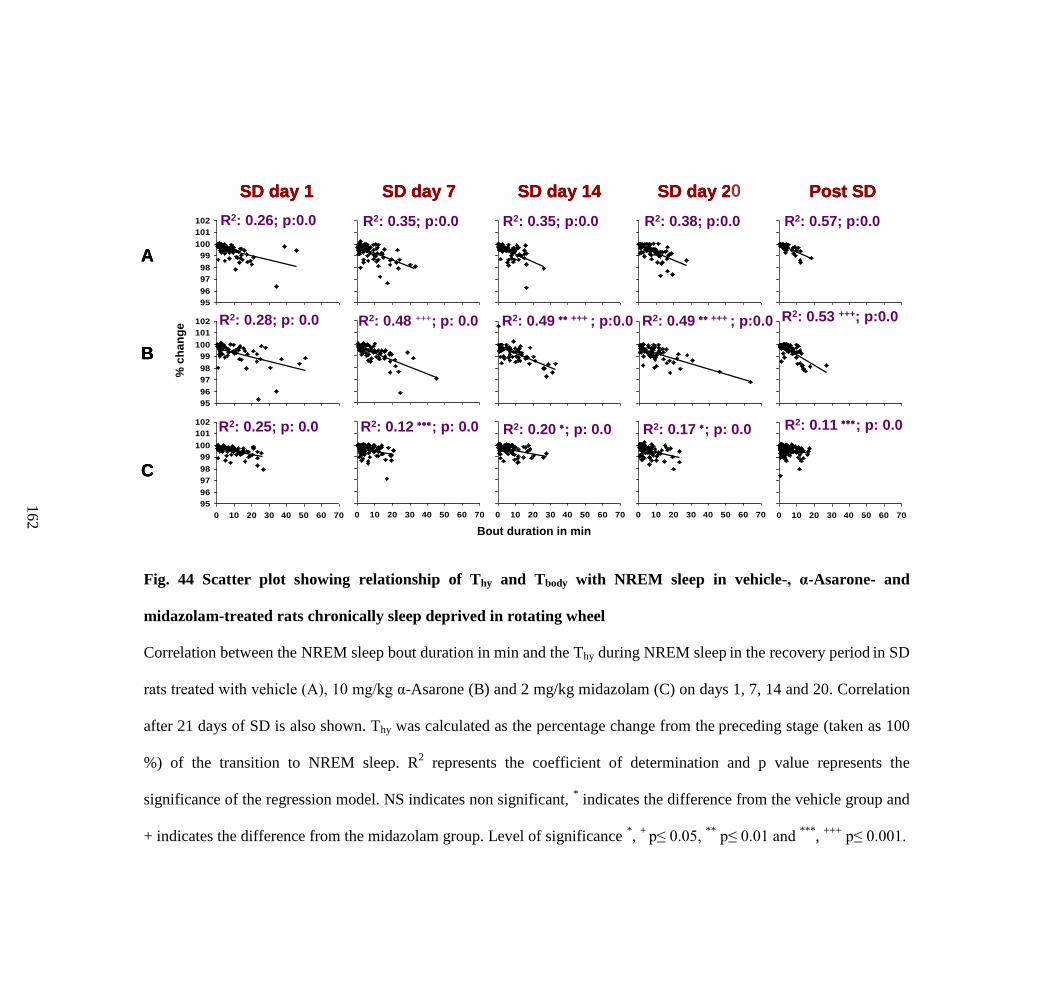
Fig. 44 Scatter plot showing relationship of Thy and Tbody with NREM sleep in vehicle-, α-Asarone- and
midazolam-treated rats chronically sleep deprived in rotating wheel
Correlation between the NREM sleep bout duration in min and the Thy during NREM sleep in the recovery period in SD
rats treated with vehicle (A), 10 mg/kg α-Asarone (B) and 2 mg/kg midazolam (C) on days 1, 7, 14 and 20. Correlation
after 21 days of SD is also shown. Thy was calculated as the percentage change from the preceding stage (taken as 100
%) of the transition to NREM sleep. R2 represents the coefficient of determination and p value represents the
significance of the regression model. NS indicates non significant, * indicates the difference from the vehicle group and
+ indicates the difference from the midazolam group. Level of significance *,
+ p≤ 0.05,
** p≤ 0.01 and
***,
+++ p≤ 0.001.
16
2
95
96
97
98
99
100
101
102
0 10 20 30 40 50 60 70
95
96
97
98
99
100
101
102
0 10 20 30 40 50 60 70
95
96
97
98
99
100
101
102
0 10 20 30 40 50 60 70
95
96
97
98
99
100
101
102
0 10 20 30 40 50 60 70
95
96
97
98
99
100
101
102
0 10 20 30 40 50 60 70
95
96
97
98
99
100
101
102
0 10 20 30 40 50 60 70
95
96
97
98
99
100
101
102
0 10 20 30 40 50 60 70
95
96
97
98
99
100
101
102
0 10 20 30 40 50 60 70
95
96
97
98
99
100
101
102
0 10 20 30 40 50 60 70
95
96
97
98
99
100
101
102
0 10 20 30 40 50 60 70
95
96
97
98
99
100
101
102
0 10 20 30 40 50 60 70
95
96
97
98
99
100
101
102
0 10 20 30 40 50 60 70
95
96
97
98
99
100
101
102
0 10 20 30 40 50 60 70
95
96
97
98
99
100
101
102
0 10 20 30 40 50 60 70
95
96
97
98
99
100
101
102
0 10 20 30 40 50 60 70
SD day 1 SD day 7
A
B
C
Bout duration in min
% c
ha
ng
e
SD day 14 SD day 21 Post SD
R2: 0.26; p:0.0
R2: 0.28; p: 0.0
R2: 0.25; p: 0.0
R2: 0.35; p:0.0
R2: 0.48 +++; p: 0.0
R2: 0.12 ; p: 0.0
R2: 0.35; p:0.0
R2: 0.49 +++ ; p:0.0
R2: 0.20 ; p: 0.0
R2: 0.38; p:0.0
R2: 0.49 +++ ; p:0.0
R2: 0.17 ; p: 0.0
R2: 0.57; p:0.0
R2: 0.53 +++; p:0.0
R2: 0.11 ; p: 0.0
95
96
97
98
99
100
101
102
0 10 20 30 40 50 60 70
95
96
97
98
99
100
101
102
0 10 20 30 40 50 60 70
95
96
97
98
99
100
101
102
0 10 20 30 40 50 60 70
95
96
97
98
99
100
101
102
0 10 20 30 40 50 60 70
95
96
97
98
99
100
101
102
0 10 20 30 40 50 60 70
95
96
97
98
99
100
101
102
0 10 20 30 40 50 60 70
95
96
97
98
99
100
101
102
0 10 20 30 40 50 60 70
95
96
97
98
99
100
101
102
0 10 20 30 40 50 60 70
95
96
97
98
99
100
101
102
0 10 20 30 40 50 60 70
95
96
97
98
99
100
101
102
0 10 20 30 40 50 60 70
95
96
97
98
99
100
101
102
0 10 20 30 40 50 60 70
95
96
97
98
99
100
101
102
0 10 20 30 40 50 60 70
95
96
97
98
99
100
101
102
0 10 20 30 40 50 60 70
95
96
97
98
99
100
101
102
0 10 20 30 40 50 60 70
95
96
97
98
99
100
101
102
0 10 20 30 40 50 60 70
SD day 1 SD day 7
A
B
C
Bout duration in min
% c
ha
ng
e
SD day 14 SD day 21 Post SD
R2: 0.26; p:0.0
R2: 0.28; p: 0.0
R2: 0.25; p: 0.0
R2: 0.35; p:0.0
R2: 0.48 +++; p: 0.0
R2: 0.12 ; p: 0.0
R2: 0.35; p:0.0
R2: 0.49 +++ ; p:0.0
R2: 0.20 ; p: 0.0
R2: 0.38; p:0.0
R2: 0.49 +++ ; p:0.0
R2: 0.17 ; p: 0.0
R2: 0.57; p:0.0
95
96
97
98
99
100
101
102
0 10 20 30 40 50 60 70
95
96
97
98
99
100
101
102
0 10 20 30 40 50 60 70
95
96
97
98
99
100
101
102
0 10 20 30 40 50 60 70
95
96
97
98
99
100
101
102
0 10 20 30 40 50 60 70
95
96
97
98
99
100
101
102
0 10 20 30 40 50 60 70
95
96
97
98
99
100
101
102
0 10 20 30 40 50 60 70
95
96
97
98
99
100
101
102
0 10 20 30 40 50 60 70
95
96
97
98
99
100
101
102
0 10 20 30 40 50 60 70
95
96
97
98
99
100
101
102
0 10 20 30 40 50 60 70
95
96
97
98
99
100
101
102
0 10 20 30 40 50 60 70
95
96
97
98
99
100
101
102
0 10 20 30 40 50 60 70
95
96
97
98
99
100
101
102
0 10 20 30 40 50 60 70
95
96
97
98
99
100
101
102
0 10 20 30 40 50 60 70
95
96
97
98
99
100
101
102
0 10 20 30 40 50 60 70
95
96
97
98
99
100
101
102
0 10 20 30 40 50 60 70
95
96
97
98
99
100
101
102
0 10 20 30 40 50 60 70
95
96
97
98
99
100
101
102
0 10 20 30 40 50 60 70
95
96
97
98
99
100
101
102
0 10 20 30 40 50 60 70
95
96
97
98
99
100
101
102
0 10 20 30 40 50 60 70
95
96
97
98
99
100
101
102
0 10 20 30 40 50 60 70
95
96
97
98
99
100
101
102
0 10 20 30 40 50 60 70
95
96
97
98
99
100
101
102
0 10 20 30 40 50 60 70
95
96
97
98
99
100
101
102
0 10 20 30 40 50 60 70
95
96
97
98
99
100
101
102
0 10 20 30 40 50 60 70
95
96
97
98
99
100
101
102
0 10 20 30 40 50 60 70
95
96
97
98
99
100
101
102
0 10 20 30 40 50 60 70
95
96
97
98
99
100
101
102
0 10 20 30 40 50 60 70
95
96
97
98
99
100
101
102
0 10 20 30 40 50 60 70
95
96
97
98
99
100
101
102
0 10 20 30 40 50 60 70
95
96
97
98
99
100
101
102
0 10 20 30 40 50 60 70
SD day 1 SD day 7
A
B
C
Bout duration in min
% c
ha
ng
e
SD day 14 SD day 21 Post SD
R2: 0.26; p:0.0
R2: 0.28; p: 0.0
R2: 0.25; p: 0.0
R2: 0.35; p:0.0
R2: 0.48 +++; p: 0.0
R2: 0.12 ; p: 0.0
R2: 0.35; p:0.0
R2: 0.49 +++ ; p:0.0
R2: 0.20 ; p: 0.0
R2: 0.38; p:0.0
R2: 0.49 +++ ; p:0.0
R2: 0.17 ; p: 0.0
R2: 0.57; p:0.0
R2: 0.53 +++; p:0.0
R2: 0.11 ; p: 0.0
0
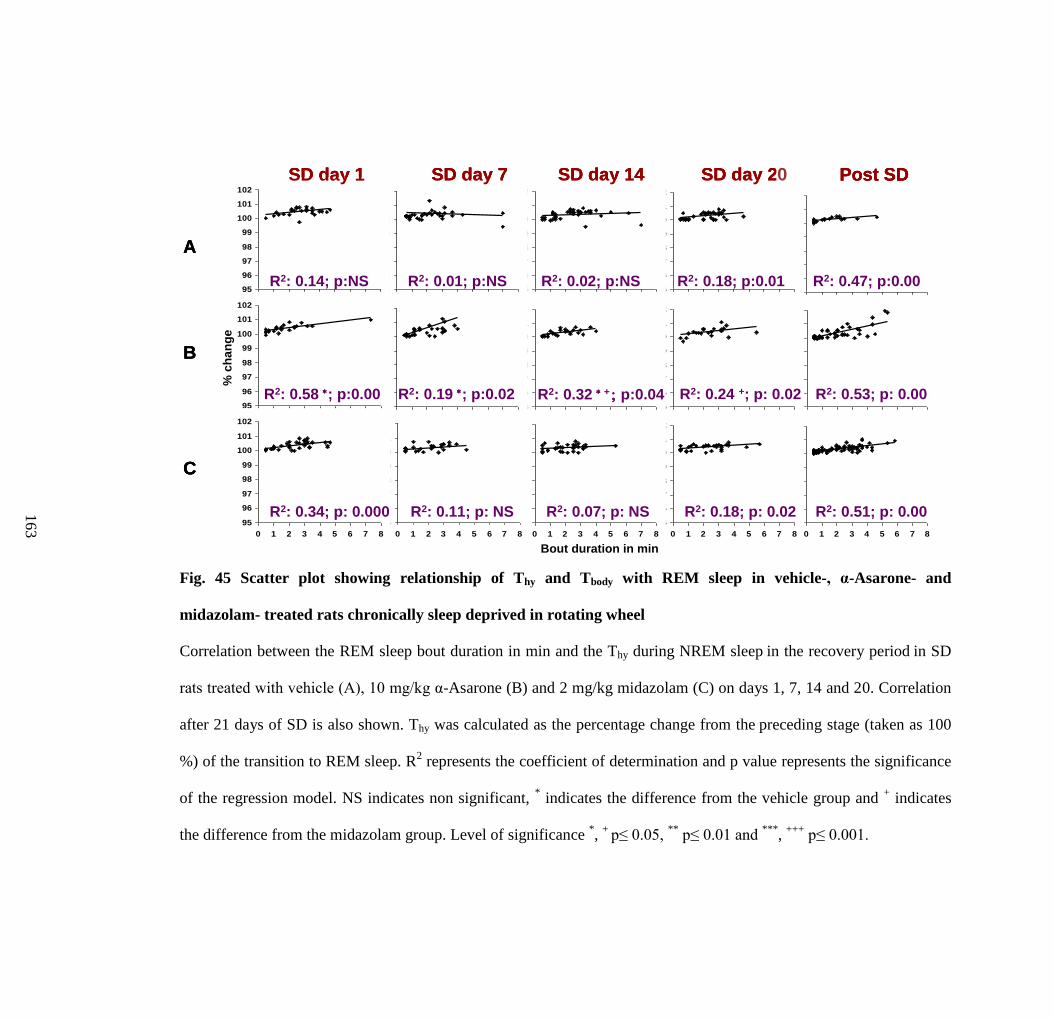
Fig. 45 Scatter plot showing relationship of Thy and Tbody with REM sleep in vehicle-, α-Asarone- and
midazolam- treated rats chronically sleep deprived in rotating wheel
Correlation between the REM sleep bout duration in min and the Thy during NREM sleep in the recovery period in SD
rats treated with vehicle (A), 10 mg/kg α-Asarone (B) and 2 mg/kg midazolam (C) on days 1, 7, 14 and 20. Correlation
after 21 days of SD is also shown. Thy was calculated as the percentage change from the preceding stage (taken as 100
%) of the transition to REM sleep. R2 represents the coefficient of determination and p value represents the significance
of the regression model. NS indicates non significant, * indicates the difference from the vehicle group and
+ indicates
the difference from the midazolam group. Level of significance *,
+ p≤ 0.05,
** p≤ 0.01 and
***,
+++ p≤ 0.001.
16
3
95
96
97
98
99
100
101
102
0 1 2 3 4 5 6 7 8
95
96
97
98
99
100
101
102
0 1 2 3 4 5 6 7 8
95
96
97
98
99
100
101
102
0 1 2 3 4 5 6 7 8
95
96
97
98
99
100
101
102
0 1 2 3 4 5 6 7 8
95
96
97
98
99
100
101
102
0 1 2 3 4 5 6 7 8
95
96
97
98
99
100
101
102
0 1 2 3 4 5 6 7 8
95
96
97
98
99
100
101
102
0 1 2 3 4 5 6 7 8
95
96
97
98
99
100
101
102
0 1 2 3 4 5 6 7 8
95
96
97
98
99
100
101
102
0 1 2 3 4 5 6 7 8
95
96
97
98
99
100
101
102
0 1 2 3 4 5 6 7 8
95
96
97
98
99
100
101
102
0 1 2 3 4 5 6 7 8
95
96
97
98
99
100
101
102
0 1 2 3 4 5 6 7 8
95
96
97
98
99
100
101
102
0 1 2 3 4 5 6 7 8
95
96
97
98
99
100
101
102
0 1 2 3 4 5 6 7 8
95
96
97
98
99
100
101
102
0 1 2 3 4 5 6 7 8
SD day 1 SD day 7
A
B
C
SD day 14 SD day 21 Post SD
R2: 0.14; p:NS
R2: 0.58 ; p:0.00
R2: 0.34; p: 0.000
R2: 0.01; p:NS
R2: 0.19 ; p:0.02
R2: 0.11; p: NS
R2: 0.02; p:NS
R2: 0.32 + p:0.04
R2: 0.07; p: NS
R2: 0.18; p:0.01
R2: 0.24 +; p: 0.02
R2: 0.18; p: 0.02
R2: 0.47; p:0.00
R2: 0.53; p: 0.00
R2: 0.51; p: 0.00
Bout duration in min
% c
ha
ng
e
95
96
97
98
99
100
101
102
0 1 2 3 4 5 6 7 8
95
96
97
98
99
100
101
102
0 1 2 3 4 5 6 7 8
95
96
97
98
99
100
101
102
0 1 2 3 4 5 6 7 8
95
96
97
98
99
100
101
102
0 1 2 3 4 5 6 7 8
95
96
97
98
99
100
101
102
0 1 2 3 4 5 6 7 8
95
96
97
98
99
100
101
102
0 1 2 3 4 5 6 7 8
95
96
97
98
99
100
101
102
0 1 2 3 4 5 6 7 8
95
96
97
98
99
100
101
102
0 1 2 3 4 5 6 7 8
95
96
97
98
99
100
101
102
0 1 2 3 4 5 6 7 8
95
96
97
98
99
100
101
102
0 1 2 3 4 5 6 7 8
95
96
97
98
99
100
101
102
0 1 2 3 4 5 6 7 8
95
96
97
98
99
100
101
102
0 1 2 3 4 5 6 7 8
95
96
97
98
99
100
101
102
0 1 2 3 4 5 6 7 8
95
96
97
98
99
100
101
102
0 1 2 3 4 5 6 7 8
95
96
97
98
99
100
101
102
0 1 2 3 4 5 6 7 8
SD day 1 SD day 7
A
B
C
SD day 14 SD day 21 Post SD
R2: 0.14; p:NS
R2: 0.58 ; p:0.00
R2: 0.34; p: 0.000
R2: 0.01; p:NS
R2: 0.19 ; p:0.02
R2: 0.11; p: NS
R2: 0.02; p:NS
R2: 0.32 + p:0.04
R2: 0.07; p: NS
R2: 0.18; p:0.01
R2: 0.24 +; p: 0.02
R2: 0.18; p: 0.02
R2: 0.47; p:0.00
R2: 0.53; p: 0.00
R2: 0.51; p: 0.00
95
96
97
98
99
100
101
102
0 1 2 3 4 5 6 7 8
95
96
97
98
99
100
101
102
0 1 2 3 4 5 6 7 8
95
96
97
98
99
100
101
102
0 1 2 3 4 5 6 7 8
95
96
97
98
99
100
101
102
0 1 2 3 4 5 6 7 8
95
96
97
98
99
100
101
102
0 1 2 3 4 5 6 7 8
95
96
97
98
99
100
101
102
0 1 2 3 4 5 6 7 8
95
96
97
98
99
100
101
102
0 1 2 3 4 5 6 7 8
95
96
97
98
99
100
101
102
0 1 2 3 4 5 6 7 8
95
96
97
98
99
100
101
102
0 1 2 3 4 5 6 7 8
95
96
97
98
99
100
101
102
0 1 2 3 4 5 6 7 8
95
96
97
98
99
100
101
102
0 1 2 3 4 5 6 7 8
95
96
97
98
99
100
101
102
0 1 2 3 4 5 6 7 8
95
96
97
98
99
100
101
102
0 1 2 3 4 5 6 7 8
95
96
97
98
99
100
101
102
0 1 2 3 4 5 6 7 8
95
96
97
98
99
100
101
102
0 1 2 3 4 5 6 7 8
SD day 1 SD day 7
A
B
C
SD day 14 SD day 21 Post SD
R2: 0.14; p:NS
R2: 0.58 ; p:0.00
R2: 0.34; p: 0.000
R2: 0.01; p:NS
R2: 0.19 ; p:0.02
R2: 0.11; p: NS
R2: 0.02; p:NS
R2: 0.32 + p:0.04
R2: 0.07; p: NS
R2: 0.18; p:0.01
R2: 0.24 +; p: 0.02
R2: 0.18; p: 0.02
R2: 0.47; p:0.00
R2: 0.53; p: 0.00
R2: 0.51; p: 0.00
Bout duration in min
% c
ha
ng
e
0

164
Chapter V: Discussion
165
The sleep-wake property of α-Asarone, an active principle of Acorus
species, was evaluated for the first time in this study. In the dose response
study, 10 mg/kg α-Asarone improved the quality and depth of sleep without
altering the total sleep time in normal rats. The improvement in the quality of
sleep persisted even after daily administration for 21 consecutive days in
normal rats. The hypnotic property of the optimal dose of α-Asarone was
evident in both acutely and chronically SD rats in comparison to the vehicle
and the positive control midazolam. α-Asarone was also an effective
anxiolytic and antioxidant agent under SD conditions. α-Asarone-mediated
changes in the Thy and Tbody facilitated the improvement in sleep quality.
1. Effects of the optimal dose of α-Asarone on S-W, Thy and Tbody
This study provided crucial evidences to the dose-dependent biphasic
effect of α-Asarone on sleep, modulated through changes in Thy and Tbody. In
the present study, daily adminstration of lower doses of α-Asarone especially
10 mg/kg, improved the quality of sleep as indicated by increased NREM bout
duration, and decreased NREM bout frequency and sleep fragmentation
without altering the total amount of sleep in normal rats for a duration of 21
days. The improvement in the sleep quality at 10 mg/kg was seen in
association with a moderate decrease in Thy and Tbody and a minimum
difference between these two parameters. This in turn facilitated a strong
negative correlation between the NREM sleep bout duration and Thy in the
normal rats. The negative correlation observed is in accordance with the
previous reports that indicated a favourable relationship between these two
166
parameters in a narrow range (Franken et al, 1992). Since the increase in
NREM sleep bout duration may also lead to decreased Thy (Franken et al,
1992), α-Asarone-mediated lowering of Thy might be the reason for the
increase in the bout duration of NREM sleep, or vice-versa. This persisted
effect even after daily administration of α-Asarone for 21 days under normal
condition probably indicated its sustained effects for long term use.
Doses higher than 10 mg/kg α-Asarone (40, 80 and 120 mg/kg), on the
other hand, produced reduced, poor quality fragmented sleep. Severe lowering
of Thy and Tbody and increased gradient between these two parameters resulted
in the reduction of sleep quantity and quality. The lowered correlations
observed between NREM sleep bout duration and Thy after administration of
40 and 80 mg/kg α-Asarone acted as an adaptive mechanism to prevent the
lowering of Thy with NREM sleep, which may further worsen the drug-
induced reduction in Thy and Tbody. Subsequently, the lowered association
between sleep and thermoregulation at these doses resulted in poor quality
sleep. However, at the dose of 120 mg/kg, the loss of this adaptive
mechanism, further contributed to hypothermia, resulting in an arousal effect.
This effect in turn produced highly reduced and fragmented sleep along with
an increase in the number of shorter bouts. Majority of variations (84 %) in the
brain temperature had been attributed to the alteration in sleep and
wakefulness (Franken et al, 1992).
Change in the REM sleep duration or any other REM sleep parameters at
lower doses of α-Asarone were insignificant but higher doses suppressed REM
sleep as a result of hypothermia. A positive correlation of Thy with REM sleep
167
bout duration (Calasso and Parmeggiani, 2008) remained unaltered at lower
doses of α-Asarone (2 and 10 mg/kg). A decrease in the common carotid
artery blood flow and the associated increase in the cerebral blood supply
through the vertebral artery could be the reason behind the increased brain
temperature during REM sleep (Calasso and Parmeggiani, 2008). At higher
doses, distinct reduction in REM sleep substantiated the reduced
interrelationship of Thy with REM sleep bout duration. This finding is
supported by previous reports wherein suppression of REM sleep during
hypothermia indicated interplay of thermoregulation and REM sleep (Amici et
al, 2014).
2. Effects of optimal dose of α-Asarone on SD-induced changes in S-W, Thy
and Tbody
The observation of SD-induced sleep rebound for 5 days in acute model
and for a week in the chronic model is similar to the earlier report
(Rechtschaffen et al, 1989). Also the reduction in the quality and depth of
sleep by the end of third and the fourth week in the chronic model is also
reported earlier (Rechtschaffen et al, 1989). Furthermore, the increase in Thy
and Tbody during acute and chronic SD and its reduction during recovery sleep
further strengthens the concept of association of sleep with thermoregulation
(Franken et al., 1991; Landis et al, 1992).
Even though the SD-induced increase in the NREM sleep (sleep rebound)
for three weeks was similar after administration of both 10 mg/kg α-Asarone
and 2 mg/kg positive control (midazolam), however, the enhancement in the
168
NREM sleep after midazolam administration was at the expense of REM sleep
as reported previously (Lancel et al, 1996). Hence, improvement in NREM
sleep without altering REM sleep probably makes α-Asarone a better
alternative drug for insomnia management.
Moreover, increase in the NREM sleep bout duration and decrease in
NREM sleep bout frequency and sleep fragmentation after α-Asarone
administration indicates its role in sleep maintenance which was evidently
lacking after midazolam administration. Shortening of the latency to sleep
after SD by α-Asarone in comparison to the hypnotic midazolam (Lancel et al,
1996) suggests its involvement in the sleep initiation process also.
Increased EEG power at delta frequency range in NREM sleep after SD
indicates an increase in the homeostatic drive and intensity for NREM sleep,
as reported previously (Franken et al, 1991). Further enhanced relative delta
power after α-Asarone administration in comparison to the other treatments in
normal and sleep deprived rats clearly indicates that this drug improves the
depth of NREM sleep after SD, thereby promoting the quality of sleep.
Decrease in alpha and beta power observed in the EEG power spectral analysis
further confirms the potential advantage of α-Asarone treatment over
midazolam. An increase in the power at beta frequency range (12-35 Hz)
during NREM sleep is a common identification in patients with insomnia
(Perlis et al, 2001). Increased beta during NREM sleep is negatively correlated
with the sleep quality and is considered as an electrophysiological marker for
arousal (Nofzinger et al, 2000). Increase in the beta power and decrease in the
delta power of EEG during NREM sleep of SD rats after administration of
169
midazolam or any hypnotics is consistent with previous reports (Aeschbach et
al, 1994; Bastian et al, 2003; Feinberg et al, 2000).
During SD, α-Asarone (10 mg/kg) reduced and normalized the Thy and
Tbody rapidly and also retained minimum difference between these two
parameters. This concomitantly enhanced the correlation of Thy with both
NREM and REM sleep bout duration which facilitated improvement in the
quality of sleep without reduction in the REM sleep. However, in the
midazolam-treated SD rats, the Tbody always remained higher along with
increased difference between Thy and Tbody. This in turn reduced the
correlation of Thy with both NREM and REM sleep bout duration resulting in
reduced sleep quality and quantity (REM sleep).
In the present study observation of withdrawal effect (rebound insomnia)
in the midazolam group was similar to a few previous reports in which this
was one of the major side-effects seen after discontinuing the usage of short-
acting hypnotics (Borbely and Achermann, 1991; Feige et al, 1999; Kales et
al, 1974). Decreased total sleep time and EEG delta power and increased high
frequency activity especially at beta frequency range are some of the major
observations in the present study indicating the withdrawal effect after
midazolam discontinuation. Furthermore, midazolam produced withdrawal
effects 72 h after its discontinuation. However, peculiar observation of
absence of withdrawal effects after discontinuation of α-Asarone 10 mg/kg
administration and sustained depth of sleep even 72 h after its discontinuation
clearly indicate that α-Asarone is a better alternative drug for insomnia
management with minimum side-effects.
170
3. Effect of α-Asarone on SD-induced changes in anxiety levels
In the present study, anxiety level was increased in both acute and chronic
SD models. Increased anxiety after SD, observed in the vehicle-treated group
in the present study, is supported by some earlier reports (Cohen et al, 2012;
Cortese et al, 2010) and is contrary to some other reports (Berro et al, 2014).
On the other hand, chronic SD produces pathological anxiety in rats (Silva et
al, 2004).
The animals treated with 10 mg/kg of α-Asarone were less anxious when
compared to their vehicle-treated counterparts after being subjected to SD. In
this study, the effect of α-Asarone was on par with the benzodiazepine
midazolam which is a clinically well established anxiolytic drug (Zangrossi et
al, 1999). The increased entries and time spent in the open arms and reversal
of SD-induced reduction in the activity of rats observed in the present study
after α-Asarone administration are reported in various other studies using
different animal models and experimental protocol (Lee et al, 2014; Liu et al,
2012; Reddy et al, 2015; Shukla et al, 2002; Tiwari et al, 2014).
Even though not prominent, the anxiolytic behavior in the rats after
administration of α-Asarone was also observed in the OFT. The anxiolysis
was on par with the commonly used anxiolytic midazolam (Zangrossi et al,
1999). In contrast to the present study, administration of α-Asarone at doses
ranging from 5-20 mg/kg, i.p. did not change the spontaneous behaviour in
normal rats when tested in OFT (Han et al, 2013). However, in another study,
administration of 200 mg/kg α-Asarone orally in the corticosterone-treated rats
171
increased the number of line crossings in the OFT indicating anxiolytic
activity (Lee et al, 2014).
Apart from rodent models, anxiolytic properties of α-Asarone were studied
in monkeys also. A dose of α-Asarone (5 mg/kg, i.p.) administration
minimized the signs of hostility in monkeys (Dandiya and Menon, 1964).
4. Effect of α-Asarone on SD-induced changes in brain antioxidant levels
In the present study, oxidative stress level in cortex, subcortex and
brainstem was altered in the rats subjected to SD. Even though 5 h SD
produced a slight increase in the oxidative stress, by fifth day of SD a cellular
adaptive response was observed with respect to the antioxidant profile. This
response might be to recoup from the acute stress produced by SD. However,
the cellular adaptive response after 5 days of SD was not evident in the
behavior of the animals. They showed an increased anxiety even after 5 days
of SD. This might be due to the reduction observed in the activity of CAT
especially in the subcortical region. Catalase over-expression is reported to be
sufficient to reduce anxiety even in the absence of alteration in levels of
oxidative stress (Olsen et al, 2013).
On the other hand, chronic SD in the present study produced increased
oxidative stress. Ramanathan et al, (2010) proposed that in the acute or short
term SD, increased production of free radicals is balanced by the increased
antioxidant responses whereas in chronic or long term sleep loss, this balance
is disrupted leading to decreased antioxidant responses. They also reported
that this differential effect of acute and chronic SD varies across brain regions.
172
Also, the same group reported that 6 h of SD increased antioxidant responses
in the rat cortex, hippocampus, basal forebrain, brainstem and cerebellum,
whereas 5-11 days of chronic SD decreased antioxidant responses in the rat
hippocampus and brainstem (Ramanathan et al, 2002). It is reported that the
acute and chronic sleep loss produce varied transcriptional changes in the rat
cerebral cortex and also the brain is capable of responding to the stress
associated with acute sleep loss and thereby preventing oxidative stress
(Cirelli et al, 2006).
The neuroprotective effect of α-Asarone may be partly due to its
antioxidant property. Increase in the MDA levels observed after chronic SD
was eliminated in the cortex, subcortex and brainstem of α-Asarone group.
Also the activity of CAT and GSH-R and the levels of GSH were found to
increase indicating that α-Asarone reduced the oxidative cellular damage
induced by sleep loss. The increase in the activity of GSH-R in striatum,
hippocampus and to lesser extent in cortex was previously reported in mice
after the treatment of α-Asarone (100 mg/kg, i.p.) for a week (Pages et al,
2010). Similarly, enhanced CAT activity was also reported as a result of sub-
chronic administration of α-Asarone 10 mg/kg, i.o. for 16 days in Alzheimer‟s
rat model (Limon et al, 2009). Furthermore, administration of α-Asarone
reversed the increased MDA levels in various regions of brain in mice treated
with scopolamine (α-Asarone 10 mg/kg, i.p. for 15 days) and rats exposed to
noise stress (α-Asarone 3-10 mg/kg, i.p. for 30 days) (Kumar et al, 2012;
Manikandan and Devi, 2005).
173
5. Mechanism of action of α-Asarone
It is evident from the present study that the longer NREM sleep bouts
indicating improved sleep quality appeared when the range of Thy and Tbody
was narrow (within 37.010.2 and 36.930.1 ºC) and when their difference
was the least (within a narrow range of 0.1 ºC). Evidently, 10 mg/kg α-
Asarone administration moderately reduced both Thy and Tbody (0.5 to 0.6 ºC)
with the difference between Thy and Tbody maintained to ≤0.1 ºC in comparison
to all the other treatments. This probably suggest that this dose was conducive
for the appearance of longer bouts along with an increased association
between the NREM sleep bout durations and Thy and Tbody. This further
substantiate the possibility that α-Asarone (at 10 mg/kg) improves sleep by
modulating Thy and Tbody.
On the other hand, higher doses of α-Asarone induced a fall in the Thy and
Tbody (> 1 ºC), and produced a huge variation between Thy and Tbody (> 0.3 ºC)
clearly indicating that the higher doses lead to reduced and fragmented sleep.
Behavioral abnormalities at higher dose of α-Asarone (80 and 120 mg/kg) and
the short-term paroxysmal epileptic-like EEG after administration of 120
mg/kg α-Asarone revealed the importance of an optimal doses for appropriate
responses. In a previous study, hypothermia-associated abnormal behavior
after injection of α-Asarone at a dose of 60 mg/kg/i.p. was reported in mice
(Pages et al, 2010). The dose dependent biphasic effect of α-Asarone is also
reported in rodent models of anxiety and depression (Chellian et al, 2016; Han
et al, 2013; Liu et al, 2012). Reduced sleep quality with high doses could
174
probably be due to the decrease in body temperature. This study showed that
the low dose of α-Asarone (10 mg/kg/i.p.) is conducive for good quality sleep.
During SD, the minimum difference observed between Thy and Tbody after
α-Asarone administration might have aided in promoting the quality sleep. On
the other hand, the reduced sleep quality in the midazolam-treated sleep
deprived rats might be due to the increased difference between Thy and Tbody
and the reduced association between NREM bout duration and Thy during the
recovery period. There were earlier reports which had expressed doubts about
the quality of sleep produced by midazolam (Lancel et al, 1996). Furthermore,
it is evident from the present study that the positive correlation between Thy
and REM sleep bout duration is lost as a result of SD. However the
appearance of the positive association between Thy and REM sleep bout
duration confirms the role of α-Asarone in preserving REM sleep. Poor
correlation observed between Thy and REM sleep bout duration after
midazolam treatment might have resulted in the reduction of REM sleep.
The present study confirmed that the appearance of longer bouts of NREM
sleep was facilitated when there is a moderate decrease in Thy and Tbody and
when the difference between these two parameters were minimum.
Administration of α-Asarone 10 mg/kg not only reduced Thy and Tbody
moderately but also kept the gradient between Thy and Tbody minimum in both
normal and SD rats. This in turn improved the association between sleep and
thermoregulation, thus improving the quality of sleep. Interaction of α-
Asarone with the transient receptor potential vanilloid channel 4 (TRPV4) in
the hypothalamic region may be responsible for the reduction in Thy and Tbody.
175
TRPV4 present in the hypothalamic region is activated at normal body
temperature and promotes hypothermic effect (Everaerts et al, 2010).
Apart from modulating Thy and Tbody, α-Asarone also functioned as an
anxiolytic and an antioxidant in the SD model. Increased antioxidant level and
decreased levels of lipid peroxidation in the brain after α-Asarone
administration is also suggested to be one of the mechanisms for anxiolysis
(Kumar et al, 2012; Manikandan et al, 2013; Reddy et al, 2014) which
probably facilitated good sleep. Furthermore, SD-induced hyperthermia might
have produced anxiety (Shibasaki et al, 2017) which may be associated with
an increase in oxidative stress (McAnulty et al, 2005). In α-Asarone-treated
rats, the rapid normalization of Thy and Tbody in the α-Asarone-treated rats and
also the minimal gradient between these two parameters with improved
association of sleep with thermoregulation might have resulted in reduced
oxidative stress which in turn resulted in anxiolysis. However, it may be noted
that the hypothermic and anxiolytic properties are not completely dependent
on each other since in the midazolam-treated rats anxiolysis was observed
even when the association between sleep and thermoregulation was less.
Hence, it can be concluded that all the three properties of α-Asarone
(hypothermic, anxiolytic and antioxidant) interacted with each other and
eliminated the SD-induced changes i.e. increase in Thy and Tbody, anxiety and
oxidative stress (Fig. 46). The present study thus confirms that α-Asarone at a
dose of 10 mg/kg given intra-peritoneally improved the quality of sleep via its
cooling, anxiolytic, and antioxidant properties (Fig. 47).
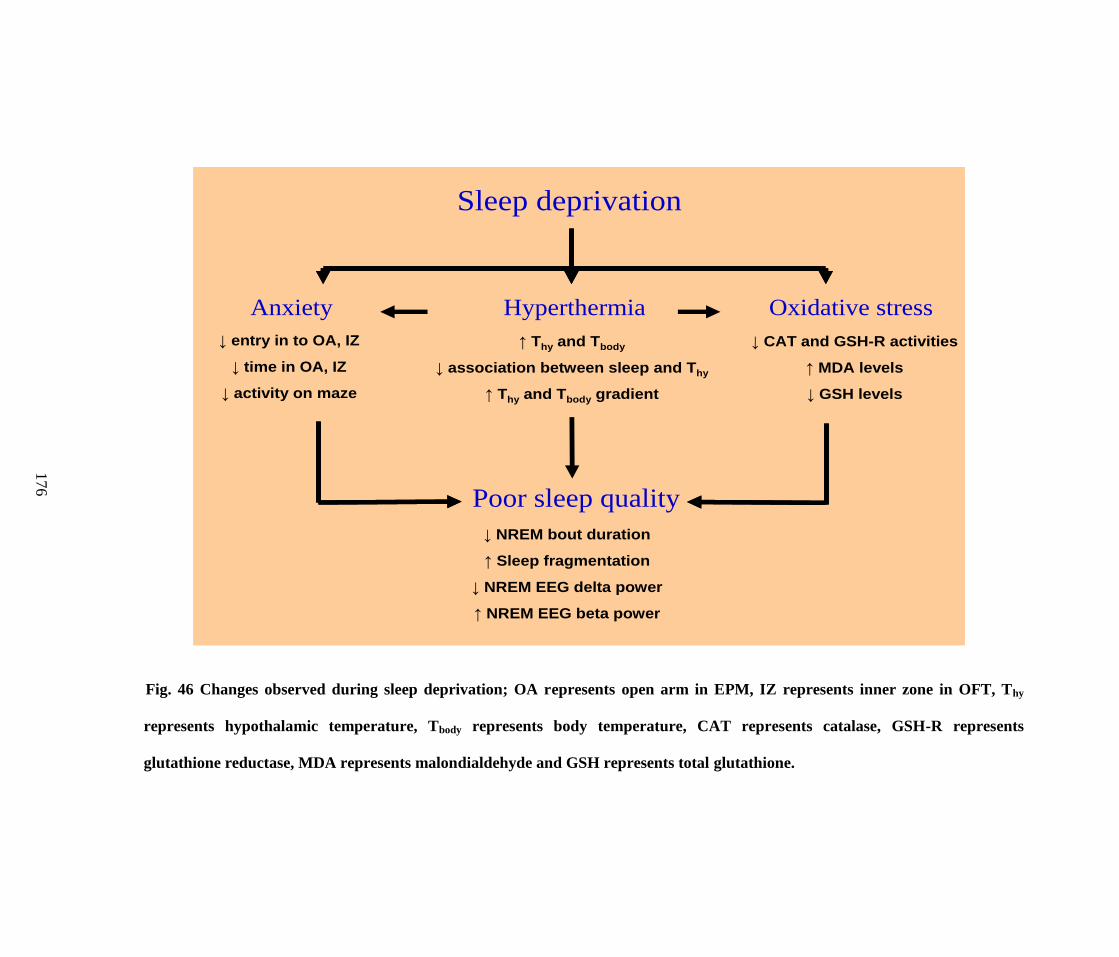
Fig. 46 Changes observed during sleep deprivation; OA represents open arm in EPM, IZ represents inner zone in OFT, Thy
represents hypothalamic temperature, Tbody represents body temperature, CAT represents catalase, GSH-R represents
glutathione reductase, MDA represents malondialdehyde and GSH represents total glutathione.
Sleep deprivation
HyperthermiaAnxiety Oxidative stress
Poor sleep quality
↓ NREM bout duration
↑ Sleep fragmentation
↓ NREM EEG delta power
↑ NREM EEG beta power
↑ Thy and Tbody
↓ association between sleep and Thy
↑ Thy and Tbody gradient
↓ CAT and GSH-R activities
↑ MDA levels
↓ GSH levels
↓ entry in to OA, IZ
↓ time in OA, IZ
↓ activity on maze
17
6
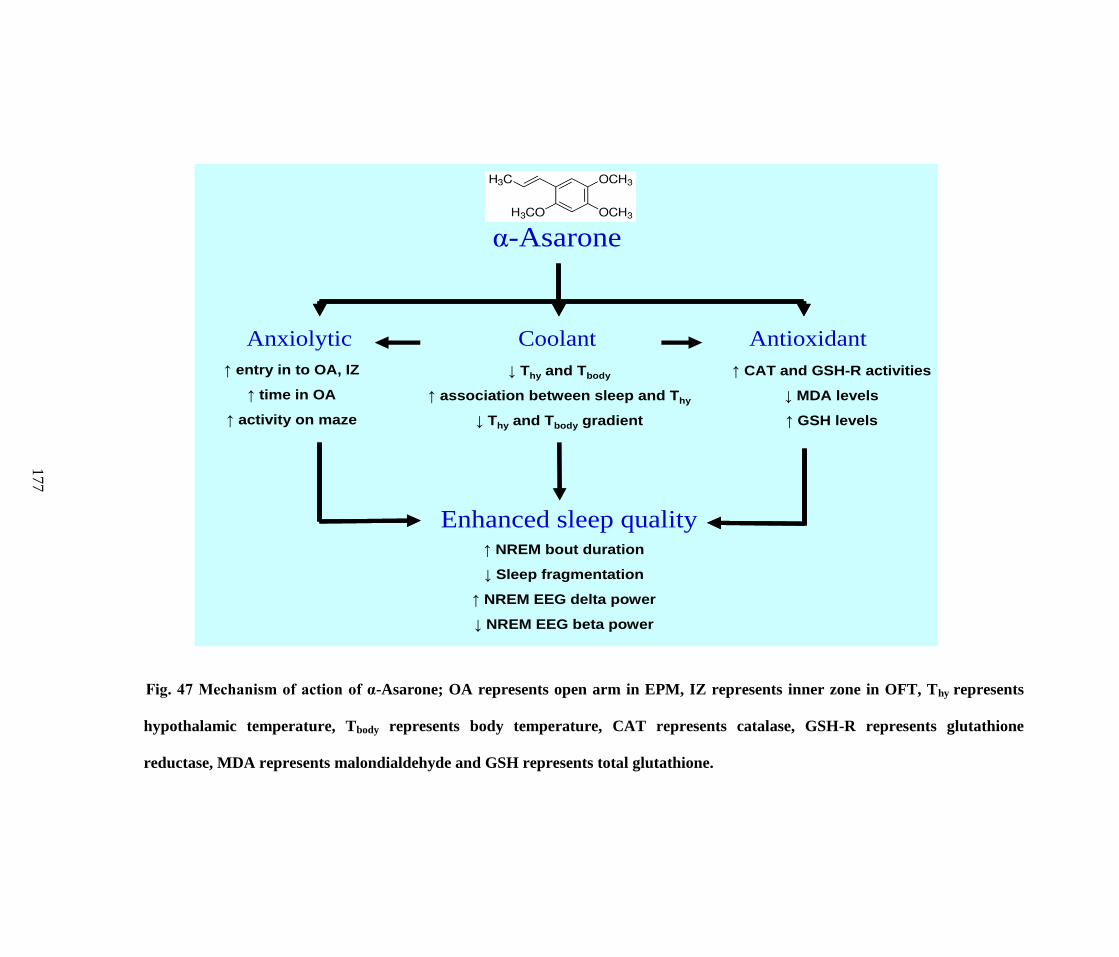
Fig. 47 Mechanism of action of α-Asarone; OA represents open arm in EPM, IZ represents inner zone in OFT, Thy represents
hypothalamic temperature, Tbody represents body temperature, CAT represents catalase, GSH-R represents glutathione
reductase, MDA represents malondialdehyde and GSH represents total glutathione.
α-Asarone
CoolantAnxiolytic Antioxidant
Enhanced sleep quality↑ NREM bout duration
↓ Sleep fragmentation
↑ NREM EEG delta power
↓ NREM EEG beta power
↓ Thy and Tbody
↑ association between sleep and Thy
↓ Thy and Tbody gradient
↑ CAT and GSH-R activities
↓ MDA levels
↑ GSH levels
↑ entry in to OA, IZ
↑ time in OA
↑ activity on maze
17
7
178
6. Clinical significance of the study
In the present study α-Asarone at 10 mg/kg has been found to reduce the core
body temperature which facilitated an improvement in the sleep especially the
quality of sleep. α-Asarone also improved the relationship of sleep with
thermoregulation. If we look from the clinical point of view, these properties of
α-Asarone will be very important in the patients with insomnia, who have
elevated core body temperature leading to severel sleep disturbances.
Moreover, the anxiety associated with both acute and chronic SD was alleviated
by α-Asarone in the present study. This would be highly beneficial for the
insomnia patients who suffer from anxiety. Enhanced antioxidant property of α-
Asarone may provide neuroprotection for patients with insomnia. In terms of
safety and efficacy we found that α-Asarone at lower dose produced hypnotic-
anxiolytic effect without developing tolerance or withdrawal effect unlike any
other clinically used medications for insomnia treatment. This is a major
breakthrough as there is no therapeutic intervention for insomnia with minimal
side-effects and maximum benefits.
7. Future directions
The effect after oral dosing should be investigated before proceeding to
clinical trials.
Intra-cerebral administration and receptor level activity using patch clamp
studies need to be evaluated to understand the target of the drug in brain.
Newer compounds from α-Asarone may be derived and tested for
improving its properties.

Chapter VI: Conclusion
179
180
The current study provided strong evidences that α-Asarone at a dose
10 mg/kg/i.p. improves the quality of sleep in normal and SD rats. Moderate
reduction and minimum variation between Thy and Tbody, enhanced the
association between sleep and Thy, thereby improving the quality of sleep.
Furthermore, anxiolytic and antioxidant properties of α-Asarone also
facilitated improvement in the quality of sleep. Hence, α-Asarone may be
considered as a potent herbal compound for the treatment of insomnia. This
study lays the foundation for developing newer generation of molecules with
similar structure but with a better hypnotic property.

181
Chapter VII: Bibliography
182
Aebi H (1984) Catalase in vitro. Methods Enzymol. 105: 121-126.
Aeschbach D, Dijk D-J, Trachsel L, Brunner DP, Borbély AA (1994) Dynamics
of slow-wave activity and spindle frequency activity in the human sleep EEG:
effect of midazolam and zopiclone. Neuropsychopharmacology 11: 237-244.
Ahmeda F, Urooja A, KS R (2009) In vitro antioxidant and anticholinesterase
activity of Acorus calamus and Nardostachys jatamansi rhizomes. J. Pharm.
Res. 2: 830-833.
Alfano CA, Ginsburg GS, Kingery JN (2007) Sleep-related problems among
children and adolescents with anxiety disorders. J. Am. Acad. Child Adolesc.
Psychiatry 46: 224-232.
Alvaro PK, Roberts RM, Harris JK (2013) A systematic review assessing
bidirectionality between sleep disturbances, anxiety, and depression. Sleep 36:
1059-1068.
American Academy of Sleep Medicine (2007) The AASM manual for the scoring
of sleep and associated events: Rules.Terminology and Technical
Specifications. Westchester: AASM.
American Academy of Sleep Medicine (2014) International classification of Sleep
Disorders, 3rd edn. American Academy of Sleep Medicine, Darien, IL.
Amici R, Bastianini S, Berteotti C, Cerri M, Del Vecchio F, Lo Martire V, et al.
(2014) Sleep and bodily functions: the physiological interplay between body
homeostasis and sleep homeostasis. Arch. Ital. Biol. 152: 66-78.
Amsterdam JD, Li Y, Soeller I, Rockwell K, Mao JJ, Shults J (2009) A
randomized, double-blind, placebo-controlled trial of oral Matricaria recutita
(chamomile) extract therapy of generalized anxiety disorder. J. Clin.
psychopharmacol. 29: 378.
Ashton H (1994) Guidelines for the rational use of benzodiazepines. Drugs 48:
25-40.
Attele AS, Xie J-T, Yuan C-S (2000) Treatment of insomnia: an alternative
approach. Altern. Med. Rev. 5: 249-259.
Baker F, Angara C, Szymusiak R, McGinty D (2005) Persistence of sleep-
temperature coupling after suprachiasmatic nuclei lesions in rats. Am. J.
Physiol. Regul. Integr. Comp. Physiol. 289: R827-R838.
Balakumbahan R, Rajamani K, Kumanan K (2010) Acorus calamus: An
overview. J. Med. Plants Res. 4: 2740-2745.
183
Banyan botanicals (12/05/2016) An Ayurvedic guide to balanced sleep.
Available:https://www.banyanbotanicals.com/info/ayurvedic-living/living-
ayurveda/health-guides/an-ayurvedic-guide-to-balanced-sleep/.
Bastian CH, LeBlanc M, Carrier J, Morin CM (2003) Sleep EEG power spectra,
insomnia, and chronic use of benzodiazepines. Sleep 26: 313-317.
Berger RJ, Phillips NH (1995) Energy conservation and sleep. Behav. Brain Res.
69: 65-73.
Berro LF, Hollais AW, Patti CL, Fukushiro DF, Mari-Kawamoto E, Talhati F, et
al. (2014) Sleep deprivation impairs the extinction of cocaine-induced
environmental conditioning in mice. Pharmacol. Biochem. Behav. 124: 13-18.
Bhattacharyya D, Sur T, Lyle N, Jana U, Debnath P (2011) A clinical study on the
management of generalized anxiety disorder with Vaca (Acorus calamus).
IJTK 10: 668-671.
Bhattacharya D, Sen M, Suri J (2013) Epidemiology of insomnia: A review of the
Global and Indian scenario. Indian J. Sleep Med. 8: 100-110.
Bonnet MH, Arand D (1992) Caffeine use as a model of acute and chronic
insomnia. Sleep 15: 526-536.
Bonnet MH, Arand DL (1998) The consequences of a week of insomnia II:
patients with insomnia. Sleep 21: 359-368.
Bonnet MH, Doghramji K, Roehrs T, Stepanski EJ, Sheldon SH, Walters AS, et
al. (2007) The scoring of arousal in sleep: reliability, validity, and alternatives.
J. Clin. Sleep Med. 3: 133-145.
Borbely AA, Neuhaus HU (1979) Sleep-deprivation: effects on sleep and EEG in
the rat. J. Comp. Physiol. 133: 71-87.
Borbely AA, Tobler I (1989) Endogenous sleep-promoting substances and sleep
regulation. Physiol. Rev. 69: 605-670.
Borbely AA, Achermann P (1991) Ultradian dynamics of sleep after a single dose
of benzodiazepine hypnotics. Eur. J. Pharmacol. 195: 11-18.
Bourdet C, Goldenberg F (1994) Insomnia in anxiety: sleep EEG changes. J.
Psychosom. Res. 38: 93-104.
Buege JA, Aust SD (1978) Microsomal lipid peroxidation. Methods Enzymol. 52:
302-310.
184
Buysse DJ, Ancoli-Israel S, Edinger JD, Lichstein KL, Morin CM (2006)
Recommendations for a standard research assessment of insomnia. Sleep 29:
1155-1173.
Cai Q, Li Y, Mao J, Pei G (2016) Neurogenesis-Promoting Natural Product α-
Asarone Modulates Morphological Dynamics of Activated Microglia. Front.
Cell. Neurosci. 10: 280.
Calasso M, Parmeggiani PL (2008) Carotid blood flow during REM sleep. Sleep
31: 701-707.
Campbell SS, Broughton RJ (1994) Rapid decline in body temperature before
sleep: fluffing the physiological pillow? Chronobiol. Int. 11: 126-131.
Cano G, Mochizuki T, Saper CB (2008) Neural circuitry of stress-induced
insomnia in rats. J. Neurosci. 28: 10167-10184.
Cao J-X, Zhang Q-Y, Cui S-Y, Cui X-Y, Zhang J, Zhang Y-H, et al. (2010)
Hypnotic effect of jujubosides from Semen Ziziphi Spinosae. J.
Ethnopharmacol. 130: 163-166.
Carskadon MA, Dement WC (2005) Normal human sleep: an overview.
Principles and Practice of Sleep Medicine 4: 13-23.
Cartus AT, Schrenk D (2016) Metabolism of the carcinogen alpha-asarone in liver
microsomes. Food Chem. Toxicol. 87: 103-112.
Cayman chemical (10/03/2014) α-Asarone (11681): Safety data sheet. Available:
https://www.caymanchem.com/product/11681 [Accessed: 14 August 2017]
Chamorro G, Salazar M, Tamariz J, Diaz F, Labarrios F (1999) Dominant Lethal
Study of -Asarone in Male and Female Mice after Sub-chronic Treatment.
Phytother. Res. 13: 308-311
Chellian R, Pandy V, Mohamed Z (2017) Pharmacology and Toxicology of α-and
β-Asarone: A Review of Preclinical Evidence. Phytomedicine 32: 41-58.
Chen Q-X, Miao J-K, Li C, Li X-W, Wu X-M, Zhang X-p (2013) Anticonvulsant
activity of acute and chronic treatment with a-asarone from Acorus gramineus
in seizure models. Biol. Pharm. Bull. 36: 23-30.
Chevalier H, Los F, Boichut D, Bianchi M, Nutt D, Hajak G, et al. (1999)
Evaluation of severe insomnia in the general population: results of a European
multinational survey. J. Psychopharmacol. 13: 21S-24S.
Chauhan V (2016) Complete list of Ayurvedic home remedies + herbs for
insomnia. Available: http://ayurvedanextdoor.com/herbs-for-insomnia/
[Accessed 21 June 2016]
185
Chouinard G (2004) Issues in the clinical use of benzodiazepines: potency,
withdrawal, and rebound. J. Clin. Psychiatry 65: 7-12.
Cirelli C (2006) Cellular consequences of sleep deprivation in the brain. Sleep
Med. Rev. 10: 307-321.
Cirelli C, Faraguna U, Tononi G (2006) Changes in brain gene expression after
long-term sleep deprivation. J. Neurochem. 98: 1632-1645.
Cohen S, Kozlovsky N, Matar MA, Kaplan Z, Zohar J, Cohen H (2012) Post-
exposure sleep deprivation facilitates correctly timed interactions between
glucocorticoid and adrenergic systems, which attenuate traumatic stress
responses. Neuropsychopharmacology 37: 2388-2404.
Colavito V, Fabene PF, Grassi-Zucconi G, Pifferi F, Lamberty Y, Bentivoglio M,
et al. (2013) Experimental sleep deprivation as a tool to test memory deficits
in rodents. Front. Syst. Neurosci. 7: 16.
Cortese BM, Mitchell TR, Galloway MP, Prevost KE, Fang J, Moore GJ, et al.
(2010) Region-specific alteration in brain glutamate: possible relationship to
risk-taking behavior. Physiol. Behav. 99: 445-450.
Czeisler CA, Weitzman ED, Moore-Ede MC, Zimmerman JC, Knauer RS (1980)
Human sleep- Its duration and organization depend on its circadian phase.
Science 210: 1264-1267.
Dandiya P, Baxter R, Walker G, Cullumbine H (1959a) Studies on Acorus
calamus, Part II. J. Pharm. and Pharmacol. 11: 163-168.
Dandiya P, Cullumbine H, Sellers E (1959b) Studies on Acorus calamus (IV):
Investigations on mechanism of action in mice. J. Pharmacol. Exp. Ther. 126:
334-337
Dandiya P, Menon M (1963) Effects of asarone and β- asarone on conditioned
responses, fighting behaviour and convulsions. Br. J. Pharmacol. Chemother.
20: 436-442.
Dandiya P, Menon M (1964) Actions of asarone on behavior, stress, and
hyperpyrexia, and its interaction with central stimulants. J. Pharmacol. Exp.
Ther. 145: 42-46.
Dandiya P, Sharma J (1962) Studies on Acorus calamus. V. Pharmacological
actions of asarone and beta-asarone on central nervous system. Indian J. Med.
Res. 50: 46-60.
186
Davies LP, Drew CA, Duffield P, Johnston GA, Jamieson DD (1992) Kava
pyrones and resin: studies on GABAA, GABAB and benzodiazepine binding
sites in rodent brain. Basic Clin. Pharmacol. Toxicol. 71: 120-126.
Dhalla N, Bhattacharya I (1968) Further studies on neuropharmacological actions
of acorus oil. Arch. Int. Pharmacodyn. Ther. 172: 356.
Dijk D-J, Neri DF, Wyatt JK, Ronda JM, Riel E, Ritz-De Cecco A, Hughes RJ, et
al. (2001) Sleep, performance, circadian rhythms, and light-dark cycles during
two space shuttle flights. Am. J. Physiol. Regul. Integr. Comp. Physiol. 281:
R1647-R1664.
Durmer JS, Dinges DF (2005) Neurocognitive consequences of sleep deprivation.
Semin. Neurol. 25: 117-129.
Ebben MR, Spielman AJ (2009) Non-pharmacological treatments for insomnia. J.
Behav. Med. 32: 244-254.
Equihua AC, Alberto K, Drucker-Colin R (2013) Orexin receptor antagonists as
therapeutic agents for insomnia. Front. Pharmacol. 4: 163.
Erman M, Seiden D, Zammit G, Sainati S, Zhang J (2006) An efficacy, safety,
and dose–response study of ramelteon in patients with chronic primary
insomnia. Sleep Med. 7: 17-24.
Everaerts W, Nilius B, Owsianik G (2010) The vanilloid transient receptor
potential channel TRPV4: From structure to disease. Prog. Biophys. Mol.
Biol. 103: 2-17.
Feige B, Voderholzer U, Riemann D, Hohagen F, Berger M (1999) Independent
sleep EEG slow-wave and spindle band dynamics associated with 4 weeks of
continuous application of short-half-life hypnotics in healthy subjects. Clin.
Neurophysiol. 110: 1965-1974.
Feinberg I, March JD, Fein G, Floyd TC, Walker JM, Price L (1978) Period
amplitude analysis of 0.5–3c/sec activity in non-REM sleep of young adults
Electroencephalogr. Clin. Neurophysiol. 44: 202–213.
Ford DE, Kamerow DB (1989) Epidemiologic study of sleep disturbances and
psychiatric disorders: an opportunity for prevention? JAMA 262: 1479-1484.
Franken P, Dijk D, Tobler I, Borbely AA (1991) Sleep deprivation in rats: effects
on EEG power spectra, vigilance states, and cortical temperature. Am. J.
Physiol. Regul. Integr. Comp. Physiol. 261: R198-R208.
187
Franken P, Tobler I, Borbely AA (1992) Cortical temperature and EEG slow-
wave activity in the rat: Analysis of vigilance state related changes. Pflugers
Arch. 420: 500-507.
Franken P, Malafosse A, Tafti M (1999) Genetic determinants of sleep regulation
in inbred mice. Sleep 22: 155-169.
Gambhir IS, Chakrabarti SS, Sharma AR, Saran DP (2014) Insomnia in the
elderly-A hospital-based study from North India. J. Clin. Gerontol. Geriatr. 5:
117-121.
Ganjewala D, Srivastava AK (2011) An update on chemical composition and
bioactivities of Acorus species. Asian J. Plant Sci. 10: 182.
Gilbert SS, van den Heuvel CJ, Ferguson SA, Dawson D (2004)
Thermoregulation as a sleep signalling system. Sleep Med. Rev. 8: 81-93.
Gopalakrishnan A, Li Ji L, Cirelli C (2004) Sleep deprivation and cellular
responses to oxidative stress. Sleep 27: 27-35.
Govindarajan R, Vijayakumar M, Pushpangadan P (2005) Antioxidant approach
to disease management and the role of „Rasayana‟herbs of Ayurveda. J.
Ethnopharmacol. 99: 165-178.
Gulec M, Ozkol H, Selvi Y, Tuluce Y, Aydin A, Besiroglu L, et al. (2012)
Oxidative stress in patients with primary insomnia. Prog.
Neuropsychopharmacol. Biol. Psychiatry 37: 247-251.
Gulia KK, Radhakrishnan A, Kumar VM (2017) Approach to Sleep Disorders in
the Traditional School of Indian Medicine: Alternative Medicine II. In Sleep
Disorders Medicine, Springer, pp 1221-1231.
Gulia KK, Mallick HN, Kumar VM (2004) Sleep-related penile erections do not
occur in rats during carbachol-induced rapid eye movement sleep. Behav.
Brain Res.154: 585-587.
Gulia KK, Mallick HN, Kumar VM (2005) Ambient temperature related sleep
changes in rats neonatally treated with capsaicin. Physiol. Behav. 85: 414-418.
Gulia KK, Judo E, Kawauchi A, Miki T, Kayama Y, Mallick HN, et al. (2008)
The septal area, site for the central regulation of penile erection during waking
and rapid eye movement sleep in rats: A stimulation study. Neuroscience 156:
1064-1073.
Gunja N (2013) The clinical and forensic toxicology of Z-drugs. J. Med. Toxicol.
9: 155-162.
188
Gutteridge J, Halliwell B (2000) Free radicals and antioxidants in the year 2000: a
historical look to the future. Ann. N. Y. Acad. Sci. 899: 136-147.
Han P, Han T, Peng W, Wang XR (2013) Antidepressant-like effects of essential
oil and asarone, a major essential oil component from the rhizome of Acorus
tatarinowii. Pharm. Biol. 51: 589-594.
Houghton PJ (1999) The scientific basis for the reputed activity of Valerian. J.
Pharm. Pharmacol. 51: 505-512.
Houghton P, Mukherjee P, Kumar V, Mal M (2006) Acetylcholinesterase
inhibition of oil from Acorus calamus rhizome. Planta Med. 72: 996.
Huang C, Li W-G, Zhang X-B, Wang L, Xu T-L, Wu D, et al. (2013) Alpha-
asarone from Acorus gramineus alleviates epilepsy by modulating A-type
GABA receptors. Neuropharmacology 65: 1-11.
Janson C, Lindberg E, Gislason T, Elmasry A, Boman G (2001) Insomnia in men-
a 10-year prospective population based study. Sleep 24: 425-430.
Jayaraman R, Anitha T, Joshi VD (2010) Analgesic and anticonvulsant effects of
Acorus calamus roots in mice. Int. J. Pharm. Tech. Re.s 2: 552-555.
John J, Kumar VM, Gopinath G, Ramesh V, Mallick H (1994) Changes in sleep-
wakefulness after kainic acid lesion of the preoptic area in rats. Jpn. J.
Physiol. 44:231-242
Kales A, Bixler EO, Tan T-L, Scharf MB, Kales JD (1974) Chronic hypnotic-
drug use: ineffectiveness, drug-withdrawal insomnia, and dependence. JAMA
227: 513-517.
Katz DA, McHorney CA (2002) The relationship between insomnia and health-
related quality of life in patients with chronic illness. J. Fam. Pract. 51: 229-
234.
Kaushik MK, Kaul SC, Wadhwa R, Yanagisawa M, Urade Y (2017) Triethylene
glycol, an active component of Ashwagandha (Withania somnifera) leaves, is
responsible for sleep induction. PloS One 12: e0172508.
Keller K, Stahl E (1983) Composition of the essential oil from beta-Asarone free
calamus. Planta Med. 47: 71-74.
Khare C. (2007) Indian Medicinal Plants, 1st Edn., Berlin/Heidlburg. Springer
verlang.
Kim B-W, Koppula S, Kumar H, Park J-Y, Kim I-W, More SV, et al. (2015) α-
Asarone attenuates microglia-mediated neuroinflammation by inhibiting NF
189
kappa B activation and mitigates MPTP-induced behavioral deficits in a
mouse model of Parkinson's disease. Neuropharmacology 97: 46-57.
Kräuchi K (2007) The human sleep–wake cycle reconsidered from a
thermoregulatory point of view. Physiol. Behav. 90: 236-245.
Krueger JM, Takahashi S (1997) Thermoregulation and Sleep. Ann. N. Y. Acad.
Sci. 813: 281-286.
Kumar H, Kim B-W, Song S-Y, Kim J-S, Kim I-S, Kwon Y-S, et al. (2012)
Cognitive enhancing effects of alpha asarone in amnesic mice by influencing
cholinergic and antioxidant defense mechanisms. Biosci. Biotech. Biochem.
76: 1518-1522.
Kumar VM, Sharma R, Wadhwa S, Manchanda SK (1993) Sleep-inducing
function of noradrenergic fibers in the medial preoptic area. Brain Res.Bull.
32:153-158.
Kumar VM (2004) Why the medial preoptic area is important for sleep regulation.
Indian J Physiol Pharmacol. 48 :137-149.
Kumar VM (2012) Sleep is an Auto-Regulatory Global Phenomenon. Front.
Neurol. 3:94.
Lack LC, Gradisar M, Van Someren EJ, Wright HR, Lushington K (2008) The
relationship between insomnia and body temperatures. Sleep Med. Rev. 12:
307-317.
Lancel M, Crönlein TA, Faulhaber J (1996) Role of GABAA receptors in sleep
regulation differential effects of muscimol and midazolam on sleep in rats.
Neuropsychopharmacology 15: 63-74.
Landis CA, Bergmann BM, Ismail MM, Rechtschaffen A (1992) Sleep
deprivation in the rat: XV. Ambient temperature choice in paradoxical sleep-
deprived rats. Sleep 15: 13-20.
Lee B, Sur B, Yeom M, Shim I, Lee H, Hahm DH (2014) Alpha-asarone, a major
component of Acorus gramineus, attenuates corticosterone-induced anxiety-
like behaviours via modulating TrkB signaling process. Korean J. Physiol.
Pharmacol. 18: 191-200.
Lesku JA, Roth TC, Rattenborg NC, Amlaner CJ, Lima SL (2008) Phylogenetics
and the correlates of mammalian sleep: a reappraisal. Sleep Med. Rev. 12:
229-244
Limón ID, Mendieta L, Díaz A, Chamorro G, Espinosa B, Zenteno E, et al.
(2009) Neuroprotective effect of alpha-asarone on spatial memory and nitric
190
oxide levels in rats injected with amyloid-β (25–35). Neurosci. Lett. 453: 98-
103.
Liu S, Chen SW, Xu N, Liu XH, Zhang H, Wang YZ, Xu XD (2012)
Anxiolytic‐like Effect of α‐Asarone in Mice. Phytother. Res. 26: 1476-1481.
Lowry OH, Rosebrough NJ, Farr AL, Randall RJ (1951) Protein measurement
with the Folin phenol reagent. J. Biol. Chem. 193: 265-275.
Lu J, Fu T, Qian Y, Zhang Q, Zhu H, Pan L, et al. (2014) Distribution of α-
asarone in brain following three different routes of administration in rats. Eur.
J. Pharm. Sci. 63: 63-70.
Macêdo PJOM, Neves GSdML, Poyares DLR, da Mota Gomes M (2016)
Insomnia current diagnosis: an appraisal. Rev. Bras. Neurol. 51: 62-68.
Mallick HN, Kumar VM (2012) Basal forebrain thermoregulatory mechanism
modulates auto-regulated sleep. Front. Neurol. 3: 102.
Manikandan S, Devi RS (2005) Antioxidant property of α-asarone against noise-
stress-induced changes in different regions of rat brain. Pharmacol. Res. 52:
467-474.
Manikandan S, Srikumar R, Jeya Parthasarathy N, Devi RS (2005) Protective
effect of Acorus calamus LINN on free radical scavengers and lipid
peroxidation in discrete regions of brain against noise stress exposed rat. Biol.
Pharm.Bull. 28: 2327-2330.
Marcks BA, Weisberg RB, Edelen MO, Keller MB (2010) The relationship
between sleep disturbance and the course of anxiety disorders in primary care
patients. Psychiatry Res. 178: 487-492.
Marklund S, Marklund G (1974) Involvement of the superoxide anion radical in
the autoxidation of pyrogallol and a convenient assay for superoxide
dismutase. FEBS J. 47: 469-474.
McAnulty SR, McAnulty L, Pascoe DD, Gropper SS, Keith RE, Morrow JD, et
al. (2005) Hyperthermia increases exercise-induced oxidative stress. Int. J.
Sports Med. 26: 188-192.
McGinty D, Szymusiak R (1990) Keeping cool: a hypothesis about the
mechanisms and functions of slow-wave sleep. Trends Neurosci. 13: 480-487.
Mendelson WB (1995) Long-term follow-up of chronic insomnia. Sleep 18: 698-
701.
191
Menon M, Dandiya P (1967) The mechanism of the tranquillizing action of
asarone from Acorus calamus Linn. J. Pharm. Pharmacol. 19: 170-175.
Mikaelsson MA, Constância M, Dent CL, Wilkinson LS, Humby T (2013)
Placental programming of anxiety in adulthood revealed by Igf2-null models.
Nat. Commun. 4: 2311.
Möhler H (2008) GABA A-benzodiazepine receptors as targets for new
hypnotics. In: Pandi-Perumal SR, Verster JC, Monti JM, Lader M, Langer SZ
(eds) Sleep disorders: diagnostics and therapeutics Informa Healthcare,
London, pp 206-219.
Monti JM, Monti D (2000) Sleep disturbance in generalized anxiety disorder and
its treatment. Sleep Med. Rev. 4: 263-276.
Moron MS, Depierre JW, Mannervik B (1979) Levels of glutathione, glutathione
reductase and glutathione S-transferase activities in rat lung and liver.
Biochem. Biophys. Acta. 582: 67-78.
Motley TJ (1994) The ethnobotany of sweet flag, Acorus calamus (Araceae).
Econ. Bot. 48: 397-412.
Mowrey DB (1986) Scientific Validation of Herbal Medicine. New Cannan, CT:
Keats Publishing, Inc.
Mukherjee PK, Kumar V, Mal M, Houghton PJ (2007) Acorus calamus.:
Scientific Validation of Ayurvedic Tradition from Natural Resources. Pharm.
Biol. 45: 651-666.
Muthuraman A, Singh N (2011) Attenuating effect of Acorus calamus extract in
chronic constriction injury induced neuropathic pain in rats: an evidence of
anti-oxidative, anti-inflammatory, neuroprotective and calcium inhibitory
effects. BMC Complement. Altern. Med. 11: 24.
Nauta WJ (1946) Hypothalamic regulation of sleep in rats; an experimental study.
J. Neurophysiol. 9: 285-316.
Ngan A, Conduit R (2011) A double‐blind, placebo‐controlled investigation of the
effects of Passiflora incarnata (Passionflower) herbal tea on subjective sleep
quality. Phytother. Res. 25: 1153-1159
Nofzinger EA, Price JC, Meltzer CC, Buysse DJ, Villemagne VL, Miewald JM,
et al. (2000) Towards a neurobiology of dysfunctional arousal in depression:
the relationship between beta EEG power and regional cerebral glucose
metabolism during NREM sleep. Psychiat. Res. Neuroim. 98: 71-91.
192
Nofzinger EA, Buysse DJ, Germain A, Price JC, Miewald JM, Kupfer DJ (2004)
Functional neuroimaging evidence for hyperarousal in insomnia. Am. J.
Psychiatry 161: 2126-2128.
Ohayon MM (2002) Epidemiology of insomnia: what we know and what we still
need to learn. Sleep Med. Rev. 6: 97-111.
Ohayon MM (2010) Dyssomnia: Impact on Medical Diseases and Morbidity.
Available: SleepEval.com. [Accessed: 3 August 2017]
Ohayon MM (2011) Epidemiological overview of sleep disorders in the general
population. SMR 2: 1-9.
Ohayon MM, Roth T (2003) Place of chronic insomnia in the course of depressive
and anxiety disorders. J. Psychiatr. Res. 37: 9-15.
Olsen RHJ, Johnson LA, Zuloaga DG, Limoli CL, Raber J (2013) Enhanced
hippocampus-dependent memory and reduced anxiety in mice over-
expressing human catalase in mitochondria. J. Neurochem. 125: 303–313.
Pages N, Maurois P, Delplanque B, Bac P, Stables JP, Tamariz J, Chamorro G,
Vamecq J (2010) Activities of α-asarone in various animal seizure models and
in biochemical assays might be essentially accounted for by antioxidant
properties. Neurosci. Res. 68: 337-344.
Paget G, Barnes J (1964) Toxicity tests. Evaluation of drug activities:
Pharmacometrics 1: 135-165.
Palani S, Raja S, Praveen K, Venkadesan D, Devi K, Sivaraj A, et al. (2009)
Therapeutic efficacy of antihepatotoxic and antioxidant activities of Acorus
calamus on acetaminophen-induced toxicity in rat. Int. J. Integrat. Biol. 7: 39-
44.
Panchal G, Venkatakrishna-Bhatt H, Doctor R, Vajpayee S (1989) Pharmacology
of Acorus calamus L. Indian J. Exp. Biol. 27: 561-567.
Panda S, Taly AB, Sinha S, Gururaj G, Girish N, Nagaraja D (2012) Sleep-related
disorders among a healthy population in South India. Neurol. India 60: 68.
Patil AB, Kumar A, Meena K (2014) Insomnia (Anidra) and Ayurveda- A Critical
Review. IAMJ. 2: 775-779.
Paxinos G, Watson C (1997) The rat brain in stereotaxic coordinates. 3rd
edition.
Academic Press, Inc. San Diego.
Perharic L, Shaw D, Colbridge M, House I, Leon C, Murray V (1994)
Toxicological problems resulting from exposure to traditional remedies and
food supplements. Drug Saf. 11: 284-294.
193
Perlis ML, Smith MT, Pigeon WR (2005) Etiology and pathophysiology of
insomnia. Principles and practice of sleep medicine 4th
edition. Saunders.
Perlis ML, Smith MT, Andrews PJ, Orff H, Giles DE (2001) Beta/Gamma EEG
cctivity in patients with primary and secondary insomnia and good sleeper
controls. Sleep 24: 110-117.
Porkka-Heiskanen T, Alanko L, Kalinchuk A, Stenberg D (2002) Adenosine and
sleep. Sleep Med. Rev. 6: 321-332.
Raina V, Srivastava S, Syamasunder K (2003) Essential oil composition of
Acorus calamus L. from the lower region of the Himalayas. Flavour Frag. J.
18: 18-20.
Rajput SB, Tonge MB, Karuppayil SM (2014) An overview on traditional uses
and pharmacological profile of Acorus calamus Linn.(Sweet flag) and other
Acorus species. Phytomedicine 21: 268-276.
Ramanathan L, Gulyani S, Nienhuis R, Siegel JM (2002) Sleep deprivation
decreases superoxide dismutase activity in rat hippocampus and brainstem.
Neuroreport 13: 1387-1390.
Ramanathan L, Hu S, Frautschy SA, Siegel JM (2010) Short-term total sleep
deprivation in the rat increases antioxidant responses in multiple brain regions
without impairing spontaneous alternation behavior. Behav. Brain Res. 207:
305-309.
Ray B, Mallick HN, Kumar VM (2004) Changes in thermal preference, sleep-
wakefulness, body temperature and locomotor activity of rats during
continuous recording for 24 hours. Behav. Brain Res. 154: 519-526.
Rechtschaffen A, Bergmann BM (2002) Sleep deprivation in the rat: an update of
the 1989 paper. Sleep 25: 18-24.
Rechtschaffen A, Bergmann BM, Gilliland MA, Bauer K (1999) Effects of
method, duration, and sleep stage on rebounds from sleep deprivation in the
rat. Sleep 22: 11-32.
Rechtschaffen A, Bergmann BM, Everson CA, Kushida CA, Gilliland MA
(1989). Sleep deprivation in the rat: X. Integration and discussion of the
findings. Sleep 12: 68-87.
Reddy S, Rao G, Shetty B, Hn G (2014) Effects of Acorus calamus Rhizome
Extract on the Neuromodulatory System in Restraint Stress Male Rats. Turk.
Neurosurg 25: 425-431.
194
Reimund E (1994) The free radical flux theory of sleep. Med. hypotheses 43: 231-
233.
Revel FG, Gottowik J, Gatti S, Wettstein JG, Moreau J-L (2009) Rodent models
of insomnia: a review of experimental procedures that induce sleep
disturbances. Neurosci. Biobehav. Rev. 33: 874-899.
Rhee YH, Lee SP, Honda K, Inoué S (1990) Panax ginseng extract modulates
sleep in unrestrained rats. Psychopharmacology 101: 486-488.
Ringdahl EN, Pereira SL, Delzell JE (2004) Treatment of primary insomnia. J.
Am. Board Fam. Pract. 17: 212-219.
Rogers NL, Ferguson S (2009) Thermoregulation and sleep-wake behavior in
humans. Basics of Sleep Guide, 2nd
edition. Sleep Research Society.
Roth T (2007) Insomnia: definition, prevalence, etiology, and consequences. J.
Clin. Sleep Med. 3: S7.
Roth T, Roehrs T (2003) Insomnia: epidemiology, characteristics, and
consequences. Clin. Cornerstone 5: 5-15.
Rotruck J, Pope A, Ganther H, Swanson A, Hafeman DG, Hoekstra W (1973)
Selenium: biochemical role as a component of glutathione peroxidase. Science
179: 588-590.
Sakai K, Crochet S (2003) A neural mechanism of sleep and wakefulness. Sleep
Biol. Rhythms 1: 29-42.
Saletu-Zyhlarz G, Saletu B, Anderer P, Brandstätter N, Frey R, Gruber G, et al.
(1997) Nonorganic insomnia in generalized anxiety disorder.
Neuropsychobiology 36: 117-129.
Sandeep D, Nair CKK (2011) Radioprotection by α-asarone: prevention of
genotoxicity and hematopoietic injury in mammalian organism. Mutat. Res.
Genet. Toxicol. Environ. Mutagen. 722: 62-68.
Sandeep D, Nair CKK (2012) Protection from lethal and sub-lethal whole body
exposures of mice to γ-radiation by Acorus calamus L.: Studies on tissue
antioxidant status and cellular DNA damage. Exp. Toxicol. Pathol. 64: 57-64.
Saper CB, Chou TC, Scammell TE (2001) The sleep switch: hypothalamic control
of sleep and wakefulness. Trends Neursci. 24: 726-731.
Schulz H, Jobert M (1994) Effects of hypericum extract on the sleep EEG in older
volunteers. J. Geriatr. Psychiatry Neurol. 7: S39-S43.
195
Schulz H, Jobert M, Hübner W (1998) The quantitative EEG as a screening
instrument to identify sedative effects of single doses of plant extracts in
comparison with diazepam. Phytomedicine 5: 449-458
Seugnet L, Suzuki Y, Thimgan M, Donlea J, Gimbel SI, Gottschalk L, et al.
(2009) Identifying sleep regulatory genes using a Drosophila model of
insomnia. J. Neurosci. 29: 7148-7157.
Sharma J, Dandiya P, Baxter R, Kandel S (1961) Pharmacodynamical effects of
asarone and β-asarone. Nature 192: 1299-1300.
Sharma PK, Shukla G, Gupta A, Goyal V, Srivastava A, Behari M (2013) Primary
sleep disorders seen at a Neurology service-based sleep clinic in India:
Patterns over an 8-year period. Ann. Indian Acad. Neurol. 16: 146.
Sharma V, Singh I, Chaudhary P (2014) Acorus calamus (The Healing Plant): a
review on its medicinal potential, micropropagation and conservation. Nat.
Prod. Res. 28: 1454-1466.
Shibasaki M, Namba M, Oshiro M, Kakigi R, Nakata H (2008) Suppression of
cognitive function in hyperthermia; from the viewpoint of executive and
inhibitive cognitive processing. Sci. Rep. 7: 43528.
Shin J-W, Cheong Y-J, Koo Y-M, Kim S, Noh C-K, Son Y-H, et al. (2014) α-
Asarone ameliorates memory deficit in lipopolysaccharide-treated mice via
suppression of pro-inflammatory cytokines and microglial activation. Biomol.
Ther. 22: 17-26.
Shukla PK, Khanna VK, Ali MM, Maurya R, Khan M, Srimal RC (2006)
Neuroprotective effect of Acorus calamus against middle cerebral artery
occlusion-induced ischaemia in rat. Hum. Exp. Toxicol. 25: 187-194.
Shukla PK, Khanna VK, Ali M, Maurya R, Handa S, Srimal R (2002) Protective
effect of Acorus calamus against acrylamide induced neurotoxicity. Phytother.
Res. 16: 256-260.
Silva RH, Kameda SR, Carvalho RC, Takatsu-Coleman AL, Niigaki ST, Abílio
VC, et al. (2004) Anxiogenic effect of SD in the elevated plus-maze test in
mice. Psychopharmacology 176: 115-122.
Singh R, Sharma PK, Malviya R (2011) Pharmacological properties and
ayurvedic value of Indian buch plant (Acorus calamus): a short review. Adv.
Biol. Res. 5: 145-154.
Smith IK, Vierheller TL, Thorne CA (1988) Assay of glutathione reductase in
crude tissue homogenates using 5, 5′-dithiobis (2-nitrobenzoic acid). Anal.
Biochem. 175: 408-413.
196
Spielman AJ, Caruso LS, Glovinsky PB (1987) A behavioral perspective on
insomnia treatment. Psychiatr. Clin. North Am. 10: 541-53.
Stein MB, Kroft CD, Walker JR (1993) Sleep impairment in patients with social
phobia. Psychiatry Res. 49: 251-256.
Stepanski E, Zorick F, Roehrs T, Young D, Roth T (1988) Daytime alertness in
patients with chronic insomnia compared with asymptomatic control subjects.
Sleep 11: 54-60.
Suri J, Sen M, Singh P, Kumar R, Aggarwal P (2007) Sleep patterns and their
impact on lifestyle, anxiety and depression in BPO workers. Indian J. Sleep
Med. 2.2: 64-70.
Suri J, Sen M, Adhikari T (2008) Epidemiology of sleep disorders in school
children of Delhi: A questionnaire based study. Indian J. Sleep Med. 3: 42-50.
Suri J, Sen M, Ojha U, Adhikari T (2009) Epidemiology of sleep disorders in the
elderly–A questionnaire survey. Indian J. Sleep Med. 4.1: 12-18.
Taylor DJ, Lichstein KL, Durrence HH, Reidel BW, Bush AJ (2005)
Epidemiology of insomnia, depression, and anxiety. Sleep 28: 1457-1464.
Taylor JM, Jones WI, Hagan EC, Gross MA, Davis DA, Cook EL (1967) Toxicity
of Oil of Calamus (Jammu variety). Toxicology and Applied Pharmacology
10: 405 (Abstract).
Tiwari N, Mishra A, Bhatt G, Chaudhary A (2014) Isolation of principle active
compound of Acorus Calamus. In vivo assessment of pharmacological activity
in the treatment of neurobiological disorder (Stress). J.M.S.C.R. 2: 2201-2212.
Toth LA, Bhargava P (2013) Animal models of sleep disorders. Comp. Med. 63:
91-104.
Tripathi A, Singh R (2010) Experimental evaluation of antidepressant effect of
Vacha (Acorus calamus) in animal models of depression. Ayu 31: 153-158.
Van Den Heuvel CJ, Ferguson SA, Gilbert SS, Dawson D (2004)
Thermoregulation in normal sleep and insomnia: the role of peripheral heat
loss and new applications for digital thermal infrared imaging (DITI). J.
Therm. Biol. 29: 457-461.
Van Someren EJ, Raymann RJ, Scherder EJ, Daanen HA, Swaab DF (2002)
Circadian and age-related modulation of thermoreception and temperature
regulation: mechanisms and functional implications. Ageing Res. Rev. 1: 721-
778.
197
Vgontzas AN, Bixler EO, Lin H-M, Prolo P, Mastorakos G, Vela-Bueno A, et al.
(2001) Chronic insomnia is associated with nyctohemeral activation of the
hypothalamic-pituitary-adrenal axis: clinical implications. J. Clin. Endocrinol.
Metab. 86: 3787-3794.
Villafuerte G, Miguel-Puga A, Murillo Rodríguez E, Machado S, Manjarrez E,
Arias-Carrión O (2015) Sleep deprivation and oxidative stress in animal
models: a systematic review. Oxid. Med. Cell. Longev. 2015: 234952.
Vohora S, Shah SA, Dandiya P (1990) Central nervous system studies on an
ethanol extract of Acorus calamus rhizomes. J. Ethnopharmacol. 28: 53-62.
Wagner J, Wagner ML, Hening WA (1998) Beyond benzodiazepines: alternative
pharmacologic agents for the treatment of insomnia. Ann. Pharmacother. 32:
680-691
Zangrossi H, Viana MB, Graeff FG (1999) Anxiolytic effect of intra-amygdala
injection of midazolam and 8-hydroxy-2-(di-n-propylamino) tetralin in the
elevated T-maze. Eur. J. Pharmacol. 369: 267-270.

198
Annexures
199
LIST OF PUBLICATIONS
From thesis
1. Radhakrishnan A, Jayakumari N, Kumar VM, Gulia KK (2017) Sleep
promoting potential of low dose α-Asarone in rat model. Neuropharmacology
125: 13-29. IF: 5.106
Other publications
1. Sivadas N, Radhakrishnan A, Aswathy BS, Kumar VM, Gulia KK (2017)
Dynamic changes in sleep pattern during post-partum in normal pregnancy in
rat model. Behav. Brain Res. 320: 264-274. IF: 3.002
2. Gulia KK, Radhakrishnan A, Kumar VM (2017) Approach to Sleep
Disorders in the Traditional School of Indian Medicine: Alternative Medicine
II. In Sleep Disorders Medicine, pp 1221-1231. Springer. Book Chapter
3. Radhakrishnan A, Aswathy BS, Kumar VM, Gulia KK (2015) Sleep
deprivation during late pregnancy produces hyperactivity and increased risk-
taking behavior in offspring. Brain Res. 1596: 88-98. IF: 2.746
4. Gulia KK, Patel N, Radhakrishnan A, Kumar VM (2014) Reduction in
ultrasonic vocalizations in pups born to rapid eye movement sleep restricted
mothers in rat model. PLoS One 9: e84948. IF: 2.806

200

Related Documents