University of Tennessee, Knoxville University of Tennessee, Knoxville TRACE: Tennessee Research and Creative TRACE: Tennessee Research and Creative Exchange Exchange Doctoral Dissertations Graduate School 5-2019 Study of local creep deformation behavior of heterogeneous weld Study of local creep deformation behavior of heterogeneous weld configurations involving ferritic Chrome-Molybdenum steel and configurations involving ferritic Chrome-Molybdenum steel and austenitic Ni-base alloys austenitic Ni-base alloys Mohan Subramanian University of Tennessee, [email protected] Follow this and additional works at: https://trace.tennessee.edu/utk_graddiss Recommended Citation Recommended Citation Subramanian, Mohan, "Study of local creep deformation behavior of heterogeneous weld configurations involving ferritic Chrome-Molybdenum steel and austenitic Ni-base alloys. " PhD diss., University of Tennessee, 2019. https://trace.tennessee.edu/utk_graddiss/5351 This Dissertation is brought to you for free and open access by the Graduate School at TRACE: Tennessee Research and Creative Exchange. It has been accepted for inclusion in Doctoral Dissertations by an authorized administrator of TRACE: Tennessee Research and Creative Exchange. For more information, please contact [email protected].

Welcome message from author
This document is posted to help you gain knowledge. Please leave a comment to let me know what you think about it! Share it to your friends and learn new things together.
Transcript
University of Tennessee, Knoxville University of Tennessee, Knoxville
TRACE: Tennessee Research and Creative TRACE: Tennessee Research and Creative
Exchange Exchange
Doctoral Dissertations Graduate School
5-2019
Study of local creep deformation behavior of heterogeneous weld Study of local creep deformation behavior of heterogeneous weld
configurations involving ferritic Chrome-Molybdenum steel and configurations involving ferritic Chrome-Molybdenum steel and
austenitic Ni-base alloys austenitic Ni-base alloys
Mohan Subramanian University of Tennessee, [email protected]
Follow this and additional works at: https://trace.tennessee.edu/utk_graddiss
Recommended Citation Recommended Citation Subramanian, Mohan, "Study of local creep deformation behavior of heterogeneous weld configurations involving ferritic Chrome-Molybdenum steel and austenitic Ni-base alloys. " PhD diss., University of Tennessee, 2019. https://trace.tennessee.edu/utk_graddiss/5351
This Dissertation is brought to you for free and open access by the Graduate School at TRACE: Tennessee Research and Creative Exchange. It has been accepted for inclusion in Doctoral Dissertations by an authorized administrator of TRACE: Tennessee Research and Creative Exchange. For more information, please contact [email protected].

To the Graduate Council:
I am submitting herewith a dissertation written by Mohan Subramanian entitled "Study of local
creep deformation behavior of heterogeneous weld configurations involving ferritic Chrome-
Molybdenum steel and austenitic Ni-base alloys." I have examined the final electronic copy of
this dissertation for form and content and recommend that it be accepted in partial fulfillment
of the requirements for the degree of Doctor of Philosophy, with a major in Engineering Science.
Sudarsanam Suresh Babu, Major Professor
We have read this dissertation and recommend its acceptance:
Zhili Feng, Hahn Choo, Chad Duty
Accepted for the Council:
Dixie L. Thompson
Vice Provost and Dean of the Graduate School
(Original signatures are on file with official student records.)

Study of local creep deformation behavior of heterogeneous
weld configurations involving ferritic Chrome-Molybdenum
steel and austenitic Ni-base alloys
A Dissertation Presented for the
Doctor of Philosophy
Degree
The University of Tennessee, Knoxville
Mohan Subramanian
May 2019

ii
Dedicated to the memory of one of my welding teachers,
Mr. Kumaran Balasubramanian

iii
Acknowledgements
First and foremost, I would like to express my sincere gratitude to my advisor Prof. Sudarsanam
Suresh Babu for investing his time in me. His mentoring and guidance have shaped me into what
I’m today. His scientific insights, his constant nudge to go into the finer details of research
problem, and his critical feedback on several of my hypotheses have immensely helped me to
refine my abilities to become a better research student. I fondly remember the discussions we both
had at Idaho National Laboratory in Idaho Falls and West town mall in Knoxville. Those two
insightful discussions have been instrumental in my development as a researcher. All these
discussions with Suresh over the years stay close to my heart and will be a source of inspiration
for me in the years to come.
I would like to thank my PhD advisory committee members, Dr. Zhili Feng, Dr. Hahn Choo, Dr.
Chad Duty and Dr. John Vitek for their valuable technical discussions and critical feedback,
which helped me to evaluate my research tasks periodically. A special word of thanks is also due
to my collaborators Prof. John DuPont and Dr. Jonathan Galler at Lehigh University for their
valuable inputs in numerous technical discussions on this research work.
My sincere thanks are due to Paul and Madeline Bunch, for recognizing my research work though
a fellowship award. The recognition served as a great deal of motivation for me in the final year
of my PhD study. I would consider myself fortunate for having had the opportunity to interact with
Paul Bunch, who has a vast amount of experience in material processing technologies and their
current industry standards. In addition to his continued guidance for my research work, he helped
me in achieving my career goals. I would also like to thank Prof. Matthew Mench for considering
me this fellowship opportunity.

iv
I am grateful for the guidance offered by Dr. Boopathy Kombaiah from Oak Ridge National
Laboratory (ORNL) over the years of my PhD work. Numerous insights offered by him on creep
fundamental theory and creep deformation mechanisms have been extremely helpful for my creep
modeling studies. He and his wife, Viji Boopathy took care of me as a family member during the
last 2 years of my stay in Knoxville.
Discussions with all my fellow students of Advance Materials Manufacturing Group (AMMG)
have been fruitful to refine my research ideas. My friends and my roommates for a long time,
Naren and Niyanth have always been encouraging and open for offering advices whenever I
needed. I would also like to sincerely thank my managers at Godrej & Boyce Mfg. Co. Ltd., Mr.
Prasad Thangavelu and Mr. Premkumar Palani for introducing me to the interesting field of
welding engineering. A special word of thanks is also due to Mr. Nash Ubale from Los Alamos
National Laboratory (LANL) (previously with Schlumberger) for mentoring me both on my
academic and careers interests.
I would also like to thank my parents, Mr. and Mrs. Subramanian, for staying as pillars of
strength in all these years of my undergraduate and graduate school life. They have been
immensely supportive of all my academic and career aspirations. I can’t thank them enough in
words for all the sacrifice they have done over the years to make me realize all my dreams in life.
My special thanks are due to my brother, Sathish Subramanian, for keeping me cheered up all
along my PhD journey.
Last but not the least, my heartfelt thanks are due to my wife, Bakkiam Meenakshisundaram.
She entered my life during the final year of my PhD study and became the core source of strength
since then. She has been such a positive influence in my life and has encouraged me in every
possible step of my PhD journey.
v
Abstract
Dissimilar Metal Welds (DMWs) made between ferritic low alloy steel (BCC) and austenitic alloys
(FCC) are widely used in the high temperature components of power plants. Ex-service data from
power plants suggests these bimetallic welds fail prematurely by creep mechanism, with lifetimes
much lesser than the creep lives of either of the base materials. Earlier creep studies have
demonstrated that failures are associated with creep cavities along the ferritic steel HAZ close to
BCC/FCC boundary, due to the local detrimental microstructure. Structure-property relationships
have not been established for these heterogeneous materials due to the limitation in the spatial
measurement of creep strain rates. Hence, the objective of this research study is to develop a
methodology to extract the local creep constitutive properties from heterogenous weld
configurations and correlate these properties with the underlying microstructure. The following
heterogeneous weld configurations were considered:
I. Conventional DMWs made between 2.25Cr-1Mo steel and Alloy 800H base materials
using Inconel weld consumable,
II. Graded Transition Joints (GTJs) made between 2.25Cr-1Mo steel and Alloy 800H base
materials using each of the three candidate filler metals viz., (i) Inconel 82, (ii) P87,
and (iii) 347H
Local creep studies discretized the heterogeneous creep behavior in both these welded
configurations. Global creep strain from both these welded configurations was a result of creep
strain evolution from the 2.25Cr-1Mo base material and regions inside 2.25Cr-1Mo HAZ, while
the other austenitic regions showed negligible creep formation. In both DMWs and GTJs, creep
strain was accumulating inside 2.25Cr-1Mo HAZ and was driving the premature failure in these
welded joints.

vi
Research findings from these local creep studies were summarized as follows:
1. In DMWs, creep strain accumulation and the creep damage occurred close to BCC/FCC
boundary due to the localized decarburization (depletion of carbides) in those regions,
2. In all the GTJs, creep strain accumulation and the creep damage occurred in the FGHAZ
at 3.5mm away from the weld interface, as a result of carbide coarsening during weld
processing.
Microstructure based creep model framework was developed to model the discrete creep strain
rates with the local microstructures of 2.25Cr-1Mo steel.

vii
Table of contents
Chapter 1 Introduction ............................................................................................................... 1
Chapter 2 Problem background ................................................................................................. 5
2.1. Base materials ............................................................................................................... 5
2.2. Dissimilar Metal Weld (DMW) failure mechanism ..................................................... 5
2.3. Microstructural evolution in DMWs in the as-welded and the subsequent aged
conditions.. ...................................................................................................................................... 8
2.4. Grading the composition in layers: a possible solution? ............................................ 15
Chapter 3 Research objectives and methodology .................................................................. 17
3.1. Objectives ................................................................................................................... 17
3.2. Test methodology ....................................................................................................... 18
Chapter 4 Study of heterogeneous creep deformation in conventional Dissimilar Metal
Welds (DMWs) ............................................................................................................................ 22
4.1. Introduction ................................................................................................................ 22
4.2. Experimental procedure .............................................................................................. 23
4.2.1. Sample fabrication .................................................................................................. 23
4.2.2. Microstructural characterization ............................................................................. 25
4.2.3. Creep testing with Digital Image Correlation (DIC) .............................................. 26
4.3. Results ........................................................................................................................ 28
4.3.1. Pre-test microstructural characterization of aged DMW samples .......................... 28
4.3.2. Creep response of the aged DMW samples ............................................................ 32
4.3.3. Identification of regions with accelerated creep strain rate within 2.25Cr-1Mo
HAZ…… ............................................................................................................................... 36
viii
4.4. Discussion ................................................................................................................... 39
4.4.1. Comparison of global creep strain rates with previous creep studies on DMWs… 39
4.4.2. Correlation of creep damage to failures in ex-service DMWs ............................... 40
4.4.3. Correlation of creep strain concentration to microstructural heterogeneity ........... 40
4.4.4. Implications of the current results........................................................................... 49
4.5. Summary ..................................................................................................................... 51
Chapter 5 Comparative creep studies on functionally Graded Transition Joints (GTJs) . 53
5.1. Introduction ................................................................................................................ 53
5.2. Experimental procedure .............................................................................................. 54
5.2.1. Fabrication of Graded Transition Joint (GTJ) coupons .......................................... 54
5.2.2. Microstructural characterization ............................................................................. 56
5.2.3. Creep testing with Digital Image Correlation (DIC) .............................................. 56
5.3. Results and discussion ................................................................................................ 58
5.3.1. Pre-test microstructural characterization of aged GTJ samples .............................. 58
5.3.2. Creep response of the 2000h aged GTJ samples .................................................... 59
5.3.3. Identification of regions with accelerated creep strain rate within 2.25Cr-1Mo
HAZ…… ............................................................................................................................... 62
5.3.4. Rationalization of creep strain concentration in 2000h aged GTJ samples ............ 66
5.4. Summary ..................................................................................................................... 68
Chapter 6 Phenomenological creep model of Dissimilar Metal Welds (DMWs) involving
ferritic Cr-Mo steels .................................................................................................................... 69
6.1. Introduction ................................................................................................................ 69
6.2. Experimental procedure .............................................................................................. 71
ix
6.3. Results and discussion ....................................................................................................... 72
6.3.1. Initial microstructure (before creep) distribution in aged DMWs .......................... 72
6.3.2. Initial microstructure (before creep) distribution in aged GTJs.............................. 80
6.3.3. Phenomenological creep model framework based on modified BMD equation… 83
6.3.4. Prediction of minimum creep strain rates using phenomenological BMD creep
model framework ................................................................................................................... 86
6.4. Summary ..................................................................................................................... 91
Chaper 7 Conclusions and future directions ......................................................................... 94
7.1. Creep studies on the aged Dissimilar Metal Welds (DMWs) and Graded Transition
Joints (GTJs)……….. ................................................................................................................... 94
7.2. Phenemenolgical BMD creep model to predict heterogenous creep strain rates in
these weld configurations ............................................................................................................. 96
7.3. Future directions ......................................................................................................... 98
7.3.1. Refinement of DIC methods of local creep strain measurement ............................ 98
7.3.2. Re-design of fabrication strategies of candidate GTJs ........................................... 98
7.3.3. Integrated model to simultaneously handle precipitation kinetics and carbon
diffusion kinetics in Dissimilar Metal Welds (DMWs)......................................................... 99
References .................................................................................................................................. 101
Appendix .................................................................................................................................... 112
Vita…. ........................................................................................................................................ 118

x
List of tables
Table 1.1: Chemical compositions of alloys used in Dissimilar Weld Configuration (DMW) ...... 3
Table 4.1: Chemical composition of materials used in high temperature applications (Single values
are maximum) ....................................................................................................................... 24
Table 4.2: Average carbide particle dimensions (Standard deviation in brackets) along the major
(Mc) and minor (mc) axes in both the aged conditions ......................................................... 31
Table 4.3: Details of creep studies used for creep strain rates comparison in Figure 4.15 ........... 50
Table 6.1: Results of carbide particle radius (r), and interparticle distance between carbides
particles (λ) analyses in the 2.25Cr-1Mo base materials of 2000h aged and 4000h aged DMWs
............................................................................................................................................... 74
Table 6.2: Results of carbide particle radius (r), and interparticle distance between carbide particles
(λ) analyses in the locations of creep strain concentration in 2000h aged (~5μm away from
BCC/FCC boundary) and 4000h aged (~400μm away from BCC/FCC boundary) DMW
samples .................................................................................................................................. 80
Table 6.3: Results of carbide particle radius (r), and interparticle distance between carbide particles
(λ) analyses in the 2.25Cr-1Mo base materials of 2000h aged GTJs (i) Inconel 82, (ii) P87,
and (iii) 347H ........................................................................................................................ 81
Table 6.4: Results of carbide particle radius (r), and interparticle distance between carbide particles
(λ) analyses in the bainitic regions at 3.5mm away from the weld interface (location of creep
strain concentration).............................................................................................................. 83
xi
List of figures
Figure 1.1: Schematic of steam generators used in power plant applications ................................ 2
Figure 2.1: Photograph showing typical low-ductility 2.25Cr-1Mo/ In-82 interface failure
observed in simulated creep tests at 590-625ºC, stress<80MPa [14] .................................... 7
Figure 2.2: Micrograph showing creep voids developed in association with interfacial carbides
after a life fraction of 79% observed in creep tests at 590-625ºC, stress< 80MPa [14] ......... 8
Figure 2.3: (a)Schematic illustration of different microstructural zones formed during a spot weld
of Inconel-82 on 2.25Cr-1Mo steel block, (b) distribution of major alloying elements in the
PMZ of a weld between 2.25Cr-1Mo steel and Inconel 182 electrode [18] ........................... 9
Figure 2.4: Schematic illustration of various sub-zones of the HAZ approximated for 0.15 wt% C
in Fe-Fe3C equilibrium diagram [23] .................................................................................... 10
Figure 2.5: Type I interfacial carbides that are formed along 2.25Cr-1Mo HAZ very close to fusion
line (a) after 2000h exposure at 625ºC and (b) after 6000h exposure at 625ºC [32] ............ 12
Figure 2.6: Variation in major and minor axis with aging time at 625ºC for Type I carbides t that
develop along the interface between 2.25Cr-1Mo steel and Inconel 82 [31] ....................... 13
Figure 2.7: Schematic illustration of general evolution of microstructures in a DMW between
2.25Cr-1Mo steel and an austenitic alloy in the as welded condition [15] ........................... 14
Figure 2.8: Schematic illustration of general evolution of microstructures in a DMW between
2.25Cr-1Mo steel and an austenitic alloy in aged/PWHT condition [15] ............................. 14
Figure 2.9: Schematic illustration of an example for GTJ fabricated between 2.25Cr-1Mo steel
and Inconel in 4 transition layers .......................................................................................... 16
Figure 3.1: Specific designed tasks for the research study ........................................................... 18

xii
Figure 3.2: Local capacitive resistance change based strain-measurement set-up used to measured
localized creep deformation along 2.25Cr-1Mo steel/ Inconel 82 weld interface [16] ........ 20
Figure 3.3: High temperature strain map showing strain concentration (A1) in the HAZ of Standard
heat treatment specimen after 90h of test [40] ...................................................................... 21
Figure 3.4: Comparison of localized strain measurement by DIC technique and overall strain
measured by extensometer during the creep test of Standard specimen after 90h of test [40]
............................................................................................................................................... 21
Figure 4.1: Schematic illustration showing different characterization studies in the aged DMW
specimens: (1), (2) Optical & SEM, (3) EDS, (4) TEM ....................................................... 26
Figure 4.2: 3D-DIC set-up in front of ATS 2330 (3:1 lever arm) creep test system .................... 27
Figure 4.3: Microstructures observed in the different regions of 2.25Cr-1Mo Heat Affected Zone
(HAZ) of 2000h aged DMW: (a) Bainite/tempered martensite in FGHAZ, (b) Tempered
martensite in CHGAZ ........................................................................................................... 29
Figure 4.4: SEM micrographs showing an array of Type I interfacial carbides close to the boundary
between ferritic (BCC)/austenitic (FCC) materials (Inconel 82- Left, 2.25Cr-1Mo- Right) in
(a):2000h aged DMW sample, (b) 4000h aged DMW sample. Carbide size distributions along
Major (M) and minor (m) axes of (c) 2000h aged DMW sample, (d) 4000h aged DMW sample
............................................................................................................................................... 30
Figure 4.5: Chemical concentration profiles of alloying elements: Fe, Cr, Ni, Mn, Mo, Nb across
ferrite (BCC) /austenite (FCC) boundary in (a) as-welded, (b) 2000h aged, and (iii) 4000h
aged conditions ..................................................................................................................... 32
xiii
Figure 4.6: Creep strain (eyy) evolution in different regions viz., 2.25Cr-1Mo HAZ (Red), 2.25Cr-
1Mo base material (Blue) and Nickel-base alloys (Pink) of 2000h aged DMW specimen.
Creep test condition: 625ºC, 50MPa, duration: 0-712h ........................................................ 34
Figure 4.7: Creep strain (eyy) evolution in different regions viz., 2.25Cr-1Mo HAZ (Red), 2.25Cr-
1Mo base material (Blue) and Nickel-base alloys (Pink) of 4000h aged DMW specimen.
Creep test condition: 625ºC, 50MPa, duration: 0-268h ........................................................ 34
Figure 4.8: Local creep strain rate (deyy/dt) as function of test time (hr) for the regions (i) 2.25Cr-
1Mo HAZ and (ii) 2.25Cr-1Mo base material in the creep test condition: 625ºC, 50MPa .. 35
Figure 4.9: (a) Creep strain (eyy) evolution along the gauge length of 2000h aged DMW specimen.
Creep test condition: 625ºC, 50MPa, 0-712h, (b) Creep strain (eyy) evolution along the gauge
length of 4000h aged DMW specimen. Creep test condition: 625ºC, 50MPa, 0-268h ........ 36
Figure 4.10: SEM micrographs close to the ferrite (BCC)/austenite (FCC) boundary (Inconel 82-
Right, 2.25Cr-1Mo- Left) showing the presence of creep cavities on 2.25Cr-1Mo side close
to the boundary in the crept 2000h aged DMW sample. Creep test condition: 625ºC, 50MPa,
After 712h ............................................................................................................................. 37
Figure 4.11: SEM micrographs showing the presence of creep cavities in HAZ (~400μm away
from ferrite (BCC) /austenite (FCC) boundary) in the crept 4000h aged DMW sample. Creep
test condition: 625ºC, 50MPa, after 712h ............................................................................. 38
Figure 4.12: EDS maps of elements b) Chromium, b) Molybdenum, and d) Silicon across ferrite
(BCC) (left)/austenite (FCC) (right) boundary of 2000h aged DMW sample before creep test
............................................................................................................................................... 42
Figure 4.13: High magnification TEM images of 2000h aged crept DMW sample (Creep test
condition: 625℃, 50MPa, 712h) showing (a) Cr-rich Type-I interfacial carbides along with
xiv
their (c) X-ray energy spectrum close to ferrite (BCC)/austenite (FCC) boundary, (b) Mo-rich
carbides along with their (d) X-ray energy spectrum at a distance of 5μm away from ferrite
(BCC)/austenite (FCC) boundary. (Interface between ferritic and austenitic alloys are
denoted by black arrows, ferritic (BCC) side on the left and austenitic (FCC) side on the right
in (a)) ..................................................................................................................................... 43
Figure 4.14: Thermocalc® predicted equilibrium volume perecentages of (i) Parent α-Fe solid
solution, (ii) M23C6 carbide and (iii) M6C carbide in 2.25Cr-1Mo base material (chemical
composition reported in Table I) with Carbon content varying from 0.02 to 0.28 weight
percent (0.15% C being nominal composition in 2.25Cr-1Mo steel) ................................... 45
Figure 4.15: EDS maps of elements a) Chromium, b) Molybdenum, and c) Silicon at the location
of creep strain concentration (~400μm away from BCC/FCC boundary) in 4000h aged DMW
sample before creep test ........................................................................................................ 46
Figure 4.16: (a) Plot showing volume fraction of carbides as a function of distance from
ferrite/austenite boundary in both 2000h and 4000h aged conditions, (b) SEM micrographs
and the respective processed images of region close to ferrite (BCC)/austenite (FCC)
boundary in 2000h and 4000h aged conditions, (c) SEM micrographs and the respective
processed images of region at distance 400μm away from ferrite (BCC)/austenite (FCC)
boundary in 2000h and 4000h aged conditions .................................................................... 48
Figure 4.17: Comparison of minimum creep strain rates (ε. ) across creep studies: (I) Parker and
Stratford [8], (II-V) Present study, and (VI-VII) Klueh [23] ................................................ 50
Figure 5.1: Schematic of the final as-fabricated part of Inconel 82 GTJ (adapted from Galler et. al
[58])....................................................................................................................................... 55

xv
Figure 5. 2: Microstructures observed in the different regions of 2.25Cr-1Mo Heat Affected Zone
(HAZ) of 2000h aged Inconel 82 GTJ: (a) Bainite in FGHAZ, (b) Tempered martensite in
CHGAZ (prior austenite grain sizes marked in red dotted lines) ......................................... 59
Figure 5.3: Creep strain (eyy) evolution in different regions viz., 2.25Cr-1Mo HAZ (Red), 2.25Cr-
1Mo base material (Blue), BCC region in transition (Green) and Dual + FCC regions of the
graded transition (Pink) of 2000h aged (a) Inconel 82 GTJ, (b) P87 GTJ specimens. Creep
test condition: 625ºC, 50MPa, duration: 0-700h................................................................... 61
Figure 5.4: Local creep strain rate (deyy/dt) as function of test time (hr) comparison of different
local regions viz., (i) 2.25Cr-1Mo base material, and (ii) location of creep strain concentration
inside 2.25Cr-1Mo HAZ for 2000h aged DMWs and GTJs (Inconel 82 and P87)
Creep test condition: 625ºC, 50MPa, duration: 0-700h ........................................................ 62
Figure 5.5: Creep strain (eyy) evolution along the gauge length of 2000h aged (a) Inconel 82 GTJ,
and (ii) P87 GTJ specimens. Creep test condition: 625ºC, 50MPa, 0-700h ......................... 63
Figure 5.6: Macro photographs of (a) Inconel 82 GTJ, (ii) P87 GTJ, and (iii) 347H GTJ crept
specimens depicting necking formation (marked by red arrows) taking place away from the
weld interface of 2.25Cr-1Mo and the 1st graded transition layer (marked by white arrows).
Creep test condition: 625ºC, 50MPa, after 1180h ................................................................ 64
Figure 5.7: SEM micrographs showing the presence of creep cavities in Fine grained HAZ
(~3.5mm away from the weld interface of 2.25Cr-1Mo material/ 1st layer of grade transition
in the crept 2000h aged (a) Inconel 82, (ii) P87, and (iii) 347H GTJ samples. Creep test
condition: 625ºC, 50MPa, after 1180h.................................................................................. 65
Figure 5.8: Comparison of EDS maps of alloying elements: Chromium and Molybdenum in 2000h
aged GTJs (a) Location of creep strain concentration (FGHAZ, 3.5mm away from the weld
xvi
interface, (c) parent 2.25Cr-1Mo material, and 2000h aged DMWs (b) Location of creep
strain concentration (~5μm away from BCC/FCC boundary) (before creep test) ................ 67
Figure 6.1: Summary of creep strain rate (deyy/dt) evolution as a function of time in the 2.25Cr-
1Mo base material and 2.25Cr-1Mo HAZ in (a) DMWs (2000h and 4000h aged) and (b) GTJs
(2000h aged) (Creep test condition: 625ºC, 50MPa) ............................................................ 70
Figure 6.2: SEM micrograph of mixed microstructure of ferritic (indicated as α) (ferrite boundaries
shown by dotted lines) and bainitic (indicated as αb) regions observed in 2.25Cr-1Mo parent
material of DMW aged at 600ºC for 2000h. Also shown on the left is the carbide distribution
inside ferritic (α) grain and on the right is the carbide distribution inside bainitic (αb) grain
............................................................................................................................................... 73
Figure 6.3: SEM micrograph of mixed microstructure of ferritic (indicated as α) (ferrite boundaries
shown by dotted lines) and bainitic (indicated as αb) regions observed in 2.25Cr-1Mo parent
material of DMW aged at 600ºC for 4000h. Also shown on the left is the carbide distribution
inside ferritic (α) grain and on the right is the carbide distribution inside bainitic (αb) grain
............................................................................................................................................... 74
Figure 6.4: Representative SEM micrograph revealing carbide distribution in the tempered
martensite microstructure (prior-austenite grain boundary indicated by dotted lines) in the
location of creep strain concentration (~5μm away from BCC/FCC boundary in 2.25Cr-1Mo
HAZ) in DMW aged at 600ºC for 2000h. ............................................................................. 78
Figure 6.5: Representative SEM micrograph showing carbide distribution in the bainitic
microstructure (prior-austenite grain boundary indicated by dotted lines) in the location of
creep strain concentration (~400μm away from BCC/FCC boundary in 2.25Cr-1Mo HAZ) in
DMW aged at 600ºC for 4000h. ........................................................................................... 79
xvii
Figure 6.6: SEM micrograph showing uniform bainite microstructure (prior-austenite grain
boundary indicated by dotted lines) in the 2.25Cr-1Mo parent material of GTJ- Inconel 82
aged at 600ºC for 2000h........................................................................................................ 81
Figure 6.7: SEM micrograph showing carbide distribution in the bainitic microstructure (prior-
austenite grain boundary indicated by dotted lines) in the location of creep strain
concentration (3.5mm away from the weld interface between 2.25Cr-1Mo material and the
1st graded transition layer) of GTJ- Inconel 82 aged at 600ºC for 2000h. ............................ 82
Figure 6.8: BMD dislocation climb based creep model framework to predict minimum creep strain
rates (εm. ) based on the carbide distribution characteristics (i) Particle radius (r), and (ii)
Interparticle distance (λ) in precipitate strengthened 2.25Cr-1Mo material ......................... 86
Figure 6.9: Results from theoretical calculation of minimum creep strain rates (ε. ) observed in (a)
2.25Cr-1Mo base material, and (ii) Location of creep strain concentration inside 2.25Cr-1Mo
HAZ using the observed Interparticle distance (λ) and Particle radius (r) parameters for
carbide distributions in these respective locations. Experimentally observed minimum creep
strain rates (ε. ) contours are also superimposed on the theoretically observed minimum creep
strain rate map ....................................................................................................................... 87
Figure 6.10: Results from theoretical calculation of minimum creep strain rates (ε. ) observed in
(is) 2.25Cr-1Mo base material, and (ii) Location of creep strain concentration inside 2.25Cr-
1Mo HAZ using the observed interparticle distance (λ) and Particle radius (r) parameters for
carbide distributions in these respective locations. Experimentally observed minimum creep
strain rates (ε. ) contours are also superimposed on the theoretically observed minimum creep
strain rate map ....................................................................................................................... 90
xviii
Figure i: Comparison of chemical potential of carbon (driving force for carbon diffusion) for a
number of candidate alloys at temperatures: 400ºC, 500ºC and 600ºC [54] ...................... 113
Figure ii: Variations in carbon chemical potential as a function of dilution for the three candidate
filler metals (a) Inconel 82, (b) P87, and (c) 347H [54] ..................................................... 114
Figure iii: Carbon concentration profiles for DMW as a function of transition distance (50μm) aged
at (a) 400ºC, (b) 500ºC, (c) 600ºC; Carbon concentration profiles for GTJ made with Inconel-
82 as a function of transition distance (10mm) aged at (d) 400ºC, (e) 500ºC, (f) 600ºC [54]
............................................................................................................................................. 115
Figure iv: Carbon loss results from kinetic simulations from DICTRA for conventional DMWs
and GTJs made with Inconel 82, P87 and 347H [54] ......................................................... 116
Figure v: EDS lines of alloying elements Fe, Cr, Ni, along with the hardness and martensite start
temperature variations for (a) DMW and GTJs made with (b) Inconel 82, (c) P87 and (d)
347H [58] ............................................................................................................................ 116
Figure vi: Heat treatment cycles for producing mixed microstructures of ferrite and bainite in
2.25Cr-1Mo steel ................................................................................................................ 117
1
Chapter 1
Introduction
Dissimilar Metal Welds (DMWs) have been widely used in many industry applications. The
adoption of DMW configurations provides flexible material design, with the efficient use of both
the material properties, with considerable economic savings. Two major fractions of DMW
configurations are as follows:
I. DMWs made between ferritic chrome-molybdenum steels and austenitic alloys used in the
steam generators of fossil and nuclear energy power plants [1,2],
II. DMWs made between ferritic low carbon steel pipes and austenitic Ni-alloy clad used in
the subsea oil and gas applications [3].
DMWs used in both these applications experience premature failure, much below the expected
design life of either of the base metal components. Failure occurs close to the weld fusion line of
the ferritic base material and the weld deposit in both these DMW configurations. However, it is
observed in the heat affected zone (HAZ) of ferritic base metal in (I) and the austenitic material in
transition in (II). In this research study, DMWs used in the power plant applications have been
considered for improvement in the design life of these bimetallic joints. However, it is being
anticipated that the research findings will serve as a tool to solve the DMW problems in subsea
applications of oil and gas industries as well.
DMWs made between ferritic Chrome-Molybdenum low alloy steel (BCC) and austenitic alloys
(FCC) have been widely used in the fossil and nuclear energy power plant components. The less
expensive low alloy steels are used in the low temperature components, while the high temperature
oxidation and corrosion resistant austenitic alloys in the high temperature components of a power
plant. Data from ex-service welds [1,4–6] have demonstrated that premature failure of these
2
DMWs occur well below the expected creep life of either of these base metals and the design life
of a power plant. These premature failures can cost a power company up to $850000/day loss in
revenue due to forced plant outages [7]. In addition, these premature failures are a subject of major
concern for life extension of existing power plants and the design of new high efficiency power
plants. Hence the primary focus of this research study is to overcome the premature creep failure
of DMWs used in power plant applications.
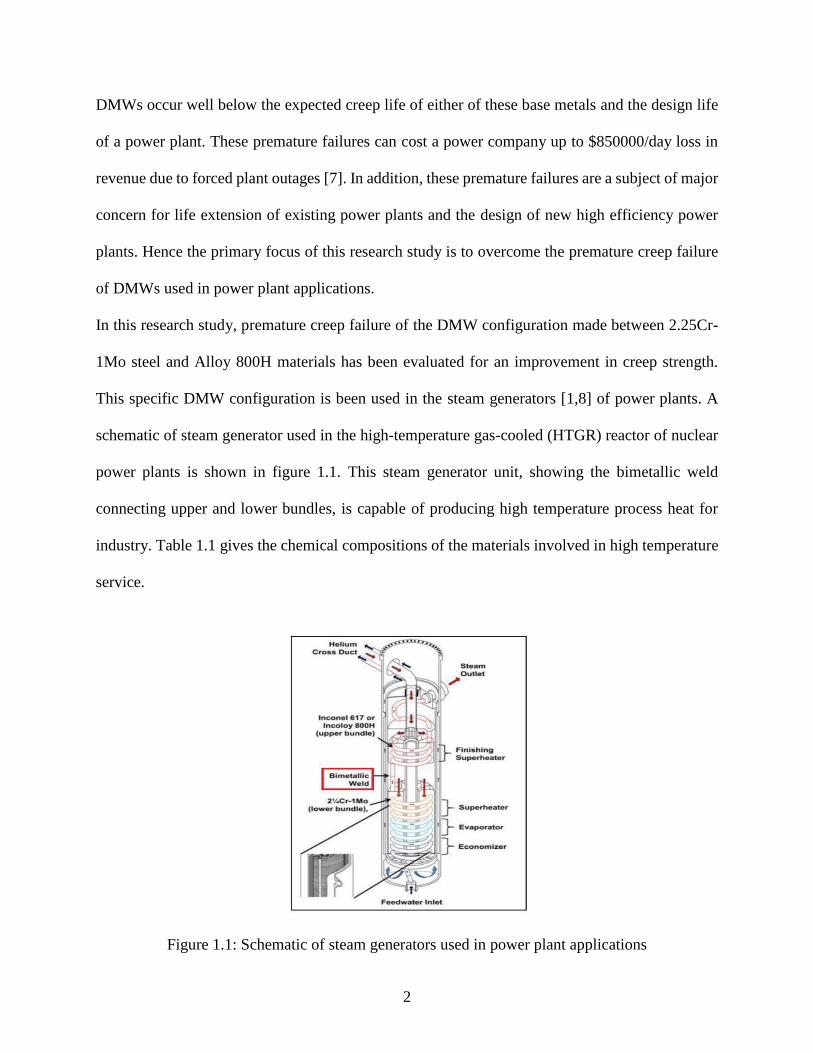
In this research study, premature creep failure of the DMW configuration made between 2.25Cr-
1Mo steel and Alloy 800H materials has been evaluated for an improvement in creep strength.
This specific DMW configuration is been used in the steam generators [1,8] of power plants. A
schematic of steam generator used in the high-temperature gas-cooled (HTGR) reactor of nuclear
power plants is shown in figure 1.1. This steam generator unit, showing the bimetallic weld
connecting upper and lower bundles, is capable of producing high temperature process heat for
industry. Table 1.1 gives the chemical compositions of the materials involved in high temperature
service.
Figure 1.1: Schematic of steam generators used in power plant applications
3
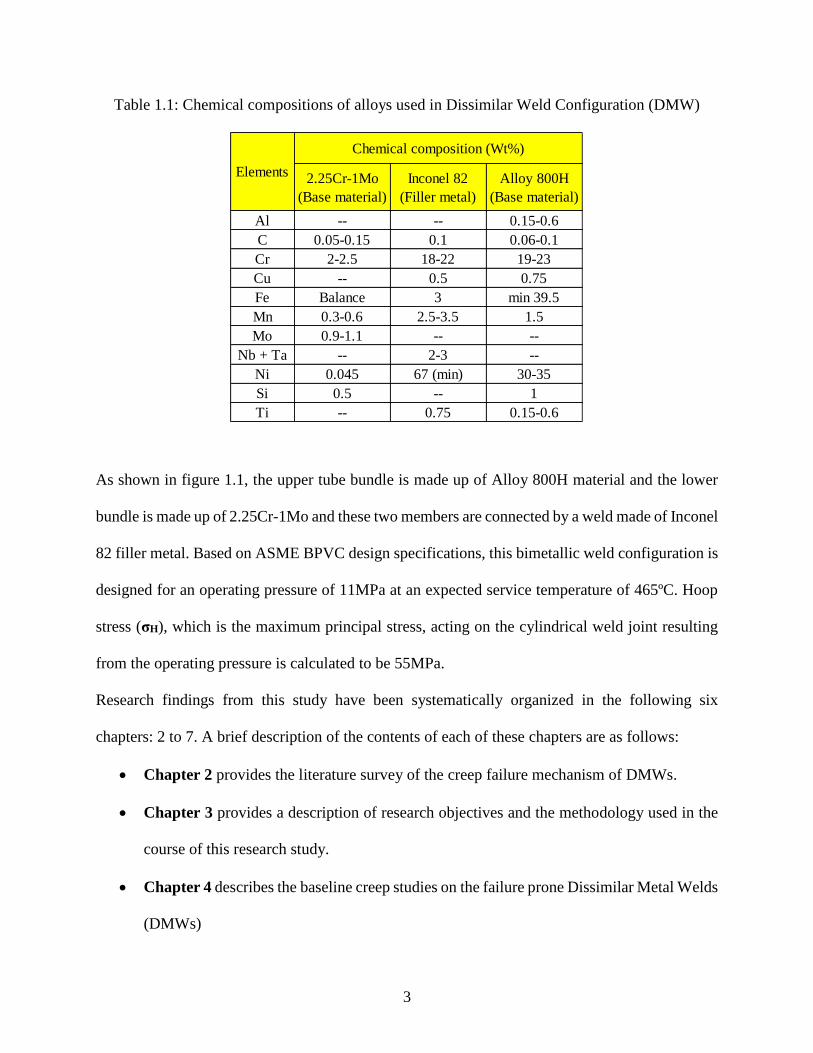
Table 1.1: Chemical compositions of alloys used in Dissimilar Weld Configuration (DMW)
As shown in figure 1.1, the upper tube bundle is made up of Alloy 800H material and the lower
bundle is made up of 2.25Cr-1Mo and these two members are connected by a weld made of Inconel
82 filler metal. Based on ASME BPVC design specifications, this bimetallic weld configuration is
designed for an operating pressure of 11MPa at an expected service temperature of 465ºC. Hoop
stress (σH), which is the maximum principal stress, acting on the cylindrical weld joint resulting
from the operating pressure is calculated to be 55MPa.
Research findings from this study have been systematically organized in the following six
chapters: 2 to 7. A brief description of the contents of each of these chapters are as follows:
Chapter 2 provides the literature survey of the creep failure mechanism of DMWs.
Chapter 3 provides a description of research objectives and the methodology used in the
course of this research study.
Chapter 4 describes the baseline creep studies on the failure prone Dissimilar Metal Welds
(DMWs)
2.25Cr-1Mo
(Base material)
Inconel 82
(Filler metal)
Alloy 800H
(Base material)
Al -- -- 0.15-0.6
C 0.05-0.15 0.1 0.06-0.1
Cr 2-2.5 18-22 19-23
Cu -- 0.5 0.75
Fe Balance 3 min 39.5
Mn 0.3-0.6 2.5-3.5 1.5
Mo 0.9-1.1 -- --
Nb + Ta -- 2-3 --
Ni 0.045 67 (min) 30-35
Si 0.5 -- 1
Ti -- 0.75 0.15-0.6
Chemical composition (Wt%)
Elements

4
Chapter 5 describes the comparative creep studies performed on the candidate Graded
Transition Joints (GTJs)
Chapter 6 describes a creep phenomenology-based model framework to predict the
heterogeneous minimum creep strain rates in the dissimilar weld configurations.
Chapter 7 enlists the conclusions drawn from this present research study, along with the
suggestions for future directions.
5
Chapter 2
Problem background
2.1. Base materials
2.25Cr-1Mo steel: 2.25Cr-1Mo is a class of creep resistant ferritic steels, developed around 1930s,
specifically for steam generators in power plants for operating temperatures and pressure more
than 450℃ and 5MPa respectively [9,10]. This category of steels is primarily strengthened by a
fine dispersion of secondary precipitates, especially carbides (MxCy) in the ferritic matrix. A few
researchers in the past have also identified interactive solid solution strengthening effect [11–13]
resulting from Mo-C clusters in the ferritic matrix. However, the effective contribution of solid
solution strengthening mechanism to the long-term creep strength of 2.25Cr-1Mo steel can be
regarded insignificant, since all Carbon available in the ferritic solid solution will be precipitated
as carbides during the initial stages of tempering treatments. These steels are designed for a creep
life of 200,000hr in the mentioned operating conditions during service of steam generators.
Alloy 800H: Alloy 800H, commercially known as Incoloy 800H, was invented by Special Metals
corporation Inc. This specific type of alloy was designed for high temperature strength and
resistance to oxidation, carburization, and other types of high-temperature corrosion [14]. It has
superior creep strength and designed for operation in the temperature range of 593-816℃. These
are austenitic Ni solid solution alloys primarily strengthened by precipitated such as Ti nitrides, Ti
carbides and Cr carbides.
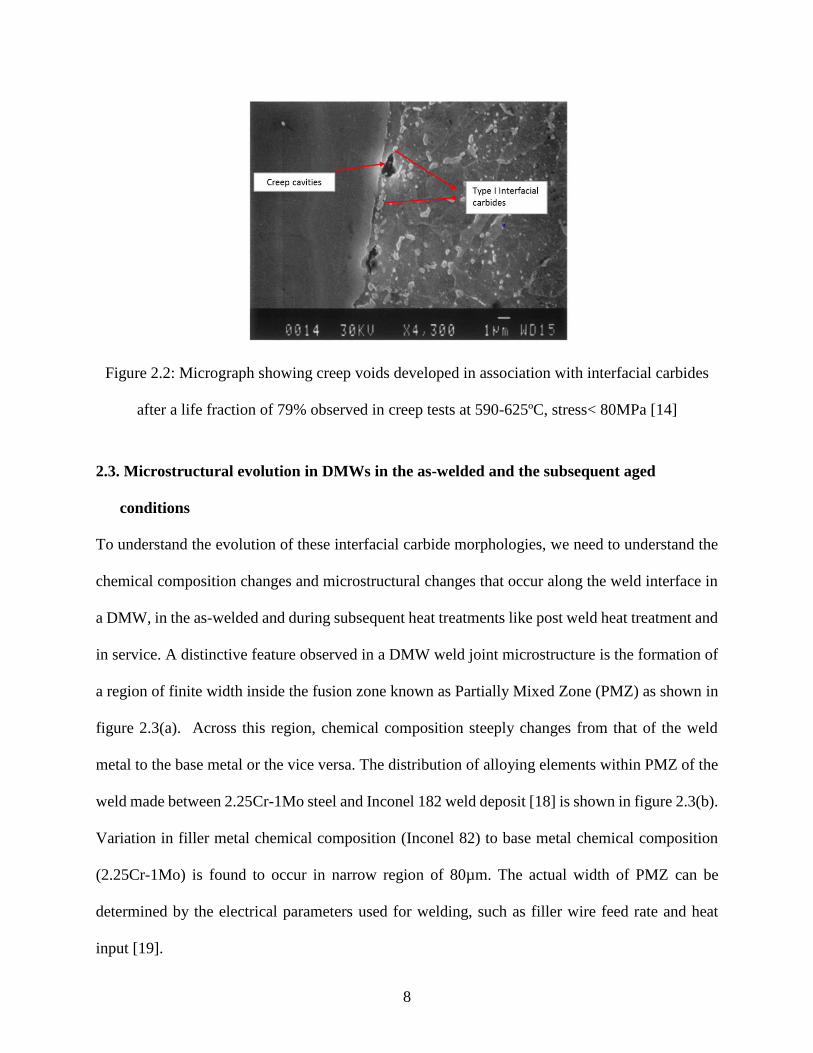
2.2. Dissimilar Metal Weld (DMW) failure mechanism
Review on the dissimilar metal weld (DMW) failures [15] between 2.25Cr-1Mo and Ni-base weld
metal have summarized the failure as low ductility intergranular creep fracture in 2.25Cr-1Mo
steel. The fracture occurs along the 2.25Cr-1Mo steel Heat Affected Zone (HAZ) close to the
6
interface (~5µm) of 2.25Cr-1Mo steel / Ni-base weld deposit. Fractured specimen typically
representing service failure is shown in figure 2.1. Simulated creep tests carried out by Parker et.
al [16,17] and Nicholson [4] have demonstrated that the fracture occurs as a result of nucleation,
growth and coalescence of creep cavities at a distance of 5µm close to the interface. Ferritic matrix-
precipitate interface of semi continuous array of type I carbides (M23C6 and M6C type) formed
close the interface as shown in figure 2.2 acts as the nucleation sites for these creep cavities.
Parker et. al [16,17], Nicholson et. al [4] and Laha et. al [18] have carried out accelearted creep
tests of welds made between 2.25Cr-1Mo steel and an austenitic alloy using Inconel 82 filler metal,
to understand the failure mechanism in this DMW configuration. These tests were performed
typically at temperatures and stresses higher than the actual service temperatures to accelarate low
ductility interfacial failure as seen in service. Laha et. al [18] performed creep tests in the stress
range of 90-250MPa at 550ºC, but the failures were not associated with the Type I interfacial
carbides, typical of service failure. It was identified that the stress levels used in these test
conditions were too high and the corresponding failure times were too low to induce the service
failure [15]. Nicholson et. al [4] performed creep tests at tempeartures: 570ºC and 640ºC and at
stresses: 62 MPa and 100MPa, but the total failure time was insufficient for the formation of Type
I interfacial carbides.
Later, Parker et. al [16,17] understood the importance in the selection of stresses and temperatures
to induce service type failures. They came up with a matrix of creep tests at temperatures 590-
625ºC and at reduced stresses 30-80MPa. Samples in the above mentioned test temperatures and
stresses were tested both in ‘New’ condition, which was only Post weld heat treated (PWHT)
(700ºC for 3 hours), and ‘Aged’ condition, which was given an aging heat treatment of 625 ºC for
3500h in addition to the Post Weld Heat treatment (PWHT). The purpose of this additional aging

7
treatment was to simulate Type I interfacial carbide morphologies, which were perceived to be
responsible for the nucleation of creep cavities. New samples exhibited low ductility interfacial
failure at all stresses 30-80MPa. However, the aged samples exhibited low ductility interfacial
fracture at stresses 50MPa and below and high ductilty fracture in 2.25Cr-1Mo base metal at
stresses above 50MPa. In all the new welds and aged welds testes at stresses 50 MPa and below,
failure occurred as a consequence of interlinkage of creep cavities formed along Type I interfacial
carbides. It was anticipated before test, aged samples with pre-existing array of carbides will
decrease the failure lives of the samples, but the failure life comparison between aged and new
samples at stresses 50 MPa and below showed no significant difference. It was hypothesized that
a critical amount of strain along the interface is needed to initiate creep cavities. This work has
also etablished that DMWs made between 2.25Cr-1Mo steel and an austenitic alloy with Inconel
82 filler metal can be tested at stresses at 50MPa and below to simulate the failure seen in service.
Figure 2.1: Photograph showing typical low-ductility 2.25Cr-1Mo/ In-82 interface failure
observed in simulated creep tests at 590-625ºC, stress<80MPa [14]
8
Figure 2.2: Micrograph showing creep voids developed in association with interfacial carbides
after a life fraction of 79% observed in creep tests at 590-625ºC, stress< 80MPa [14]
2.3. Microstructural evolution in DMWs in the as-welded and the subsequent aged
conditions
To understand the evolution of these interfacial carbide morphologies, we need to understand the
chemical composition changes and microstructural changes that occur along the weld interface in
a DMW, in the as-welded and during subsequent heat treatments like post weld heat treatment and
in service. A distinctive feature observed in a DMW weld joint microstructure is the formation of
a region of finite width inside the fusion zone known as Partially Mixed Zone (PMZ) as shown in
figure 2.3(a). Across this region, chemical composition steeply changes from that of the weld
metal to the base metal or the vice versa. The distribution of alloying elements within PMZ of the
weld made between 2.25Cr-1Mo steel and Inconel 182 weld deposit [18] is shown in figure 2.3(b).
Variation in filler metal chemical composition (Inconel 82) to base metal chemical composition
(2.25Cr-1Mo) is found to occur in narrow region of 80µm. The actual width of PMZ can be
determined by the electrical parameters used for welding, such as filler wire feed rate and heat
input [19].
9
Figure 2.3: (a) Schematic illustration of different microstructural zones formed during a spot
weld of Inconel-82 on 2.25Cr-1Mo steel block, (b) distribution of major alloying elements in the
PMZ of a weld between 2.25Cr-1Mo steel and Inconel 182 electrode [18]
In addition to the chemical composition changes, this narrow PMZ region will have regions of
finite widths corresponding to both FCC and BCC crystal structures (based on the concentrations
of ferrite and austenite stabilizers along the width of PMZ) in the as-welded condition. Knowing
the chemical composition variation as a function of PMZ width, Schaeffler diagram [20] can be
used to predict the widths of different phases that can form in a PMZ as a result of cooling rates
typical of arc welding. Based on Schaeffler diagram’s prediction, formation of FCC and BCC
phases have been shown in figure 2.3(b). It has been shown in various studies [21,22], that the
regions corresponding to BCC inside PMZ in the as-welded regions will have non-equilibrium as-
quenched martensitic microstructure. As-quenched martensite is formed in the as-welded
condition due to high mixing of alloying elements and cooling rates associated with PMZ.
Adjacent to the PMZ, inside the steel substrate, a zone of finite width, usually in a few millimeters,
gets affected by thermal cycles (peak temperatures less than melting temperature, TL) during
10
welding process. This zone of visibly different microstructure in the as-welded condition is termed
as Heat Affected Zone (HAZ). In the case of welding of steel, there are four different zones that
would exist inside the HAZ [23] viz., (i) Sub-critical HAZ (Peak temperature, TP <A1)
characterized relatively less distribution of carbides compared to the unaffected base metal ferritic
microstructure, (ii) Inter-critical HAZ (Peak temperature, A3<TP >A1) characterized relatively less
distribution of carbides compared to the unaffected base metal ferritic microstructure, (iii) Fine
Grained HAZ (Peak temperature, TP>A3) characterized by fine grained ferritic microstructure, (iv)
Coarse Grained HAZ (Peak temperature, TP>>>A3), characterized by coarse grained prior
austenitic grains with as-quenched martensite. Schematic diagram of various sub-zones of the
HAZ approximated corresponding to the 0.15 wt.% C on the Fe-Fe3C equilibrium diagram is
shown in figure 2.4.
Figure 2.4: Schematic illustration of various sub-zones of the HAZ approximated for 0.15 wt% C
in Fe-Fe3C equilibrium diagram [23]
11
During the subsequent Post-weld heat treatment (PWHT) and aging in service, concentration
gradients and microstructural gradients existing inside PMZ will result in the evolution of different
carbide sizes and morphologies. Evolution of different carbide sizes and morphologies in the PMZ
is mainly attributed to the diffusion of C down its chemical potential gradient at high temperatures.
Carbon migration has been shown to be the most important factor for failure in DMWs and has
received a lot of attention in the literature [24–29]. It needs to be noted that Chromium (Cr) lowers
the chemical potential of Carbon. Inside PMZ, the chemical potential of Carbon decreases as Cr
content increases from the undiluted ferritic side to the undiluted austenitic side. Existence of
Carbon chemical potential gradient in the as-welded condition will be the driving force for
diffusion of Carbon from the low Cr to high Cr regions. Furthermore, diffusion of Carbon from
ferritic to austenitic alloys in the transition will be controlled by the relative diffusivities and
solubilities of carbon in these respective matrices. Baker and Nutting [30] have shown M23C6 and
M6C carbides as the equilibrium carbides in the carbide evolution sequence, during the tempering
treatment of quenched 2.25Cr-1Mo steel.
Parker et. al [31,32] have done aging heat treatment studies at 625ºC till a time of 6000h to
understand the growth and morphology characteristics of Type I interfacial carbides. Sizes and
number densities of these carbides were studied every 500h of exposure till 6000h. Interfacial
carbides of 0.3µm diameter were formed after a minimal 300h of thermal exposure. These carbides
start to nucleate as spherical shape, but gradually acquire a lenticular morphology before
developing into regions of continuous or semi continuous network of carbides close to the
interface. Figure 2.5 shows the changes in carbides sizes and morphologies observed after 2000h
and 6000h exposure at 625ºC.

12
Figure 2.5: Type I interfacial carbides that are formed along 2.25Cr-1Mo HAZ very close to
fusion line (a) after 2000h exposure at 625ºC and (b) after 6000h exposure at 625ºC [32]
13
Growth rates of carbides along major and minor axes of interfacial carbides are shown in figure
2.6. The growth kinetics have been compared with that of the interfacial carbides observed during
creep tests at 625ºC at 30-80MPa [31]. Both the aged (without stress) and creep tested samples
seem indistinguishable. Based on these results, it was suggested that the stress didn’t seem to affect
the growth kinetics of these interfacial carbides.
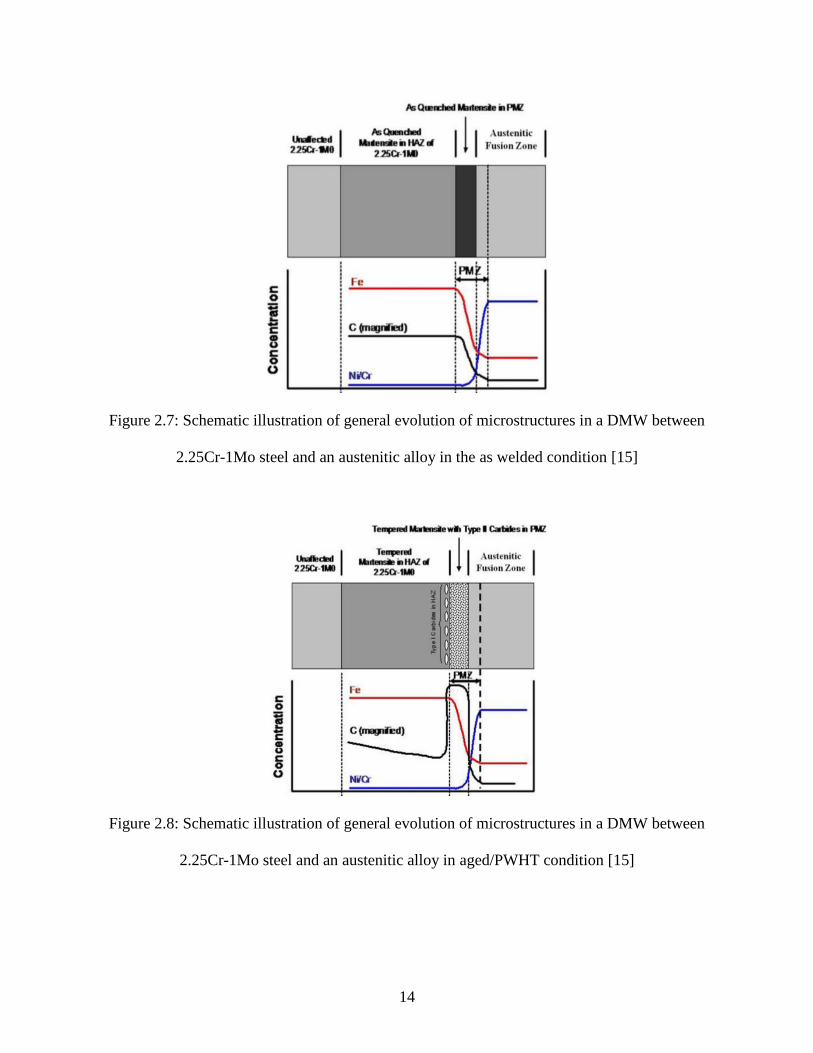
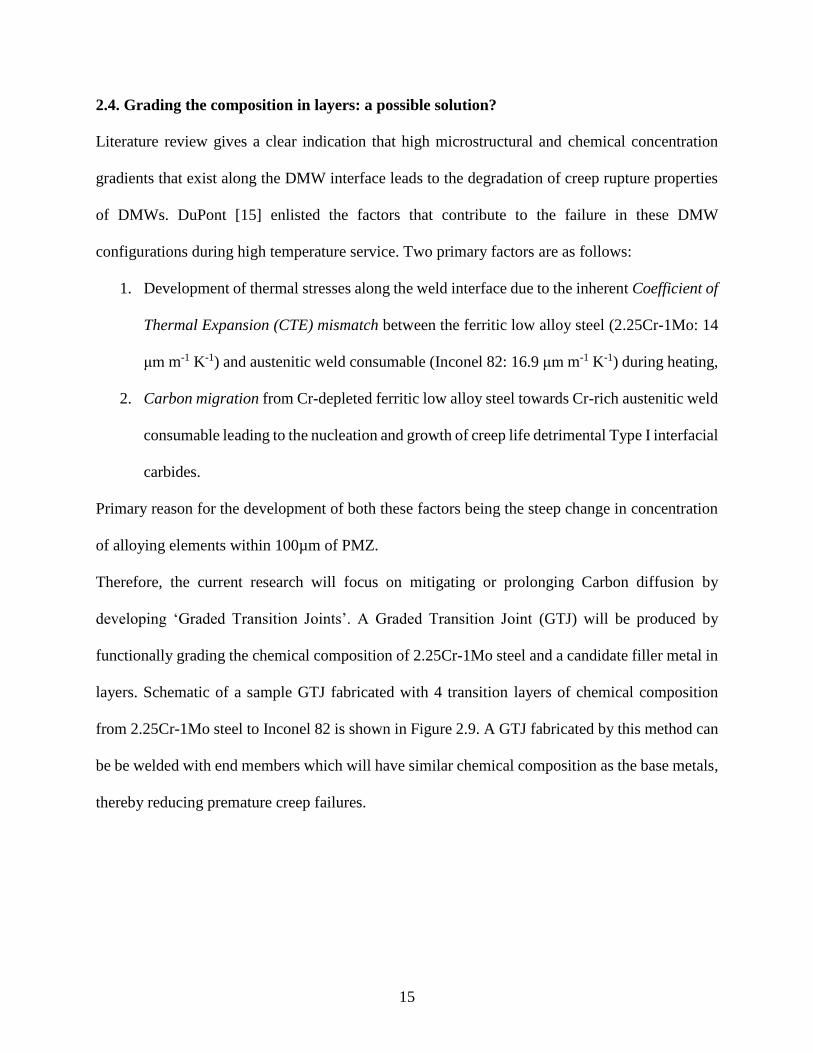
DuPont [15] summarized the microstructural and chemical concentration gradients in figures 2.7
and 2.8, that occur in a DMW made between 2.25Cr-1Mo steel and an austenitic alloy in the as-
welded condition and aged/PWHT condition.
Figure 2.6: Variation in major and minor axis with aging time at 625ºC for Type I carbides t that
develop along the interface between 2.25Cr-1Mo steel and Inconel 82 [31]
14
Figure 2.7: Schematic illustration of general evolution of microstructures in a DMW between
2.25Cr-1Mo steel and an austenitic alloy in the as welded condition [15]
Figure 2.8: Schematic illustration of general evolution of microstructures in a DMW between
2.25Cr-1Mo steel and an austenitic alloy in aged/PWHT condition [15]
15
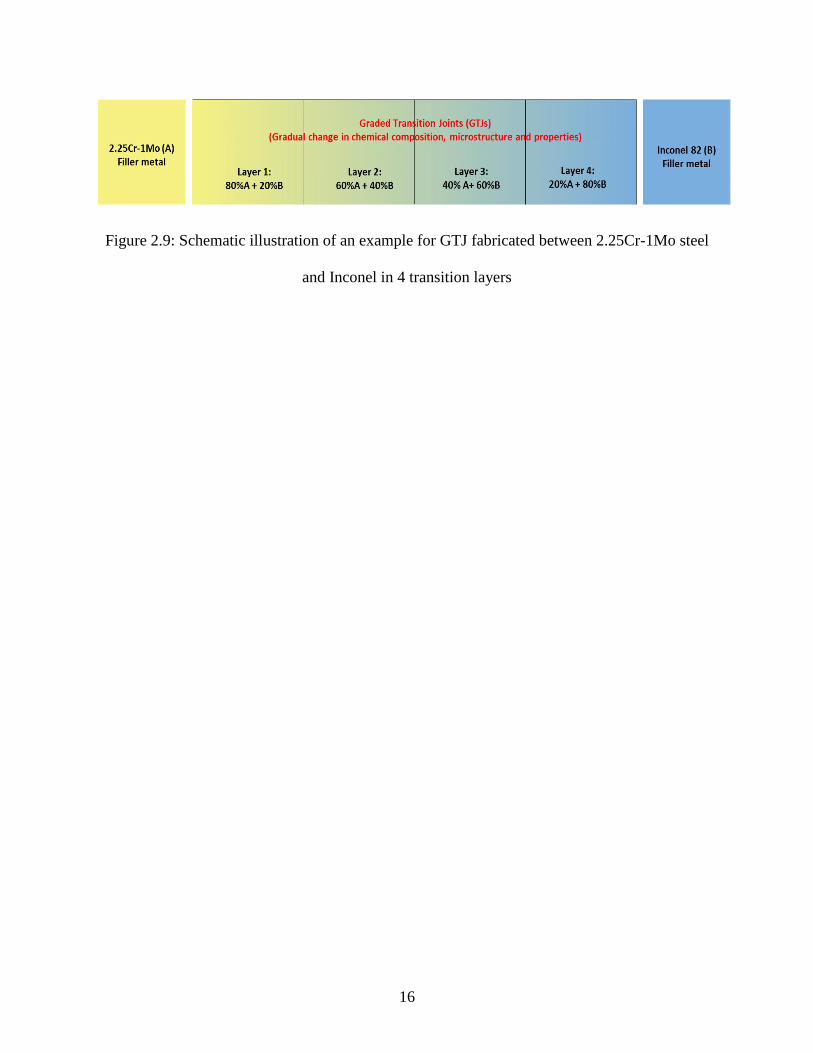
2.4. Grading the composition in layers: a possible solution?
Literature review gives a clear indication that high microstructural and chemical concentration
gradients that exist along the DMW interface leads to the degradation of creep rupture properties
of DMWs. DuPont [15] enlisted the factors that contribute to the failure in these DMW
configurations during high temperature service. Two primary factors are as follows:
1. Development of thermal stresses along the weld interface due to the inherent Coefficient of
Thermal Expansion (CTE) mismatch between the ferritic low alloy steel (2.25Cr-1Mo: 14
μm m-1 K-1) and austenitic weld consumable (Inconel 82: 16.9 μm m-1 K-1) during heating,
2. Carbon migration from Cr-depleted ferritic low alloy steel towards Cr-rich austenitic weld
consumable leading to the nucleation and growth of creep life detrimental Type I interfacial
carbides.
Primary reason for the development of both these factors being the steep change in concentration
of alloying elements within 100µm of PMZ.
Therefore, the current research will focus on mitigating or prolonging Carbon diffusion by
developing ‘Graded Transition Joints’. A Graded Transition Joint (GTJ) will be produced by
functionally grading the chemical composition of 2.25Cr-1Mo steel and a candidate filler metal in
layers. Schematic of a sample GTJ fabricated with 4 transition layers of chemical composition
from 2.25Cr-1Mo steel to Inconel 82 is shown in Figure 2.9. A GTJ fabricated by this method can
be be welded with end members which will have similar chemical composition as the base metals,
thereby reducing premature creep failures.
16
Figure 2.9: Schematic illustration of an example for GTJ fabricated between 2.25Cr-1Mo steel
and Inconel in 4 transition layers
17
Chapter 3
Research objectives and methodology
3.1. Objectives
In a broader perspective, overarching aim of this research is to establish a test methodology to
extract local creep constitutive properties of a heterogeneous weld configuration and correlate
these properties with the underlying microstructure. The following research questions need to be
answered, which would add valuable inputs to the existing literature on the premature failure of
dissimilar metal welds (DMWs):
1) How Carbon migration in DMWs during high temperature exposure, results in poor creep
resistance properties in the ferritic steel HAZ?
2) Can Graded Transition Joints (GTJs) extend the creep life of the bimetallic joint involving
ferritic steels and austenitic alloy?
3) Can a creep constitutive model be developed for dissimilar metal welds to predict the
heterogenous creep behavior of these joints?
Research work was divided in four specific tasks as mentioned below in figure 3.1. In the task 1,
a baseline creep test methodology to measure local creep constitutive properties of heterogenous
weld configurations will be pursued. In the task 2, will be a study of local creep deformation
behavior of baseline Dissimilar Metal Welds (DMWs). In this task, fundamental mechanism
behind Carbon migration leading to premature creep failure will be discussed. In the task 3,
candidate GTJs, which have been designed and fabricated by Lehigh university as the potential
candidate to extend creep life of DMWs, will be creep tested using the methodology developed in
task 2. Primary objective of this task to evaluate the suitability of GTJs to replace failure prone
conventional DMWs in high temperature service. In the task-4, a phenomenological creep
18
Figure 3.1: Specific designed tasks for the research study
constitutive model to predict the steady state creep behavior of heterogenous microstructure in
these weld configurations (DMWs and GTJs) will be discussed.
3.2.Test methodology
Goal of this research is to establish a methodology to measure local interfacial creep strain
concentration in a short duration of time, say ~1 month, in the DMWs made between 2.25Cr-1Mo
steel and an austenitic alloy using Ni-base weld consumable. This involves two important
considerations: (i) Selection of accelerated creep test condition that can induce interfacial fracture
similar to the one seen in service, and (ii) Selection of an appropriate creep strain measurement
technique.
Creep studies by Parker and Stratford [16] established that DMWs between 2.25Cr-1Mo steel and
an austenitic alloy welded with Inconel 82 can be tested at stresses of 50MPa and below to simulate
the service failure. Hence, the creep test condition: 625ºC, 50MPa has been selected for this work.
19
Moreover, to induce the formation of creep detrimental Type I interfacial carbides before the start
of any creep test, DMW samples were aging heat treated at 600ºC for 2000h and 600ºC for 4000h
to induce the presence of Type I interfacial carbides with varying sizes and distribution.
Creep tests done by Parker and Stratford [16] were coupled with capacitive resistance change based
strain sensors (see figure 3.2) to measure localized strain in 2.25Cr-1Mo steel HAZ, which resulted
in low ductily fracture close to the weld interface. However the technique used was not capable of
measuring localized deformation occuring in less than a millimeter where Type I interfacial
carbides nucleate and grow along the interface. In addition, it didn’t possess the capabilty to
measure local strain measurements from multiple local regions in the hetergeneous transition. It is
imperative that the technique used to measure localized deformation in a DMW joint during a
uniaxial creep test, should have a better spatial resolution less than 1mm and should be able to
measure the localized deformation throughout the entire gauge length with such a spatial
resolution. Hence, in this research work, Digital Image Correlation (DIC), an in-situ, and non-
contact surface deformation measurement technique has been used to measure localized non-
uniform creep deformation.
Over the last two decades, DIC technique has been employed to measure full field strains in a
deforming object [33]. In various applications, DIC has been successfully used to measure
residual stress distribution in components [34–37] and study high temperature tensile behavior of
materials [38,39]. Yu. et. al [40] have shown the effectiveness of DIC technique in determining
the localized creep deformation in the Heat affected zone (HAZ) of creep resistant Gr 91 steels in
an inert atmosphere. In that work, two grades of Grade 91 steel welds that had undergone two
different tempering heat treatments at 760ºC (standard) and 650ºC (non-standard), were creep
tested at 650ºC with a stress of 70MPa to study the creep strain distribution.
20
Figure 3.2: Local capacitive resistance change based strain-measurement set-up used to
measured localized creep deformation along 2.25Cr-1Mo steel/ Inconel 82 weld interface [16]
Figure 3.3 illustrates the effectiveness of DIC technique in determining the local creep strain
concentration in the HAZ of Grade 91 steel sample which had undergone a standard tempering
heat treatment at 760ºC. Figure 3.4 clearly indicates the standard extensometer measurements
made during a standard creep test will not be able to detect the localized high deformation
occurring in the specific regions of a heterogeneous test sample. In an extension to this
technology, work presented in this paper would describe the usage of DIC technique in measuring
localized creep deformation in DMWs in the open-air atmosphere, as used in conventional
laboratory creep tests.
21
Figure 3.3: High temperature strain map showing strain concentration (A1) in the HAZ of
Standard heat treatment specimen after 90h of test [40]
Figure 3.4: Comparison of localized strain measurement by DIC technique and overall strain
measured by extensometer during the creep test of Standard specimen after 90h of test [40]
22
Chapter 4
Study of heterogeneous creep deformation in conventional Dissimilar Metal Welds
(DMWs)
4.1. Introduction
Earlier creep failure studies on DMWs [4,17,41] have described the premature failure as low
ductility intergranular creep fracture in ferritic matrix at the Heat Affected Zone (HAZ) close to
the fusion line of Nickel-base weld deposit. DuPont [15] summarized all the DMW research
studies and attributed the premature failure to two major factors. The first factor is the formation
of a continuous network of carbides, termed as Type I interfacial carbides, along ferritic steel Heat
Affected Zone (HAZ), at about 5-10μm close to the weld fusion line. This microstructure evolution
is controlled by Carbon migration from ferritic region towards the weld interface. At the same
time, creep cavities are nucleated at the interface of carbide-ferritic matrix interface [4,17]. Even
though a positive correlation between network of carbides and premature creep life has been
confirmed, the primary reason for the nucleation of these voids at carbide/ferritic matrix interfaces
is not completely understood. The second factor for failure is associated with mismatch of
coefficient of thermal expansion (CTE) between ferritic steel and austenitic Nickel-base weld
region. On heating to service temperature, these differences lead to thermal stresses and further
strain localization close to weld fusion line. The relative contribution of these two factors towards
creep failure has not been discussed before due to lack spatial measurements of creep rates. These
limitations motivated us to develop strain measurement methodology that can measure localized
creep strain in these DMWs.
Parker and Stratford [16] used local strain sensors planted across the weld interface of ferritic
2.25Cr-1Mo steel and austenitic Inconel-82 weld deposit. This arrangement was intended to
23
measure local creep strain along a length of 6-8mm across the weld interface in these DMWs.
Although these measurements captured strain concentrations along the length of 6-8mm, the length
of these strain gauges included almost equal lengths of both 2.25Cr-1Mo steel and Inconel 82 weld
deposit materials. As a result, the spatial resolution of the strain measurement was insufficient to
characterize discrete local creep strain behavior in microstructurally distinct regions of the DMW.
In this regard, Digital Image Correlation (DIC), an in-situ and non-contact surface deformation
measurement technique, has the ability to measure discrete local strains in heterogeneous materials
with spatial resolution less than a millimeter. One of the early pioneering studies to measure local
creep strain using DIC was performed by Yu. et. al [40] for Gr-91welds with the same chemical
composition, but with microstructural heterogeneity. The above experiment was conducted using
a Gleeble® thermo-mechanical simulator which relies on the joule heating mechanism. However,
this methodology cannot be extended to DMWs due to large variations in the electrical resistance
of BCC (Fe-base), FCC (Ni-base) and FCC (Fe-base) materials. Therefore, extended the DIC
testing technique to measure local creep constitutive properties of DMWs, made between ferritic
Cr-Mo steels and austenitic alloys, within a conventional creep tester in open air atmosphere,
which is closer to the real-life operating conditions. Characterization studies have been carried out
to rationalize the observed local creep properties in these DMWs with underlying microstructure
evolution.
4.2. Experimental procedure
4.2.1. Sample fabrication
The DMW Configuration consists of a weld made between 2.25Cr-1Mo steel and Alloy 800H
material using Inconel weld consumable. The DMW coupon was fabricated with ¾” (25.4mm)
thick base metal plates of 2.25Cr-1Mo steel and Alloy 800H materials using Nickel-base weld
24
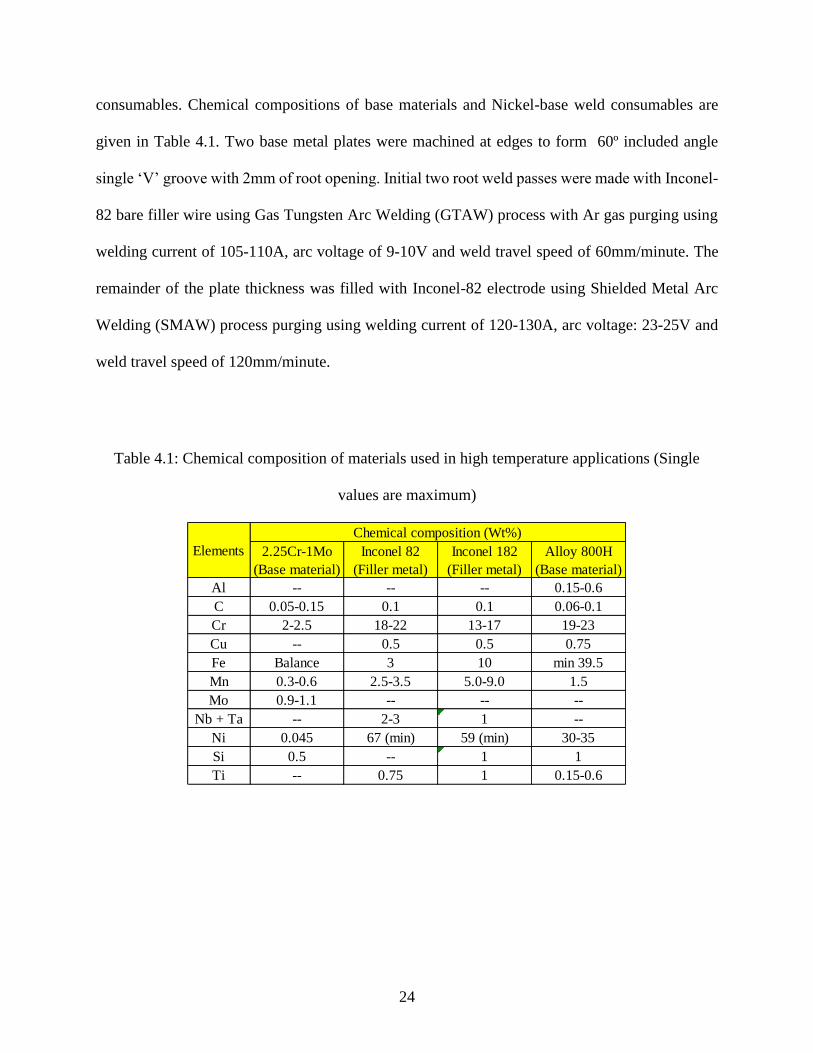
consumables. Chemical compositions of base materials and Nickel-base weld consumables are
given in Table 4.1. Two base metal plates were machined at edges to form 60º included angle
single ‘V’ groove with 2mm of root opening. Initial two root weld passes were made with Inconel-
82 bare filler wire using Gas Tungsten Arc Welding (GTAW) process with Ar gas purging using
welding current of 105-110A, arc voltage of 9-10V and weld travel speed of 60mm/minute. The
remainder of the plate thickness was filled with Inconel-82 electrode using Shielded Metal Arc
Welding (SMAW) process purging using welding current of 120-130A, arc voltage: 23-25V and
weld travel speed of 120mm/minute.
Table 4.1: Chemical composition of materials used in high temperature applications (Single
values are maximum)
2.25Cr-1Mo
(Base material)
Inconel 82
(Filler metal)
Inconel 182
(Filler metal)
Alloy 800H
(Base material)
Al -- -- -- 0.15-0.6
C 0.05-0.15 0.1 0.1 0.06-0.1
Cr 2-2.5 18-22 13-17 19-23
Cu -- 0.5 0.5 0.75
Fe Balance 3 10 min 39.5
Mn 0.3-0.6 2.5-3.5 5.0-9.0 1.5
Mo 0.9-1.1 -- -- --
Nb + Ta -- 2-3 1 --
Ni 0.045 67 (min) 59 (min) 30-35
Si 0.5 -- 1 1
Ti -- 0.75 1 0.15-0.6
Elements
Chemical composition (Wt%)

25
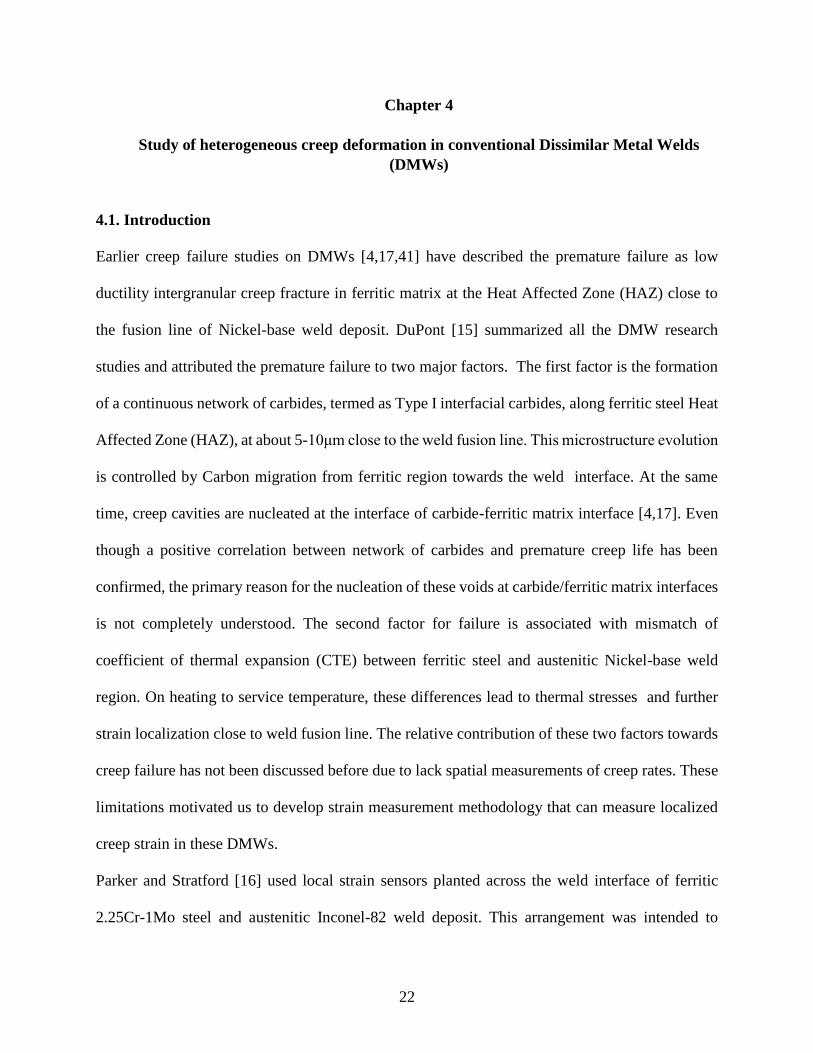
4.2.2. Microstructural characterization
Detailed multilength scale characterization spanned specific regions from 2.25Cr-1Mo HAZ and
the transition region between 2.25Cr-1Mo, and Inconel 82 weld region (see figure 4.1), using light
optical microscopy (OM), scanning electron microscopy (SEM), X-ray energy dispersive
spectroscopy (EDS) and selected samples with transmission electron microscopy (TEM). Samples
for OM and SEM were prepared by grinding through 1200-grit SiC grit papers, followed by
diamond polishing in 3μm and 1μm suspensions. The final polish was obtained through vibratory-
polishing with 0.05μm colloidal silica suspension for 3 hours. For carbide characterization in the
2.25Cr-1Mo regions, the polished DMW samples were immersion etched in freshly prepared 2%
Nital solution for about a minute. A Leica DM2500 metallograph was used for performing OM
analyses. Scanning electron miscrsocopy (SEM) analyses were performed using JEOL 6500 SEM
equipped with both secondary electron (SE) and backscattered electron (BSE) detectors, with
accelerated beam voltages in the range of 15-20kV was used. Detailed characterizations of carbide
size-distribution in (i) specific regions of 2.25Cr-1Mo HAZ, and (ii) Type I interfacial carbides
close to the BCC/FCC boundary, as referenced as (1) and (2) in figure 4.1, were performed in
SEM and image analysis. The microstructural images were acquired at uniform intervals (400-
2000µm) and magnifications (2000-6000X) for one-to-one comparison of carbide size-
distributions in samples of different aged conditions. The greyscale images were imported to
ImageJ® software and particle analysis was performed after binary thresholding to delineate
carbide particles from 2.25Cr-1Mo ferritic matrix background. The EDS analyses was performed
in a Versa 3D scanning electron microscope (SEM) built with Oxford® X-ray EDS detectors. X-
ray Energy Dispersive Spectroscopy (EDS) area maps and line profiles were obtained at a beam
accelerated voltage of 20kV with a step size of 0.06μm. The EDS compositional analyses were
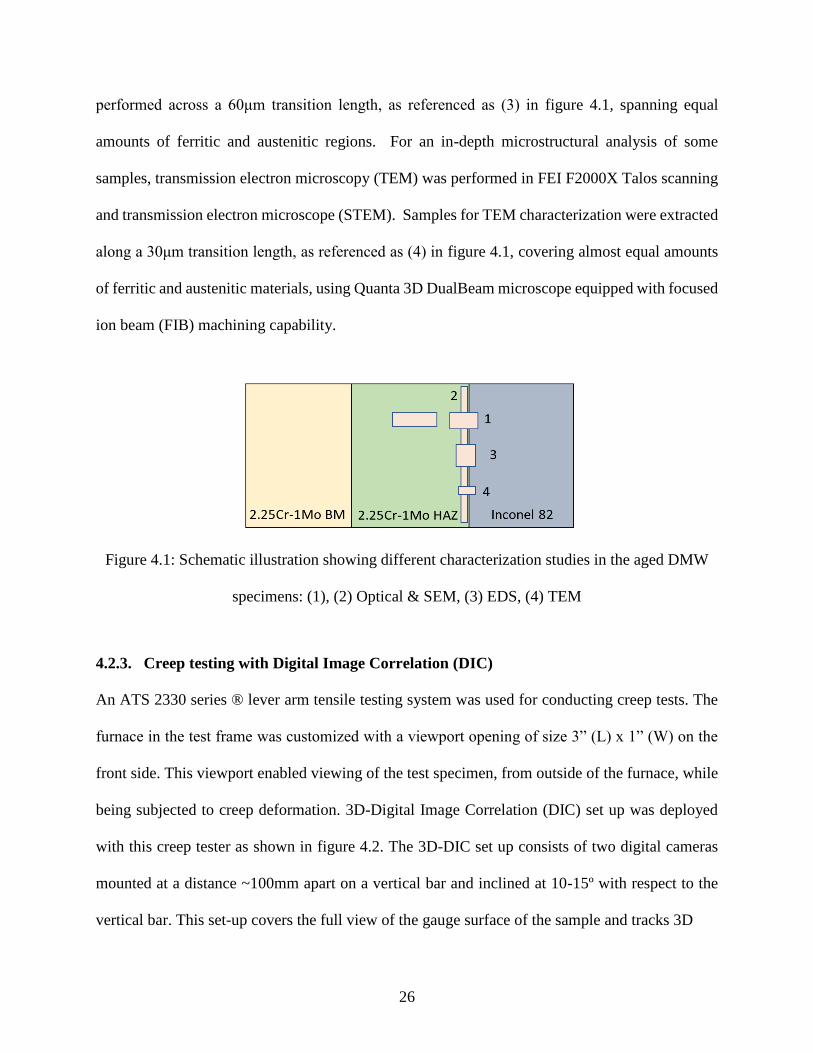
26
performed across a 60μm transition length, as referenced as (3) in figure 4.1, spanning equal
amounts of ferritic and austenitic regions. For an in-depth microstructural analysis of some
samples, transmission electron microscopy (TEM) was performed in FEI F2000X Talos scanning
and transmission electron microscope (STEM). Samples for TEM characterization were extracted
along a 30μm transition length, as referenced as (4) in figure 4.1, covering almost equal amounts
of ferritic and austenitic materials, using Quanta 3D DualBeam microscope equipped with focused
ion beam (FIB) machining capability.
Figure 4.1: Schematic illustration showing different characterization studies in the aged DMW
specimens: (1), (2) Optical & SEM, (3) EDS, (4) TEM
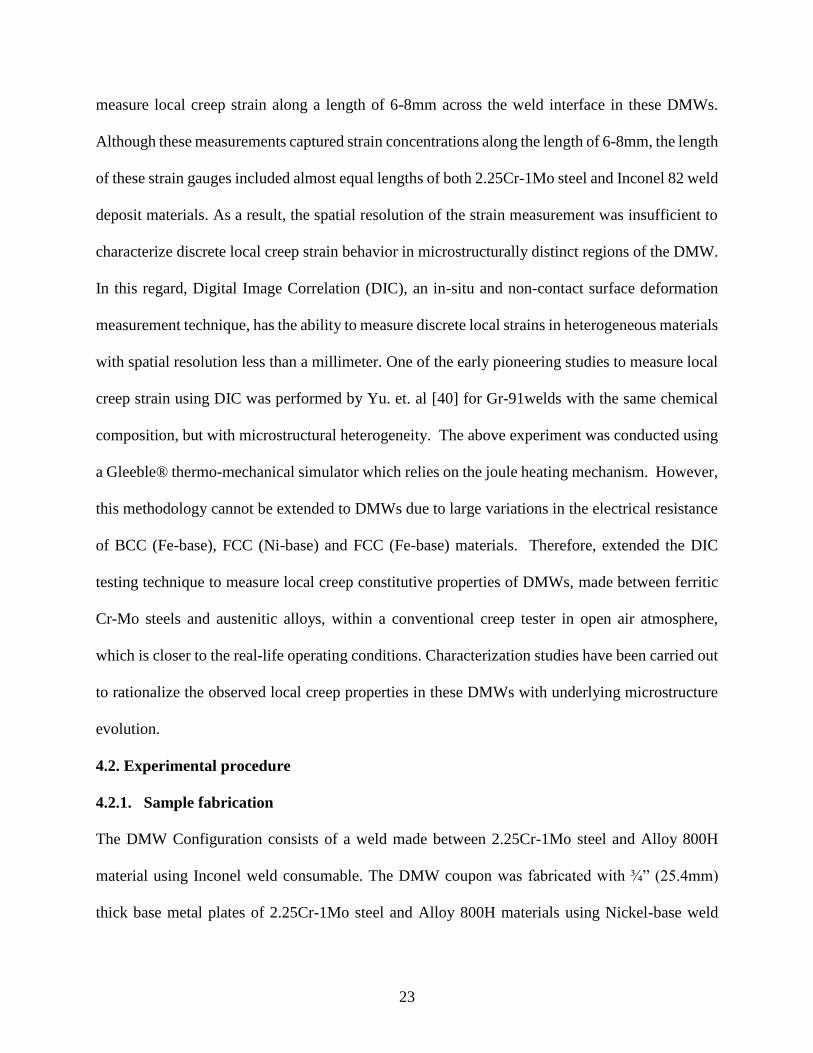
4.2.3. Creep testing with Digital Image Correlation (DIC)
An ATS 2330 series ® lever arm tensile testing system was used for conducting creep tests. The
furnace in the test frame was customized with a viewport opening of size 3” (L) x 1” (W) on the
front side. This viewport enabled viewing of the test specimen, from outside of the furnace, while
being subjected to creep deformation. 3D-Digital Image Correlation (DIC) set up was deployed
with this creep tester as shown in figure 4.2. The 3D-DIC set up consists of two digital cameras
mounted at a distance ~100mm apart on a vertical bar and inclined at 10-15º with respect to the
vertical bar. This set-up covers the full view of the gauge surface of the sample and tracks 3D

27
Figure 4.2: 3D-DIC set-up in front of ATS 2330 (3:1 lever arm) creep test system
displacements of every point on the gauge surface. Digital cameras (Point grey® cameras: 2.4MP)
with Schneider lenses with a fixed focal length of 28mm were linked to a computer with VIC-
snap® image acquisition software for the programmed capturing of images. An external LED
lamp, clamped in between the cameras, was used for illuminating the specimen gauge surface.
The total gauge length for measuring local strain using DIC covered a length of 47mm with 14-
14.2mm of 2.25Cr-1Mo material and the remainder of Inconel-82 and Alloy-800H materials. The
gauge surfaces of these test specimens were sandblasted for good adherence to the DIC speckle
pattern paints. Random speckle patterns were created by an innovative 3-layer speckle pattern
procedure [42] with randomly distributed black speckles on a white background. Three
thermocouples were attached to the back surface of the specimen, one on each region of the test
specimen, i.e., 2.25Cr-1Mo steel, middle of the Inconel-82 weld and Alloy 800H to monitor

28
temperature gradients within +/- 1℃ during creep tests. Speckle patterned test specimens were
heated inside the furnace to the test temperature of 625ºC at a heating rate of 150ºC/hr. After 1
hour of soak time at 625℃, 50MPa stress was applied. At the onset of stress application, the VIC-
Snap® software was programmed to capture images of the speckled gauge surface at every 5.25-
minute interval throughout the entire duration of test. While the VIC-Snap® software was
periodically collecting images of speckled sample surface during creep deformation, collected
images were parallelly imported to VIC-3D® software to determine creep strain (eyy) distribution
in the gauge surface along the loading direction. DIC image capturing was stopped after 268h and
712h in 4000h aged and 2000h aged DMW creep tests respectively, once the locally developed
regions of strain concentration reached tertiary stage of creep in the respective test specimens.
However, both the test specimens were unloaded after 712h of creep test, to make an even
comparison of the extension of creep damage in both the crept samples.
4.3. Results
4.3.1. Pre-test microstructural characterization of aged DMW samples
Microstructural heterogenity: Since majority of DMW creep failures have been associated with
ferritic steel HAZ [4,16] microstructural characterization was focussed on the 2.25Cr-1Mo HAZ
regions. Salient results are as following. (i) width of the 2.25Cr-1Mo HAZ in the 2000h aged
sample was 1.6 to 1.8mm. (ii) the region adjacent to the boundary between ferritic (BCC)
/austenitic (FCC) materials consisted of tempered martensitic microstructure, typical to that of
coarse grained (prior-austenite grain size of ~25μm) HAZ (CGHAZ) microstructure, as shown in
figure 4.3. This CGHAZ region ranged from 270-300μm of the total HAZ width. (iii) Right next
to the CGHAZ, mixture of bainite and tempered martensite typical to that of fine grained (grain
size of ~5μm) grain HAZ (FGHAZ) was observed (see figure 4.3). This FGHAZ region spanned

29
Figure 4.3: Microstructures observed in the different regions of 2.25Cr-1Mo Heat Affected Zone
(HAZ) of 2000h aged DMW: (a) Bainite/tempered martensite in FGHAZ, (b) Tempered
martensite in CHGAZ
the remainder of the width of the HAZ. Since these DMW samples were aged for relatively long
periods of time, the Inter Critical HAZ (ICHAZ) could not be delineated. The width of the HAZ
and the microstructural gradients in the 4000h aged sample were similar to that of the 2000h aged
sample.
Carbide size distributions: The carbide particle analysis confirmed that the majority of Type I
interfacial carbide paricles were in the lenticlular shape, with the Major axis (M) lying parallel to
the BCC/FCC boundary (perpendicular to the stress direction) and minor axis lying perpendicular
to the BCC/FCC boundary (parallel to the stress direction). This observation is indeed in agreement
with published work by Parker and Startford [31]. Typical distribution of Type I interfacial
carbides in the 2000h and 4000h aged DMW samples are shown in figures 4.4a and 4.4b
respectively. Particle size distribution in both the 2000h anad 4000h aged conditions comfirmed
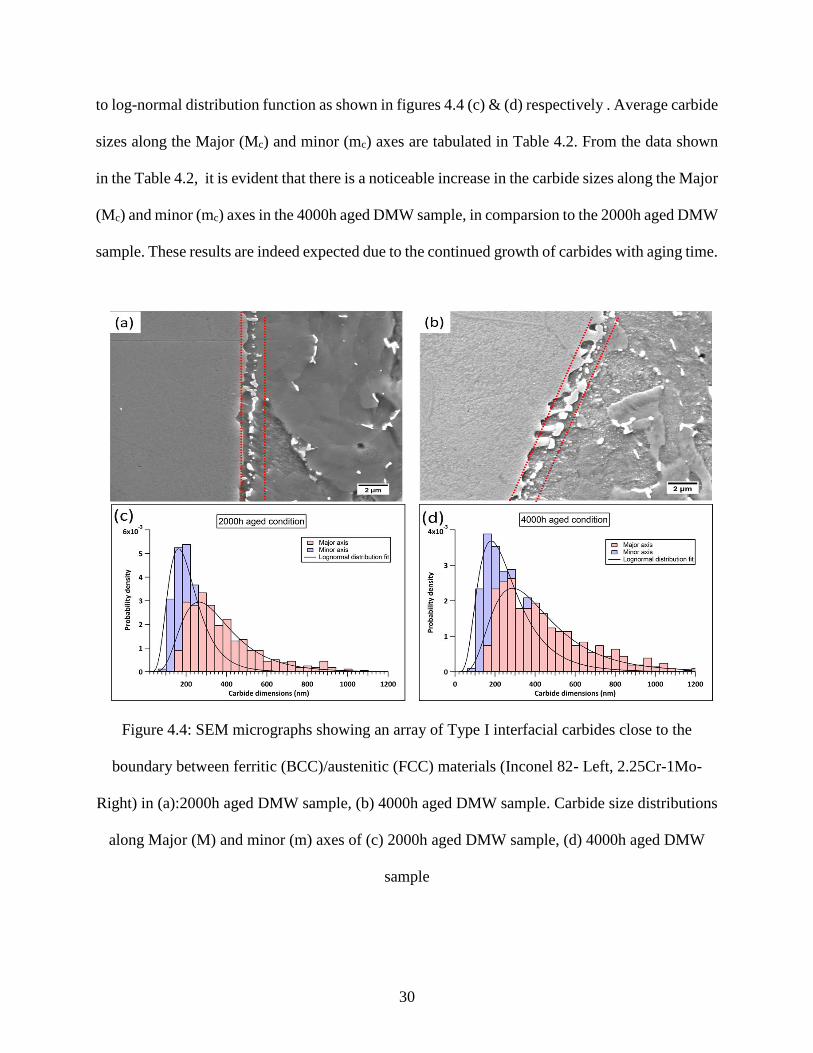
30
to log-normal distribution function as shown in figures 4.4 (c) & (d) respectively . Average carbide
sizes along the Major (Mc) and minor (mc) axes are tabulated in Table 4.2. From the data shown
in the Table 4.2, it is evident that there is a noticeable increase in the carbide sizes along the Major
(Mc) and minor (mc) axes in the 4000h aged DMW sample, in comparsion to the 2000h aged DMW
sample. These results are indeed expected due to the continued growth of carbides with aging time.
Figure 4.4: SEM micrographs showing an array of Type I interfacial carbides close to the
boundary between ferritic (BCC)/austenitic (FCC) materials (Inconel 82- Left, 2.25Cr-1Mo-
Right) in (a):2000h aged DMW sample, (b) 4000h aged DMW sample. Carbide size distributions
along Major (M) and minor (m) axes of (c) 2000h aged DMW sample, (d) 4000h aged DMW
sample
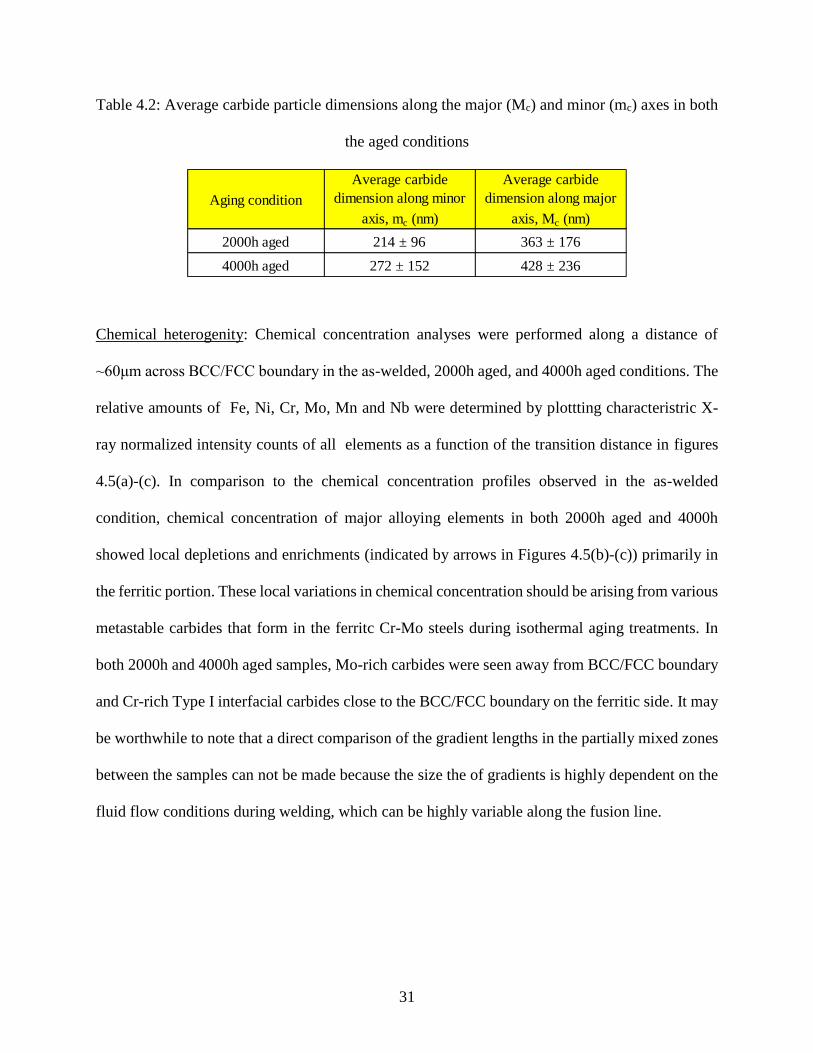
31
Table 4.2: Average carbide particle dimensions along the major (Mc) and minor (mc) axes in both
the aged conditions
Chemical heterogenity: Chemical concentration analyses were performed along a distance of
~60μm across BCC/FCC boundary in the as-welded, 2000h aged, and 4000h aged conditions. The
relative amounts of Fe, Ni, Cr, Mo, Mn and Nb were determined by plottting characteristric X-
ray normalized intensity counts of all elements as a function of the transition distance in figures
4.5(a)-(c). In comparison to the chemical concentration profiles observed in the as-welded
condition, chemical concentration of major alloying elements in both 2000h aged and 4000h
showed local depletions and enrichments (indicated by arrows in Figures 4.5(b)-(c)) primarily in
the ferritic portion. These local variations in chemical concentration should be arising from various
metastable carbides that form in the ferritc Cr-Mo steels during isothermal aging treatments. In
both 2000h and 4000h aged samples, Mo-rich carbides were seen away from BCC/FCC boundary
and Cr-rich Type I interfacial carbides close to the BCC/FCC boundary on the ferritic side. It may
be worthwhile to note that a direct comparison of the gradient lengths in the partially mixed zones
between the samples can not be made because the size the of gradients is highly dependent on the
fluid flow conditions during welding, which can be highly variable along the fusion line.
Aging condition
Average carbide
dimension along minor
axis, mc (nm)
Average carbide
dimension along major
axis, Mc (nm)
2000h aged 214 ± 96 363 ± 176
4000h aged 272 ± 152 428 ± 236
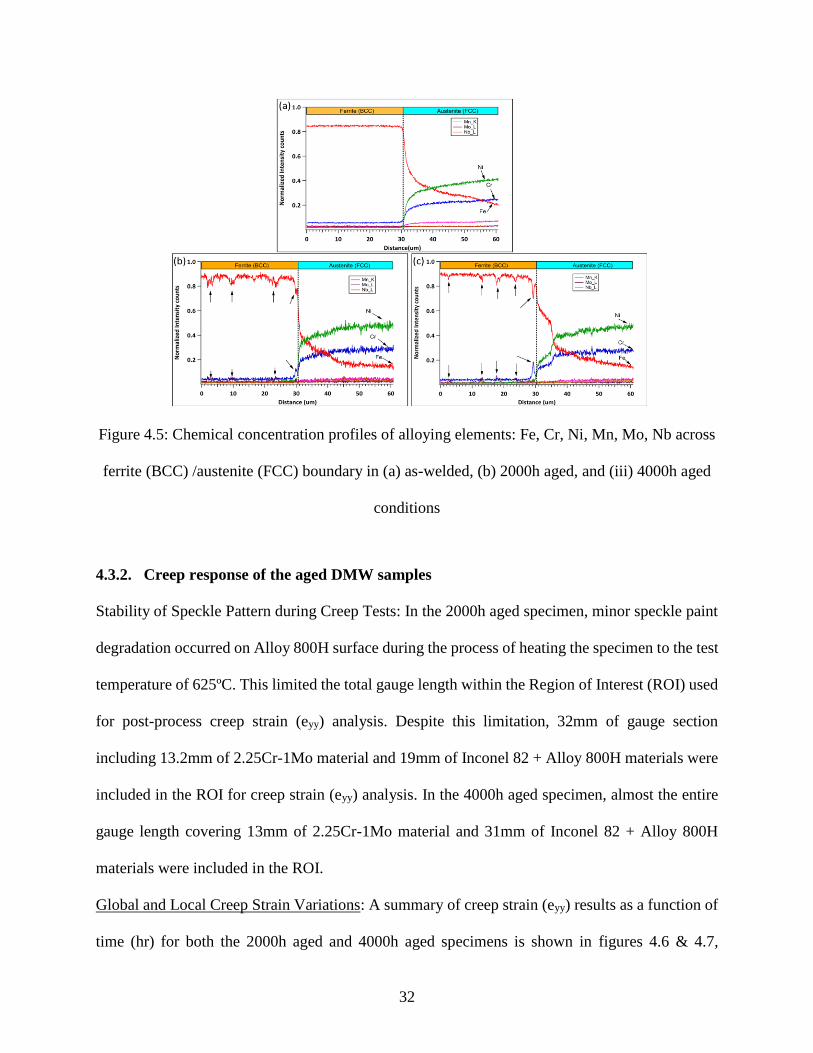
32
Figure 4.5: Chemical concentration profiles of alloying elements: Fe, Cr, Ni, Mn, Mo, Nb across
ferrite (BCC) /austenite (FCC) boundary in (a) as-welded, (b) 2000h aged, and (iii) 4000h aged
conditions
4.3.2. Creep response of the aged DMW samples
Stability of Speckle Pattern during Creep Tests: In the 2000h aged specimen, minor speckle paint
degradation occurred on Alloy 800H surface during the process of heating the specimen to the test
temperature of 625ºC. This limited the total gauge length within the Region of Interest (ROI) used
for post-process creep strain (eyy) analysis. Despite this limitation, 32mm of gauge section
including 13.2mm of 2.25Cr-1Mo material and 19mm of Inconel 82 + Alloy 800H materials were
included in the ROI for creep strain (eyy) analysis. In the 4000h aged specimen, almost the entire
gauge length covering 13mm of 2.25Cr-1Mo material and 31mm of Inconel 82 + Alloy 800H
materials were included in the ROI.
Global and Local Creep Strain Variations: A summary of creep strain (eyy) results as a function of
time (hr) for both the 2000h aged and 4000h aged specimens is shown in figures 4.6 & 4.7,
33
respectively. Creep strain distribution in these DMW samples, in both the aged conditions, reveal
a heterogeneous creep behavior. The global creep strain (eyy_global) in these DMW samples is the
result of accumulated strain across three discrete regions viz., 2.25Cr-1Mo base material, 2.25Cr-
1Mo HAZ and Nickel-base alloys (Inconel-82 + Alloy 800H) within this heterogenous
configuration. In both the aged samples, creep strain (eyy) emanating from the local 2.25Cr-1Mo
HAZ crept faster than the 2.25Cr-1Mo base material and was driving the creep-rupture in these
DMW samples. One noticeable difference, between the creep test results of 2000h aged and 4000h
aged samples, is the time of emergence of a weak-region inside the 2.25Cr-1Mo HAZ. In the case
of 2000h aged sample, the weak local region in the 2.25Cr-1Mo HAZ took more than 120 hours
of test duration, while in the 4000h aged sample the weak local region in the 2.25Cr-1Mo HAZ
emerged in just 30 hours of test duration. The minimum creep strain rates in the regions containing
Inconel-82 weld and Alloy 800H materials were negligible, for both the aged conditions. The
minimum creep strain rates exhbited by both these alloys were of the order of 10-7 hr-1 or less and
remained in the steady state condition. This is indeed expected, since both Inconel-82 and Alloy
800H materials are considered to be highly creep resistant. Both these alloys exhibit a steady state
creep strain rate of 10-7 hr-1 or less for a creep test condition of 650ºC, 50MPa, as shown in the
material data sheets of these alloys [43,44].
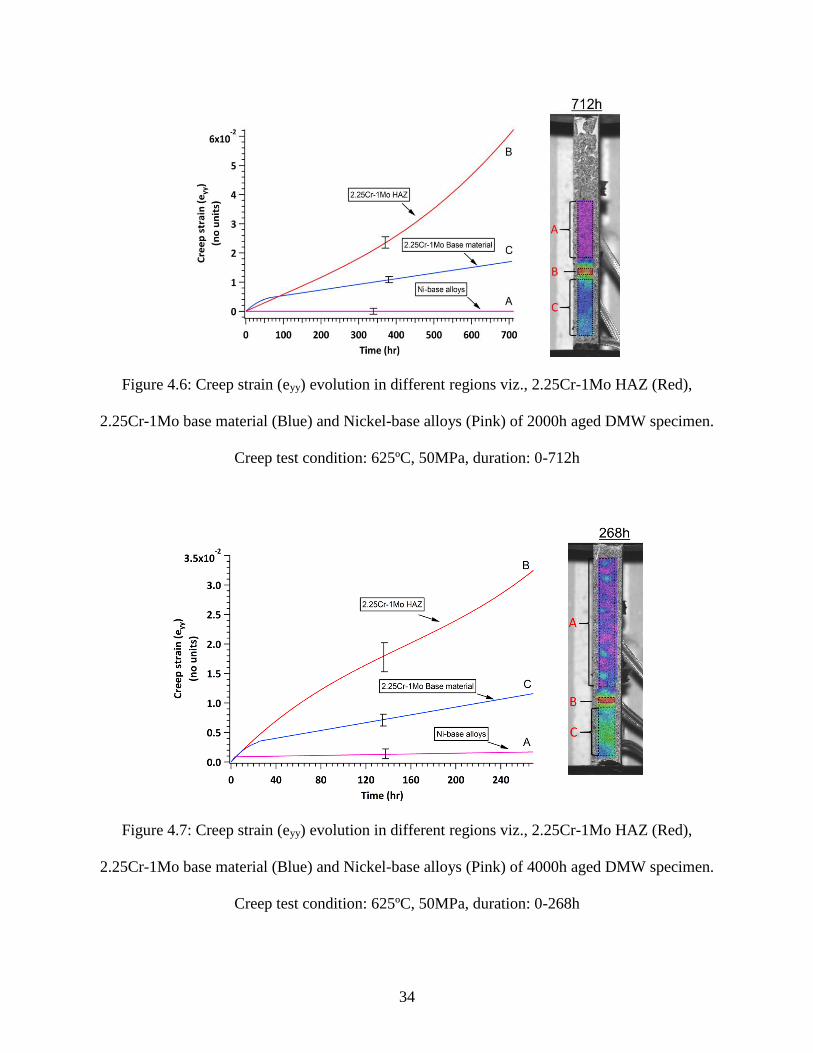
34
Figure 4.6: Creep strain (eyy) evolution in different regions viz., 2.25Cr-1Mo HAZ (Red),
2.25Cr-1Mo base material (Blue) and Nickel-base alloys (Pink) of 2000h aged DMW specimen.
Creep test condition: 625ºC, 50MPa, duration: 0-712h
Figure 4.7: Creep strain (eyy) evolution in different regions viz., 2.25Cr-1Mo HAZ (Red),
2.25Cr-1Mo base material (Blue) and Nickel-base alloys (Pink) of 4000h aged DMW specimen.
Creep test condition: 625ºC, 50MPa, duration: 0-268h
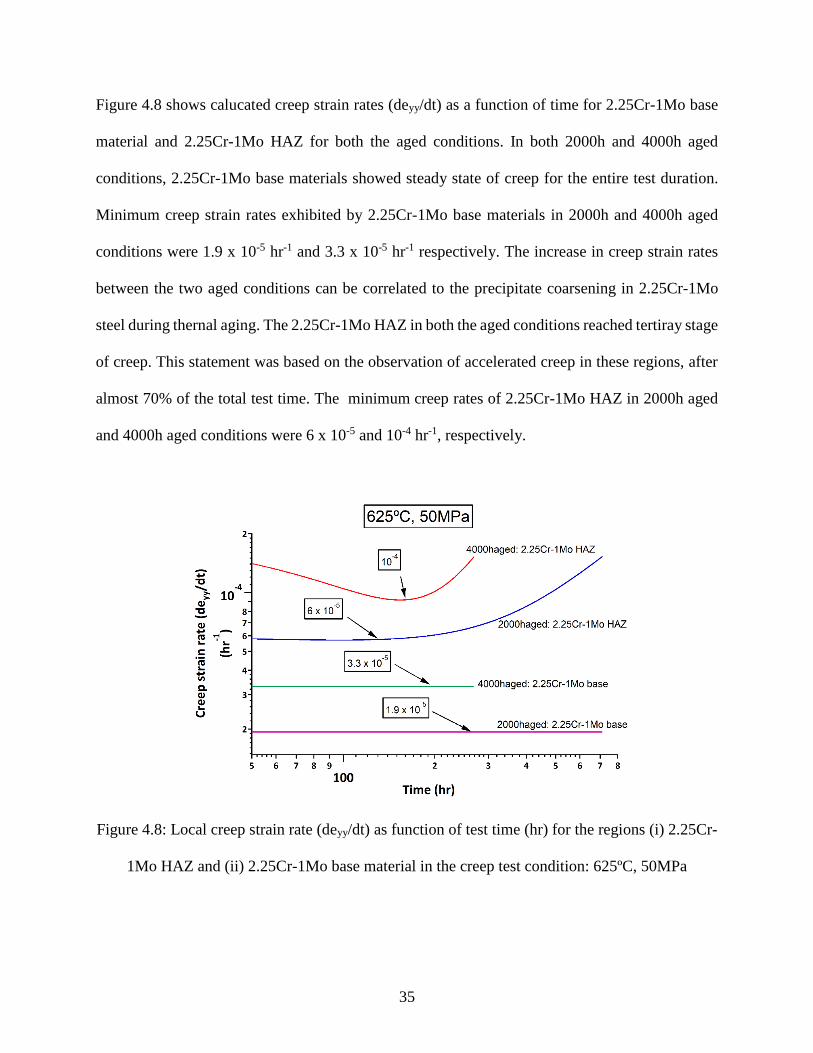
35
Figure 4.8 shows calucated creep strain rates (deyy/dt) as a function of time for 2.25Cr-1Mo base
material and 2.25Cr-1Mo HAZ for both the aged conditions. In both 2000h and 4000h aged
conditions, 2.25Cr-1Mo base materials showed steady state of creep for the entire test duration.
Minimum creep strain rates exhibited by 2.25Cr-1Mo base materials in 2000h and 4000h aged
conditions were 1.9 x 10⁻⁵ hr-1 and 3.3 x 10⁻⁵ hr-1 respectively. The increase in creep strain rates
between the two aged conditions can be correlated to the precipitate coarsening in 2.25Cr-1Mo
steel during thernal aging. The 2.25Cr-1Mo HAZ in both the aged conditions reached tertiray stage
of creep. This statement was based on the observation of accelerated creep in these regions, after
almost 70% of the total test time. The minimum creep rates of 2.25Cr-1Mo HAZ in 2000h aged
and 4000h aged conditions were 6 x 10⁻⁵ and 10-4 hr-1, respectively.
Figure 4.8: Local creep strain rate (deyy/dt) as function of test time (hr) for the regions (i) 2.25Cr-
1Mo HAZ and (ii) 2.25Cr-1Mo base material in the creep test condition: 625ºC, 50MPa
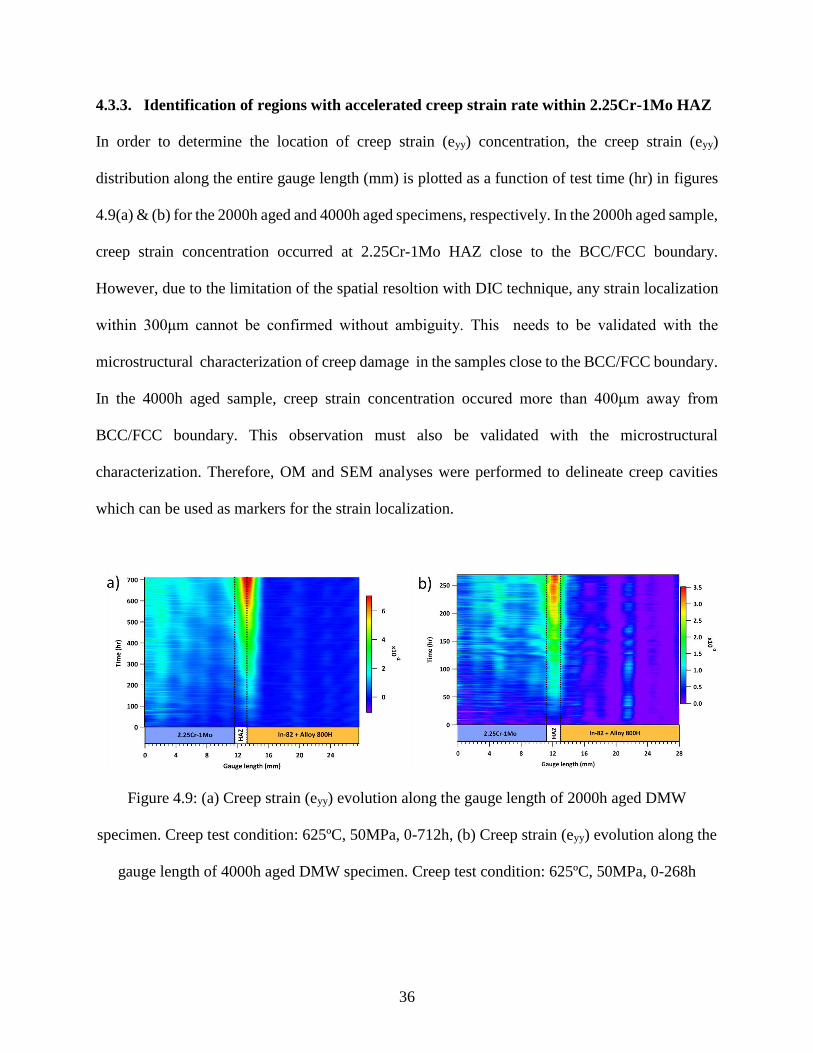
36
4.3.3. Identification of regions with accelerated creep strain rate within 2.25Cr-1Mo HAZ
In order to determine the location of creep strain (eyy) concentration, the creep strain (eyy)
distribution along the entire gauge length (mm) is plotted as a function of test time (hr) in figures
4.9(a) & (b) for the 2000h aged and 4000h aged specimens, respectively. In the 2000h aged sample,
creep strain concentration occurred at 2.25Cr-1Mo HAZ close to the BCC/FCC boundary.
However, due to the limitation of the spatial resoltion with DIC technique, any strain localization
within 300μm cannot be confirmed without ambiguity. This needs to be validated with the
microstructural characterization of creep damage in the samples close to the BCC/FCC boundary.
In the 4000h aged sample, creep strain concentration occured more than 400μm away from
BCC/FCC boundary. This observation must also be validated with the microstructural
characterization. Therefore, OM and SEM analyses were performed to delineate creep cavities
which can be used as markers for the strain localization.
Figure 4.9: (a) Creep strain (eyy) evolution along the gauge length of 2000h aged DMW
specimen. Creep test condition: 625ºC, 50MPa, 0-712h, (b) Creep strain (eyy) evolution along the
gauge length of 4000h aged DMW specimen. Creep test condition: 625ºC, 50MPa, 0-268h
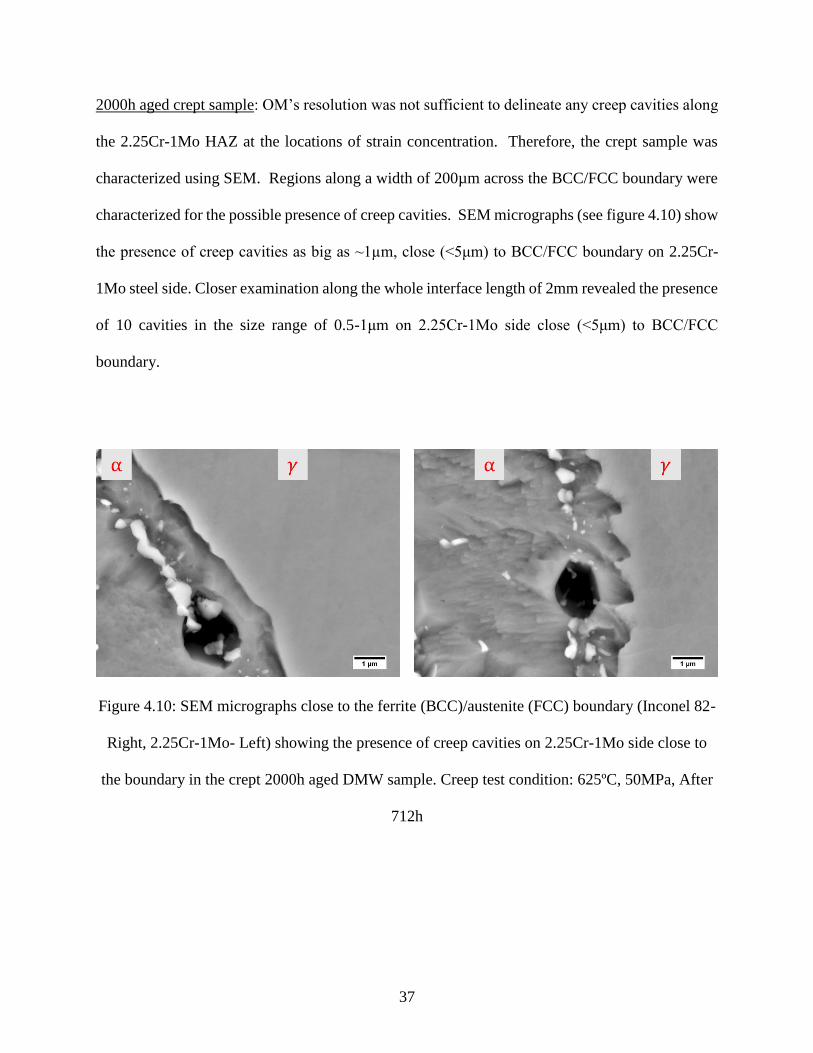
37
2000h aged crept sample: OM’s resolution was not sufficient to delineate any creep cavities along
the 2.25Cr-1Mo HAZ at the locations of strain concentration. Therefore, the crept sample was
characterized using SEM. Regions along a width of 200µm across the BCC/FCC boundary were
characterized for the possible presence of creep cavities. SEM micrographs (see figure 4.10) show
the presence of creep cavities as big as ~1µm, close (<5μm) to BCC/FCC boundary on 2.25Cr-
1Mo steel side. Closer examination along the whole interface length of 2mm revealed the presence
of 10 cavities in the size range of 0.5-1μm on 2.25Cr-1Mo side close (<5μm) to BCC/FCC
boundary.
Figure 4.10: SEM micrographs close to the ferrite (BCC)/austenite (FCC) boundary (Inconel 82-
Right, 2.25Cr-1Mo- Left) showing the presence of creep cavities on 2.25Cr-1Mo side close to
the boundary in the crept 2000h aged DMW sample. Creep test condition: 625ºC, 50MPa, After
712h
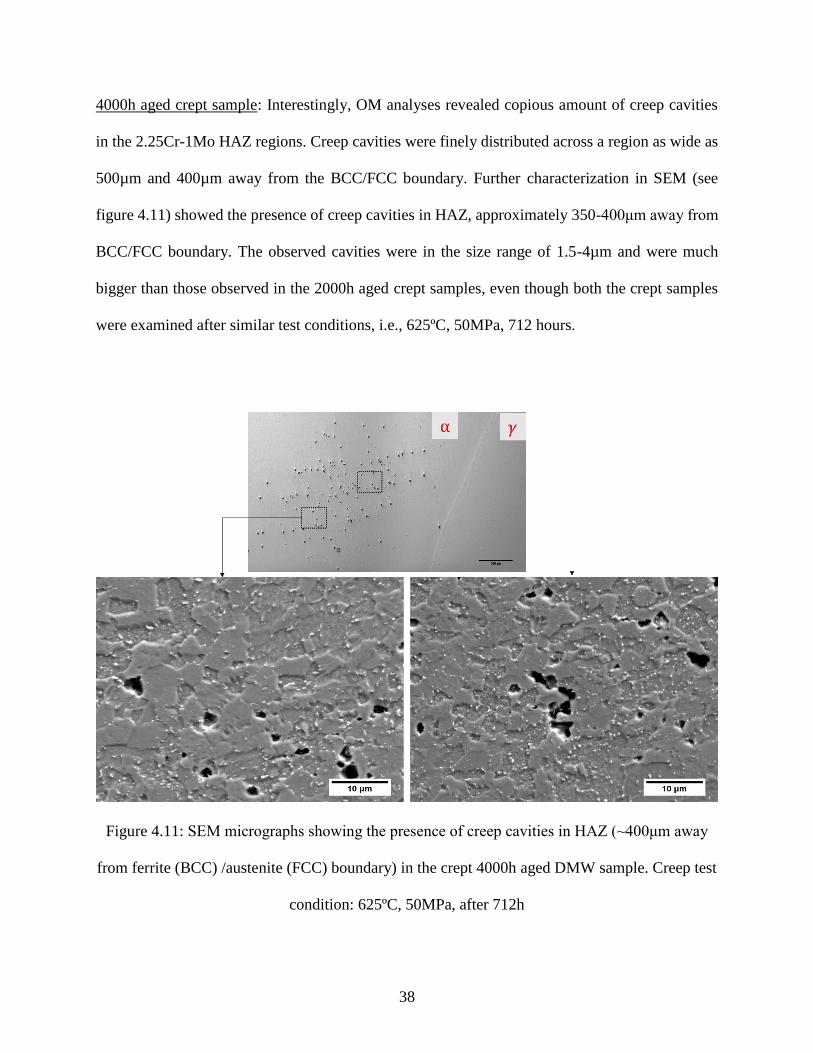
38
4000h aged crept sample: Interestingly, OM analyses revealed copious amount of creep cavities
in the 2.25Cr-1Mo HAZ regions. Creep cavities were finely distributed across a region as wide as
500µm and 400µm away from the BCC/FCC boundary. Further characterization in SEM (see
figure 4.11) showed the presence of creep cavities in HAZ, approximately 350-400μm away from
BCC/FCC boundary. The observed cavities were in the size range of 1.5-4µm and were much
bigger than those observed in the 2000h aged crept samples, even though both the crept samples
were examined after similar test conditions, i.e., 625ºC, 50MPa, 712 hours.
Figure 4.11: SEM micrographs showing the presence of creep cavities in HAZ (~400μm away
from ferrite (BCC) /austenite (FCC) boundary) in the crept 4000h aged DMW sample. Creep test
condition: 625ºC, 50MPa, after 712h
39
4.4. Discussion
4.4.1. Comparison of global creep strain rates with previous creep studies on DMWs
The results confirmed our hypothesis that local creep deformation behavior of 2.25Cr-1Mo HAZ
will drive the premature failure in the Dissimilar Metal Weld (DMW) made between 2.25Cr-1Mo
steel and an austenitic alloy using Nickel-base weld consumable. Interestingly, most of the
published literature ignore the local variations of creep strain rate. In the creep studies performed
by Parker and Startford [16] on DMWs made between 2.25C-1Mo steel and an austenitic alloy
with Inconel weld consumable, a global creep strain rate of 3.33 x 10⁻⁶ hr-1 was obtained for the
same creep test condition used here (625℃, 50MPa). Samples used for these tests were post-weld
heat treated (PWHT) at 700℃ for 3h after weld fabrication. To allow for one to one comparison,
mimimum global creep rates in the present study were recalculated by maintaining the same
proportions of different materials (46.25% of Inconel 82 weld deposit, 26.875% each of ferritic
and austenitic base materials) in the gauge section similar to that of Parker and Stratford [16].
Minimum global creep strain rates obtained in the 2000h aged and 4000h aged specimens were
1.7 x 10⁻⁵ hr-1 and 2.72 x 10⁻⁵ hr-1, which are approximately an order higher than that observed in
the creep tests by Parker and Startford [16] in the same test condition. Considerable increase in the
observed global creep strain rates in the present study can be rationalized due to the presence of
pre-existing array of Type I interfacial carbides, resulting from the aging treatments (600℃ for
2000h and 600℃ for 4000h). Furthermore, the location of creep strain conecntration in the 4000h
aged DMW specimen is far away from the BCC/FCC boundary and the underlying creep
mechanism in this aged condition might be different from that observed in the 2000h aged DMW
aged counterpart.

40
4.4.2. Correlation of creep damage to failures in ex-service DMWs
SEM characterization of the 2000h aged crept specimen revealed a sparse distribution of creep
cavities. The creep cavities were in the size range of 0.5-1μm and were distributed at an average
of 5 cavities/mm on 2.25Cr-1Mo steel side close to the BCC/FCC boundary. This was in good
agreement with interrupted creep cavity evaluation done by Parker and Stratford [17], on crept
samples of DMWs made between 2.25Cr-1Mo steel and AISI 316 stainless steel as parent
materials, welded with Inconel 82 weld consumable. Their studies showed that creep cavities
observed were in the size range of 0.5-1μm and they were distributed at an average of less than 10
cavities/mm untill 50% of life. No cavity coalesecnce or microcracks were observed untill 80% of
life was exhausted in these earlier studies. These agreements gave a clear indication that the creep
damage observed in the crept 2000h aged DMW specimen should replicate low ductility
intergranular creep fracture observed close to BCC/FCC boundary in ex-service DMWs. Creep
cavities observed in the 4000h aged crept specimen were finely distributed in the HAZ, away from
the BCC/FCC boundary. Moreover, observed creep cavities were in the size range of 1.5-4μm.
These observations indicate 4000h aged DMW specimen will not repliate low ductility
intergranular creep fracture as seen in ex-service welds.
4.4.3. Correlation of creep strain concentration to microstructural heterogeneity
2000h aged condition: Creep strain measurements from 2000h aged DMW sample showed strain
concentration and sparse distribution of creep cavities on 2.25Cr-1Mo side close to BCC/FCC
boundary. To correlate the creep damage in this local region to microstructure, EDS maps of
alloying elements (Cr, Mo and Si), along BCC/FCC boundary of 2000h aged DMW sample before
creep, were acquired as shown in figures 4.12(b)-(d) respectively. These maps show a line of Cr-
rich carbides close to BCC/FCC boundary and a network of Mo rich carbides with traces of Si,

41
away from BCC/FCC boundary on ferritic steel side. Location and distribution of Cr-rich carbides
in these maps is a clear indication that these are Type I interfacial carbides similar to those
observed in DMWs during aging heat treatments. Futher high resolution TEM EDS analyses of
carbides were perfomed close to BCC/FCC boundary to characterize the type of these carbides.
Figures. 4.13(a) & (b) show TEM EDS maps obtained from two regions: (a) close to BCC/FCC
boundary that includes Cr-rich carbides and (b) 5μm away from BCC/FCC boundary that includes
Mo-rich carbides. X-ray spectra analyses from these carbides as shown in figures 4.13(c)&(d),
show that Cr-rich carbides also contain substitutional alloying elemets such as Fe, Mo, Ni in the
decreasing order of predominance, and Mo-rich carbides also contain substitutional alloying
elements such as Fe, Si, Cr, Ni in the decreasing order of predominance. Ratio of weight percent
of substitutional alloying elements (excluding C weight percent) in Cr-rich carbides is observed to
be Cr: Fe: Mo: Ni = (48.5-51) : (35-37.5) : 8.2 : 5.6. These observed wieght proportions of
substitutional alloying elements are consistent with M23C6 type carbides that are formed in 2.25Cr-
1Mo steels during isothermal tempering in the tempetrature range of 600-650℃ [45]. Ratio of
weight perecent of substitutional alloying elements (excluding C weight percent) in Mo-rich
carbides is observed to be Mo: Fe: Si: Cr: Ni = 51 : 29.5 : 11.6 : 6 : 1.9. Two attributes [45,46] that
identify these carbides as M6C type carbides are (i) presence of Si in these carbides and (ii)
presence of Fe as the second richest alloying element after Mo in these carbides. These two
attributes rule out the possiblity of these carbides being Mo-rich M2C carbides. It also needs to
noted down that small concentrations of Ni existed in both these carbides, which might have
occurred as a result of diffusion from Ni rich austenitic alloy side during isothermal tempering.

42
Figure 4.12: EDS maps of elements b) Chromium, b) Molybdenum, and d) Silicon across ferrite
(BCC) (left)/austenite (FCC) (right) boundary of 2000h aged DMW sample before creep test
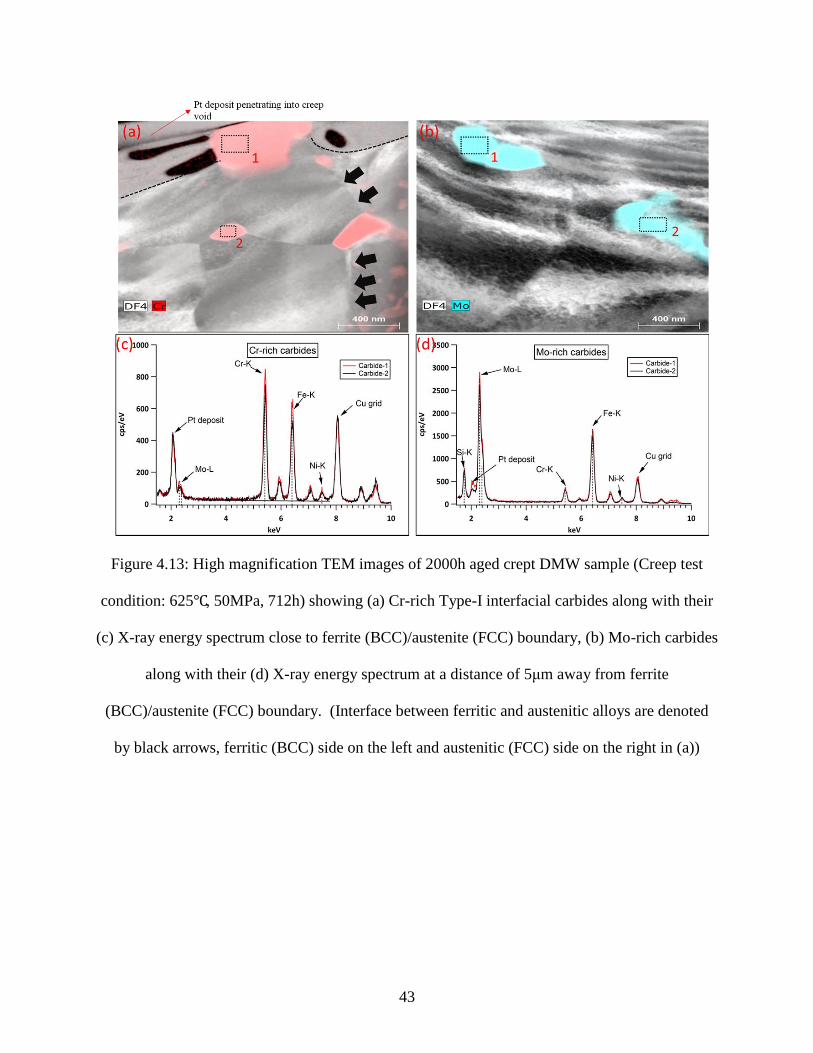
43
Figure 4.13: High magnification TEM images of 2000h aged crept DMW sample (Creep test
condition: 625℃, 50MPa, 712h) showing (a) Cr-rich Type-I interfacial carbides along with their
(c) X-ray energy spectrum close to ferrite (BCC)/austenite (FCC) boundary, (b) Mo-rich carbides
along with their (d) X-ray energy spectrum at a distance of 5μm away from ferrite
(BCC)/austenite (FCC) boundary. (Interface between ferritic and austenitic alloys are denoted
by black arrows, ferritic (BCC) side on the left and austenitic (FCC) side on the right in (a))
44
To determine the influence of total Carbon content on the type and volume fraction of equilibrium
carbides in 2.25Cr-1Mo steels, thermodynamic simulations were performed at the aging
temperature of 600℃. Figure.4.14 shows thermodynamic calculations performed in Thermocalc
sofware using TCFe8 database to determine equilibrium volume fraction of carbides in 2.25Cr-
1Mo steel with carbon content (weight percent) varying from 0.02% to 0.28%. Nominal
composition of 2.25Cr-1Mo steel used for calculations is listed in Table 4.1. Thermodynamic
calculations (as shown in figure 4.14) show an increase or decrease in total C content results in the
respective increase or decrease in total volume fraction of equilibrium carbides with respect to that
of the nominal 2.25Cr-1Mo steel composition. However, enrichment of C results in Cr-rich M23C6
carbides becoming thermodynamically more stable at the expense of Mo rich M6C carbides and in
contrast, depletion of C results in Mo rich M6C carbides carbides becoming thermodynamically
more stable at the expense of Cr-rich M23C6 carbides. Klueh et. al [47] and Pilling et. al [48] have
also observed similar carbide evolution in decarburized 2.25Cr-1Mo steel favoring the growth Mo
rich M6C carbides at the expense of Cr-rich M23C6 carbides during isothermal tempering in the
temperature range of 566℃-700℃.
In the present creep study on 2000h aged DMW sample creep damage occuring on 2.25Cr-1Mo
steel side close to to BCC/FCC boundary can be rationalized as creep strain localizing in an
apparent Carbon depleted region characterized by M6C carbides immediately adjacent to an
apparent Carbon enriched region characterized by a line of M23C6 carbides.

45
Figure 4.14: Thermocalc® predicted equilibrium volume perecentages of (i) Parent α-Fe solid
solution, (ii) M23C6 carbide and (iii) M6C carbide in 2.25Cr-1Mo base material (chemical
composition reported in Table I) with Carbon content varying from 0.02 to 0.28 weight percent
(0.15% C being nominal composition in 2.25Cr-1Mo steel)
Comparison with 4000h aged condition: Creep strain measurements made using DIC technique on
4000h aged DMW sample showed strain concentration away from the BCC/FCC boundary and
futher OM and SEM characterization of the 4000h aged crept DMW sample showed a fine
distribution of creep cavities in the 2.25Cr-1Mo HAZ approximately 400μm away from the
BCC/FCC boundary. EDS maps of alloying elements (Cr, Mo and Si) (see figures. 4.15b-d),
captured from the location of creep strain concentration showed predominantly Mo-rich rich
carbides with traces of Si inside them indicating an apparent Carbon depleted region, similar to
EDS observations in the location of creep strain concentration in 2000h aged condition.
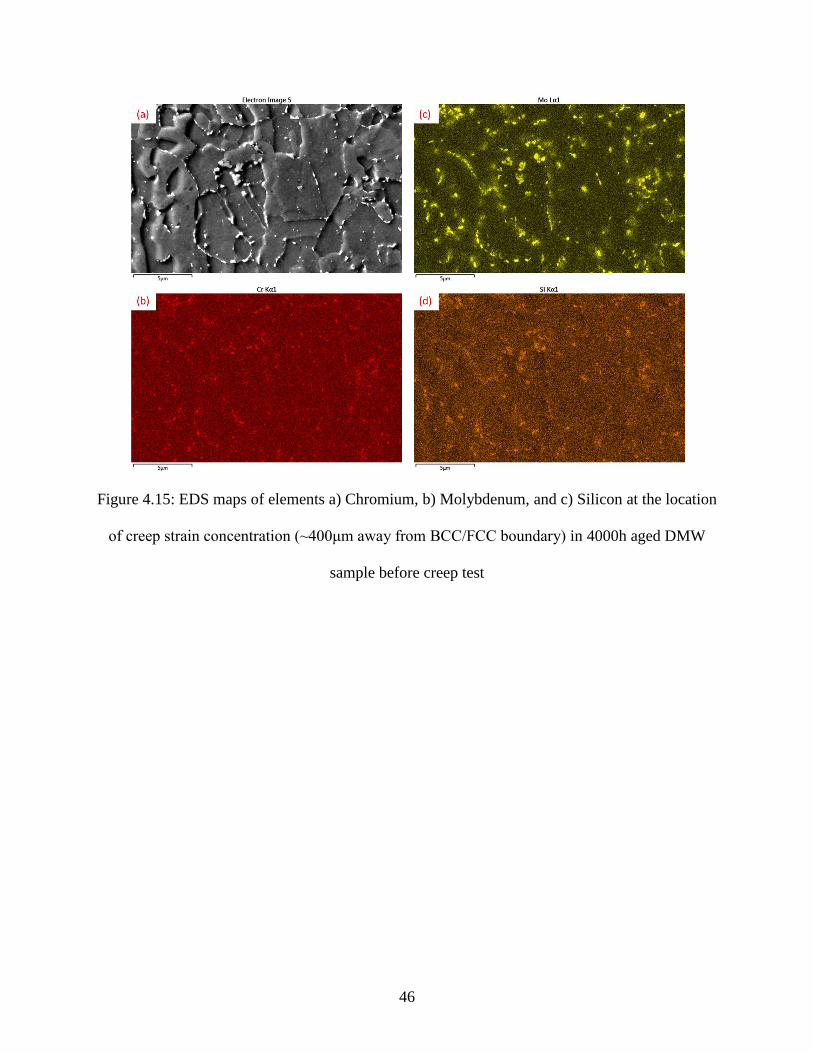
46
Figure 4.15: EDS maps of elements a) Chromium, b) Molybdenum, and c) Silicon at the location
of creep strain concentration (~400μm away from BCC/FCC boundary) in 4000h aged DMW
sample before creep test
47
To rationalize the shift in the location of creep strain concentration in the 4000h aged condition,
carbide distribution and the creep strain localization in these samples has to be compared with
discussions from 2000h sample data. Figure 4.16(a) show carbide volume fraction at the location
creep strain concentration in 2000h aged (indicated as location-1) and 4000h (indicated as location-
2) aged DMW samples. It can be noticed from this plot that there is a relative increase in volume
fraction of carbides close to BCC/FCC boundary (location-1) in 4000h aged condition in
comparison to that in 2000h aged condition and a relative decrease in volume fraction of carbides
at a distance of 400μm away from BCC/FCC boundary (location-2) in 4000h aged condition in
comparison to that in 2000h aged condition. Representative SEM images of location-1 and
location-2 in 2000h and 4000h aged DMW specimens and their respective images processed in
ImajeJ® sofware to characterize carbide distribution are shown in figures 4.16(b)&(c)
respectively. In the location of creep strain concentration (location-2) in 4000h aged DMW sample
(as shown in figure 4.16c), there is an apparent depletion in the amount of carbides in comparison
to the 2000h aged DMW sample. In the 2000h aged DMW, carbides are distributed both along the
grain boundaries and inside the grains (indicated by black arrows). However, in the 4000h aged
DMW, carbides are majorly distrubuted along the grain boundaries and the majority of grain
interiors are depleted of carbides (indicated by black arrows). Carbide depletion away from
BCC/FCC boundary (location-2) in 4000h aged condition can be inferred due to the diffusion of
C towards BCC/FCC boundary. This rationale is supported by the enrichment of carbides in 4000h
aged condition, as Type I interfacial carbides (as shown figure 4.16) close to BCC/FCC boundary
(figure 4.4) and a network of carbides at a distance of 5μm away from BCC/FCC boundary
(location-1) (as shown in figure 4.16b) compared to 2000h aged condition.

48
Figure 4.16: (a) Plot showing volume fraction of carbides as a function of distance from
ferrite/austenite boundary in both 2000h and 4000h aged conditions, (b) SEM micrographs and
the respective processed images of region close to ferrite (BCC)/austenite (FCC) boundary in
2000h and 4000h aged conditions, (c) SEM micrographs and the respective processed images of
region at distance 400μm away from ferrite (BCC)/austenite (FCC) boundary in 2000h and
4000h aged conditions
49
4.4.4. Implications of the current results
The above discussions confirm that the localized microstructural heterogenities lead to spatial and
temporal variation of creep strain rates, thereby the published global strain rates from DMW must
be compared only if they have similar initial microstructures. To demonstrate the significance of
these local creep strain rates, strain rate measurements made in the present studies are compared
with (i) creep studies on a similar DMW configuration from Parker and Stratford [16], and (ii)
creep studies on decarburized 2.25Cr-1Mo steel by Klueh [49]. Details of these mentioned creep
studies are enlisted in Table 4.3. Figure 4.17 shows the comparison of minimum creep strain rates
(ε.) obatined across these studies with the present study. Local creep strain rates measured in the
work of Parker and Stratford [16] (as indiacted as I in figure 4.17) are comparable only to the local
creep strain rates obtained in the 2.25Cr-1Mo base material in 2000h aged condition (as indicated
as II in figure 4.16) of the present study. This clearly demonstrates that spatial resolution (less than
1mm) obtained using DIC technique is needed to discretize locally weak microstructures in such
DMW configurations.
In addition, since the present study attributed the creep strain concentration in the locally weak
regions of 2.25Cr-1Mo HAZ to the carbide depletion in these regions, further comparison was
made with the creep studies performed on decarburized 2.25Cr-1Mo steel [49]. In the creep studies
of Klueh [49], creep strain rates observed in the aged + decarbruzied 2.25Cr-1Mo material
(labelled as VII in figure 4.17) was almost 3 times the creep strain rates observed in the aged
2.25Cr-1Mo material (labelled as VI in figure 4.17) in the same creep test condition. Similar to
these observations, in the present study, creep strain results obtained in 2.25Cr-1Mo HAZ (labelled
as III and V in figure 4.17) were 3-4 times more than the respective aged 2.25Cr-1Mo base

50
Figure 4.17: Comparison of minimum creep strain rates (ε.) across creep studies: (I) Parker and
Stratford [8], (II-V) Present study, and (VI-VII) Klueh [23]
Table 4.3: Details of creep studies used for creep strain rates comparison in Figure 4.15
Legends Reference Test specimen Strain measurement locationCreep test
conditionRemarks
I Parker and Stratford [8]
DMW with base materials: 2.25Cr-1Mo and
AISI 316 stainless teel,
weld deposit: Inconel 82
Weld interface 625℃ , 50 Mpa
Local creep strain measurements made
across a distance of 6-8mm including
equal amounts of 2.25Cr-1Mo and Inconel
82 weld deposit
II 2.25Cr-1Mo base material
III 2.25Cr-1Mo HAZ
IV 2.25Cr-1Mo base material
V 2.25Cr-1Mo HAZ
VIAnnealed 2.25Cr-1Mo material aged at
566℃ for 26500h566℃ , 55MPa --
VIIAnnealed 2.25Cr-1Mo material aged and
decarburized at 566℃ for 26500h566℃ , 55MPa
Decarburizing was carried out by aging
these material in Sodium exposure
Global strain measurement
Local creep strain measurements made
using DIC technique with a spatial
resolution ~300μm
Present study
Klueh [23]
DMW with base materials 2.25Cr-1Mo and
Alloy 800H, weld deposit: Inconel 82 aged
at 600℃ for 2000h
DMW with base materials 2.25Cr-1Mo and
Alloy 800H, weld deposit: Inconel 82 aged
at 600℃ for 4000h
625℃ , 50 MPa
625℃ , 50 MPa
51
materials (labelled as II and IV in figure 4.17). These results prove local creep strain measurements
made in the present study were efficient in revealing the heterogenity in creep behavior of DMWs.
4.5. Summary
Creep studies were performed on Dissimilar Metal Welds (DMWs) made between ferritic steel
and austenitic alloy using Ni-base weld consumable to study spatial and temporal variation of
creep deformation in these heterogeneous configurations. As-fabricated DMW blocks were aged
at two conditions: (i) 600℃ for 2000h, and (ii) 600℃ for 4000h to induce the nucleation and
growth of different sizes and distribution of creep detrimental Type I interfacial carbides close to
BCC/FCC boundary. Short term (~1 month) creep tests (Creep test condition: 625℃, 50MPa)
were integrated with Digital Image Correlation (DIC) technique to measure local creep strains
along the entire heterogeneous gauge section. Following concluding remarks were drawn out of
these creep studies:
Local creep strain measurements made using DIC technique discretized the creep behavior in
Dissimilar Metal Weld (DMW) configurations. Such local creep strain behavior information
is essential for developing creep resistant microstructures with the potential to overcome
premature failures in DMWs. Further refining to address limitations in current methods will
make this technique an appropriate methodology to study creep behavior is dissimilar metal
configurations.
2000h aged DMW specimen used for these creep tests exhibited strain concentration in 2.25Cr-
1Mo HAZ close to BCC/FCC boundary. Strain concentration occurred in this local region due
to the apparent depletion of total Carbon content as a result of formation of line of Type I
interfacial carbides close to BCC/FCC boundary.
52
4000h aged DMW specimens used for these creep tests exhibited strain concentration in
2.25Cr-1Mo HAZ at a distance of ~400μm away from BCC/FCC boundary. These specimens
are perceived to have been overaged to replicate strain concentration close to BCC/FCC
boundary as seen in both 2000h aged condition and ex-service welds. Strain concentration
occurred in this local region due to the depletion of carbides in this region resulting from the
relative enrichment of carbides close to BCC/FCC boundary. Failures in regions away from
BCC/FCC boundary can also be envisaged, when power plants do not operate at their full
capacties and experience frequent shutdowns.
53
Chapter 5
Comparative creep studies on functionally Graded Transition Joints (GTJs)
5.1. Introduction
In the last decade, functionally graded transition joints have been identified as potential candidates
to replace failure prone dissimilar metal welds (DMWs) in power plant applications. A
conventional Graded Transition Joint (GTJ) is fabricated between two alloys, say A and B, by
additively depositing layers of increasing dilution levels (0 to 100%) of alloy B on the alloy A
substrate or the vice versa. Based on the design concepts, a typical as-fabricated GTJ is expected
to have a gradual change in chemical composition, microstructure and mechanical properties
transitioning from one alloy to that of the other alloy.
Researchers at Lehigh university [50] pioneered the design concepts to develop GTJs between
ferritic steels and austenitic alloys. In their modelling studies, Finite Element (FE) based models
were utilized to optimize the grade length and geometry of GTJs to minimize the development of
local interfacial stresses due to inherent thermal expansion mismatch between the ferritic and
austenitic materials. Results from their FE models indicated almost 80% (from ~240 MPa to ~50
MPa) reduction in local thermal stresses is possible with a grade length of 120mm. Additionally,
thermodynamics and kinetics-based models were used to predict the loss of Carbon content in the
graded region due to incumbent Carbon chemical potential gradients across the graded regions
during high temperature service exposure. A grade length of 25mm was determined to be sufficient
for negligible loss in Carbon content, at a service temperature of 500ºC. Fabrication of GTJs were
attempted using powder-blown laser direct metal deposition process [51,52] and wire fed dual wire
gas tungsten arc welding (DWGTAW) [53] process. Both processes have shown reasonable
promise in fabricating transitions joints.

54
Recently, Galler et. al [54] developed GTJs with an objective to overcome premature creep failure
in a specific DMW configuration made between 2.25Cr-1Mo steel (BCC) tubes and Alloy 800H
(FCC) tubes used in the steam generators of power plants. In this study, three different filler metals
viz., (i) Inconel 82, (ii) P87, and (iii) E347H were utilized as candidate filler materials for
fabricating GTJs. These filler metals were selected based on one of the design requirements to
possess an intermediate coefficient of thermal expansions (CTEs) (temperature range: 400-600℃)
between the two base materials: 2.25Cr-1Mo (14 μm m-1 K-1) and Alloy 800H (16.9 μm m-1 K-1).
Further, a grade length of 20mm was determined for transition based on the other design
requirement to minimize Carbon content loss in graded transition within 10 weight percent in the
operating temperature range: 400-600℃ for 20 years lifetime. It was done using commercially
available software tools like Thermocalc and Dictra [55–57] for performing thermodynamic and
kinetic simulations. In this chapter, creep studies were performed on the three different candidate
GTJs using the test methodology established in Chapter-2. Local creep constitutive strain results
obtained from these studies were compared with that of the baseline DMWs in the Chapter-3 to
determine the suitability of GTJs to replace the failure-prone conventional DMWs.
5.2. Experimental procedure
5.2.1. Fabrication of Graded Transition Joint (GTJ) coupons
Graded Transition Joint (GTJ) coupons were manufactured with three candidate filler metals: (i)
Inconel 82, (ii) P87, and (iii) 347H. All these filler materials are Ni-rich austenitic alloys and the
nominal chemical composition of them are listed in Table 1. GTJs’ fabrication has been performed
using 2.25Cr-1Mo material (Dimensions: 12” (L) x 3” (W) x ½” (T)) as the substrate base plate.
Deposition of graded transition layers was done in the ‘weld overlay’ fashion on the thickness (½”
T) surface of the substrate plate and along the length (12” L) of the substrate plate. Dual wire Gas
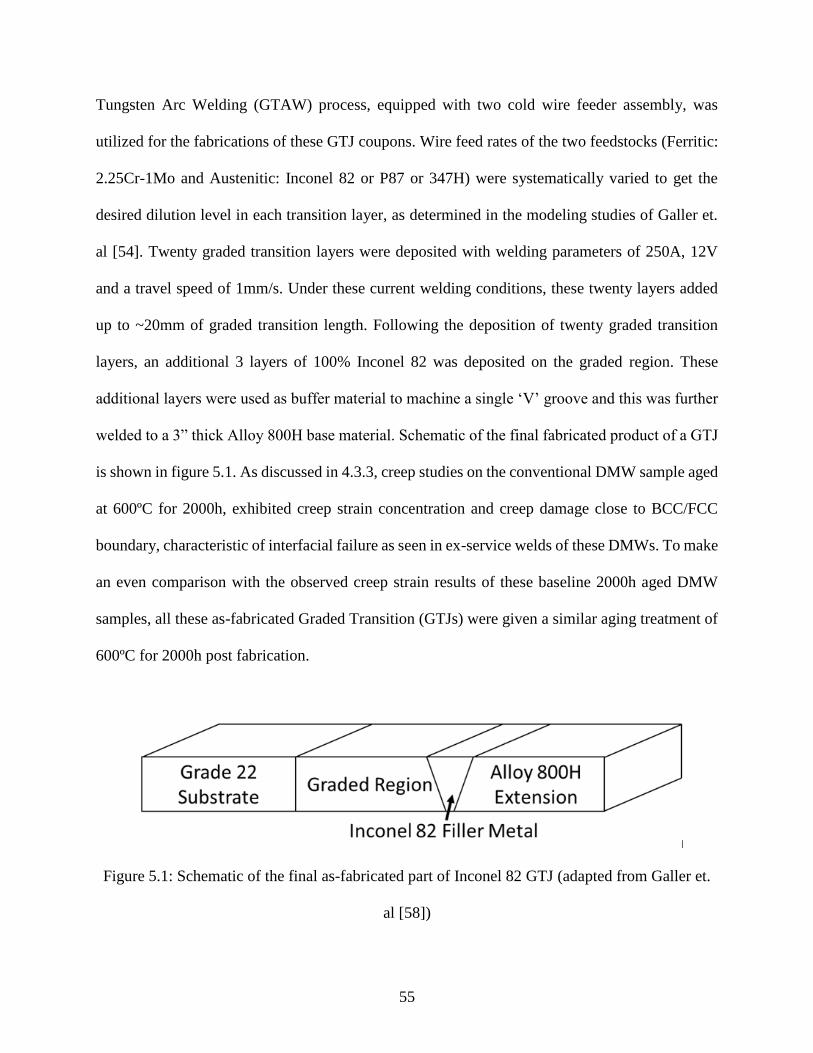
55
Tungsten Arc Welding (GTAW) process, equipped with two cold wire feeder assembly, was
utilized for the fabrications of these GTJ coupons. Wire feed rates of the two feedstocks (Ferritic:
2.25Cr-1Mo and Austenitic: Inconel 82 or P87 or 347H) were systematically varied to get the
desired dilution level in each transition layer, as determined in the modeling studies of Galler et.
al [54]. Twenty graded transition layers were deposited with welding parameters of 250A, 12V
and a travel speed of 1mm/s. Under these current welding conditions, these twenty layers added
up to ~20mm of graded transition length. Following the deposition of twenty graded transition
layers, an additional 3 layers of 100% Inconel 82 was deposited on the graded region. These
additional layers were used as buffer material to machine a single ‘V’ groove and this was further
welded to a 3” thick Alloy 800H base material. Schematic of the final fabricated product of a GTJ
is shown in figure 5.1. As discussed in 4.3.3, creep studies on the conventional DMW sample aged
at 600ºC for 2000h, exhibited creep strain concentration and creep damage close to BCC/FCC
boundary, characteristic of interfacial failure as seen in ex-service welds of these DMWs. To make
an even comparison with the observed creep strain results of these baseline 2000h aged DMW
samples, all these as-fabricated Graded Transition (GTJs) were given a similar aging treatment of
600ºC for 2000h post fabrication.
Figure 5.1: Schematic of the final as-fabricated part of Inconel 82 GTJ (adapted from Galler et.
al [58])
56
5.2.2. Microstructural characterization
Detailed characterization of microstructural and microhardness gradients in the transition layers
of GTJs were performed in the characterization studies of Galler et. al [58]. Some of the key
research findings of that study that has relevance to the creep studies performed in this chapter
have been discussed in the appendix section. In the current investigation, detailed characterization
spanned 2.25Cr-1Mo HAZ to 2.25Cr-1Mo base material regions using light optical microscopy
(OM), scanning electron microscopy (SEM) and X-ray energy dispersive spectroscopy (EDS).
Samples for OM and SEM were prepared by grinding through 1200-grit SiC grit papers, followed
by diamond polishing in 3μm and 1μm suspensions. The final polish was obtained through
vibratory-polishing with 0.05μm colloidal silica suspension for 3 hours. For the purposes of
carbide characterization and identifying microstructurally different regions inside the 2.25Cr-1Mo
HAZ, the polished GTJ samples were immersion etched in freshly prepared 2% Nital solution for
about a minute. A Leica DM2500 metallograph was used for performing OM analyses. Scanning
electron microscopy (SEM) analyses were performed using JEOL 6500 SEM, equipped with both
secondary electron (SE) and backscattered electron (BSE) detectors, using accelerated beam
voltages in the range of 15-20kV. The EDS analyses were performed in a Versa 3D scanning
electron microscope (SEM) built with Oxford® X-ray EDS detectors. X-ray Energy Dispersive
Spectroscopy (EDS) area maps were obtained at a beam accelerated voltage of 20kV with a step
size of 0.01μm.
5.2.3. Creep testing with Digital Image Correlation (DIC)
ATS 2330 series ® lever arm tensile testing system, used for conducting creep tests on aged
DMWs was utilized for conducting creep tests on GTJs as well. Creep test frame set-up with 3D
DIC have been discussed in detail in 4.2.3.

57
The total gauge length for measuring local strain using DIC covered a length of 48mm with 12-
14mm of 2.25Cr-1Mo material, 20mm of graded transition region and the remainder of Inconel-
82 and Alloy-800H materials. Speckle pattern application procedure used for GTJ samples was
similar to that used for the creep tests of aged DMW samples, as discussed in the 4.2.3. Three
thermocouples were attached to the back surface of the specimen, one on each region of the test
specimen, i.e., 2.25Cr-1Mo steel, middle of the graded transition region, and Alloy 800H to
monitor temperature gradients within +/- 1℃ during creep tests. Speckle patterned test specimens
were clamped and heated inside the furnace to the test temperature of 625ºC at a heating rate of
150ºC/hr. A small tensile pre-load of 8lbs was applied during heating time period to avoid any
buckling of the test samples due to thermal expansion. After 1 hour of soak time at 625℃, test
stress of 50MPa was applied. At the onset of stress application, the VIC-Snap® software was
programmed to capture images of the speckled gauge surface at every 5.25-minute interval
throughout the entire duration of test. While the VIC-Snap® software was periodically collecting
images of speckled sample surface during creep deformation, collected images were parallelly
imported to VIC-3D® software to determine creep strain (eyy) distribution in the gauge surface
along the loading direction. DIC image capturing was stopped after about a month (~700 hours)
in all the creep tests, once the locally developed regions of strain concentration reached tertiary
stage of creep in the respective test specimens. However, all the test specimens were unloaded
after 1180h of creep test, to make an even comparison of the extension of creep damage in all the
crept samples.
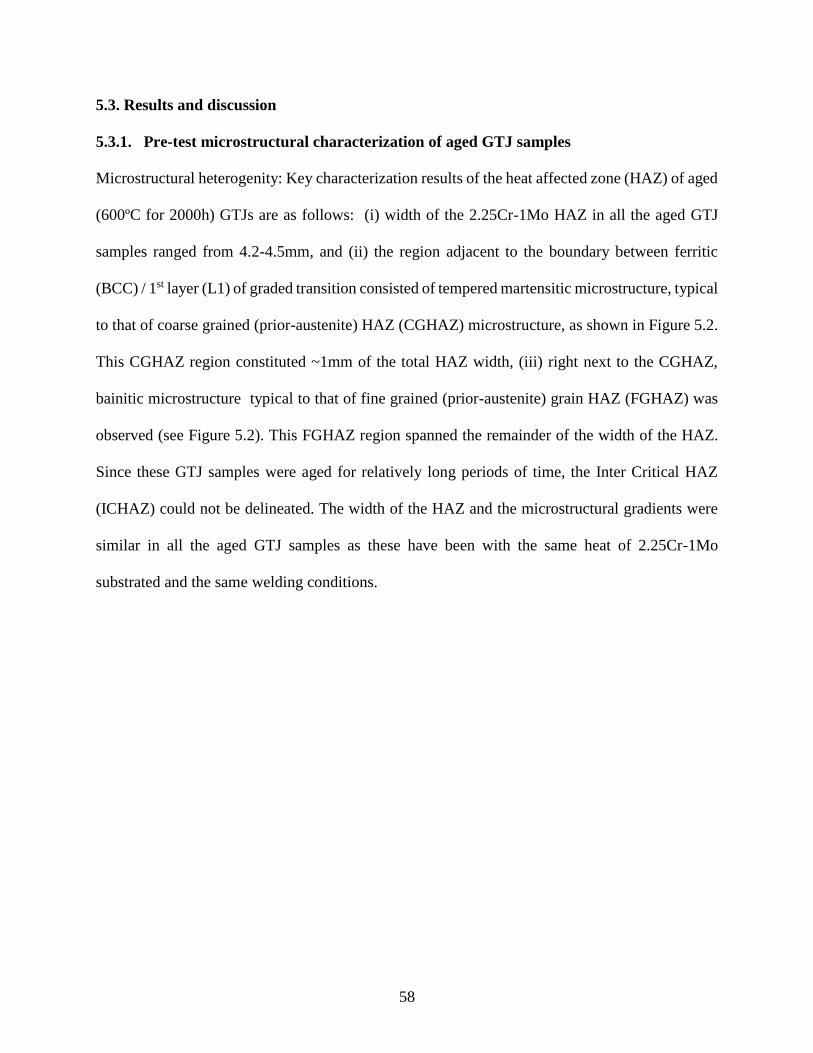
58
5.3. Results and discussion
5.3.1. Pre-test microstructural characterization of aged GTJ samples
Microstructural heterogenity: Key characterization results of the heat affected zone (HAZ) of aged
(600ºC for 2000h) GTJs are as follows: (i) width of the 2.25Cr-1Mo HAZ in all the aged GTJ
samples ranged from 4.2-4.5mm, and (ii) the region adjacent to the boundary between ferritic
(BCC) / 1st layer (L1) of graded transition consisted of tempered martensitic microstructure, typical
to that of coarse grained (prior-austenite) HAZ (CGHAZ) microstructure, as shown in Figure 5.2.
This CGHAZ region constituted ~1mm of the total HAZ width, (iii) right next to the CGHAZ,
bainitic microstructure typical to that of fine grained (prior-austenite) grain HAZ (FGHAZ) was
observed (see Figure 5.2). This FGHAZ region spanned the remainder of the width of the HAZ.
Since these GTJ samples were aged for relatively long periods of time, the Inter Critical HAZ
(ICHAZ) could not be delineated. The width of the HAZ and the microstructural gradients were
similar in all the aged GTJ samples as these have been with the same heat of 2.25Cr-1Mo
substrated and the same welding conditions.
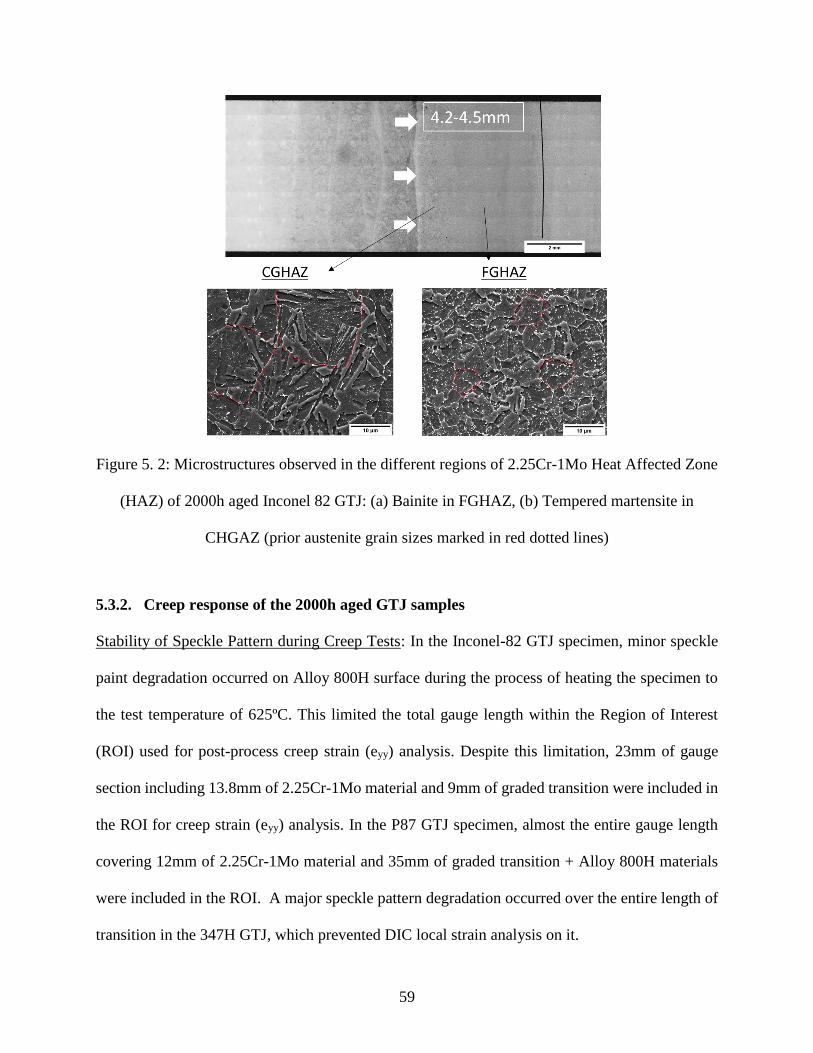
59
Figure 5. 2: Microstructures observed in the different regions of 2.25Cr-1Mo Heat Affected Zone
(HAZ) of 2000h aged Inconel 82 GTJ: (a) Bainite in FGHAZ, (b) Tempered martensite in
CHGAZ (prior austenite grain sizes marked in red dotted lines)
5.3.2. Creep response of the 2000h aged GTJ samples
Stability of Speckle Pattern during Creep Tests: In the Inconel-82 GTJ specimen, minor speckle
paint degradation occurred on Alloy 800H surface during the process of heating the specimen to
the test temperature of 625ºC. This limited the total gauge length within the Region of Interest
(ROI) used for post-process creep strain (eyy) analysis. Despite this limitation, 23mm of gauge
section including 13.8mm of 2.25Cr-1Mo material and 9mm of graded transition were included in
the ROI for creep strain (eyy) analysis. In the P87 GTJ specimen, almost the entire gauge length
covering 12mm of 2.25Cr-1Mo material and 35mm of graded transition + Alloy 800H materials
were included in the ROI. A major speckle pattern degradation occurred over the entire length of
transition in the 347H GTJ, which prevented DIC local strain analysis on it.
60
Global and Local Creep Strain Variations: Creep strain (eyy) evolution in different local regions,
as a function of test time (hr) for Inconel-82 GTJ and P87 GTJ specimens, are shown in figures
5.3(a) & (b), respectively. Similar to the creep response of 2000h aged DMW samples, creep
strain distribution in these 2000h aged GTJ samples, reveal a heterogeneous creep behavior. The
global creep strain (eyy_global) in these DMW samples is the resultant accumulated strain across four
discrete regions viz., 2.25Cr-1Mo base material, 2.25Cr-1Mo HAZ, BCC region of transition, and
Dual (mixture of BCC + FCC) + FCC regions of the transition and Nickel-base alloys (Inconel-82
+ Alloy 800H) within this heterogenous configuration. In both the aged samples, creep strain (eyy)
emanating from the local 2.25Cr-1Mo HAZ crept faster than the 2.25Cr-1Mo base material and
was driving the creep-rupture in these GTJ samples. The minimum creep strain rates in the regions
constituting Inconel-82 weld, Dual (mixture of BCC + FCC) + FCC regions of the transition were
negligible, for both the Inconel 82 and P87 GTJ samples. The minimum creep strain rates exhbited
in these regions were of the order of 10-7 hr-1 or less and remained in the steady state condition for
the entire test duration. Creep strain rate observed in the BCC region of graded transition was
much lesser to that observed to those in the 2.25Cr-1Mo base material and HAZ regions. All these
creep strain results in the graded transition layers were indeed expected based on the design
concepts of these transition layers in these GTJs [54].
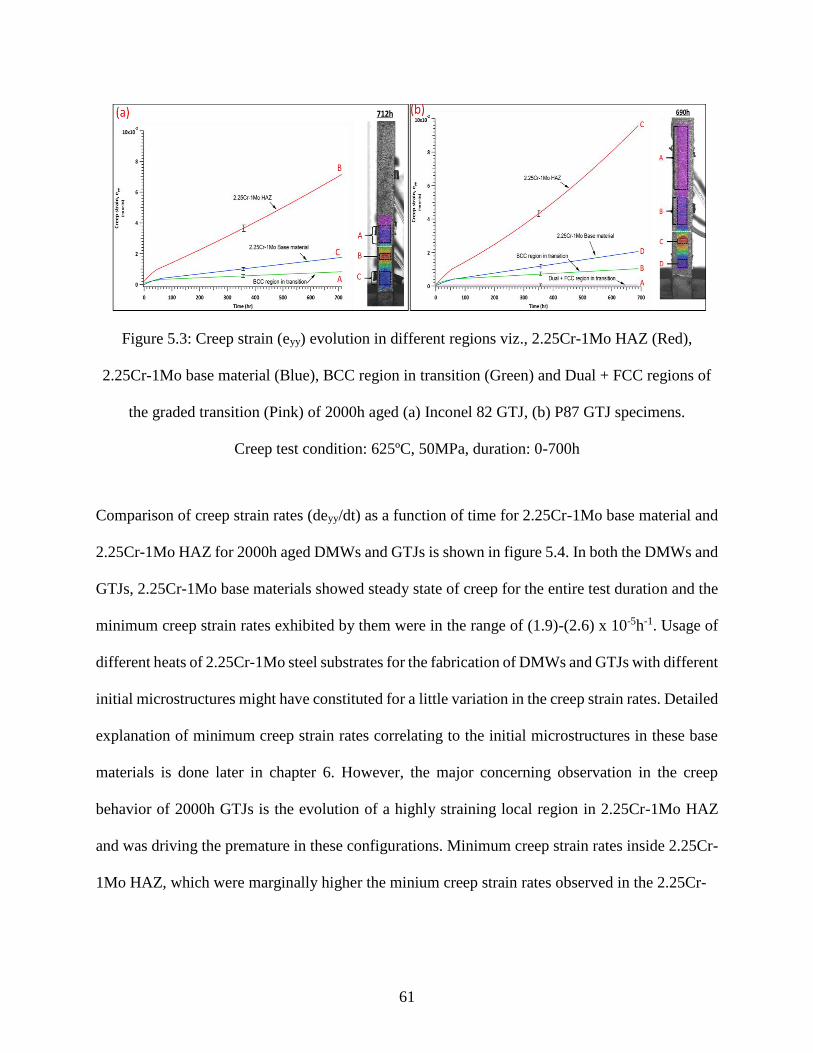
61
Figure 5.3: Creep strain (eyy) evolution in different regions viz., 2.25Cr-1Mo HAZ (Red),
2.25Cr-1Mo base material (Blue), BCC region in transition (Green) and Dual + FCC regions of
the graded transition (Pink) of 2000h aged (a) Inconel 82 GTJ, (b) P87 GTJ specimens.
Creep test condition: 625ºC, 50MPa, duration: 0-700h
Comparison of creep strain rates (deyy/dt) as a function of time for 2.25Cr-1Mo base material and
2.25Cr-1Mo HAZ for 2000h aged DMWs and GTJs is shown in figure 5.4. In both the DMWs and
GTJs, 2.25Cr-1Mo base materials showed steady state of creep for the entire test duration and the
minimum creep strain rates exhibited by them were in the range of (1.9)-(2.6) x 10-5h-1. Usage of
different heats of 2.25Cr-1Mo steel substrates for the fabrication of DMWs and GTJs with different
initial microstructures might have constituted for a little variation in the creep strain rates. Detailed
explanation of minimum creep strain rates correlating to the initial microstructures in these base
materials is done later in chapter 6. However, the major concerning observation in the creep
behavior of 2000h GTJs is the evolution of a highly straining local region in 2.25Cr-1Mo HAZ
and was driving the premature in these configurations. Minimum creep strain rates inside 2.25Cr-
1Mo HAZ, which were marginally higher the minium creep strain rates observed in the 2.25Cr-
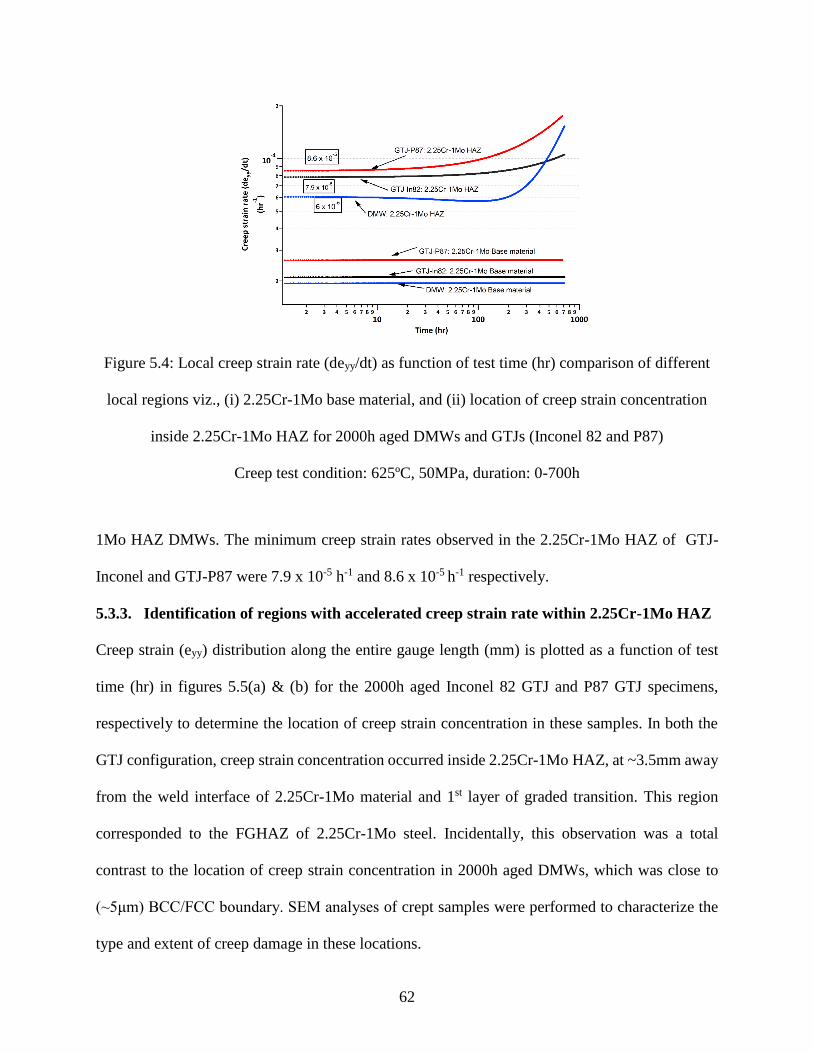
62
Figure 5.4: Local creep strain rate (deyy/dt) as function of test time (hr) comparison of different
local regions viz., (i) 2.25Cr-1Mo base material, and (ii) location of creep strain concentration
inside 2.25Cr-1Mo HAZ for 2000h aged DMWs and GTJs (Inconel 82 and P87)
Creep test condition: 625ºC, 50MPa, duration: 0-700h
1Mo HAZ DMWs. The minimum creep strain rates observed in the 2.25Cr-1Mo HAZ of GTJ-
Inconel and GTJ-P87 were 7.9 x 10⁻⁵ h-1 and 8.6 x 10⁻⁵ h-1 respectively.
5.3.3. Identification of regions with accelerated creep strain rate within 2.25Cr-1Mo HAZ
Creep strain (eyy) distribution along the entire gauge length (mm) is plotted as a function of test
time (hr) in figures 5.5(a) & (b) for the 2000h aged Inconel 82 GTJ and P87 GTJ specimens,
respectively to determine the location of creep strain concentration in these samples. In both the
GTJ configuration, creep strain concentration occurred inside 2.25Cr-1Mo HAZ, at ~3.5mm away
from the weld interface of 2.25Cr-1Mo material and 1st layer of graded transition. This region
corresponded to the FGHAZ of 2.25Cr-1Mo steel. Incidentally, this observation was a total
contrast to the location of creep strain concentration in 2000h aged DMWs, which was close to
(~5μm) BCC/FCC boundary. SEM analyses of crept samples were performed to characterize the
type and extent of creep damage in these locations.
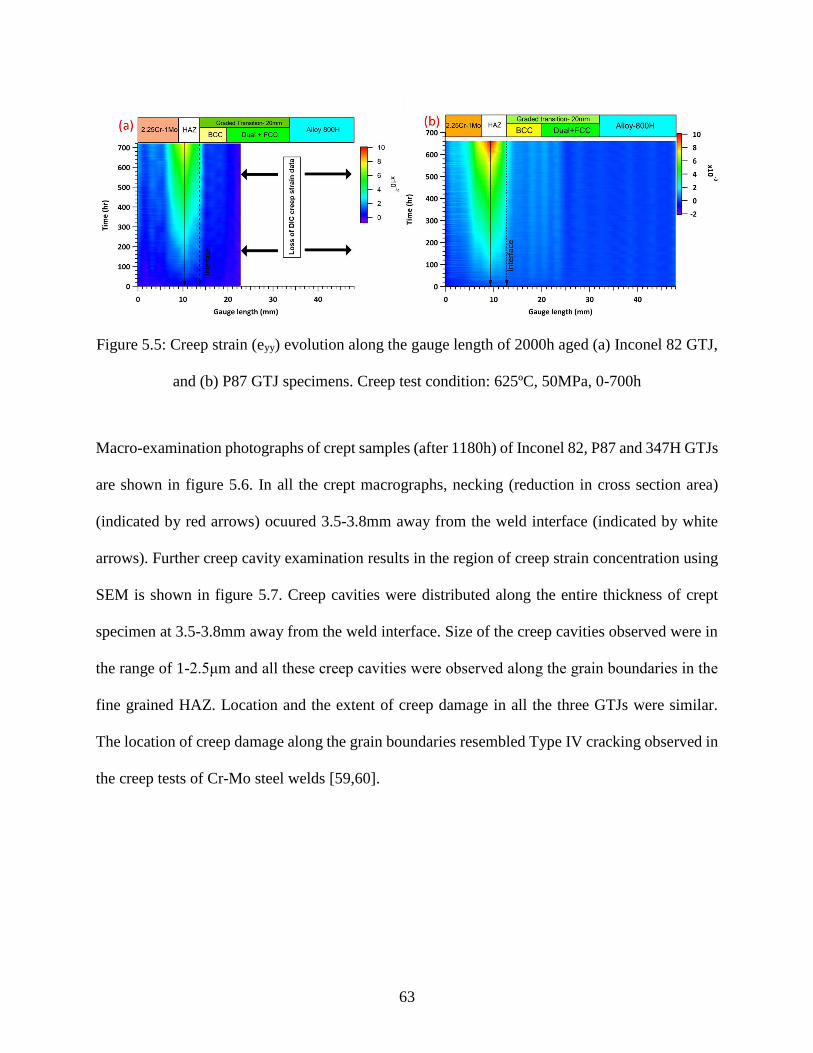
63
Figure 5.5: Creep strain (eyy) evolution along the gauge length of 2000h aged (a) Inconel 82 GTJ,
and (b) P87 GTJ specimens. Creep test condition: 625ºC, 50MPa, 0-700h
Macro-examination photographs of crept samples (after 1180h) of Inconel 82, P87 and 347H GTJs
are shown in figure 5.6. In all the crept macrographs, necking (reduction in cross section area)
(indicated by red arrows) ocuured 3.5-3.8mm away from the weld interface (indicated by white
arrows). Further creep cavity examination results in the region of creep strain concentration using
SEM is shown in figure 5.7. Creep cavities were distributed along the entire thickness of crept
specimen at 3.5-3.8mm away from the weld interface. Size of the creep cavities observed were in
the range of 1-2.5μm and all these creep cavities were observed along the grain boundaries in the
fine grained HAZ. Location and the extent of creep damage in all the three GTJs were similar.
The location of creep damage along the grain boundaries resembled Type IV cracking observed in
the creep tests of Cr-Mo steel welds [59,60].
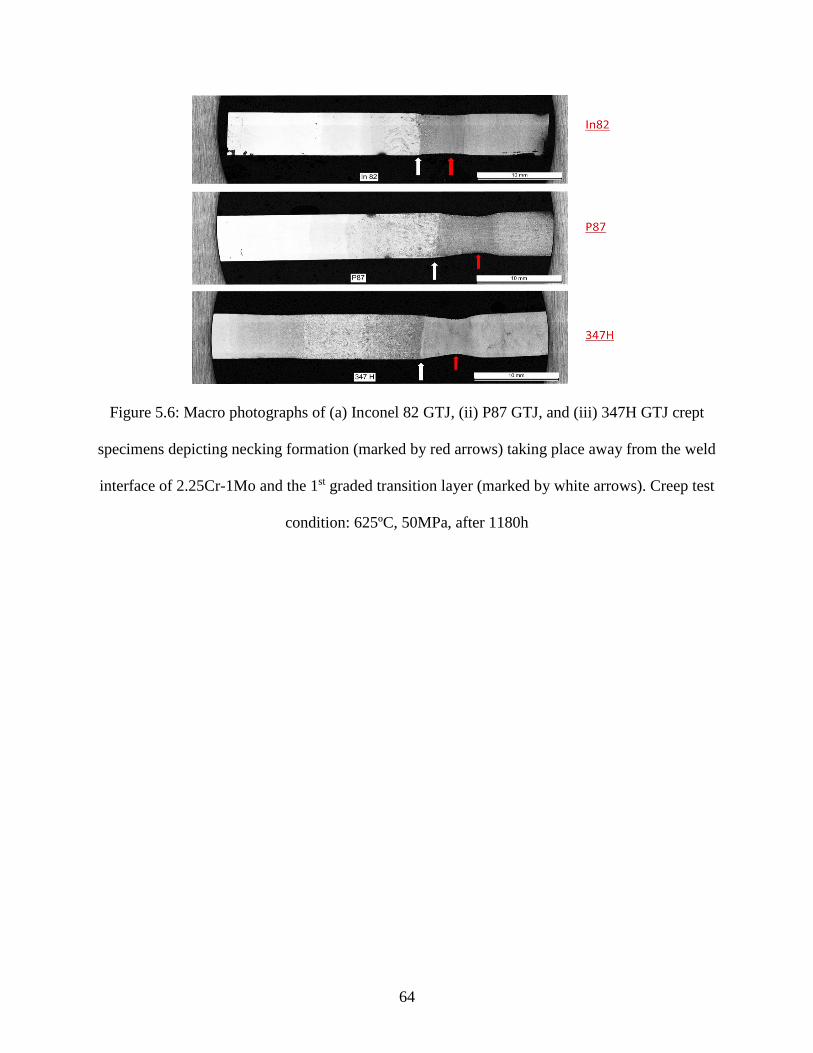
64
Figure 5.6: Macro photographs of (a) Inconel 82 GTJ, (ii) P87 GTJ, and (iii) 347H GTJ crept
specimens depicting necking formation (marked by red arrows) taking place away from the weld
interface of 2.25Cr-1Mo and the 1st graded transition layer (marked by white arrows). Creep test
condition: 625ºC, 50MPa, after 1180h
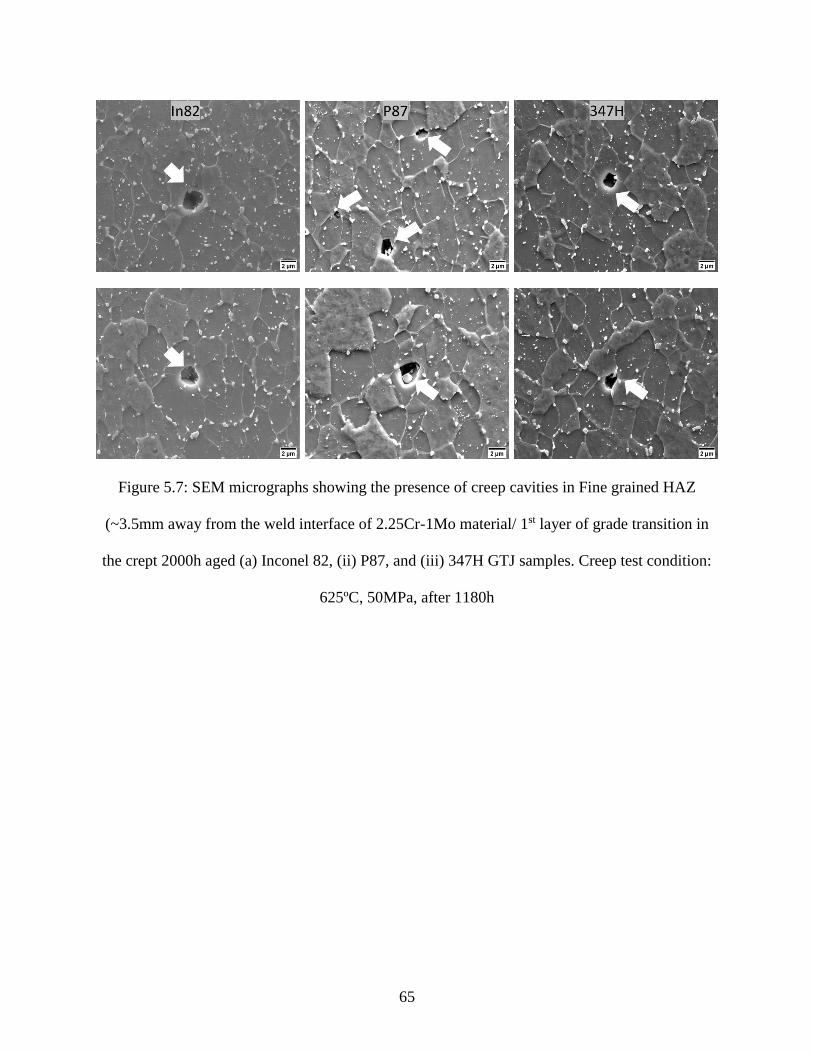
65
Figure 5.7: SEM micrographs showing the presence of creep cavities in Fine grained HAZ
(~3.5mm away from the weld interface of 2.25Cr-1Mo material/ 1st layer of grade transition in
the crept 2000h aged (a) Inconel 82, (ii) P87, and (iii) 347H GTJ samples. Creep test condition:
625ºC, 50MPa, after 1180h
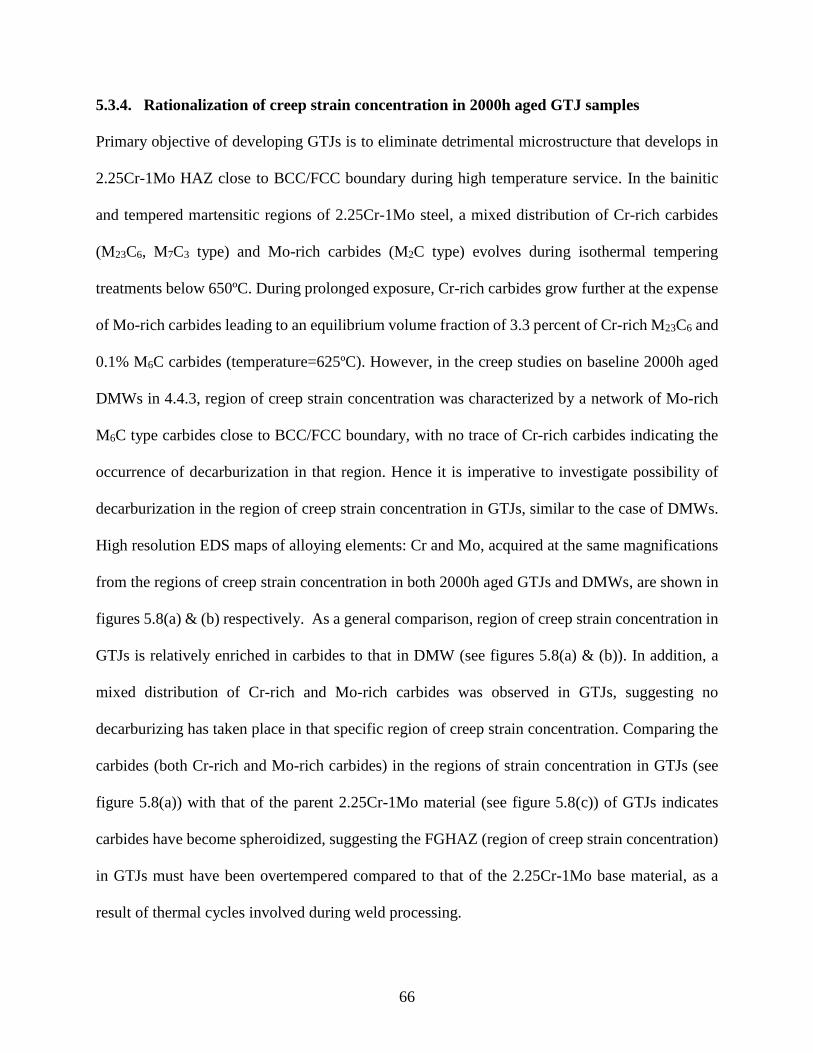
66
5.3.4. Rationalization of creep strain concentration in 2000h aged GTJ samples
Primary objective of developing GTJs is to eliminate detrimental microstructure that develops in
2.25Cr-1Mo HAZ close to BCC/FCC boundary during high temperature service. In the bainitic
and tempered martensitic regions of 2.25Cr-1Mo steel, a mixed distribution of Cr-rich carbides
(M23C6, M7C3 type) and Mo-rich carbides (M2C type) evolves during isothermal tempering
treatments below 650ºC. During prolonged exposure, Cr-rich carbides grow further at the expense
of Mo-rich carbides leading to an equilibrium volume fraction of 3.3 percent of Cr-rich M23C6 and
0.1% M6C carbides (temperature=625ºC). However, in the creep studies on baseline 2000h aged
DMWs in 4.4.3, region of creep strain concentration was characterized by a network of Mo-rich
M6C type carbides close to BCC/FCC boundary, with no trace of Cr-rich carbides indicating the
occurrence of decarburization in that region. Hence it is imperative to investigate possibility of
decarburization in the region of creep strain concentration in GTJs, similar to the case of DMWs.
High resolution EDS maps of alloying elements: Cr and Mo, acquired at the same magnifications
from the regions of creep strain concentration in both 2000h aged GTJs and DMWs, are shown in
figures 5.8(a) & (b) respectively. As a general comparison, region of creep strain concentration in
GTJs is relatively enriched in carbides to that in DMW (see figures 5.8(a) & (b)). In addition, a
mixed distribution of Cr-rich and Mo-rich carbides was observed in GTJs, suggesting no
decarburizing has taken place in that specific region of creep strain concentration. Comparing the
carbides (both Cr-rich and Mo-rich carbides) in the regions of strain concentration in GTJs (see
figure 5.8(a)) with that of the parent 2.25Cr-1Mo material (see figure 5.8(c)) of GTJs indicates
carbides have become spheroidized, suggesting the FGHAZ (region of creep strain concentration)
in GTJs must have been overtempered compared to that of the 2.25Cr-1Mo base material, as a
result of thermal cycles involved during weld processing.
67
Figure 5.8: Comparison of EDS maps of alloying elements: Chromium and Molybdenum in
2000h aged GTJs (a) Location of creep strain concentration (FGHAZ, 3.5mm away from the
weld interface, (c) parent 2.25Cr-1Mo material, and 2000h aged DMWs (b) Location of creep
strain concentration (~5μm away from BCC/FCC boundary) (before creep test)
68
5.4. Summary
Functionally Graded Transition Joints (GTJs) were fabricated with three different filler metals viz.,
Inconel 82, P87 and 347H (chemical analyses of GTJs shared in the appendix section) with a
graded transition length of 20mm with an objective to overcome premature creep failure in
conventional DMWs. Creep tests were carried out on the aged (600ºC for 2000h) samples of these
GTJs in a test condition of 625ºC, 50MPa, to make an even comparison with the creep strain results
of conventional DMWs tested in the same conditions. Key research findings from these studies
are summarized as follows:
Similar to the creep results of DMWs, all the three GTJs exhibited a heterogenous creep
behavior. Four distinct regions of creep strain evolution such as 2.25Cr-1Mo base material,
2.25Cr-1Mo HAZ, BCC region of graded transition and Dual (mixture of BCC + FCC) +
FCC region of graded transition were observed.
Creep strain was accumulating in the 2.25Cr-1Mo FGHAZ, at 3.5mm away from the weld
interface and driving these premature of these GTJ configurations. Creep cavities in the
size of 1-2.5μm were observed along the grain boundaries of FGHAZ and the damage was
consistent along the entire specimen thickness.
Acquired EDS maps of Cr and Mo alloying from the region of creep strain concentration
in GTJs (before creep test) didn’t show carbide distributions similar to that in the
decarburized regions of DMWs. However, carbides in FGHAZ appear to have coarsened
in comparison to the carbides in the parent 2.25Cr-1Mo material region, suggesting a Type
IV weld failure mechanism in Cr-Mo steel welds.
69
Chapter 6
Phenomenological creep model of Dissimilar Metal Welds (DMWs) involving ferritic
Cr-Mo steels
6.1. Introduction
In the previous two chapters (Chapters 4-5), creep tests were performed on the aged (600ºC for
2000h) samples of both Dissimilar Metal Welds (DMWs) and Graded Transition Joints (GTJs) to
extract local creep constitutive properties of such heterogeneous weld configurations. Key research
findings from these creep studies can be summarized (see Figure 6.1) as follows:
I. Both the welded configurations exhibited creep strain accumulation inside 2.25Cr-1Mo
heat affected zone (HAZ) and crept at strain rates higher than those of the respective
2.25Cr-1Mo base materials,
II. All the other local regions of transition and Ni-base parent materials showed negligible
creep strain rates in comparison to these microstructurally distinct regions in 2.25Cr-1Mo
material.
Hence in this chapter, attempts have been made to develop a creep model framework to predict the
heterogeneous creep strain rates observed in the different regions of 2.25Cr-1Mo steel.
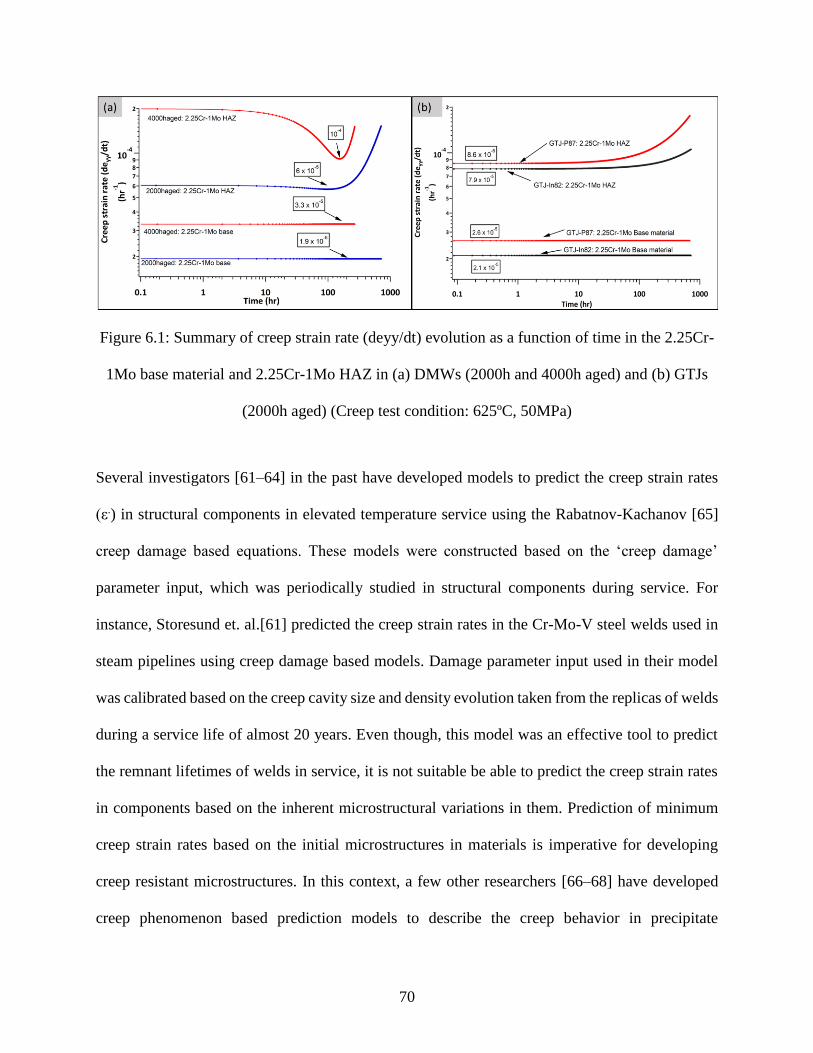
70
Figure 6.1: Summary of creep strain rate (deyy/dt) evolution as a function of time in the 2.25Cr-
1Mo base material and 2.25Cr-1Mo HAZ in (a) DMWs (2000h and 4000h aged) and (b) GTJs
(2000h aged) (Creep test condition: 625ºC, 50MPa)
Several investigators [61–64] in the past have developed models to predict the creep strain rates
(ε.) in structural components in elevated temperature service using the Rabatnov-Kachanov [65]
creep damage based equations. These models were constructed based on the ‘creep damage’
parameter input, which was periodically studied in structural components during service. For
instance, Storesund et. al.[61] predicted the creep strain rates in the Cr-Mo-V steel welds used in
steam pipelines using creep damage based models. Damage parameter input used in their model
was calibrated based on the creep cavity size and density evolution taken from the replicas of welds
during a service life of almost 20 years. Even though, this model was an effective tool to predict
the remnant lifetimes of welds in service, it is not suitable be able to predict the creep strain rates
in components based on the inherent microstructural variations in them. Prediction of minimum
creep strain rates based on the initial microstructures in materials is imperative for developing
creep resistant microstructures. In this context, a few other researchers [66–68] have developed
creep phenomenon based prediction models to describe the creep behavior in precipitate
71
strengthened alloy systems like modified 9Cr steels and Fe-30Cr-Al alloys. For instance, Shassere
et. al. [67] extended the well-established Bird-Mukherjee-Dorn (BMD) creep equation [69] by
incorporating the threshold stress concept to theoretically predict the minimum creep strain rates
in the modified 9Cr steel, strengthened by a fine distribution of MX precipitates inside the BCC
grains. A similar BMD creep equations-based modeling frame work was developed in this chapter
to predict the minimum creep strain rates, depending on the initial carbide sizes and distributions
in the different regions of strain evolution in 2.25Cr-1Mo steel.
6.2. Experimental procedure
Microstructural characterization was performed using scanning electron microscopy (SEM)
technique to determine the initial (before creep) microstructures in the aged (600℃ for 2000h)
DMW (600℃ for 2000h and 4000h) and GTJ (600℃ for 2000h) samples. Characterization was
restricted to the two discrete regions of creep strain evolution during the creep test viz., 2.25Cr-
1Mo base material and the specific locations of creep strain concentration (5μm away from
BCC/FCC boundary in the 2000h aged DMW, 400μm away from BCC/FCC boundary in the
4000h aged DMW and 3.5mm away from the weld interface of 2.25Cr-1Mo material and the first
layer of graded transition in all the 2000h aged GTJs) inside 2.25Cr-1Mo heat affected zone
(HAZ), in both these sample configurations. Scanning electron miscrsocopy (SEM) analyses were
performed using JEOL 6500 SEM equipped with both secondary electron (SE) and backscattered
electron (BSE) detectors, with an accelerated beam voltage of 20kV was used. Samples for SEM
were prepared by grinding through 1200-grit SiC grit papers, followed by diamond polishing in
3μm and 1μm suspensions. For the purpose of carbide characterization in these 2.25Cr-1Mo
regions, the polished DMW and GTJ samples were immersion etched in a freshly prepared 2%
Nital solution for a minute. All the samples were etched for the exact same amount of time to
72
maintain consistent etching depths in all these samples. To obtain a good statistics of carbide sizes
and distribution in different 2.25Cr-1Mo regions, SEM images were obtained at 5 locations starting
from the top to bottom along the thickness of these samples. The greyscale images were imported
to ImageJ® software to determine the following details: (i) average carbide particle radius (<r>),
and (ii) average interparticle distance (<λ>) between particles in all the regions of interest. These
particle analyses were performed after binary thresholding to delineate carbide particles from
2.25Cr-1Mo ferritic matrix background. Carbide particle size calculation was perfomed using
circularity values ranging from 0 (linear) to 1 (perfectly circular) to accommodate varying shapes
of carbide particles. Determined particle size values (in square units) were used to calculate
equivalent carbide particle radius (r), so as to make an even comparison with the carbide particles
of varying shapes. Average interparticle distance (λ) between particles, in a specific region of
carbide particle distribution, was determined by calculating the average value of the entire set of
nearest neighbor distances from the centroids of each and every particle in that region. This analyis
is based on the in-built algorithm in ImageJ® software developed by Y. Mao [70]. Microhardness
measurements were made on specific locations of mixed microstructure in 2.25Cr-1Mo parent
material of 2000h aged DMW to identify the difference in phases using LECO TM103D
microhardness tester. Microhardness indentation was carried out using a load of 50g diamond
indenter for a dwell time of 20μs.
6.3. Results and discussion
6.3.1. Initial microstructure (before creep) distribution in aged DMWs
DMW base materials: The parent 2.25Cr-1Mo material used for DMW fabrication consisted of a
mixed microstructure of coarse-grained bainitic (αb) and relatively fine-grained ferritic (α) regions
in both the 2000h aged and 4000h aged conditions as shown in Figures 6.2 & 6.3 respectively.
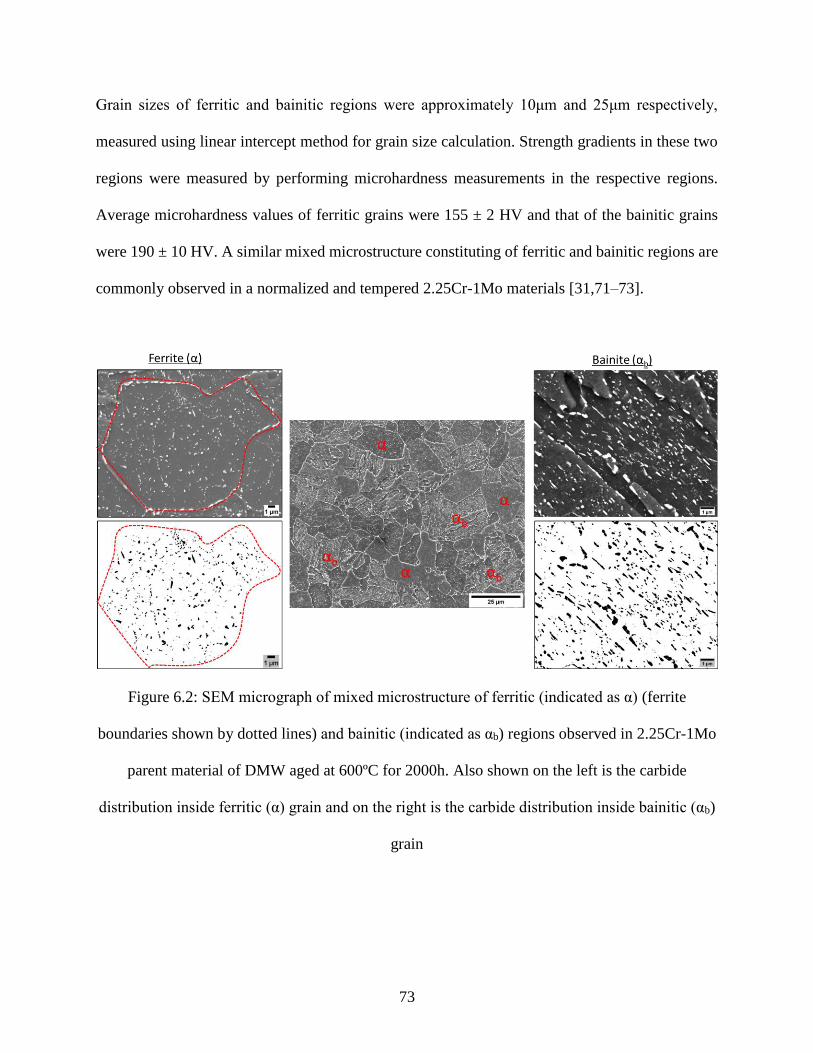
73
Grain sizes of ferritic and bainitic regions were approximately 10μm and 25μm respectively,
measured using linear intercept method for grain size calculation. Strength gradients in these two
regions were measured by performing microhardness measurements in the respective regions.
Average microhardness values of ferritic grains were 155 ± 2 HV and that of the bainitic grains
were 190 ± 10 HV. A similar mixed microstructure constituting of ferritic and bainitic regions are
commonly observed in a normalized and tempered 2.25Cr-1Mo materials [31,71–73].
Figure 6.2: SEM micrograph of mixed microstructure of ferritic (indicated as α) (ferrite
boundaries shown by dotted lines) and bainitic (indicated as αb) regions observed in 2.25Cr-1Mo
parent material of DMW aged at 600ºC for 2000h. Also shown on the left is the carbide
distribution inside ferritic (α) grain and on the right is the carbide distribution inside bainitic (αb)
grain

74
Figure 6.3: SEM micrograph of mixed microstructure of ferritic (indicated as α) (ferrite
boundaries shown by dotted lines) and bainitic (indicated as αb) regions observed in 2.25Cr-1Mo
parent material of DMW aged at 600ºC for 4000h. Also shown on the left is the carbide
distribution inside ferritic (α) grain and on the right is the carbide distribution inside bainitic (αb)
grain
Table 6.1: Results of carbide particle radius (r), and interparticle distance between carbides
particles (λ) analyses in the 2.25Cr-1Mo base materials of 2000h aged and 4000h aged DMWs
Microstructural
region
Average particle
radius,
<r> (nm)
Average Interparticle
distance,
<λ> (nm)
Average Orowan-
Asbhy bowing stress,
<σO-A> (MPa)
Ferrite 58 ± 44 320 ± 46 89
Bainite 59 ± 44 203 ± 8 140.4
Ferrite 58 ± 45 334 ± 55 85.3
Bainite 57 ± 40 246 ± 12 115.7
2000h aged
4000h aged
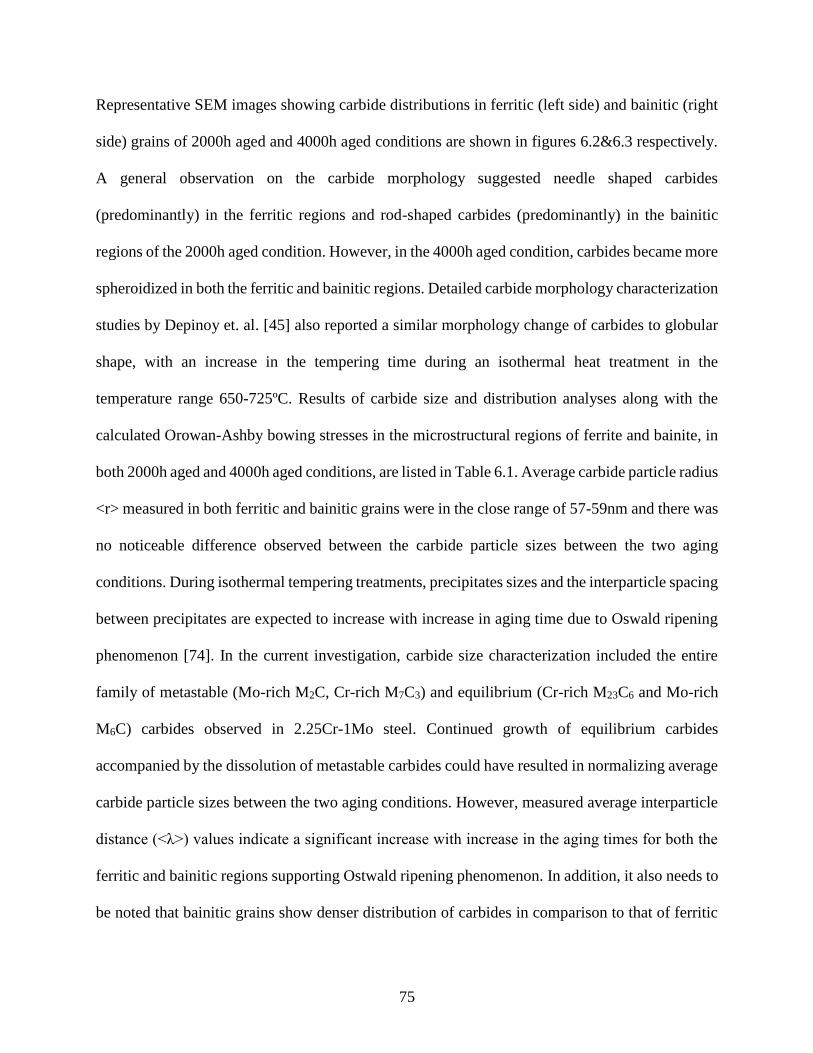
75
Representative SEM images showing carbide distributions in ferritic (left side) and bainitic (right
side) grains of 2000h aged and 4000h aged conditions are shown in figures 6.2&6.3 respectively.
A general observation on the carbide morphology suggested needle shaped carbides
(predominantly) in the ferritic regions and rod-shaped carbides (predominantly) in the bainitic
regions of the 2000h aged condition. However, in the 4000h aged condition, carbides became more
spheroidized in both the ferritic and bainitic regions. Detailed carbide morphology characterization
studies by Depinoy et. al. [45] also reported a similar morphology change of carbides to globular
shape, with an increase in the tempering time during an isothermal heat treatment in the
temperature range 650-725ºC. Results of carbide size and distribution analyses along with the
calculated Orowan-Ashby bowing stresses in the microstructural regions of ferrite and bainite, in
both 2000h aged and 4000h aged conditions, are listed in Table 6.1. Average carbide particle radius
<r> measured in both ferritic and bainitic grains were in the close range of 57-59nm and there was
no noticeable difference observed between the carbide particle sizes between the two aging
conditions. During isothermal tempering treatments, precipitates sizes and the interparticle spacing
between precipitates are expected to increase with increase in aging time due to Oswald ripening
phenomenon [74]. In the current investigation, carbide size characterization included the entire
family of metastable (Mo-rich M2C, Cr-rich M7C3) and equilibrium (Cr-rich M23C6 and Mo-rich
M6C) carbides observed in 2.25Cr-1Mo steel. Continued growth of equilibrium carbides
accompanied by the dissolution of metastable carbides could have resulted in normalizing average
carbide particle sizes between the two aging conditions. However, measured average interparticle
distance (<λ>) values indicate a significant increase with increase in the aging times for both the
ferritic and bainitic regions supporting Ostwald ripening phenomenon. In addition, it also needs to
be noted that bainitic grains show denser distribution of carbides in comparison to that of ferritic
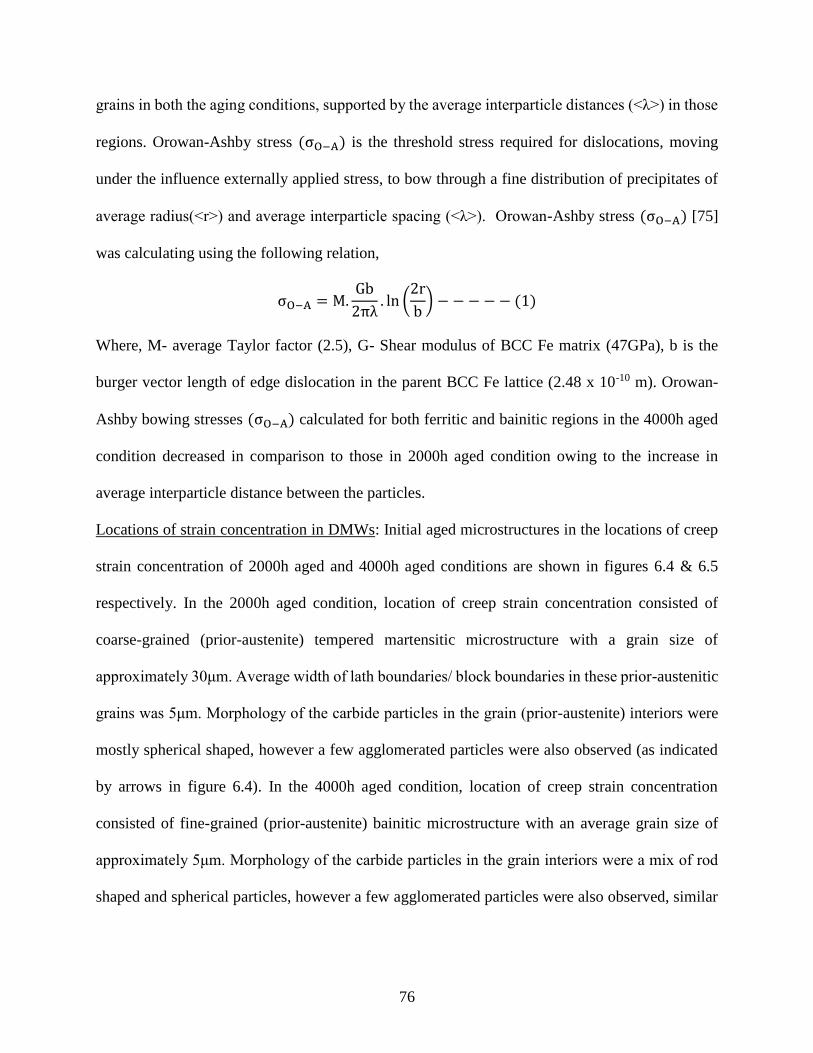
76
grains in both the aging conditions, supported by the average interparticle distances (<λ>) in those
regions. Orowan-Ashby stress (σO−A) is the threshold stress required for dislocations, moving
under the influence externally applied stress, to bow through a fine distribution of precipitates of
average radius(<r>) and average interparticle spacing (<λ>). Orowan-Ashby stress (σO−A) [75]
was calculating using the following relation,
σO−A = M.Gb
2πλ. ln (
2r
b) − − − − − (1)
Where, M- average Taylor factor (2.5), G- Shear modulus of BCC Fe matrix (47GPa), b is the
burger vector length of edge dislocation in the parent BCC Fe lattice (2.48 x 10⁻¹⁰ m). Orowan-
Ashby bowing stresses (σO−A) calculated for both ferritic and bainitic regions in the 4000h aged
condition decreased in comparison to those in 2000h aged condition owing to the increase in
average interparticle distance between the particles.
Locations of strain concentration in DMWs: Initial aged microstructures in the locations of creep
strain concentration of 2000h aged and 4000h aged conditions are shown in figures 6.4 & 6.5
respectively. In the 2000h aged condition, location of creep strain concentration consisted of
coarse-grained (prior-austenite) tempered martensitic microstructure with a grain size of
approximately 30μm. Average width of lath boundaries/ block boundaries in these prior-austenitic
grains was 5μm. Morphology of the carbide particles in the grain (prior-austenite) interiors were
mostly spherical shaped, however a few agglomerated particles were also observed (as indicated
by arrows in figure 6.4). In the 4000h aged condition, location of creep strain concentration
consisted of fine-grained (prior-austenite) bainitic microstructure with an average grain size of
approximately 5μm. Morphology of the carbide particles in the grain interiors were a mix of rod
shaped and spherical particles, however a few agglomerated particles were also observed, similar

77
to the location of creep strain concentration in 2000h aged condition (as indicated by arrows in
figure 6.5).
Results of carbide size and distribution analyses along with the calculated Orowan-Ashby bowing
stresses in the locations of creep strain concentration, in both the 2000h aged and 4000h aged
conditions, are listed in Table 6.2. Average carbide particle radius (<r>) observed in the 2000h
aged and 4000h aged conditions were 105nm and 84nm respectively. These observed carbide
particle sizes are significantly larger than those observed in both the ferritic and bainitic regions
of the respective 2.25Cr-1Mo base materials. Similarly, measured average interparticle distance
between carbide particles in these locations of creep strain concentration were 1024mm and 557nm
respectively, approximately 2-3 times more than those observed in the respective base materials.
Calculated Orowan-Asbhy bowing stress (σO−A) in the location of creep strain concentration in
the 2000h and 4000h aged conditions are 30.5MPa and 54.2MPa respectively. In comparison to
the applied stress of 50MPa, Orowan-Asbhy bowing stress (σO−A) was marginally higher in the
4000h aged condition, while it was much lower in the 2000h aged condition.
78
Figure 6.4: Representative SEM micrograph revealing carbide distribution in the tempered
martensite microstructure (prior-austenite grain boundary indicated by dotted lines) in the
location of creep strain concentration (~5μm away from BCC/FCC boundary in 2.25Cr-1Mo
HAZ) in DMW aged at 600ºC for 2000h.
79
Figure 6.5: Representative SEM micrograph showing carbide distribution in the bainitic
microstructure (prior-austenite grain boundary indicated by dotted lines) in the location of creep
strain concentration (~400μm away from BCC/FCC boundary in 2.25Cr-1Mo HAZ) in DMW
aged at 600ºC for 4000h.
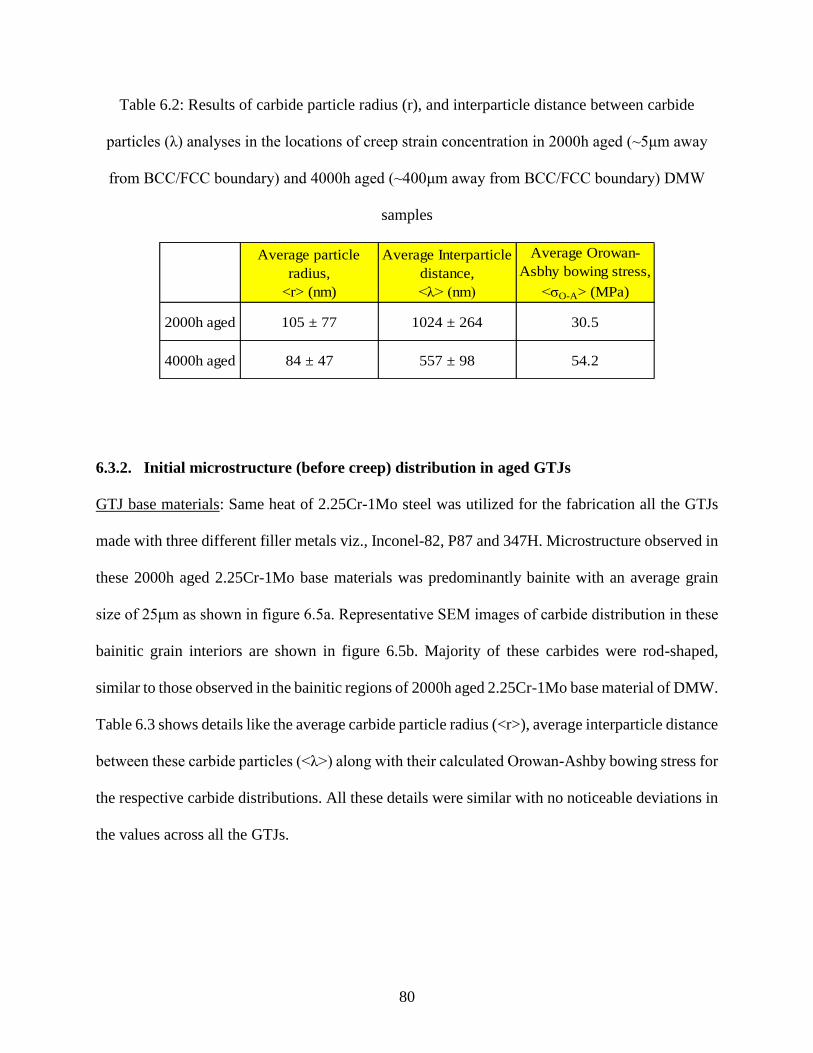
80
Table 6.2: Results of carbide particle radius (r), and interparticle distance between carbide
particles (λ) analyses in the locations of creep strain concentration in 2000h aged (~5μm away
from BCC/FCC boundary) and 4000h aged (~400μm away from BCC/FCC boundary) DMW
samples
6.3.2. Initial microstructure (before creep) distribution in aged GTJs
GTJ base materials: Same heat of 2.25Cr-1Mo steel was utilized for the fabrication all the GTJs
made with three different filler metals viz., Inconel-82, P87 and 347H. Microstructure observed in
these 2000h aged 2.25Cr-1Mo base materials was predominantly bainite with an average grain
size of 25μm as shown in figure 6.5a. Representative SEM images of carbide distribution in these
bainitic grain interiors are shown in figure 6.5b. Majority of these carbides were rod-shaped,
similar to those observed in the bainitic regions of 2000h aged 2.25Cr-1Mo base material of DMW.
Table 6.3 shows details like the average carbide particle radius (<r>), average interparticle distance
between these carbide particles (<λ>) along with their calculated Orowan-Ashby bowing stress for
the respective carbide distributions. All these details were similar with no noticeable deviations in
the values across all the GTJs.
Average particle
radius,
<r> (nm)
Average Interparticle
distance,
<λ> (nm)
Average Orowan-
Asbhy bowing stress,
<σO-A> (MPa)
2000h aged 105 ± 77 1024 ± 264 30.5
4000h aged 84 ± 47 557 ± 98 54.2
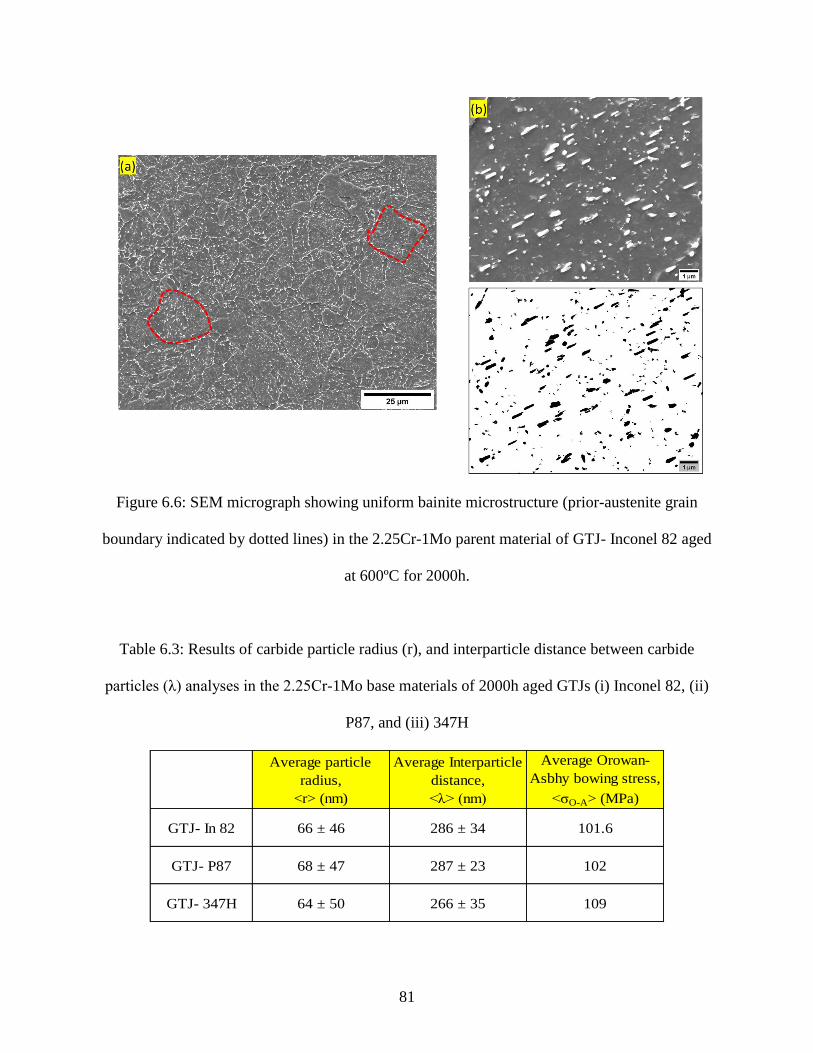
81
Figure 6.6: SEM micrograph showing uniform bainite microstructure (prior-austenite grain
boundary indicated by dotted lines) in the 2.25Cr-1Mo parent material of GTJ- Inconel 82 aged
at 600ºC for 2000h.
Table 6.3: Results of carbide particle radius (r), and interparticle distance between carbide
particles (λ) analyses in the 2.25Cr-1Mo base materials of 2000h aged GTJs (i) Inconel 82, (ii)
P87, and (iii) 347H
Average particle
radius,
<r> (nm)
Average Interparticle
distance,
<λ> (nm)
Average Orowan-
Asbhy bowing stress,
<σO-A> (MPa)
GTJ- In 82 66 ± 46 286 ± 34 101.6
GTJ- P87 68 ± 47 287 ± 23 102
GTJ- 347H 64 ± 50 266 ± 35 109
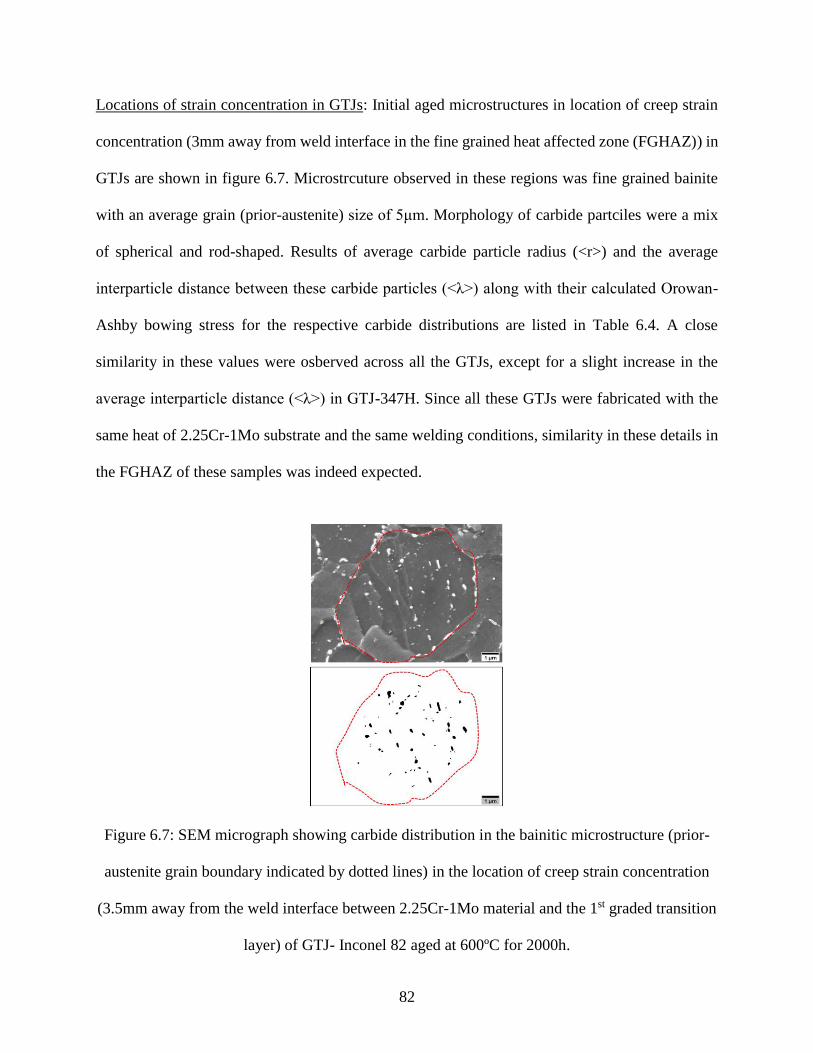
82
Locations of strain concentration in GTJs: Initial aged microstructures in location of creep strain
concentration (3mm away from weld interface in the fine grained heat affected zone (FGHAZ)) in
GTJs are shown in figure 6.7. Microstrcuture observed in these regions was fine grained bainite
with an average grain (prior-austenite) size of 5μm. Morphology of carbide partciles were a mix
of spherical and rod-shaped. Results of average carbide particle radius (<r>) and the average
interparticle distance between these carbide particles (<λ>) along with their calculated Orowan-
Ashby bowing stress for the respective carbide distributions are listed in Table 6.4. A close
similarity in these values were osberved across all the GTJs, except for a slight increase in the
average interparticle distance (<λ>) in GTJ-347H. Since all these GTJs were fabricated with the
same heat of 2.25Cr-1Mo substrate and the same welding conditions, similarity in these details in
the FGHAZ of these samples was indeed expected.
Figure 6.7: SEM micrograph showing carbide distribution in the bainitic microstructure (prior-
austenite grain boundary indicated by dotted lines) in the location of creep strain concentration
(3.5mm away from the weld interface between 2.25Cr-1Mo material and the 1st graded transition
layer) of GTJ- Inconel 82 aged at 600ºC for 2000h.
83
Table 6.4: Results of carbide particle radius (r), and interparticle distance between carbide
particles (λ) analyses in the bainitic regions at 3.5mm away from the weld interface (location of
creep strain concentration)
6.3.3. Phenomenological creep model framework based on modified BMD equation
Shrestha et. al [66] and Shassere et. al [67] have articulated the phenomenological creep behavior
of precipitate strengthened modified-9Cr steels utilizing a dislocation-climb controlled Bird-
Mukherjee-Dorn (BMD) constitutive creep equation as follows:
εm. .K.T
D.E= ADis. (
σ−σTh
E)
n
---------- (2)
where ADis is the dimensionless constant correspoding to discloation climb based creep
mechanism, K is Boltzmann’s constant (m2.Kg. s-2.K-1), T is the absolute test temperature (Kelvin),
n is the stress exponent usually in the range of 4-5 for dislocation climb controlled creep, b is the
burger vector length of edge dislocation in the parent BCC Fe lattice, E is the elastic modulus of
parent BCC Fe matrix at the test temperature, σTh is the threshold stress required for mobile edge
dislocations to overcome a fine dispersion of precipitates, D is the diffsuion coefficient of BCC
pure Fe matrix calculated using the following relation,
D = D0 exp (−Q
R.T)---------(3)
Average particle
radius,
<r> (nm)
Average Interparticle
distance,
<λ> (nm)
Average Orowan-
Asbhy bowing stress,
<σO-A> (MPa)
GTJ- In 82 67 ± 58 410 ± 55 71.22
GTJ- P87 52 ± 41 409 ± 61 68.4
GTJ- 347H 66 ± 44 546 ± 70 53.3
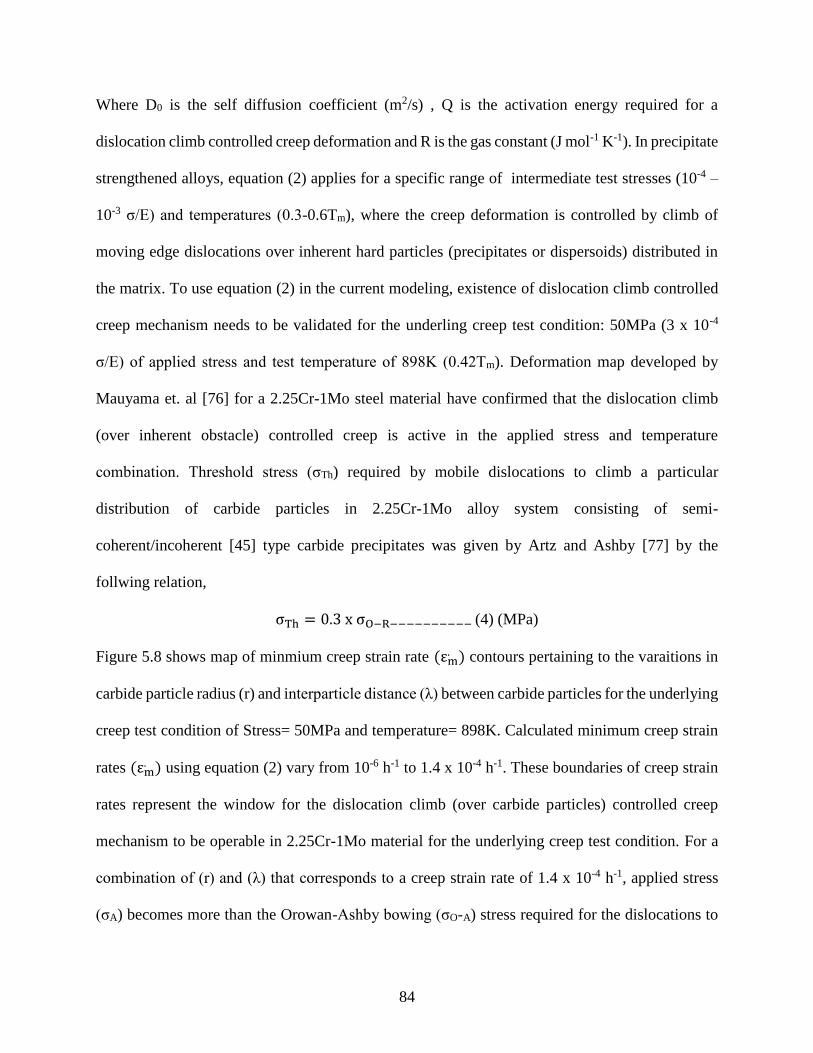
84
Where D0 is the self diffusion coefficient (m2/s) , Q is the activation energy required for a
dislocation climb controlled creep deformation and R is the gas constant (J mol-1 K-1). In precipitate
strengthened alloys, equation (2) applies for a specific range of intermediate test stresses (10-4 –
10-3 σ/E) and temperatures (0.3-0.6Tm), where the creep deformation is controlled by climb of
moving edge dislocations over inherent hard particles (precipitates or dispersoids) distributed in
the matrix. To use equation (2) in the current modeling, existence of dislocation climb controlled
creep mechanism needs to be validated for the underling creep test condition: 50MPa (3 x 10⁻⁴
σ/E) of applied stress and test temperature of 898K (0.42Tm). Deformation map developed by
Mauyama et. al [76] for a 2.25Cr-1Mo steel material have confirmed that the dislocation climb
(over inherent obstacle) controlled creep is active in the applied stress and temperature
combination. Threshold stress (σTh) required by mobile dislocations to climb a particular
distribution of carbide particles in 2.25Cr-1Mo alloy system consisting of semi-
coherent/incoherent [45] type carbide precipitates was given by Artz and Ashby [77] by the
follwing relation,
σTh = 0.3 x σO−R−−−−−−−−−− (4) (MPa)
Figure 5.8 shows map of minmium creep strain rate (εm. ) contours pertaining to the varaitions in
carbide particle radius (r) and interparticle distance (λ) between carbide particles for the underlying
creep test condition of Stress= 50MPa and temperature= 898K. Calculated minimum creep strain
rates (εm. ) using equation (2) vary from 10-6 h-1 to 1.4 x 10⁻⁴ h-1. These boundaries of creep strain
rates represent the window for the dislocation climb (over carbide particles) controlled creep
mechanism to be operable in 2.25Cr-1Mo material for the underlying creep test condition. For a
combination of (r) and (λ) that corresponds to a creep strain rate of 1.4 x 10⁻⁴ h-1, applied stress
(σA) becomes more than the Orowan-Ashby bowing (σO-A) stress required for the dislocations to

85
bow through a particular carbide particle distribution. Above 1.4 x 10⁻⁴ h-1, mobile edge
dislocations can easily bow through the residual carbide particle distributions and the alloy tends
to be no longer being strengthened by a fine dispersion of carbide particles. For a combination of
(r) and (λ) that corresponds to a minimum creep strain rate below 10-6 h-1, calculated threshold
stress (σTh) required to overcome the carbide particle distribution becomes more than that of the
applied stress (σA), which makes it difficult for the mobile edge dislocations to climb through the
carbide particle distribution.
Creep parametes used in BMD equation:
D = 0.0002. ex p (−240000
8.314x898) m2. s−1 [74]
ADis = 6e7 [78] (no units)
E = 2.55 x G = 119.8 GPa
b = 2.48 x 10⁻¹⁰m
k = 1.38 x 10⁻²³m2. Kg. S−2. K−1
σ = 50MPa
T = 898K
n = 3.7 ± 0.1
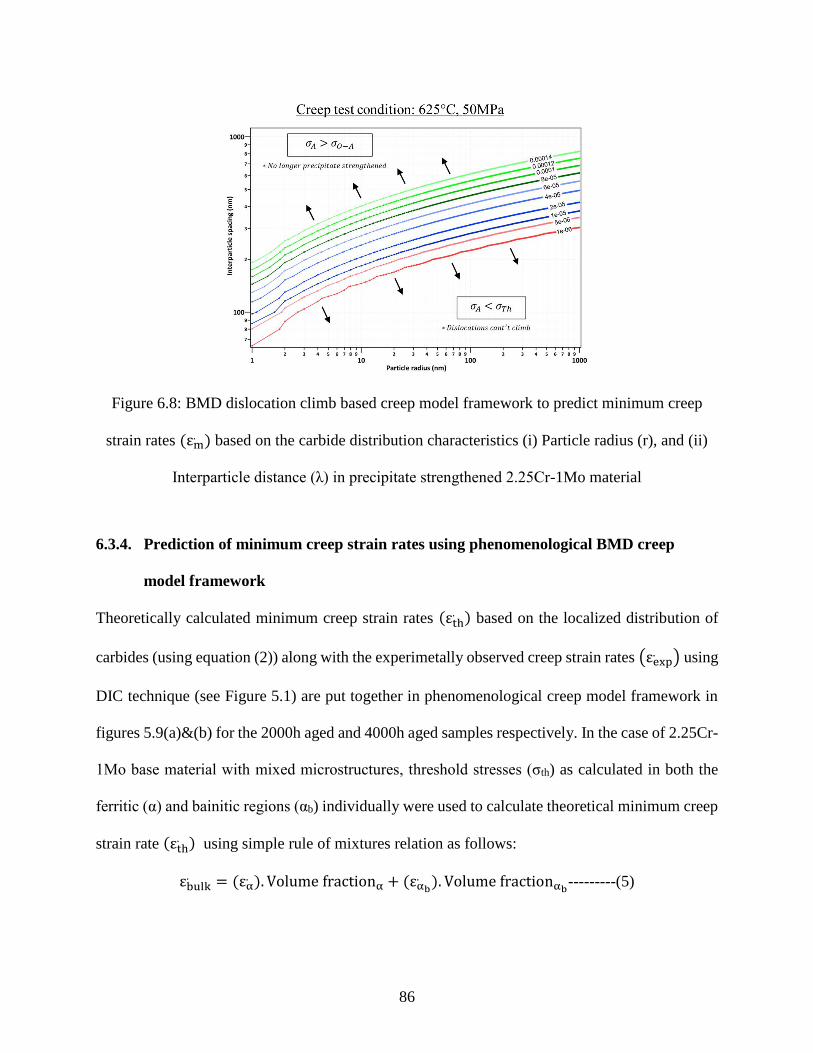
86
Figure 6.8: BMD dislocation climb based creep model framework to predict minimum creep
strain rates (εm. ) based on the carbide distribution characteristics (i) Particle radius (r), and (ii)
Interparticle distance (λ) in precipitate strengthened 2.25Cr-1Mo material
6.3.4. Prediction of minimum creep strain rates using phenomenological BMD creep
model framework
Theoretically calculated minimum creep strain rates (εth. ) based on the localized distribution of
carbides (using equation (2)) along with the experimetally observed creep strain rates (εexp. ) using
DIC technique (see Figure 5.1) are put together in phenomenological creep model framework in
figures 5.9(a)&(b) for the 2000h aged and 4000h aged samples respectively. In the case of 2.25Cr-
1Mo base material with mixed microstructures, threshold stresses (σth) as calculated in both the
ferritic (α) and bainitic regions (αb) individually were used to calculate theoretical minimum creep
strain rate (εth. ) using simple rule of mixtures relation as follows:
εbulk. = (εα
. ). Volume fractionα + (εαb
. ). Volume fractionαb---------(5)
87
Despite several crystal plasticity models have been proposed to predict mechanical properties of
regions of with mixed and complex micrsotructures [79,80], experimental methods to validate
these models have not been established owing to the difficulties in measuring properties of these
micron level micrsotructural regions. Hence a simple rule of mixtures based calculation was
applied to predict the bulk material minimum creep strain rates in the 2.25Cr-1Mo regions. It can
be inferred from figures 6.9 (a)&(b), theoretically calculated minimum creep strain rates (εth. ) in
the 2.25Cr-1Mo base materials are agreeable to that of the experimentally observed creep strain
rates. Theoretically predicted calculated creep strain rates (εth. ) are much closer to that of the
ferritic region, since ferritic regions of 2.25Cr-1Mo base materials crept a little over a mignitude
higher than the bainitic regions.
Figure 6.9: Results from theoretical calculation of minimum creep strain rates (ε.) observed in
(a) 2.25Cr-1Mo base material, and (ii) Location of creep strain concentration inside 2.25Cr-1Mo
HAZ using the observed Interparticle distance (λ) and Particle radius (r) parameters for carbide
distributions in these respective locations. Experimentally observed minimum creep strain rates
(ε.) contours are also superimposed on the theoretically observed minimum creep strain rate map

88
Calculated Orowan-Ashby bowing stress (σO-A) for the carbide distribution in the region of creep
strain concentration (5μm away from BCC/FCC boundary) in the 2000h aged condition (see Table
6.2) is much lesser than the applied tensile stress of 50MPa, which would possibly lead to the
mobile edge dislocations to bow through this particular carbide particle distribution without the
need to climb over carbide particles. Minimum creep strain rates (εexp. ) in these microstructural
regions would be more than 1.4 x 10⁻⁴ h-1 as predicted by the BMD creep equations based model
framework as defined in figure 6.8. However, the experimetally observed minimum creep strain
rate (εth. ) was 6 x 10⁻⁵ h-1 for this specific region. Discrepancy in the theoretically predicted and
experimetally observed minimum creep strain rates could be due to any of the following two
reasons:
(i) DIC methods to measure local creep strain in this research study has a spatial resolution
of ~300μm. Since creep strain accumulation in 2000h aged DMW occurred close to
BCC/FCC boundary (see figure 4.8(a)), it is highly possible that the specific length
over which creep strain was measured in that location could have included a portion of
creep resistant austenitic material in transition adjacent to BCC/FCC boundary, which
could have resulted in normalized local creep strain values.
(ii) Possibility of an additional creep strengthening mechansim, in addition to the primary
precipitate based strengthening mechanism in Cr-Mo steels was explored to explain
this discrepancy. Klueh [11] proposed presence of Mo-C clusters in the BCC-Fe solid
solution could exert a drag force on the moving dislocations, which results in solid
solution strengthening. However, SEM and TEM EDS maps (see figures 4.11 & 4.12)
of this local region showed Molybdenum is locked as Mo-rich M6C carbides, which
rules out of this possibility. In the creep studies of modified 9Cr [81–83] steels,
89
researchers have proposed a possible subgrain boundary strengthening mechansim in
the tempered martensitic microstructure. It was theorized that the lath/block boundaries
with an average width of 0.2-0.5μm in a typical tempered martensite microstructure of
these steels could result in an athermal yield stress given by the following relation,
σyield = 10Gb
λ --------(6)
Where, λ is the average width of subgrain boundaries. However, role of subgrain boundaries in
enhancing creep strength in tempered martensitic microstructure is still open to debate in the
literature [84], since it is unclear whether the strengthening contribution is a result of fine subgrain
boudaries (lath/block boundaries) or MX/M23C6 carbides distributed along the subgrain boundaries
(lath/block boundaries).
Experimentally observed and theoretically calculated minimum creep strain rates are of a good
agreement in the location of creep strain concentration (~400μm away from BCC/FCC boundary)
in the 4000h aged DMW as shown in figure 6.9(b). Theoreticallly calculated minimum creep
strain rate (εth. ), calculated based on the initial carbide ditsribution in that local region, is close to
the upper bound of creep strain rates, where the rate controlling creep mechansim is dislocation
climb over a distribution of precipitates. This initial microstructure is not expected to last for a
longer time during creep tests at a temperature of 625ºC, as the precipiates coarsen further during
thermal exposure in creep tests and subsequently lose the precipitate strengthening capability. This
inference was supported by the experimentally observed minimum creep strain rate (εexp. ) in that
local region, which exhibited steady state creep for a short time period of 160h (40h to 200h)
during creep test (see figure 6.1), before getting into the tertiary stage of creep where creep strain
rate accelerate with time.
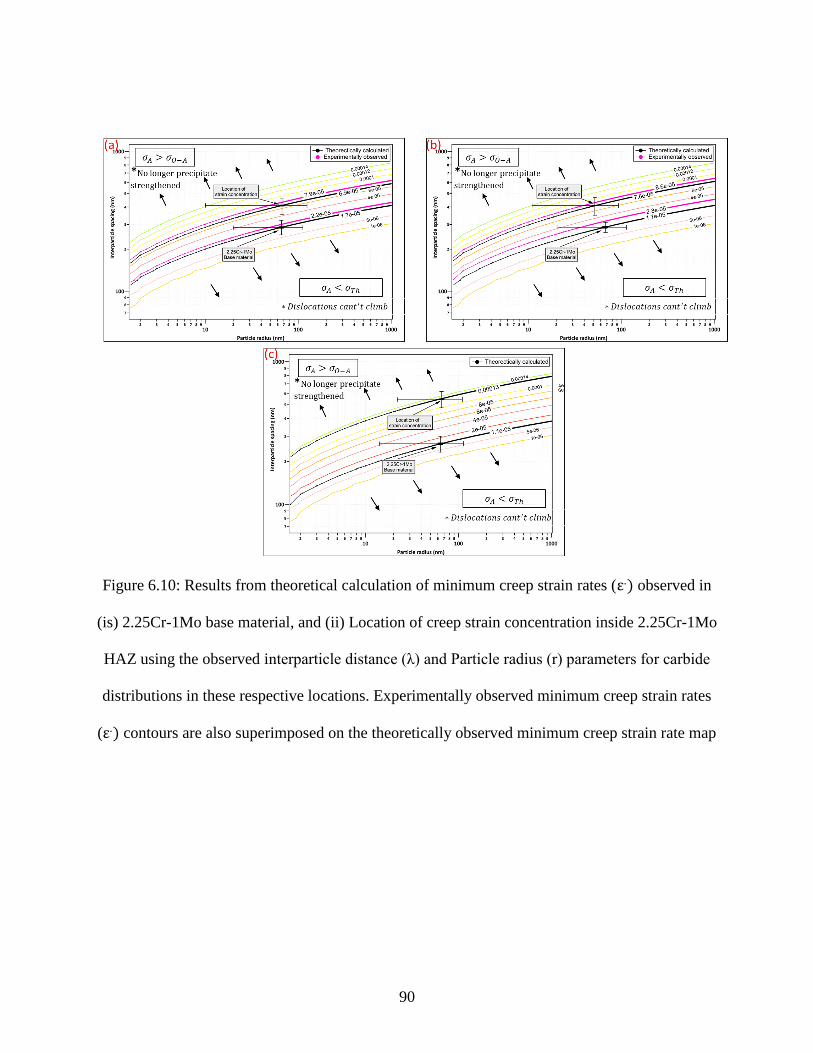
90
Figure 6.10: Results from theoretical calculation of minimum creep strain rates (ε.) observed in
(is) 2.25Cr-1Mo base material, and (ii) Location of creep strain concentration inside 2.25Cr-1Mo
HAZ using the observed interparticle distance (λ) and Particle radius (r) parameters for carbide
distributions in these respective locations. Experimentally observed minimum creep strain rates
(ε.) contours are also superimposed on the theoretically observed minimum creep strain rate map
91
Theorectically calculated minimum creep strain rates (εth. ) overlaid with the experimentally
observed minimum creep strain rates (εexp. ) in (i) 2.25Cr-1Mo base material, and (ii) location of
creep strain concentration (~3.5mm away from weld interface) in Inconel 82 , P87 and 347H GTJs
are illustrated in figures 5.10 (a), (b) & (c) respectively. As mentioned in 6.3.1.2, 2.25Cr-1Mo base
materials used for all these GTJs had a fully bainitic microstructure. Minimum creep strain rates
(εth. ) were calculataed based on the carbide distribution in the bainitic grains of 2.25Cr-1Mo base
material. It can be seen from the figures 5.10 (a), (b) & (c), theoretically and experimentally
calculated minimum creep strain rates were of a good agreement in both in the base material
regions and the regions of creep strain concentration in all these GTJs. While the theoretcially
calculated creep strain rates in 2.25Cr-1Mo base material was close to the lower bound creep strain
rate, crep strain rates of that of the regions of strain concentration are close to upper bound of creep
strain rates defined by BMD model for dislocation climb over distribution of precipitates creep
mechanism.
6.4. Summary
BMD creep equations based creep model framework was developed to predict the heterogeneous
creep behavior of DMWs and GTJs based on the initial (before creep) microstructure distribution
in them. Carbide characterization analyses were performed to determine (i) average carbide
particle radius (<r>), and (ii) interparticle distance between carbides (<λ>) in the regions of (i)
2.2Cr-1Mo base material, and (ii) location of creep strain concentration in DMWs and GTJs. These
details were incorporated as microstructural inputs into the phenomenological creep model
framework to see if theoretically predicted minimum creep strain rates are agreeable to the
experimentally observed minimum creep strain rates obtained using DIC methods. Key
conclusions of this research study are as follows:
92
Parent 2.25Cr-1Mo steel used for DMWs’ fabrication consisted of a mixed microstructure
of ferrite and bainite in both the aged conditions (600ºC for 2000h and 4000h). Minimum
creep strain rates were calculated individually based on the initial carbide distributions in
both the ferritic and bainitic regions before creep test. Bulk material creep strain rate was
determined based on a simple rule of mixtures based calculation from the individual
microstructure’s creep strain rate. Calculated bulk material creep strain rate was a good
agreement to the experimentally observed minimum creep strain rates from those regions.
In the location of creep strain concentration in the 2000h aged DMW, experimentally and
theoreticallly observed creep strain rates weren’t agreeable. Lack of spatial resolution in
DIC methods could have resulted in normalized creep strain values in the local region close
to BCC/FCC boundary. In t In the location of creep strain concentration in the 4000h aged
DMW, experimentally and theoreticallly observed creep strain rates weren ver much
agreable and was close to the upper bound creep strain rates as defined by BMD model for
dislocation climb over a distribution of precipitates creep mechanism.
In all the GTJs, parent 2.25Cr-1Mo material consistuted of a fully bainitic microstructure.
Theorectically calculated minimum creep strain rates based on the initial carbide
distributions complied to the experimentally observed creep strain rates from these local
regions. Location of creep strain concentration was comprised of fine grained bainitic
structure, typical of FGHAZ in 2.25Cr-1Mo steel welds. Experimentally observed
minimum creep strain rates in this location were almost 4 times higher than that of the
2.25Cr-1Mo base material creep strain rates. Carbide particle density in these local regions
decreased in comparsion to that in the parent 2.25Cr-1Mo regions, which further resulted
in an increase in the average interparticle distance (λ) between particles in the grain

93
interiors. This eventually lead to an increase in the minimum creep strain rates in the region
of creep strain concentration. This observation was also captured in the developed BMD
creep model.
94
Chaper 7
Conclusions and future directions
7.1. Creep studies on the aged Dissimilar Metal Welds (DMWs) and Graded Transition
Joints (GTJs)
Creep studies were performed on Dissimilar Metal Welds (DMWs) (Chapter-4) and Graded
Transition Joints (GTJs) (Chapter-5) made between ferritic steel and austenitic alloy using Ni-base
weld consumable to study spatial and temporal variation of creep deformation in these
heterogeneous weld configurations. Both the as-fabricated weld configurations were aged for
longer times to simulate creep detrimental microstructure development in these configurations (if
any. Creep tests were performed both on aged DMWs and GTJs in a creep test condition of 625ºC,
50MPa. Key conclusions of these creep studies are as follows,
Local creep strain measurements made using DIC technique discretized the creep behavior in
both DMWs and GTJs. Global creep strain from both the welded configurations was a result
of creep strain evolutions from the 2.25Cr-1Mo base material and heat affected zone (HAZ)
regions of the transition. In both the creep tests, creep strain was accumulating in 2.25Cr-1Mo
HAZ and was driving the premature failure in these joints.
Results from the creep studies of 2000h aged DMW specimen replicated characteristics of
service type interfacial failure seen in DMWs of power plant applications. Creep strain
concentration and the apparent creep damage in the tertiary stage of creep occurred in the local
ferritic region adjacent to the line of Type I interfacial carbides in 2.25Cr-1Mo HAZ. Strain
concentration occurred in this local region due to the apparent local decarburization as a result
of formation of line of Type I interfacial carbides close to BCC/FCC boundary.
95
Results from the creep studies on 4000h aged DMW indicated creep strain and the subsequent
creep damage accumulation in 2.25Cr-1Mo HAZ at a distance of ~400±200μm away from
BCC/FCC boundary specimens used for these creep tests exhibited strain concentration in
2.25Cr-1Mo HAZ at a distance of ~400±200μm away from BCC/FCC boundary. These
specimens are perceived to have been overaged to replicate strain concentration close to
BCC/FCC boundary as seen in both 2000h aged condition and ex-service welds. Strain
concentration occurred in this local region due to the depletion of carbides in this region
resulting from the relative enrichment of carbides close to BCC/FCC boundary. Failures in
regions away from BCC/FCC boundary can also be envisaged, when power plants do not
operate at their full capacties and experience frequent shutdowns.
In all the 2000h aged GTJs (Inconel 82, P87 and 347H) creep strain was accumulating in the
2.25Cr-1Mo FGHAZ, and creep cavities were distributed at 3.5±0.2mm away from the weld
interface and driving these premature of these GTJ configurations. Creep cavities in the size
of 1-2.5μm were observed along the grain boundaries of FGHAZ and the damage was
consistent along the entire specimen thickness. This observation was unexpected as the
objective of this research study was to eliminate creep detrimental microstructure in 2.25Cr-
1Mo HAZ.
EDS maps of carbide distributions suggested that the region of creep strain concentration in
GTJs didn’t show carbide distributions characteristic of the decarburized regions in the creep
studies of 2000h aged DMWs. However, carbides in FGHAZ appear to have coarsened in
comparison to the carbides in the parent 2.25Cr-1Mo material region, suggesting a Type IV
weld failure mechanism in Cr-Mo steel welds.
96
Carbon migration related problems associated with DMWs have not occurred in GTJs.
However, GTJs were prone to typical Type IV failure problems in the Cr-Mo steel weldments.
7.2. Phenemenolgical BMD creep model to predict heterogenous creep strain rates in these
weld configurations
BMD creep equations based creep model framework was developed to predict the heterogeneous
creep behavior of DMWs and GTJs based on the initial (before creep) microstructure distribution
in them. Microstrcuture based creep model framework is necessary to develop creep resistant
microstructures in DMWs. Carbide size and distribution characteristics in these different regions
of creep strain evolution in 2.25Cr-1Mo steel were analyzed and incorporated as microstructure
based input to the BMD creep model. Key conclusions ofrom the findings of this modeling study
are as follows:
Parent 2.25Cr-1Mo steel used for DMWs’ fabrication consisted of a mixed microstructure
of ferrite and bainite in both the aged conditions (600ºC for 2000h and 4000h). Minimum
creep strain rates were calculated individually based on the carbide distributions in both
the ferritic and bainitic regions. Bulk material creep strain rate was determined based on a
simple rule of mixtures based calculation from the individual microstructure’s creep strain
rate. Calculated bulk material creep strain rate (1.4 x 10⁻⁵ h-1 for 2000h aged and 2.4 x 10-
5 h-1 for 4000h aged) was a good agreement to the experimentally observed minimum
creep strain rates from those regions (1.9 x 10⁻⁵ h-1 for 2000h aged and 3.3 x 10⁻⁵ h-1 for
4000h aged).
In the location of creep strain concentration in the 2000h aged DMW, experimentally and
theoreticallly observed creep strain rates weren’t agreeable. Theoretically predicted creep
strain rate was more than 1.4 x 10⁻⁴ h-1, however the experimentally observed creep strain

97
rate was 6 x 10⁻⁵ h-1. Lack of spatial resolution in DIC methods have been hypothesized to
have normalized creep strain values in this local region close to BCC/FCC boundary. In
the location of creep strain concentration in the 4000h aged DMW, experimentally (10-4 h-
1) and theoreticallly (1.2 x 10⁻⁴ h-1) observed creep strain rates weren’t very much agreable
and was close to the upper bound creep strain rates as defined by BMD model for
dislocation climb over a distribution of precipitates creep mechanism.
In all the GTJs, parent 2.25Cr-1Mo material consistuted of a fully bainitic microstructure.
Theorectically calculated minimum creep strain rates based on the initial carbide
distributions complied to the experimentally observed creep strain rates from these local
regions. Location of creep strain concentration was constituted of fine grained (grain size
of approximately 5μm) bainitic structure, typical of FGHAZ in 2.25Cr-1Mo steel welds.
Experimentally observed minimum creep strain rates in this location (8-9 x 10⁻⁵ h-1) were
almost 4 times higher than that of the 2.25Cr-1Mo base material creep strain rates (2 x 10-
5 h-1). Coarsening of carbide particles in these local regions resulted in an increase in the
average interparticle distance (λ) between particles in the grain interiors, which eventually
resulted in an increase in the minimum creep strain rates. This observation was also
captured in the developed BMD creep model.
BMD creep equations based model framwork was effective in predicting creep behavior in
the different micrsostrcuture regions of DMWs and GTJs. Stress exponent-n and activation
energy- Q used in these constitutive equations need be be calibrated with a range of test
conditions with temperatures in the range of 400-650ºC and stresses in the range 30-
80MPa.

98
7.3. Future directions
7.3.1. Refinement of DIC methods of local creep strain measurement
Local strain analysis in the DIC technique is based on tracking displacements in small pockets of
regions (subsets) placed at finite distances (steps) in every deforming image of the specimen with
reference to the undeformed image of the specimen. Invariably, spatial resolution of strain
measurements using DIC technique depends on two factors: (i) subset size and step size selection,
and (ii) magnification at which images were captured. Uniform subset size- 17 x 17 pixels and step
size- 4 x 4 pixels were used for creep strain analyses in these experiments, which yielded a spatial
resolution of 280-300μm. A better spatial resolution could not be achieved in these tests due to the
combination of two factors: (i) lack of fineness in distribution of black and white speckle patterns
associated with manually spraying of these paints, and (ii) errors in displacement values due to
existence of convectional heat waves existing inside the furnace, which become increasingly
prominent at high magnification images. Strain measurement methods in DIC need to be refined
for a spatial resolution better than the current methods. To minimize thermal turbulence due to
heat waves, a customized air knife arrangement [85] for a uniform flow of air can be used. The
fineness of DIC speckle patterns can be improved by using a fine point airbrush [86] to spray
paints. However, these two recommendations need to be validated with an ample amount of
experimental studies.
7.3.2. Re-design of fabrication strategies of candidate GTJs
GTJs were fabricated by depositing layers of increasing dilution of each of the three candidate
filler metals viz., (i) Inconel 82, (ii) P87, and (iii) 347H on the 2.25Cr-1Mo steel substrate. In the
current study, such fabrication methodology has resulted in the coarsening of carbides, due to
excess tempering of 2.25Cr-1Mo material during weld processing. This further resulted in the
99
deterioration of creep properties in the fine grained HAZ (FGHAZ) of 2.25Cr-1Mo base material
in all the candidate GTJs, in comparison to the 2.25Cr-1Mo base material (unaffected by weld
themal cycles). To prevent the excessive tempering of 2.25Cr-1Mo susbstrate, fabrication strategy
for GTJs needs to be re-designed. This can be done by interchanging the susbstrate used for
depositing the graded transition layers. GTJs can be fabricated by depositing layers of increasing
dilution of 2.25Cr-1Mo filler metal on the Alloy 800H substrate till the composition of transition
layers becomes the undiluted 2.25Cr-1Mo steel. It can be expected that re-design of fabrication
sequence will overtemper Alloy 800H material. Creep strain distribution results from 4.3.2 and
5.3.2 show negligible creep deformation in the Alloy 800H material. Hence, overtempering of
Alloy 800H shouldn’t deteriorate the creep properties of the GTJs.
7.3.3. Integrated model to simultaneously handle precipitation kinetics and carbon
diffusion kinetics in Dissimilar Metal Welds (DMWs)
Creep model framework developed in chapter-6 is based on the initial microstructural (before
creep) variations in 2.25Cr-1Mo steel regions of both DMWs and GTJs. However, both DMW and
GTJ configurations were aged extensively to induce variable carbide distributions inside the
different regions of 2.25Cr-1Mo steel (base material and heat affected zone (HAZ)). Thermal
cycles during weld processing followed by the long-term aging heat treatments have resulted in (i)
decarburization in 2.25Cr-1Mo HAZ close to BCC/FCC boundary in DMWs, and (ii) carbide
coarsening in the FGHAZ of 2.25Cr-1Mo material of GTJs. It is neceassry to have a model that
can accurately predict the variations in characteristics of carbide distribution (carbide size (r) and
interparticle distance between carbides (λ)) in different regions of ferritic steel during both the
weld processing and the subsequent aging treatments. Such a model will save thousands of hours
and money spend in the aging treatments to simulate the heteregeneous microstructures. Currently,
100
there are two types of modeling tools available, namely CALPHAD based models and
Simultaneous Transformation Kinetics (STK) models for this application. Homogenization
module of the commercially available DICTRA sofware (CALPHAD based) is capable of
modeling carbon diffusion based on the carbon chemical potential (driving force for carbon
diffusion) gradients in the matrix. Researchers at lehigh university [50,54] have performed such
modeling studies to predict the carbon diffusion across a dissmilar metal weld interface of ferritic
steel and an austenitic alloy, for transition lengths varying from 50μm to 20mm. However,
CALPHAD based models are not capable of accounting for simultaneous preicpitation of carbides
of different morphologies along with carbon diffusion. STK based models are capable of modeling
simultaneous nucleation and competitive growth of different carbide morphologies in a ferritic
steel. The set of governing equations were developed by Bhadeshia and Jones [87] initially in 1997
and later refined by Bhadeshia and Fujita [88] in 2002. STK based models were applied for
predicting precipitation sequences in other alloy systems like Ti-6Al-4V as well [89,90]. An
integration of these two models to simultaneously predict carbide precipitation and carbon
diffusion will be necessary to theoretically determine the different carbide distributions in these
DMW and GTJ configurations.

101
References
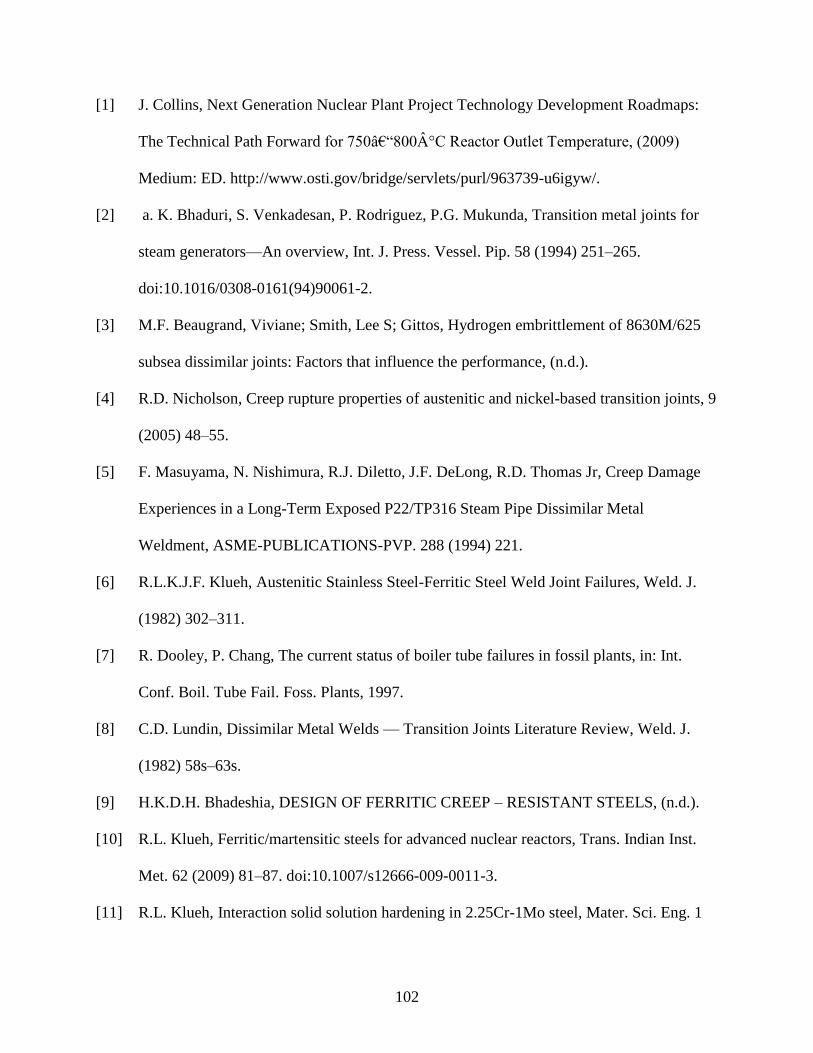
102
[1] J. Collins, Next Generation Nuclear Plant Project Technology Development Roadmaps:
The Technical Path Forward for 750–800°C Reactor Outlet Temperature, (2009)
Medium: ED. http://www.osti.gov/bridge/servlets/purl/963739-u6igyw/.
[2] a. K. Bhaduri, S. Venkadesan, P. Rodriguez, P.G. Mukunda, Transition metal joints for
steam generators—An overview, Int. J. Press. Vessel. Pip. 58 (1994) 251–265.
doi:10.1016/0308-0161(94)90061-2.
[3] M.F. Beaugrand, Viviane; Smith, Lee S; Gittos, Hydrogen embrittlement of 8630M/625
subsea dissimilar joints: Factors that influence the performance, (n.d.).
[4] R.D. Nicholson, Creep rupture properties of austenitic and nickel-based transition joints, 9
(2005) 48–55.
[5] F. Masuyama, N. Nishimura, R.J. Diletto, J.F. DeLong, R.D. Thomas Jr, Creep Damage
Experiences in a Long-Term Exposed P22/TP316 Steam Pipe Dissimilar Metal
Weldment, ASME-PUBLICATIONS-PVP. 288 (1994) 221.
[6] R.L.K.J.F. Klueh, Austenitic Stainless Steel-Ferritic Steel Weld Joint Failures, Weld. J.
(1982) 302–311.
[7] R. Dooley, P. Chang, The current status of boiler tube failures in fossil plants, in: Int.
Conf. Boil. Tube Fail. Foss. Plants, 1997.
[8] C.D. Lundin, Dissimilar Metal Welds — Transition Joints Literature Review, Weld. J.
(1982) 58s–63s.
[9] H.K.D.H. Bhadeshia, DESIGN OF FERRITIC CREEP – RESISTANT STEELS, (n.d.).
[10] R.L. Klueh, Ferritic/martensitic steels for advanced nuclear reactors, Trans. Indian Inst.
Met. 62 (2009) 81–87. doi:10.1007/s12666-009-0011-3.
[11] R.L. Klueh, Interaction solid solution hardening in 2.25Cr-1Mo steel, Mater. Sci. Eng. 1
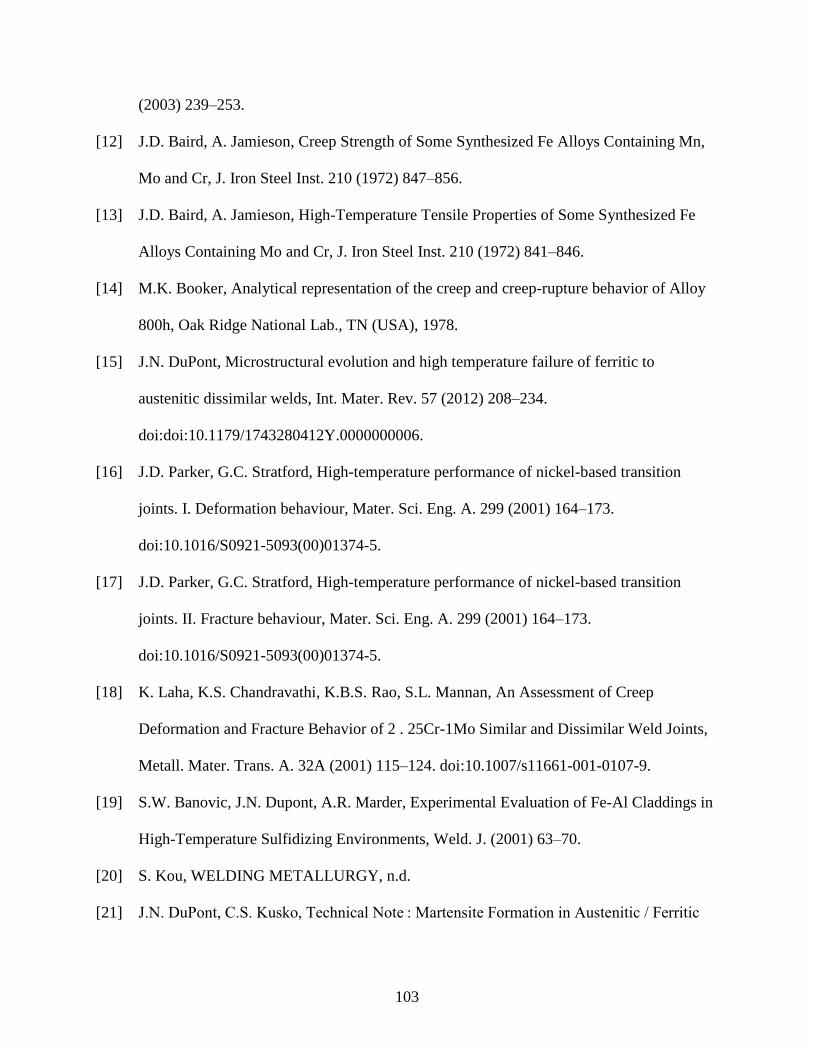
103
(2003) 239–253.
[12] J.D. Baird, A. Jamieson, Creep Strength of Some Synthesized Fe Alloys Containing Mn,
Mo and Cr, J. Iron Steel Inst. 210 (1972) 847–856.
[13] J.D. Baird, A. Jamieson, High-Temperature Tensile Properties of Some Synthesized Fe
Alloys Containing Mo and Cr, J. Iron Steel Inst. 210 (1972) 841–846.
[14] M.K. Booker, Analytical representation of the creep and creep-rupture behavior of Alloy
800h, Oak Ridge National Lab., TN (USA), 1978.
[15] J.N. DuPont, Microstructural evolution and high temperature failure of ferritic to
austenitic dissimilar welds, Int. Mater. Rev. 57 (2012) 208–234.
doi:doi:10.1179/1743280412Y.0000000006.
[16] J.D. Parker, G.C. Stratford, High-temperature performance of nickel-based transition
joints. I. Deformation behaviour, Mater. Sci. Eng. A. 299 (2001) 164–173.
doi:10.1016/S0921-5093(00)01374-5.
[17] J.D. Parker, G.C. Stratford, High-temperature performance of nickel-based transition
joints. II. Fracture behaviour, Mater. Sci. Eng. A. 299 (2001) 164–173.
doi:10.1016/S0921-5093(00)01374-5.
[18] K. Laha, K.S. Chandravathi, K.B.S. Rao, S.L. Mannan, An Assessment of Creep
Deformation and Fracture Behavior of 2 . 25Cr-1Mo Similar and Dissimilar Weld Joints,
Metall. Mater. Trans. A. 32A (2001) 115–124. doi:10.1007/s11661-001-0107-9.
[19] S.W. Banovic, J.N. Dupont, A.R. Marder, Experimental Evaluation of Fe-Al Claddings in
High-Temperature Sulfidizing Environments, Weld. J. (2001) 63–70.
[20] S. Kou, WELDING METALLURGY, n.d.
[21] J.N. DuPont, C.S. Kusko, Technical Note : Martensite Formation in Austenitic / Ferritic
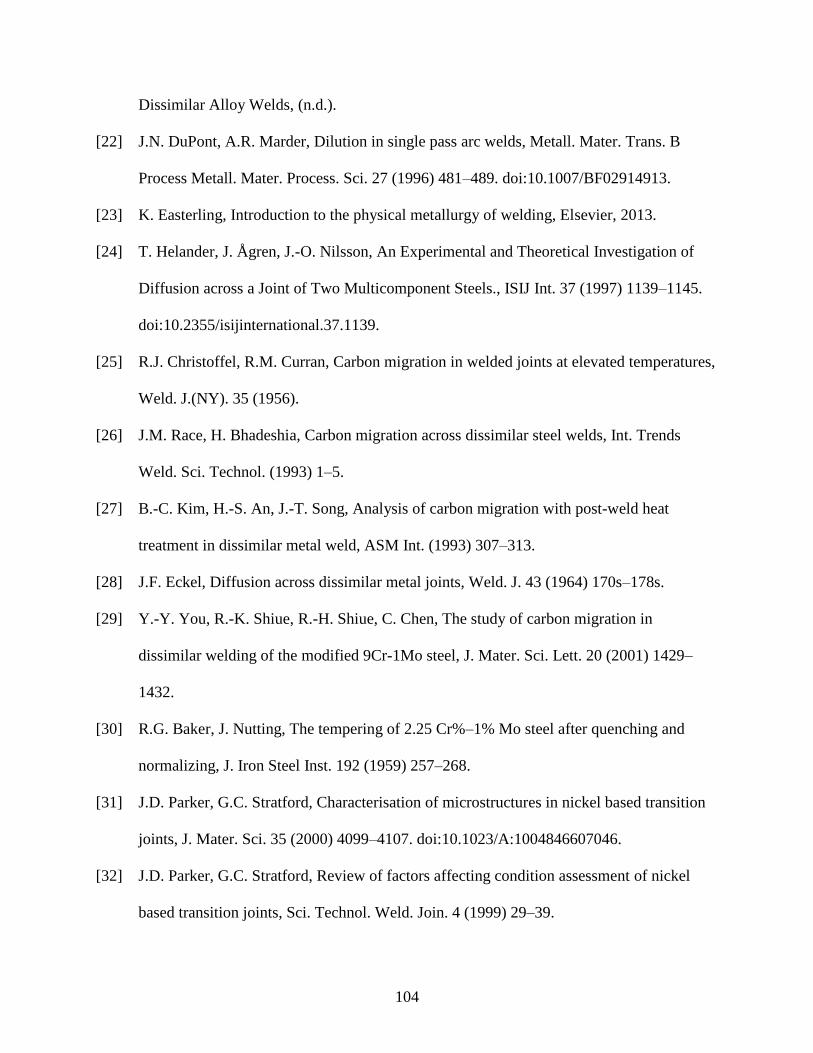
104
Dissimilar Alloy Welds, (n.d.).
[22] J.N. DuPont, A.R. Marder, Dilution in single pass arc welds, Metall. Mater. Trans. B
Process Metall. Mater. Process. Sci. 27 (1996) 481–489. doi:10.1007/BF02914913.
[23] K. Easterling, Introduction to the physical metallurgy of welding, Elsevier, 2013.
[24] T. Helander, J. Ågren, J.-O. Nilsson, An Experimental and Theoretical Investigation of
Diffusion across a Joint of Two Multicomponent Steels., ISIJ Int. 37 (1997) 1139–1145.
doi:10.2355/isijinternational.37.1139.
[25] R.J. Christoffel, R.M. Curran, Carbon migration in welded joints at elevated temperatures,
Weld. J.(NY). 35 (1956).
[26] J.M. Race, H. Bhadeshia, Carbon migration across dissimilar steel welds, Int. Trends
Weld. Sci. Technol. (1993) 1–5.
[27] B.-C. Kim, H.-S. An, J.-T. Song, Analysis of carbon migration with post-weld heat
treatment in dissimilar metal weld, ASM Int. (1993) 307–313.
[28] J.F. Eckel, Diffusion across dissimilar metal joints, Weld. J. 43 (1964) 170s–178s.
[29] Y.-Y. You, R.-K. Shiue, R.-H. Shiue, C. Chen, The study of carbon migration in
dissimilar welding of the modified 9Cr-1Mo steel, J. Mater. Sci. Lett. 20 (2001) 1429–
1432.
[30] R.G. Baker, J. Nutting, The tempering of 2.25 Cr%–1% Mo steel after quenching and
normalizing, J. Iron Steel Inst. 192 (1959) 257–268.
[31] J.D. Parker, G.C. Stratford, Characterisation of microstructures in nickel based transition
joints, J. Mater. Sci. 35 (2000) 4099–4107. doi:10.1023/A:1004846607046.
[32] J.D. Parker, G.C. Stratford, Review of factors affecting condition assessment of nickel
based transition joints, Sci. Technol. Weld. Join. 4 (1999) 29–39.
105
http://www.scopus.com/inward/record.url?eid=2-s2.0-
0003034092&partnerID=40&md5=20b5c403986bb83dcd94d3b5b9e6f2a0.
[33] M.A. Sutton, Digital Image Correlation for Shape and Deformation Measurements, (n.d.)
565–600.
[34] D. V Nelson, A. Makino, T. Schmidt, Residual stress determination using hole drilling
and 3D image correlation, Exp. Mech. 46 (2006) 31–38.
[35] M.J. McGinnis, S. Pessiki, H. Turker, Application of three-dimensional digital image
correlation to the core-drilling method, Exp. Mech. 45 (2005) 359.
[36] J. Gao, H. Shang, Deformation-pattern-based digital image correlation method and its
application to residual stress measurement, Appl. Opt. 48 (2009) 1371–1381.
[37] X. Chen, N. Xu, L. Yang, D. Xiang, High temperature displacement and strain
measurement using a monochromatic light illuminated stereo digital image correlation
system, Meas. Sci. Technol. 23 (2012) 125603.
[38] B. Pan, High-temperature digital image correlation method for full-field deformation
measurement at 1200 ° C, (2010). doi:10.1088/0957-0233/22/1/015701.
[39] X. Guo, J. Liang, Z. Tang, B. Cao, M. Yu, High-temperature digital image correlation
method for full-field deformation measurement captured with filters at 2600°C using
spraying to form speckle patterns, Opt. Eng. 53 (2014) 063101.
doi:10.1117/1.OE.53.6.063101.
[40] X. Yu, Z. Feng, Y. Yamamoto, O. Ridge, O. Ridge, IN-SITU FULL FIELD CREEP
DEFORMATION STUDY OF CREEP, (n.d.).
[41] R.L.K.J.F. Klueh, Austenitic Stainless Steel-Ferritic Steel Weld Joint Failures, Weld. J. 61
(1982) 302–311.
106
[42] M. Subramanian, S.S. Babu, Invention Disclosure on “Development of novel DIC speckle
pattern to measure in-situ heterogeneous strain distributions and material degradation
during high temperature service,” (n.d.).
[43] Special Metals Corporation, INCONEL ® alloy 625, (n.d.). www.specialmetals.com
(accessed December 25, 2018).
[44] Special Metals Corporation, Incoloy 800H, (n.d.).
[45] C. Toffolon-masclet, J. Roubaud, B. Marini, O.I.S. Roch, E. Kozeschnik, Carbide
Precipitation in 2 . 25 Cr-1 Mo Bainitic Steel : Effect of Heating and Isothermal
Tempering Conditions, Metall. Mater. Trans. A. 48A (2017) 2164–2178.
doi:10.1007/s11661-017-4045-6.
[46] J. Yu, Carbide Stability Diagrams in 2.25Cr-1Mo Steels, Metall. Trans. A. 20A (1989)
1561–1564.
[47] R.L. Klueh, J.M. Leitnaker, An analysis of the decarburization and aging processes in 2
1/4 Cr-1 Mo steel, Metall. Trans. A. 6 (1975) 2089–2093. doi:10.1007/BF03161835.
[48] J. Pilling, N. Ridley, Tempering of 2.25 Pct Cr-1 Pct Mo Low Carbon Steels, Metall.
Trans. A. 13 (1982) 557–563. doi:10.1007/BF02644419.
[49] R.L. Klueh, Creep of decarburized and aged 2.25Cr-1Mo steel, J. Nucl. Mater. 96 (1981)
187–195.
[50] G. Brentrup, B. Snowden, J. DuPont, J.G.-W. Journal, U. 2012, Design considerations of
graded transition joints for welding dissimilar alloys, Lehigh.Edu. 91 (2012).
http://www.lehigh.edu/~inmatsci/faculty/dupont/docs/Design_Considerations_of_Graded_
Transition_Joints_for_Joining_Dissimilar_Alloys.pdf.
[51] J.D. Farren, J.N. DuPont, F.F. Noecker, Fabrication of a Carbon Steel-to-Stainless Steel
107
Transition Joint Using Direct Laser Deposition — A Feasibility Study, Weld. Res. (2007)
55–61.
[52] N. Sridharan, E. Cakmak, B. Jordan, D. Leonard, W.H. Peter, R.R. Dehoff, D. Gandy, S.S.
Babu, Design , Fabrication , and Characterization of Graded Transition Joints The
susceptibility of hot cracking in the graded transition region is evaluated, Weld. Res. 96
(2017) 295–306.
[53] G.J. Brentrup, J.N. DuPont, Fabrication and Characterization of Graded Transition Joints
for Welding Dissimilar Alloys, Weld. J. 92 (2013) 72–79.
doi:10.1016/j.infsof.2008.09.005.
[54] J.P. Galler, J.N. Dupont, S.S. Babu, M. Subramanian, Design of Graded Transition Joints
through Thermodynamic and Kinetic Modeling, Submitt. to Weld. J. (n.d.).
[55] J.-O. Andersson, T. Helander, L. Höglund, P. Shi, B. Sundman, Thermo-Calc & DICTRA,
computational tools for materials science, Calphad. 26 (2002) 273–312.
[56] H. Larsson, A. Engström, A homogenization approach to diffusion simulations applied to
α + γ Fe–Cr–Ni diffusion couples, Acta Mater. 54 (2006) 2431–2439.
doi:10.1016/j.actamat.2006.01.020.
[57] H. Larsson, L. Höglund, Multiphase diffusion simulations in 1D using the DICTRA
homogenization model, Calphad. 33 (2009) 495–501.
[58] J.P. Galler, J.N. Dupont, S.S. Babu, M. Subramanian, Microstructural Evolution of
Graded Transition Joints, (n.d.).
[59] T. Watanabe, M. Tabuchi, M. Yamazaki, H. Hongo, T. Tanabe, Creep damage evaluation
of 9Cr-1Mo-V-Nb steel welded joints showing Type IV fracture, Int. J. Press. Vessel. Pip.
83 (2006) 63–71. doi:10.1016/j.ijpvp.2005.09.004.
108
[60] Y. Li, H. Hongo, M. Tabuchi, Y. Takahashi, Y. Monma, Evaluation of creep damage in
heat affected zone of thick welded joint for Mod.9Cr-1Mo steel, Int. J. Press. Vessel. Pip.
86 (2009) 585–592. doi:10.1016/j.ijpvp.2009.04.008.
[61] J. Storesund, K. Borggreen, W. Zang, Creep behaviour and lifetime of large welds in X 20
CrMOV 12 1-results based on simulation and inspection, Int. J. Press. Vessel. Pip. 83
(2006) 875–883. doi:10.1016/j.ijpvp.2006.08.015.
[62] J. Storesund, P. Andersson, L.A. Samuelson, P. Segle, Prediction of creep cracks in low
alloy steel pipe welds by use of the continuum damage mechanics approach, in: Fourth
Int. Colloq. Ageing Mater. Method Assess. Lifetimes Eng. Plant, Cape Town, South
Africa, 1997: pp. 129–144.
[63] W.G. Kim, S.H. Kim, W.S. Ryu, Creep characterization of type 316LN and HT-9 stainless
steels by the K-R creep damage model, KSME Int. J. 15 (2001) 1463–1471.
doi:10.1007/BF03185735.
[64] P. Wilson, REMANENT CREEP LIFE PREDICTION IN LOW-ALLOY FERRITIC
STEEL, 1990.
[65] Y.N. Rabotnov, Creep problems in structural members• Ñorth-Holland, JEN. 385 (1969)
8.
[66] T. Shrestha, M. Basirat, I. Charit, G.P. Potirniche, K.K. Rink, Creep deformation
mechanisms in modified 9Cr – 1Mo steel, J. Nucl. Mater. 423 (2012) 110–119.
doi:10.1016/j.jnucmat.2012.01.005.
[67] B.A. Shassere, Y. Yamamoto, S.S. Babu, Toward Improving the Type IV Cracking
Resistance in Cr-Mo Steel Weld Through Thermo-Mechanical Processing, Metall. Mater.
Trans. A Phys. Metall. Mater. Sci. 47 (2016) 2188–2200. doi:10.1007/s11661-016-3387-
109
9.
[68] B. Shassere, Y. Yamamoto, J. Poplawsky, W. Guo, S.S. Babu, Heterogeneous Creep
Deformations and Correlation to Microstructures in Fe-30Cr-3Al Alloys Strengthened by
an Fe2Nb Laves Phase, Metall. Mater. Trans. A Phys. Metall. Mater. Sci. 48 (2017) 4598–
4614. doi:10.1007/s11661-017-4274-8.
[69] J.E. Bird, James E; Mukherjee, Amiya K; Dorn, Experimental correlations for high-
temperature creep, (1968).
[70] Y. Mao, Nearest Neighbor Distances Calculation with ImageJ - EVOCD, (n.d.).
https://icme.hpc.msstate.edu/mediawiki/index.php/Nearest_Neighbor_Distances_Calculati
on_with_ImageJ (accessed November 18, 2018).
[71] N.S. Cheruvu, Degradation of mechanical properties of Cr-Mo-V and 2.25Cr-1Mo steel
components after long-term service at elevated temperatures, Metall. Trans. A. 20 (1989)
87–97. doi:10.1007/BF02647496.
[72] D.R.G. Mitchell, C.J. Ball, A quantitative X-ray diffraction and analytical electron
microscopy study of service-exposed 2 . 25Cr – 1Mo steels, Mater. Charact. 47 (2001)
17–26.
[73] Y. Yang, Y. Chen, K. Sridharan, T.R. Allen, Evolution of Carbide Precipitates in 2 . 25Cr-
1Mo Steel during Long-Term Service in a Power Plant, Metall. Mater. Trans. A. 41
(2010) 1441–1447. doi:10.1007/s11661-010-0194-6.
[74] D.A. Porter, K.E. Easterling, M. Sherif, Phase Transformations in Metals and Alloys,
(Revised Reprint), CRC press, 2009.
[75] M.F. Ashby, Results and consequences of a recalculation of the frank-read and the orowan
stress, Acta Metall. 14 (1966) 679–681. doi:10.1016/0001-6160(66)90074-5.

110
[76] K. Maruyama, K. Sawada, J. Koike, H. Sato, K. Yagi, Examination of deformation
mechanism maps in 2 . 25Cr-1Mo steel by creep tests at strain rates of 10^-11 to 10^-6
S^-1, Mater. Sci. Eng. A. 224 (1997) 166–172. doi:10.1016/S0921-5093(96)10566-9.
[77] E. Arzt, M.F. Ashby, Threshold stresses in materials containing dispersed particles, Scr.
Metall. 16 (1982) 1285–1290. doi:http://dx.doi.org/10.1016/0036-9748(82)90484-7.
[78] K.L. Murty, F.A. Mohamed, J.E. Dorn, Viscous glide, dislocation climb and newtonian
viscous deformation mechanisms of high temperature creep in Al-3Mg, Acta Metall. 20
(1972) 1009–1018. doi:10.1016/0001-6160(72)90135-6.
[79] P.R. Dawson, D.E. Boyce, Crystal-Scale Simulations Using Finite-Element Formulations,
(2009).
[80] J.M. Gerken, P.R. Dawson, A finite element formulation to solve a non-local constitutive
model with stresses and strains due to slip gradients, Comput. Methods Appl. Mech. Eng.
197 (2008) 1343–1361. doi:10.1016/j.cma.2007.11.003.
[81] K. Maruyama, K. Sawada, J. Koike, Strengthening Mechanisms of Creep Resistant
Tempered Martensitic Steel, ISIJ Int. 41 (2001) 641–653.
doi:10.2355/isijinternational.41.641.
[82] F. Abe, Precipitate design for creep strengthening of 9% Cr tempered martensitic steel for
ultra-supercritical power plants, Sci. Technol. Adv. Mater. 9 (2008). doi:10.1088/1468-
6996/9/1/013002.
[83] S. Spigarelli, E. Cerri, P. Bianchi, E. Evangelista, Interpretation of creep behaviour of a
9Cr–Mo–Nb–V–N (T91) steel using threshold stress concept Interpretation of creep
behaviour of a 9Cr–Mo–Nb–V–N (T91) steel using threshold stress concept, Mater. Sci.
Technol. 15 (2016) 1433–1440. doi:10.1179/026708399101505428.
111
[84] R. Abe, Fujio; Kern, Torsen; Viswanathan, Creep resistant steels, n.d.
[85] M.D. Novak, F.W. Zok, High-temperature materials testing with full-field strain
measurement: Experimental design and practice, Rev. Sci. Instrum. 82 (2011) 1–7.
doi:10.1063/1.3657835.
[86] Y. Dong, H. Kakisawa, Y. Kagawa, Development of microscale pattern for digital image
correlation up to 1400 1 C, Opt. Lasers Eng. 68 (2015) 7–15.
doi:10.1016/j.optlaseng.2014.12.003.
[87] J. S.J., H.K.D.H. Bhadeshia, Kinetics of the simultaneous decomposition austenite into
several transformation products, Acta Mater. 7 (1997) 2911–2920.
[88] N. Fujita, H.K.D.H. Bhadeshia, Modelling Simultaneous Alloy Carbide Sequence in
Power Plant Steels., ISIJ Int. 42 (2002) 760–769. doi:10.2355/isijinternational.42.760.
[89] K. Makiewicz, S.S. Babu, M. Keller, A. Chaudhary, Microstructure Evolution during
Laser Additive Manufacturing of Ti6Al4V Alloy, Trends Weld. Res. Proc. 9th Int. Conf.
(2013) 970–977. doi:978-1-62708-998-2.
[90] A.W. Prabhu, Improving Fatigue Life of LENS Deposited Ti-6Al-4V through
Microstructure and Process Control, (2014).

112
Appendix
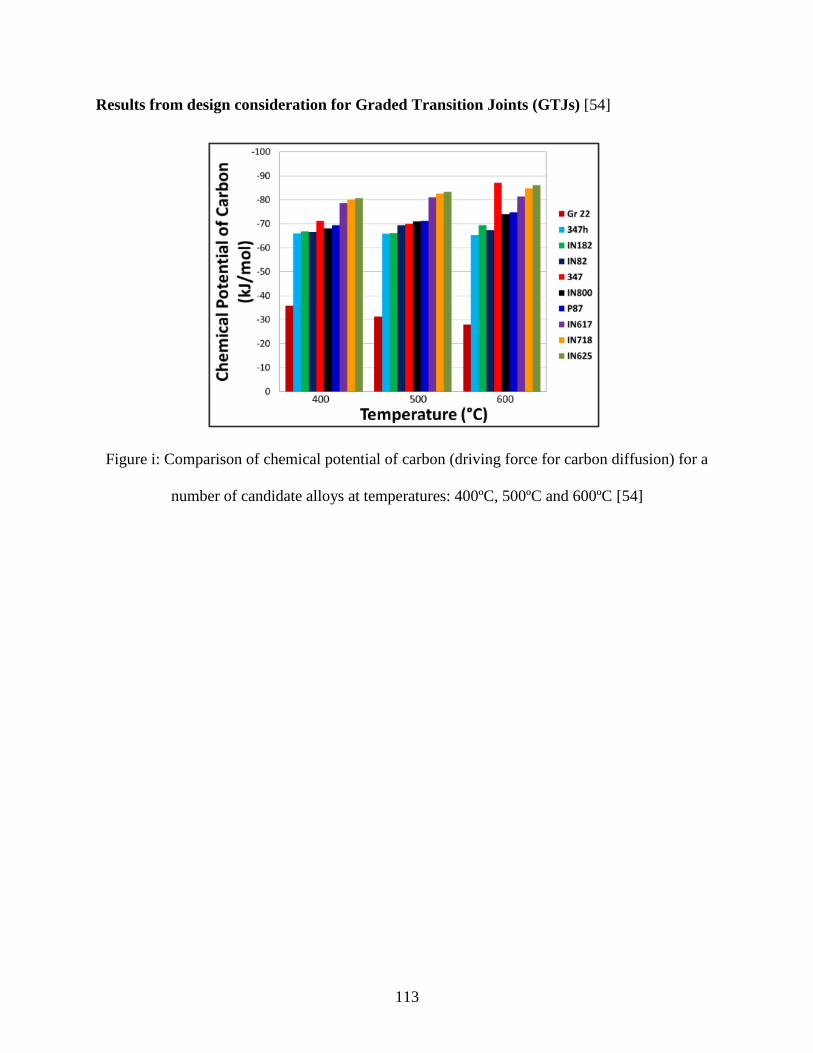
113
Results from design consideration for Graded Transition Joints (GTJs) [54]
Figure i: Comparison of chemical potential of carbon (driving force for carbon diffusion) for a
number of candidate alloys at temperatures: 400ºC, 500ºC and 600ºC [54]
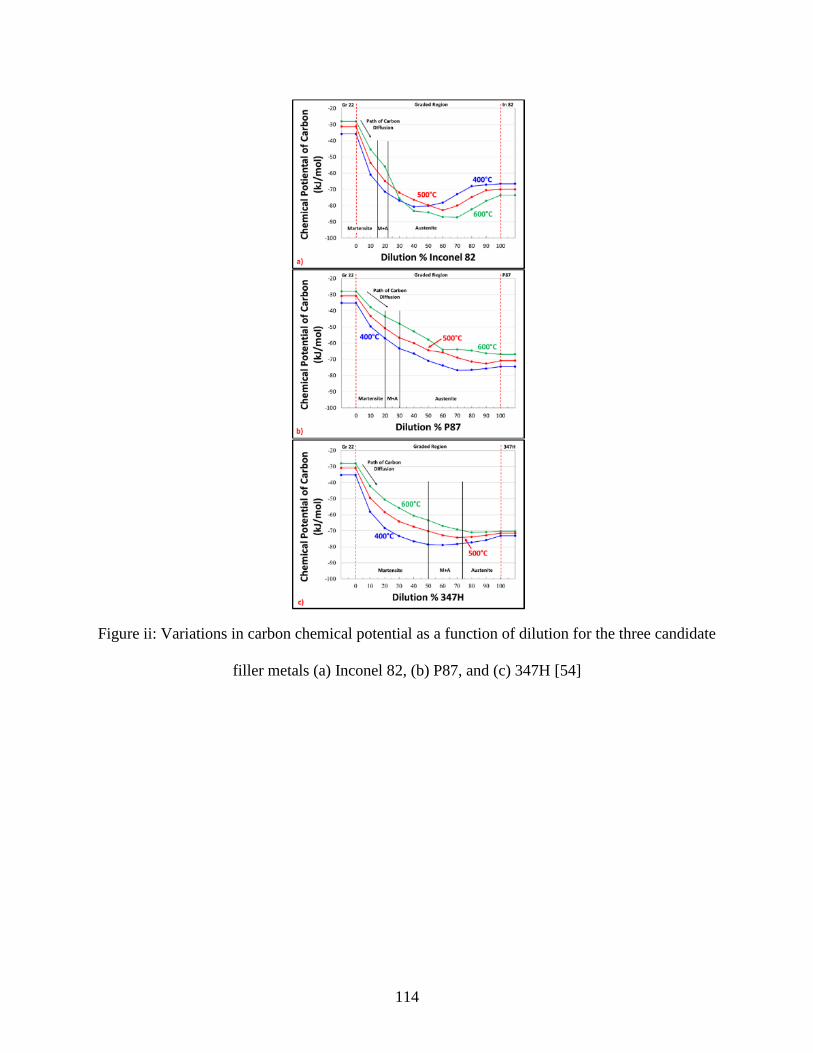
114
Figure ii: Variations in carbon chemical potential as a function of dilution for the three candidate
filler metals (a) Inconel 82, (b) P87, and (c) 347H [54]
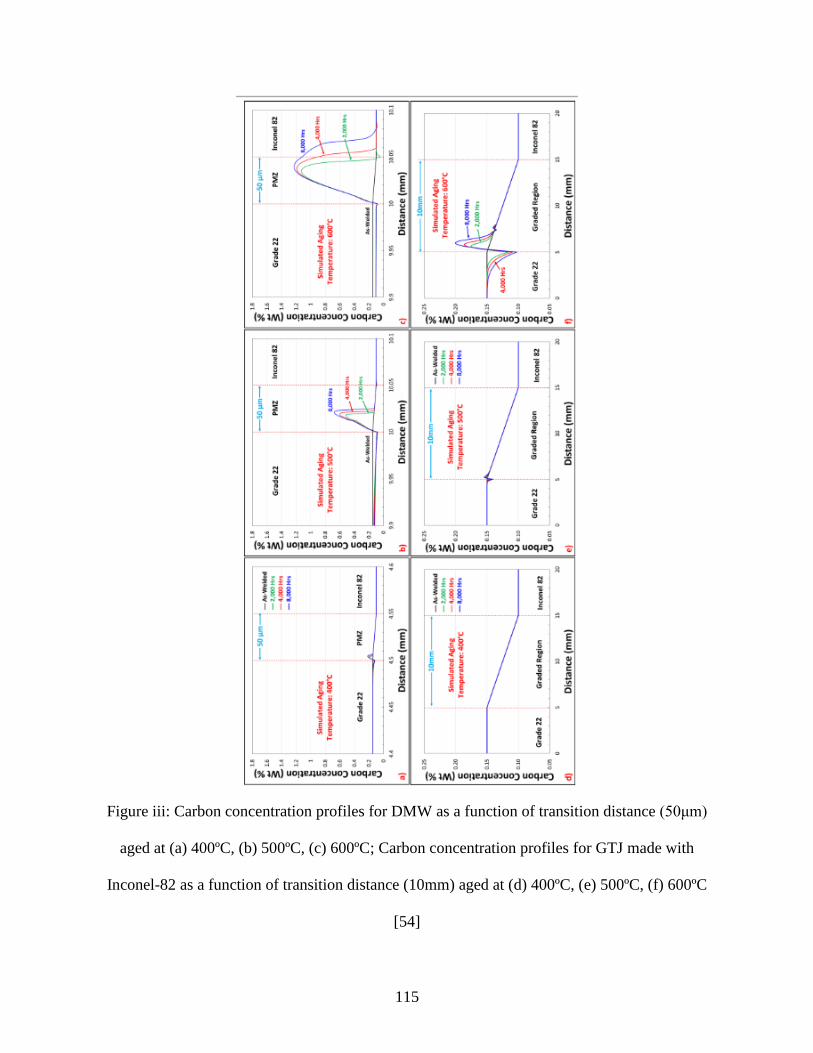
115
Figure iii: Carbon concentration profiles for DMW as a function of transition distance (50μm)
aged at (a) 400ºC, (b) 500ºC, (c) 600ºC; Carbon concentration profiles for GTJ made with
Inconel-82 as a function of transition distance (10mm) aged at (d) 400ºC, (e) 500ºC, (f) 600ºC
[54]
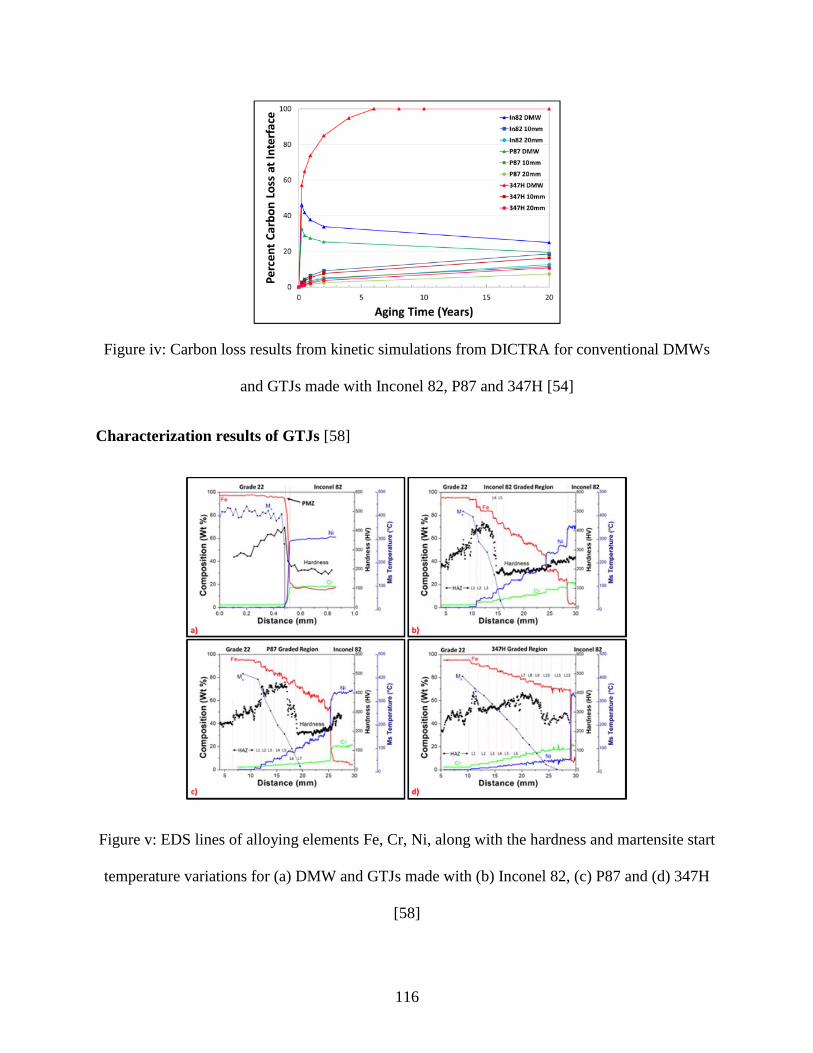
116
Figure iv: Carbon loss results from kinetic simulations from DICTRA for conventional DMWs
and GTJs made with Inconel 82, P87 and 347H [54]
Characterization results of GTJs [58]
Figure v: EDS lines of alloying elements Fe, Cr, Ni, along with the hardness and martensite start
temperature variations for (a) DMW and GTJs made with (b) Inconel 82, (c) P87 and (d) 347H
[58]
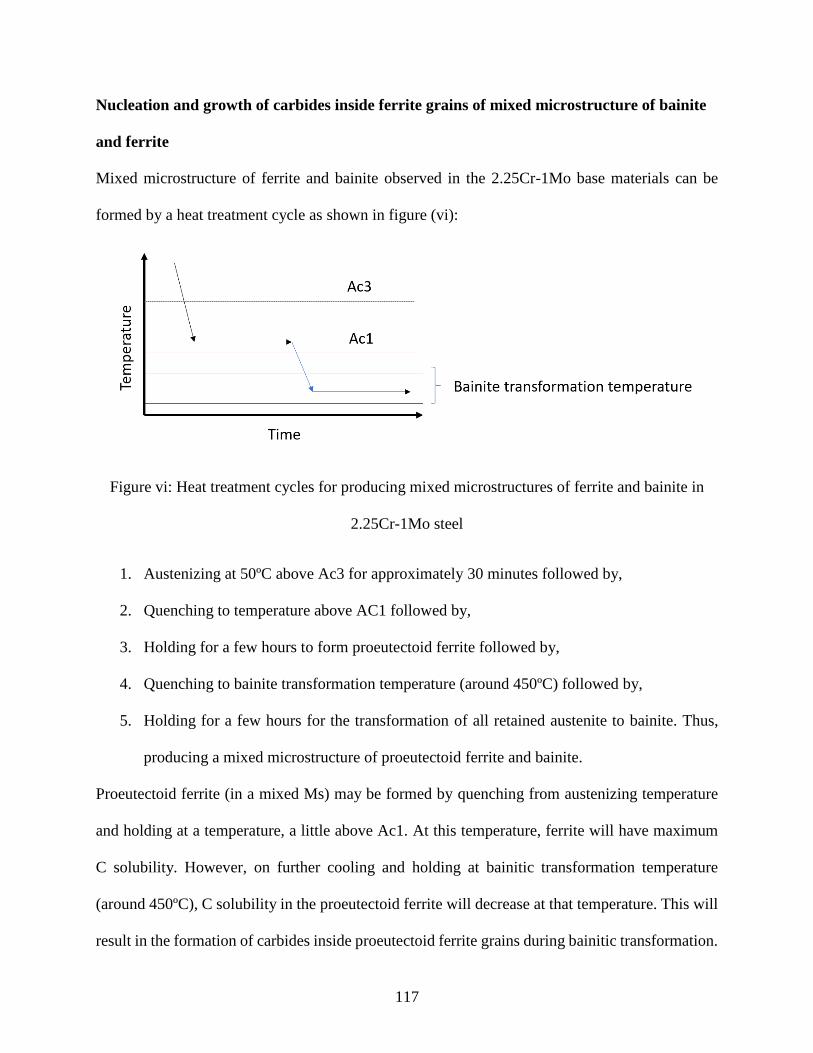
117
Nucleation and growth of carbides inside ferrite grains of mixed microstructure of bainite
and ferrite
Mixed microstructure of ferrite and bainite observed in the 2.25Cr-1Mo base materials can be
formed by a heat treatment cycle as shown in figure (vi):
Figure vi: Heat treatment cycles for producing mixed microstructures of ferrite and bainite in
2.25Cr-1Mo steel
1. Austenizing at 50ºC above Ac3 for approximately 30 minutes followed by,
2. Quenching to temperature above AC1 followed by,
3. Holding for a few hours to form proeutectoid ferrite followed by,
4. Quenching to bainite transformation temperature (around 450ºC) followed by,
5. Holding for a few hours for the transformation of all retained austenite to bainite. Thus,
producing a mixed microstructure of proeutectoid ferrite and bainite.
Proeutectoid ferrite (in a mixed Ms) may be formed by quenching from austenizing temperature
and holding at a temperature, a little above Ac1. At this temperature, ferrite will have maximum
C solubility. However, on further cooling and holding at bainitic transformation temperature
(around 450ºC), C solubility in the proeutectoid ferrite will decrease at that temperature. This will
result in the formation of carbides inside proeutectoid ferrite grains during bainitic transformation.
118
Vita
Mohan was born in Periyakulam, Tamil Nadu, India on the 13th December 1987. He completed
his higher secondary school education from TVS Lakshmi matriculation higher secondary school
and graduated in 2005. Upon graduation from high school, he pursued an undergraduate
metallurgical engineering degree in PSG college of Technology, Coimbatore, Tamil Nadu (2005-
09). After graduation, he worked as a welding engineer in the process equipment manufacturing
division of Godrej and Boyce Mfg. co. Ltd, Mumbai, India (2009-14). Following his 5-year stint
as welding engineer in India, he enrolled in a PhD program in engineering sciences at the
University of Tennessee, Knoxville, from Fall ’14. His research study primarily focused on
addressing the premature failures associated with dissimilar metal welds used in power plant
applications. After graduation, he will work as a research engineer in AK steel’s research and
innovation center in Middletown, OH. Outside research, his major interests are playing badminton
and cricket.
Related Documents