Study of Liquid−Solid Mass Transfer and Hydrodynamics in Micropacked Bed with Gas−Liquid Flow Enhong Cao, † Anand N. P. Radhakrishnan, † Redza bin Hasanudin, and Asterios Gavriilidis* Cite This: https://doi.org/10.1021/acs.iecr.1c00089 Read Online ACCESS Metrics & More Article Recommendations * sı Supporting Information ABSTRACT: The volumetric liquid−solid (L-S) mass transfer coefficient under gas−liquid (G-L) two-phase flow in a silicon- chip-based micropacked bed reactor (MPBR) was studied using the copper dissolution method and was related to the reactor hydrodynamic behavior. Using a high-speed camera and a robust computational image analysis method that selectively analyzed the bed voidage around the copper particles, the observed hydro- dynamics were directly related to the L-S mass transfer rates in the MPBR. This hydrodynamic study revealed different pulsing structures inside the packed copper bed depending on the flow patterns established preceding the packed bed upon increasing gas velocity. A “liquid-dominated slug” flow regime was associated with an upstream slug flow feed. A “sparse slug” flow regime developed with an upstream slug-annular flow feed. At higher gas velocity, a “gas continuous with pulsing” regime developed with an annular flow feed, which had similar features to the pulsing flow in macroscale packed beds, but it was sensitive and easily destabilized by disturbances from upstream or downstream pressure fluctuations. The volumetric L-S mass transfer coefficient decreased with increasing gas velocity under the liquid-dominated slug flow regime and became rather less affected under the sparse slug flow regime. By resolving the transition from the liquid-dominated slug flow to the sparse slug flow and capturing the onset of the gas-continuous with pulsing regime, we gained new insights into the hydrodynamic effects of G-L flows on the L-S mass transfer rates in a MPBR. ■ INTRODUCTION Microreactors are useful tools for chemical reaction and kinetic studies. Because of reduced length scales, they can offer advantages such as improved temperature control, accelerated heat and mass transfer, and enhanced mixing of reactants. 1,2 Micropacked bed reactors (MPBRs) or microfixed bed reactors, which combine the benefits of microreactors and fixed-bed reactors, have been demonstrated to be promising tools for multiphase catalytic reaction systems in investigating catalyst performance, 3−6 reaction kinetics, 7 and chemical synthesis. 8−11 Enhanced mass transfer in MPBRs has been reported by many researchers (refer to the review by Zhang et al. 12 ). In a typical example reported by Losey et al., 3 for the hydrogenation of cyclohexane on Pt/Al 2 O 3 catalyst particles in a MPBR, an overall mass transfer coefficient k l a (lumping gas− liquid and liquid−solid mass transfer coefficients) was found to be in the range of 5−15 s −1 , demonstrating a 100-fold increase in comparison with conventional industrial-scale trickle-bed reactors. In multiphase reactors with packed beds of catalyst particles, the gaseous reactant is usually sparingly soluble in the liquid phase, and both liquid reactant and the dissolved gas reactant diffuse to the catalyst surface where the reaction takes place. The evaluation of liquid-to-solid mass transfer is essential for modeling and designing of multiphase reactors. A significant amount of research has been performed on the measurement of mass transfer properties between flowing liquid and solid particles under trickle flow conditions. Generally, two main experimental techniques have been employed to determine liquid−solid (L-S) mass transfer coefficients: (1) dissolution of sparingly soluble solids into liquids 13−18 and (2) electro- chemical techniques. 19−22 Other experimental techniques have also been reported such as chemical reactions with significant solid−liquid mass transfer resistance, 23 ion exchange followed by an instantaneous irreversible reaction 24 and dynamic absorption. 25 In gas−liquid (G-L) two-phase flow in macro- scale packed beds, low gas and liquid flow rates lead to a low interaction regime, where the gas does not affect the liquid textures and the particles may not be entirely wetted, resulting in trickle flow with poor mass transfer characteristics. On the Special Issue: Giuseppe Storti Festschrift Received: January 7, 2021 Revised: May 7, 2021 Accepted: May 11, 2021 Article pubs.acs.org/IECR © XXXX American Chemical Society A https://doi.org/10.1021/acs.iecr.1c00089 Ind. Eng. Chem. Res. XXXX, XXX, XXX−XXX Downloaded via UNIV COLLEGE LONDON on June 8, 2021 at 14:49:41 (UTC). See https://pubs.acs.org/sharingguidelines for options on how to legitimately share published articles.

Welcome message from author
This document is posted to help you gain knowledge. Please leave a comment to let me know what you think about it! Share it to your friends and learn new things together.
Transcript
Study of LiquidminusSolid Mass Transfer and Hydrodynamics inMicropacked Bed with GasminusLiquid FlowEnhong Caodagger Anand N P Radhakrishnandagger Redza bin Hasanudin and Asterios Gavriilidis
Cite This httpsdoiorg101021acsiecr1c00089 Read Online
ACCESS Metrics amp More Article Recommendations sı Supporting Information
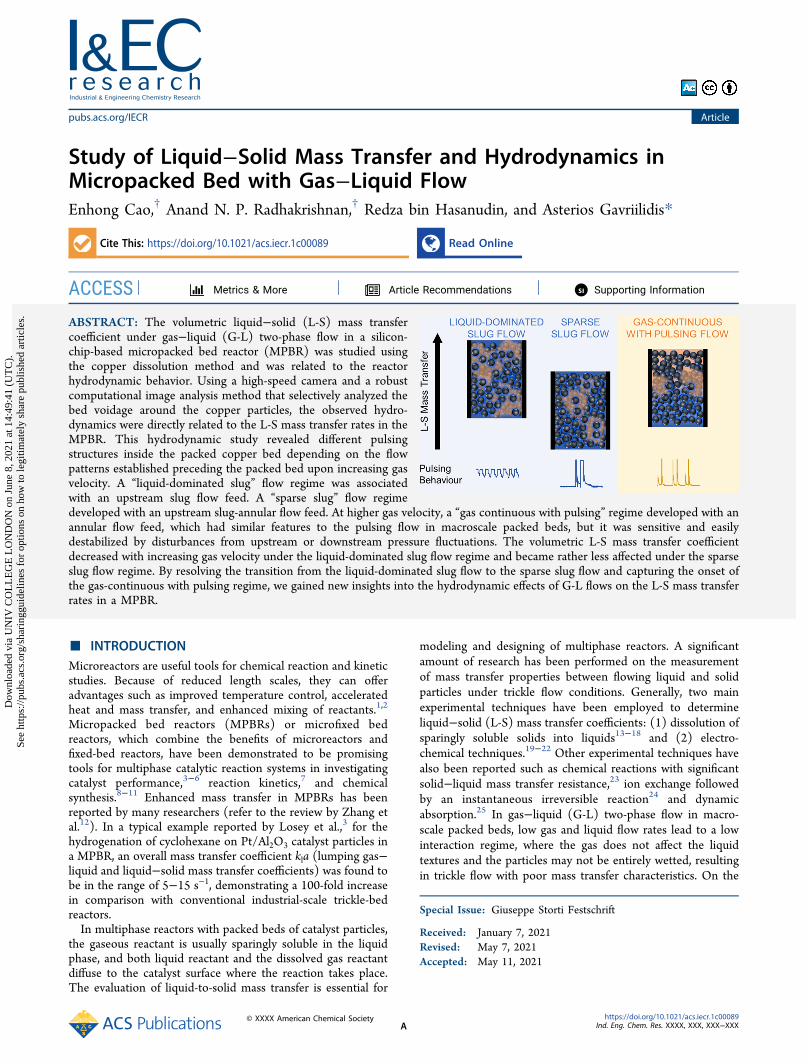
ABSTRACT The volumetric liquidminussolid (L-S) mass transfercoefficient under gasminusliquid (G-L) two-phase flow in a silicon-chip-based micropacked bed reactor (MPBR) was studied usingthe copper dissolution method and was related to the reactorhydrodynamic behavior Using a high-speed camera and a robustcomputational image analysis method that selectively analyzed thebed voidage around the copper particles the observed hydro-dynamics were directly related to the L-S mass transfer rates in theMPBR This hydrodynamic study revealed different pulsingstructures inside the packed copper bed depending on the flowpatterns established preceding the packed bed upon increasing gasvelocity A ldquoliquid-dominated slugrdquo flow regime was associatedwith an upstream slug flow feed A ldquosparse slugrdquo flow regimedeveloped with an upstream slug-annular flow feed At higher gas velocity a ldquogas continuous with pulsingrdquo regime developed with anannular flow feed which had similar features to the pulsing flow in macroscale packed beds but it was sensitive and easilydestabilized by disturbances from upstream or downstream pressure fluctuations The volumetric L-S mass transfer coefficientdecreased with increasing gas velocity under the liquid-dominated slug flow regime and became rather less affected under the sparseslug flow regime By resolving the transition from the liquid-dominated slug flow to the sparse slug flow and capturing the onset ofthe gas-continuous with pulsing regime we gained new insights into the hydrodynamic effects of G-L flows on the L-S mass transferrates in a MPBR
INTRODUCTIONMicroreactors are useful tools for chemical reaction and kineticstudies Because of reduced length scales they can offeradvantages such as improved temperature control acceleratedheat and mass transfer and enhanced mixing of reactants12
Micropacked bed reactors (MPBRs) or microfixed bedreactors which combine the benefits of microreactors andfixed-bed reactors have been demonstrated to be promisingtools for multiphase catalytic reaction systems in investigatingcatalyst performance3minus6 reaction kinetics7 and chemicalsynthesis8minus11 Enhanced mass transfer in MPBRs has beenreported by many researchers (refer to the review by Zhang etal12) In a typical example reported by Losey et al3 for thehydrogenation of cyclohexane on PtAl2O3 catalyst particles ina MPBR an overall mass transfer coefficient kla (lumping gasminusliquid and liquidminussolid mass transfer coefficients) was found tobe in the range of 5minus15 sminus1 demonstrating a 100-fold increasein comparison with conventional industrial-scale trickle-bedreactorsIn multiphase reactors with packed beds of catalyst particles
the gaseous reactant is usually sparingly soluble in the liquidphase and both liquid reactant and the dissolved gas reactantdiffuse to the catalyst surface where the reaction takes placeThe evaluation of liquid-to-solid mass transfer is essential for
modeling and designing of multiphase reactors A significantamount of research has been performed on the measurementof mass transfer properties between flowing liquid and solidparticles under trickle flow conditions Generally two mainexperimental techniques have been employed to determineliquidminussolid (L-S) mass transfer coefficients (1) dissolution ofsparingly soluble solids into liquids13minus18 and (2) electro-chemical techniques19minus22 Other experimental techniques havealso been reported such as chemical reactions with significantsolidminusliquid mass transfer resistance23 ion exchange followedby an instantaneous irreversible reaction24 and dynamicabsorption25 In gasminusliquid (G-L) two-phase flow in macro-scale packed beds low gas and liquid flow rates lead to a lowinteraction regime where the gas does not affect the liquidtextures and the particles may not be entirely wetted resultingin trickle flow with poor mass transfer characteristics On the
Special Issue Giuseppe Storti Festschrift
Received January 7 2021Revised May 7 2021Accepted May 11 2021
ArticlepubsacsorgIECR
copy XXXX American Chemical SocietyA
httpsdoiorg101021acsiecr1c00089Ind Eng Chem Res XXXX XXX XXXminusXXX
Dow
nloa
ded
via
UN
IV C
OL
LE
GE
LO
ND
ON
on
June
8 2
021
at 1
449
41
(UT
C)
See
http
sp
ubs
acs
org
shar
ingg
uide
lines
for
opt
ions
on
how
to le
gitim
atel
y sh
are
publ
ishe
d ar
ticle
s
other hand at higher gas and liquid flow rates a highinteraction regime is obtained where bubble dispersed andpulse flow lead to improved mass transfer characteristics1518
Even though trickle flow is not obtained at the microscalebecause of the dominance of capillary forces4 low and highinteraction regimes exist Gas and liquid phases have a ratherconstant share of the bed voidage without significantlyperturbing each other at low flow rates (low interaction)while at increased liquid superficial velocities a competitionbetween the two phases for the void spaces leads tofluctuations in both gas and liquid characteristic lengths(high interaction)26
The correlations for larger scale packed bed reactors are notsuitable for predicting the mass transfer in microscale packedbed reactors37 The main reason for this comes from the factthat viscous and capillary forces are predominant in theMPBRs in comparison with the large-scale packed bedreactors427 Hydrodynamic behavior of an MPBR (or even abench-scale trickle-bed reactor) differs from that of anindustrial-scale trickle bed due to the significant effect ofcapillary forces and consequently there could be no real trickleflow in a microscale packed bed4 In literature L-S masstransfer studies in MPBRs are scarce Tidona et al28 reported astudy of liquid-to-particle mass transfer in micropacked bedswith liquid-only flow using the copper dissolution method fordifferent channel geometries ie circular and rectangular andchannel hydraulic diameter to particle diameter ratio N Theydemonstrated that the shape of the channel has no influenceon the liquid-to-particle mass transfer as long as N is constantFaridkhou et al29 determined L-S mass transfer coefficients inmicropacked beds with single-phase flow using an electro-chemical method with an electrolyte solution containingferricyanide and ferrocyanide Single liquid-phase flow experi-ments revealed much higher volumetric L-S mass transfercoefficients as compared to macroscale packed beds Althoughobtained at different velocity range and particle sizes themeasured mass transfer coefficients tended to be in agreementwith the data reported by Tidona et al However themeasurement of the L-S mass transfer coefficient with G-Ltwo-phase flow was not successful as the electrochemicaltechnique showed limitations Templis and Papayannakos30
reported the study of L-S mass transfer using the copperdissolution method in mini-string reactors formed withcylindrical particles in spiral and vertical configurations andoperated with liquid-only and G-L feeds in upflow mode Themeasurement of liquid-to-solid mass transfer thus remains achallenge in MPBRsIn this study we investigated the L-S mass transfer in
MPBRs with G-L flow The copper dissolution method wasemployed as it has been widely used in L-S mass transferstudies We present the effect of gas and liquid superficialvelocities on the conversion of dichromate ions in the copperdissolution reaction Subsequently we estimate the L-S masstransfer coefficients assuming an axial dispersion modelFurthermore the flow dynamics of different G-L two-phaseflows were investigated to correlate flow transitions with thereaction conversions obtained in the MPBR Advancing ourprevious work27 we employed a high-speed imaging method-ology coupled with computational signal processing analysis toaccurately record the pulsation properties in the micropackedbed rather than relying only on qualitative observations fromimage snapshots
EXPERIMENTAL SECTIONMicropacked Bed Reactor A silicon-glass microreactor of
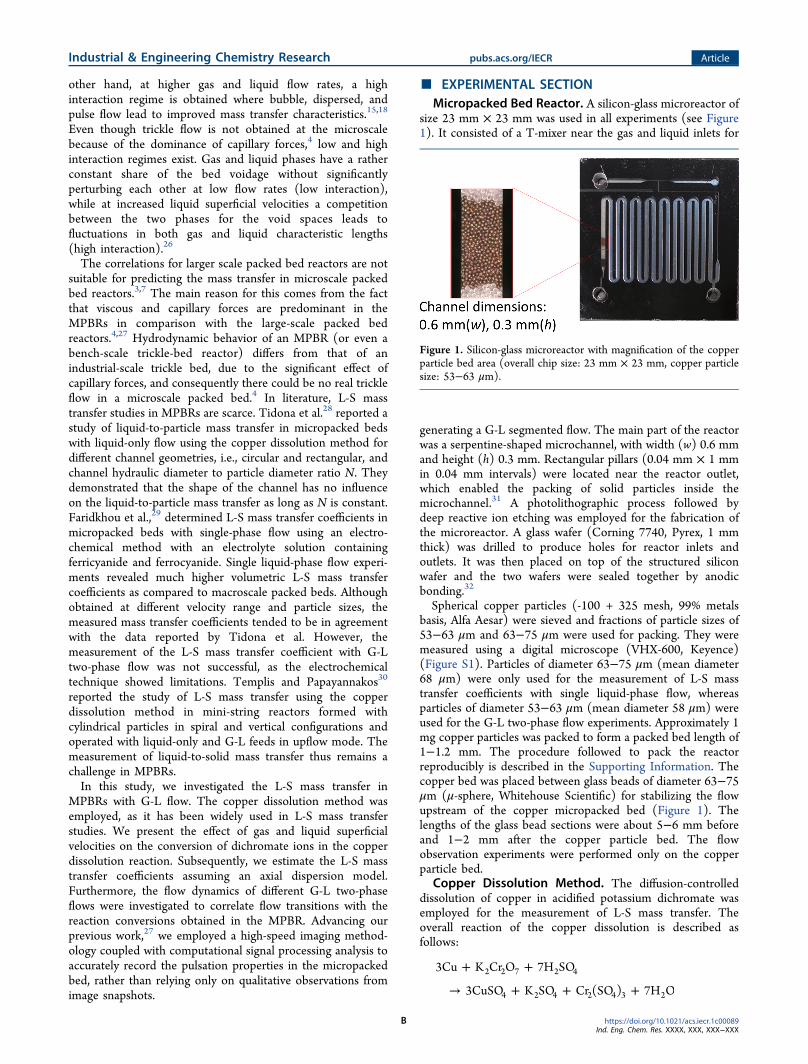
size 23 mm times 23 mm was used in all experiments (see Figure1) It consisted of a T-mixer near the gas and liquid inlets for
generating a G-L segmented flow The main part of the reactorwas a serpentine-shaped microchannel with width (w) 06 mmand height (h) 03 mm Rectangular pillars (004 mm times 1 mmin 004 mm intervals) were located near the reactor outletwhich enabled the packing of solid particles inside themicrochannel31 A photolithographic process followed bydeep reactive ion etching was employed for the fabrication ofthe microreactor A glass wafer (Corning 7740 Pyrex 1 mmthick) was drilled to produce holes for reactor inlets andoutlets It was then placed on top of the structured siliconwafer and the two wafers were sealed together by anodicbonding32
Spherical copper particles (-100 + 325 mesh 99 metalsbasis Alfa Aesar) were sieved and fractions of particle sizes of53minus63 μm and 63minus75 μm were used for packing They weremeasured using a digital microscope (VHX-600 Keyence)(Figure S1) Particles of diameter 63minus75 μm (mean diameter68 μm) were only used for the measurement of L-S masstransfer coefficients with single liquid-phase flow whereasparticles of diameter 53minus63 μm (mean diameter 58 μm) wereused for the G-L two-phase flow experiments Approximately 1mg copper particles was packed to form a packed bed length of1minus12 mm The procedure followed to pack the reactorreproducibly is described in the Supporting Information Thecopper bed was placed between glass beads of diameter 63minus75μm (μ-sphere Whitehouse Scientific) for stabilizing the flowupstream of the copper micropacked bed (Figure 1) Thelengths of the glass bead sections were about 5minus6 mm beforeand 1minus2 mm after the copper particle bed The flowobservation experiments were performed only on the copperparticle bed
Copper Dissolution Method The diffusion-controlleddissolution of copper in acidified potassium dichromate wasemployed for the measurement of L-S mass transfer Theoverall reaction of the copper dissolution is described asfollows
3Cu K Cr O 7H SO
3CuSO K SO Cr (SO ) 7H O2 2 7 2 4
4 2 4 2 4 3 2
+ +
rarr + + +
Figure 1 Silicon-glass microreactor with magnification of the copperparticle bed area (overall chip size 23 mm times 23 mm copper particlesize 53minus63 μm)
Industrial amp Engineering Chemistry Research pubsacsorgIECR Article
httpsdoiorg101021acsiecr1c00089Ind Eng Chem Res XXXX XXX XXXminusXXX
B
There are two steps involved namely (1) diffusion of thedichromate anion Cr2O7
2minus from the liquid phase to the solidcopper surface across the diffusion layer and (2) chemicalreaction between Cr2O7
2minus ion and Cu0 on the particle surfaceReaction step 2 is considered instantaneous and the overallrate of the reaction is controlled by the diffusion step33
A solution containing 033 mM K2Cr2O7 in 033 M H2SO4was used as suggested by Gruber and Melin34 to minimize theinfluence of natural convection between the fluid and thesurface of copper particles The ratio of acid to dichromateconcentration was 1000 which was larger than 7 as suggestedby Gregory and Riddiford33 and was high enough to excludeany ionic migration and to ensure that the transport ofdichromate ions to the copper surface occurred only by forcedconvection28
Experimental Procedure for Mass Transfer Coeffi-cient Determination A schematic diagram of the exper-imental setup is shown in Figure 2 The prepared micropacked
bed reactor was placed in a Perspex holder where the inlet andoutlets were connected using 116 in PTFE tubing The feedsolution was supplied by a syringe pump (Harvard PhD Ultra)Nitrogen gas (Zero grade BOC) was metered by a mass flowcontroller (SLA Brooks Instruments) Liquid samples werecollected at the outlet of the reactor by directing either liquid-only flow or G-L flow into cuvettes (UV-Cuvette microBrand) where the gas and liquid were separated by gravityBefore the experiment a leak test was performed at 2 bar to
ensure the flow system was gastight After the leak test the gasline was closed and the liquid feed solution was pumped intothe reactor at the desired flow rate When the reactor channelfilled up with liquid N2 gas was introduced into the reactor at apreset flow rate The system was then left running forapproximately 10 min to let the flow stabilize A set of threesamples with an approximate volume of 150 μL each wascollected in cuvettes at each G-L flow condition The sampleswere analyzed using a UVminusvis spectrometer (UV-2550Shimadzu) and the absorption peak of Cr(VI) at thewavelength of 350 nm was used to quantify the concentrationof the potassium dichromateThe copper dissolution experiments were carried out at
ambient conditions with a constant room temperature of 22degC For single phase flow the liquid superficial velocity (ul)varied in the range of 37 times 10minus3 to 11 times 10minus1 ms For the G-L two phase flow through the packed copper bed the L-S masstransfer was studied at four superficial liquid velocities rangingfrom 37 times 10minus3 to 15 times 10minus2 ms while the superficial gasvelocity (ug) was varied from 9 times 10minus2 to 358 ms at eachliquid velocity level with G-L flow rate ratios ranging from 60to sim1000
Because copper is consumed during the reaction the particlesize and their surface morphology could change which couldalter the properties of the packed bed Tidona et al28 foundabout 5minus17 variation in measured Sherwood numberbetween a single use (single measurement) packed bed and amulti-use (4minus5 consecutive measurements) packed bed Nosignificant changes in the particle size and the bed length wereobserved after the experiments with multi-use reactors In ourwork each packed microreactor was used for the mass transferstudies over four or five G-L flow conditions (multi-use packedbed) to ensure the changes in copper particle size and thepacked bed length after the measurements were less than 10minus17 This was checked by examining the copper packed bedand measuring the bed length before and after each experiment(a set of typical pictures of the packed bed before and after theexperiment is given in the Supporting Information) For thehigher rates of dissolution which corresponded to higher liquidflow rates the duration of experiment was limited by using afixed volume of the liquid solution in each experiment whichlimited the reduction of the bed length to less than 15minus17The conditions and data obtained toward the end of anexperiment were repeated in the next experiment with a freshbed to ensure consistency of results In this way the range ofG-L flow for the newly packed reactor always had one pointoverlapping with the previous set of flow conditions Themeasurements were always performed with increasing gas flowrate
Flow Observation and Characterization Quantitativecharacterization of the G-L flow in the copper particle bed wasperformed using a high-speed imaging methodology A high-speed camera (Mini AX-100 Photron) mounted on a digitalmicroscope (Axioscope A1 Carl Zeiss) was employed for flowvisualization studies using water and nitrogen gas Images wereacquired at 1000 frames per second (fps) ie 1 image per msat an exposure of 0996 ms and 10times magnification resulting inan image of size 960 μm times 605 μm Dark-field imaging wasimplemented as opposed to conventional bright-field micros-copy which overcame the limitation of observing just thestagnant liquid pockets under the glass cover layer commonlyseen in the literature This microscopy technique highlights thechange in contrast on the surface of the copper particlesthereby accurately picking up the fluctuations of the gasminusliquidpulses Images of the two-phase flow in the packed bed werethen processed using an automated computational imageanalysis script developed on the Python programminglanguage35minus37 In short the images were loaded by the scriptand a preprocessing algorithm was applied wherein theparticles in the image were distinguished from one anotherand from the void area by a watershed segmentation techniquewith an Otsu binary threshold3839 Artifacts in the image werethen removed by a median filter thus resulting in a binaryimage of zeroes and ones (see Figure 3 black represents theapparent copper particles and whiteminusthe void space ie thespace available for G-L flow) Identifying the copper particlesand removing them from analysis enabled the tracking of gasminusliquid pulsation in the void space with high accuracy The totalarea of the void space was calculated per frame to analyze therelative change in the void area during the G-L flow (see theSupporting Information and Video S1) Video S1 shows theraw frames of the micropacked bed before and after filteringthe copper particles and corresponding temporal estimation ofthe background area around the particles highlighting thefluctuations The total void area was divided by the length of
Figure 2 Experimental setup for liquidminussolid mass transfermeasurement PIC pressure controller MFC mass flow controllerP pressure sensor Valve needle valve to switch flow onoff
Industrial amp Engineering Chemistry Research pubsacsorgIECR Article
httpsdoiorg101021acsiecr1c00089Ind Eng Chem Res XXXX XXX XXXminusXXX
C
the image to give rise to a characteristic length (Λ)Normalizing the void area by the length of the image (in thedirection of the fluid flow) highlights the pixel-fluctuations dueto pulsation across the width of the packed bed (in thedirection perpendicular to flow) around the copper particlesPeaks of the Λ curve (local maxima) corresponded to the bedfilled with liquid and the troughs (local minima) represented agas-filled bed To quantify the flow transitions spectrogramswere generated from the Λ curves through a series of Fouriertransforms using Python4041 Spectrograms highlight theprinciple frequency of pulsation in the packed bed over timeand provide information on how the gas pushes the liquid slugsout of the bed through secondary or tertiary frequenciesSpectrograms were generated using a rectangular window ofsampling frequency 1 s with 1000 samples per segment Theimage analysis script written using Python accuratelydistinguished individual particles which were then removedfrom further analysis as including the particles to determinethe Λ curve would lead to erroneous resultsTo aid visualization of the pulsing flow another script was
written to calculate the difference in the pixel values betweentwo consecutive frames thereby highlighting the regions ofmaximum variation in the pixel values when there is a changein fluid phase In practical terms this allowed the observationof the path taken by the G-L interface around the particles
RESULTS AND DISCUSSION
Single-Phase Flow LiquidminusSolid Mass Transfer Theliquidminussolid (L-S) mass transfer coefficient was first measuredwith only liquid phase flowing through the copper particlepacked bed (mean diameter 68 μm) to validate theexperimental setup and procedures and serve as a referenceThe conversion of the dichromate anions (X) with varyingliquid superficial velocity (ul) obtained at the outlet of themicropacked bed is presented in Figure 4 The conversion (X)was calculated from the ratio of the concentration ofdichromate at the outlet and the inlet of the packed beddenoted as cL and c0 respectively
Xcc
1 L
0= minus
(1)
For single liquid flow through the micropacked bed a one-dimensional plug flow model with superimposed axialdispersion can be used to simulate and predict the reactorperformance under steady flow conditions The differentialequation for the dispersion flow model describing the steady-state concentration profile in an isothermal reactor is given by
Dc yy
uc y
yr
d ( )d
d ( )d
0ax
2
2 lminus minus =(2)
where c(y) is the concentration profile of dichromate ionsalong the length of the packed bed such that y varies from 0 tothe length of packed bed (L) and Dax is the axial dispersioncoefficient For the diffusion-controlled dissolution of copperin acidified dichromate the chemical reaction between thedichromate anion Cr2O7
2minus and Cu was considered instanta-neous and the overall rate of the reaction is controlled by thediffusion Thus it is given by
r k ac y( )s= prime (3)
and eq 2 can be rewritten as
Dc yy
uc y
yk ac y
d ( )d
d ( )d
( ) 0ax
2
2 l sminus minus prime =(4)
where ksprime is the mass transfer coefficient associated with theaxial dispersion reactor model and a is the total specificparticle surface area of the packed bed which can be calculatedusing the copper bed packing information such as copperdensity loading particles size (dp) bed length and channeldimensions28 Applying the Danckwerts boundary conditions
y c c u c c y Dc y
y
y L c L cc y
y
At 0 (0) ( (0) ( ))d ( )
d
At ( ) d ( )
d0
0 l ax
L
= = minus = minus
= = =
(5)
The solution of the differential equation gives42
Figure 3 Illustrations of the image processing to identify the copperparticles by a watershed segmentation technique (identified as blackpixels in the images on the middle and right side) The apparentparticle sizes decrease when the liquid phase fills the bed The netchange in the void space (white pixels) characterized by Λ is used todistinguish the flow patterns inside the packed bed A low Λ denotesgas-filled space (middle image) whereas a high Λ denotes a liquid-filled space (right-side image) Images taken at 1000 fps of two-phaseflow at ug = 008 ms and ul = 00075 ms Figure 4 Conversion of dichromate anions (X) versus superficial
liquid velocity (ul) in a liquid-phase flow experiment in the MPBR (dp= 68 μm) Error bars denote plusmn1 standard deviation
Industrial amp Engineering Chemistry Research pubsacsorgIECR Article
httpsdoiorg101021acsiecr1c00089Ind Eng Chem Res XXXX XXX XXXminusXXX
D
( )( ) ( )
cc
B
B B
4 exp
(1 ) exp (1 ) exp
u LD
Bu LD
Bu LD
L
0
2
22
22
l
ax
l
ax
l
ax
=+ minus minus minus
(6)
where
Bk aD
u1
4 s ax
l2= +
prime
(7)
If one considers a plug flow reactor model (ie if axialdispersion is neglected) eq 4 can be simplified as
uc y
yk ac y
d ( )d
( ) 0l sminus minus =(8)
Integration of eq 8 gives
ikjjjjj
yzzzzzk a
uL
cc
lnsl L
0= minus
(9)
The Sherwood numbers are then calculated as
Shk d
D
Shk d
D
Without axial dispersion
With axial dispersion
s p
m
s p
m
=
prime =prime
(10)
here Dm is the molecular diffusivity of dichromate 138 times 10minus9
m2s34
To assess axial dispersion effects the axial dispersioncoefficient Daxu which is based on the interstitial velocity wascalculated by using the correlation for liquid flow in macroscaleporous media for 4 lt Pem and Rel lt 10 as an approximation43
DD Pe
Pe Sc
Peud
uu
Peud
DRe
u d
18 235
D
axum m
m12 038
mp l
bm
p
ml
l p
m
τ
ε ν
=prime
prime +
prime = = = =τ
minus minus
(11)
where τ is the tortuosity factor of the micropacked bed εb isthe bed voidage u is the interstitial liquid velocity Pemprime is theeffective Peclet number and Sc is the Schmidt number ν is thekinematic viscosity of the liquid τ was taken as 2 for thespherical particle bed (random and well packed bed)44 and εbwas estimated from the packing parameters (the weight ofcopper particles the density of copper (8943 kgm3) length ofthe packed bed and the channel width and depth) to be 04minus042 Dax for eq 4 was then estimated as
D Dax axu bε= (12)
The estimated Sherwood numbers with and withoutconsideration of axial dispersion are shown in Figure 5aalong with the corresponding estimated mass transfercoefficients (Figure 5b) with increasing superficial liquidvelocity (ul) The Sherwood numbers without considerationof axial dispersion obtained by Tidona et al28 in similarmicropacked beds with the same copper dissolution methodare also presented in Figure 5a for comparison It can be seenthat for the liquid-phase flow the Sherwood number obtainedwith a PFR model from two different works fall on the sametrendline against the liquid Reynolds number although theranges of Reynolds number in the two works are different Theeffect of axial dispersion observed in our work increases with adecrease in liquid Reynolds number Shprime is about 5 higherthan Sh at Rel = 8 and is sim38 higher than Sh at Rel = 025However the influence of axial dispersion was small and can
be neglected at higher Reynolds number as observed in thework of Tidona et al28 Wakao and Funazkri45 also suggestedthat axial dispersion can be neglected for liquidminussolid masstransfer at Rel above 3
Two-Phase Flow Hydrodynamics CharacterizationFlow Pattern Observation and Pulsing Behavior in theMicropacked Bed Gas and liquid were introduced into themicroreactor through a T-junction and flowed through asection of empty channel before reaching the packed bedproducing either slug-flow or annular flow depending on theratio of gas to liquid flow rates Flow observation with a high-speed camera provided further information on the flowpatterns and of liquid pulses passing through the packedbed It was observed that the flow behavior in the packed bed
Figure 5 (a) Sherwood number versus liquid Reynolds number for liquid phase flow with (open blue marks) and without (solid blue marks)consideration of axial dispersion Channel dimensions w = 600 μm h = 300 μm N = 58 dp = 68 μm The data from Tidona et al28 for w = 1000μm h = 250 μm N = 54 dp = 75 μm (solid red marks Rel gt 10) are also shown (b) Volumetric mass transfer coefficient versus superficial liquidvelocity with (open blue marks) and without consideration of axial dispersion (solid blue marks) Error bars denote plusmn1 standard deviation
Industrial amp Engineering Chemistry Research pubsacsorgIECR Article
httpsdoiorg101021acsiecr1c00089Ind Eng Chem Res XXXX XXX XXXminusXXX
E
was highly dependent on the flow pattern establishedupstream At low ug the established slug flow preceding thepacked bed manifested as a dispersed-liquid or liquid-rich slugflow inside the packed bed producing periodical sweeping ofthe particles With increasing ug the pulses in the packed bedbecame shorter and faster as the upstream liquid slugs becameshorter in length Further increasing ug resulted in a sparse slugflow pattern with discrete liquid pulses that spanned the entirewidth of the bed separated by long gas sections that pushed theliquid pockets out The observed pressure drops under theseflow conditions increased with increasing ug However longerpulses formed sporadically which produced a sudden decreasein pressure drop46 At higher ug and an annular flow in theempty channel upstream liquid spraying (but no discretepulses) over the whole packed bed was observed indicatingthat a gas-continuous flow formed in the packed bed27 Thisgas-continuous flow pattern was not always stable orachievable It could easily degrade to sparse slug flow uponany small disturbances from the upstream or the downstreamsections This was also accompanied by a variation in thepressure drop decreasing pressure drops were observed whenthe flow changed from the established gas-continuous flow tothe sparse slug flowFigure 6 shows the advancing front of the liquid slugs
entering the packed bed during the transition between a liquid
slug (entering) and a gas bubble (exiting) in the packed bedAt low gas velocities (top row in Figure 6) a fully segmentedpulsing flow was observed as liquid-rich pulses entered thepacked bed but did not span the whole packed bed cross-section indicating possible existence of liquid channellingpreferential flow We define this flow pattern as ldquoliquid-dominated slug flowrdquo (see Videos S2minusS5 of ug = 004minus040 ms) It is worth noting that the preferential flow paths taken bythe liquid seem to be due to entrapment of gas pockets in thepacked bed where the flow is not sufficient to remove thesegas pockets With increasing gas velocity (middle row in Figure6) the discrete features of the pulsing gradually diminished
and liquid pulses spanning the whole cross section of thepacked bed were observed We define this flow pattern asldquosparse slug flowrdquo where gas entrapment was negligible andtherefore the liquid slug covered the entire width of thepacked bed (see Videos S6minusS8 of ug = 071minus243 ms) butwith a significantly long gas-only phase in the bed between theliquid pulsesThe liquid pulses at gas velocities ug = 323 and 419 ms
were big and sharp pulses and swept over almost all the voidspace in the observation cell (bottom row in Figure 6) whichwas similar to the natural pulsing observed in conventionaltrickle beds We define this flow pattern as ldquogas-continuouswith pulsingrdquo flow (see Videos S9 and S10 of ug = 323 and419 ms) At the highest gas velocities (annularslug-annularflow upstream of the packed bed) the discrete pulses were sosmall that only some ldquograiny fluctuationsrdquo in the pixel valuedifferences were observed indicating there was liquid movingin the void space perhaps in the form of thin layers or smalldroplets (much like ldquosprayingrdquo) demonstrating the onset of aldquofully gas-continuousrdquo flow (see Video S11 of ug = 848 ms)The observed pulsing behavior can be characterized using
the liquid characteristic length (Λ) Figure 7 shows the traces
of the dynamic variation of Λ at different superficial gasvelocities while the liquid velocity was kept constant at 00075ms resulting in periodic responses The peaks of thecharacteristic length (Λ) of each trace represent a liquid-filledbed (ie maximum liquid fillingsweeping over the void space)and the troughs that of a gas-filled bed (with minimum liquidfilling ie gas-filled bed with wetted particles) The troughswere not considered for analysis because of significantfluctuations in the values brought about by the liquid holdupin the packed bed At the outset it is noted that the peakheights are lower at low ug than those at higher ug indicatingthat the transition from the ldquominimum liquid-filled bedrdquocondition to the ldquomaximum liquid-filled bedrdquo conditioninvolves significant gas-entrapment at lower ug On the otherhand as can be observed from the Videos S6minusS8 of ug = 071minus243 ms the ldquomaximum liquid-filledrdquo state contains negligiblegas-entrapment thereby resulting in higher peak heights(associated with transition from the ldquominimum liquid-filledbedrdquo condition)
Figure 6 Evolution of liquid pulsing in the copper particle bed atdifferent superficial gas velocities ug (at ul = 00075 ms) Blue colorindicates the regions of maximum variation in the pixel valuesbetween two consecutive frames thereby highlighting the path takenby a liquid slug and a gas bubble entering the micropacked bed Theframes shown represent the advancing front of a liquid slug enteringthe micropacked bed (dp = 58 μm) The flow is from the bottom tothe top of the frames
Figure 7 Traces of dynamic variation of characteristic length (Λ) atdifferent superficial gas velocities (ug) with superficial liquid velocityul = 00075 ms in the MPBR (dp = 58 μm)
Industrial amp Engineering Chemistry Research pubsacsorgIECR Article
httpsdoiorg101021acsiecr1c00089Ind Eng Chem Res XXXX XXX XXXminusXXX
F
Figure 7 shows that at lower gas velocities ug = 004minus04 ms the trace of the dynamic variation of Λ showed fairly regularpeaks (pulses) with sharp fronts and receding tailscorresponding to the liquid-rich sections of flow induced by
the upstream slug-flow (Figure 6 top left panel) in a similarway as reported by Boelhouwer et al47 for induced pulsingflow This is confirmed by the spectrograms in Figure 8 (toprow) where at ug = 004 ms the pulsation in the bed is
Figure 8 Spectrograms of G-L flow at the entrance of the packed bed in the MPBR (dp = 58 μm) obtained from the Λ dynamic traces at differentsuperficial gas velocities (ug) with a superficial liquid velocity of 00075 ms The x-axis is time (s) and the y-axis refers to the frequency of pulsationseen in Figure 7 The color scale represents the amplitude of a specific frequency at a particular time corresponding to the characteristic length (Λ)and the rectangular Fourier ldquowindowrdquo for every frequencyminustime combination A high amplitude denotes the dominant principle pulsationfrequency of the liquid slugs and the presence of secondary or tertiary frequencies denote the gas pushing the liquid phase out of the packed bed
Figure 9 Conversion of dichromate anions (X) versus superficial gas (ug) and liquid velocities (ul) in the MPBR (dp = 58 μm) Each set of coloredmarkers corresponds to an experiment performed with the same packing of copper particles
Industrial amp Engineering Chemistry Research pubsacsorgIECR Article
httpsdoiorg101021acsiecr1c00089Ind Eng Chem Res XXXX XXX XXXminusXXX
G
periodic at a single frequency of 4 Hz and the gas pushes theliquid out homogeneously (no secondary pulsation frequen-cies) As ug increased the frequency increased to 65 Hz and atug = 017 ms presence of secondary and tertiary frequencieswas observed (at 13 and 19 Hz respectively) indicating anonuniform pulsation across the bed These nonuniformdisturbances are ldquoproto-pulsesrdquo (ug = 017 and 040 ms) thatare observed at the transition region between liquid-dominatedslug flow and sparse slug flow These quasi steady-state proto-pulses go on to form fully developed pulses at higher ug similarto those reported by Boelhouwer et al47
At ug = 071minus243 ms the traces of the dynamic variationof Λ showed a transition to alternating liquid pulsing clustersinstead of the regular pulses at lower gas velocities This wasevident between ug of 04 and 071 ms (Figure 8) where theirregular pulsation frequency (proto-pulses) at 040 msreduced at 071 ms with increasing gas sections (denotedby the regions where the amplitude sim0 in Figure 8) and liquidpulsing in clusters The liquid pulsing clusters consisted ofpulses with different amplitudes (Figure 7) which indicates thecoexistence of preferential flow paths and discrete pulsesspanning the entire width of the bed as observed in Figure 6(sparse slug flow regime) The flat base sections in the tracesrepresent a minimal liquid filling of the void space which couldbe an indication of a gas-continuous section between twosuccessive liquid pulsing clusters The number of pulsesinvolved in the pulsing clusters decreased with increasing ug(1minus2 Hz per cluster in Figure 8 middle panel) This can berelated to the upstream slug-annular flow where the liquidslugs were getting shorter and the gas sections were gettinglonger with increasing gas velocityWith further increasing ug to 323 ms the traces of Λ
showed that the pulsing clusters were reduced to single sharpand narrow pulses and exhibited an organized pulsing flowsimilar to the natural pulsing developed under pulsing flowregime in macroscale trickle beds48 This transition occurredbetween ug of 243 and 323 ms At ug = 323 and 419 mswe observed a gas-continuous regime It is worth noting thatthe Λ trace at ug = 848 ms shows a totally flat line indicatinga fully gas-continuous flow pattern The superficial gas velocityof 848 ms is out of the gas flow rate range applied in this L-Smass transfer study but demonstrates that in micropackedbeds where the capillary forces are predominant a fully gas-continuous flow can still be achieved when the gas velocity ishigh enough27
Two-Phase Flow LiquidminusSolid Mass Transfer Con-version of Dichromate at the Exit of the Micropacked BedThe measurement of the L-S mass transfer coefficient with G-Ltwo-phase flow was carried out by varying the N2 gassuperficial velocity ug under a fixed liquid superficial velocityul The effect of ug on the conversion of dichromate anions (X)at four liquid superficial velocities is shown in Figure 9 Asstated in the Experimental Section each set of colored datacorresponds to an experiment performed with the samepacking of copper particles before repacking the microreactorwith new copper particles Overall it can be seen that theconversion of the dichromate anions showed a similar trendversus ug at all four liquid velocities The measured conversiondecreased sharply with increasing ug up to 06minus07 ms Thedecrease in the conversion was less severe with increasing ugand seemed to approach a minimum at ug of sim15 ms Themeasurements were quite reproducible with small deviations atug up to 15 ms with ul at 00037 and 00075 ms However
the deviations became large as ul increased further to 00112and 00149 ms The measured conversion at the exit of thepacked bed showed multiple responses conversion eitherincreaseddecreased or was not affected by ug for severalrepeated measurements which produced scattered results withincreasing liquid velocityIn the region of high gas velocities where multiple values of
conversion from the repeated measurements were observedfluctuations in pressure drop were also observed In general atug lt 15 ms the pressure drop increased steadily with gasvelocity for every set of measurements However withmeasurements starting from higher gas velocity (ug gt 15 ms) the observed pressure drop change upon increasing the gasvelocity showed no consistent pattern in the subsequent set ofmeasurements the pressure drop either increased consistentlywith increasing gas velocity or increased first and thendecreased or not increased at all depending on the flowpatterns formed in the micropacked bed (see Flow PatternObservation and Pulsing Behavior in the Micropacked Bed)This led to a variation in the dichromate conversion at the exitof the packed bed high pressure drop was observed when ahigher conversion was obtained and a low pressure drop whena lower conversion was obtained Hysteresis phenomena in thisregion were also observed (with increasingdecreasing gas flowrate) but it is not possible to analyze them accurately as thebed length and particle size changed considerably during theseprolonged experimentsFigure 10 shows measured conversions of the dichromate
anions at the exit of the copper bed with the corresponding
transitions from one flow pattern to another indicating acorrelation between the G-L flow patterns and the perform-ance of the copper dissolution The poor reproducibility of theconversion at ug gt 10 ms could be due to the fact that theflow patterns that developed in the packed bed were verysensitive to minor disturbances such as pressure fluctuationfrom upstream or downstream A gradual increase inconversion with ug was observed in the gas-continuous withpulsing regime (ug gt 243 ms) where as the liquid pulsing
Figure 10 Conversion of dichromate anions (X) versus superficial gasvelocity (ug) under different flow patterns observed in the MPBR (dp= 58 μm) Each set of colored markers corresponds to an experimentperformed with the same packing of copper particles
Industrial amp Engineering Chemistry Research pubsacsorgIECR Article
httpsdoiorg101021acsiecr1c00089Ind Eng Chem Res XXXX XXX XXXminusXXX
H
frequency increased the length of the gas-sections and hencethe effect of the slug flow decreasedVolumetric LiquidminusSolid Mass Transfer Coefficients In
experimental studies of L-S mass transfer using dissolutionmethods in macroscale packed beds the L-S volumetric masstransfer coefficient was commonly derived with an ideal plugflow reactor (PFR) model under steady flow conditions forboth trickling and pulsing flow regimes13151849 The dispersedflow model has often been used to describe the deviation fromplug flow by superimposing axial dispersion on the plug flowmodel More detailed models have also been developed likethe PDE (piston flow with axial dispersion and mass exchangebetween the dynamic and the stagnant zone) model bydividing the liquid phase in a packed bed into a dynamic and astagnant zone50minus52 or models with discrete series ofcontinuous mixing cells containing a stagnant zone53
However in micropacked beds with gasminusliquid flow fewstudies exist on the characterization of dispersion character-istics Marquez et al54 found that the dispersion in a smallmilli-packed bed (2 mm inner diameter and 90 cm long 115μm glass spheres) operated under a limited fluid-mechanicalinteraction of the gas phase with the liquid was lower than thedispersion in an equivalent single-liquid-phase system by afactor of 2minus3 Zhang et al55 reported that the dispersionnumber in a small packed bed (238minus533 mm inner diameterand 10 cm long with glass beads of various ranges within 150minus425 μm) was determined to be 0007minus002 with the gas andliquid superficial velocities well within the low interactionregimes as described by Faridkhou and Larachi26 indicating anearly plug flow behavior In our work the L-S mass transfercalculations for liquid flow only showed that axial back-mixingeffects under the applied flow conditions cannot be ignored(Figure 5) However the experimental determination ofdispersion characteristics and liquid holdup at micropackedbeds is challenging Faridkhou et al reported the difficulties inobtaining useful response from conductivity measurements in amicropacked bed (1 mm ID) under gasminusliquid flow29 Directvisualization using fluorescence microscopy and a high-speedcamera reported by Saber et al52 could be an alternativetechnique but this would be very difficult to adapt to thesmall-scale packed beds with channel dimensions of 06 mm(w) times 03 mm (h) and large GL ratios used in our work
To describe the axial dispersion under gasminusliquid flow in themicropacked bed the same equation as for single-phase (eq 2)was used but in the correlations of longitudinal dispersion inmacroscale porous media43 a modified superficial velocity termwas employed to account for the liquid holdup values5 Thesuperficial liquid velocity ul was divided by the liquid holdup toaccount for the fact that there was no gas inside the liquidzonelayer and thus the velocity u in eq 11 becomes
uu
hl
l bε=
(13)
The values of the liquid holdup were 065minus085 as reported byMarquez et al54 and 05minus07 as reported by Zhang et al55 inmilli-packed beds A value of the liquid holdup of 075 wasassumed and the mass transfer coefficients were calculatedusing eqs 6 and 12In macroscale gasminusliquid flows in packed beds it is
recognized that particle wetting depends strongly on liquidvelocity and weakly on gas velocity1849 Even though capillaryforces are expected to alter this behavior in the microscale towhat extent wetting effects are influential in the microscalepacked bed used in this work is difficult to ascertain For thisreason in our analysis we use an appropriately definedSherwood number accounting for potentially incompleteutilization of the copper surface area
Shk d
D
a
afs p
m
2phaseprime =prime
(14)
where a2phase is the specific copper surface area active duringthe two-phase mass transfer experiments (which is not knownbut measured together with ksprime) Because the experiments athigh gas flow rates showed irreproducible conversion of thedichromate anions the calculation of the L-S mass transfercoefficient was limited for the data with ug lt 1 ms and arepresented in the form of Sherwood number Shfprime in Figure 11Figure 11a shows that the Sherwood number decreases with
increasing ratio of gas-to-liquid superficial velocities It is worthnoting that the data practically collapse to a single curve for allul values The values of the two-phase L-S volumetric masstransfer coefficient (Figure 11b) are lower than those in therespective single liquid phase flow (Figure 5b) Similarbehaviour was reported by Templis and Papayannakos from
Figure 11 (a) Sherwood number (Shfprime) in the MPBR (dp = 58 μm) during gasminusliquid flow for various gas and liquid superficial velocities for datawith ug lt 1 ms (b) Corresponding mass transfer coefficients (ksprimea2phase) for ug lt 1 ms Error bars denote plusmn1 standard deviation
Industrial amp Engineering Chemistry Research pubsacsorgIECR Article
httpsdoiorg101021acsiecr1c00089Ind Eng Chem Res XXXX XXX XXXminusXXX
I
the studies of L-S mass transfer in milliscale string-bed reactors(reactor diameter 2 mm copper cylindrical particles dp = 15mm) using the copper dissolution method30 They attributedthis to the lower wetting efficiency of the particles during thegasminusliquid flow However they reported a small positive ornegligible response of the measured two-phase L-S volumetricmass transfer coefficient to the gas velocity Other investigatorswho studied L-S mass transfer in similar or larger scale reactorsreported similar insignificant or weak positive effects of gasvelocity on mass transfer13minus15184956 In particular Hirose etal15 Satterfield et al16 and Rao and Drikenburg19 observedthat the L-S mass transfer coefficient was not affected (orweakly affected) by gas velocity except during transition froma gas continuous flow (low interaction regime) to pulse flow(high interaction regime) when it increased In suchmacroscale systems the bubbles in the liquid phase decreasethe cross-sectional area available for liquid flow increasing theliquid velocity whereas they can also disturb the boundarylayer around the particles57 However a negative effect of gasvelocity on the L-S mass transfer has been reported byMohammed et al for a tubular reactor with solid foampacking58
In our work different pulsing flow structures were observedinside the micropacked bed which are closely related to the G-L flow patterns preceding the packed bed At the gas velocityrange 004 to 040 ms in which the L-S mass transfercoefficient declined with increasing gas velocities the micro-packed bed operated under liquid-dominated slug flow regimeand from 040 ms to sim10 ms sparse slug flow also startedcontributing as the feed upstream of the bed transitioned fromslug to slug-annular flow For industrial trickle bed reactorsinduced pulsing by cyclic liquid feed has been recommended asa method to improve fluid distribution and mass transfer incatalytic packed beds However enhancement in the reactorperformance by induced pulsing depends on the nature of thereaction ie whether the reaction is gas-limited or liquid-limited224759 The values of the two-phase L-S volumetricmass transfer coefficient in Figure 11b show an overallenhanced L-S mass transfer in the micropacked bed ascompared to literature In conventional lab scale beds packedwith cylindrical particles (3minus6 mm) or spherical particles(054minus24 mm) ksa was reported to be in the order of 10minus2 to10minus1 sminus114171860 Templis and Papayannakos30 reported ksa onthe order of 10minus2 sminus1 in structured-bed minireactors formedwith cylindrical particles (15 mm diameter) In our micro-packed bed ksa is of the order of 10 s
minus1 This difference can beattributed to the enhancement of the active specific surfacearea a and possibly also of the mass transfer coefficient ks inour micropacked bedHirose et al observed an enhancement of the L-S mass
transfer coefficient when gas flow was introduced for increasingparticle size (dp = 28minus127 mm)15 However this enhance-ment became less significant for smaller particles and in factreversed (two-phase flow gave smaller L-S mass transfercoefficient than liquid only flow) at even smaller particles (dp =05 mm)14 This behavior was attributed to the effect ofincreasing linear velocity (and hence increasing mass transfer)that dominates at large particle sizes and the effect of decreaseof effective surface area (and hence decreasing mass transfer)that dominates at smaller particle sizes A similar decrease ofeffective wetted surface area because of gas-entrapment inconjunction with the increased importance of capillary forcesin the microscale may be the reason for the observed decrease
of the volumetric mass transfer coefficient with gas flow rate(at ug lt 15 ms) The occasional higher conversions at ug gt15 ms are difficult to attribute due to the large fluctuations inthe flow patterns in that regionFigure 11b shows an increasing trend of the volumetric mass
transfer coefficient with liquid flow rate following the sametrend as that in liquid phase flow This trend is much moresignificant in macroscale systems Various investiga-tors1315184956 observed a strong increase of L-S mass transfercoefficient during two-phase flow with liquid velocityattributed to enhancement of solid wetting by the liquid anda decrease in the thickness of the liquid film surrounding theparticles It is worth mentioning that a fixed value of the liquidholdup of 075 was employed in the calculation of the L-S masstransfer coefficients Although Marquez et al reported that theliquid holdup did not vary significantly with gas velocity54
Zhang et al observed a substantial effect of gas and liquidsuperficial velocities on the liquid holdup in a micropackedbed decreasing ul or increasing ug resulted in decreased liquidholdup55 However our calculations of the L-S mass transfercoefficients were not sensitive to the value of the liquid holdupin the range of 065 to 085 showing a variation of thecalculated volumetric L-S mass transfer coefficients by plusmn1minus5which did not significantly alter the dependence of thecalculated Shprimef on gas and liquid superficial velocities in Figure11 On the basis of the data in Figure 11 a correlation of theSherwood number with the gas and liquid Reynolds numberswas obtained The data fitted well the following equation withrelative error within plusmn15 (see Figure 12)
Sh Re Re Re Re144 02 1 03 6f l054
g034
l gprime = lt lt lt ltminus
(15)
There are only limited studies which obtained L-S masstransfer coefficients with G-L flow using packed beds withsubmillimeter particles Goto and Smith14 developed adimensional correlation that showed that the Sherwoodnumber depended on the liquid flow rate raised to a powerof 056minus067 for dp = 0054minus024 mm Saroha performedexperiments with dp = 05 mm and found that the L-S mass
Figure 12 Parity plot of the experimental and the correlatedSherwood number during gasminusliquid flow in the MPBR used in thiswork (dp = 58 μm) for ug lt 1 ms
Industrial amp Engineering Chemistry Research pubsacsorgIECR Article
httpsdoiorg101021acsiecr1c00089Ind Eng Chem Res XXXX XXX XXXminusXXX
J
transfer coefficient increased with increasing ug (60minus170 mms) and also with ul (87minus261 mms) but did not report acorrelation13
CONCLUDING REMARKSThe liquidminussolid mass transfer in a chip-based micropackedbed under G-L two-phase flow was studied using the copperdissolution method Liquid and gas were introduced into thepacked bed via a T-junction Hydrodynamic studies using ahigh-speed camera revealed that different pulsing structuresdeveloped inside the packed copper bed as a result of the flowpatterns established preceding the packed bed These resultsshow that pulsing flow was predominant in the MPBR for thewhole range of G-L flow rates investigated in this work Thecharacteristics of the pulsing structures varied depending onthe flow pattern of upstream G-L flow With an upstream slug-flow feed a liquid-dominated slug flow was observed in the bedwith apparent channelling due to significant gas-entrapmentupon increasing the gas flow rate a sparse slug flow wasobserved in the bed with the liquid pulses spanning the crosssection of the packed bed With an upstream annular flow feeda gas-continuous pulsing flow was observed with discreteliquid pulses between long gas sections However this flowpattern was sensitive and destabilized by disturbances fromupstream or downstream pressure fluctuations or nonuniformpacking which made the reaction measurement in higher gasvelocities irreproducibleThere was a transition from the liquid-dominated slug flow
regime to the sparse slug flow regime when the upstream(feed) flow became slug-annular where pulsing clusters with agas-continuous flow section was observed On performing theL-S mass transfer studies the observed Sherwood numbersincreased with increasing liquid velocity for the whole range ofgas and liquid velocities However they decreased with gasvelocity under the liquid-dominated slug flow regime likelydue to a reduction of the effective interfacial area because ofgas-entrapment Investigations of the effect of partial-wettingand boundary layer thickness can shed further light on thereasons behind the decreasing mass transfer The mass-transfer however was less affected during the sparse slugflow regime possibly due to the negligible presence of gaspockets resulting in an increase of the effective interfacial areaWhile our studies have been performed with nonporousparticles investigation of porous catalysts are required toimprove the correlations for use in catalytic micropacked bedreactors
ASSOCIATED CONTENTsı Supporting InformationThe Supporting Information is available free of charge athttpspubsacsorgdoi101021acsiecr1c00089
Details on the copper particle size distribution andinformation on how to pack a micropacked bed reactor(PDF)Video S1 showing the image analysis routine estimatingthe pulsation pattern in the packed bed (MP4)Video S2 raw high-speed video of pulsation with gassuperficial velocity of 004 ms recorded at 1000 fps andplayed back at 20 fps (MP4)Video S3 raw high-speed video of pulsation with gassuperficial velocity of 008 ms recorded at 1000 fps andplayed back at 20 fps (MP4)
Video S4 raw high-speed video of pulsation with gassuperficial velocity of 017 ms recorded at 1000 fps andplayed back at 20 fps (MP4)Video S5 raw high-speed video of pulsation with gassuperficial velocity of 040 ms recorded at 1000 fps andplayed back at 20 fps (MP4)Video S6 raw high-speed video of pulsation with gassuperficial velocity of 071 ms recorded at 1000 fps andplayed back at 20 fps (MP4)Video S7 raw high-speed video of pulsation with gassuperficial velocity of 161 ms recorded at 1000 fps andplayed back at 20 fps (MP4)Video S8 raw high-speed video of pulsation with gassuperficial velocity of 243 ms recorded at 1000 fps andplayed back at 20 fps (MP4)Video S9 raw high-speed video of pulsation with gassuperficial velocity of 323 ms recorded at 1000 fps andplayed back at 20 fps (MP4)Video 10 raw high-speed video of pulsation with gassuperficial velocity of 419 ms recorded at 1000 fps andplayed back at 20 fps (MP4)Video 11 raw high-speed video of pulsation with gassuperficial velocity of 848 ms recorded at 1000 fps andplayed back at 20 fps (MP4)
AUTHOR INFORMATIONCorresponding Author
Asterios Gavriilidis minus Department of Chemical EngineeringUniversity College London London WC1E 7JE UnitedKingdom orcidorg0000-0003-3508-5043Email agavriilidisuclacuk
AuthorsEnhong Cao minus Department of Chemical EngineeringUniversity College London London WC1E 7JE UnitedKingdom
Anand N P Radhakrishnan minus Department of ChemicalEngineering University College London London WC1E 7JEUnited Kingdom orcidorg0000-0002-9763-8830
Redza bin Hasanudin minus Department of Chemical EngineeringUniversity College London London WC1E 7JE UnitedKingdom
Complete contact information is available athttpspubsacsorg101021acsiecr1c00089
Author ContributionsdaggerEC and ANPR contributed equally to this workNotesThe authors declare no competing financial interest
ACKNOWLEDGMENTSFinancial support from EPSRC UK (Grants EPJ017833 andEPL027232) is gratefully acknowledged
NOTATIONa Specific surface area of the packed bed [m2
particle mminus3
bed]a2phase Specific copper surface area active during the two-phase mass-transfer experiments [m2
particle mminus3
bed]
B 1 k aDu
4 s ax
l2+ prime
c Concentration of dichromate anions in the packed bed[mol mminus3]
Industrial amp Engineering Chemistry Research pubsacsorgIECR Article
httpsdoiorg101021acsiecr1c00089Ind Eng Chem Res XXXX XXX XXXminusXXX
K
c0 Concentration of dichromate anions at the entrance ofthe packed bed [mol mminus3]cL Concentration of dichromate anions at the outlet of thepacked bed [mol mminus3]Dax Axial dispersion coefficient based on the superficialvelocity ul [m
2 sminus1]Dax u Axial dispersion coefficient based on the interstitialvelocity u [m2 sminus1]Dm Molecular diffusivity [m2 sminus1]dp Diameter of the copper particles [m]h Height of the microchannel [m]hl Liquid holdup [mliquid
3 mvoidminus3]
ks Mass-transfer coefficient without axial dispersion [m sminus1]ksprime Mass-transfer coefficient with axial dispersion [m sminus1]L Length of the copper packed bed [m]N Hydraulic channel diameter to particle diameter ratioPem Peclet number without axial dispersion udpDm
minus1
Peprimem Effective Peclet number udp(Dmτ)minus1
r Overall rate of the copper dissolution reaction [mol sminus1
mminus3]Reg Gas Reynolds number ugdpν
minus1
Rel Liquid Reynolds number uldpνminus1
Sc Schmidt number νDmminus1
Sh Sherwood number without axial dispersion ksdpDmminus1
Shprime Sherwood number with axial dispersion ksprimedpDmminus1
Shprimef Modified Sherwood number with axial dispersionk d
D
a
am
s p 2phaseprime
u Interstitial liquid velocity [m sminus1]ug Superficial gas velocity [m sminus1]ul Superficial liquid velocity [m sminus1]w Width of the microchannels [m]X Conversion of dichromate anionsy Position along the copper packed bed [m]
GREEK LETTERSΛ Characteristic length of flow pattern in MPBRεb Bed voidage [mvoid
3 mbedminus3]
ν Kinematic viscosity [m2 sminus1]τ Tortuosity factor of the micropacked bed
REFERENCES(1) Hessel V Hardt S Loumlwe H Chemical Micro ProcessEngineering Fundamentals Modelling and Reactions WileyminusVCHDarmstadt Germany 2006(2) Hessel V Loumlwe H Muller A Kolb G Chemical Micro ProcessEngineering Processing and Plants WileyminusVCH Darmstadt Germany2006(3) Losey M W Schmidt M A Jensen K F Microfabricatedmultiphase packed-bed reactors characterization of mass transfer andreactions Ind Eng Chem Res 2001 40 (12) 2555minus2562(4) Alsolami B H Berger R J Makkee M Moulijn J A Catalystperformance testing in multiphase systems implications of using smallcatalyst particles in hydrodesulfurization Ind Eng Chem Res 201352 (26) 9069minus9085(5) Moulijn J A Makkee M Berger R J Catalyst testing inmultiphase micro-packed-bed reactors criterion for radial masstransport Catal Today 2016 259 354minus359(6) Cao E Brett G Miedziak P J Douthwaite J M Barrass SMcMillan P F Hutchings G J Gavriilidis A A micropacked-bedmulti-reactor system with in situ Raman analysis for catalystevaluation Catal Today 2017 283 195minus201(7) Tadepalli S Halder R Lawal A Catalytic hydrogenation of o-nitroanisole in a microreactor reactor performance and kineticstudies Chem Eng Sci 2007 62 (10) 2663minus2678
(8) Ajmera S K Losey M W Jensen K F Schmidt M AMicrofabricated packed-bed reactor for phosgene synthesis AIChE J2001 47 (7) 1639minus1647(9) Bakhtiary-Davijany H Hayer F Phan X K Myrstad RVenvik H J Pfeifer P Holmen A Characteristics of an integratedmicro packed bed reactor-heat exchanger for methanol synthesis fromsyngas Chem Eng J 2011 167 (2) 496minus503(10) Inoue T Schmidt M A Jensen K F Microfabricatedmultiphase reactors for the direct synthesis of hydrogen peroxide fromhydrogen and oxygen Ind Eng Chem Res 2007 46 (4) 1153minus1160(11) Knochen J Guttel R Knobloch C Turek T FischerminusTropsch synthesis in milli-structured fixed-bed reactors experimentalstudy and scale-up considerations Chem Eng Chem Eng Process2010 49 (9) 958minus964(12) Zhang J Wang K Teixeira A R Jensen K F Luo GDesign and scaling up of microchemical systems a review Annu RevChem Biomol Eng 2017 8 (1) 285minus305(13) Saroha A K Solidminusliquid mass transfer studies in trickle bedreactors Chem Eng Res Des 2010 88 (5minus6) 744minus747(14) Goto S Smith J M Trickle-bed reactor performance Part IHoldup and mass transfer effects AIChE J 1975 21 (4) 706minus713(15) Hirose T Mori Y Sato Y Liquid-to-particle mass transfer infixed bed reactor with cocurrent gas-liquid downflow J Chem EngJpn 1976 9 (3) 220minus225(16) Satterfield C N Van Eek M W Bliss G S Liquid-solidmass transfer in packed beds with downward concurrent gas-liquidflow AIChE J 1978 24 (4) 709minus717(17) Speccia V Baldi G Gianetto A Solid-liquid mass transfer inconcurrent two-phase flow through packed beds Ind Eng ChemProcess Des Dev 1978 17 (3) 362minus367(18) Lakota A Levec J Solid-liquid mass transfer in packed bedswith cocurrent downward two-phase flow AIChE J 1990 36 (9)1444minus1448(19) Rao V G Drinkenburg A A H Solid-liquid mass transfer inpacked beds with cocurrent gas-liquid downflow AIChE J 1985 31(7) 1059minus1068(20) Chau P C Local liquid-solid mass transfer measurement in atrickle film flow model using an electrochemical technique Int J HeatMass Transfer 1987 30 (11) 2305minus2317(21) Rode S Midoux N Latifi M A Storck A Hydrodynamicsand liquid-solid mass transfer mechanisms in packed beds operating incocurrent gas-liquid downflow an experimental study using electro-chemical shear rate sensors Chem Eng Sci 1994 49 (9) 1383minus1401(22) Trivizadakis M E Karabelas A J A study of local liquidsolidmass transfer in packed beds under trickling and induced pulsing flowChem Eng Sci 2006 61 (23) 7684minus7696(23) Morita S Smith J M Mass transfer and contacting efficiencyin a trickle-bed reactor Ind Eng Chem Fundam 1978 17 (2) 113minus120(24) Yoshikawa M Iwai K Goto S Teshima H Liquid-solidmass transfer in gas-liquid cocurrent flows through beds of smallpackings J Chem Eng Jpn 1981 14 (6) 444minus450(25) Tan C S Smith J M A dynamic method for liquid-particlemass transfer in trickle beds AIChE J 1982 28 (2) 190minus195(26) Faridkhou A Larachi F Hydrodynamics of gas-liquidcocurrent flows in micropacked beds - wall visualization study IndEng Chem Res 2012 51 (50) 16495minus16504(27) Al-Rifai N Galvanin F Morad M Cao E Cattaneo SSankar M Dua V Hutchings G Gavriilidis A Hydrodynamiceffects on three phase micro-packed bed reactor performance - gold-palladium catalysed benzyl alcohol oxidation Chem Eng Sci 2016149 129minus142(28) Tidona B Desportes S Altheimer M Ninck K von RohrP R Liquid-to-particle mass transfer in a micro packed bed reactorInt J Heat Mass Transfer 2012 55 (4) 522minus530(29) Faridkhou A Tourvieille J-N Larachi F Reactionshydrodynamics and mass transfer in micro-packed beds - Overviewand new mass transfer data Chem Eng Process 2016 110 80minus96
Industrial amp Engineering Chemistry Research pubsacsorgIECR Article
httpsdoiorg101021acsiecr1c00089Ind Eng Chem Res XXXX XXX XXXminusXXX
L
(30) Templis C C Papayannakos N G Liquid-to-particle masstransfer in a structured-bed minireactor Chem Eng Technol 2017 40(2) 385minus394(31) Cao E Motherwell W B Gavriilidis A Single andmultiphase catalytic oxidation of benzyl alcohol by tetrapropylammo-nium perruthenate in a mobile microreactor system Chem EngTechnol 2006 29 (11) 1372minus1375(32) Cao E Gavriilidis A Oxidative dehydrogenation of methanolin a microstructured reactor Catal Today 2005 110 (1minus2) 154minus163(33) Gregory D P Riddiford A C Dissolution of copper insulfuric acid solutions J Electrochem Soc 1960 107 (12) 950minus956(34) Gruber R Melin T Mixed convection in the copperdissolution technique of studying mass transfer Int J Heat MassTransfer 2003 46 (13) 2403minus2413(35) Oliphant T E Python for scientific computing Comput SciEng 2007 9 (3) 10minus20(36) Van Der Walt S Colbert S C Varoquaux G The NumPyarray a structure for efficient numerical computation Comput SciEng 2011 13 (2) 22minus30(37) van Rossum G Python Tutorial Technical Report CS-R9526 Centrum voor Wiskunde en Informatica Amsterdam 1995(38) Beucher S Lantueacutej C Use of watersheds in contourdetection In International Workshop on Image Processing Real-TimeEdge and Motion DetectionEstimation Rennes France 1979(39) Patel M Radhakrishnan A N P Bescher L Hunter-SellarsE Schmidt-Hansberg B Amstad E Ibsen S Guldin STemperature-induced liquid crystal microdroplet formation in apartially miscible liquid mixture Soft Matter 2021 17 (4) 947minus954(40) Serres M Maison T Philippe R Vidal V Aphenomenological model for bubble coalescence in confined highlyporous media Int J Multiphase Flow 2018 105 134minus141(41) Serres M Zanota M L Philippe R Vidal V On thestability of Taylor bubbles inside a confined highly porous mediumInt J Multiphase Flow 2016 85 157minus163(42) Levenspiel O Chemical Reaction Engineering 3rd ed JohnWiley amp Sons New York 1999(43) Delgado J M P Q Longitudinal and transverse dispersion inporous media Chem Eng Res Des 2007 85 (9) 1245minus1252(44) Delgado J M P Q A critical review of dispersion in packedbeds Heat Mass Transfer 2006 42 (4) 279minus310(45) Wakao N Funazkri T Effect of fluid dispersion coefficientson particle-to-fluid mass transfer coefficients in packed bedsCorrelation of Sherwood numbers Chem Eng Sci 1978 33 (10)1375minus1384(46) Radhakrishnan A N P Pradas M Sorensen E KalliadasisS Gavriilidis A Hydrodynamic characterization of phase separationin devices with microfabricated capillaries Langmuir 2019 35 (25)8199minus8209(47) Boelhouwer J G Piepers H W Drinkenburg A A HLiquid-induced pulsing flow in trickle-bed reactors Chem Eng Sci2002 57 (16) 3387minus3399(48) Tsochatzidis N A Karabelas A J Experiments in trickle bedsat the micro- and macroscale Flow characterization and onset ofpulsing Ind Eng Chem Res 1994 33 (5) 1299minus1309(49) Gonzaacutelez-Mendizabal D Aguilera M E Pironti F Solid-liquid mass transfer and wetting factors in trickle bed reactors effectof the type of solid phase and the presence of chemical reactionChem Eng Commun 1998 169 37minus55(50) Stegeman D Van Rooijen F E Kamperman A A WeijerS Westerterp K R Residence time distribution in the liquid phase ina cocurrent gas-liquid trickle bed reactor Ind Eng Chem Res 199635 (2) 378minus385(51) Iliuta I Larachi F Grandjean B P A Residence time masstransfer and back-mixing of the liquid in trickle flow reactorscontaining porous particles Chem Eng Sci 1999 54 (18) 4099minus4109(52) Saber M Huu T T Pham-Huu C Edouard D Residencetime distribution axial liquid dispersion and dynamic-static liquid
mass transfer in trickle flow reactor containing β-SiC open-cell foamsChem Eng J 2012 185minus186 294minus299(53) Serres M Schweich D Vidal V Philippe R Liquidresidence time distribution of multiphase horizontal flow in packedbed milli-channel spherical beads versus open cell solid foams ChemEng Sci 2018 190 149minus163(54) Maacuterquez N Castano P Makkee M Moulijn J A KreutzerM T Dispersion and holdup in multiphase packed bed microreactorsChem Eng Technol 2008 31 (8) 1130minus1139(55) Zhang J Teixeira A R Koumlgl L T Yang L Jensen K FHydrodynamics of gasminusliquid flow in micropacked beds pressuredrop liquid holdup and two-phase model AIChE J 2017 63 (10)4694minus4704(56) Bartelmus G Local solid-liquid mass transfer coefficients in athree-phase fixed bed reactor Chem Eng Process 1989 26 (2) 111minus120(57) Shao N Gavriilidis A Angeli P Flow regimes for adiabaticgas-liquid flow in microchannels Chem Eng Sci 2009 64 (11)2749minus2761(58) Mohammed I Bauer T Schubert M Lange R Liquid-solidmass transfer in a tubular reactor with solid foam packings Chem EngSci 2014 108 223minus232(59) Wilhite B A Huang X McCready M J Varma A Effects ofinduced pulsing flow on trickle-bed reactor performance Ind EngChem Res 2003 42 (10) 2139minus2145(60) Sylvester N D Pitayagulsarn P Mass transfer for two-phasecocurrent downflow in a packed bed Ind Eng Chem Process Des Dev1975 14 (4) 421minus426
Industrial amp Engineering Chemistry Research pubsacsorgIECR Article
httpsdoiorg101021acsiecr1c00089Ind Eng Chem Res XXXX XXX XXXminusXXX
M
other hand at higher gas and liquid flow rates a highinteraction regime is obtained where bubble dispersed andpulse flow lead to improved mass transfer characteristics1518
Even though trickle flow is not obtained at the microscalebecause of the dominance of capillary forces4 low and highinteraction regimes exist Gas and liquid phases have a ratherconstant share of the bed voidage without significantlyperturbing each other at low flow rates (low interaction)while at increased liquid superficial velocities a competitionbetween the two phases for the void spaces leads tofluctuations in both gas and liquid characteristic lengths(high interaction)26
The correlations for larger scale packed bed reactors are notsuitable for predicting the mass transfer in microscale packedbed reactors37 The main reason for this comes from the factthat viscous and capillary forces are predominant in theMPBRs in comparison with the large-scale packed bedreactors427 Hydrodynamic behavior of an MPBR (or even abench-scale trickle-bed reactor) differs from that of anindustrial-scale trickle bed due to the significant effect ofcapillary forces and consequently there could be no real trickleflow in a microscale packed bed4 In literature L-S masstransfer studies in MPBRs are scarce Tidona et al28 reported astudy of liquid-to-particle mass transfer in micropacked bedswith liquid-only flow using the copper dissolution method fordifferent channel geometries ie circular and rectangular andchannel hydraulic diameter to particle diameter ratio N Theydemonstrated that the shape of the channel has no influenceon the liquid-to-particle mass transfer as long as N is constantFaridkhou et al29 determined L-S mass transfer coefficients inmicropacked beds with single-phase flow using an electro-chemical method with an electrolyte solution containingferricyanide and ferrocyanide Single liquid-phase flow experi-ments revealed much higher volumetric L-S mass transfercoefficients as compared to macroscale packed beds Althoughobtained at different velocity range and particle sizes themeasured mass transfer coefficients tended to be in agreementwith the data reported by Tidona et al However themeasurement of the L-S mass transfer coefficient with G-Ltwo-phase flow was not successful as the electrochemicaltechnique showed limitations Templis and Papayannakos30
reported the study of L-S mass transfer using the copperdissolution method in mini-string reactors formed withcylindrical particles in spiral and vertical configurations andoperated with liquid-only and G-L feeds in upflow mode Themeasurement of liquid-to-solid mass transfer thus remains achallenge in MPBRsIn this study we investigated the L-S mass transfer in
MPBRs with G-L flow The copper dissolution method wasemployed as it has been widely used in L-S mass transferstudies We present the effect of gas and liquid superficialvelocities on the conversion of dichromate ions in the copperdissolution reaction Subsequently we estimate the L-S masstransfer coefficients assuming an axial dispersion modelFurthermore the flow dynamics of different G-L two-phaseflows were investigated to correlate flow transitions with thereaction conversions obtained in the MPBR Advancing ourprevious work27 we employed a high-speed imaging method-ology coupled with computational signal processing analysis toaccurately record the pulsation properties in the micropackedbed rather than relying only on qualitative observations fromimage snapshots
EXPERIMENTAL SECTIONMicropacked Bed Reactor A silicon-glass microreactor of
size 23 mm times 23 mm was used in all experiments (see Figure1) It consisted of a T-mixer near the gas and liquid inlets for
generating a G-L segmented flow The main part of the reactorwas a serpentine-shaped microchannel with width (w) 06 mmand height (h) 03 mm Rectangular pillars (004 mm times 1 mmin 004 mm intervals) were located near the reactor outletwhich enabled the packing of solid particles inside themicrochannel31 A photolithographic process followed bydeep reactive ion etching was employed for the fabrication ofthe microreactor A glass wafer (Corning 7740 Pyrex 1 mmthick) was drilled to produce holes for reactor inlets andoutlets It was then placed on top of the structured siliconwafer and the two wafers were sealed together by anodicbonding32
Spherical copper particles (-100 + 325 mesh 99 metalsbasis Alfa Aesar) were sieved and fractions of particle sizes of53minus63 μm and 63minus75 μm were used for packing They weremeasured using a digital microscope (VHX-600 Keyence)(Figure S1) Particles of diameter 63minus75 μm (mean diameter68 μm) were only used for the measurement of L-S masstransfer coefficients with single liquid-phase flow whereasparticles of diameter 53minus63 μm (mean diameter 58 μm) wereused for the G-L two-phase flow experiments Approximately 1mg copper particles was packed to form a packed bed length of1minus12 mm The procedure followed to pack the reactorreproducibly is described in the Supporting Information Thecopper bed was placed between glass beads of diameter 63minus75μm (μ-sphere Whitehouse Scientific) for stabilizing the flowupstream of the copper micropacked bed (Figure 1) Thelengths of the glass bead sections were about 5minus6 mm beforeand 1minus2 mm after the copper particle bed The flowobservation experiments were performed only on the copperparticle bed
Copper Dissolution Method The diffusion-controlleddissolution of copper in acidified potassium dichromate wasemployed for the measurement of L-S mass transfer Theoverall reaction of the copper dissolution is described asfollows
3Cu K Cr O 7H SO
3CuSO K SO Cr (SO ) 7H O2 2 7 2 4
4 2 4 2 4 3 2
+ +
rarr + + +
Figure 1 Silicon-glass microreactor with magnification of the copperparticle bed area (overall chip size 23 mm times 23 mm copper particlesize 53minus63 μm)
Industrial amp Engineering Chemistry Research pubsacsorgIECR Article
httpsdoiorg101021acsiecr1c00089Ind Eng Chem Res XXXX XXX XXXminusXXX
B
There are two steps involved namely (1) diffusion of thedichromate anion Cr2O7
2minus from the liquid phase to the solidcopper surface across the diffusion layer and (2) chemicalreaction between Cr2O7
2minus ion and Cu0 on the particle surfaceReaction step 2 is considered instantaneous and the overallrate of the reaction is controlled by the diffusion step33
A solution containing 033 mM K2Cr2O7 in 033 M H2SO4was used as suggested by Gruber and Melin34 to minimize theinfluence of natural convection between the fluid and thesurface of copper particles The ratio of acid to dichromateconcentration was 1000 which was larger than 7 as suggestedby Gregory and Riddiford33 and was high enough to excludeany ionic migration and to ensure that the transport ofdichromate ions to the copper surface occurred only by forcedconvection28
Experimental Procedure for Mass Transfer Coeffi-cient Determination A schematic diagram of the exper-imental setup is shown in Figure 2 The prepared micropacked
bed reactor was placed in a Perspex holder where the inlet andoutlets were connected using 116 in PTFE tubing The feedsolution was supplied by a syringe pump (Harvard PhD Ultra)Nitrogen gas (Zero grade BOC) was metered by a mass flowcontroller (SLA Brooks Instruments) Liquid samples werecollected at the outlet of the reactor by directing either liquid-only flow or G-L flow into cuvettes (UV-Cuvette microBrand) where the gas and liquid were separated by gravityBefore the experiment a leak test was performed at 2 bar to
ensure the flow system was gastight After the leak test the gasline was closed and the liquid feed solution was pumped intothe reactor at the desired flow rate When the reactor channelfilled up with liquid N2 gas was introduced into the reactor at apreset flow rate The system was then left running forapproximately 10 min to let the flow stabilize A set of threesamples with an approximate volume of 150 μL each wascollected in cuvettes at each G-L flow condition The sampleswere analyzed using a UVminusvis spectrometer (UV-2550Shimadzu) and the absorption peak of Cr(VI) at thewavelength of 350 nm was used to quantify the concentrationof the potassium dichromateThe copper dissolution experiments were carried out at
ambient conditions with a constant room temperature of 22degC For single phase flow the liquid superficial velocity (ul)varied in the range of 37 times 10minus3 to 11 times 10minus1 ms For the G-L two phase flow through the packed copper bed the L-S masstransfer was studied at four superficial liquid velocities rangingfrom 37 times 10minus3 to 15 times 10minus2 ms while the superficial gasvelocity (ug) was varied from 9 times 10minus2 to 358 ms at eachliquid velocity level with G-L flow rate ratios ranging from 60to sim1000
Because copper is consumed during the reaction the particlesize and their surface morphology could change which couldalter the properties of the packed bed Tidona et al28 foundabout 5minus17 variation in measured Sherwood numberbetween a single use (single measurement) packed bed and amulti-use (4minus5 consecutive measurements) packed bed Nosignificant changes in the particle size and the bed length wereobserved after the experiments with multi-use reactors In ourwork each packed microreactor was used for the mass transferstudies over four or five G-L flow conditions (multi-use packedbed) to ensure the changes in copper particle size and thepacked bed length after the measurements were less than 10minus17 This was checked by examining the copper packed bedand measuring the bed length before and after each experiment(a set of typical pictures of the packed bed before and after theexperiment is given in the Supporting Information) For thehigher rates of dissolution which corresponded to higher liquidflow rates the duration of experiment was limited by using afixed volume of the liquid solution in each experiment whichlimited the reduction of the bed length to less than 15minus17The conditions and data obtained toward the end of anexperiment were repeated in the next experiment with a freshbed to ensure consistency of results In this way the range ofG-L flow for the newly packed reactor always had one pointoverlapping with the previous set of flow conditions Themeasurements were always performed with increasing gas flowrate
Flow Observation and Characterization Quantitativecharacterization of the G-L flow in the copper particle bed wasperformed using a high-speed imaging methodology A high-speed camera (Mini AX-100 Photron) mounted on a digitalmicroscope (Axioscope A1 Carl Zeiss) was employed for flowvisualization studies using water and nitrogen gas Images wereacquired at 1000 frames per second (fps) ie 1 image per msat an exposure of 0996 ms and 10times magnification resulting inan image of size 960 μm times 605 μm Dark-field imaging wasimplemented as opposed to conventional bright-field micros-copy which overcame the limitation of observing just thestagnant liquid pockets under the glass cover layer commonlyseen in the literature This microscopy technique highlights thechange in contrast on the surface of the copper particlesthereby accurately picking up the fluctuations of the gasminusliquidpulses Images of the two-phase flow in the packed bed werethen processed using an automated computational imageanalysis script developed on the Python programminglanguage35minus37 In short the images were loaded by the scriptand a preprocessing algorithm was applied wherein theparticles in the image were distinguished from one anotherand from the void area by a watershed segmentation techniquewith an Otsu binary threshold3839 Artifacts in the image werethen removed by a median filter thus resulting in a binaryimage of zeroes and ones (see Figure 3 black represents theapparent copper particles and whiteminusthe void space ie thespace available for G-L flow) Identifying the copper particlesand removing them from analysis enabled the tracking of gasminusliquid pulsation in the void space with high accuracy The totalarea of the void space was calculated per frame to analyze therelative change in the void area during the G-L flow (see theSupporting Information and Video S1) Video S1 shows theraw frames of the micropacked bed before and after filteringthe copper particles and corresponding temporal estimation ofthe background area around the particles highlighting thefluctuations The total void area was divided by the length of
Figure 2 Experimental setup for liquidminussolid mass transfermeasurement PIC pressure controller MFC mass flow controllerP pressure sensor Valve needle valve to switch flow onoff
Industrial amp Engineering Chemistry Research pubsacsorgIECR Article
httpsdoiorg101021acsiecr1c00089Ind Eng Chem Res XXXX XXX XXXminusXXX
C
the image to give rise to a characteristic length (Λ)Normalizing the void area by the length of the image (in thedirection of the fluid flow) highlights the pixel-fluctuations dueto pulsation across the width of the packed bed (in thedirection perpendicular to flow) around the copper particlesPeaks of the Λ curve (local maxima) corresponded to the bedfilled with liquid and the troughs (local minima) represented agas-filled bed To quantify the flow transitions spectrogramswere generated from the Λ curves through a series of Fouriertransforms using Python4041 Spectrograms highlight theprinciple frequency of pulsation in the packed bed over timeand provide information on how the gas pushes the liquid slugsout of the bed through secondary or tertiary frequenciesSpectrograms were generated using a rectangular window ofsampling frequency 1 s with 1000 samples per segment Theimage analysis script written using Python accuratelydistinguished individual particles which were then removedfrom further analysis as including the particles to determinethe Λ curve would lead to erroneous resultsTo aid visualization of the pulsing flow another script was
written to calculate the difference in the pixel values betweentwo consecutive frames thereby highlighting the regions ofmaximum variation in the pixel values when there is a changein fluid phase In practical terms this allowed the observationof the path taken by the G-L interface around the particles
RESULTS AND DISCUSSION
Single-Phase Flow LiquidminusSolid Mass Transfer Theliquidminussolid (L-S) mass transfer coefficient was first measuredwith only liquid phase flowing through the copper particlepacked bed (mean diameter 68 μm) to validate theexperimental setup and procedures and serve as a referenceThe conversion of the dichromate anions (X) with varyingliquid superficial velocity (ul) obtained at the outlet of themicropacked bed is presented in Figure 4 The conversion (X)was calculated from the ratio of the concentration ofdichromate at the outlet and the inlet of the packed beddenoted as cL and c0 respectively
Xcc
1 L
0= minus
(1)
For single liquid flow through the micropacked bed a one-dimensional plug flow model with superimposed axialdispersion can be used to simulate and predict the reactorperformance under steady flow conditions The differentialequation for the dispersion flow model describing the steady-state concentration profile in an isothermal reactor is given by
Dc yy
uc y
yr
d ( )d
d ( )d
0ax
2
2 lminus minus =(2)
where c(y) is the concentration profile of dichromate ionsalong the length of the packed bed such that y varies from 0 tothe length of packed bed (L) and Dax is the axial dispersioncoefficient For the diffusion-controlled dissolution of copperin acidified dichromate the chemical reaction between thedichromate anion Cr2O7
2minus and Cu was considered instanta-neous and the overall rate of the reaction is controlled by thediffusion Thus it is given by
r k ac y( )s= prime (3)
and eq 2 can be rewritten as
Dc yy
uc y
yk ac y
d ( )d
d ( )d
( ) 0ax
2
2 l sminus minus prime =(4)
where ksprime is the mass transfer coefficient associated with theaxial dispersion reactor model and a is the total specificparticle surface area of the packed bed which can be calculatedusing the copper bed packing information such as copperdensity loading particles size (dp) bed length and channeldimensions28 Applying the Danckwerts boundary conditions
y c c u c c y Dc y
y
y L c L cc y
y
At 0 (0) ( (0) ( ))d ( )
d
At ( ) d ( )
d0
0 l ax
L
= = minus = minus
= = =
(5)
The solution of the differential equation gives42
Figure 3 Illustrations of the image processing to identify the copperparticles by a watershed segmentation technique (identified as blackpixels in the images on the middle and right side) The apparentparticle sizes decrease when the liquid phase fills the bed The netchange in the void space (white pixels) characterized by Λ is used todistinguish the flow patterns inside the packed bed A low Λ denotesgas-filled space (middle image) whereas a high Λ denotes a liquid-filled space (right-side image) Images taken at 1000 fps of two-phaseflow at ug = 008 ms and ul = 00075 ms Figure 4 Conversion of dichromate anions (X) versus superficial
liquid velocity (ul) in a liquid-phase flow experiment in the MPBR (dp= 68 μm) Error bars denote plusmn1 standard deviation
Industrial amp Engineering Chemistry Research pubsacsorgIECR Article
httpsdoiorg101021acsiecr1c00089Ind Eng Chem Res XXXX XXX XXXminusXXX
D
( )( ) ( )
cc
B
B B
4 exp
(1 ) exp (1 ) exp
u LD
Bu LD
Bu LD
L
0
2
22
22
l
ax
l
ax
l
ax
=+ minus minus minus
(6)
where
Bk aD
u1
4 s ax
l2= +
prime
(7)
If one considers a plug flow reactor model (ie if axialdispersion is neglected) eq 4 can be simplified as
uc y
yk ac y
d ( )d
( ) 0l sminus minus =(8)
Integration of eq 8 gives
ikjjjjj
yzzzzzk a
uL
cc
lnsl L
0= minus
(9)
The Sherwood numbers are then calculated as
Shk d
D
Shk d
D
Without axial dispersion
With axial dispersion
s p
m
s p
m
=
prime =prime
(10)
here Dm is the molecular diffusivity of dichromate 138 times 10minus9
m2s34
To assess axial dispersion effects the axial dispersioncoefficient Daxu which is based on the interstitial velocity wascalculated by using the correlation for liquid flow in macroscaleporous media for 4 lt Pem and Rel lt 10 as an approximation43
DD Pe
Pe Sc
Peud
uu
Peud
DRe
u d
18 235
D
axum m
m12 038
mp l
bm
p
ml
l p
m
τ
ε ν
=prime
prime +
prime = = = =τ
minus minus
(11)
where τ is the tortuosity factor of the micropacked bed εb isthe bed voidage u is the interstitial liquid velocity Pemprime is theeffective Peclet number and Sc is the Schmidt number ν is thekinematic viscosity of the liquid τ was taken as 2 for thespherical particle bed (random and well packed bed)44 and εbwas estimated from the packing parameters (the weight ofcopper particles the density of copper (8943 kgm3) length ofthe packed bed and the channel width and depth) to be 04minus042 Dax for eq 4 was then estimated as
D Dax axu bε= (12)
The estimated Sherwood numbers with and withoutconsideration of axial dispersion are shown in Figure 5aalong with the corresponding estimated mass transfercoefficients (Figure 5b) with increasing superficial liquidvelocity (ul) The Sherwood numbers without considerationof axial dispersion obtained by Tidona et al28 in similarmicropacked beds with the same copper dissolution methodare also presented in Figure 5a for comparison It can be seenthat for the liquid-phase flow the Sherwood number obtainedwith a PFR model from two different works fall on the sametrendline against the liquid Reynolds number although theranges of Reynolds number in the two works are different Theeffect of axial dispersion observed in our work increases with adecrease in liquid Reynolds number Shprime is about 5 higherthan Sh at Rel = 8 and is sim38 higher than Sh at Rel = 025However the influence of axial dispersion was small and can
be neglected at higher Reynolds number as observed in thework of Tidona et al28 Wakao and Funazkri45 also suggestedthat axial dispersion can be neglected for liquidminussolid masstransfer at Rel above 3
Two-Phase Flow Hydrodynamics CharacterizationFlow Pattern Observation and Pulsing Behavior in theMicropacked Bed Gas and liquid were introduced into themicroreactor through a T-junction and flowed through asection of empty channel before reaching the packed bedproducing either slug-flow or annular flow depending on theratio of gas to liquid flow rates Flow observation with a high-speed camera provided further information on the flowpatterns and of liquid pulses passing through the packedbed It was observed that the flow behavior in the packed bed
Figure 5 (a) Sherwood number versus liquid Reynolds number for liquid phase flow with (open blue marks) and without (solid blue marks)consideration of axial dispersion Channel dimensions w = 600 μm h = 300 μm N = 58 dp = 68 μm The data from Tidona et al28 for w = 1000μm h = 250 μm N = 54 dp = 75 μm (solid red marks Rel gt 10) are also shown (b) Volumetric mass transfer coefficient versus superficial liquidvelocity with (open blue marks) and without consideration of axial dispersion (solid blue marks) Error bars denote plusmn1 standard deviation
Industrial amp Engineering Chemistry Research pubsacsorgIECR Article
httpsdoiorg101021acsiecr1c00089Ind Eng Chem Res XXXX XXX XXXminusXXX
E
was highly dependent on the flow pattern establishedupstream At low ug the established slug flow preceding thepacked bed manifested as a dispersed-liquid or liquid-rich slugflow inside the packed bed producing periodical sweeping ofthe particles With increasing ug the pulses in the packed bedbecame shorter and faster as the upstream liquid slugs becameshorter in length Further increasing ug resulted in a sparse slugflow pattern with discrete liquid pulses that spanned the entirewidth of the bed separated by long gas sections that pushed theliquid pockets out The observed pressure drops under theseflow conditions increased with increasing ug However longerpulses formed sporadically which produced a sudden decreasein pressure drop46 At higher ug and an annular flow in theempty channel upstream liquid spraying (but no discretepulses) over the whole packed bed was observed indicatingthat a gas-continuous flow formed in the packed bed27 Thisgas-continuous flow pattern was not always stable orachievable It could easily degrade to sparse slug flow uponany small disturbances from the upstream or the downstreamsections This was also accompanied by a variation in thepressure drop decreasing pressure drops were observed whenthe flow changed from the established gas-continuous flow tothe sparse slug flowFigure 6 shows the advancing front of the liquid slugs
entering the packed bed during the transition between a liquid
slug (entering) and a gas bubble (exiting) in the packed bedAt low gas velocities (top row in Figure 6) a fully segmentedpulsing flow was observed as liquid-rich pulses entered thepacked bed but did not span the whole packed bed cross-section indicating possible existence of liquid channellingpreferential flow We define this flow pattern as ldquoliquid-dominated slug flowrdquo (see Videos S2minusS5 of ug = 004minus040 ms) It is worth noting that the preferential flow paths taken bythe liquid seem to be due to entrapment of gas pockets in thepacked bed where the flow is not sufficient to remove thesegas pockets With increasing gas velocity (middle row in Figure6) the discrete features of the pulsing gradually diminished
and liquid pulses spanning the whole cross section of thepacked bed were observed We define this flow pattern asldquosparse slug flowrdquo where gas entrapment was negligible andtherefore the liquid slug covered the entire width of thepacked bed (see Videos S6minusS8 of ug = 071minus243 ms) butwith a significantly long gas-only phase in the bed between theliquid pulsesThe liquid pulses at gas velocities ug = 323 and 419 ms
were big and sharp pulses and swept over almost all the voidspace in the observation cell (bottom row in Figure 6) whichwas similar to the natural pulsing observed in conventionaltrickle beds We define this flow pattern as ldquogas-continuouswith pulsingrdquo flow (see Videos S9 and S10 of ug = 323 and419 ms) At the highest gas velocities (annularslug-annularflow upstream of the packed bed) the discrete pulses were sosmall that only some ldquograiny fluctuationsrdquo in the pixel valuedifferences were observed indicating there was liquid movingin the void space perhaps in the form of thin layers or smalldroplets (much like ldquosprayingrdquo) demonstrating the onset of aldquofully gas-continuousrdquo flow (see Video S11 of ug = 848 ms)The observed pulsing behavior can be characterized using
the liquid characteristic length (Λ) Figure 7 shows the traces
of the dynamic variation of Λ at different superficial gasvelocities while the liquid velocity was kept constant at 00075ms resulting in periodic responses The peaks of thecharacteristic length (Λ) of each trace represent a liquid-filledbed (ie maximum liquid fillingsweeping over the void space)and the troughs that of a gas-filled bed (with minimum liquidfilling ie gas-filled bed with wetted particles) The troughswere not considered for analysis because of significantfluctuations in the values brought about by the liquid holdupin the packed bed At the outset it is noted that the peakheights are lower at low ug than those at higher ug indicatingthat the transition from the ldquominimum liquid-filled bedrdquocondition to the ldquomaximum liquid-filled bedrdquo conditioninvolves significant gas-entrapment at lower ug On the otherhand as can be observed from the Videos S6minusS8 of ug = 071minus243 ms the ldquomaximum liquid-filledrdquo state contains negligiblegas-entrapment thereby resulting in higher peak heights(associated with transition from the ldquominimum liquid-filledbedrdquo condition)
Figure 6 Evolution of liquid pulsing in the copper particle bed atdifferent superficial gas velocities ug (at ul = 00075 ms) Blue colorindicates the regions of maximum variation in the pixel valuesbetween two consecutive frames thereby highlighting the path takenby a liquid slug and a gas bubble entering the micropacked bed Theframes shown represent the advancing front of a liquid slug enteringthe micropacked bed (dp = 58 μm) The flow is from the bottom tothe top of the frames
Figure 7 Traces of dynamic variation of characteristic length (Λ) atdifferent superficial gas velocities (ug) with superficial liquid velocityul = 00075 ms in the MPBR (dp = 58 μm)
Industrial amp Engineering Chemistry Research pubsacsorgIECR Article
httpsdoiorg101021acsiecr1c00089Ind Eng Chem Res XXXX XXX XXXminusXXX
F
Figure 7 shows that at lower gas velocities ug = 004minus04 ms the trace of the dynamic variation of Λ showed fairly regularpeaks (pulses) with sharp fronts and receding tailscorresponding to the liquid-rich sections of flow induced by
the upstream slug-flow (Figure 6 top left panel) in a similarway as reported by Boelhouwer et al47 for induced pulsingflow This is confirmed by the spectrograms in Figure 8 (toprow) where at ug = 004 ms the pulsation in the bed is
Figure 8 Spectrograms of G-L flow at the entrance of the packed bed in the MPBR (dp = 58 μm) obtained from the Λ dynamic traces at differentsuperficial gas velocities (ug) with a superficial liquid velocity of 00075 ms The x-axis is time (s) and the y-axis refers to the frequency of pulsationseen in Figure 7 The color scale represents the amplitude of a specific frequency at a particular time corresponding to the characteristic length (Λ)and the rectangular Fourier ldquowindowrdquo for every frequencyminustime combination A high amplitude denotes the dominant principle pulsationfrequency of the liquid slugs and the presence of secondary or tertiary frequencies denote the gas pushing the liquid phase out of the packed bed
Figure 9 Conversion of dichromate anions (X) versus superficial gas (ug) and liquid velocities (ul) in the MPBR (dp = 58 μm) Each set of coloredmarkers corresponds to an experiment performed with the same packing of copper particles
Industrial amp Engineering Chemistry Research pubsacsorgIECR Article
httpsdoiorg101021acsiecr1c00089Ind Eng Chem Res XXXX XXX XXXminusXXX
G
periodic at a single frequency of 4 Hz and the gas pushes theliquid out homogeneously (no secondary pulsation frequen-cies) As ug increased the frequency increased to 65 Hz and atug = 017 ms presence of secondary and tertiary frequencieswas observed (at 13 and 19 Hz respectively) indicating anonuniform pulsation across the bed These nonuniformdisturbances are ldquoproto-pulsesrdquo (ug = 017 and 040 ms) thatare observed at the transition region between liquid-dominatedslug flow and sparse slug flow These quasi steady-state proto-pulses go on to form fully developed pulses at higher ug similarto those reported by Boelhouwer et al47
At ug = 071minus243 ms the traces of the dynamic variationof Λ showed a transition to alternating liquid pulsing clustersinstead of the regular pulses at lower gas velocities This wasevident between ug of 04 and 071 ms (Figure 8) where theirregular pulsation frequency (proto-pulses) at 040 msreduced at 071 ms with increasing gas sections (denotedby the regions where the amplitude sim0 in Figure 8) and liquidpulsing in clusters The liquid pulsing clusters consisted ofpulses with different amplitudes (Figure 7) which indicates thecoexistence of preferential flow paths and discrete pulsesspanning the entire width of the bed as observed in Figure 6(sparse slug flow regime) The flat base sections in the tracesrepresent a minimal liquid filling of the void space which couldbe an indication of a gas-continuous section between twosuccessive liquid pulsing clusters The number of pulsesinvolved in the pulsing clusters decreased with increasing ug(1minus2 Hz per cluster in Figure 8 middle panel) This can berelated to the upstream slug-annular flow where the liquidslugs were getting shorter and the gas sections were gettinglonger with increasing gas velocityWith further increasing ug to 323 ms the traces of Λ
showed that the pulsing clusters were reduced to single sharpand narrow pulses and exhibited an organized pulsing flowsimilar to the natural pulsing developed under pulsing flowregime in macroscale trickle beds48 This transition occurredbetween ug of 243 and 323 ms At ug = 323 and 419 mswe observed a gas-continuous regime It is worth noting thatthe Λ trace at ug = 848 ms shows a totally flat line indicatinga fully gas-continuous flow pattern The superficial gas velocityof 848 ms is out of the gas flow rate range applied in this L-Smass transfer study but demonstrates that in micropackedbeds where the capillary forces are predominant a fully gas-continuous flow can still be achieved when the gas velocity ishigh enough27
Two-Phase Flow LiquidminusSolid Mass Transfer Con-version of Dichromate at the Exit of the Micropacked BedThe measurement of the L-S mass transfer coefficient with G-Ltwo-phase flow was carried out by varying the N2 gassuperficial velocity ug under a fixed liquid superficial velocityul The effect of ug on the conversion of dichromate anions (X)at four liquid superficial velocities is shown in Figure 9 Asstated in the Experimental Section each set of colored datacorresponds to an experiment performed with the samepacking of copper particles before repacking the microreactorwith new copper particles Overall it can be seen that theconversion of the dichromate anions showed a similar trendversus ug at all four liquid velocities The measured conversiondecreased sharply with increasing ug up to 06minus07 ms Thedecrease in the conversion was less severe with increasing ugand seemed to approach a minimum at ug of sim15 ms Themeasurements were quite reproducible with small deviations atug up to 15 ms with ul at 00037 and 00075 ms However
the deviations became large as ul increased further to 00112and 00149 ms The measured conversion at the exit of thepacked bed showed multiple responses conversion eitherincreaseddecreased or was not affected by ug for severalrepeated measurements which produced scattered results withincreasing liquid velocityIn the region of high gas velocities where multiple values of
conversion from the repeated measurements were observedfluctuations in pressure drop were also observed In general atug lt 15 ms the pressure drop increased steadily with gasvelocity for every set of measurements However withmeasurements starting from higher gas velocity (ug gt 15 ms) the observed pressure drop change upon increasing the gasvelocity showed no consistent pattern in the subsequent set ofmeasurements the pressure drop either increased consistentlywith increasing gas velocity or increased first and thendecreased or not increased at all depending on the flowpatterns formed in the micropacked bed (see Flow PatternObservation and Pulsing Behavior in the Micropacked Bed)This led to a variation in the dichromate conversion at the exitof the packed bed high pressure drop was observed when ahigher conversion was obtained and a low pressure drop whena lower conversion was obtained Hysteresis phenomena in thisregion were also observed (with increasingdecreasing gas flowrate) but it is not possible to analyze them accurately as thebed length and particle size changed considerably during theseprolonged experimentsFigure 10 shows measured conversions of the dichromate
anions at the exit of the copper bed with the corresponding
transitions from one flow pattern to another indicating acorrelation between the G-L flow patterns and the perform-ance of the copper dissolution The poor reproducibility of theconversion at ug gt 10 ms could be due to the fact that theflow patterns that developed in the packed bed were verysensitive to minor disturbances such as pressure fluctuationfrom upstream or downstream A gradual increase inconversion with ug was observed in the gas-continuous withpulsing regime (ug gt 243 ms) where as the liquid pulsing
Figure 10 Conversion of dichromate anions (X) versus superficial gasvelocity (ug) under different flow patterns observed in the MPBR (dp= 58 μm) Each set of colored markers corresponds to an experimentperformed with the same packing of copper particles
Industrial amp Engineering Chemistry Research pubsacsorgIECR Article
httpsdoiorg101021acsiecr1c00089Ind Eng Chem Res XXXX XXX XXXminusXXX
H
frequency increased the length of the gas-sections and hencethe effect of the slug flow decreasedVolumetric LiquidminusSolid Mass Transfer Coefficients In
experimental studies of L-S mass transfer using dissolutionmethods in macroscale packed beds the L-S volumetric masstransfer coefficient was commonly derived with an ideal plugflow reactor (PFR) model under steady flow conditions forboth trickling and pulsing flow regimes13151849 The dispersedflow model has often been used to describe the deviation fromplug flow by superimposing axial dispersion on the plug flowmodel More detailed models have also been developed likethe PDE (piston flow with axial dispersion and mass exchangebetween the dynamic and the stagnant zone) model bydividing the liquid phase in a packed bed into a dynamic and astagnant zone50minus52 or models with discrete series ofcontinuous mixing cells containing a stagnant zone53
However in micropacked beds with gasminusliquid flow fewstudies exist on the characterization of dispersion character-istics Marquez et al54 found that the dispersion in a smallmilli-packed bed (2 mm inner diameter and 90 cm long 115μm glass spheres) operated under a limited fluid-mechanicalinteraction of the gas phase with the liquid was lower than thedispersion in an equivalent single-liquid-phase system by afactor of 2minus3 Zhang et al55 reported that the dispersionnumber in a small packed bed (238minus533 mm inner diameterand 10 cm long with glass beads of various ranges within 150minus425 μm) was determined to be 0007minus002 with the gas andliquid superficial velocities well within the low interactionregimes as described by Faridkhou and Larachi26 indicating anearly plug flow behavior In our work the L-S mass transfercalculations for liquid flow only showed that axial back-mixingeffects under the applied flow conditions cannot be ignored(Figure 5) However the experimental determination ofdispersion characteristics and liquid holdup at micropackedbeds is challenging Faridkhou et al reported the difficulties inobtaining useful response from conductivity measurements in amicropacked bed (1 mm ID) under gasminusliquid flow29 Directvisualization using fluorescence microscopy and a high-speedcamera reported by Saber et al52 could be an alternativetechnique but this would be very difficult to adapt to thesmall-scale packed beds with channel dimensions of 06 mm(w) times 03 mm (h) and large GL ratios used in our work
To describe the axial dispersion under gasminusliquid flow in themicropacked bed the same equation as for single-phase (eq 2)was used but in the correlations of longitudinal dispersion inmacroscale porous media43 a modified superficial velocity termwas employed to account for the liquid holdup values5 Thesuperficial liquid velocity ul was divided by the liquid holdup toaccount for the fact that there was no gas inside the liquidzonelayer and thus the velocity u in eq 11 becomes
uu
hl
l bε=
(13)
The values of the liquid holdup were 065minus085 as reported byMarquez et al54 and 05minus07 as reported by Zhang et al55 inmilli-packed beds A value of the liquid holdup of 075 wasassumed and the mass transfer coefficients were calculatedusing eqs 6 and 12In macroscale gasminusliquid flows in packed beds it is
recognized that particle wetting depends strongly on liquidvelocity and weakly on gas velocity1849 Even though capillaryforces are expected to alter this behavior in the microscale towhat extent wetting effects are influential in the microscalepacked bed used in this work is difficult to ascertain For thisreason in our analysis we use an appropriately definedSherwood number accounting for potentially incompleteutilization of the copper surface area
Shk d
D
a
afs p
m
2phaseprime =prime
(14)
where a2phase is the specific copper surface area active duringthe two-phase mass transfer experiments (which is not knownbut measured together with ksprime) Because the experiments athigh gas flow rates showed irreproducible conversion of thedichromate anions the calculation of the L-S mass transfercoefficient was limited for the data with ug lt 1 ms and arepresented in the form of Sherwood number Shfprime in Figure 11Figure 11a shows that the Sherwood number decreases with
increasing ratio of gas-to-liquid superficial velocities It is worthnoting that the data practically collapse to a single curve for allul values The values of the two-phase L-S volumetric masstransfer coefficient (Figure 11b) are lower than those in therespective single liquid phase flow (Figure 5b) Similarbehaviour was reported by Templis and Papayannakos from
Figure 11 (a) Sherwood number (Shfprime) in the MPBR (dp = 58 μm) during gasminusliquid flow for various gas and liquid superficial velocities for datawith ug lt 1 ms (b) Corresponding mass transfer coefficients (ksprimea2phase) for ug lt 1 ms Error bars denote plusmn1 standard deviation
Industrial amp Engineering Chemistry Research pubsacsorgIECR Article
httpsdoiorg101021acsiecr1c00089Ind Eng Chem Res XXXX XXX XXXminusXXX
I
the studies of L-S mass transfer in milliscale string-bed reactors(reactor diameter 2 mm copper cylindrical particles dp = 15mm) using the copper dissolution method30 They attributedthis to the lower wetting efficiency of the particles during thegasminusliquid flow However they reported a small positive ornegligible response of the measured two-phase L-S volumetricmass transfer coefficient to the gas velocity Other investigatorswho studied L-S mass transfer in similar or larger scale reactorsreported similar insignificant or weak positive effects of gasvelocity on mass transfer13minus15184956 In particular Hirose etal15 Satterfield et al16 and Rao and Drikenburg19 observedthat the L-S mass transfer coefficient was not affected (orweakly affected) by gas velocity except during transition froma gas continuous flow (low interaction regime) to pulse flow(high interaction regime) when it increased In suchmacroscale systems the bubbles in the liquid phase decreasethe cross-sectional area available for liquid flow increasing theliquid velocity whereas they can also disturb the boundarylayer around the particles57 However a negative effect of gasvelocity on the L-S mass transfer has been reported byMohammed et al for a tubular reactor with solid foampacking58
In our work different pulsing flow structures were observedinside the micropacked bed which are closely related to the G-L flow patterns preceding the packed bed At the gas velocityrange 004 to 040 ms in which the L-S mass transfercoefficient declined with increasing gas velocities the micro-packed bed operated under liquid-dominated slug flow regimeand from 040 ms to sim10 ms sparse slug flow also startedcontributing as the feed upstream of the bed transitioned fromslug to slug-annular flow For industrial trickle bed reactorsinduced pulsing by cyclic liquid feed has been recommended asa method to improve fluid distribution and mass transfer incatalytic packed beds However enhancement in the reactorperformance by induced pulsing depends on the nature of thereaction ie whether the reaction is gas-limited or liquid-limited224759 The values of the two-phase L-S volumetricmass transfer coefficient in Figure 11b show an overallenhanced L-S mass transfer in the micropacked bed ascompared to literature In conventional lab scale beds packedwith cylindrical particles (3minus6 mm) or spherical particles(054minus24 mm) ksa was reported to be in the order of 10minus2 to10minus1 sminus114171860 Templis and Papayannakos30 reported ksa onthe order of 10minus2 sminus1 in structured-bed minireactors formedwith cylindrical particles (15 mm diameter) In our micro-packed bed ksa is of the order of 10 s
minus1 This difference can beattributed to the enhancement of the active specific surfacearea a and possibly also of the mass transfer coefficient ks inour micropacked bedHirose et al observed an enhancement of the L-S mass
transfer coefficient when gas flow was introduced for increasingparticle size (dp = 28minus127 mm)15 However this enhance-ment became less significant for smaller particles and in factreversed (two-phase flow gave smaller L-S mass transfercoefficient than liquid only flow) at even smaller particles (dp =05 mm)14 This behavior was attributed to the effect ofincreasing linear velocity (and hence increasing mass transfer)that dominates at large particle sizes and the effect of decreaseof effective surface area (and hence decreasing mass transfer)that dominates at smaller particle sizes A similar decrease ofeffective wetted surface area because of gas-entrapment inconjunction with the increased importance of capillary forcesin the microscale may be the reason for the observed decrease
of the volumetric mass transfer coefficient with gas flow rate(at ug lt 15 ms) The occasional higher conversions at ug gt15 ms are difficult to attribute due to the large fluctuations inthe flow patterns in that regionFigure 11b shows an increasing trend of the volumetric mass
transfer coefficient with liquid flow rate following the sametrend as that in liquid phase flow This trend is much moresignificant in macroscale systems Various investiga-tors1315184956 observed a strong increase of L-S mass transfercoefficient during two-phase flow with liquid velocityattributed to enhancement of solid wetting by the liquid anda decrease in the thickness of the liquid film surrounding theparticles It is worth mentioning that a fixed value of the liquidholdup of 075 was employed in the calculation of the L-S masstransfer coefficients Although Marquez et al reported that theliquid holdup did not vary significantly with gas velocity54
Zhang et al observed a substantial effect of gas and liquidsuperficial velocities on the liquid holdup in a micropackedbed decreasing ul or increasing ug resulted in decreased liquidholdup55 However our calculations of the L-S mass transfercoefficients were not sensitive to the value of the liquid holdupin the range of 065 to 085 showing a variation of thecalculated volumetric L-S mass transfer coefficients by plusmn1minus5which did not significantly alter the dependence of thecalculated Shprimef on gas and liquid superficial velocities in Figure11 On the basis of the data in Figure 11 a correlation of theSherwood number with the gas and liquid Reynolds numberswas obtained The data fitted well the following equation withrelative error within plusmn15 (see Figure 12)
Sh Re Re Re Re144 02 1 03 6f l054
g034
l gprime = lt lt lt ltminus
(15)
There are only limited studies which obtained L-S masstransfer coefficients with G-L flow using packed beds withsubmillimeter particles Goto and Smith14 developed adimensional correlation that showed that the Sherwoodnumber depended on the liquid flow rate raised to a powerof 056minus067 for dp = 0054minus024 mm Saroha performedexperiments with dp = 05 mm and found that the L-S mass
Figure 12 Parity plot of the experimental and the correlatedSherwood number during gasminusliquid flow in the MPBR used in thiswork (dp = 58 μm) for ug lt 1 ms
Industrial amp Engineering Chemistry Research pubsacsorgIECR Article
httpsdoiorg101021acsiecr1c00089Ind Eng Chem Res XXXX XXX XXXminusXXX
J
transfer coefficient increased with increasing ug (60minus170 mms) and also with ul (87minus261 mms) but did not report acorrelation13
CONCLUDING REMARKSThe liquidminussolid mass transfer in a chip-based micropackedbed under G-L two-phase flow was studied using the copperdissolution method Liquid and gas were introduced into thepacked bed via a T-junction Hydrodynamic studies using ahigh-speed camera revealed that different pulsing structuresdeveloped inside the packed copper bed as a result of the flowpatterns established preceding the packed bed These resultsshow that pulsing flow was predominant in the MPBR for thewhole range of G-L flow rates investigated in this work Thecharacteristics of the pulsing structures varied depending onthe flow pattern of upstream G-L flow With an upstream slug-flow feed a liquid-dominated slug flow was observed in the bedwith apparent channelling due to significant gas-entrapmentupon increasing the gas flow rate a sparse slug flow wasobserved in the bed with the liquid pulses spanning the crosssection of the packed bed With an upstream annular flow feeda gas-continuous pulsing flow was observed with discreteliquid pulses between long gas sections However this flowpattern was sensitive and destabilized by disturbances fromupstream or downstream pressure fluctuations or nonuniformpacking which made the reaction measurement in higher gasvelocities irreproducibleThere was a transition from the liquid-dominated slug flow
regime to the sparse slug flow regime when the upstream(feed) flow became slug-annular where pulsing clusters with agas-continuous flow section was observed On performing theL-S mass transfer studies the observed Sherwood numbersincreased with increasing liquid velocity for the whole range ofgas and liquid velocities However they decreased with gasvelocity under the liquid-dominated slug flow regime likelydue to a reduction of the effective interfacial area because ofgas-entrapment Investigations of the effect of partial-wettingand boundary layer thickness can shed further light on thereasons behind the decreasing mass transfer The mass-transfer however was less affected during the sparse slugflow regime possibly due to the negligible presence of gaspockets resulting in an increase of the effective interfacial areaWhile our studies have been performed with nonporousparticles investigation of porous catalysts are required toimprove the correlations for use in catalytic micropacked bedreactors
ASSOCIATED CONTENTsı Supporting InformationThe Supporting Information is available free of charge athttpspubsacsorgdoi101021acsiecr1c00089
Details on the copper particle size distribution andinformation on how to pack a micropacked bed reactor(PDF)Video S1 showing the image analysis routine estimatingthe pulsation pattern in the packed bed (MP4)Video S2 raw high-speed video of pulsation with gassuperficial velocity of 004 ms recorded at 1000 fps andplayed back at 20 fps (MP4)Video S3 raw high-speed video of pulsation with gassuperficial velocity of 008 ms recorded at 1000 fps andplayed back at 20 fps (MP4)
Video S4 raw high-speed video of pulsation with gassuperficial velocity of 017 ms recorded at 1000 fps andplayed back at 20 fps (MP4)Video S5 raw high-speed video of pulsation with gassuperficial velocity of 040 ms recorded at 1000 fps andplayed back at 20 fps (MP4)Video S6 raw high-speed video of pulsation with gassuperficial velocity of 071 ms recorded at 1000 fps andplayed back at 20 fps (MP4)Video S7 raw high-speed video of pulsation with gassuperficial velocity of 161 ms recorded at 1000 fps andplayed back at 20 fps (MP4)Video S8 raw high-speed video of pulsation with gassuperficial velocity of 243 ms recorded at 1000 fps andplayed back at 20 fps (MP4)Video S9 raw high-speed video of pulsation with gassuperficial velocity of 323 ms recorded at 1000 fps andplayed back at 20 fps (MP4)Video 10 raw high-speed video of pulsation with gassuperficial velocity of 419 ms recorded at 1000 fps andplayed back at 20 fps (MP4)Video 11 raw high-speed video of pulsation with gassuperficial velocity of 848 ms recorded at 1000 fps andplayed back at 20 fps (MP4)
AUTHOR INFORMATIONCorresponding Author
Asterios Gavriilidis minus Department of Chemical EngineeringUniversity College London London WC1E 7JE UnitedKingdom orcidorg0000-0003-3508-5043Email agavriilidisuclacuk
AuthorsEnhong Cao minus Department of Chemical EngineeringUniversity College London London WC1E 7JE UnitedKingdom
Anand N P Radhakrishnan minus Department of ChemicalEngineering University College London London WC1E 7JEUnited Kingdom orcidorg0000-0002-9763-8830
Redza bin Hasanudin minus Department of Chemical EngineeringUniversity College London London WC1E 7JE UnitedKingdom
Complete contact information is available athttpspubsacsorg101021acsiecr1c00089
Author ContributionsdaggerEC and ANPR contributed equally to this workNotesThe authors declare no competing financial interest
ACKNOWLEDGMENTSFinancial support from EPSRC UK (Grants EPJ017833 andEPL027232) is gratefully acknowledged
NOTATIONa Specific surface area of the packed bed [m2
particle mminus3
bed]a2phase Specific copper surface area active during the two-phase mass-transfer experiments [m2
particle mminus3
bed]
B 1 k aDu
4 s ax
l2+ prime
c Concentration of dichromate anions in the packed bed[mol mminus3]
Industrial amp Engineering Chemistry Research pubsacsorgIECR Article
httpsdoiorg101021acsiecr1c00089Ind Eng Chem Res XXXX XXX XXXminusXXX
K
c0 Concentration of dichromate anions at the entrance ofthe packed bed [mol mminus3]cL Concentration of dichromate anions at the outlet of thepacked bed [mol mminus3]Dax Axial dispersion coefficient based on the superficialvelocity ul [m
2 sminus1]Dax u Axial dispersion coefficient based on the interstitialvelocity u [m2 sminus1]Dm Molecular diffusivity [m2 sminus1]dp Diameter of the copper particles [m]h Height of the microchannel [m]hl Liquid holdup [mliquid
3 mvoidminus3]
ks Mass-transfer coefficient without axial dispersion [m sminus1]ksprime Mass-transfer coefficient with axial dispersion [m sminus1]L Length of the copper packed bed [m]N Hydraulic channel diameter to particle diameter ratioPem Peclet number without axial dispersion udpDm
minus1
Peprimem Effective Peclet number udp(Dmτ)minus1
r Overall rate of the copper dissolution reaction [mol sminus1
mminus3]Reg Gas Reynolds number ugdpν
minus1
Rel Liquid Reynolds number uldpνminus1
Sc Schmidt number νDmminus1
Sh Sherwood number without axial dispersion ksdpDmminus1
Shprime Sherwood number with axial dispersion ksprimedpDmminus1
Shprimef Modified Sherwood number with axial dispersionk d
D
a
am
s p 2phaseprime
u Interstitial liquid velocity [m sminus1]ug Superficial gas velocity [m sminus1]ul Superficial liquid velocity [m sminus1]w Width of the microchannels [m]X Conversion of dichromate anionsy Position along the copper packed bed [m]
GREEK LETTERSΛ Characteristic length of flow pattern in MPBRεb Bed voidage [mvoid
3 mbedminus3]
ν Kinematic viscosity [m2 sminus1]τ Tortuosity factor of the micropacked bed
REFERENCES(1) Hessel V Hardt S Loumlwe H Chemical Micro ProcessEngineering Fundamentals Modelling and Reactions WileyminusVCHDarmstadt Germany 2006(2) Hessel V Loumlwe H Muller A Kolb G Chemical Micro ProcessEngineering Processing and Plants WileyminusVCH Darmstadt Germany2006(3) Losey M W Schmidt M A Jensen K F Microfabricatedmultiphase packed-bed reactors characterization of mass transfer andreactions Ind Eng Chem Res 2001 40 (12) 2555minus2562(4) Alsolami B H Berger R J Makkee M Moulijn J A Catalystperformance testing in multiphase systems implications of using smallcatalyst particles in hydrodesulfurization Ind Eng Chem Res 201352 (26) 9069minus9085(5) Moulijn J A Makkee M Berger R J Catalyst testing inmultiphase micro-packed-bed reactors criterion for radial masstransport Catal Today 2016 259 354minus359(6) Cao E Brett G Miedziak P J Douthwaite J M Barrass SMcMillan P F Hutchings G J Gavriilidis A A micropacked-bedmulti-reactor system with in situ Raman analysis for catalystevaluation Catal Today 2017 283 195minus201(7) Tadepalli S Halder R Lawal A Catalytic hydrogenation of o-nitroanisole in a microreactor reactor performance and kineticstudies Chem Eng Sci 2007 62 (10) 2663minus2678
(8) Ajmera S K Losey M W Jensen K F Schmidt M AMicrofabricated packed-bed reactor for phosgene synthesis AIChE J2001 47 (7) 1639minus1647(9) Bakhtiary-Davijany H Hayer F Phan X K Myrstad RVenvik H J Pfeifer P Holmen A Characteristics of an integratedmicro packed bed reactor-heat exchanger for methanol synthesis fromsyngas Chem Eng J 2011 167 (2) 496minus503(10) Inoue T Schmidt M A Jensen K F Microfabricatedmultiphase reactors for the direct synthesis of hydrogen peroxide fromhydrogen and oxygen Ind Eng Chem Res 2007 46 (4) 1153minus1160(11) Knochen J Guttel R Knobloch C Turek T FischerminusTropsch synthesis in milli-structured fixed-bed reactors experimentalstudy and scale-up considerations Chem Eng Chem Eng Process2010 49 (9) 958minus964(12) Zhang J Wang K Teixeira A R Jensen K F Luo GDesign and scaling up of microchemical systems a review Annu RevChem Biomol Eng 2017 8 (1) 285minus305(13) Saroha A K Solidminusliquid mass transfer studies in trickle bedreactors Chem Eng Res Des 2010 88 (5minus6) 744minus747(14) Goto S Smith J M Trickle-bed reactor performance Part IHoldup and mass transfer effects AIChE J 1975 21 (4) 706minus713(15) Hirose T Mori Y Sato Y Liquid-to-particle mass transfer infixed bed reactor with cocurrent gas-liquid downflow J Chem EngJpn 1976 9 (3) 220minus225(16) Satterfield C N Van Eek M W Bliss G S Liquid-solidmass transfer in packed beds with downward concurrent gas-liquidflow AIChE J 1978 24 (4) 709minus717(17) Speccia V Baldi G Gianetto A Solid-liquid mass transfer inconcurrent two-phase flow through packed beds Ind Eng ChemProcess Des Dev 1978 17 (3) 362minus367(18) Lakota A Levec J Solid-liquid mass transfer in packed bedswith cocurrent downward two-phase flow AIChE J 1990 36 (9)1444minus1448(19) Rao V G Drinkenburg A A H Solid-liquid mass transfer inpacked beds with cocurrent gas-liquid downflow AIChE J 1985 31(7) 1059minus1068(20) Chau P C Local liquid-solid mass transfer measurement in atrickle film flow model using an electrochemical technique Int J HeatMass Transfer 1987 30 (11) 2305minus2317(21) Rode S Midoux N Latifi M A Storck A Hydrodynamicsand liquid-solid mass transfer mechanisms in packed beds operating incocurrent gas-liquid downflow an experimental study using electro-chemical shear rate sensors Chem Eng Sci 1994 49 (9) 1383minus1401(22) Trivizadakis M E Karabelas A J A study of local liquidsolidmass transfer in packed beds under trickling and induced pulsing flowChem Eng Sci 2006 61 (23) 7684minus7696(23) Morita S Smith J M Mass transfer and contacting efficiencyin a trickle-bed reactor Ind Eng Chem Fundam 1978 17 (2) 113minus120(24) Yoshikawa M Iwai K Goto S Teshima H Liquid-solidmass transfer in gas-liquid cocurrent flows through beds of smallpackings J Chem Eng Jpn 1981 14 (6) 444minus450(25) Tan C S Smith J M A dynamic method for liquid-particlemass transfer in trickle beds AIChE J 1982 28 (2) 190minus195(26) Faridkhou A Larachi F Hydrodynamics of gas-liquidcocurrent flows in micropacked beds - wall visualization study IndEng Chem Res 2012 51 (50) 16495minus16504(27) Al-Rifai N Galvanin F Morad M Cao E Cattaneo SSankar M Dua V Hutchings G Gavriilidis A Hydrodynamiceffects on three phase micro-packed bed reactor performance - gold-palladium catalysed benzyl alcohol oxidation Chem Eng Sci 2016149 129minus142(28) Tidona B Desportes S Altheimer M Ninck K von RohrP R Liquid-to-particle mass transfer in a micro packed bed reactorInt J Heat Mass Transfer 2012 55 (4) 522minus530(29) Faridkhou A Tourvieille J-N Larachi F Reactionshydrodynamics and mass transfer in micro-packed beds - Overviewand new mass transfer data Chem Eng Process 2016 110 80minus96
Industrial amp Engineering Chemistry Research pubsacsorgIECR Article
httpsdoiorg101021acsiecr1c00089Ind Eng Chem Res XXXX XXX XXXminusXXX
L
(30) Templis C C Papayannakos N G Liquid-to-particle masstransfer in a structured-bed minireactor Chem Eng Technol 2017 40(2) 385minus394(31) Cao E Motherwell W B Gavriilidis A Single andmultiphase catalytic oxidation of benzyl alcohol by tetrapropylammo-nium perruthenate in a mobile microreactor system Chem EngTechnol 2006 29 (11) 1372minus1375(32) Cao E Gavriilidis A Oxidative dehydrogenation of methanolin a microstructured reactor Catal Today 2005 110 (1minus2) 154minus163(33) Gregory D P Riddiford A C Dissolution of copper insulfuric acid solutions J Electrochem Soc 1960 107 (12) 950minus956(34) Gruber R Melin T Mixed convection in the copperdissolution technique of studying mass transfer Int J Heat MassTransfer 2003 46 (13) 2403minus2413(35) Oliphant T E Python for scientific computing Comput SciEng 2007 9 (3) 10minus20(36) Van Der Walt S Colbert S C Varoquaux G The NumPyarray a structure for efficient numerical computation Comput SciEng 2011 13 (2) 22minus30(37) van Rossum G Python Tutorial Technical Report CS-R9526 Centrum voor Wiskunde en Informatica Amsterdam 1995(38) Beucher S Lantueacutej C Use of watersheds in contourdetection In International Workshop on Image Processing Real-TimeEdge and Motion DetectionEstimation Rennes France 1979(39) Patel M Radhakrishnan A N P Bescher L Hunter-SellarsE Schmidt-Hansberg B Amstad E Ibsen S Guldin STemperature-induced liquid crystal microdroplet formation in apartially miscible liquid mixture Soft Matter 2021 17 (4) 947minus954(40) Serres M Maison T Philippe R Vidal V Aphenomenological model for bubble coalescence in confined highlyporous media Int J Multiphase Flow 2018 105 134minus141(41) Serres M Zanota M L Philippe R Vidal V On thestability of Taylor bubbles inside a confined highly porous mediumInt J Multiphase Flow 2016 85 157minus163(42) Levenspiel O Chemical Reaction Engineering 3rd ed JohnWiley amp Sons New York 1999(43) Delgado J M P Q Longitudinal and transverse dispersion inporous media Chem Eng Res Des 2007 85 (9) 1245minus1252(44) Delgado J M P Q A critical review of dispersion in packedbeds Heat Mass Transfer 2006 42 (4) 279minus310(45) Wakao N Funazkri T Effect of fluid dispersion coefficientson particle-to-fluid mass transfer coefficients in packed bedsCorrelation of Sherwood numbers Chem Eng Sci 1978 33 (10)1375minus1384(46) Radhakrishnan A N P Pradas M Sorensen E KalliadasisS Gavriilidis A Hydrodynamic characterization of phase separationin devices with microfabricated capillaries Langmuir 2019 35 (25)8199minus8209(47) Boelhouwer J G Piepers H W Drinkenburg A A HLiquid-induced pulsing flow in trickle-bed reactors Chem Eng Sci2002 57 (16) 3387minus3399(48) Tsochatzidis N A Karabelas A J Experiments in trickle bedsat the micro- and macroscale Flow characterization and onset ofpulsing Ind Eng Chem Res 1994 33 (5) 1299minus1309(49) Gonzaacutelez-Mendizabal D Aguilera M E Pironti F Solid-liquid mass transfer and wetting factors in trickle bed reactors effectof the type of solid phase and the presence of chemical reactionChem Eng Commun 1998 169 37minus55(50) Stegeman D Van Rooijen F E Kamperman A A WeijerS Westerterp K R Residence time distribution in the liquid phase ina cocurrent gas-liquid trickle bed reactor Ind Eng Chem Res 199635 (2) 378minus385(51) Iliuta I Larachi F Grandjean B P A Residence time masstransfer and back-mixing of the liquid in trickle flow reactorscontaining porous particles Chem Eng Sci 1999 54 (18) 4099minus4109(52) Saber M Huu T T Pham-Huu C Edouard D Residencetime distribution axial liquid dispersion and dynamic-static liquid
mass transfer in trickle flow reactor containing β-SiC open-cell foamsChem Eng J 2012 185minus186 294minus299(53) Serres M Schweich D Vidal V Philippe R Liquidresidence time distribution of multiphase horizontal flow in packedbed milli-channel spherical beads versus open cell solid foams ChemEng Sci 2018 190 149minus163(54) Maacuterquez N Castano P Makkee M Moulijn J A KreutzerM T Dispersion and holdup in multiphase packed bed microreactorsChem Eng Technol 2008 31 (8) 1130minus1139(55) Zhang J Teixeira A R Koumlgl L T Yang L Jensen K FHydrodynamics of gasminusliquid flow in micropacked beds pressuredrop liquid holdup and two-phase model AIChE J 2017 63 (10)4694minus4704(56) Bartelmus G Local solid-liquid mass transfer coefficients in athree-phase fixed bed reactor Chem Eng Process 1989 26 (2) 111minus120(57) Shao N Gavriilidis A Angeli P Flow regimes for adiabaticgas-liquid flow in microchannels Chem Eng Sci 2009 64 (11)2749minus2761(58) Mohammed I Bauer T Schubert M Lange R Liquid-solidmass transfer in a tubular reactor with solid foam packings Chem EngSci 2014 108 223minus232(59) Wilhite B A Huang X McCready M J Varma A Effects ofinduced pulsing flow on trickle-bed reactor performance Ind EngChem Res 2003 42 (10) 2139minus2145(60) Sylvester N D Pitayagulsarn P Mass transfer for two-phasecocurrent downflow in a packed bed Ind Eng Chem Process Des Dev1975 14 (4) 421minus426
Industrial amp Engineering Chemistry Research pubsacsorgIECR Article
httpsdoiorg101021acsiecr1c00089Ind Eng Chem Res XXXX XXX XXXminusXXX
M
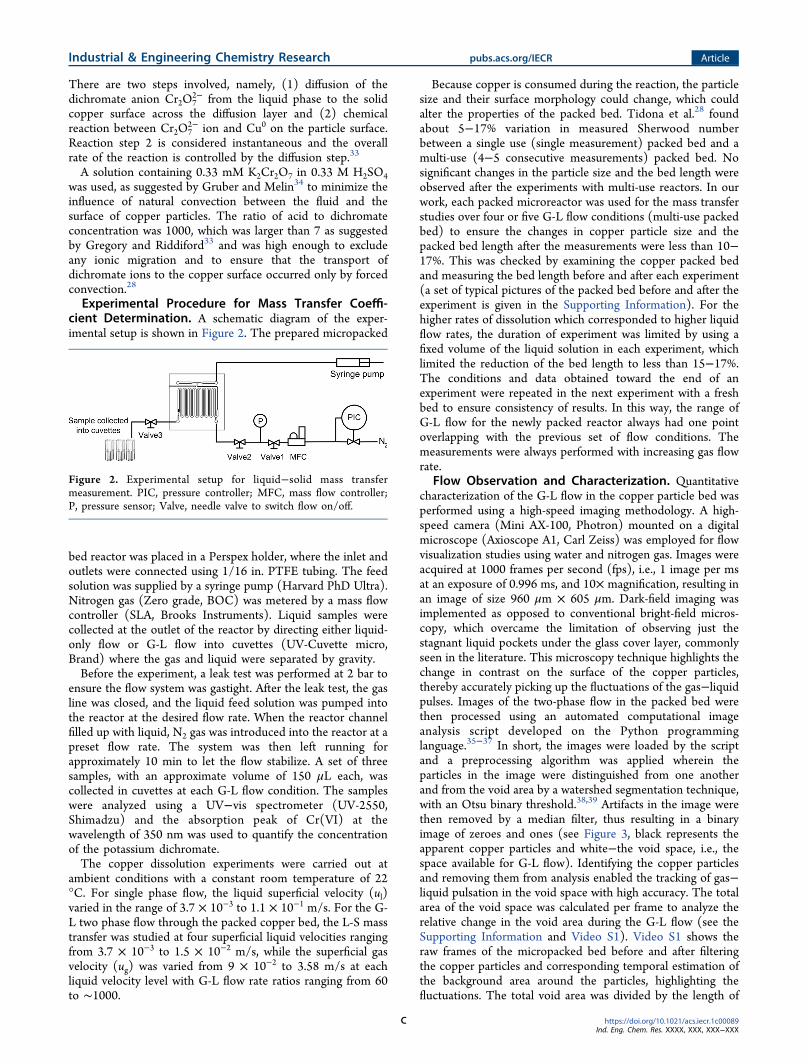
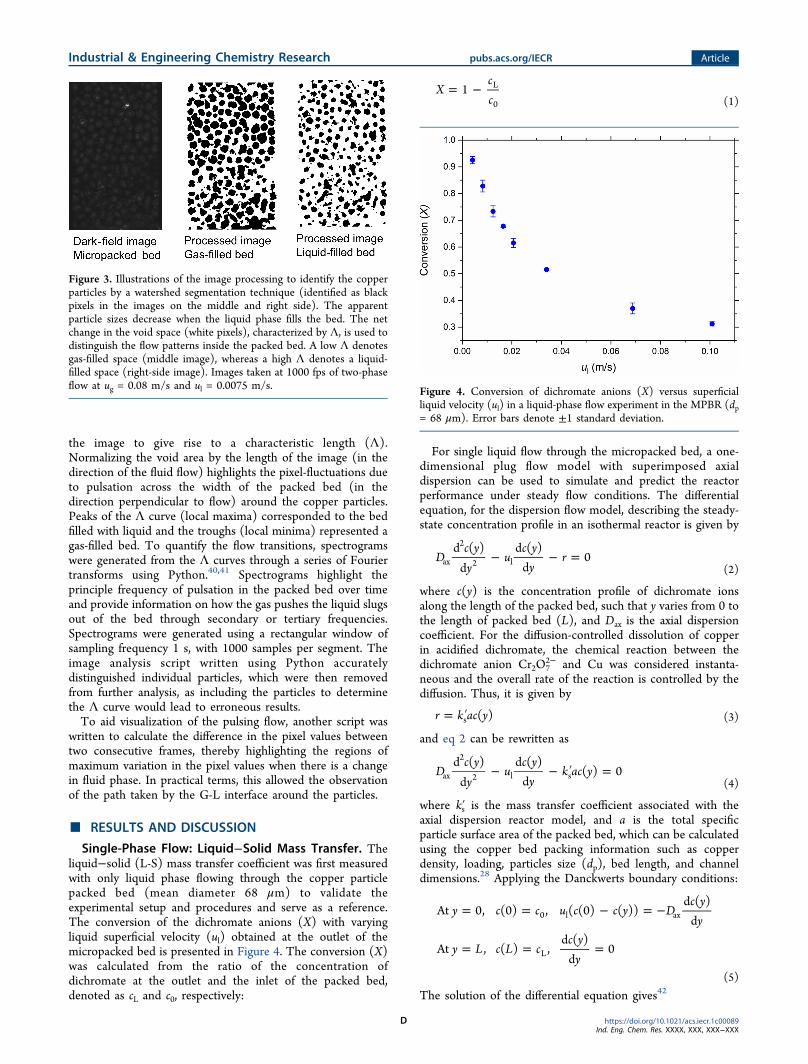
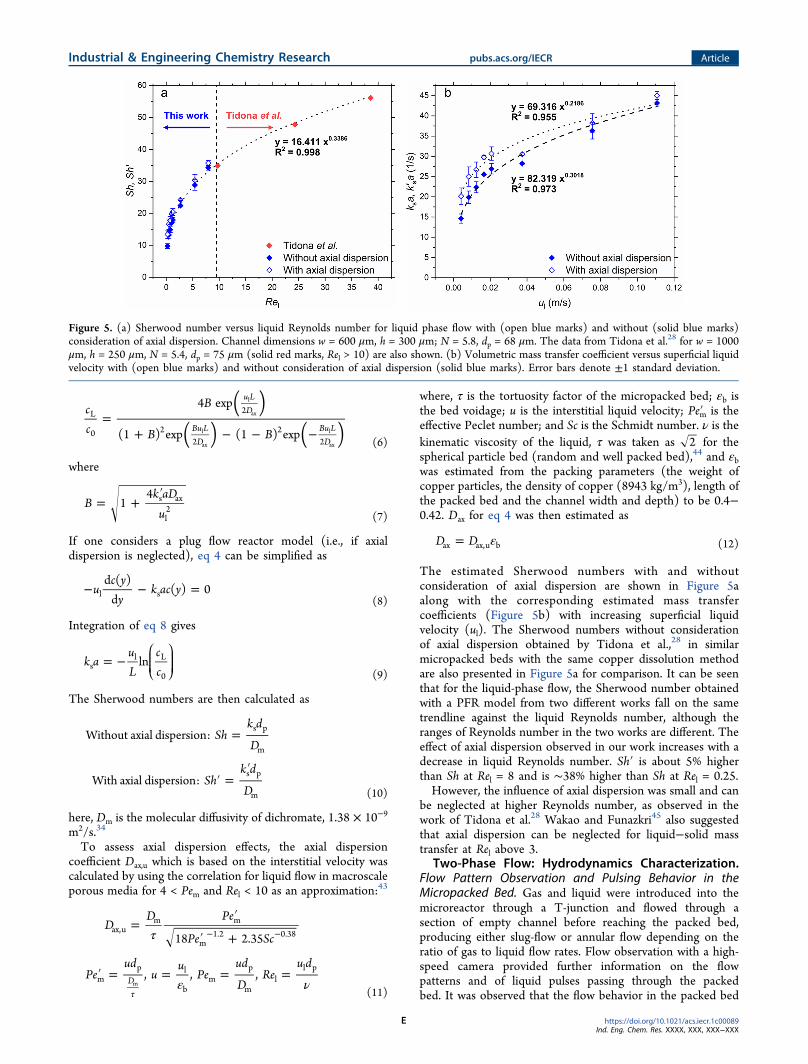
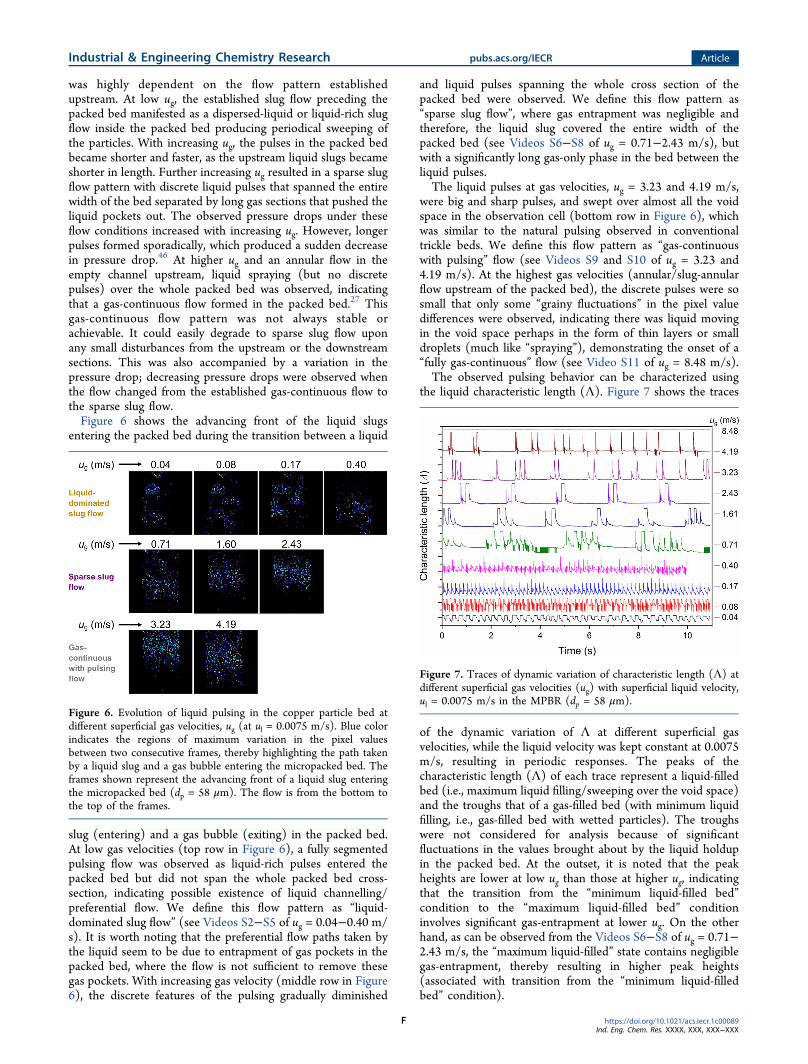
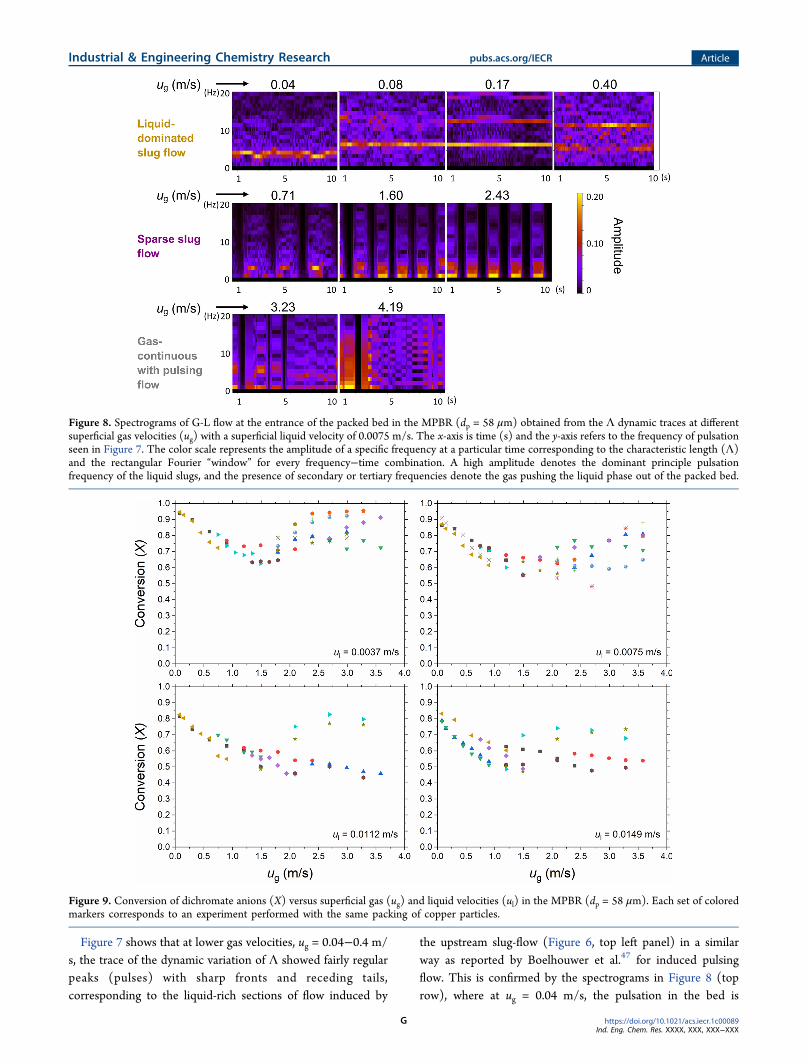
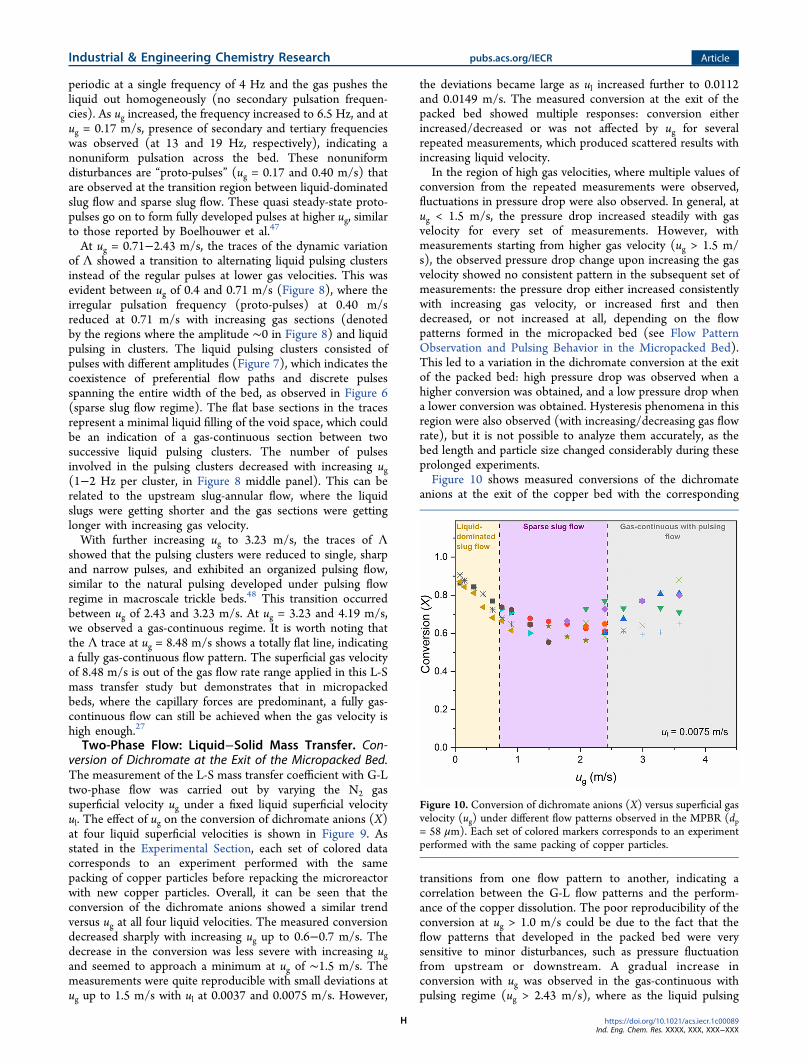
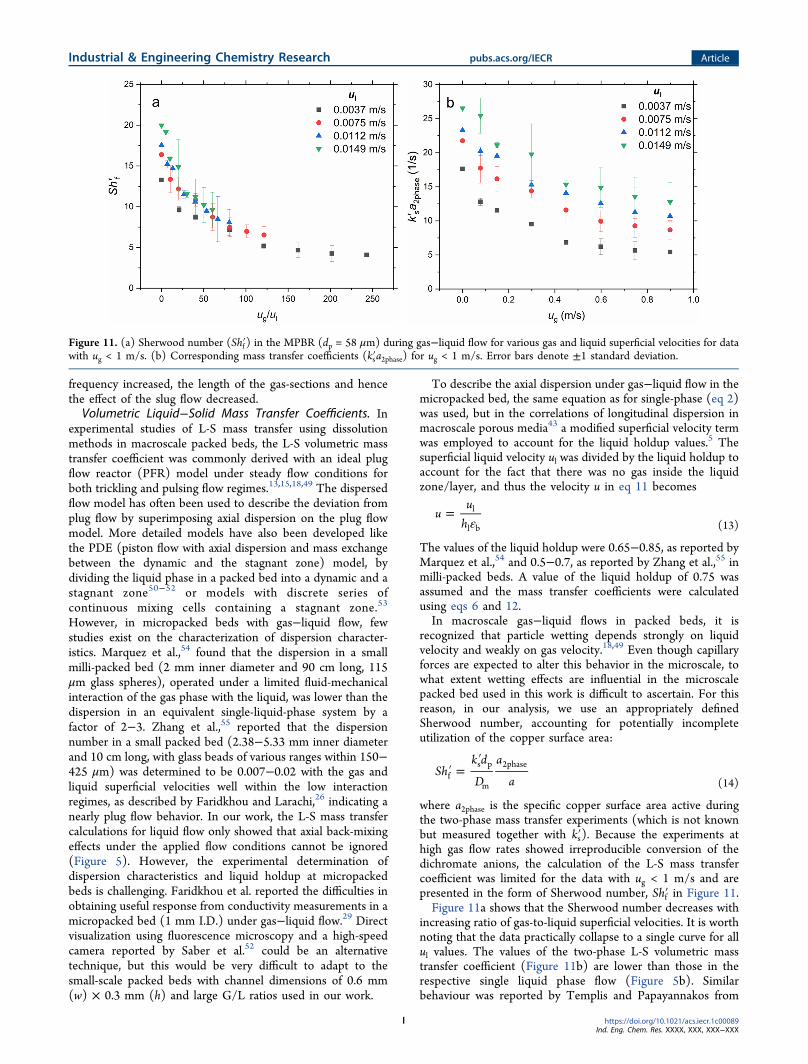
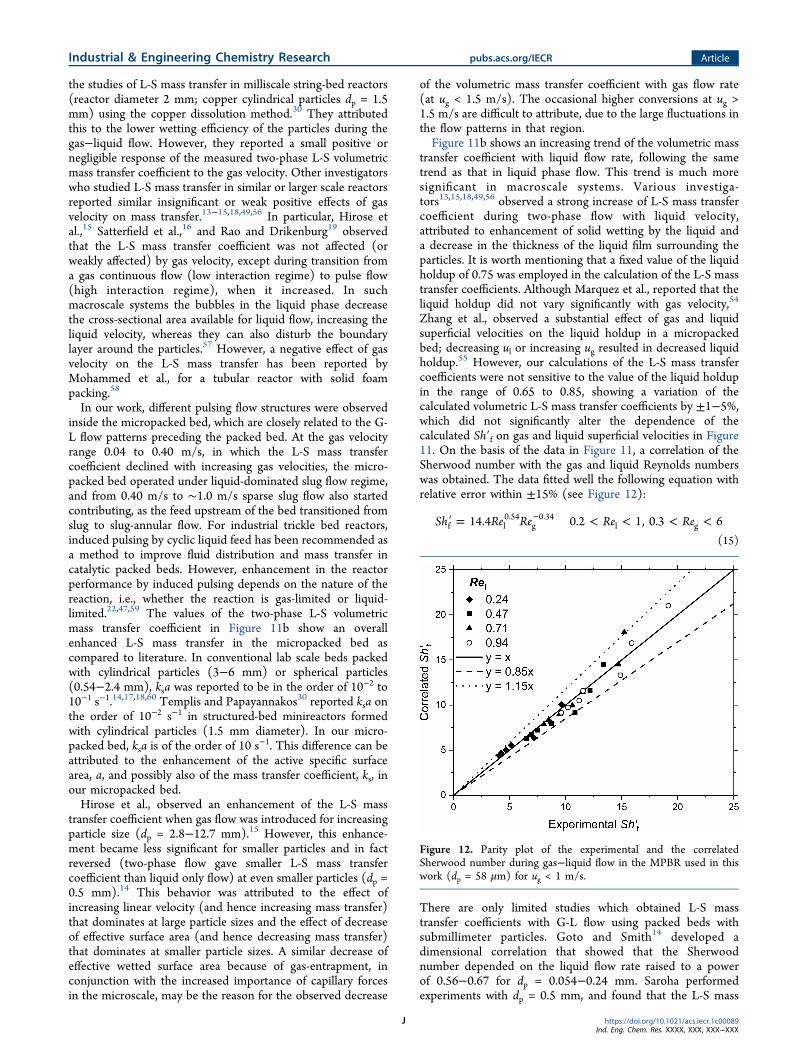
Related Documents