STUDY OF IMAGE DENOISING USING CURVELET TRANSFORM RAJAT SINGH (109CS0345) D.S. MEENA (109CS0633) Department of Computer Science and Engineering National Institute of Technology, Rourkela

Welcome message from author
This document is posted to help you gain knowledge. Please leave a comment to let me know what you think about it! Share it to your friends and learn new things together.
Transcript

STUDY OF IMAGE DENOISING USING
CURVELET TRANSFORM
RAJAT SINGH (109CS0345)
D.S. MEENA (109CS0633)
Department of Computer Science and Engineering
National Institute of Technology, Rourkela

STUDY OF IMAGE DENOISING USING CURVELET
TRANSFORM
A Thesis submitted in partial fulfillment of the requirements for the degree
Of
Bachelor of Technology in “Computer Science and Engineering”
By
RAJAT SINGH (109CS0345)
D.S. MEENA (109CS0633)
Under guidance of :
Prof. Ratnakar Dash
Prof. R.K. Mohapatra
Department of Computer Science and Engineering
National Institute of Technology
Rourkela-769008 (ODISHA)
2013
- 1 -
DEPARTMENT OF COMPUTER SCIENCE AND ENGINEERING
NATIONAL INSTITUTE OF TECHNOLOGY, ROURKELA
ODISHA, INDIA-769008
CERTIFICATE
This is to certify that the thesis entitled “Image de-noising using curvelet transform”, submitted
by Rajat Singh (Roll No. 109CS0345) and Devendra Singh Meena (Roll No. 109CS0633) in partial
fulfillment of the requirements for the award of Bachelor of Technology in Computer Science and
Engineering during session 2012-2013 at National Institute of Technology, Rourkela. A bonafide
record of research work carried out by them under my supervision and guidance.
The candidates have fulfilled all the prescribed requirements.
The thesis which is based on candidates’ own work, have not submitted elsewhere for a
degree/diploma.
In my opinion, the thesis is of standard required for the award of a bachelor of technology degree in
Computer Science and Engineering.
Place: Rourkela
Dept. of Computer Science Engineering Prof. Ratnakar Dash National institute of Technology Prof. R.K. Mohapatra Rourkela-769008
- 2 -

ACKNOWLEDGEMENT
We are grateful to The Department of Computer Science and Engineering for giving us the
opportunity to carry out this project, which is an integral fragment of the curriculum in B. Tech
programme at the National Institute of Technology, Rourkela. We would like to express our heartfelt
gratitude and regards to our project guide, Prof. Ratnakar Dash and Prof. R.K. Mohapatra,
Department of Computer Science and Engineering, for being the corner stone of our project. It was
their incessant motivation and guidance during periods of doubts and uncertainties that has helped us
to carry on with this project. We would like to thank Prof. A.K. Turuk, Head of the Department, and
Computer Science and Engineering for his guidance, support and direction. We are also obliged to
the staff of Computer Science and Engineering Department for aiding us during the course of our
project. We offer our heartiest thanks to our friends for their help in collection of data samples
whenever necessary. Last but not the least, we want to acknowledge the contributions of our parents
and family members, for their constant and never ending motivation.
RAJAT SINGH (109CS0345)
DEVENDRA SINGH MEENA (109CS0633)
B.TECH (COMPUTER SCIENCE AND ENGINEERING)
a
Dedicated to
Our beloved parents
b

ABSTRACT
The images usually bring different kinds of noise in the process of receiving, coding and
Transmission. In our implementation the Curvelet transform is used for de-noising of image.
Two digital implementations of the Curvelet transform the Unequally Spaced Fast Fourier
Transform (USFFT) and the Wrapping Algorithm are used to de-noise images degraded by
different types of noises such as Gaussian, Salt and Pepper, Random, Speckle and Poisson
noise. This thesis aims at the effect the Curvelet transform has in Curve-let shrinkage assuming
different types of noise models. A signal to noise ratios a measure of the quality of de-noising
was preferred. The experimental results show that the normal Curvelet shrinkage approach fails
to remove Poisson noise in medical images.
Keywords Curvelet transform, wrapping algorithm, USFFT
i

CONTENTS Abstract i
Contents ii
CHAPTER 1
INTRODUCTION
1.1 Introduction 2
CHAPTER 2
ADDITIVE AND MULTIPLICATIVE NOISES
2.1 Guassian noise 5
2.2 Salt and pepper noise 6
2.3 Speckle noise 7
2.4 Brownian noise
2.5 Poisson noise
CHAPTER-3
THE WAVELET TRANSFORM AND DENOISING
3.1 Discrete wavelet transform – Principles 10
3.2 Properties of DWT 12
3.3 Wavelet thresholding 13
CHAPTER-4
THE CURVELET TRANSFORM
4.1 Introduction 16
4.2 Image de-noise using curve-lets 17
4.3 Algorithm 17
4.4 Curve-let shrinkage/thresholding 18
CHAPTER-5
RESULTS AND DISCUSSIONS
5.1 RESULTS 19 ii
CHAPTER-6
CONCLUSION
6.1 Conclusion 24
References 26
iii

CHAPTER1
Introduction
1
Introduction
A very vast portion of digital image processing is concerned with image de-noising. This includes
research in algorithm and routine goal oriented image Processing. Image restoration is the removal
or reduction of degraded images that are Incurred while the image is being obtained. Degradation
comes from blurring as Well as noise due to various sources. Blurring is a form of bandwidth
reduction in the image caused by the imperfect image formation process like relative motion between
the camera & the object or by an optical system which is out of the focus. When aerial photographs
are taken for remote sensing purposes, atmospheric turbulence introduces blurs, optical system
aberration and relative motion between camera and the ground. With these blurring effects, the
recorded image can also be corrupted by noises. A noise can be introduced in the transmission
medium due to a noisy channel, errors during the measurement process and during quantization of
the data for digital storage. Each element in the imaging chain such as film, lenses, digitizer, etc.
contribute to the degradation. Image de-noising is often used in the field of photography or publishing
where an image is somehow degraded but it needs to be improved before it can be printed. For this
type of application we need to know about the degradation process in order to design a model for it.
When a model for the degradation process is designed, the inverse process can be applied to the image
to de-noise it back to its original form. It is the type of image de-noise often used in space exploration
to help eliminate artifacts generated by mechanical jitter in a spacecraft or to reduce distortion in the
optical system of a telescope. Image de-noising finds applications in fields such as astronomy where
the resolution limitations are high, in medical imaging where the physical requirements for high
quality imaging are needed for analyzing the images of unique events and in the forensic science
where potentially useful photographic information is sometimes of extremely bad quality.
2
Digital images are 2-D matrices in image processing and important task is to adjust values of these
matrices in order to get clear features of images. The adjusting of values obeys a certain mathematical
model. The main challenge is to build suitable mathematical models for practical requirements.
Taking image de-noising example many mathematical models are based on a frequency partition of
the image, where components having high frequency are interpreted as noise which have to be
removed while those with low frequency can be seen as features to be remained. Curve-lets, which
we are using, can be seen as an effective model that not only considers a multi scale time-frequency
local-partition but also makes use of the direction of features.
Applications of wavelets are increasingly being used in scientific and engineering fields, traditional
wavelets do well only at representing point singularities, as they ignore the geometric properties of
structures and do not exploit the regularity of edges. Thus, de-noising, wavelet based compression
or structure extraction become computationally inefficient for geometric features with line and
surface singularities. For ex, when we download compressed image or video, we mostly find a mosaic
phenomenon. The mosaic phenomenon comes from the poor ability of wavelets to handle line
singularities. In fluid mechanics, discrete wavelet thresholding mostly leads to oscillations along
edges of the coherent eddies, and to the deterioration of the vortex tube structures, which later can
cause an unphysical leak of energy into neighboring scales producing an artificial “cascade" of
energy.
3

CHAPTER2
Additive and Multiplicative
Noises
4

Noise is undesired information that degrades the image. In the image de-noising process, information
of the type of noise present in the original image plays a significant role. Mostly images can be
corrupted with noise modeled with either a uniform, Gaussian, or salt and pepper distribution.
Another type of noise is a speckle noise which is multiplicative in nature. Noise is present in image
either in an additive or multiplicative form.
Rule for additive noise
w(x, y) = s(x, y) + n(x, y) , ……………(1)
Rule for multiplicative noise
w(x, y) = s(x, y)×n(x, y) , ……………(2)
where (x,y) is original signal, n(x,y) is the noise introduced into the signal to produce a noisy image
w(x,y), and (x,y) is the pixel location. The above image algebra is done at pixel level. Image addition
also has applications in image morphing. Image multiplication means the brightness of the image is
varied.
The digital image acquisition process transforms an optical image into a continuous electrical signal
that is, sampled. In every step of the process there are fluctuations caused by natural phenomena,
adding random value to the exact brightness value for a given pixel.
2.1 Gaussian Noise
A gaussian noise is evenly distributed in the signal. That means every pixel in the noisy image is the
sum of the a random Gaussian distributed noise value and true pixel value. This type of noise has a
Gaussian distribution, which has a probability distribution function given by,
5

……….(3)
Where g represents the gray level, m is the mean of the function and σ is standard deviation in the
noise. Graphically, it is represented as shown in Figure below.
Figure 1 : Gaussian distribution
2.2 Salt and Pepper Noise
Salt and pepper noise is impulse type of noise, that is also referred to as intensity spikes. It is caused
generally due to the errors in the data transmission. It has only two possible values that is a and b.
The probability of each is typically less than 0.1. Corrupted pixels can be set alternatively to the
minimum or to the maximum value, giving image a “salt and pepper” like appearance. Pixels remain
unchanged for unaffected. For a 8-bit image, the value of pepper noise is 0 and for salt noise 255.
Salt and pepper noise is mainly caused by malfunctioning of pixel elements in the sensors of cameras,
faulty memory locations, or timing errors of the digitization process.
6

The probability density function for this type of noise is shown in the Figure below.
. Figure 2: PDF for salt and pepper noise
2.3 Speckle Noise
Speckle noise is multiplicative noise. This type of noise occurs mostly in all coherent imaging
systems such as acoustics, laser, acoustics and SAR (Synthetic Aperture Radar) imagery. Source of
this noise is attributed to the random interference between the coherent returns. A fully developed
speckle noise has the characteristic of multiplicative noise. Speckle noise follows a gamma
distribution and given as
………………(4)
where variance is a2αand g is the gray level.
7

2.4 Brownian Noise
Brownian noise is under the category of fractal or 1/f noises. The mathematical model for 1/f noise is
the fractional Brownian motion. Brownian motion is non-stationary stochastic process which follows
a normal distribution. Brownian noise is a special case of 1/f noise. It can be obtained by integrating
white noise. It can be graphically represented as shown in Figure below.
Figure 3 : Brownian noise distribution
2.5 Poisson Noise
Many images like as those from radiography, have noise that satisfies a poisson distribution.
Magnitude of Poisson noise varies across an image and it depends on the image intensity, thatmakes
removing such noise very hard. Poisson images occur in situations where the image acquisition is
performed using the detection of particles (e.g) counting photons being emitted from a radioactive
source is applied in medical imaging like SPECT and PET , therefore Poisson noise reduction is an
essential problem.Poisson noise is generated from the data in place of adding artificial noise to the
data. For ex. if a pixel in an unsigned integer input has the value 10, then corresponding output pixel
will be generated from Poisson distribution with a mean 10.
8

CHAPTER3
The Wavelet Transforms and De-noising
9
3.1. Discrete Wavelet Transform (DWT) - Principles:
Wavelets are the mathematical functions which analyze data according to the scale or
resolution. They help in studying a signal in different windows or in different resolutions. For
example, if the signal is viewed in the large window, gross feature can be noticed, and if viewed
in a small window, only the small features can be noticed. The wavelets provide some
advantages over Fourier transforms. For instance, they do a great job in approximating signals
with sharp spikes and signals having discontinuities. Wavelets can also model music, speech,
video and non-stationary stochastic signals. The wavelets can be used in applications such as
turbulence, image compression, human vision, earthquake prediction, etc.
The term “wavelets” is refered to a set of orthonormal basis functions generated by translation
and dilation of scaling function φand a mother wavelet ψ. A finite scale multi resolution
representation of a discrete function is called as a discrete wavelet transform. DWT is a fast
linear operation on the data vector, whose length is an integeral power of 2. This transform is
orthogonal and invertible where the inverse transform expressed as the matrix is the transpose
of the transform matrix. The wavelet basis or function, unlike sines and cosines in Fourier
transform, is localized in space. Similar to sines and cosines the individual wavelet functions
are localized in frequency.
The orthonormal basis or wavelet basis is defined as
……………(5)
The scaling function is given as
…………. (6)
10

Where ψ is the wavelet function and j and k are integers that scale and dilate the wavelet
function. Factor ‘j’ in Equations is called as the scale index, which indicates the width of the
wavelet. The location index k provides the position. The wavelet function is dilated by powers
of two and is translated by the integer k. In terms of the wavelet coefficients, the wavelet
equation is
………….(7)
Where g0, g1, g2…. are high pass wavelet coefficients. The scaling equation in terms of scaling
coefficients as given below
………….(8)
The function φ(x) is the scaling function and the coefficients h0, h1,….. are low pass scaling
coefficients. The wavelet and scaling coefficients are related by the quadrature mirror
relationship, which is
………….(9)
Where N is the number of vanishing moments.
11

3.2 Properties of DWT
Properties of a discrete wavelet transforms are given below.
DWT is a fast linear operation, that can be applied on data vectors having length as
integeral power of 2.
DWT is invertible and orthogonal. The scaling function φand the wavelet function ψ
are orthogonal to each other in L2(0, 1), i.e., <φ, ψ>= 0.
The wavelet basis is localized in the space and frequency.
The coefficients satisfies some constraints
………………………(10) & (11)
Here δis the delta function and l is the location index.
…………….(12)
12

3.3 Wavelet Thresholding
The term wavelet thresholding is defined as decomposition of the data of image into wavelet
coefficients, comparing the detailed coefficients having a given threshold value, and
minimizing these coefficients close to zero to remove the effect of noise in the data. Then image
is reconstructed from modified coefficients. This is also known as inverse discrete wavelet
transform. At the time of thresholding, a wavelet coefficient is compared to the given threshold
and is set to zero if its magnitude is less than the threshold otherwise, it is then retained or
modified depending on the thresholding rule. Thresholding distinguishes between coefficients
due to noise and the ones consisting of important signal information. The selection of a
threshold is an important point of interest. It plays an important role in the removal of noise in
the images because de-noising most frequently produces smoothed images, by reducing the
sharpness of the image. Care should be taken to preserve the edges of the de-noised image.
Various methods for wavelet thresholding exists, which rely on the choice of a threshold value.
Typically used methods for image noise removal include Sureshrink, VisuShrink and
BayesShrink. It is necessary to know about the two generic categories of thresholding. These
are hard thresholding and soft thresholding. The hard-thresholding TH is given as
……………(13)
where t is the threshold value. A plot of TH is shown in Figure below
Figure 4 : Hard thresholding
13
Therefore, all coefficients whose magnitude is greater than the selected threshold value T
remains same and the others with magnitudes smaller than t are set to zero. It creates a region
around 0 where the coefficients are considered to be negligible.
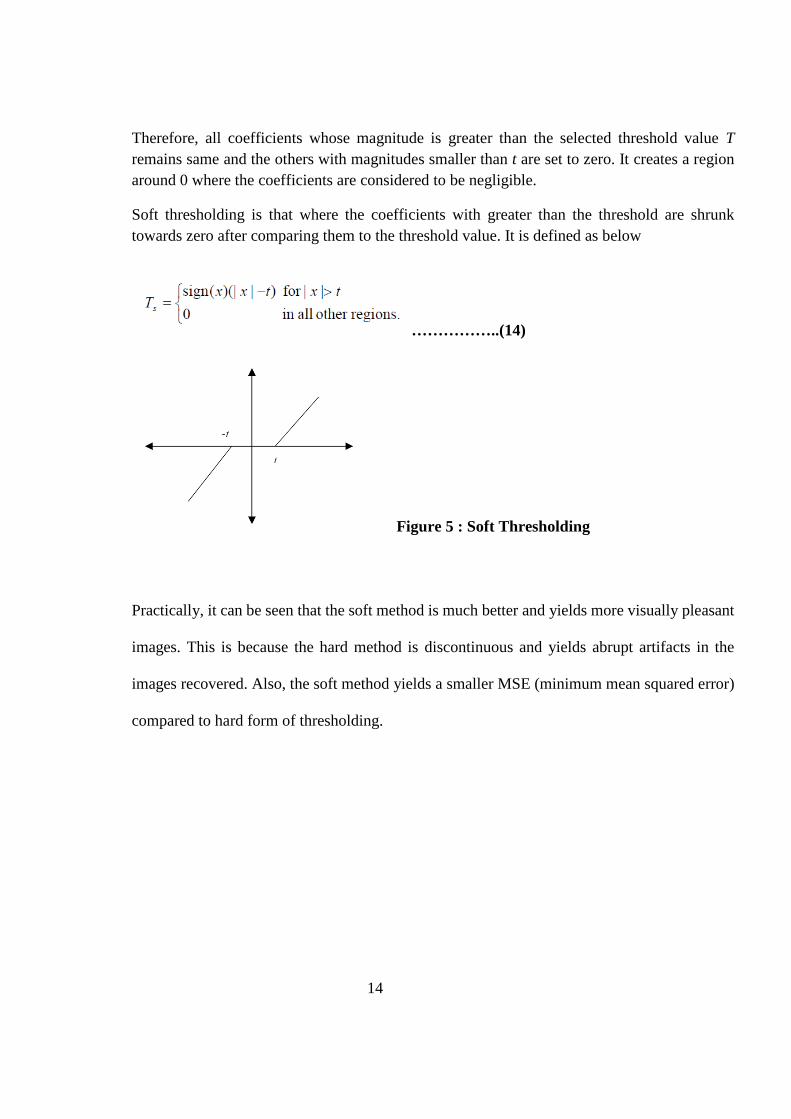
Soft thresholding is that where the coefficients with greater than the threshold are shrunk
towards zero after comparing them to the threshold value. It is defined as below
……………..(14)
Figure 5 : Soft Thresholding
Practically, it can be seen that the soft method is much better and yields more visually pleasant
images. This is because the hard method is discontinuous and yields abrupt artifacts in the
images recovered. Also, the soft method yields a smaller MSE (minimum mean squared error)
compared to hard form of thresholding.
14
CHAPTER4
The Curvelet Transform
15
4.1 Introduction
The Curvelet transform is a higher dimensional generalization of the wavelet transform designed to
represent images at different scales and different angles. Curvelet transform is a special member of
the multi scale geometric transforms. It is a transform with a multi scale pyramid with many directions
at each length scale. Curvelets will be superior over wavelets in following cases:
Optimal sparse representation in object with edges
Optimal image reconstruction of severely ill-posed problems
Optimal sparse representation in wave propagators
The idea of the Curve-let transform is first to decompose the image into sub-bands, i.e. to separate
the object into a series of disjoint scales. Curve-lets are initially introduced by Candes and Donoho.
The Discrete Curvelet transform (DCT) takes as input a Cartesian grid of the form ,
, 0 , and outputs a collection of coefficients cD ( j, l, k)
defined by
…………….(15)
where are digital curvelet waveforms which preserve the listed properties of the continuous
curve-let. DCT can be implemented in two ways. First method is based on unequally-spaced fast
Fourier transform (USFFT) and the second is based on the Wrapping of specially selected Fourier
samples. The two implementations are differ by spatial grid used to translate curve-lets at each scale
and angle.
16
The curve-let de-noising method consists of the following steps:
Estimate the noise standard deviation ‘σ’ in the input image
Calculate the Curve-let transform of the input image. We get a set of bands wj, each band wj
contains Nj coefficients and corresponds to a given resolution level.
Calculate noise standard deviation’ ’ for each band j of the Curve-let transform.
For each band j do : Calculate the maximum of the band and multiply each curve-let
coefficient.
Reconstruct the image from the modified curvelet Coefficient
4.2 Image de-noising using curve-lets
Image De-noising is implemented to produce good estimates of the original image from noisy
observations. The restored images hould contain less noise than the observations while still keep
sharp transitions (i.e edges). Suppose an image f(m,n) is corrupted by the additive noise
g(m,n) = f(m,n) + η(m,n) …………….(16)
where η(m,n) are independent identically distributed Gaussian random variable with zero mean and
variance σ2. Image de-noising algorithms vary from simple thresholding to complicate model based
methods. However simple thresholding methods can remove most of the noise.
4.3 Algorithm
1. Apply the Forward Curvelet transform to the noisy image.
2. Threshold the Curvelet co-efficients to remove some insignificant curve-let co-efficients by using
a thresholding function in the curve-let domain.
3. Inverse Curvelet transform of the thresholded co-efficients to reconstruct a function.
17

4.4 Curve-let Shrinkage/Thresholding
Shrinkage/thresholding plays an important role incurve-let application. Various thresholding
techniques have been applied on the curve-let co-efficient of the observed image. The small co-
efficients are dominated by noise, while co-efficient with large absolute value carry more signal
information than noise. As a result noisy co-efficients (small co-efficients below acertain threshold
value) are replaced by zero.
The curve-let shrinkage is taken as
…………(17)
T denotes the Curve-let transform, T-1 the inverse transform and Sσ is the thresholding function.
18
CHAPTER5
Results and Discussion
19

5.1 Results
The experiments are performed on several types of gray scale images of size 256 x 256 in MATLAB
platform and the Curve-let transform via USFFT and Wrapping technique was Implemented based
on curve-let software package. The effectiveness of the Curve-let shrinkage methods as well as partial
reconstruction of Curve-let coefficients are demonstrated for various gray scale images with a noise
factor of σ = 20 for Random noise, noise density of 0.04 for Salt & Pepper noise, a multiplicative
noise factor of 0.05 for Speckle noise and for Gaussian white noise a mean of 0 and 0.01 variance is
used.
To compare the results of different curvelet thresholding techniques, PSNR measure is used
…………..(18)
here fmax is the maximum value of the image intensities.
The average PSNR measurements of various gray scale images degraded by Random noise, Speckle
noise, Salt & Pepper noise, Gaussian noise and Poisson noise with the two digital implementations
of Curvelet transform are listed in tables.
Table1: De-noising results (PSNR in dB) with curve-let via
USFFT for the four de-noising methods for CT images
Noise Noisy image Soft
Thresholding
Hard
Thresholding
Partial
reconstruction
Random 21.09 26.89 28.90 24.28
Salt and pepper 18.67 24.70 20.87 19.82
Guassian 19.77 27.70 28.12 22.40
Speckle 21.20 27.12 28.90 22.50
Poisson 27.55 27.28 31.24 28.10
20
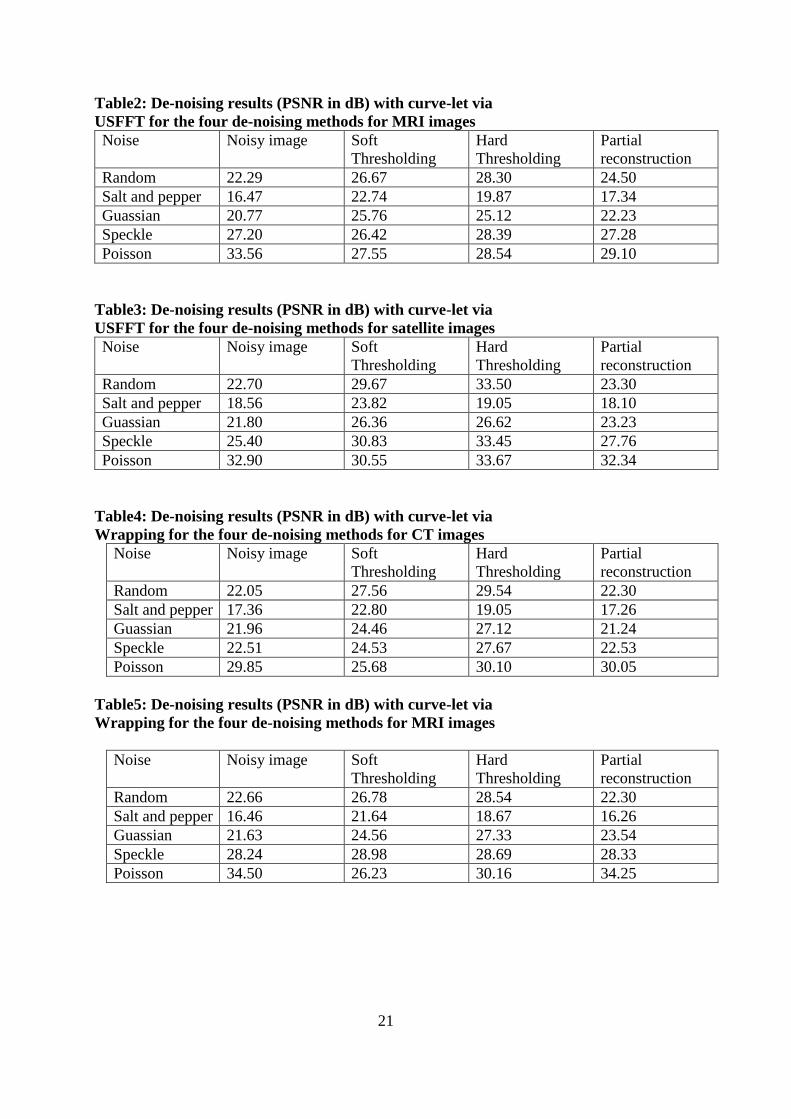
Table2: De-noising results (PSNR in dB) with curve-let via
USFFT for the four de-noising methods for MRI images
Noise Noisy image Soft
Thresholding
Hard
Thresholding
Partial
reconstruction
Random 22.29 26.67 28.30 24.50
Salt and pepper 16.47 22.74 19.87 17.34
Guassian 20.77 25.76 25.12 22.23
Speckle 27.20 26.42 28.39 27.28
Poisson 33.56 27.55 28.54 29.10
Table3: De-noising results (PSNR in dB) with curve-let via
USFFT for the four de-noising methods for satellite images
Noise Noisy image Soft
Thresholding
Hard
Thresholding
Partial
reconstruction
Random 22.70 29.67 33.50 23.30
Salt and pepper 18.56 23.82 19.05 18.10
Guassian 21.80 26.36 26.62 23.23
Speckle 25.40 30.83 33.45 27.76
Poisson 32.90 30.55 33.67 32.34
Table4: De-noising results (PSNR in dB) with curve-let via
Wrapping for the four de-noising methods for CT images
Noise Noisy image Soft
Thresholding
Hard
Thresholding
Partial
reconstruction
Random 22.05 27.56 29.54 22.30
Salt and pepper 17.36 22.80 19.05 17.26
Guassian 21.96 24.46 27.12 21.24
Speckle 22.51 24.53 27.67 22.53
Poisson 29.85 25.68 30.10 30.05
Table5: De-noising results (PSNR in dB) with curve-let via
Wrapping for the four de-noising methods for MRI images
Noise Noisy image Soft
Thresholding
Hard
Thresholding
Partial
reconstruction
Random 22.66 26.78 28.54 22.30
Salt and pepper 16.46 21.64 18.67 16.26
Guassian 21.63 24.56 27.33 23.54
Speckle 28.24 28.98 28.69 28.33
Poisson 34.50 26.23 30.16 34.25
21

Table6: De-noising results (PSNR in dB) with curve-let via
Wrapping for the four de-noising methods for satellite images
Noise Noisy image Soft
Thresholding
Hard
Thresholding
Partial
reconstruction
Random 22.23 30.48 28.55 22.36
Salt and pepper 16.24 23.40 19.33 16.25
Guassian 21.47 26.55 26.35 22.19
Speckle 25.45 30.90 28.70 28.99
Poisson 32.66 30.60 28.15 34.40
De-noising results for CT image (Random Noise) via
USFFT (a) Original (b) Noisy (PSNR=22.05) (c) Soft
(PSNR=26.48) (d) Hard (PSNR=29.94) (e) Garrote
(PSNR=29.79) (f) Partial Reconstruction (PSNR=24.42)
22

De-noising results for Satellite image (Speckle Noise)
via USFFT (a) Original (b) Noisy (PSNR=26.82) (c)
Soft (PSNR=33.77) (d) Hard (PSNR=36.67) (e)
Garrote (PSNR=36.48) (f) Partial Reconstruction
(PSNR=27.75)
De-noising results for MRI image (Gaussian) via
Wrapping (a) Original (b) Noisy (PSNR=21.69) (c) Soft
(PSNR=23.32) (d) Hard (PSNR=25.27) (e) Garrote
(PSNR=24.79) (f) Partial Reconstruction (PSNR=22.17)
23

CHAPTER7
Conclusion
24

7.1 Conclusions and Discussion:
A strategy for digitally implementing the Curve-let transform via USSFT and Wrapping
technique is presented. The Curve-let transform is capable of resolving 2D singularities and
represents edges more efficiently in images. The resulting implementations have the exact
reconstruction property and gives table reconstruction. The experimental results showed that
the Curve-let transform implemented with USFFT & Wrapping Algorithm using Hard
&Garrote thresholding consistently produces the highest PSNR for Bio medical images,
satellite images & natural images degraded by Random noise, Gaussian noise and Speckle
noise, while soft thresholding offers best results for de-noising Salt & Pepper noise for all the
test images used.
Alhough best results are obtained while de-noising the test images corrupted by Random noise,
Speckle noise, Gaussian noise and Salt & Pepper noise in terms of PSNR gain it is noticed in the
result that lowest PSNR gain is obtained for Bio-medical images when compared to satellite
images.
The results clearly indicates that Curve-let transform using thresholding techniques proves to be
inferior in de-noising Bio-medical images corrupted by Random noise, Gaussian noise, Speckle
noise and Salt and Pepper noise. Curve-let thresholding techniques proves to be a failure in the
removal of Poisson noise in Bio-medical images. Partial reconstruction of curve-let coefficients
proves to be a failure for all types of noises tested with various images. However the visual quality
of images is preserved.
25

REFERENCES
[1] R.Sivakumar. 2007. ” De-noising of Computer Tomography Images using Curve-let
transform”, ARPN Journal of Engineering and applied Sciences”, Vol2, No1, February 2007.
[2] Jean-Lue Starck, Emmanuel J. Candes and David L.Donoho. 2002. “ The Curve-let transform
for Image De-noising” IEEE Transactions on Image Processing, Vol 11, No 6, June 2002.
[3] Yeqiu Li, Jianming Lu, Ling Wang. 2005. ”Removing Poisson Noise From Images In Wavelet
Domain”,2005 IEEE
[4] E.Candes & D.L.Donoho,”Fast Discreet Curve-let transform”, Stanford University, July2005.
[5] Ke Ding. 2010. ”Wavelets, curve-lets and Wave Atoms for Image Denoising”,2010 3rd
International Congress on Image& Signal Processing(CISP 2010).
[6] RafaelC. Gonzalez and Richard E. Woods,” Digital Image Processing” Second Edition.
[7] E. J. Candµes and D. L. Donoho. Curve-lets. Manuscript.
http://wwwstat.stanford.edu/~donoho/Reports/1999/curvelets.pdf, 1999.
[8] E. J. Candµes and D. L. Donoho. Curve-lets { a surprisingly e®ective non-adaptive
representation for objects with edges. In A. Cohen, C. Rabut, and L.L. Schumaker, editors, Curve
and Surface Fitting: Saint-Malo 1999, Nashville, TN, 1999. Vanderbilt University Press.
[9] Jun Xu, Lei Yang, Dapeng Wu. 2010. ” Ripplet : A new transform for image processing”,
J.Vis. commun. Image R.21(2010) 627-639
[10] D.L.Donoho. 1995. “De-noising by soft-thresholding”, IEEE Transactions on Information
Theory, Vol 41, No3, May 1995.
[11] R.A. Zuidwijk. The wavelet X-ray transform. Technical Report PNA-R9703, ISSN 1386-
3711, Centre Math. Computer Sci., 1997.
[12] A. Averbuch, R. R. Coifman, D. L. Donoho, M. Israeli, and J. Waldén,“Polar FFT, rectopolar
FFT, and applications,” Stanford Univ., Stanford,CA, Tech. Rep., 2000
[13] R. R. Coifman and D. L. Donoho, “Translation invariant de-noising,” in Wavelets and
Statistics, A. Antoniadis and G. Oppenheim, Eds. New York. Springer-Verlag, 1995, pp. 125–
150.
26
Related Documents