STUDY OF FLOW AND CONTROL OF GAS MIXTURE FOR THE RESISTIVE PLATE CHAMBER (RPC) PERFORMANCE IN CLOSED LOOP SYSTEM A THESIS SUBMITTED FOR FULFILMENT OF THE REQUIREMENTS FOR THE DEGREE OF Doctor of Philosophy By KALMANI SURESH DEVENDRAPPA Under the guidance of Dr. P. V. Hunagund Professor of Electronics FACULTY OF SCIENCE & TECHNOLOGY DEPARTMENT OF POST GRADUATE STUDIES & RESEARCH IN APPLIED ELECTRONICS, GULBARGA UNIVERSITY, KALABURAGI-585 106, KARNATAKA, INDIA April, 2018 Electronic Instrumentation

Welcome message from author
This document is posted to help you gain knowledge. Please leave a comment to let me know what you think about it! Share it to your friends and learn new things together.
Transcript

STUDY OF FLOW AND CONTROL OF GAS MIXTURE
FOR THE RESISTIVE PLATE CHAMBER (RPC) PERFORMANCE IN CLOSED LOOP SYSTEM
A THESIS SUBMITTED FOR FULFILMENT OF THE REQUIREMENTS
FOR THE DEGREE OF
Doctor of Philosophy
By
KALMANI SURESH DEVENDRAPPA
Under the guidance of
Dr. P. V. Hunagund
Professor of Electronics
FACULTY OF SCIENCE & TECHNOLOGY
DEPARTMENT OF POST GRADUATE STUDIES &
RESEARCH IN APPLIED ELECTRONICS,
GULBARGA UNIVERSITY, KALABURAGI-585 106,
KARNATAKA, INDIA
April, 2018
Electronic Instrumentation
ii
iii
Declaration
I hereby declare that, the research work presented in the thesis entitled
“STUDY OF FLOW AND CONTROL OF GAS MIXTURE FOR THE RESISTIVE
PLATE CHAMBER (RPC) PERFORMANCE IN CLOSED LOOP SYSTEM” has
been carried out by me, under the supervision of Dr. P. V. Hunagund, Professor,
Department of Applied Electronics, Gulbarga University, Kalaburagi for the award of
the degree of Doctor of Philosophy.
Further, the results presented in this thesis have not been submitted in any
University or Institute for the award of any other degree.
Date: Kalmani Suresh Devendrappa
Place: Kalaburagi (Research student)

iv
Declaration
I declare that this written submission represents our ideas in my own words
and where others’ ideas or words have been included, I have adequately cited and ref-
erenced the original sources. I also declare that I have adhered to all principles of aca-
demic honesty and integrity and have not misrepresented or fabricated or falsified any
idea/data/fact/source in my submission. I understand that any violation of the above
will be cause for disciplinary action by the Institute / University and can also evoke
penal action from the sources which have thus not been properly cited or from whom
proper permission has not been taken when needed.
Place:
Date:
Kalmani Suresh Devendrappa
(Research student)
v
Acknowledgements
I wish to place on record my deep sense of gratitude to my research guide
Dr. P. V. Hunagund, Department of PG studies and Research in Applied Electronics,
Kalaburagi for his initiative, motivation, constant encouragement, meticulous care,
co-operation, guidance and valuable suggestions at all stages of my research work to
bring out my investigations of research work in thesis form. The remarks and sugges-
tions made by him throughout this work were very resourceful.
My mentor Prof. Naba K. Mondal Former INO Project Director, TIFR Mumbai, is
a lot more than just that to me. I have enjoyed working with him for the last 33 years
in building several front-ranking high energy physics experiments. I am immensely
inspired by his enthusiasm and encouragement in pursuing the research work.
I would like to thank Profusely TIFR Director Prof. Sandeep Tribedi, Former Di-
rector, Dean NSF, INO Project Director and the Former Chairperson of DHEP; Prof.
Mustansir Barma, Prof. E. V. Sampathkumaran, Prof. Vivek Datar and Prof. B.S.
Acharaya, respectively for permitting me to make use of the laboratory facilities at
TIFR, Mumbai, for my higher studies.
I am extremely grateful to Dr. S. R. Niranjana, Vice-Chancellor, Dr. E.T. Puttaiah,
Former Vice-chancellor, Dr Dayanand Agsar, Registrar, Gulbarga University, Kala-
burgi for their administrative help.
I would like to thank and place on record, the Founder Professor and Chairman,
Dean, Faculty of science, Member Syndicate, Late Dr. H.V. Ganganna who was my
mentor at Post graduation. Moreover, I am very thankful to Mrs. Sudha Ganganna for
her encouraging words to pursuing my higher studies leading to Ph.D.

vi
I am thankful to Dr. R. L. Raibagkar, Professor and Chairman, Prof. S. N. Mulgi,
and Prof. Pradeep M. Hadalgi; for their help, co-operation and valuable suggestions in
completing my research work.
I am extremely thankful to Dr. (Mrs.) Vani R.M, Professor and Head, Department
of University Science and Instrumentation Center (USIC) for her fruitful discussions
and encouragement throughout my research work.
I wish to acknowledge for many useful discussions, with late Avinash Joshi
(M/s Alpha Pneumatics, Mumbai), my guru on gas systems.
I am also grateful to the authorities of Tata Institute of Fundamental Research,
Mumbai and the Gulbarga University, Gulbarga, for providing me with all the facili-
ties required for carrying out this research work.
I am indebted to Prof. Sudeshna Banerjee, Prof. Gobinda Mujamdar, Prof. Shashi
Dugad , Dr. Satyanarayana Bheesette, Dr. Sudeb. Bhattacharya, Dr. G. Rajasekaran,
Dr. Y. P. Viyogi, Dr. Deepak Samuel, Dr. G. K. Padmashree, Dr. M. V. N. Murthy
for their valuable suggestions and encouragement with the present work.
I had opportunities to interact with many experts in the field. I wish to thank Prof.
Rinaldo Santanico (INFN Roma), Dr. Archana Sharma (CERN), R. Guida, F. Hahn,
Prof. Yoshio Hayashi and Prof. Saburao Kawakami (Osaka City University), Prof A.
B. Pandit (ICT) and Rushikesh Shinde (VJTI).
It is a pleasure to acknowledge Ravindra Ragunath Shinde, Piyush Verma, Man-
dar Saraf, Pathaleswar, V Pavan Kumar and Manas Bhuyan for their immense help.
A sincere vote of thanks to my TIFR, department colleagues, Professors; Shashi
Dugad, Sunil Gupta, Tariq Aziz, Atul Gurtu, K. Sudhakar, Kajari Mazumdar, as well
as S. R. Chendvankar, M. R. Patil and P. K. Mohanty for their help and encourage-
ment throughout the period of this research work.

vii
I wish to thank the INO Electronics R&D Team Members Suresh Upadhya, K. C.
Ravindran, Venkatesam Reddy, Nagaraj Panyam, Dipankar Sil, Yuvaraj E, N. Si-
varamkrishana, Sarika Bhide, Shekhar Lahamge, Shobha Rao, B. K. Nagesh, and S.
R. Joshi for their immense timely support and co-operation.
I am thankful to timely technical help by Dinesh B. Ganure, Research student and
thanks to Smt. Umadevi and late. Shri. Hanumant Doddamani, Department of Applied
Electronics, Gulbarga University, for their ministerial support and co-operation.
My sincere gratitude to the INO students, Suryanaraya Mondal, Peturaj and
Apoorva Bhat, for their constructive suggestions on occasions of discussions, assis-
tance on setting up the experiments.
I would like to thank Santosh Chavan, Vishal Asgolkar, Ganesh Ghodake and
Darshana Koli, who provided an admirable technical assistance in carrying out the
experiments and also thank the DHEP, Department administrative staff namely
Vidhya Lotankar and Minal Rane.
I owe most of my accomplishments including this one, to my wife Smt. Kalpana
and daughters; Ar. Rochan and Dr. Rasika. Due to my self-commitment towards end-
less work, most often, I could not honor even the family commitments and end up be-
ing a guilty witness to their endless patience and silent sacrifices.
Last but not the least; I am very much grateful to those people whose names have
not been mentioned here, but who have helped me directly or indirectly for the com-
pletion of my research work.
Kalmani Suresh Devendrappa

viii
Preface
The India-based Neutrino Observatory (INO) collaboration plans to construct a
large 50 K ton magnetized Iron tracking CALorimeters (ICAL) in the Bodhi hills, in
the state of Tamil Nadu in an underground cavern. The key goal of this observatory is
to detect, identify and evaluate the properties of omnipresent cosmic particles called
Neutrinos. This giant particle experiment will use active large number (28,800) of gas
based detectors called as Resistive Plate Chamber (RPC) of size (1.85 × 1.9) m2 each,
filled with gas mixture media within which all action takes place during an event. The
performance of the calorimeter relates to performance of individual detectors and in-
cludes parameters such as efficiency of detection, sensitivity of measurement, opera-
tional life of the individual detector. The other peripheral requirements like gas con-
sumption, pollution caused by gas leaks and the DAQ system are of prime importance
and are, in a way, connected with the overall performance.
The numbers of RPCs in the ICAL experiment are 28,800; each has 128 channels
(64 X-side and 64 Y-side) readout. Therefore DAQ has to process about 3.7 million
channels on the arrival of predefined trigger criteria.
The total quantity of mixed gas in the ICAL calorimeter RPCs is about 200 M3.
The RPC use a gas mixture consisting of R134a (C2H2F4), I-butane (iC4H10) and Sul-
phur Hexafluoride (SF6) in ratio of 95:4.5:0.5 respectively and the mixed gas is a
non–flammable and are relative expensive. To maintain the detector performance and
efficiency, the gas mixture is required to flow through the RPCs continuously, main-
tains the composition of the gas mixture and applied HV as per the characteristics of
each RPC. The flow rate parameter is to be optimized for a proto-type detector taking
into the RPC performance tests. As the number of RPCs are large in number, letting
ix
the gas into atmosphere will contributes significantly to pollution and global warming
and moreover the gas is expensive therefore it is mandatory to reuse the gas in the
closed loop mode. In addition there will be logistic problems of taking this huge quan-
tity of gas in and out of the underground experiment (cavern below 1 KM approxi-
mately).
A proto-type, PLC (Programmable Logic Controller –Siemens make) based
Closed Loop gas recirculation System (CLS) is designed, which supports 12 RPCs
stack of size (1.85 × 1.9) m2 each. This system is in operation for the last 4.5 years
and several factor related to the changes in the periodic atmospheric pressure changes
are addressed and the system is successfully functioning satisfactorily.
The performance of the RPCs depend on environmental conditions (such as at-
mospheric pressure, ambient temperature, humidity ), flow rate of gas mixture into the
RPCs, quality of gas , the RPC input gas pressure, uniform resistivity of conductive
coating on one surface of each glass, gap thickness etc. The purity of gas studies indi-
cates a correlation between RPC performance and the quality of the gas mixture. The
current drawn by the chambers can rapidly rise if the amounts of pollutants in the gas
mixture increase due to poor gas quality. Also in reusing the gas in the CLS, there are
several challenges that need to be addressed like pressure at the input of the RPCs in
loop, gas purity, maintaining the gas composition, type of purifiers etc. In the present
case an RGA300 (Residual Gas Analyzer-SRS make), a small scale mass spectrome-
ter is connected in the closed loop gas recirculation system in the loop to continuous
monitor the gas coming out of the RPCs for the moisture content, composition of the
gas mixture, O2 level in the mixture etc. The appropriate mixtures of the molecular
sieves (13x, 5A0) are used in the purifier section in the CLS to remove and purify the
impurities like the moisture, O2 etc. The removal of N2 is not known and remains to be

x
unsolved. But, optimizing the leaks (air entering inside) in the CLS loop improves the
performance.
The flow rate of the gas mixture into the RPC is a very important parameter. In
the initial design stage design of CLS, the flow of few Standard Liters Per Minute
(SLPM) was assumed and due to which several glass RPCs were damaged in the test-
ing stage. The back ground rate for INO-ICAL is low by a factor compared to the ac-
celerator or the surface experiments. The ICAL RPCs use glass as electrode. There-
fore, a flow rate of few SCCM (Standard Cubic Centimeters per Minute) is good
enough. The flow rate is one of parameter that is addressed by simulation and by per-
forming experiments using different types of flow resistors namely the capillaries.
The pressure at the input of the RPC is studied in detail, understood and is a precisely
measured parameter. The tested pressure is 5 mbar and break down test value is ~12
mbar. The optimum safe operational value decided is (2 to 3) mbar for safe operation
of an RPC chamber. The laboratories, where the RPCs are tested are temperature and
humidity controlled and not pressure controlled. There is period atmospheric pressure
variation in the laboratory and due to which several RPCs were damaged (buttons
holding the glasses were popped up). This issue was resolved by using an external
pressure sensor to correct and set the required input pressure. During a 24 hour cycle
the atmospheric pressure oscillates twice about its mean value by nearly 3 mbar pres-
sure. The pressure inside RPC detector has to follow the outside pressure to remain
within specified safe pressure difference.
To control the flow of gas, the division technique using a capillary is employed to
distribute gas mixture in equal quantities to each detector. The capillary is a micro
bore tubular device having a large ratio of surface area to cross section area. The drag
effect of inner surface of micro-bore on each component of gas as a function of con-
xi
centration (partial pressure), molecular weight, density and total velocity are very im-
portant for dynamic equilibrium of gas concentrations. This device is studied in detail
for material, surface finish, length of capillary, radius of curvature of flow path and
bore diameter,. The feasibility of miniaturization of capillary structure within RPC
assembly and without adversely affecting the uniformity of gas mixture is studied.
To summarize, a flow rate of 6 SCCM (corresponds to about 1 volume change of
gas inside an RPC) with input pressure of (2 to 3) mbar and having a flow control us-
ing capillary (as flow resistor) is ideal for ICAL glass RPCs without deteriorating the
performance.
The entire research work is divided into the six chapters.
Chapter 1 begins with a brief note on INO-ICAL experiment; the aim of the ex-
periment with physics goals (measure precisely the mass of neutrino etc.) is presented.
The INO ICAL experiment details are tabulated. The glass RPC construction, work-
ing principle, types and classifications, modes of operation and their applications are
briefly mentioned. The gases used for the operation of RPCs are given.
Chapter 2 is devoted to the review of literature survey on RPC since invention,
types of RPCs, their performances, aging issues etc. The types of gas systems used
worldwide and the in-depth work done so far related to flow and control of gas mix-
ture for the RPC performance in a closed loop system is summarized in tabular form
and the objectives of the thesis is justified.
Chapter 3 discusses the entire research and development done on the thesis sub-
ject and parameters related to the RPC performance in a closed loop gas systems. We
do not have much expertise in our country in building the specialized gas mixing and
purification systems. Hence, the conceptual and block design parameters are chosen
from the CERN gas systems documents. But the overall control parameters and the

xii
designs of the system using PLCs is indigenized and a proto-type closed loop system
that supports 12 RPCs in feedback of gas mixture loop is developed and tested for pa-
rameters like flow rate, pressure and purity of gas.
The design and development work of the two types of gas systems namely, the
Open Loop gas System (OLS) and Closed Loop recirculation System (CLS), includ-
ing the problems and challenges which were overcome during the course of this work
are described in detail. The types of purifiers used are explained in detailed and those
which are readily available and being used else were, are mentioned. The gas analysis
studies that are done using RGA analysis for the gas coming out of the RPCs in the
loop are reported.
Chapter 4 deals with work done to justify the study of flow and control of gas
mixture for the Resistive Plate Chamber (RPC) performance when connected in a
closed loop system. Simulations for the flow and gas distribution inside an RPC on
different platforms are presented. The experiment setup using different types of capil-
lary for flow control is explored and described in detail.
Chapter 5 gives details of the results related to validation of CLS operation, long
term stability and ageing effects studies performed using RPCs in OES and CLS.
Chapter 6 is dedicated to summary, conclusions and remarks of the research
work done.
The list of references made for the research work has been put at the end of the
chapter. The list of publications of the author, references made and possible upgrade
and modifications for flow control in a CLS are given at the end of the thesis.
xiii
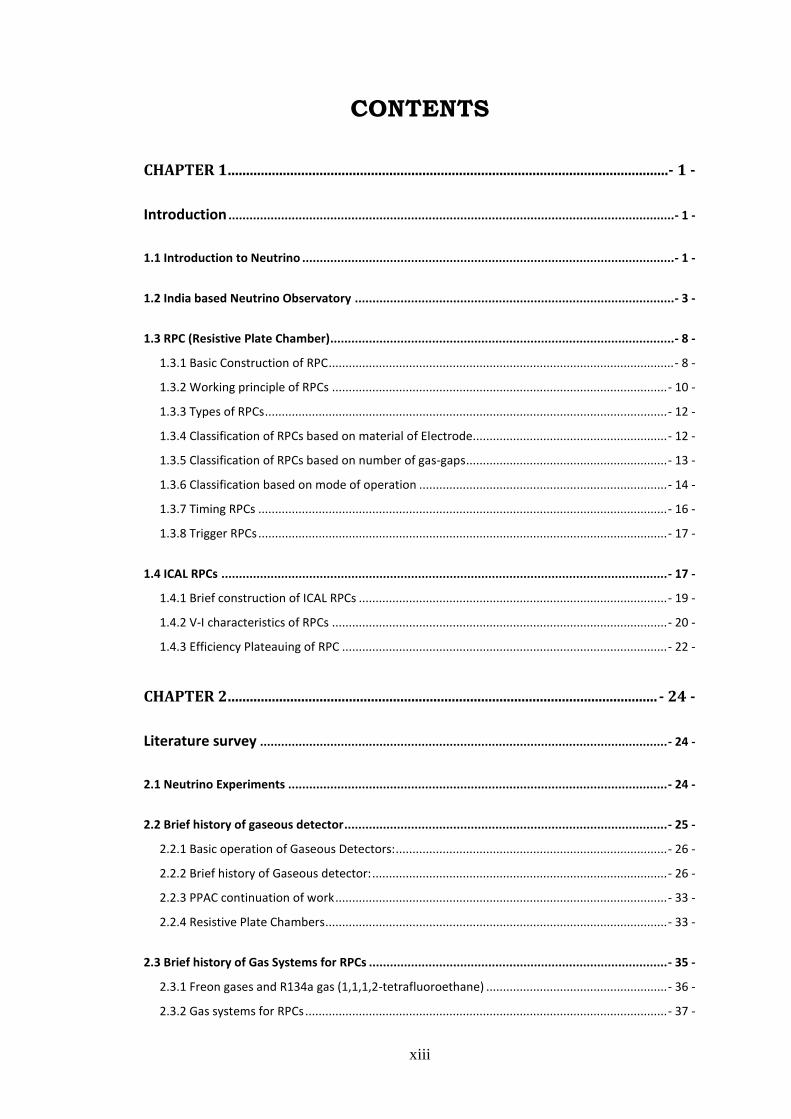
CONTENTS
CHAPTER 1 ........................................................................................................................- 1 -
Introduction ............................................................................................................................... - 1 -
1.1 Introduction to Neutrino .......................................................................................................... - 1 -
1.2 India based Neutrino Observatory ........................................................................................... - 3 -
1.3 RPC (Resistive Plate Chamber) .................................................................................................. - 8 -
1.3.1 Basic Construction of RPC ....................................................................................................... - 8 -
1.3.2 Working principle of RPCs .................................................................................................... - 10 -
1.3.3 Types of RPCs ........................................................................................................................ - 12 -
1.3.4 Classification of RPCs based on material of Electrode.......................................................... - 12 -
1.3.5 Classification of RPCs based on number of gas-gaps ............................................................ - 13 -
1.3.6 Classification based on mode of operation .......................................................................... - 14 -
1.3.7 Timing RPCs .......................................................................................................................... - 16 -
1.3.8 Trigger RPCs .......................................................................................................................... - 17 -
1.4 ICAL RPCs ............................................................................................................................... - 17 -
1.4.1 Brief construction of ICAL RPCs ............................................................................................ - 19 -
1.4.2 V-I characteristics of RPCs .................................................................................................... - 20 -
1.4.3 Efficiency Plateauing of RPC ................................................................................................. - 22 -
CHAPTER 2 ..................................................................................................................... - 24 -
Literature survey .................................................................................................................... - 24 -
2.1 Neutrino Experiments ............................................................................................................ - 24 -
2.2 Brief history of gaseous detector ............................................................................................ - 25 -
2.2.1 Basic operation of Gaseous Detectors: ................................................................................. - 26 -
2.2.2 Brief history of Gaseous detector: ........................................................................................ - 26 -
2.2.3 PPAC continuation of work ................................................................................................... - 33 -
2.2.4 Resistive Plate Chambers ...................................................................................................... - 33 -
2.3 Brief history of Gas Systems for RPCs ..................................................................................... - 35 -
2.3.1 Freon gases and R134a gas (1,1,1,2-tetrafluoroethane) ...................................................... - 36 -
2.3.2 Gas systems for RPCs ............................................................................................................ - 37 -
xiv
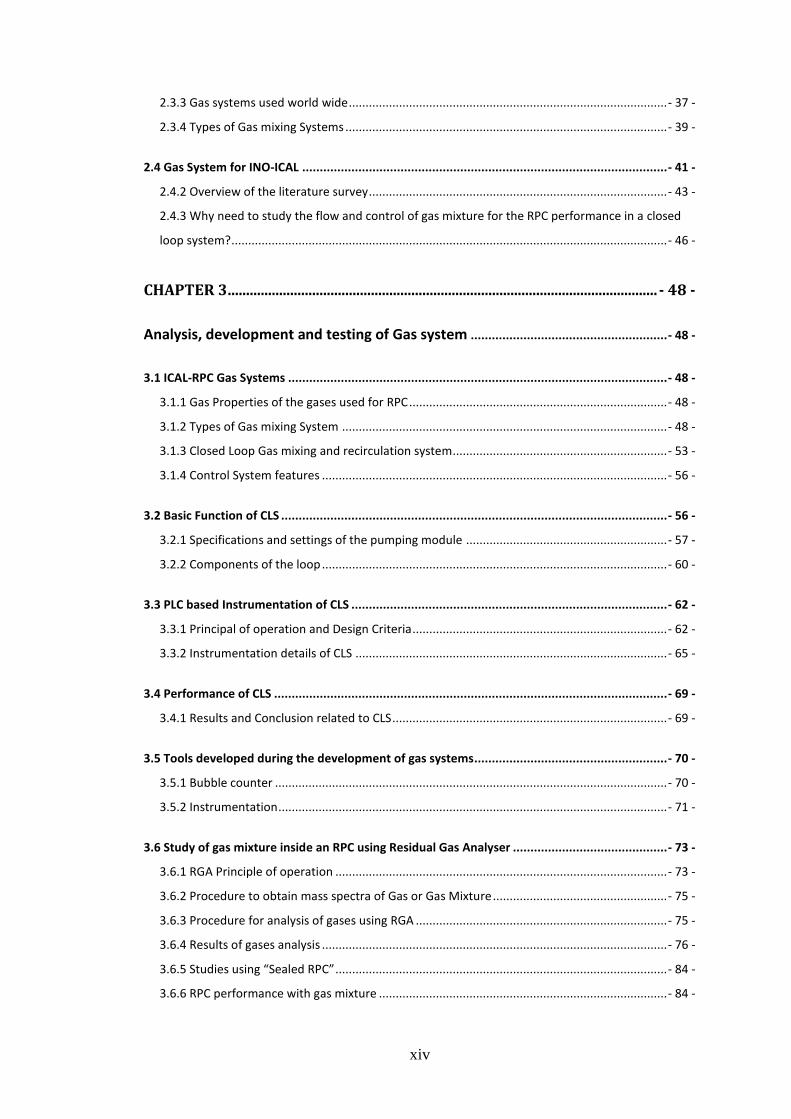
2.3.3 Gas systems used world wide ............................................................................................... - 37 -
2.3.4 Types of Gas mixing Systems ................................................................................................ - 39 -
2.4 Gas System for INO-ICAL ........................................................................................................ - 41 -
2.4.2 Overview of the literature survey ......................................................................................... - 43 -
2.4.3 Why need to study the flow and control of gas mixture for the RPC performance in a closed
loop system? .................................................................................................................................. - 46 -
CHAPTER 3 ..................................................................................................................... - 48 -
Analysis, development and testing of Gas system ........................................................ - 48 -
3.1 ICAL-RPC Gas Systems ............................................................................................................ - 48 -
3.1.1 Gas Properties of the gases used for RPC ............................................................................. - 48 -
3.1.2 Types of Gas mixing System ................................................................................................. - 48 -
3.1.3 Closed Loop Gas mixing and recirculation system................................................................ - 53 -
3.1.4 Control System features ....................................................................................................... - 56 -
3.2 Basic Function of CLS .............................................................................................................. - 56 -
3.2.1 Specifications and settings of the pumping module ............................................................ - 57 -
3.2.2 Components of the loop ....................................................................................................... - 60 -
3.3 PLC based Instrumentation of CLS .......................................................................................... - 62 -
3.3.1 Principal of operation and Design Criteria ............................................................................ - 62 -
3.3.2 Instrumentation details of CLS ............................................................................................. - 65 -
3.4 Performance of CLS ................................................................................................................ - 69 -
3.4.1 Results and Conclusion related to CLS .................................................................................. - 69 -
3.5 Tools developed during the development of gas systems....................................................... - 70 -
3.5.1 Bubble counter ..................................................................................................................... - 70 -
3.5.2 Instrumentation .................................................................................................................... - 71 -
3.6 Study of gas mixture inside an RPC using Residual Gas Analyser ............................................ - 73 -
3.6.1 RGA Principle of operation ................................................................................................... - 73 -
3.6.2 Procedure to obtain mass spectra of Gas or Gas Mixture .................................................... - 75 -
3.6.3 Procedure for analysis of gases using RGA ........................................................................... - 75 -
3.6.4 Results of gases analysis ....................................................................................................... - 76 -
3.6.5 Studies using “Sealed RPC” ................................................................................................... - 84 -
3.6.6 RPC performance with gas mixture ...................................................................................... - 84 -

xv
CHAPTER 4 ..................................................................................................................... - 86 -
Experimental studies on flow resistors and Simulation of gas flow inside an RPC ......... - 86 -
4.1 Experimental studies with Capillaries ..................................................................................... - 87 -
4.1.1 Design of capillary and testing .............................................................................................. - 87 -
4.1.2 Types of capillaries under test .............................................................................................. - 88 -
4.1.3 Experimental Setup .............................................................................................................. - 89 -
4.1.4 Ohmic law for pressure versus flow ..................................................................................... - 90 -
4.1.5 Flow rate versus pressure difference ................................................................................... - 94 -
4.1.6 Measurement of pressure difference across an RPC............................................................ - 95 -
4.1.7 Flow balance in a multiple RPCs ........................................................................................... - 95 -
4.1.8 Capillary Conclusion and Results .......................................................................................... - 97 -
4.2 Simulation studies for flow of gas distribution within an RPC ................................................ - 98 -
4.2.1 Objectives and Goals of simulation ...................................................................................... - 98 -
4.2.2 Simulation using Solid-Works ............................................................................................... - 99 -
4.3 Simulation using COMSOL .................................................................................................... - 114 -
4.3.1 Software tools and Criteria ................................................................................................. - 115 -
4.3.2 Interpretation of Graphs .................................................................................................... - 115 -
4.3.3 Experimental Setup ............................................................................................................ - 120 -
4.3.4 Results ................................................................................................................................ - 121 -
4.4 Simulation using CDF ............................................................................................................ - 122 -
4.4.1 Nozzle positions .................................................................................................................. - 123 -
4.4.2 Fluid Simulation .................................................................................................................. - 123 -
4.4.3 Gas Simulation of R134a ..................................................................................................... - 126 -
4.4.4 Interpretations of the velocities ......................................................................................... - 130 -
4.4.5 Mixed Gas simulation and Nozzle position variation studies ............................................. - 130 -
4.4.6 Results and interpretation .................................................................................................. - 137 -
4.4.7 Conclusion on simulations .................................................................................................. - 138 -
CHAPTER 5 .................................................................................................................. - 139 -
Validation and results related to flow and control of gas mixture for RPC performance. ........... - 139 -
5.1 Long term study stability ...................................................................................................... - 139 -
5.1.1 Efficiency of the CLS ............................................................................................................ - 143 -
5.1.2 Ageing effect and recovery of RPCs .................................................................................... - 146 -

xvi
5.1.3 CLS Validation ..................................................................................................................... - 147 -
CHAPTER 6 .................................................................................................................. - 149 -
Summary, Conclusions and Remarks .............................................................................. - 149 -
6.1 RPC Performance .................................................................................................................. - 149 -
6.2 Not in the scope of the research work .................................................................................. - 151 -
6.3 Summary of various Gas Systems ......................................................................................... - 151 -
6.3.1 Open Ended gas System (OES) ............................................................................................ - 152 -
6.3.2 Closed loop system ............................................................................................................. - 155 -
6.4 Observation and conclusions of flow and control of gas in CLS ............................................. - 156 -
6.5 Conclusions of Simulation Studies ........................................................................................ - 158 -
6.6 Some Remarks ...................................................................................................................... - 160 -
6.6.1 Leak test and flow control in CLS. ....................................................................................... - 161 -
6.7 Some new features for upgrading the CLS ............................................................................ - 161 -
6.7.1 Alternate gas mixture studies etc. ...................................................................................... - 162 -
APPENDIX A ................................................................................................................ - 163 -
Possible up-gradation / modification of the existing CLS for flow control .................................. - 163 -
A1: Limitation in the present CLS ............................................................................................... - 163 -
REFERENCES............................................................................................................... - 167 -
PUBLICATIONS OF THE AUTHOR ........................................................................ - 177 -
PHOTO-SHEET OF CLOSED LOOP SYSTEM (FRONT VIEW) .............. - 178 -
PHOTO-SHEET OF CLOSED LOOP SYSTEM (REAR VIEW) ................. - 179 -
xvii
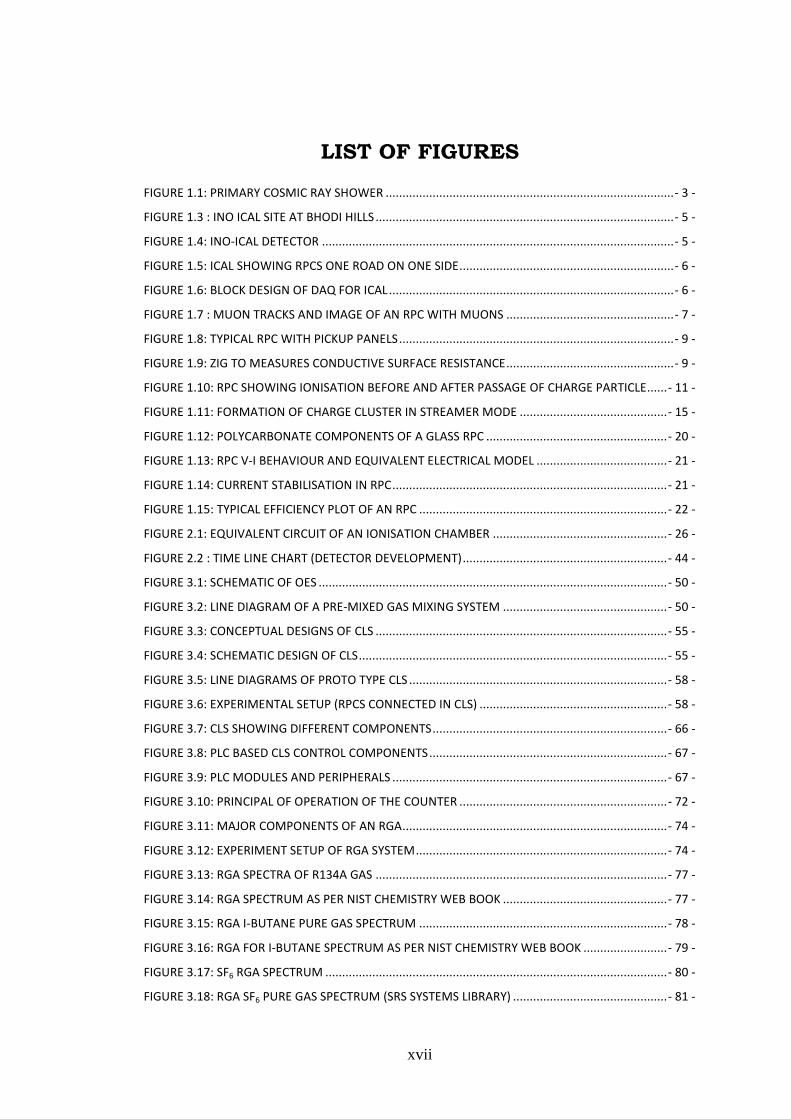
LIST OF FIGURES
FIGURE 1.1: PRIMARY COSMIC RAY SHOWER ...................................................................................... - 3 -
FIGURE 1.3 : INO ICAL SITE AT BHODI HILLS ......................................................................................... - 5 -
FIGURE 1.4: INO-ICAL DETECTOR ......................................................................................................... - 5 -
FIGURE 1.5: ICAL SHOWING RPCS ONE ROAD ON ONE SIDE ................................................................ - 6 -
FIGURE 1.6: BLOCK DESIGN OF DAQ FOR ICAL ..................................................................................... - 6 -
FIGURE 1.7 : MUON TRACKS AND IMAGE OF AN RPC WITH MUONS .................................................. - 7 -
FIGURE 1.8: TYPICAL RPC WITH PICKUP PANELS .................................................................................. - 9 -
FIGURE 1.9: ZIG TO MEASURES CONDUCTIVE SURFACE RESISTANCE .................................................. - 9 -
FIGURE 1.10: RPC SHOWING IONISATION BEFORE AND AFTER PASSAGE OF CHARGE PARTICLE ...... - 11 -
FIGURE 1.11: FORMATION OF CHARGE CLUSTER IN STREAMER MODE ............................................ - 15 -
FIGURE 1.12: POLYCARBONATE COMPONENTS OF A GLASS RPC ...................................................... - 20 -
FIGURE 1.13: RPC V-I BEHAVIOUR AND EQUIVALENT ELECTRICAL MODEL ....................................... - 21 -
FIGURE 1.14: CURRENT STABILISATION IN RPC .................................................................................. - 21 -
FIGURE 1.15: TYPICAL EFFICIENCY PLOT OF AN RPC .......................................................................... - 22 -
FIGURE 2.1: EQUIVALENT CIRCUIT OF AN IONISATION CHAMBER .................................................... - 26 -
FIGURE 2.2 : TIME LINE CHART (DETECTOR DEVELOPMENT) ............................................................. - 44 -
FIGURE 3.1: SCHEMATIC OF OES ........................................................................................................ - 50 -
FIGURE 3.2: LINE DIAGRAM OF A PRE-MIXED GAS MIXING SYSTEM ................................................. - 50 -
FIGURE 3.3: CONCEPTUAL DESIGNS OF CLS ....................................................................................... - 55 -
FIGURE 3.4: SCHEMATIC DESIGN OF CLS ............................................................................................ - 55 -
FIGURE 3.5: LINE DIAGRAMS OF PROTO TYPE CLS ............................................................................. - 58 -
FIGURE 3.6: EXPERIMENTAL SETUP (RPCS CONNECTED IN CLS) ........................................................ - 58 -
FIGURE 3.7: CLS SHOWING DIFFERENT COMPONENTS ...................................................................... - 66 -
FIGURE 3.8: PLC BASED CLS CONTROL COMPONENTS ....................................................................... - 67 -
FIGURE 3.9: PLC MODULES AND PERIPHERALS .................................................................................. - 67 -
FIGURE 3.10: PRINCIPAL OF OPERATION OF THE COUNTER .............................................................. - 72 -
FIGURE 3.11: MAJOR COMPONENTS OF AN RGA ............................................................................... - 74 -
FIGURE 3.12: EXPERIMENT SETUP OF RGA SYSTEM ........................................................................... - 74 -
FIGURE 3.13: RGA SPECTRA OF R134A GAS ....................................................................................... - 77 -
FIGURE 3.14: RGA SPECTRUM AS PER NIST CHEMISTRY WEB BOOK ................................................. - 77 -
FIGURE 3.15: RGA I-BUTANE PURE GAS SPECTRUM .......................................................................... - 78 -
FIGURE 3.16: RGA FOR I-BUTANE SPECTRUM AS PER NIST CHEMISTRY WEB BOOK ......................... - 79 -
FIGURE 3.17: SF6 RGA SPECTRUM ...................................................................................................... - 80 -
FIGURE 3.18: RGA SF6 PURE GAS SPECTRUM (SRS SYSTEMS LIBRARY) .............................................. - 81 -

xviii
FIGURE 3.19: MIXED GAS (R134A + SF6 +I-BUTANE) RGA SPECTRUM ................................................ - 82 -
FIGURE 3.20: RPC OUTPUT MIXED GAS NORMALISED SPECTRA IN CLS ............................................. - 83 -
FIGURE 3.21: MIXED GAS (RPC OUTPUT CALCULATED AND OBSERVED) ........................................... - 83 -
FIGURE 4.1: CAPILLARIES C2, C5 AND C6 OF 300 MICRONS C1, C3, AND C4: 1800 MICRON ............. - 89 -
FIGURE 4.2: EXPERIMENTAL SETUP .................................................................................................... - 91 -
FIGURE 4.3: MFC CALIBRATIONS FOR SF6 GAS ................................................................................... - 91 -
FIGURE 4.4: RESULTS WITH ASHCROFT DIFFERENTIAL PRESSURE SENSOR ....................................... - 92 -
FIGURE 4.5: FLOW TO CURRENT RELATION USING ASHCROFT PRESSURE SENSORS ......................... - 92 -
FIGURE 4.6: CAPILLARY C2 RESULTS WITH R134A, I-BUTANE AND SF6 GASES ................................... - 93 -
FIGURE 4.7: CAPILLARY C5 RESULTS WITH R134A, I-BUTANE AND SF6 GASES ................................... - 93 -
FIGURE 4.8: CAPILLARY C6 RESULTS WITH R134A, I-BUTANE AND SF6 GASES ................................... - 94 -
FIGURE 4.9: STRIP COUNT / NOISE RATE ............................................................................................ - 96 -
FIGURE 4.10 : CURRENT AND VOLTAGE ............................................................................................. - 96 -
FIGURE 4.11: TYPICAL RPC ................................................................................................................ - 100 -
FIGURE 4.12: RPC GLASS DIMENSIONS AND POSITION OF NOZZLE ................................................. - 101 -
FIGURE 4.13: POLY CARBONATE COMPONENTS FOR MAKING RPC GAS GAP ................................. - 101 -
FIGURE 4.14: SIMULATION PARAMETERS ........................................................................................ - 102 -
FIGURE 4.15: R134A AT 3 SCCM ....................................................................................................... - 106 -
FIGURE 4.16: R134A AT 30 SCCM ..................................................................................................... - 106 -
FIGURE 4.17: R134A AT 300 SCCM ................................................................................................... - 107 -
FIGURE 4.18: I-BUTANE AT 0.3 SCCM ............................................................................................... - 107 -
FIGURE 4.19: I-BUTANE AT 3 SCCM .................................................................................................. - 108 -
FIGURE 4.20: I-BUTANE AT 30 SCCM ................................................................................................ - 108 -
FIGURE 4.21: SWIRLS SEEN AROUND THE BUTTONS ....................................................................... - 109 -
FIGURE 4.22: SF6 AT 3 SCCM ............................................................................................................ - 109 -
FIGURE 4.23: SF6 AT 30 SCCM .......................................................................................................... - 110 -
FIGURE 4.24: CERN CFD TEAM FLOW DISTRIBUTION ....................................................................... - 110 -
FIGURE 4.25: STREAMLINES AT 5.45 SECONDS ................................................................................ - 116 -
FIGURE 4.26: STREAMLINES AT 32.72 SECONDS .............................................................................. - 117 -
FIGURE 4.27: STREAM LINES VELOCITIES AT 60 SECONDS ............................................................... - 117 -
FIGURE 4.28: VELOCITY FLOW DISTRIBUTION AT 1.5 SCCM ............................................................ - 118 -
FIGURE 4.29: VELOCITY FLOW DISTRIBUTION AT 6SCCM ................................................................ - 119 -
FIGURE 4.30: VELOCITY MAGNITUDE SHOWING UNEQUAL FLOWS ................................................ - 119 -
FIGURE 4.31: EXPERIMENT SETUP TO STUDY THE FLOW OF GAS AT THE OUTPUT NOZZLES .......... - 120 -
FIGURE 4.32: TOP GLASS OF AN RPC GAP ........................................................................................ - 124 -
FIGURE 4.33: BOTTOM GLASS OF AN RPC GAP ................................................................................ - 124 -
FIGURE 4.34: CHAMFERING DETAIL OF GLASS ................................................................................. - 125 -
FIGURE 4.35: ASSUMPTION FOR SIMULATIONS ............................................................................... - 125 -
xix
FIGURE 4.36: VELOCITY CONTOUR AT 0.17 M/S .............................................................................. - 127 -
FIGURE 4.37: VELOCITY CONTOUR AND STREAMLINES AT 0.17 M/S............................................... - 128 -
FIGURE 4.38: TRANSIENT SIMULATIONS AT 0.17 M/S ..................................................................... - 129 -
FIGURE 4.39: TRANSIENT SIMULATIONS AT 0.085 M/S ................................................................... - 129 -
FIGURE 4.40: TRANSIENT SIMULATIONS AT 0.85 M/S ..................................................................... - 130 -
FIGURE 4.41: TRANSIENT SIMULATIONS AT 0.85 M/S FOR MIXED GAS ........................................... - 132 -
FIGURE 4.42: TRANSIENT SIMULATIONS AT 0.17 M/S FOR MIXED GAS ........................................... - 133 -
FIGURE 4.43: TRANSIENT SIMULATIONS AT 0.01234 M/S FOR MIXED GAS ..................................... - 133 -
FIGURE 4.44: SIMULATION RESULTS NOZZLE POSITION DESIGN 1 .................................................. - 135 -
FIGURE 4.45: SIMULATION RESULTS NOZZLE POSITION DESIGN 2 .................................................. - 136 -
FIGURE 5.1: NOISE RATE FOR LAYER-2 X-SIDE FOR STRIP # 14......................................................... - 140 -
FIGURE 5.2: NOISE RATE FOR LAYER-2 Y-SIDE FOR STRIP # 12 ......................................................... - 140 -
FIGURE 5.3: NOISE RATE WITH ERROR BAR ..................................................................................... - 141 -
FIGURE 5.4: V-I STABILITY FOR A PERIOD OF ONE YEAR .................................................................. - 141 -
FIGURE 5.5: AMBIENT PARAMETERS TEMPERATURE AND HUMIDITY OVER A PERIOD OF 6 MONTHS ........ - 142 -
FIGURE 5.6: CURRENT MONITORING (RPCS IN SERIES FOR GAS FLOW) .......................................... - 143 -
FIGURE 5.7: FRESH GAS TOP-UP EVERY 12 DAYS IN CLS .................................................................. - 144 -
FIGURE 5.8: RPC SET FLOW USING MFC-6 IN CLS ............................................................................. - 144 -
FIGURE 5.9: CASCADING OF FOUR NUMBER OF (1 × 1) M2
RPCS ..................................................... - 145 -
FIGURE 5.10: PERFORMANCE OF AN RPC IN A CLS AND OPEN ENDED SYSTEM .............................. - 146 -
FIGURE A -1: HP-LP SERVO CONTROLLER BASED REGULATOR (0.3 KG/CM2 TO 3 MBAR) ............... - 164 -
FIGURE A -2: DETAILS OF THE VALVE ............................................................................................... - 164 -
FIGURE A -3 : UP GRADATION OF CLS IN THE DISPLACEMENT PUMP SECTION ............................... - 165 -
xx
LIST OF TABLES
TABLE 1.1 : INO ICAL AT A GLANCE ...................................................................................................... - 7 -
TABLE 1.2: DIFFERENCES BETWEEN AVALANCHE MODE AND STREAMER MODE ............................. - 16 -
TABLE 1.3: INO ICAL GAS REQUIREMENT ........................................................................................... - 18 -
TABLE 2.1: GAS SYSTEM AT LHC ......................................................................................................... - 40 -
TABLE 2.2: IMPORTANT INVENTIONS OF GASEOUS DETECTOR ......................................................... - 44 -
TABLE 2.3: LARGE SCALE EXPERIMENTS USING RPC AND TYPE OF GAS MIXTURES ........................... - 45 -
TABLE 3.1 : CLS OPERATING VALUES .................................................................................................. - 59 -
TABLE 3.2: CLS ANALOG DATA SETTINGS ........................................................................................... - 59 -
TABLE 3.3: R134A (CH2FCF3) FRAGMENTS .......................................................................................... - 78 -
TABLE 3.4 :I-BUTANE (FRAGMENTS) .................................................................................................. - 80 -
TABLE 3.5: SF6 GAS FRAGMENTS ........................................................................................................ - 82 -
TABLE 4.1: PARAMETERS FOR DESIGN 1 AND DESIGN 2 FOR NOZZLE POSITIONS ........................... - 137 -

xxi
LIST OF ABBREVIATION NOTATION
AND NOMENCLATURE
µ Micro
µm micro-meter
abs absolute pressure
AL 01 RPC with label as AL # 01
AL 02 RPC with label as AL # 02
CERN European Organization for Nuclear Research, Geneva
CLS Closed Loop System
CSC Cathode Strip Chambers
DAQ Data Acquisition system.
DFT Dry Film Thickness
FC Femto Coulomb
I-butane Isobutane gas
ID Inner Diameter
K ton Kilo ton
L1, L2. .. Layer 1, Layer 2. ..
LHC Large Hadron Collider
m/s meters per second
MDT MIP Timing Detector (MTD)
MFC-6 Mass Flow Controller with label assigned as 6
mm WC millimetre of Water Column
mm millimetre
mV milli-Volts
nA Nano- Amperes
nS Nano Seconds
OD Outer Diameter
OES Open Ended System
OLS Open Loop recirculation System
P.s Pascal-second
pC Pico Column
ppm Parts Per Million
pS Pico Seconds
R134a C2H2F4 (1,1,1,2 tetraflouro ethane)
SCCM Standard Cubic Centimetres per Minute
TGC Thin Gap Chamber (TGC)
X-side X-side read out strip
Y-side Y-side read out strip

Chapter 1
Introduction
The elementary particle called “Neutrino” was first proposed by Wolfgang Pauli
in 1930, to explain the continuous energy spectrum in beta decay. It was found in an
experiment by Clyde Cowan and Frederick Reines in 1956 (Reines got the Nobel
prize in physics for this work in 1995). Ever since then the research activity in this
area has grown especially so in the last 15 years. This was facilitated by very im-
portant developments in particle detectors and associated instrumentation. The re-
search on the neutrino studies has led to several Nobel prizes. There are large num-
bers of experiments being carried across the world to study the little known neutrino
properties.
1.1 Introduction to Neutrino
The neutrino is tiny sub-atomic particle with zero electric charge. Neutrinos are
the second most abundant particles in the universe, next to photons. They have a tiny
mass 100 m eV or about a million times smaller than an electron. In the universe
there are about 300 neutrinos in every cubic centimetre. These were created during the
big bang, and are also continuously produced in the Sun (about 65 billion every sec-
ond passing through every square centimetre of earth), natural radioactive decays.
Manmade neutrinos are produced through particle accelerators and in nuclear reac-
tors. Neutrinos are extremely difficult to detect as they interact very weekly with mat-
ter.
There are three flavours of neutrinos and are known as electron neutrino, Muon
neutrino and tau neutrino and are named after the type of particle that arises when a

- 2 -
neutrino undergoes a charged current interaction with a nucleus or an electron. The
phenomenon of changing of flavour as it propagates is known as “Neutrino Oscilla-
tion”.
The Neutrinos were produced extensively in the Big Bang and depending on their
mass, can have a significant influence on how the universe evolves. Neutrinos are an
essential part of the production of all the elements heavier than the iron in collapsing
stars called supernovae. The Sun, which is one of the 400 billion stars in the Milky
Way galaxy, is also a strong source of neutrinos of about 60 billion per square cm per
second. The neutrinos which weakly interact with matter are detected through their
interactions with the nucleus or electrons. The cross section of neutrino-nucleus inter-
action is of the order of 1042 cm2 making it difficult, though not impossible, to de-
tect them. The neutrinos have zero mass in the Standard Model (SM) of particle phys-
ics and do not change their type or flavour. The Super Kamiokande group and the
heavy water detector at Sudbury Neutrino Observatory (SNO) have found evidence
for neutrino oscillation in measurements of atmospheric neutrino and solar neutrinos,
respectively. Another consequence of these experiments is that neutrinos have a non-
zero mass and that they violate flavour conservation. Thus neutrinos serve as a win-
dow to study physics beyond the Standard Model.
India was a pioneer in the field of neutrino physics, conducting experiments in the
underground laboratories at Kolar Gold Fields. The first reported evidence on the ex-
istence of atmospheric neutrinos, produced by cosmic rays hitting the upper atmos-
phere, was observed about 50 years ago in the Kolar Gold Fields at a depth of 7600
feet. In the Standard Model of particle physics neutrinos belong to the family of lep-
tons.
- 3 -
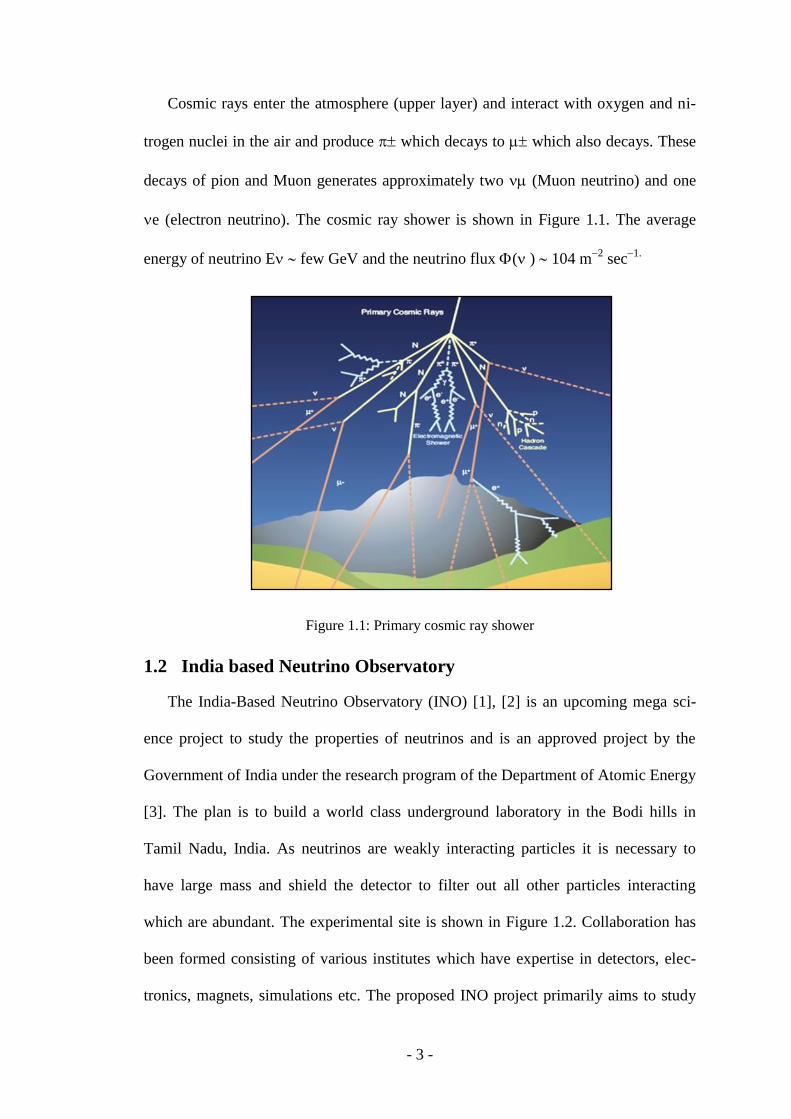
Cosmic rays enter the atmosphere (upper layer) and interact with oxygen and ni-
trogen nuclei in the air and produce which decays to which also decays. These
decays of pion and Muon generates approximately two (Muon neutrino) and one
e (electron neutrino). The cosmic ray shower is shown in Figure 1.1. The average
energy of neutrino E few GeV and the neutrino flux ( ) 104 m2
sec1.
Figure 1.1: Primary cosmic ray shower
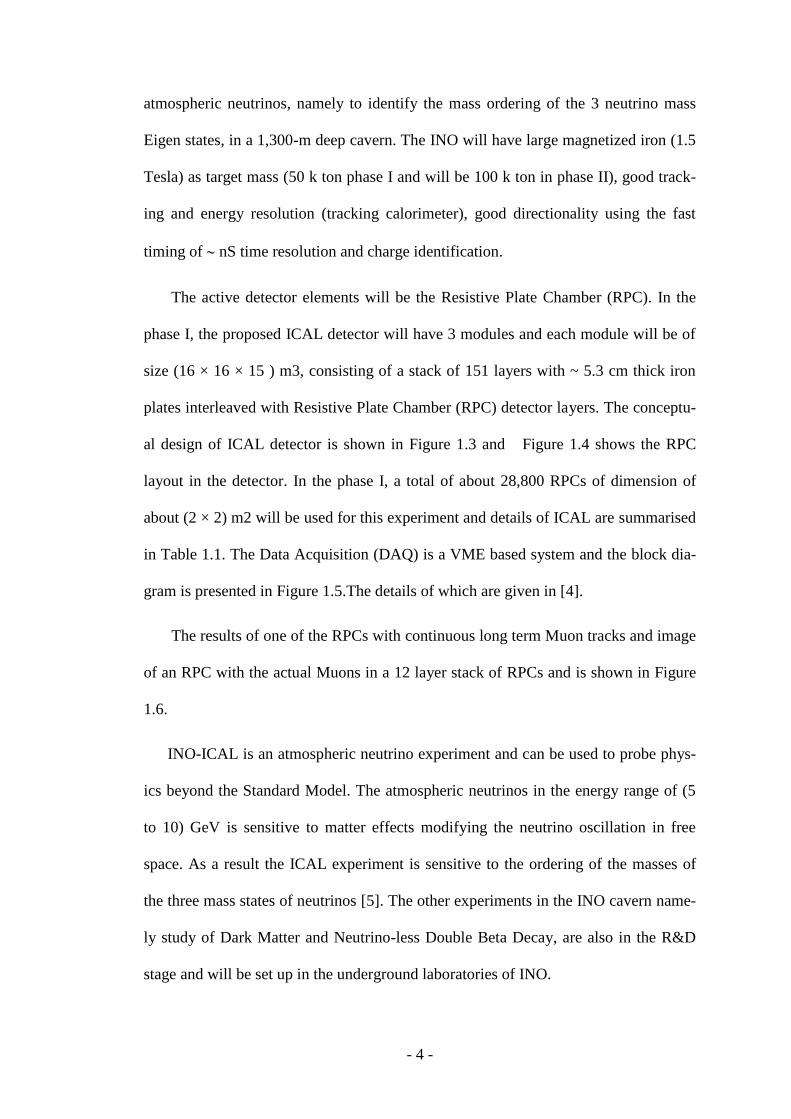
1.2 India based Neutrino Observatory
The India-Based Neutrino Observatory (INO) [1], [2] is an upcoming mega sci-
ence project to study the properties of neutrinos and is an approved project by the
Government of India under the research program of the Department of Atomic Energy
[3]. The plan is to build a world class underground laboratory in the Bodi hills in
Tamil Nadu, India. As neutrinos are weakly interacting particles it is necessary to
have large mass and shield the detector to filter out all other particles interacting
which are abundant. The experimental site is shown in Figure 1.2. Collaboration has
been formed consisting of various institutes which have expertise in detectors, elec-
tronics, magnets, simulations etc. The proposed INO project primarily aims to study
- 4 -
atmospheric neutrinos, namely to identify the mass ordering of the 3 neutrino mass
Eigen states, in a 1,300-m deep cavern. The INO will have large magnetized iron (1.5
Tesla) as target mass (50 k ton phase I and will be 100 k ton in phase II), good track-
ing and energy resolution (tracking calorimeter), good directionality using the fast
timing of nS time resolution and charge identification.
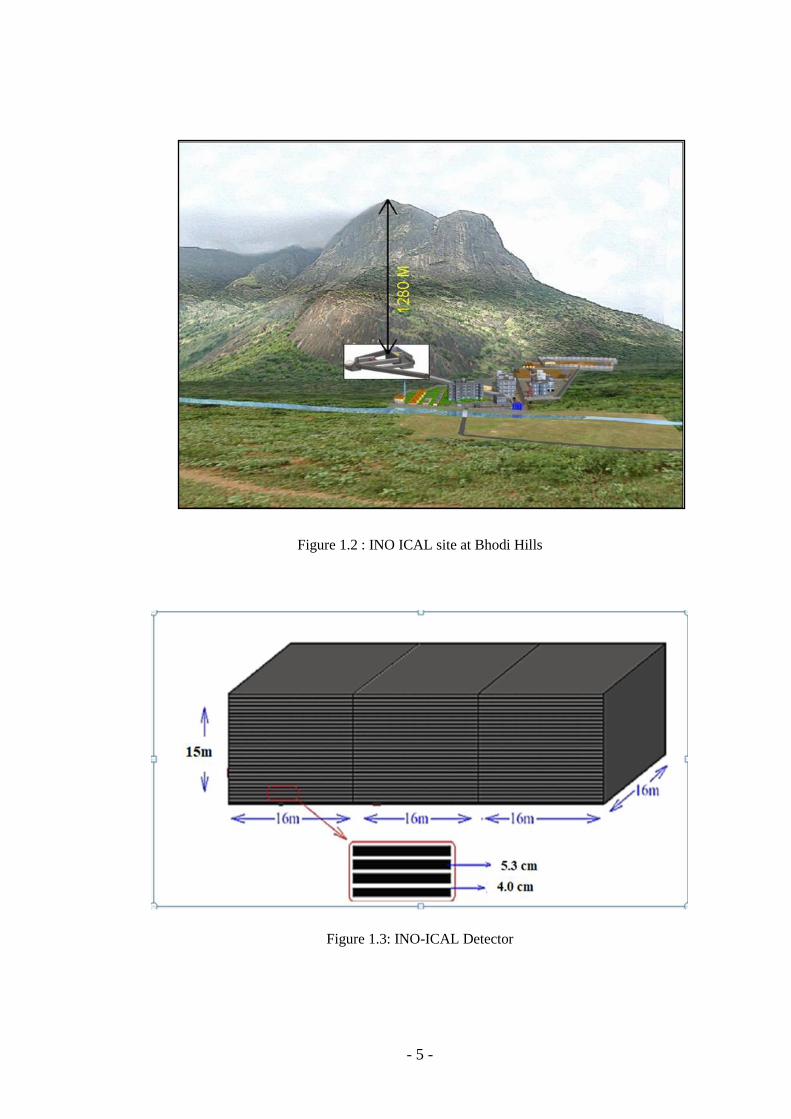
The active detector elements will be the Resistive Plate Chamber (RPC). In the
phase I, the proposed ICAL detector will have 3 modules and each module will be of
size (16 × 16 × 15 ) m3, consisting of a stack of 151 layers with ~ 5.3 cm thick iron
plates interleaved with Resistive Plate Chamber (RPC) detector layers. The conceptu-
al design of ICAL detector is shown in Figure 1.3 and Figure 1.4 shows the RPC
layout in the detector. In the phase I, a total of about 28,800 RPCs of dimension of
about (2 × 2) m2 will be used for this experiment and details of ICAL are summarised
in Table 1.1. The Data Acquisition (DAQ) is a VME based system and the block dia-
gram is presented in Figure 1.5.The details of which are given in [4].
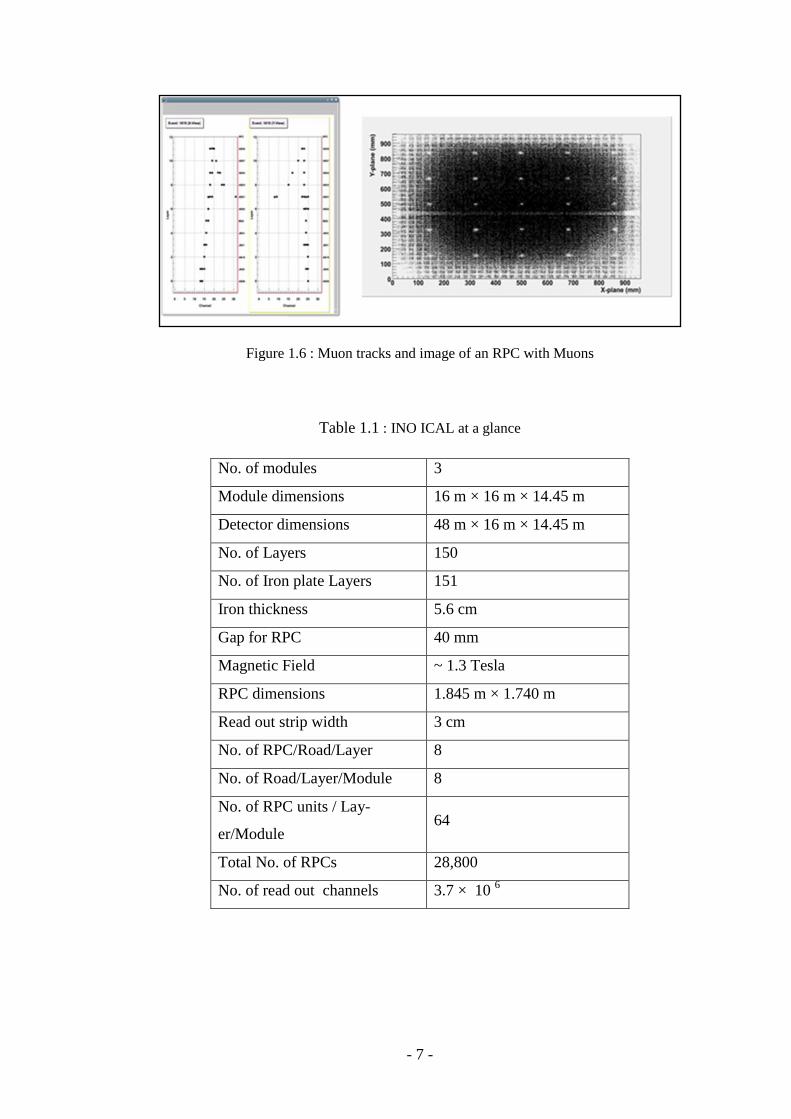
The results of one of the RPCs with continuous long term Muon tracks and image
of an RPC with the actual Muons in a 12 layer stack of RPCs and is shown in Figure
1.6.
INO-ICAL is an atmospheric neutrino experiment and can be used to probe phys-
ics beyond the Standard Model. The atmospheric neutrinos in the energy range of (5
to 10) GeV is sensitive to matter effects modifying the neutrino oscillation in free
space. As a result the ICAL experiment is sensitive to the ordering of the masses of
the three mass states of neutrinos [5]. The other experiments in the INO cavern name-
ly study of Dark Matter and Neutrino-less Double Beta Decay, are also in the R&D
stage and will be set up in the underground laboratories of INO.
- 5 -
Figure 1.2 : INO ICAL site at Bhodi Hills
Figure 1.3: INO-ICAL Detector

- 6 -
Figure 1.4: ICAL showing RPCs one road on one side
Figure 1.5: Block design of DAQ for ICAL
- 7 -
Figure 1.6 : Muon tracks and image of an RPC with Muons
Table 1.1 : INO ICAL at a glance
No. of modules 3
Module dimensions 16 m × 16 m × 14.45 m
Detector dimensions 48 m × 16 m × 14.45 m
No. of Layers 150
No. of Iron plate Layers 151
Iron thickness 5.6 cm
Gap for RPC 40 mm
Magnetic Field ~ 1.3 Tesla
RPC dimensions 1.845 m × 1.740 m
Read out strip width 3 cm
No. of RPC/Road/Layer 8
No. of Road/Layer/Module 8
No. of RPC units / Lay-
er/Module 64
Total No. of RPCs 28,800
No. of read out channels 3.7 × 10 6

- 8 -
The development of RPC detectors, electronics, gas systems, the required magnet-
ic field etc. are in the final stage due to the dedicated effort by the collaborating insti-
tution and universities.
1.3 RPC (Resistive Plate Chamber)
The RPC [6], is a gaseous ionization detector for particle physics characterized by
high detection efficiency (97-98%), a very good time resolution (1.5-2 ns), a good
spatial resolution (~1 cm) [7] and good reliability. It’s compactness along with an in-
dustrial-supported production makes it an ideal instrument for fast response applica-
tion like Muon trigger in many large experiments in involving large surface area cov-
er [8].
1.3.1 Basic Construction of RPC
A typical view of an RPC built with a 2 mm thick float glass is shown Figure 1.7.
It consists of two components, one is gas-gap and the other is signal readout panel.
The gas gap of 2 mm is formed by using two glass plates having coated high resistivi-
ty on the outer surface, separated by small spacers (buttons) usually 2mm. The gas
nozzles have been used to flush gas through the tiny gap. In order to apply high volt-
age on each plate, a resistive coating having surface resistance of about 1M
ohm/square is applied [9], [10], [11], [12]. The resistance value depends on the specif-
ic application of the experiment where the RPCs are used. The tool used to measure
the resistance coated on the glass is shown in Figure 1.8.The read out panels are used
to collect traces of particles from gas gap, which act like transmission lines. The con-
cept is similar to that of a capacitor.

- 9 -
Figure 1.8: Zig to measures conductive surface resistance
Figure 1.7: Typical RPC with pickup panels

- 10 -
1.3.2 Working principle of RPCs
The gaseous ionization detector consists of a gas gap bounded on both sides by
two parallel electrodes made of commercially available float glass. The outer surface
of the two glass plates are applied with a high voltage (about 10 kV) and the current
drawn is of the order of few tens of nA depending on the size of the RPC. When a suf-
ficiently energetic radiation passes through the chamber, it ionizes the gas molecules
and produces a certain number of electron-ion pairs. The number (mean) of electron-
ion pairs created is proportional to the energy deposited on the chamber. With the ap-
plication of electric field, the electrons are drawn towards the anode and the ions are
drawn towards the cathode and the charge gets collected. If an intense electric field is
applied, further ionisations are produced by the primary electrons. The electrons pro-
duced in secondary ionisations are further accelerated to produce more ionisations and
so on. This chain of ionizations causes a distribution of free charge in the gas having a
characteristic shape of an avalanche. The recombination of electron-ion occurs, thus
liberating photons, which can also initiate secondary ionisations. When series of sev-
eral secondary avalanches are formed, a large amount of free charge is formed within
the gas creating a streamer pulse. Then, these growing numbers of charges propagate
within the gas inducing a signal in the read-out electrodes. The type of the gas mixture
used plays a vital role in determining either the chamber is working in the avalanche
regime or the streamer regime [13].
If n0 primary electrons accelerated by electric field and x is the distance between
anode and point of interaction then no of electrons that reaches the anode (n) is given
by equation,

- 11 -
𝑛 = 𝑛0𝑒𝜂𝑥------------ (1.1)
where,
𝜂 = 𝛼 − 𝛽 --------------(1.2)
“α” is first Townsend Coefficient which represents number of ionisations per unit
length and β is attachment coefficient which represent number of electrons that are
captured by gas per unit length. The gain factor (M) of RPC which decides the mode
of operation is defined as
𝑀 = 𝑛
𝑛0 ---------------------(1.3)
Figure 1.9: RPC showing ionisation before and after passage of charge particle
If M is greater than 108, the probability of streamer formation is more giving rise
to streamer mode of operation of the RPC, while M less than 108 settles the RPC with
avalanche mode of operation. The charge particle before and after passing in the de-
tector is shown in Figure 1.9 . Discharge is localized to about 0.1 mm2 area and it

- 12 -
takes about 2 second to recharge the dead area of detector. Thus each discharge local-
ly deadens the glass RPC and the recovery time called dead time () can be calculated
as follows.
= RC, where R is the resistance of the glass plate given by ( l /A), C is the
capacitance of the RPC given by (kε0 A/d)
where =5 × 10¹²
Ω-cm, l = 2m, A = 2 m2, k = 4 and ε0 = 8.854 × 10
-12 F/m
and d = 2 mm. Then = ~2 seconds of dead time.
1.3.3 Types of RPCs
There are various types of RPC [14],[15],[16] and these are classified based on the
material of electrode, number of inter electrode gaps and their application.
1.3.4 Classification of RPCs based on material of Electrode
Bakelite RPCs: The Resistive plates or the electrodes are made of Bakelite, coat-
ed with linseed oil from inside and with conductive coats at the outer surface. These
resistances are of few Mega ohms per square. The typical gas mixture used is 95.2-
96.2% of R134a [C2H2F4], 3.5 % to 4.5% of I-butane (C4H10) and 0.3% Sulphur hexa-
fluoride (SF6), with a 45% relative humidity. The water vapour is generally added to
obtain a gas mixture with a relative humidity of 40–50%, which affects the resistivity
of plate material. The Bakelite based, to improve efficiency at lower operating voltage
and thus, avoid a degradation of RPC performance under high background conditions
[17],[18] and [19].

- 13 -
Glass RPCs: The electrodes are made of float glass of typical thickness of 2 mm
or 3 mm, coated with conductive coating at the outer surface with resistance of few
Mega ohms per square. The gas volume is of 2 mm, with higher bulk resistivity and
better time resolution than Bakelite. The mechanical stiffness and surface quality of
glass electrode are superior to Bakelite [20]. Due to delicacy of glass, handling needs
proper tools.
Hybrid RPCs: Combination of metallic and resistive electrodes is used to make
hybrid RPCs. Precaution needs to be taken to avoid gas-gap confinement by metal-
metal electrodes otherwise it will be “Parallel Plate Chamber (PPC) and will have vi-
olent discharge [21].
1.3.5 Classification of RPCs based on number of gas-gaps
Single gap RPC: It is basic original form of RPC which contains one gap formed
with 2 electrodes. Usually the gap is 2 mm, so the required high voltage for operation
will be under limit (about 10 KV). The current drawn is few nA.
Double gap RPC: It has two gaps. Double gap RPCs designed with larger num-
ber of electrode and read-out panels allows more variety in structures of RPCs. It im-
proves the timing of detector.
Multi-gap RPCs: These RPCs are introduced in year 1996 [22].The most im-
portant feature of this design is inclusion of resistive plates electrically (floating elec-
trodes) that divide the gas volume in to a number of individual gas gaps without the
need of any conductive electrodes. It has time resolution about pS, but it requires
higher voltage for operation.
- 14 -
1.3.6 Classification based on mode of operation
The RPCs can be operated in two modes namely the avalanche mode and the
streamer mode, that differ in the mechanism in which signal is generated [23].
a.) Avalanche mode: The charged particles that are accelerated by the electric field,
produces primary ions, which again produces secondary ionizations by collision
with gas molecules. The electric field of this cluster of ionized particles is opposed
by the external field and the multiplication process stops after sometime. These
charges are then drifting towards the plates where from they are collected. The av-
alanche mode operates at a lower voltage and has less gain. Typical pulse ampli-
tudes are of the order of few mV. In this mode, the RPCs Gain Factor (M) is be-
low 108 and the secondary ionization is controlled by suitable gas mixture.
b.) Streamer mode: Here the secondary ionization continues to occur until there is a
breakdown of the gas and a continuous discharge takes place as shown in Figure
1.10. This mode operates at a higher voltage and also results in high gain. Typical
pulse amplitudes are of the order of 100-200 mV. As a result of secondary ionisa-
tion, the gain Factor (M) is more than 108 which gives streamer Pulses. The ampli-
fier may not be needed for further processing the pulse information [24].

- 15 -
Figure 1.10: Formation of charge cluster in Streamer mode
The desired mode of operation decides the gas mixture inside an RPC. Originally
the RPCs were operated in the streamer mode using Argon gas based mixture, the
higher signal of few 100 pC (few tens of millivolt pulse) with high current. The
streamer mode has poor rate capability of about 100 Hz/cm2.
The avalanche mode uses Freon based mixture of gas, the signal is low with few
pC (few millivolts) and low current of few n A. It also has high voltage drop at high
particle rate so is useful in good rate capabilities (few kilo hertz’s per centimetre
square). The detector has aging issues in streamer mode and high counting rate (by an
order of magnitude) applications has made avalanche mode popular than the streamer
mode. It is possible to suppress the streamer formation by using quenching C2F4H2
based gas mixtures with small quantity of SF6. The broad comparison of Avalanche
and Streamer mode is given in Table 1.2

- 16 -
Table 1.2: Differences between Avalanche mode and Streamer mode
The transitions from the avalanche to streamer in RPCs is studied in detail and
documented by R.Cardarelli, R.Santonico et al [19]. The study was based on the di-
rect inspection of the signal produced by the RPC. The data shows that the avalanche
amplitude to be strongly dependent on the operating voltage value where the satura-
tion occurs and streamer starts and the streamer is accompanied by a precursor pulse
and according to their studies the high voltage must cause the variation of the stream-
er time position in two times more than in the avalanche case etc.
The measurements of avalanche size and position resolution with different re-
sistance, avalanche to streamer transition etc. is given in [25] ,[26], [27] etc.
1.3.7 Timing RPCs
The timing RPCs were developed in late 1990’s and have currently have reached a
resolution of (50 to 60) picoseconds for an electrode areas ranging from about (10 to
1600) cm2. The initial current grows exponentially in time, until the discriminating
Parameters Avalanche mode Streamer mode
Gas Composition (typical)
C2H2F4:C2H10:SF6:Ar
Pulse Height 1-2 mV More than 100mV
Charge Few pC About 100 pC
External Amplification Required Not Required
Plateau Region 9.6kV-10.5kV 8.8kV-9.6kV
Time Resolution 1 nS 1.5 nS
Stability Long lasting Early Aging Effect
Experiments ATLAS, CMS, LHCBL3, BABAR, BELLE, ARGO,
OPERA, MONOLITH
95.2:4.5:0.3:0 62:8:0:30

- 17 -
level is reached. The delay in time is independent from the position occupied by the
initial charges in the gap, providing excellent timing [13]. The timing jitter depend-
ents on the variation of the initial current (avalanche and cluster statistics) and in-
versely on the current growth rate is (a times v), where a is the First Townsend Coef-
ficient and v is the electron drift velocity. The combination of metallic and resistive
electrodes with signal-transparent semi-conductive layers, highly isolating layers and
different kinds of pickup electrodes makes the RPCs with a rich variety of configura-
tions, tuneable to a variety of requirements.
1.3.8 Trigger RPCs
In the Accelerator based experiment (CMS, ATLAS), several type of detectors
(RPC, DFT, Scintillator based etc.) are employed and operation in the experiments.
RPCs have an advantage of good time resolution and hence are used for triggering the
events, based on certain criteria (which will also provide information on the presence
and arrival time of charged particles). The RPCs used in ATLAS section of LHC are
triggering RPCs and usage details are given in [21], [28], [29].
1.4 ICAL RPCs
The proposed INO-ICAL detector will be instrumented with 28,800 single gap
RPCs. These RPCs are of (1.85 × 1.9) m2
size, consists of two glass electrodes sepa-
rated by 2 mm and use a gas mixture composition of R134a (C2H2F4), I-butane
(iC4H10) and sulphur hexafluoride (SF6) in the ratio of 95.4 %, 4.5% and 0.1% respec-
tively and are operated in avalanche mode. As the numbers of RPCs are large, the to-
tal gas required is of the order of about 200 m3 and hence it is mandatory to use a
Closed Loop Gas mixing System (CLS) to supply the gas into the detectors into reuse

- 18 -
the gas coming out of the RPCs. The ICAL detailed gas requirement is shown in the
Table 1.3.
Table 1.3: INO ICAL Gas requirement
Each of these detectors will have 64 readout channels on X-side and similar num-
ber on the Y-side. Therefore, there will be about 3.7 million channels to be read and
processed, based on criteria of trigger for neutrino studies. The RPC is a gaseous de-
tector and its performance dependence on the quality of the gases and more over the
number of these detectors are huge and considering the safety aspects, an automated
CLS that will supply mixed gas and purify it after flowing through the RPC in a loop
is designed, developed and is in operation for the last 5 years. The details of which are
described latter.
The ICAL magnet provides target nucleons for neutrino interaction as well as it
serves a medium in which secondary charge particles can be separated on the bases of
their magnetic rigidity so that their momenta can be estimated. The magnetized iron
calorimeter will use iron of low carbon iron (less than 0.1%) in order to have good
magnetic characteristics and uniform magnetic field.

- 19 -
The INO ICAL design is modular so that future up-gradation is feasible and the
detector readout system will have a time resolution of 1 nS and special resolution of
about a 1 cm.
1.4.1 Brief construction of ICAL RPCs
INO RPCs use simple float glass as electrode having thickness of 3 mm, and area
of about (2 × 2) m2
in size with two big chamfering at two diagonally opposite corners
(for electronics boards) and small chamfer at the other two corners. Usually cleaning
of cut glasses is done with high purity ethyl alcohol solution and distilled water.
Cleanliness is very important factor during fabrication which enhances performance
of the operation of RPC. One surface of each glass is coated with conductive paint.
Two methods of painting to get the required resistance on the glass surface are
achieved, namely the spray painting and the screen printing. The glass surface is coat-
ed with a mask of 10mm around the edges.
In case of spray painting a special conductive paint has been developed by M/s
Nerolac Kansai Paint (India) Limited [30].This paint uses 50% of slow drying thinner
and the expected Wet Film Thickness of about 20µ. The second method is by screen
printing using screen printing ink or called as carbon paste namely DC20 and
DC1000M (which are 20 ohm and 1000 mega ohm pastes respectively) of Dozen
make in the ratio of 1:5.5 used to achieve the required resistance of 1MΩ per square
of surface resistance. The coated glasses are then cured at temperature of about 80-
100 degree Celsius for few minutes. Two coated glasses are then used to form a “glass
gas gap” (air leak tight), which will have electrodes that are separated by 72 polycar-
bonate buttons with a spacing of 20 mm and to maintain 2 mm gap over large area.
Side spacers, big and small chamfers are used to seal the chambers. Four gas nozzles
are used for gas inlet and outlet. The Epoxy of 3M make (DP190-grey) is used for

- 20 -
gluing chambers. After leak test, these gaps are made available for assembly of RPC.
The detailed poly carbonate components used to fabricate an RPC are shown in Fig-
ure 1.11.
Figure 1.11: Polycarbonate components of a glass RPC
1.4.2 V-I characteristics of RPCs
A V-I characteristics study for a typical RPC is plotted and shown in Figure 1.12.
It has been done to find Ohmic and discharge region of operation of this RPCs. The
voltage is gradually increased and corresponding leakage current is noted down. The
V-I shows that at lower voltage contribution due to leakage current through spacers is
more. As the high voltages increases the gas volume contributes more in leakage cur-
rent. It takes about (5 to 6) days to stabilise the current drawn by the chamber and the
observed time is shown in Figure 1.13 for a typical RPC.

- 21 -
Figure 1.12: RPC V-I behaviour and equivalent electrical model
Figure 1.13: Current Stabilisation in RPC

- 22 -
1.4.3 Efficiency Plateauing of RPC
Each RPC before going into the stack undergoes efficiency plateau to find out op-
erating voltage of RPCs [31]. With coincidence of (2 to 3) finger scintillator Paddles
trigger has been formed and then strips under paddles are checked for Muon(s). Typi-
cal efficiency plateau plot is as shown in Figure 1.14 . The main strip and the two ad-
jacent strips on either side are shown in the plots. It is seen that at typical high voltage
of 9.9 kV, an efficiency of 99 % is achieved. The current drawn by an RPC chamber
of ~ (2 × 2) m2 is few hundred nA.
The RPC is a parallel plate gas detector and in the next chapter we present the lit-
erature survey beginning with inventions of gas detectors and how RPC were evolved
with time. The latest development beyond the discovery of RPC detectors is also
highlighted. Why RPCs are chosen for INO-ICAL research program is addressed.
Then the literature survey is followed by the Gas System and their evolution with time
Figure 1.14: Typical efficiency plot of an RPC

- 23 -
is highlighted. Type of Gas system and methodology of mixing gases is surveyed and
finally what type gas mixing system that is best suited for INO-ICAL. Based on this
literature survey formation of research problem is made.

- 24 -
Chapter 2
Literature survey
This chapter is devoted for the literature survey on major gaseous detectors since
their invention(s) and the innovation in gas systems developed with time and their ap-
plications in various neutrinos experiment.
In the overview section, the detailed survey on the neutrino experiments that are in
operation and the various types and mode of RPCs , type of gas systems that are em-
ployed in different experiments are reported in tabular form. Finally at the end of the
chapter based on the literature survey the thesis topic is formulated.
2.1 Neutrino Experiments
The major neutrino experiments operational worldwide are mentioned below.
In Japan, three experiments are operation
a) HYPER Kamiokande (Kamioka Nucleon Decay Experiment).
b) Super-K(Super-Kamiokande) and
c) T2K (Tokai to Kamioka).
In USA, the experiments are
a) NOνA (NuMI Off-Axis νe Appearance)
b) MINOS+ (Upgraded electronics for MINOS)
c) SciBooNE (Scintillator Bar Booster Neutrino Experiment) and
d) MINERVA (Main Injector Experiment).
In China the experiments are
a) Daya Bay (Daya Bay Reactor Neutrino Experiment) and
b) JUNO (Jiangmen Underground Neutrino Observatory) in China

- 25 -
In Italy
a) ICARUS (Imaging Cosmic And Rare Underground Signal),
b) BOREXINO (BORon EXperiment) at Grand Sasso, Italy.
The other neutrino experiments are Precision Ice-Cube Next Generation Upgrade
(PINGU) [32] in Antarctica, at Amundsen-Scott South Pole Station, SNO+ (SNO
with liquid scintillator) at Creighton Mine, Ontario, Super-NEMO in Fréjus Road
Tunnel, France and the upcoming, INO (India based Neutrino Observatory) in Tamil
Nadu, INDIA.
2.2 Brief history of gaseous detector
The Nuclear and Particle Physics experiment depends upon the detection of pri-
mary particles / radiation. The interaction of particles with atomic electrons is making
this detection possible. There are three types of particle detectors namely gaseous de-
tectors, liquid based (water mineral oil etc.) and solid (scintillator semiconductor etc.)
and based on the requirement like a good energy resolution, spatial resolution, time
resolution etc., a particular type of detector is selected. The literature is focused on the
gaseous detector as the INO collaboration has decided to use a gaseous based detec-
tor.

- 26 -
2.2.1 Basic operation of Gaseous Detectors:
Figure 2.1: Equivalent circuit of an Ionisation Chamber
The Figure 2.1 shows the equivalent circuit of a typical gaseous ionisation cham-
ber. The high voltage positive is applied to the central wire (anode-positive) and the
negative supply to the chamber walls (cathode- negative). When the charged particle
passing through the chamber ionisation of gas molecules takes place inside the cham-
ber and produces negative electrons called as anions and positive ions as cations along
the path. The charge (pulse) is collected across the resistance by increases the voltage
across the resistance and reducing the voltage across the capacitor. The pulse height
across resistor is [Charge due to Ionisation × Amplification factor].
2.2.2 Brief history of Gaseous detector:
Evolution of the particle detectors started with the discovery of X-rays by Wil-
helm Conrad Roentgen in 1901 and Radioactivity in 1890s.
In 1908, Rutherford and Geiger fabricated the first gas detector using cylindrical
electrical counter for counting alpha particles [33], which they improved in 1912 by

- 27 -
introducing a spherical counter. Further progress was achieved in 1913, when a detec-
tor for counting beta particles was developed.
At atmospheric pressure the gases act as insulators of electricity as they don't have
any free electrons to carry current. But, the free electrons are produced in gas
by ionization and electric discharge occurs. In 1915, Townsend [34], had observed
that the current in the parallel plate gap increased rapidly when the voltage is increase.
He postulated that the current must be due to the positive ions and photons and these
ions will liberate electrons by colliding with gas molecules and by bombardment
against the cathode. Similarly, the photons will also release electrons after collision
with gas molecules and from the cathode after photon impact.
In 1928, Geiger and Mueller introduced Geiger-Mueller Counter (G-M Coun-
ter). It is based on gas ionization in which one avalanche will trigger second ava-
lanche and so on within a short period of time. As amplitude of collected pulses is the
same, it only works as radiation induced event counter. It consists of cathode as tube
surface and anode wire is supported at one end only along the axis of the cathode cyl-
inder. Thin window made up of mica or other material provided for radiation entry. It
has to support substantial differential pressure, as G-M counters and is operated below
atmospheric pressure. The typical gases used are He, Ne, Ar. etc.
A study of the deterioration of methane-filled Geiger-Mueller counter by Farmer,
Earl and Brown is published in [35] and the construction details are given in book ed-
ited in 2010 is by Knoll [36].
In the Keuffel’s spark counter the high voltage is applied between two metal
plates. The charged particle leaves a trail of electrons and ions in the gap and causes a
spark (discharge). The time resolution is excellent about few tens of Pico-seconds.

- 28 -
The operating principle of spark counter with a localized discharge are described
from the view point of the improvement of its time characteristics by G.V. Fedoto-
vich, Y. N. Psetov and others [37]. The typical sizes of detectors for large physical
devices are of (2 to 3) meter. The experiments have shown that the manufacturing of
spark localized-discharge counters of such sizes seemed to be quite realistic. The
main difficulties confronted are due to the preparation of the large, fine, non-defective
electrode surfaces before assembly of the counters.
The other important task is to find new gas mixtures with better time characteris-
tics and less prone to polymerization induced by the discharges. The comparison of
various Nobel gases influence on the counter characteristics was made. Neon com-
pared to Argon and Xenon, decreases the threshold value and has good time resolu-
tion. The low operating voltage should improve the gas mixture stability. The anode is
made of semiconductor glass and the cathode is simple glass on which a copper layer
is deposited A typical gas mixture consists of a noble gas with an addition of organic
gases whose total absorption spectra cover a wide range of photon wavelengths below
225 nm. A mixture of gases namely, 2.5% of 1.3 butadiene; 1% ethylene; 10% I-
butane and 85.6% argon under a total pressure of 12 bar, are used for one of the coun-
ter electrodes and choosing a special gas mixture which absorbs photons prior to their
travelling regions of the high electric field. The spark chambers had limited size and
read out was optical and electrical.
Spark chambers, on the other hand, are triggered devices and in order to sensitize
the spark chamber, a high voltage pulse has to be applied immediately after the pas-
sage of a particle whose trajectory has to be determined. This requires fast high volt-
age trigger circuits with very high reliability (even now under up gradation and devel-
opment), but it also creates a very severe electromagnetic interference (EMI) problem.
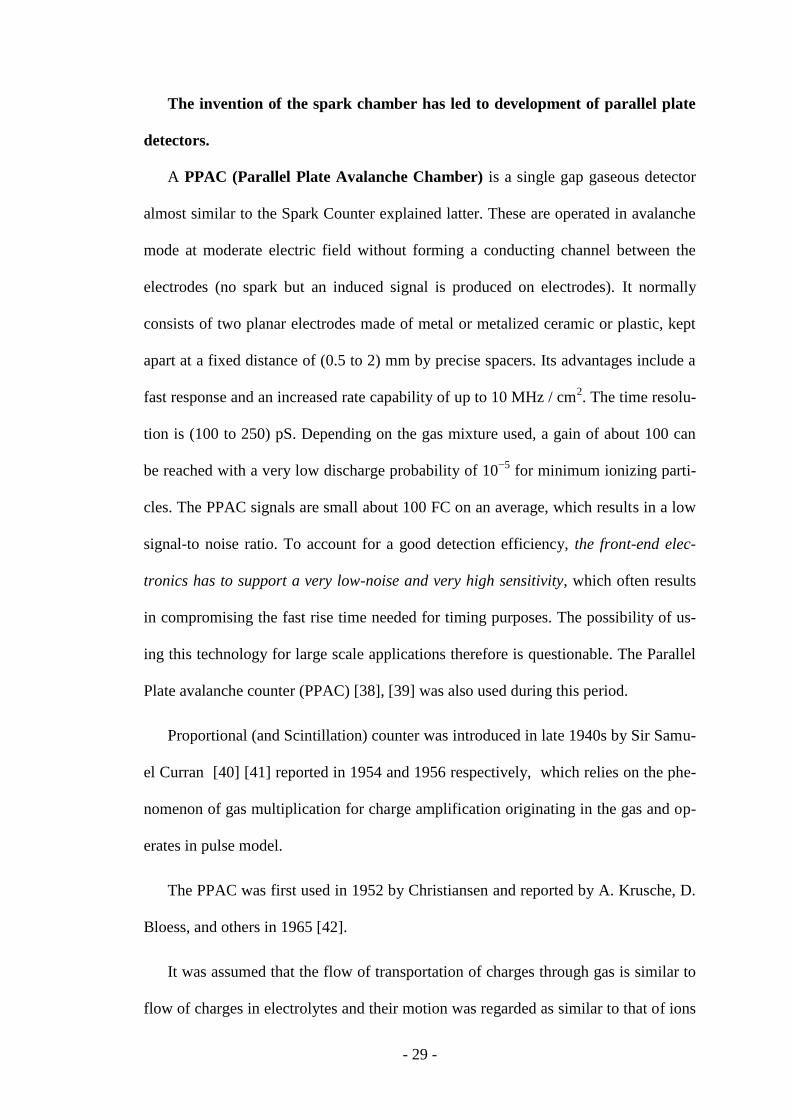
- 29 -
The invention of the spark chamber has led to development of parallel plate
detectors.
A PPAC (Parallel Plate Avalanche Chamber) is a single gap gaseous detector
almost similar to the Spark Counter explained latter. These are operated in avalanche
mode at moderate electric field without forming a conducting channel between the
electrodes (no spark but an induced signal is produced on electrodes). It normally
consists of two planar electrodes made of metal or metalized ceramic or plastic, kept
apart at a fixed distance of (0.5 to 2) mm by precise spacers. Its advantages include a
fast response and an increased rate capability of up to 10 MHz / cm2. The time resolu-
tion is (100 to 250) pS. Depending on the gas mixture used, a gain of about 100 can
be reached with a very low discharge probability of 10−5
for minimum ionizing parti-
cles. The PPAC signals are small about 100 FC on an average, which results in a low
signal-to noise ratio. To account for a good detection efficiency, the front-end elec-
tronics has to support a very low-noise and very high sensitivity, which often results
in compromising the fast rise time needed for timing purposes. The possibility of us-
ing this technology for large scale applications therefore is questionable. The Parallel
Plate avalanche counter (PPAC) [38], [39] was also used during this period.
Proportional (and Scintillation) counter was introduced in late 1940s by Sir Samu-
el Curran [40] [41] reported in 1954 and 1956 respectively, which relies on the phe-
nomenon of gas multiplication for charge amplification originating in the gas and op-
erates in pulse model.
The PPAC was first used in 1952 by Christiansen and reported by A. Krusche, D.
Bloess, and others in 1965 [42].
It was assumed that the flow of transportation of charges through gas is similar to
flow of charges in electrolytes and their motion was regarded as similar to that of ions

- 30 -
in conducting liquids, and obeyed the ohm’s law within a certain range of experi-
mental conditions. To show the dependency of the current in a gas on the various pa-
rameters, a gap consisting of two parallel plane electrodes was filled with a known
gas, pressure and temperature. A potential difference was applied. This chamber gas
was irradiated by a uniform beam of X-rays. It was observed that the current rises and
reaches a saturation value, which means at low voltages (weak electric fields) the
number of ions created by radiation is large compared with the number of ions
dragged to the electrodes. Since the speed of the ions increases with increasing field,
an increasing number of ions of both signs are driven to the electrodes and the current
rises. However, since the number of ions produced in a gas in unit time is finite and
proportional to the intensity of irradiation, the highest rate of removal of ions can just
be equal to the rate of production. Hence, a limiting value of current was obtained
when every ion pair which is produced reaches the electrodes without being able to
recombine in the gas. The increase of field further within certain limits does not affect
the saturation current. Its value can only be raised by an increase in irradiation, a prin-
ciple which is used in ionization chambers. The more detailed report (1956) is given
by A Von Engel, “Electron-Emission Gas Discharges” [43].
In 1967-68, G. Charpak and F. Sauli introduced the Multi-Wire Proportional
Chamber (MWPC) which consists of a grid of uniformly spaced thin anode wires,
sandwiched between two cathode planes, the cathodes may either consist of uniform
conducting foils, or of wire grids with two arrays of anode wires, stretched even at
small distances from each other, sandwiched between two cathode surfaces, constitute
independent detectors. The MWPCs are sensitive to position of radiation interaction.
The details of development operation are summarised G. Charpak, D. Rahm, and H.
Steiner, in [44].

- 31 -
The applications of the Multi-Wire Proportional Counter (MWPC) for wide-angle
diffraction experiments and as a potential detector for protein crystallography are
known. The electrostatic problems found with large area MWPC when operated at
high pressure were resolved. A glass micro-strip detector can be used in place of the
wire frames. The characteristic of a high-pressure Micro-Strip Gas Chamber (MSGC)
was tested in a laboratory by Charpak
The details of the MWPC development is explained by Doolittle, Pollvolt and
Eskovitz and is reported in 1973 [45].
The MWPC was able to track the elementary charge particle and obtain fast elec-
tronic images of photons. Charpak was awarded in 1992 with the Nobel Prize in Phys-
ics for this fantastic invention of MWPC.
In 1981, the Resistive Plate Chamber (RPC) was developed by R. Santonico and
R.Cardarelli,[46] like the spark counter and the PPAC, the RPC consists of two paral-
lel plate electrodes and had a resolution of 1 nS.
The Micro-Pattern Gaseous Detectors (MPGD) were developed in early 1990s
as results of efforts of many groups. The invention of MPGD ,Gas Electron Multiplier
(GEM), the Micro-Mesh Gaseous Structure (Micro-Me Gas), and more recently other
Micro pattern detector schemes, offers the potential to develop new gaseous detectors
with unprecedented spatial resolution, large sensitive area, high rate capability, opera-
tional stability etc. The applications that require very large-area coverage with moder-
ate spatial resolutions, more coarse Macro-patterned detectors, e.g. Thick-GEMs not-
ed as THGEM, could offer an interesting and economic solution. The new micro-
pattern device appears suitable for industrial production.

- 32 -
The availability of highly integrated amplification with readout electronics allows
for the design of gas-detector systems with channel densities comparable to that of
silicon detectors. The modern wafer post-processing allows for the integration of gas-
amplification structures on top of a pixel, readout chip. Due to these recent develop-
ments, particle detection through the ionization of gas has large fields of application
in future Particle, Nuclear and Astro-particle physics experiments with and without
accelerators.
In 1997 the Gas Electron Multiplier (GEM) detector was developed by Physicist
Fabio Sauli. The GEMs are fabricated using Kapton foils coated with copper layer of
few tens of μ m and using precision Printed Circuit Board technology for itching etc.
A voltage of a few 100 V is applied and the resulting electric field strength is in the
order of ~ 10 kV/cm, which is high enough for the gas amplification of tens of thou-
sands is achievable. The detailed technical report of fabrication of GEM at CERN by
Fabio is given in [47].
Presently, the GEMs are used in the COMPASS experiment, the International
Linear Collider, STAR and PHENIX experiment. The GEM’s amplification technique
is used for position detection of ionising radiation (charged particles, photons etc.) in
gas detectors. The GEMS can be used for large-area detectors as they are mechanical-
ly much simpler to implement and are versatile. The modified application details of
GEM are reported 2015 and 2016 in [48] and [49].
Recent particle detectors use silicon detectors (semiconductor) as their central
tracking detector. The position resolution is far better than the ionisation chambers.
An individual detector module comprises silicon that has been doped to form a diode.
These detectors have made impact but are expensive as of now.

- 33 -
In 1996, P. Fonte introduced Multi-gap RPC (MRPC) which was very useful for
the time of Flight experiment.
Since then many scientists have been exploited successfully the charge infor-
mation in many experiments using a wide variety of different applications and are de-
scribed by F.Sauli, “Gas detectors recent developments and future perspectives and
Gas detectors achievement and trends” [50], [51] and F. Flakus has also described
“Detecting and Measuring ionization radiation” – A short history [52].
The development and advance research development is going on. The working
principles are well understood today and also with the help of modern simulation
techniques, new configurations can be easily examined and optimized before a first
experimental test. Most of the gaseous detectors exploit the electric field produced by
a positively charged wire. The field’s strong dependence on the distance r from the
wire (E α 1/r) leads to these characteristics in the detector working.
The alpha spectrometry which is instrumented and reported Hartman J. Hutsch F.
Kruger et al in 2015 [53].
2.2.3 PPAC continuation of work
As mentioned above, in 1971, Pestov and Santanico started their work on PPAC
(Parallel Plate Avalanche Chamber) and eventually in 1981 the Resistive Plate Cham-
ber (RPC) was developed by R. Santonico and R.Cardarelli [46] and hence the birth
of RPC detectors. The primary charges produce avalanches without forming a con-
ductive channel between the electrodes. There is no spark induced on the electrodes.
2.2.4 Resistive Plate Chambers
In 1981, the Resistive Plate Chamber (RPC) was developed by R. Santonico and
R.Cardarelli, like the spark counter and the PPAC, the RPC consists of two parallel

- 34 -
plate electrodes. At least one of the electrodes is made of a material with high volume
resistivity. A charge “Q0” that enters the resistive electrode surface, decomposes with
time “t” following an exponential
Q(t) = Q0 e -t/T
(1.1)
where T =µµᵋᵠ (1.2)
The Resistive Plate Chamber, (RPC) is a parallel plate ionization detector charac-
terized by high detection efficiency (97-98%), a very good time resolution (1.5 to 2)
nS, a good spatial resolution (~1 cm) and good reliability proved in many applica-
tions. Due to its compactness and an industrial-supported production, together with
the possibility of covering large surfaces, make the RPC an ideal instrument for fast
response application like Muon trigger at LHC. The elementary component of a RPC
is a gap, a gas volume enclosed between two resistive plates
2.2.4.1 RPC using Heat Strengthening and Tempered Glass
The glass electrode with heat strengthening and tempered is being tried out for
INO-ICAL experiment, so that the handling of glass RPCs would be more feasible.
The initial research and development work is reported by G. Majumder , G. Majum-
der, V. Datar, S. Kalmani, N. Mondal and S. Mondal [54].
The bottleneck in this development is the sagging effect of the glass due to tem-
pering and is being addressed.
2.2.4.2 Why glass based RPCs for ICAL
The Resistive Plate Chambers (RPCs) are very much suitable for large volume
experiment like INO-ICAL, CMS, and ATLAS at CERN, Argo [55] etc. The RPCs
have detection efficiency of more than 96% with time resolution of about (1 to 2) nS

- 35 -
and operating the RPCs in the avalanche mode, the aging effect on RPCs can be de-
ferred for long periods say more than a decade [56] .
In the RPCs, the signal readout is from pick-up panels and not from electrode sur-
face directly and hence is noise free. The signal is the image of the pulse, as the RPC
functions like a capacitor. The small area on the readout strip (~1 mm) is the dead
space, but rest of strip is available for detection.
The dielectric strength of glass is one order better than Bakelite, therefore has bet-
ter spatial response. In Bakelite RPCs, the roughness and defects on the inner surfaces
of RPC resistive electrodes can cause high dark current, high singles counting rate and
breakdowns. The Bakelite RPCs require linseed oil treatment [57] which improves the
smoothness of inner surface and enhances the performance. The raw glass material for
electrode is cheaply and readily available therefore for about 28,800 RPC, it is very
economical.
The timing performance will be crucial for detectors at future accelerators a time
resolution of about 100 pS is achievable by RPCs and has helped in solution of an un-
ambiguous bunch crossing identification at LHC experiments. Even an accurate track-
ing with 100 μ m resolution has been already achieved by them. RPC by virtue can be
a powerful instrument to investigate electrical phenomena in gaseous media.
Keeping all above technical and economical parameters in mind, the INO ICAL
collaboration had decided to use glass electrode RPC.
2.3 Brief history of Gas Systems for RPCs
Until the eighteenth century, gas was not recognized as a separate state of matter,
it was Joseph Black who realized that carbon dioxide was in fact a different sort of
gas altogether from atmospheric air. Latter the other gases were identified, including

- 36 -
hydrogen by Henry Cavendish in 1766. Alessandro Volta expanded the list with his
discovery of methane in 1776. It was known from a long time that inflammable gases
could be produced from most combustible materials, such as coal and wood, through
the process of distillation. In the last two decades of the eighteenth century, as more
gases were being discovered and the techniques and instruments of pneumatic chem-
istry became more sophisticated, a number of natural philosophers and engineers
thought about using gases in medical and industrial applications.
2.3.1 Freon gases and R134a gas (1,1,1,2-tetrafluoroethane)
Freon gas was discovered in the 1980s. It is a stable, non-flammable, moderately
toxic gas and is also known as R-22. The refrigerants (R22, R-410A) used in the air
conditioners are called Chlorofluorocarbons (CFCs).The CFCs are family of chemi-
cals that contain chlorine, fluorine and carbon. The chlorine content in these com-
pounds causes the depletion of the ozone layer. This discovery prompted to phase out
the greenhouse gases which include carbon dioxide, Nitrogen dioxide, Carbon mon-
oxide, CFCs etc. The Hydro-Chloro-Fluoro Carbon (HCFC) a fluorocarbon that is
replacing chlorofluorocarbon as a refrigerant and propellant in aerosol cans. The
R134a is also known as Tetrafluoroethane (CF3CH2F or C2H2F4) from the family of
HFC refrigerant. The R134a gas refrigerant is ozone friendly and is a popular re-
placement for R12. But, due to greenhouse effect it has been decided to stop the pro-
duction of CFCs by 1995 and HCFCs by 2030 [58].
In view of the above, there is need to study and operate RPC detectors in future
with Freon-less gases. There are several groups working for Freon-less gas RPCs and
some of the details of which are given in [59], [60], [61] and [62] etc.
- 37 -
2.3.2 Gas systems for RPCs
Gas system in detectors is analogous to the respiratory system of human beings.
The operating mode of RPCs depends on the mixture of gas supplied by gas system.
The main functions of gas system is to mix the required gas composition precisely and
then uniformly distribute it to each RPCs. Depending on the number of detectors, the
gas coming out of the RPCs will be let out into the atmosphere (Open Ended system)
or will purified and then looped back into the RPCs (Closed Loop recirculation Sys-
tem).
2.3.3 Gas systems used world wide
The major experiments at the LHC (Large Hadron Collider), CERN (European
Council for Nuclear Research) are ALICE, ATLAS, CMS etc. with different phys-
ics goals, use a largest number of gas detectors like RPCs, CSC, MDT, TGC, TRT
etc. which need different types of gases like CF4, C2H2F4, iC4H10, SF6, Xe,
Ar,N2,CO2, Liquid nC5H12 etc. with different gas mixing compositions and are used in
large quantities as the detectors are in large numbers. Most of these experiments are
conducted underground at a depth of about 800 meters and a modular design approach
is used for gas mixing (at surface) and circulation, distribution and purification system
(underground cavern). There is massive work done on the purification and analysiss
process of mixed gases. The key team players for designing and developing the dif-
ferent gas systems which are operation at CERN are L. Besset, F. Hahn, C. Zinoni, I.
Crotty, S. Nuzzo, S. Haider, A. D’Aurai, Ch. Schaefer, M. Bosteels, R.C.A. Brown,
C.R. Gregory, C.W. Nuttall, M. Treichel, S. Konovalov, G. Mikenberg, V. Polychro-
nakos, A. Romaniouk, R. Santonico, Guidato etc. [63].

- 38 -
The work done on the gas systems and purification is well documented as Tech-
nical Design Report (TDR) and the publications are available for references. Some of
these are M. Bosteels et al. CMS gas system proposal, CMS Note 1999/018, L. Bes-
set, F. Hahn, S. Haider and C. Zinoni, Experimental tests with a standard closed loop
gas circulation system, CMS Note 2000/040, RPC gas distribution layout by
I.Crootty, F.Hahn et al, detailed, ATLAS gas system proposals by LHC gas working
group (ATLAS Technical Design Report) etc.
The other experiments like BaBar IFR detector at SLAC use gas systems that are
in operations [64] etc. The Gas system and its up-gradation are discussed in the paper
by Wolfgang Menges [65]. As a part of upgrade of the forward end cap Muon detec-
tion system (IFR) a gas distribution and monitoring system was installed at SLAC
[66]. Here about 300 gas circuits are controlled and monitored. The returned gas flow
is monitored by digital bubblers which use photo-gate electronics to count the bub-
bling rate. The bubble rates are monitored in real time and recorded in a history data-
base allowing studies of flow rate versus chamber performance. It is an open ended
system (OES) and the mixed gas is produced from the tanks of argon, Freon, and I-
butane and distributed via low-pressure manifolds to gas distribution boxes mounted
on the detector. The gas flow is measured using bubblers before venting the gas into
the atmosphere. The typical flow rates used are (3 to 8) volume changes per day.
The BELLE detector at KEK experiment uses a similar gas distribution system as
mentioned above and is Open Ended System (OES) type. The flow resistors and elec-
tronic bubbler that are used are given reference [67].
In gaseous detectors, gases play a major role in the output signal quality. Hence
special attention has been paid to select suitable gas mixture and its circulation sys-
tem. The MWPC uses “Magic Gas” consisting of Argon (75%), I-butane (24.5%) and

- 39 -
Freon-13, B1 (0.5%) where the proportions are in volume. Some gas mixture studies
carried have been carried out by NASA [45].
Most of the LHC experiments uses closed loop gas system and its up-gradation
has been described in R. Guida et al [68].
An ARGO experiment set up at high altitude to study mainly cosmic gamma-
radiation (TIBET, CHINA), at energy threshold of 100Gev, use RPCs as active ele-
ment and three types of gases are used. The gas system is a OES and is by developed
by R. Santanico and his team [55].
The RPC performance with new purifiers in closed loop system has been studied
for LHC experiment noted down by M. Capeans et al [69] and the ageing process is
known as the degradation of their performance under the exposure to ionizing radia-
tion is studied [70].
The experience of the operation of the Gas Gain Monitoring system (GGM) of the
CMS RPC Muon detector has been described by S. Colafranceschi et al [71].The pur-
pose of GGM is to monitor any shift of the working point of the CMS RPC detector.
The Gas systems used in various LHC experiments are summarized in Table 2.1.
2.3.4 Types of Gas mixing Systems
There are various methods by which, one can mix the required composition of
gases. The number of RPCs in an experiment will decides the type of gas mixing sys-
tem that is required.
2.3.4.1 Open Ended gas System (OES)
In an open ended gas system, the mixed gas is let into the atmosphere after the us-
age in the detector. The OES are suitable where the numbers of gas detectors are few

- 40 -
tens in number. An OES consists of input section with mass flow controllers (MFCs)
to provide gas with proper proportions, input manifold for gas mixing, capillary tubes
for balancing flow and safety bubblers for avoiding the damage caused to RPCs if
there is any obstacle to flow through RPCs. Output section consist of isolation bub-
blers which are helpful to isolate system pressure from atmospheric pressure and use-
ful to indicate gas flow and output manifold which collected the gas and sent it to
vent. The technical details is described in the reference [72].
2.3.4.2 PRE-MIXED gas mixing system
The offline mode of gas mixing technique is used is known as Pre-mixed gas sys-
tems. In this gas system, a large volume supply cylinder (say of 15 Litres) which is
filled with the required composition of gas. Then the supply cylinder is connected to
the RPC or any Gas detectors. When the pressure drops the mixed gas is refilled.
Table 2.1: Gas System at LHC
Active Element RPC CSC GEM
Experiment ALICE, ALAS,CMS CMS LHCb
Gas Mixture
C2H2F4, iC4H10, SF6 Ar, CO2,
CF4 Ar, CO2, CF4
95%, 4.5%, 0.3% 40%,
50%, 10% 45%, 15%, 40%
Gas Volume ~15 m3(each) ~90 m
3 <1 m
3
Gas Recirculation (ALICE - OES ) (CLS) (OES)
Greenhouse contribution 75% 10% 6%
2.3.4.3 Closed Loop gas System
In a Closed Loop gas System (CLS), the gases are mixed as per the required com-
position, then fed into RPC stack and the output gas from the RPCs is purified and
recirculate back into the RPC stack. In CLS the gas is reused in the detectors continu-

- 41 -
ously after purification [73], [74]. The impurities which get accumulated in the gas
mixture due to leaks or formation of radicals are removed by suitable filters in the pu-
rifiers section.
2.3.4.4 The Open Loop System (OLS)
The open loop system recirculation system is based on the separation and recovery
of major gas components after passage of the gas mixture through the RPCs, and has
the advantage that it does not need filters for removal of impurities. However our
studies have indicated that the CLS is found to be more efficient than OLS. The re-
search and development under taken for feasible study is reported in [75].
2.4 Gas System for INO-ICAL
The INO ICAL experiment uses a large volume of gas mixture (~ 200 m3) of three
gases namely R134a, I-butane and SF6. Both from the operation point of view and
economic point of view an automated Closed Loop System (CLS) is better option and
is mandatory. It also helps in maintaining the environment clean and pollution free.
2.4.1.1 Simulation studies for Gas flow distribution inside an RPC
There is huge work done by several simulation groups who have presented their
work on the RPC behaviour, performance, operation function, gas gap variation, char-
acterization, effect of SF6 variation[76], [77] etc. in an RPC. But, the literature survey
related to the distribution of gas, flow rate of gas mixture, variation of composition of
gases, nozzle positions for inlet and outlet of the gas for an RPC which are some of
the parameters which help in improving the performance of an RPC, only a single pa-
per is available that too it deals with the distribution of gas inside an RPC (Bakelite)
by the CDF team at CERN [78]. Hence, there is a wide scope to understand the pa-
rameter mentioned above by simulation.

- 42 -
2.4.1.2 RPC performance studies
The performance of an RPC depends on the following factors;
a) Making the RPC gap (type of electrode used may be Bakelite or Glass) [79]:
Where in the uniform thickness of electrodes used and the thickness of gas gap
throughout the area of the gap (specially all the edges), cleanliness of the elec-
trodes, proper curing of the glue that is used to hold the spacers etc., uniform sur-
face resistance, nozzle position and leak prof gas gap with the target leak rate of
5×10⁻⁴
SCCM (say pressure drop of less than 1.75 mm WC in more than 33 hours)
[80].
b) The pickup panel having precise matching impendence, so that signal does not get
attenuated or buried.
c) All chambers should have uniform flow of gas distribution. The function of the
gas flow rate through the chambers and the environmental conditions, such as at-
mospheric pressure, ambient temperature and air humidity etc. are to be optimized
[81]. The performance measures include the noise rate as well as the detection ef-
ficiency and pad multiplicity for cosmic rays.
d) The aging effect, a long-term aging test of a Resistive Plate Chamber (RPC) was
carried out with an intense gamma 137 Cs source and the RPC performance was
monitored under cosmic rays. The detailed aging studies are presented in [82],
[83], [84], [85], [86], [87] and [88].
e) The composition of gas mixture and the quality of gas analysis in a Closed Loop
system in detail are reported in [89], [90], [91], [92], [93] and [94]. These are re-
ferred and the details are mentioned latter.
- 43 -
2.4.2 Overview of the literature survey
In this chapter, a detailed report on the literature survey of gaseous detectors,
since their inventions and their recent developments are discussed. The Figure 2.2,
shows how the gaseous detectors evolved with improved capabilities of their usage
(position sensitive or imaging etc.) with time. The Table 2.2, summarises the history of
development of gas detectors.
The gas based detectors like the GM counters, Spark chambers, PPAC detectors,
MWPC etc., are highlighted with the principle of operations in this chapter. The Spark
chambers, Parallel Plate Chamber, Resistive Plate Chambers and GEM’s are ideal the
large scale experiments and for the high accuracy tracker Gas Micro-strip Chambers
and Micro-Pattern chambers are suitable.
The details of the experiments operating worldwide, the type of RPCs, composi-
tion of gases used, the types of gas systems interfaced is summarized in the Table 2.3.
Out of these gaseous detectors mentioned above, the INO-ICAL collaboration
team has decided to use glass RPC, as it has good detection efficiency, fast rise time
(order of 1 nS), fine spatial response and from the economic point of view, glasses
RPCs are cheaper than other detectors and has the advantage of simple to fabricate,
assemble and test RPCs.
As RPC require gas mixture for ionization, so we have also gone thrown the doc-
uments and literature to known about the various gas systems developed by several
institution around the globe. The large scale experiment at LHC in CERN have devel-
oped and integrated several gas mixing systems for their different experiments with
different types of gases and different compositions. There is also enormous work on
gas purifications at CERN and most of their work is well documented.
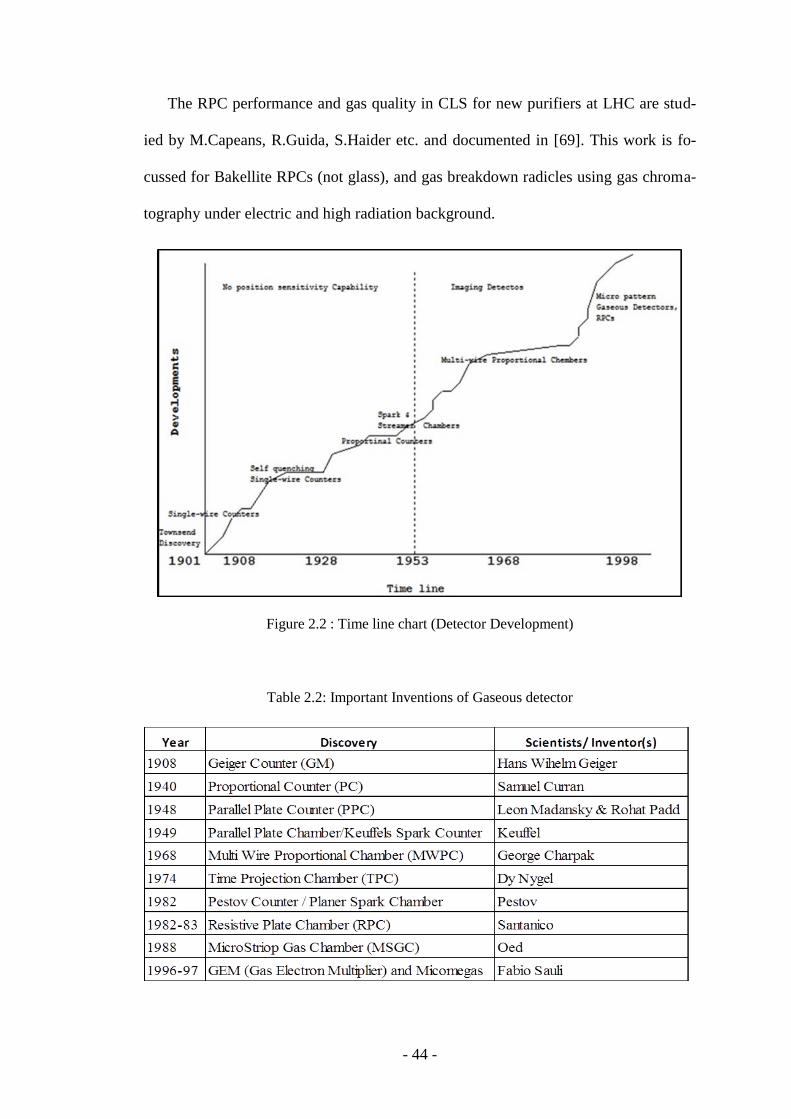
- 44 -
The RPC performance and gas quality in CLS for new purifiers at LHC are stud-
ied by M.Capeans, R.Guida, S.Haider etc. and documented in [69]. This work is fo-
cussed for Bakellite RPCs (not glass), and gas breakdown radicles using gas chroma-
tography under electric and high radiation background.
Figure 2.2 : Time line chart (Detector Development)
Table 2.2: Important Inventions of Gaseous detector

- 45 -
Table 2.3: Large Scale Experiments using RPC and type of gas mixtures
The preliminary results on optimisation of gas flow rate for ICAL by M. Bhuyan,
S. Kalmani, N. Mondal, S. Pal, D. Samuel, and B. Satyanarayana is reported in [74].,
where in the studies done are using glass RPCs which are sealed after filling a mix-
ture of gas in it and then operated in the OES system and CLS.
Experiment(s)
RPC-
Area(m2) Electrode
Gap
thickness
(mm)
No of
gaps
Mode of
operation Purpose Gas System
Gas Mixture
(approximate ratio)
CBM TOF 120 Glass 0.25 10 Avalanche Timing Open End
C2H2F4(85%)+ C4H10(5%)
+SF6(10% )
ALICE
MUON 140 Bakelite 2 1
Highly satuated
Avalanche Trigger Open End
C2H2F4(89.7%)+
C4H10(10%) +SF6(0.3% )
ALICE TOF 170 Glass 0.25 10 Avalanche Timing Closed Loop
C2H2F4 (90%)+
C4H10(5%) +SF6(5% )
L3 600 Bakelite 2 2 Streamer Trigger Open End
Ar (58%) + I-butane (39%)
+ CBrF3 (3%).
BESIII 1200 Bakelite 2 1 Streamer Trigger Open End
Ar (50%)+ C2F4H2 (42%)
+ C4H10 (8%)
BaBar 2000 Bakelite 2 1 Streamer Trigger Open End
Ar (61.2%) +
C2H2F4(34.4%)+
C4H10(4.4%)
Belle 2200 Glass 2 2 Streamer Trigger Open End
Ar (30%) + C2H2F4(62
%)+ C4H10(8 %) (butane
silver)
CMS 3750 Bakelite 2 2 Avalanche Trigger Closed Loop
C2H2F4(95.2%)+
C4H10(4.5%) +SF6(0.3%)
OPERA 3200 Bakelite 2 1 Streamer Trigger Open End
Ar (75.4%)+ C2F4H2
(20%) + C4H10 (4%) +
SF6 (0.6)
YBJ-ARGO 5630 Bakelite 2 1 Streamer Trigger Open End
Ar (15%)+ C2F4H2 (75 %)
+ C4H10 (10%)
ATLAS 7500 Bakelite 2 1 Avalanche Trigger Closed Loop
C2H2F4(94.7%)+
C4H10(5%) +SF6(0.3% )
Daya Bay 640 Glass 2 1 Streamer Trigger Open End
Ar (65.4%)+ C2F4H2
(30%) + C4H10 (4%) +
SF6 (0.5)
INO-ICAL 97505 Glass 2 1 Avalanche Trigger Closed Loop
C2H2F4(95.2%)+
C4H10(4.5%) +SF6(0.3% )

- 46 -
2.4.3 Why need to study the flow and control of gas mixture for the
RPC performance in a closed loop system?
As seen from the above literature a huge work has been carried out by the scientist
in the field of gaseous detectors. The earlier inventions of gaseous detectors were of
sealed type and the gas is stagnant in the detector for the period of operation and due
to temperature and pressure variations leaks and the efficiency will degrade. But these
detectors were portable and easy to operate.
The literature study indicates that, there is not much detailed research work done
around the globe on the RPCs which use glass as electrodes, except for the BELLE
experiment in which a few hundreds of them were used in OES and NOT in CLS,
while most of the bigger experiments at CERN use Bakelite based electrode RPC.
In view of the above, the INO-ICAL collaboration has decided to use glass based
RPCs and as the number of RPCs is huge and quantity of gas is about 200 M 3, hence
it is mandatory to use a CLS.
In India, we do not have expertise to design and build the CLS for the research
program like INO ICAL. In 2012, a conceptual design and prototype testing of Open
Loop recirculation gas System (OLS), a new technique based on condensation and
separation of the mixed gas was presented by the ICAL team and it was loudly appre-
ciated by the RPC community [75]. But due to technicality, feasibility, time schedule,
cost involved expert man power issues etc. OLS was differed and a CLS was decided
to be built and tested by INO collaborators. Some additional work to enhance the per-
formance of the OLS using centrifugal separation of gases is done by us, which is
highlighted in this thesis.
Survey of literature shows that the flow rate studies for glass RPC in CLS envi-
ronment is very rare in the literature. The INO RPCs will be used in low back ground

- 47 -
radiation (underground cosmic rays only) and hence the flow rate will be different
when compared to the other accelerator based experiments. The atmospheric pressure
variations will be different in India and hence the control study is included.
In view of the above “Study of flow and control of gas mixture on the perfor-
mance of the RPC in Closed Loop System” is being persuaded.

- 48 -
Chapter 3
Analysis, development and testing of Gas system
In this chapter we briefly describe the research and development work done on the
various gas systems that were designed, fabricated and tested for the INO-ICAL re-
search program. The detailed work done on Closed Loop System (CLS), some tools
developed for testing the gas systems are explained. The gas analysis using Residual
Gas Analyser (RGA a small scale mass spectrometer) in a CLS is described.
3.1 ICAL-RPC Gas Systems
In the initial stages of testing RPCs, the gas mixture was procured form industries
in a cylinder with the required concentration of gas mixtures and it was very expen-
sive and did not have leverage to have different concentration of gas at the user end.
Therefore several types of mixing and distribution gas systems were developed and
evolved with time.
3.1.1 Gas Properties of the gases used for RPC
The gases used for the ICAL glass RPCs are R-134, I-butane and Sulphur-
hexafluoride for avalanche mode of operation (streamer need additional argon gas)
and their properties are studied.
A prototype CLS for 12 RPC stack is designed and tested for the study of flow
and control of gas mixture for the RPC performance.
3.1.2 Types of Gas mixing System
The basic function of the gas system for RPCs is to mix the required gases as per
the required composition of gases and then latter distribute the mixture to the individ-
ual chambers. The ICAL gas detector volume (~200 m3) is required and the relative
- 49 -
expensive gases make a CLS essential and mandatory. The studies have shown that
some of the major parameters that affect the performance of RPCs are the quality of
gas mixture, composition of the gases and the flow rate. The poor quality of gas mix-
ture inside the detector increases the current drawn by the RPCs which turn increases
the background noise rates, due to which the RPC performances deteriorate. The
composition of the required gas mixture can affect the RPC pulse shape and hence
mode of operation (could go into streamer mode). The simulation studies have shown
that the “Dead Zones” pockets inside an RPC are created, where the gas does not, so
the flow rate, quality and purity of the gas are very important parameter.
3.1.2.1 Open Ended gas System (OES) type gas mixing system
In the OES, the discharge of the gas coming out of the RPC is let out in to atmos-
phere as shown in Figure 3.1. This type of system is suitable when the RPC detector
volume is few tens of cubic meters i.e. RPCs are just less than few tens.
3.1.2.2 Pre-mixed Gas Mixing System by partial pressure method
The detail of the Pre-mixing system is shown in Figure 3.2. In this mixing system
the gases are filled into a cylinder by partial pressure method.
A few rota-meters are used to indicate the flow of each gas into the mixing cylin-
der and a pressure sensor is used to indicate the filling pressure on the cylinder [1].
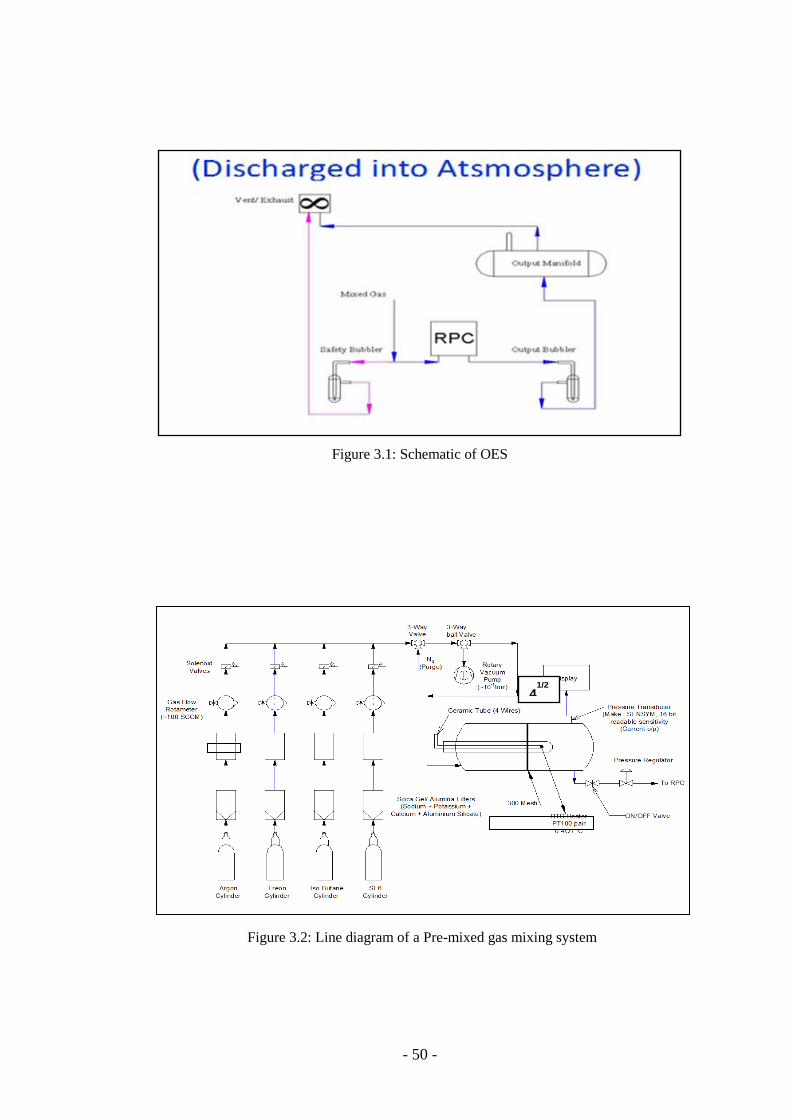
- 50 -
Figure 3.1: Schematic of OES
41/2
Figure 3.2: Line diagram of a Pre-mixed gas mixing system

- 51 -
Procedure of mixing:
If the required gas concentrations are R134a is 95%, I-butane as 4.5% and SF6 of
0.5%. Then the mixing procedure is as followed.
Firstly, the cylinder (20 litres.) is evacuated to 10-1
Torr, assuming the required
pressure needed is 2 atmosphere (abs) after mixing all the gases.
The required total pressure would be pressure of (R134a + I-butane + SF6) = 2
atmosphere (abs), which is displayed as 10,000 counts on display.
The Pressure of SF6 will be equal to [2 atmosphere × 0.5%] = 0.01 atmosphere [50
counts] is filled, as the needed concentration is 0.5%.
Next, the pressure of I-butane = [2 atmosphere × 4.5%] = 0.09 atmosphere [450
counts] and lastly the pressure of R134a =2 atmosphere × 95% = 1.9 atmosphere
[9500 counts] is filled.
This system has provision for Argon gas, when required. This system helped in
filling the gas in house and performed well.
3.1.2.3 Volumetric method an OES (Open Ended System)
The pre-mixed gas system described above has a disadvantage of dead time; the
flow of gas into the RPCs has to stop for refilling the supply cylinder when it becomes
empty. Hence an online OES, using volumetric method of mixing the required gas
concentration of gases (and distributing the same to 16 channels) was developed. It is
a Mass Flow Controller (MFC) based system and has a provision for mixing four gas-
es. The outlet of gas from the RPCs is let out into the atmosphere and hence the name
Open Ended System.

- 52 -
3.1.2.4 Open Loop Recirculation System (OLS)
Another type of gas recirculation system namely the Open Loop recirculation Sys-
tem (OLS) has been implemented as an alternative to CLS. The basic difference be-
tween these gas systems is that in OLS major gas component (R134a) is extracted
from the gas stream and reused while the remaining small quantity of gas mixture is
chemically treated into safer compounds. In case of CLS the minor components (im-
purities and radicals) are trapped through several filters and removed from gas stream
while remaining major part of gas mixture is recirculate. In OLS R134a gas contained
in the gas mixture flowing out of RPC outlet is converted into liquefied state and sep-
arated from gas mixture. Selective condensation and separation of R134a is achieved
by maintaining gas mixture under specific combination of pressure and temperature.
Liquefied R134a at -10 °C is filled in container and sent back to inlet of gas mixing
system. Cold liquefied gas in the container is heated to room temperature, develops
pressure due to heating and reused. In this way R134a gas is being re-circulated, not
in a direct loop but by batch type transfer, hence the name “Open Loop”. This type of
system does not require the filters or adsorbents for individual impurities, delicate
loop pressure control or any precision chemical analysis to decide the top-up gas
quantities. A moisture sensor placed at the outlet of RPC is sufficient to indicate
amount of moisture which serves as indicator to ingress of air into gas mixture by
leakages. In this method the mixed gases coming out of RPCs are separated, purified,
stored and reused. The gases are separated from the mixture is accomplished by using
differences in their physical and chemical properties. For example: I-butane and
R134a can be liquefied at temperatures above -30 °C, whereas Argon and SF6 are still
in gas phase at that temperature. R134a is a saturated compound but I-butane retains
substantial chemical affinity. In gas phase SF6 is 2½ times heavier than Argon. The

- 53 -
conceptual functioning could be demonstrated, but due to cost and time schedule a
new CLS was designed, developed and tested as its feasibility of operation was seen
at the LHC, CERN experiments.
3.1.3 Closed Loop Gas mixing and recirculation system
A Closed Loop System (CLS) capable of purifying and recirculating gas mixture
in a loop is more suitable when the numbers of chambers are large. In a CLS the gas
mixture, after having flown through detector is not let out into atmosphere but looped
back to the detectors after purification and re-pressurization. The impurities that get
accumulated in gas mixture due to leak or formation of radicals are removed by suita-
ble filters. The efficiency of CLS is defined as ratio of difference between total gas
mixture volume and gas volume lost as leakage and formation of radicals, to total gas
mixture volume. Typical efficiency of a closed loop system is in range of 85 % to 95
%. However for setups with small number of detectors working under cosmic lumi-
nosity this value is found to be near 97%.
We do not have much expertise for designing and developing a CLS in our coun-
try and therefore, it becomes difficult for fabrication of bigger gas systems that would
be required in the INO project.
In view of the above, the conceptual design of the CLS which are being used at
CERN for the CMS, ATLAS [63], [68], [69], [71], [95], [96], [97], etc. experiments
are chosen by us for a proto-type CLS for a stack of 12 RPCs. But, the overall de-
tailed control designs, fabrication and instrumentation using PLCs (Programmable
Logical Controllers) is indigenized designed and developed.
The basic function of the CLS is to mix the gas as per the required composition,
distribute the mixture of gas in to the individual chambers and have purification sys-
tem in the loop of the gas flow. The CLS is operated with a fraction of fresh mixture
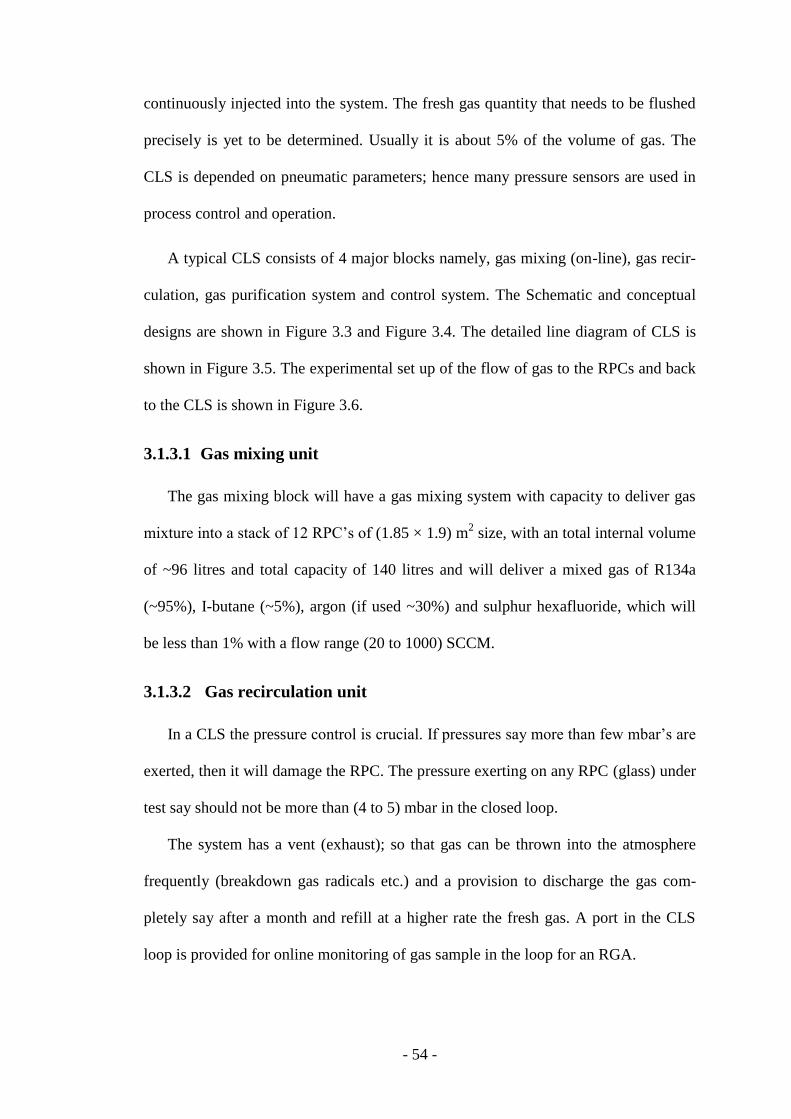
- 54 -
continuously injected into the system. The fresh gas quantity that needs to be flushed
precisely is yet to be determined. Usually it is about 5% of the volume of gas. The
CLS is depended on pneumatic parameters; hence many pressure sensors are used in
process control and operation.
A typical CLS consists of 4 major blocks namely, gas mixing (on-line), gas recir-
culation, gas purification system and control system. The Schematic and conceptual
designs are shown in Figure 3.3 and Figure 3.4. The detailed line diagram of CLS is
shown in Figure 3.5. The experimental set up of the flow of gas to the RPCs and back
to the CLS is shown in Figure 3.6.
3.1.3.1 Gas mixing unit
The gas mixing block will have a gas mixing system with capacity to deliver gas
mixture into a stack of 12 RPC’s of (1.85 × 1.9) m2 size, with an total internal volume
of ~96 litres and total capacity of 140 litres and will deliver a mixed gas of R134a
(~95%), I-butane (~5%), argon (if used ~30%) and sulphur hexafluoride, which will
be less than 1% with a flow range (20 to 1000) SCCM.
3.1.3.2 Gas recirculation unit
In a CLS the pressure control is crucial. If pressures say more than few mbar’s are
exerted, then it will damage the RPC. The pressure exerting on any RPC (glass) under
test say should not be more than (4 to 5) mbar in the closed loop.
The system has a vent (exhaust); so that gas can be thrown into the atmosphere
frequently (breakdown gas radicals etc.) and a provision to discharge the gas com-
pletely say after a month and refill at a higher rate the fresh gas. A port in the CLS
loop is provided for online monitoring of gas sample in the loop for an RGA.
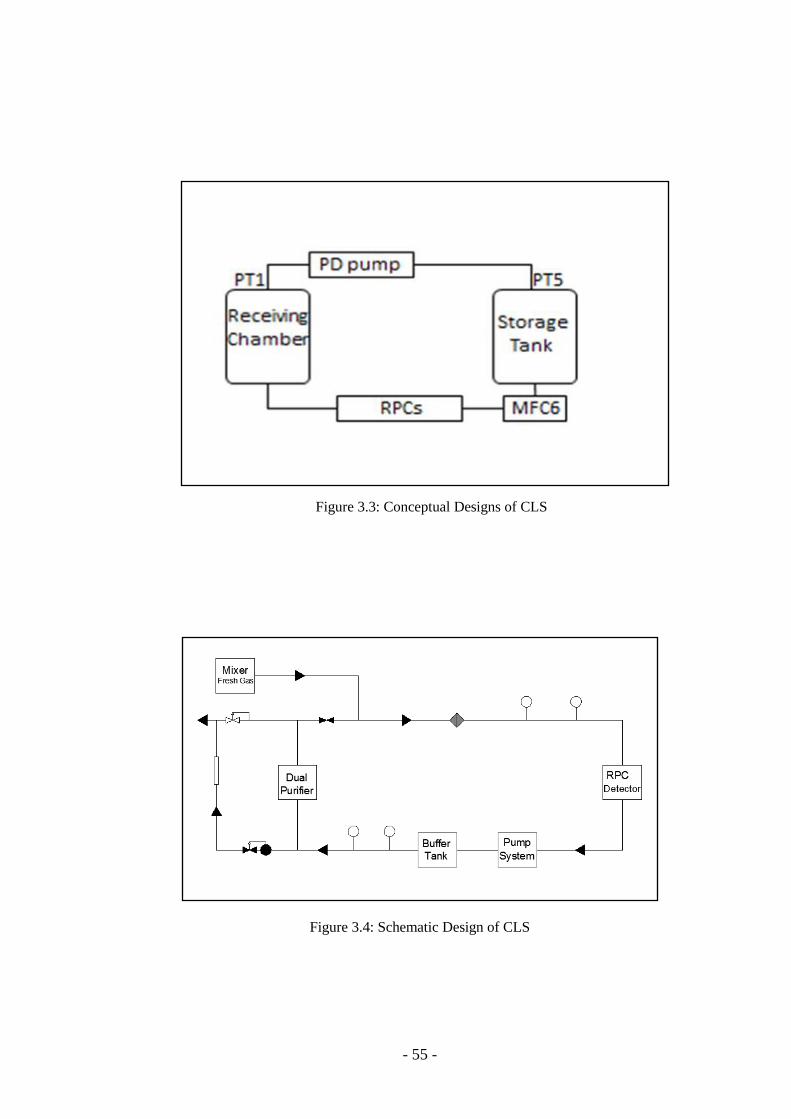
- 55 -
Figure 3.4: Schematic Design of CLS
Figure 3.3: Conceptual Designs of CLS
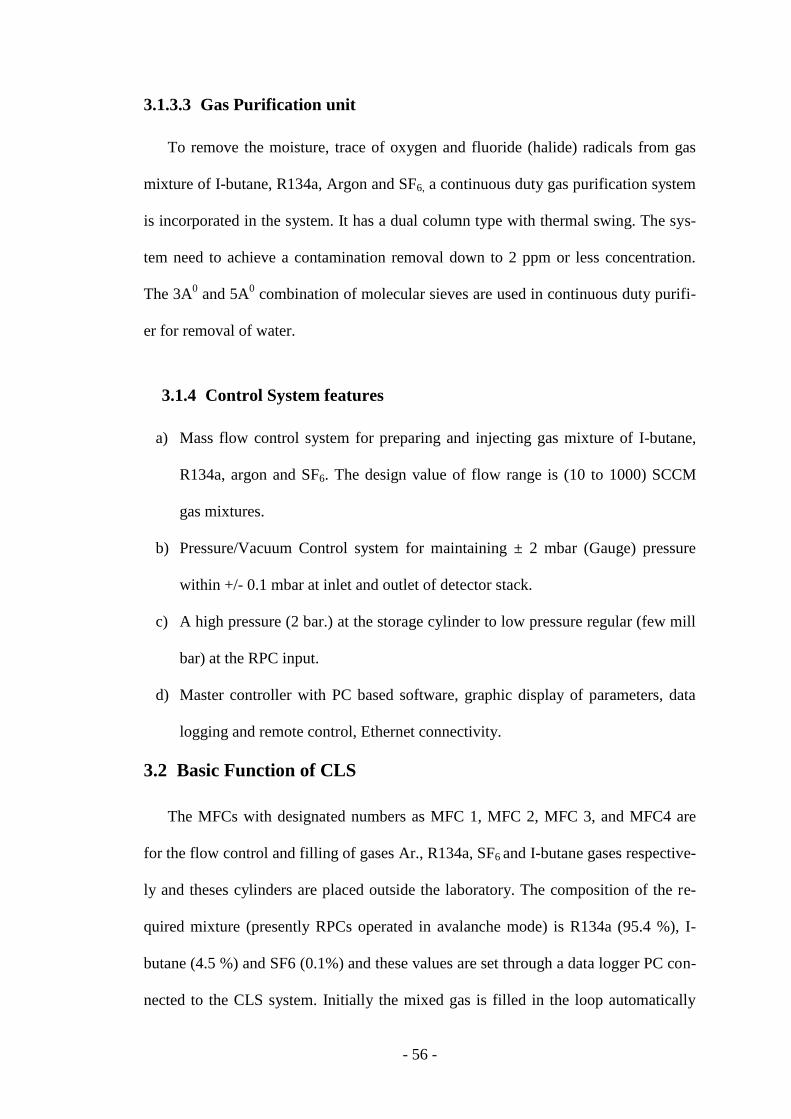
- 56 -
3.1.3.3 Gas Purification unit
To remove the moisture, trace of oxygen and fluoride (halide) radicals from gas
mixture of I-butane, R134a, Argon and SF6, a continuous duty gas purification system
is incorporated in the system. It has a dual column type with thermal swing. The sys-
tem need to achieve a contamination removal down to 2 ppm or less concentration.
The 3A0 and 5A
0 combination of molecular sieves are used in continuous duty purifi-
er for removal of water.
3.1.4 Control System features
a) Mass flow control system for preparing and injecting gas mixture of I-butane,
R134a, argon and SF6. The design value of flow range is (10 to 1000) SCCM
gas mixtures.
b) Pressure/Vacuum Control system for maintaining ± 2 mbar (Gauge) pressure
within +/- 0.1 mbar at inlet and outlet of detector stack.
c) A high pressure (2 bar.) at the storage cylinder to low pressure regular (few mill
bar) at the RPC input.
d) Master controller with PC based software, graphic display of parameters, data
logging and remote control, Ethernet connectivity.
3.2 Basic Function of CLS
The MFCs with designated numbers as MFC 1, MFC 2, MFC 3, and MFC4 are
for the flow control and filling of gases Ar., R134a, SF6 and I-butane gases respective-
ly and theses cylinders are placed outside the laboratory. The composition of the re-
quired mixture (presently RPCs operated in avalanche mode) is R134a (95.4 %), I-
butane (4.5 %) and SF6 (0.1%) and these values are set through a data logger PC con-
nected to the CLS system. Initially the mixed gas is filled in the loop automatically

- 57 -
through the PLC system. The total gas in the circuit is (a) 20 litres in the supply cylin-
der having a pressure sensor PT5 (b) 20 buffer or receiver cylinder having PT1 pres-
sure sensor attached to it and (c) the two purifiers cylinders are of 5 litres each.
The supply cylinder is filled to a 1.6 bar (again settable through the data logger PC
or the HMI connected to the series of PLCs - details explained later).
The MFC 6 (at a set flow rate) connected to the high pressure cylinder (storage
tank output) supplies the mixed to the RPC stack as shown in Figure 3.6 and through
the RPCs the gas the flows back into the receiver tank and the pneumatic pump sucks
the gas from the RPCs through the buffer cylinder and based on the pressure PT1 de-
veloped due to gas flow inside it and then this gas is pushed into the dual purifier sec-
tion and back into the storage tank after purification. This way the loop continues and
frequently as and when required the fresh gas is topped up into the CLS depending on
the on the pressures PT5 and PT1 (difference being 0.300 abs bar). This top-up gas is
about 5 litres.
3.2.1 Specifications and settings of the pumping module
The pumping module is the most important vital device in the CLS. It sets up the
gas flow across closed loop and through the 12 RPCs. The operating values in detail
for the CLS (pressures, speed of pump etc.) are given in Table 3.1 and the pressures
and flow settings (minimum and maximum) needed for Aanlog Input (AI) modules
are shown in Table 3.2 (analog settings).

- 58 -
Figure 3.5: Line diagrams of Proto type CLS
Figure 3.6: Experimental Setup (RPCs connected in CLS)

- 59 -
Table 3.1 : CLS operating values
Table 3.2: CLS Analog data settings
1 SP1 1.007 bar Maximum value for PT1 (Receiver Pressure)
2 SP2 0.997 bar Minimum value for PT1 (Receiver Pressure)
3 TF1 12 sec Waiting time for delivery stroke
4 TF2 18 sec Waiting time for suction stroke
5 FP1 Nil Flow setting for Argon
6 FP2 14.0 SCCM Flow setting for I-butane
7 FP3 304 SCCM Flow setting for R134a
8 FP4 1.6 SCCM Flow setting for SF6
9 FP5 Nil Flow setting for Exhaust Flow
10 FP6 0.700 SCCM Flow setting for Loop flow (one RPC)
11 PBS 1.150 bar Minimum storage-tank pressure for top-up start
Sl.no. Device No. Minimum Maximum Description
1 PT1 0 2.447 bar Receiver pressure transmitter
2 PT2 0 5.0 bar Pump pressure transmitter
3 PT3 0 6.10 bar Vacuum pump pressure transmitter
4 PT4 0 2.447 bar Low pressure transmitter
5 PT5 0 6.10 bar Medium pressure transmitter
6 PT6 0 6.10 bar Comparative pressure transmitter
7 MT1 0 5000 Moisture transmitter
8 MFC1 0 Argon mass flow controller
9 MFC2 0 243 SCCM I-butane mass flow controller
10 MFC3 0 1500 SCCM R134a mass flow controller
11 MFC4 0 1.6 SCCM SF6 mass flow controller
12 MFC5 0 100 SCCM Vent gas mass flow controller
13 MFC6 6 0.0 100 SCCM Loop-flow mass flow controller
14 LP1 0 320 Exhaust Pressure transmitter
15 BT1 0 10 Baratron transmitter

- 60 -
3.2.2 Components of the loop
a) Pneumatic Pump: It is a dual cylinder Positive Displacement (PD) Pump. It
can suck and deliver gas at (0.5 and 5) bars. The stroke of the pump starts a new cy-
cle. The compression ratio, stroke speed and wait time can be set and adjusted through
the main PLC. Two directional check valves in the outlet keep the gas moving in and
out in a positive direction.
b) Gas Purifier: It has 3 cylinders of 5 litre capacity. The purifier cylinder con-
tains activated basic alumina (Al2O3 mixed with small proportion of Al (OH) 3). This
purifier removes the unwanted radicals formed in the gas mixture (for e.g. SF2, SF4
etc.) which may cause damage to the detector by forming complex compounds with
the RPC glass. The other two cylinders have Molecular Sieves (mainly aluminium
silicate) with 4A (pore size 4A0) and 13X (pore size 10A
0) type in the ratio of 90:10.
The 4A0 adsorbs moisture, SO2, C2H4, C2H6, C3H6, ethanol but not higher hydrocar-
bons. Some 5A sieves (pore size 5A0), are also used for adsorbing normal (linear) hy-
drocarbons up to n-C4H10 (not the Iso-compounds). The 13X sieves is used for purifi-
cation of higher hydrocarbons. The purifier has set of six valves which can isolate
each cylinder or put them in parallel. The heaters along with PT-100 (temperature
transducers) are attached to the cylinders for the purpose of regeneration. The gas pu-
rity after purification is in the range of 2 ppm water vapour or better.
c) Moisture Sensor: The moisture transmitter senses the moisture content of the
gas stream, in series. Its output is in the form of current of (4 to 20) mA. , that is pro-
portional to the moisture content.
d) Storage Tank: This is about 30 litres Stainless steel storage tank which can
hold up to 90 litres of gas mixture (3 bar abs). This tank has four pressure transducers
(BT1, PT4, PT5, and PT6) which are used to fill it at different pressures. This way a
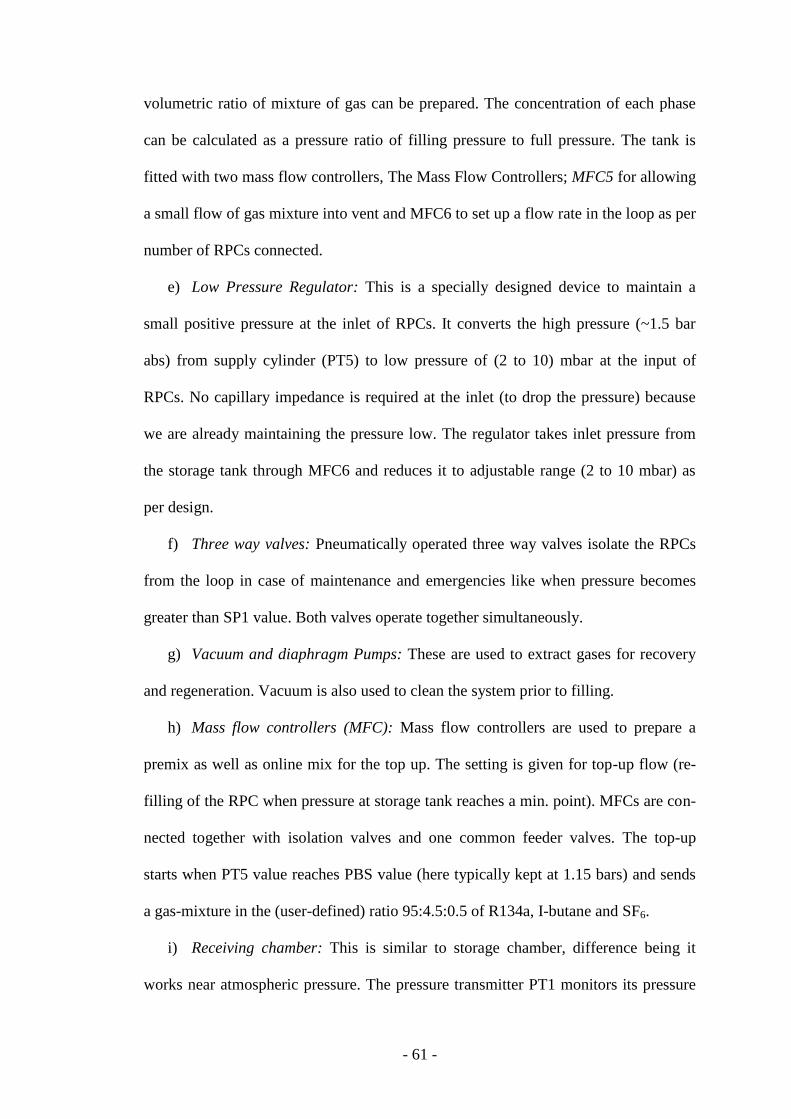
- 61 -
volumetric ratio of mixture of gas can be prepared. The concentration of each phase
can be calculated as a pressure ratio of filling pressure to full pressure. The tank is
fitted with two mass flow controllers, The Mass Flow Controllers; MFC5 for allowing
a small flow of gas mixture into vent and MFC6 to set up a flow rate in the loop as per
number of RPCs connected.
e) Low Pressure Regulator: This is a specially designed device to maintain a
small positive pressure at the inlet of RPCs. It converts the high pressure (~1.5 bar
abs) from supply cylinder (PT5) to low pressure of (2 to 10) mbar at the input of
RPCs. No capillary impedance is required at the inlet (to drop the pressure) because
we are already maintaining the pressure low. The regulator takes inlet pressure from
the storage tank through MFC6 and reduces it to adjustable range (2 to 10 mbar) as
per design.
f) Three way valves: Pneumatically operated three way valves isolate the RPCs
from the loop in case of maintenance and emergencies like when pressure becomes
greater than SP1 value. Both valves operate together simultaneously.
g) Vacuum and diaphragm Pumps: These are used to extract gases for recovery
and regeneration. Vacuum is also used to clean the system prior to filling.
h) Mass flow controllers (MFC): Mass flow controllers are used to prepare a
premix as well as online mix for the top up. The setting is given for top-up flow (re-
filling of the RPC when pressure at storage tank reaches a min. point). MFCs are con-
nected together with isolation valves and one common feeder valves. The top-up
starts when PT5 value reaches PBS value (here typically kept at 1.15 bars) and sends
a gas-mixture in the (user-defined) ratio 95:4.5:0.5 of R134a, I-butane and SF6.
i) Receiving chamber: This is similar to storage chamber, difference being it
works near atmospheric pressure. The pressure transmitter PT1 monitors its pressure
- 62 -
(which is also the output pressure from RPC). It acts as buffer tank for pressure regu-
lation. It works between the max and min values set by SP1 and SP2 respectively
(max being around 1.004 (1.007 bar and min being around 0.997 to 1.001 bar).The
pump module sucks the gas from Receiving chamber and puts it back in the loop.
3.3 PLC based Instrumentation of CLS
The pressure parameters play a crucial role in the design of CLS. The basic block
diagram of CLS is shown in Figure 3.5. The CLS is completely automated and has
provision to mix four types of gases (only three used) in the appropriate ratio as re-
quired by the user, typically R134a (95.2%), I-butane (4.5%) and sulphur hexafluo-
ride (0.3%) with a set flow rate of 6 SCCM to each detector and maintain a safe pres-
sure of 3 mbar for the normal operation of the RPCs. Initially the designed flow rate
was very high (few SLPH). The purification process in the loop is automated by using
dual purifiers. The safety aspects like over pressure, and isolation or cut-off of flow of
gas into the RPC detector stack due to blockage of gas is implemented.
3.3.1 Principal of operation and Design Criteria
There are two basic pressures, PT1 measured on the receiver tank pressure and PT5
on the storage or delivery tank pressure. The pressure observed by the PT1 (sensor) is
lowest in the loop while PT5 is highest. The suction pump is a reciprocating type of
pump that sucks gas from receiver tank and delivers it to purifier tank. The receiver
tank acts like a buffer tank. The reciprocating pump is used for better discharge rate
control and its suction is not continuous as it would have been in case of a rotary or
centrifugal pump. The pressure seen at PT1 reduces, when the suction stroke is ON
and it increases due to return flow when suction stroke is OFF. The PT1 being the low-
est pressure in the loop and it can be assumed that the pressure inside RPC is greater

- 63 -
than PT1 and is allowed to change within a band of pressures which is about 3 mbar.
This means pressure inside RPC cannot change more than 3 mbar. The lower limiting
value is termed as SP1 which is in the range of 0.998 bars to 1.003 bars. The upper
pressure range is SP2 and can be set at (1.000 to 1.006) bar abs, depending upon the
allowable pressure band. When pressure falls below the value of SP1, the pumping
stops and further lowering of PT1 does not take place and the flow is full as per set
point on the MFC 6 (Mass Flow Controller) which supplies the gas into the RPC stack
with the set flow rate of 6 SCCM. Due to this action PT1 tends to rise. When pressure
goes above or equals SP2, the flow stops completely through MFC 6 hence PT1 cannot
further increase. The pumping is kept ON so that it helps in lowering PT1 to a pressure
below SP2.
The flow is proportional to the band of (SP2-SP1) and actual value of PT1 can be
given as the Flow rate = MFC6 *((SP2-SP1)/PT1))
The storage tank pressure (PT5) is monitored to obtain and estimate the leak rate,
and the amount of gas available for recirculation. The limits are set on PT5 such that
is should not be less than 1.150 bar (abs) and more than 1.450 bar (abs). This limit of
300 mbar is constant and is internally set. So for every refill the gas pumped / top-up
is 300 mbar in a 20 litre storage cylinder. The lower pressure range is termed as PBS
and is adjustable. When PT5 reaches a value of 1.150 bar due to leakage or bleed
through MFC 5 (exhaust MFC), the backfill is activated .The selected valves which
are not shown in drawing namely SV10 ( I-butane) SV11 ( Freon) and SV12( SF6)
are opened along with SV13 which is a discharge valve. When the pressure PT5
reaches (PBS + 300) mbar i.e. 1.450 bar abs, the backfill stops. All along the backfill,
the normal function of pumping and PT1 is ON along with all interlocking actions.

- 64 -
The pump used to suck gas from the storage cylinder is a reciprocating type (pis-
ton based) and driven by a pneumatic cylinder. The stroke is 100 mm and its bore is
18 mm. The stroke lengths (both forward and return) can be adjusted by the position
of reed switches provided on the body of pump. The speeds, both forward and reverse
are controlled by unidirectional needle valves which are provided on compressed air
tubes. The supply pressure of 5 bars is required to operate the pumps.
To keep the flow uniform throughout the pumping cycle and similarly the pressure
should also be kept constant. A HPLP regulator was installed in the loop to reduce
pressure from PT5 (1.45 bar abs) to an adjustable (20 to 30) mbar constant pressure
(safe operation of RPCs). But (20 to 30) mbar pressure is too low for MFC 6 to work
on downstream of low pressure regulator. Hence we have to keep it on the upstream
side of LP regulator. During a condition PT5>SP2, the MFC6 flow stops completely
and this action starves LP regulator of gas sending it into unstable control.
During evacuation of the system the entire volume comes under vacuum, includ-
ing low pressure regulator. As this is a large area device, vacuum produces tremen-
dous forces on the diaphragm which might get ruptured or may lose smoothness of
pressure control.
The storage tank delivers low pressure gas to the RPC which is collected in the re-
ceiver tank and pumped and returned to the storage tank. A set of MFCs are used to
mix gas at appropriate flow rate. The system operates between (1.15 to 1.45) bar abs
where the top up starts at 1.15 bars and stops at 1.45 bars abs. The RPC is maintained
between 1.006 to 1.009 bars with (2 to 3) mbar ratio difference. The flow rates can be
adjusted for (1 to 100) SCCM. The room pressure variation is periodic and observed
pressure variation is (1.004 to 1.010) bar and twice a day.

- 65 -
In the purifier section the removal of radicals by disposable activated Alumina and
the removal of Oxygen by CuZn and Ni-NiO on activated Alumina/Silica by continu-
ous duty purifier (standard cartages available) and the moisture level and oxygen level
is maintained less than 2 ppm.
3.3.2 Instrumentation details of CLS
The key components of the CLS are PLC units namely the master controller CPU
(model SIMATIC-S7-1214C), digital input (SM 1222-DC), digital input and out
module (SM 1223- DC / DC), Analog input modules (SM 1231 AI) and Analog out-
put module (SM 1232 AQ). The other components are the Shavison make, AS 775 (8
Channel, solenoid driver with input 24VDC/15mA and Output of 24VDC/2.5A), AS
773 and AS 333 (power distribution module), TAON-30s/60S, TATP-180SAS 622
namely solenoid valve controller, solenoid drivers, power distribution modules, tim-
ers, Analog timers, isolated coils, respectively, Schneider make relays (24V) MCBs,
GE Pan metrics transmitter, Tylan make MFCs (Mass Flow Controller), pressure sen-
sors (MSI make Model M5256-000012 ), RTDs, purifier units, heaters for regenera-
tion etc. The storage tank and receiver tank are of about 20 litres, to deliver mixed
gas to RPC stack and receiver tank to receive exhaust gas from RPCs, a High Pressure
to Low Pressure (HPLP) regulators (to control and regulate the flow and pressure of
the mixed gas into the RPCs). The front view is pictorially represented in Figure 3.7
and details of the PLC and peripherals are represented in the form of block diagrams
as shown in the Figure 3.8 and Figure 3.9

- 66 -
Figure 3.7: CLS showing different components
The pressure transducers have (4 to 20) mA current output are used for receiver
tank (PT1), radical remover tank (PT2), regeneration of molecular sieve cylinders
(PT3), Storage tank (PT5 and PT4), laboratory pressure monitor (PT6) and similarly
the mass flow controllers MFC1 to MFC4 are for refilling of gas, MFC 5 for control
of exhaust gas and MFC 6 for control of flow of gas into the RPCs. The relays are
used to shut off the valves of MFCs to completely stop the flow of gas. The over cur-
rent relays are used for the compressors, vacuum pump, electrical heater for regenera-
tion and diaphragm pump. The timers are used to make heater ON or OFF and are
used for controlling the displacement pump to start and stop and wait for particular
position. A gang of solenoid valves are used for pumping of displacement pump and
to control MFC supply.
There are two Analog inputs that are connected to the CPU from the RTDs which
are used for monitoring temperature of gas purifier chambers. These parameters play

- 67 -
a crucial role during recharging / regeneration of molecular sieves which are used for
purification of gases.
The main CPU has six bit-operated digital inputs and 2 bit operated digital output.
It is also providing 8 digital outputs as independent channels. Digital output of CPU
and Signal Module are given to solenoid driver which is used to operate solid state
relays controlling heaters, air compressor, metering and vacuum pump and solenoid
valves of purifier units. The LAN interface has been controlled using CPU1214C.
Figure 3.8: PLC based CLS control components
Figure 3.9: PLC modules and peripherals
- 68 -
The SM1223 DC-DC Digital I/O is used to get five inputs from Nitrogen (N2) cyl-
inder pressure input, air pressure, Pump-1 position delivery and Pump-1 position suc-
tion. Its eight outputs are connected to solenoid driver which controls the solenoids
valves of MFC for on/off operation, feeder valve, air compressor and RPC stack By-
pass operation.
Digital output unit (SM1222 DO) used to drive 16 solenoid driver circuit (Shavi-
son AS775) which controls the gas flow ON/OFF operation of individual RPCs. It
also drives positive displacement pump. Apart from these modules two Analog output
modules (SM1232 AO) connected to exhaust MFC, RPCs flow MFC and individual
gas MFCs to provide Analog control voltage in proportional to set gas flow.
One Analog input module (SM1231 AI) has seven inputs from storage tank pres-
sure (PT5), laboratory pressure (PT6), moisture meter (used to check quality of gas),
exhaust MFC (MFC 5), RPC flow MFCs (MFC 6), mixture tank-2 (controller) and
outlet pressure. The other SM1231 AI module is used to get the control Analog volt-
age read values which corresponds to actual gas flow through the MFCs. The receiver
tank pressure sensor (PT1) output, Purifier suction pressure(PT2) , regeneration Pres-
sure(PT3) , storage tank pressure(PT4) have been monitored through this module.
A Human Machine Interface (HMI) is a platform which permits communication
between PLC based CPU and computer interaction between users and automation
equipment. It has 7 inch TFT LCD display with flash ROM of 128 MB and 30 MB
system memory, a total of 82 MB user memory and 16MB backup memory is availa-
ble. A RS-232/485/433 communication link is also present in this model and has in
build feature of saving data through USB) without connecting it to PC. It provides 8
levels of passwords to set user security to prevent improper use.

- 69 -
A monitoring PC is connected to CLS CPU through Ethernet via DOP e-Server
data collection software. There are 28 monitoring data (pressures PT5, PT1, mass
flow rates, refilling time etc.) parameters that are stored every 3 minutes (can be set as
per requirement) in an excel sheet for offline analysis. The CLS are built at other
INO-ICAL collaboration institutions, but with few functions and a fully automated
one.
3.4 Performance of CLS
. The ambient pressure variation cycle has great impact on the gas flow operation
of CLS in absolute mode of operation, which in turn has effected on current, noise
rate of the RPCs and a few RPCs were damaged. A differential mode of operation was
then introduced to overcome the problem.
3.4.1 Results and Conclusion related to CLS
The Gas flow is controlled efficiently using PLC based instrumentation. All the
peripherals of PCL-CPU are operating as per design with added modification for the
last 4 years. The auto refill cycle of 12 days has been achieved with minimum a leak-
age which corresponds to about 5 litres of gas to top-up. The leakages of the gas at the
several joints were further reduced by gluing and reduction in auto-refill cycle period
was observed.
In the process of modifications the HPLP regulator is replaced by a capillary at
each input of an RPC, the details of which are presented in the next chapter. The flow
rate optimisation results are described in chapter 5.
.

- 70 -
3.5 Tools developed during the development of gas systems
Several tools for testing and analysis of gas were developed for smooth function
of the CLS. The gas flowing through the detector was monitored by using a bubble
counter was developed and briefly explained below.
3.5.1 Bubble counter
As a part of R and D work for INO-ICAL development, several type of gas mix-
ing systems open ended, open loop, closed loop etc., mixing systems were developed
to study the flow and control of gas mixture into the RPCs. In the process several
tools were developed and one such tool namely a bubble counter was developed mak-
ing use of a microcontroller 89C51 (Philips make), to test the flow of gas into the
RPC.
In an open ended gas system, the gas coming out of the RPC is left out into the
atmosphere through a bubbler(s) made of borosilicate glass containing non-degassing
oil DC706 ( = 1.08 gm./cc). The outlet of the RPC is connected to an Isolation bub-
bler and at the input bubbler is called as the safety bubbler [72].When there is a block
in the flow path, due to dust particle or any impurity in the RPC, the safety bubbler
releases the gas into the atmosphere and thus protects the RPC. The oil levels in the
two bubbler is such that, the level in the safety bubbler is double (10 mm) that of the
isolation bubbler. When the gas flows through the RPC, bubbles are seen the isolation
bubbler and indicate that the system is functioning well (not leaky) which means there
is continuous flow of gas through that RPC. Therefore, counting these bubbles indi-
cates, there is a flow of gas in the RPC and the number of bubbles will indicate the
quantity of gas flowing through it. To count these bubbles a microcontroller based

- 71 -
system has been developed and successfully integrated during initial studies of Gas
system and RPCs tests. The detail of electronics tool developed is given below.
3.5.2 Instrumentation
A simple LDR has been used to detect bubble shadow which is cutting light of
LED seating opposite of LDR. The LED light is obstructed by the bubble passing
through the light passage. When this happens there is resistance change in the LDR.
This change is registered is processed to register a bubble count Figure 3.10.
The electronic tool to count the bubbles is divided into three sections namely (a)
Sensor section (b) Signal conditioning and (c) Readout section.
In the sensor section, bubbles are detected using LED and LDR combination. The
LDR and LED are kept face to face on the wall of glass bubbler containing oil as
shown in Figure 3. The LED light falls on the LDR through the oil. When bubble
comes out of bubbler, it blocks the light falling on LDR which in turn increases the
resistance of the LDR. In the signal conditioning section, the small variation of re-
sistance is sensed in terms of voltage by connecting it to the comparator through a
buffer. The comparator output is connected to microcontroller port. Isolation is pro-
vided between the microcontroller and the signal conditioning circuit section by using
an op to-coupler.
In the readout section, an LCD display of 16 × 2 lines is used to read the
counts through the microcontroller and display it. The first line on the display is the
bubble count which is updated as and when it is registered and second line shows the
count of the bubbles per minute. The code has been written in assembly language and
then the hex file has been loaded in Microcontroller using application called flash
magic.
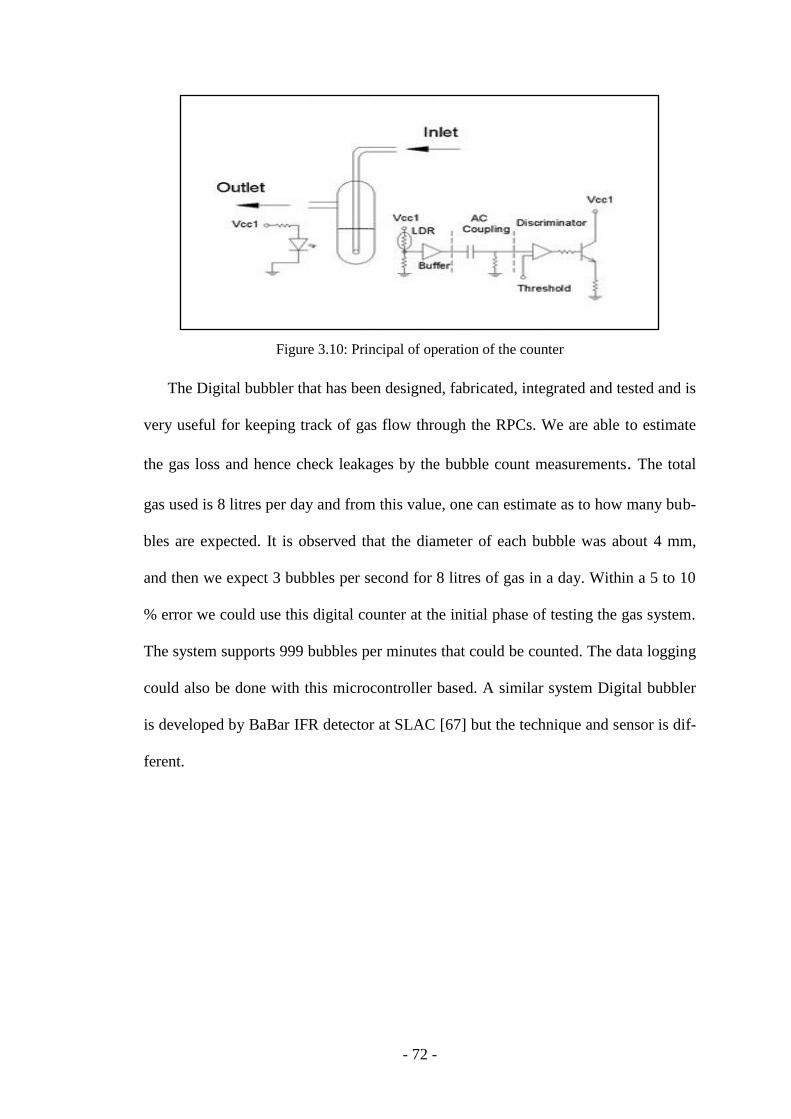
- 72 -
Figure 3.10: Principal of operation of the counter
The Digital bubbler that has been designed, fabricated, integrated and tested and is
very useful for keeping track of gas flow through the RPCs. We are able to estimate
the gas loss and hence check leakages by the bubble count measurements. The total
gas used is 8 litres per day and from this value, one can estimate as to how many bub-
bles are expected. It is observed that the diameter of each bubble was about 4 mm,
and then we expect 3 bubbles per second for 8 litres of gas in a day. Within a 5 to 10
% error we could use this digital counter at the initial phase of testing the gas system.
The system supports 999 bubbles per minutes that could be counted. The data logging
could also be done with this microcontroller based. A similar system Digital bubbler
is developed by BaBar IFR detector at SLAC [67] but the technique and sensor is dif-
ferent.

- 73 -
3.6 Study of gas mixture inside an RPC using Residual Gas Analyser
The sophisticated gas analysers like the Gas Chromatographs are used at CERN
experiments for studying the breakdown radicals of gas mixture coming out, after the
usage from an RPC and several results are reported in [96], [98], [99], [100]. But the
Chromatographs are expensive. In lieu of the chromatograph a simple Residual Gas
Analyser (RGA) which is a small scale mass spectrometer is used by us. It is connect-
ed directly to a vacuum system (vacuum chamber) and whose function is to analyse
the gases inside a vacuum chamber. It can be used for complete characterization of a
vacuum environment that requires the detection of all the component gases present, as
well as measurement of the total pressure.
A Stanford Research Systems (SRS) incorporation make RGA (Residual Gas
Analyser) probe was purchased by us. This probe was then hooked to a turbo vacuum
pump (Pfeiffer make) along with an assembly of chamber with ports which was de-
signed by us. It is interfaced to a PC through an RS232c port. The library for basic
analysis is provided by the SRC.
3.6.1 RGA Principle of operation
A small fraction of the gas molecules are ionized (forming positive ions), and the
resulting ions are separated, detected and measured according to their molecular
masses (mass to charge ratio of ion). To accomplish these, a typical RGA has three
major parts, namely, an ionizer, a mass analyser (here it is a quadruple filter), and an
ion detector as shown in Figure 3.11. (This figure is adapted from the SRS manual).
The output of an RGA is a spectrum that shows the relative intensities of the vari-
ous species present in the gas. This output is known as a mass scan or mass spectrum.
From these mass spectra one can identify the different molecules present in a residual
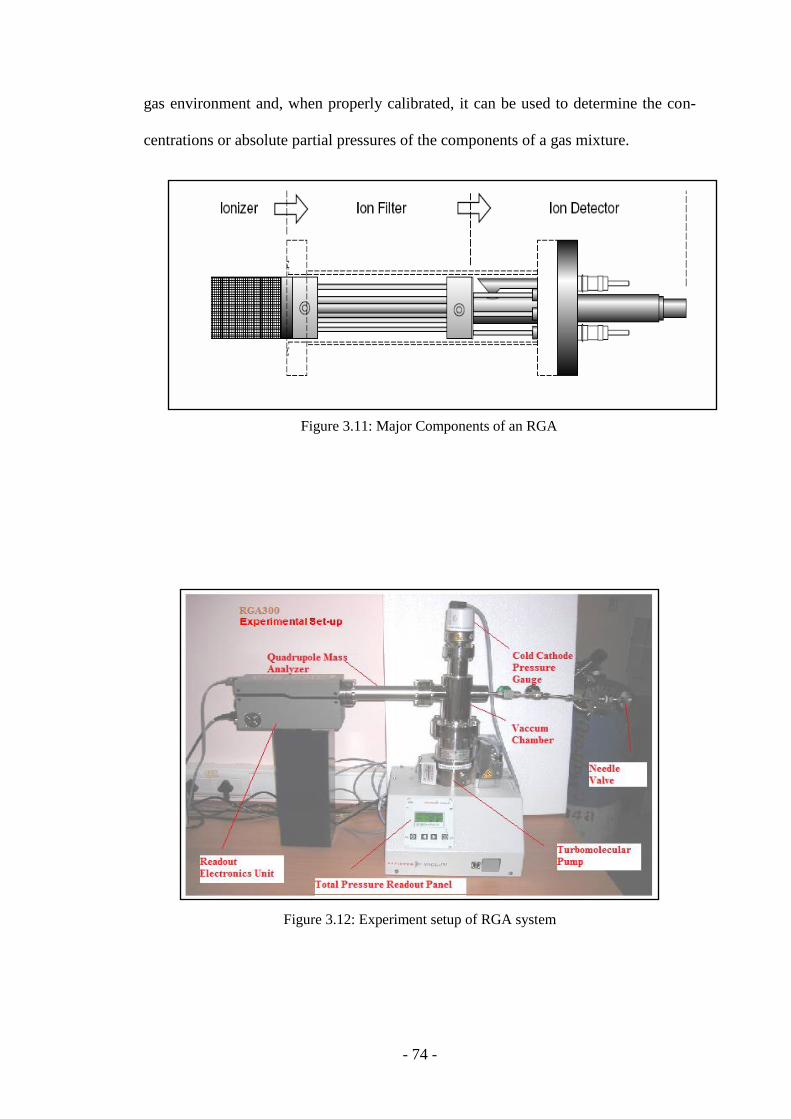
- 74 -
gas environment and, when properly calibrated, it can be used to determine the con-
centrations or absolute partial pressures of the components of a gas mixture.
Figure 3.12: Experiment setup of RGA system
Figure 3.11: Major Components of an RGA

- 75 -
3.6.2 Procedure to obtain mass spectra of Gas or Gas Mixture
The complete experimental setup is shown in Figure 3.12. The fabricated vacuum
chamber whose one end is connected to the RGA probe and the other end is connect-
ed to the RPC gas (to be analysed) output through a fine tune needle valve. The
chamber is evacuated to a very low pressure of the order of 10-8
mbar.
The needle valve is used for fine tuning the flow of gas inside the chamber. Initial-
ly it is turned off not letting any gas to enter the chamber while the chamber is being
evacuated.
After sufficient flushing for hours together, the needle valve is opened such that
the gas to be analysed enters the chamber at a pressure of order 10-5
mbar. Again to
remove traces of impurities that might be present inside the chamber, the chamber is
flushed with the gas to be analysed at pressure of order 10 -5
mbar for a couple of
hours. Since flushing process takes time hence the entire process of taking a mass
spectrum becomes time consuming.
Then the RGA is turned on and then the filament is switched on, such that it heats
up. The RGA is operated via a computer interface where mass spectra data is collect-
ed. A typical mass spectrum is shown below where X-axis corresponds to mass by
charge ratio in atomic mass unit and Y-axis corresponds to the ratio of pressure at a
particular m/e to the total pressure represented in terms of percentage.
3.6.3 Procedure for analysis of gases using RGA
The vacuum pressure at maximum (closing all the valves) should reach about
1.2 × 10⁻⁸
mbar. The RGA system is connected to PC via the RS232C and then the
filament is switched on and set the mode as histogram and the scan parameters stop
mass to 150 (since SF6’s molecular mass is 146). Start the scan, set the ‘analyse’

- 76 -
window (In utilities) on the screen so that you can analyse the gases present in it. Af-
ter every 10 scans save the ASCII data (In file) for analysis. Save at least four to six
ASCII data [about 50 to 60 scans].The ASCII data gives all the masses (150 masses)
versus its partial pressures. Create an excel file and import the ASCII data [It will give
you partial pressures of all the 150 masses]. Normalize each mass pressure with total
pressure (sum of partial pressures). For example, if total pressure = 1.2 × 10⁻⁸
, partial
pressure for a mass number = 3 × 10⁻⁹
. Then the normalization = (3 × 10-9
×100) / 1.2
× 10-8
. Normalize each mass pressure with highest partial pressure. Plot molecular
mass Verses percentage of gases in actual normalization and highest gas normaliza-
tion. For each of the gases the cylinders are connected and gases are flushed for about
2 hours and the vacuum pressure obtained is in the range of 2.2 × 10⁻⁵
to 5.4 × 10⁻⁵
.
3.6.4 Results of gases analysis
The RGA analysis results of (a) R134a gas, (b) I-butane and (c) SF6 gases in
the pure form directly obtained from the cylinder(s) are shown in Figure 3.13, Figure
3.15, and Figure 3.17. As per the National Institute of Standards and technology
(NIST) Chemistry web book reference [101], the plots for R134a and I-butane are
shown in Figure 3.14, Figure 3.16 and the RGA spectrum for SF6 is available in the
Library of the SRS system itself so we have used the for analysis and comparison. It
is shown in
Figure 3.18 and all are normalized plots. The results for the 3 gases are summarized
in, Table 3.3, Table 3.4 and Table 3.5 which shows the complete breakdown fragment
of each gas. There is good correlation between the two plots except for addition of
moisture seen in the acquired plots.

- 77 -
3.6.4.1 RGA spectrum of R134a gas
Figure 3.13: RGA spectra of R134a gas
As per NIST (Chemistry web book) the spectrum is considered for cross-checking
Figure 3.14: RGA Spectrum as per NIST Chemistry web book
Normalised mass spectrum of freon without background
0
5
10
15
20
25
30
35
40
45
50
55
60
65
70
75
80
85
90
95
100
0 5 10 15 20 25 30 35 40 45 50 55 60 65 70 75 80 85 90 95 100
105
110
115
120
125
130
135
140
145
150
Molecular masses(m/z)
% o
f com
poun
ds

- 78 -
Table 3.3: R134a (CH2FCF3) Fragments
3.6.4.2 RGA Spectrum of I-butane
Figure 3.15: RGA I-butane pure gas spectrum
Actual
Percentage
Normalized
percentage
Normalized
PercentageNIST
(w/o
background)
(with
background)
(w/o
background)Library
33 CH2F 52.52 51.37 100 95.42 47.1
69 CF3 18.7 18.24 35.69 33.85 NA
83 C2H2F3 6.31 6.1 12.1 11.24 64.6
31 CF 5.26 4.46 10.019 6.84 12.8
51 CHF2 4.43 4.17 8.454 7.37 100
63 C2H2F2 1.53 1.38 2.9 2.35 NA
32 CFH 2.14 1.52 4.07 1.64 8.3
Molecular mass Fragments
Actual
Percentage (with
background)
Normalised mass spectrum of Isobutane without background
0
10
20
30
40
50
60
70
80
90
100
0 5 10 15 20 25 30 35 40 45 50 55 60 65 70 75 80 85 90 95 100 105 110 115 120 125 130 135 140 145 150
Molecular masses(m/z)
% o
f co
mp
ou
nd
s

- 79 -
Figure 3.16: RGA for I-Butane Spectrum as per NIST Chemistry web book
3.6.4.3 RGA spectra of gas mixture
In the CLS, the R134a, I-butane and SF6 gases are mixed in fixed proportions and
are flown through RPC. The RGA spectrum is obtained using one of the outputs con-
nected to RGA system via fine tune needle valve (to attain a stable low pressure). The
output will be always going through a bubbler ensuring flow of gas. Also we have
collected the spectra of gas coming out of RPC, with similar arrangement. The nor-
malised plots are shown in Figure 3.19 and Figure 3.20 are expected and calculated.
We generated the mixed gas RGA (Calculated output) spectra from the known
mixing ratio of the gases, using individual pure spectra. It is well matching with the
Spectra collected gas (which is input to RPC). But it was not matching with the spec-
tra collected with gas which was coming out of RPC. Also the spectra of mixed gas
and RPC output gas are not matching in some mass number like 28, 18. The plots are
shown in Figure 3.21. The reason could be due to plastic tubing that is used for the
gas coming out of RPC and may be prone to moisture and air and also somewhere gas
may be leaking.
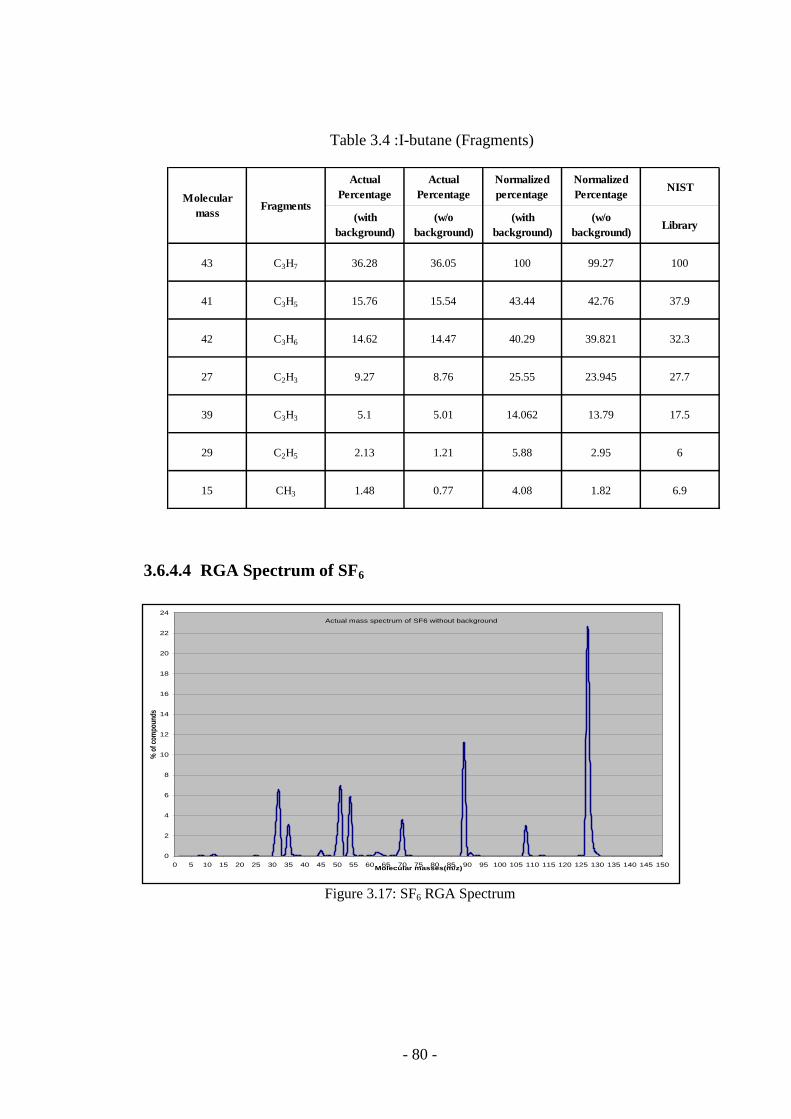
- 80 -
Table 3.4 :I-butane (Fragments)
3.6.4.4 RGA Spectrum of SF6
Figure 3.17: SF6 RGA Spectrum
Actual
Percentage
Actual
Percentage
Normalized
percentage
Normalized
PercentageNIST
(with
background)
(w/o
background)
(with
background)
(w/o
background)Library
43 C3H7 36.28 36.05 100 99.27 100
41 C3H5 15.76 15.54 43.44 42.76 37.9
42 C3H6 14.62 14.47 40.29 39.821 32.3
27 C2H3 9.27 8.76 25.55 23.945 27.7
39 C3H3 5.1 5.01 14.062 13.79 17.5
29 C2H5 2.13 1.21 5.88 2.95 6
15 CH3 1.48 0.77 4.08 1.82 6.9
Molecular
massFragments
Actual mass spectrum of SF6 without background
0
2
4
6
8
10
12
14
16
18
20
22
24
0 5 10 15 20 25 30 35 40 45 50 55 60 65 70 75 80 85 90 95 100 105 110 115 120 125 130 135 140 145 150Molecular masses(m/z)
% o
f com
poun
ds

- 81 -
Figure 3.18: RGA SF6 pure gas spectrum (SRS Systems Library)
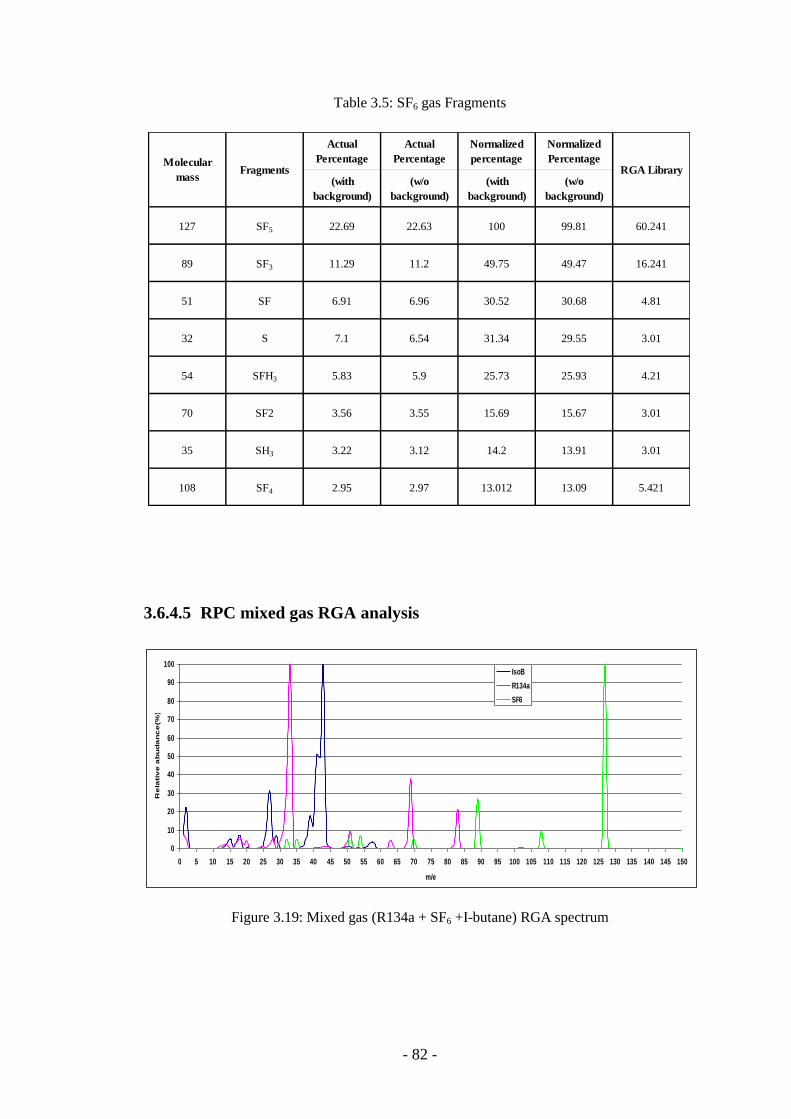
- 82 -
Table 3.5: SF6 gas Fragments
3.6.4.5 RPC mixed gas RGA analysis
Figure 3.19: Mixed gas (R134a + SF6 +I-butane) RGA spectrum
Actual
Percentage
Actual
Percentage
Normalized
percentage
Normalized
Percentage
(with
background)
(w/o
background)
(with
background)
(w/o
background)
127 SF5 22.69 22.63 100 99.81 60.241
89 SF3 11.29 11.2 49.75 49.47 16.241
51 SF 6.91 6.96 30.52 30.68 4.81
32 S 7.1 6.54 31.34 29.55 3.01
54 SFH3 5.83 5.9 25.73 25.93 4.21
70 SF2 3.56 3.55 15.69 15.67 3.01
35 SH3 3.22 3.12 14.2 13.91 3.01
108 SF4 2.95 2.97 13.012 13.09 5.421
Molecular
massFragments RGA Library
0
10
20
30
40
50
60
70
80
90
100
0 5 10 15 20 25 30 35 40 45 50 55 60 65 70 75 80 85 90 95 100 105 110 115 120 125 130 135 140 145 150
m/e
Re
lati
ve
ab
ud
an
ce
(%)
IsoB
R134a
SF6
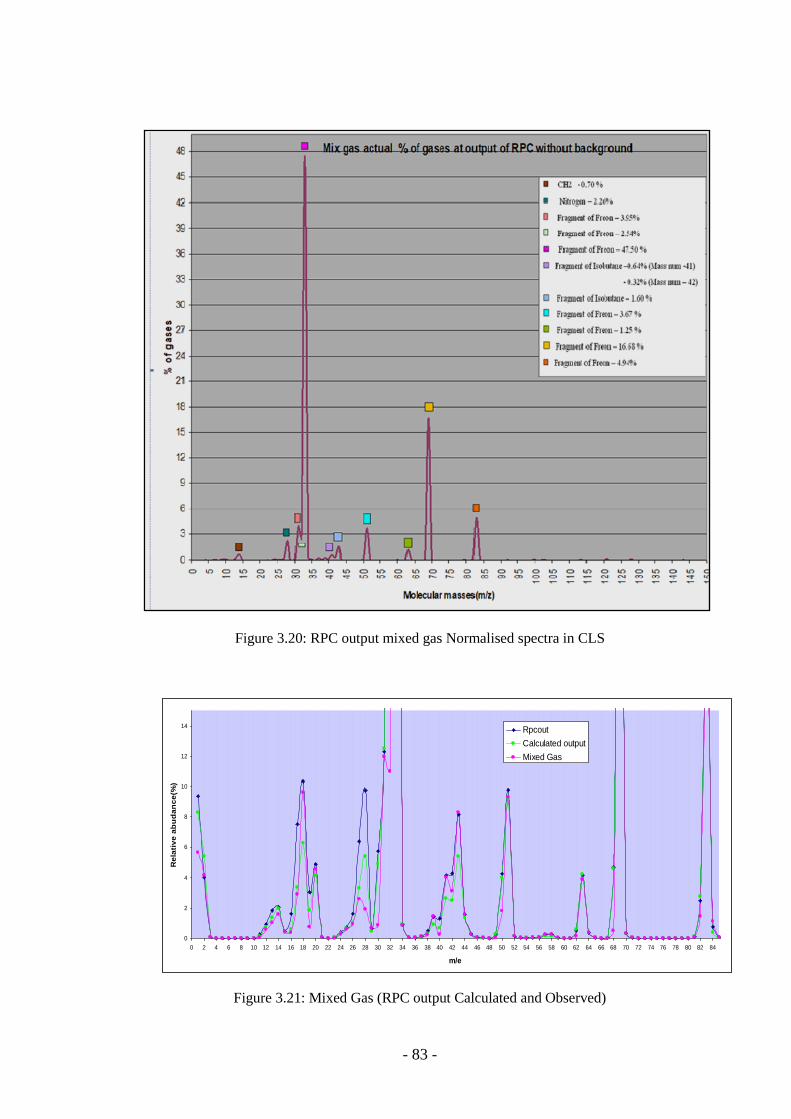
- 83 -
Figure 3.20: RPC output mixed gas Normalised spectra in CLS
Figure 3.21: Mixed Gas (RPC output Calculated and Observed)
0
2
4
6
8
10
12
14
0 2 4 6 8 10 12 14 16 18 20 22 24 26 28 30 32 34 36 38 40 42 44 46 48 50 52 54 56 58 60 62 64 66 68 70 72 74 76 78 80 82 84
m/e
Re
lati
ve
ab
ud
an
ce
(%)
Rpcout
Calculated output
Mixed Gas

- 84 -
3.6.5 Studies using “Sealed RPC”
The RGA was interfaced in the loop of the 4 RPC stacks of 4 RPCs in the CLS
and operated for the last several years. We have not observed any breakdown radicals
from the gas mixture in the CLS loop. The moisture level was found to increase grad-
ually, but the current and noise was found to be in acceptable range. This could be
attributed to the leakages in the plumping and flow rate.
Unlike the proportional counter, where the mixed gas is sealed inside the chamber,
the mixed gas is flowed inside the RPCs and is removed through the exhaust nozzles
continuously (there is no stagnant gas). An interesting result was observed when an
RPC was sealed (both input and output nozzles were closed after filling gas in it) and
the efficiency, current and noise rates (background noise signals) were monitored
round the clock for 4 months. Its efficiency was found to have declined from 90% to
over 80% over the period of 4 months. This decline in efficiency is attributed to de-
cline in gas mixture quality. Yet, no breakdown radicals were observed, during opera-
tion of 4 RPCs in a CLS for more than a year. One of the reasons could be due to the
low background rate and moreover the set flow rate may be lower than required.
3.6.6 RPC performance with gas mixture
a) The studies done by sealing the RPC output and the input, after filling it with a
mixing gas show that the efficiency of the detectors has not decreased substan-
tially over the period of 4 months. So fresh gas need not need be frequently
flushed or topped up in the system.
b) We need to monitor regularly the concentration of gas mixing ratio, gas flow
rate, bubblers, proper circulation, pressure variations, leaks etc. and the long
term reliability of cylinder exchanges, replacement or regeneration of molecu-

- 85 -
lar sieves, all safety parameters related to detectors, system leaks, working
place and working staff.
c) The periodic pressure changes in the atmosphere were addressed and the sys-
tem is successfully functioning over the last 4 years and the results are report-
ed here.
d) Using RGA 300 (Residual Gas Analyser-SRS make), a small scale mass spec-
trometer is hooked in the loop of gas flow in the CLS to monitor continuous
the gas coming out of the RPCs and the moisture content, concentration ratio
of the gas mixture, O2 etc. are studied in detail. Appropriate molecular sieves
are used in the purifier section in the CLS to remove and purify the impurities
like the moisture, O2 etc. The removal of N2 is not known and remains to be
solved. But, optimizing the leaks (air entering inside) in the CLS loop im-
proves the performance.
e) The flow rate of the gas mixture into the RPC is a very important parameter.
In the initial design of CLS system, the flow of few litres per minute (LPM)
was assumed and designed (as in the case of LHC experiments), several INO
glass RPCs were damaged as the flow set was of the order of few LPM. The
back ground rate for INO-ICAL at the underground will be very low and the
electrodes of the INO RPC, being a simple glass float a flow rate of few
SCCM was found to give satisfactory RPC performance results.
f) Some studies on the gas mixture and high voltage monitoring are described in
[93] which are not addressed by us so far.
g) The design feature and studies performed on CLS system may be used as
bench mark for future up-gradation and most of the thesis work pertains to this
work

- 86 -
Chapter 4
Experimental studies on flow resistors and
Simulation of gas flow inside an RPC
In this chapter, we describe the experimental studies on different flow resistors
namely the capillaries [102], [103] and simulations. We have fabricated various types
of capillaries to study the effect of capillary as a dynamic impedance element on the
differential pressure across RPC detector in a CLS. The simulations related to the pa-
rameters like the flow rate, gas distribution of the gas mixture inside an RPC and noz-
zle positions on the RPCs are studied on various platforms like Solid-Works, COM-
SOL and CDF are performed.
The performances of the RPCs depend on various parameters like environmental
conditions (such as atmospheric pressure, ambient temperature, humidity, radiation
etc.),[86], [104], [70], [105], [106] etc., flow rate of gas mixture into the RPCs, con-
centration or the composition of the gas mixture (which should be maintained
throughout the operation of an RPCs), quality of gas, the RPC input gas pressure, uni-
formity of conductive coating on the surface [12] uniform gas gap thickness, nozzle
positions, electrode thickness, ageing [31] etc. In the previous chapter the studies re-
lated to the purity of the gases, concentration of gas mixtures and analysis is ad-
dressed.
In this chapter, we have tried to address the optimum flow rate that would be re-
quired and type of flow limiting register that could be used suitable for the RPCs
without deteriorating the performance in a CLS environment.

- 87 -
4.1 Experimental studies with Capillaries
The problem of balancing the flow of gas mixture into the RPCs using a flow re-
sistance viz. capillary is done. Several different sizes of capillaries are fabricated and
studied so that the optimum dimension of capillary that could be used in the RPC tray
in the final ICAL. In the following, we describe the design and test carried out with
different types of capillaries and their behaviour with different gases.
4.1.1 Design of capillary and testing
A capillary tube is a long, narrow tube of constant diameter and acts as a flow lim-
iter and majoring the chamber impedance so as to make the individual flow independ-
ent on the chamber impedance. The capillary is used in medical applications and
widely used in gas detectors in large experiments like CMS and ATLAS at CERN.
The capillary acts like high impedance source in an electrical system, where the pres-
sure drop is analogous to the voltage and the flow to current. It obeys a linear rela-
tionship. Therefore, if we need to supply uniform flow into multiple RPCs from a
common source (manifold) which is at high pressure, then a capillary at the input of
each RPC would act like a high current source and the flow would be uniform in all
RPCs having different impedances (due to the different lengths of tubes connecting
them at the input).
A standard flow of 6 SCCM is being used based on the study done so far, corre-
sponding to about one volume change per day with a safe differential pressure of 2.5
mbar across the input of an RPC.
Started fabricating the first capillary, assuming the input pressure to be 1.002 bar
abs (which is a requirement of MFC used in the CLS), the length of stainless (SS)
tube to be 2500 mm, pressure difference required to be say about 2.5 mbar for a flow
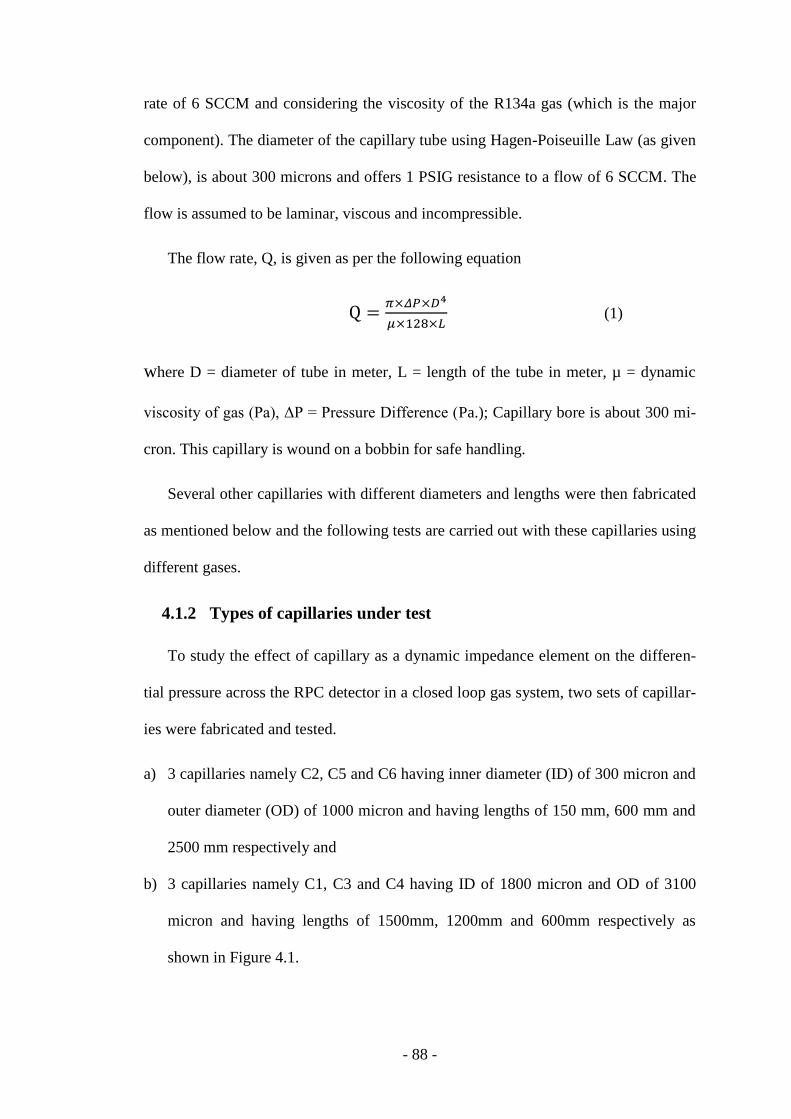
- 88 -
rate of 6 SCCM and considering the viscosity of the R134a gas (which is the major
component). The diameter of the capillary tube using Hagen-Poiseuille Law (as given
below), is about 300 microns and offers 1 PSIG resistance to a flow of 6 SCCM. The
flow is assumed to be laminar, viscous and incompressible.
The flow rate, Q, is given as per the following equation
Q =𝜋×𝛥𝑃×𝐷4
𝜇×128×𝐿 (1)
where D = diameter of tube in meter, L = length of the tube in meter, µ = dynamic
viscosity of gas (Pa), ΔP = Pressure Difference (Pa.); Capillary bore is about 300 mi-
cron. This capillary is wound on a bobbin for safe handling.
Several other capillaries with different diameters and lengths were then fabricated
as mentioned below and the following tests are carried out with these capillaries using
different gases.
4.1.2 Types of capillaries under test
To study the effect of capillary as a dynamic impedance element on the differen-
tial pressure across the RPC detector in a closed loop gas system, two sets of capillar-
ies were fabricated and tested.
a) 3 capillaries namely C2, C5 and C6 having inner diameter (ID) of 300 micron and
outer diameter (OD) of 1000 micron and having lengths of 150 mm, 600 mm and
2500 mm respectively and
b) 3 capillaries namely C1, C3 and C4 having ID of 1800 micron and OD of 3100
micron and having lengths of 1500mm, 1200mm and 600mm respectively as
shown in Figure 4.1.

- 89 -
Figure 4.1: Capillaries C2, C5 and C6 of 300 microns C1, C3, and C4: 1800 micron
4.1.3 Experimental Setup
A simple AURDINO microcontroller is used having open ended source. The ex-
perimental setup is as shown in Figure 4.2 and as seen in the block diagram, under
observation test, there is a provision to connect different capillaries and if required an
RPC can be connected in lieu of capillary to measure the differential pressure. The
components in the loop are two Mass Flow Controllers (MFC), differential pressure
sensors and a microcontroller (Arduino-Uno) board with an add-on 16 bit ADC (ADC
1115), interfaced via USB to a computer.
The studies are performed by flowing 3 gases namely C2H2F4 (R 134a), C4H10 (I-
Butane) and SF6 (Sulphur hexafluoride) into the capillary and measuring the pressure
across set flow. The data is recorded at a rate of (17 to 20) samples per second in a PC
operated in the Linux platform.
We had two old MFCs of Tylan make, having full scale of 45 SCCM meant for
nitrogen gas. The minimum operating pressure is 2 bar abs and one of them is used at

- 90 -
the input, to set and control of the flow of gas and it is called as the control MFC,
while the second MFC function is to read only and hence we call it a meter MFC at
the output of the capillary. The two MFCs are calibrated using water displacement
method for each of the gas and a typical calibration plot for SF6 gas is presented in
Figure 4.3. It is seen from the calibration plot that a flow of 10 SCCM (nitrogen gas)
corresponds to 2.69 SCCM for SF6 gas as the MFC is meant for nitrogen, while being
used for SF6 etc. A factor of 0.26 needs to be considered for SF6 and similarly the cal-
ibrated factor are 0.25 and 0.28 for I-butane and R134a respectively.
We started the experiment with a pressure sensors namely (a) XLdp, Ashcroft
made, which is a diaphragm based, having a differential pressure range of ± 61.3
mbar with a current output of (4 to 20) mA and having a resolution of ± 0.005 mbar.
At a later stage we have used SM5852, Silicon Microstructures Inc. make, a fully am-
plified, and calibrated and temperature compensated sensor and having a range of ±
100 mbar, with full scale of 0.5 volts to 4.5 volts (amplified digital output) with a res-
olution ± 0.1 mbar. The second pressure sensor had to be used due to the limitation in
the range of the first one, as it was getting saturated beyond the range as seen in the
plot Figure 4.4, which also shows the I-butane gas behaviour with different capillary.
4.1.4 Ohmic law for pressure versus flow
The Ashcroft made sensor has an out current of (4 to 20) mA and using a multi
meter the current is recorded against each flow rate set, and in parallel the current val-
ues measured by converting the same current by (RCV420) to voltage and calibrated
to differential pressure are noted. The equivalent current read value(s) to the pressure
difference value is plotted in the same Figure 4.5, which is a linear plot and also fol-
lows the equivalent Ohmic law for pressure versus the flow.
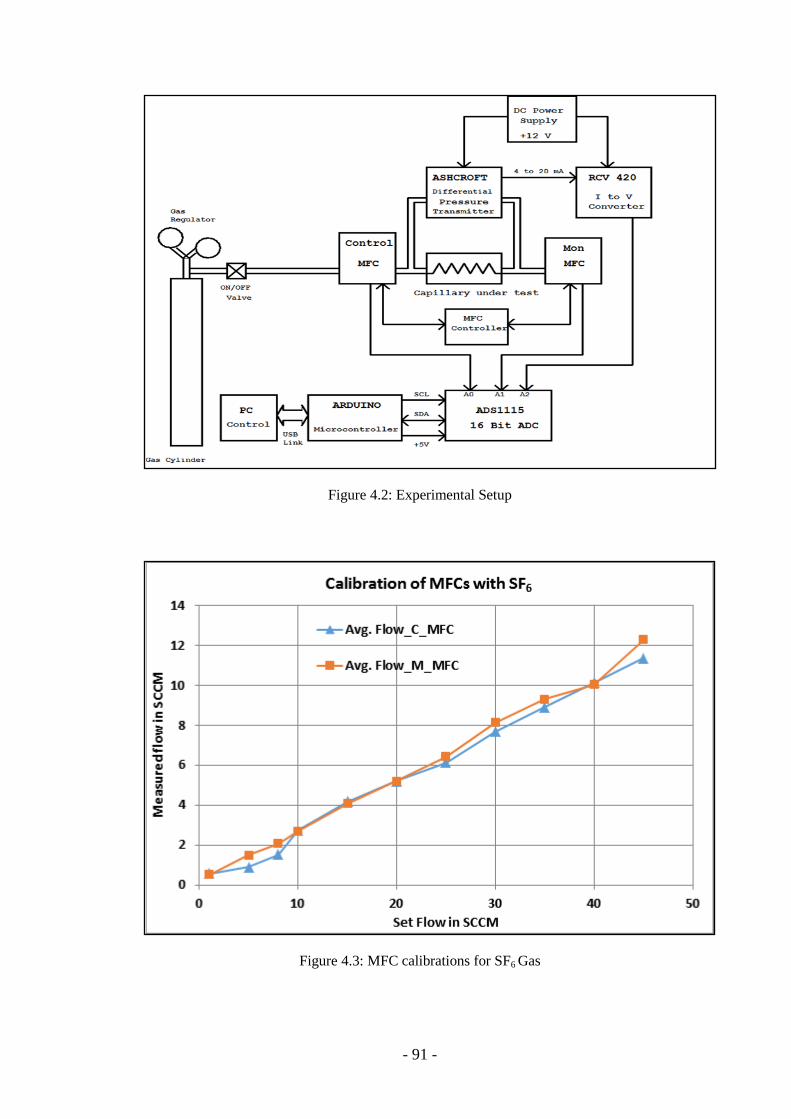
- 91 -
Figure 4.2: Experimental Setup
Figure 4.3: MFC calibrations for SF6 Gas

- 92 -
Figure 4.4: Results with Ashcroft Differential Pressure Sensor
Figure 4.5: Flow to current relation using Ashcroft Pressure Sensors

- 93 -
Figure 4.6: Capillary C2 Results with R134a, I-butane and SF6 gases
Figure 4.7: Capillary C5 Results with R134a, I-butane and SF6 gases

- 94 -
4.1.5 Flow rate versus pressure difference
In the Figure 4.6, it is seen that, I-butane which has the lowest viscosity among the
three gases produces the lowest pressure drop for a given flow rate. The same results
are observed in Figure 4.7 and Figure 4.8 that the dependency of the viscosity of the
gases with capillaries C2, C5 and C6 which are having same diameter (300 micron),
but of different lengths.
The longest capillary C6, which is wound on a bobbin, shows ideal performance
and could be the most suitable one for INO RPCs where the flow rate is about 6
SCCM; it can function well for the increased flow rate to 25 SCCM. But if space is to
optimised then C2 and C5 could also be used which will have less impedance and
higher flow than C6.
The capillaries C1, C3 and C4 did not show any pressure difference at low flow
rates of few tens of SCCM are not suitable when these are to be used for impendence
matching.
Figure 4.8: Capillary C6 Results with R134a, I-butane and SF6 gases

- 95 -
4.1.6 Measurement of pressure difference across an RPC
To study the pressure drop across the RPC for given flow rate, a RPC of (1 × 1)
m2 in lieu of capillary (as shown in the setup) is connected. An input flow rate of 6
SCCM was applied to the RPC under test and it was observed that, the output flow
rate reached the input in few tens of seconds. The pressure drop of about 0.1 mbar
across the RPC was observed. The input nozzles have a termination on the side spacer
of an RPC with an opening of [(0.7 mm) height × 2.55 mm width × 11 mm length],
which would give a resistance to the flow inside the RPC gap. But looks this termina-
tion has marginal effect of the capillary.
4.1.7 Flow balance in a multiple RPCs
It is observed from our studies of the RPC stacks that, with a flow rate of 6 SCCM
per RPC and using capillary of 300 µ and of length 600 mm, the performance parame-
ter like the noise rate and current are stable over a long period several years.
The noise rates for one strips each from X-side and of Y-side of the latest data as
shown in Figure 4.9 and observed noise rate is about (100 to 150) per second. The
current drawn by the RPC is shown in Figure 4.10, which is about (100 to 150) nA
and the current are stable for six months. The flow rate of 6 SCCM per RPC is very
low by a factor, as compared to that of Bakelite RPCs at CERN and elsewhere and
may cause segregation of SF6 (heavy gas) in a CLS, whose concentration is very low
and hence a longer study may be needed.
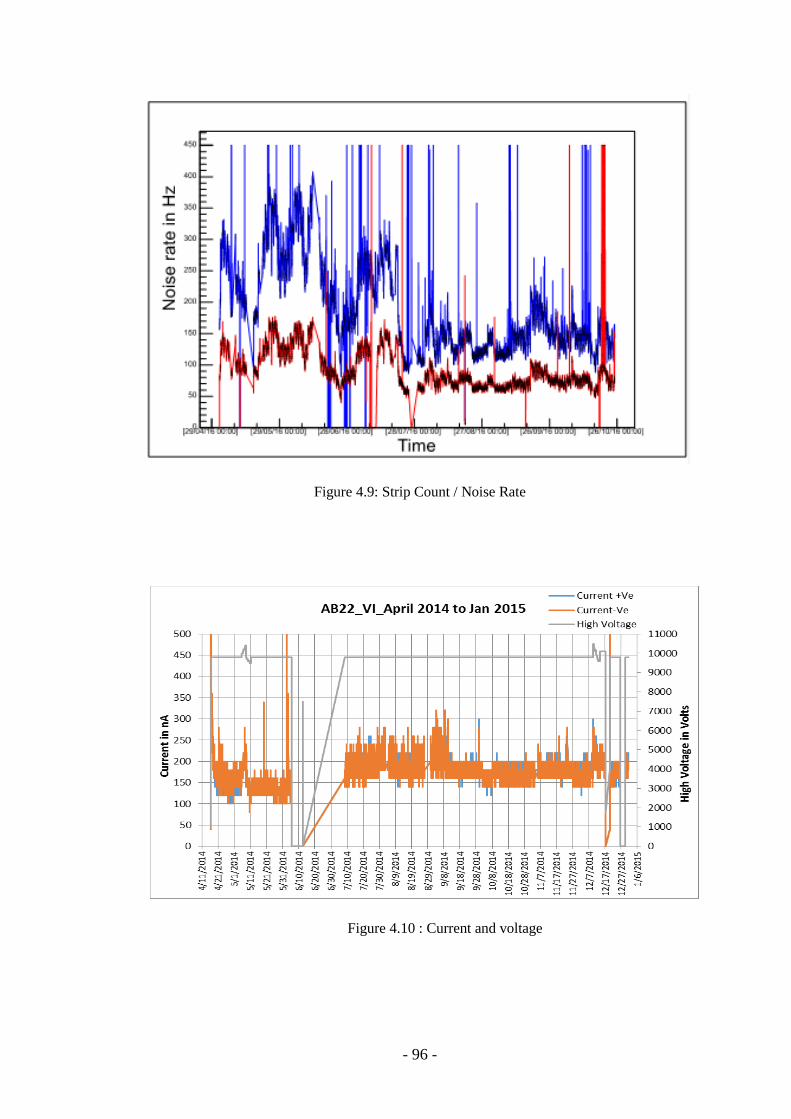
- 96 -
Figure 4.9: Strip Count / Noise Rate
Figure 4.10 : Current and voltage

- 97 -
4.1.8 Capillary Conclusion and Results
The function of flow resistor depends on the type of gas that flows through it. It is
very prominently observed that, higher the gas viscosity of the gas, then higher is the
pressure difference required across it. If the plot of flow rate versus pressure differ-
ence is linear then the slope is given by D4/(nL), if it is not a straight line then we
have to use the compressible fluid equation and the measurements of input and output
has to be on an absolute scale (barometric pressure). With the present setup it could
not have been possible to measure.
The flow through the capillaries namely C2, C5 and C6 is laminar and hence
obeys Poiseuille's principle for fluid and gases. The flow rate of 6 SCCM is in the lin-
ear region. In the present CLS, the capillaries C6 and C5 appear to be ideal and could
be used inside the RPC tray with a suitable design to accommodate them in an RPC
tray and multiple connections to match impedances of the different RPCs.
The RPC performance parameters,, the current and noise rates (back ground cos-
mic ray rate) are shown in Figure 4.9 and Figure 4.10 above are with the capillaries
C5 and C6 used in the loop.

- 98 -
4.2 Simulation studies for flow of gas distribution within an RPC
Some of the important parameters affecting the performance of an RPC are uni-
form flow of gas, gas distribution, gas purity inside the chamber, the nozzle positions
and the flow rate etc. The earlier studies have indicated [68] that the current drawn by
the RPC (chambers) can rapidly rise, if the amount of pollutants in the mixture in-
creases due to poor gas quality and breakdown radicals of gases etc. Also in reusing
of the gas in the CLS, there are several challenges to be addressed like gas purity (pu-
rifiers used) and concentration of the gas mixture which may vary with time. The gas
purity at the outlet need to be continuously monitored using gas spectrum analysers
and controlled through a set of gas purifiers. The estimate of progress of partial pres-
sure gradient of a gas mixture or the radicals generated over a period of time of transit
during process of detection. Hence a number of studies on controlling and optimisa-
tion of the gas flow through an RPC is required. Few of these parameters namely, the
flow rate or the velocity of gas inside the gas gap, position of the input and output
nozzles on the gap etc. are simulated and studied.
The simulation studies have been performed on the 3 platforms namely Solid-
Works, COMSOL and CDF (CFX) with different goals. Each of these packages has
some limitation and some benefits to some extent are exploited for the gas flow stud-
ies.
4.2.1 Objectives and Goals of simulation
a) To study the flow dynamics in the gas distribution system in order to ensure uni-
form gas flow in the entire chamber volume.
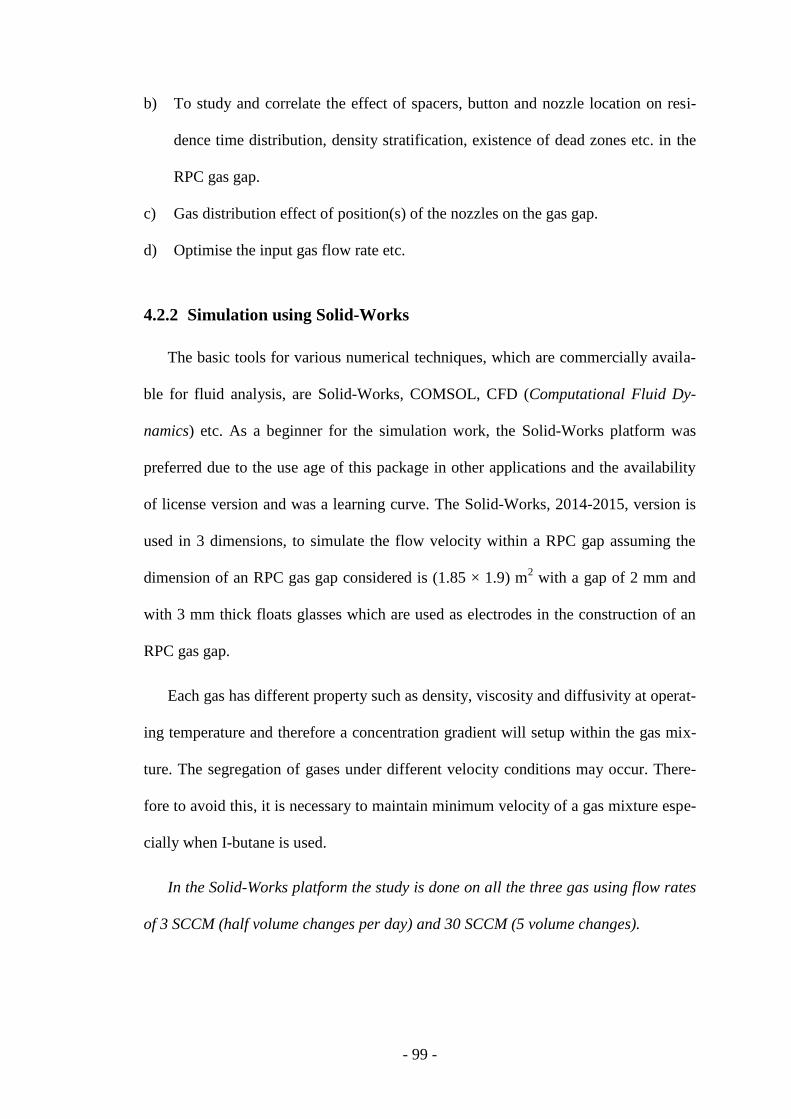
- 99 -
b) To study and correlate the effect of spacers, button and nozzle location on resi-
dence time distribution, density stratification, existence of dead zones etc. in the
RPC gas gap.
c) Gas distribution effect of position(s) of the nozzles on the gas gap.
d) Optimise the input gas flow rate etc.
4.2.2 Simulation using Solid-Works
The basic tools for various numerical techniques, which are commercially availa-
ble for fluid analysis, are Solid-Works, COMSOL, CFD (Computational Fluid Dy-
namics) etc. As a beginner for the simulation work, the Solid-Works platform was
preferred due to the use age of this package in other applications and the availability
of license version and was a learning curve. The Solid-Works, 2014-2015, version is
used in 3 dimensions, to simulate the flow velocity within a RPC gap assuming the
dimension of an RPC gas gap considered is (1.85 × 1.9) m2 with a gap of 2 mm and
with 3 mm thick floats glasses which are used as electrodes in the construction of an
RPC gas gap.
Each gas has different property such as density, viscosity and diffusivity at operat-
ing temperature and therefore a concentration gradient will setup within the gas mix-
ture. The segregation of gases under different velocity conditions may occur. There-
fore to avoid this, it is necessary to maintain minimum velocity of a gas mixture espe-
cially when I-butane is used.
In the Solid-Works platform the study is done on all the three gas using flow rates
of 3 SCCM (half volume changes per day) and 30 SCCM (5 volume changes).

- 100 -
4.2.2.1 Schematics of an RPC
A schematic diagram of a glass RPC gap, dimensions, components and the de-
tailed cross of a spacer used in simulation are shown Figure 4.11 (typical RPC), Fig-
ure 4.12 (actual dimensions of glass with chamfering shown), Figure 4.13 (poly car-
bonate components used for making a RPC-gap) and Figure 4.14 (side spacer dimen-
sions showing the hole of nozzle).
Figure 4.11: Typical RPC

- 101 -
Figure 4.12: RPC glass dimensions and position of Nozzle
Figure 4.13: Poly carbonate components for making RPC gas gap

- 102 -
Figure 4.14: Simulation parameters
4.2.2.2 Hardware details and Software assumptions
The basic components of an RPC gas gap are the float glass of 3mm thickness,
polycarbonate buttons of 2 mm thickness and of 11 mm diameter, the T-shaped side
spacers and gas nozzles. The geometry has been simplified for simulation purpose.
The float glass wall is assumed to be adiabatic and having roughness of 0.05 μ m. The
buttons that are placed inside the chamber at 200 mm spacing are considered to be
cylindrical of the exact height of 2 mm. The button height plays a crucial role in
maintaining the gap or thickness throughout the area of RPC gap, so that the applied
field is uniform. The side spacers are of T-type,these side spacers help in holding the
glass and act as sealants, so that the glass gap so formed has leak proof sealing, but
one can see that, the rectangular section only of T-side spacer comes in the contact of
gas, hence in modelling the spacers are considered to be rectangle. The two gas noz-
zles are placed for the entry and exit of gases. There are four in numbers and in lieu of

- 103 -
full nozzles the input rectangular holes are considered as two dimensional entry
points having nozzle end dimensions of 1.81 mm hole. The entry point position and the
orientation are identical to that of nozzle.
The gas mixture used is R134a, I-butane and SF6. The assumption considered is
that, the major concentration of gas mixture is R134a which is 95% and hence it
would replicate as a single gas for simulation purpose. The gas properties namely the
density and viscosity are considered. The boundary conditions used are the flow rate
at the input taking into consideration the volume changes that would take place for an
RPC. Since the laboratory where the RPCs are used, is maintained at a controlled
temperate and pressure, the base thermodynamic parameter like pressure is taken to
be 1 bar abs and temperature as 240
C, for all simulation purposes.
A 3D simulation is done and assuming flow is symmetrical about the mid plane in
Y-directions that is the thickness and taking into consideration the configuration of
the PC used for number crunching and flow calculation, the fluid cells are numbering
to 10813 and partial cells are 1024515. The number of iterations done is about 214 for
each set of calculations a symmetry condition is applied to the mid plane in the Y-
direction i.e. the width of gap (2mm).
4.2.2.3 RPC performance parameter
The desired performance of an RPC are (a) detection efficiency of about 97-98%
(b) time resolution of about 2 nanosecond and spatial resolution of less than 1 cm and
the low leakage currents of few n A. (c) Long term stability over a long period. (d)
The breakdown radicals are produced during operation of RPC. The residence time of
the radicals within a gap is related to the drift and diffusion properties of gas flowing

- 104 -
inside an RPC. The least residence time for radicals is desirable for extended life
span of a RPC.
4.2.2.4 Function of each gas in an RPC
The R134a acts as a main ionization gas. I-butane gas helps in absorbing the sec-
ondary UV photons and SF6 helps in absorbing electrons and stops the streamer for-
mation. The quencher (i-C4H10) and electronegative (SF6) gases will help in contain-
ing the charge development and reducing the streamer probability, the more the I-
butane better is the performance, but more than 8 % is not permitted due to safety is-
sues. If the percentage of SF6 is increased to greater than 0.3 %, the noise rate gets
reduced and effectively the efficiency is also reduced and the time resolutions of the
RPC operation deteriorate. If R-134a concentration is reduced the efficiency and noise
rate is reduced and hence timing gets affected. Hence it is important that, the appro-
priate concentration of gases is to be maintained. The current increases, if the per-
centage of air (due to leakage) is more.
Therefore it is mandatory that the air must be completely displaced by the gas
mixture in the entire gap of the RPC detector. The concentration of I-butane should
not vary by few per-cents. The concentration of SF6 should not vary more than 1 %.
The optimized ratio of the gas mixture for ICAL glass RPC gap is 95.0:4.5:0.5 ,
R134a, I-butane and SF6 respectively to get the best performance of the RPC.
The gas mixture ratio is required to be maintained uniformly throughout the vol-
ume of the RPC detector. If any deviation is seen within localized area such as pock-
ets, then the performance would be affected in a localized area of RPC.

- 105 -
4.2.2.5 Interpretation of simulation Plots
The simulation has been carried out with following flow rates which are within
the ranges of operation. The flow trajectories have been plotted considering gas in the
pure form.
a) The flow studies with R134a with flow rate of 3 SCCM, 30 SCCM and at 300
SCCM are simulated. These are shown in Figure 4.15, Figure 4.16 and Figure 4.17
respectively.
b) The flow studies with I-Butane with 0.3 SCCM, 3 SCCM and 30 SCCM are
shown Figure 4.18, Figure 4.19 and Figure 4.20. The Swirls seen around the buttons
is shown in Figure 4.21.
c) Flow simulation for SF6 at 3 SCCM and 30 SCCM are shown in Figure 4.22
and Figure 4.23
d) The simulation studies performed by the CERN, CDF [68] team are shown in
Figure 4.24. This Figure is adapted from CDF data.

- 106 -
Figure 4.15: R134a at 3 SCCM
Figure 4.16: R134a at 30 SCCM
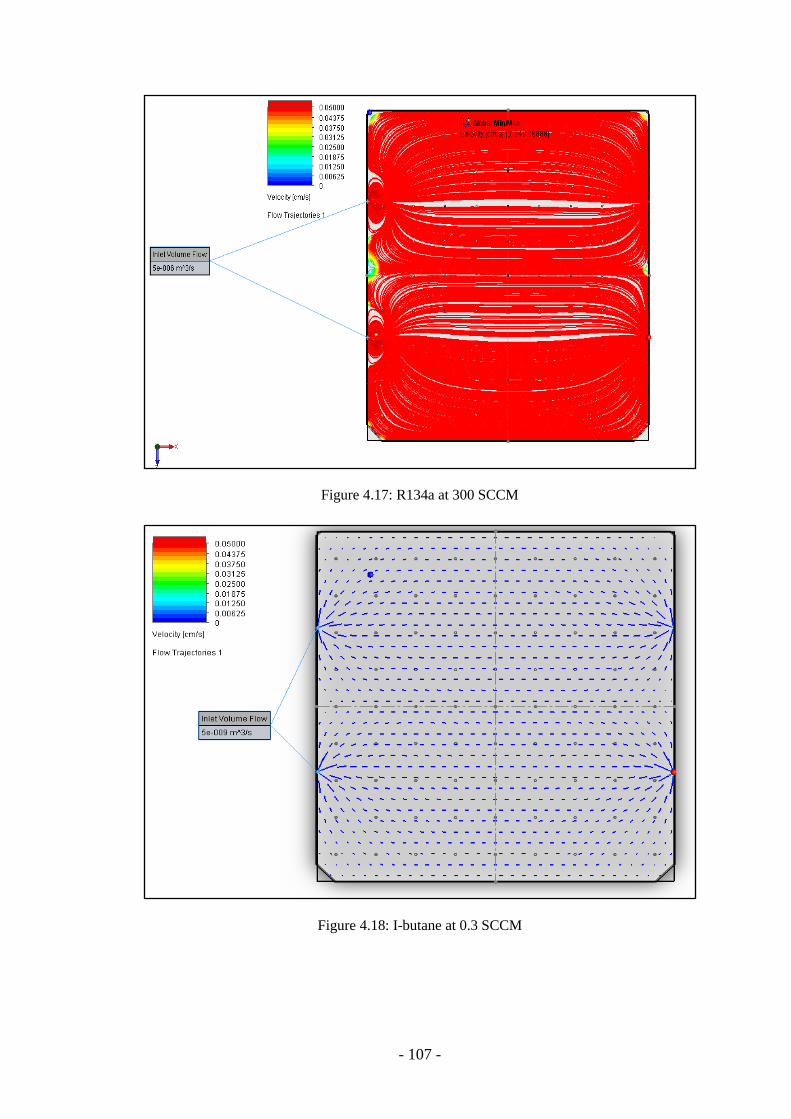
- 107 -
Figure 4.17: R134a at 300 SCCM
Figure 4.18: I-butane at 0.3 SCCM

- 108 -
Figure 4.19: I-butane at 3 SCCM
Figure 4.20: I-butane at 30 SCCM
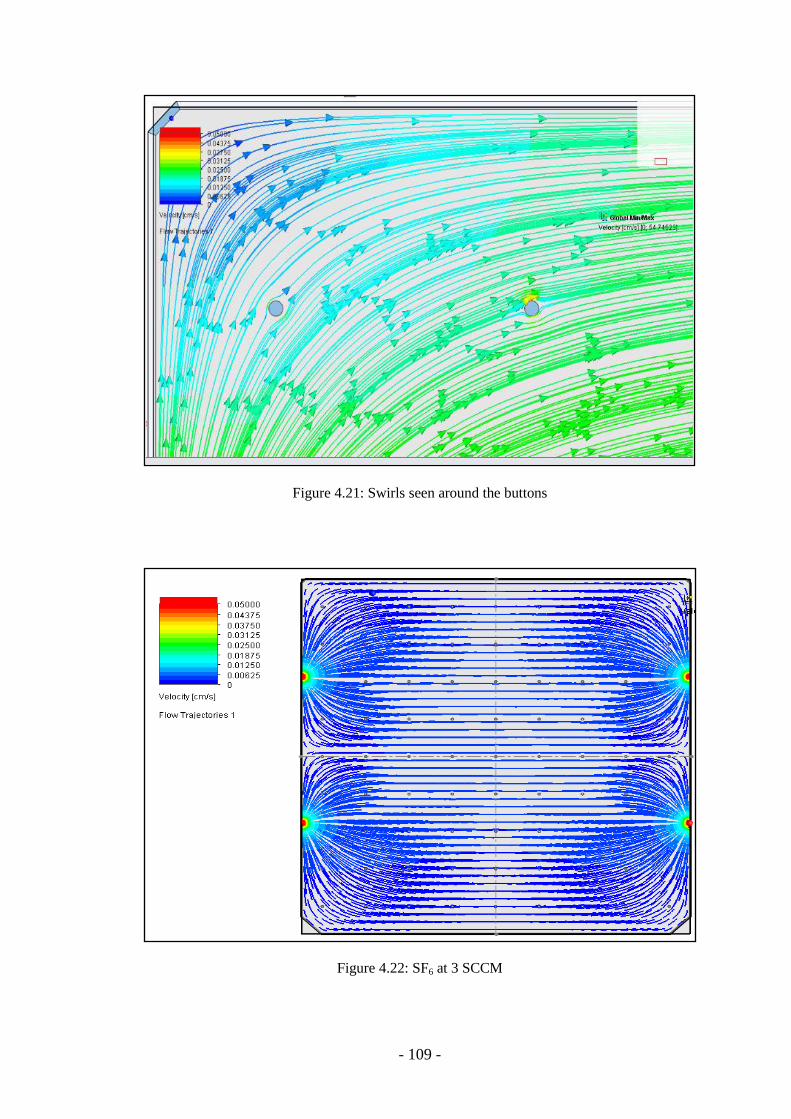
- 109 -
Figure 4.21: Swirls seen around the buttons
Figure 4.22: SF6 at 3 SCCM

- 110 -
Figure 4.23: SF6 at 30 SCCM
Figure 4.24: CERN CFD team flow distribution

- 111 -
4.2.2.6 Analysis and Comparison
The Dead Zones are observed on the four corners and on the surface of the gap
along the nozzles, where the flow of the gas is almost zero. For comparison of the ob-
served data with that of CERN data, following points are to be noted.
a) RPC size: CERN RPC is (1.3 × 2) m2, while INO RPC is (1.85 × 1.9) m
2
b) The nozzles for the CERN RPC are located at the corners and are 4, while that of
ICAL RPCs are located along the edges and are also 4.
c) The average velocity over large working area (nearly 70%) is 0.4 × 10⁻³
me-
ters/sec at flow rate of 6 to 10 SCCM, while for INO RPC it is between 0.1875 ×
10-3
and 0.3125 × 10⁻³
at 30 SCCM
d) The radiation intensity to which CERN RPC is subjected is many times higher
than for the INO RPC, hence CERN RPCs need large number of volume changes
of fresh gas per unit time. This requirement may not be strictly applicable with
ICAL RPC. The INO RPCs has glass as electrode while the CERN RPCs are of
Bakelite, therefore in view of low background radiations, the ICAL RPC can be
operated at flow rates much lower than CERN RPCs.
e) Hence a flow rate of less than 30 SCCM appears to be adequate for INO RPCs
under cosmic radiations.
4.2.2.7 3 SCCM flow rate of R-134a
a) The velocities all over RPC are in a range of 0.0625 × 10⁻³
m/sec to 0.1 × 10⁻³
m/sec.
b) Only very near the nozzles the velocities are in the range of 0.3 × 10⁻³
to 0.5 × 10⁻³
m/sec.

- 112 -
c) The average velocity over 90% of area is nearly (1/7th
) of the average velocity in-
side CERN RPC.
d) This flow rate will cause 1 volume change every 2 days. It will take about 3 to 4
volume changes for the RPC to become operative. Therefore to reduce the flush-
ing time 6 to 10 SCCM of flow rate is sufficient.
e) To supplement the leakages from RPC some excess flow is required to maintain a
concentration gradient.
Hence from the simulation studies, a flow rate of 6 to 10 SCCM gas mixture
may considered as optimum for a (1.85 × 1.9) m2 size RPC running under cosmic
radiation.
4.2.2.8 R-134a, I-butane and SF6
Maintaining the uniformity of gas mixture ratio’s within the RPC comparison be-
tween R-134a, I-butane and SF6 distribution at various flow rates. The SF6 and R-
134a flowing at 3 SCCM individually show the identical velocity of 0.06 × 10 e -3
m/sec distribution and therefore they will not undergo the separation.
4.2.2.9 Effect of buttons on the flow patterns
From the velocity plots Figure 4.21, it can be seen that,
a) The highly localised Swirls are caused by the buttons to the extent of causing
velocity in Z direction (along the width of the gap).
b) The magnitude of swirl velocity is 2 × 10⁻⁹
meters/ sec at maximum.
c) The swirl causes flow in Y direction
d) The magnitude of linear velocity in X – Z plane is 0.06 × 10⁻³
, which is nearly
104 times higher than the swirl velocity.

- 113 -
The swirl velocity is considerably low as compared to the linear velocity and
hence has no significant effect of drift or diffusion to alter the gas distribution.
4.2.2.10 Conclusions (Solid-works simulation platform)
The preliminary results show that, there are “Dead Pockets” (where the drift ve-
locity of gas is Zero) in the RPC detector. The time taken by the gas mixture to com-
pletely refill the dead zones will be longer for the larger dead zone. The Dead zones
can be smaller at high flow velocities of gas, but cannot be Zero. The same can be
used for validating the large scale models. A flow is a combination of drift and diffu-
sion (the drift is the movement of gas atoms caused by pressure difference and the
diffusion is the movement of gas atoms caused by concentration difference) and hence
a Dead zone may have contained small fraction of gas which has diffused.
a) The flow rates of 3 SCCM to 10 SCCM are adequate to initiate the RPC in
reasonable time and sufficient to operate them under cosmic radiation condi-
tions.
b) The objects in the path of the gas flow such as nozzles, buttons do not cause
turbulent conditions at flow rates near 3 SCCM.
c) The “Reynolds’s Number” (Rd), a dimension less quantity and an important
characteristic of fluid under motion using the following formula:
Rd = (Density of fluid × Velocity of Fluid × diameter of pipe)/Dynamic Vis-
cosity.
Then, in the case pipe diameter is 2 mm i.e. gap between glasses. The calcula-
tions show that, the Reynolds Number for all gases between 0.06 to 6.0 for
flow rates between 0.3 SCCM to 30 SCCM is less than 2500 and hence the
- 114 -
flow pattern is considered as Laminar and NOT Transient (2500 to 3000) or
Turbulent (above 3500)
d) The Separation of gases does not take place even in the dead zones at flow
rates of 3 SCCM or more. The flow rate of 4 to 9 SCCM can be simulated to
find the precise flow rates required to operate RPC under optimum conditions.
e) Improvement in gas nozzle design, simulations of scaled up version of RPC to
provide final recommendation for design of internals of an RPC.
4.3 Simulation using COMSOL
The Simulation is also done on a platform of COMSOL Multiphysics® version
5.1 in 2 dimensions, to study the flow velocity of gas within a RPC gap with dimen-
sions are (1.85 × 1.9) m2
with a gap of 2 mm and assuming 3 mm as thick glass. The
emphasis on the simulation results are related to the (a) Transient flow pattern of gas
inside the RPC detector say form 0 second to 60 seconds using R-134a (R22) gas
(major component of a mixed gas). (b) Gas flow inside the RPC detector for small
flow rate few SCCM (velocity from 0.01meters/second to 0.18 metres/second), as the
glass RPCs are very efficient in low flow rate when the outside environment of opera-
tion has low radiation for the underground ICAL experiment, while in LHC-CMS it is
quite high due to collusion of photons and antiprotons.
The gas used in the simulation is R22 (assuming that the flow pattern would be
similar to R134a), as it was available in the library of COMSOL package. The major
concentration of gas mixture is Freon which is 95% and hence it would replicate as a
single gas for simulation purpose. The boundary conditions used are the flow rate at
the input taking into consideration the volume changes that would take place for an
RPC. As the laboratory is maintained at a fixed temperate and pressure the earlier

- 115 -
modules generated in Solid-Works platform are imported in the COMSOL and the
simulation is done in 2D and it is assumed that the flow is symmetrical about the mid-
plane in Y-directions i.e. thickness and taking into consideration.
A schematic diagram of the glass RPC gap dimensions considered are similar to
that used in Solid-Works.
4.3.1 Software tools and Criteria
The main objective is to conduct a simulation study and understand the gas flow
patterns inside an RPC chamber at low velocities and initial gas distribution profile.
The COMSOL platform is used in this analysis as this will give some cross verifica-
tion for the simulation work done earlier using Solid-Works and to decide for further
details studies if it can be used.
4.3.2 Interpretation of Graphs
The Part A of simulation consists of plots showing Flow lines called ‘Iso-flow’ for
from (5.45 to 60) seconds. An Iso-flow is defined as a line joining points of equal
magnitude of gas velocities in a 2D plane or 3D space, bunched to form a particular
range flow velocity. A single component gas flow is introduced at time t=0 into the
gap. The subsequent development of Iso-flow lines through different part of the gap
after a period starting from t = 5.45 sec. to t = 60 sec are reported here and simulation
results are shown in Figure 4.25 for 5.45 seconds, Figure 4.26 for 32.72 seconds and
Figure 4.27 for 60 seconds.
The distribution of gases after introduction through the inlet nozzle is under study.
This is important from many points such as how each component of gas mixture is
going to develop its partial pressure over a period of time from inlet to the outlet of
the detector.
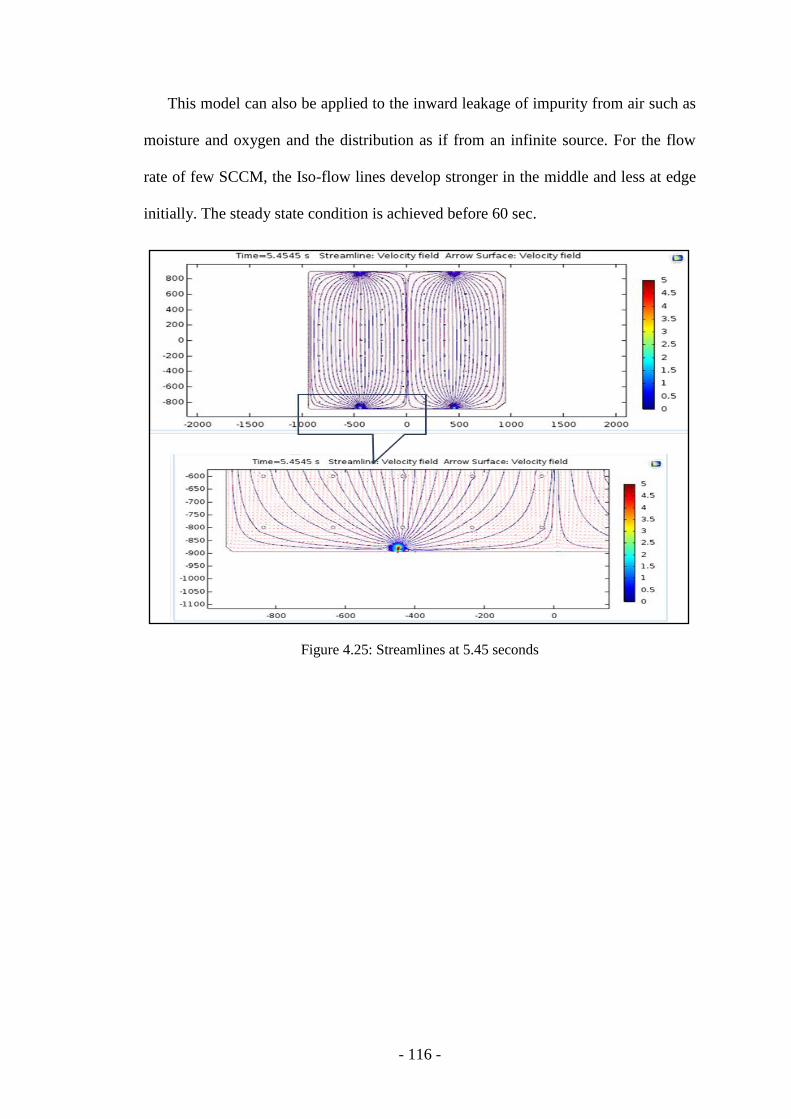
- 116 -
This model can also be applied to the inward leakage of impurity from air such as
moisture and oxygen and the distribution as if from an infinite source. For the flow
rate of few SCCM, the Iso-flow lines develop stronger in the middle and less at edge
initially. The steady state condition is achieved before 60 sec.
Figure 4.25: Streamlines at 5.45 seconds

- 117 -
Figure 4.26: Streamlines at 32.72 seconds
Figure 4.27: Stream lines velocities at 60 seconds
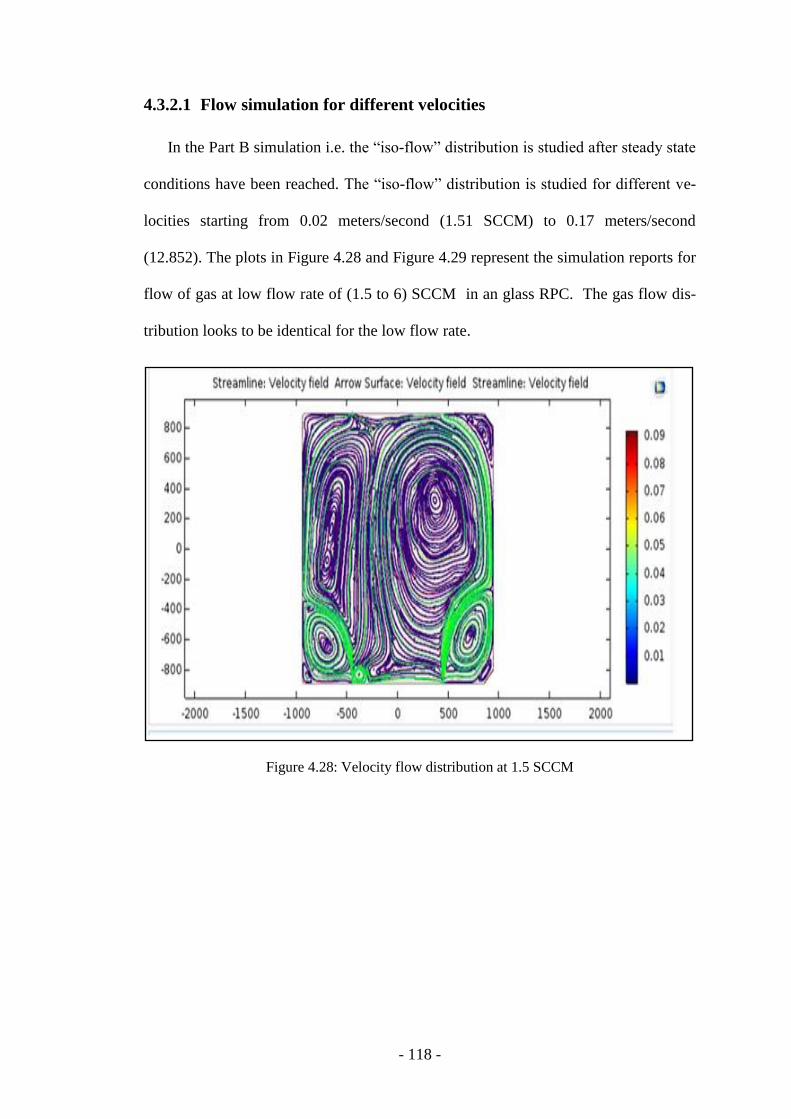
- 118 -
4.3.2.1 Flow simulation for different velocities
In the Part B simulation i.e. the “iso-flow” distribution is studied after steady state
conditions have been reached. The “iso-flow” distribution is studied for different ve-
locities starting from 0.02 meters/second (1.51 SCCM) to 0.17 meters/second
(12.852). The plots in Figure 4.28 and Figure 4.29 represent the simulation reports for
flow of gas at low flow rate of (1.5 to 6) SCCM in an glass RPC. The gas flow dis-
tribution looks to be identical for the low flow rate.
Figure 4.28: Velocity flow distribution at 1.5 SCCM

- 119 -
Figure 4.29: Velocity flow distribution at 6SCCM
Figure 4.30: Velocity magnitude showing unequal flows

- 120 -
4.3.2.2 Velocity magnitude
In the Part C simulation, the surface height velocity magnitude plot is shown in
Figure 4.30. There are two inputs gas nozzles and two output nozzles and it looks that
the flow of gas reaching at both the output nozzles is different and to verify this an
experimental is performed.
4.3.3 Experimental Setup
To verify the simulation result (velocity magnitude plot) that the flow of gas is
more in one of the output nozzles of the RPC gap, the following experimental setup
was done:
Figure 4.31: Experiment setup to study the flow of gas at the output nozzles
The experimental setup is shown in Figure 4.31. The RPC gap under test is a
(1 × 1) m2 gap having two inputs and two outputs and the R-134a gas is used. The
MFC flow is set as per the composition of gas (from few SCCM to tens of SCCM) to
the RPCs under test. The gas flows through the RPC and then moves into the bubblers
connected at the output. The tube lengths going to the input and output of the RPC
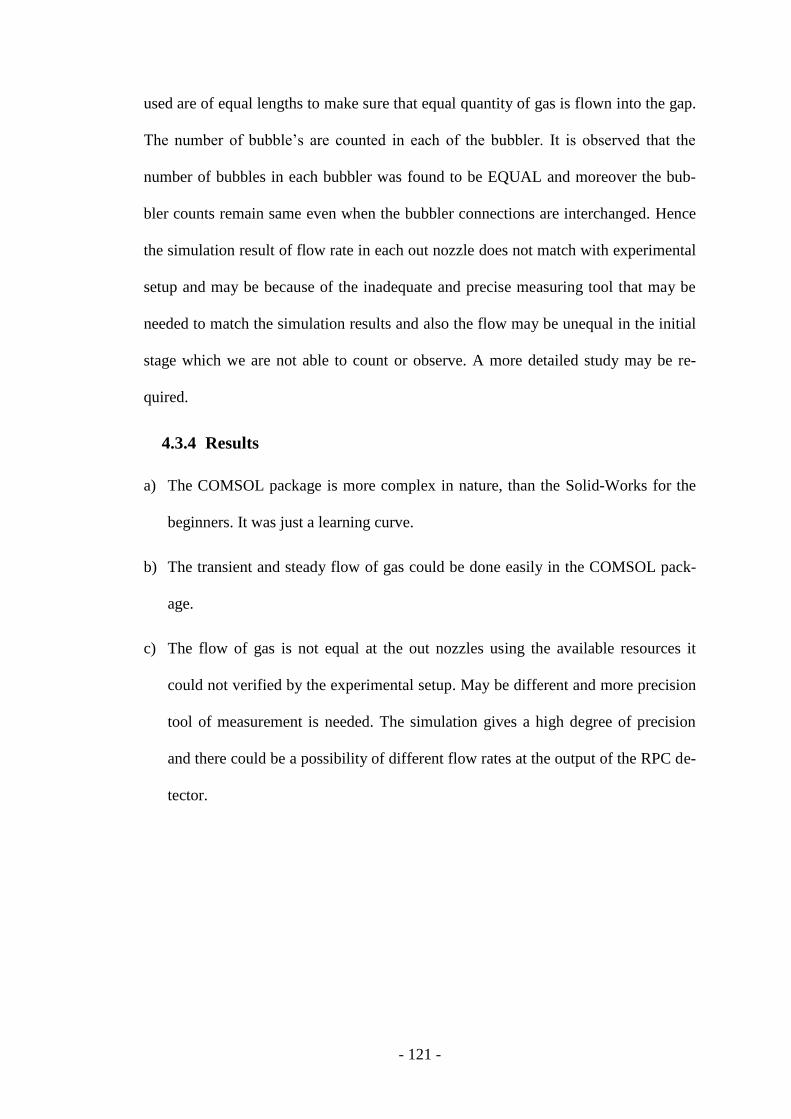
- 121 -
used are of equal lengths to make sure that equal quantity of gas is flown into the gap.
The number of bubble’s are counted in each of the bubbler. It is observed that the
number of bubbles in each bubbler was found to be EQUAL and moreover the bub-
bler counts remain same even when the bubbler connections are interchanged. Hence
the simulation result of flow rate in each out nozzle does not match with experimental
setup and may be because of the inadequate and precise measuring tool that may be
needed to match the simulation results and also the flow may be unequal in the initial
stage which we are not able to count or observe. A more detailed study may be re-
quired.
4.3.4 Results
a) The COMSOL package is more complex in nature, than the Solid-Works for the
beginners. It was just a learning curve.
b) The transient and steady flow of gas could be done easily in the COMSOL pack-
age.
c) The flow of gas is not equal at the out nozzles using the available resources it
could not verified by the experimental setup. May be different and more precision
tool of measurement is needed. The simulation gives a high degree of precision
and there could be a possibility of different flow rates at the output of the RPC de-
tector.

- 122 -
4.4 Simulation using CDF
In order to validate the studies done using so far and to incorporate the new di-
mensions, a study of the flow of the gases through RPC gas gap, using the CDF (CFX
/ FLUENT) is done by a team of members including a summer vacation project stu-
dent.
Some changes in the RPC dimension and position of the gas nozzles are imple-
mented due to design and space constraints. In the latest designs of RPC, nozzles are
not placed at the corner, but are placed on the one side (input nozzles) of the gap and
the outlet nozzles are on the opposite side of the RPC gap and they are placed in-
clined by 45°.
The CFX and FLUENT are the options for CFD analysis. The CFX solver is pre-
ferred, due to lack of time and the other advantage of the using CFX is the volume of
control is assembled around the nodes (cell vertex), where each element is divided in
sub volumes.
An RPC is constructed by using the latest dimension of (1.850 × 1.738) m2, the
sheets (resistive plates) of 3 mm thickness and a gas gap of 2 mm between glass
sheets which is maintained by button spacers of height 2 mm and diameter 11 mm and
are placed at distances of 200 mm along X and Y directions and the side spacers used
are of thickness of 2 mm, on the four edges to make glass gap. These buttons maintain
a uniform gap throughout the area of RPC gap, so that the applied field is uniform.
The elementary component of an RPC is the gas gap, the gas volume enclosed be-
tween two resistive plates. There are two inlets and two outlets for gas flow as shown
in the Figure 4.32 and Figure 4.33 for the top and bottom gap of an RPC respectively.
The top and bottom are different as the RPC gap is rectangular and the nozzles are
placed on the longer end and in opposite directions. The shows Figure 4.34 the details

- 123 -
of the chamfering of 4 side of RPC glass electrode. The inlet nozzles are 45 degrees
inclined clockwise, while the outlet nozzles are inclined at anti-clockwise 45 degrees.
The current design of RPC glass gap is referred as design 1.
4.4.1 Nozzle positions
Two design position of placing the nozzles are studied. The details of design 1 are
shown in Figure 4.32 and Figure 4.33 for top and bottom glass respectively. The dis-
tance between the left edges and left nozzle is lesser, compared to the distance be-
tween the right nozzle and the right edge. During the initial design of the RPC gap,
nozzle positions were different. In the design 2, the nozzles are placed in such way,
that the distance between the left nozzle and the left wall is equal to the distance be-
tween right nozzle and right wall and also the distance between two nozzles is twice
the distance between nozzle and the nearest wall.
The final design of ICAL may have a parallel flow for 4 RPCs with in a road,
from a common source of gas manifold.
4.4.2 Fluid Simulation
The previous simulation using COMSOL platform, was done for a single gas
which was for R22 (assuming it is equivalent of R134a for simulation purpose). In
present study, simulations are done for all the three gases individually that are being
(used in avalanche mode), for the mixed gas and then the nozzle position variation is
also considered. The inlet velocities for the gases are kept at 0.17 m/s (as it was kept
in the previous studies), 0.085 m/s (one fifth of 0.17) and 0.85(5 times of 0.17).
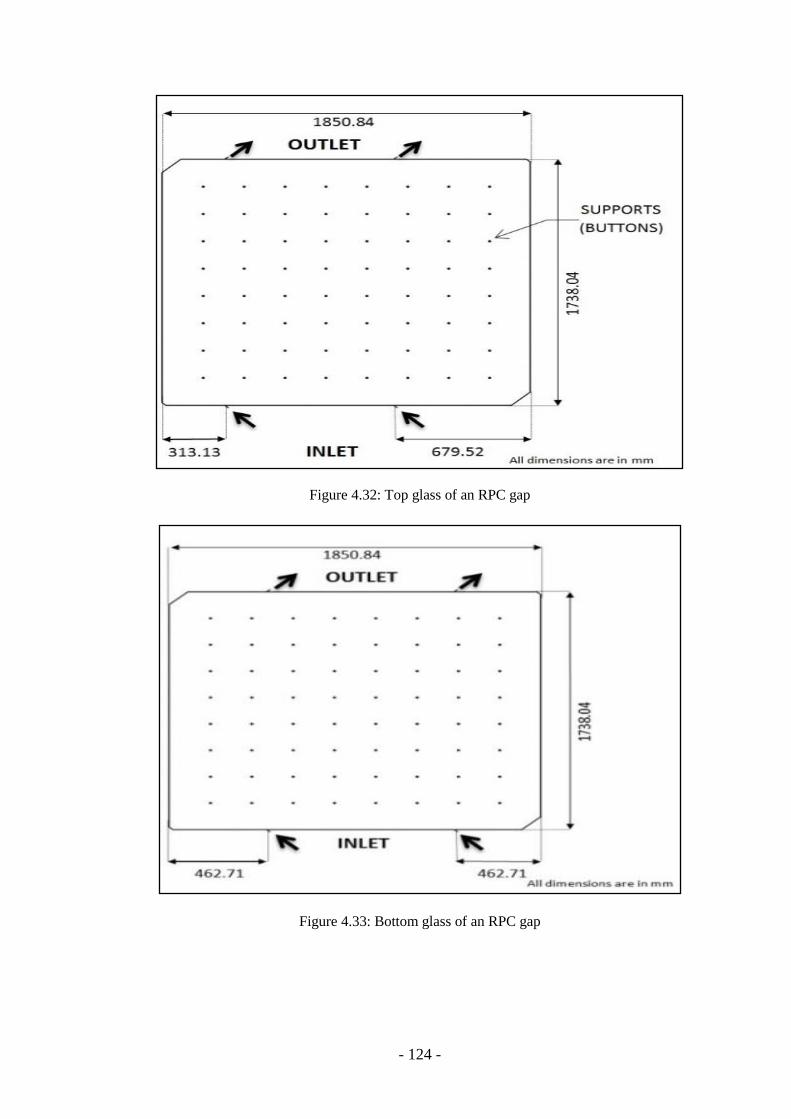
- 124 -
Figure 4.32: Top glass of an RPC gap
Figure 4.33: Bottom glass of an RPC gap
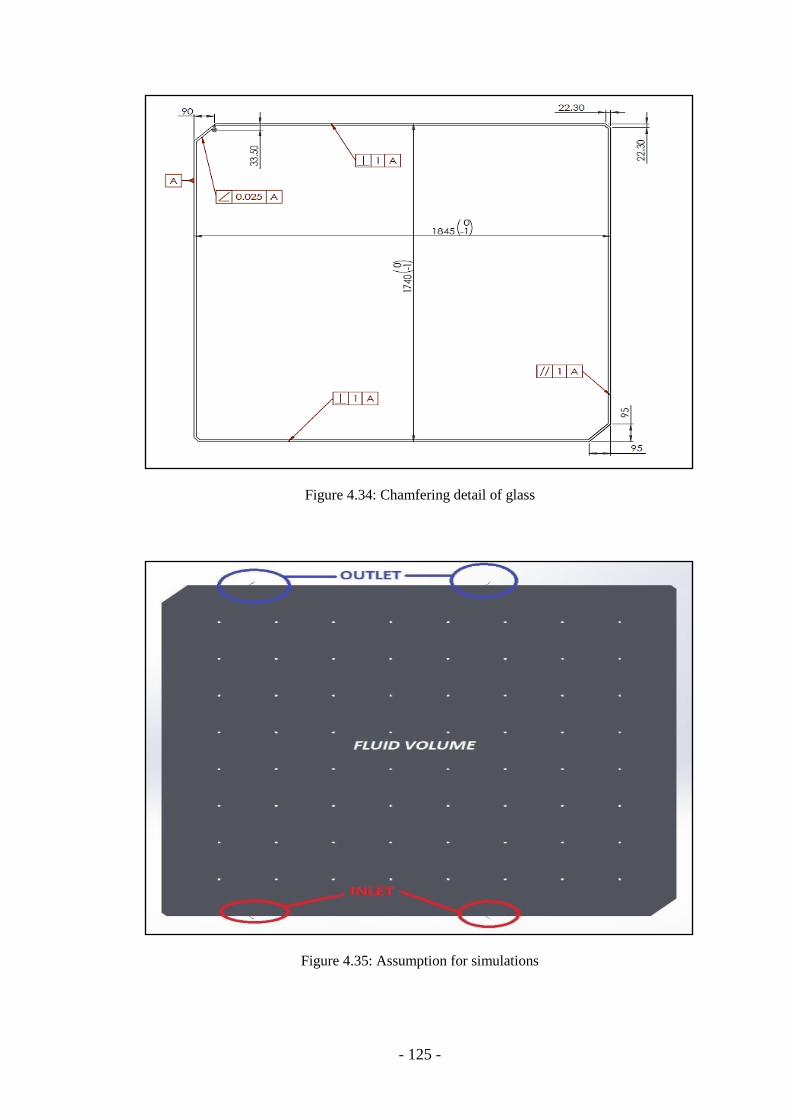
- 125 -
Figure 4.34: Chamfering detail of glass
Figure 4.35: Assumption for simulations

- 126 -
The nozzle angle is also considered. The mixed gas flow simulation for the flow
of 6 SCCM is considered. The fluid volume assumption is as shown in Figure 4.35.
4.4.3 Gas Simulation of R134a
The boundary conditions are
a) Inlet velocity of 0.85 m/s
For 25 litres / hour volumetric flow, velocity is kept as 0.85 m/s.
25 litres / hour = 25,000 cm3/sec
For one second the flow will be 25,000 cm3/3600 sec = 6.94444E-006 cm
3/sec
This is the flow through two nozzles, through one nozzle the flow will be
6.94444E-006 /2 cm3/sec = 3.47222E-006 cm
3/sec
Diameter of the inlet nozzle is 2.30 mm Therefore Area of the inlet is
𝜋 × (1.15 × 10⁻³)2 =4.15475E-006
Inlet velocity is
3.47222E−006 cm3/sec
4.15475E−006 m2 = 0.845𝑚/𝑠 (Aapproximately 0.85 m/s)
b) Inlet velocity of 0.17m/s
The initial velocity of 0.17 m/s (which is one fifth of the 0.85 m/s) the volumetric
flow will become one fifth and that is 5 litres / hour.
c) Inlet velocity of 0.085m/s
The velocity 0.085 meters /second is one tenth of the 0.85.The volumetric flow will
also be one tenth and will be 2.5 litres / hour

- 127 -
d) Outlet conditions applied
The outlet is defined as opening for all simulations and the gauge pressure is kept as
Zero bar abs.
4.4.3.1 Material Properties
Freon (R134a)
Molecular Weight - 102.03 g /mole
Density - 4.25 kg /m3
Dynamic viscosity - 11.6E-006 Pa.S
4.4.3.2 Inlet velocity of 0.17 m/s
a) With the residual of 10-4
: Velocity contour
b) With the residual of 10-6
:Velocity contour and streamlines
Figure 4.36: Velocity contour at 0.17 m/s
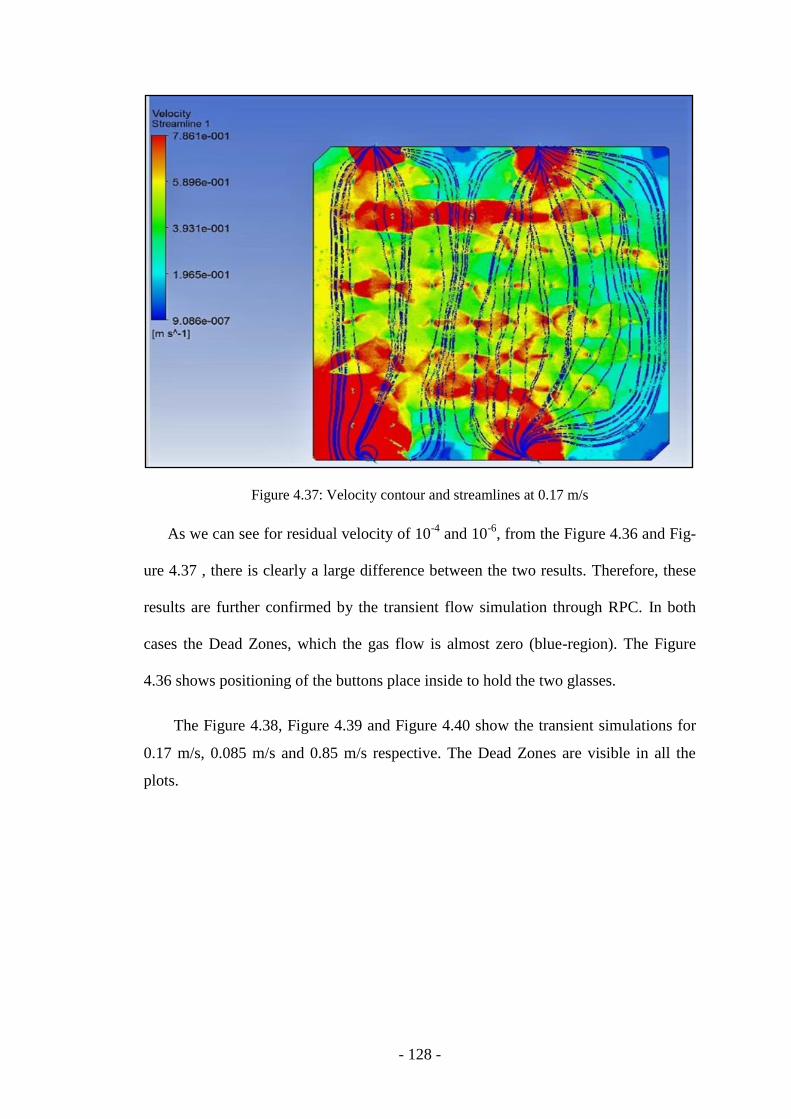
- 128 -
Figure 4.37: Velocity contour and streamlines at 0.17 m/s
As we can see for residual velocity of 10-4
and 10-6
, from the Figure 4.36 and Fig-
ure 4.37 , there is clearly a large difference between the two results. Therefore, these
results are further confirmed by the transient flow simulation through RPC. In both
cases the Dead Zones, which the gas flow is almost zero (blue-region). The Figure
4.36 shows positioning of the buttons place inside to hold the two glasses.
The Figure 4.38, Figure 4.39 and Figure 4.40 show the transient simulations for
0.17 m/s, 0.085 m/s and 0.85 m/s respective. The Dead Zones are visible in all the
plots.

- 129 -
4.4.3.3 Transient simulation with the residual of 10-6
Figure 4.38: Transient simulations at 0.17 m/s
4.4.3.4 Inlet velocity of 0.085 m/s
Figure 4.39: Transient simulations at 0.085 m/s

- 130 -
4.4.3.5 Inlet velocity of 0.85 m/s
Figure 4.40: Transient simulations at 0.85 m/s
4.4.4 Interpretations of the velocities
In the RPC the volume fraction of all 3 gases are hardly changing. In the case of
R34a the volume fraction is hardly varying between 94.5 to 95.5 per cent. The similar
results can be observed for the SF6 and I-butane. That’s why assuming the gas as
fixed composition mixture is a good approximation. The simulation has been also
done by assuming the gas as the fixed composition mixture. The mass percentage of
the respective gas was given to the solver and the values were interpolated.
4.4.5 Mixed Gas simulation and Nozzle position variation studies
In the previous simulations assumption made was that the physical properties of
the gases are almost constant and the volume by volume percentages of the gases are
not varying with time and it is independent of where it flows. So the composition of

- 131 -
the gas at inlet was given. The inlet and out composition of the gas are assumed to be
equal.
4.4.5.1 Boundary conditions
a) Gap Inlet
For a 6 cm3
Volumetric flow of gas the inlet velocity will be 0.012 m2.
Diameter of the inlet nozzle is 2.30 mm.
Therefore Area of the inlet is 𝜋 × (1.15 × 10⁻³)2 = 4.15475E-006
Volumetric flow is 6cm3
per minute. Per nozzle the volume flow will be 3 SCCM.
So per second it is 0.1 cm3
per minute ⌊6 cm3
60 𝑠𝑒𝑐⌋
Inlet velocity is ( cm3/sec)/(4.15475E − 006 m2) = 0.012034 m/s
b) Gap Outlet
The outlet of the nozzle is kept as atmospheric opening and the volume fraction of the
gas components at the outlet are assumed to be same as inlet.
4.4.5.2 Material properties
a) R134a.
Molecular Weight - 102.03 gram /mole
Density - 4.25 kg/m3
Dynamic viscosity - 11.6E-006 Pa.S
b) I-butane
Molecular Weight - 58.122 gram /mole
Density - 2.4397 kg/m3

- 132 -
Dynamic viscosity - 7.4978E-006 Pa.S
c) Sulphur hexafluoride
Molecular Weight – 146 gram /mole
Density - 6.2563 kg/m3
d) Dynamic viscosity and concentration of gases
The assumed viscosity is 1.5123E-005 Pa. S and the actual gas flowing through
the RPC is the mixture of above three gases with fixed composition viz., R134a of 95
%, I-butane of 4.5 % and SF6 of 0.5 % by volume.
4.4.5.3 RPC size of (1.850 × 1.738) m2
The boundary conditions were same except the inlet velocity. The velocities are
0.01243 m/s (for 6 SCCM), 0.17m/s and 0.85m/s.
(a) For inlet velocity of 0.85
Figure 4.41: Transient simulations at 0.85 m/s for mixed gas

- 133 -
(b) inlet velocity of 0.17
Figure 4.42: Transient simulations at 0.17 m/s for mixed gas
(c) inlet velocity 0.01234 m/s
Figure 4.43: Transient simulations at 0.01234 m/s for mixed gas
The Figure 4.41, Figure 4.42 and Figure 4.43 show the transient flow simulation plots for
various velocities. The dead zones are visible an all the plots.

- 134 -
4.4.5.4 Study of flow with nozzle position variations on the RPC
The latest or the final and modified design of nozzle positions of the RPC gap
with an angle of 45° is considered and then changing the position of the input and
output nozzles, some simulation studies are done. Firstly, the flow of R134a is done
and then for the mixed gas.
The gas mixture flowing through the RPC gap is considered as a fixed component
mixture. The transient simulation for the time of 60 sec has been performed. A lami-
nar is assumed during the simulation because of very low velocity of gases, all the
surfaces like polycarbonate buttons, glass sheets are assumed to be smooth. The gas
leakages within an RPC is assumed to be zero.

- 135 -
Figure 4.44: Simulation results Nozzle Position Design 1

- 136 -
Figure 4.45: Simulation results Nozzle Position Design 2

- 137 -
4.4.6 Results and interpretation
In the design 1, the distance between the left wall and left inlet is less compared to
the distance between right nozzle and right wall. The direction of the velocity vector
of the gas at the inlet is 45° in the direction of the left wall. Due to this particular con-
figuration, gas entering the setup from the left nozzle has little space to flow com-
pared to the gas entering from the right nozzle. As a result, velocity of the gas in the
left side of the RPC is greater than the velocity of the gas from the right nozzle. The
flow rate remains constant throughout the RPC and hence the velocity of the gas de-
creases after entering the RPC, reaches a minimum and then increases as the gas ap-
proaches the outlet.
The stream lines and the velocity contour are symmetric in all simulations for the
design 2. But in this case flow rate in the right outlet nozzle is more to that of the left
outlet nozzle. The volume fraction for all the 3 gases is hardly changing for both con-
figurations. The results for both the cases (parameters) are compared in the Table 4.1
In the Figure 4.44 and Figure 4.45 we can see that in the green area the volume
fraction of the SF6 is varying from the values 4.998e-003 to 5.012e-003. This is ±2.4
% change with respect to the assumed value. Similar results have been observed for
the R134a and I-butane.
Table 4.1: Parameters for Design 1 and Design 2 for nozzle positions
- 138 -
For the given set of boundary conditions, the flow pattern in the RPC design is
almost same for the R134a gas, mixed gas and fixed composition mixture.
4.4.7 Conclusion on simulations
The main concern during the study was the change in the concentration in the SF6.
The studies have shown that a small change in the concentration of SF6 will affect the
performance of RPC drastically. The results show that for the flow of 6 SCCM,
change in the volume concentration is very small for the SF6 in all cases. For the case
of 6 SCCM flow, for both designs, the volume concentration of all gases are not
changing significantly. So the overall performance of the RPC will not be affected.
Some dead places for the gas flows are also observed in both designs. In the de-
sign 1, at the right side of the RPC the velocity of the gases is very low. As a result in
the practical arrangement, gas may stagnate. Consequently, the formation of radicals
at these spots will affect the performance the RPC.
In the design 2, dead zones are comparatively less. The previous design of the
RPC seems to be a better design as flow lines are spread out and pressure drop across
it compared to the design 1 is less. As previously mentioned due to some physical con-
straints nozzle positions are changed. So to improve the flow of gases, more optimiza-
tion needs to be done.
The “dead zones” are observed in the simulation results, but the performance of
the RPCs for long run under cosmic rays muon studies show that the position effi-
ciency is more than 95%, so this could be because of diffusion (not drift) of the gas in
the entire volume of the RPC chamber and also the air leakages into the RPCs help in
reducing these dead zones.
- 139 -
Chapter 5
Validation and results related to flow and
control of gas mixture for RPC perfor-
mance.
The Proto-type CLS designed for a stack of 12 RPCs is functioning as per the de-
sign specification and being used. The system is tested thoroughly for 6 RPCs at a
given time and some of their performance parameters are described below. The de-
signed numbers of 12 RPCs were not integrating in the CLS due to time constrains
and other research activities.
The applied high voltage, the current drawn, noise rate, ambient parameters etc.,
play a vital role in the performance on an RPC. The following are some of the studies
and results obtained by us when RPC’s are operated in both OES and CLS.
5.1 Long term study stability
a) The Figure 5.1 and Figure 5.2 are the noise rate for L2, X-side and for strip num-
ber 14 and L2, Y-side strip number 12, of an (1.85 × 1.73) m2
size RPC, over a pe-
riod of one year in an OES gas system with a flow rate of (3 to 6) SCCM per
RPC. The expected noise rate is about 100 hertz and some fluctuation seen in the
plots is due to ambient environment. The Figure 5.3 shows the error bar in the
noise rate data which is within ± 1 %.

- 140 -
Figure 5.1: Noise rate for Layer-2 X-side for strip # 14
Figure 5.2: Noise rate for Layer-2 Y-side for strip # 12
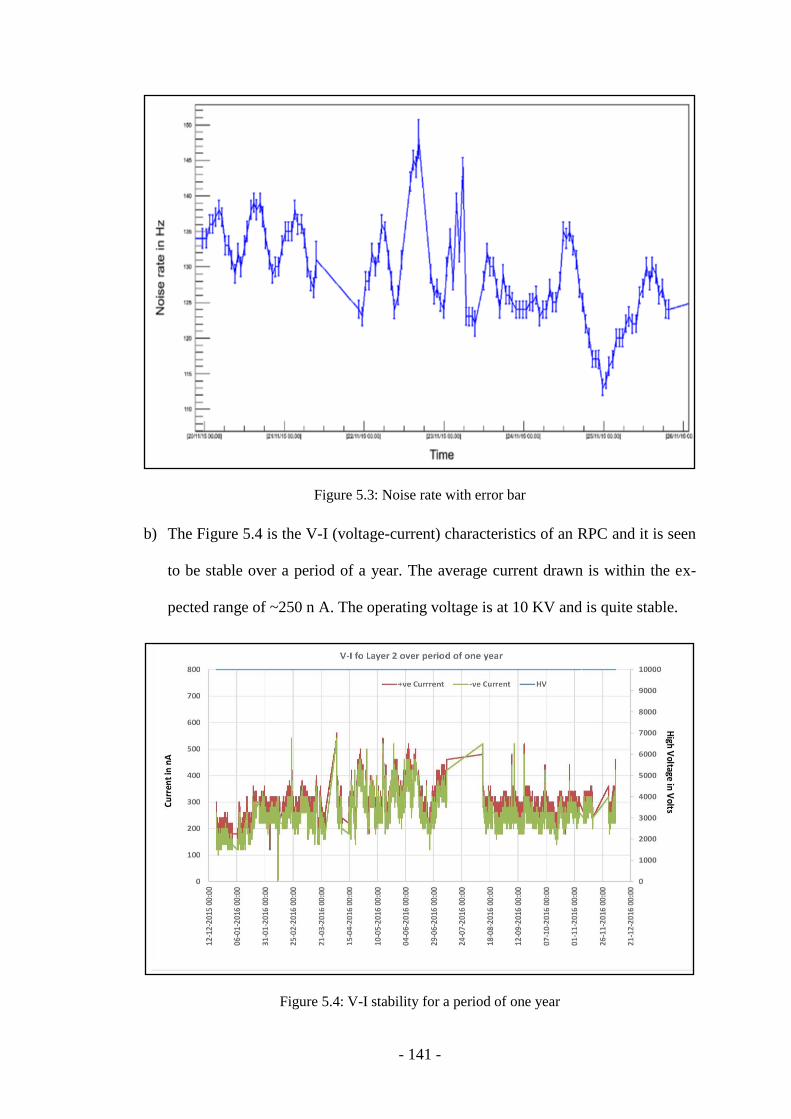
- 141 -
Figure 5.3: Noise rate with error bar
b) The Figure 5.4 is the V-I (voltage-current) characteristics of an RPC and it is seen
to be stable over a period of a year. The average current drawn is within the ex-
pected range of ~250 n A. The operating voltage is at 10 KV and is quite stable.
Figure 5.4: V-I stability for a period of one year

- 142 -
c) The temperature and humidity monitoring for a two RPC connected in series in
CLS, namely RPC- AL 01 and RPC- AL 03 (2nd
in series) over a period of 6
months is shown in the Figure 5.5 and Figure 5.6. As seen in these figures there is
correlation between temperature, humidity and the current drawn by the RPCs.
The missing data is due to power failure. The laboratory temperature maintained
is about 22 0 C and humidity of (40-45) %.
Figure 5.5: Ambient parameters temperature and humidity over a period of 6 months

- 143 -
Figure 5.6: current monitoring (RPCs in series for gas flow)
5.1.1 Efficiency of the CLS
The efficiency of CLS is defined by measurement of its leak rate and in the ideal
case it should be Zero. There is top-up of fresh gas every 12 days in the CLS opera-
tion as seen in the Figure 5.7 . This leakage is from the contribution of the leak in the
CLS itself; leak(s) in the RPCs and from the various joint in the gas path. As per the
accepted criteria for RPC at CERN, the leak rate should be 10E-4
SCCM (1 cc in 33

- 144 -
hours). But for the Glass based ICAL RPCs, the test criteria for the accepted leak is 2
cc per day at 3 mbar pressure (taking into consideration the variation in temperature in
room, the atmospheric periodic pressure variations etc.).
Figure 5.7: Fresh gas top-up every 12 days in CLS
Figure 5.8: RPC set flow using MFC-6 in CLS

- 145 -
The performance or the stability of the set flow rate of the MFC-6 in the CLS is
shown in Figure 5.8. It is observed that irrespective of variation in pressure (PT1 sen-
sor) in the receiver tank the set flow of 4.5 SCCM for an RPC remain uniform
throughout the period of operation of few months. The glitches seen may be due to
system parameter, which was eventually corrected by tracking the ambient lab pres-
sure.
In lieu of an RPC of (1.85 × 1.73) m2 size, an equivalent RPC of (2 × 2) m
2 is
formed using four RPCs of (1 × 1) m2 and connecting two in series (the output gas
line of the first is connected to the input of the second) as shown in Figure 5.9. These
were made for ease of handling and testing in the initial stages of testing RPCs.
Figure 5.9: Cascading of four number of (1 × 1) m2 RPCs
This RPC is in operation in one of the channels of the CLS for more than a year.
But when each of these four were tested in the OES (Open Ended gas System), an in-
teresting result was observed by us. The efficiency of the RPC (IB-20) one of the (1 ×

- 146 -
1) m 2 when observed in CLS and the same gap operated in OLE gas system, was
found to be as close as that of an RPC in an OES as seen in the Figure 5.10. While the
expected efficiency would have been lower, because the efficiency of the RPC would
have deteriorated with time due to leakages of air and moisture inside the RPC gap
when it was operated in the CLS system for a long period, while that when connected
in the OES, a fresh gas flows in to the RPC every time. Hence the performance of an
RPC has not deteriorated with time in the CLS.
Figure 5.10: Performance of an RPC in a CLS and Open Ended System
5.1.2 Ageing effect and recovery of RPCs
A long-term (~3 years) aging test of a Resistive Plate Chamber (RPC) was carried
out with an intense gamma 137
Cs source [82], [83] and [84] at the GIF facility at
CERN. The detectors used were operated in avalanche mode and had the Bakelite sur-
face treated with linseed oil. After the irradiation the estimated dose, charge and flu-
ency were approximately equal to the expected values after 10 years of operation in

- 147 -
the CMS experiment. The increase in the current and noise rates were observed under
radiation but the increase was irreversible. When the radiation was withdrawn within
a few months the rates decreased. The localized accumulated charge for strip was also
studied and no significant variation of strip profile or dead strips were observed. The
only ageing effect observed was due to the water vapor contamination. However, by
flushing ammonia for a short period, the chambers were full recovered.
In the case of glass RPCs the resistivity is found to be stable with the integrated
charge. No ageing effect has been observed on glass RPCs which are operated in ava-
lanche mode at high temperature (55 0C for few months), because glass electrodes do
not need a surface treatment as that required in an Bakelite RPC with linseed oil. As
expected, the rate capability of glass RPCs improve with temperature, due to the low-
ering of glass resistivity.
In the long term operation of the glass RPC in CLS the decomposition of the gases
used under electrical discharge produce a significant concentration of fluorine ionic at
the RPC output or exhaust gas. The F- radicals may produce HF which possibly inter-
act with the inner surface of the RPC electrode due to chemical reactivity and may be
removed by the gas flow with high rate or may damage the glass surface and hence
deteriorate the efficiency of RPCs.
The RGA analysis does not shown any HF radicles for the ICAL RPCs for the last
several years of operations.
5.1.3 CLS Validation
The above results of RPC performance with a flow rate of about 6 SCCM per
RPC indicate that the CLS is functioning as expected and following are some of con-
clusions and precautions to be taken care.

- 148 -
a) RPCs should not be operated under negative differential pressure with respect to
atmospheric pressure, one volume change/day flow rate (~ 6 SCCM) is sufficient
to cope up with regular changes in atmospheric pressure but a provision for 5 vol-
ume changes/day flow rate must be made for emergency atmospheric pressure
transients.
b) Actual position of an RPC in the stack must be considered to calculate effective
pressure inside.
c) A differential pressure of (2 to 4) mbar is safe for an ICAL RPC.
d) Mass flow controllers should be vented before and after back fill cycle. The MFC
control valve should be electrically grounded when not in use and the valves must
be normally closed.
e) Flow division through calibrated capillaries is adequate, no actual measurement is
required.
f) Under cosmic conditions radicals are not produced or observed by us from the SF6
gas inside RPC for the last 5 years.

- 149 -
Chapter 6
Summary, Conclusions and Remarks
The INO project is awaiting for the clearance from the respective government
agencies and is non-technical in nature. This chapter is dedicated to conclusion of the
research work done and with some important remarks. Some of the CLS validation
results are covered in the previous chapter.
The ICAL will have a magnetic field of ~1.5 tesla around each RPC and a sub-
stantial research and development is done including testing and simulation of the
fields for a proto-type system by all the collaborating groups. The readout electronics
plays an important role in building large experiments like INO and will help to im-
prove the detector performance.
The INO electronics team has developed a low noise and fast electronics in the
form of miniature DAQ board sitting on the 100 square centimeter chamfered triangu-
lar area on one of corner of each RPC and it is working as per the specifications. The
data from the DAQ board is being transferred by packet switching at a rate of few
megahertz. More the space occupied by the FEB (Front End Board) , more will be the
inefficiency of the system and hence miniaturization is a must to achieve the physics
goals.The RPCs provide excellent timings, spatial precision and homogeneity.
6.1 RPC Performance
The performance of the active RPCs dependence on many factors like
a) Making a gas gap of uniform thickness (2 mm) throughout the large area and es-
pecially at the edges, so that the applied high voltage provides uniform potential
throughput the active area.

- 150 -
b) Air tight or leak proof gas gap and the ideal expected leak rate is 8.33 × 10⁻⁴
SCCM (equivalent to a pressure drop of less than 1.75 mm WC in about 33 hours)
is an important parameter which decides the performance and hence for ICAL
RPCs the leak test is a mandatory, before accepting it for operation. The observed
leak rate using an automated microcontroller based system developed by the INO
students has shown to be is 1.5 ml / hour (manometer cannot detect this kind of
leak rate) [80].
c) Uniform resistance coating: Our studies have shown that 1M Ω to about 5M Ω are
ideal for proper pulse formation for the ICAL glass RPCs.
d) Purity of gases used should have not have oxygen and moisture level more than 2
ppm for long term stable operations of the gaps, while our observation for RPC
under tests have shown that, the moisture level using RGA in an CLS was found
to be about 46 % (Base Pressure =1.6 × 10 -7
, Water = 46% = 1.6 × 10 -7
× 0.46)
which corresponds to 0.06 ppm) and hence has not affected the performance in
spite of the leakages at the various joints.
e) Proper composition of the gas mixture as per the required ratio (higher value of
any one of the gases in the mixture say by more than a percentage, the gap may
start discharge into the streamer mode of operation or vice versa) is necessary and
need to be monitored on line.
f) The optimum flow rate parameter of gas mixture into the RPCs operated in the
CLS is very crucial parameter, the leakage of air from the atmosphere into the
RPC or / and leakage of the gas from the system into the atmosphere (higher the
flow rate may lead into leakage of gas into the atmosphere and lower may cause
moisture and air to enter into detector) in the loop is to be kept under control.
- 151 -
The efficiency of the CLS depends on maintaining pressure balance, flow rate, ef-
ficiency of purification process and very much on leak integrity of the RPCs.
6.2 Not in the scope of the research work
Some of the following parameters are mandatory as of now and most of these are
defined taking into consideration the physics goals and the large scale volume of the
INO- ICAL experiment by the collaboration team.
a) Based on the initial studies done, the type of electrode to be used for making the
RPC gas gap is the float glass of 3 mm thick and of about (2 × 2 ) m2 size. This
parameter is decided based on the availability, cost and design constrains of the
ICAL having a magnetic field of about1.5 mega tesla. The dimensions of the
RPCs (except for the nozzle positions) cannot be optimized based on the study re-
sults, but efficiency, handling and operation can be optimised.
b) Underground environment, which has the advantage of filtering the high energy
cosmic rays.
c) Safety accepts to be considered in design about rapid drop or rise in the differen-
tial pressure at the chosen working place.
d) The flammable gas namely, I-butane being used cannot be exceeding 12 % in
composition of the mixed gas. The SF6 gas cannot be more than 1 %, as the INO
RPCs are to be operated in avalanche mode as of now.
6.3 Summary of various Gas Systems
The proposed INO-ICAL detector will be instrumented with 28,800 RPCs (Resis-
tive Plate Chamber). These RPCs are of (1.85 × 1.78) m2
size will be made of glass as
electrode with 2 mm. gas gap and will be operated in avalanche mode. The gas mix-

- 152 -
ture used for operating these detectors is R134a (C2H2F4) of about 95 %, I-butane
(iC4H10) of 4.5% and 0.5 % of Sulphur hexafluoride (SF6). Several types of Gas mix-
ing system were evolved with time so that the gas mixture is equally distributed into
each RPC under tests. The total internal volume of gas mixture is huge about 200 m3
in the ICAL detectors. The two main gas recirculation systems for which elaborate
and research work is done by us is summarised.
6.3.1 Open Ended gas System (OES)
The most commonly used gas mixing and distributing systems for small detector
setups is Open Ended gas System (OES), which vents the gas mixture into atmosphere
after only one passage through the RPC detector. However OES is not suitable for
large area experiments as the gases are too expensive and hazardous (due to high
global warming potential) and hence gas cannot be let out into atmosphere in large
volumes after single use.
A Closed Loop System (CLS) capable of purifying and recirculating gas mixture
in a loop is more suitable. The efficiency of CLS is defined as ratio of difference be-
tween total gas mixture volume and gas volume lost as leakage and formation of radi-
cals, to total gas mixture volume. Typical efficiency of a closed loop system is in
range of 85 % to 95 %. However for setups with small number of detectors working
under cosmic luminosity this value is found to be near 97 % by us.
Another type of gas recirculation system namely the Open Loop Recirculation
System (OLS) has been implemented as an alternative to CLS. The basic difference
between these gas systems is that in OLS major gas component (R134a) is extracted
from the gas stream and reused while the remaining small quantity of gas mixture is
chemically treated into safer compounds and disposed. In case of CLS, the gas break-

- 153 -
down impurities and radicals are trapped through several filters and removed from gas
stream while remaining major part of gas mixture is re-circulated. In the OLS, the
R134a gas contained in the gas mixture flowing out of RPC outlet is converted into
liquefied state and separated from gas mixture. Selective condensation and separation
of R134a is achieved by maintaining gas mixture under specific combination of pres-
sure and temperature. Liquefied R134a at -10°C is filled in container and sent back to
inlet of gas mixing system. Cold liquefied gas in the container is heated to room tem-
perature, develops pressure due to heating and reused. In this way R134a gas is being
recalculated, not in a direct loop but by batch type transfer, hence the name “Open
Loop”. This type of system does not require the filters /adsorbents for individual im-
purities, delicate loop pressure control or any precision chemical analysis to decide
the top-up gas quantities. A moisture sensor placed at the outlet of RPC is sufficient to
indicate amount of moisture which serves as indicator to ingress of air into gas mix-
ture by leakages.
It is observed that the efficiency of the OLS built earlier was around 75.0 % only.
This poor efficiency was due to loss of I-butane (4.5 %) and sulphur hexafluoride (0.5
%) and additional loss of about 10.0 % R134a which must have remain uncondensed
to avoid co-condensation of I-butane towards the end of batch cycle. To enhance the
efficiency of the open loop process to greater than 95.0 %, it is necessary to extract
maximum I-butane before R134a extraction. Recovery of I-butane will increase OLS
efficiency. It will also help in more extraction of R134a and thereby increasing OLS
efficiency further. I-butane and R134a can be separated by using a centrifuge tech-
nique because of the large difference in the molecular weights.
The feasibility study of centrifugal separation of R134a and I-butane from the gas
mixture was explored by us. The open loop recirculation system has advantage that it
- 154 -
can remove nitrogen impurity and does not need filters / adsorbents for each type of
impurity. Yet, it is neither economical nor necessary to separate the R134a and I-
butane for every volume change cycle of gas mixture. Instead, the gases could be sep-
arated only after a predetermined number of volume changes till impurity concentra-
tion builds up as indicated by the moisture sensor. Such combination of closed loop
and open loop recirculation will be quite effective and efficient. The feasibility study
of centrifugal separation of R134a and I-butane from the gas mixture was explored.
The efficiency of Open Loop Gas recirculation can be increased from 75 to 90 %
by extraction of I-butane before liquefaction and recovery of R134a. RGA and Gas
chromatograph results show that I-butane is pumped faster than R134a by turbo-
molecular pump of RGA. I-butane concentration is seen to drop from 4.5 to under 2
%. Hence separation of R134a and I-butane is possible by centrifugal process. Con-
taminants will also get separated and removed due to their lower molecular weight.
SF6 will not interfere with extraction process as its concentration is too low to alter
and affect partial pressures of I-butane or R134a. The efficiency of open loop system
can be enhanced with centrifugal concentrator and this could address problems of re-
moval of contaminant. The OLS has advantage that the nitrogen impurity gets re-
moved automatically without using filters/adsorbents. There is no need to use a filter
for each type of impurity.
It is not necessary to separate the R134a and I-butane for every volume change of
gas mixture. Instead, the gases could be separated only after a predetermined number
of volume changes. This combination of closed loop and open loop recirculation
would be very effective.
The Centrifuge being very expensive equipment and it has not been procured yet.
A Varian V70 turbo pump was used to simulate the centrifuge to study dynamic drag
- 155 -
due to RPC gases. Therefore the design and testing of the OLS is still at a conceptual
or a proto-typing and testing level. The detailed reported by us is given in [107].
6.3.2 Closed loop system
The basic principle of design of the INO-ICAL proto-type CLS is based on the
LHC-CERN gas systems used at CERN; these systems are operated for a flow rate of
few liters per minute, as they use Bakelite electrodes for the RPCs in their experi-
ments and are operated at high luminosity, where in the background rate is high due to
their operation of particle collusion environment. The INO ICAL will uses glass RPC
and are operated underground which has a low background.
The proto-type CLS designed for a stack of 12 RPCs of size (1.85 × 1.73) m2 is an
automated system developed using the SEIMENS make PLCs. During the testing and
integrating this system, in the initial stage of design, a diaphragm based High Pressure
to Low Pressure (HPLP) regulator was used by us at the input of the supply gas cylin-
der and the output of this HPLP was connected to the RPCs. This regulator being a
mechanical device, the response was slow to the variation in the periodic atmospheric
and seasonal changes in pressure (not expected by us). This problem was overcome
by using a capillary in lieu of the HPLP regulator at the input of the RPC.
The flow rate assumed was a few LPM (Liters Per Minute) in each RPC, which
we found that it was very high for the glass RPCs and several RPC gaps were dam-
aged. Our studies after long run tests proved that, the low flow rate of a few SCCM is
ideal.
An additional pressure sensor had to be integrated to the system to monitor and
correct the atmosphere periodic variation in the room as the RPC testing laboratory is
temperature and humidity controlled and not pressure controlled.

- 156 -
6.4 Observation and conclusions of flow and control of gas in CLS
The RPC performance studies (noise rate, current, efficiency etc. under controlled
temperature and humidity) for several years of operation in the CLS (also that in the
OES) show that the safe operating pressure that is needed at the input of INO glass
RPCs is (2 to 4) mbar. While the breakdown tests conducted by us show that the glass
RPCs can sustain a few tens of mbar’s of pressure.
a) In the process of testing the RPCs in the CLS for few years the flow rate could be
optimized for the ICAL RPCs (1.85 × 1.9) m2 with a gas gap of 2 mm, to be 6
SCCM ( but as low 3 SCCM and high of 9 SCCM ) which corresponds to about
one volume change of gas per day. Some excess flow may be required to maintain
a concentration gradient. The low flow rate of 3 SCCM has also yielded good re-
sults.
b) The pilot CLS has achieved leak rate of 0.09 SCCM when connected to 4 RPCs
for 12 days (auto refill).
c) RPCs should be operated under negative differential pressure with respect to at-
mospheric pressure in a CLS is not tried out by us.
d) About One volume change/day flow rate is sufficient to cope up with regular
changes in atmospheric pressure but a provision for 5 volume changes/day flow
rate must be made for emergency atmospheric pressure transients.
e) Actual position of an RPC in the stack must be considered to calculate effective
pressure inside.
f) At high temperature the two stage regulator on the supply cylinder of I-butane
were found to be mall functioning and frequently we had to replace them and
hence the cylinders need to be stored in a temperate controlled room.
- 157 -
The proto-type CLS developed, tested and validated has a simple purification unit
containing molecular sieves and copper catalyst which are useful for removal of mois-
ture and simple break down radicals. In the operation of the CLS for the last few
years, using the simple RGA gas analyzer system no major breakdown radicals were
observed by us. The only issue related to increase in the moisture level in the loop
was observed and could be due to air leaks at the joints of the plumbing system. How-
ever, the performance of the RPCs like the current, nose rate and efficiency were stud-
ied in detail.
The flow resistors namely the capillary studies have shown that if 4 RPCs are
connected in series (road in the final ICAL) a capillary of length 250 cm and diameter
of 300 micron is ideally suitable, but if one needs to optimise the space then a capil-
lary of few centimetres in length and of 300 micron diameter would also function
suitably. The design of the nozzles used in the RPCs gap at the input and output is
such that it has some capillary effect due to its small bore of (1.84 × 0.74) mm of
length 3 mm (refer Figure 4.14) and may be in principal no capillary may be needed
at the input. But, from safety point of view if the link is broken the complete pressure
is exerted on the previous RPC, which would be equivalent to a no capillary at all.
Therefore, some capillary is needed at the input of each RPC. As of now the flow of
gas into the RPC is considered to in parallel that is each RPC will have a flow resistor
at its input.
A Capillary is prone to choke as the diameter is 300 micron (dust particles etc.)
and hence cause change of impendence. If the outlet blocks then the capillary will be
unable to control and the pressure may rise to the dangerous level inside of RPC and
may be damaged.

- 158 -
In view of the above a servo based motor controlled valve to produce a safety
range of low pressure flow is designed (conceptual) and is given in the appendix.
The studies done us by sealing of an RPCs, where the gas is filled inside an RPC
under safe pressure and sealed and operated for about 6 months show that the perfor-
mance of the RPCs is stable for few months, which is a good indication that the glass
RPCs can be used in CLS system without replacing the entire gas in the system for at
least over a period of about a month or so.
The long studies using RGA (Residual Gas Analyzer), a small scale mass spec-
trometer hooked in the CLS loop has NOT shown any breakdown radicle of the mixed
gases for the period of operation from 2013 onwards. The disadvantage of RGA is
that, the gas under test is broken down into gas radicals for analysis. So one has to
study and analyses in detail to understand if the gas breakdown takes place in the
RGA or the radical is broken inside the RPC itself. If breakdown of SF6 gas takes
place then the fluorine would etch the glass electrode and which in turn would deteri-
orate the performance of the RPC.
6.5 Conclusions of Simulation Studies
The simulation studies are done to understand the gas flow rate, its distribution in-
side an RPC and the effect of gas distribution due to the position variation of the noz-
zles. The simulation studies are performed on the 3 platforms namely Solid works,
COMSOL and CDF (CFX) with different goals. As a beginner started with available
Solid works, then COMSOL was used and then finally CDF collaborative studies
were done. The results in solid works and the CFX are more fruitful.

- 159 -
The conclusive results are summarized.
a) The preliminary results show that, there are “Dead Pockets” (where the drift ve-
locity of gas is zero) in the RPC detector. The Dead zones can be smaller at high
flow velocities of gas, but cannot be Zero. The same can be used for validating the
large scale models. The Dead zones are observed near the mid-section of inlet
wall and outlet walls if the nozzle position are at the four corners of the RPCs.
b) The calculations show that, the Reynolds Number for all gases for the flow rates
between 0.3 SCCM to 30 SCCM is less than 2500 and hence the flow patter is
considered is LAMINAR and NOT Transient (2500 to 3000) or Turbulent (above
3500).
c) The flow through the both outlet nozzle is not equal. This can be a problem if
RPCs are connected in the series because, for the next RPC the inlet flows will not
be equal.
d) The SF6 is the heaviest of the 3 gases and I-butane is the lightest. The density of
the SF6 is almost double of the I-butane and hence the velocity of the SF6 and Fre-
on is less compared to the velocity of I-butane.
e) In the RPC, the volume fractions of all 3 gases are hardly changing. In the case of
R134a the volume fraction is hardly varying between 94.5 to 95.5 per cent. Simi-
lar results have been observed for the SF6 and I-butane. That’s why assuming the
gas as fixed composition mixture is a good approximation for simulation.
f) The average residence time in chamber from inlet to outlet is in range of 8105
seconds (i.e. ~ 10 days). The residence (replacement) times are different for each
gas and hence one need to optimise time and flow to fill the RPC with gas. A de-
tailed study is required as the number of RPCs gap are huge in the final ICAL.
- 160 -
g) The flow rates of (3 to 10) SCCM is adequate to initiate the RPC in reasonable
time and sufficient to operate it under cosmic radiation conditions. The objects in
the path of the gas flow such as nozzles, buttons do not cause turbulent conditions
at flow rates near 3 SCCM.
h) The Separation of gases does not take place even in the dead zones at flow rates of
3 SCCM or more.
i) There are four nozzles in an RPC of which two are for the flow of input gas and
the other two for the output flow of gas. Simulation studies indicate that some
dead zones are present, irrespective of the position of nozzles placed. The oldest
design (nozzles at 4 corners) seems to be a better design both as flow lines are
spread out and pressure drop across it compared to the design 1 which has less
compared to design 2.
Simulation results play an important role in improving the performance of an
RPC. A lot of work still needs to be done, to further improve on the study of distribu-
tion of gas inside an RPC. The dead zone pockets are still to be studied and under-
stood in detail. The presented results are just the initial bench marks.
6.6 Some Remarks
In the existing CLS, the removal of water is by combination of 3A0 and 5A
0 mo-
lecular sieves which are continuous duty purifier and the removal of radicals is by
disposable activated alumina and the removal of oxygen is by Cu Zn and Ni-NiO on
activated alumina by continuous duty purifier.
The above purification processes do not fully address the breakdown radicals of
SF6 in the CLS. The tests and analysis that have been done so far by us are for a
smaller number of RPCs with minimum purifier stages therefore a detailed work has
to be carried out.

- 161 -
A better gas analysis and monitoring system like the Gas Chromatograph, pH sen-
sors contaminants detectors are needed for detailed studies of gases in the CLS loop.
6.6.1 Leak test and flow control in CLS.
One the major issues observed all around the globe where RPCs or any gas detec-
tors, that are used in large scale experiment is the gas leak control which is observed
either in the detector itself (smaller / marginal) and or in the complete chain of con-
nection(s) in the overall system.
Some leakages in the detector(s) need to accepted, but more attention in integrat-
ing the gas systems with detectors has to be done in methodological way (like sealing
of each joints, use of un hydrophobic tubes , standard fitting etc.). But when a huge
number (like few thousands) of chambers are to be manufacture and assembled in an
industry a more reliable test procedure need to be developed to qualify RPCs.
The most common leak tests are by pressure drop, bubble test (inaccurate for de-
tecting 10E-4
SCCM leak rate), sniffer (Hydrogen used as target gas and all joints
scanned for leak using a sniffer, high sensitivity but laborious and unreliable due to
large number of measurement points) and mass spectrometry etc.
6.7 Some new features for upgrading the CLS
a) A multi stage displacement pump with adjustable compression ratio in the CLS,
which can mechanically adjust stroke and compression ratio (minimum and max-
imum pressure electronic valves for pressure and flow rate control)
b) Safety devices with full redundancy and safe parking in event of any failure.

- 162 -
c) A possible servo controlled electronic pressure regulator for safe flow and control
of pressure at RPC input (a conceptual design for future upgrading the CLS) is
given at the end in the annexure chapter.
The studies done on the flow rate, for the glass RPCs so far show that a flow rate
of 6 SCCM to 10 SCCM is ideal. A more precise study to optimize the usage of ex-
pensive gases taking into the leak issues and keeping the performance of an RPC to a
high level with the desired physics goals is to be further fine-tuned when the number
of RPCs will be huge in the final ICAL.
6.7.1 Alternate gas mixture studies etc.
In a long run for RPCs, an alternative gas mixture is a must, though C2H2F4 and
SF6 are the result of a long search to optimize the RPC gas. The gases need to eco-
friendly and need to work towards it.
There is a need to fully exploit the RPC potential both in basic research and in in-
dustrial applications such as imaging, PET, Muon tomography etc.

- 163 -
Appendix A
Possible up-gradation / modification of the
existing CLS for flow control
A1: Limitation in the present CLS
In the initial design of CLS, a HPLP mechanical regulator (which was to regu-
late the high pressure gas ~1.6 bar abs., flow from the storage tank connecting to the
RPCs outlet pressure (15 to 50) mm WC. This control worked very well when the
room pressure was steady. But due to periodic changes in the atmospheric pressure
(this was not known at the design stage of CLS) the mechanical pressure regulator
was unable to cope up with the changes seen daily and the seasonal atmospheric pres-
sure variations due to mechanical hysteresis and inertia of control components. So the
glass RPCs could be subjected to higher than specified pressure differences for short
periods causing stress on glass. The HPLP regulator was removed and replaced with
set of capillary elements to act as flow resistors and maintain the pressure inside RPC
to a safe level. However there is an safety issue in this technique that if RPC outlet
gets blocked due to some reason ( pinching of Tygon tube used on the nozzle of the
RPC, dust particle in the detector etc.), Then RPC can go to dangerous pressures,
when using two or three RPCs care can be taken to maintain safe outlet condition. But
the risk and extent of possible damage considerably increase when the number of
RPC increases.
In view of the above a modified conceptual design of a servo motor controlled
based electronic valve to replace HPLP valve is shown in Figure A -1 and Figure
A -2.

- 164 -
Figure A -1: HP-LP Servo controller based regulator (0.3 Kg/cm2 to 3 mbar)
Figure A -2: Details of the valve
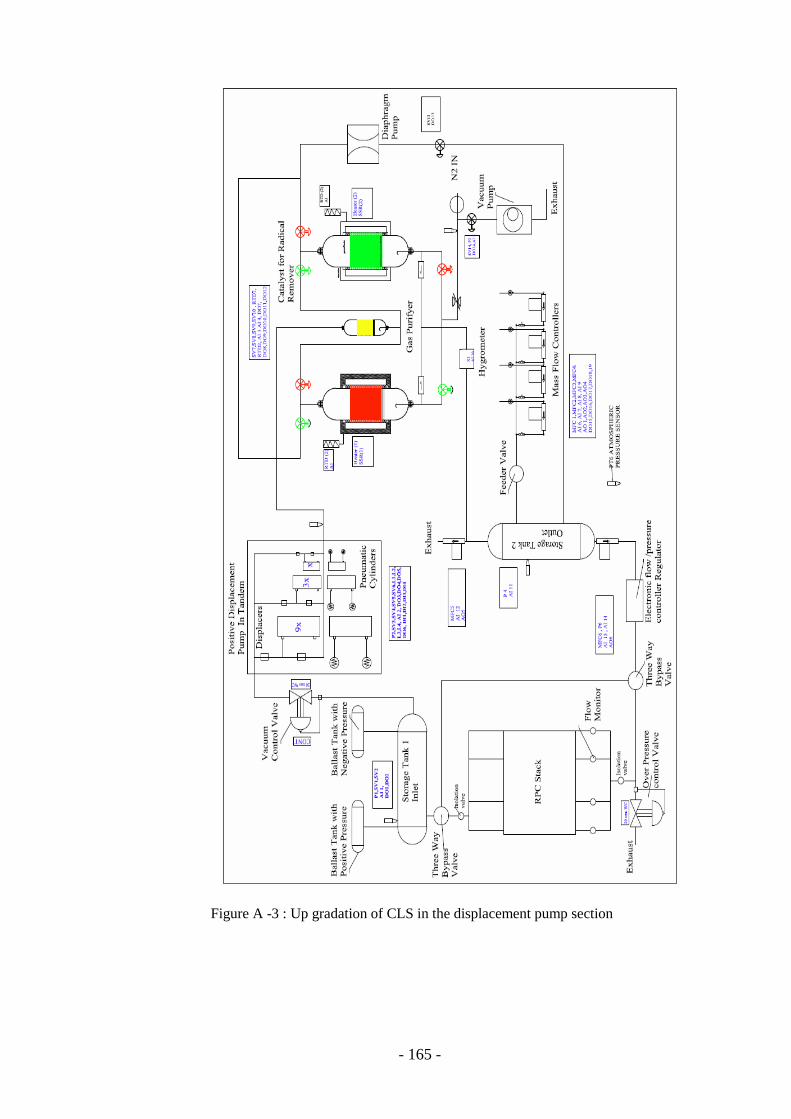
- 165 -
Figure A -3 : Up gradation of CLS in the displacement pump section

- 166 -
The Figure A -3 shows upgrade version of CLS with electronic control regulator
(described in the earlier) and having multi-displacement pumps for different suction
volume of gas so as to suck the gas from the storage tank (i.e. more efficiently from
the RPC stack into the CLS).

- 167 -
REFERENCES [1] I. N. O. collaboration, “INO Project Report,” Technical Report INO/2006/01,
2006.
[2] V. Datar, S. Jena, S. Kalmani, N. Mondal, P. Nagaraj, L.V.Reddy, M.Saraf,
B.Satayanaryana, R.R.Shinde and P.Verma, “Development of glass resistive
plate chambers for INO experiment,” Nucl. Instrum. Methods Phys. Res. Sect.
Accel. Spectrometers Detect. Assoc. Equip., vol. 602, no. 3, pp. 744–748, 2009.
[3] M. Murthy and I. N. O. Collaboration, “India-based Neutrino Observatory
(INO): A Status Report,” in AIP Conference Proceedings, 2011, vol. 1405, pp.
309–316.
[4] M. Bhuyan, V.B.Chandratre, S.Dasgupta, V.M.Datar, S.D.Kalmani,
S.M.Lahamge, N.K.Mondal, P. Nagaraj, S.Pal, S.K.Rao, A.Redij, D.Samuel,
M.N.Saraf, B.Satyanarayana, R.R. Shinde, S.S.Upadhya, “VME-based data ac-
quisition system for the India-based Neutrino Observatory prototype detector,”
Nucl. Instrum. Methods Phys. Res. Sect. Accel. Spectrometers Detect. Assoc.
Equip., vol. 661, pp. S73–S76, 2012.
[5] S. Bhide, Sarika, Datar, V.M,,Jena, Satyajit, Kalmani SD,Mondal, NK and Pad-
mashree, GK, Satyanarayana, B, Shinde, RR and Verma, P , “Preliminary results
from India-based Neutrino Observatory detector R&D programme.,” Pramana J.
Phys., vol. 69, no. 6, 2007.
[6] R. Santonico, A. Di Biagio, A. Lucci, and R. Cardarelli, “Progress in Resistive
Plate Counters,” Nucl Instrum Meth, vol. 263, pp. 20–25, 1988.
[7] Li, Qite and Ye, Yanlin and Wen, Chao and Ji, Wei and Song, Yushou and Ma,
Rongrong and Zhou, Chen and Ge, Yucheng and Liu, Hongtao, “Study of spatial
resolution properties of a glass RPC,” Nucl. Instrum. Methods Phys. Res. Sect.
Accel. Spectrometers Detect. Assoc. Equip., vol. 663, no. 1, pp. 22–25, 2012.
[8] W. Riegler and C. Lippmann, “The physics of resistive plate chambers,” Nucl.
Instrum. Methods Phys. Res. Sect. Accel. Spectrometers Detect. Assoc. Equip.,
vol. 518, no. 1, pp. 86–90, 2004.
[9] S. Bhide, V. Datar, S. Jena, S. Kalmani, N.K. Mondal,
G.K.Padmashree,B.Satynaryana and P.verma, “Experiences of using float glass
as electrodes for radiation detectors,” Magnesium, vol. 2, pp. 2–00, 2006.
- 168 -
[10] R. Guida, “The Resistive Plate Chamber detectors at the Large Hadron Collider
experiments,” in PH-DT Detector Seminar (https://indico. cern.
ch/conferenceDisplay. py, 2009.
[11] M.Bhuyan, M and Datar, VM and Kalmani, SD and Lahamge, SM and Moham-
med, S and Mondal, NK and Nagaraj, P and Redij, A and Samuel, D and Saraf,
“Development of 2m X 2m size glass RPCs for INO,” Nucl. Instrum. Methods
Phys. Res. Sect. Accel. Spectrometers Detect. Assoc. Equip., vol. 661, pp. S64–
S67, 2012.
[12] M. K. Jaiswal, V. Singh, V. S. Subrahmanyam, V. Sharma, K. Saraswat, and N.
S. Chouhan, “Study of Surface Resistivity of Resistive Plate Chamber Detec-
tors,” in DAE Symp. Nucl. Phys., 2012, vol. 57, pp. 968–969.
[13] P. Fonte, A. Smirnitski, and M. Williams, “A new high-resolution TOF technol-
ogy,” Nucl. Instrum. Methods Phys. Res. Sect. Accel. Spectrometers Detect. As-
soc. Equip., vol. 443, no. 1, pp. 201–204, 2000.
[14] P. Fonte, “Applications and new developments in resistive plate chambers,”
IEEE Trans. Nucl. Sci., vol. 49, no. 3, pp. 881–887, 2002.
[15] C.Zeballos, E Cerron and Crotty, Ian and Hatzifotiadou, D and Valverde, J La-
mas and Neupane, S and Williams, MCS and Zichichi, Antonino E., “A new
type of resistive plate chamber: the multigap RPC,” Nucl. Instrum. Methods
Phys. Res. Sect. Accel. Spectrometers Detect. Assoc. Equip., vol. 374, no. 1, pp.
132–135, 1996.
[16] B. S. Acharya, B. Satyanarayana, P. Verma, M. R. Krishnaswamy, K. Sudhakar,
and CMS colloboration, “The CMS Outer Hadron Calorimeter,” CERN-CMS-
NOTE-2006-127, 2006.
[17] V. Khachatryan, Vardan and Erbacher, Robin and Carrillo Montoya, Camilo
Andres and Carvalho, Wagner and Gorskis, “The CMS trigger system,” JINST,
vol. 12, no. arXiv: 1609.02366, p. P01020, 2016.
[18] F. Bellini and U. Rome, “Experience with the resistive plate chamber in the Ba-
Bar experiment,” Stanford Linear Accelerator Center (SLAC), 2006.
[19] R. Cardarelli, R. Santonico, and V. Makeev, “The avalanche to streamer transi-
tion in RPCs,” in Third International Workshop on RPC and Related Detector,
1995, pp. 11–24.
[20] V. Français, “Description and simulation of physics of Resistive Plate Cham-
bers,” J. Instrum., vol. 11, p. C05023, 2016.

- 169 -
[21] H. Chia-Yu, L. W. Tsung-Tai, N. Tomida, H. Ohnishi, C. Wen-Chen, and M.
Niiyama, “Trigger rate dependence and gas mixture of MRPC for the LEPS2
experiment at SPring-8,” PoS, p. 061, 2012.
[22] T. S. Virdee and R. Cousins, “The Status of the CMS Experiment at the LHC.
CMS,” PoS, vol. EPS-HEP2009, p. 006, 2009.
[23] M. Kumagai, K. Abe, Y. Hoshi, K. Neichi, and T. Takahashi, “Quenching prop-
erties of gas mixture in glass RPC operated with streamer mode,” Nucl. Instrum.
Methods Phys. Res. Sect. Accel. Spectrometers Detect. Assoc. Equip., vol. 533,
no. 1, pp. 169–172, 2004.
[24] Denni, U and Felici, G and Frani, MA and Mengucci, A and Papalino, G and
Spinetti, M and Paoloni, A, “Streamer studies in resistive plate chambers,” Nucl.
Instrum. Methods Phys. Res. Sect. Accel. Spectrometers Detect. Assoc. Equip.,
vol. 640, no. 1, pp. 76–84, 2011.
[25] Y. Qian, L. Yuan-Jing, Y. Jin, C. Jian-Ping, W. Yi, and W. Yu-Cheng, “Meas-
urement of avalanche size and position resolution of RPCs with different surface
resistivities of the high voltage provider,” Chin. Phys. C, vol. 34, no. 5, p. 565,
2010.
[26] M. Rabie and C. M. Franck, “A study of the avalanche-to-streamer transition in
arbitrary gases by particle simulation,” J. Phys. Appl. Phys., vol. 49, no. 17, p.
175202, 2016.
[27] J. Ying, Y. Ye, Y. Ban, H. Liu, Z. Zhu, and T.Chen, “Study of an avalanche-
mode resistive plate chamber,” J. Phys. G Nucl. Part. Phys., vol. 26, no. 8, p.
1291, 2000.
[28] G. Aielli, M. Bindi, and A. Polini, “Performance, operation and detector studies
with the ATLAS Resistive Plate Chambers,” J. Instrum., vol. 8, no. 02, p.
P02020, 2013.
[29] F. Thyssen, “Performance of the Resistive Plate Chambers in the CMS experi-
ment,” J. Instrum., vol. 7, no. 01, p. C01104, 2012.
[30] S. Kalmani, N. Mondal, B. Satyanarayana, P. Verma, and V. Datar, “Develop-
ment of conductive coated polyester film as RPC electrodes using screen print-
ing,” Nucl. Instrum. Methods Phys. Res. Sect. Accel. Spectrometers Detect. As-
soc. Equip., vol. 602, no. 3, pp. 835–838, 2009.

- 170 -
[31] S. Bhide, V. Datar, S. Kalmani, N. Mondal, L. Pant, B.Satyanaraya and
R.Shinde, “On aging problem of glass Resistive Plate Chambers,” Nucl. Phys.
B-Proc. Suppl., vol. 158, pp. 195–198, 2006.
[32] M. Aartsen, MG and Abraham, K and Ackermann, M and Adams, J and Aguilar,
JA and Ahlers, M and Ahrens, M and Altmann, D and Andeen, K, “PINGU: a
vision for neutrino and particle physics at the South Pole,” J. Phys. G Nucl. Part.
Phys., vol. 44, no. 5, p. 054006, 2017.
[33] E.Rutherford, Geiger H, and John Harling, “An Electrical Method of Counting
the Number of a-Particles from Radio-active Substances.,” R. Soc., Jue 1908.
[34] JS Townsend, “Electricity in gases Oxford University press,” Oxford University
press, New York, 1915.
[35] Farmer, Earle C, Brown, and Sanborn C, “A study of the deterioration of me-
thane-filled Geiger-Mueller counter,” Phys. Rev., vol. 74, p. 902, 1948.
[36] G. F. Knoll, Radiation detection and measurement. John Wiley & Sons, 2010.
[37] G. Fedotovich, Y. N. Pestov, and K. Putilin, “Spark Counter with a Localized
Discharge,” in Int. Conf. on Instrumentation for Colliding Beam Physics", Pre-
Proc., Part, 1982, vol. 2, p. 4.
[38] L. Madansky and R. Pidd, “Characteristics of the parallel-plate Counter,” Phys.
Rev., vol. 73, no. 10, p. 1215, 1948.
[39] R. Pidd and L. Madansky, “Some Properties of the Parallel Plate Spark Counter
I,” Phys. Rev., vol. 75, no. 8, p. 1175, 1949.
[40] Curran, SC, “Gamma-ray spectroscopy,” Taylor Francis, vol. 2, no. Advances in
Physics, pp. 411–449, 1953.
[41] Miller, DG, “Gamma Ray Spectroscopy Using a Gas Filled Proportional Coun-
ter,” Hanford Works, 1954.
[42] A. Krusche, D. Bloess, and F. Münnich, “Nanosecond lifetime measurements
with a fast gaseous counter,” Nucl. Instrum. Methods, vol. 33, no. 1, pp. 177–
179, 1965.
[43] Von Engel, A, Ionization in gases by electrons in electric fields. Springer, 1956.
[44] G. Charpak, D. Rahm, and H. Steiner, “Some developments in the operation of
multiwire proportional chambers,” Nucl. Instrum. Methods, vol. 80, no. 1, pp.
13–34, 1970.
[45] R. Doolittle, U. Pollvogt, and A. Eskovitz, “Multiwire proportional chamber de-
velopment,” 1973.

- 171 -
[46] R. Santonico and R. Cardarelli, “Development of resistive plate counters,” Nucl.
Instrum. Methods Phys. Res., vol. 187, no. 2–3, pp. 377–380, 1981.
[47] F. Sauli, “GEM: A new concept for electron amplification in gas detectors,”
Nucl. Instrum. Methods Phys. Res. Sect. Accel. Spectrometers Detect. Assoc.
Equip., no. A 386, pp. 531–534, Nov. 1996.
[48] A. Sharma, “A GEM Detector System for an Upgrade of the CMS Muon
Endcaps,” Intend. CMS Intern. Use Distrib. Only, 2012.
[49] D. Abbaneo, M. Abbrescia, M. A. Akl, C. Argamaingaud, P. Aspell, and others,
“Development and performance of large scale triple GEM for CMS,” J. Instrum.,
vol. 8, no. 11, p. C11017, 2013.
[50] F. Sauli, “Gas detectors: Recent developments and future perspectives,” Nucl.
Instrum. Methods Phys. Res. Sect. Accel. Spectrometers Detect. Assoc. Equip.,
vol. 419, no. 2, pp. 189–201, 1998.
[51] F. Sauli, “Gas detectors: achievements and trends,” Nucl. Instrum. Methods
Phys. Res. Sect. Accel. Spectrometers Detect. Assoc. Equip., vol. 461, no. 1, pp.
47–54, 2001.
[52] F. Flakus, “Detecting and Measuring Ionizing Radiation- A Short History.,”
IAEA Bull., vol. 23, no. 4, pp. 31–36, 1982.
[53] A. Hartmann, J. Hutsch, F.Kriiger, M.Sobuella, H.Wilsenach, and K.Zuber, “De-
sign and performance of an ionisation chamber for the measurement of low al-
pha-activitie,” Elsevier, vol. 814, pp. 12–18, 2016.
[54] G. Majumder, V. Datar, S. Kalmani, N. Mondal, S. Mondal,
B.Satayanarya,R.R.Shinde, “Development of a Resistive Plate Chamber with
heat strengthened glass,” J. Instrum., vol. 11, no. 09, p. C09019, 2016.
[55] C. Bacci, K.Z. Bao, F. Barone, B. Bartoli, P. Bernardini, R. Buonomo, S. Bus-
sino, E. Calloni, B.Y. Cao,R. Cardarelli, S. Catalanotti, A. Cavaliere, F. Cesaro-
ni,P. Creti, Danzengluobu, B. D’Ettorr, Piazzoli,M. De Vincenzi, T. Di Giro-
lamo, G. Di Sciascio, Z.Y. Feng, Y. Fu, X.Y. Gao, Q.X. Geng, H.W. Guo ,H.H,
M. He, Q. Huang, M. Iacovacci, N. Iucci, “High altitude test of RPCs for the
Argo YBJ experiment,” Nucl. Instrum. Methods Phys. Res. Sect. Accel. Spec-
trometers Detect. Assoc. Equip., vol. 443, no. 2, pp. 342–350, 2000.
[56] M. A. Shah, “Comparison of CMS Resistive Plate Chambers performance during
LHC RUN-1 and RUN-2,” ArXiv Prepr. ArXiv160509366, 2016.
- 172 -
[57] J.Zhang, Jiawen and Du, Zizhen and Han, Jifeng and Li, Jiancheng and Li, Rubai
and Liu, Qian and Qian, Sen and Wang, Yifang and Xie, Yigang and Xie,
Yuguang, “A new surface treatment for the prototype RPCs of the BESIII spec-
trometer,” Nucl. Instrum. Methods Phys. Res. Sect. Accel. Spectrometers Detect.
Assoc. Equip., vol. 540, no. 1, pp. 102–112, 2005.
[58] S. Montzka, M. McFarland, S. Andersen, B. Miller, D. Fahey, and B. Hall, “Re-
cent trends in global emissions of hydrochlorofluorocarbons and hydrofluoro-
carbons: Reflecting on the 2007 adjustments to the Montreal Protocol,” J. Phys.
Chem. A, vol. 119, no. 19, pp. 4439–4449, 2014.
[59] Y. Hoshi, Y. Mikami, T. Nagamine, K. Watanabe, A. Yamaguchi, and Y. Yusa,
“Freonless gas mixtures for glass RPC operated in streamer mode,” Nucl. In-
strum. Methods Phys. Res. Sect. Accel. Spectrometers Detect. Assoc. Equip.,
vol. 508, no. 1, pp. 56–62, 2003.
[60] S. Sehgal, V. Kashyap, C. Yadav, R. Thomas, and L. Pant, “Calibration of RPC
gas mixture,” in Proceedings of the DAE-BRNS symposium on nuclear physics.
V. 57, 2012.
[61] A. Paoloni, A. Longhin, A. Mengucci, F. Pupilli, and M. Ventura, “Gas mixture
studies for streamer operated Resistive Plate Chambers,” J. Instrum., vol. 11, no.
6, p. C06001, 2016.
[62] A. Mengucci, A. Paoloni, M. Spinetti, and L. Votano, “Gas mixture studies for
streamer operation of Resistive Plate Chambers at low rate,” Nucl. Instrum.
Methods Phys. Res. Sect. Accel. Spectrometers Detect. Assoc. Equip., vol. 583,
no. 2, pp. 264–269, 2007.
[63] Bosteels, M and Brown, RCA and Gregory, CR and Hahn, F and Haider, S and
Lindner, R and Nuttall, CW and Peach, “CMS gas system proposal,” CMS In-
tern. Note CMS IN, vol. 18, p. 1999, 1999.
[64] Bernard Aubert, A. Bazan, A. Boucham, D. Boutigny, I. D. Bonis, and J. Favier,
“The BABAR detector,” Nucl. Instrum. Methods Phys. Res. Sect. Accel. Spec-
trometers Detect. Assoc. Equip., vol. 479, no. 1, pp. 1–116, 2002.
[65] W. Menges, “The BABAR muon system upgrade,” in Nuclear Science Sympo-
sium Conference Record, 2005 IEEE, 2005, vol. 3, pp. 1470–1474.
[66] S. Foulkes, JW Gary, BC Shen, K Wang, and R Boyce, “Gas system upgrade for
the BaBar IFR detector at SLAC,” Nucl. Instrum. Methods Phys. Res. Sect. Ac-
cel. Spectrometers Detect. Assoc. Equip., vol. 538, no. 1, pp. 801–809, 2005.

- 173 -
[67] A. Little, “Evaluation of the Electronic Bubbler Gas Monitoring System for High
Flow in the BABAR Detector, 2003,” Partial Fulfillment Sci Undergrad Lab In-
ternsh. SULI.
[68] M. Capeans, I. Glushkov, R. Guida, F. Hahn, and S. Haider, “Optimization of a
closed-loop gas system for operation of resistive plate chambers at the Large
Hadron Collider,” in Nuclear Science Symposium Conference Record
(NSS/MIC), 2009 IEEE, 2009, pp. 237–244.
[69] M. Capeans, R. Guida, F. Hahn, S. Haider, and B. Mandelli, “RPC performances
and gas quality in a closed loop gas system for the new purifiers configuration at
LHC experiments,” J. Instrum., vol. 8, no. 08, p. T08003, 2013.
[70] T. Greci, F Felli, G Saviano, L Benussi, L Passamonti, and others, “A model for
the chemistry of defects in bakelite plates exposed to high-radiation environ-
ment,” in XIth Workshop on Resistive Plate Chambers and Related Detectors
(RPC2012), 2012.
[71] S. Colafranceschi, R. Aurilio, L. Benussi, S. Bianco, L. Passamonti, and D. Pic-
colo, “A study of gas contaminants and interaction with materials in RPC closed
loop systems,” J. Instrum., vol. 8, no. 03, p. T03008, 2013.
[72] S. Kalmani, N. Mondal, B. Satyanarayana, P. Verma, and A. Joshi, “On-line gas
mixing and multi-channel distribution system,” Nucl. Instrum. Methods Phys.
Res. Sect. Accel. Spectrometers Detect. Assoc. Equip., vol. 602, no. 3, pp. 845–
849, 2009.
[73] M. Bhuyan, A Joshi, NK Mondal, B. Satyanarayana, and Kalmani S D, “Perfor-
mance of the prototype gas recirculation system with built-in RGA for INO RPC
system,” Nucl. Instrum. Methods Phys. Res. Sect. Accel. Spectrometers Detect.
Assoc. Equip., vol. 661, pp. S234–S240, 2012.
[74] M. Bhuyan, S. Kalmani, N. Mondal, S. Pal, D. Samuel, and B. Satyanarayana,
“Preliminary results on optimisation of gas flow rate for ICAL RPCs,” Nucl. In-
strum. Methods Phys. Res. Sect. Accel. Spectrometers Detect. Assoc. Equip.,
vol. 736, pp. 135–142, 2014.
[75] A. Joshi, S. Kalmani, N. Mondal, and B. Satyanarayana, “RPC gas recovery by
open loop method,” Nucl. Instrum. Methods Phys. Res. Sect. Accel. Spectrome-
ters Detect. Assoc. Equip., vol. 602, no. 3, pp. 809–813, 2009.

- 174 -
[76] M. Salim, R. Hasan, N. Majumdar, S. Mukhopadhayay, and B. Satyanarayana,
“Experimental and numerical studies on the effect of SF6 in a glass RPC,” J. In-
strum., vol. 7, no. 11, p. P11019, 2012.
[77] M. Salim, A. Jash, R. Hasan, B. Satyanarayana, N. Majumdar, and S. Mukho-
padhayay, “Simulation of efficiency and time resolution of resistive plate cham-
bers and comparison with experimental data,” J. Instrum., vol. 10, no. 04, p.
C04033, 2015.
[78] M. Capeans, I. Glushkov, R. Guida, S. Haider, F. Hahn, and S. Rouwette, “Op-
timal gas system for the operation of Resistive Plate Chambers at the Large Had-
ron Collider experiments,” in Nuclear Science Symposium Conference Record
(NSS/MIC), 2010 IEEE, 2010, pp. 1427–1432.
[79] D. Gonzalez-Diaz and A. Sharma, “Challenges for resistive gaseous detectors
towards RPC2014,” J. Instrum., vol. 8, no. 02, p. T02001, 2013.
[80] S. Mondal, V. Datar, S. Kalmani, G. Majumder, N. Mondal, and B. Satyana-
rayana, “Leak rate estimation of a resistive plate chamber gap by monitoring ab-
solute pressure,” J. Instrum., vol. 11, no. 11, p. C11009, 2016.
[81] B. Satyanarayana, G. Majumder, N. Mondal, S. Kalmani, R. Shinde, and A.
Joshi, “Effect of ambient pressure variation on closed loop gas system for India
based Neutrino Observatory (INO),” J. Instrum., vol. 9, no. 10, p. C10001, 2014.
[82] A. Candela, A. Di Giovanni, M. D’Incecco, N. Redaelli, and G. Trinchero,
“Ageing and recovering of glass RPC,” Nucl. Instrum. Methods Phys. Res. Sect.
Accel. Spectrometers Detect. Assoc. Equip., vol. 533, no. 1, pp. 116–120, 2004.
[83] M. Abbrescia, G. Iaselli, M. Maggi, S. Natali, G. Pugliese, and A. Ranieri, “Ag-
ing study for resistive plate chambers of the CMS muon trigger detector,” Nucl.
Instrum. Methods Phys. Res. Sect. Accel. Spectrometers Detect. Assoc. Equip.,
vol. 515, no. 1, pp. 342–347, 2003.
[84] G. Carboni, S. De Capua, R. Messi, and M. Veltri, “Final results from an exten-
sive ageing test of bakelite Resistive Plate Chambers,” Nucl. Instrum. Methods
Phys. Res. Sect. Accel. Spectrometers Detect. Assoc. Equip., vol. 533, no. 1, pp.
107–111, 2004.
[85] R. Ganai, M. K. Shiroya, Z. Ahammed, and S. Chattopadhyay, “Long term per-
formance studies of large oil-free bakelite resistive plate chamber,” J. Instrum.,
vol. 11, no. 09, p. C09010, 2016.

- 175 -
[86] Q. Zhang, J. Butler, G. Mavromanolakis, J. Repond, and L. Xia, “Environmental
dependence of the performance of resistive plate chambers,” J. Instrum., vol. 5,
no. 02, p. P02007, 2010.
[87] Abbrescia, M, Colaleo, A, Guida, R, Iaselli, G, Loddo, F, Maggi, M, Marangelli,
B, Natali, S, Nuzzo, S and Pugliese, “The gas monitoring system for the resistive
plate chamber detector of the CMS experiment at LHC,” Nucl. Phys. B-Proc.
Suppl., vol. 177, pp. 293–296, 2008.
[88] Giordano Cattani, “The Resistive Plate Chambers of the ATLAS experiment:
performance studies,” in Journal of Physics: Conference Series, 2011, vol. 280,
p. 012001.
[89] D. M. Rossi (R3B Collaboration) and H. Simon, “A closed-circuit gas recycling
system for RPC detectors,” Nucl. Instrum. Methods Phys. Res. Sect. Accel.
Spectrometers Detect. Assoc. Equip., vol. 661, pp. S230–S233, 2012.
[90] Saviano, G, Ferrini, M, Aurilio, RR, and Lupi, C, “Gas purifiers for closed-loop
gas systems,” in Proceedings of the XIth Workshop on Resistive Plate Chambers
and Related Detectors (RPC2012)., Laboratori Nazionali di Frascati dell’INFN-
Frascati (Rome)-Italy., 2012.
[91] M. Jo, B. Hong, K. S. Lee, and R. Y. M. Sang, “Gas mixture dependence of the
performance for multigap resistive plate chambers in the avalanche mode,” J.
Korean Phys. Soc., vol. 56, no. 5, pp. 1423–1429, 2010.
[92] C. Gustavino, A. Candela, M. De Deo, M. D’Incecco, and R. Moro, “Perfor-
mance of glass RPC operated in streamer mode with four-fold gas mixtures con-
taining SF 6,” Nucl. Instrum. Methods Phys. Res. Sect. Accel. Spectrometers
Detect. Assoc. Equip., vol. 517, no. 1, pp. 101–108, 2004.
[93] L. Benussi, D Pierluigi, L. Passamonti, and G. Saviano, “Study of gas mixtures
and high voltage in a single gap RPC monitoring system,” PoS, p. 057, 2012.
[94] B. Bartoli, R. Buonomo, E. Calloni, S. Catalanotti, and B. D. Piazzoli, “Study of
RPC gas mixtures for the ARGO-YBJ experiment,” Nucl. Instrum. Methods
Phys. Res. Sect. Accel. Spectrometers Detect. Assoc. Equip., vol. 456, no. 1, pp.
35–39, 2000.
[95] M. Capeans, R. Guida, F. Hahn, S. Haider, and B. Mandelli, “Long term valida-
tion of the optimal filters configuration for the Resistive Plate Chambers gas sys-
tem at the Large Hadron Collider experiments,” in Nuclear Science Symposium
and Medical Imaging Conference (NSS/MIC), 2011 IEEE, 2011, pp. 1775–1782.
- 176 -
[96] B. Mandelli, R. Guida and CMS team, Long-term study of optimal gas purifiers
for the RPC systems at LHC. CERN PHEP-Tech-Note-2012-001.
[97] E Abat, M. Arik, G. Atoian, B. Auerbach, O. Baker, and ATLAS collaboration
team, “The ATLAS TRT barrel detector,” J. Instrum., vol. 3, no. 02, p. P02014,
2008.
[98] S. Bianco, “Gas Analysis and Monitoring Systems for the RPC Detector of CMS
at LHC,” in Nuclear Science Symposium Conference Record, 2006. IEEE, 2006,
vol. 2, pp. 891–894.
[99] R. De Asmundis, “Application of gas chromatographic analysis to RPC detectors
in the ATLAS experiment at CERN-LHC,” J. Instrum., vol. 2, no. 06, p.
T06001, 2007.
[100] X. Fan, “Analysis of RPC Performance with Different Gas Mixture,” 2015.
[101] P. J. Linstrom and W. Mallard, “NIST Chemistry webbook; NIST standard
reference database No. 69,” 2001.
[102] E. Pastori, “An improved gas distribution system for the ATLAS RPCs,” PoS,
p. 054, 2012.
[103] J. Topolnicki, M. Kudasik, N. Skoczylas, and J. Sobczyk, “Low cost capillary
flow meter,” Sens. Actuators Phys., vol. 152, no. 2, pp. 146–150, 2009.
[104] R. de Asmundis, “A Method for Humidity extraction from the Gas Mixture of
the RPC detectors in the ATLAS Experiment,” in Nuclear Science Symposium
Conference Record, 2007. NSS’07. IEEE, 2007, vol. 1, pp. 652–656.
[105] B. Biskup, “Design Study and Optimization of Irradiation Facilities for Detec-
tor and Accelerator Equipment Testing in the SPS North Area at CERN,” PhD
Thesis, Prague, Tech. U.
[106] G Aielli, B. Liberti, A. Paoloni, E. Pastori, and R. Santonico, “RPC operation
at high temperature,” Nucl. Instrum. Methods Phys. Res. Sect. Accel. Spectrom-
eters Detect. Assoc. Equip., vol. 508, no. 1, pp. 44–49, 2003.
[107] S. Kalmani, A. Joshi, S. Bhattacharya, and P.V. Hunagund, “Performance en-
hancement of open loop gas recovery process by centrifugal separation of gas-
es,” J. Instrum., vol. 11, no. 11, p. C11031, 2016.

- 177 -
Publications of the author National and International Journals:
1. S. D. Kalmani, P. Verma, P.V. Hunagund.,“Preliminary Simulation results on Op-
timisation of flow of mixed gas in Resistive Plate Chamber”, International Jour-
nal of Computer Science & Communication, Volume 5. Number 2, July-Sept
2014. PP.124-133 ISSN-0973-7391.
2. S. D. Kalmani, P. Verma, P.V. Hunagund.,“Simulation: study of flow of gas in a
resistive plate chamber”, International Journal of Research in Engineering and
Technology eISSN: 2319-1163 | pISSN: 2321-7308
3. Suresh Kalmani, Avinash Joshi, S. Bhattacharya and P. V. Hunagund., “Perfor-
mance Enhancement of Open Loop Gas Recovery Process by Centrifugal Separa-
tion of Gases”, Journal of Instrumentation (JINST -an IOP and SSISA Journal-
Italy), JINST_101P_ 0516_ open_ loop.pdf., ISSN 1748-0221.
4. S. D. Kalmani, A.V. Joshi , R.R. Shinde and P. V. Hunagund,“PLC Based Instru-
mentation of Closed Loop Gas System for RPC Detectors”, IOSR (International
Journal of Scientific Research) - Journal of Applied Physics (IOSR-JAP) e-ISSN:
2278-4861, Volume 9, Issue 1 Ver. I Jan. – Feb. 2017, PP 74-77.
5. S. D. Kalmani, Mondal.S, Shinde R.R and Hunagund P.V., “Effect of capillary as
a dynamic impedance element on the differential pressure across RPC detector in
a closed loop gas system”, International Journal of Development Research. Vol.
07, Issue, 07, pp.13710-13713, July 2017.
6. S. D. Kalmani, P.V. Verma, R. P. SHINDE and P. V. Hunagund “Study of
Mixed Gas Flow Pattern Inside RPC” International Journal of Applied Engineer-
ing Research, Volume 12, Number 9 (2017) pp. 1094-1099. ISSN 0973-4562
7. S. D. Kalmani, Surya Mondal, R. R. Shinde and P. V. Hunagund, “Some studies
using capillary for flow control in a closed loop gas recirculation system”,
https://link.springer.com/chapter/10.1007/978-3-319-73171-1_223-- XXII DAE
High Energy Physics Symposium pp 913-915|

- 178 -
Photo-sheet of Closed Loop System (Front View)

- 179 -
Photo-sheet of Closed Loop System (Rear View)

- 180 -
Back Page of the Thesis
STUDY OF FLOW AND CONTROL OF GAS MIXTURE FOR
THE RESISTIVE PLATE CHAMBER PERFORMANCE IN CLOSED LOOP SYSTEM
Ph.D. Thesis
By
Kalmani Suresh Devendrappa
The upcoming INO-ICAL experiment will be
instrumented with 28,800 of RPCs (glass based elec-
trode) of size (1.85× 1.74) m2, which are the active
elements and the key goal of ICAL is to precisely
measure the neutrino(s) mass. The mixed gas used
for RPCs is R134a (94.6%), I-Butane (4.5%) and
SF6 (< 1%). As the number of RPCs are large with
volume of ~ 200 m3, a Closed Loop gas mixing Sys-
tem (CLS) is mandatory.
A CLS is designed, developed and tested for
12 RPCs. The issues related to periodic atmospheric
pressure variation are addressed, the flow resistors
(capillaries) to be used at the input of the RPC(s) are
designed and the flow rate of gas mixture to be in-
jected into the RPCs connected in the CLS is opti-
mised to (6 to 10) SCCM, depending on the leak
rates. The input tested value for safe operating pres-
sure for an RPC is (2 to 3) mbar. The Gas analysis
studies in the CLS loop by using a RGA (a small
scale mass spectrometer) to identify for gas break-
down radicles inside an RPC are studied and no
break down radicals are observed by us, moisture is
under control and except N2 ,as of now no known
technique to remove it. The simulation results; for
the flow distribution of gas mixture inside an RPC
show some “Dead zone” pockets and the position of
the nozzle (polycarbonate) at the input and output of
an RPC plays a significant role for different flow
rates.
Related Documents


