STUDY OF ACCESSIBILITY TO ONTARIO LAW SCHOOLS REPORT submitted to Deans of Law at Osgoode Hall, York University University of Ottawa Queen’s University University of Western Ontario University of Windsor Alan J.C. King Wendy K. Warren Sharon R. Miklas Social Program Evaluation Group Queen’s University October 2004 This project was funded by the Law Foundation of Ontario and the Law Society of Upper Canada

Welcome message from author
This document is posted to help you gain knowledge. Please leave a comment to let me know what you think about it! Share it to your friends and learn new things together.
Transcript
STUDY OF ACCESSIBILITY TO ONTARIO LAW SCHOOLS
REPORT
submitted to
Deans of Law at
Osgoode Hall, York University University of Ottawa Queen’s University
University of Western Ontario University of Windsor
Alan J.C. King Wendy K. Warren Sharon R. Miklas
Social Program Evaluation Group Queen’s University
October 2004
This project was funded by the Law Foundation of Ontario and the Law Society of Upper Canada

Aussi disponible en français
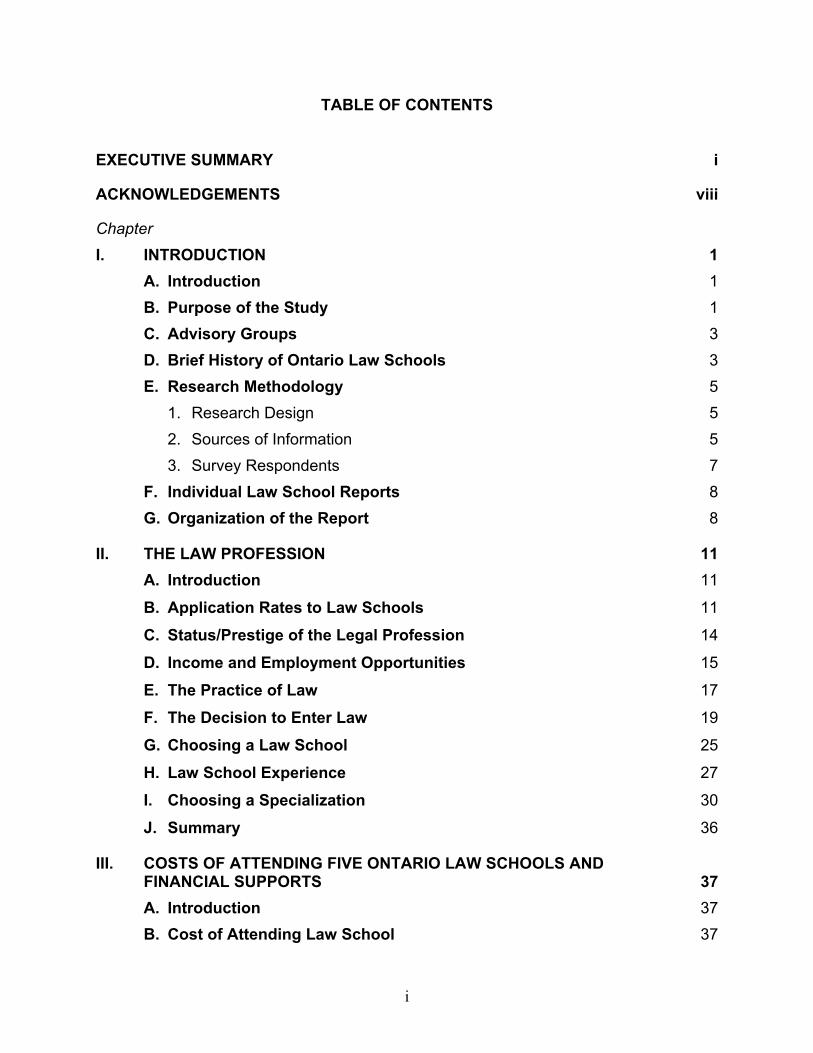
TABLE OF CONTENTS EXECUTIVE SUMMARY i
ACKNOWLEDGEMENTS viii
Chapter I. INTRODUCTION 1
A. Introduction 1 B. Purpose of the Study 1 C. Advisory Groups 3 D. Brief History of Ontario Law Schools 3 E. Research Methodology 5
1. Research Design 5 2. Sources of Information 5 3. Survey Respondents 7
F. Individual Law School Reports 8 G. Organization of the Report 8
II. THE LAW PROFESSION 11 A. Introduction 11 B. Application Rates to Law Schools 11 C. Status/Prestige of the Legal Profession 14 D. Income and Employment Opportunities 15 E. The Practice of Law 17 F. The Decision to Enter Law 19 G. Choosing a Law School 25
H. Law School Experience 27
I. Choosing a Specialization 30
J. Summary 36
III. COSTS OF ATTENDING FIVE ONTARIO LAW SCHOOLS AND FINANCIAL SUPPORTS 37
A. Introduction 37 B. Cost of Attending Law School 37
i
1. Tuition 37 2. Costs Per Year 40 3. Bar Admission Course 41 a. Bar Admission Course Costs and Financial Assistance 42 b. Articling 43 i. The Articling Search Process 44 C. Financial Supports 45
1. Parental Support 46 2. Savings and Summer Jobs 46 3 Paid Part-time/School-Year Jobs 48 4. Financial Awards 52 a. Bursaries 52 i. University/Law School Bursaries 53 ii. Canadian Millennium Bursary 54 b. Scholarships, Awards and Prizes 55 5. Loans 56 a. Personal Loans 57 b. Canada-Ontario Integrated Student Loans (OSAP) 58 c. Bank Loans, Lines of Credit and Credit Card Debt 60
6. Other Sources of Financial Support 64 D. Tuition Increases and Financial Support 65 E. Student and Graduate Views on Financial Assistance 66 1. Introduction 66 2. General Themes 67 a. Timing of the Notification of Financial Assistance 67 b. Communication of Information Available on Financial Assistance 67 c. Conditions for Receiving Financial Aid/Fairness 68
d. Impact of Tuition Increases 70 3. Financial Assistance Sources 70 a. OSAP 70 b. Bursaries 72
c. Scholarships 73 d. Work Study 75
ii
e. Line of Credit, Credit Cards 76 4. Special Categories of Students 76 a. Mature Students and Students with Families 76
b. Disadvantaged: Visible Minority Students 77 c. Aboriginal Students 78
F. Summary 79
IV. CHARACTERISTICS OF LAW STUDENTS 81 A. Introduction 81 B. Representativeness of the Law School Population 81
1. Gender 82 2. Marital Status 83 3. Sexual/Gender Identity 84 4. Language of Law School Students 85 5. Socioeconomic Status 86
a. Parents’ Education 86 b. Parents’ Income 88
6. Ethnocultural Background 89 7. Citizenship 92 8. Geographic Origin 93 a. Region of Ontario 93
C. Diversity in the Law School Population 95 1. Disabled Students 96 2. Aboriginal Students 98 3. Mature Students 100 4. Visible Minorities 100 5. Other Provinces/Countries 100
D. Summary 101
V. CHANGES OVER TIME IN LAW STUDENT CHARACTERISTICS 103 A. Introduction 103 B. Age at Entry 103 C. Gender 104 D. Marital Status 105
iii
E. Socioeconomic Status 106 1. Parents’ Education 106 2. Parents’ Occupation 108 3. Parents’ Income 109 F. Ethnocultural Background 111 G. Geographic Origin 112
H. Language 113 I. Special Needs Students 114 J. Summary 115
VI. DEBT AND IMPACT OF DEBT 117 A. Introduction 117 B. Debt 117 1. Debt at Entry to Law School 117
2. Debt at Exit from Law School 119 3. Background Characteristics of Students and Graduates in Relation to Extent of Debt 124 a. Debt at Graduation by Gender 125 b. Debt at Graduation by Age 127 c. Debt at Graduation by Language 128 d. Debt at Graduation by Marital Status 131
e. Debt at Graduation for Students/Graduates With or Without Dependents 132 f. Debt at Graduation by Parents’ Education 134 g. Distribution of Debt by Visible Minority Status 138
4. Debt in Relation to Sources of Financial Support 141 5. Part-Time Work and Debt 142 C. Impact of Debt Load 145
1. Impact of Debt on Career Decisions 145 a. Articling Placement 145 b. Type of Law to be Practised 147
2. Impact of Debt on Law School Experience 149 a. Choice of Law Subjects Studied 149 b. Purchase of Texts and Other Learning Resources 151
iv
c. Academic Achievement 152 d. Satisfaction with Law School Experience 154
3. Impact of Debt on Family and Personal Relationships 156 4. Impact of Debt on Basic Needs 157 5. Debt and Decision to Enrol 159
D. Summary 159
VII. SUMMARY AND FUTURE DIRECTIONS 163 A. Introduction 163 B. Summary of Findings 163
1. Who Goes to Law School? 163 2. Have there been changes in the background characteristics of law
students since tuition deregulation? 163 3. What are the major sources of student financial support, and to what extent have they changed since tuition deregulation? 164
a. University/Law School Bursaries 164 b. Canada Millennium Bursaries 165 c. Scholarships/Awards/Prizes 165 d. Parental Support 165 e. Savings and Summer Jobs 166 f. Paid Part-Time/School Year Jobs 166 g. Loans 167
i. Personal Loans 167 ii. Canada-Ontario Integrated Student Loans (OSAP) 167 iii. Bank Loans, Lines of Credit and Credit Cards 167
h. Out-of-Province Student Loans 168 i. Funding for Aboriginal Law Students 168
4. What is the impact of debt on law students? 168 a. Debt at Program Entry and Graduation 168 b. Characteristics of Students with More or Less Debt 169 c. Impact of Debt on Students 169
C. Understanding The Law School Experience 170
v
D. Myths/Realities 171 1. With increased tuition, there is a growing trend for law schools to serve only the children of affluent parents. 172 2. Members of visible minorities are underrepresented at law schools, and there is an increasing trend for this situation to worsen. 172 3. Most students will have a massive debt burden at graduation. 172 4. Many bursaries go to those who are not in financial need. 173 5. Many students are prevented from practising in the area of social justice and public interest because they must obtain high-paying jobs to pay down law school debts. 173
E. Future Directions 174 1. Increase Maximum Assistance from OSAP 174 2. Examine the Feasibility of a Debt-Relief Program 174 3. Refine the Work Study Plan 175 4. Align Bursary Allocations More Consistently with Student Financial Need 176 5. Ensure Openness, Fairness and Support for Students in Search of
Articling Positions 176 F. Concluding Statement 176
REFERENCES 179
APPENDIX A – Surveys and Letters
APPENDIX B – Tables B-1 to B-32
APPENDIX C – Focus Group Guide and Consent Form
vi
LIST OF TABLES
Page Chapter I Table 1.1: Survey Respondents by Law School (% Students by Year & Graduates, 2000-03) 7 Chapter II Table 2.1: Salaries Associated with Practising Law ($) 16
Table 2.2: Estimated Gross Annual Earnings of 2000 Graduates Working Full Time in 2002, by Selected Professions ($) 16
Table 2.3: Employment Rate for 2000 Graduates in 2002, by Selected Professions (%) 17
Table 2.4: Current Practice Setting (% 2000-02 Graduates & Ontario Lawyers) 19
Table 2.5: Grades 10 & 12 Student Responses to ‘Expected Job After Schooling?’ (%) 20
Table 2.6: Parents as Lawyers and Judges (% Students & Graduates) 21
Table 2.7: Post-Secondary Education at Entry Into Law, by Year (% Students) 24
Table 2.8: Number of Law Schools Applied to, by Year (% Applicants, 1997-2003) 25
Table 2.9: Reasons for First Choice Law School (% Students, 2003-04 Graduates Articling & 2000-02 Graduates) 27
Table 2.10: First Choice of Law Practice Areas (% Students by Year) & Current Areas of Specialization (Graduates 2000-02) 31
Table 2.11: Articling Placement: Preferred & Expected Settings (% Students by Year) 33
Table 2.12: Graduates’ Actual Articling Settings (%) 34
Table 2.13: Preferred Settings to Practise Law (% Students by Year & Graduates) 35
Table 2.14: Activities of Graduates Not Currently Practising Law (% Graduates) 35
Chapter III Table 3.1: Tuition Fees at Six Law Schools (1997-98 to 2003-04) 39
Table 3.2: Estimated Total Cost of Attending Law School at Three Ontario Law Schools for the 2003-04 Academic Year ($) 41
Table 3.3: Articling Student Salaries 45
Table 3.4: Parent(s)/Guardian(s)’ Income/Savings as a Source of Financial Support (% Students by Year & Graduates) 46
Table 3.5: Sources of Financial Support from Own Income/Savings (% Students by Year & Graduates) 46
Table 3.6: Students & Graduates with Paid Part-Time Jobs 49
vii
Table 3.7: Hours Per Week Spent on Paid Part-Time Jobs (% Students by Year & Graduates) 50
Table 3.8: Law-related Paid Jobs (% Students by Year & Graduates) 50
Table 3.9: Reasons for Paid Job(s) (% Students by Year & Graduates) 51
Table 3.10: Financial Support from Research/Teaching Assistantship (% Students by Year & Graduates) 52
Table 3.11: Number & Percentage Students Assisted by Law School Bursaries, Total & Average Amounts Awarded (1997-2003) 54
Table 3.12: Financial Support from Canada Millennium Bursary (% Students by Year & Graduates) 55
Table 3.13: Scholarships, Awards & Prizes Available at the Five Ontario Law Schools (2003-04) 56
Table 3.14: Personal Loans at Entry to Law School (% Students by Year & Graduates) 57
Table 3.15: Loans from Parents (% Students by Year & Graduates) 58
Table 3.16: Eligibility Requirements for the Canada-Ontario Integrated Student Loan Program (OSAP) 58
Table 3.17: OSAP Loan at Entry to Law School & Current OSAP Loan (% Students by Year & Graduates) 59
Table 3.18: Sources of Financial Support from OSAP (% Students by Year & Graduates) 60
Table 3.19: Distribution of Students with Credit Card Debt by Debt Level 62
Table 3.20: Sources of Financial Support from Bank Loans (% Students by Year & Graduates) 63
Table 3.21: Bank Loans at Entry to Program and Current Bank Loans (% Students by Year & Graduates) 63
Table 3.22: Source of Financial Support from Other Provincial Loans (% Students by Year & Graduates) 64
Table 3.23: Sources of Financial Support from First Nation Education Authority Grant (% Students by Year & Graduates) 64
Table 3.24: Bursary Information Related to Tuition at Five Ontario Law Schools (1999-00 & 2003-04) 65
Table 3.25: Satisfaction with OSAP (% Students by Year & Graduates) 71
Table 3.26: Satisfaction with Government & University/Law Faculty Bursaries/Grants (% Students by Year & Graduates) 72
Table 3.27: Satisfaction with Law Faculty & University Scholarships & Prizes (% Students by Year & Graduates) 74
Table 3.28: Satisfaction with Work Study Plan (% Students by Year & Graduates) 75
viii
Chapter IV Table 4.1: Education & Population Analysis of Ontario & Canada, by Gender (%) 83
Table 4.2: Marital Status of Survey Respondents & Ontario & Canadian Residents, by Gender (%) 84
Table 4.3: Sexual/Gender Identity of Survey Respondents, Canadian Residents & Canada Youth & AIDS Study Students (%) 85
Table 4.4: First Language of Student & Graduate Respondents & of Ontario & Canadian Residents (%) 86
Table 4.5: Ethnocultural Group of Student & Graduate Respondents Compared to Ontario & Canadian Residents (%) 91
Table 4.6: Citizenship of 2003 Law School Registrants & Survey Respondents Compared to Ontario & Canadian Residents (%) 93
Table 4.7: Law School Registrants (2003) & Ontario Residents, by Region of Ontario (%) 94
Table 4.8: Disability Status of Survey Respondents & Ontario University Students & Ontario & Canadian Residents (%) 96
Table 4.9: Type of Disability of Survey Respondents & Canadians (%) 97
Table 4.10: Aboriginal Representation of Survey Respondents & Ontario Residents (%) 98
Table 4.11: Highest Level of Educational Attainment of Aboriginal & Non-Aboriginal Ontario Residents (%) 99
Table 4.12: Parental Income Level of Aboriginal & Non-Aboriginal Ontario Residents (%) 99
Table 4.13: Last University Attended, by Registration Year (% Registrants) 101
Chapter V Table 5.1: Mother’s Education (% Students by Year & Graduates) 107
Table 5.2: Father’s Education (% Students by Year & Graduates) 107
Table 5.3: Mother’s Occupation (% Students by Year & Graduates) 108
Table 5.4: Father’s Occupation (% Students by Year & Graduates) 108
Table 5.5: Ethnocultural Background (% Students by Year & Graduates) 111
Table 5.6: Impairment (% Students by Year & Graduates) 115
Chapter VI Table 6.1: Comparison of Law School Enrolees’ Debt at Entry with Bachelor’s Degree Graduates’ Debt at Exit 118
Table 6.2: Projected Debt at Graduation (% Students, by Mother’s Education) 135
Table 6.3: Projected Debt at Graduation (% Students, by Father’s Education) 137
Table 6.4: Major Sources of Financial Support by Projected Debt at Graduation (% Students) 141
ix
Table 6.5: Major Sources of Financial Support by Projected Debt at Graduation (% Graduates) 142
Table 6.6: Extent of Paid Job’s Negative Impact (% Students by Year & Graduates) 143
Table 6.7: Did you have a part-time job this academic year/during your third year? by Debt at Graduation (% Students & Graduates) 144
Table 6.8: Would You Have Entered Law Program With Your Projected Debt Load at Time of Graduation? (% Law Students by Year & Graduates) 159
x
LIST OF FIGURES Page Chapter II Figure 2.1: Ontario Law School Applications and Registrations (1997-2003) 12
Figure 2.2: Yield Rate, Ontario Law Schools (% Registrants/Offers) 13
Figure 2.3: Previous Degree Program of Law Registrants (1997-2003) 23
Figure 2.4: Source of Law School Applicants (%; Six Law Schools–1997-03) 26
Figure 2.5: Legal Education Timeline 28
Chapter III Figure 3.1: Number of Credit Cards by Age of Student (%) 62
Chapter IV Figure 4.1: Parents’ Education of Law Students (%) 87
Figure 4.2: Parent Income of Law Registrants Compared to Canadian Family Income Quintiles (% Registrants) 89
Chapter V Figure 5.1: Age of Year 1 Law School Registrants (% in Five Law Schools, 1997-2003) 104
Figure 5.2: Year 1 Registrants, by Gender (% in Five Law Schools, 1997-2003) 105
Figure 5.3: Marital Status of Year 1 Law School Registrants 1997-2003 (% Married in Five Law Schools) 106
Figure 5.4: Proportion of Year 1 Law School Registrants from Canadian Family Income Quintiles (% in Five Law Schools, 1997-2003) 110
Figure 5.5: Registration Rates, by Region (% Five Law Schools, Year 1 Registrants) 112
Figure 5.6: First Language of Year 1 Law School Registrants, by Registration Year (% in Five Law Schools) 114
Chapter VI Figure 6.1: Debt at Entry to Law School (% Graduates & Students by Year) 119
Figure 6.2: Debt at Graduation from Law School (% Graduates & Students by Year) 120
Figure 6.3: Change in Debt in $10,000s from Entry to Graduation (% Students by Year & Graduates) 122
Figure 6.4: Change in Debt in $10,000s from Entry to Graduation, by Size of Debt at Entry (% Students) 123
Figure 6.5: Distribution of Projected Debt at Graduation (% Students, by Gender) 125
Figure 6.6: Distribution of Debt at Graduation (% Graduates, by Gender) 126
Figure 6.7: Distribution of Debt at Graduation (% Students, by Age at Entry) 127
Figure 6.8: Distribution of Debt at Graduation (% Graduates, by Age at Entry) 128
xi
xii
Figure 6.9: Distribution of Projected Debt at Graduation (% Students, by Language of Comfort) 129
Figure 6.10: Distribution of Debt at Graduation (% Graduates, by Language of Comfort) 130
Figure 6.11: Distribution of Projected Debt at Graduation (% Students, by Marital Status) 131
Figure 6.12: Distribution of Debt at Graduation (% Graduates, by Marital Status) 132
Figure 6.13: Distribution of Projected Debt at Graduation (% Students, With/Without Dependents) 133
Figure 6.14: Distribution of Debt at Graduation (% Graduates, With/Without Dependents) 134
Figure 6.15: Distribution of Debt at Graduation (% Graduates, by Mother's Education) 136
Figure 6.16: Distribution of Debt at Graduation (% Graduates, by Father's Education) 138
Figure 6.17: Distribution of Projected Debt at Graduation, Students by Blacks & Non-Minority Groups 139
Figure 6.18: Distribution of Projected Debt at Graduation, Students by South Asian & Non-Minority Groups 139
Figure 6.19: Distribution of Projected Debt at Graduation, Students by Chinese & Non-Minority Groups 140
Figure 6.20: Distribution of Projected Debt at Graduation, Students by Southeast Asian & Non-Minority Groups 140
Figure 6.21: Articling Placement Decisions Adversely Affected 'To a Great Extent', by Debt Size (% Students by Year & Graduates) 146
Figure 6.22: Type of Law to be Practised Adversely Affected 'To a Great Extent', by Debt Size (% Students by Year & Graduates) 148
Figure 6.23: Choice of Law Subjects Studied Adversely Affected 'To a Great Extent', by Debt Size (% Students by Year & Graduates) 150
Figure 6.24: Purchase of Texts Adversely Affected 'To a Great Extent', by Debt Size (% Students by Year & Graduates) 152
Figure 6.25: Academic Achievement Adversely Affected 'To a Great Extent', by Debt Size (% Students by Year & Graduates) 153
Figure 6.26: Satisfaction with Law School Experience Adversely Affected 'To a Great Extent', by Debt Size (% Students by Year & Graduates) 155
Figure 6.27: Family/Personal Relationships Adversely Affected 'To a Great Extent', by Debt Size (% Students by Year & Graduates) 157
Figure 6.28: Basic Needs Adversely Affected 'To a Great Extent', by Debt Size (% Students by Year & Graduates) 158
EXECUTIVE SUMMARY
Introduction: The Study of Accessibility to Ontario Law Schools was commissioned by the Law
Deans from five Ontario universities, and funded by the Law Society of Upper Canada and the Law
Foundation of Ontario. The five law schools engaged in the study were Osgoode Hall at York
University and the faculties of law at: the University of Ottawa (both the English and French
Common Law Programs), Queen’s University, the University of Western Ontario and the University
of Windsor. The Social Program Evaluation Group at Queen’s University conducted the study.
The Faculty of Law at the University of Toronto did not participate in this research study because the
university had recently completed its own internal study (Neuman, 2003).
Purpose of the Study: The overall purpose of this study was fourfold: (1) to describe the
demographic characteristics of law school students in the five Ontario law schools; (2) to determine
whether the demographic characteristics of law students have changed since tuition deregulation;
(3) to determine whether there have been changes in the types and amounts of student financial
support since tuition deregulation; and (4) to examine the amount of debt incurred by students in law
school and the impact of debt on their lives.
The study was not intended to evaluate individual law programs or to identify barriers to entry for
prospective applicants to Ontario Bachelor of Laws programs. Neither was the study intended to
assess the appropriateness of tuition increases.
Information Sources:
• financial assistance programs, including the Ontario Student Assistance Program (OSAP), Canada Millennium Scholarship Foundation Bursary Program, university and law school financial aid programs;
• Ontario Law School Application Service (OLSAS) data files and yearly reports;
• Statistics Canada;
• a survey of students from Years 1, 2 and 3 in five law schools by means of questionnaires – 2,260 respondents;
• an online or mailed survey of law graduates (years 2000 to 2003) – 966 respondents;
• student focus group sessions held in each of the five law schools;
• interviews with key informants from each law school about admissions and financial aid programs; and,
• an extensive literature review.
i
EXECUTIVE SUMMARY
•
Findings:
1. Who goes to law school?
• Ontario law schools have a diverse student population in relation to ethnocultural background, mature student status, disability status and geographic region of origin, in keeping with their admissions goals related to diversity.
• There are some differences in the characteristics between students at the five Ontario law schools and their approximate age group in the Ontario population; that is, law schools enrol proportionally:
- more women than men, as is the case with university programs in general;
- more students from affluent homes headed by parents with a university education (two-thirds of law students come from the top 40 percent of the family income distribution and about 10 percent from the bottom 40 percent of the distribution);
- more students of Arab, Chinese, Korean and South Asian descent;
- fewer Aboriginal students; and,
- more students from the Greater Toronto Area and fewer from Northern Ontario.
2. Have there been changes in the characteristics of law students since tuition deregulation?
There have been some slight but notable changes in the characteristics of law school enrolees over the past seven years that may be attributed to tuition deregulation. They include:
- an increase of 4.7 percent in the proportion of law students’ parents who earn incomes in the top 40 percent of the average family income distribution for Canada and a decrease in the proportion of students whose parents earn incomes in the middle 20 percent of the distribution;
- an increase in the proportion of 24 and 25 year old Year 1 registrants; and a decline in the proportion of registrants 23 and younger, indicating that a higher proportion of Year 1 registrants are entering law school later than did their pre-tuition deregulation counterparts;
- an increase in the proportion of visible-minority students, particularly those individuals of South Asian and Chinese descent;
- a decrease in the proportion of students whose first language is French; and,
- a decrease in the already small proportion of students from Northern Ontario.
3. What are the major sources of financial support for law school students, and have they
changed since tuition deregulation? Since the deregulation of tuition for professional programs at the end of 1997, tuition fees at four
of the five Ontario law schools have more than doubled, and tuition at the other has more than
tripled. Over this same period, the cost of law school excluding tuition—i.e., ancillary fees, living
expenses and law program expenses (e.g., books, duplicating and other supplies)—has
ii
EXECUTIVE SUMMARY
increased by 14 percent based on changes in the Consumer Price Index (between 1998 and
2003).
a. University/Law School Bursaries and Scholarships
• The primary sources of financial aid distributed by the law schools are needs-based bursaries and merit scholarships.
• Over the past five years, there has been a dramatic increase in the total amount of bursary money awarded to students in financial need at the five law schools. This increase parallels the Ontario government’s legal requirement of universities to redirect a minimum of 30 percent of all deregulated tuition to needs-based student financial aid.
• One-fifth of current law students cited university/law school bursaries and scholarships as a major source of financial support, and over two-fifths of current students reported that they were at least a moderate source.
• In 2003-04, the average bursary amount granted per student at the five law schools
ranged from $2,059 to $4,752 and the percentage of students receiving bursaries ranged from 46.8 percent to 68.5 percent.
• For most students receiving the maximum bursaries, these awards cover the cost of their tuition. However, for over one-half of current students tuition increases have added to the cost of their legal education.
• Scholarships/awards/prizes are typically awarded based on assessments of a student’s academic performance; however, at least two of the five law schools have a number of ‘needs-based’ scholarships that assess a student’s financial need in combination with academic achievement.
• There are more entrance scholarships than upper year scholarships, meaning that a disproportionate amount of scholarship money is awarded to Year 1 students.
• Between 11.2 and 18 percent of students across the five law schools received scholarships, awards and prizes in 2003-04 and the average scholarship/award/prize amount granted per student ranged from $1,313 to $3,736.
• While the total monies allocated to scholarships/awards/prizes have increased in recent years, the number of students receiving this type of funding has not changed substantially.
b. Government Loans, Bursaries and Grants
• The provincial and federal governments fund post-secondary educational loans jointly through the Canada-Ontario Integrated Student Loan Program (administered by OSAP). Students who wish to receive government loans must apply to the Ontario Student Assistance Program (OSAP) and submit evidence of their financial need. Ontario law students are eligible to receive a maximum of $9,350 in government loans per academic year. When surveyed, over one-half of Year 2 and 3 respondents held OSAP-administered student loans. A greater proportion of students than graduates considered OSAP-administered loans to be ‘little or no source of financial support’. This result is not surprising given that the maximum amount of OSAP funding has not increased in nine years and has, therefore, decreased in real terms as a proportion of law school costs.
iii
EXECUTIVE SUMMARY
• A Canada Millennium Bursary is a federal government bursary that pays $3,000 per academic year to students in financial need who have already completed some post-secondary education. In Ontario, OSAP assesses students’ financial need and overall eligibility for the Canada Millennium Bursary. If a student qualifies for the Millennium Bursary in Ontario, he/she receives an OSAP loan amount that is reduced by the bursary amount. One-quarter of Years 2 and 3 law students and one-fifth of Year 1 law students consider the Canada Millennium Bursary to be a major source of financial support. The Canada Millennium Bursary was first awarded in 2000 and has not increased in amount since then.
• The provincial government provides funding for part-time student employment through the Ontario Work Study Plan administered by OSAP (up to a maximum of $1,000 per term); nevertheless, very few students appear to take advantage of this program.
• While over 17 percent of law students at the five Ontario law schools are originally from other provinces, less than 3 percent of current students report that out-of-province government loans represent a major funding source. Twice as many graduates as students relied on government loans from other provinces as a major source of financial support.
• Approximately one percent of law students rely on First Nation Education Authority Grant funding as a major source of financial support, a number consistent with the representation of grant-eligible Aboriginal students within the law student population. More current students than graduates report that First Nation Education Authority Grant funding is a major source of financial support.
c. Family Support
• Parents represent a major source of financial support for just over one-quarter of current law students. The proportion of students indicating that their parents are a major source of financial support was similar to that of graduates.
• Students who identify parents as a major source of financial support are far less likely to incur substantial debt while at law school.
• The proportion of students indicating personal loans (typically from parents) as a major source of financial support has increased slightly since tuition deregulation. Personal loans are preferable to other types of loans because they involve minimal or no interest payments and tend to have flexible repayment schedules. Approximately 13 percent of Year 2 and 3 students had personal loans.
d. Paid Part-Time/School-Year Jobs
• About one-fifth of Year 1 and about two-fifths of Years 2 and 3 students held part-time jobs at the time of the survey, and one-fifth of the students who worked did so for over 16 hours a week.
• Surprisingly, fewer current law students worked part time than did law graduates.
• The majority of current law students who worked during the school year did so in order to defray program-related costs.
• Although those students who take on paid employment while at school may reduce their debt, some believe that their academic performance is negatively affected due to the time that they are required to spend doing paid work.
• More than half of Year 2 and 3 students who had paid employment worked in law-related positions.
iv

EXECUTIVE SUMMARY
e. Bank Loans, Lines of Credit and Credit Cards
• Of all the sources of financial support available to law students, banks represent one of the few resources providing loans amounts that surpass tuition fees at the Ontario law schools. Some Ontario law schools have recognized the importance of bank funding for students by making special arrangements for their students with a particular bank(s) although most major banks already offer special rates to individuals in professional programs.
• Few students entered a law program holding bank loans; however, when in Years 2 and 3, approximately one-half of students cited bank loans as a major source of financial support.
• Current law students were more likely than graduates to use bank funding to manage their debt.
4. What is the impact of debt on students?
a. What is the extent of law student debt?
• There has been a slight increase in the median debt at program entry reported by students entering the law program at the five Ontario law schools since the deregulation of tuition for professional programs. During this time, nearly one-half of students entered law school with no debt.
• One-fifth of all current law students expected to graduate from law school with no debt, but 27 percent expected to have debt of $40,000 to $70,000 and 13 percent expected to graduate with over $70,000 of debt.
• Current students projected more debt at graduation than the actual debt reported by graduates.
b. What are the characteristics of students with more or less debt?
• Black students and students of South Asian background were more likely than non-minority students to anticipate having debt at exit from their law program (greater than $40,000) and were less likely to anticipate having no-debt at graduation. Students of Southeast Asian background were more likely than non-minority students to anticipate having debt at exit from their law program greater than $60,000. Students of Chinese background were less likely to have high debt and were more likely to have no debt than non-minority students.
• Older students and those students and graduates with dependents tended to project or have had more debt at graduation from law school than did younger students and students and graduates without dependents. For graduates, slightly more women had high debt and more men had low debt.
• For students and graduates with low debt, personal savings and parents were the primary sources of support, while for students and graduates with high debt, bank and government loans provided the major portion of educational funding.
• Graduates, especially those with low debt, relied more than students on their savings as a major source of funding their legal education. Students with low debt were far more likely than graduates to indicate that their parents were a major source of financial support. High-debt students were more likely than graduates to indicate that bank loans were a major source of funding and were less likely than graduates to indicate that OSAP was a major source of financial support.
v
EXECUTIVE SUMMARY
c. What aspects of students’ lives are affected by their debt load?
• Students with debt tended to view it as having a significant adverse impact on important aspects of their academic and personal life, including articling and practising decisions, satisfaction with the law school experience, basic needs and family/personal relationships. While some students felt that their rapidly accumulating debt was affecting every aspect of their lives, other students were untouched by concerns about debt, the need to work part time and how debt affected career planning.
• Approximately 30 percent of Year 2 students with debt (65.1% of Year 2 respondents) indicated that their debt had a substantial effect on their articling and practising decisions; for example, many felt obliged to seek out high-paying positions rather than those in public service or smaller communities. A greater proportion of students would have preferred to work in public-service settings than there are employment opportunities available.
• Law students’ achievement is functionally linked to the articling process and, ultimately, their professional career from the moment that they begin the law program. Students believe that their financial circumstances limit their ability to achieve academically as well as their opportunities to article and practise in desired settings.
• For current students with high debt, the area of law in which they hoped to practise was the aspect of their academic and personal lives that they believed was most affected by their debt. In comparison, graduates with high debt claimed that their satisfaction with the law school experience was the aspect of their lives most adversely affected by their debt.
• Upper year students in the moderate to high debt categories were the most likely of all respondent groups to report that a particular aspect of their academic or personal lives was affected ‘to a great extent’ by their debt, while graduates were the least likely of all respondent groups to report that their lives were greatly impacted by their debt.
• It appears that, since tuition deregulation, more students have felt the impact of debt on all aspects of their lives than did graduates.
• The wide variability in student debt and in articling and employment prospects generates tension in an atmosphere where the vast majority of students view a fair and open competition for highly valued articling/practising positions as extremely important.
Future Directions: The following suggestions for change are general in nature and would require
more detailed development prior to implementation.
1. Increase Maximum Assistance from OSAP The Ontario Student Assistance Program currently has a cap of $9,350 a year. This amount
represents less than half of the total annual cost of law school; consequently, more and more law
students are turning to banks in order to deal with their debt. OSAP offers better terms as well as
standardized conditions of repayment and should, therefore, increase maximum amounts available
to students in professional programs such as law.
vi
EXECUTIVE SUMMARY 2. Examine the Feasibility of a Debt-Relief Program A number of debt-relief programs exist in other jurisdictions and are designed to serve law graduates
who enter public service and other relatively low-paying careers. Programs incorporating
components such as income-contingent tuition fees and loan forgiveness could be examined for
their appropriateness in the management of law students’ projected and real debt. If a province-
wide debt-relief program were introduced, a standardized approach to administration could be
undertaken by an existing agency such as OSAP. This approach would encourage fairness and
consistency in program delivery.
3. Refine the Work Study Plan The Work Study Plan financed through OSAP appears to need fine-tuning. The rate of pay available
to students in the program should be consistent with other part-time work opportunities, and the
nature of the work funded through the plan should clearly be relevant to the practice of law.
4. Align Bursary Allocations More Consistently with Student Financial Need There has been a substantial increase in bursary money available to students from law schools over
the past few years. Generally speaking, this money has been made available to students on the
basis of financial need. More precise targeting of bursary funds to students with the greatest
financial need would be beneficial.
5. Ensure Openness, Fairness and Support for Students in Search of Articling Positions It is difficult to know how to relieve the pressure on students created by the intensely competitive
environment in law school regarding academic achievement and the search for optimum articling
settings. This tension is further exacerbated by some students’ concerns about debt repayment and
perceptions of how opportunities for success at school and in their careers are affected by their
financial circumstances. Ensuring equal opportunity to participate in articling interviews and law
program-related activities for all students is a laudable goal, but may be impossible to achieve.
Nevertheless, maintaining and building on the student support system already in place in the law
schools is worth the effort required.
vii
ACKNOWLEDGEMENTS
This report was commissioned by five Deans of Law: Dean Patrick Monahan, Osgoode Hall Law
School, York University; Dean Bruce Feldthusen, Faculty of Law, University of Ottawa; Dean Alison
Harvison Young, Faculty of Law, Queen’s University; Dean Ian Holloway, Faculty of Law, University
of Western Ontario; and, Dean Bruce Elman, Faculty of Law, University of Windsor. The Deans
acted as advisors over the course of the project.
The Project Advisory Committee comprised the Deans of the five law schools, five technical
advisors, faculty and student representatives, and representatives from The Law Society of Upper
Canada and the Canadian Bar Association. The faculty representatives were as follows: Ben
Richardson (Chair, Admissions Committee, Osgoode Hall); Bill Bogart (faculty, University of
Windsor); Michael Lynk (faculty, University of Western Ontario); Yves LeBouthillier (Vice Dean,
French Common Law, Université d’Ottawa); Larry Chartrand (faculty, University of Ottawa); Helen
Connop (Manager, Education & Equity Services, Queen’s University); and, Anita Anand (faculty,
Queen’s University). The student representatives were as follows: Jennifer Goulin, Alexis Levine
and Sam Rappos (Osgoode Hall); Robert Wright and Jiku Elamathail (University of Windsor); Shawn
Pulver (University of Western Ontario); Dawn Palin (Ottawa); and, Trevor Shaw (Queen’s
University). The Law Society of Upper Canada representatives were: Vern Krishna, Paul Copeland
and Josée Bouchard. The Canadian Bar Association representative was Charles Smith.
The five technical advisors, also members of the Project Advisory Committee, assisted the research
team with piloting the questionnaire items with faculty and students, as well as providing financial,
registration and other pertinent information. The project benefited from the commitment and
dedication of the technical advisors: Gina Alexandris (Assistant Dean, Students Services, Osgoode
Hall; Michelle Pilutti (Assistant Dean, Faculty of Law, University of Windsor; Beryl Theobald (Director
of Admissions, Faculty of Law, University of Western Ontario; Joanne Chartrand (former Assistant to
the Dean, Faculty of Law, University of Ottawa); and, Ann Tierney (Assistant Dean, Faculty of Law,
Queen’s University). Ann Tierney coordinated the project on behalf of the Deans, and reviewed this
report for validity and consistency.
We are grateful for the indefatigable efforts of members of our research team: as research
associate/computer analyst, Matthew King was responsible for the data analysis and ensuring data
accuracy; as computer analyst, Bill Orme supervised data entry and conducted the computer
analyses of the survey data; and as administrative secretary, Diane Yocum was responsible for word
processing and coordination of all parts of the report.
viii
CHAPTER I - INTRODUCTION
A. Introduction
The Study of Accessibility to Ontario Law Schools was sponsored by the Law Deans from five
Ontario universities, and funded by the Law Society of Upper Canada and the Law Foundation
of Ontario. The five law schools engaged in the study were Osgoode Hall at York University
and the faculties of law at the University of Ottawa (both the English and French Common Law
Programs), Queen’s University, the University of Western Ontario and the University of
Windsor.1 The study was conducted by the Social Program Evaluation Group at Queen’s
University.
University administrators, members of the law profession, student groups, and the general
public have become concerned over the past seven years that access to a legal education for
potential candidates (especially those from lower income backgrounds, ethnocultural groups
and Aboriginal communities) may have been limited by tuition increases. This study was
initiated to understand more about the effects of increases in the cost of a legal education since
the 1997 deregulation of tuition fees.
This chapter outlines the purpose and objectives of the study, the role of study advisory groups,
a brief history of Ontario law schools, the research methodology and the organization of the
report.
B. Purpose of the Study The overall purpose of the study was fourfold: (1) to describe the demographic characteristics of
law school students in the five Ontario law schools; (2) to determine whether the demographic
characteristics of law students have changed since tuition deregulation; and, (3) to determine
whether there have been changes in the types and amounts of student financial support since
tuition deregulation; and (4) to examine the impact of debt on students’ lives at law school as
well as the later impact of debt on their articling and career decisions.
1 The Faculty of Law at the University of Toronto did not participate in this research study because the
university had recently completed its own internal study (Neuman, 2003).
1
Chapter I - Introduction
Specifically, the questions addressed by the research were as follows:
1. What are the background characteristics of students who applied to and enrolled in Ontario
law school programs from 1997 to 2003? Are these students representative of the Ontario
population and Canadian society in general?
2. If there have been changes in these background characteristics, what are they and to what
extent might they be associated with increased law school tuition costs and projected
student debt load?
3. Have increases in law school tuition costs over the past five years contributed to more
student debt at graduation and, if so, what is the magnitude of the change?
4. Has university-based financial aid (bursaries and scholarships) increased in proportion to
law school tuition increases?
5. Has government-based financial aid increased in proportion to law school tuition increases?
6. Have the major sources of student financial support changed over the past five years?
7. To what extent does debt load affect students’ decision making regarding articling positions
and career decisions?
8. Would financial aid incentives (e.g., loan forgiveness programs, favourable repayment
options) help increase student accessibility to Ontario law schools?
The study was not intended as a program evaluation. It was not designed to examine or assess
any particular aspect of the Bachelor of Laws program as it is offered in the five Ontario law
schools (e.g., the admissions decision-making process, academic offerings). In particular, the
study was not designed to identify the barriers to entry that exist for prospective applicants to
Ontario Bachelor of Laws programs. Neither was the study intended to assess the
appropriateness of tuition increases.
2
Chapter I - Introduction
C. Advisory Groups A Project Advisory Committee, that comprised 18 members, assisted in refining methodologies,
encouraging the support of the various stakeholders, reviewing the research instruments,
interpreting the findings, and developing a communication plan for the study findings. The
committee included the following members: the five Law Deans; the Vice-Dean, Common Law,
French Language Program, University of Ottawa; a faculty representative from each law school;
a student representative from each law school; and one representative from each of the Ontario
Bar Association and the Law Society of Upper Canada. This group met twice throughout the
course of the study.
Each university’s law faculty had an internal Advisory Committee to assist in laying the
groundwork for the study in their school, reviewing data collection procedures, suggesting
program-specific items on the instruments, and monitoring the study’s administration. Advisory
Committee members also facilitated communication between the researchers and participating
law school personnel for the review of the instruments prior to their implementation.
A technical advisor from each of the law schools provided essential information to the research
team at the design and analysis stages of the study. These advisors were in close contact with
the team and were particularly helpful in facilitating data collection and analysis.
D. Brief History of Ontario Law Schools2 Despite the English ancestry of the common law system in Canada, the Canadian model of
legal education more closely resembles the American model, rather than that of the United
Kingdom.
The first common law school to open in Canada was at Dalhousie University, in 1883.
Dalhousie’s Law School was closely modeled after Harvard’s law school, and it eventually
became the model for almost every other law school in Canada outside of Quebec. In Ontario,
however, the story of today’s law schools is slightly more complicated.
2 Thanks to Dr. Ian Holloway, Dean, Faculty of Law, University of Western Ontario for kindly contributing
this historical account.
3
Chapter I - Introduction
Shortly after the founding of the Dalhousie Law School, several Ontario universities, including
the University of Western Ontario, Queen’s University, the University of Ottawa and the
University of Toronto, created their own law faculties. But within a couple of years, the Law
Society of Upper Canada, which possessed a statutory monopoly over the practice of law in
Ontario at that time, forced the closure of the Ontario law schools by refusing to recognize
university-based legal education as a basis for membership in the bar. Instead, the Society
maintained its own law school at Osgoode Hall.
It was only in 1957, after a protracted struggle between the Ontario universities (led by
Professor C.A. Wright of the University of Toronto) and the Law Society, that the Law Society
acknowledged that a university-taught LLB should form an obligatory component of a lawyer’s
professional education. Thereafter, the nineteenth century law schools reopened: Toronto,
Queen’s and Ottawa, in 1957, and Western in 1959. The Osgoode Hall Law School was
transferred from the Law Society to York University in 1968. The Faculty of Law at the
University of Windsor admitted its first class in that same year. In 1977, the common law
section of the Faculty of Law at the University of Ottawa began to offer courses in French.
Ottawa’s Common Law section is now composed of two common law programs, one in English
and one in French.
An integral part of a legal education in Ontario continues to be the placement of a recent law
graduate with a practising lawyer. This internship, called ‘articling’, provides recent graduates
with practical legal experience before they begin formal practice. The term ‘articling’ derives
from:
…the articles of clerkship, which constitute the written, formal agreement between the master and the clerk (the student). At one time, articles were purely a private agreement between a lawyer and his student, but, today the articling relationship is usually defined and regulated by provincial law societies that enjoy the delegated authority to make rules for the student members under articles. (John Law, 2001-02)
The Law Society of Upper Canada (LSUC) regulates the legal profession in Ontario.
4
Chapter I - Introduction
E. Research Methodology This section describes the research design and sources of information.
1. Research Design The study was designed to simulate a longitudinal analysis of change over a seven-year
period. That is, the study was to involve graduates from the past four years (2000, 2001,
2002 and 2003) who report retrospectively on their law school experience, as well as the
three classes of current law students expected to graduate in 2004, 2005 and 2006. This
perspective was designed to reflect the pre- and post-tuition deregulation period. There are
limitations associated with collecting data at one point in time, in that such data is dependent
on respondents’ ability to accurately recall events and because the events occurring at that
point in time may influence their responses. For example, data were collected when the
second year summer hiring process was occurring at all law schools and when intense
deliberations surrounding proposed tuition hikes were taking place at Osgoode Hall.
Consequently, these caveats should be kept in mind when interpreting the data.
2. Sources of Information
The research team obtained data from the following sources:
a. Financial assistance programs (e.g., OSAP-administered loans, university and law
school financial aid including awards, bursaries and scholarships since 1997).
b. Ontario Law School Application Service (OLSAS)
i. OLSAS data file – select information on applicants (e.g., birth year, emergency
contact). All identifying information had been removed from the file as had all
information pertaining to the University of Toronto Law School.
ii. OLSAS annual reports of applications, offers of admission and registrations for
the Ontario law schools. c. Statistics Canada (StatCan) information on a variety of demographic and
socioeconomic status variables related to the Ontario and Canadian populations.
d. Law school records (for deferrals, attrition and graduation data since 1997).
e. Questionnaire administered to students enrolled in the law programs at the five
universities as of the 2003-04 academic year. The survey items were developed in
consultation with faculty, students and staff at each law school and through pilot
testing with a small group of students from all years of the law program. The survey
items addressed the following themes:
5
Chapter I - Introduction
i. student characteristics (i.e., place of birth, place of parents’ birth, citizenship,
ethnocultural background, parents’ occupation and education, age, gender,
language, sexual or gender identity, secondary school and post-secondary
education status, undergraduate program, marital status, dependents);
ii. law schools applied to and reason for first choice law school;
iii. future career plans (i.e., preferred and expected type of articling placement and
practice, setting, region);
iv. sources of financial support (i.e., part-time work, financial aid, other sources);
v. debt at entry and projected debt at exit; impact of debt;
vi. satisfaction with and recommendations to improve financial assistance programs
f. Questionnaire administered to graduates since 2000. The survey was available
electronically via the Internet and a hard copy of the survey was also enclosed in the
introductory letter mailed to graduates from each Law Dean. Most Graduate Survey
items were identical to those on the Student Survey. The themes of the Graduate
Survey were as follows: i. graduate characteristics (i.e., place of birth, place of parents’ birth, citizenship,
ethnocultural background, parents’ occupations and education, age, gender,
language, sexual or gender identity, secondary school and post-secondary
education status, undergraduate program, marital status, dependents);
ii. law schools applied to and reason for first choice law school;
iii. current employment; career plans (e.g., type of work, region); language of
practice
iv. sources of financial support (i.e., part-time work, financial aid, other sources);
v. debt at entry and exit; impact of debt;
vi. satisfaction with and recommendations to improve financial assistance programs.
Copies of both questionnaires can be found in Appendix A.
g. Focus group sessions with each year’s students (two small groups per year) at the
five law schools lasting up to one and a half hours. These sessions provided an
opportunity to clarify, elaborate on and validate issues addressed on the
questionnaire. They were not used as a primary source of data on the key variables.
They were designed to provide further information on the decision to enter the law
profession and elaborate on survey responses about the law school experience and
the impact of debt.
6
Chapter I - Introduction
The focus group topics included: factors that influenced students’ decisions to enter
law, their choice of program, their selection of articling placements and area of
specialization; the impact of their debt load; and their views about accessibility to the
program and the law school’s financial aid initiatives (see Appendix C).
h. Interviews with Student Services personnel about financial aid programs and the
admissions process.
i. An extensive review of the literature.
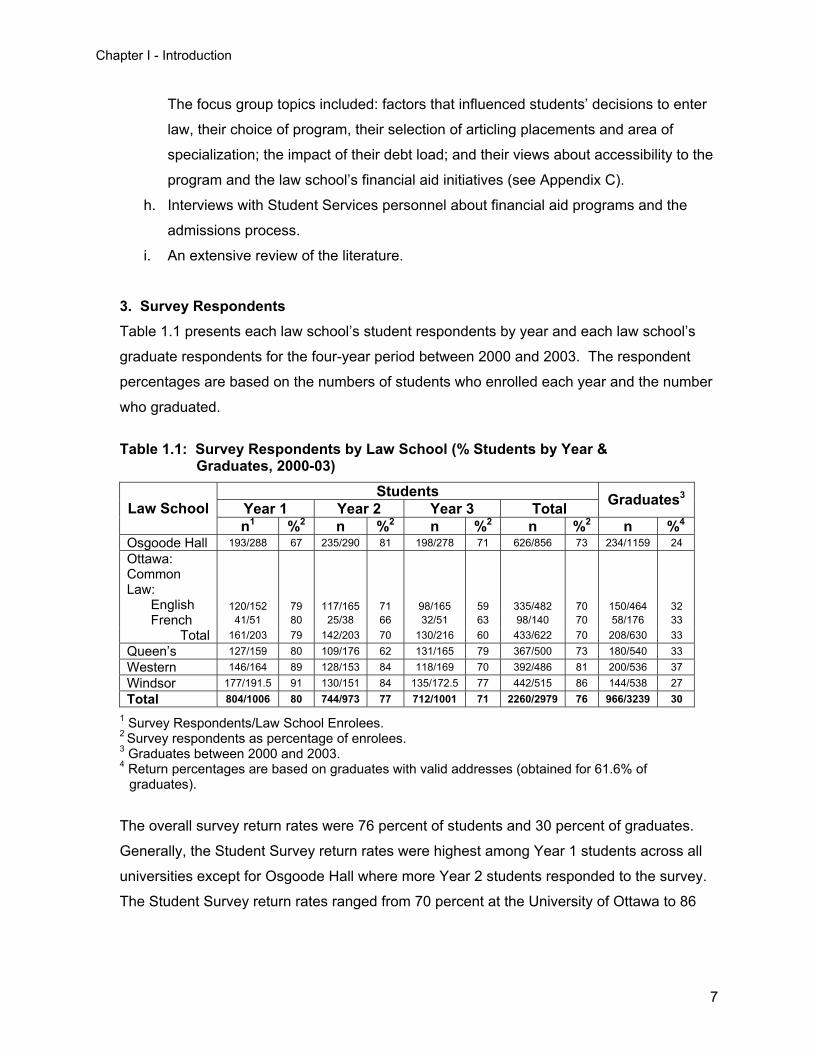
3. Survey Respondents Table 1.1 presents each law school’s student respondents by year and each law school’s
graduate respondents for the four-year period between 2000 and 2003. The respondent
percentages are based on the numbers of students who enrolled each year and the number
who graduated.
Table 1.1: Survey Respondents by Law School (% Students by Year &
Graduates, 2000-03)
Students Year 1 Year 2 Year 3 Total Graduates3 Law School n1 %2 n %2 n %2 n %2 n %4
Osgoode Hall 193/288 67 235/290 81 198/278 71 626/856 73 234/1159 24 Ottawa: Common Law: English 120/152 79 117/165 71 98/165 59 335/482 70 150/464 32 French 41/51 80 25/38 66 32/51 63 98/140 70 58/176 33
Total 161/203 79 142/203 70 130/216 60 433/622 70 208/630 33 Queen’s 127/159 80 109/176 62 131/165 79 367/500 73 180/540 33 Western 146/164 89 128/153 84 118/169 70 392/486 81 200/536 37 Windsor 177/191.5 91 130/151 84 135/172.5 77 442/515 86 144/538 27 Total 804/1006 80 744/973 77 712/1001 71 2260/2979 76 966/3239 30
1 Survey Respondents/Law School Enrolees. 2 Survey respondents as percentage of enrolees. 3 Graduates between 2000 and 2003. 4 Return percentages are based on graduates with valid addresses (obtained for 61.6% of
graduates).
The overall survey return rates were 76 percent of students and 30 percent of graduates.
Generally, the Student Survey return rates were highest among Year 1 students across all
universities except for Osgoode Hall where more Year 2 students responded to the survey.
The Student Survey return rates ranged from 70 percent at the University of Ottawa to 86
7
Chapter I - Introduction
percent at the University of Windsor. Graduate Survey returns ranged between 24 percent
at Osgoode Hall and 37 percent at the University of Western Ontario. Slightly more than
43 percent of graduate respondents completed the survey online, while almost 57 percent
completed a hard copy of the questionnaire (some graduates did both). Approximately
58 percent of both student and graduate respondents were female (see Table B-1 in
Appendix B).
Tables B-2 and B-3 in Appendix B present the numbers and percentages of student and
graduate respondents, respectively, by program/registrant type and by law school and year.
Approximately 94 percent of English law program enrolees and 98 percent of French
Common Law enrolees were registered full time in the regular Bachelor of Laws (LLB)
program at four universities. At the University of Windsor, 86.5 percent were registered full
time in the regular program and 11.6 percent in one of the two joint programs (the JD/LLB
program a collaboration between the University of Windsor Faculty of Law and the
University of Detroit Mercy School of Law, and the MBA/LLB in conjunction with the Odette
School of Business at Windsor). Very few graduates were enrolled in a joint program (the
range was from one student and University of Windsor to five at Osgoode Hall and the
University of Ottawa).
F. Individual Law School Reports Findings varied across law schools. A report of findings has been prepared for each law school.
In these confidential reports, each law school’s findings have been compared with the range of
findings from the other four law schools. We suggest that reviewers from the individual law
schools consider the findings from their report in the context of this larger report.
G. Organization of the Report The study’s findings are reported as responses to the specific research questions posed in this
introductory chapter. An attempt has been made to contextualize findings in order to facilitate
the reader’s understanding of issues that may be specific to a legal education in Ontario.
Relevant research literature has been integrated into the text, where appropriate.
Students’ verbatim comments from the questionnaires and focus groups have been used to add
some depth and context to the themes that appear in the data. Typically, the comments were
selected to represent the proportion of those individuals who gave a specific response to a
8
Chapter I - Introduction
9
given survey question, and, therefore, the quotes should be considered in light of the
responses shown in an adjacent table.
At the end of each chapter, the findings that apply to the research questions raised in the
introduction to the chapter are summarized.
The report is organized into seven chapters: Chapter II – The Law Profession; Chapter III –
Costs of Attending Five Ontario Law Schools and Financial Supports; Chapter IV –
Characteristics of Law Students; Chapter V – Changes Over Time in Law Student
Characteristics; Chapter VI – Debt and Impact of Debt; and Chapter VII – Summary and Future
Directions. In the final chapter, the findings are summarized and recommendations are offered.
CHAPTER II – THE LAW PROFESSION
A. Introduction In this chapter, we examine the attraction that the law holds for individuals, the factors that
affect their decision to enter law and the evolution of their perceptions of the careers they would
like to follow as they proceed through their law school program and into the actual practice of
law. Two themes are discussed that relate to the larger purpose of the study. The first is
concerned with changes in the application rates to law schools that might be associated with
increased tuition, and the second is concerned with the role that tuition plays in the decision to
attend a particular law school. The remainder of the chapter is designed to provide context for
the later discussion in Chapter VI on the impact of debt on students and graduates: the
program, law-related activities, and decisions that students must make during their law school
years are examined.
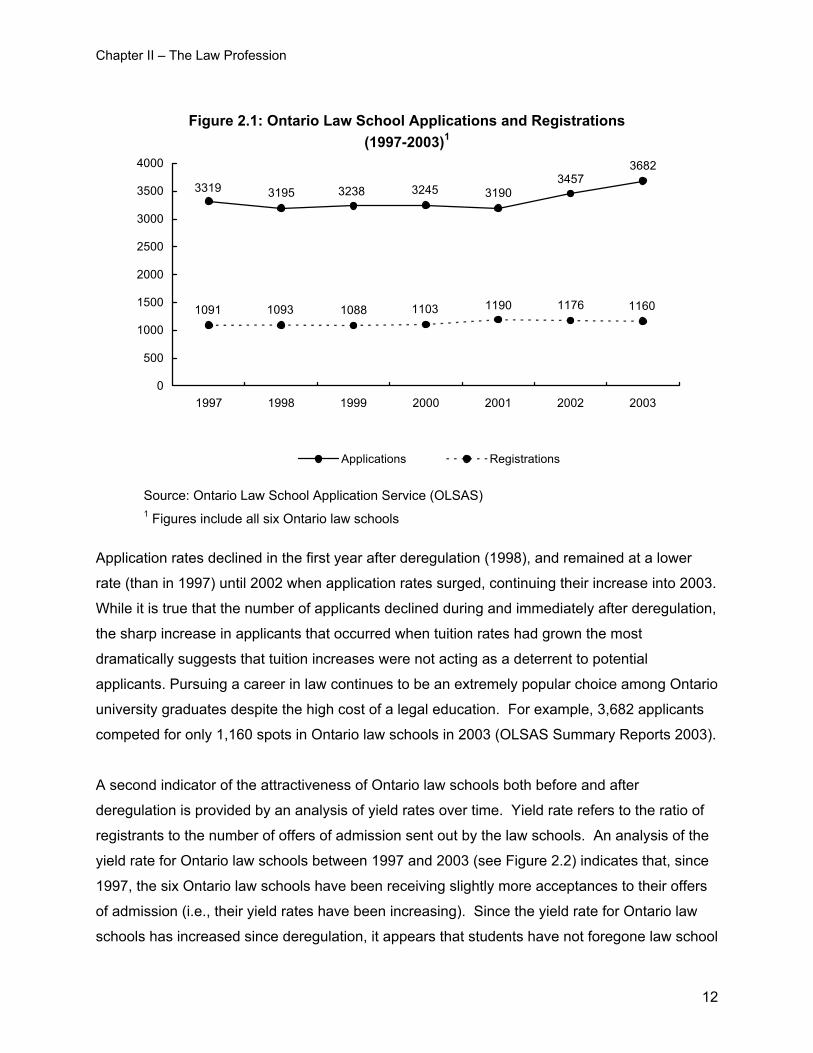
B. Application Rates to Law Schools Trends in the number of applications to law school is one indication of the overall popularity of a
career in law. Specific to this study is the question: Do law schools continue to attract highly
qualified applicants despite tuition fee increases? In order to answer this question, we examine
application rates to Ontario law schools, the proportion of accepted students who actually enrol
in each law school, and the academic achievement of applicants both before and after the
provincial government’s deregulation of professional programs’ tuition. Figure 2.1 presents the
numbers of students who applied to and registered in Ontario law schools from 1997 to 2003.
11
Chapter II – The Law Profession
Figure 2.1: Ontario Law School Applications and Registrations (1997-2003)1
3682
3319 3195 3238 3245 31903457
11601091 1093 1088 1103 1190 1176
0
500
1000
1500
2000
2500
3000
3500
4000
1997 1998 1999 2000 2001 2002 2003
Applications Registrations
Source: Ontario Law School Application Service (OLSAS) 1 Figures include all six Ontario law schools
Application rates declined in the first year after deregulation (1998), and remained at a lower
rate (than in 1997) until 2002 when application rates surged, continuing their increase into 2003.
While it is true that the number of applicants declined during and immediately after deregulation,
the sharp increase in applicants that occurred when tuition rates had grown the most
dramatically suggests that tuition increases were not acting as a deterrent to potential
applicants. Pursuing a career in law continues to be an extremely popular choice among Ontario
university graduates despite the high cost of a legal education. For example, 3,682 applicants
competed for only 1,160 spots in Ontario law schools in 2003 (OLSAS Summary Reports 2003).
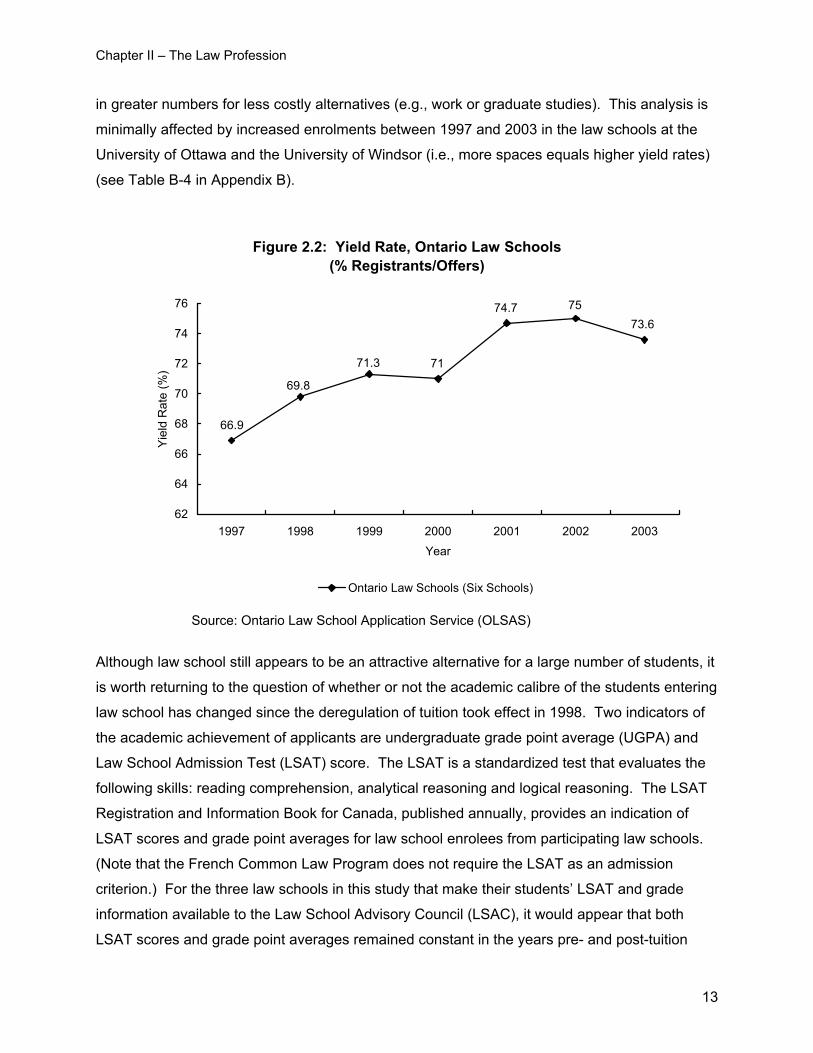
A second indicator of the attractiveness of Ontario law schools both before and after
deregulation is provided by an analysis of yield rates over time. Yield rate refers to the ratio of
registrants to the number of offers of admission sent out by the law schools. An analysis of the
yield rate for Ontario law schools between 1997 and 2003 (see Figure 2.2) indicates that, since
1997, the six Ontario law schools have been receiving slightly more acceptances to their offers
of admission (i.e., their yield rates have been increasing). Since the yield rate for Ontario law
schools has increased since deregulation, it appears that students have not foregone law school
12
Chapter II – The Law Profession
in greater numbers for less costly alternatives (e.g., work or graduate studies). This analysis is
minimally affected by increased enrolments between 1997 and 2003 in the law schools at the
University of Ottawa and the University of Windsor (i.e., more spaces equals higher yield rates)
(see Table B-4 in Appendix B).
Figure 2.2: Yield Rate, Ontario Law Schools (% Registrants/Offers)
73.67574.7
7171.3
69.8
66.9
62
64
66
68
70
72
74
76
1997 1998 1999 2000 2001 2002 2003
Year
Yie
ld R
ate
(%)
Ontario Law Schools (Six Schools)
Source: Ontario Law School Application Service (OLSAS)
Although law school still appears to be an attractive alternative for a large number of students, it
is worth returning to the question of whether or not the academic calibre of the students entering
law school has changed since the deregulation of tuition took effect in 1998. Two indicators of
the academic achievement of applicants are undergraduate grade point average (UGPA) and
Law School Admission Test (LSAT) score. The LSAT is a standardized test that evaluates the
following skills: reading comprehension, analytical reasoning and logical reasoning. The LSAT
Registration and Information Book for Canada, published annually, provides an indication of
LSAT scores and grade point averages for law school enrolees from participating law schools.
(Note that the French Common Law Program does not require the LSAT as an admission
criterion.) For the three law schools in this study that make their students’ LSAT and grade
information available to the Law School Advisory Council (LSAC), it would appear that both
LSAT scores and grade point averages remained constant in the years pre- and post-tuition
13
Chapter II – The Law Profession
deregulation (LSAC Registration and Information Books for Canada, 1998 to 2003). Thus, it
would appear that law schools in Ontario continue to attract high achieving students.
C. Status/Prestige of the Legal Profession Two important elements of a profession’s attractiveness are the status accorded to it by society
and the prestige assigned to members of that profession. For the purposes of this discussion,
status or rank is defined as one’s position within a socially-defined hierarchy based on
occupation (Guppy, 2003); and prestige is defined as “the relative honour accorded to someone
by virtue of a position in a certain role or as the practitioner of particular tasks” (Sandefur, 2001).
Occupational prestige is generally considered to be one of the elements comprising an
individual’s relative socioeconomic status:
Socioeconomic implies at least two dimensions of inequality—social and economic…The economic dimension is best represented by money or wealth as reflected in employment income, home ownership, and other financial assets…The social dimension incorporates education, occupational prestige, authority, and community standing. (Guppy 2003)
Lawyers and judges consistently rank among the occupations with the greatest status according
to socioeconomic scales developed to classify occupations (see Blishen et al., 1987; Goyder et
al., 2003). Such scales typically combine a measure of education and income to determine a
composite rank for occupational status. Lawyers typically possess both an undergraduate and
a professional degree (i.e., generally seven years of university education) and thus, salaries
compare favourably with those of other high-ranking professions such as medicine (see Tables
2.1 and 2.2, p.15). The practice of law ranks in the top 5 percent of all professions with regard
to status.
The media tends to promulgate perceptions of the law as a prestigious occupation. Television
programs and films typically portray lawyers as intelligent, articulate, proactive, smartly dressed
individuals who possess impressive reasoning skills (e.g., Tom Cruise in The Firm or Cynthia
Dale in Street Legal). Lawyers are often portrayed as making positive contributions to their
community in helping to solve complex legal problems, usually related to criminal law (e.g.,
Atticus Finch in To Kill a Mockingbird, Assistant D.A. Jack McCoy on Law & Order or Cara Pifko
of This is Wonderland). In real life, many highly placed individuals in politics and business hold
law degrees, lending further prestige to the profession as a whole. For example, seven of the
14

Chapter II – The Law Profession
previous nine prime ministers held law degrees, including current Prime Minister Paul Martin
(Dwyer, 1997).
Given the cynical view that many people hold regarding politicians’ ethics, it is perhaps not
surprising that in contrast to the perceived prestige of the legal profession in terms of
remuneration and education, images of lawyers as unethical and/or avaricious also abound. As
often as they are heroes, lawyers are depicted negatively in movies and television as
‘ambulance chasers’ and perpetrators of needless litigation. In addition, public opinion polls,
such as the Gallup Poll and Harris Poll, routinely demonstrate that the public tends to have a
somewhat negative perception of lawyers’ ethics (Hartley & Massuca, 2002).
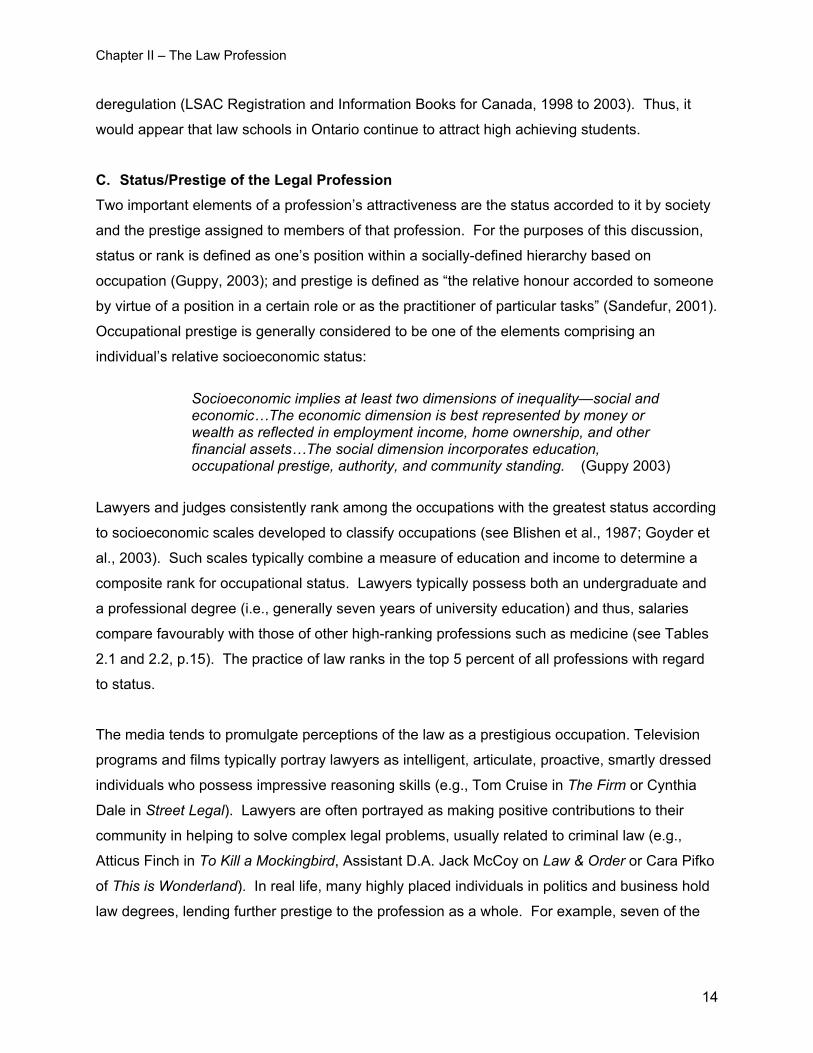
D. Income and Employment Opportunities As we noted in the preceding section, financial return is a major component of status, and
therefore, it is not surprising to see in Table 2.1 that the salaries of lawyers in their first year of
practice in Ontario in 2004, could be as much as $135,000. In 2004, the middle 50 percent of
first-year Ontario lawyers have salaries ranging from $56,500 to $99,270. While the median
and high range of first year associates’ salaries make a legal career appear extremely attractive
from an economic perspective, on the other hand, it is important to note that one-quarter of
Ontario lawyers receive a significantly lower return, between $36,000 and $56,499. Given that
they must receive good marks in order to access high paying articling and practising positions,
law students’ academic performance is critical to ensure that such options are open to them.
This issue is developed more fully in Section I of this chapter and in Chapter IV.
15
Chapter II – The Law Profession
Table 2.1: Salaries Associated with Practising Law ($)
Year1: Salary ($) National Average Ontario
2002: Low Mid Range (26-75%)
High
20,000 49,730-69,420
110,000
20,000 44,110-84,390
110,000 2003: Low Mid Range (26-75%)
High
36,000 44,440-81,620
135,000
36,000 53,290-90,250
135,000 2004: Low Mid Range (26-75%)
High
30,000 40,080-77,290
135,000
36,000 56,500-99,270
135,000
Source: “Canadian Lawyer National Compensation Survey”, Canadian Lawyer (1997-2003) 1 The year the survey was completed. Data are for lawyers called to the bar the
previous year.
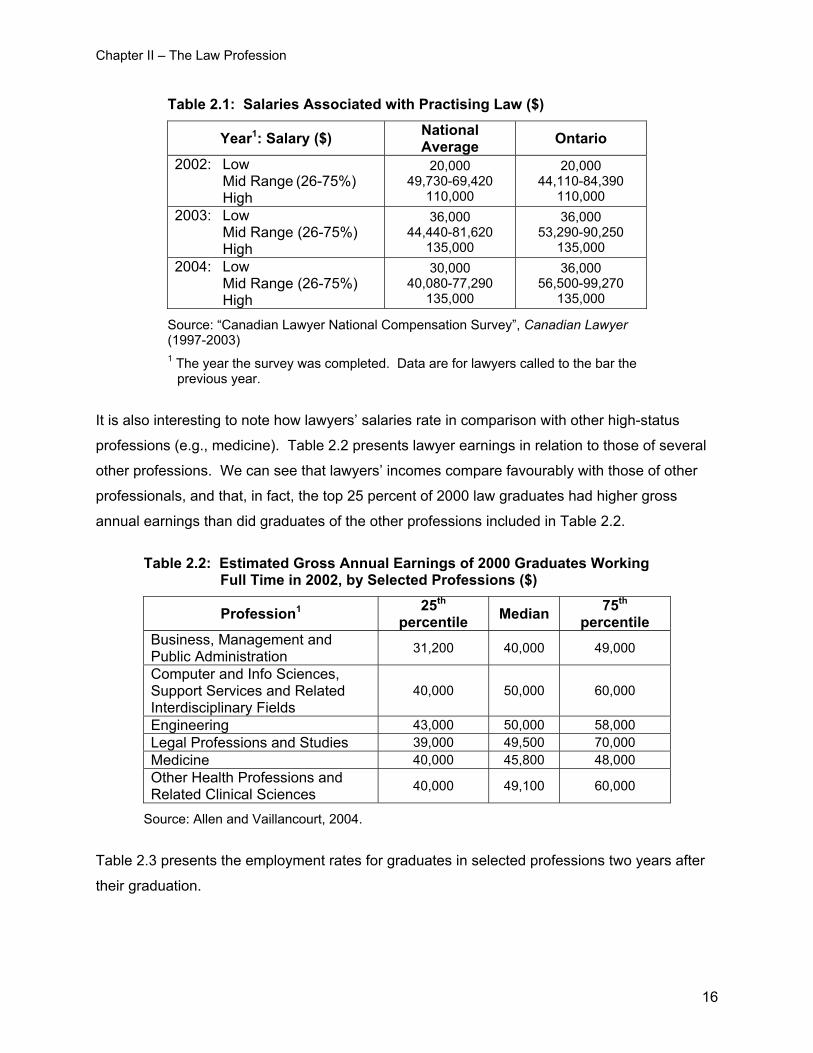
It is also interesting to note how lawyers’ salaries rate in comparison with other high-status
professions (e.g., medicine). Table 2.2 presents lawyer earnings in relation to those of several
other professions. We can see that lawyers’ incomes compare favourably with those of other
professionals, and that, in fact, the top 25 percent of 2000 law graduates had higher gross
annual earnings than did graduates of the other professions included in Table 2.2.
Table 2.2: Estimated Gross Annual Earnings of 2000 Graduates Working
Full Time in 2002, by Selected Professions ($)
Profession1 25th percentile Median 75th
percentile Business, Management and Public Administration 31,200 40,000 49,000
Computer and Info Sciences, Support Services and Related Interdisciplinary Fields
40,000 50,000 60,000
Engineering 43,000 50,000 58,000 Legal Professions and Studies 39,000 49,500 70,000 Medicine 40,000 45,800 48,000 Other Health Professions and Related Clinical Sciences 40,000 49,100 60,000
Source: Allen and Vaillancourt, 2004.
Table 2.3 presents the employment rates for graduates in selected professions two years after
their graduation.
16
Chapter II – The Law Profession
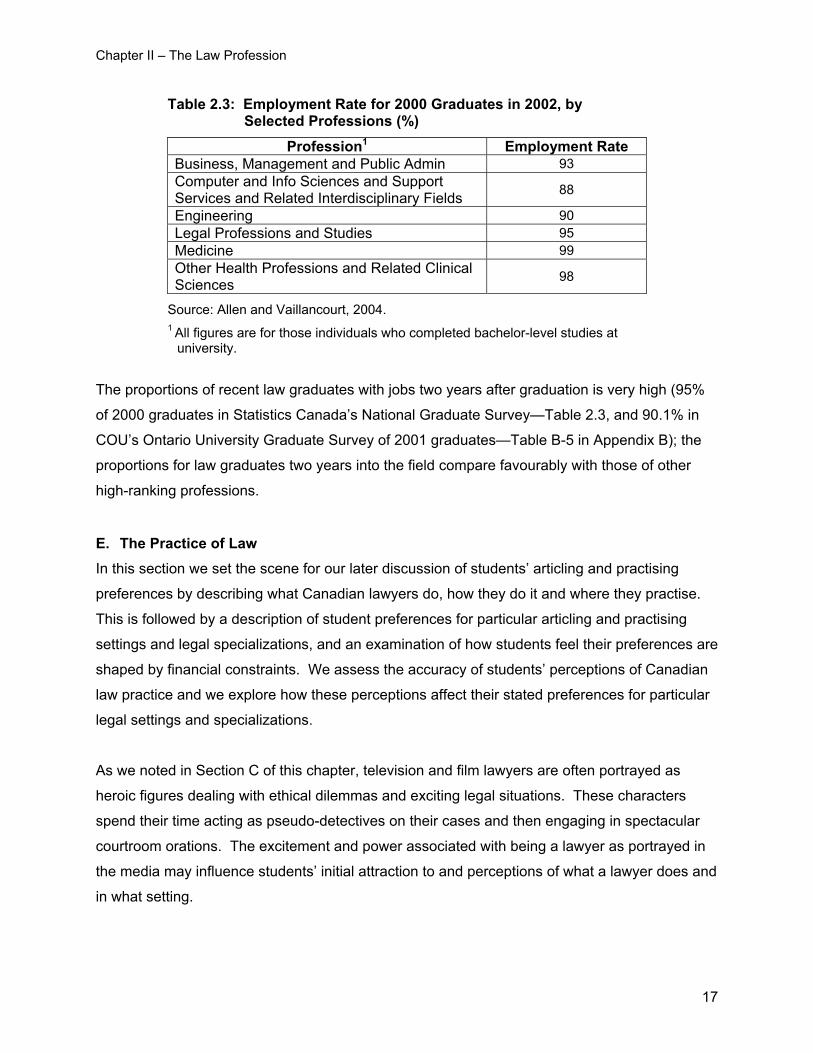
Table 2.3: Employment Rate for 2000 Graduates in 2002, by Selected Professions (%)
Profession1 Employment Rate Business, Management and Public Admin 93 Computer and Info Sciences and Support Services and Related Interdisciplinary Fields 88
Engineering 90 Legal Professions and Studies 95 Medicine 99 Other Health Professions and Related Clinical Sciences 98
Source: Allen and Vaillancourt, 2004. 1 All figures are for those individuals who completed bachelor-level studies at
university.
The proportions of recent law graduates with jobs two years after graduation is very high (95%
of 2000 graduates in Statistics Canada’s National Graduate Survey—Table 2.3, and 90.1% in
COU’s Ontario University Graduate Survey of 2001 graduates—Table B-5 in Appendix B); the
proportions for law graduates two years into the field compare favourably with those of other
high-ranking professions.
E. The Practice of Law In this section we set the scene for our later discussion of students’ articling and practising
preferences by describing what Canadian lawyers do, how they do it and where they practise.
This is followed by a description of student preferences for particular articling and practising
settings and legal specializations, and an examination of how students feel their preferences are
shaped by financial constraints. We assess the accuracy of students’ perceptions of Canadian
law practice and we explore how these perceptions affect their stated preferences for particular
legal settings and specializations.
As we noted in Section C of this chapter, television and film lawyers are often portrayed as
heroic figures dealing with ethical dilemmas and exciting legal situations. These characters
spend their time acting as pseudo-detectives on their cases and then engaging in spectacular
courtroom orations. The excitement and power associated with being a lawyer as portrayed in
the media may influence students’ initial attraction to and perceptions of what a lawyer does and
in what setting.
17
Chapter II – The Law Profession
Many students who participated in the focus group discussions described how films and
television shows had affected their images of the law and of lawyers. The following comments
are illustrative of the opinions expressed by the students on this issue:
My first introduction to a lawyer was Atticus Finch, then Arty Becker on L.A. Law—what a fall! (Year 2, Male)
I thought [the law] was courtroom drama, cross-examination…what you see on T.V…This is Wonderland is quite accurate. (Year 3, Male)
However, legal practice is generally not so glamorous as films and television would have us
believe:
In reality, approximately ten percent of a lawyer’s time is spent in court…Although the adversarial process in the courtroom has a higher profile, most of a lawyer’s time is spent in the planning stages trying to offer solutions. (Purcell, 1994)
Riveting courtroom drama is rare, and when it does occur it is but one short breath in the many long, often tedious hours that were spent in case preparation. (Johnson, 1996)
Lawyers in private firms work long and hard to meet billing targets set by their firms (based on
the billable hours that associates record and submit). For example, in the 2003 Canadian
Lawyer Law Firm Associates’ Survey, the majority of the associates surveyed who were from
mid-sized to large firms described the high level of anxiety and stress resulting from the
pressure to meet elevated billing targets. Although remuneration and ‘perks’ often
compensated for some of their stress, many associates reported feeling that their quality of life
suffered as a result of their work. Given that over 80 percent of recent graduates surveyed and
over 82 percent of Ontario lawyers are employed with private firms (see Table 2.4), the reality of
private practice described above is one that pertains to the vast majority of those practising law
in Ontario.
18
Chapter II – The Law Profession
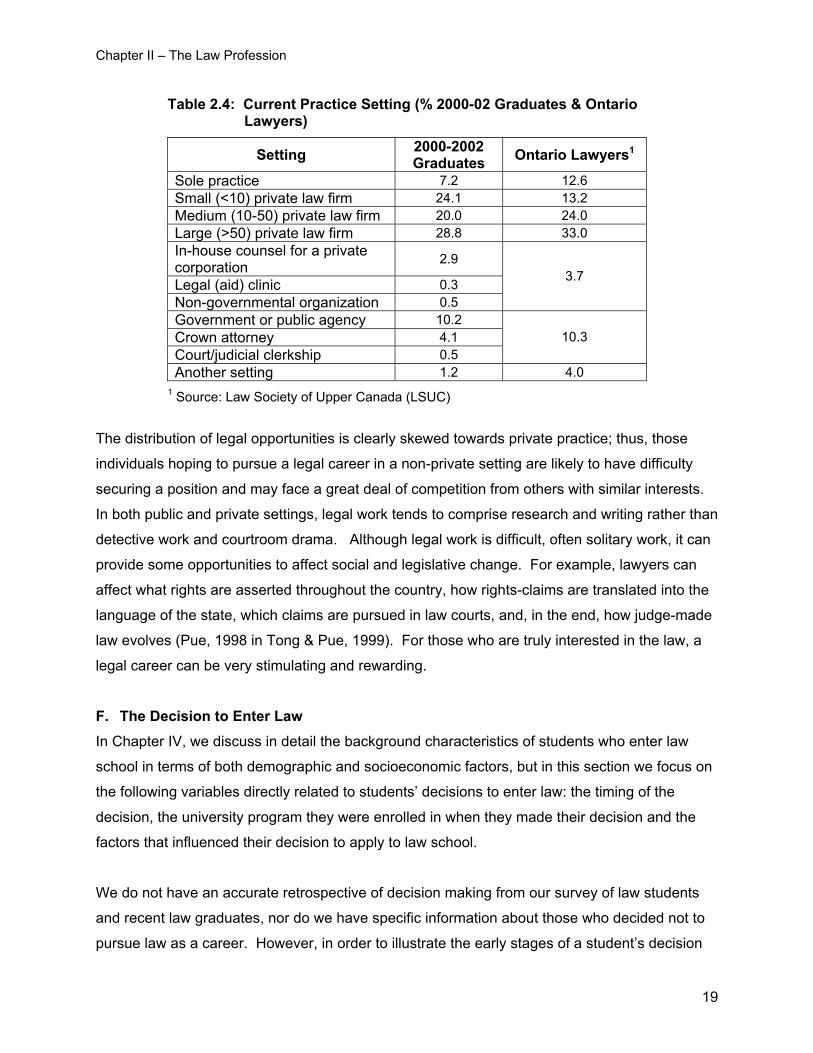
Table 2.4: Current Practice Setting (% 2000-02 Graduates & Ontario Lawyers)
Setting 2000-2002 Graduates Ontario Lawyers1
Sole practice 7.2 12.6 Small (<10) private law firm 24.1 13.2 Medium (10-50) private law firm 20.0 24.0 Large (>50) private law firm 28.8 33.0 In-house counsel for a private corporation 2.9
Legal (aid) clinic 0.3 Non-governmental organization 0.5
3.7
Government or public agency 10.2 Crown attorney 4.1 Court/judicial clerkship 0.5
10.3
Another setting 1.2 4.0 1 Source: Law Society of Upper Canada (LSUC)
The distribution of legal opportunities is clearly skewed towards private practice; thus, those
individuals hoping to pursue a legal career in a non-private setting are likely to have difficulty
securing a position and may face a great deal of competition from others with similar interests.
In both public and private settings, legal work tends to comprise research and writing rather than
detective work and courtroom drama. Although legal work is difficult, often solitary work, it can
provide some opportunities to affect social and legislative change. For example, lawyers can
affect what rights are asserted throughout the country, how rights-claims are translated into the
language of the state, which claims are pursued in law courts, and, in the end, how judge-made
law evolves (Pue, 1998 in Tong & Pue, 1999). For those who are truly interested in the law, a
legal career can be very stimulating and rewarding.
F. The Decision to Enter Law In Chapter IV, we discuss in detail the background characteristics of students who enter law
school in terms of both demographic and socioeconomic factors, but in this section we focus on
the following variables directly related to students’ decisions to enter law: the timing of the
decision, the university program they were enrolled in when they made their decision and the
factors that influenced their decision to apply to law school.
We do not have an accurate retrospective of decision making from our survey of law students
and recent law graduates, nor do we have specific information about those who decided not to
pursue law as a career. However, in order to illustrate the early stages of a student’s decision
19
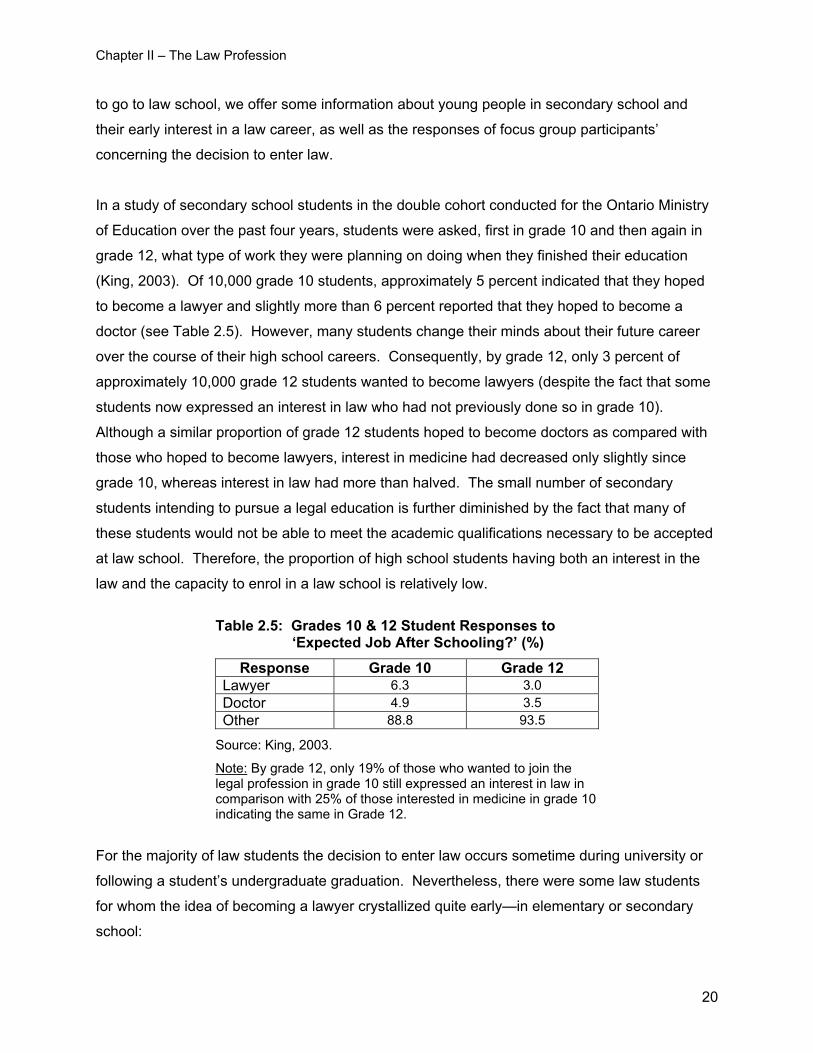
Chapter II – The Law Profession
to go to law school, we offer some information about young people in secondary school and
their early interest in a law career, as well as the responses of focus group participants’
concerning the decision to enter law.
In a study of secondary school students in the double cohort conducted for the Ontario Ministry
of Education over the past four years, students were asked, first in grade 10 and then again in
grade 12, what type of work they were planning on doing when they finished their education
(King, 2003). Of 10,000 grade 10 students, approximately 5 percent indicated that they hoped
to become a lawyer and slightly more than 6 percent reported that they hoped to become a
doctor (see Table 2.5). However, many students change their minds about their future career
over the course of their high school careers. Consequently, by grade 12, only 3 percent of
approximately 10,000 grade 12 students wanted to become lawyers (despite the fact that some
students now expressed an interest in law who had not previously done so in grade 10).
Although a similar proportion of grade 12 students hoped to become doctors as compared with
those who hoped to become lawyers, interest in medicine had decreased only slightly since
grade 10, whereas interest in law had more than halved. The small number of secondary
students intending to pursue a legal education is further diminished by the fact that many of
these students would not be able to meet the academic qualifications necessary to be accepted
at law school. Therefore, the proportion of high school students having both an interest in the
law and the capacity to enrol in a law school is relatively low.
Table 2.5: Grades 10 & 12 Student Responses to
‘Expected Job After Schooling?’ (%)
Response Grade 10 Grade 12 Lawyer 6.3 3.0 Doctor 4.9 3.5 Other 88.8 93.5
Source: King, 2003.
Note: By grade 12, only 19% of those who wanted to join the legal profession in grade 10 still expressed an interest in law in comparison with 25% of those interested in medicine in grade 10 indicating the same in Grade 12.
For the majority of law students the decision to enter law occurs sometime during university or
following a student’s undergraduate graduation. Nevertheless, there were some law students
for whom the idea of becoming a lawyer crystallized quite early—in elementary or secondary
school:
20
Chapter II – The Law Profession
I can’t really remember when I didn’t want to do law even when I was a kid…a lot of it had to do with the earning potential of law…initial attraction. (Year 2, Male)
I’m a very outspoken, outgoing type of person…since I was four years old my parents’ friends would say, ‘you’ve got a little lawyer there’…all my life people were telling me, “you’ve got to be a lawyer”…I took law in high school and loved it…so undergrad for me was a means to get into [law school]. (Year 1, Female)
Many young people are influenced by those closest to them with regard to their future career
aspirations. For example, a member of their family may want them to become a lawyer or they
may have a parent(s) who is a lawyer or judge.
I grew up in a family where my father and mother thought being a lawyer was the ultimate…from the time I was a child I wanted to be a lawyer…I was interested in politics. (Year 2, Male)
I come from a family of lawyers [mother and brother are lawyers; stepfather teaches policing]. (Year 3, Female)
Not unexpectedly, a significant number of law school enrolees have a parent(s)—most often
their father, who is a lawyer or a judge (8.7% of the student enrolment and 8.6% of graduates;
see Table 2.6).
Table 2.6: Parents as Lawyers and Judges
(% Students & Graduates)
Mother Father Total Students 1.1 7.9 8.7 Graduates 1.0 8.0 8.6
In contrast, a medical student study reported that 15.6 percent of the respondents had a parent
who was a physician (Dhalla et al., 2002). It appears that medical students are more strongly
influenced by their parents’ profession than are law students.
As discussed previously, lawyers tend to be represented in the media as attractive, energetic
people engaging primarily in criminal law and as being dynamic tools of justice. Many young
people may be influenced by the exciting image of a lawyer portrayed in the media to pursue a
career in the legal profession.
I didn’t want to go on and get my PhD in Psychology…I was watching TV and a lawyer came on and I decided that’s what I want to do…so I wrote the LSATs and applied and I got in. (Year 2, Female)
21
Chapter II – The Law Profession
The comments of many students in the focus groups reinforced the idea that students tend to
make the choice to enter law at some point during their university career. The idea of attending
law school may have been carefully considered by some students as one possibility among a
number of alternatives, while for others law school was pursued almost as an afterthought:
Applied to law school on a whim…couldn’t get into medical school. (Year 3, Female)
I didn’t know what I wanted to do…a teacher [at university] said to me that I should consider law school. (Year 2, Female)
I just didn’t know what else to do…I took politics in undergrad and I thought [law] was a nice complement. (Year 3, Female)
For other students, making the decision was more complex. The following comments illustrate
students’ uncertainty about their decision to pursue law as well as some of the other career and
education options they were considering.
I really pondered towards the end of undergrad [about what to do next]. [I wasn’t] ready to join the work force yet. I didn’t really know what I wanted to do. Law sounded kind of exciting. I like to learn. (Year 3, Male)
I realized in fourth year that I wouldn’t be able to face doing a master’s. Then I started exploring other options. I didn’t really know what I wanted to do. A friend was writing the LSAT [and I thought] even it I don’t want to be a lawyer it’s a good degree to do. (Year 2, Female)
I was doing an English major and I didn’t want to become a prof. This would be a degree that would open up some doors. Having a professional degree would give me a bit more credibility….(Year 3, Female)
Some students in the focus groups reported that a negative experience with the law encouraged
them to pursue a legal career. The following quotes describe two such experiences:
I got sued in grade 11 for violation of a city bylaw.… I represented myself [in court]. …and my interest grew from there…. (Year 2, Male)
I got divorced. I lost everything I had. I had a lawyer who perpetuated the fights. At one point I fired my lawyer and I took over …. [I decided] I wanted to be [a lawyer]. (Year 1, Female)
Perhaps the most common decision-making pattern for young people was a choice between
pursuing a graduate degree and entering law school. This perspective is illustrated in the
following quotations from focus groups:
22
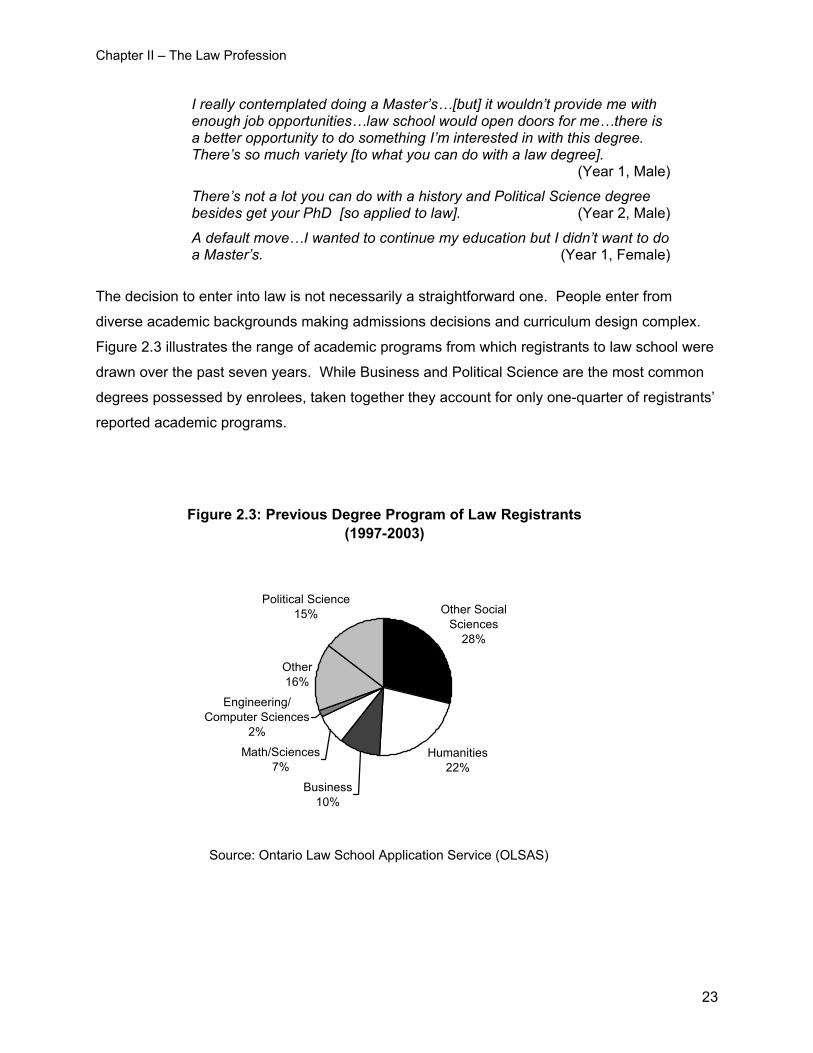
Chapter II – The Law Profession
I really contemplated doing a Master’s…[but] it wouldn’t provide me with enough job opportunities…law school would open doors for me…there is a better opportunity to do something I’m interested in with this degree. There’s so much variety [to what you can do with a law degree]. (Year 1, Male) There’s not a lot you can do with a history and Political Science degree besides get your PhD [so applied to law]. (Year 2, Male)
A default move…I wanted to continue my education but I didn’t want to do a Master’s. (Year 1, Female)
The decision to enter into law is not necessarily a straightforward one. People enter from
diverse academic backgrounds making admissions decisions and curriculum design complex.
Figure 2.3 illustrates the range of academic programs from which registrants to law school were
drawn over the past seven years. While Business and Political Science are the most common
degrees possessed by enrolees, taken together they account for only one-quarter of registrants’
reported academic programs.
Figure 2.3: Previous Degree Program of Law Registrants (1997-2003)
Other Social Sciences
28%
Humanities22%
Business10%
Math/Sciences7%
Other16%
Political Science15%
Engineering/Computer Sciences
2%
Source: Ontario Law School Application Service (OLSAS)
23
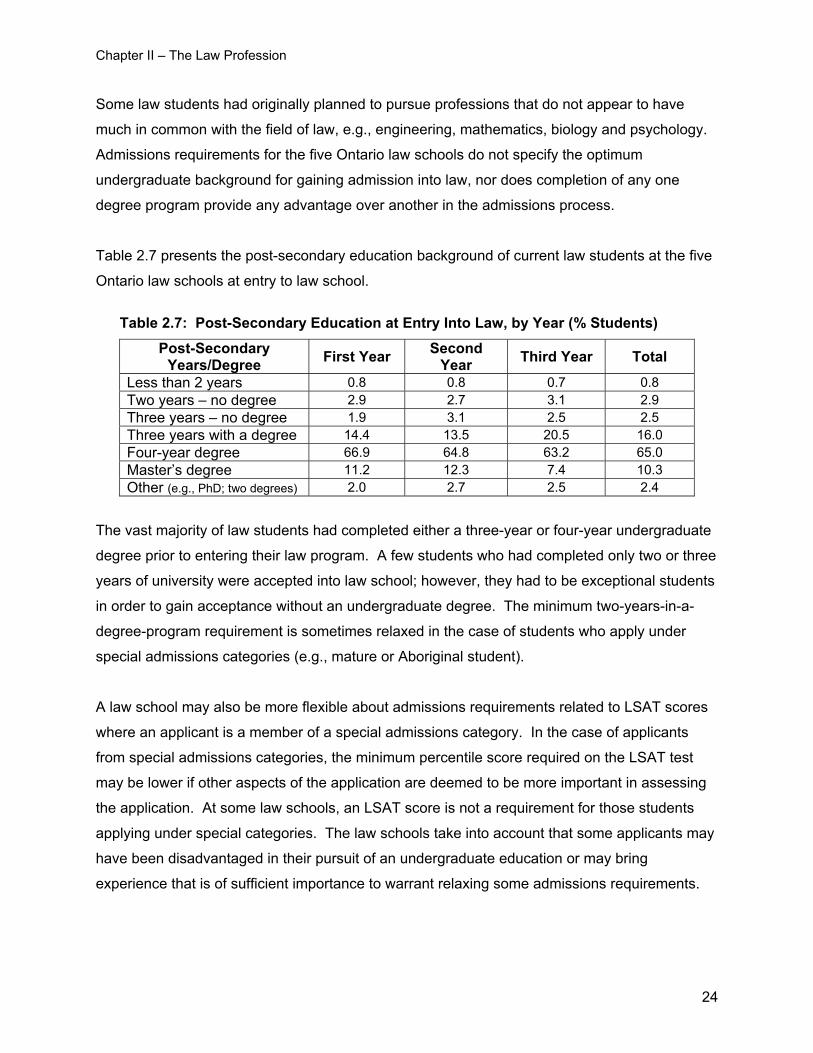
Chapter II – The Law Profession
Some law students had originally planned to pursue professions that do not appear to have
much in common with the field of law, e.g., engineering, mathematics, biology and psychology.
Admissions requirements for the five Ontario law schools do not specify the optimum
undergraduate background for gaining admission into law, nor does completion of any one
degree program provide any advantage over another in the admissions process.
Table 2.7 presents the post-secondary education background of current law students at the five
Ontario law schools at entry to law school.
Table 2.7: Post-Secondary Education at Entry Into Law, by Year (% Students)
Post-Secondary Years/Degree First Year Second
Year Third Year Total
Less than 2 years 0.8 0.8 0.7 0.8 Two years – no degree 2.9 2.7 3.1 2.9 Three years – no degree 1.9 3.1 2.5 2.5 Three years with a degree 14.4 13.5 20.5 16.0 Four-year degree 66.9 64.8 63.2 65.0 Master’s degree 11.2 12.3 7.4 10.3 Other (e.g., PhD; two degrees) 2.0 2.7 2.5 2.4
The vast majority of law students had completed either a three-year or four-year undergraduate
degree prior to entering their law program. A few students who had completed only two or three
years of university were accepted into law school; however, they had to be exceptional students
in order to gain acceptance without an undergraduate degree. The minimum two-years-in-a-
degree-program requirement is sometimes relaxed in the case of students who apply under
special admissions categories (e.g., mature or Aboriginal student).
A law school may also be more flexible about admissions requirements related to LSAT scores
where an applicant is a member of a special admissions category. In the case of applicants
from special admissions categories, the minimum percentile score required on the LSAT test
may be lower if other aspects of the application are deemed to be more important in assessing
the application. At some law schools, an LSAT score is not a requirement for those students
applying under special categories. The law schools take into account that some applicants may
have been disadvantaged in their pursuit of an undergraduate education or may bring
experience that is of sufficient importance to warrant relaxing some admissions requirements.
24
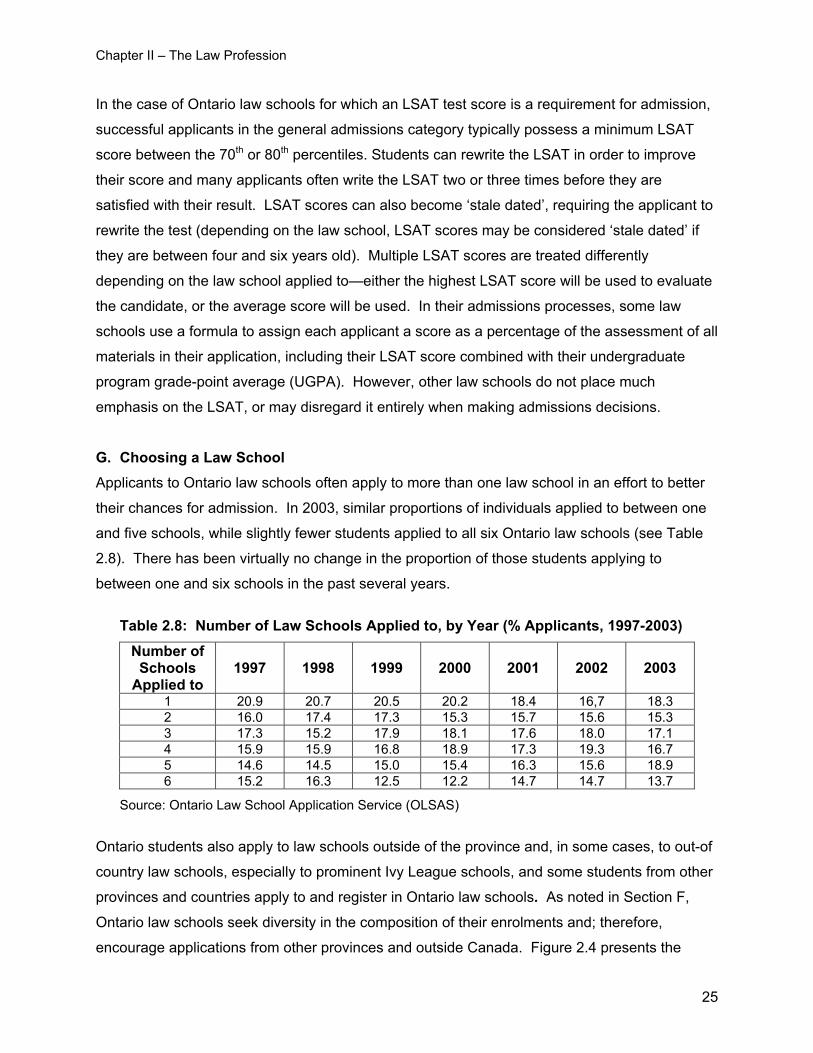
Chapter II – The Law Profession
In the case of Ontario law schools for which an LSAT test score is a requirement for admission,
successful applicants in the general admissions category typically possess a minimum LSAT
score between the 70th or 80th percentiles. Students can rewrite the LSAT in order to improve
their score and many applicants often write the LSAT two or three times before they are
satisfied with their result. LSAT scores can also become ‘stale dated’, requiring the applicant to
rewrite the test (depending on the law school, LSAT scores may be considered ‘stale dated’ if
they are between four and six years old). Multiple LSAT scores are treated differently
depending on the law school applied to—either the highest LSAT score will be used to evaluate
the candidate, or the average score will be used. In their admissions processes, some law
schools use a formula to assign each applicant a score as a percentage of the assessment of all
materials in their application, including their LSAT score combined with their undergraduate
program grade-point average (UGPA). However, other law schools do not place much
emphasis on the LSAT, or may disregard it entirely when making admissions decisions.
G. Choosing a Law School Applicants to Ontario law schools often apply to more than one law school in an effort to better
their chances for admission. In 2003, similar proportions of individuals applied to between one
and five schools, while slightly fewer students applied to all six Ontario law schools (see Table
2.8). There has been virtually no change in the proportion of those students applying to
between one and six schools in the past several years.
Table 2.8: Number of Law Schools Applied to, by Year (% Applicants, 1997-2003)
Number of Schools
Applied to 1997 1998 1999 2000 2001 2002 2003
1 20.9 20.7 20.5 20.2 18.4 16,7 18.3 2 16.0 17.4 17.3 15.3 15.7 15.6 15.3 3 17.3 15.2 17.9 18.1 17.6 18.0 17.1 4 15.9 15.9 16.8 18.9 17.3 19.3 16.7 5 14.6 14.5 15.0 15.4 16.3 15.6 18.9 6 15.2 16.3 12.5 12.2 14.7 14.7 13.7
Source: Ontario Law School Application Service (OLSAS)
Ontario students also apply to law schools outside of the province and, in some cases, to out-of
country law schools, especially to prominent Ivy League schools, and some students from other
provinces and countries apply to and register in Ontario law schools. As noted in Section F,
Ontario law schools seek diversity in the composition of their enrolments and; therefore,
encourage applications from other provinces and outside Canada. Figure 2.4 presents the
25
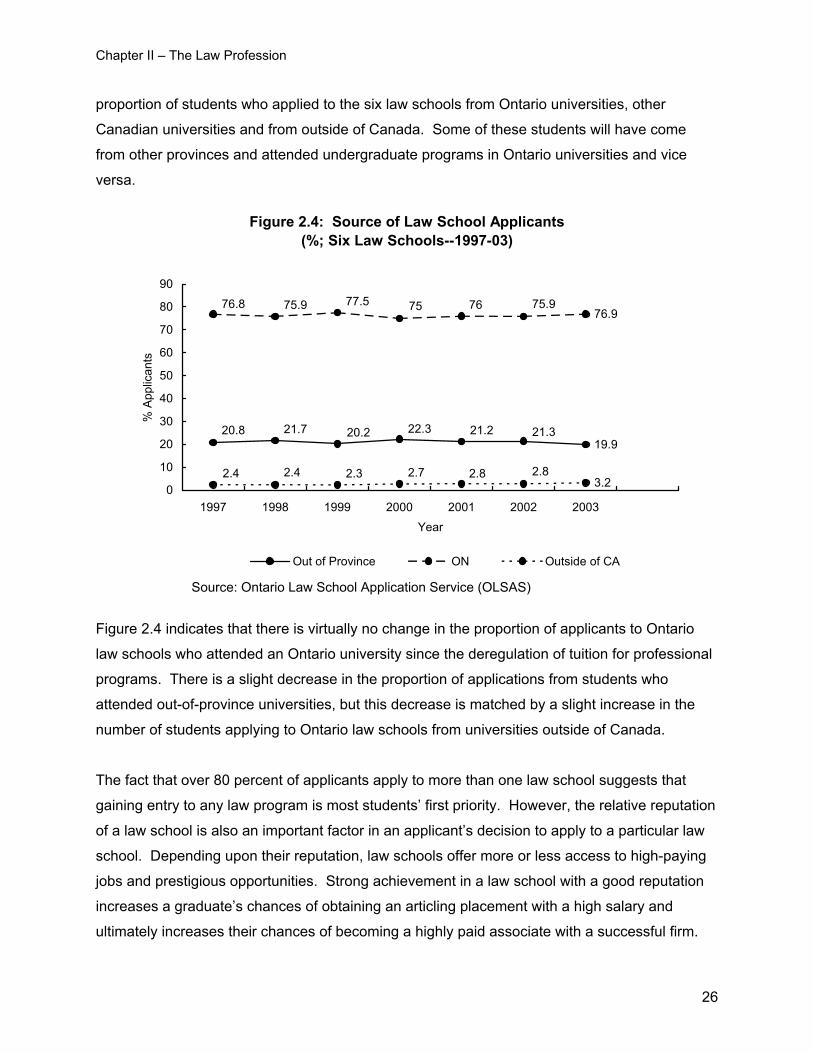
Chapter II – The Law Profession
proportion of students who applied to the six law schools from Ontario universities, other
Canadian universities and from outside of Canada. Some of these students will have come
from other provinces and attended undergraduate programs in Ontario universities and vice
versa.
Figure 2.4: Source of Law School Applicants (%; Six Law Schools--1997-03)
19.9
76.9
3.2
21.321.222.320.221.720.8
75.9767577.575.976.8
2.82.82.72.32.42.40
10
20
30
40
50
60
70
80
90
1997 1998 1999 2000 2001 2002 2003
Year
% A
pplic
ants
Out of Province ON Outside of CA
Source: Ontario Law School Application Service (OLSAS)
Figure 2.4 indicates that there is virtually no change in the proportion of applicants to Ontario
law schools who attended an Ontario university since the deregulation of tuition for professional
programs. There is a slight decrease in the proportion of applications from students who
attended out-of-province universities, but this decrease is matched by a slight increase in the
number of students applying to Ontario law schools from universities outside of Canada.
The fact that over 80 percent of applicants apply to more than one law school suggests that
gaining entry to any law program is most students’ first priority. However, the relative reputation
of a law school is also an important factor in an applicant’s decision to apply to a particular law
school. Depending upon their reputation, law schools offer more or less access to high-paying
jobs and prestigious opportunities. Strong achievement in a law school with a good reputation
increases a graduate’s chances of obtaining an articling placement with a high salary and
ultimately increases their chances of becoming a highly paid associate with a successful firm.
26
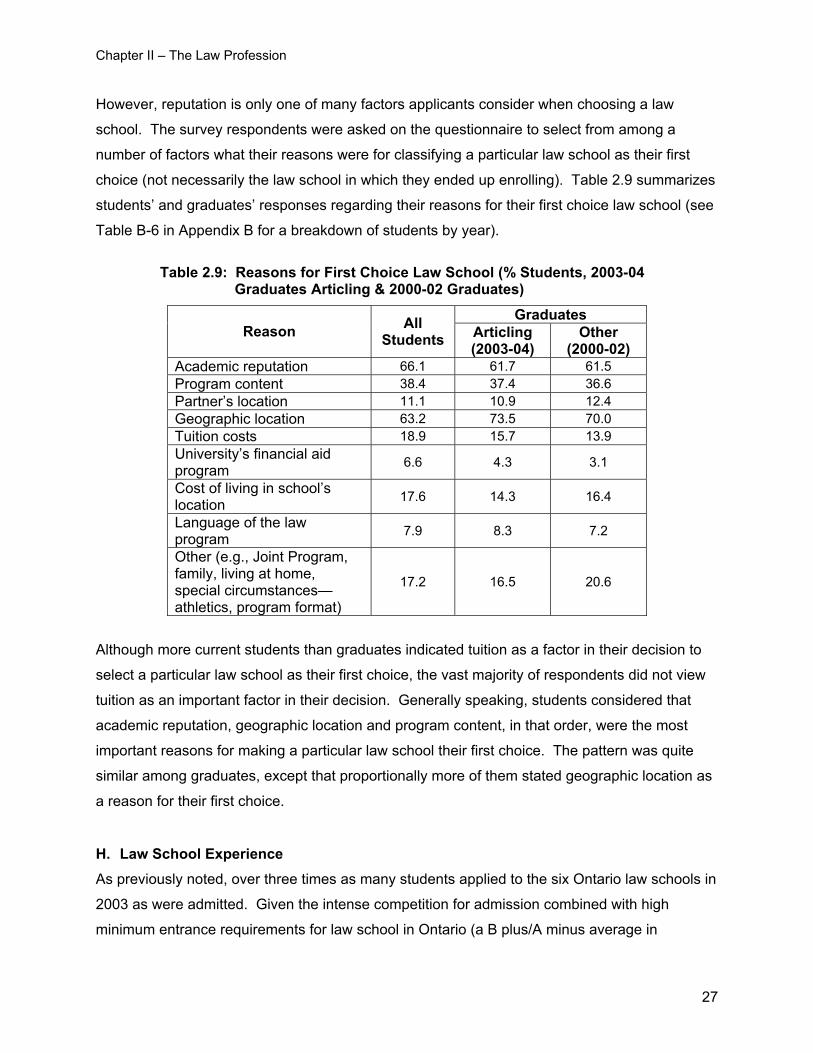
Chapter II – The Law Profession
However, reputation is only one of many factors applicants consider when choosing a law
school. The survey respondents were asked on the questionnaire to select from among a
number of factors what their reasons were for classifying a particular law school as their first
choice (not necessarily the law school in which they ended up enrolling). Table 2.9 summarizes
students’ and graduates’ responses regarding their reasons for their first choice law school (see
Table B-6 in Appendix B for a breakdown of students by year).
Table 2.9: Reasons for First Choice Law School (% Students, 2003-04
Graduates Articling & 2000-02 Graduates)
Graduates Reason All
Students Articling (2003-04)
Other (2000-02)
Academic reputation 66.1 61.7 61.5 Program content 38.4 37.4 36.6 Partner’s location 11.1 10.9 12.4 Geographic location 63.2 73.5 70.0 Tuition costs 18.9 15.7 13.9 University’s financial aid program 6.6 4.3 3.1
Cost of living in school’s location 17.6 14.3 16.4
Language of the law program 7.9 8.3 7.2
Other (e.g., Joint Program, family, living at home, special circumstances—athletics, program format)
17.2 16.5 20.6
Although more current students than graduates indicated tuition as a factor in their decision to
select a particular law school as their first choice, the vast majority of respondents did not view
tuition as an important factor in their decision. Generally speaking, students considered that
academic reputation, geographic location and program content, in that order, were the most
important reasons for making a particular law school their first choice. The pattern was quite
similar among graduates, except that proportionally more of them stated geographic location as
a reason for their first choice.
H. Law School Experience As previously noted, over three times as many students applied to the six Ontario law schools in
2003 as were admitted. Given the intense competition for admission combined with high
minimum entrance requirements for law school in Ontario (a B plus/A minus average in
27
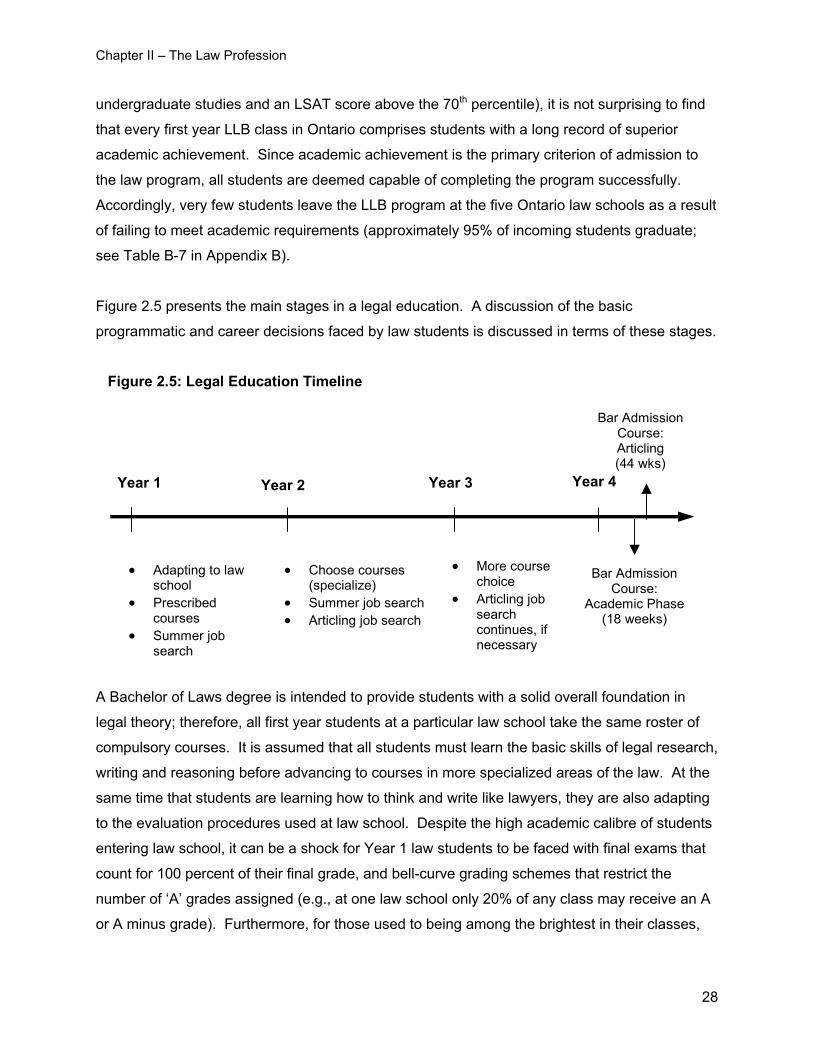
Chapter II – The Law Profession
undergraduate studies and an LSAT score above the 70th percentile), it is not surprising to find
that every first year LLB class in Ontario comprises students with a long record of superior
academic achievement. Since academic achievement is the primary criterion of admission to
the law program, all students are deemed capable of completing the program successfully.
Accordingly, very few students leave the LLB program at the five Ontario law schools as a result
of failing to meet academic requirements (approximately 95% of incoming students graduate;
see Table B-7 in Appendix B).
Figure 2.5 presents the main stages in a legal education. A discussion of the basic
programmatic and career decisions faced by law students is discussed in terms of these stages.
Figure 2.5: Legal Education Timeline
Bar Admission Course: Articling (44 wks)
Year 1 Year 2 Year 3
• Adapting to law school
• Prescribed courses
• Summer job search
• Choose courses (specialize)
• Summer job search • Articling job search
• More course choice
• Articling job search continues, if necessary
Year 4
Bar Admission Course:
Academic Phase (18 weeks)
A Bachelor of Laws degree is intended to provide students with a solid overall foundation in
legal theory; therefore, all first year students at a particular law school take the same roster of
compulsory courses. It is assumed that all students must learn the basic skills of legal research,
writing and reasoning before advancing to courses in more specialized areas of the law. At the
same time that students are learning how to think and write like lawyers, they are also adapting
to the evaluation procedures used at law school. Despite the high academic calibre of students
entering law school, it can be a shock for Year 1 law students to be faced with final exams that
count for 100 percent of their final grade, and bell-curve grading schemes that restrict the
number of ‘A’ grades assigned (e.g., at one law school only 20% of any class may receive an A
or A minus grade). Furthermore, for those used to being among the brightest in their classes,
28
Chapter II – The Law Profession
finding themselves only one among many accomplished students can also be stressful, as
attested to by students who participated in focus groups. However, law students have little time
to adjust to the new challenges posed by their academic environment if they hope to secure
coveted summer positions with Toronto law firms (see Chapter III, Section C2 for a discussion
of the financial implications of summer jobs with law firms).
As of the beginning of their second term of law school, Year 1 law students are faced with
application deadlines for summer jobs with the Toronto law firms. Students hoping to secure
one of these scarce and highly contested positions must face competition from hundreds of
students all across Canada—in 2004, only about 25 summer jobs for first year students from
across Canada were available with the large Toronto law firms (Career Planning Handbook,
2004). Given that the only objective tool that large firms have to allow them to distinguish
between candidates for summer positions are their first term marks, early academic
achievement in law school has become increasingly important for students (Schofield, 2001). In
fact, in 2001 the competition for summer jobs supposedly motivated about 24 students from the
first year class at the University of Toronto law school to lie about their first term marks in order
to appear more competitive to law firms (Cowan, 2002). The importance of the summer job
process has been recognized for some years now by the Law Society of Upper Canada (LSUC),
which carefully regulates and oversees the timing of job applications, interviews and offers.
Competition for summer jobs begins again in the September of a law student’s second year (for
those who did not obtain a desired position after first year) refocusing attention on first year
grades and requiring students to ready application materials almost before they begin their
second year classes. Adding to the hectic pace of the summer job search process are on-
campus interviews (OCIs) scheduled with Toronto law firms over the course of one day in
October. Prior to the day that on-campus interviews take place, students are advised as to how
many (if any) interviews they have scheduled. These individual interviews are scheduled at the
law schools for twenty minutes each (17 minutes plus a three minute break in between
interviews) with a break for lunch. The Toronto law firms then extend an invitation to students
for a formal/full interview on a specific date(s) termed ‘call day’. On ‘call day’, all the Toronto
law firms will telephone those students that they wish to interview and arrange to meet with
them during the interview period set by the LSUC. The Law Society also specifies when offers
can be made to students and how long these offers are valid. The Law Society has deemed it
necessary to implement strict rules governing the summer job and articling search/recruitment
29
Chapter II – The Law Profession
processes in an attempt to alleviate the tremendous power imbalance between large firms and
law students. These procedures emphasize the integration of the LSUC, the profession and law
students’ educational program. For those students who receive a number of offers, ‘call day’
can be very hectic, as can be the process of scheduling multiple interviews during the
prescribed interview period. Ironically, in light of the interest of many students in working in
public service settings, unlike the private sector, public service organizations requiring lawyers
do not appear to actively promote their organizations to students.
Just less than one-half of all Year 2 students are likely to receive a summer job offer from a law
firm. Many graduates article at the same law firm that they worked for during the summer
following first or second year; however, summer jobs may or may not result in an articling
placement with the same firm. Applications for articling positions in Ontario are due in the
spring or early summer following Year 2 and interviews are scheduled in the summer of that
same year. The majority of law students will have secured an articling position by the beginning
of their third year of legal studies, whether it is through the summer job search process or the
articling search process; but for some the search will continue into their third year. For example,
at two law schools in 2003-04, between 18 and 20 percent of students were still looking for an
articling position as of September of Year 3.
I. Choosing a Specialization Although salary and firm prestige may seem to overshadow most, if not all, issues considered
during the job search process, given the choice, many students would prefer to take a position
with a firm that practises law in an area that interests them. Law schools offer a range of
courses on a wide variety of subjects allowing students to be exposed to the theoretical side of
many different areas of law—for example, Commercial Law, Criminal Law, Family Law,
Immigration Law, and Intellectual Property Law. Although many law schools offer students the
opportunity to focus their course selection in particular areas of law, a student will typically not
choose a specialization until he/she begins to practise law. However, most students attempt to
choose courses that relate to the area of law in which they hope to practise; consequently,
course selection is likely to mirror a student’s preferred area of specialization.
Some students may be fortunate enough to accumulate specialized legal experience prior to
becoming practising lawyers if their articling placement allows them some exposure to and/or
preliminary experience in an area of law in which they would eventually like to practise. Prior to
30
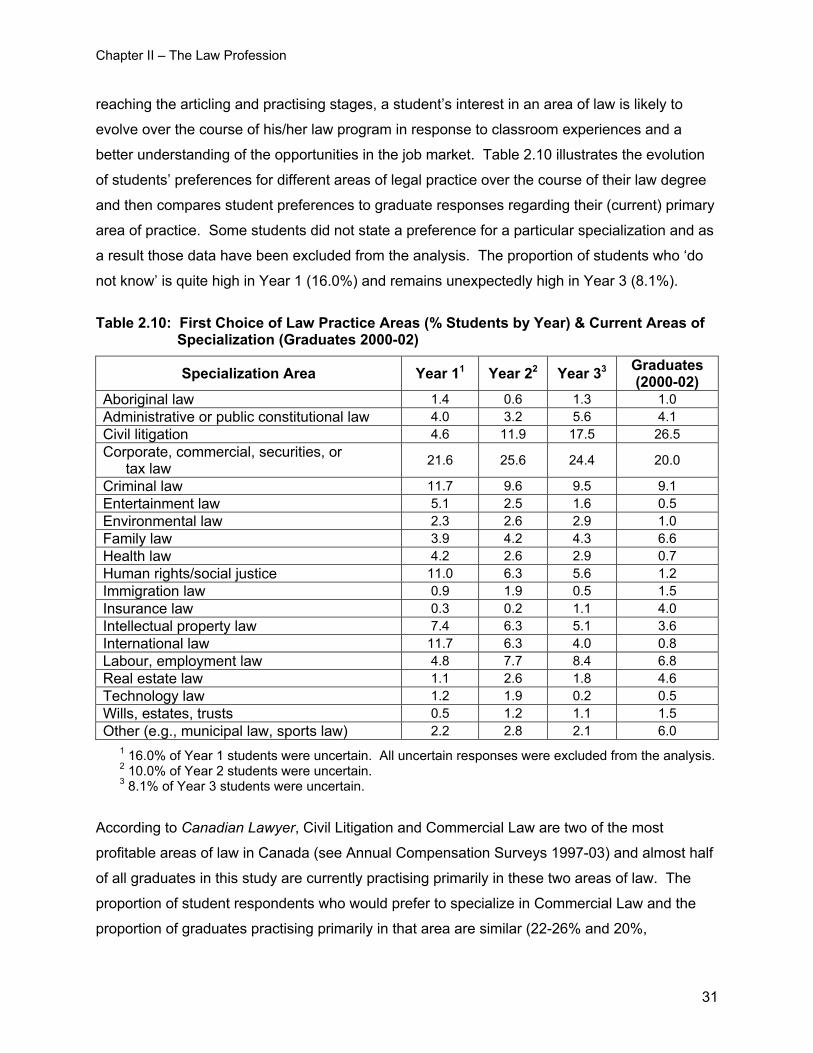
Chapter II – The Law Profession
reaching the articling and practising stages, a student’s interest in an area of law is likely to
evolve over the course of his/her law program in response to classroom experiences and a
better understanding of the opportunities in the job market. Table 2.10 illustrates the evolution
of students’ preferences for different areas of legal practice over the course of their law degree
and then compares student preferences to graduate responses regarding their (current) primary
area of practice. Some students did not state a preference for a particular specialization and as
a result those data have been excluded from the analysis. The proportion of students who ‘do
not know’ is quite high in Year 1 (16.0%) and remains unexpectedly high in Year 3 (8.1%).
Table 2.10: First Choice of Law Practice Areas (% Students by Year) & Current Areas of
Specialization (Graduates 2000-02)
Specialization Area Year 11 Year 22 Year 33 Graduates (2000-02)
Aboriginal law 1.4 0.6 1.3 1.0 Administrative or public constitutional law 4.0 3.2 5.6 4.1 Civil litigation 4.6 11.9 17.5 26.5 Corporate, commercial, securities, or tax law 21.6 25.6 24.4 20.0
Criminal law 11.7 9.6 9.5 9.1 Entertainment law 5.1 2.5 1.6 0.5 Environmental law 2.3 2.6 2.9 1.0 Family law 3.9 4.2 4.3 6.6 Health law 4.2 2.6 2.9 0.7 Human rights/social justice 11.0 6.3 5.6 1.2 Immigration law 0.9 1.9 0.5 1.5 Insurance law 0.3 0.2 1.1 4.0 Intellectual property law 7.4 6.3 5.1 3.6 International law 11.7 6.3 4.0 0.8 Labour, employment law 4.8 7.7 8.4 6.8 Real estate law 1.1 2.6 1.8 4.6 Technology law 1.2 1.9 0.2 0.5 Wills, estates, trusts 0.5 1.2 1.1 1.5 Other (e.g., municipal law, sports law) 2.2 2.8 2.1 6.0
1 16.0% of Year 1 students were uncertain. All uncertain responses were excluded from the analysis. 2 10.0% of Year 2 students were uncertain. 3 8.1% of Year 3 students were uncertain.
According to Canadian Lawyer, Civil Litigation and Commercial Law are two of the most
profitable areas of law in Canada (see Annual Compensation Surveys 1997-03) and almost half
of all graduates in this study are currently practising primarily in these two areas of law. The
proportion of student respondents who would prefer to specialize in Commercial Law and the
proportion of graduates practising primarily in that area are similar (22-26% and 20%,
31
Chapter II – The Law Profession
respectively). However, the proportion of graduates who end up practising primarily in Civil
Litigation outweighs that of students who are interested in that area of law by a substantial
margin (26.5% vs. 4.6 to 17.5%, respectively). Either students are not aware of the employment
opportunities available in Civil Litigation, or their exposure to aspects of Civil Litigation during
their legal education does not pique their interest. The latter explanation seems most likely,
given that student interest in both Civil Litigation and Commercial Law appears to increase over
the course of their education. It may be that students’ preferences for these two areas of law
increased as they learned that Civil Litigation and Commercial Law were fields where
employment opportunities existed and where they might also be exposed to other types of law
depending on the case (e.g., Health Law and Entertainment Law).
With regard to students’ motivation for entering law school, some students had a desire to affect
societal change through the legal profession, and this interest is reflected in the relatively high
level of interest in Human Rights/Social Justice in Year 1 (see Table 2.10). Unfortunately, it
appears that students’ initial idealism wanes over the course of their legal education—interest in
working in the Human Rights/Social Justice fields decreases from 11 percent of students in
Year 1 to 5.6 percent in Year 3. The declining interest in Human Rights/Social Justice over time
may be due to the recognition that there are few employment opportunities in these fields as
evidenced by the fact that only 1.2 percent of graduates are currently practising in this area of
law.
In addition to area of specialization, another important factor related to law career decisions is
the setting in which a student hopes to practise. If a student eventually joins a private firm,
he/she may become a member of a small- (less than 10 lawyers), medium- (10-50 lawyers) or
large-sized firm (more than 50 lawyers). The size of a firm is likely to determine its geographic
location, opportunities for advancement within the firm, and salary (see Tables B-8 and B-9 in
Appendix B). Aside from becoming an associate with a private law firm, other opportunities
sought by law graduates may include: acting as proprietary counsel for a specific private
corporation; working with a government agency (a government controlled organization, e.g.,
Canada Customs and Revenue Agency); joining a crown attorney’s office in order to act on the
province’s behalf in bringing criminal cases to trial; assisting a judge as a clerk in all aspects of
court preparation; working as part of the not-for-profit Legal Aid system that provides legal
representation to those who cannot afford to pay for it; or joining a non-governmental
organization (public interest/service organization). Table 2.11 provides a comparison of student
32
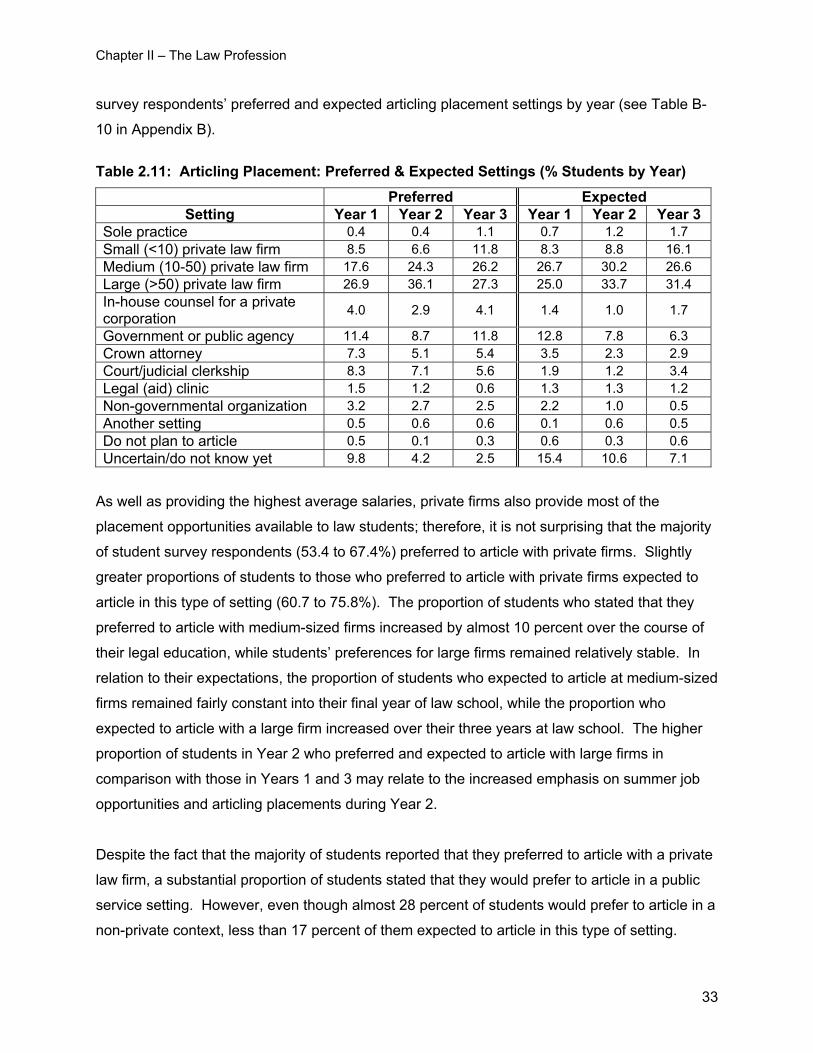
Chapter II – The Law Profession
survey respondents’ preferred and expected articling placement settings by year (see Table B-
10 in Appendix B).
Table 2.11: Articling Placement: Preferred & Expected Settings (% Students by Year)
Preferred Expected Setting Year 1 Year 2 Year 3 Year 1 Year 2 Year 3
Sole practice 0.4 0.4 1.1 0.7 1.2 1.7 Small (<10) private law firm 8.5 6.6 11.8 8.3 8.8 16.1 Medium (10-50) private law firm 17.6 24.3 26.2 26.7 30.2 26.6 Large (>50) private law firm 26.9 36.1 27.3 25.0 33.7 31.4 In-house counsel for a private corporation 4.0 2.9 4.1 1.4 1.0 1.7
Government or public agency 11.4 8.7 11.8 12.8 7.8 6.3 Crown attorney 7.3 5.1 5.4 3.5 2.3 2.9 Court/judicial clerkship 8.3 7.1 5.6 1.9 1.2 3.4 Legal (aid) clinic 1.5 1.2 0.6 1.3 1.3 1.2 Non-governmental organization 3.2 2.7 2.5 2.2 1.0 0.5 Another setting 0.5 0.6 0.6 0.1 0.6 0.5 Do not plan to article 0.5 0.1 0.3 0.6 0.3 0.6 Uncertain/do not know yet 9.8 4.2 2.5 15.4 10.6 7.1
As well as providing the highest average salaries, private firms also provide most of the
placement opportunities available to law students; therefore, it is not surprising that the majority
of student survey respondents (53.4 to 67.4%) preferred to article with private firms. Slightly
greater proportions of students to those who preferred to article with private firms expected to
article in this type of setting (60.7 to 75.8%). The proportion of students who stated that they
preferred to article with medium-sized firms increased by almost 10 percent over the course of
their legal education, while students’ preferences for large firms remained relatively stable. In
relation to their expectations, the proportion of students who expected to article at medium-sized
firms remained fairly constant into their final year of law school, while the proportion who
expected to article with a large firm increased over their three years at law school. The higher
proportion of students in Year 2 who preferred and expected to article with large firms in
comparison with those in Years 1 and 3 may relate to the increased emphasis on summer job
opportunities and articling placements during Year 2.
Despite the fact that the majority of students reported that they preferred to article with a private
law firm, a substantial proportion of students stated that they would prefer to article in a public
service setting. However, even though almost 28 percent of students would prefer to article in a
non-private context, less than 17 percent of them expected to article in this type of setting.
33
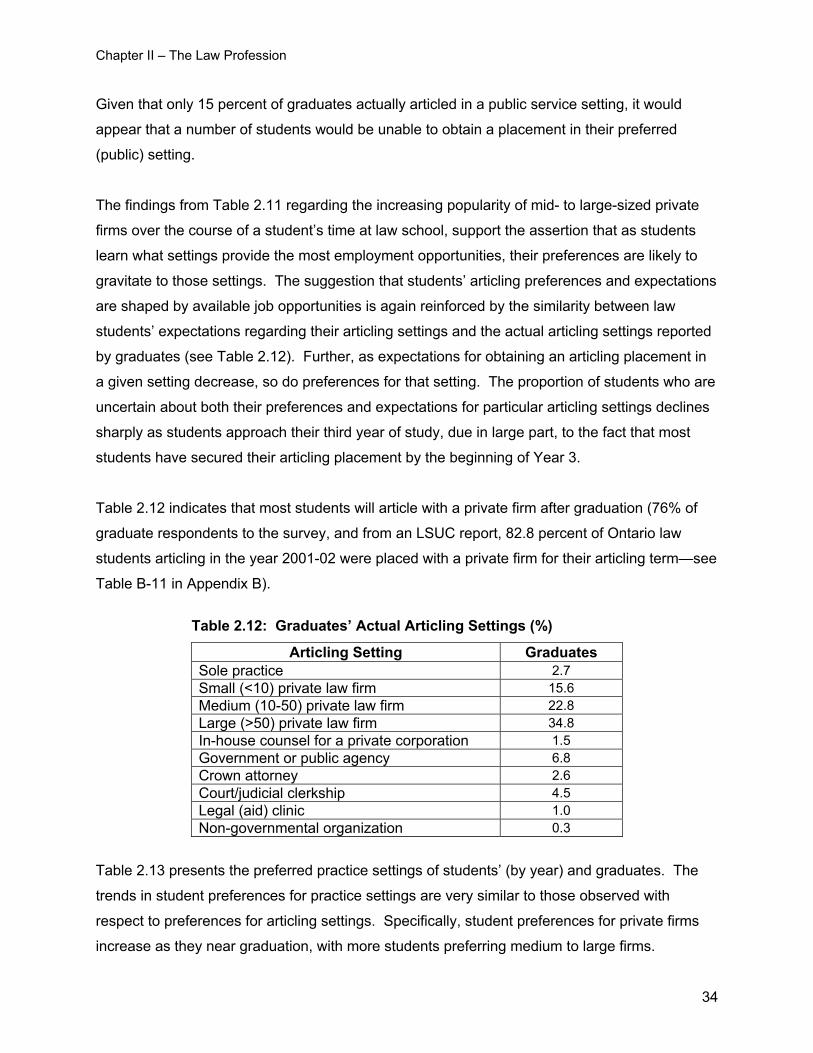
Chapter II – The Law Profession
Given that only 15 percent of graduates actually articled in a public service setting, it would
appear that a number of students would be unable to obtain a placement in their preferred
(public) setting.
The findings from Table 2.11 regarding the increasing popularity of mid- to large-sized private
firms over the course of a student’s time at law school, support the assertion that as students
learn what settings provide the most employment opportunities, their preferences are likely to
gravitate to those settings. The suggestion that students’ articling preferences and expectations
are shaped by available job opportunities is again reinforced by the similarity between law
students’ expectations regarding their articling settings and the actual articling settings reported
by graduates (see Table 2.12). Further, as expectations for obtaining an articling placement in
a given setting decrease, so do preferences for that setting. The proportion of students who are
uncertain about both their preferences and expectations for particular articling settings declines
sharply as students approach their third year of study, due in large part, to the fact that most
students have secured their articling placement by the beginning of Year 3.
Table 2.12 indicates that most students will article with a private firm after graduation (76% of
graduate respondents to the survey, and from an LSUC report, 82.8 percent of Ontario law
students articling in the year 2001-02 were placed with a private firm for their articling term—see
Table B-11 in Appendix B).
Table 2.12: Graduates’ Actual Articling Settings (%)
Articling Setting Graduates Sole practice 2.7 Small (<10) private law firm 15.6 Medium (10-50) private law firm 22.8 Large (>50) private law firm 34.8 In-house counsel for a private corporation 1.5 Government or public agency 6.8 Crown attorney 2.6 Court/judicial clerkship 4.5 Legal (aid) clinic 1.0 Non-governmental organization 0.3
Table 2.13 presents the preferred practice settings of students’ (by year) and graduates. The
trends in student preferences for practice settings are very similar to those observed with
respect to preferences for articling settings. Specifically, student preferences for private firms
increase as they near graduation, with more students preferring medium to large firms.
34
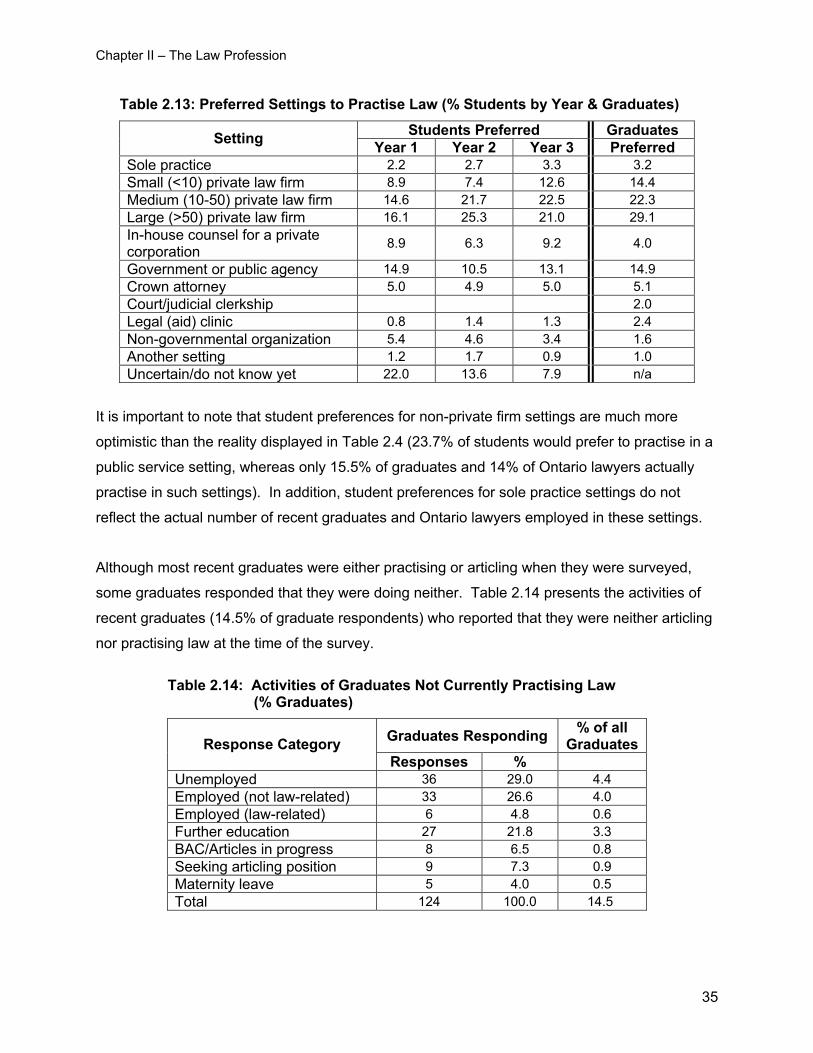
Chapter II – The Law Profession
Table 2.13: Preferred Settings to Practise Law (% Students by Year & Graduates)
Students Preferred Graduates Setting Year 1 Year 2 Year 3 Preferred Sole practice 2.2 2.7 3.3 3.2 Small (<10) private law firm 8.9 7.4 12.6 14.4 Medium (10-50) private law firm 14.6 21.7 22.5 22.3 Large (>50) private law firm 16.1 25.3 21.0 29.1 In-house counsel for a private corporation 8.9 6.3 9.2 4.0
Government or public agency 14.9 10.5 13.1 14.9 Crown attorney 5.0 4.9 5.0 5.1 Court/judicial clerkship 2.0 Legal (aid) clinic 0.8 1.4 1.3 2.4 Non-governmental organization 5.4 4.6 3.4 1.6 Another setting 1.2 1.7 0.9 1.0 Uncertain/do not know yet 22.0 13.6 7.9 n/a
It is important to note that student preferences for non-private firm settings are much more
optimistic than the reality displayed in Table 2.4 (23.7% of students would prefer to practise in a
public service setting, whereas only 15.5% of graduates and 14% of Ontario lawyers actually
practise in such settings). In addition, student preferences for sole practice settings do not
reflect the actual number of recent graduates and Ontario lawyers employed in these settings.
Although most recent graduates were either practising or articling when they were surveyed,
some graduates responded that they were doing neither. Table 2.14 presents the activities of
recent graduates (14.5% of graduate respondents) who reported that they were neither articling
nor practising law at the time of the survey.
Table 2.14: Activities of Graduates Not Currently Practising Law (% Graduates)
Graduates Responding % of all Graduates Response Category
Responses % Unemployed 36 29.0 4.4 Employed (not law-related) 33 26.6 4.0 Employed (law-related) 6 4.8 0.6 Further education 27 21.8 3.3 BAC/Articles in progress 8 6.5 0.8 Seeking articling position 9 7.3 0.9 Maternity leave 5 4.0 0.5 Total 124 100.0 14.5
35
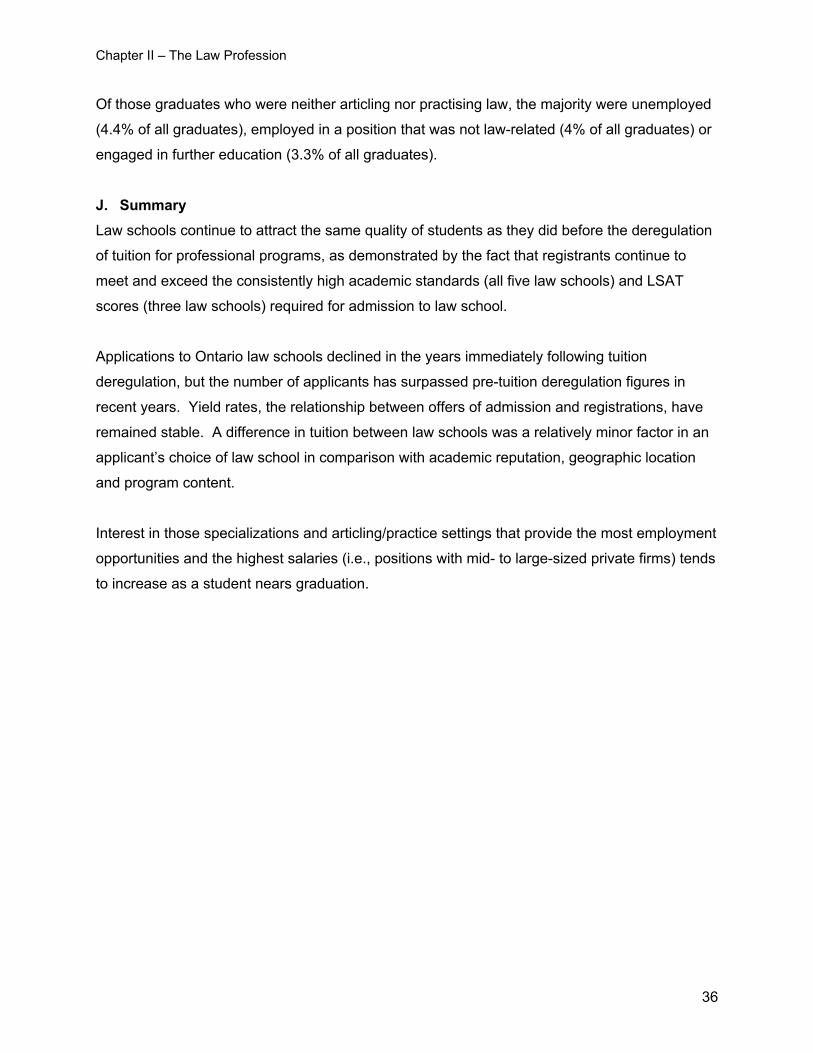
Chapter II – The Law Profession
36
Of those graduates who were neither articling nor practising law, the majority were unemployed
(4.4% of all graduates), employed in a position that was not law-related (4% of all graduates) or
engaged in further education (3.3% of all graduates).
J. Summary
Law schools continue to attract the same quality of students as they did before the deregulation
of tuition for professional programs, as demonstrated by the fact that registrants continue to
meet and exceed the consistently high academic standards (all five law schools) and LSAT
scores (three law schools) required for admission to law school.
Applications to Ontario law schools declined in the years immediately following tuition
deregulation, but the number of applicants has surpassed pre-tuition deregulation figures in
recent years. Yield rates, the relationship between offers of admission and registrations, have
remained stable. A difference in tuition between law schools was a relatively minor factor in an
applicant’s choice of law school in comparison with academic reputation, geographic location
and program content.
Interest in those specializations and articling/practice settings that provide the most employment
opportunities and the highest salaries (i.e., positions with mid- to large-sized private firms) tends
to increase as a student nears graduation.
CHAPTER III – COSTS OF ATTENDING FIVE ONTARIO LAW SCHOOLS AND FINANCIAL SUPPORTS
A. Introduction In the first section of this chapter, we present tuition rates at each of the five law schools for the
past seven years and indicate the changes in tuition since deregulation. We also estimate the
total cost of a legal education, including expenses related to the Bar Admission Course.
In the second section, we focus on student sources of financial support. Changes over time in
the number of students receiving a particular form of financial aid and the amounts awarded per
student are considered. We identify and describe the major sources of financial assistance
available to law students and examine the changes to financial aid (i.e., bursaries, scholarships
and awards) that have taken place in response to tuition increases.
Throughout this chapter, comparisons are made between information on graduates,
representing the period prior to tuition deregulation and that of current students, representing
the post-deregulation period.
B. Cost of Attending Law School
1. Tuition
In Ontario, tuition fees for most undergraduate university programs (including professional
programs such as law) are set by a university’s governing board. Tuition is typically
calculated by adding a ‘discretionary’ amount to the ‘standard fee’ established by the
provincial government. Although the tuition standard set by the Ontario government is not
binding on any particular university, the provincial funding given to a university is reduced by
the amount by which the university exceeds the province’s calculated ‘standard fee’ (Ontario
Council of Universities – Briefing Notes October 2000). On December 15, 1997, then
Minister of Finance Ernie Eves announced the following changes to provincial tuition
regulation during Ontario’s annual economic statement:
that institutions would have discretion to set tuition fees for graduate and professional programs at universities…and for other college programs where job opportunities for graduates are virtually guaranteed and income after graduation is substantial. (Frangou, 1997)
37
Chapter III –Costs of Attending Five Ontario Law Schools and Financial Supports
In May of 1998, the Ministry of Training for Colleges and Universities (MTCU) clarified the
December 1997 tuition policy announcement by providing the following information: tuition
fee increases for any single program could not exceed 20 percent (until current students
completed their program in 1999) and ‘additional cost recovery’ was allowed in the case of
graduate and professional programs (Ontario Council of Universities, 2000).
In an attempt to mitigate the effect of tuition increases on university students, the provincial
government introduced a tuition reinvestment policy to Ontario universities as of the 1996-97
academic year requiring them to augment student financial aid by a portion of their annual
tuition fee increases. The following year, universities were required to increase student
financial aid by 30 percent (up from 10 percent in 1996-97) of the annual tuition increase for
all enrolees—i.e., 30 percent of the tuition fee increase between the previous year and the
current year multiplied by the current year’s enrolment (Ontario Council of Universities,
2000).
The first tuition increase following the announcement of the deregulation of tuition for
university professional programs could have been implemented by law schools as of 1998-
99 academic year. Thus, it is important to look at tuition fees between the 1997-98
academic year and the 2003-04 academic year in order to understand how deregulation has
affected law school tuition. Since the 1997-98 academic year, tuition fees at the five Ontario
law schools in this study have risen by between $5,318 and $8,772 (see Table 3.1).
38
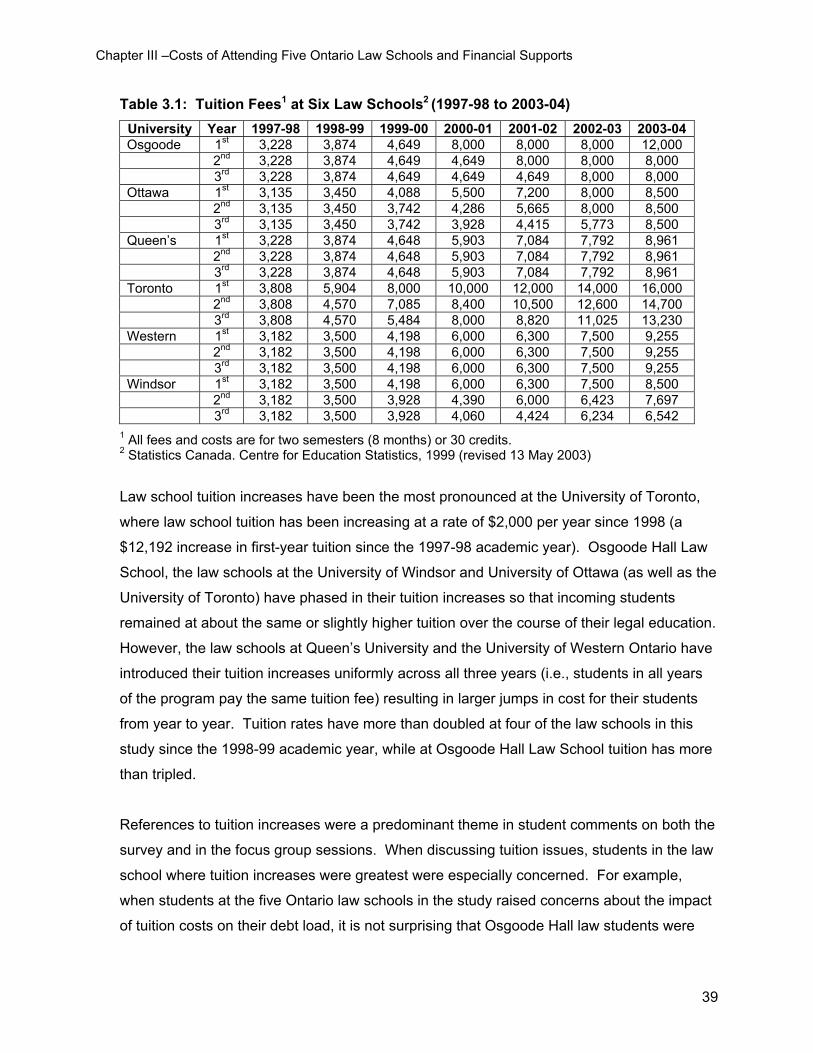
Chapter III –Costs of Attending Five Ontario Law Schools and Financial Supports
Table 3.1: Tuition Fees1 at Six Law Schools2 (1997-98 to 2003-04) University Year 1997-98 1998-99 1999-00 2000-01 2001-02 2002-03 2003-04 Osgoode 1st 3,228 3,874 4,649 8,000 8,000 8,000 12,000 2nd 3,228 3,874 4,649 4,649 8,000 8,000 8,000 3rd 3,228 3,874 4,649 4,649 4,649 8,000 8,000 Ottawa 1st 3,135 3,450 4,088 5,500 7,200 8,000 8,500 2nd 3,135 3,450 3,742 4,286 5,665 8,000 8,500 3rd 3,135 3,450 3,742 3,928 4,415 5,773 8,500 Queen’s 1st 3,228 3,874 4,648 5,903 7,084 7,792 8,961 2nd 3,228 3,874 4,648 5,903 7,084 7,792 8,961 3rd 3,228 3,874 4,648 5,903 7,084 7,792 8,961 Toronto 1st 3,808 5,904 8,000 10,000 12,000 14,000 16,000 2nd 3,808 4,570 7,085 8,400 10,500 12,600 14,700 3rd 3,808 4,570 5,484 8,000 8,820 11,025 13,230 Western 1st 3,182 3,500 4,198 6,000 6,300 7,500 9,255 2nd 3,182 3,500 4,198 6,000 6,300 7,500 9,255 3rd 3,182 3,500 4,198 6,000 6,300 7,500 9,255 Windsor 1st 3,182 3,500 4,198 6,000 6,300 7,500 8,500 2nd 3,182 3,500 3,928 4,390 6,000 6,423 7,697 3rd 3,182 3,500 3,928 4,060 4,424 6,234 6,542
1 All fees and costs are for two semesters (8 months) or 30 credits. 2 Statistics Canada. Centre for Education Statistics, 1999 (revised 13 May 2003)
Law school tuition increases have been the most pronounced at the University of Toronto,
where law school tuition has been increasing at a rate of $2,000 per year since 1998 (a
$12,192 increase in first-year tuition since the 1997-98 academic year). Osgoode Hall Law
School, the law schools at the University of Windsor and University of Ottawa (as well as the
University of Toronto) have phased in their tuition increases so that incoming students
remained at about the same or slightly higher tuition over the course of their legal education.
However, the law schools at Queen’s University and the University of Western Ontario have
introduced their tuition increases uniformly across all three years (i.e., students in all years
of the program pay the same tuition fee) resulting in larger jumps in cost for their students
from year to year. Tuition rates have more than doubled at four of the law schools in this
study since the 1998-99 academic year, while at Osgoode Hall Law School tuition has more
than tripled.
References to tuition increases were a predominant theme in student comments on both the
survey and in the focus group sessions. When discussing tuition issues, students in the law
school where tuition increases were greatest were especially concerned. For example,
when students at the five Ontario law schools in the study raised concerns about the impact
of tuition costs on their debt load, it is not surprising that Osgoode Hall law students were
39
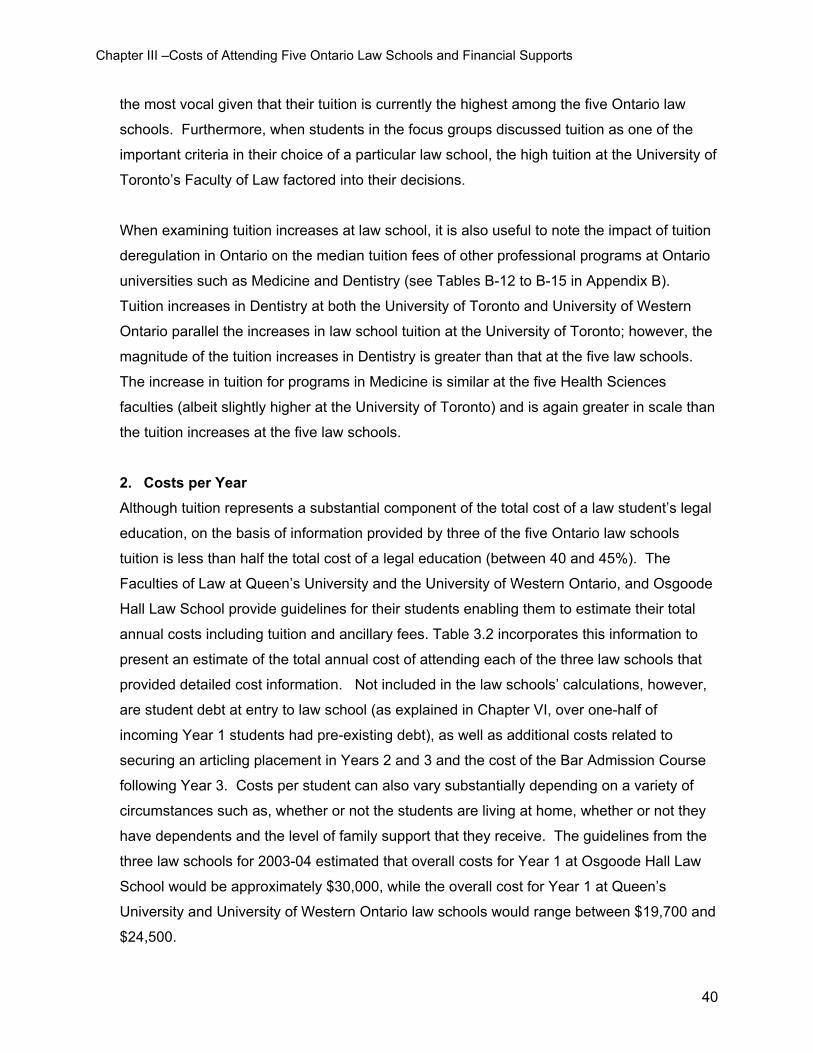
Chapter III –Costs of Attending Five Ontario Law Schools and Financial Supports
the most vocal given that their tuition is currently the highest among the five Ontario law
schools. Furthermore, when students in the focus groups discussed tuition as one of the
important criteria in their choice of a particular law school, the high tuition at the University of
Toronto’s Faculty of Law factored into their decisions.
When examining tuition increases at law school, it is also useful to note the impact of tuition
deregulation in Ontario on the median tuition fees of other professional programs at Ontario
universities such as Medicine and Dentistry (see Tables B-12 to B-15 in Appendix B).
Tuition increases in Dentistry at both the University of Toronto and University of Western
Ontario parallel the increases in law school tuition at the University of Toronto; however, the
magnitude of the tuition increases in Dentistry is greater than that at the five law schools.
The increase in tuition for programs in Medicine is similar at the five Health Sciences
faculties (albeit slightly higher at the University of Toronto) and is again greater in scale than
the tuition increases at the five law schools. 2. Costs per Year Although tuition represents a substantial component of the total cost of a law student’s legal
education, on the basis of information provided by three of the five Ontario law schools
tuition is less than half the total cost of a legal education (between 40 and 45%). The
Faculties of Law at Queen’s University and the University of Western Ontario, and Osgoode
Hall Law School provide guidelines for their students enabling them to estimate their total
annual costs including tuition and ancillary fees. Table 3.2 incorporates this information to
present an estimate of the total annual cost of attending each of the three law schools that
provided detailed cost information. Not included in the law schools’ calculations, however,
are student debt at entry to law school (as explained in Chapter VI, over one-half of
incoming Year 1 students had pre-existing debt), as well as additional costs related to
securing an articling placement in Years 2 and 3 and the cost of the Bar Admission Course
following Year 3. Costs per student can also vary substantially depending on a variety of
circumstances such as, whether or not the students are living at home, whether or not they
have dependents and the level of family support that they receive. The guidelines from the
three law schools for 2003-04 estimated that overall costs for Year 1 at Osgoode Hall Law
School would be approximately $30,000, while the overall cost for Year 1 at Queen’s
University and University of Western Ontario law schools would range between $19,700 and
$24,500.
40
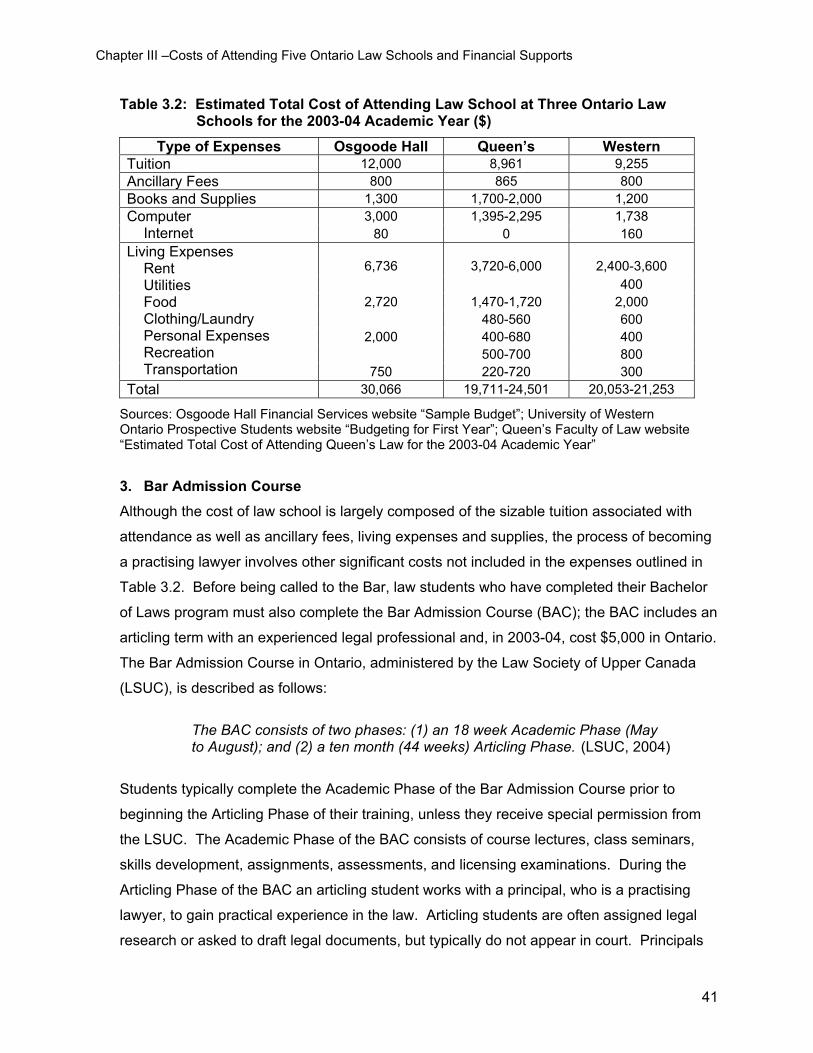
Chapter III –Costs of Attending Five Ontario Law Schools and Financial Supports
Table 3.2: Estimated Total Cost of Attending Law School at Three Ontario Law Schools for the 2003-04 Academic Year ($)
Type of Expenses Osgoode Hall Queen’s Western Tuition 12,000 8,961 9,255 Ancillary Fees 800 865 800 Books and Supplies 1,300 1,700-2,000 1,200
3,000 1,395-2,295 1,738 Computer Internet 80 0 160
6,736
3,720-6,000
2,400-3,600
400 2,720 1,470-1,720 2,000
480-560 600 2,000 400-680 400
500-700 800
Living Expenses Rent Utilities Food Clothing/Laundry Personal Expenses Recreation Transportation 750 220-720 300
Total 30,066 19,711-24,501 20,053-21,253
Sources: Osgoode Hall Financial Services website “Sample Budget”; University of Western Ontario Prospective Students website “Budgeting for First Year”; Queen’s Faculty of Law website “Estimated Total Cost of Attending Queen’s Law for the 2003-04 Academic Year”
3. Bar Admission Course Although the cost of law school is largely composed of the sizable tuition associated with
attendance as well as ancillary fees, living expenses and supplies, the process of becoming
a practising lawyer involves other significant costs not included in the expenses outlined in
Table 3.2. Before being called to the Bar, law students who have completed their Bachelor
of Laws program must also complete the Bar Admission Course (BAC); the BAC includes an
articling term with an experienced legal professional and, in 2003-04, cost $5,000 in Ontario.
The Bar Admission Course in Ontario, administered by the Law Society of Upper Canada
(LSUC), is described as follows:
The BAC consists of two phases: (1) an 18 week Academic Phase (May to August); and (2) a ten month (44 weeks) Articling Phase. (LSUC, 2004)
Students typically complete the Academic Phase of the Bar Admission Course prior to
beginning the Articling Phase of their training, unless they receive special permission from
the LSUC. The Academic Phase of the BAC consists of course lectures, class seminars,
skills development, assignments, assessments, and licensing examinations. During the
Articling Phase of the BAC an articling student works with a principal, who is a practising
lawyer, to gain practical experience in the law. Articling students are often assigned legal
research or asked to draft legal documents, but typically do not appear in court. Principals
41
Chapter III –Costs of Attending Five Ontario Law Schools and Financial Supports
submit an education plan for approval to the LSUC that outlines the tasks and
responsibilities that the articling student is to perform during his/her articling term. Once
students have completed both phases of the Bar Admission Course, they attend a formal
ceremony at which they are ‘called to the Bar’. Seven of these ceremonies were held in
June 2004.
At the end of 2003, the Law Society’s governing body approved reforms to the Bar
Admission Course program that are set to take effect in the spring of 2006. Under the
proposed reforms, the 18 week Academic Phase of the BAC would be replaced by a 4 week
skills and professional responsibility program. Students would be required to complete two
licensing examinations (a barrister examination and a solicitor examination) as opposed to
the six examinations that were previously required for the course. The two examinations
required under the new BAC format would be scheduled three times a year (in July, October
and February) and are considered part of the Articling Phase of the Bar Admission Course.
Students will be given five business days to study for each exam and two business days to
complete each exam (one free day and one day to write the exam) resulting in 14 business
days being required for the completion of the exams. The three-week period necessary for
licensing examinations is to be added onto the existing 44-week articling period under the
current system, resulting in a new 47 week Articling Phase—students had previously
completed their licensing examinations as part of the Academic Phase of the BAC. The new
Bar Admission Course format is intended to better prepare students for the practice of law
by providing more instruction in areas not covered under the current law school curriculum
(i.e., skills and professional responsibility). Also, by shortening the initial phase of the BAC,
it is estimated that students will save $1,800 in tuition and fees, not to mention the added
financial benefit of beginning their articling placement earlier (and thereby beginning to earn
a salary earlier).
a. Bar Admission Course Costs and Financial Assistance The Bar Admission Course is offered in five cities: Kingston, London, Ottawa, Toronto
and Windsor. The numbers of students attending the 2004 BAC Academic Phase at
each centre were as follows: 118 students in London, 99 students in Windsor, 344
students in Ottawa, 21 students in Kingston and 1,043 in Toronto (1,625 students total).
Given the amount of time that students must physically spend at the BAC location of
their choice, students must either secure accommodation in that city or commute to and
42
Chapter III –Costs of Attending Five Ontario Law Schools and Financial Supports
from the location on a regular basis. In addition to travel and accommodation costs, the
basic fees associated with the 2004 Bar Admission Course are as follows: (1) an
application fee of $133.75; (2) tuition of $4,708; and (3) a fee associated with their formal
Call to the Bar of $224.70 (The Articling Handbook). The basic fees mentioned above
do not include late fees, replacement fees (for lost materials or student cards) or fees
associated with the printing of an official BAC transcript.
Financial assistance is available to law students during the BAC Academic Phase.
Students requiring additional funds may apply to the Ontario Student Assistance
Program (OSAP), the Ontario Work Study Program (OWSP) and the Law Society
Repayable Allowance Program (LRAP), as well as for bank loans, lines of credit (the
LSUC website specifically mentions the Bank of Montreal’s Student Line of Credit for
Professionals) and/or other types of loans. The LRAP is a program developed by the
Law Society of Upper Canada for those BAC students who are unable to obtain funding
from other sources (i.e., students must have applied for and been denied other types of
financial assistance). Students who qualify for LRAP receive a maximum of $5,000 per
calendar year.
b. Articling Articling, as a type of apprenticeship, was defined in Chapter I. Although, as noted
above, the Law Society of Upper Canada in Ontario administers and regulates the
Articling Phase of the Bar Admission Course, it is primarily up to students to secure an
articling position. Law school personnel, especially those associated with a law school’s
career services department, provide students with help in this process. As part of the
effort to provide assistance to students seeking articling positions, career services
personnel provide practical skills training (e.g., assistance with resumés and interview
techniques) meet with firms to investigate potential placement, communicate with
colleagues across law schools to develop strategies, share a common database of firms
with potential articling opportunities, and serve as a contact for employers. The process
of obtaining an articling position is highly competitive as well as very stressful for
students and can be quite costly. Students must assume the financial burden of printing
resumés, obtaining transcripts and sending out applications (some schools send out
applications), as well as the costs associated with traveling to out-of-town interviews and
purchasing appropriate attire for interviews.
43
Chapter III –Costs of Attending Five Ontario Law Schools and Financial Supports
i. The Articling Search Process Law students typically begin the articling search process in the summer following the
end of Year 2 in law school. At this time, applications, including resumés and
transcripts, are submitted for articling positions with the desired law firms. If students
are unsuccessful at obtaining an articling position before the start of Year 3, their
search will continue into their final year of law school—placing them in a very
stressful position. Two law schools’ career services staff reported a slight increase in
the proportion of Year 3 students who had not secured an articling position by
September of their third year; this could be due to a recent shortage of articling
positions.
The next step in the search for an articling position occurs when a student receives a
call for an interview with an interested firm. If a student is extremely fortunate, he or
she may secure an articling position with a firm (typically a large Toronto firm) that
will pay not only the Bar Admission Course fees but that will also pay them a salary
over the course of the eighteen-week Academic Phase. In the 2002-03 year, 75
percent of Ontario law students articling in Toronto had some or all of their BAC
tuition fees paid and 60 percent received their full salary while completing the Bar
Admission Course (these figures represent 52.3% and 41.8% of all 2002-03 Ontario
articling students). Many students covet positions with firms that typically offer
additional funding.
I definitely prioritized large firms for articling applications. I could not have imagined incurring more debt than would have come from Bar-ad fees, etc – was lucky enough to have salary paid during Bar-ads and third year tuition bonus… (Graduate 2002, Female)
In addition to the financial benefits of receiving a salary and having one’s BAC fees
paid, an articling student may receive a more or less generous articling salary
depending on the firm with whom he or she is employed. In general, larger sized
firms’ articling salaries are significantly higher than those of smaller firms. For
example, as can be seen in Table 3.3, in mid-to-large size firms (26 or more lawyers)
salaries for 2003 articling students are substantially more than those paid by small
(5-25 lawyers) or solo-to-four firms. Once students begin articling, or if they have not
automatically had their provincial and federal student loans put on hold while
completing the Academic Phase of the Bar Admission Course, they must begin to
44
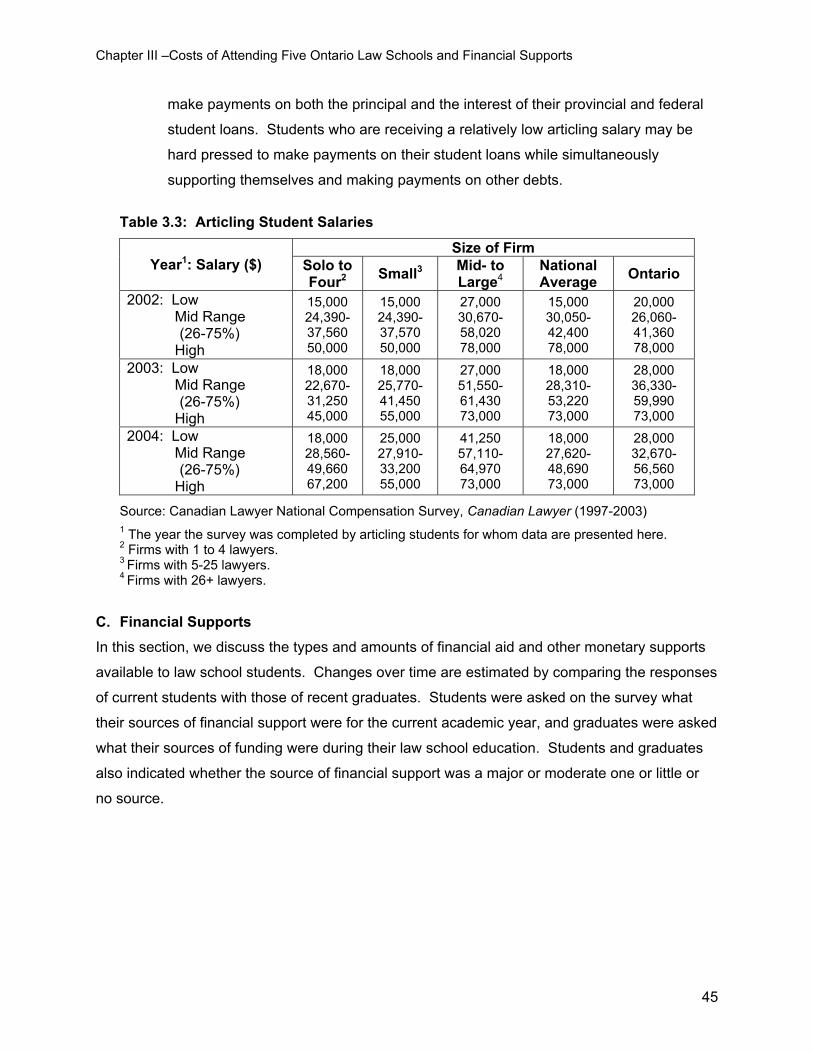
Chapter III –Costs of Attending Five Ontario Law Schools and Financial Supports
make payments on both the principal and the interest of their provincial and federal
student loans. Students who are receiving a relatively low articling salary may be
hard pressed to make payments on their student loans while simultaneously supporting themselves and making payments on other debts.
Table 3.3: Articling Student Salaries
Size of Firm Year1: Salary ($) Solo to
Four2 Small3 Mid- to Large4
National Average Ontario
2002: Low Mid Range (26-75%)
High
15,000 24,390-37,560 50,000
15,000 24,390-37,570 50,000
27,000 30,670-58,020 78,000
15,000 30,050-42,400 78,000
20,000 26,060-41,360 78,000
2003: Low Mid Range (26-75%)
High
18,000 22,670-31,250 45,000
18,000 25,770-41,450 55,000
27,000 51,550-61,430 73,000
18,000 28,310-53,220 73,000
28,000 36,330-59,990 73,000
2004: Low Mid Range (26-75%)
High
18,000 28,560-49,660 67,200
25,000 27,910-33,200 55,000
41,250 57,110-64,970 73,000
18,000 27,620-48,690 73,000
28,000 32,670-56,560 73,000
Source: Canadian Lawyer National Compensation Survey, Canadian Lawyer (1997-2003) 1 The year the survey was completed by articling students for whom data are presented here. 2 Firms with 1 to 4 lawyers. 3 Firms with 5-25 lawyers. 4 Firms with 26+ lawyers.
C. Financial Supports
In this section, we discuss the types and amounts of financial aid and other monetary supports
available to law school students. Changes over time are estimated by comparing the responses
of current students with those of recent graduates. Students were asked on the survey what
their sources of financial support were for the current academic year, and graduates were asked
what their sources of funding were during their law school education. Students and graduates
also indicated whether the source of financial support was a major or moderate one or little or
no source.
45
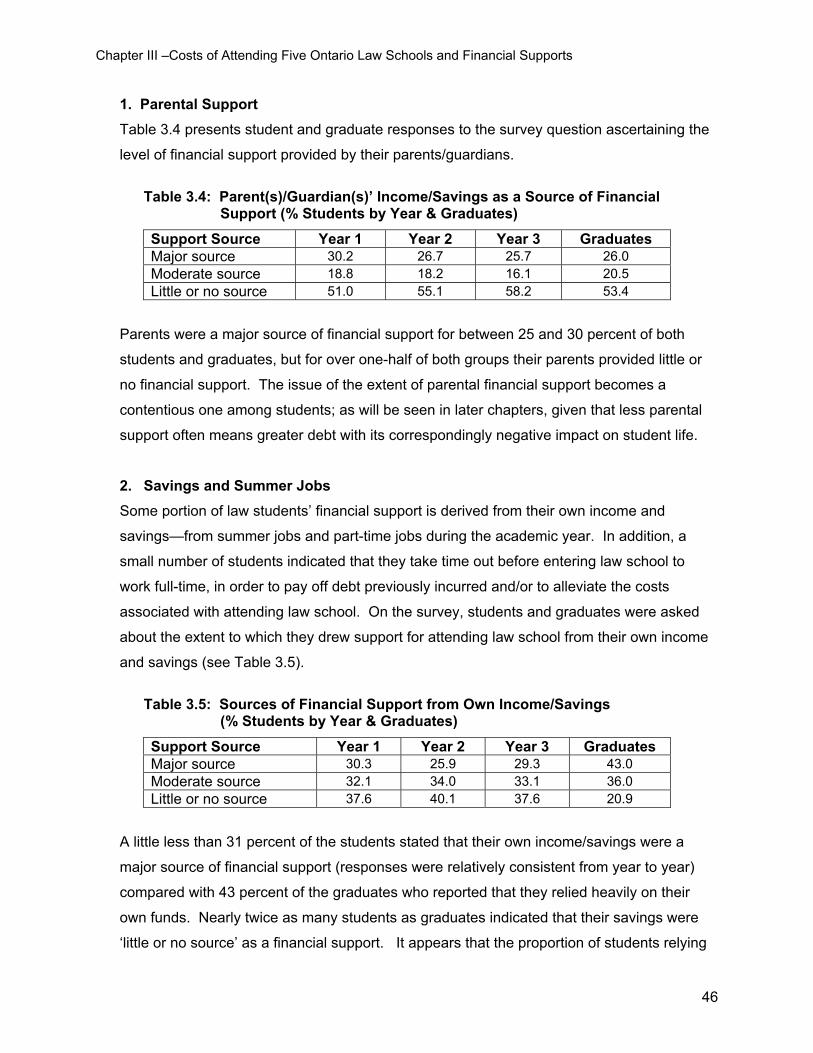
Chapter III –Costs of Attending Five Ontario Law Schools and Financial Supports
1. Parental Support Table 3.4 presents student and graduate responses to the survey question ascertaining the
level of financial support provided by their parents/guardians.
Table 3.4: Parent(s)/Guardian(s)’ Income/Savings as a Source of Financial
Support (% Students by Year & Graduates)
Support Source Year 1 Year 2 Year 3 Graduates Major source 30.2 26.7 25.7 26.0 Moderate source 18.8 18.2 16.1 20.5 Little or no source 51.0 55.1 58.2 53.4
Parents were a major source of financial support for between 25 and 30 percent of both
students and graduates, but for over one-half of both groups their parents provided little or
no financial support. The issue of the extent of parental financial support becomes a
contentious one among students; as will be seen in later chapters, given that less parental
support often means greater debt with its correspondingly negative impact on student life.
2. Savings and Summer Jobs Some portion of law students’ financial support is derived from their own income and
savings—from summer jobs and part-time jobs during the academic year. In addition, a
small number of students indicated that they take time out before entering law school to
work full-time, in order to pay off debt previously incurred and/or to alleviate the costs
associated with attending law school. On the survey, students and graduates were asked
about the extent to which they drew support for attending law school from their own income
and savings (see Table 3.5).
Table 3.5: Sources of Financial Support from Own Income/Savings
(% Students by Year & Graduates)
Support Source Year 1 Year 2 Year 3 Graduates Major source 30.3 25.9 29.3 43.0 Moderate source 32.1 34.0 33.1 36.0 Little or no source 37.6 40.1 37.6 20.9
A little less than 31 percent of the students stated that their own income/savings were a
major source of financial support (responses were relatively consistent from year to year)
compared with 43 percent of the graduates who reported that they relied heavily on their
own funds. Nearly twice as many students as graduates indicated that their savings were
‘little or no source’ as a financial support. It appears that the proportion of students relying
46
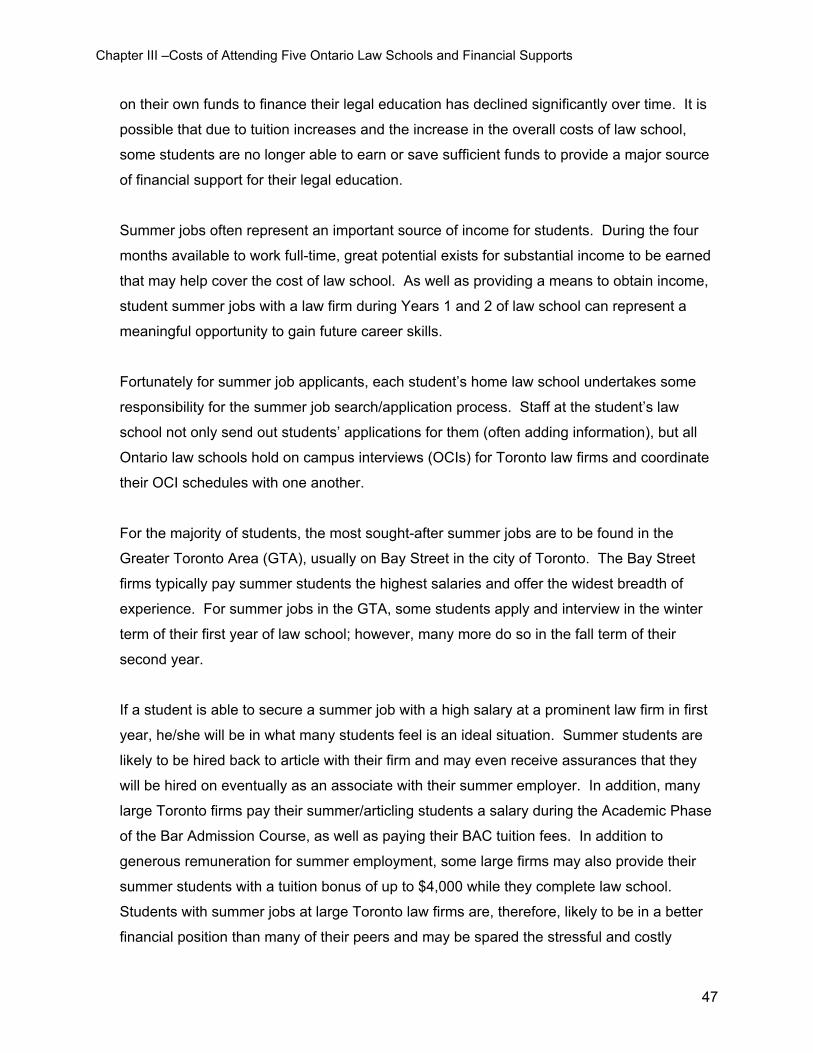
Chapter III –Costs of Attending Five Ontario Law Schools and Financial Supports
on their own funds to finance their legal education has declined significantly over time. It is
possible that due to tuition increases and the increase in the overall costs of law school,
some students are no longer able to earn or save sufficient funds to provide a major source
of financial support for their legal education.
Summer jobs often represent an important source of income for students. During the four
months available to work full-time, great potential exists for substantial income to be earned
that may help cover the cost of law school. As well as providing a means to obtain income,
student summer jobs with a law firm during Years 1 and 2 of law school can represent a
meaningful opportunity to gain future career skills.
Fortunately for summer job applicants, each student’s home law school undertakes some
responsibility for the summer job search/application process. Staff at the student’s law
school not only send out students’ applications for them (often adding information), but all
Ontario law schools hold on campus interviews (OCIs) for Toronto law firms and coordinate
their OCI schedules with one another.
For the majority of students, the most sought-after summer jobs are to be found in the
Greater Toronto Area (GTA), usually on Bay Street in the city of Toronto. The Bay Street
firms typically pay summer students the highest salaries and offer the widest breadth of
experience. For summer jobs in the GTA, some students apply and interview in the winter
term of their first year of law school; however, many more do so in the fall term of their
second year.
If a student is able to secure a summer job with a high salary at a prominent law firm in first
year, he/she will be in what many students feel is an ideal situation. Summer students are
likely to be hired back to article with their firm and may even receive assurances that they
will be hired on eventually as an associate with their summer employer. In addition, many
large Toronto firms pay their summer/articling students a salary during the Academic Phase
of the Bar Admission Course, as well as paying their BAC tuition fees. In addition to
generous remuneration for summer employment, some large firms may also provide their
summer students with a tuition bonus of up to $4,000 while they complete law school.
Students with summer jobs at large Toronto law firms are, therefore, likely to be in a better
financial position than many of their peers and may be spared the stressful and costly
47
Chapter III –Costs of Attending Five Ontario Law Schools and Financial Supports
process of searching for an articling position after Year 2 (and possibly into Year 3). For this
reason, although the articling search process following second year is highly stressful and
competitive, the summer job search has become increasingly competitive and stressful as
well. The pressure to compete for the most sought-after positions and firms can begin as
early as the second term of Year 1 in law school.
3. Paid Part-Time/School-Year Jobs Although many students find it necessary to secure paid work during the school year, even
part-time employment can have a negative impact on their achievement and their ability to
fully engage in all aspects of law school life. In this section, we describe the proportion of
law students and graduates who worked in paid part-time jobs, the number of hours they
worked, the relationship of their school year job to their future law career and the reasons
that students/graduates held their jobs.
It does not appear that many law students take advantage of the Ontario Work Study
Program (OWSP) offered by the provincial government through OSAP. For example, at the
University of Ottawa in the 2001-02 academic year, only 23 students participated in the work
study program out of the approximately 600 students in the Ottawa law program (i.e., less
than 4% of law students). At the Faculty of Law at Queen’s this academic year (2003-04),
only 11 students took part in the OWSP. Two of the law schools had no students using the
OWSP. Students must complete a separate Ontario Work Study Plan application to be
considered for the work study program at their university and submit it to their university’s
financial aid office. To qualify for the Ontario Work Study Plan, a student must be: a
Canadian citizen or permanent resident, an Ontario resident, registered full-time at any
public university and able to demonstrate financial need (either because they received
OSAP during the previous academic year or as a result of the submission of a budget or
financial plan). If eligible for work study, a student’s financial aid office will recommend
him/her to OSAP for approval and will then help the student to find paid part-time work. A
student may earn up to a maximum of $1,000 per term (or $2,000 per academic year) in the
work study program. Typically, each university has a number of paid jobs that they reserve
for students participating in the work study program and an attempt is made to provide paid
positions to students in such a way that they develop and/or improve skills related to their
future employment. Although the work study program is a provincial program, it is largely
administered and managed by the financial aid offices of the individual universities.
48
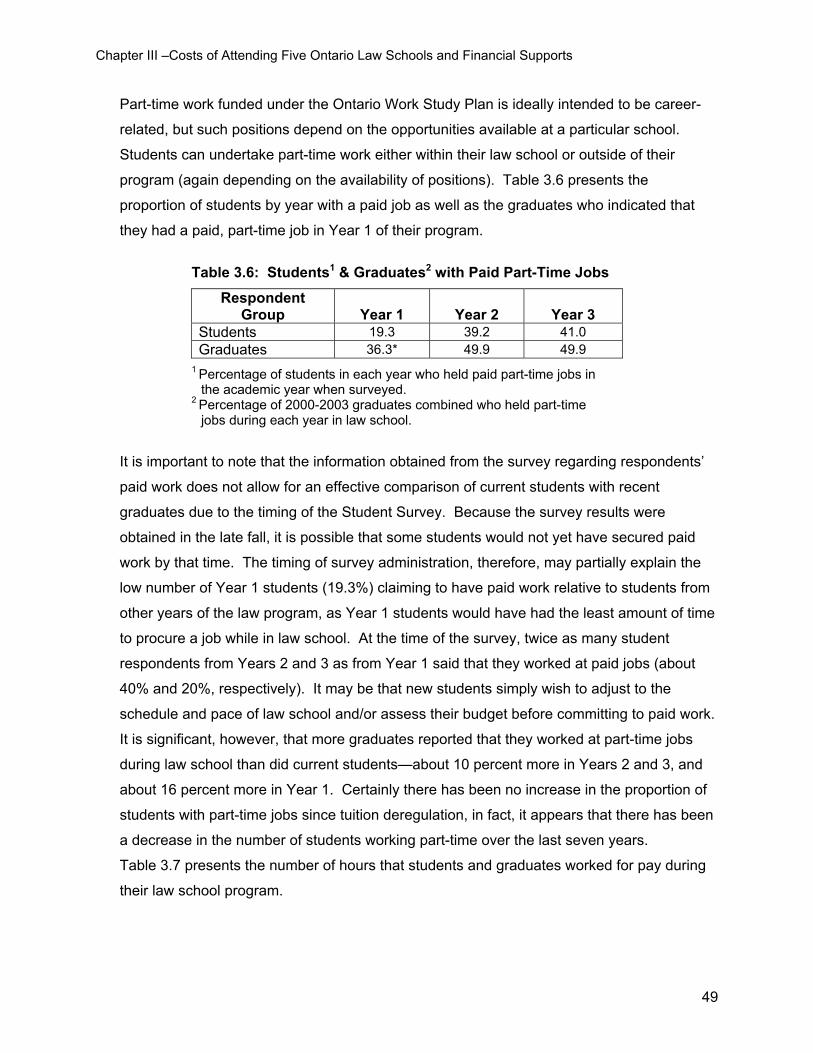
Chapter III –Costs of Attending Five Ontario Law Schools and Financial Supports
Part-time work funded under the Ontario Work Study Plan is ideally intended to be career-
related, but such positions depend on the opportunities available at a particular school.
Students can undertake part-time work either within their law school or outside of their
program (again depending on the availability of positions). Table 3.6 presents the
proportion of students by year with a paid job as well as the graduates who indicated that
they had a paid, part-time job in Year 1 of their program.
Table 3.6: Students1 & Graduates2 with Paid Part-Time Jobs
Respondent Group
Year 1
Year 2
Year 3
Students 19.3 39.2 41.0 Graduates 36.3* 49.9 49.9
1 Percentage of students in each year who held paid part-time jobs in the academic year when surveyed.
2 Percentage of 2000-2003 graduates combined who held part-time jobs during each year in law school.
It is important to note that the information obtained from the survey regarding respondents’
paid work does not allow for an effective comparison of current students with recent
graduates due to the timing of the Student Survey. Because the survey results were
obtained in the late fall, it is possible that some students would not yet have secured paid
work by that time. The timing of survey administration, therefore, may partially explain the
low number of Year 1 students (19.3%) claiming to have paid work relative to students from
other years of the law program, as Year 1 students would have had the least amount of time
to procure a job while in law school. At the time of the survey, twice as many student
respondents from Years 2 and 3 as from Year 1 said that they worked at paid jobs (about
40% and 20%, respectively). It may be that new students simply wish to adjust to the
schedule and pace of law school and/or assess their budget before committing to paid work.
It is significant, however, that more graduates reported that they worked at part-time jobs
during law school than did current students—about 10 percent more in Years 2 and 3, and
about 16 percent more in Year 1. Certainly there has been no increase in the proportion of
students with part-time jobs since tuition deregulation, in fact, it appears that there has been
a decrease in the number of students working part-time over the last seven years.
Table 3.7 presents the number of hours that students and graduates worked for pay during
their law school program.
49
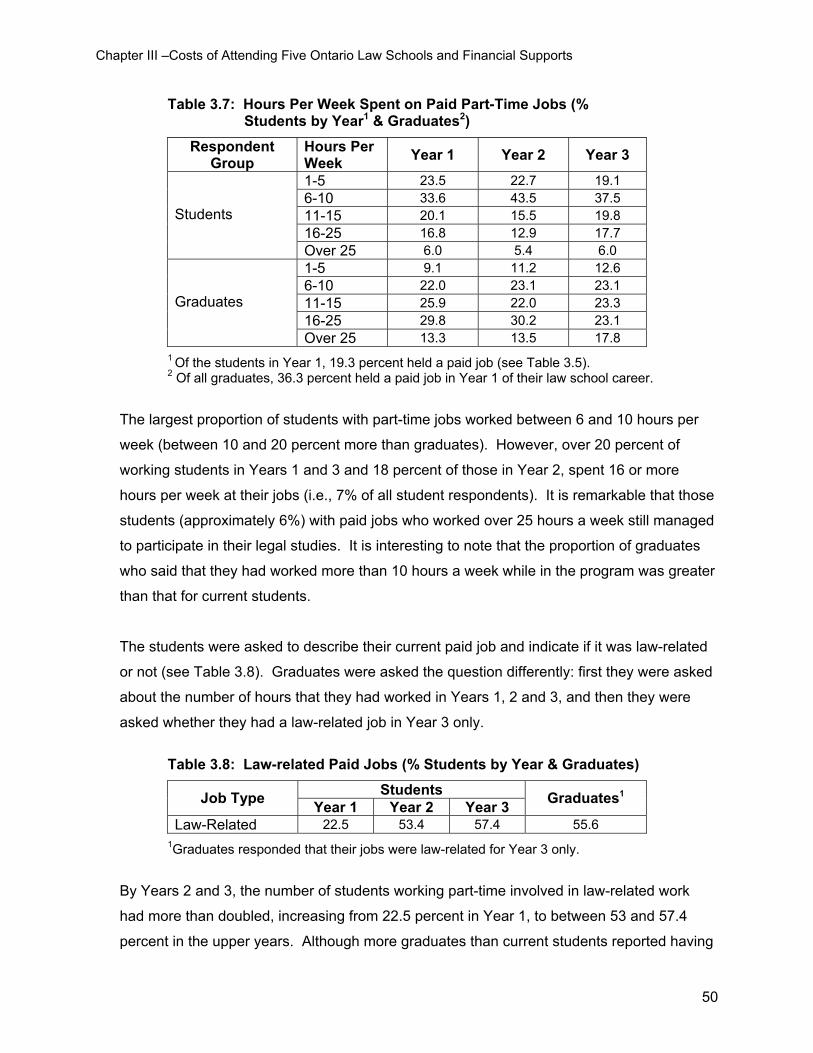
Chapter III –Costs of Attending Five Ontario Law Schools and Financial Supports
Table 3.7: Hours Per Week Spent on Paid Part-Time Jobs (% Students by Year1 & Graduates2)
Respondent Group
Hours Per Week Year 1 Year 2 Year 3
1-5 23.5 22.7 19.1 6-10 33.6 43.5 37.5 11-15 20.1 15.5 19.8 16-25 16.8 12.9 17.7
Students
Over 25 6.0 5.4 6.0 1-5 9.1 11.2 12.6 6-10 22.0 23.1 23.1 11-15 25.9 22.0 23.3 16-25 29.8 30.2 23.1
Graduates
Over 25 13.3 13.5 17.8 1 Of the students in Year 1, 19.3 percent held a paid job (see Table 3.5). 2 Of all graduates, 36.3 percent held a paid job in Year 1 of their law school career.
The largest proportion of students with part-time jobs worked between 6 and 10 hours per
week (between 10 and 20 percent more than graduates). However, over 20 percent of
working students in Years 1 and 3 and 18 percent of those in Year 2, spent 16 or more
hours per week at their jobs (i.e., 7% of all student respondents). It is remarkable that those
students (approximately 6%) with paid jobs who worked over 25 hours a week still managed
to participate in their legal studies. It is interesting to note that the proportion of graduates
who said that they had worked more than 10 hours a week while in the program was greater
than that for current students.
The students were asked to describe their current paid job and indicate if it was law-related
or not (see Table 3.8). Graduates were asked the question differently: first they were asked
about the number of hours that they had worked in Years 1, 2 and 3, and then they were
asked whether they had a law-related job in Year 3 only.
Table 3.8: Law-related Paid Jobs (% Students by Year & Graduates)
Students Job Type Year 1 Year 2 Year 3 Graduates1
Law-Related 22.5 53.4 57.4 55.6 1Graduates responded that their jobs were law-related for Year 3 only.
By Years 2 and 3, the number of students working part-time involved in law-related work
had more than doubled, increasing from 22.5 percent in Year 1, to between 53 and 57.4
percent in the upper years. Although more graduates than current students reported having
50
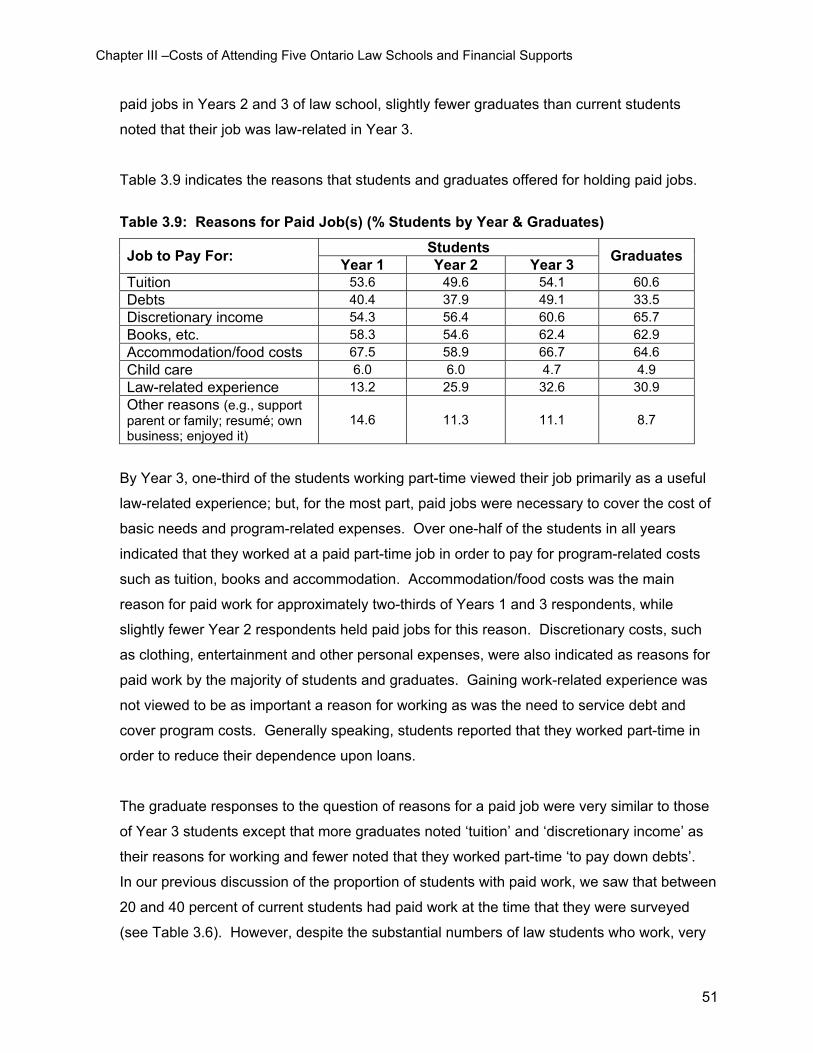
Chapter III –Costs of Attending Five Ontario Law Schools and Financial Supports
paid jobs in Years 2 and 3 of law school, slightly fewer graduates than current students
noted that their job was law-related in Year 3.
Table 3.9 indicates the reasons that students and graduates offered for holding paid jobs.
Table 3.9: Reasons for Paid Job(s) (% Students by Year & Graduates)
Students Job to Pay For: Year 1 Year 2 Year 3 Graduates
Tuition 53.6 49.6 54.1 60.6 Debts 40.4 37.9 49.1 33.5 Discretionary income 54.3 56.4 60.6 65.7 Books, etc. 58.3 54.6 62.4 62.9 Accommodation/food costs 67.5 58.9 66.7 64.6 Child care 6.0 6.0 4.7 4.9 Law-related experience 13.2 25.9 32.6 30.9 Other reasons (e.g., support parent or family; resumé; own business; enjoyed it)
14.6 11.3 11.1 8.7
By Year 3, one-third of the students working part-time viewed their job primarily as a useful
law-related experience; but, for the most part, paid jobs were necessary to cover the cost of
basic needs and program-related expenses. Over one-half of the students in all years
indicated that they worked at a paid part-time job in order to pay for program-related costs
such as tuition, books and accommodation. Accommodation/food costs was the main
reason for paid work for approximately two-thirds of Years 1 and 3 respondents, while
slightly fewer Year 2 respondents held paid jobs for this reason. Discretionary costs, such
as clothing, entertainment and other personal expenses, were also indicated as reasons for
paid work by the majority of students and graduates. Gaining work-related experience was
not viewed to be as important a reason for working as was the need to service debt and
cover program costs. Generally speaking, students reported that they worked part-time in
order to reduce their dependence upon loans.
The graduate responses to the question of reasons for a paid job were very similar to those
of Year 3 students except that more graduates noted ‘tuition’ and ‘discretionary income’ as
their reasons for working and fewer noted that they worked part-time ‘to pay down debts’.
In our previous discussion of the proportion of students with paid work, we saw that between
20 and 40 percent of current students had paid work at the time that they were surveyed
(see Table 3.6). However, despite the substantial numbers of law students who work, very
51
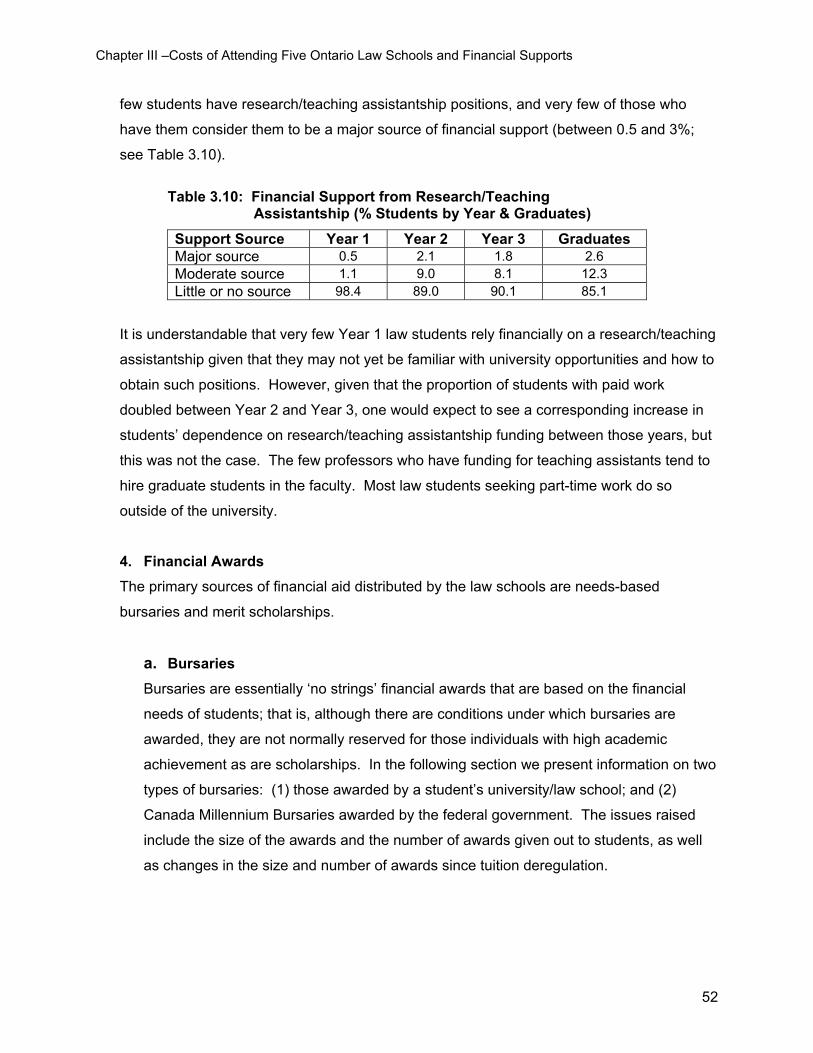
Chapter III –Costs of Attending Five Ontario Law Schools and Financial Supports
few students have research/teaching assistantship positions, and very few of those who
have them consider them to be a major source of financial support (between 0.5 and 3%;
see Table 3.10).
Table 3.10: Financial Support from Research/Teaching
Assistantship (% Students by Year & Graduates)
Support Source Year 1 Year 2 Year 3 Graduates Major source 0.5 2.1 1.8 2.6 Moderate source 1.1 9.0 8.1 12.3 Little or no source 98.4 89.0 90.1 85.1
It is understandable that very few Year 1 law students rely financially on a research/teaching
assistantship given that they may not yet be familiar with university opportunities and how to
obtain such positions. However, given that the proportion of students with paid work
doubled between Year 2 and Year 3, one would expect to see a corresponding increase in
students’ dependence on research/teaching assistantship funding between those years, but
this was not the case. The few professors who have funding for teaching assistants tend to
hire graduate students in the faculty. Most law students seeking part-time work do so
outside of the university.
4. Financial Awards The primary sources of financial aid distributed by the law schools are needs-based
bursaries and merit scholarships.
a. Bursaries Bursaries are essentially ‘no strings’ financial awards that are based on the financial
needs of students; that is, although there are conditions under which bursaries are
awarded, they are not normally reserved for those individuals with high academic
achievement as are scholarships. In the following section we present information on two
types of bursaries: (1) those awarded by a student’s university/law school; and (2)
Canada Millennium Bursaries awarded by the federal government. The issues raised
include the size of the awards and the number of awards given out to students, as well
as changes in the size and number of awards since tuition deregulation.
52
Chapter III –Costs of Attending Five Ontario Law Schools and Financial Supports
i. University/Law School Bursaries University/law school bursaries are awarded to students who provide documentation
to support the claim that they are in need of financial assistance. In order to qualify
for bursaries, students must provide their law school or university with a detailed
account of their income and expenses. Often students must submit their parents’ or
spouse’s financial information in addition to their own when applying for a bursary.
Some compromises have been made in presenting the information collected from the
five law schools since the information obtained differed slightly in format from one
school to another. Table 3.11 presents the 1997-98 to 2003-04 bursaries data for all
five Ontario law schools.
Taking into account the differences in the way in which bursaries were reported,
bursary amounts awarded in 2003-04 ranged from an average of $2,374 per student
at the University of Ottawa (Common Law Program), to an average of $4,752 per
student at the Faculty of Law, Queen’s University. The proportions of students
assisted through bursaries ranged from 47 to 68.5 percent.
Osgoode Hall Law School offers a tuition rebate as part of its bursary system to its
law students whose needs are not met by other available financial assistance
programs. Eligible students who pay tuition fees of $8,000 receive a tuition rebate of
$4,000, whereas eligible students paying more than $8,000 receive a higher rebate.
To be eligible for Osgoode Hall’s tuition rebate program students must “demonstrate
and document three things: (i) that [they] received a maximum government student
loan; (ii) that [they] made an application to Osgoode’s Bursary Program; and (iii) that
[they] have demonstrated financial need”
(http://www.yorku.ca/osgoode/financialservices).
More current students view bursaries (and scholarships) as a major source of
financial support than graduates (see Table B-16 in Appendix B). Not surprisingly,
as can be seen in Table 3.11, the growth in monies available to students in the form
of bursaries in the five law schools has been quite remarkable. Also, the proportion
of students receiving bursaries has steadily increased.
53
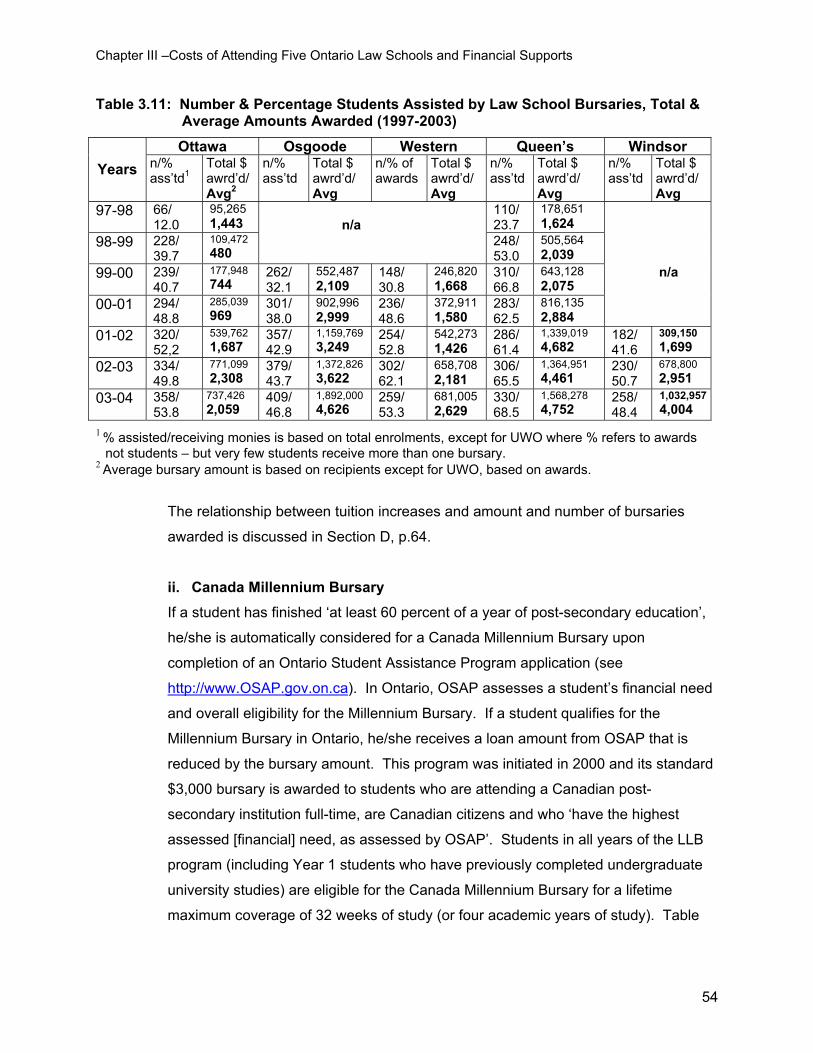
Chapter III –Costs of Attending Five Ontario Law Schools and Financial Supports
Table 3.11: Number & Percentage Students Assisted by Law School Bursaries, Total & Average Amounts Awarded (1997-2003) Ottawa Osgoode Western Queen’s Windsor
Years n/% ass’td1
Total $ awrd’d/ Avg2
n/% ass’td
Total $ awrd’d/ Avg
n/% of awards
Total $ awrd’d/ Avg
n/% ass’td
Total $ awrd’d/ Avg
n/% ass’td
Total $ awrd’d/ Avg
97-98 66/ 12.0
95,265 1,443
n/a
110/ 23.7
178,651 1,624
98-99 228/ 39.7
109,472 480
248/ 53.0
505,564 2,039
99-00 239/ 40.7
177,948 744
262/ 32.1
552,487 2,109
148/ 30.8
246,820 1,668
310/ 66.8
643,128 2,075
n/a
00-01 294/ 48.8
285,039 969
301/ 38.0
902,996 2,999
236/ 48.6
372,911 1,580
283/ 62.5
816,135 2,884
01-02 320/ 52,2
539,762 1,687
357/ 42.9
1,159,769 3,249
254/ 52.8
542,273 1,426
286/ 61.4
1,339,019 4,682
182/ 41.6
309,150 1,699
02-03 334/ 49.8
771,099 2,308
379/ 43.7
1,372,826 3,622
302/ 62.1
658,708 2,181
306/ 65.5
1,364,951 4,461
230/ 50.7
678,800 2,951
03-04 358/ 53.8
737,426 2,059
409/ 46.8
1,892,000 4,626
259/ 53.3
681,005 2,629
330/ 68.5
1,568,278 4,752
258/ 48.4
1,032,9574,004
1 % assisted/receiving monies is based on total enrolments, except for UWO where % refers to awards not students – but very few students receive more than one bursary.
2 Average bursary amount is based on recipients except for UWO, based on awards.
The relationship between tuition increases and amount and number of bursaries
awarded is discussed in Section D, p.64.
ii. Canada Millennium Bursary If a student has finished ‘at least 60 percent of a year of post-secondary education’,
he/she is automatically considered for a Canada Millennium Bursary upon
completion of an Ontario Student Assistance Program application (see
http://www.OSAP.gov.on.ca). In Ontario, OSAP assesses a student’s financial need
and overall eligibility for the Millennium Bursary. If a student qualifies for the
Millennium Bursary in Ontario, he/she receives a loan amount from OSAP that is
reduced by the bursary amount. This program was initiated in 2000 and its standard
$3,000 bursary is awarded to students who are attending a Canadian post-
secondary institution full-time, are Canadian citizens and who ‘have the highest
assessed [financial] need, as assessed by OSAP’. Students in all years of the LLB
program (including Year 1 students who have previously completed undergraduate
university studies) are eligible for the Canada Millennium Bursary for a lifetime
maximum coverage of 32 weeks of study (or four academic years of study). Table
54
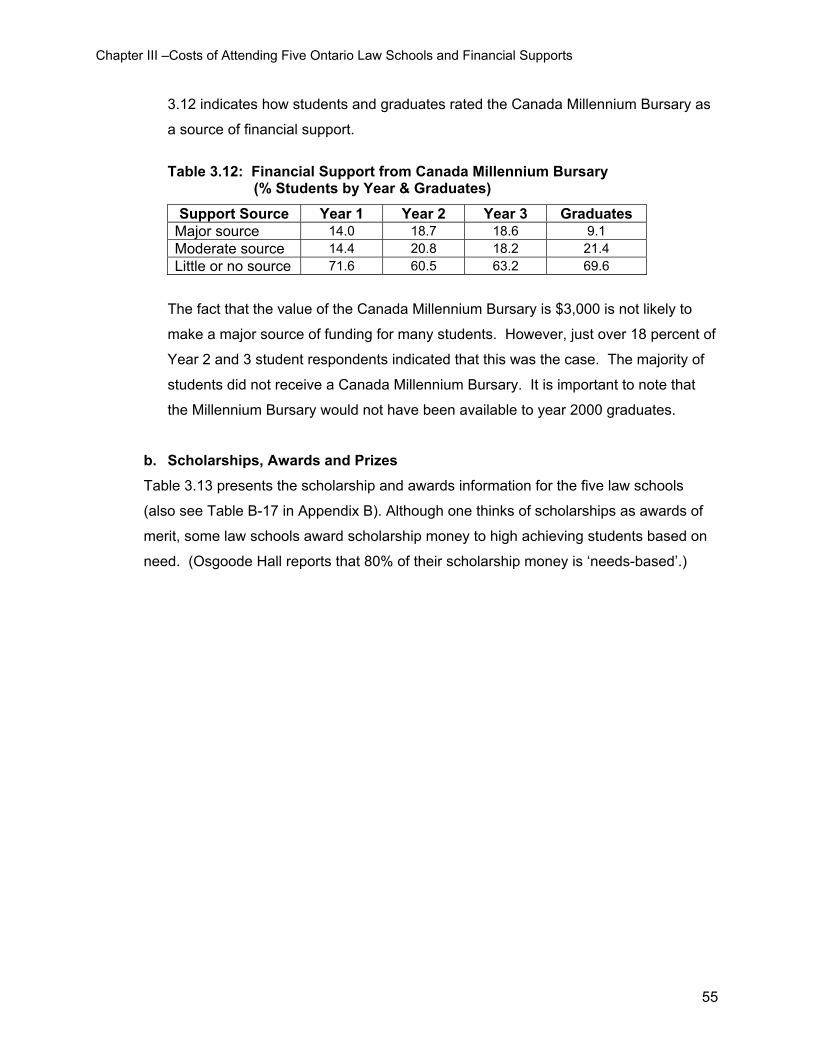
Chapter III –Costs of Attending Five Ontario Law Schools and Financial Supports
3.12 indicates how students and graduates rated the Canada Millennium Bursary as
a source of financial support.
Table 3.12: Financial Support from Canada Millennium Bursary
(% Students by Year & Graduates)
Support Source Year 1 Year 2 Year 3 Graduates Major source 14.0 18.7 18.6 9.1 Moderate source 14.4 20.8 18.2 21.4 Little or no source 71.6 60.5 63.2 69.6
The fact that the value of the Canada Millennium Bursary is $3,000 is not likely to
make a major source of funding for many students. However, just over 18 percent of
Year 2 and 3 student respondents indicated that this was the case. The majority of
students did not receive a Canada Millennium Bursary. It is important to note that
the Millennium Bursary would not have been available to year 2000 graduates.
b. Scholarships, Awards and Prizes Table 3.13 presents the scholarship and awards information for the five law schools
(also see Table B-17 in Appendix B). Although one thinks of scholarships as awards of
merit, some law schools award scholarship money to high achieving students based on
need. (Osgoode Hall reports that 80% of their scholarship money is ‘needs-based’.)
55
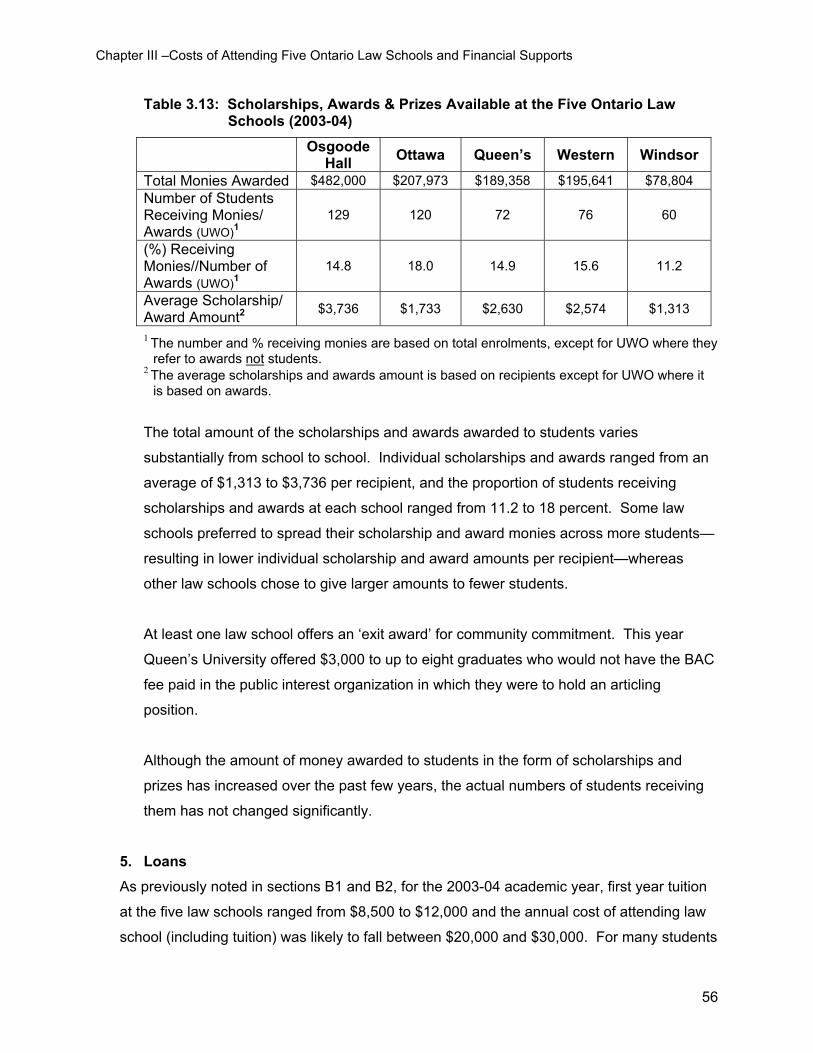
Chapter III –Costs of Attending Five Ontario Law Schools and Financial Supports
Table 3.13: Scholarships, Awards & Prizes Available at the Five Ontario Law Schools (2003-04)
Osgoode Hall Ottawa Queen’s Western Windsor
Total Monies Awarded $482,000 $207,973 $189,358 $195,641 $78,804 Number of Students Receiving Monies/ Awards (UWO)1
129 120 72 76 60
(%) Receiving Monies//Number of Awards (UWO)1
14.8 18.0 14.9 15.6 11.2
Average Scholarship/ Award Amount2 $3,736 $1,733 $2,630 $2,574 $1,313
1 The number and % receiving monies are based on total enrolments, except for UWO where they refer to awards not students.
2 The average scholarships and awards amount is based on recipients except for UWO where it is based on awards.
The total amount of the scholarships and awards awarded to students varies
substantially from school to school. Individual scholarships and awards ranged from an
average of $1,313 to $3,736 per recipient, and the proportion of students receiving
scholarships and awards at each school ranged from 11.2 to 18 percent. Some law
schools preferred to spread their scholarship and award monies across more students—
resulting in lower individual scholarship and award amounts per recipient—whereas
other law schools chose to give larger amounts to fewer students.
At least one law school offers an ‘exit award’ for community commitment. This year
Queen’s University offered $3,000 to up to eight graduates who would not have the BAC
fee paid in the public interest organization in which they were to hold an articling
position.
Although the amount of money awarded to students in the form of scholarships and
prizes has increased over the past few years, the actual numbers of students receiving
them has not changed significantly.
5. Loans As previously noted in sections B1 and B2, for the 2003-04 academic year, first year tuition
at the five law schools ranged from $8,500 to $12,000 and the annual cost of attending law
school (including tuition) was likely to fall between $20,000 and $30,000. For many students
56
Chapter III –Costs of Attending Five Ontario Law Schools and Financial Supports
loans appear to be an important source of financial support in terms of bridging the gap
between monies received from paid work, bursaries and scholarships and the total cost of
law school. For the purposes of this discussion, the term loan refers to: personal loans from
family or friends, Canada-Ontario Integrated Student Loans and bank loans, lines of credit
and credit cards.
a. Personal Loans Most loans are negotiated with government or business entities and necessitate the
borrower’s acceptance of substantial interest rates and immutable repayment deadlines.
In contrast to government or commercial loans, some law students may be fortunate
enough to secure informal personal loans with family or friends. For those students with
personal loans, the vast majority were able to arrange them with their parents. Personal
loans are particularly attractive to students given that interest on personal loans is
typically low or non-existent and repayment is usually ‘when you can’. Despite the fact
that the conditions associated with personal loans are often relatively informal, there are
exceptions where the parties negotiate detailed interest and repayment plans. Table
3.14 indicates the proportion of student and graduate respondents who reported on the
survey that they had obtained personal loans.
Table 3.14: Personal Loans at Entry to Law School (% Students by
Year & Graduates)
Type of Debt Year 1 Year 2 Year 3 Graduates Personal Loans 8.5 8.4* 6.7* 6.0
*The current level of personal loans are as follows: 12.0% of the Year 2 students and 13.9% of Year 3 students hold personal loans.
Between 7 and 8 percent of students had personal loans at entry to law school. Perhaps
surprisingly, over half of this group reported owing more than $10,000 in personal loans
when they entered the program (see Table B-18 in Appendix B). Approximately 13
percent of Year 2 and 3 students reported having personal loans and more than half of
them indicated that they had over $10,000 in personal loan debt (see Table B-19 in
Appendix B).
57
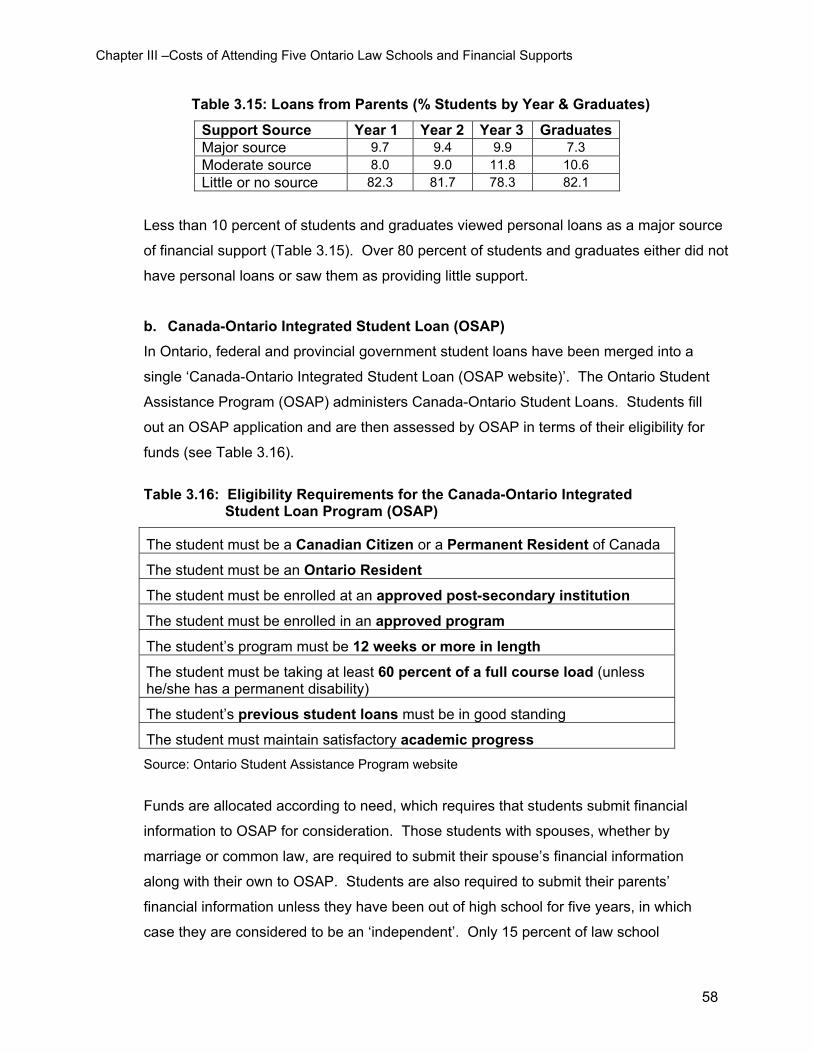
Chapter III –Costs of Attending Five Ontario Law Schools and Financial Supports
Table 3.15: Loans from Parents (% Students by Year & Graduates)
Support Source Year 1 Year 2 Year 3 Graduates Major source 9.7 9.4 9.9 7.3 Moderate source 8.0 9.0 11.8 10.6 Little or no source 82.3 81.7 78.3 82.1
Less than 10 percent of students and graduates viewed personal loans as a major source
of financial support (Table 3.15). Over 80 percent of students and graduates either did not
have personal loans or saw them as providing little support.
b. Canada-Ontario Integrated Student Loan (OSAP) In Ontario, federal and provincial government student loans have been merged into a
single ‘Canada-Ontario Integrated Student Loan (OSAP website)’. The Ontario Student
Assistance Program (OSAP) administers Canada-Ontario Student Loans. Students fill
out an OSAP application and are then assessed by OSAP in terms of their eligibility for
funds (see Table 3.16).
Table 3.16: Eligibility Requirements for the Canada-Ontario Integrated
Student Loan Program (OSAP)
The student must be a Canadian Citizen or a Permanent Resident of Canada
The student must be an Ontario Resident
The student must be enrolled at an approved post-secondary institution
The student must be enrolled in an approved program
The student’s program must be 12 weeks or more in length
The student must be taking at least 60 percent of a full course load (unless he/she has a permanent disability)
The student’s previous student loans must be in good standing
The student must maintain satisfactory academic progress Source: Ontario Student Assistance Program website
Funds are allocated according to need, which requires that students submit financial
information to OSAP for consideration. Those students with spouses, whether by
marriage or common law, are required to submit their spouse’s financial information
along with their own to OSAP. Students are also required to submit their parents’
financial information unless they have been out of high school for five years, in which
case they are considered to be an ‘independent’. Only 15 percent of law school
58
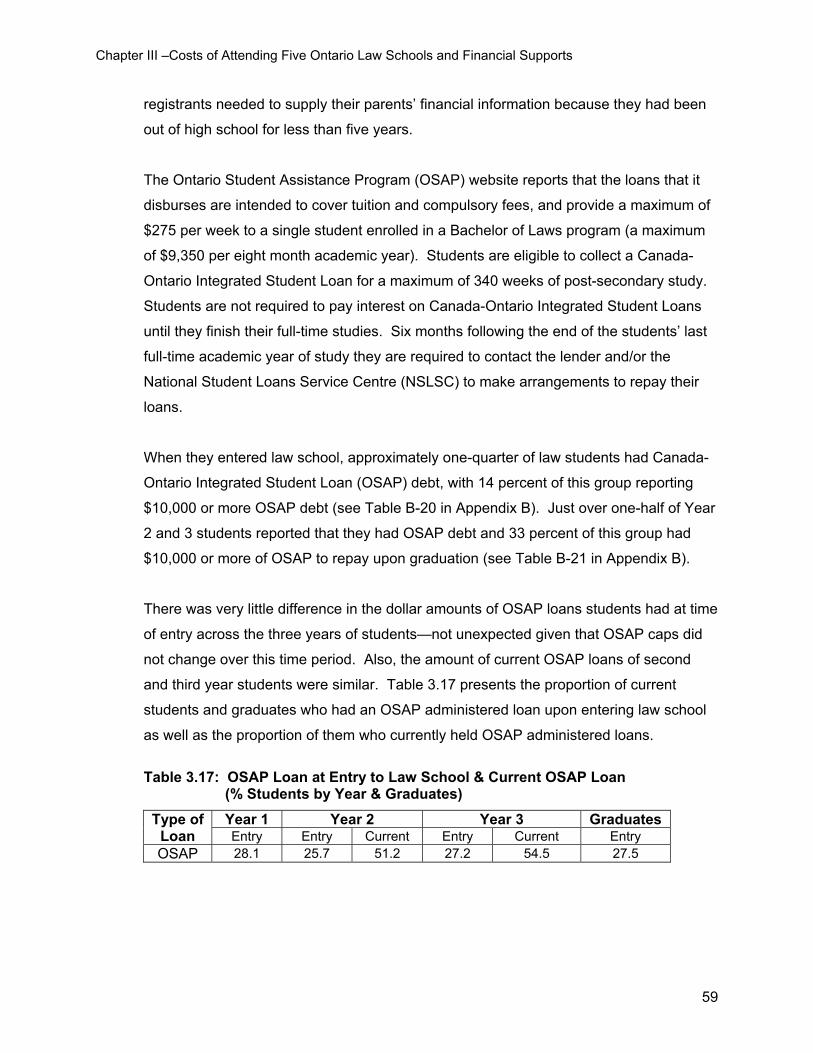
Chapter III –Costs of Attending Five Ontario Law Schools and Financial Supports
registrants needed to supply their parents’ financial information because they had been
out of high school for less than five years.
The Ontario Student Assistance Program (OSAP) website reports that the loans that it
disburses are intended to cover tuition and compulsory fees, and provide a maximum of
$275 per week to a single student enrolled in a Bachelor of Laws program (a maximum
of $9,350 per eight month academic year). Students are eligible to collect a Canada-
Ontario Integrated Student Loan for a maximum of 340 weeks of post-secondary study.
Students are not required to pay interest on Canada-Ontario Integrated Student Loans
until they finish their full-time studies. Six months following the end of the students’ last
full-time academic year of study they are required to contact the lender and/or the
National Student Loans Service Centre (NSLSC) to make arrangements to repay their
loans.
When they entered law school, approximately one-quarter of law students had Canada-
Ontario Integrated Student Loan (OSAP) debt, with 14 percent of this group reporting
$10,000 or more OSAP debt (see Table B-20 in Appendix B). Just over one-half of Year
2 and 3 students reported that they had OSAP debt and 33 percent of this group had
$10,000 or more of OSAP to repay upon graduation (see Table B-21 in Appendix B).
There was very little difference in the dollar amounts of OSAP loans students had at time
of entry across the three years of students—not unexpected given that OSAP caps did
not change over this time period. Also, the amount of current OSAP loans of second
and third year students were similar. Table 3.17 presents the proportion of current
students and graduates who had an OSAP administered loan upon entering law school
as well as the proportion of them who currently held OSAP administered loans.
Table 3.17: OSAP Loan at Entry to Law School & Current OSAP Loan
(% Students by Year & Graduates)
Year 1 Year 2 Year 3 Graduates Type of Loan Entry Entry Current Entry Current Entry OSAP 28.1 25.7 51.2 27.2 54.5 27.5
59
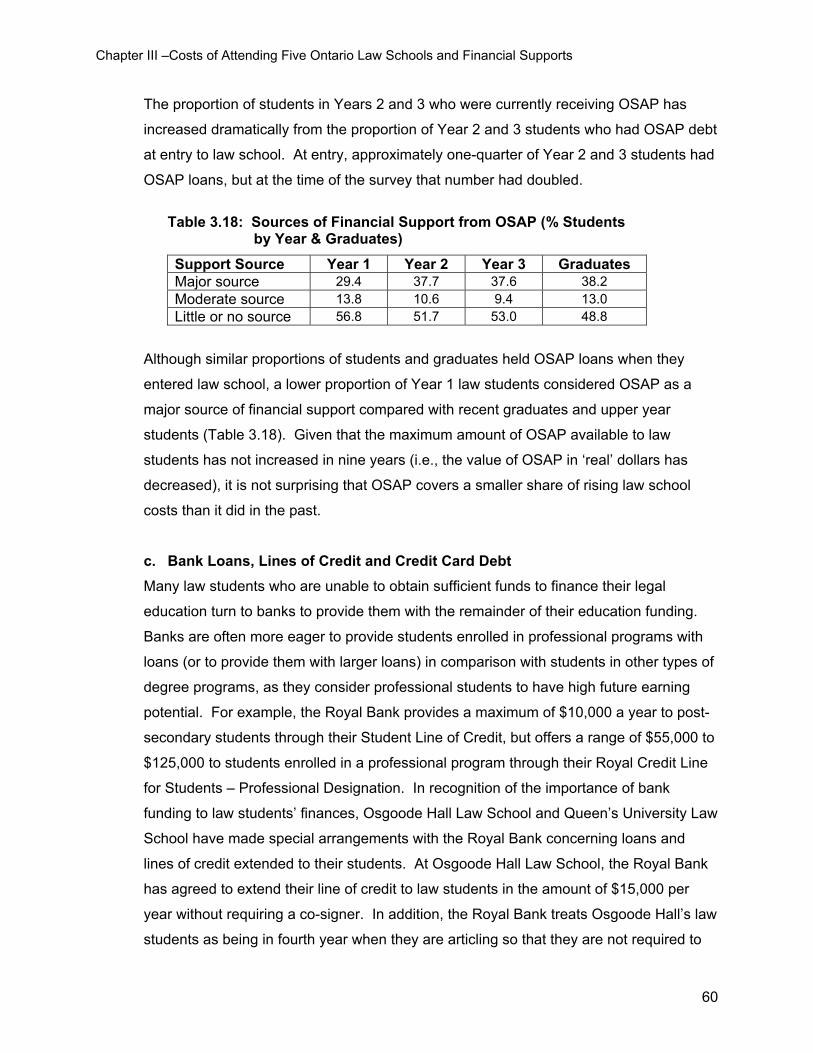
Chapter III –Costs of Attending Five Ontario Law Schools and Financial Supports
The proportion of students in Years 2 and 3 who were currently receiving OSAP has
increased dramatically from the proportion of Year 2 and 3 students who had OSAP debt
at entry to law school. At entry, approximately one-quarter of Year 2 and 3 students had
OSAP loans, but at the time of the survey that number had doubled.
Table 3.18: Sources of Financial Support from OSAP (% Students
by Year & Graduates)
Support Source Year 1 Year 2 Year 3 Graduates Major source 29.4 37.7 37.6 38.2 Moderate source 13.8 10.6 9.4 13.0 Little or no source 56.8 51.7 53.0 48.8
Although similar proportions of students and graduates held OSAP loans when they
entered law school, a lower proportion of Year 1 law students considered OSAP as a
major source of financial support compared with recent graduates and upper year
students (Table 3.18). Given that the maximum amount of OSAP available to law
students has not increased in nine years (i.e., the value of OSAP in ‘real’ dollars has
decreased), it is not surprising that OSAP covers a smaller share of rising law school
costs than it did in the past.
c. Bank Loans, Lines of Credit and Credit Card Debt Many law students who are unable to obtain sufficient funds to finance their legal
education turn to banks to provide them with the remainder of their education funding.
Banks are often more eager to provide students enrolled in professional programs with
loans (or to provide them with larger loans) in comparison with students in other types of
degree programs, as they consider professional students to have high future earning
potential. For example, the Royal Bank provides a maximum of $10,000 a year to post-
secondary students through their Student Line of Credit, but offers a range of $55,000 to
$125,000 to students enrolled in a professional program through their Royal Credit Line
for Students – Professional Designation. In recognition of the importance of bank
funding to law students’ finances, Osgoode Hall Law School and Queen’s University Law
School have made special arrangements with the Royal Bank concerning loans and
lines of credit extended to their students. At Osgoode Hall Law School, the Royal Bank
has agreed to extend their line of credit to law students in the amount of $15,000 per
year without requiring a co-signer. In addition, the Royal Bank treats Osgoode Hall’s law
students as being in fourth year when they are articling so that they are not required to
60
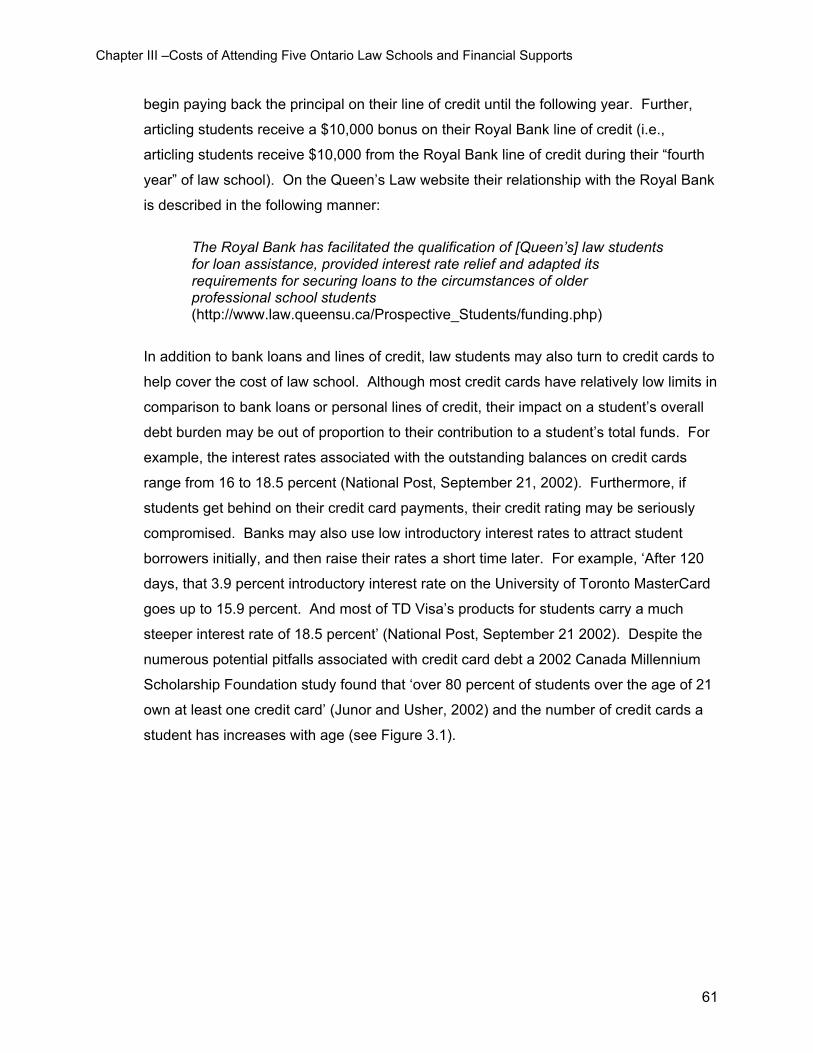
Chapter III –Costs of Attending Five Ontario Law Schools and Financial Supports
begin paying back the principal on their line of credit until the following year. Further,
articling students receive a $10,000 bonus on their Royal Bank line of credit (i.e.,
articling students receive $10,000 from the Royal Bank line of credit during their “fourth
year” of law school). On the Queen’s Law website their relationship with the Royal Bank
is described in the following manner:
The Royal Bank has facilitated the qualification of [Queen’s] law students for loan assistance, provided interest rate relief and adapted its requirements for securing loans to the circumstances of older professional school students (http://www.law.queensu.ca/Prospective_Students/funding.php)
In addition to bank loans and lines of credit, law students may also turn to credit cards to
help cover the cost of law school. Although most credit cards have relatively low limits in
comparison to bank loans or personal lines of credit, their impact on a student’s overall
debt burden may be out of proportion to their contribution to a student’s total funds. For
example, the interest rates associated with the outstanding balances on credit cards
range from 16 to 18.5 percent (National Post, September 21, 2002). Furthermore, if
students get behind on their credit card payments, their credit rating may be seriously
compromised. Banks may also use low introductory interest rates to attract student
borrowers initially, and then raise their rates a short time later. For example, ‘After 120
days, that 3.9 percent introductory interest rate on the University of Toronto MasterCard
goes up to 15.9 percent. And most of TD Visa’s products for students carry a much
steeper interest rate of 18.5 percent’ (National Post, September 21 2002). Despite the
numerous potential pitfalls associated with credit card debt a 2002 Canada Millennium
Scholarship Foundation study found that ‘over 80 percent of students over the age of 21
own at least one credit card’ (Junor and Usher, 2002) and the number of credit cards a
student has increases with age (see Figure 3.1).
61
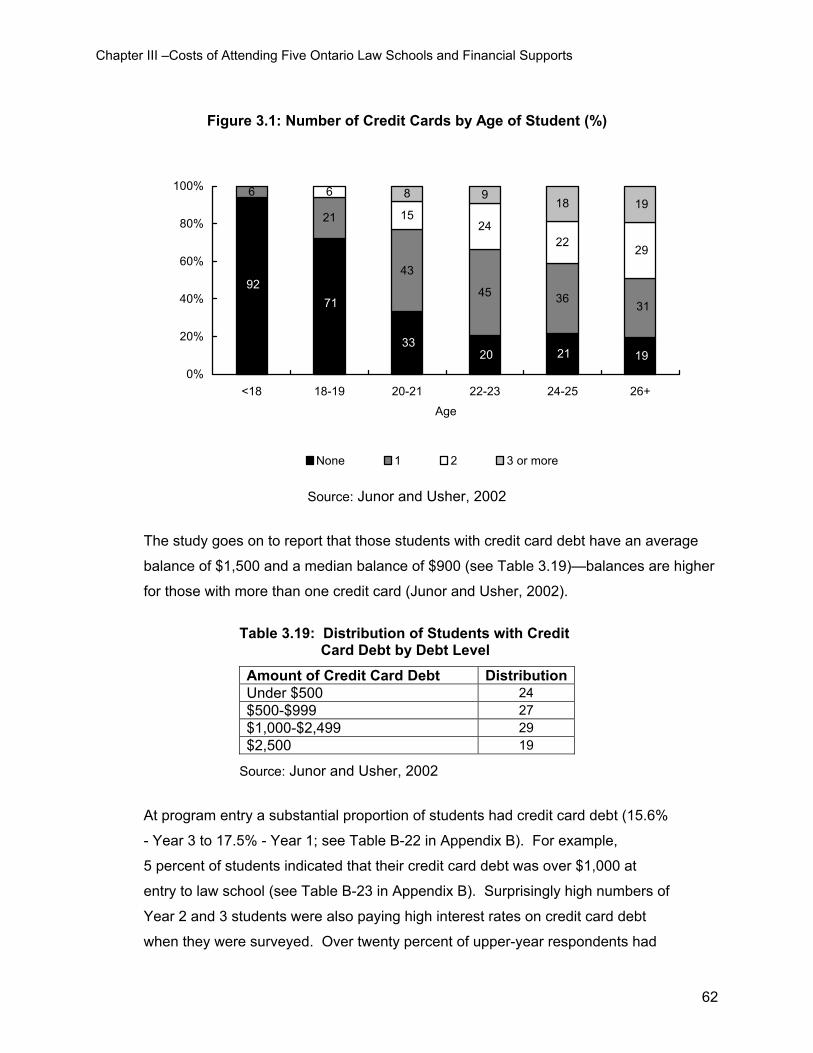
Chapter III –Costs of Attending Five Ontario Law Schools and Financial Supports
Figure 3.1: Number of Credit Cards by Age of Student (%)
6
21
43
45 36
6
1524
22
8 918
9271
3320 21 19
31
29
19
0%
20%
40%
60%
80%
100%
<18 18-19 20-21 22-23 24-25 26+
Age
None 1 2 3 or more
Source: Junor and Usher, 2002
The study goes on to report that those students with credit card debt have an average
balance of $1,500 and a median balance of $900 (see Table 3.19)—balances are higher
for those with more than one credit card (Junor and Usher, 2002).
Table 3.19: Distribution of Students with Credit
Card Debt by Debt Level
Amount of Credit Card Debt DistributionUnder $500 24 $500-$999 27 $1,000-$2,499 29 $2,500 19
Source: Junor and Usher, 2002
At program entry a substantial proportion of students had credit card debt (15.6%
- Year 3 to 17.5% - Year 1; see Table B-22 in Appendix B). For example,
5 percent of students indicated that their credit card debt was over $1,000 at
entry to law school (see Table B-23 in Appendix B). Surprisingly high numbers of
Year 2 and 3 students were also paying high interest rates on credit card debt
when they were surveyed. Over twenty percent of upper-year respondents had
62
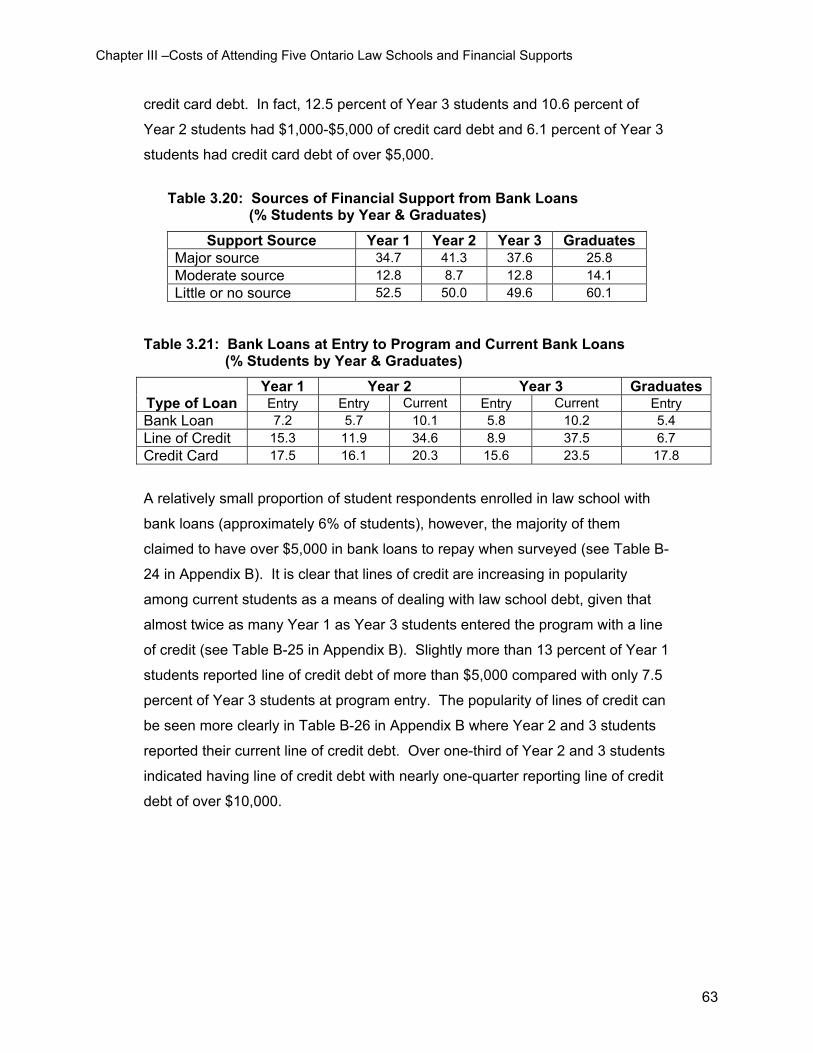
Chapter III –Costs of Attending Five Ontario Law Schools and Financial Supports
credit card debt. In fact, 12.5 percent of Year 3 students and 10.6 percent of
Year 2 students had $1,000-$5,000 of credit card debt and 6.1 percent of Year 3
students had credit card debt of over $5,000.
Table 3.20: Sources of Financial Support from Bank Loans
(% Students by Year & Graduates)
Support Source Year 1 Year 2 Year 3 Graduates Major source 34.7 41.3 37.6 25.8 Moderate source 12.8 8.7 12.8 14.1 Little or no source 52.5 50.0 49.6 60.1
Table 3.21: Bank Loans at Entry to Program and Current Bank Loans (% Students by Year & Graduates)
Year 1 Year 2 Year 3 Graduates Type of Loan Entry Entry Current Entry Current Entry Bank Loan 7.2 5.7 10.1 5.8 10.2 5.4 Line of Credit 15.3 11.9 34.6 8.9 37.5 6.7 Credit Card 17.5 16.1 20.3 15.6 23.5 17.8
A relatively small proportion of student respondents enrolled in law school with
bank loans (approximately 6% of students), however, the majority of them
claimed to have over $5,000 in bank loans to repay when surveyed (see Table B-
24 in Appendix B). It is clear that lines of credit are increasing in popularity
among current students as a means of dealing with law school debt, given that
almost twice as many Year 1 as Year 3 students entered the program with a line
of credit (see Table B-25 in Appendix B). Slightly more than 13 percent of Year 1
students reported line of credit debt of more than $5,000 compared with only 7.5
percent of Year 3 students at program entry. The popularity of lines of credit can
be seen more clearly in Table B-26 in Appendix B where Year 2 and 3 students
reported their current line of credit debt. Over one-third of Year 2 and 3 students
indicated having line of credit debt with nearly one-quarter reporting line of credit
debt of over $10,000.
63
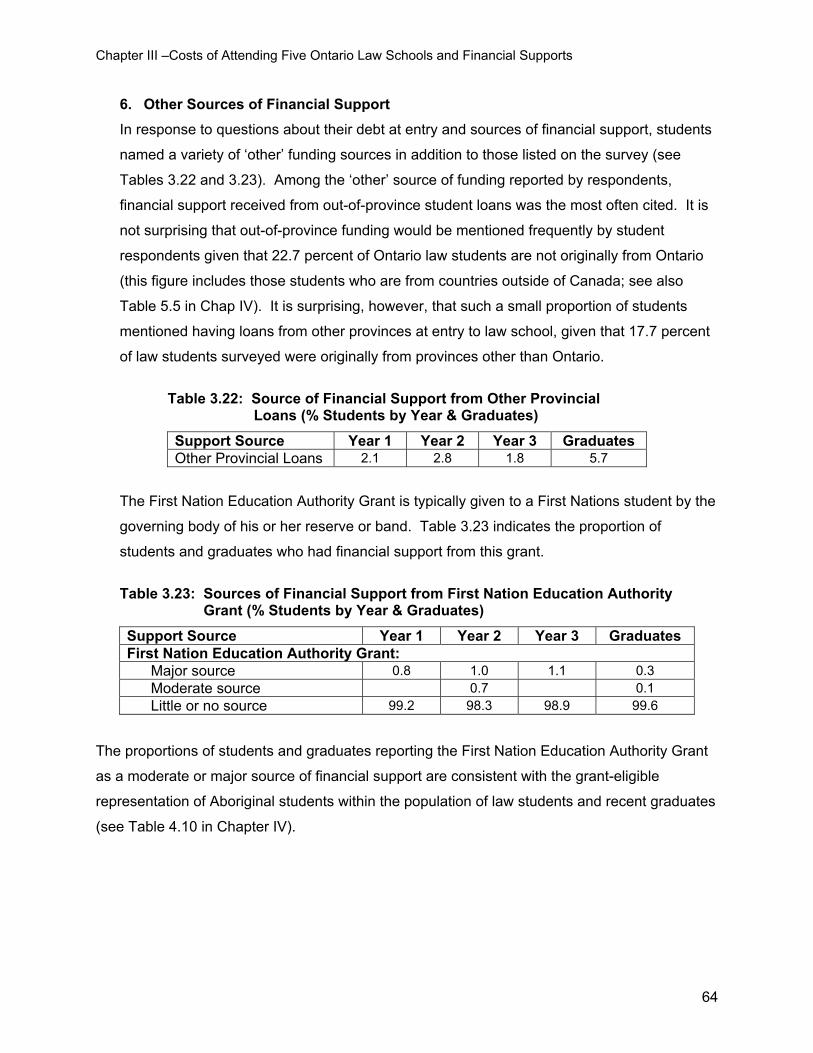
Chapter III –Costs of Attending Five Ontario Law Schools and Financial Supports
6. Other Sources of Financial Support In response to questions about their debt at entry and sources of financial support, students
named a variety of ‘other’ funding sources in addition to those listed on the survey (see
Tables 3.22 and 3.23). Among the ‘other’ source of funding reported by respondents,
financial support received from out-of-province student loans was the most often cited. It is
not surprising that out-of-province funding would be mentioned frequently by student
respondents given that 22.7 percent of Ontario law students are not originally from Ontario
(this figure includes those students who are from countries outside of Canada; see also
Table 5.5 in Chap IV). It is surprising, however, that such a small proportion of students
mentioned having loans from other provinces at entry to law school, given that 17.7 percent
of law students surveyed were originally from provinces other than Ontario.
Table 3.22: Source of Financial Support from Other Provincial
Loans (% Students by Year & Graduates)
Support Source Year 1 Year 2 Year 3 Graduates Other Provincial Loans 2.1 2.8 1.8 5.7
The First Nation Education Authority Grant is typically given to a First Nations student by the
governing body of his or her reserve or band. Table 3.23 indicates the proportion of
students and graduates who had financial support from this grant.
Table 3.23: Sources of Financial Support from First Nation Education Authority
Grant (% Students by Year & Graduates)
Support Source Year 1 Year 2 Year 3 Graduates First Nation Education Authority Grant: Major source 0.8 1.0 1.1 0.3 Moderate source 0.7 0.1 Little or no source 99.2 98.3 98.9 99.6
The proportions of students and graduates reporting the First Nation Education Authority Grant
as a moderate or major source of financial support are consistent with the grant-eligible
representation of Aboriginal students within the population of law students and recent graduates
(see Table 4.10 in Chapter IV).
64
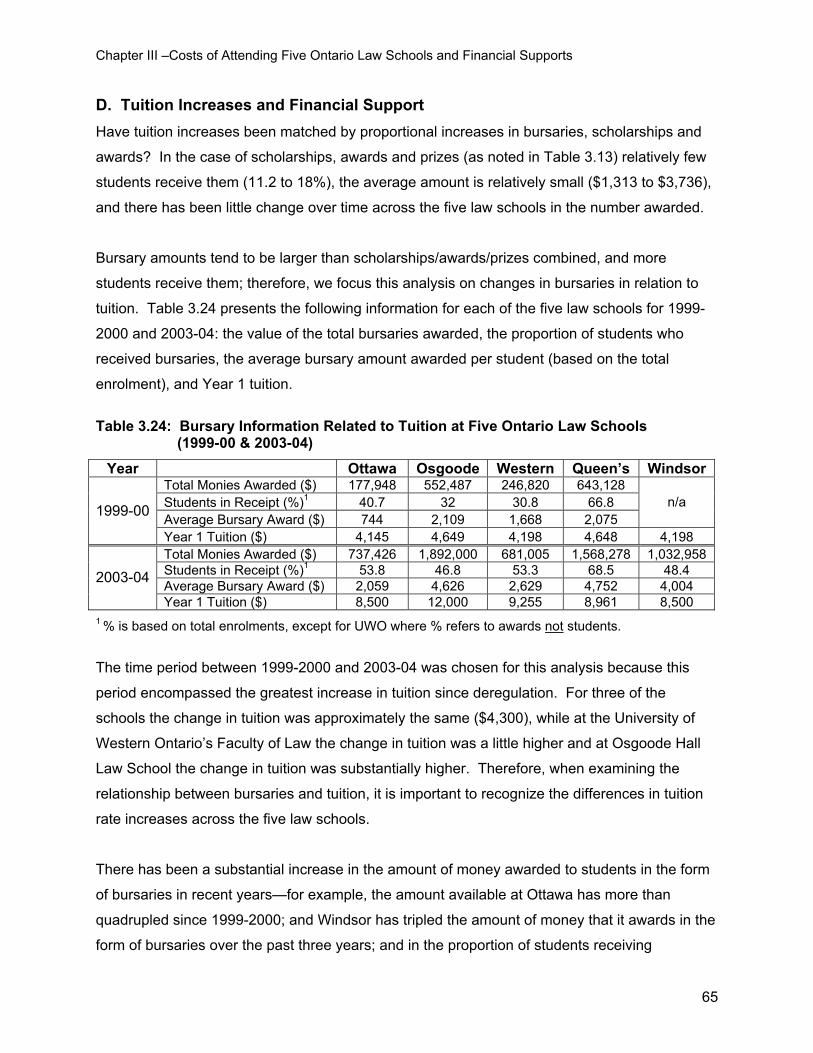
Chapter III –Costs of Attending Five Ontario Law Schools and Financial Supports
D. Tuition Increases and Financial Support Have tuition increases been matched by proportional increases in bursaries, scholarships and
awards? In the case of scholarships, awards and prizes (as noted in Table 3.13) relatively few
students receive them (11.2 to 18%), the average amount is relatively small ($1,313 to $3,736),
and there has been little change over time across the five law schools in the number awarded.
Bursary amounts tend to be larger than scholarships/awards/prizes combined, and more
students receive them; therefore, we focus this analysis on changes in bursaries in relation to
tuition. Table 3.24 presents the following information for each of the five law schools for 1999-
2000 and 2003-04: the value of the total bursaries awarded, the proportion of students who
received bursaries, the average bursary amount awarded per student (based on the total
enrolment), and Year 1 tuition.
Table 3.24: Bursary Information Related to Tuition at Five Ontario Law Schools (1999-00 & 2003-04)
Year Ottawa Osgoode Western Queen’s Windsor Total Monies Awarded ($) 177,948 552,487 246,820 643,128 Students in Receipt (%)1 40.7 32 30.8 66.8 Average Bursary Award ($) 744 2,109 1,668 2,075
n/a 1999-00
Year 1 Tuition ($) 4,145 4,649 4,198 4,648 4,198 Total Monies Awarded ($) 737,426 1,892,000 681,005 1,568,278 1,032,958 Students in Receipt (%)1 53.8 46.8 53.3 68.5 48.4 Average Bursary Award ($) 2,059 4,626 2,629 4,752 4,004 2003-04
Year 1 Tuition ($) 8,500 12,000 9,255 8,961 8,500 1 % is based on total enrolments, except for UWO where % refers to awards not students.
The time period between 1999-2000 and 2003-04 was chosen for this analysis because this
period encompassed the greatest increase in tuition since deregulation. For three of the
schools the change in tuition was approximately the same ($4,300), while at the University of
Western Ontario’s Faculty of Law the change in tuition was a little higher and at Osgoode Hall
Law School the change in tuition was substantially higher. Therefore, when examining the
relationship between bursaries and tuition, it is important to recognize the differences in tuition
rate increases across the five law schools.
There has been a substantial increase in the amount of money awarded to students in the form
of bursaries in recent years—for example, the amount available at Ottawa has more than
quadrupled since 1999-2000; and Windsor has tripled the amount of money that it awards in the
form of bursaries over the past three years; and in the proportion of students receiving
65
Chapter III –Costs of Attending Five Ontario Law Schools and Financial Supports
bursaries. However, there is substantial variation in the amount of money allocated to bursary
awards from law school to law school, and there is also substantial variation in the amounts
awarded per student. Queen’s has consistently chosen to spread its bursary monies across a
wide range of students—almost three-quarters of Queen’s’ students received bursaries. At the
other four law schools closer to one-half of students received bursaries. At Osgoode Hall Law
School, fewer students were awarded bursaries, but individual bursary amounts were higher. At
law schools in the lower range of tuition increases, students receiving the highest bursary
allocations received enough, or nearly enough, money to cover their tuition. For example, at
Queen’s in 2003-04, 22.2 percent of students received $7,000 or more and 5.6 percent received
$8,961 (source: Queen’s University, Faculty of Law September 20/04 memo to Faculty Board).
At Osgoode Hall, in 2003-04 the highest-level bursary group included about one-quarter of all
students. For Year 1 students, this meant that they received $8,000 or two-thirds of tuition
(source: Osgoode Hall financial information compiled for this study).
It is clear that there has been a major effort to increase the amount of money available to
students in financial need in the form of bursaries over the past five years, nevertheless, tuition
increases have added substantially to the real cost of law school for the majority of students
(i.e., those students receiving little or no bursary money). However, for those students receiving
above average bursary awards, these monies go a long way towards defraying the increased
cost of tuition.
E. Student and Graduate Views on Financial Assistance
1. Introduction On the survey, both students and graduates were asked how satisfied they were with the
various financial assistance programs available to them. In addition to rating financial
assistance programs on a four-point satisfaction scale, respondents were also given the
opportunity to comment on these programs and make recommendations that they felt would
improve financial assistance for law students. The majority of students took the opportunity
to comment on funding issues. We content analyzed their open-ended responses, identified
the most common themes, and selected sample quotes to illustrate the themes. The
themes derived from the content analysis are used to expand on questionnaire responses.
Financial aid for special needs groups are discussed and illustrated with comments that
address the theme.
66
Chapter III –Costs of Attending Five Ontario Law Schools and Financial Supports
2. General Themes The general themes most mentioned by students and graduates and described below were
(a) the timing of financial assistance application approvals, (b) communication of financial
assistance information, (c) conditions with respect to the eligibility for awards and
perceptions of fairness of those conditions, and (d) the perceived impact of tuition increases.
a. Timing of the Notification of Financial Assistance
The expectation of incoming students is that they would be notified as early as possible
that their applications for financial assistance will have been accepted and they would be
notified imminently of the amount of loan and/or bursary money they would receive. A
common theme of respondent dissatisfaction with their law school’s financial aid
programs was related to the timing of both bursaries and OSAP loans. Many students
felt that it was difficult to develop effective budgets for themselves when they learned
about funding so late in the school year.
…No indication of how much OSAP/other loans/bursaries will provide until after acceptance/admittance, therefore impossible to budget and too late to change mind. (Year 3, Female)
Decisions [about financial aid] should be made earlier in academic year – now decisions are not made until the end of first term, which makes budgeting difficult. (Year 3, Female)
… bursaries are allocated very late in term and are now held back till mid January -- causes enormous stress when rents are due and no income. Detracts from studies and forces one to consider dropping out. (Year 2, Female)
b. Communication of Information Available on Financial Assistance Information about financial assistance is found on each law school’s website and
in the law school calendars. As well, each law faculty has a designated person
who informs each applicant/candidate about the financial aid available, eligibility
and application procedures. Some students suggested ways to improve
communication about this information.
More consistent communication of the various loans available would be useful…. (Year 1, Male)
Make students more aware of bursaries, have more automatic bursaries…. (Year 3, Female)
67
Chapter III –Costs of Attending Five Ontario Law Schools and Financial Supports
Faculty bursaries are so difficult to access on the web and so time consuming. (Year 3, Female)
c. Conditions for Receiving Financial Aid/Fairness After the issue of insufficient OSAP funding (see 3a), the most frequent student
complaint with respect to financial assistance was related to the conditions governing
eligibility for aid. Although some students felt that too many resources were given to
merit-based awards, most of the dissatisfaction with the conditions relate to calculations
of an individual’s financial need. In the case of needs-based bursaries and government
assistance, students must submit financial documentation related to all of their income,
expenses and debt. Financial need is then calculated by subtracting all ‘expected
financial contributions’ (OSAP website) or ‘resources’ (Osgoode Hall website) from the
student’s expenses. The greater the proportion of expenses as opposed to contributions
or resources, the greater a student’s calculated financial need. However, many students
feel that their contribution/resources were overstated due to the way in which their
assets and/or income are classified by certain organizations. For example, if a student
owns a car, OSAP automatically imputes a value of $6,000 to the student’s car
(regardless of trade-in or resale value).
Further, some students feel that credit card debt should not be considered as income for
the purpose of calculating financial need for government assistance. On the other hand,
many students also feel that they are disadvantaged because they had demonstrated
the ability to responsibly manage their finances. For example, students who worked
during their undergraduate academic career in order to avoid taking out student loans,
will have a lower calculated financial need than a student who took out a large number of
undergraduate student loans and did not work. Similarly for students who take a year off
in order to offset program costs.
For students who had gone to great effort to minimize their overall law school debt by
working during the school year, the summer and/or prior to entering the program, their
perception of the unfairness of the OSAP qualifications with regard to income was
stressed in comments submitted.
68
Chapter III –Costs of Attending Five Ontario Law Schools and Financial Supports
Do not penalize people for earning income in the summer by reducing eligible OSAP and bursaries because this favours those who take summers off for no reason. I worked hard all summer and made enough tuition money but then it didn’t matter because I lost half my OSAP funding; eligibility for bursaries and lost my millennium bursary so I ended up more worse off than if I hadn’t worked…. (Year 3, Female)
Students who don’t qualify for OSAP because they made too much income during the summer do not necessarily have enough to get them through the school year. Yet qualifying for government loans is the [basic] requirement to access the majority of ALL other financial assistance at the university. This is a MAJOR problem. (Year 3, Female)
Some students strongly objected to their parents’ income being used to screen them
from receiving funding when they did not rely on their parents for financial support.
OSAP’s heavy emphasis on how much your parent’s make puts students whose parents do not contribute at a severe disadvantage, and it’s very hard to get out of this requirement…. (Year 2, Female)
A relatively small number of respondents commented on what they perceived to be the
lack of fairness evidenced in award disbursement. For example, some students
mentioned that they had not received bursaries while students with less financial need
had received funds. I did not receive enough to pay for school from OSAP. Must borrow from parents, plus I did not receive a bursary which is unfair because people got [money] who don’t really need it and … they use the money for cars. This is very frustrating. (Year 2, Male)
…I am completely drowning in the debt associated with law school and I find that those who are not in financial need are getting financial assistance. (Year 2, Female)
Bursary applications should be looked into in more depth because some receive them who do not have as much financial need as others. [Need] more …[scholarships] based on financial need rather than marks because the same people keep winning them and they usually don’t experience the same financial need as others. (Year 3, Female)
69
Chapter III –Costs of Attending Five Ontario Law Schools and Financial Supports
d. Impact of Tuition Increases Respondents were not specifically asked about their views on law school tuition rates or
the increase in tuition over the past few years. However, some individuals chose to
comment on the impact of tuition increases as part of their response to the open-ended
question asking for comments or suggestions following the question about satisfaction
with the available financial assistance programs.
…Bottom line: tuition needs to be reduced. Universities can’t control the cost of living … they must be responsible and keep tuition low…. (Year 3, Female)
If law school tuition keeps increasing, either the whole system has to be re-developed in order to cover the cost of tuition or articling jobs have to pay more…. (Year 3, Female)
Il est d’une grande importance de garder les frais de scolarité raisonnables, afin que les étudiants ne commencent pas leur carrière complètement endettés. (Graduate 2000, Female)
3. Financial Assistance Sources
In this section, students and graduates views on specific sources of financial support are
analyzed. For each type of financial aid, a table with student responses to the satisfaction
question is presented. In general, graduate responses represent a period of time for the law
schools when tuition was lower and more consistent, whereas students responses are a
reaction to the increases in tuition that have taken place since deregulation came into effect.
It is important to note that respondents did not always feel the need to comment on each
financial assistance category and that, therefore, they responded ‘no opinion’; the number
who did so varies considerably from item to item. Generally speaking, graduates were more
likely to have no opinion than were current students, with some exceptions.
a. OSAP The topic of OSAP was discussed in Chapter III, Section C4b. An OSAP loan is intended
to cover tuition and compulsory fees, and provides a maximum of $9,350 for the eight
month academic year). Table 3.25 indicates the level of satisfaction that law students
and graduates have with OSAP.
70
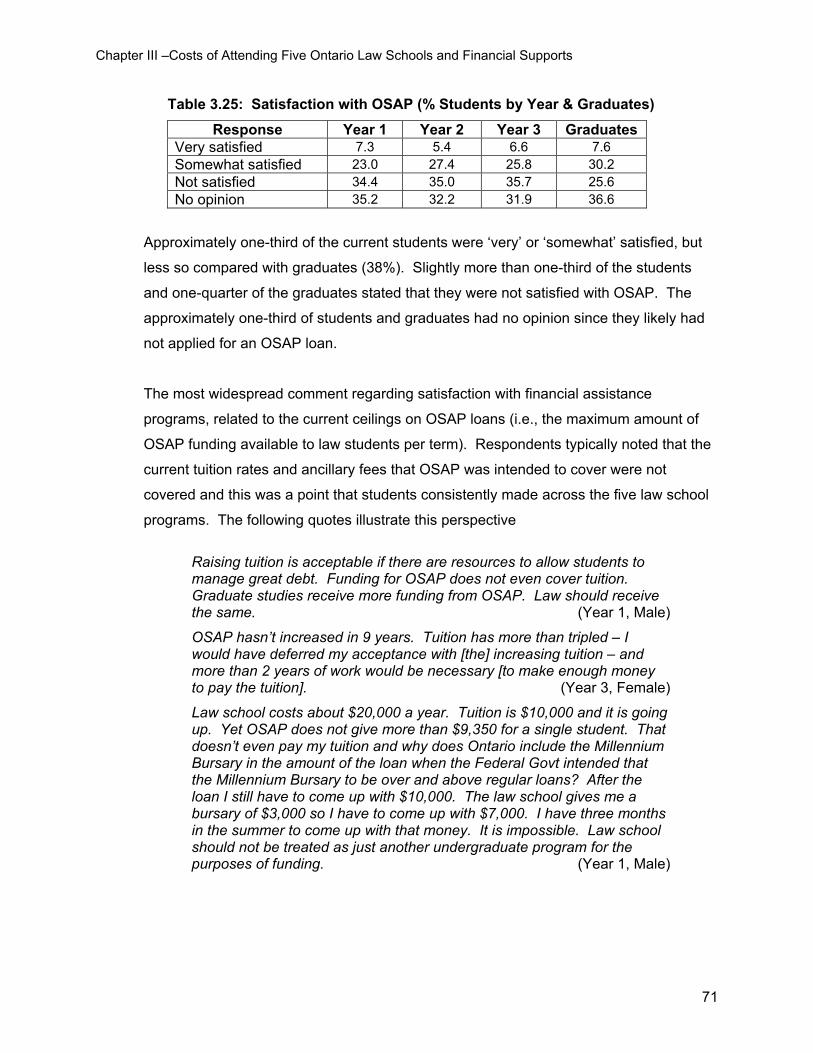
Chapter III –Costs of Attending Five Ontario Law Schools and Financial Supports
Table 3.25: Satisfaction with OSAP (% Students by Year & Graduates)
Response Year 1 Year 2 Year 3 Graduates Very satisfied 7.3 5.4 6.6 7.6 Somewhat satisfied 23.0 27.4 25.8 30.2 Not satisfied 34.4 35.0 35.7 25.6 No opinion 35.2 32.2 31.9 36.6
Approximately one-third of the current students were ‘very’ or ‘somewhat’ satisfied, but
less so compared with graduates (38%). Slightly more than one-third of the students
and one-quarter of the graduates stated that they were not satisfied with OSAP. The
approximately one-third of students and graduates had no opinion since they likely had
not applied for an OSAP loan.
The most widespread comment regarding satisfaction with financial assistance
programs, related to the current ceilings on OSAP loans (i.e., the maximum amount of
OSAP funding available to law students per term). Respondents typically noted that the
current tuition rates and ancillary fees that OSAP was intended to cover were not
covered and this was a point that students consistently made across the five law school
programs. The following quotes illustrate this perspective
Raising tuition is acceptable if there are resources to allow students to manage great debt. Funding for OSAP does not even cover tuition. Graduate studies receive more funding from OSAP. Law should receive the same. (Year 1, Male)
OSAP hasn’t increased in 9 years. Tuition has more than tripled – I would have deferred my acceptance with [the] increasing tuition – and more than 2 years of work would be necessary [to make enough money to pay the tuition]. (Year 3, Female)
Law school costs about $20,000 a year. Tuition is $10,000 and it is going up. Yet OSAP does not give more than $9,350 for a single student. That doesn’t even pay my tuition and why does Ontario include the Millennium Bursary in the amount of the loan when the Federal Govt intended that the Millennium Bursary to be over and above regular loans? After the loan I still have to come up with $10,000. The law school gives me a bursary of $3,000 so I have to come up with $7,000. I have three months in the summer to come up with that money. It is impossible. Law school should not be treated as just another undergraduate program for the purposes of funding. (Year 1, Male)
71
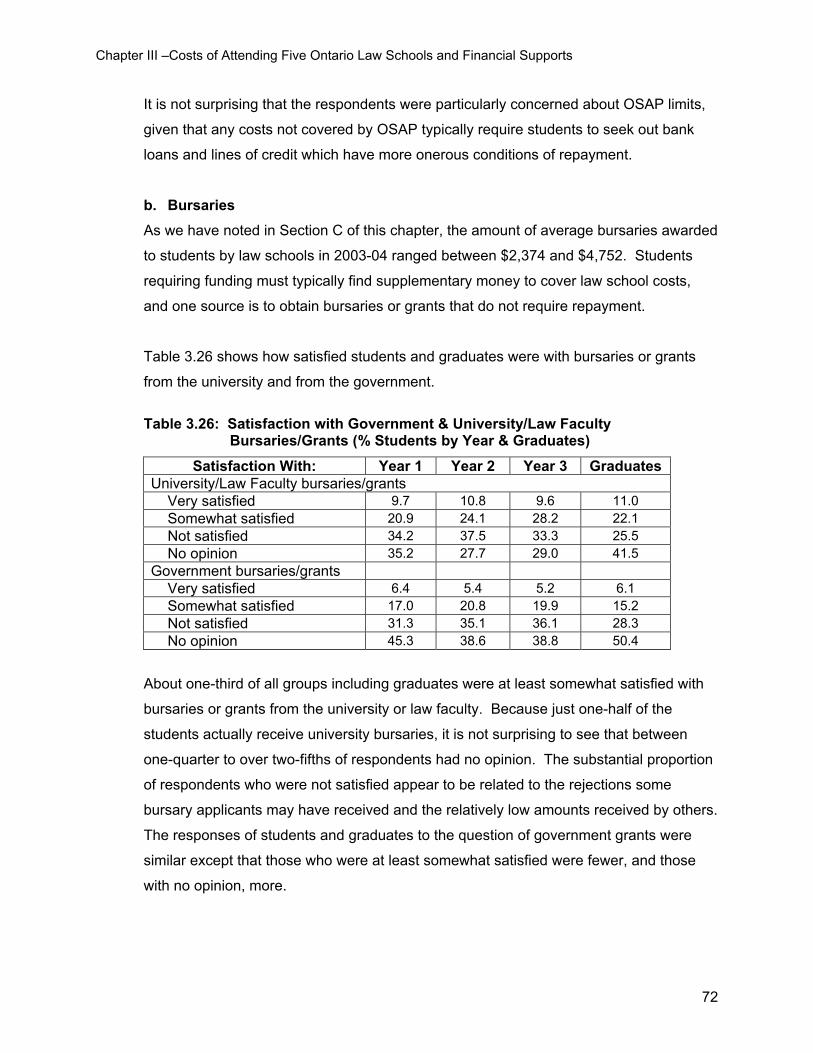
Chapter III –Costs of Attending Five Ontario Law Schools and Financial Supports
It is not surprising that the respondents were particularly concerned about OSAP limits,
given that any costs not covered by OSAP typically require students to seek out bank
loans and lines of credit which have more onerous conditions of repayment.
b. Bursaries As we have noted in Section C of this chapter, the amount of average bursaries awarded
to students by law schools in 2003-04 ranged between $2,374 and $4,752. Students
requiring funding must typically find supplementary money to cover law school costs,
and one source is to obtain bursaries or grants that do not require repayment.
Table 3.26 shows how satisfied students and graduates were with bursaries or grants
from the university and from the government.
Table 3.26: Satisfaction with Government & University/Law Faculty
Bursaries/Grants (% Students by Year & Graduates)
Satisfaction With: Year 1 Year 2 Year 3 Graduates University/Law Faculty bursaries/grants Very satisfied 9.7 10.8 9.6 11.0 Somewhat satisfied 20.9 24.1 28.2 22.1 Not satisfied 34.2 37.5 33.3 25.5 No opinion 35.2 27.7 29.0 41.5 Government bursaries/grants Very satisfied 6.4 5.4 5.2 6.1 Somewhat satisfied 17.0 20.8 19.9 15.2 Not satisfied 31.3 35.1 36.1 28.3 No opinion 45.3 38.6 38.8 50.4
About one-third of all groups including graduates were at least somewhat satisfied with
bursaries or grants from the university or law faculty. Because just one-half of the
students actually receive university bursaries, it is not surprising to see that between
one-quarter to over two-fifths of respondents had no opinion. The substantial proportion
of respondents who were not satisfied appear to be related to the rejections some
bursary applicants may have received and the relatively low amounts received by others.
The responses of students and graduates to the question of government grants were
similar except that those who were at least somewhat satisfied were fewer, and those
with no opinion, more.
72
Chapter III –Costs of Attending Five Ontario Law Schools and Financial Supports
Some students offered comments about the criteria for awards and about the number of
bursaries available.
When considering bursaries to second and third year students it should be imperative that consideration be given to students who do not have articling or summer jobs and whose [Bar Admission Course fees] are not being paid by their employers (Year 3, Female)
There is a great need for more provision of funding for bursaries … less restrictions on bursaries. (Year 2, Female)
One student from a lower-income family made a case for a review of the needs
assessment of applications for university financial aid.
The criteria for scholarships and bursaries seriously need to be re-addressed. I almost was not able to return to law school in 2nd year. But my family did not want to see me drop out so they organized a collection on my behalf (these are people in factory positions, retail jobs, retired grandparents, etc), people who cannot really afford to help but… they did. (Year 3, Female)
c. Scholarships Table 3.27 presents the students and graduates’ responses to the satisfaction question
in relation to prizes and the different type of scholarships available—the law faculty
entrance, upper year and continuing scholarships, as well as the university (non-law
faculty) scholarships. Most of the scholarships across the five law faculties are not
based on demonstrated financial need; however two faculties award a large number of
scholarships based on need, as well as on academic achievement.
73
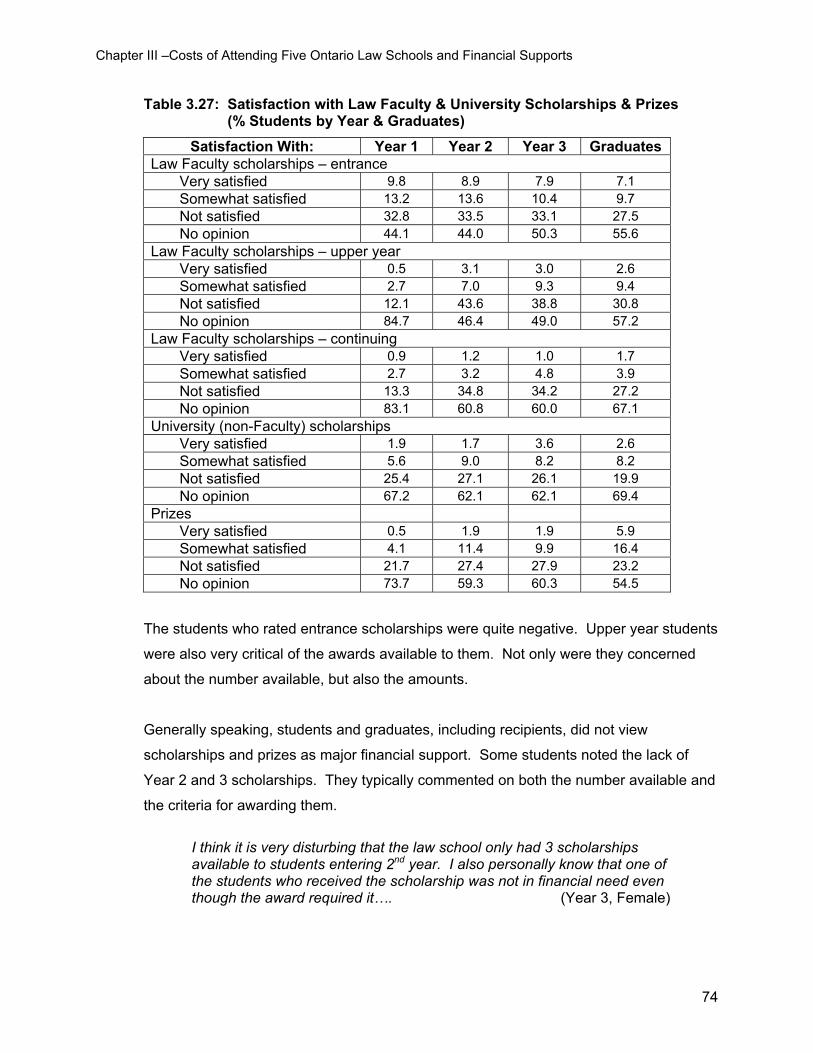
Chapter III –Costs of Attending Five Ontario Law Schools and Financial Supports
Table 3.27: Satisfaction with Law Faculty & University Scholarships & Prizes (% Students by Year & Graduates)
Satisfaction With: Year 1 Year 2 Year 3 Graduates Law Faculty scholarships – entrance Very satisfied 9.8 8.9 7.9 7.1 Somewhat satisfied 13.2 13.6 10.4 9.7 Not satisfied 32.8 33.5 33.1 27.5 No opinion 44.1 44.0 50.3 55.6 Law Faculty scholarships – upper year Very satisfied 0.5 3.1 3.0 2.6 Somewhat satisfied 2.7 7.0 9.3 9.4 Not satisfied 12.1 43.6 38.8 30.8 No opinion 84.7 46.4 49.0 57.2 Law Faculty scholarships – continuing Very satisfied 0.9 1.2 1.0 1.7 Somewhat satisfied 2.7 3.2 4.8 3.9 Not satisfied 13.3 34.8 34.2 27.2 No opinion 83.1 60.8 60.0 67.1 University (non-Faculty) scholarships Very satisfied 1.9 1.7 3.6 2.6 Somewhat satisfied 5.6 9.0 8.2 8.2 Not satisfied 25.4 27.1 26.1 19.9 No opinion 67.2 62.1 62.1 69.4 Prizes Very satisfied 0.5 1.9 1.9 5.9 Somewhat satisfied 4.1 11.4 9.9 16.4 Not satisfied 21.7 27.4 27.9 23.2 No opinion 73.7 59.3 60.3 54.5
The students who rated entrance scholarships were quite negative. Upper year students
were also very critical of the awards available to them. Not only were they concerned
about the number available, but also the amounts.
Generally speaking, students and graduates, including recipients, did not view
scholarships and prizes as major financial support. Some students noted the lack of
Year 2 and 3 scholarships. They typically commented on both the number available and
the criteria for awarding them.
I think it is very disturbing that the law school only had 3 scholarships available to students entering 2nd year. I also personally know that one of the students who received the scholarship was not in financial need even though the award required it…. (Year 3, Female)
74
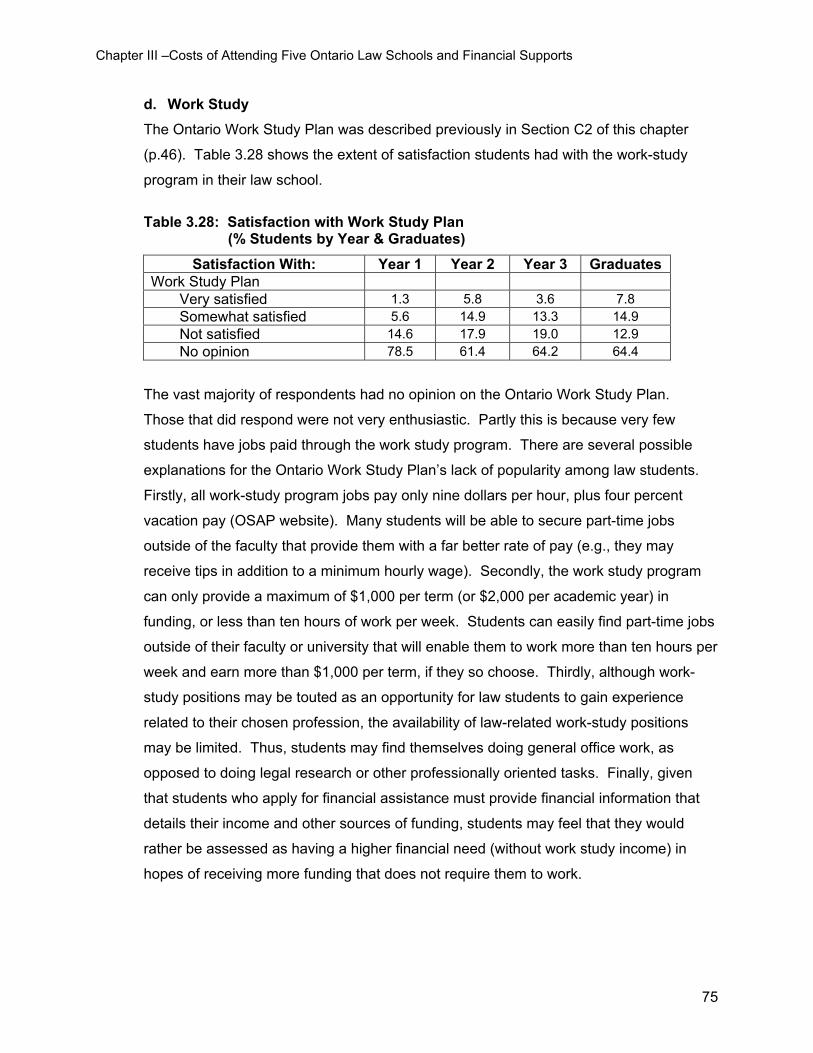
Chapter III –Costs of Attending Five Ontario Law Schools and Financial Supports
d. Work Study The Ontario Work Study Plan was described previously in Section C2 of this chapter
(p.46). Table 3.28 shows the extent of satisfaction students had with the work-study
program in their law school.
Table 3.28: Satisfaction with Work Study Plan
(% Students by Year & Graduates)
Satisfaction With: Year 1 Year 2 Year 3 Graduates Work Study Plan Very satisfied 1.3 5.8 3.6 7.8 Somewhat satisfied 5.6 14.9 13.3 14.9 Not satisfied 14.6 17.9 19.0 12.9 No opinion 78.5 61.4 64.2 64.4
The vast majority of respondents had no opinion on the Ontario Work Study Plan.
Those that did respond were not very enthusiastic. Partly this is because very few
students have jobs paid through the work study program. There are several possible
explanations for the Ontario Work Study Plan’s lack of popularity among law students.
Firstly, all work-study program jobs pay only nine dollars per hour, plus four percent
vacation pay (OSAP website). Many students will be able to secure part-time jobs
outside of the faculty that provide them with a far better rate of pay (e.g., they may
receive tips in addition to a minimum hourly wage). Secondly, the work study program
can only provide a maximum of $1,000 per term (or $2,000 per academic year) in
funding, or less than ten hours of work per week. Students can easily find part-time jobs
outside of their faculty or university that will enable them to work more than ten hours per
week and earn more than $1,000 per term, if they so choose. Thirdly, although work-
study positions may be touted as an opportunity for law students to gain experience
related to their chosen profession, the availability of law-related work-study positions
may be limited. Thus, students may find themselves doing general office work, as
opposed to doing legal research or other professionally oriented tasks. Finally, given
that students who apply for financial assistance must provide financial information that
details their income and other sources of funding, students may feel that they would
rather be assessed as having a higher financial need (without work study income) in
hopes of receiving more funding that does not require them to work.
75
Chapter III –Costs of Attending Five Ontario Law Schools and Financial Supports
It is unfortunate that individuals from medium income homes that do not qualify for OSAP are denied the opportunity to apply for work study. (Year 2, Male)
e. Line of Credit, Credit Cards Because of the high costs of attending law school and the need for many students to
obtain more funding than that received from OSAP and the university, as previously
explained, some students have to obtain a Line of Credit from their bank, as well as go
into debt through extensive use of their credit card. Some of those students decry having
to borrow in this manner as illustrated by these comments.
… I feel that relying on other loan sources, like credit cards and lines of credit has been necessary but will make repayment complex; I wish that the whole system could be combined and easier to manage for borrowers. (Year 3, Female)
I was not eligible for OSAP because I have a car in working condition and I have managed to save some money in RRSPs. That has put me at a disadvantage as I have had to take out a line of credit from a bank. (Year 1, Female)
4. Special Categories of Students
All five law schools provide funding for special categories of students. They include mature
students, students disadvantaged for reasons outlined in law schools’ policies, students
from ethnocultural groups1, and Aboriginal students. Also, joint degree programs where a
law degree is combined with another degree are offered at all of the five law schools; for
example, a University of Western Ontario student enrolled in the law program may also be
enrolled in the MBA program or a University of Windsor law student may also be enrolled in
the JD/LLB program at the University of Detroit Mercy in Michigan.
a. Mature Students and Students with Families About one-third of law school registrants have applied as mature students and this
proportion has remained quite constant since 1997. In the survey, 93.1 percent of
current students reported that they had no dependents. In the focus groups and in the
survey, mature students in financial need were critical about the disadvantages they felt
1 In the study we normally use the term ‘ethnocultural’ to refer to visible minorities (e.g., Arabs, East
Asians, and Blacks) According to the Statistics Canada Census Dictionary, “visible minorities [are] ‘persons, other than Aboriginal peoples, who are non-Caucasian in race or non-white in colour’ ”.
76
Chapter III –Costs of Attending Five Ontario Law Schools and Financial Supports
with regard to not being able to obtain financial assistance. The following comments
illustrate this view.
As a married student, OSAP has expected my husband to contribute to my education which he is unable to do. OSAP also believes my expenses have declined since I was married when in fact they have increased. For example, we have to get our own house insurance when before it was covered by my parents, we have life insurance, no benefits, etc. (Year 3, Female)
If access to justice is to be meaningful, schools and professors must comprehend and accommodate mature and working students. The philosophies still adhere to the traditional student who is approximately 22, who lives at home with parental support, both financial and emotional. This image needs to change to one of simply an adult. Many, if not the majority of students do not have parental financial support. An increasing number of students are parents themselves. Do not alienate those students who are non-traditional. (Year 3, Female)
Married students should not be excluded from financial aid. My husband’s income only pays our living expenses. My husband needs a car to work, we cannot sell our car to pay for tuition. Married students have other expenses that one never considered in OSAP or university bursaries. Allow married students to be eligible for these bursaries/loans and take into account all expenses. I should not be expected to sell my home/car, etc just to go to law school. (Year 2, Female)
b. Disadvantaged: Visible Minority Students There were many comments made on the surveys and in focus groups about the
negative implications of tuition increases for students who would meet the special
categories for admission in each law school. Those students who are members
of visible minorities, one of the categories of ‘disadvantaged’ specified in the
policies for diversity, as well as advocates for them, were particularly critical
about those implications, as can be seen in the following comments.
With the rising tuition costs, it will be very difficult for other black students like myself to have access to a legal education or to finish the legal education they have already commenced. I am one of five black law students in a class of 180 and I see the numbers going down in the future years because of the high expense incurred to go to law school and the few avenues available which provide financial assistance. (Year 3, Female)
. … [There needs to be] complete scholarships continuing throughout [the] whole program offered to a few, capable and interested students from Aboriginal community and other cultural ethnic groups under-represented in law school. (Year 2, Female)
77
Chapter III –Costs of Attending Five Ontario Law Schools and Financial Supports
My biggest issue with increasing tuition is that it serves as a new way to limit marginalized peoples access to legal education. (Year 3, Female)
c. Aboriginal Students Very few Aboriginal students attend law schools despite attempts to increase the
numbers of applications (see Chapter IV, Section C2). The term “Aboriginal”
refers to North American Indians (some are members of First Nations or Bands),
Inuit, and Métis. Statistics Canada’s 2001 Aboriginal Peoples Survey reports that
over 70 percent of the total Aboriginal identity population in Canada includes
people who do not live on reserves (O’Donnell and Tait, 2003).
Some First Nations members are fortunate to receive funding to attend law
school from their Band Councils. A few students spoke about the implications of
tuition increases for the Band Councils who provide that funding to potential LLB
candidates.
If tuition costs keep going up, First Nations people will not be able to pursue professional careers. As it is now, most Bands will not allow its members to apply to U of T due to high cost. Raising costs will inhibit First Nations People’s career choices. (Year 1, Female)
Despite Band Council funding for law students, additional funding is generally
required in order to cover all law school costs. Aboriginal students commented
on the limitations of OSAP as illustrated below.
First Nations funding is not enough to provide for students with children. OSAP should take that into account. I was also denied OSAP because I have a car. However, a car is a necessity when you have children and no family support in the city. (Year 3, Female)
78
Chapter III –Costs of Attending Five Ontario Law Schools and Financial Supports
F. Summary Since the deregulation of tuition for professional programs at the end of 1997, tuition fees at four
of the five law schools have more than doubled, and tuition at the other has more than tripled.
At the five law schools, tuition increases during this period have ranged from $5,318 to $8,782.
Estimated Year 1 costs for 2003-04 students (tuition, program-related costs and living
expenses) ranged from $20,000 at Queen’s and Western to $30,000 at Osgoode Hall—before
the cost of the Bar Admissions Course (BAC) is included. The cost of law school borne by a
particular student may vary widely depending on the level of parental support, articling salary
and the type of financial aid received by the student.
Over the past five years, there has been a dramatic increase in the total amount of bursary
money awarded to students in financial need at the five law schools. In 2003-04, the average
bursary amount granted per student at the five law schools ranged from $2,374 to $4,752 and
the percentage of students receiving bursaries ranged from 47 percent to 68.5 percent. For
most students receiving the maximum bursaries, these awards cover the cost of their tuition.
However, for over one-half of current students, tuition increases have added to the cost of their
legal education. One-fifth of current law students cited university/law school bursaries and
scholarships as a major source of financial support, and over two-fifths of current students
reported that they were at least a moderate source.
While the total monies allocated to scholarships/awards/prizes has increased in recent years,
the number of students receiving this type of funding has not changed substantially. Between
11.2 and 18 percent of students across the five law schools received scholarships, awards and
prizes in 2003-04 and the average scholarship/award/prize amount granted per student ranged
from $1,313 to $3,736.
Ontario law students are eligible to receive a maximum of $9,350 in government loans per
academic year. When surveyed, over one-half of Year 2 and 3 respondents held OSAP-
administered student loans. A greater proportion of students than graduates considered OSAP-
administered loans to be ‘little or no source of financial support’. This result is not surprising
given that the maximum amount of OSAP funding has not increased in nine years and has,
therefore, decreased in real terms as a proportion of law school costs. Although the provincial
government provides funding for part-time student employment through the Ontario Work Study
79
Chapter III –Costs of Attending Five Ontario Law Schools and Financial Supports
80
Plan administered by OSAP (to a maximum of $1,000 per term), very few students appear to
take advantage of this program.
There have been several important changes in the proportion of students relying primarily on
different forms of financial support to fund their legal education since deregulation. The
proportion of current students who rely on their own income/savings as a major source of
support is much lower than for graduates (28.5% compared with 43%). More graduates
undertook paid, part-time work during law school in order to defray their law school costs than
did current students. Finally, a greater proportion of current students depended on bank loans
and lines of credit as a major source of financial support than did graduates (37.8% compared
with 25.8%). Overall, students have begun to rely more on loans.
Student criticisms of the financial supports available to them focused on the following issues:
the inappropriateness of the OSAP ceilings and criteria, the lateness of financial awards in
terms of students’ budget decisions, the need for better communication concerning awards, the
appropriateness of decision making regarding the distribution of financial awards and the
effectiveness of the Ontario Work Study Plan. Special category students (i.e., disabled,
Aboriginal and mature students) also noted particular concerns with respect to financial
assistance from their law schools.
CHAPTER IV – CHARACTERISTICS OF LAW STUDENTS
A. Introduction
Prior to undertaking an analysis of changes in the characteristics of law school enrolees—
changes that may or may not be associated with the increased costs of attending law school
resulting from tuition deregulation—it is important to determine the extent to which law school
enrolees are drawn proportionally from all groups within Ontario and Canadian society. This
analysis is useful not only to determine to what extent the law schools represent the larger
society but also to access the potential for change. For example, if law students have
historically been drawn from homes with parents who are highly educated and affluent, the law
student population would be less vulnerable to increases in the cost of a legal education, and
would likely demonstrate little change in response to tuition and other cost increases.
This chapter is also concerned with the extent to which law schools respond to their stated
mandate of encouraging diversity within the student population. The law schools’ individual
policies on diversity are typically implemented through specific admissions initiatives intended to
attract students from different ethnocultural and socioeconomic backgrounds as well as those
with special needs. Admissions policies that target groups with unique characteristics are not
necessarily intended to produce a student body that mirrors the Canadian population. Instead,
targeted admissions programs attempt to ensure that law students will be drawn from diverse
backgrounds, thereby increasing the potential to serve the needs of Canadian society and
enriching the law school experience for all. Although diversity and representativeness are not
synonymous, many of the student characteristics detailed below in the section on
representativeness may overlap with characteristics described in the ensuing section on
diversity, and vice versa.
B. Representativeness of the Law School Population To what extent does the enrolment in Ontario law schools represent the gender, marital status,
socioeconomic status and ethnocultural composition of Ontario and Canadian society? For this
analysis, we examine the following characteristics: (1) gender; (2) marital status and
dependents; (3) sexual/gender identity; (4) language; (5) socioeconomic status; (6)
ethnocultural background; (7) citizenship; and, (8) geographic origin.
81
Chapter IV – Characteristics of Law Students
In all analyses except those related to socioeconomic status variables, survey responses were
compared with Statistics Canada 2001 Census data of Ontario and Canadian residents aged 20
to 29 years (this age group was presumed to best approximate the demographic of law
students). However, the Statistics Canada distribution of 20 to 29 year olds and the age
distribution of law school enrolees are not a perfect match. Law students’ age distribution
includes fewer younger and older individuals than does Statistics Canada data. Nonetheless,
the Census data are useful for comparison purposes so long as the limitations of the
comparison are kept in mind.
In the discussion on socioeconomic status, the distribution of parents’ income and education
within the law school student population is compared to Statistics Canada 2001 Census data of
Ontario residents aged 45 to 54 years—the age group presumed to best approximate the
demographic of law students’ parents.
1. Gender It has been argued for decades that structural disincentives exist that discourage young
women in Canadian society from pursuing certain types of careers. For example, until the
1980s, images of lawyers portrayed in the Canadian and North American media were
almost exclusively male, and often the qualities that tended to be associated with successful
lawyers were deemed to be so-called ‘masculine’ traits. In addition, counseling of women’s
careers in schools at this time tended to focus on nursing and teaching, with less emphasis
placed on professions that had not historically been the province of women. However, while
these social and structural obstacles may have existed in the past, their current impact on
young women’s aspirations has been greatly diminished.
Beginning in the 1980s, a clear shift occurred in the aspirations of young women in
secondary schools from wishing marriage first and then perhaps career, to career first. This
shift in the concept of career had its impact almost immediately on gender differences in
secondary school graduation rates and post-secondary level enrolments. Currently the
proportion of young women graduating from secondary schools and entering post-
secondary institutions is now higher than that observed for males (Table 4.1). In addition,
substantially more women than men graduate from secondary school and enrol in Ontario
colleges and universities (King, 2004). Thus, based on this pattern we would anticipate that
more women would be enrolled in Ontario law schools at the present time. While men and
82
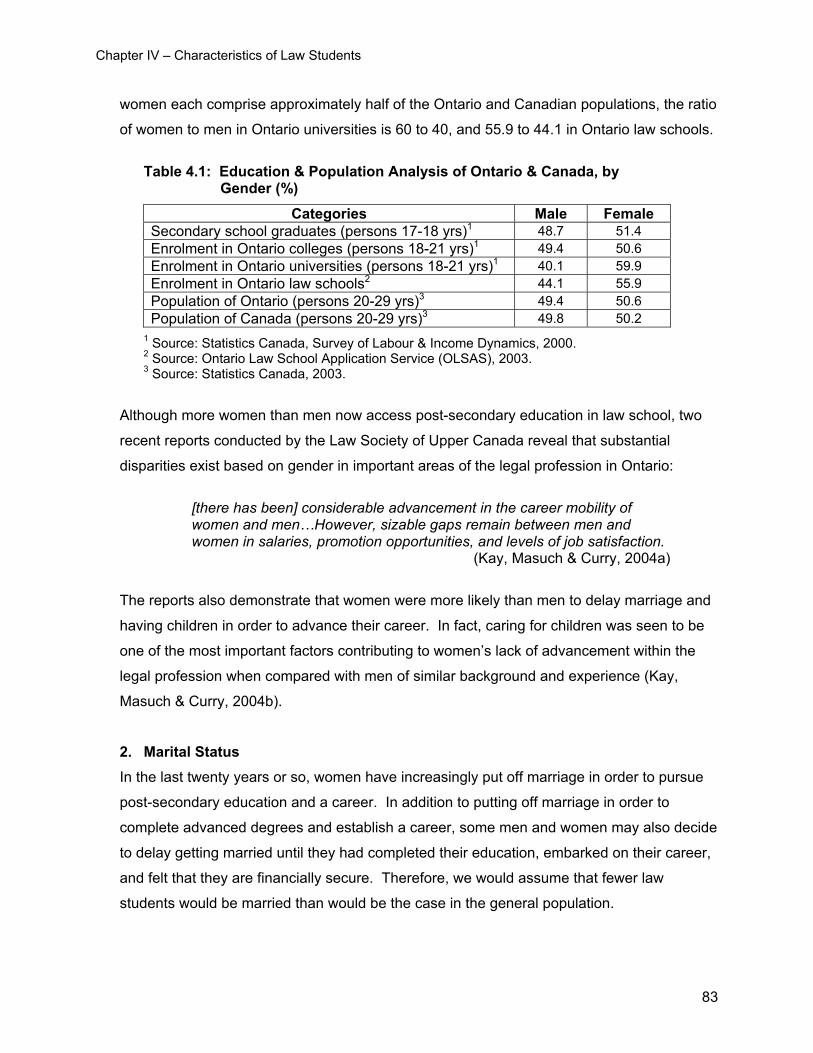
Chapter IV – Characteristics of Law Students
women each comprise approximately half of the Ontario and Canadian populations, the ratio
of women to men in Ontario universities is 60 to 40, and 55.9 to 44.1 in Ontario law schools.
Table 4.1: Education & Population Analysis of Ontario & Canada, by
Gender (%)
Categories Male Female Secondary school graduates (persons 17-18 yrs)1 48.7 51.4 Enrolment in Ontario colleges (persons 18-21 yrs)1 49.4 50.6 Enrolment in Ontario universities (persons 18-21 yrs)1 40.1 59.9 Enrolment in Ontario law schools2 44.1 55.9 Population of Ontario (persons 20-29 yrs)3 49.4 50.6 Population of Canada (persons 20-29 yrs)3 49.8 50.2
1 Source: Statistics Canada, Survey of Labour & Income Dynamics, 2000. 2 Source: Ontario Law School Application Service (OLSAS), 2003. 3 Source: Statistics Canada, 2003.
Although more women than men now access post-secondary education in law school, two
recent reports conducted by the Law Society of Upper Canada reveal that substantial
disparities exist based on gender in important areas of the legal profession in Ontario:
[there has been] considerable advancement in the career mobility of women and men…However, sizable gaps remain between men and women in salaries, promotion opportunities, and levels of job satisfaction. (Kay, Masuch & Curry, 2004a)
The reports also demonstrate that women were more likely than men to delay marriage and
having children in order to advance their career. In fact, caring for children was seen to be
one of the most important factors contributing to women’s lack of advancement within the
legal profession when compared with men of similar background and experience (Kay,
Masuch & Curry, 2004b).
2. Marital Status In the last twenty years or so, women have increasingly put off marriage in order to pursue
post-secondary education and a career. In addition to putting off marriage in order to
complete advanced degrees and establish a career, some men and women may also decide
to delay getting married until they had completed their education, embarked on their career,
and felt that they are financially secure. Therefore, we would assume that fewer law
students would be married than would be the case in the general population.
83
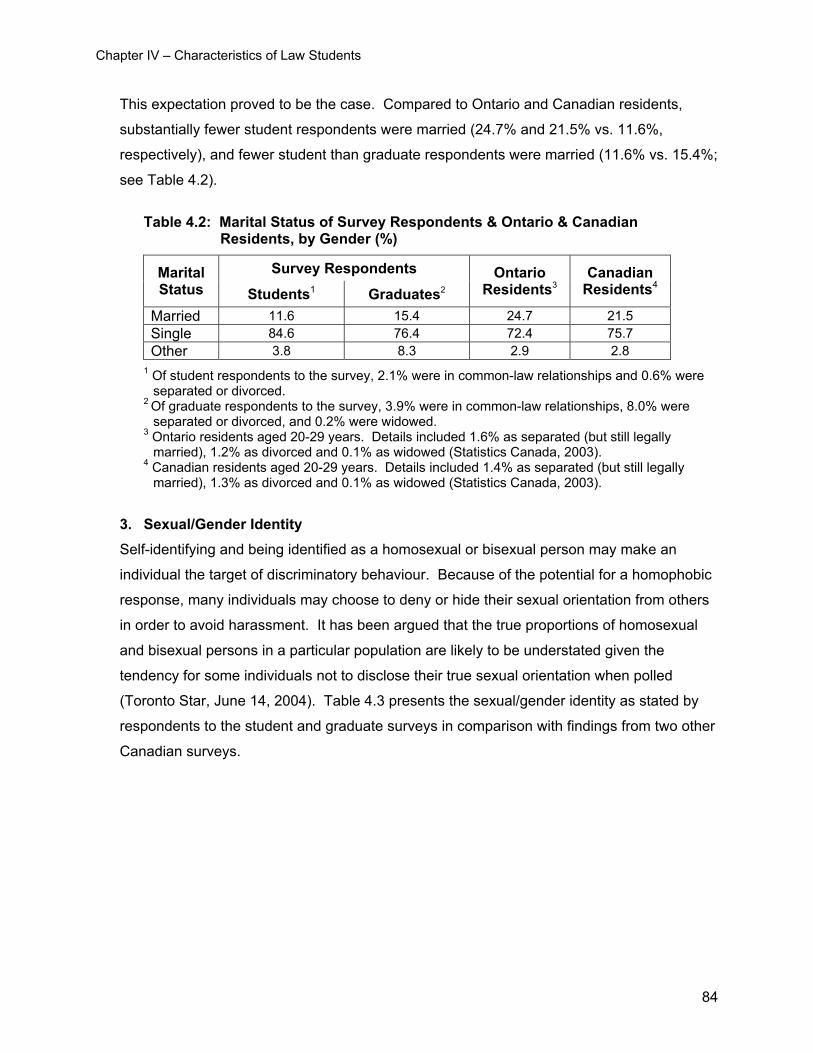
Chapter IV – Characteristics of Law Students
This expectation proved to be the case. Compared to Ontario and Canadian residents,
substantially fewer student respondents were married (24.7% and 21.5% vs. 11.6%,
respectively), and fewer student than graduate respondents were married (11.6% vs. 15.4%;
see Table 4.2).
Table 4.2: Marital Status of Survey Respondents & Ontario & Canadian
Residents, by Gender (%)
Survey Respondents Marital Status Students1 Graduates2
Ontario Residents3
Canadian Residents4
Married 11.6 15.4 24.7 21.5 Single 84.6 76.4 72.4 75.7 Other 3.8 8.3 2.9 2.8
1 Of student respondents to the survey, 2.1% were in common-law relationships and 0.6% were separated or divorced.
2 Of graduate respondents to the survey, 3.9% were in common-law relationships, 8.0% were separated or divorced, and 0.2% were widowed.
3 Ontario residents aged 20-29 years. Details included 1.6% as separated (but still legally married), 1.2% as divorced and 0.1% as widowed (Statistics Canada, 2003).
4 Canadian residents aged 20-29 years. Details included 1.4% as separated (but still legally married), 1.3% as divorced and 0.1% as widowed (Statistics Canada, 2003).
3. Sexual/Gender Identity Self-identifying and being identified as a homosexual or bisexual person may make an
individual the target of discriminatory behaviour. Because of the potential for a homophobic
response, many individuals may choose to deny or hide their sexual orientation from others
in order to avoid harassment. It has been argued that the true proportions of homosexual
and bisexual persons in a particular population are likely to be understated given the
tendency for some individuals not to disclose their true sexual orientation when polled
(Toronto Star, June 14, 2004). Table 4.3 presents the sexual/gender identity as stated by
respondents to the student and graduate surveys in comparison with findings from two other
Canadian surveys.
84
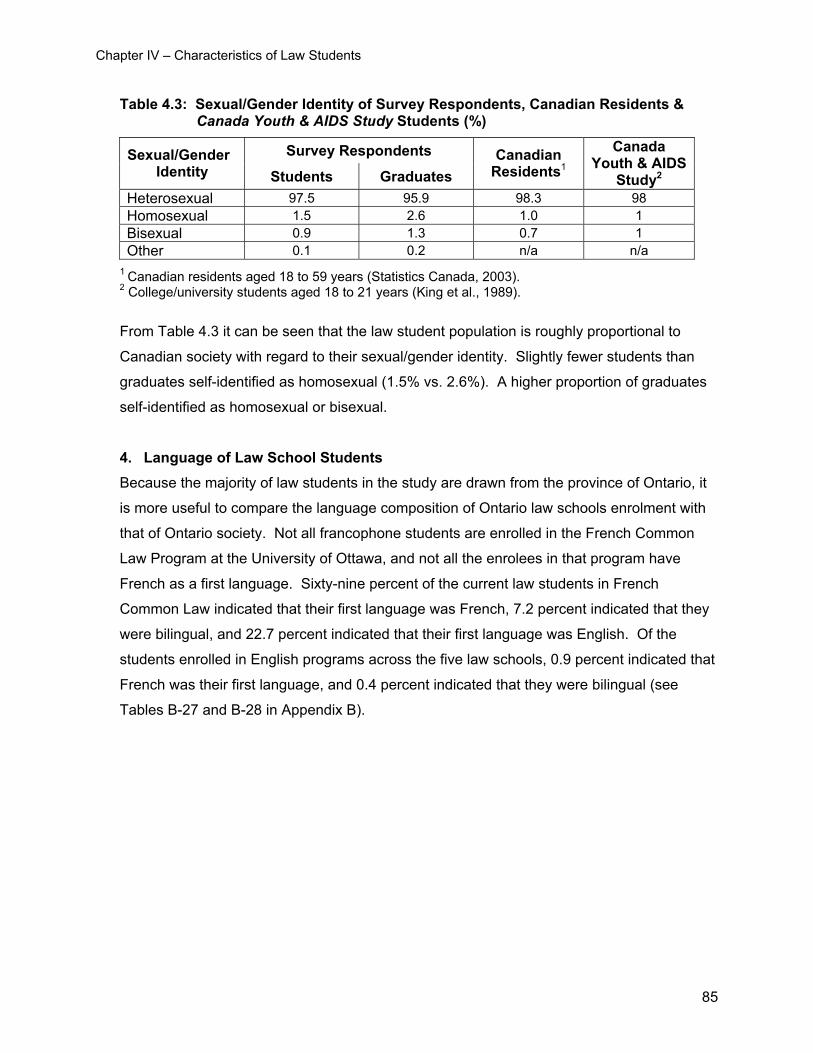
Chapter IV – Characteristics of Law Students
Table 4.3: Sexual/Gender Identity of Survey Respondents, Canadian Residents & Canada Youth & AIDS Study Students (%)
Survey Respondents Sexual/Gender Identity Students Graduates
Canadian Residents1
Canada Youth & AIDS
Study2 Heterosexual 97.5 95.9 98.3 98 Homosexual 1.5 2.6 1.0 1 Bisexual 0.9 1.3 0.7 1 Other 0.1 0.2 n/a n/a
1 Canadian residents aged 18 to 59 years (Statistics Canada, 2003). 2 College/university students aged 18 to 21 years (King et al., 1989).
From Table 4.3 it can be seen that the law student population is roughly proportional to
Canadian society with regard to their sexual/gender identity. Slightly fewer students than
graduates self-identified as homosexual (1.5% vs. 2.6%). A higher proportion of graduates
self-identified as homosexual or bisexual.
4. Language of Law School Students Because the majority of law students in the study are drawn from the province of Ontario, it
is more useful to compare the language composition of Ontario law schools enrolment with
that of Ontario society. Not all francophone students are enrolled in the French Common
Law Program at the University of Ottawa, and not all the enrolees in that program have
French as a first language. Sixty-nine percent of the current law students in French
Common Law indicated that their first language was French, 7.2 percent indicated that they
were bilingual, and 22.7 percent indicated that their first language was English. Of the
students enrolled in English programs across the five law schools, 0.9 percent indicated that
French was their first language, and 0.4 percent indicated that they were bilingual (see
Tables B-27 and B-28 in Appendix B).
85
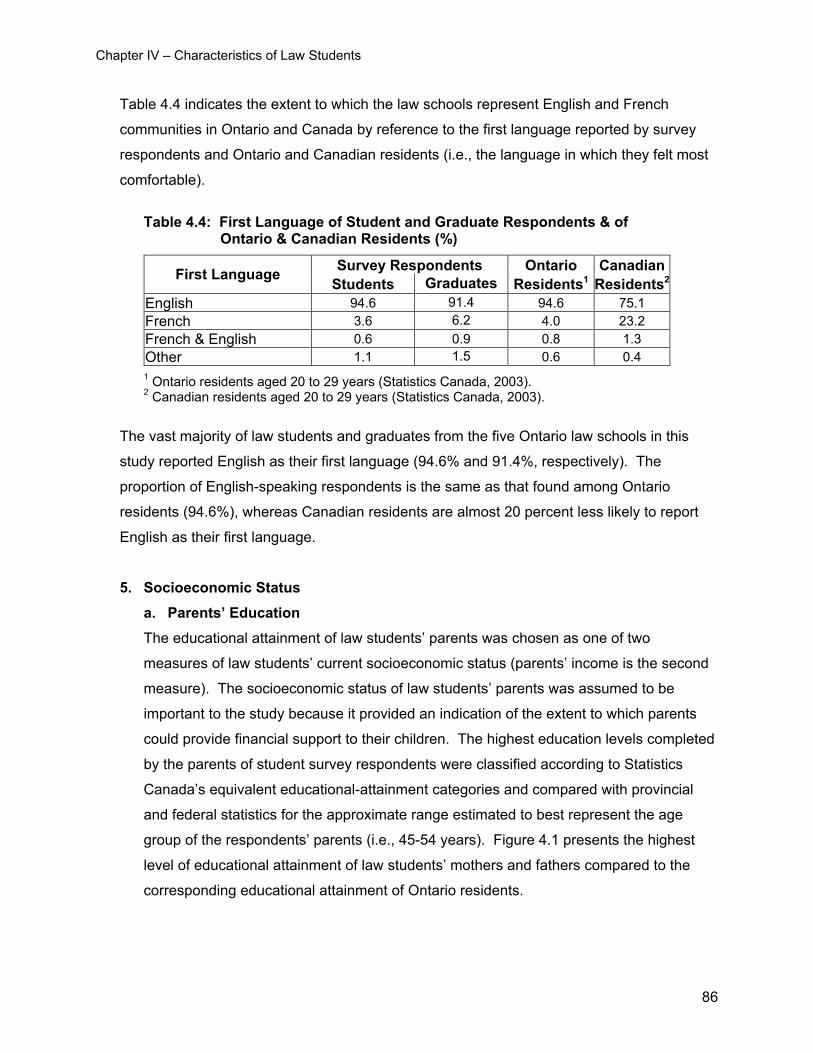
Chapter IV – Characteristics of Law Students
Table 4.4 indicates the extent to which the law schools represent English and French
communities in Ontario and Canada by reference to the first language reported by survey
respondents and Ontario and Canadian residents (i.e., the language in which they felt most
comfortable).
Table 4.4: First Language of Student and Graduate Respondents & of
Ontario & Canadian Residents (%)
Survey Respondents Ontario CanadianFirst Language Students Graduates Residents1 Residents2
English 94.6 91.4 94.6 75.1 French 3.6 6.2 4.0 23.2 French & English 0.6 0.9 0.8 1.3 Other 1.1 1.5 0.6 0.4 1 Ontario residents aged 20 to 29 years (Statistics Canada, 2003). 2 Canadian residents aged 20 to 29 years (Statistics Canada, 2003).
The vast majority of law students and graduates from the five Ontario law schools in this
study reported English as their first language (94.6% and 91.4%, respectively). The
proportion of English-speaking respondents is the same as that found among Ontario
residents (94.6%), whereas Canadian residents are almost 20 percent less likely to report
English as their first language.
5. Socioeconomic Status a. Parents’ Education The educational attainment of law students’ parents was chosen as one of two
measures of law students’ current socioeconomic status (parents’ income is the second
measure). The socioeconomic status of law students’ parents was assumed to be
important to the study because it provided an indication of the extent to which parents
could provide financial support to their children. The highest education levels completed
by the parents of student survey respondents were classified according to Statistics
Canada’s equivalent educational-attainment categories and compared with provincial
and federal statistics for the approximate range estimated to best represent the age
group of the respondents’ parents (i.e., 45-54 years). Figure 4.1 presents the highest
level of educational attainment of law students’ mothers and fathers compared to the
corresponding educational attainment of Ontario residents.
86
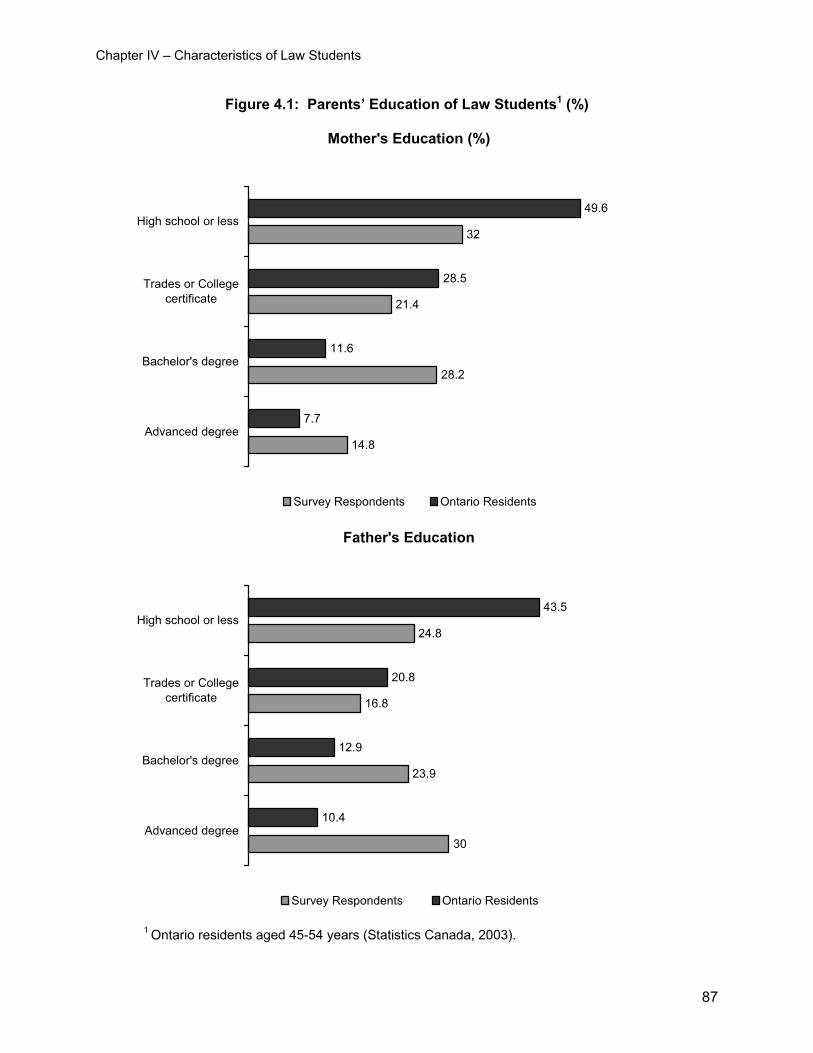
Chapter IV – Characteristics of Law Students
Figure 4.1: Parents’ Education of Law Students1 (%)
Mother's Education (%)
14.8
28.2
21.4
32
7.7
11.6
28.5
49.6
Advanced degree
Bachelor's degree
Trades or Collegecertificate
High school or less
Survey Respondents Ontario Residents
Father's Education
30
23.9
16.8
24.8
10.4
12.9
20.8
43.5
Advanced degree
Bachelor's degree
Trades or Collegecertificate
High school or less
Survey Respondents Ontario Residents
1 Ontario residents aged 45-54 years (Statistics Canada, 2003).
87
Chapter IV – Characteristics of Law Students
In general, law school students are more than twice as likely as Ontario residents to be
drawn from homes where the mother and/or father has a university education, and are
far less likely to be drawn from homes where the parents have at most a high school
education (see Figure 4.1). The differences were especially pronounced at the advanced
degree level where law students’ parents were two to three times as likely to possess an
advanced degree as were Ontario residents in their age cohort. It is also worth noting
the difference between law students’ fathers’ and mothers’ educational attainment in
light of the changes that are taking place in the educational attainment of women
previously discussed. For example, more law students’ mothers had a bachelor’s
degree than did their fathers, but less than half as many mothers as fathers had an
advanced degree.
b. Parents’ Income The income of law students’ parents was used as a second measure of socioeconomic
status (in addition to parents’ education) to be compared with that of the average
household income of Canadians. Since it was not appropriate to ask the survey
respondents about their parents’ income, an alternate procedure was implemented.
Family income quintiles were obtained by dividing the distribution of average family
income for Canada into equal fifths (the data were derived from the Statistics Canada’s
postal code conversion file). Only law school registrants who listed their parents as their
emergency contact on their law school application to OLSAS were included in this
analysis (approximately 70% of all registrants). Law school registrants’ parents were
assigned to a family income category by matching their postal code to the appropriate
dissemination area and associated income figure in the Statistics Canada postal code
conversion file. Using quintiles, Figure 4.2 presents the distribution of law registrants’
parents’ income compared with the average household income of Canadian families.
88
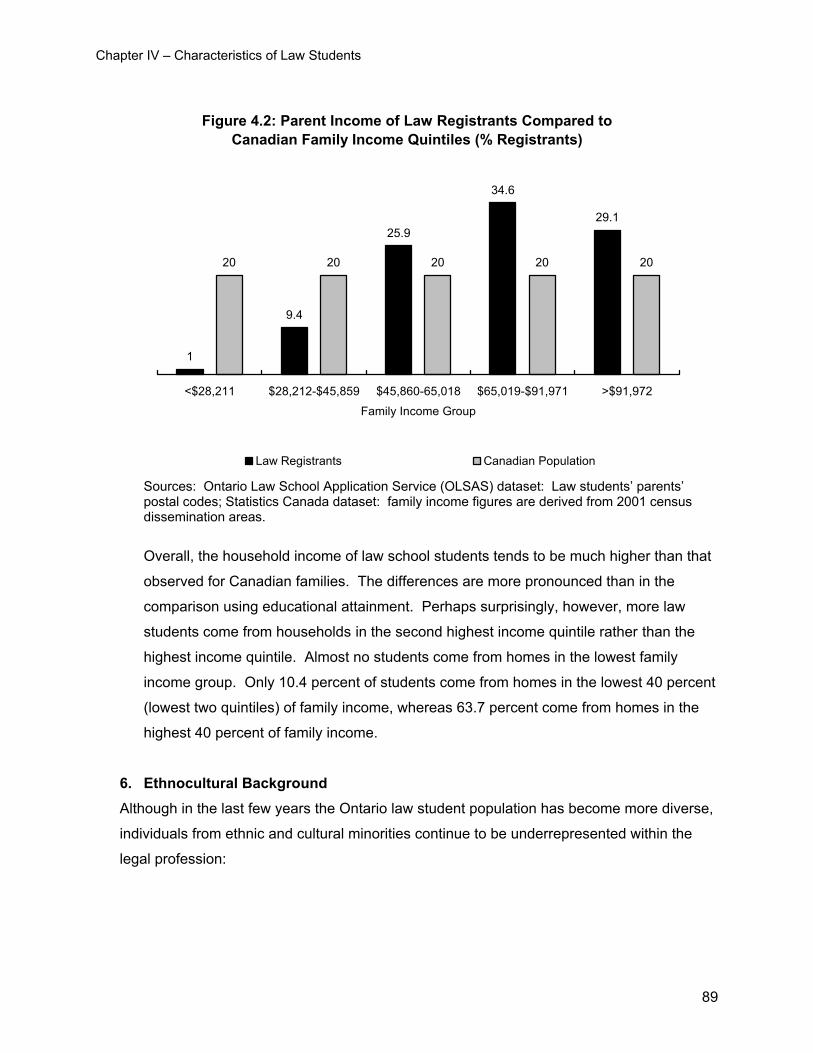
Chapter IV – Characteristics of Law Students
Figure 4.2: Parent Income of Law Registrants Compared to Canadian Family Income Quintiles (% Registrants)
1
9.4
25.9
34.6
29.1
20 20 20 20 20
<$28,211 $28,212-$45,859 $45,860-65,018 $65,019-$91,971 >$91,972
Family Income Group
Law Registrants Canadian Population
Sources: Ontario Law School Application Service (OLSAS) dataset: Law students’ parents’ postal codes; Statistics Canada dataset: family income figures are derived from 2001 census dissemination areas.
Overall, the household income of law school students tends to be much higher than that
observed for Canadian families. The differences are more pronounced than in the
comparison using educational attainment. Perhaps surprisingly, however, more law
students come from households in the second highest income quintile rather than the
highest income quintile. Almost no students come from homes in the lowest family
income group. Only 10.4 percent of students come from homes in the lowest 40 percent
(lowest two quintiles) of family income, whereas 63.7 percent come from homes in the
highest 40 percent of family income.
6. Ethnocultural Background Although in the last few years the Ontario law student population has become more diverse,
individuals from ethnic and cultural minorities continue to be underrepresented within the
legal profession:
89
Chapter IV – Characteristics of Law Students
Recent research suggests that while there is evidence of progress, ongoing bias may prevent…diverse groups from entering the profession and advancing to positions of power where they might affect meaningful changes to the culture of the legal profession. (Kay, Masuch & Curry, 2004b)
If the legal profession appears to be lacking in ethnic diversity, one would anticipate that
inequity would also exist at the “access point to the legal profession (St. Lewis & Trevino,
1999)”, namely admissions to law school. However, all five of the Ontario law schools
specifically include ethnicity in their formal admission policies on diversity and equity.
Diversity policies and practices are designed to minimize the barriers placed in the way of
those groups disadvantaged by social circumstances and/or ethnocultural background.
The need for law schools to address the issue of discrimination because of on ethnicity
through equitable admissions policies, is underscored not only by under representation
within the profession, but also by the growing ethnic diversity in the province of Ontario,
particularly the Greater Toronto Area (GTA). According to a 2004 Statistics Canada report,
“in 2001…nearly one half (47%) of the Black population…lived in the Toronto census
metropolitan area (CMA), one of the most ethnically and culturally diverse urban areas in the
world (Milan and Tran, 2004).” Table 4.5 presents the visible minority status of law students
and graduates from five law schools compared with those of Ontario and Canadian
residents.
90
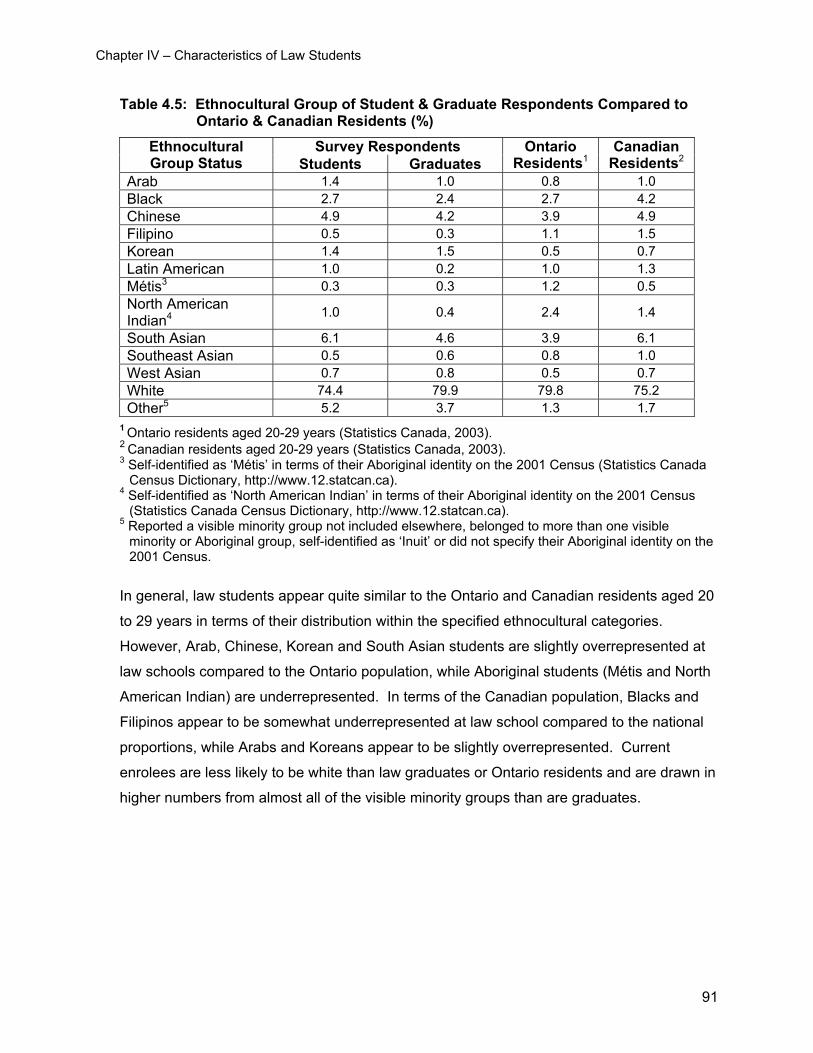
Chapter IV – Characteristics of Law Students
Table 4.5: Ethnocultural Group of Student & Graduate Respondents Compared to Ontario & Canadian Residents (%)
Survey Respondents Ethnocultural Group Status Students Graduates
Ontario Residents1
Canadian Residents2
Arab 1.4 1.0 0.8 1.0 Black 2.7 2.4 2.7 4.2 Chinese 4.9 4.2 3.9 4.9 Filipino 0.5 0.3 1.1 1.5 Korean 1.4 1.5 0.5 0.7 Latin American 1.0 0.2 1.0 1.3 Métis3 0.3 0.3 1.2 0.5 North American Indian4 1.0 0.4 2.4 1.4
South Asian 6.1 4.6 3.9 6.1 Southeast Asian 0.5 0.6 0.8 1.0 West Asian 0.7 0.8 0.5 0.7 White 74.4 79.9 79.8 75.2 Other5 5.2 3.7 1.3 1.7
1 Ontario residents aged 20-29 years (Statistics Canada, 2003). 2 Canadian residents aged 20-29 years (Statistics Canada, 2003). 3 Self-identified as ‘Métis’ in terms of their Aboriginal identity on the 2001 Census (Statistics Canada
Census Dictionary, http://www.12.statcan.ca). 4 Self-identified as ‘North American Indian’ in terms of their Aboriginal identity on the 2001 Census
(Statistics Canada Census Dictionary, http://www.12.statcan.ca). 5 Reported a visible minority group not included elsewhere, belonged to more than one visible
minority or Aboriginal group, self-identified as ‘Inuit’ or did not specify their Aboriginal identity on the 2001 Census.
In general, law students appear quite similar to the Ontario and Canadian residents aged 20
to 29 years in terms of their distribution within the specified ethnocultural categories.
However, Arab, Chinese, Korean and South Asian students are slightly overrepresented at
law schools compared to the Ontario population, while Aboriginal students (Métis and North
American Indian) are underrepresented. In terms of the Canadian population, Blacks and
Filipinos appear to be somewhat underrepresented at law school compared to the national
proportions, while Arabs and Koreans appear to be slightly overrepresented. Current
enrolees are less likely to be white than law graduates or Ontario residents and are drawn in
higher numbers from almost all of the visible minority groups than are graduates.
91
Chapter IV – Characteristics of Law Students
7. Citizenship In our previous discussion of the socioeconomic status of law students’ parents, we
established the important role played by parents’ socioeconomic status in determining
students’ participation in higher education—in this case, law school. The two variables
comprising parents’ socioeconomic status in our analysis were education and income.
When we combine our discussion of parents’ socioeconomic status with an examination of
law students’ citizenship, some assumptions can be made as to how law students’
citizenship might relate to their participation in law school. It is important to note that the
Law Society of Upper Canada (LSUC) requires those individuals who wish to practise law in
the province of Ontario to be Canadian citizens or permanent residents of Canada.
Upon arrival in a new country, recent immigrants must adjust to a host of different elements,
namely language and cultural differences that may affect their occupational status and
income level:
…compared with longer-established immigrants, and with those born in Canada, many [recent immigrants] may experience higher unemployment rates, hold jobs that do not reflect their level of training and education, and earn lower incomes. (Boyd and Vickers, 2000)
Thus, the more recently a law students’ parents immigrated to Canada, the lower the
students’ parents’ occupational status and income level are likely to be, thereby reducing the
student’s likelihood to attend law school. This effect is compounded by the fact that, as
Parker et al. (2003) contend, the occupational status of an immigrant’s father is one of the
most important influences on his educational attainment.
If the children of recent immigrants to Canada are likely to have lower educational
attainment than the children of parents who are, at the very least, second-generation
immigrants, we would expect law school students to most often be Canadian citizens. Table
4.6 presents the citizenship of 2003 registrants at the five Ontario law schools, law students
and recent law graduates compared with the citizenship of Ontario and Canadian residents.
92
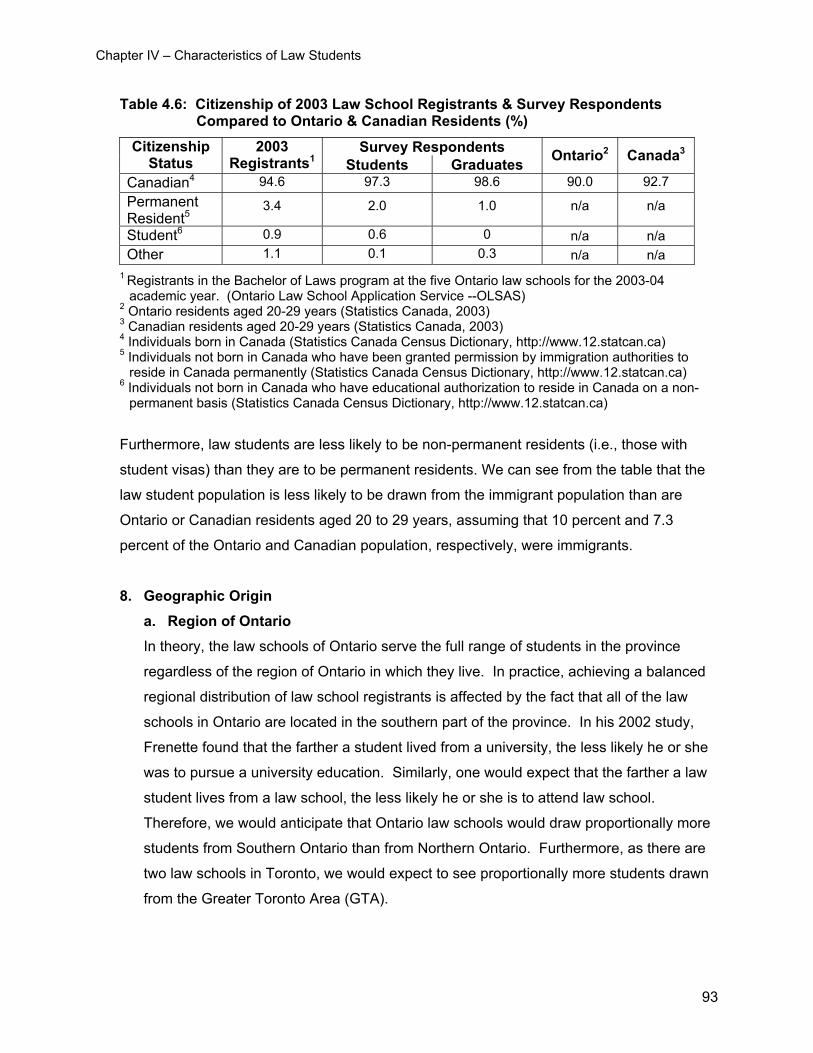
Chapter IV – Characteristics of Law Students
Table 4.6: Citizenship of 2003 Law School Registrants & Survey Respondents Compared to Ontario & Canadian Residents (%)
Survey Respondents Citizenship Status
2003 Registrants1 Students Graduates Ontario2 Canada3
Canadian4 94.6 97.3 98.6 90.0 92.7 Permanent Resident5
3.4 2.0 1.0 n/a n/a
Student6 0.9 0.6 0 n/a n/a Other 1.1 0.1 0.3 n/a n/a
1 Registrants in the Bachelor of Laws program at the five Ontario law schools for the 2003-04 academic year. (Ontario Law School Application Service --OLSAS)
2 Ontario residents aged 20-29 years (Statistics Canada, 2003) 3 Canadian residents aged 20-29 years (Statistics Canada, 2003) 4 Individuals born in Canada (Statistics Canada Census Dictionary, http://www.12.statcan.ca) 5 Individuals not born in Canada who have been granted permission by immigration authorities to
reside in Canada permanently (Statistics Canada Census Dictionary, http://www.12.statcan.ca) 6 Individuals not born in Canada who have educational authorization to reside in Canada on a non-
permanent basis (Statistics Canada Census Dictionary, http://www.12.statcan.ca)
Furthermore, law students are less likely to be non-permanent residents (i.e., those with
student visas) than they are to be permanent residents. We can see from the table that the
law student population is less likely to be drawn from the immigrant population than are
Ontario or Canadian residents aged 20 to 29 years, assuming that 10 percent and 7.3
percent of the Ontario and Canadian population, respectively, were immigrants.
8. Geographic Origin a. Region of Ontario In theory, the law schools of Ontario serve the full range of students in the province
regardless of the region of Ontario in which they live. In practice, achieving a balanced
regional distribution of law school registrants is affected by the fact that all of the law
schools in Ontario are located in the southern part of the province. In his 2002 study,
Frenette found that the farther a student lived from a university, the less likely he or she
was to pursue a university education. Similarly, one would expect that the farther a law
student lives from a law school, the less likely he or she is to attend law school.
Therefore, we would anticipate that Ontario law schools would draw proportionally more
students from Southern Ontario than from Northern Ontario. Furthermore, as there are
two law schools in Toronto, we would expect to see proportionally more students drawn
from the Greater Toronto Area (GTA).
93
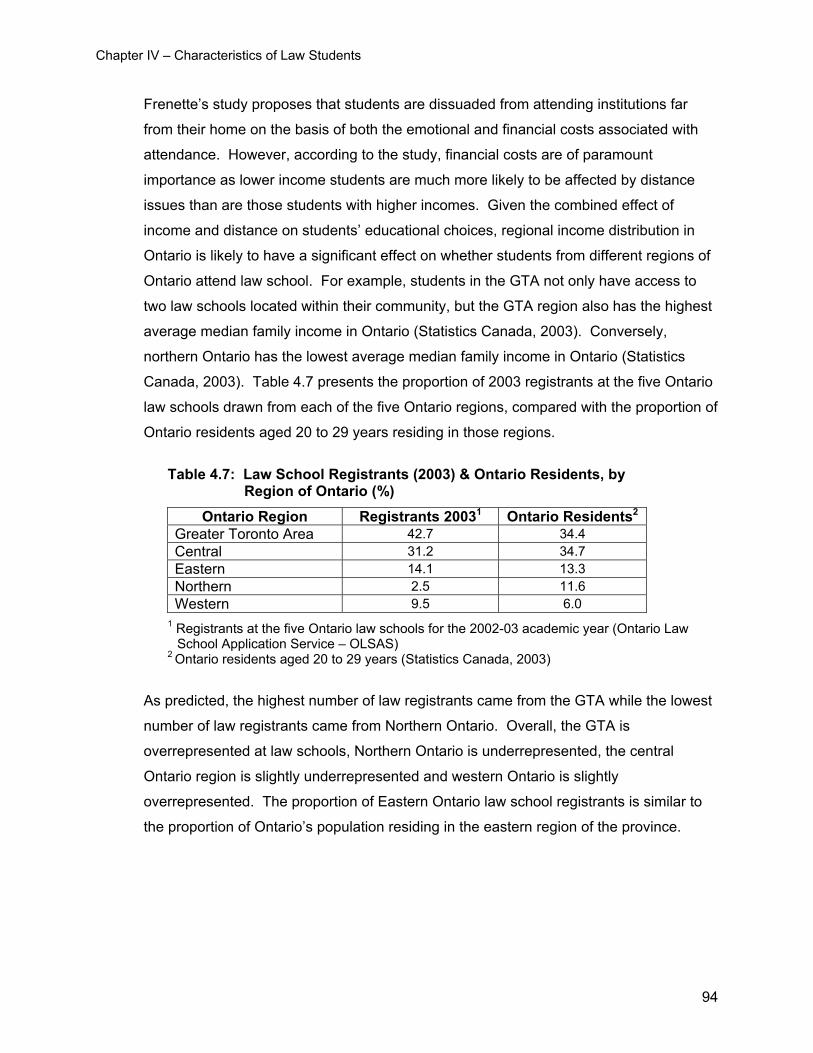
Chapter IV – Characteristics of Law Students
Frenette’s study proposes that students are dissuaded from attending institutions far
from their home on the basis of both the emotional and financial costs associated with
attendance. However, according to the study, financial costs are of paramount
importance as lower income students are much more likely to be affected by distance
issues than are those students with higher incomes. Given the combined effect of
income and distance on students’ educational choices, regional income distribution in
Ontario is likely to have a significant effect on whether students from different regions of
Ontario attend law school. For example, students in the GTA not only have access to
two law schools located within their community, but the GTA region also has the highest
average median family income in Ontario (Statistics Canada, 2003). Conversely,
northern Ontario has the lowest average median family income in Ontario (Statistics
Canada, 2003). Table 4.7 presents the proportion of 2003 registrants at the five Ontario
law schools drawn from each of the five Ontario regions, compared with the proportion of
Ontario residents aged 20 to 29 years residing in those regions.
Table 4.7: Law School Registrants (2003) & Ontario Residents, by
Region of Ontario (%)
Ontario Region Registrants 20031 Ontario Residents2 Greater Toronto Area 42.7 34.4 Central 31.2 34.7 Eastern 14.1 13.3 Northern 2.5 11.6 Western 9.5 6.0
1 Registrants at the five Ontario law schools for the 2002-03 academic year (Ontario Law School Application Service – OLSAS)
2 Ontario residents aged 20 to 29 years (Statistics Canada, 2003)
As predicted, the highest number of law registrants came from the GTA while the lowest
number of law registrants came from Northern Ontario. Overall, the GTA is
overrepresented at law schools, Northern Ontario is underrepresented, the central
Ontario region is slightly underrepresented and western Ontario is slightly
overrepresented. The proportion of Eastern Ontario law school registrants is similar to
the proportion of Ontario’s population residing in the eastern region of the province.
94
Chapter IV – Characteristics of Law Students
C. Diversity in the Law School Population Each of the Ontario law schools has made a formal commitment, articulated in their policies on
equity and diversity, to attempt to ease the inequities faced by various minorities with regard to
the admissions process and the overall law school experience:
[Osgoode Hall Law School’s] aim is to recruit and admit individuals with good academic potential who have themselves confronted, or who are from groups which have confronted identifiable social, educational and/or economic barriers to education in general or legal education in particular (http://www.osgoode.yorku.ca/categories.htm).
The Common Law Section [University of Ottawa] understands the systemic barriers faced by individuals from diverse communities and is deeply committed to eliminating such barriers in legal education (http://www.uottawa.ca/academic/info/regist/crs/ clawEN/ComLawEN-FINAL.pdf).
The Faculty of Law at Queen’s recognizes the reality that some students come from and live in circumstances that disadvantage their competitiveness in the conventional admissions procedure and later in their legal studies. To this end the admissions policy at Queen’s is committed to a procedure which encourages the application and supports the admission of such individuals (http://qsilver.queensu.ca/law/equity/equityvision.htm)
While the Faculty [of Law at the University of Western Ontario] believes that excellence in academic studies is the best evidence of ability to succeed in the study of law, it also believes that achievements in other areas may indicate potential for success in legal studies. Accordingly, our application policies allow applicants to show their potential in various ways, and are designed to produce students with diverse experiences (http://www.law.uwo.ca/mainSite/).
We [Faculty of Law at the University of Windsor] undertake to offer and dispense legal education…without differentiation on the basis of traits peculiar to the person such as sex, marital status, sexual preference, race, colour, nationality, place of origin, age, religious belief or lack thereof, ethnic origin, political belief or activity, creed, citizenship, family relation, physical disability or economic status (http://athena.uwindsor.ca/units/law/Law.nsf.
In this section we examine the impact of the policies articulated above on the characteristics of
current enrolees and recent graduates of Ontario law schools. Specifically, we will discuss
whether or not the following groups are adequately represented at the five schools: (1) disabled
students; (2) Aboriginal students; (3) mature students; (4) students from visible minority groups;
and (5) students from other provinces/countries.
95
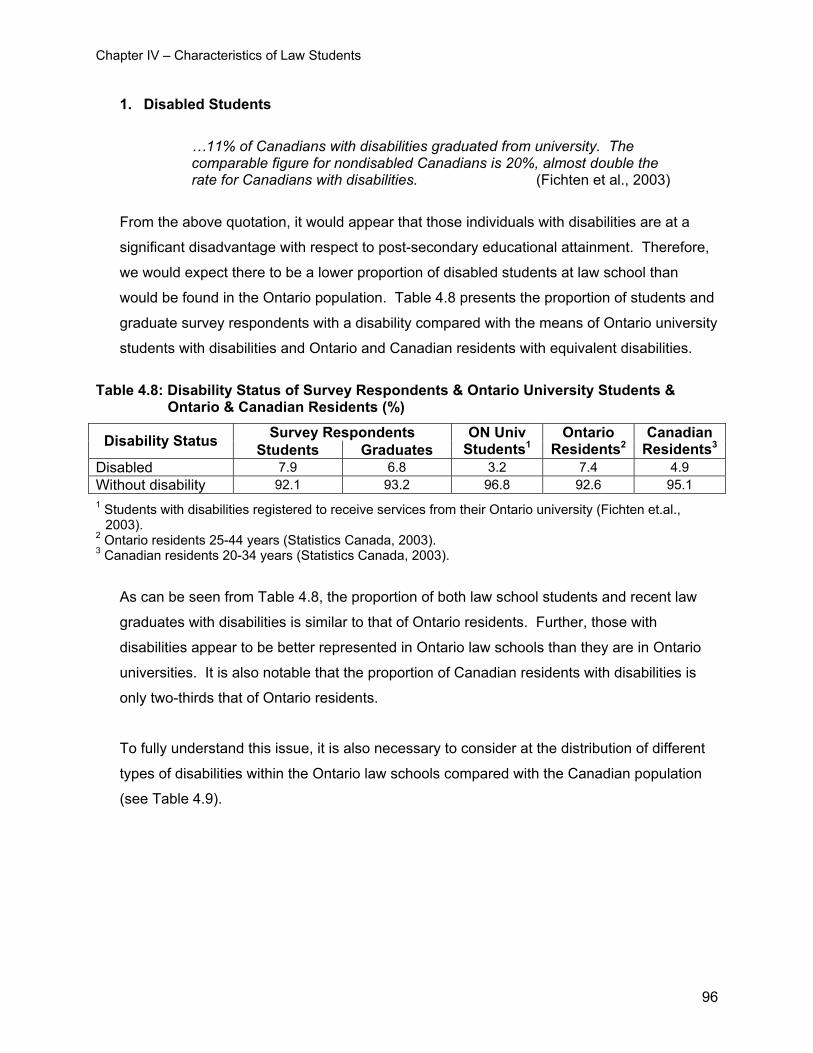
Chapter IV – Characteristics of Law Students
1. Disabled Students
…11% of Canadians with disabilities graduated from university. The comparable figure for nondisabled Canadians is 20%, almost double the rate for Canadians with disabilities. (Fichten et al., 2003)
From the above quotation, it would appear that those individuals with disabilities are at a
significant disadvantage with respect to post-secondary educational attainment. Therefore,
we would expect there to be a lower proportion of disabled students at law school than
would be found in the Ontario population. Table 4.8 presents the proportion of students and
graduate survey respondents with a disability compared with the means of Ontario university
students with disabilities and Ontario and Canadian residents with equivalent disabilities.
Table 4.8: Disability Status of Survey Respondents & Ontario University Students &
Ontario & Canadian Residents (%)
Survey Respondents Disability Status Students Graduates ON Univ
Students1 Ontario
Residents2 Canadian
Residents3
Disabled 7.9 6.8 3.2 7.4 4.9 Without disability 92.1 93.2 96.8 92.6 95.1 1 Students with disabilities registered to receive services from their Ontario university (Fichten et.al.,
2003). 2 Ontario residents 25-44 years (Statistics Canada, 2003). 3 Canadian residents 20-34 years (Statistics Canada, 2003).
As can be seen from Table 4.8, the proportion of both law school students and recent law
graduates with disabilities is similar to that of Ontario residents. Further, those with
disabilities appear to be better represented in Ontario law schools than they are in Ontario
universities. It is also notable that the proportion of Canadian residents with disabilities is
only two-thirds that of Ontario residents.
To fully understand this issue, it is also necessary to consider at the distribution of different
types of disabilities within the Ontario law schools compared with the Canadian population
(see Table 4.9).
96
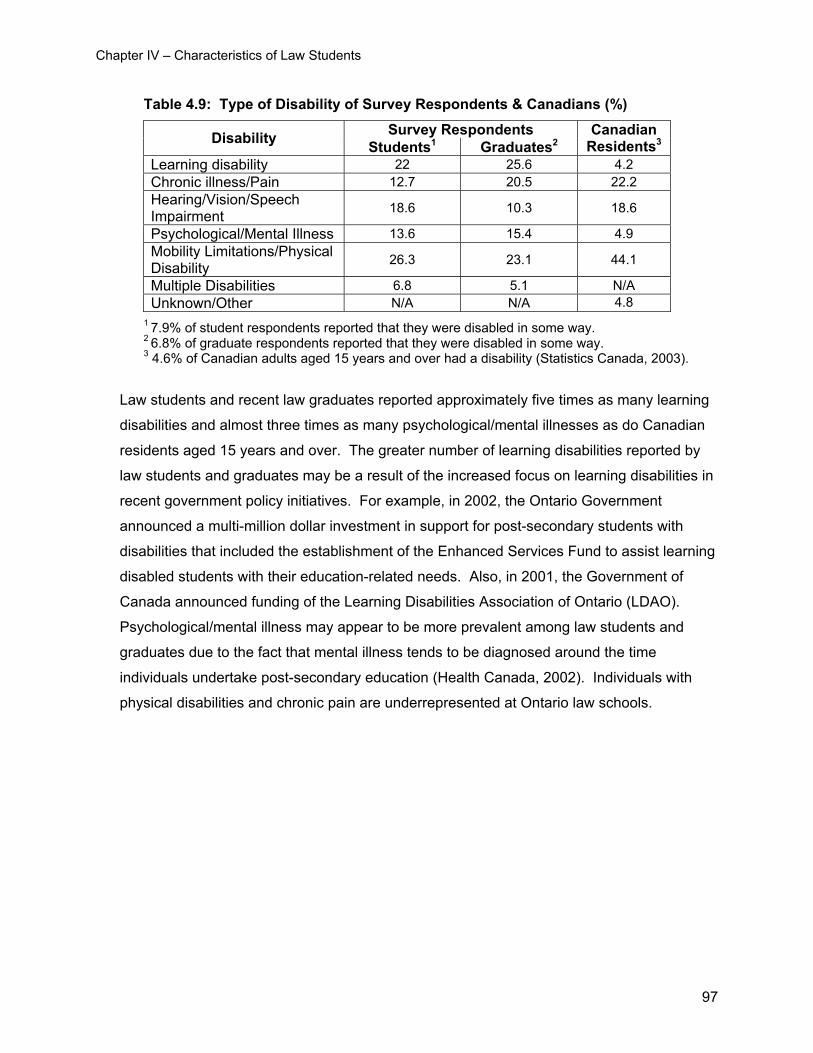
Chapter IV – Characteristics of Law Students
Table 4.9: Type of Disability of Survey Respondents & Canadians (%)
Survey Respondents Disability Students1 Graduates2 Canadian
Residents3 Learning disability 22 25.6 4.2 Chronic illness/Pain 12.7 20.5 22.2 Hearing/Vision/Speech Impairment 18.6 10.3 18.6
Psychological/Mental Illness 13.6 15.4 4.9 Mobility Limitations/Physical Disability 26.3 23.1 44.1
Multiple Disabilities 6.8 5.1 N/A Unknown/Other N/A N/A 4.8
1 7.9% of student respondents reported that they were disabled in some way. 2 6.8% of graduate respondents reported that they were disabled in some way. 3 4.6% of Canadian adults aged 15 years and over had a disability (Statistics Canada, 2003).
Law students and recent law graduates reported approximately five times as many learning
disabilities and almost three times as many psychological/mental illnesses as do Canadian
residents aged 15 years and over. The greater number of learning disabilities reported by
law students and graduates may be a result of the increased focus on learning disabilities in
recent government policy initiatives. For example, in 2002, the Ontario Government
announced a multi-million dollar investment in support for post-secondary students with
disabilities that included the establishment of the Enhanced Services Fund to assist learning
disabled students with their education-related needs. Also, in 2001, the Government of
Canada announced funding of the Learning Disabilities Association of Ontario (LDAO).
Psychological/mental illness may appear to be more prevalent among law students and
graduates due to the fact that mental illness tends to be diagnosed around the time
individuals undertake post-secondary education (Health Canada, 2002). Individuals with
physical disabilities and chronic pain are underrepresented at Ontario law schools.
97
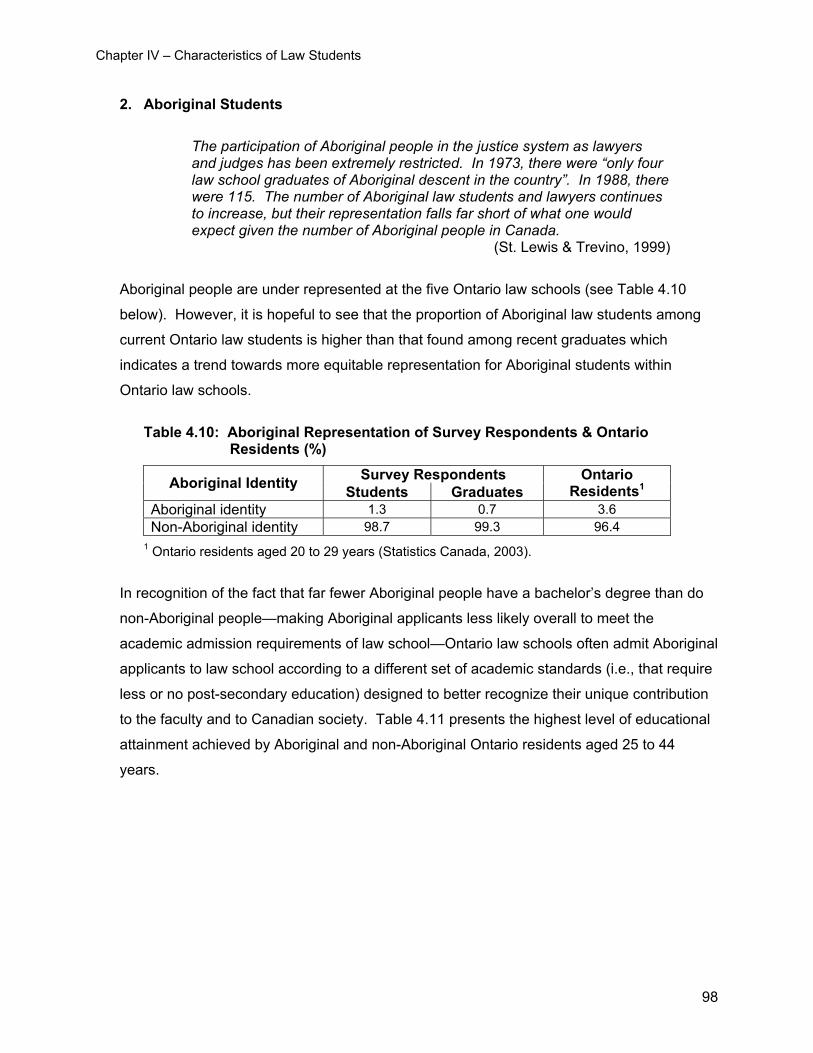
Chapter IV – Characteristics of Law Students
2. Aboriginal Students
The participation of Aboriginal people in the justice system as lawyers and judges has been extremely restricted. In 1973, there were “only four law school graduates of Aboriginal descent in the country”. In 1988, there were 115. The number of Aboriginal law students and lawyers continues to increase, but their representation falls far short of what one would expect given the number of Aboriginal people in Canada. (St. Lewis & Trevino, 1999)
Aboriginal people are under represented at the five Ontario law schools (see Table 4.10
below). However, it is hopeful to see that the proportion of Aboriginal law students among
current Ontario law students is higher than that found among recent graduates which
indicates a trend towards more equitable representation for Aboriginal students within
Ontario law schools.
Table 4.10: Aboriginal Representation of Survey Respondents & Ontario
Residents (%)
Survey Respondents Aboriginal Identity Students Graduates Ontario
Residents1 Aboriginal identity 1.3 0.7 3.6 Non-Aboriginal identity 98.7 99.3 96.4
1 Ontario residents aged 20 to 29 years (Statistics Canada, 2003).
In recognition of the fact that far fewer Aboriginal people have a bachelor’s degree than do
non-Aboriginal people—making Aboriginal applicants less likely overall to meet the
academic admission requirements of law school—Ontario law schools often admit Aboriginal
applicants to law school according to a different set of academic standards (i.e., that require
less or no post-secondary education) designed to better recognize their unique contribution
to the faculty and to Canadian society. Table 4.11 presents the highest level of educational
attainment achieved by Aboriginal and non-Aboriginal Ontario residents aged 25 to 44
years.
98
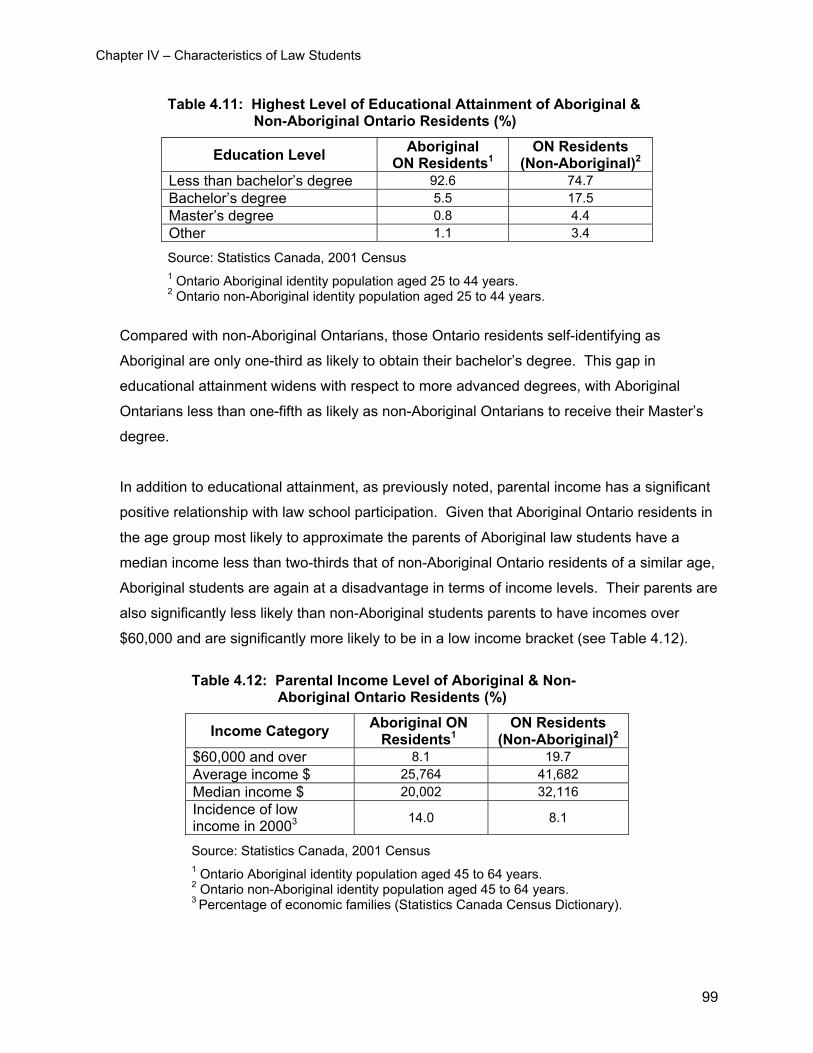
Chapter IV – Characteristics of Law Students
Table 4.11: Highest Level of Educational Attainment of Aboriginal & Non-Aboriginal Ontario Residents (%)
Education Level Aboriginal ON Residents1
ON Residents (Non-Aboriginal)2
Less than bachelor’s degree 92.6 74.7 Bachelor’s degree 5.5 17.5 Master’s degree 0.8 4.4 Other 1.1 3.4
Source: Statistics Canada, 2001 Census 1 Ontario Aboriginal identity population aged 25 to 44 years. 2 Ontario non-Aboriginal identity population aged 25 to 44 years.
Compared with non-Aboriginal Ontarians, those Ontario residents self-identifying as
Aboriginal are only one-third as likely to obtain their bachelor’s degree. This gap in
educational attainment widens with respect to more advanced degrees, with Aboriginal
Ontarians less than one-fifth as likely as non-Aboriginal Ontarians to receive their Master’s
degree.
In addition to educational attainment, as previously noted, parental income has a significant
positive relationship with law school participation. Given that Aboriginal Ontario residents in
the age group most likely to approximate the parents of Aboriginal law students have a
median income less than two-thirds that of non-Aboriginal Ontario residents of a similar age,
Aboriginal students are again at a disadvantage in terms of income levels. Their parents are
also significantly less likely than non-Aboriginal students parents to have incomes over
$60,000 and are significantly more likely to be in a low income bracket (see Table 4.12).
Table 4.12: Parental Income Level of Aboriginal & Non-
Aboriginal Ontario Residents (%)
Income Category Aboriginal ON Residents1
ON Residents (Non-Aboriginal)2
$60,000 and over 8.1 19.7 Average income $ 25,764 41,682 Median income $ 20,002 32,116 Incidence of low income in 20003 14.0 8.1
Source: Statistics Canada, 2001 Census 1 Ontario Aboriginal identity population aged 45 to 64 years. 2 Ontario non-Aboriginal identity population aged 45 to 64 years. 3 Percentage of economic families (Statistics Canada Census Dictionary).
99
Chapter IV – Characteristics of Law Students
Financial considerations are especially important in encouraging Aboriginal people to attend
law school given that, “federal funding for [Aboriginal] student assistance (delivered through
Indian and Northern Affairs) [has been] frozen in absolute terms and declining in real terms
over the last decade (Association of Universities and Colleges of Canada). In addition, over
one-fifth of the non-reserve Aboriginal population reported that finances were responsible for
their not finishing their post-secondary studies” (O’Donnell and Tait, 2003).
3. Mature Students In order to qualify as a mature student for the purposes of admission into one of the five
Ontario law schools, an individual must be at least 26 years of age and must possess a
minimum of five years of non-university experience (OLSAS website). Each of the five
schools makes certain admissions accommodations for mature students with regard to
academic requirements and LSAT score in an effort to encourage those individuals with
substantial non-academic experience to attend law school. The proportion of students aged
26 years and above who entered the law program at the five schools is a little less than one-
third (see Figure 5.1).
4. Visible Minorities As previously noted (Table 4.5), law students belonging to visible minority groups appear to
be well represented at the five Ontario law schools with the exception of those students of
Aboriginal descent.
5. Other Provinces/Countries In order to have a diverse and stimulating student body, the law schools actively seek
applicants from other provinces and countries. Table 4.13 illustrates the success of these
initiatives. In 2003, less than 70 percent of Year 1 registrants came from an Ontario
university as compared with approximately 73 percent in 1997. Now more foreign students
attend law school, and there has been a steady growth in students coming from all parts of
Canada, except for Quebec. It would appear that that since the deregulation of tuition, the
five Ontario law schools are attracting a more geographically diverse group of students.
100
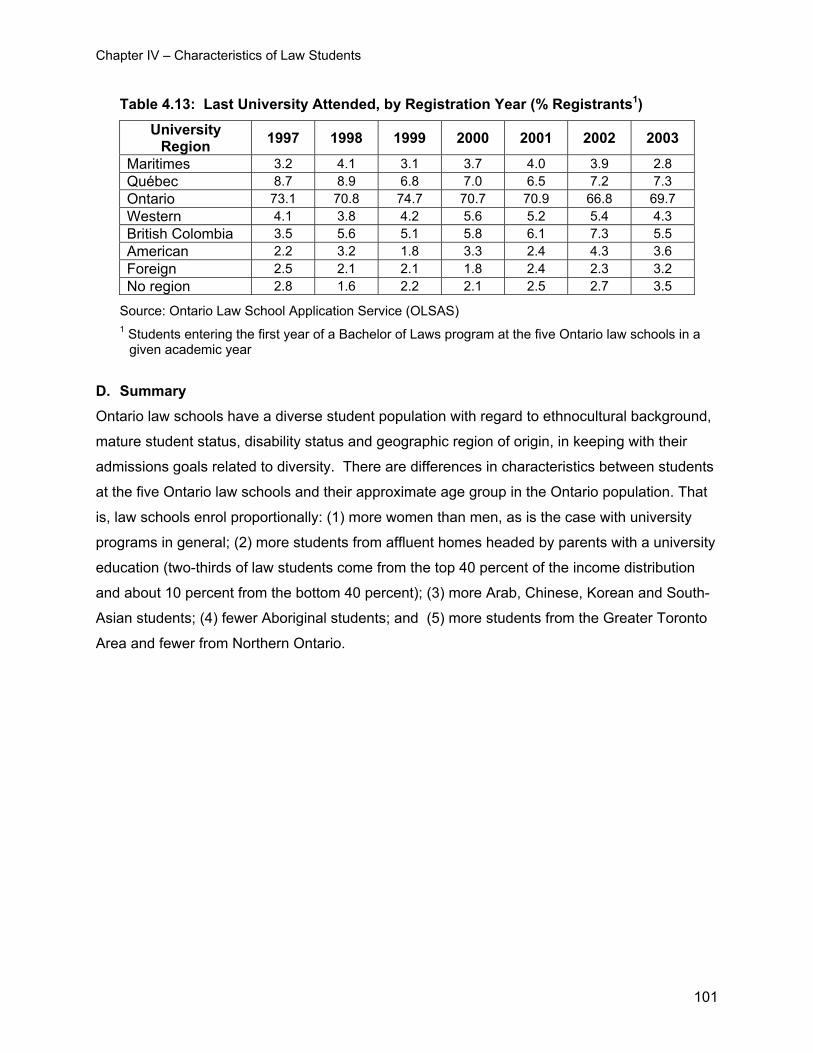
Chapter IV – Characteristics of Law Students
101
Table 4.13: Last University Attended, by Registration Year (% Registrants1)
University Region 1997 1998 1999 2000 2001 2002 2003
Maritimes 3.2 4.1 3.1 3.7 4.0 3.9 2.8 Québec 8.7 8.9 6.8 7.0 6.5 7.2 7.3 Ontario 73.1 70.8 74.7 70.7 70.9 66.8 69.7 Western 4.1 3.8 4.2 5.6 5.2 5.4 4.3 British Colombia 3.5 5.6 5.1 5.8 6.1 7.3 5.5 American 2.2 3.2 1.8 3.3 2.4 4.3 3.6 Foreign 2.5 2.1 2.1 1.8 2.4 2.3 3.2 No region 2.8 1.6 2.2 2.1 2.5 2.7 3.5
Source: Ontario Law School Application Service (OLSAS) 1 Students entering the first year of a Bachelor of Laws program at the five Ontario law schools in a
given academic year
D. Summary Ontario law schools have a diverse student population with regard to ethnocultural background,
mature student status, disability status and geographic region of origin, in keeping with their
admissions goals related to diversity. There are differences in characteristics between students
at the five Ontario law schools and their approximate age group in the Ontario population. That
is, law schools enrol proportionally: (1) more women than men, as is the case with university
programs in general; (2) more students from affluent homes headed by parents with a university
education (two-thirds of law students come from the top 40 percent of the income distribution
and about 10 percent from the bottom 40 percent); (3) more Arab, Chinese, Korean and South-
Asian students; (4) fewer Aboriginal students; and (5) more students from the Greater Toronto
Area and fewer from Northern Ontario.
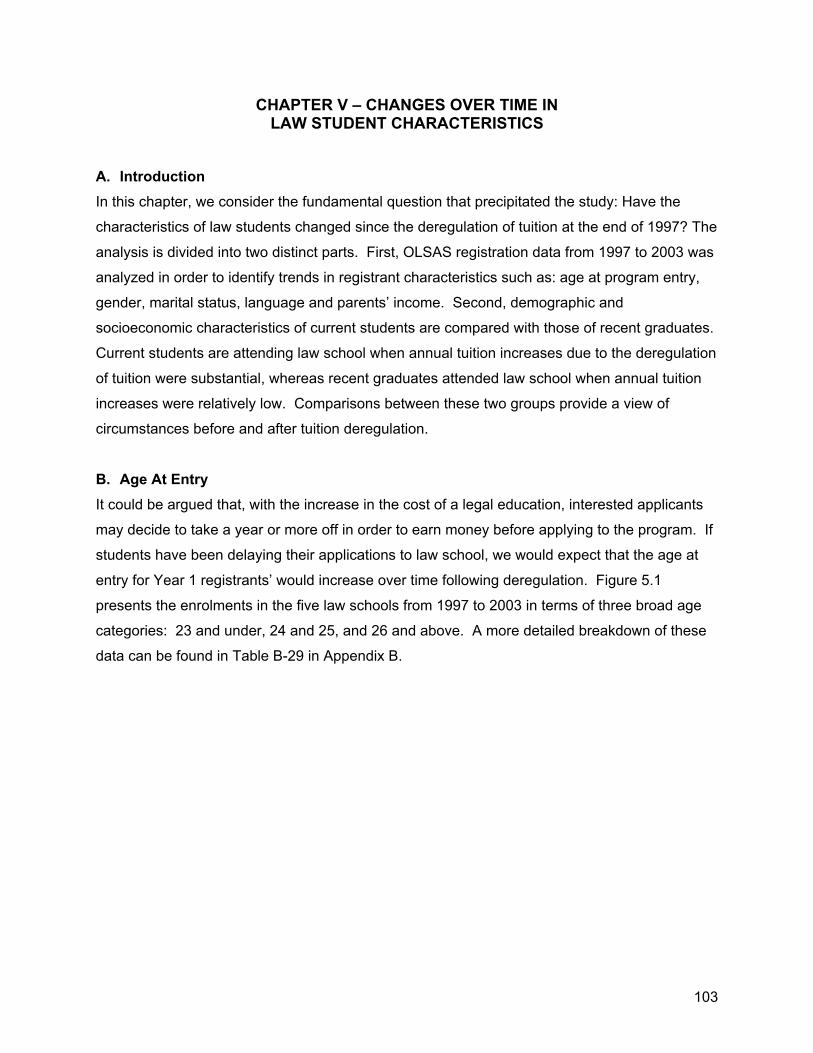
CHAPTER V – CHANGES OVER TIME IN LAW STUDENT CHARACTERISTICS
A. Introduction In this chapter, we consider the fundamental question that precipitated the study: Have the
characteristics of law students changed since the deregulation of tuition at the end of 1997? The
analysis is divided into two distinct parts. First, OLSAS registration data from 1997 to 2003 was
analyzed in order to identify trends in registrant characteristics such as: age at program entry,
gender, marital status, language and parents’ income. Second, demographic and
socioeconomic characteristics of current students are compared with those of recent graduates.
Current students are attending law school when annual tuition increases due to the deregulation
of tuition were substantial, whereas recent graduates attended law school when annual tuition
increases were relatively low. Comparisons between these two groups provide a view of
circumstances before and after tuition deregulation.
B. Age At Entry It could be argued that, with the increase in the cost of a legal education, interested applicants
may decide to take a year or more off in order to earn money before applying to the program. If
students have been delaying their applications to law school, we would expect that the age at
entry for Year 1 registrants’ would increase over time following deregulation. Figure 5.1
presents the enrolments in the five law schools from 1997 to 2003 in terms of three broad age
categories: 23 and under, 24 and 25, and 26 and above. A more detailed breakdown of these
data can be found in Table B-29 in Appendix B.
103
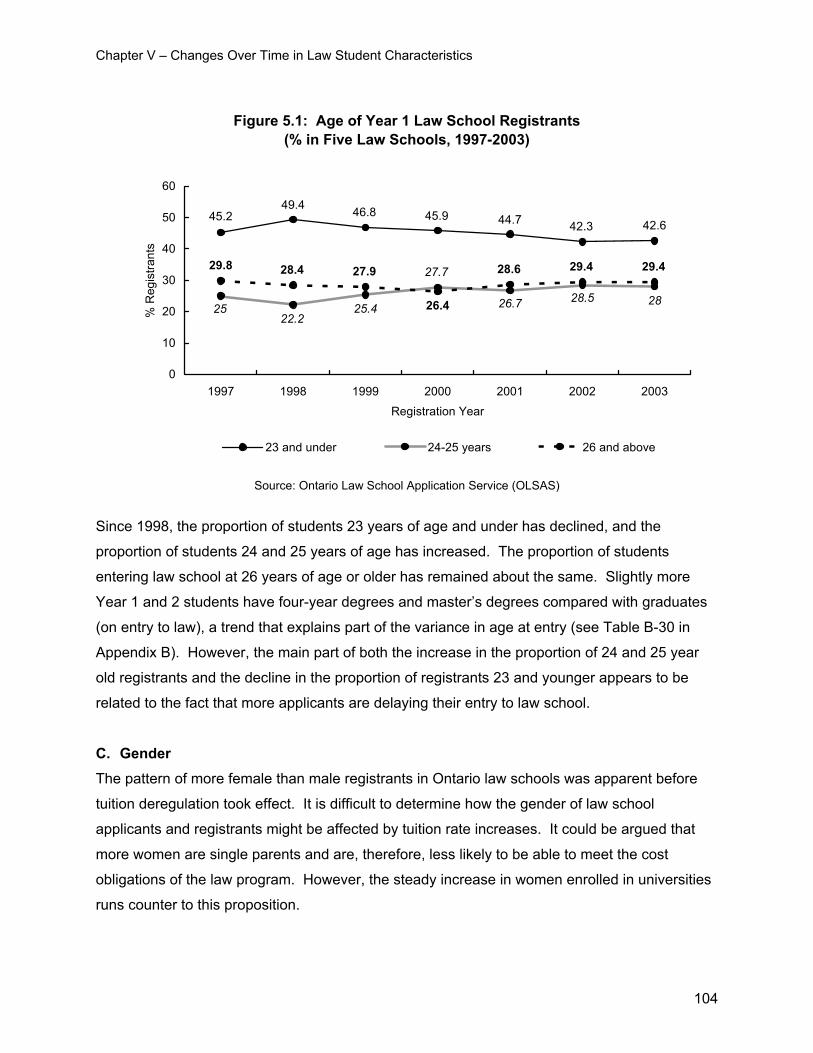
Chapter V – Changes Over Time in Law Student Characteristics
Figure 5.1: Age of Year 1 Law School Registrants (% in Five Law Schools, 1997-2003)
42.642.344.745.946.849.445.2
2828.526.7
27.7
25.422.2
25
29.429.428.6
26.4
27.928.429.8
0
10
20
30
40
50
60
1997 1998 1999 2000 2001 2002 2003
Registration Year
% R
egis
trant
s
23 and under 24-25 years 26 and above
Source: Ontario Law School Application Service (OLSAS)
Since 1998, the proportion of students 23 years of age and under has declined, and the
proportion of students 24 and 25 years of age has increased. The proportion of students
entering law school at 26 years of age or older has remained about the same. Slightly more
Year 1 and 2 students have four-year degrees and master’s degrees compared with graduates
(on entry to law), a trend that explains part of the variance in age at entry (see Table B-30 in
Appendix B). However, the main part of both the increase in the proportion of 24 and 25 year
old registrants and the decline in the proportion of registrants 23 and younger appears to be
related to the fact that more applicants are delaying their entry to law school.
C. Gender The pattern of more female than male registrants in Ontario law schools was apparent before
tuition deregulation took effect. It is difficult to determine how the gender of law school
applicants and registrants might be affected by tuition rate increases. It could be argued that
more women are single parents and are, therefore, less likely to be able to meet the cost
obligations of the law program. However, the steady increase in women enrolled in universities
runs counter to this proposition.
104
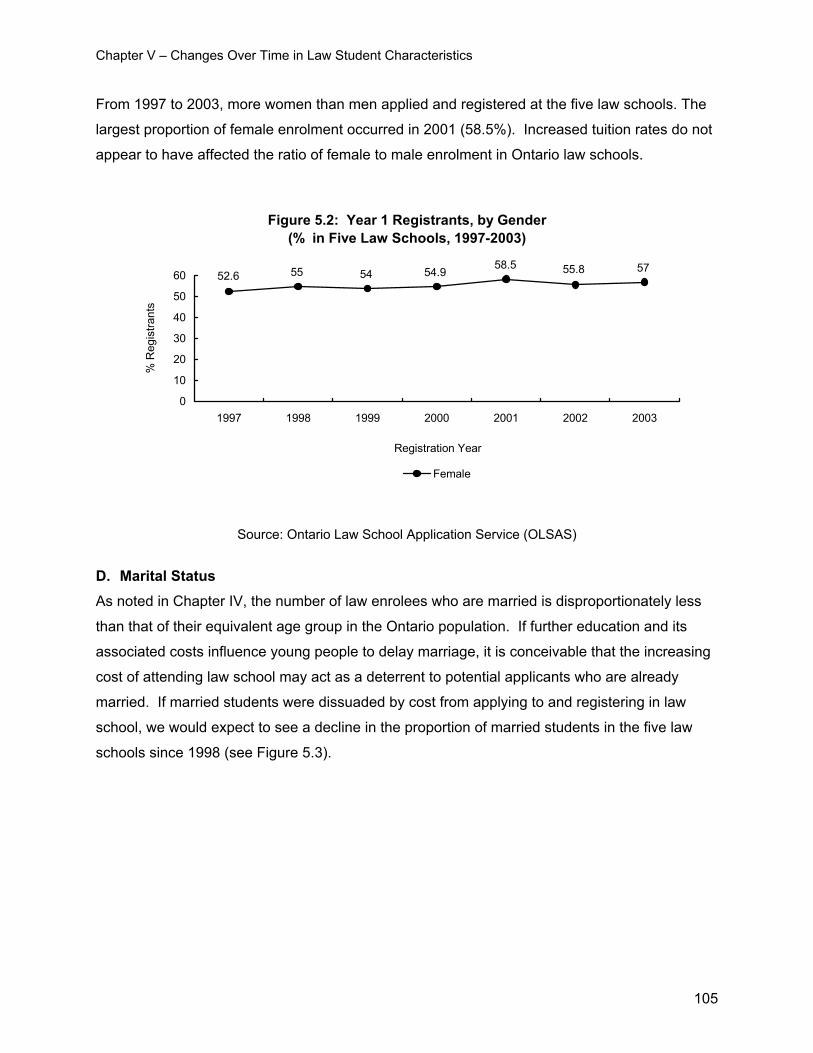
Chapter V – Changes Over Time in Law Student Characteristics
From 1997 to 2003, more women than men applied and registered at the five law schools. The
largest proportion of female enrolment occurred in 2001 (58.5%). Increased tuition rates do not
appear to have affected the ratio of female to male enrolment in Ontario law schools.
Figure 5.2: Year 1 Registrants, by Gender(% in Five Law Schools, 1997-2003)
5755.858.554.9545552.6
0
10
20
30
40
50
60
1997 1998 1999 2000 2001 2002 2003
Registration Year
% R
egis
trant
s
Female
Source: Ontario Law School Application Service (OLSAS)
D. Marital Status As noted in Chapter IV, the number of law enrolees who are married is disproportionately less
than that of their equivalent age group in the Ontario population. If further education and its
associated costs influence young people to delay marriage, it is conceivable that the increasing
cost of attending law school may act as a deterrent to potential applicants who are already
married. If married students were dissuaded by cost from applying to and registering in law
school, we would expect to see a decline in the proportion of married students in the five law
schools since 1998 (see Figure 5.3).
105
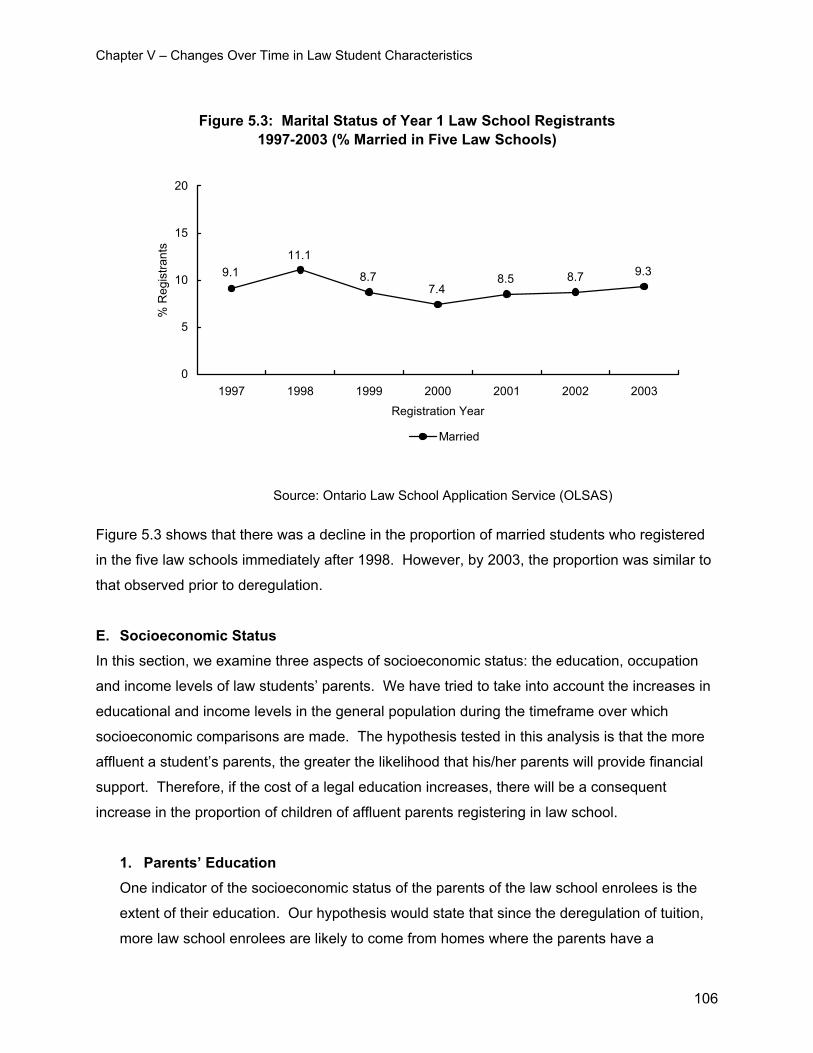
Chapter V – Changes Over Time in Law Student Characteristics
Figure 5.3: Marital Status of Year 1 Law School Registrants 1997-2003 (% Married in Five Law Schools)
9.38.78.57.4
8.7
11.19.1
0
5
10
15
20
1997 1998 1999 2000 2001 2002 2003
Registration Year
% R
egis
trant
s
Married
Source: Ontario Law School Application Service (OLSAS)
Figure 5.3 shows that there was a decline in the proportion of married students who registered in the five law schools immediately after 1998. However, by 2003, the proportion was similar to
that observed prior to deregulation.
E. Socioeconomic Status In this section, we examine three aspects of socioeconomic status: the education, occupation
and income levels of law students’ parents. We have tried to take into account the increases in
educational and income levels in the general population during the timeframe over which
socioeconomic comparisons are made. The hypothesis tested in this analysis is that the more
affluent a student’s parents, the greater the likelihood that his/her parents will provide financial
support. Therefore, if the cost of a legal education increases, there will be a consequent
increase in the proportion of children of affluent parents registering in law school.
1. Parents’ Education One indicator of the socioeconomic status of the parents of the law school enrolees is the
extent of their education. Our hypothesis would state that since the deregulation of tuition,
more law school enrolees are likely to come from homes where the parents have a
106
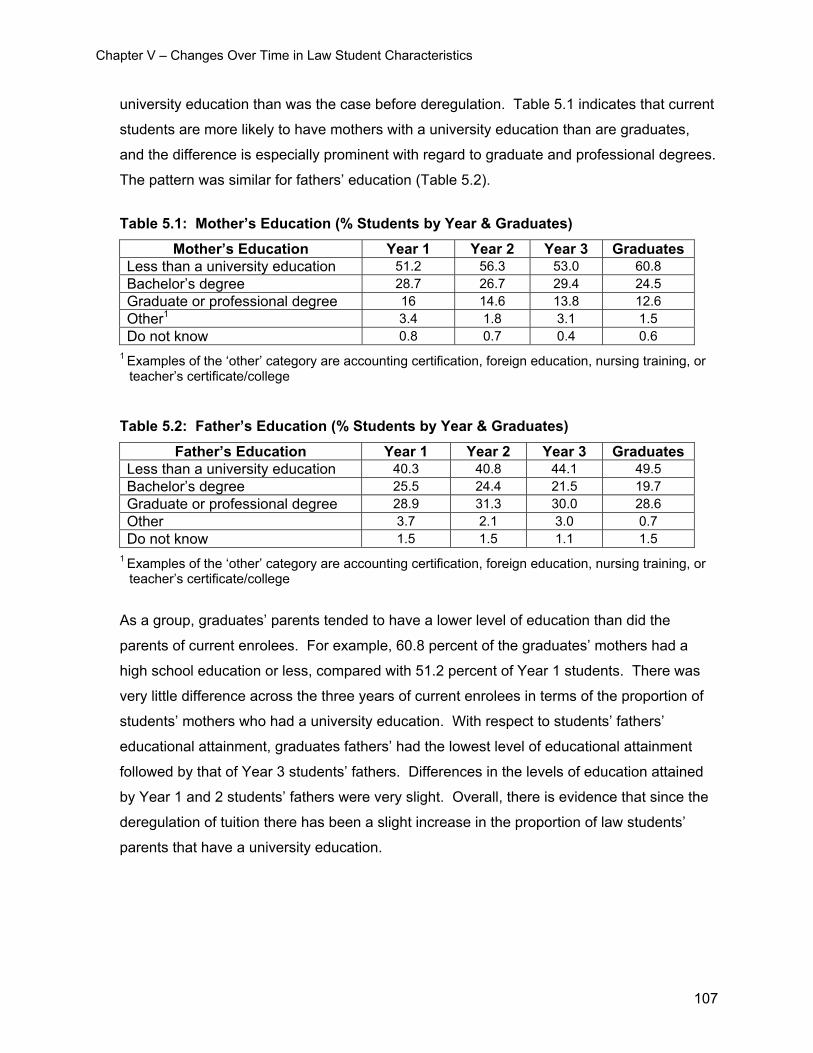
Chapter V – Changes Over Time in Law Student Characteristics
university education than was the case before deregulation. Table 5.1 indicates that current
students are more likely to have mothers with a university education than are graduates,
and the difference is especially prominent with regard to graduate and professional degrees.
The pattern was similar for fathers’ education (Table 5.2).
Table 5.1: Mother’s Education (% Students by Year & Graduates)
Mother’s Education Year 1 Year 2 Year 3 Graduates Less than a university education 51.2 56.3 53.0 60.8 Bachelor’s degree 28.7 26.7 29.4 24.5 Graduate or professional degree 16 14.6 13.8 12.6 Other1 3.4 1.8 3.1 1.5 Do not know 0.8 0.7 0.4 0.6
1 Examples of the ‘other’ category are accounting certification, foreign education, nursing training, or teacher’s certificate/college
Table 5.2: Father’s Education (% Students by Year & Graduates)
Father’s Education Year 1 Year 2 Year 3 Graduates Less than a university education 40.3 40.8 44.1 49.5 Bachelor’s degree 25.5 24.4 21.5 19.7 Graduate or professional degree 28.9 31.3 30.0 28.6 Other 3.7 2.1 3.0 0.7 Do not know 1.5 1.5 1.1 1.5
1 Examples of the ‘other’ category are accounting certification, foreign education, nursing training, or teacher’s certificate/college
As a group, graduates’ parents tended to have a lower level of education than did the
parents of current enrolees. For example, 60.8 percent of the graduates’ mothers had a
high school education or less, compared with 51.2 percent of Year 1 students. There was
very little difference across the three years of current enrolees in terms of the proportion of
students’ mothers who had a university education. With respect to students’ fathers’
educational attainment, graduates fathers’ had the lowest level of educational attainment
followed by that of Year 3 students’ fathers. Differences in the levels of education attained
by Year 1 and 2 students’ fathers were very slight. Overall, there is evidence that since the
deregulation of tuition there has been a slight increase in the proportion of law students’
parents that have a university education.
107
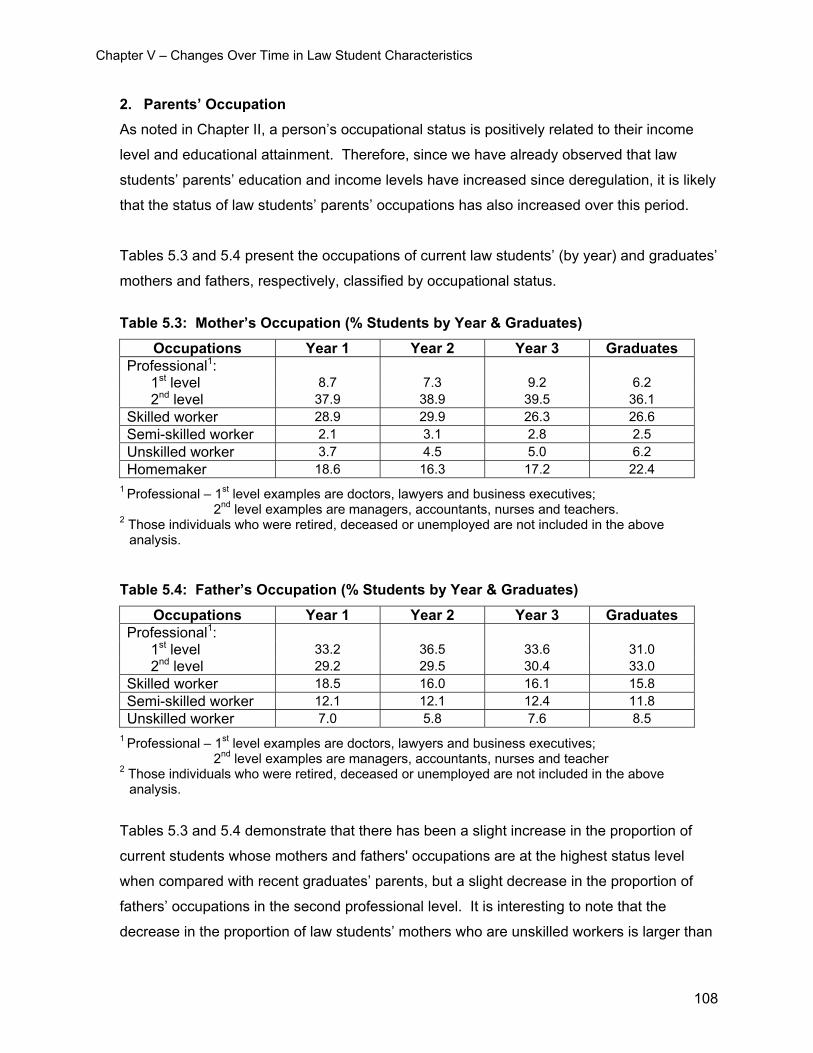
Chapter V – Changes Over Time in Law Student Characteristics
2. Parents’ Occupation As noted in Chapter II, a person’s occupational status is positively related to their income
level and educational attainment. Therefore, since we have already observed that law
students’ parents’ education and income levels have increased since deregulation, it is likely
that the status of law students’ parents’ occupations has also increased over this period.
Tables 5.3 and 5.4 present the occupations of current law students’ (by year) and graduates’
mothers and fathers, respectively, classified by occupational status.
Table 5.3: Mother’s Occupation (% Students by Year & Graduates)
Occupations Year 1 Year 2 Year 3 Graduates Professional1: 1st level 8.7 7.3 9.2 6.2 2nd level 37.9 38.9 39.5 36.1 Skilled worker 28.9 29.9 26.3 26.6 Semi-skilled worker 2.1 3.1 2.8 2.5 Unskilled worker 3.7 4.5 5.0 6.2 Homemaker 18.6 16.3 17.2 22.4
1 Professional – 1st level examples are doctors, lawyers and business executives; 2nd level examples are managers, accountants, nurses and teachers.
2 Those individuals who were retired, deceased or unemployed are not included in the above analysis.
Table 5.4: Father’s Occupation (% Students by Year & Graduates)
Occupations Year 1 Year 2 Year 3 Graduates Professional1: 1st level 33.2 36.5 33.6 31.0 2nd level 29.2 29.5 30.4 33.0 Skilled worker 18.5 16.0 16.1 15.8 Semi-skilled worker 12.1 12.1 12.4 11.8 Unskilled worker 7.0 5.8 7.6 8.5
1 Professional – 1st level examples are doctors, lawyers and business executives; 2nd level examples are managers, accountants, nurses and teacher
2 Those individuals who were retired, deceased or unemployed are not included in the above analysis.
Tables 5.3 and 5.4 demonstrate that there has been a slight increase in the proportion of
current students whose mothers and fathers' occupations are at the highest status level
when compared with recent graduates’ parents, but a slight decrease in the proportion of
fathers’ occupations in the second professional level. It is interesting to note that the
decrease in the proportion of law students’ mothers who are unskilled workers is larger than
108
Chapter V – Changes Over Time in Law Student Characteristics
the decrease observed for their fathers. In addition, the proportion of law students’ mothers
who are homemakers has decreased. Overall, there has been a very slight increase in the
occupational status of the parents of law school students.
3. Parents’ Income A general impression held by some law school faculty and supported by some research is
that students from middle-income homes are more likely to be affected by tuition increases
than students from higher- or lower-income homes because more affluent parents have
income levels that are too high to allow their children to qualify for bursaries and government
loans, and lower-income parents are not wealthy enough to provide their children with
funding sufficient to cover their law school costs.
the costs of higher education have certainly increased and in part these costs have been shifted onto students, as reflected in much higher levels of borrowing and the decline in university participation rates of those from middle income families. (Corak et al., 2003)
The consensus seems to be, however, that students from lower-income families will be the
most significantly affected by law school tuition increases. Figure 5.4 presents the average
family income of first year law registrants in the five law schools from 1997 to 2003. The
quintiles used for the analysis were derived from average family income data compiled by
Statistics Canada. The procedure by which the average family income of law school
registrants was assigned and then matched with Statistics Canada data for Canadian
families is described in detail in Chapter IV, Section 5b.
109
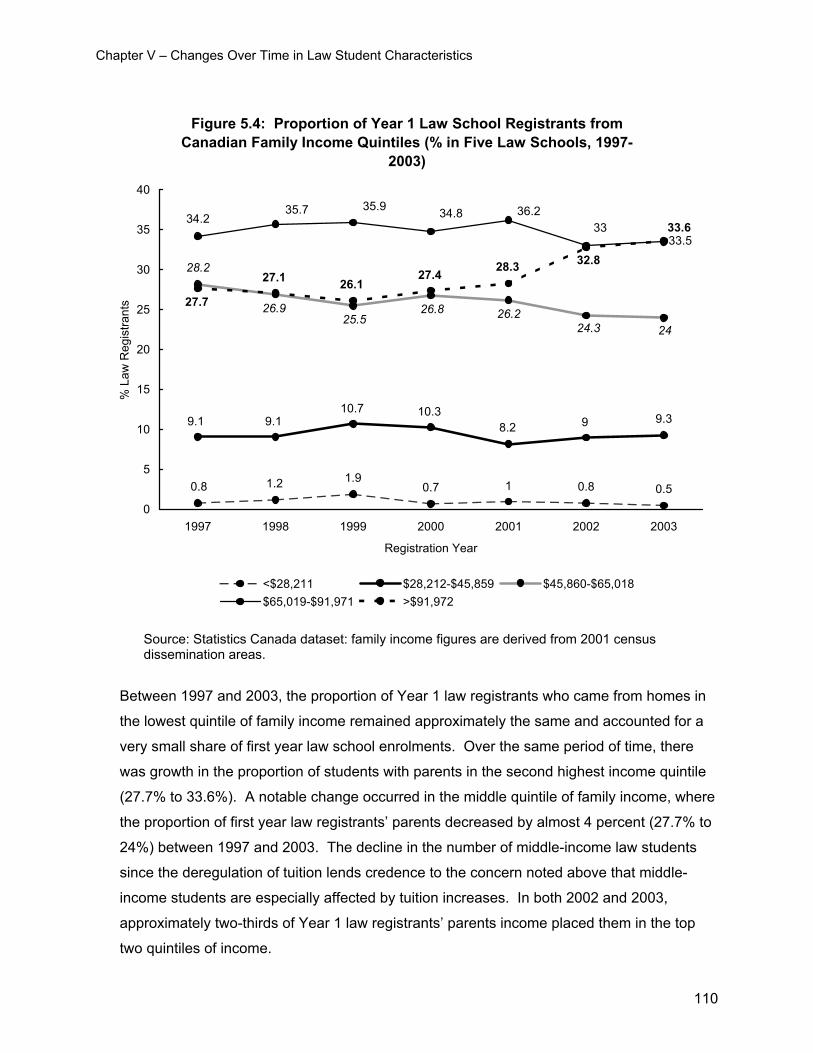
Chapter V – Changes Over Time in Law Student Characteristics
Figure 5.4: Proportion of Year 1 Law School Registrants from Canadian Family Income Quintiles (% in Five Law Schools, 1997-
2003)
0.8 1.2 1.90.7 1 0.8 0.5
9.39.1 9.110.7 10.3
8.2 9
2425.5
26.9
28.2
26.8 26.224.3
3333.5
34.8 36.235.935.734.2
27.1 26.127.7
27.4 28.3 32.8
33.6
0
5
10
15
20
25
30
35
40
1997 1998 1999 2000 2001 2002 2003
Registration Year
% L
aw R
egis
trant
s
<$28,211 $28,212-$45,859 $45,860-$65,018$65,019-$91,971 >$91,972
Source: Statistics Canada dataset: family income figures are derived from 2001 census dissemination areas.
Between 1997 and 2003, the proportion of Year 1 law registrants who came from homes in
the lowest quintile of family income remained approximately the same and accounted for a
very small share of first year law school enrolments. Over the same period of time, there
was growth in the proportion of students with parents in the second highest income quintile
(27.7% to 33.6%). A notable change occurred in the middle quintile of family income, where
the proportion of first year law registrants’ parents decreased by almost 4 percent (27.7% to
24%) between 1997 and 2003. The decline in the number of middle-income law students
since the deregulation of tuition lends credence to the concern noted above that middle-
income students are especially affected by tuition increases. In both 2002 and 2003,
approximately two-thirds of Year 1 law registrants’ parents income placed them in the top
two quintiles of income.
110
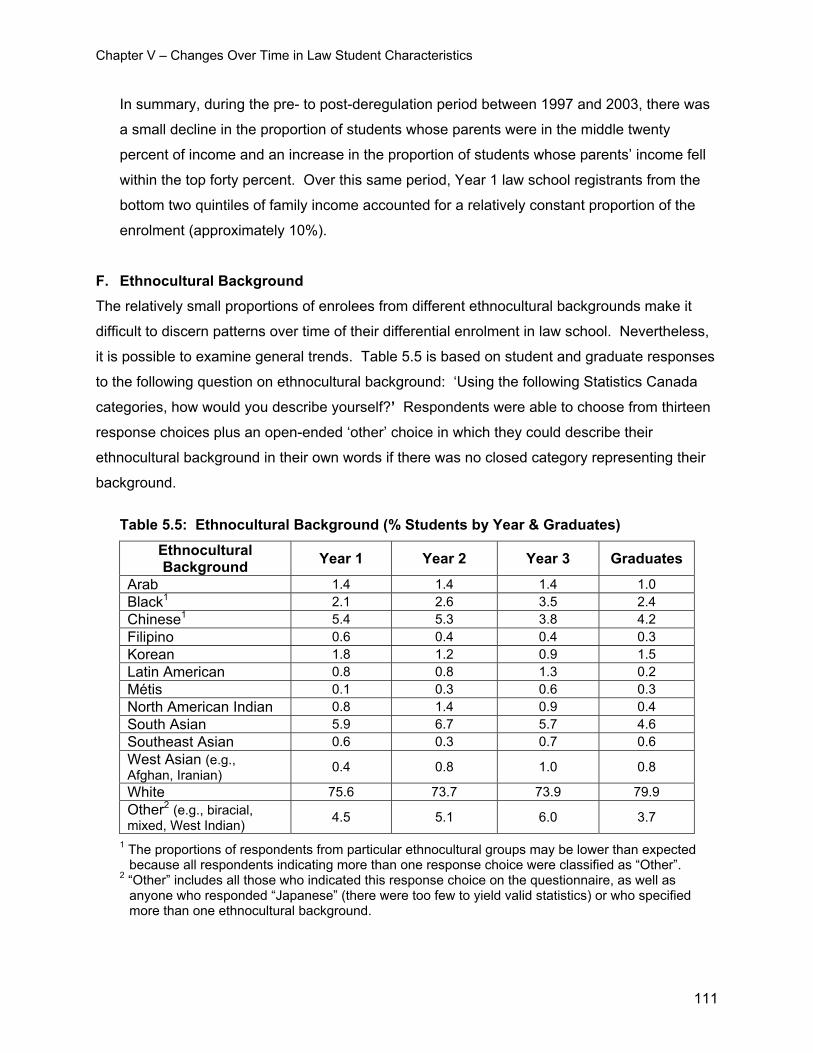
Chapter V – Changes Over Time in Law Student Characteristics
In summary, during the pre- to post-deregulation period between 1997 and 2003, there was
a small decline in the proportion of students whose parents were in the middle twenty
percent of income and an increase in the proportion of students whose parents’ income fell
within the top forty percent. Over this same period, Year 1 law school registrants from the
bottom two quintiles of family income accounted for a relatively constant proportion of the
enrolment (approximately 10%).
F. Ethnocultural Background The relatively small proportions of enrolees from different ethnocultural backgrounds make it
difficult to discern patterns over time of their differential enrolment in law school. Nevertheless,
it is possible to examine general trends. Table 5.5 is based on student and graduate responses
to the following question on ethnocultural background: ‘Using the following Statistics Canada
categories, how would you describe yourself?’ Respondents were able to choose from thirteen
response choices plus an open-ended ‘other’ choice in which they could describe their
ethnocultural background in their own words if there was no closed category representing their
background.
Table 5.5: Ethnocultural Background (% Students by Year & Graduates)
Ethnocultural Background Year 1 Year 2 Year 3 Graduates
Arab 1.4 1.4 1.4 1.0 Black1 2.1 2.6 3.5 2.4 Chinese1 5.4 5.3 3.8 4.2 Filipino 0.6 0.4 0.4 0.3 Korean 1.8 1.2 0.9 1.5 Latin American 0.8 0.8 1.3 0.2 Métis 0.1 0.3 0.6 0.3 North American Indian 0.8 1.4 0.9 0.4 South Asian 5.9 6.7 5.7 4.6 Southeast Asian 0.6 0.3 0.7 0.6 West Asian (e.g., Afghan, Iranian) 0.4 0.8 1.0 0.8
White 75.6 73.7 73.9 79.9 Other2 (e.g., biracial, mixed, West Indian) 4.5 5.1 6.0 3.7
1 The proportions of respondents from particular ethnocultural groups may be lower than expected because all respondents indicating more than one response choice were classified as “Other”.
2 “Other” includes all those who indicated this response choice on the questionnaire, as well as anyone who responded “Japanese” (there were too few to yield valid statistics) or who specified more than one ethnocultural background.
111
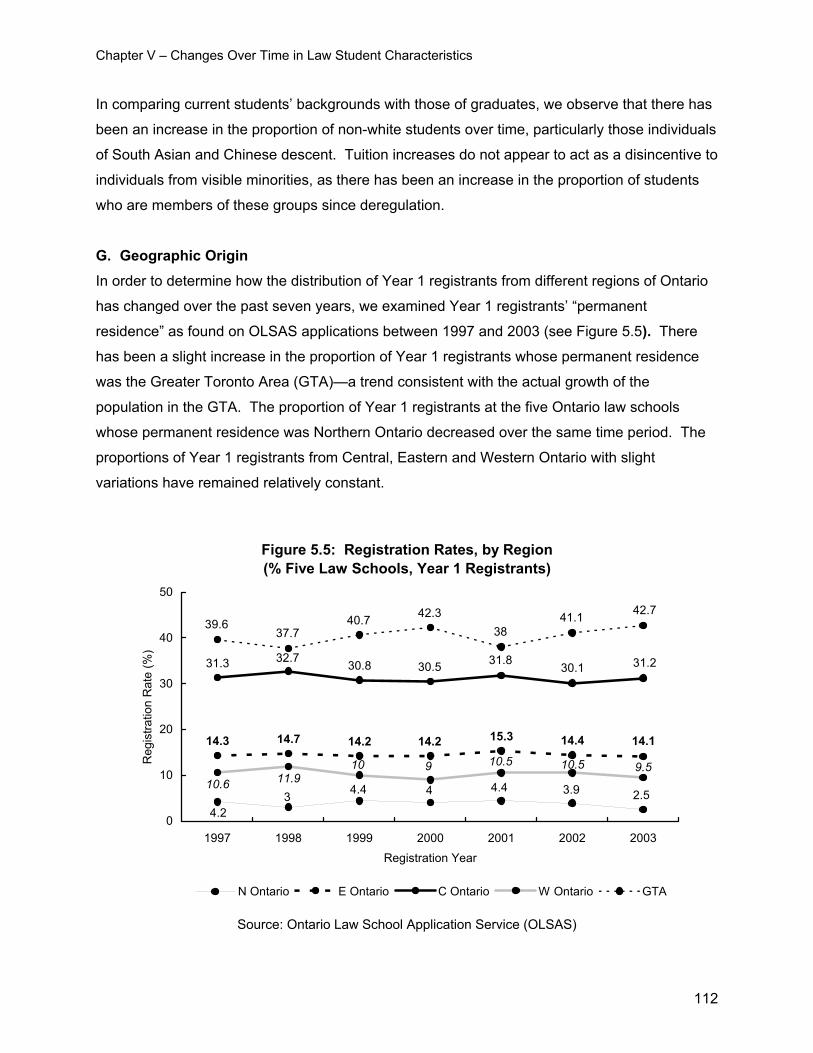
Chapter V – Changes Over Time in Law Student Characteristics
In comparing current students’ backgrounds with those of graduates, we observe that there has
been an increase in the proportion of non-white students over time, particularly those individuals
of South Asian and Chinese descent. Tuition increases do not appear to act as a disincentive to
individuals from visible minorities, as there has been an increase in the proportion of students
who are members of these groups since deregulation.
G. Geographic Origin In order to determine how the distribution of Year 1 registrants from different regions of Ontario
has changed over the past seven years, we examined Year 1 registrants’ “permanent
residence” as found on OLSAS applications between 1997 and 2003 (see Figure 5.5). There
has been a slight increase in the proportion of Year 1 registrants whose permanent residence
was the Greater Toronto Area (GTA)—a trend consistent with the actual growth of the
population in the GTA. The proportion of Year 1 registrants at the five Ontario law schools
whose permanent residence was Northern Ontario decreased over the same time period. The
proportions of Year 1 registrants from Central, Eastern and Western Ontario with slight
variations have remained relatively constant.
Figure 5.5: Registration Rates, by Region (% Five Law Schools, Year 1 Registrants)
4.23 4.4 4 4.4 3.9 2.5
14.3 14.7 14.2 14.2 15.3 14.4 14.1
31.3 32.7 30.8 30.5 31.8 30.1 31.2
10.610
11.99 10.5 10.5 9.5
39.637.7
40.7 42.338
41.1 42.7
0
10
20
30
40
50
1997 1998 1999 2000 2001 2002 2003
Registration Year
Reg
istra
tion
Rat
e (%
)
N Ontario E Ontario C Ontario W Ontario GTA
Source: Ontario Law School Application Service (OLSAS)
112
Chapter V – Changes Over Time in Law Student Characteristics
The trends observed for the GTA and Northern Ontario regions support the contention that the
further an individual lives from a university or educational institution, the less likely he or she is
to attend that institution and vice versa (Frenette, 2002). Students who live close to a law
school have the option of living at home to decrease the cost of their legal studies while those
who are from more remote regions do not. As tuition rates increase and law school becomes
more costly, it is not unexpected that fewer individuals from Northern Ontario feel able to pursue
a legal education.
H. Language As noted in Chapter IV (Section B, Part 4), current students whose first language is French are
enrolled in the five law schools in similar proportions to their numbers in Ontario society. It is
important to note that an analysis of the Year 1 enrolment of law students by first language does
not necessarily reflect registration in English and French Bachelor of Laws programs. Many
students whose first language is French register in English undergraduate law programs, while
a number of English-speaking students and those who primarily speak other languages register
in the French Common Law program (see Table B-28 in Appendix B). Figure 5.6 indicates that
there has been a slight decline in the proportion of Year 1 registrants whose first language is
French over the past seven years. It is interesting that in 2002 the proportion of English-
speaking students increased, while the proportions of French-speaking students and those
whose first language is neither English nor French declined.
113
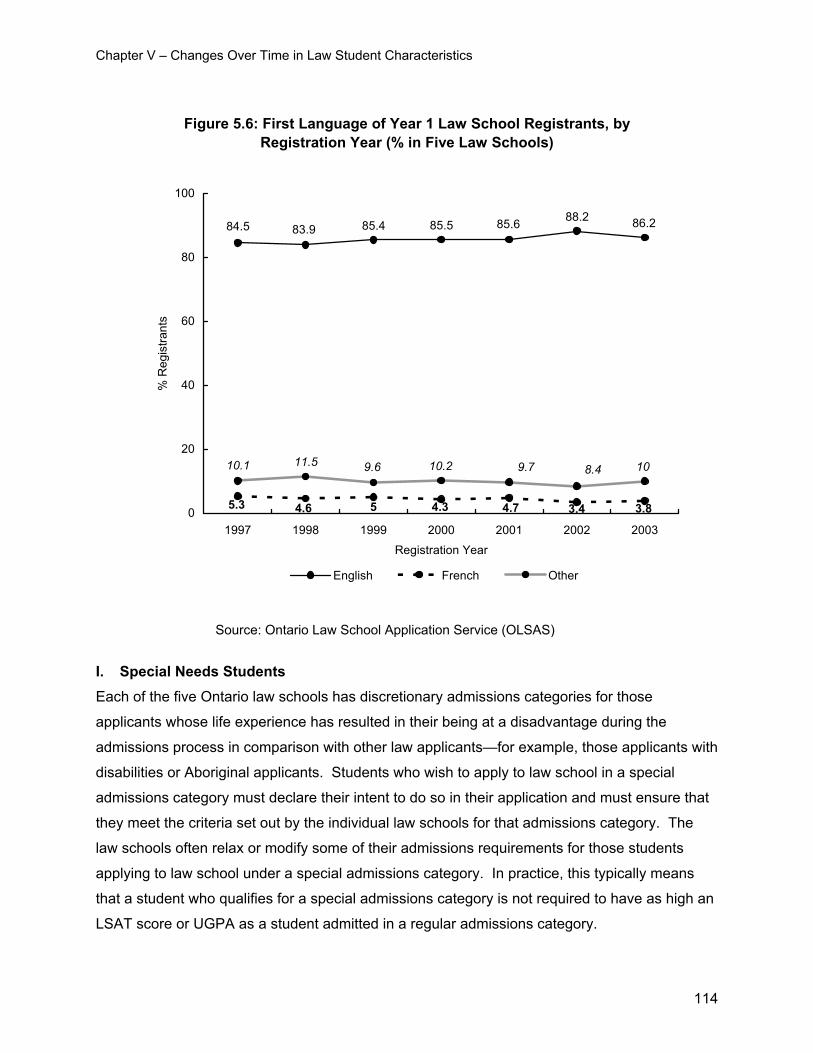
Chapter V – Changes Over Time in Law Student Characteristics
Figure 5.6: First Language of Year 1 Law School Registrants, by Registration Year (% in Five Law Schools)
86.284.5 83.9 85.4 85.5 85.6 88.2
3.85.3 4.6 5 4.3 4.7 3.4
1010.1 11.5 9.6 10.2 9.7 8.4
0
20
40
60
80
100
1997 1998 1999 2000 2001 2002 2003
Registration Year
% R
egis
trant
s
English French Other
Source: Ontario Law School Application Service (OLSAS)
I. Special Needs Students Each of the five Ontario law schools has discretionary admissions categories for those
applicants whose life experience has resulted in their being at a disadvantage during the
admissions process in comparison with other law applicants—for example, those applicants with
disabilities or Aboriginal applicants. Students who wish to apply to law school in a special
admissions category must declare their intent to do so in their application and must ensure that
they meet the criteria set out by the individual law schools for that admissions category. The
law schools often relax or modify some of their admissions requirements for those students
applying to law school under a special admissions category. In practice, this typically means
that a student who qualifies for a special admissions category is not required to have as high an
LSAT score or UGPA as a student admitted in a regular admissions category.
114
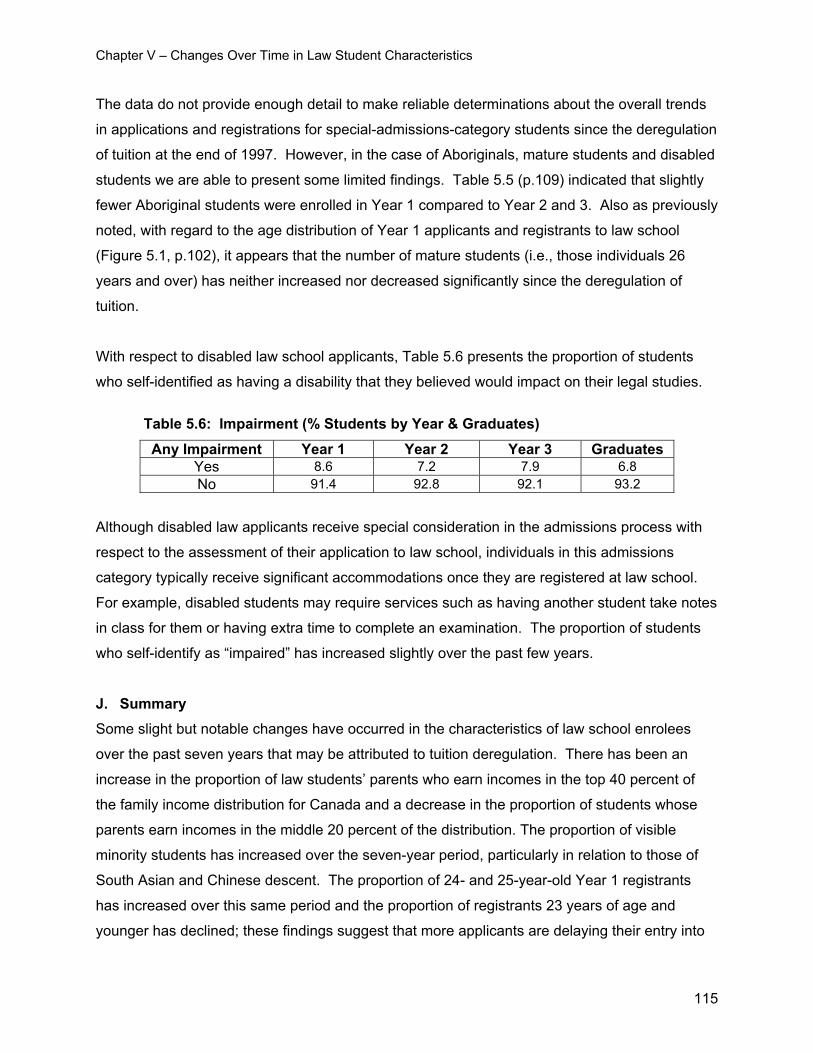
Chapter V – Changes Over Time in Law Student Characteristics
The data do not provide enough detail to make reliable determinations about the overall trends
in applications and registrations for special-admissions-category students since the deregulation
of tuition at the end of 1997. However, in the case of Aboriginals, mature students and disabled
students we are able to present some limited findings. Table 5.5 (p.109) indicated that slightly
fewer Aboriginal students were enrolled in Year 1 compared to Year 2 and 3. Also as previously
noted, with regard to the age distribution of Year 1 applicants and registrants to law school
(Figure 5.1, p.102), it appears that the number of mature students (i.e., those individuals 26
years and over) has neither increased nor decreased significantly since the deregulation of
tuition.
With respect to disabled law school applicants, Table 5.6 presents the proportion of students
who self-identified as having a disability that they believed would impact on their legal studies.
Table 5.6: Impairment (% Students by Year & Graduates)
Any Impairment Year 1 Year 2 Year 3 Graduates Yes 8.6 7.2 7.9 6.8 No 91.4 92.8 92.1 93.2
Although disabled law applicants receive special consideration in the admissions process with
respect to the assessment of their application to law school, individuals in this admissions
category typically receive significant accommodations once they are registered at law school.
For example, disabled students may require services such as having another student take notes
in class for them or having extra time to complete an examination. The proportion of students
who self-identify as “impaired” has increased slightly over the past few years.
J. Summary Some slight but notable changes have occurred in the characteristics of law school enrolees
over the past seven years that may be attributed to tuition deregulation. There has been an
increase in the proportion of law students’ parents who earn incomes in the top 40 percent of
the family income distribution for Canada and a decrease in the proportion of students whose
parents earn incomes in the middle 20 percent of the distribution. The proportion of visible
minority students has increased over the seven-year period, particularly in relation to those of
South Asian and Chinese descent. The proportion of 24- and 25-year-old Year 1 registrants
has increased over this same period and the proportion of registrants 23 years of age and
younger has declined; these findings suggest that more applicants are delaying their entry into
115

Chapter V – Changes Over Time in Law Student Characteristics
116
law school. The proportion of Year 1 students whose first language is French has declined
slightly since 1997. Also of note is the fact that the already small proportion of students who
come from Northern Ontario has declined since the deregulation of tuition, which may indicate
that law school is becoming even less accessible to such students.
CHAPTER VI – DEBT AND IMPACT OF DEBT
A. Introduction In the previous chapter, we attempted to determine whether any changes had occurred in the
demographic characteristics of students enrolled in the five law schools that might be attributed
to an increase in law school tuition since deregulation. Some changes were noted, but, overall,
the characteristics of law school registrants have changed little since the deregulation of tuition.
However, this does not mean that the debt load of some law students has not increased with
consequent, negative impact on their lives. In this chapter, we examine student and graduate
debt in detail including debt at entry to and exit from the program, the characteristics of students
and graduates in debt, sources of student funding and the impact of debt on students’ personal
and professional lives.
B. Debt 1. Debt at Entry to Law School In this section, we focus on how much debt law students had at entry to their law program,
and how the debt at entry of Year 1 law registrants has changed since tuition deregulation.
If the cost of attending law school is increasingly viewed as prohibitive by some students, we
would expect to find that those students who enrol in law school have incurred less debt
during their undergraduate years than did Year 1 law registrants in the past. In addition, if
the debt load of graduating bachelor’s degree students were greater than the debt load of
entering law students, this finding would suggest that those with high debt following the
completion of their bachelor’s degree would be less likely to register in law schools.
Table 6.1 presents students’ and graduates’ median debt on entering law school, as well as
the proportion of law students who entered with no debt. As in our previous analyses, data
on current students are used to represent the post-tuition deregulation period and recent law
graduates from 2000 to 2003, the period prior to substantial tuition increases.
The Statistics Canada report on the 2000 National Graduate Survey (NGS) provides the
most current and comprehensive figures on undergraduate university student debt in
Canada (Allen & Vaillancourt, 2004). We compared student debt for bachelor’s degree
graduates (as obtained from the 2000 NGS) with student debt at entry as reported in our
survey of law school students and graduates (Table 6.1).
117
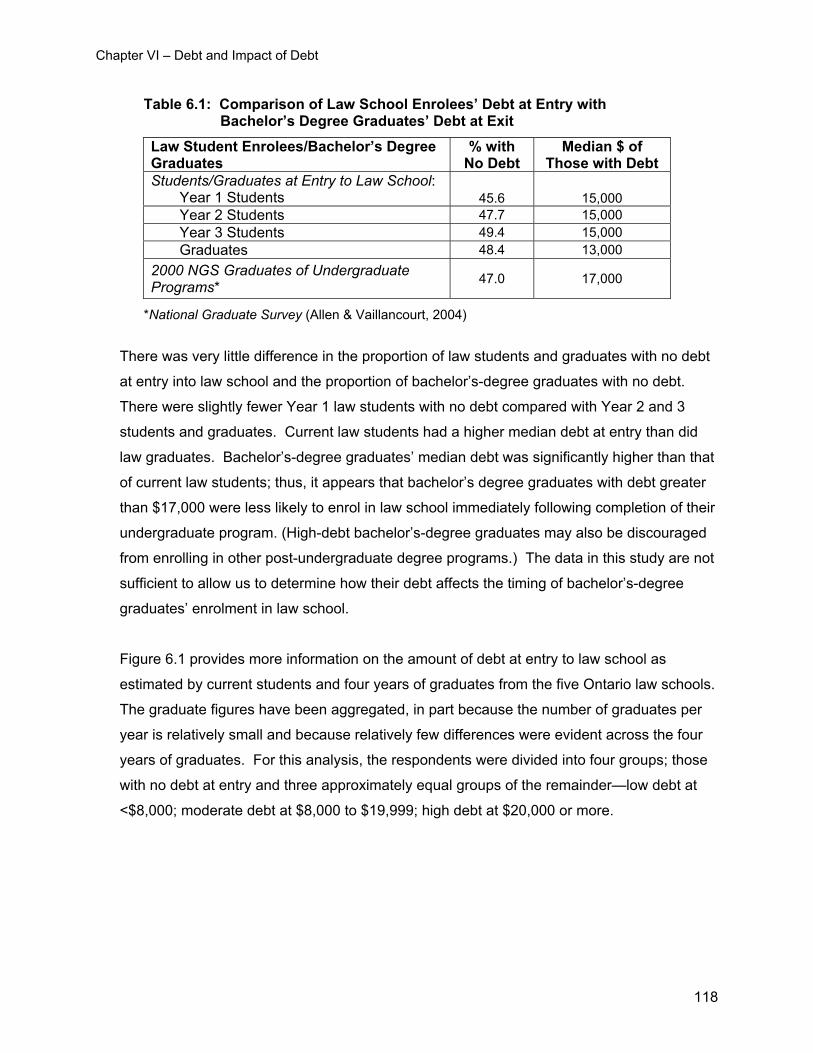
Chapter VI – Debt and Impact of Debt
Table 6.1: Comparison of Law School Enrolees’ Debt at Entry with Bachelor’s Degree Graduates’ Debt at Exit
Law Student Enrolees/Bachelor’s Degree Graduates
% with No Debt
Median $ of Those with Debt
Students/Graduates at Entry to Law School: Year 1 Students 45.6 15,000 Year 2 Students 47.7 15,000 Year 3 Students 49.4 15,000 Graduates 48.4 13,000 2000 NGS Graduates of Undergraduate Programs* 47.0 17,000
*National Graduate Survey (Allen & Vaillancourt, 2004)
There was very little difference in the proportion of law students and graduates with no debt
at entry into law school and the proportion of bachelor’s-degree graduates with no debt.
There were slightly fewer Year 1 law students with no debt compared with Year 2 and 3
students and graduates. Current law students had a higher median debt at entry than did
law graduates. Bachelor’s-degree graduates’ median debt was significantly higher than that
of current law students; thus, it appears that bachelor’s degree graduates with debt greater
than $17,000 were less likely to enrol in law school immediately following completion of their
undergraduate program. (High-debt bachelor’s-degree graduates may also be discouraged
from enrolling in other post-undergraduate degree programs.) The data in this study are not
sufficient to allow us to determine how their debt affects the timing of bachelor’s-degree
graduates’ enrolment in law school.
Figure 6.1 provides more information on the amount of debt at entry to law school as
estimated by current students and four years of graduates from the five Ontario law schools.
The graduate figures have been aggregated, in part because the number of graduates per
year is relatively small and because relatively few differences were evident across the four
years of graduates. For this analysis, the respondents were divided into four groups; those
with no debt at entry and three approximately equal groups of the remainder—low debt at
<$8,000; moderate debt at $8,000 to $19,999; high debt at $20,000 or more.
118
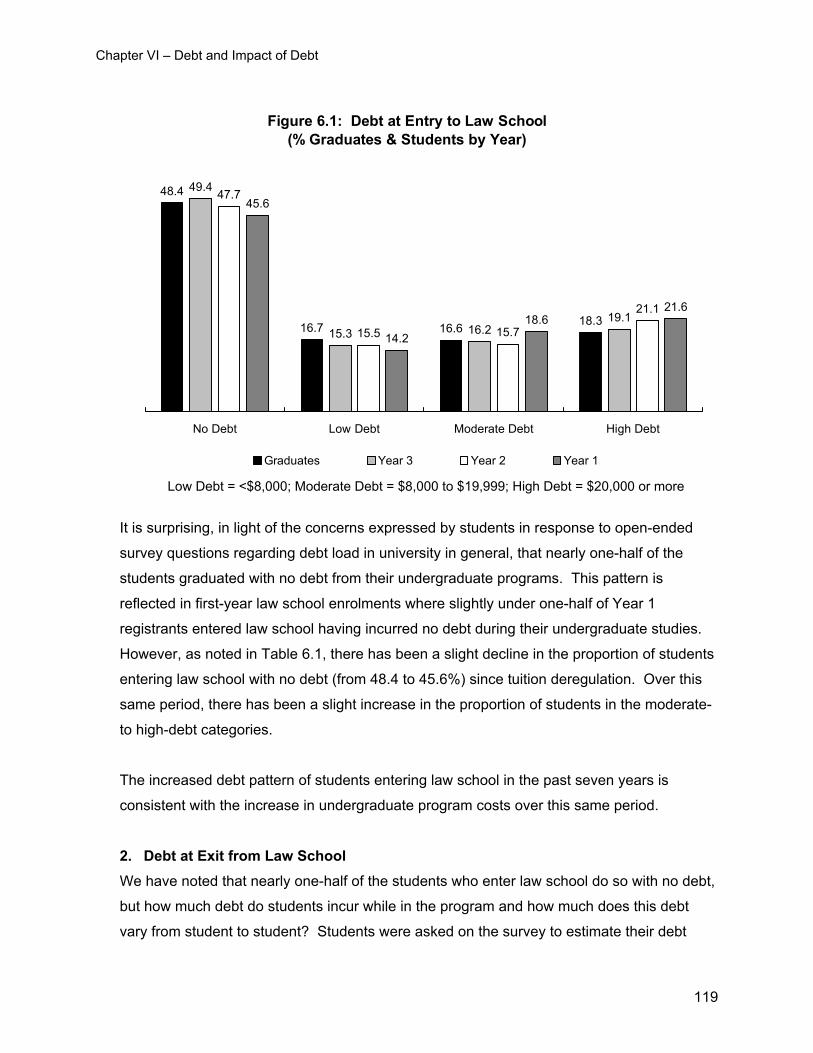
Chapter VI – Debt and Impact of Debt
Figure 6.1: Debt at Entry to Law School (% Graduates & Students by Year)
48.4
16.7 16.6 18.3
49.4
15.3 16.219.1
47.7
15.5 15.7
21.1
45.6
14.218.6
21.6
No Debt Low Debt Moderate Debt High Debt
Graduates Year 3 Year 2 Year 1
Low Debt = <$8,000; Moderate Debt = $8,000 to $19,999; High Debt = $20,000 or more
It is surprising, in light of the concerns expressed by students in response to open-ended
survey questions regarding debt load in university in general, that nearly one-half of the
students graduated with no debt from their undergraduate programs. This pattern is
reflected in first-year law school enrolments where slightly under one-half of Year 1
registrants entered law school having incurred no debt during their undergraduate studies.
However, as noted in Table 6.1, there has been a slight decline in the proportion of students
entering law school with no debt (from 48.4 to 45.6%) since tuition deregulation. Over this
same period, there has been a slight increase in the proportion of students in the moderate-
to high-debt categories.
The increased debt pattern of students entering law school in the past seven years is
consistent with the increase in undergraduate program costs over this same period.
2. Debt at Exit from Law School We have noted that nearly one-half of the students who enter law school do so with no debt,
but how much debt do students incur while in the program and how much does this debt
vary from student to student? Students were asked on the survey to estimate their debt
119
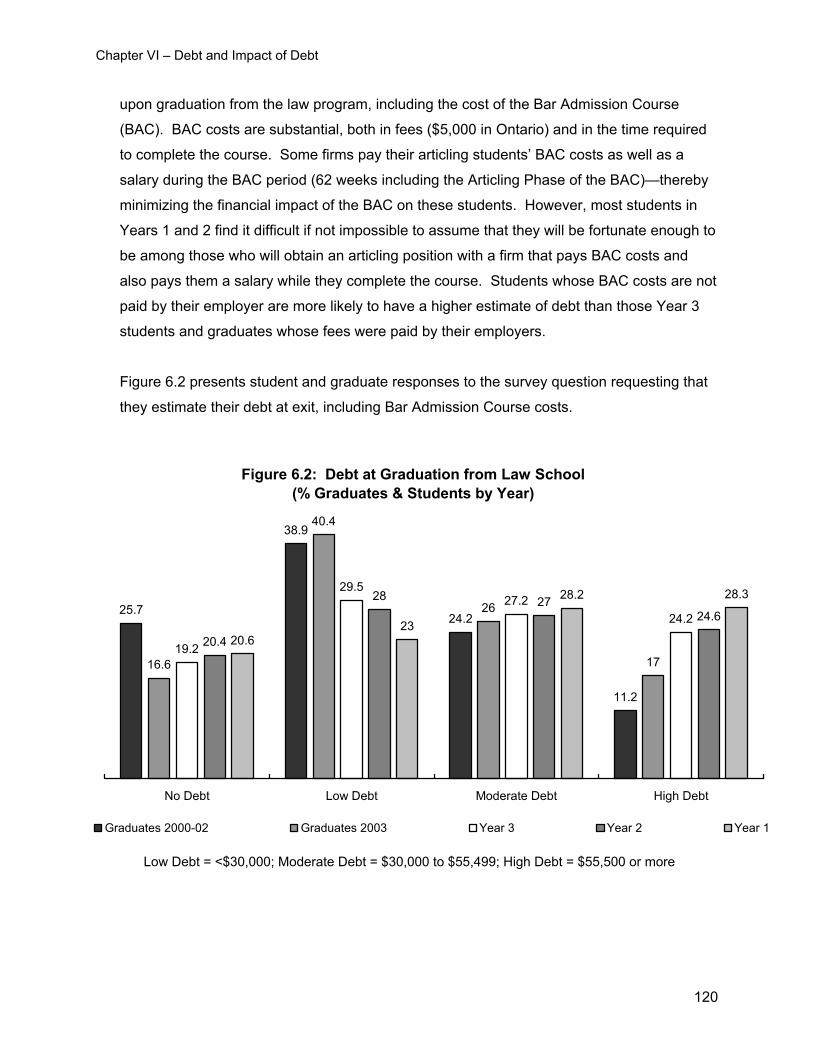
Chapter VI – Debt and Impact of Debt
upon graduation from the law program, including the cost of the Bar Admission Course
(BAC). BAC costs are substantial, both in fees ($5,000 in Ontario) and in the time required
to complete the course. Some firms pay their articling students’ BAC costs as well as a
salary during the BAC period (62 weeks including the Articling Phase of the BAC)—thereby
minimizing the financial impact of the BAC on these students. However, most students in
Years 1 and 2 find it difficult if not impossible to assume that they will be fortunate enough to
be among those who will obtain an articling position with a firm that pays BAC costs and
also pays them a salary while they complete the course. Students whose BAC costs are not
paid by their employer are more likely to have a higher estimate of debt than those Year 3
students and graduates whose fees were paid by their employers.
Figure 6.2 presents student and graduate responses to the survey question requesting that
they estimate their debt at exit, including Bar Admission Course costs.
Figure 6.2: Debt at Graduation from Law School (% Graduates & Students by Year)
25.7
38.9
24.2
11.2
16.6
40.4
26
1719.2
29.527.2
24.2
20.4
28 2724.6
20.623
28.2 28.3
No Debt Low Debt Moderate Debt High Debt
Graduates 2000-02 Graduates 2003 Year 3 Year 2 Year 1
Low Debt = <$30,000; Moderate Debt = $30,000 to $55,499; High Debt = $55,500 or more
120
Chapter VI – Debt and Impact of Debt
The proportion of current students projecting moderate and high debt at exit is greatest for
Year 1 students. About the same proportion of students projected that they would have no
debt at the end of their law school experience for each of the three years (about 20% per
year). Only 16.6 percent of the articling graduates (from the most recent graduating class)
reported that they had had no debt at exit compared with over one-quarter of the three years
of graduates more than one year beyond graduation. It is difficult to estimate the
significance of the firm-paid BAC costs on debt at exit figures, but it is useful to note the
differences in debt between current students and all four years of graduates. Graduates’
reports of their actual debt at program completion are much lower than current students’
estimates of debt at exit.
Figure 6.3 is designed to illustrate the change in the amount of debt incurred by students
and graduates from entry to exit from the program. To produce a debt estimate for each
student and graduate, the debt at entry was subtracted from projected or actual debt at exit.
The amount of debt is divided into $10,000 increments.
121
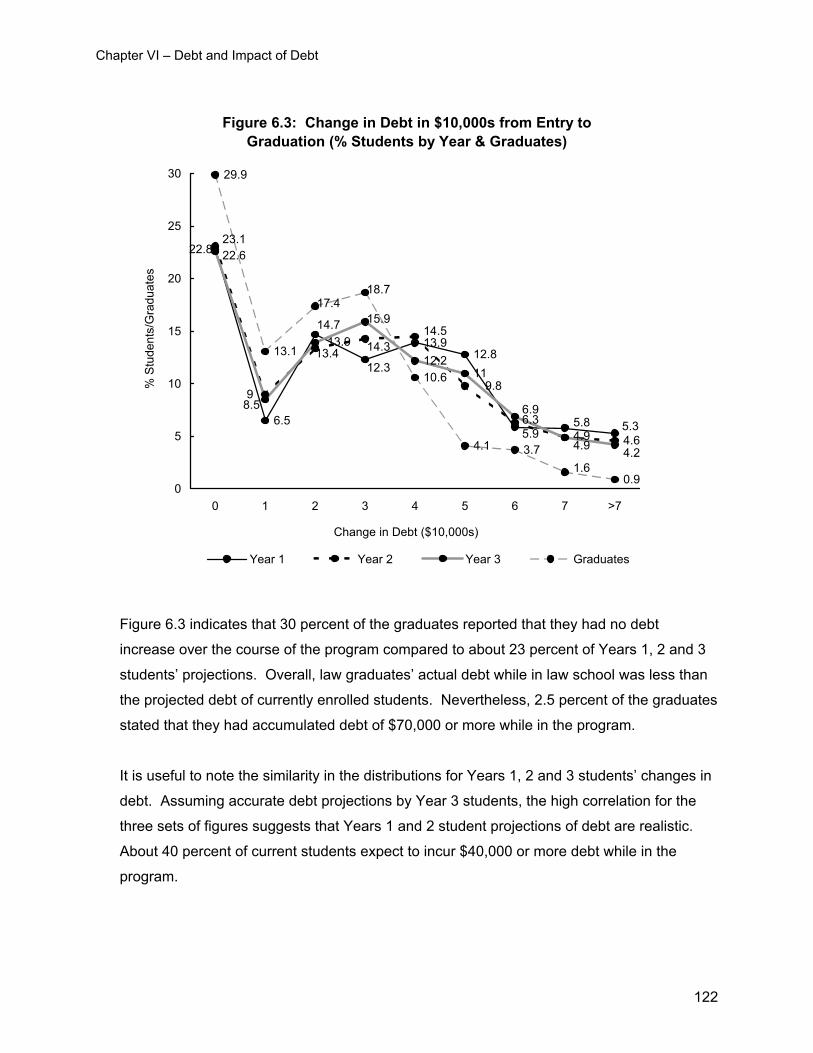
Chapter VI – Debt and Impact of Debt
Figure 6.3: Change in Debt in $10,000s from Entry to Graduation (% Students by Year & Graduates)
6.5
13.912.8
4.6
12.211
29.9
13.1
10.6
4.1 3.7
0.9
5.35.85.9
12.3
14.7
22.8
9.8
4.9
6.3
14.514.313.4
9
23.1
4.24.9
6.9
15.9
13.9
8.5
22.6
1.6
18.717.4
0
5
10
15
20
25
30
0 1 2 3 4 5 6 7 >7
Change in Debt ($10,000s)
% S
tude
nts/
Gra
duat
es
Year 1 Year 2 Year 3 Graduates
Figure 6.3 indicates that 30 percent of the graduates reported that they had no debt
increase over the course of the program compared to about 23 percent of Years 1, 2 and 3
students’ projections. Overall, law graduates’ actual debt while in law school was less than
the projected debt of currently enrolled students. Nevertheless, 2.5 percent of the graduates
stated that they had accumulated debt of $70,000 or more while in the program.
It is useful to note the similarity in the distributions for Years 1, 2 and 3 students’ changes in
debt. Assuming accurate debt projections by Year 3 students, the high correlation for the
three sets of figures suggests that Years 1 and 2 student projections of debt are realistic.
About 40 percent of current students expect to incur $40,000 or more debt while in the
program.
122
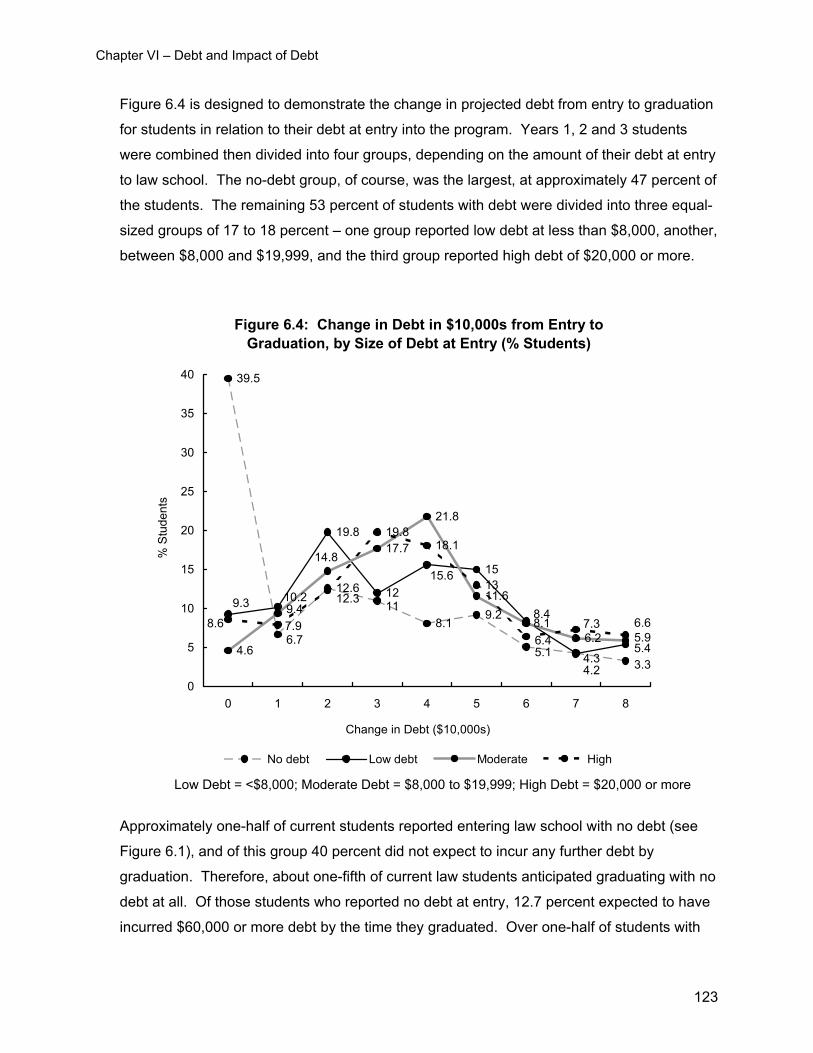
Chapter VI – Debt and Impact of Debt
Figure 6.4 is designed to demonstrate the change in projected debt from entry to graduation
for students in relation to their debt at entry into the program. Years 1, 2 and 3 students
were combined then divided into four groups, depending on the amount of their debt at entry
to law school. The no-debt group, of course, was the largest, at approximately 47 percent of
the students. The remaining 53 percent of students with debt were divided into three equal-
sized groups of 17 to 18 percent – one group reported low debt at less than $8,000, another,
between $8,000 and $19,999, and the third group reported high debt of $20,000 or more.
Figure 6.4: Change in Debt in $10,000s from Entry to Graduation, by Size of Debt at Entry (% Students)
39.5
12.6
8.19.2
19.8
12
15
4.6
17.7
21.8
11.6
6.2
19.818.1
13
3.34.35.1
11
6.75.4
4.2
8.4
15.6
10.29.3
5.98.1
14.8
9.46.67.3
6.4
12.3
7.98.6
0
5
10
15
20
25
30
35
40
0 1 2 3 4 5 6 7 8
Change in Debt ($10,000s)
% S
tude
nts
No debt Low debt Moderate High
Low Debt = <$8,000; Moderate Debt = $8,000 to $19,999; High Debt = $20,000 or more
Approximately one-half of current students reported entering law school with no debt (see
Figure 6.1), and of this group 40 percent did not expect to incur any further debt by
graduation. Therefore, about one-fifth of current law students anticipated graduating with no
debt at all. Of those students who reported no debt at entry, 12.7 percent expected to have
incurred $60,000 or more debt by the time they graduated. Over one-half of students with
123
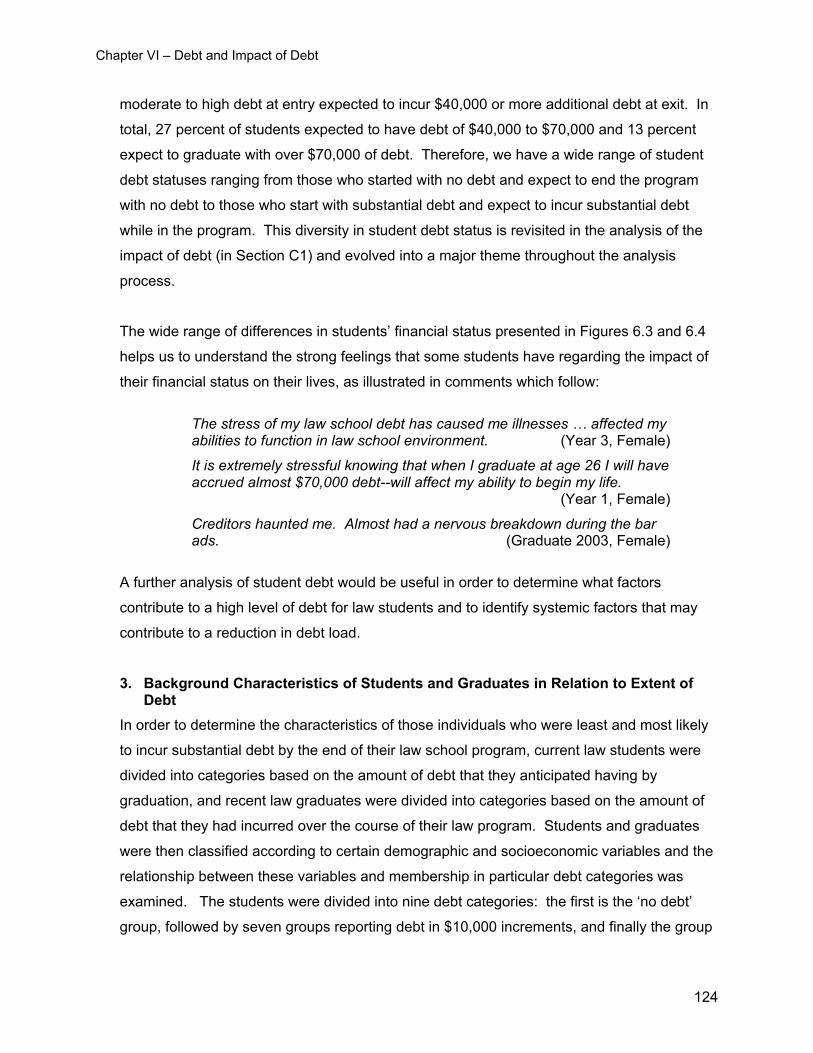
Chapter VI – Debt and Impact of Debt
moderate to high debt at entry expected to incur $40,000 or more additional debt at exit. In
total, 27 percent of students expected to have debt of $40,000 to $70,000 and 13 percent
expect to graduate with over $70,000 of debt. Therefore, we have a wide range of student
debt statuses ranging from those who started with no debt and expect to end the program
with no debt to those who start with substantial debt and expect to incur substantial debt
while in the program. This diversity in student debt status is revisited in the analysis of the
impact of debt (in Section C1) and evolved into a major theme throughout the analysis
process.
The wide range of differences in students’ financial status presented in Figures 6.3 and 6.4
helps us to understand the strong feelings that some students have regarding the impact of
their financial status on their lives, as illustrated in comments which follow:
The stress of my law school debt has caused me illnesses … affected my abilities to function in law school environment. (Year 3, Female)
It is extremely stressful knowing that when I graduate at age 26 I will have accrued almost $70,000 debt--will affect my ability to begin my life. (Year 1, Female)
Creditors haunted me. Almost had a nervous breakdown during the bar ads. (Graduate 2003, Female)
A further analysis of student debt would be useful in order to determine what factors
contribute to a high level of debt for law students and to identify systemic factors that may
contribute to a reduction in debt load.
3. Background Characteristics of Students and Graduates in Relation to Extent of Debt
In order to determine the characteristics of those individuals who were least and most likely
to incur substantial debt by the end of their law school program, current law students were
divided into categories based on the amount of debt that they anticipated having by
graduation, and recent law graduates were divided into categories based on the amount of
debt that they had incurred over the course of their law program. Students and graduates
were then classified according to certain demographic and socioeconomic variables and the
relationship between these variables and membership in particular debt categories was
examined. The students were divided into nine debt categories: the first is the ‘no debt’
group, followed by seven groups reporting debt in $10,000 increments, and finally the group
124
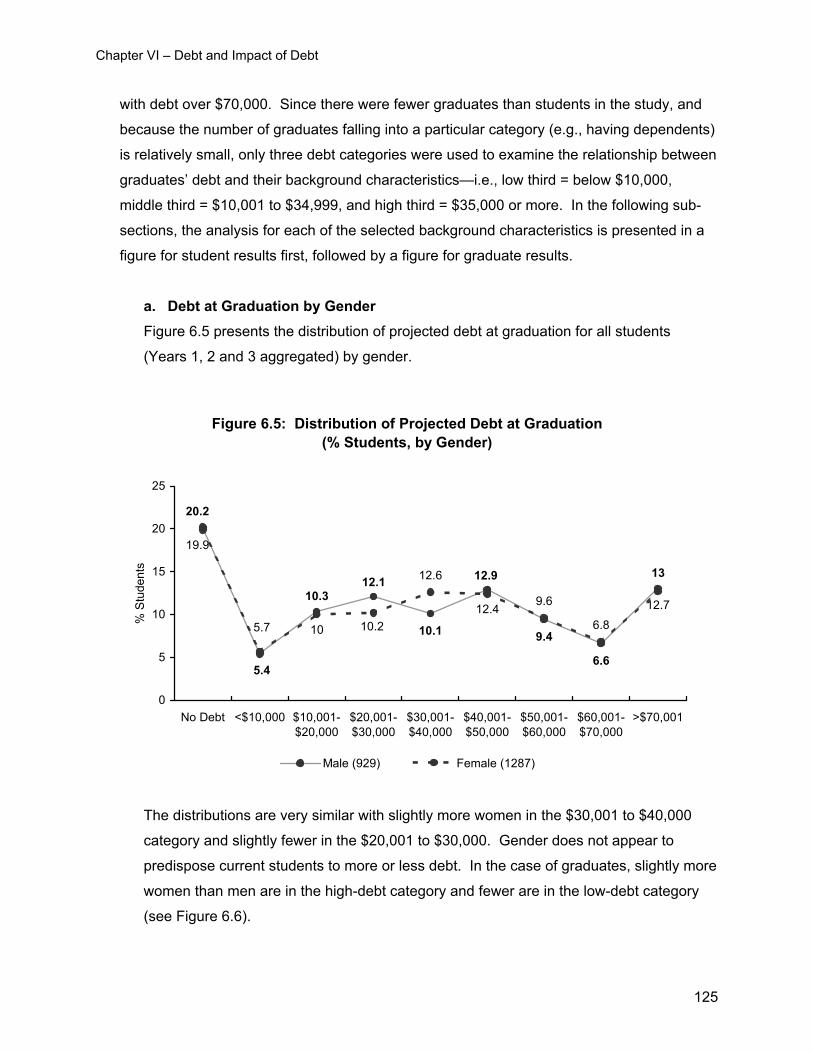
Chapter VI – Debt and Impact of Debt
with debt over $70,000. Since there were fewer graduates than students in the study, and
because the number of graduates falling into a particular category (e.g., having dependents)
is relatively small, only three debt categories were used to examine the relationship between
graduates’ debt and their background characteristics—i.e., low third = below $10,000,
middle third = $10,001 to $34,999, and high third = $35,000 or more. In the following sub-
sections, the analysis for each of the selected background characteristics is presented in a
figure for student results first, followed by a figure for graduate results.
a. Debt at Graduation by Gender Figure 6.5 presents the distribution of projected debt at graduation for all students
(Years 1, 2 and 3 aggregated) by gender.
Figure 6.5: Distribution of Projected Debt at Graduation (% Students, by Gender)
10.1 9.4
6.6
12.6
9.6
6.8
1312.912.110.3
5.4
20.2
12.712.410.2105.7
19.9
0
5
10
15
20
25
No Debt <$10,000 $10,001-$20,000
$20,001-$30,000
$30,001-$40,000
$40,001-$50,000
$50,001-$60,000
$60,001-$70,000
>$70,001
% S
tude
nts
Male (929) Female (1287)
The distributions are very similar with slightly more women in the $30,001 to $40,000
category and slightly fewer in the $20,001 to $30,000. Gender does not appear to
predispose current students to more or less debt. In the case of graduates, slightly more
women than men are in the high-debt category and fewer are in the low-debt category
(see Figure 6.6).
125
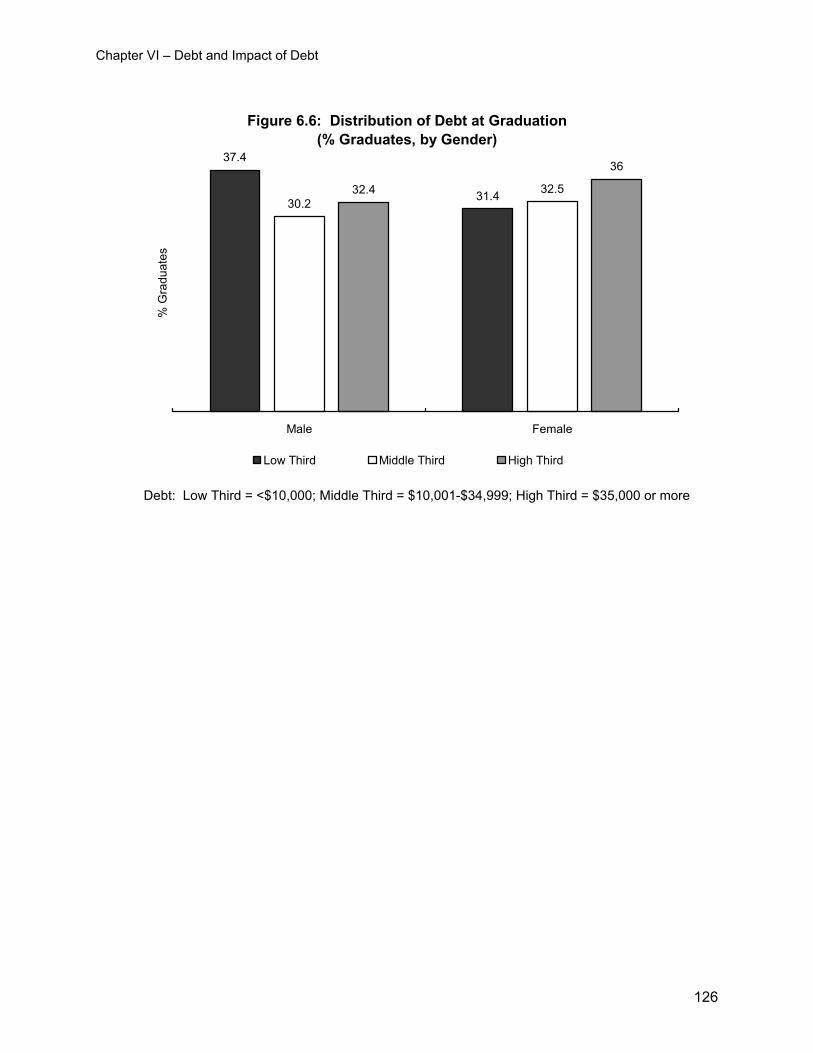
Chapter VI – Debt and Impact of Debt
Figure 6.6: Distribution of Debt at Graduation(% Graduates, by Gender)
37.4
31.430.232.532.4
36
Male Female
% G
radu
ates
Low Third Middle Third High Third
Debt: Low Third = <$10,000; Middle Third = $10,001-$34,999; High Third = $35,000 or more
126
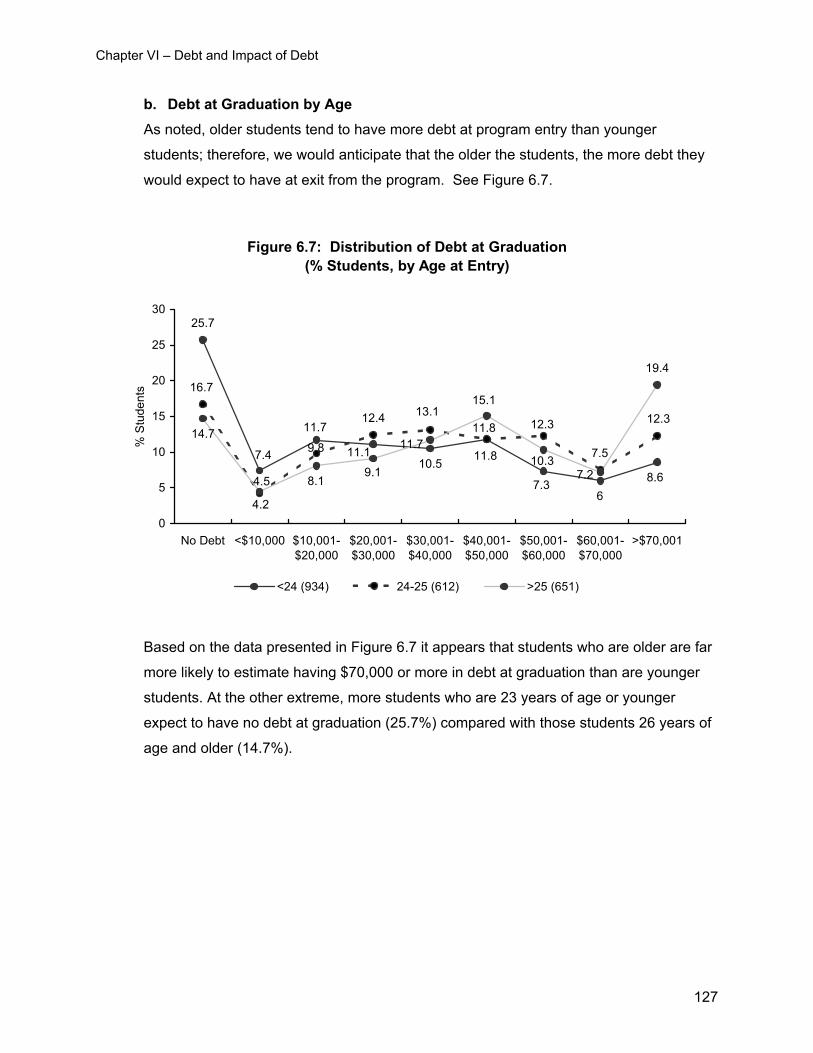
Chapter VI – Debt and Impact of Debt
b. Debt at Graduation by Age As noted, older students tend to have more debt at program entry than younger
students; therefore, we would anticipate that the older the students, the more debt they
would expect to have at exit from the program. See Figure 6.7.
Figure 6.7: Distribution of Debt at Graduation(% Students, by Age at Entry)
25.7
12.4
19.4
8.66
7.3
11.8
10.511.1
11.7
7.4
12.312.3
11.8
13.1
9.8
16.7
7.5
4.2
10.3
15.1
11.7
9.18.1
14.7
7.24.5
0
5
10
15
20
25
30
No Debt <$10,000 $10,001-$20,000
$20,001-$30,000
$30,001-$40,000
$40,001-$50,000
$50,001-$60,000
$60,001-$70,000
>$70,001
% S
tude
nts
<24 (934) 24-25 (612) >25 (651)
Based on the data presented in Figure 6.7 it appears that students who are older are far
more likely to estimate having $70,000 or more in debt at graduation than are younger
students. At the other extreme, more students who are 23 years of age or younger
expect to have no debt at graduation (25.7%) compared with those students 26 years of
age and older (14.7%).
127
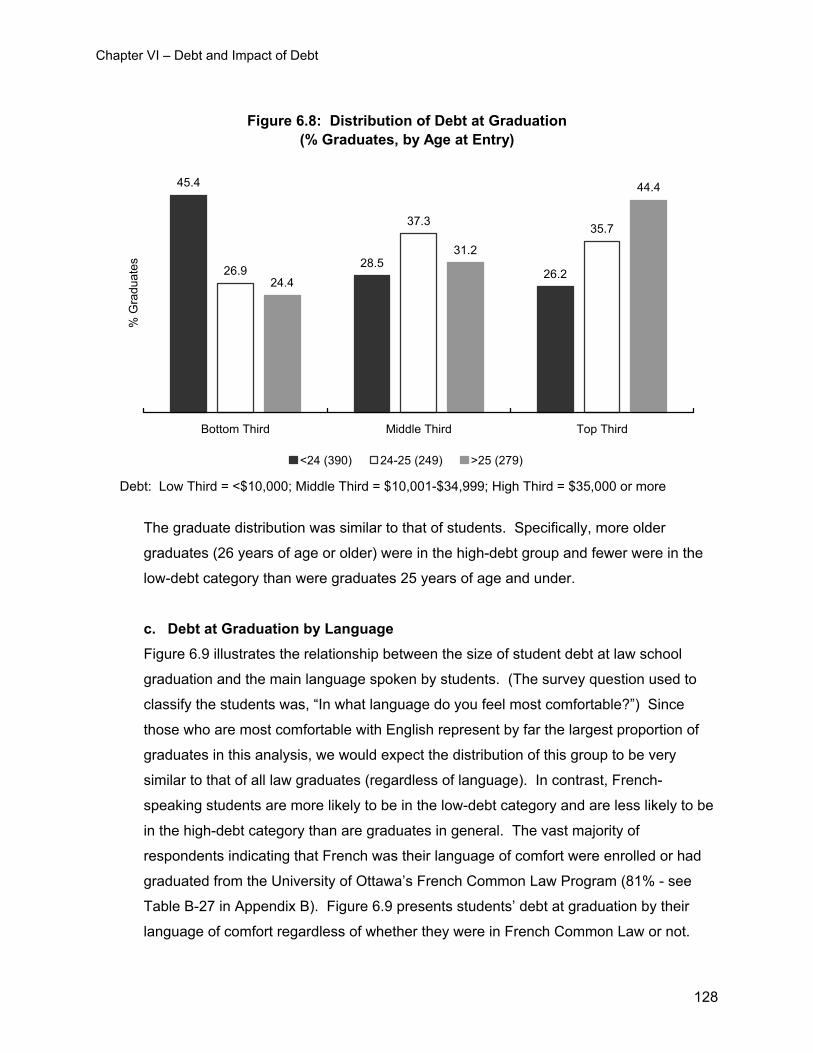
Chapter VI – Debt and Impact of Debt
Figure 6.8: Distribution of Debt at Graduation(% Graduates, by Age at Entry)
45.4
28.526.226.9
37.3 35.7
24.4
31.2
44.4
Bottom Third Middle Third Top Third
% G
radu
ates
<24 (390) 24-25 (249) >25 (279)
Debt: Low Third = <$10,000; Middle Third = $10,001-$34,999; High Third = $35,000 or more
The graduate distribution was similar to that of students. Specifically, more older
graduates (26 years of age or older) were in the high-debt group and fewer were in the
low-debt category than were graduates 25 years of age and under.
c. Debt at Graduation by Language Figure 6.9 illustrates the relationship between the size of student debt at law school
graduation and the main language spoken by students. (The survey question used to
classify the students was, “In what language do you feel most comfortable?”) Since
those who are most comfortable with English represent by far the largest proportion of
graduates in this analysis, we would expect the distribution of this group to be very
similar to that of all law graduates (regardless of language). In contrast, French-
speaking students are more likely to be in the low-debt category and are less likely to be
in the high-debt category than are graduates in general. The vast majority of
respondents indicating that French was their language of comfort were enrolled or had
graduated from the University of Ottawa’s French Common Law Program (81% - see
Table B-27 in Appendix B). Figure 6.9 presents students’ debt at graduation by their
language of comfort regardless of whether they were in French Common Law or not.
128
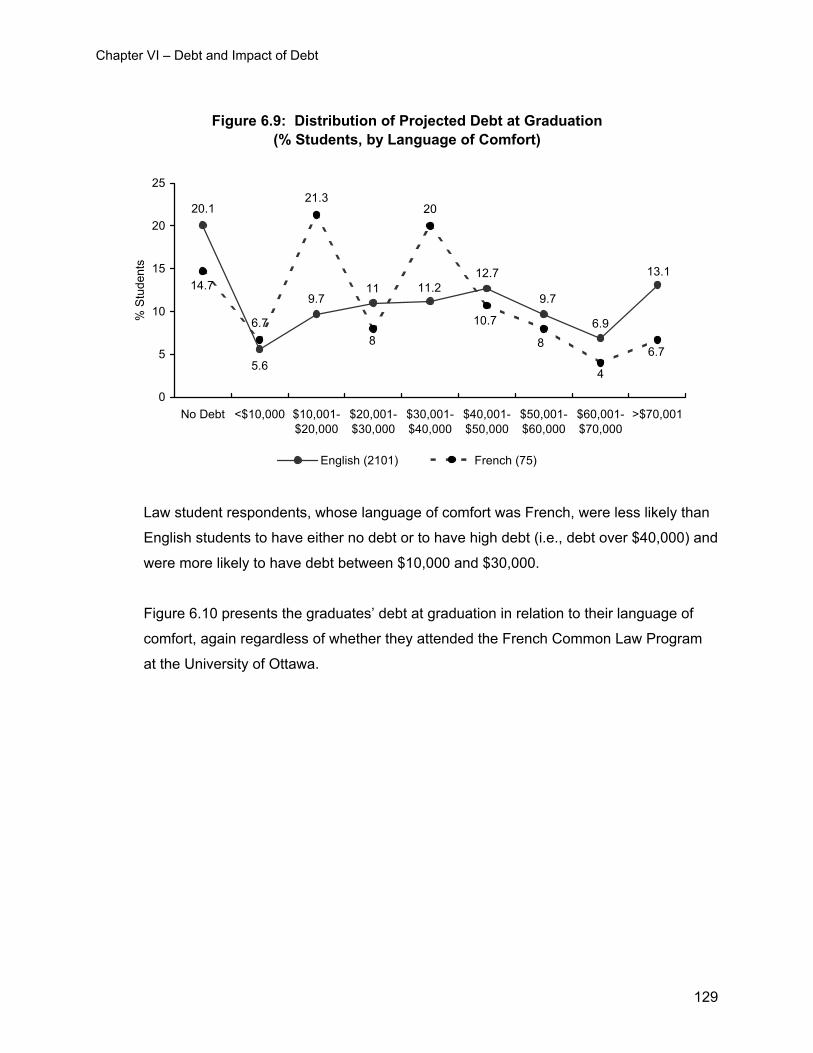
Chapter VI – Debt and Impact of Debt
Figure 6.9: Distribution of Projected Debt at Graduation (% Students, by Language of Comfort)
5.6
6.7
21.320
11.29.7
13.1
6.9
20.1
1112.7
9.7
6.7
4
14.7
8
10.7
8
0
5
10
15
20
25
No Debt <$10,000 $10,001-$20,000
$20,001-$30,000
$30,001-$40,000
$40,001-$50,000
$50,001-$60,000
$60,001-$70,000
>$70,001
% S
tude
nts
English (2101) French (75)
Law student respondents, whose language of comfort was French, were less likely than
English students to have either no debt or to have high debt (i.e., debt over $40,000) and
were more likely to have debt between $10,000 and $30,000.
Figure 6.10 presents the graduates’ debt at graduation in relation to their language of
comfort, again regardless of whether they attended the French Common Law Program
at the University of Ottawa.
129
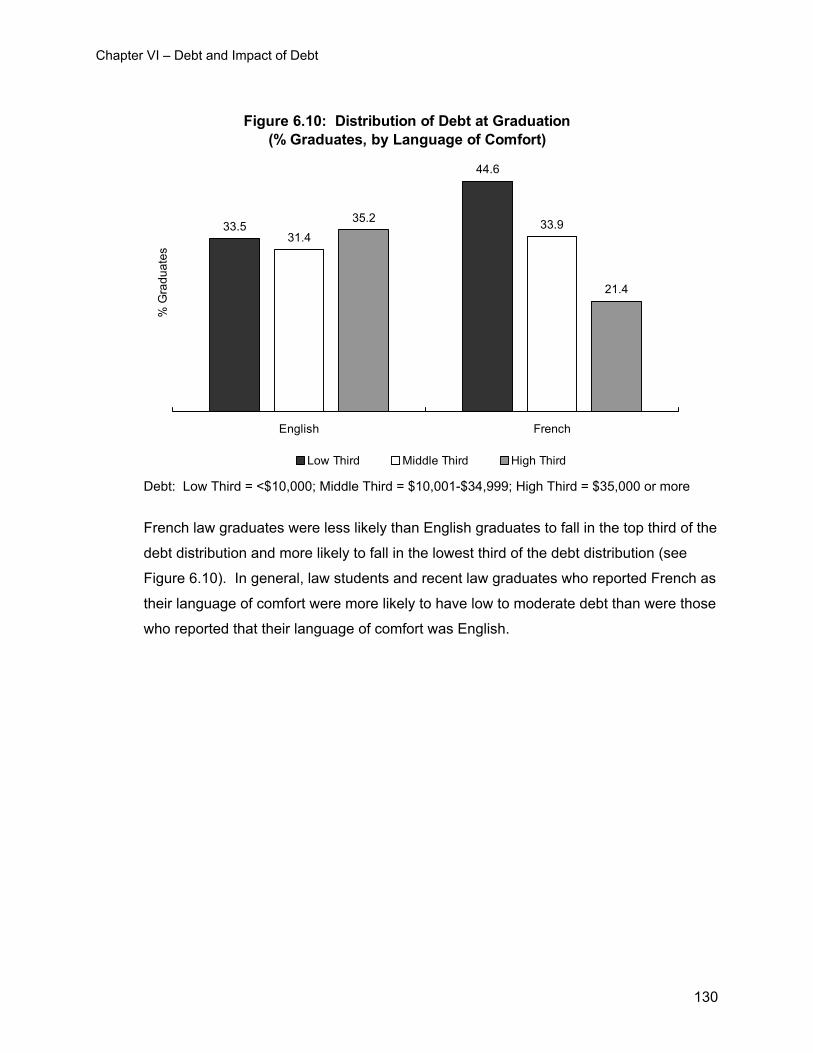
Chapter VI – Debt and Impact of Debt
Figure 6.10: Distribution of Debt at Graduation(% Graduates, by Language of Comfort)
33.5
44.6
31.433.935.2
21.4
English French
% G
radu
ates
Low Third Middle Third High Third
Debt: Low Third = <$10,000; Middle Third = $10,001-$34,999; High Third = $35,000 or more
French law graduates were less likely than English graduates to fall in the top third of the
debt distribution and more likely to fall in the lowest third of the debt distribution (see
Figure 6.10). In general, law students and recent law graduates who reported French as
their language of comfort were more likely to have low to moderate debt than were those
who reported that their language of comfort was English.
130
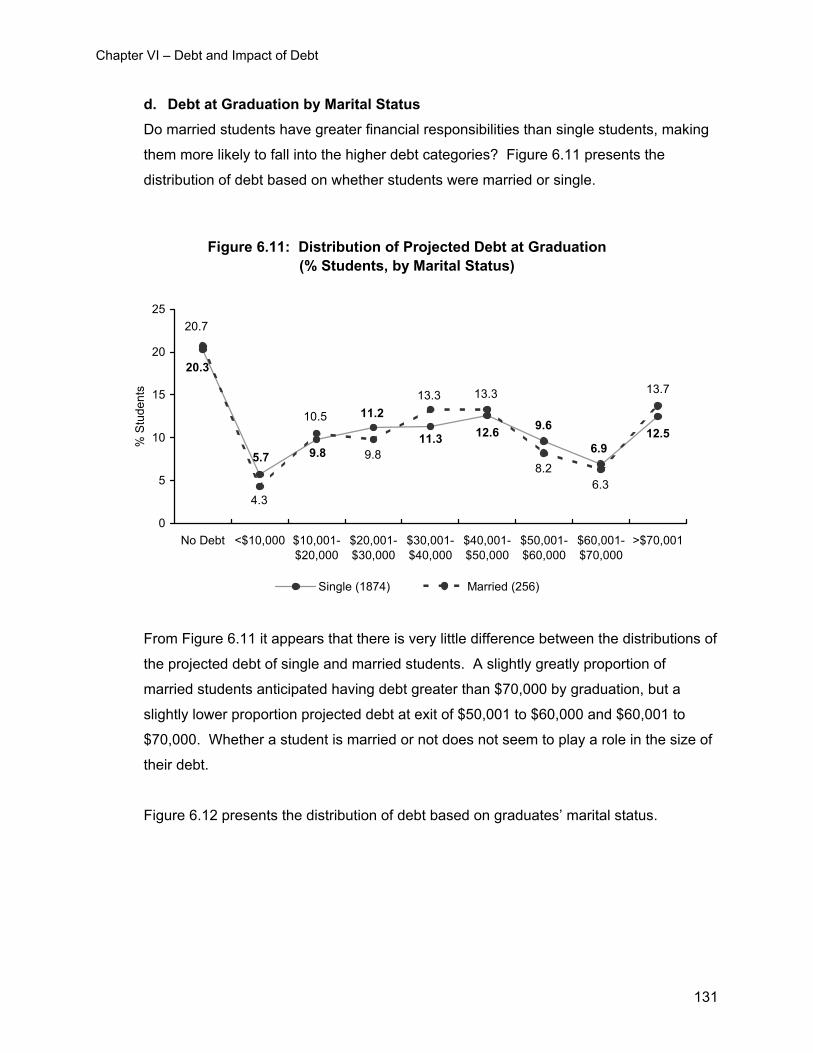
Chapter VI – Debt and Impact of Debt
d. Debt at Graduation by Marital Status Do married students have greater financial responsibilities than single students, making
them more likely to fall into the higher debt categories? Figure 6.11 presents the
distribution of debt based on whether students were married or single.
Figure 6.11: Distribution of Projected Debt at Graduation (% Students, by Marital Status)
12.6 12.5
13.7
6.9
9.611.3
11.2
9.85.7
20.3
6.38.2
13.313.3
9.8
10.5
4.3
20.7
0
5
10
15
20
25
No Debt <$10,000 $10,001-$20,000
$20,001-$30,000
$30,001-$40,000
$40,001-$50,000
$50,001-$60,000
$60,001-$70,000
>$70,001
% S
tude
nts
Single (1874) Married (256)
From Figure 6.11 it appears that there is very little difference between the distributions of
the projected debt of single and married students. A slightly greatly proportion of
married students anticipated having debt greater than $70,000 by graduation, but a
slightly lower proportion projected debt at exit of $50,001 to $60,000 and $60,001 to
$70,000. Whether a student is married or not does not seem to play a role in the size of
their debt.
Figure 6.12 presents the distribution of debt based on graduates’ marital status.
131
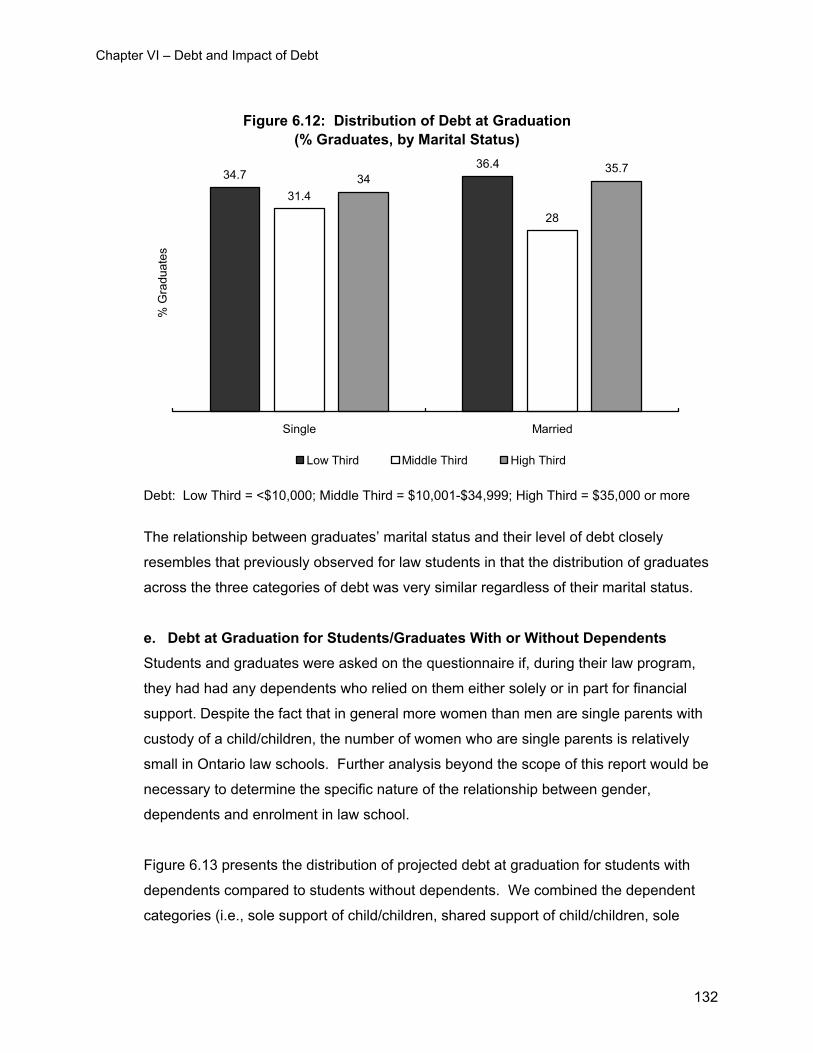
Chapter VI – Debt and Impact of Debt
Figure 6.12: Distribution of Debt at Graduation(% Graduates, by Marital Status)
34.736.4
31.4
28
3435.7
Single Married
% G
radu
ates
Low Third Middle Third High Third
Debt: Low Third = <$10,000; Middle Third = $10,001-$34,999; High Third = $35,000 or more
The relationship between graduates’ marital status and their level of debt closely
resembles that previously observed for law students in that the distribution of graduates
across the three categories of debt was very similar regardless of their marital status.
e. Debt at Graduation for Students/Graduates With or Without Dependents Students and graduates were asked on the questionnaire if, during their law program,
they had had any dependents who relied on them either solely or in part for financial
support. Despite the fact that in general more women than men are single parents with
custody of a child/children, the number of women who are single parents is relatively
small in Ontario law schools. Further analysis beyond the scope of this report would be
necessary to determine the specific nature of the relationship between gender,
dependents and enrolment in law school.
Figure 6.13 presents the distribution of projected debt at graduation for students with
dependents compared to students without dependents. We combined the dependent
categories (i.e., sole support of child/children, shared support of child/children, sole
132
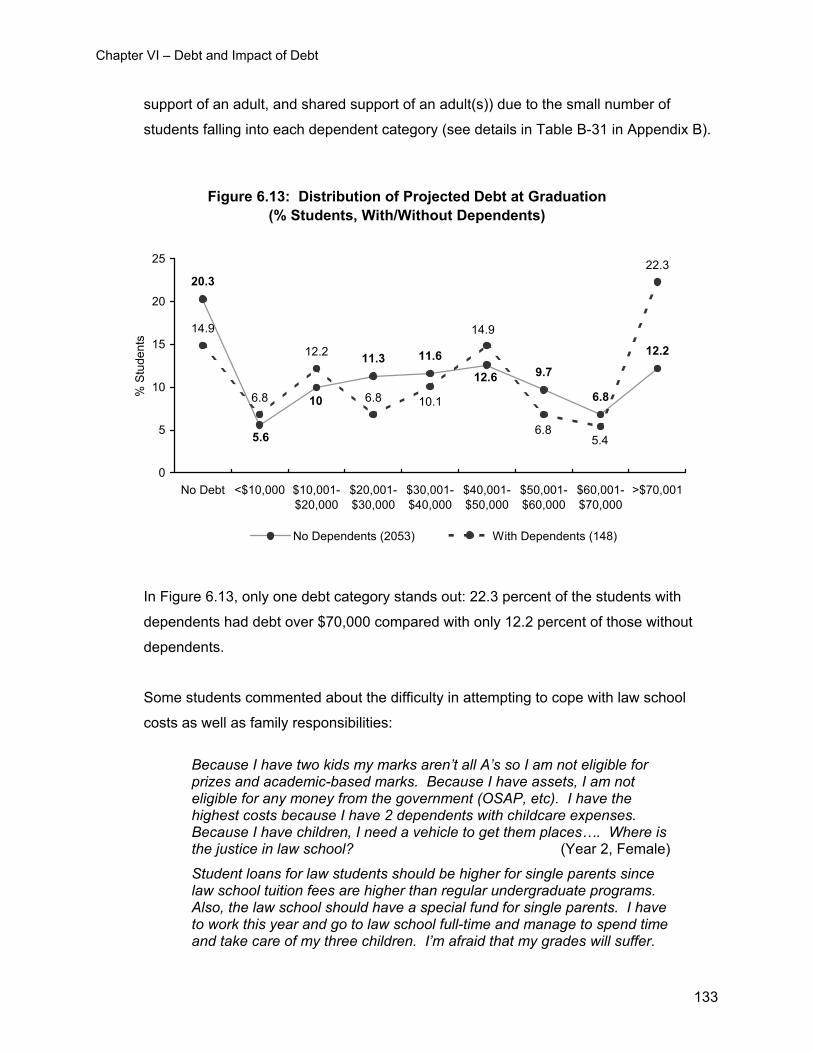
Chapter VI – Debt and Impact of Debt
support of an adult, and shared support of an adult(s)) due to the small number of
students falling into each dependent category (see details in Table B-31 in Appendix B).
Figure 6.13: Distribution of Projected Debt at Graduation (% Students, With/Without Dependents)
20.3
11.3 11.69.7
6.8
12.2
14.9
6.8
12.2
6.8
22.3
12.6
10
5.6 5.46.8
14.9
10.1
0
5
10
15
20
25
No Debt <$10,000 $10,001-$20,000
$20,001-$30,000
$30,001-$40,000
$40,001-$50,000
$50,001-$60,000
$60,001-$70,000
>$70,001
% S
tude
nts
No Dependents (2053) With Dependents (148)
In Figure 6.13, only one debt category stands out: 22.3 percent of the students with
dependents had debt over $70,000 compared with only 12.2 percent of those without
dependents.
Some students commented about the difficulty in attempting to cope with law school
costs as well as family responsibilities:
Because I have two kids my marks aren’t all A’s so I am not eligible for prizes and academic-based marks. Because I have assets, I am not eligible for any money from the government (OSAP, etc). I have the highest costs because I have 2 dependents with childcare expenses. Because I have children, I need a vehicle to get them places…. Where is the justice in law school? (Year 2, Female)
Student loans for law students should be higher for single parents since law school tuition fees are higher than regular undergraduate programs. Also, the law school should have a special fund for single parents. I have to work this year and go to law school full-time and manage to spend time and take care of my three children. I’m afraid that my grades will suffer.
133
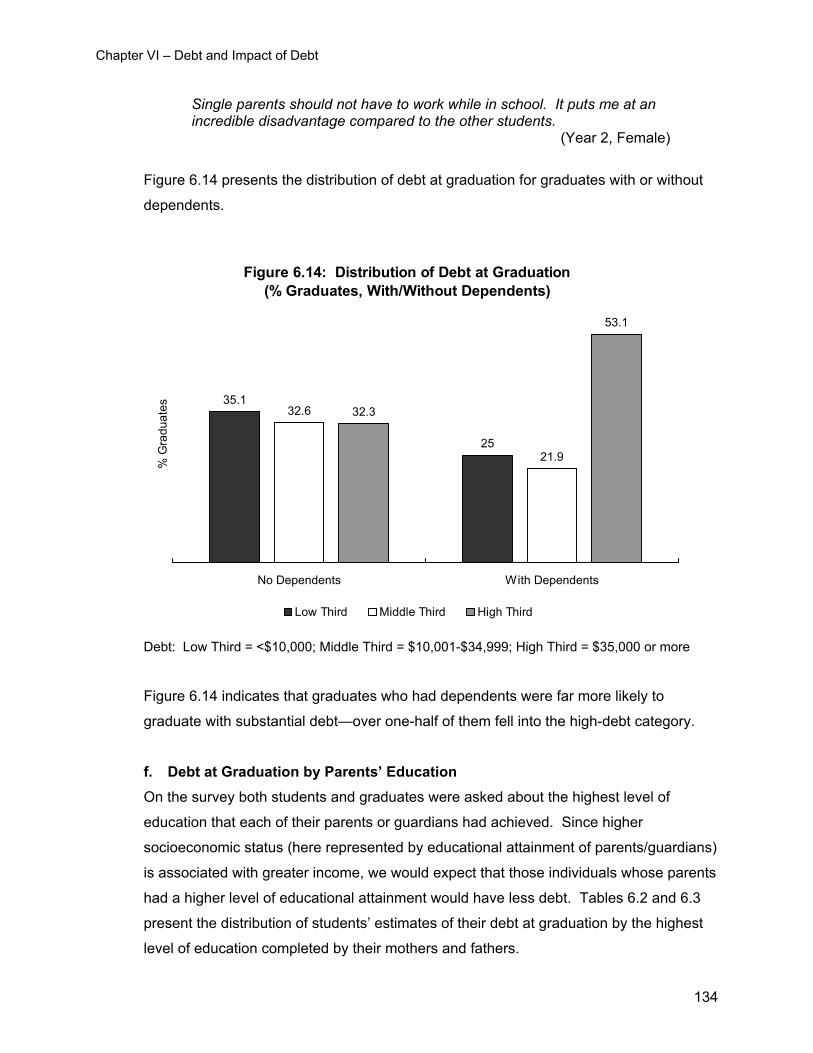
Chapter VI – Debt and Impact of Debt
Single parents should not have to work while in school. It puts me at an incredible disadvantage compared to the other students. (Year 2, Female)
Figure 6.14 presents the distribution of debt at graduation for graduates with or without
dependents.
Figure 6.14: Distribution of Debt at Graduation(% Graduates, With/Without Dependents)
35.1
25
32.6
21.9
32.3
53.1
No Dependents With Dependents
% G
radu
ates
Low Third Middle Third High Third
Debt: Low Third = <$10,000; Middle Third = $10,001-$34,999; High Third = $35,000 or more
Figure 6.14 indicates that graduates who had dependents were far more likely to
graduate with substantial debt—over one-half of them fell into the high-debt category.
f. Debt at Graduation by Parents’ Education On the survey both students and graduates were asked about the highest level of
education that each of their parents or guardians had achieved. Since higher
socioeconomic status (here represented by educational attainment of parents/guardians)
is associated with greater income, we would expect that those individuals whose parents
had a higher level of educational attainment would have less debt. Tables 6.2 and 6.3
present the distribution of students’ estimates of their debt at graduation by the highest
level of education completed by their mothers and fathers.
134
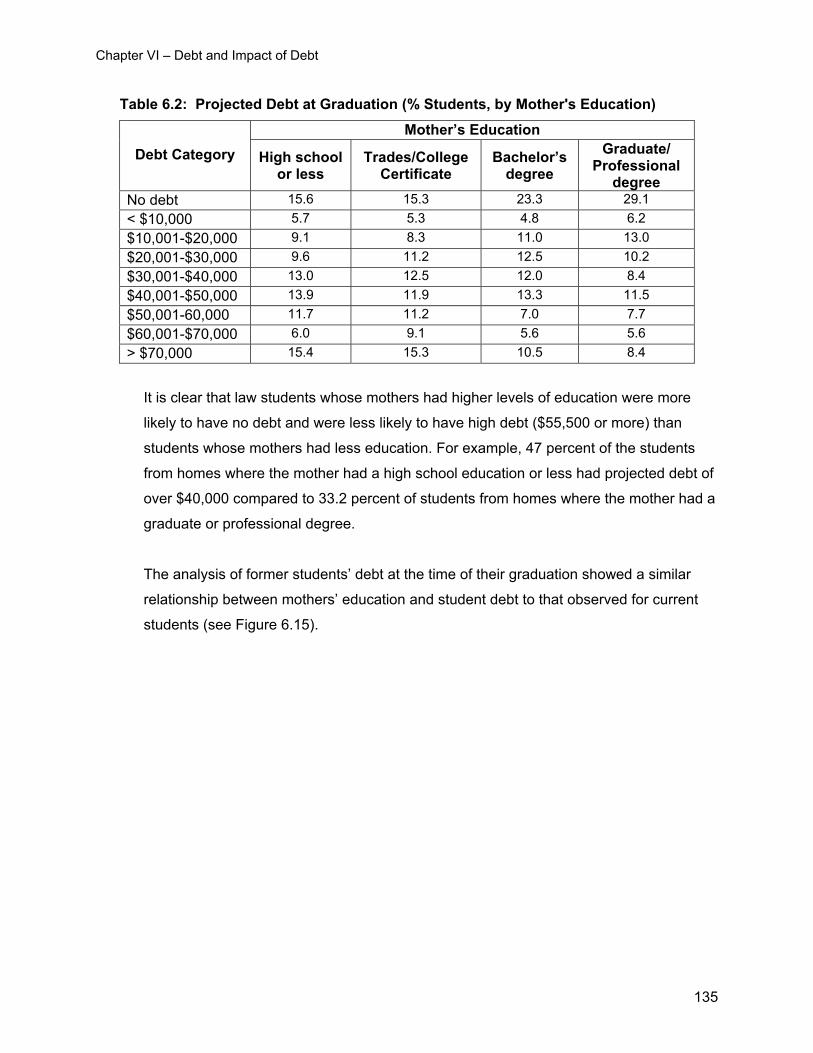
Chapter VI – Debt and Impact of Debt
Table 6.2: Projected Debt at Graduation (% Students, by Mother's Education)
Mother’s Education Debt Category High school
or less Trades/College
Certificate Bachelor’s
degree Graduate/
Professional degree
No debt 15.6 15.3 23.3 29.1 < $10,000 5.7 5.3 4.8 6.2 $10,001-$20,000 9.1 8.3 11.0 13.0 $20,001-$30,000 9.6 11.2 12.5 10.2 $30,001-$40,000 13.0 12.5 12.0 8.4 $40,001-$50,000 13.9 11.9 13.3 11.5 $50,001-60,000 11.7 11.2 7.0 7.7 $60,001-$70,000 6.0 9.1 5.6 5.6 > $70,000 15.4 15.3 10.5 8.4
It is clear that law students whose mothers had higher levels of education were more
likely to have no debt and were less likely to have high debt ($55,500 or more) than
students whose mothers had less education. For example, 47 percent of the students
from homes where the mother had a high school education or less had projected debt of
over $40,000 compared to 33.2 percent of students from homes where the mother had a
graduate or professional degree.
The analysis of former students’ debt at the time of their graduation showed a similar
relationship between mothers’ education and student debt to that observed for current
students (see Figure 6.15).
135
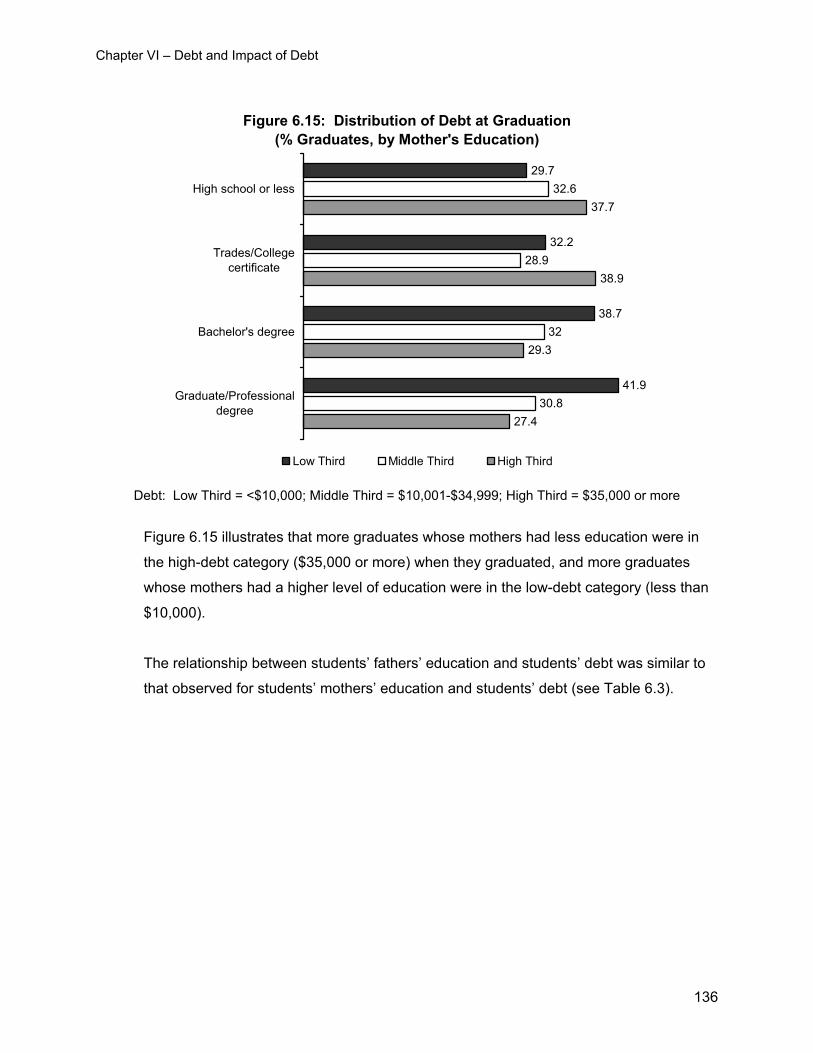
Chapter VI – Debt and Impact of Debt
Figure 6.15: Distribution of Debt at Graduation(% Graduates, by Mother's Education)
29.7
32.2
38.7
41.9
32.6
28.9
32
30.8
37.7
38.9
29.3
27.4
High school or less
Trades/Collegecertificate
Bachelor's degree
Graduate/Professionaldegree
Low Third Middle Third High Third
Debt: Low Third = <$10,000; Middle Third = $10,001-$34,999; High Third = $35,000 or more
Figure 6.15 illustrates that more graduates whose mothers had less education were in
the high-debt category ($35,000 or more) when they graduated, and more graduates
whose mothers had a higher level of education were in the low-debt category (less than
$10,000).
The relationship between students’ fathers’ education and students’ debt was similar to
that observed for students’ mothers’ education and students’ debt (see Table 6.3).
136
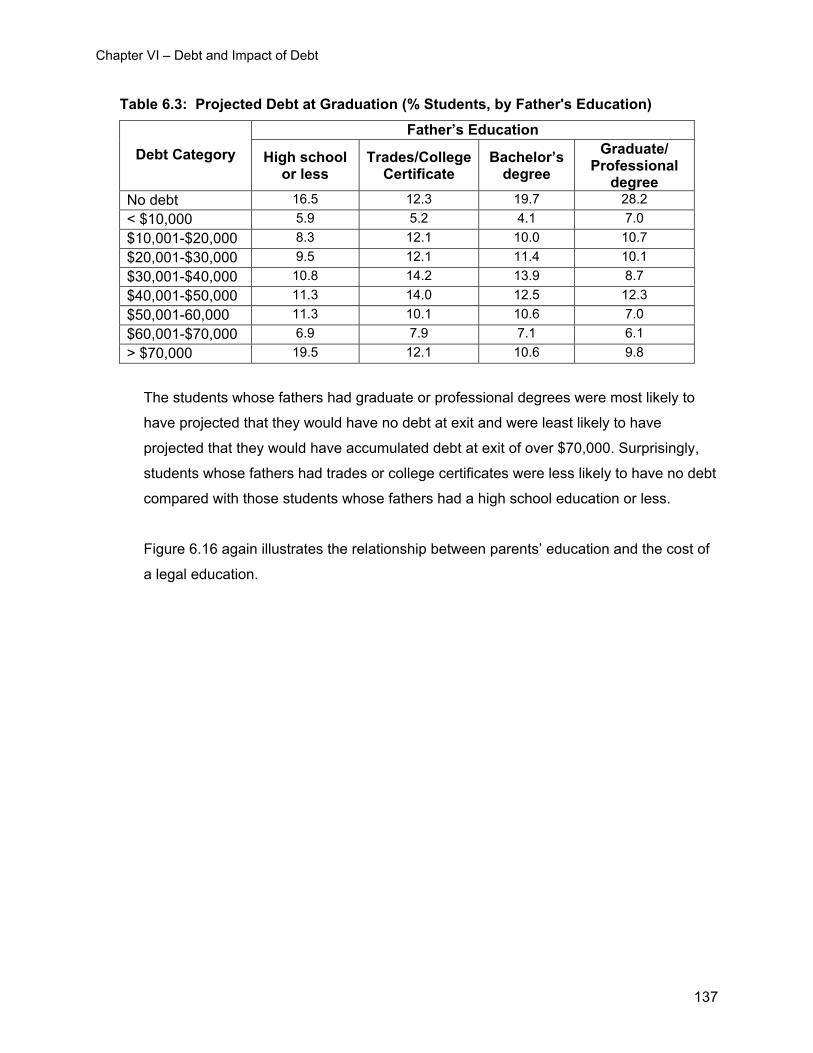
Chapter VI – Debt and Impact of Debt
Table 6.3: Projected Debt at Graduation (% Students, by Father's Education)
Father’s Education Debt Category High school
or less Trades/College
Certificate Bachelor’s
degree Graduate/
Professional degree
No debt 16.5 12.3 19.7 28.2 < $10,000 5.9 5.2 4.1 7.0 $10,001-$20,000 8.3 12.1 10.0 10.7 $20,001-$30,000 9.5 12.1 11.4 10.1 $30,001-$40,000 10.8 14.2 13.9 8.7 $40,001-$50,000 11.3 14.0 12.5 12.3 $50,001-60,000 11.3 10.1 10.6 7.0 $60,001-$70,000 6.9 7.9 7.1 6.1 > $70,000 19.5 12.1 10.6 9.8
The students whose fathers had graduate or professional degrees were most likely to
have projected that they would have no debt at exit and were least likely to have
projected that they would have accumulated debt at exit of over $70,000. Surprisingly,
students whose fathers had trades or college certificates were less likely to have no debt
compared with those students whose fathers had a high school education or less.
Figure 6.16 again illustrates the relationship between parents’ education and the cost of
a legal education.
137
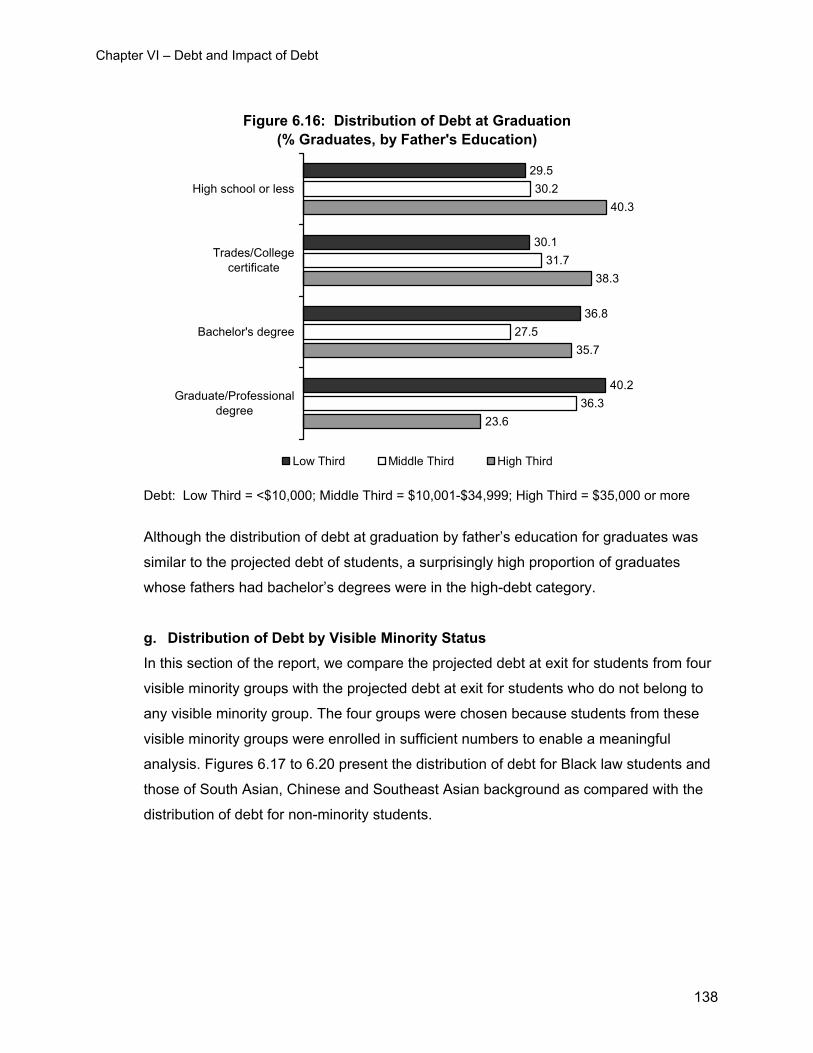
Chapter VI – Debt and Impact of Debt
Figure 6.16: Distribution of Debt at Graduation(% Graduates, by Father's Education)
29.5
30.1
36.8
40.2
30.2
31.7
27.5
36.3
40.3
38.3
35.7
23.6
High school or less
Trades/Collegecertificate
Bachelor's degree
Graduate/Professionaldegree
Low Third Middle Third High Third
Debt: Low Third = <$10,000; Middle Third = $10,001-$34,999; High Third = $35,000 or more
Although the distribution of debt at graduation by father’s education for graduates was
similar to the projected debt of students, a surprisingly high proportion of graduates
whose fathers had bachelor’s degrees were in the high-debt category.
g. Distribution of Debt by Visible Minority Status In this section of the report, we compare the projected debt at exit for students from four
visible minority groups with the projected debt at exit for students who do not belong to
any visible minority group. The four groups were chosen because students from these
visible minority groups were enrolled in sufficient numbers to enable a meaningful
analysis. Figures 6.17 to 6.20 present the distribution of debt for Black law students and
those of South Asian, Chinese and Southeast Asian background as compared with the
distribution of debt for non-minority students.
138
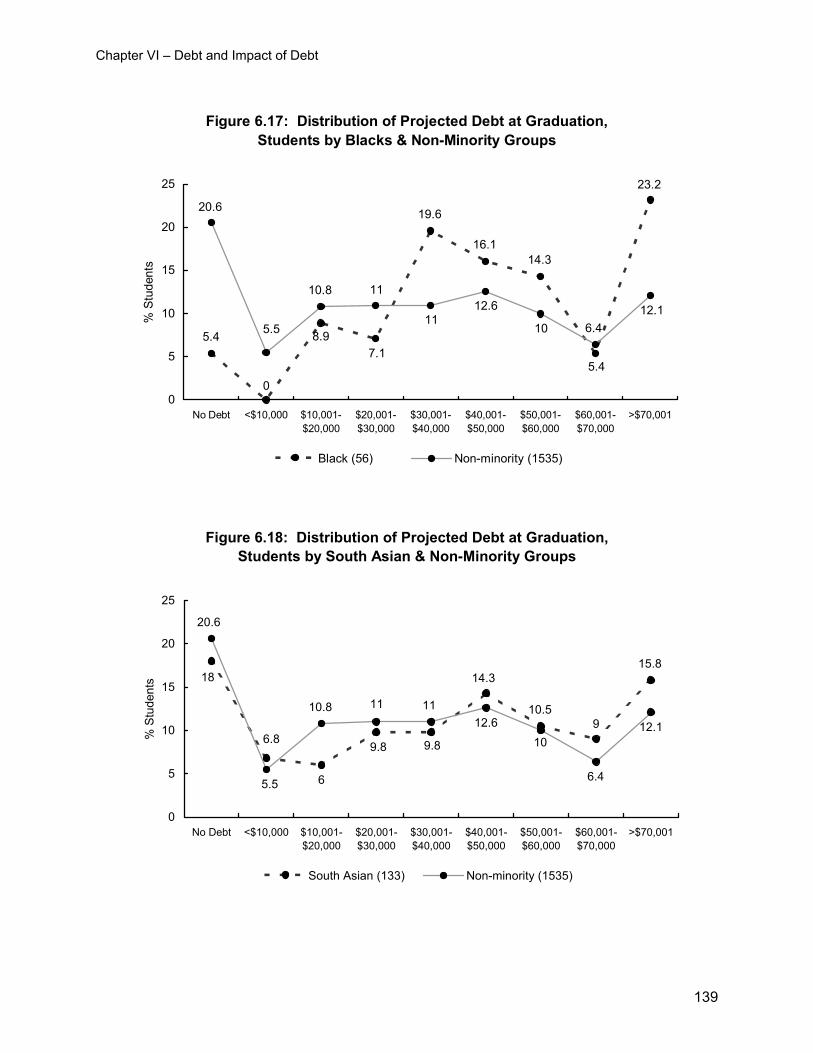
Chapter VI – Debt and Impact of Debt
Figure 6.17: Distribution of Projected Debt at Graduation, Students by Blacks & Non-Minority Groups
23.2
5.4
14.316.1
19.6
7.18.9
0
5.4
12.16.410
12.611
1110.8
5.5
20.6
0
5
10
15
20
25
No Debt <$10,000 $10,001-$20,000
$20,001-$30,000
$30,001-$40,000
$40,001-$50,000
$50,001-$60,000
$60,001-$70,000
>$70,001
% S
tude
nts
Black (56) Non-minority (1535)
Figure 6.18: Distribution of Projected Debt at Graduation, Students by South Asian & Non-Minority Groups
15.8
910.5
14.3
9.89.8
6
6.8
18
12.1
6.4
1012.6
111110.8
5.5
20.6
0
5
10
15
20
25
No Debt <$10,000 $10,001-$20,000
$20,001-$30,000
$30,001-$40,000
$40,001-$50,000
$50,001-$60,000
$60,001-$70,000
>$70,001
% S
tude
nts
South Asian (133) Non-minority (1535)
139
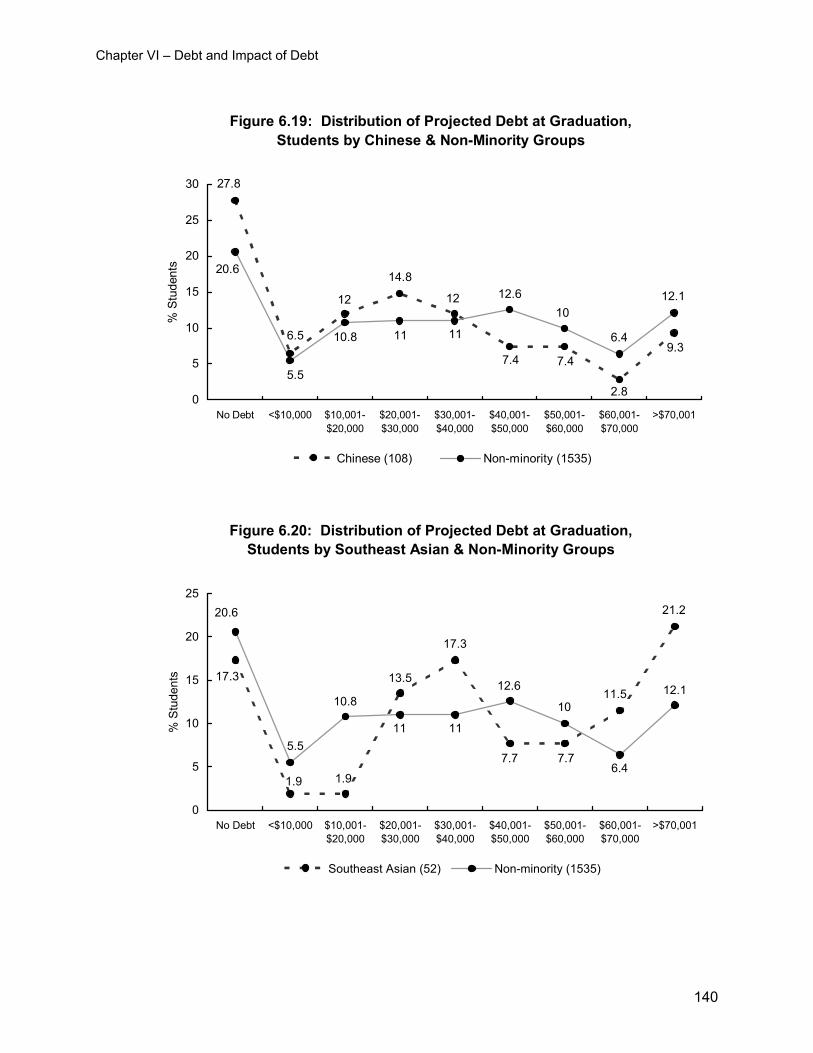
Chapter VI – Debt and Impact of Debt
Figure 6.19: Distribution of Projected Debt at Graduation, Students by Chinese & Non-Minority Groups
9.3
2.8
7.47.4
12
14.8
12
6.5
27.8
12.1
6.4
1012.6
111110.8
5.5
20.6
0
5
10
15
20
25
30
No Debt <$10,000 $10,001-$20,000
$20,001-$30,000
$30,001-$40,000
$40,001-$50,000
$50,001-$60,000
$60,001-$70,000
>$70,001
% S
tude
nts
Chinese (108) Non-minority (1535)
Figure 6.20: Distribution of Projected Debt at Graduation, Students by Southeast Asian & Non-Minority Groups
21.2
11.5
7.77.7
17.3
13.5
1.91.9
17.312.1
6.4
10
12.6
1111
10.8
5.5
20.6
0
5
10
15
20
25
No Debt <$10,000 $10,001-$20,000
$20,001-$30,000
$30,001-$40,000
$40,001-$50,000
$50,001-$60,000
$60,001-$70,000
>$70,001
% S
tude
nts
Southeast Asian (52) Non-minority (1535)
140
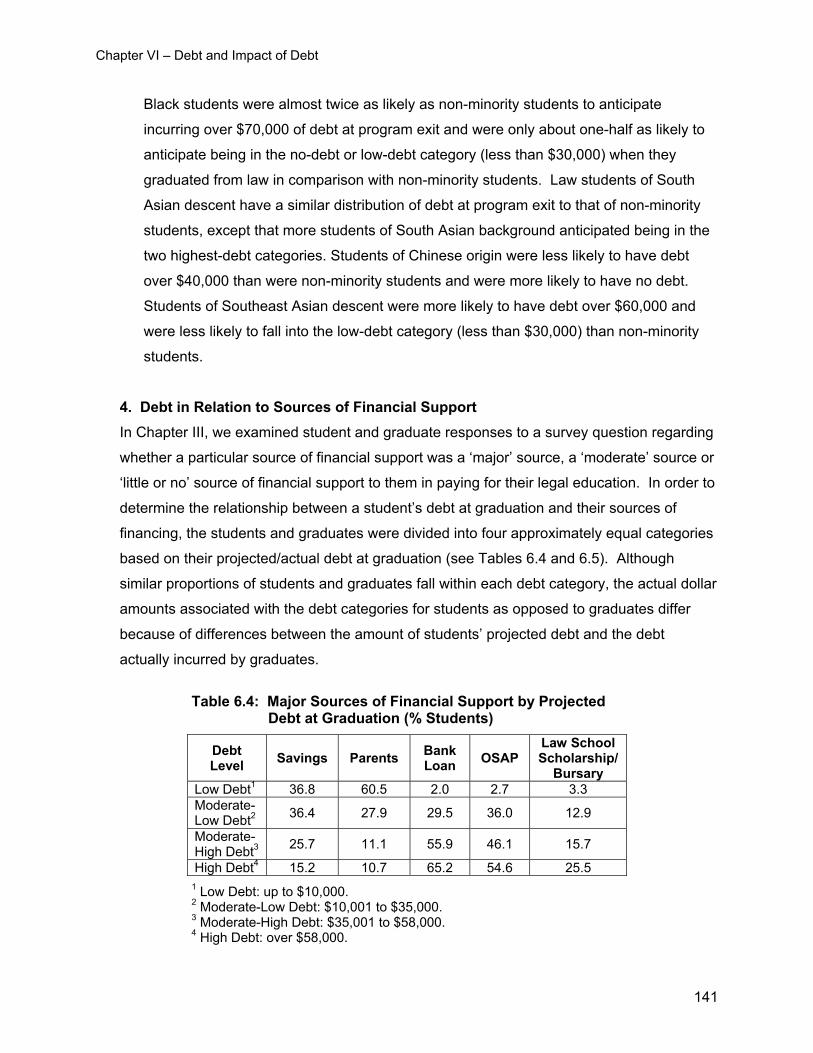
Chapter VI – Debt and Impact of Debt
Black students were almost twice as likely as non-minority students to anticipate
incurring over $70,000 of debt at program exit and were only about one-half as likely to
anticipate being in the no-debt or low-debt category (less than $30,000) when they
graduated from law in comparison with non-minority students. Law students of South
Asian descent have a similar distribution of debt at program exit to that of non-minority
students, except that more students of South Asian background anticipated being in the
two highest-debt categories. Students of Chinese origin were less likely to have debt
over $40,000 than were non-minority students and were more likely to have no debt.
Students of Southeast Asian descent were more likely to have debt over $60,000 and
were less likely to fall into the low-debt category (less than $30,000) than non-minority
students.
4. Debt in Relation to Sources of Financial Support In Chapter III, we examined student and graduate responses to a survey question regarding
whether a particular source of financial support was a ‘major’ source, a ‘moderate’ source or
‘little or no’ source of financial support to them in paying for their legal education. In order to
determine the relationship between a student’s debt at graduation and their sources of
financing, the students and graduates were divided into four approximately equal categories
based on their projected/actual debt at graduation (see Tables 6.4 and 6.5). Although
similar proportions of students and graduates fall within each debt category, the actual dollar
amounts associated with the debt categories for students as opposed to graduates differ
because of differences between the amount of students’ projected debt and the debt
actually incurred by graduates.
Table 6.4: Major Sources of Financial Support by Projected
Debt at Graduation (% Students)
Debt Level Savings Parents Bank
Loan OSAP Law School Scholarship/
Bursary Low Debt1 36.8 60.5 2.0 2.7 3.3 Moderate-Low Debt2 36.4 27.9 29.5 36.0 12.9
Moderate-High Debt3 25.7 11.1 55.9 46.1 15.7
High Debt4 15.2 10.7 65.2 54.6 25.5 1 Low Debt: up to $10,000. 2 Moderate-Low Debt: $10,001 to $35,000. 3 Moderate-High Debt: $35,001 to $58,000. 4 High Debt: over $58,000.
141
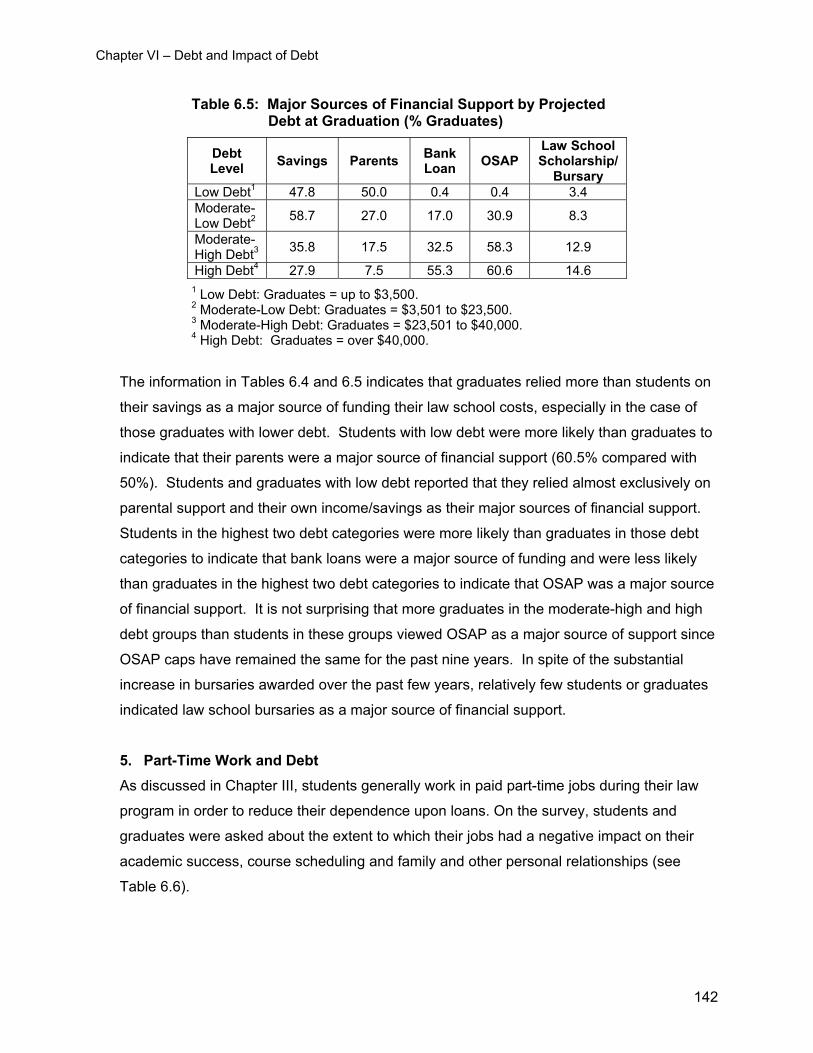
Chapter VI – Debt and Impact of Debt
Table 6.5: Major Sources of Financial Support by Projected Debt at Graduation (% Graduates)
Debt Level Savings Parents Bank
Loan OSAP Law School Scholarship/
Bursary Low Debt1 47.8 50.0 0.4 0.4 3.4 Moderate-Low Debt2 58.7 27.0 17.0 30.9 8.3
Moderate-High Debt3 35.8 17.5 32.5 58.3 12.9
High Debt4 27.9 7.5 55.3 60.6 14.6 1 Low Debt: Graduates = up to $3,500. 2 Moderate-Low Debt: Graduates = $3,501 to $23,500. 3 Moderate-High Debt: Graduates = $23,501 to $40,000. 4 High Debt: Graduates = over $40,000.
The information in Tables 6.4 and 6.5 indicates that graduates relied more than students on
their savings as a major source of funding their law school costs, especially in the case of
those graduates with lower debt. Students with low debt were more likely than graduates to
indicate that their parents were a major source of financial support (60.5% compared with
50%). Students and graduates with low debt reported that they relied almost exclusively on
parental support and their own income/savings as their major sources of financial support.
Students in the highest two debt categories were more likely than graduates in those debt
categories to indicate that bank loans were a major source of funding and were less likely
than graduates in the highest two debt categories to indicate that OSAP was a major source
of financial support. It is not surprising that more graduates in the moderate-high and high
debt groups than students in these groups viewed OSAP as a major source of support since
OSAP caps have remained the same for the past nine years. In spite of the substantial
increase in bursaries awarded over the past few years, relatively few students or graduates
indicated law school bursaries as a major source of financial support.
5. Part-Time Work and Debt As discussed in Chapter III, students generally work in paid part-time jobs during their law
program in order to reduce their dependence upon loans. On the survey, students and
graduates were asked about the extent to which their jobs had a negative impact on their
academic success, course scheduling and family and other personal relationships (see
Table 6.6).
142
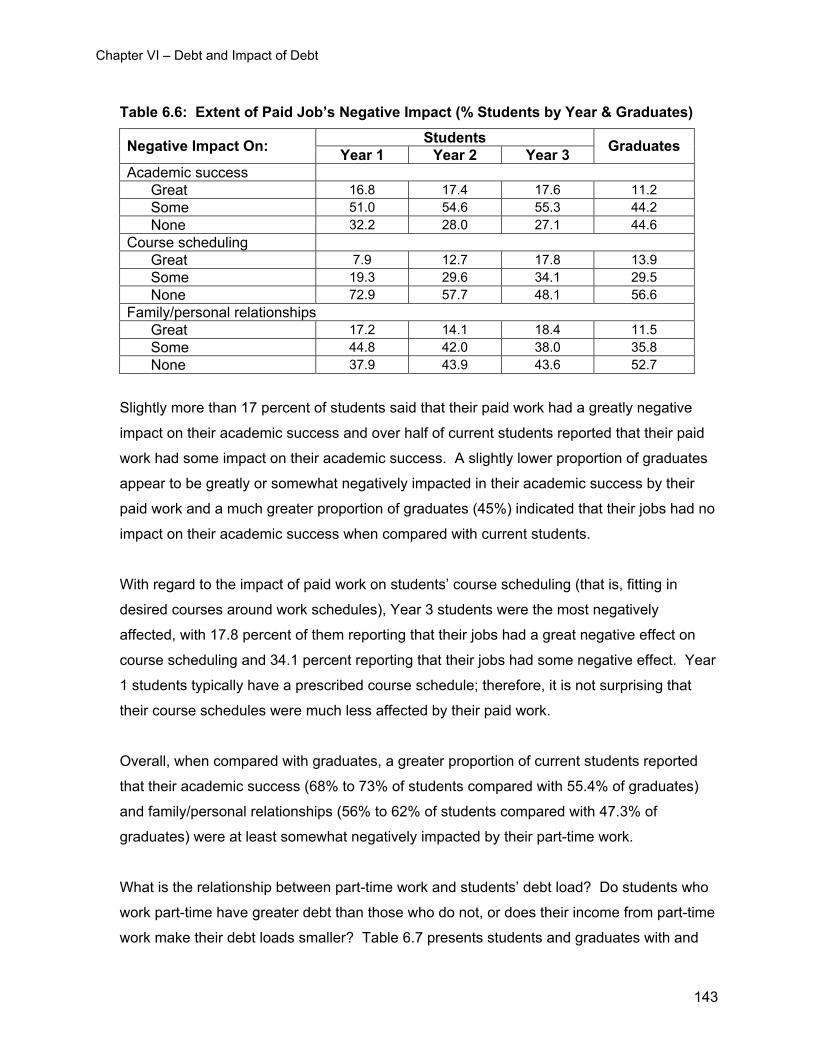
Chapter VI – Debt and Impact of Debt
Table 6.6: Extent of Paid Job’s Negative Impact (% Students by Year & Graduates)
Students Negative Impact On: Year 1 Year 2 Year 3 Graduates
Academic success Great 16.8 17.4 17.6 11.2 Some 51.0 54.6 55.3 44.2 None 32.2 28.0 27.1 44.6 Course scheduling Great 7.9 12.7 17.8 13.9 Some 19.3 29.6 34.1 29.5 None 72.9 57.7 48.1 56.6 Family/personal relationships Great 17.2 14.1 18.4 11.5 Some 44.8 42.0 38.0 35.8 None 37.9 43.9 43.6 52.7
Slightly more than 17 percent of students said that their paid work had a greatly negative
impact on their academic success and over half of current students reported that their paid
work had some impact on their academic success. A slightly lower proportion of graduates
appear to be greatly or somewhat negatively impacted in their academic success by their
paid work and a much greater proportion of graduates (45%) indicated that their jobs had no
impact on their academic success when compared with current students.
With regard to the impact of paid work on students’ course scheduling (that is, fitting in
desired courses around work schedules), Year 3 students were the most negatively
affected, with 17.8 percent of them reporting that their jobs had a great negative effect on
course scheduling and 34.1 percent reporting that their jobs had some negative effect. Year
1 students typically have a prescribed course schedule; therefore, it is not surprising that
their course schedules were much less affected by their paid work.
Overall, when compared with graduates, a greater proportion of current students reported
that their academic success (68% to 73% of students compared with 55.4% of graduates)
and family/personal relationships (56% to 62% of students compared with 47.3% of
graduates) were at least somewhat negatively impacted by their part-time work.
What is the relationship between part-time work and students’ debt load? Do students who
work part-time have greater debt than those who do not, or does their income from part-time
work make their debt loads smaller? Table 6.7 presents students and graduates with and
143
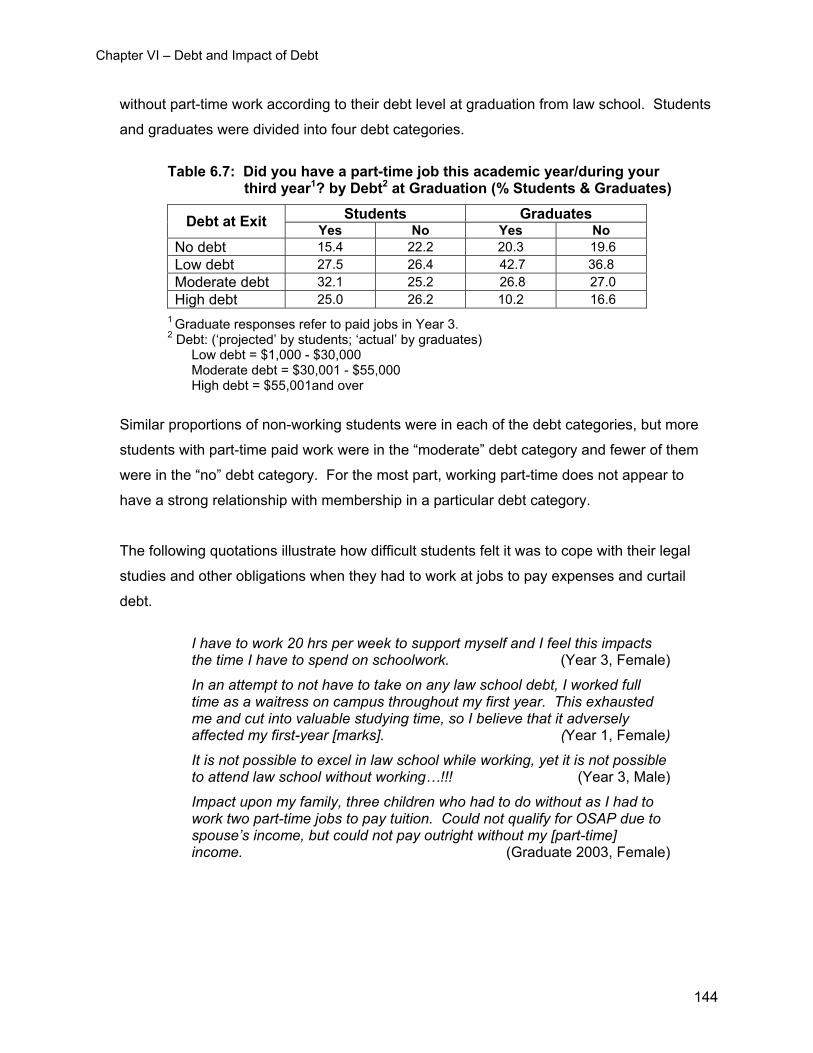
Chapter VI – Debt and Impact of Debt
without part-time work according to their debt level at graduation from law school. Students
and graduates were divided into four debt categories.
Table 6.7: Did you have a part-time job this academic year/during your
third year1? by Debt2 at Graduation (% Students & Graduates)
Students Graduates Debt at Exit Yes No Yes No No debt 15.4 22.2 20.3 19.6 Low debt 27.5 26.4 42.7 36.8 Moderate debt 32.1 25.2 26.8 27.0 High debt 25.0 26.2 10.2 16.6
1 Graduate responses refer to paid jobs in Year 3. 2 Debt: (‘projected’ by students; ‘actual’ by graduates) Low debt = $1,000 - $30,000 Moderate debt = $30,001 - $55,000 High debt = $55,001and over
Similar proportions of non-working students were in each of the debt categories, but more
students with part-time paid work were in the “moderate” debt category and fewer of them
were in the “no” debt category. For the most part, working part-time does not appear to
have a strong relationship with membership in a particular debt category.
The following quotations illustrate how difficult students felt it was to cope with their legal
studies and other obligations when they had to work at jobs to pay expenses and curtail
debt.
I have to work 20 hrs per week to support myself and I feel this impacts the time I have to spend on schoolwork. (Year 3, Female)
In an attempt to not have to take on any law school debt, I worked full time as a waitress on campus throughout my first year. This exhausted me and cut into valuable studying time, so I believe that it adversely affected my first-year [marks]. (Year 1, Female)
It is not possible to excel in law school while working, yet it is not possible to attend law school without working…!!! (Year 3, Male)
Impact upon my family, three children who had to do without as I had to work two part-time jobs to pay tuition. Could not qualify for OSAP due to spouse’s income, but could not pay outright without my [part-time] income. (Graduate 2003, Female)
144
Chapter VI – Debt and Impact of Debt
C. Impact of Debt Load
In this section we discuss the impact of student and graduate debt on career decisions, the law
school experience, family and other personal relationships, and basic needs1. In order to
facilitate the analysis of the impact of debt on various aspects of law students’ lives, survey
respondents were divided into three groups based on their level of debt—low, moderate and
high. Respondents’ debt levels were assigned differently depending on whether the respondent
was a current student or a recent graduate, and for current students, depending on whether
they were in Year 1, 2 or 3. For Year 1 students the level of a student’s debt at entry to the
program was used in the analysis, whereas for Year 2 and 3 students current debt level was
used (i.e., debt level at the time that the student completed the survey). For graduates, debt
level at graduation was used to assign graduates to groups based on debt level. The relative
impact of debt on students in the different debt groups was then examined to determine how
each group was differentially affected by debt. Students with no debt and those who did not
respond to the question were excluded from the analysis.
1. Impact of Debt on Career Decisions a. Articling Placement As noted, law students’ debt loads have increased over the years since tuition
deregulation. Since the vast majority of student debt must be repaid once a student
leaves law school, we would expect that decisions about articling (i.e., location, type of
law and starting salary) and similar decisions about the practice of law would be affected
by a student’s debt level given their short- and long-term effects on students’ income and
financial future.
1 On the survey, students and graduates were asked the question about the impact of debt on these
aspects differently. Students carrying loans were asked: If you have incurred debt associated with law school at this university, to what extent has it adversely affected the following? Graduates were asked: If you were carrying substantial debt through law school, to what extent did it adversely affect the following?
145
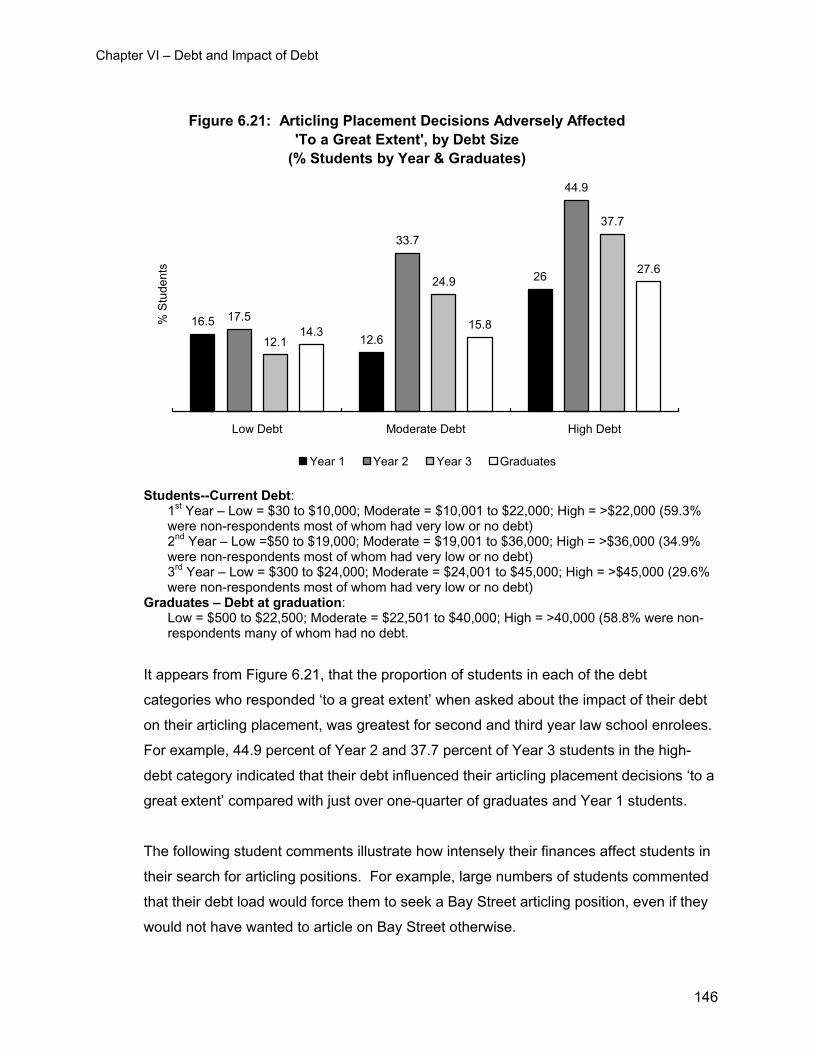
Chapter VI – Debt and Impact of Debt
Figure 6.21: Articling Placement Decisions Adversely Affected 'To a Great Extent', by Debt Size
(% Students by Year & Graduates)
16.512.6
26
17.5
33.7
44.9
12.1
24.9
37.7
14.3 15.8
27.6
Low Debt Moderate Debt High Debt
% S
tude
nts
Year 1 Year 2 Year 3 Graduates
Students--Current Debt: 1st Year – Low = $30 to $10,000; Moderate = $10,001 to $22,000; High = >$22,000 (59.3% were non-respondents most of whom had very low or no debt) 2nd Year – Low =$50 to $19,000; Moderate = $19,001 to $36,000; High = >$36,000 (34.9% were non-respondents most of whom had very low or no debt) 3rd Year – Low = $300 to $24,000; Moderate = $24,001 to $45,000; High = >$45,000 (29.6% were non-respondents most of whom had very low or no debt)
Graduates – Debt at graduation: Low = $500 to $22,500; Moderate = $22,501 to $40,000; High = >40,000 (58.8% were non-respondents many of whom had no debt.
It appears from Figure 6.21, that the proportion of students in each of the debt
categories who responded ‘to a great extent’ when asked about the impact of their debt
on their articling placement, was greatest for second and third year law school enrolees.
For example, 44.9 percent of Year 2 and 37.7 percent of Year 3 students in the high-
debt category indicated that their debt influenced their articling placement decisions ‘to a
great extent’ compared with just over one-quarter of graduates and Year 1 students.
The following student comments illustrate how intensely their finances affect students in
their search for articling positions. For example, large numbers of students commented
that their debt load would force them to seek a Bay Street articling position, even if they
would not have wanted to article on Bay Street otherwise.
146
Chapter VI – Debt and Impact of Debt
Having a debt load has completely shifted where I am articling. I would never have decided to article on Bay St. if tuition had been lower. (Year 3, Female)
The only reason I am applying for a “Bay St” law firm is because of the debt….It frustrates the process of learning when the overwhelming concern is the ability to pay for school…. (Year 3, Female)
Others were concerned about being unable to article in an area of law or in a
setting that they preferred (e.g., an area of law related to public service or a
smaller firm setting).
I am now, after a summer or working in a large firm, likely going to enter that firm after articling to get out of debt. I never imagined myself working in corporate law and choosing courses and what activities I would participate in to be more compatible with corporate success… (Year 3, Female)
[debt] made it much more difficult to explore the possibility of articling with either a small firm or legal aid. As well, it limited the cities to which I applied for articles. I could not go and practise in a smaller town. (Graduate 2003, Male)
Some students stated that their living costs prevented them from accessing important
articling interviews.
The cost of applying and interviewing for articling positions has had an effect on my family’s resources in an adverse way. Many sacrifices have been made that we can’t afford. All this on top of simple tuition, books and living costs. The reason why a student accepts or declines an articling interview should not be solely based on their financial status, i.e., costs of hotel, bus/rental car, etc. (Year 3, Male)
b. Type of Law to be Practised In addition to articling decisions, the students were asked on the survey to indicate how
much their debt load would influence the type of law that they planned to practise. The
assumption here was that the higher the student’s debt load, the greater the likelihood
that they would seek employment in an area of law with the greatest potential for
economic return.
147
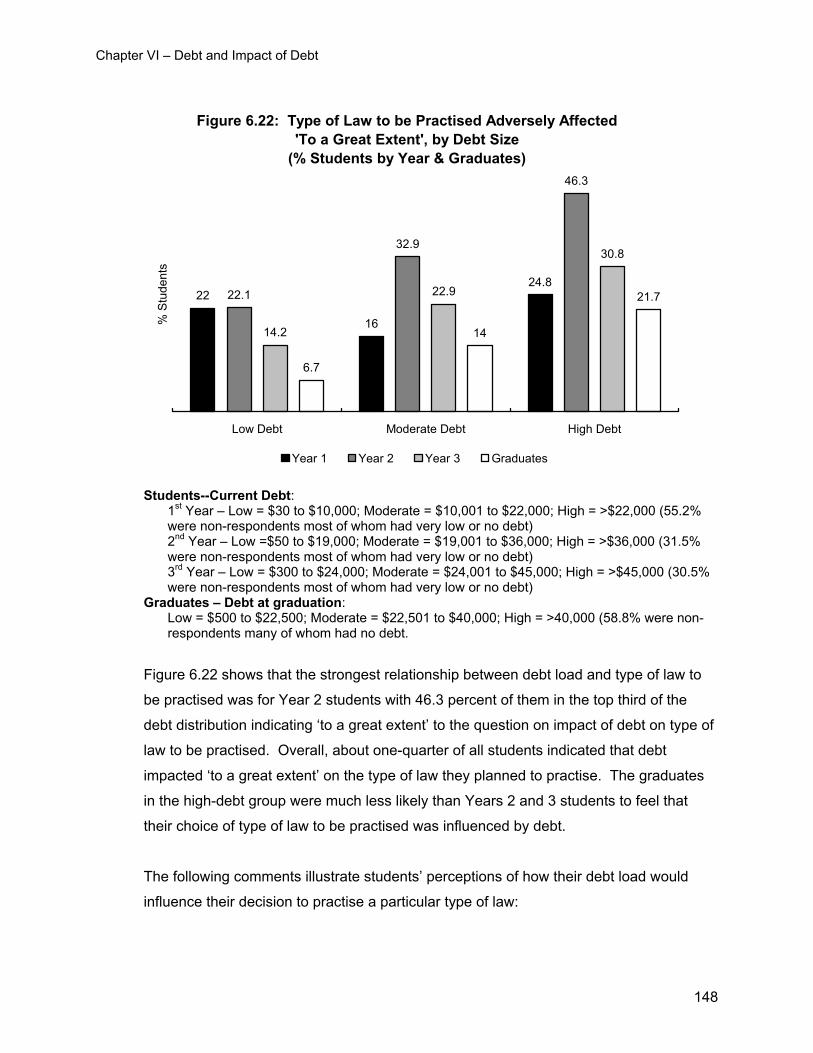
Chapter VI – Debt and Impact of Debt
Figure 6.22: Type of Law to be Practised Adversely Affected 'To a Great Extent', by Debt Size
(% Students by Year & Graduates)
22
16
24.822.1
32.9
46.3
14.2
22.9
30.8
6.7
14
21.7
Low Debt Moderate Debt High Debt
% S
tude
nts
Year 1 Year 2 Year 3 Graduates
Students--Current Debt: 1st Year – Low = $30 to $10,000; Moderate = $10,001 to $22,000; High = >$22,000 (55.2% were non-respondents most of whom had very low or no debt) 2nd Year – Low =$50 to $19,000; Moderate = $19,001 to $36,000; High = >$36,000 (31.5% were non-respondents most of whom had very low or no debt) 3rd Year – Low = $300 to $24,000; Moderate = $24,001 to $45,000; High = >$45,000 (30.5% were non-respondents most of whom had very low or no debt)
Graduates – Debt at graduation: Low = $500 to $22,500; Moderate = $22,501 to $40,000; High = >40,000 (58.8% were non-respondents many of whom had no debt.
Figure 6.22 shows that the strongest relationship between debt load and type of law to
be practised was for Year 2 students with 46.3 percent of them in the top third of the
debt distribution indicating ‘to a great extent’ to the question on impact of debt on type of
law to be practised. Overall, about one-quarter of all students indicated that debt
impacted ‘to a great extent’ on the type of law they planned to practise. The graduates
in the high-debt group were much less likely than Years 2 and 3 students to feel that
their choice of type of law to be practised was influenced by debt.
The following comments illustrate students’ perceptions of how their debt load would
influence their decision to practise a particular type of law:
148
Chapter VI – Debt and Impact of Debt
… My practise area and articling choices have been pre-determined by the high costs of tuition. I can't help but feel that the public service and NGOs are adversely affected by the pressures on students to accept the highest possible paying job despite their interest in practising in the public interest. (Year 3, Female)
Despite the temptation to take a higher paying position regardless of one’s
interests in order to pay off debt, some students were determined not to let their
debt load keep them from practising in an area of law that they valued.
I came to law school to practise environmental law, I have been tempted to pick a more lucrative career instead. I will continue to scrape by but at least not hate myself. (Year 3, Female)
I say that my debt load did not impact on my articling placement, the type of law I wanted to practise nor the choice of law subject studied. I want to explain that I am very committed to social justice and simply would not practise in any other field. (Year 2, Female)
2. Impact of Debt on Law School Experience The students were asked a series of survey questions regarding the impact of debt on
course selection, purchase of texts and supporting materials, academic achievement, and
satisfaction with the law school experience. In order to facilitate the analysis, students and
graduates were again divided into low, moderate and high debt categories according to the
procedure described in the introduction to Part C of this chapter.
a. Choice of Law Subjects Studied As noted, Year 1 law students are typically required to take a prescribed first year
curriculum leaving them with little or no course choice opportunities. Upper year law
students have more flexibility in terms of their course selection and most try to choose
courses that will be of value to them in their future employment. Therefore, if students
who anticipate substantial debt at graduation tend to be attracted to more profitable
areas of practice, we would anticipate that these same students would be most likely to
select courses that prepare them for a career with the greatest potential for economic
return (i.e., in a large corporate firm on Bay Street).
149
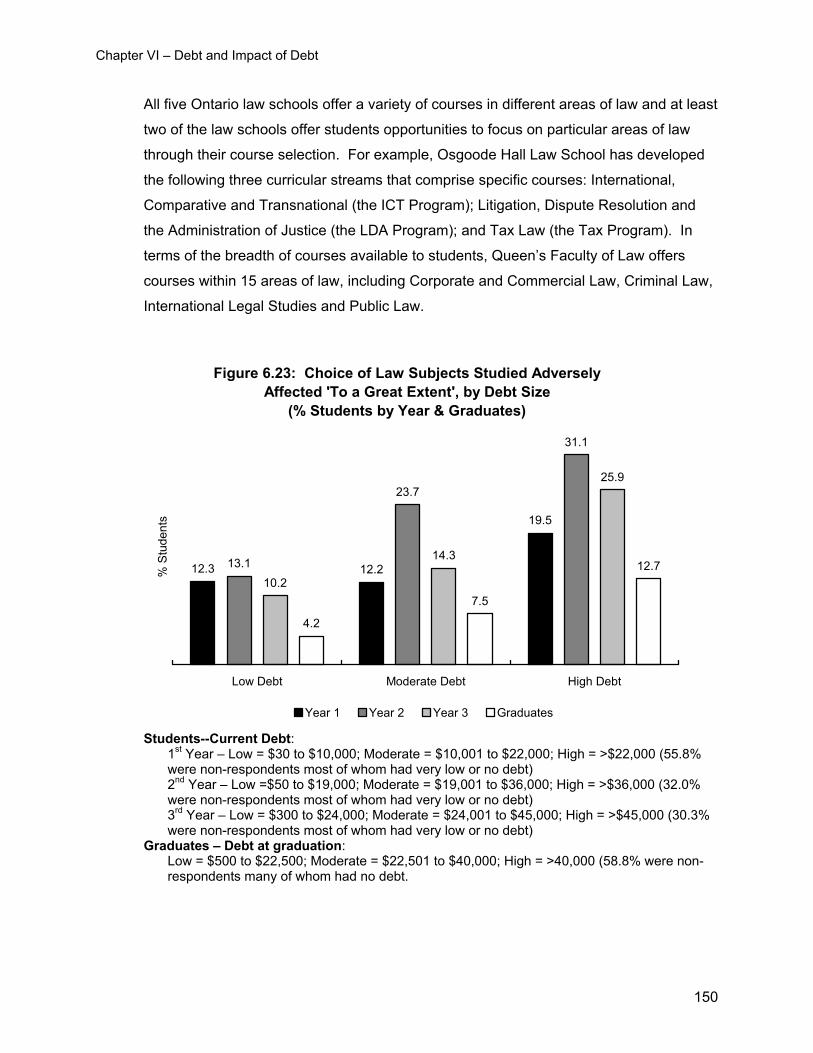
Chapter VI – Debt and Impact of Debt
All five Ontario law schools offer a variety of courses in different areas of law and at least
two of the law schools offer students opportunities to focus on particular areas of law
through their course selection. For example, Osgoode Hall Law School has developed
the following three curricular streams that comprise specific courses: International,
Comparative and Transnational (the ICT Program); Litigation, Dispute Resolution and
the Administration of Justice (the LDA Program); and Tax Law (the Tax Program). In
terms of the breadth of courses available to students, Queen’s Faculty of Law offers
courses within 15 areas of law, including Corporate and Commercial Law, Criminal Law,
International Legal Studies and Public Law.
Figure 6.23: Choice of Law Subjects Studied Adversely Affected 'To a Great Extent', by Debt Size
(% Students by Year & Graduates)
12.3 12.2
19.5
13.1
23.7
31.1
10.2
14.3
25.9
4.2
7.5
12.7
Low Debt Moderate Debt High Debt
% S
tude
nts
Year 1 Year 2 Year 3 Graduates
Students--Current Debt: 1st Year – Low = $30 to $10,000; Moderate = $10,001 to $22,000; High = >$22,000 (55.8% were non-respondents most of whom had very low or no debt) 2nd Year – Low =$50 to $19,000; Moderate = $19,001 to $36,000; High = >$36,000 (32.0% were non-respondents most of whom had very low or no debt) 3rd Year – Low = $300 to $24,000; Moderate = $24,001 to $45,000; High = >$45,000 (30.3% were non-respondents most of whom had very low or no debt)
Graduates – Debt at graduation: Low = $500 to $22,500; Moderate = $22,501 to $40,000; High = >40,000 (58.8% were non-respondents many of whom had no debt.
150
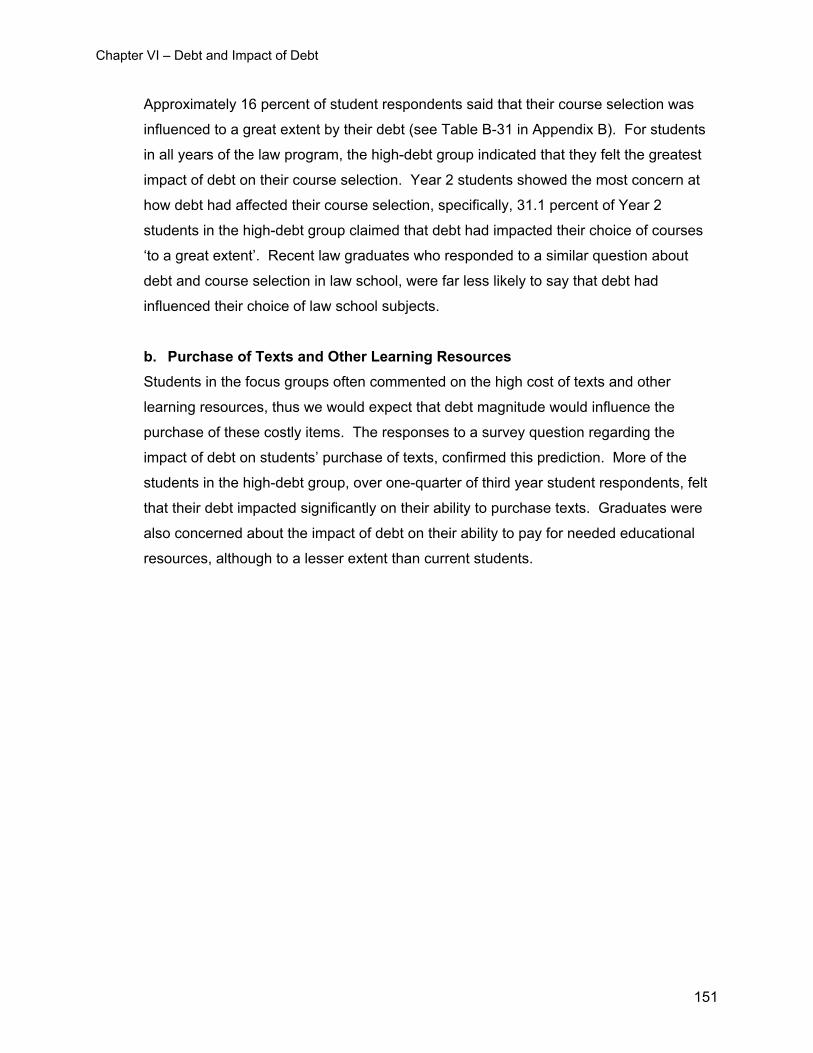
Chapter VI – Debt and Impact of Debt
Approximately 16 percent of student respondents said that their course selection was
influenced to a great extent by their debt (see Table B-31 in Appendix B). For students
in all years of the law program, the high-debt group indicated that they felt the greatest
impact of debt on their course selection. Year 2 students showed the most concern at
how debt had affected their course selection, specifically, 31.1 percent of Year 2
students in the high-debt group claimed that debt had impacted their choice of courses
‘to a great extent’. Recent law graduates who responded to a similar question about
debt and course selection in law school, were far less likely to say that debt had
influenced their choice of law school subjects.
b. Purchase of Texts and Other Learning Resources Students in the focus groups often commented on the high cost of texts and other
learning resources, thus we would expect that debt magnitude would influence the
purchase of these costly items. The responses to a survey question regarding the
impact of debt on students’ purchase of texts, confirmed this prediction. More of the
students in the high-debt group, over one-quarter of third year student respondents, felt
that their debt impacted significantly on their ability to purchase texts. Graduates were
also concerned about the impact of debt on their ability to pay for needed educational
resources, although to a lesser extent than current students.
151
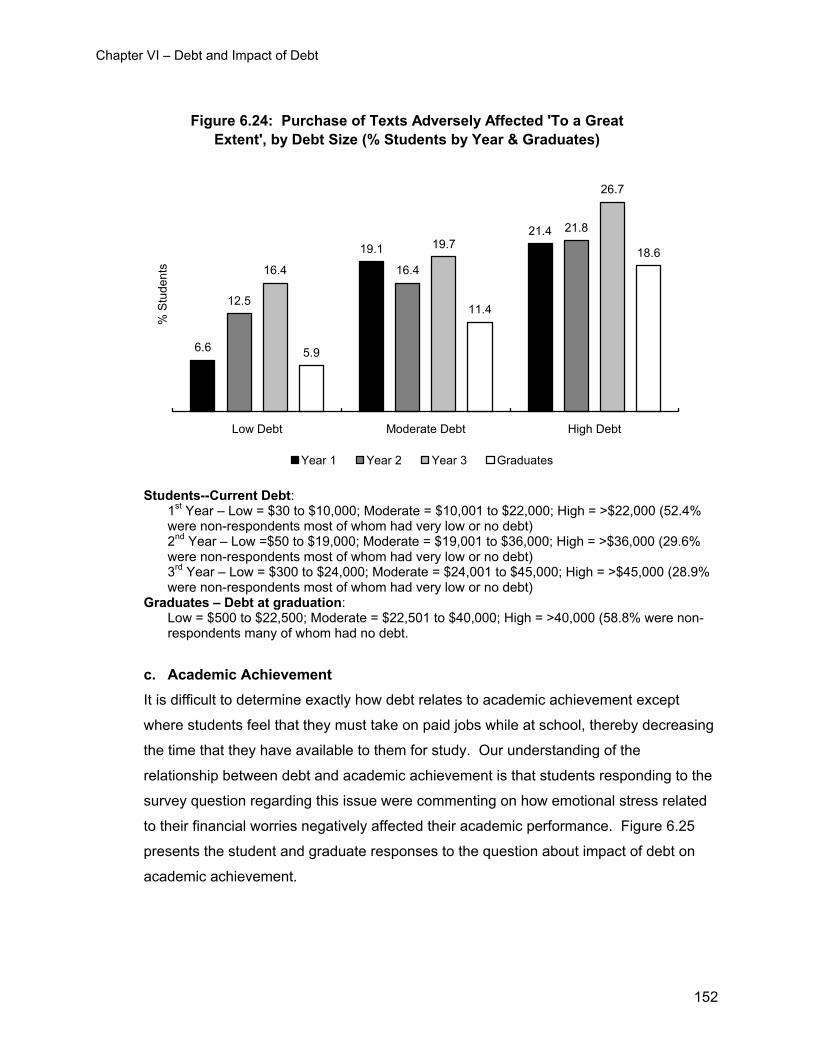
Chapter VI – Debt and Impact of Debt
Figure 6.24: Purchase of Texts Adversely Affected 'To a Great Extent', by Debt Size (% Students by Year & Graduates)
6.6
19.121.4
12.5
16.4
21.8
16.4
19.7
26.7
5.9
11.4
18.6
Low Debt Moderate Debt High Debt
% S
tude
nts
Year 1 Year 2 Year 3 Graduates
Students--Current Debt: 1st Year – Low = $30 to $10,000; Moderate = $10,001 to $22,000; High = >$22,000 (52.4% were non-respondents most of whom had very low or no debt) 2nd Year – Low =$50 to $19,000; Moderate = $19,001 to $36,000; High = >$36,000 (29.6% were non-respondents most of whom had very low or no debt) 3rd Year – Low = $300 to $24,000; Moderate = $24,001 to $45,000; High = >$45,000 (28.9% were non-respondents most of whom had very low or no debt)
Graduates – Debt at graduation: Low = $500 to $22,500; Moderate = $22,501 to $40,000; High = >40,000 (58.8% were non-respondents many of whom had no debt.
c. Academic Achievement It is difficult to determine exactly how debt relates to academic achievement except
where students feel that they must take on paid jobs while at school, thereby decreasing
the time that they have available to them for study. Our understanding of the
relationship between debt and academic achievement is that students responding to the
survey question regarding this issue were commenting on how emotional stress related
to their financial worries negatively affected their academic performance. Figure 6.25
presents the student and graduate responses to the question about impact of debt on
academic achievement.
152
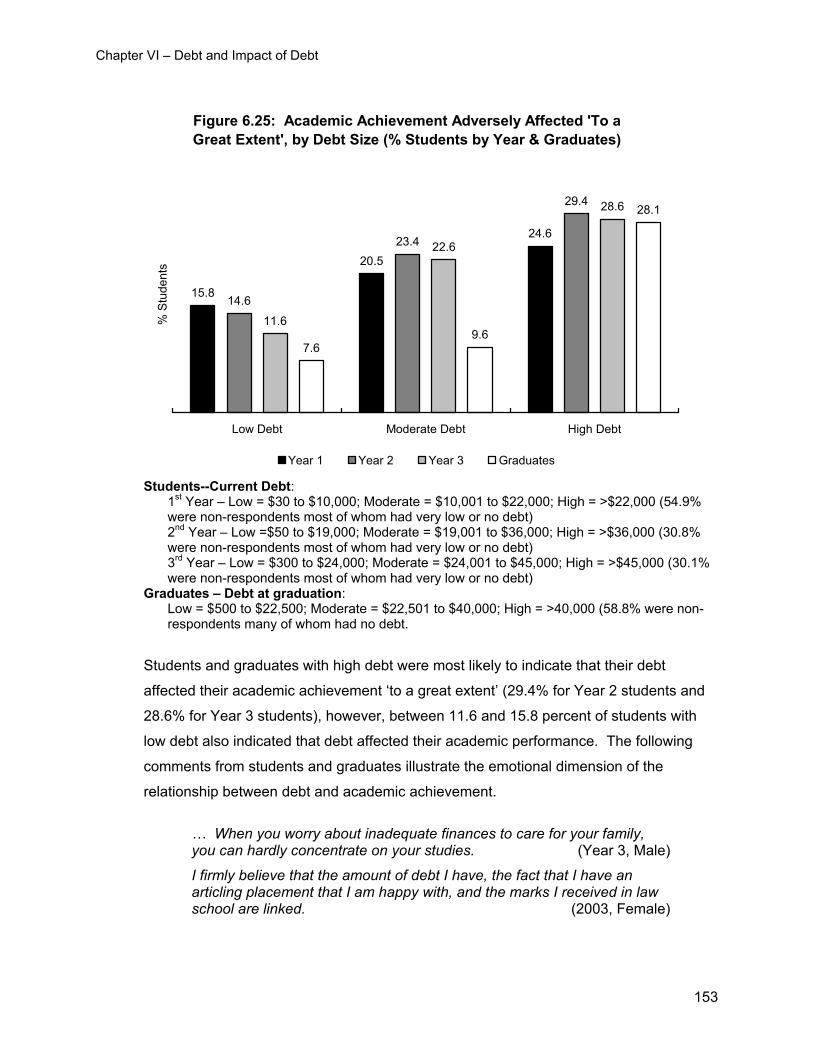
Chapter VI – Debt and Impact of Debt
Figure 6.25: Academic Achievement Adversely Affected 'To a Great Extent', by Debt Size (% Students by Year & Graduates)
15.8
20.5
24.6
14.6
23.4
29.4
11.6
22.6
28.6
7.69.6
28.1
Low Debt Moderate Debt High Debt
% S
tude
nts
Year 1 Year 2 Year 3 Graduates
Students--Current Debt: 1st Year – Low = $30 to $10,000; Moderate = $10,001 to $22,000; High = >$22,000 (54.9% were non-respondents most of whom had very low or no debt) 2nd Year – Low =$50 to $19,000; Moderate = $19,001 to $36,000; High = >$36,000 (30.8% were non-respondents most of whom had very low or no debt) 3rd Year – Low = $300 to $24,000; Moderate = $24,001 to $45,000; High = >$45,000 (30.1% were non-respondents most of whom had very low or no debt)
Graduates – Debt at graduation: Low = $500 to $22,500; Moderate = $22,501 to $40,000; High = >40,000 (58.8% were non-respondents many of whom had no debt.
Students and graduates with high debt were most likely to indicate that their debt
affected their academic achievement ‘to a great extent’ (29.4% for Year 2 students and
28.6% for Year 3 students), however, between 11.6 and 15.8 percent of students with
low debt also indicated that debt affected their academic performance. The following
comments from students and graduates illustrate the emotional dimension of the
relationship between debt and academic achievement.
… When you worry about inadequate finances to care for your family, you can hardly concentrate on your studies. (Year 3, Male)
I firmly believe that the amount of debt I have, the fact that I have an articling placement that I am happy with, and the marks I received in law school are linked. (2003, Female)
153
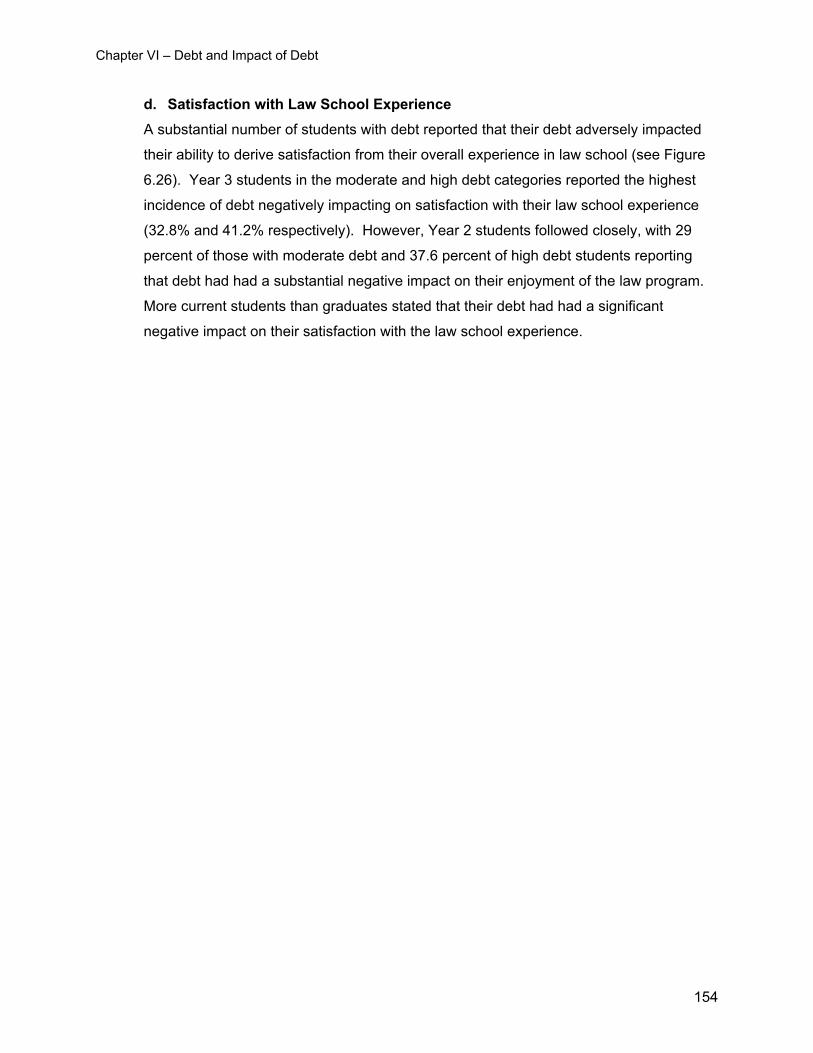
Chapter VI – Debt and Impact of Debt
d. Satisfaction with Law School Experience A substantial number of students with debt reported that their debt adversely impacted
their ability to derive satisfaction from their overall experience in law school (see Figure
6.26). Year 3 students in the moderate and high debt categories reported the highest
incidence of debt negatively impacting on satisfaction with their law school experience
(32.8% and 41.2% respectively). However, Year 2 students followed closely, with 29
percent of those with moderate debt and 37.6 percent of high debt students reporting
that debt had had a substantial negative impact on their enjoyment of the law program.
More current students than graduates stated that their debt had had a significant
negative impact on their satisfaction with the law school experience.
154
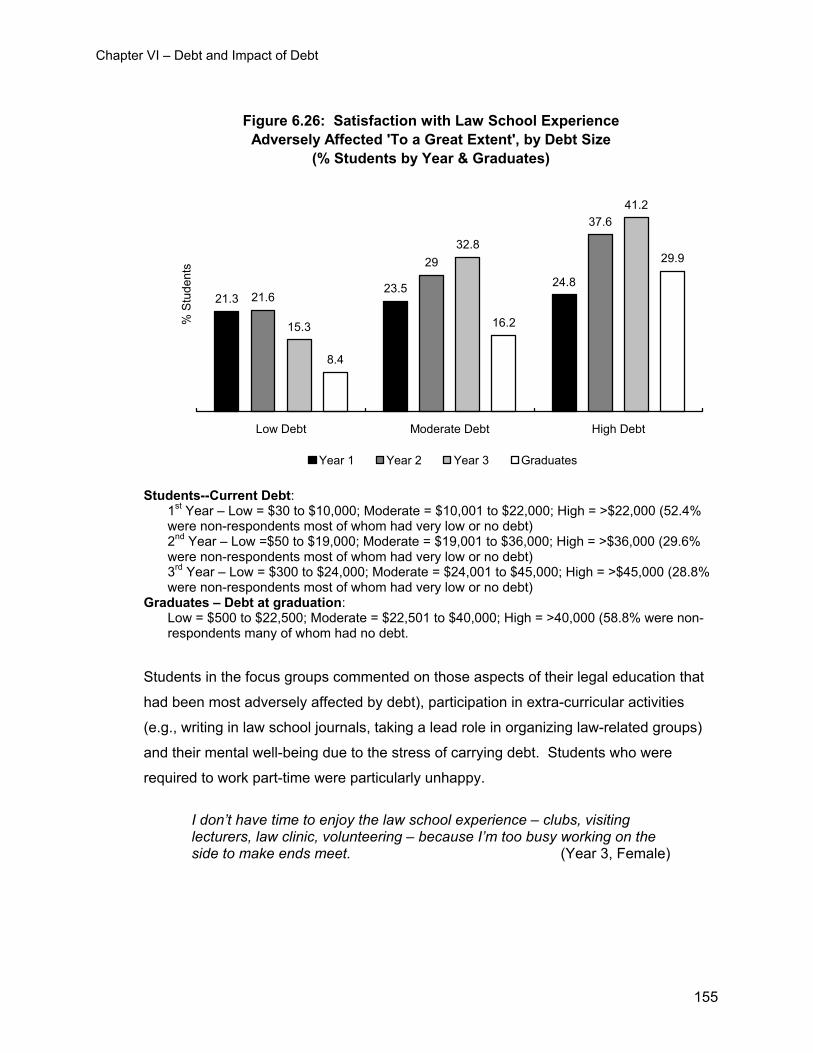
Chapter VI – Debt and Impact of Debt
Figure 6.26: Satisfaction with Law School Experience Adversely Affected 'To a Great Extent', by Debt Size
(% Students by Year & Graduates)
21.323.5 24.8
21.6
29
37.6
15.3
32.8
41.2
8.4
16.2
29.9
Low Debt Moderate Debt High Debt
% S
tude
nts
Year 1 Year 2 Year 3 Graduates
Students--Current Debt: 1st Year – Low = $30 to $10,000; Moderate = $10,001 to $22,000; High = >$22,000 (52.4% were non-respondents most of whom had very low or no debt) 2nd Year – Low =$50 to $19,000; Moderate = $19,001 to $36,000; High = >$36,000 (29.6% were non-respondents most of whom had very low or no debt) 3rd Year – Low = $300 to $24,000; Moderate = $24,001 to $45,000; High = >$45,000 (28.8% were non-respondents most of whom had very low or no debt)
Graduates – Debt at graduation: Low = $500 to $22,500; Moderate = $22,501 to $40,000; High = >40,000 (58.8% were non-respondents many of whom had no debt.
Students in the focus groups commented on those aspects of their legal education that
had been most adversely affected by debt), participation in extra-curricular activities
(e.g., writing in law school journals, taking a lead role in organizing law-related groups)
and their mental well-being due to the stress of carrying debt. Students who were
required to work part-time were particularly unhappy.
I don’t have time to enjoy the law school experience – clubs, visiting lecturers, law clinic, volunteering – because I’m too busy working on the side to make ends meet. (Year 3, Female)
155
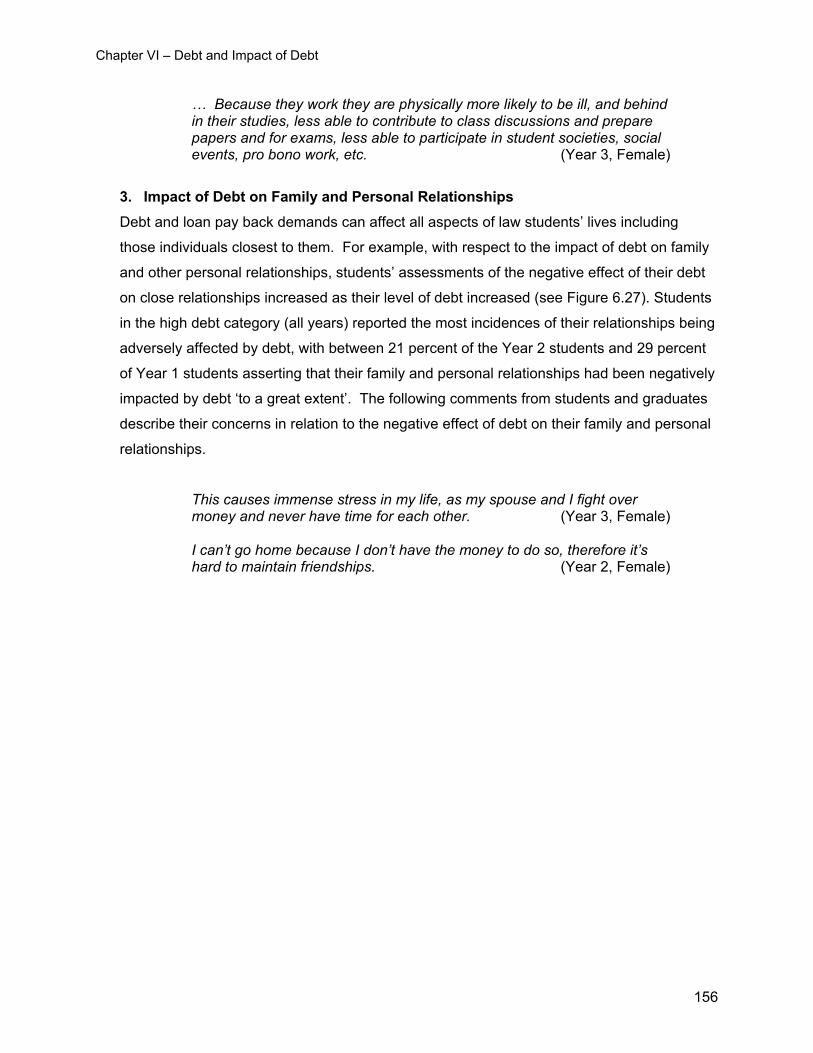
Chapter VI – Debt and Impact of Debt
… Because they work they are physically more likely to be ill, and behind in their studies, less able to contribute to class discussions and prepare papers and for exams, less able to participate in student societies, social events, pro bono work, etc. (Year 3, Female)
3. Impact of Debt on Family and Personal Relationships Debt and loan pay back demands can affect all aspects of law students’ lives including
those individuals closest to them. For example, with respect to the impact of debt on family
and other personal relationships, students’ assessments of the negative effect of their debt
on close relationships increased as their level of debt increased (see Figure 6.27). Students
in the high debt category (all years) reported the most incidences of their relationships being
adversely affected by debt, with between 21 percent of the Year 2 students and 29 percent
of Year 1 students asserting that their family and personal relationships had been negatively
impacted by debt ‘to a great extent’. The following comments from students and graduates
describe their concerns in relation to the negative effect of debt on their family and personal
relationships.
This causes immense stress in my life, as my spouse and I fight over money and never have time for each other. (Year 3, Female) I can’t go home because I don’t have the money to do so, therefore it’s hard to maintain friendships. (Year 2, Female)
156
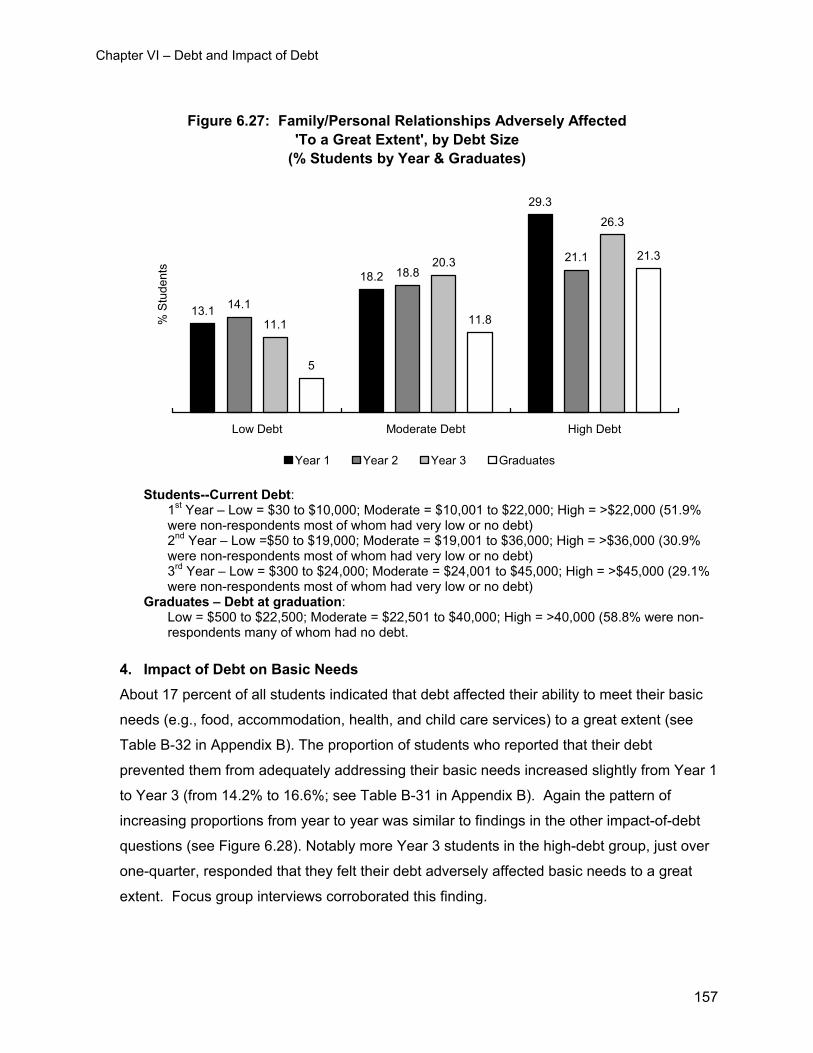
Chapter VI – Debt and Impact of Debt
Figure 6.27: Family/Personal Relationships Adversely Affected 'To a Great Extent', by Debt Size
(% Students by Year & Graduates)
13.1
18.2
29.3
14.1
18.821.1
11.1
20.3
26.3
5
11.8
21.3
Low Debt Moderate Debt High Debt
% S
tude
nts
Year 1 Year 2 Year 3 Graduates
Students--Current Debt: 1st Year – Low = $30 to $10,000; Moderate = $10,001 to $22,000; High = >$22,000 (51.9% were non-respondents most of whom had very low or no debt) 2nd Year – Low =$50 to $19,000; Moderate = $19,001 to $36,000; High = >$36,000 (30.9% were non-respondents most of whom had very low or no debt) 3rd Year – Low = $300 to $24,000; Moderate = $24,001 to $45,000; High = >$45,000 (29.1% were non-respondents most of whom had very low or no debt)
Graduates – Debt at graduation: Low = $500 to $22,500; Moderate = $22,501 to $40,000; High = >40,000 (58.8% were non-respondents many of whom had no debt.
4. Impact of Debt on Basic Needs About 17 percent of all students indicated that debt affected their ability to meet their basic
needs (e.g., food, accommodation, health, and child care services) to a great extent (see
Table B-32 in Appendix B). The proportion of students who reported that their debt
prevented them from adequately addressing their basic needs increased slightly from Year 1
to Year 3 (from 14.2% to 16.6%; see Table B-31 in Appendix B). Again the pattern of
increasing proportions from year to year was similar to findings in the other impact-of-debt
questions (see Figure 6.28). Notably more Year 3 students in the high-debt group, just over
one-quarter, responded that they felt their debt adversely affected basic needs to a great
extent. Focus group interviews corroborated this finding.
157
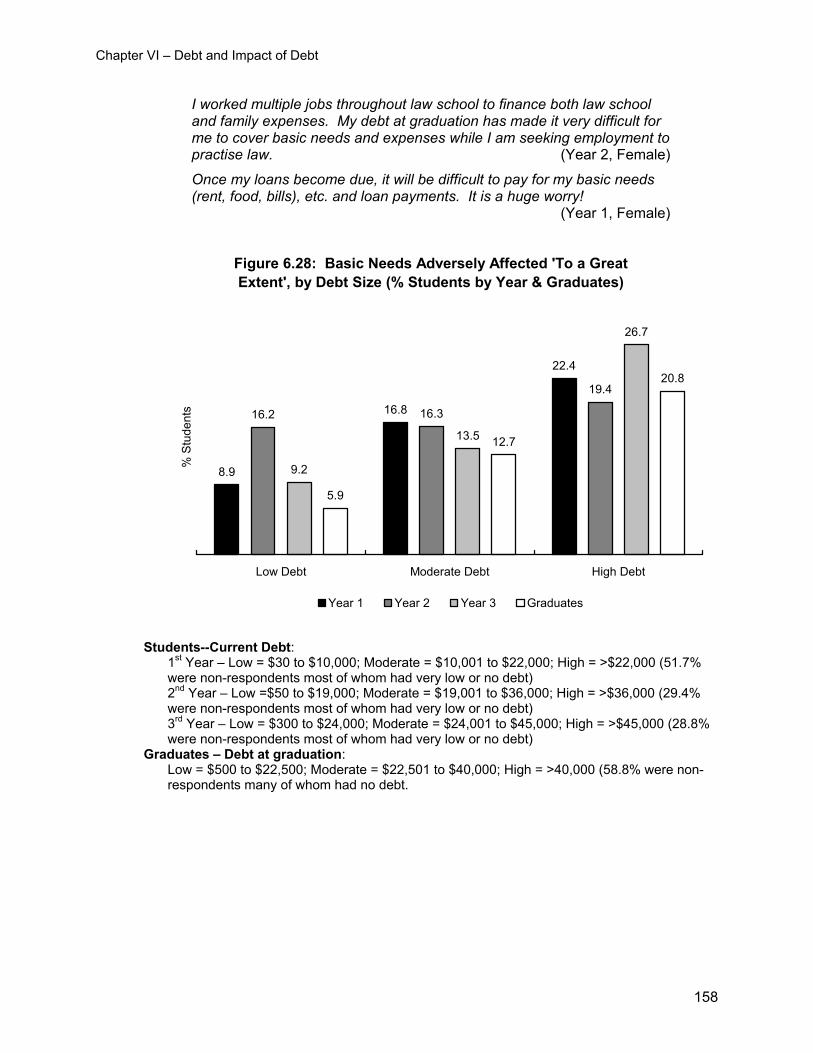
Chapter VI – Debt and Impact of Debt
I worked multiple jobs throughout law school to finance both law school and family expenses. My debt at graduation has made it very difficult for me to cover basic needs and expenses while I am seeking employment to practise law. (Year 2, Female)
Once my loans become due, it will be difficult to pay for my basic needs (rent, food, bills), etc. and loan payments. It is a huge worry!
(Year 1, Female)
Figure 6.28: Basic Needs Adversely Affected 'To a Great Extent', by Debt Size (% Students by Year & Graduates)
8.9
16.8
22.4
16.2 16.3
19.4
9.2
13.5
26.7
5.9
12.7
20.8
Low Debt Moderate Debt High Debt
% S
tude
nts
Year 1 Year 2 Year 3 Graduates
Students--Current Debt:
1st Year – Low = $30 to $10,000; Moderate = $10,001 to $22,000; High = >$22,000 (51.7% were non-respondents most of whom had very low or no debt) 2nd Year – Low =$50 to $19,000; Moderate = $19,001 to $36,000; High = >$36,000 (29.4% were non-respondents most of whom had very low or no debt) 3rd Year – Low = $300 to $24,000; Moderate = $24,001 to $45,000; High = >$45,000 (28.8% were non-respondents most of whom had very low or no debt)
Graduates – Debt at graduation: Low = $500 to $22,500; Moderate = $22,501 to $40,000; High = >40,000 (58.8% were non-respondents many of whom had no debt.
158
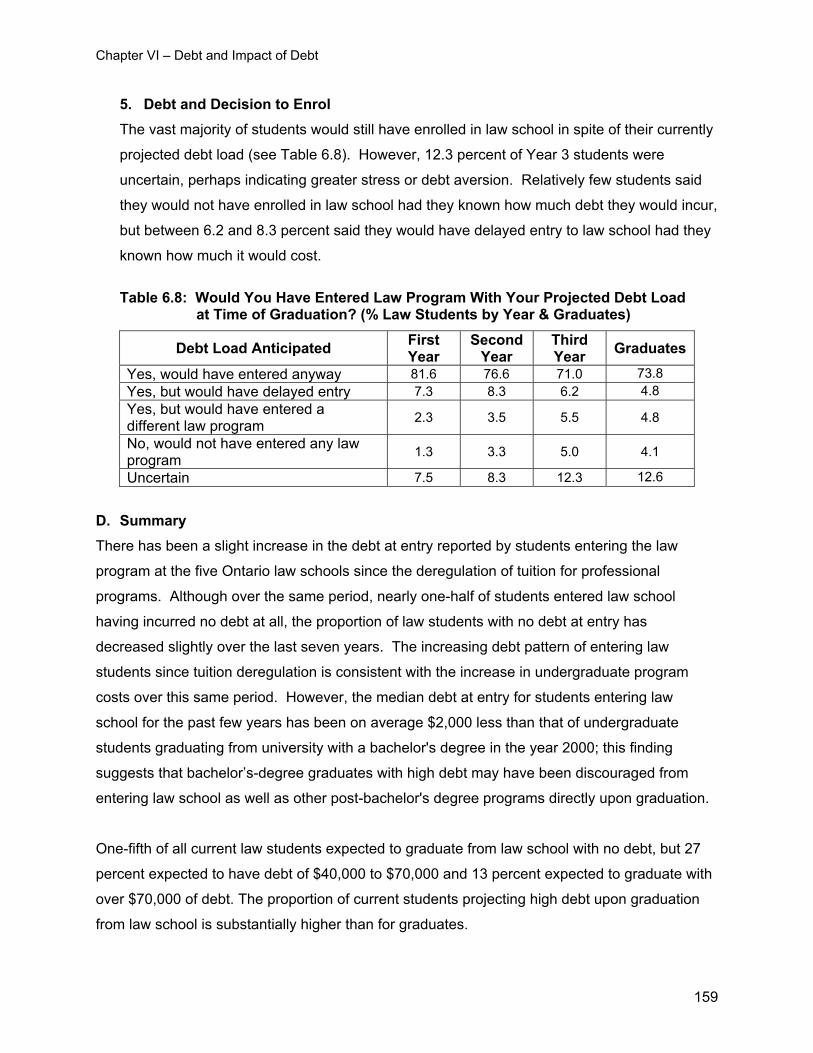
Chapter VI – Debt and Impact of Debt
5. Debt and Decision to Enrol The vast majority of students would still have enrolled in law school in spite of their currently
projected debt load (see Table 6.8). However, 12.3 percent of Year 3 students were
uncertain, perhaps indicating greater stress or debt aversion. Relatively few students said
they would not have enrolled in law school had they known how much debt they would incur,
but between 6.2 and 8.3 percent said they would have delayed entry to law school had they
known how much it would cost. Table 6.8: Would You Have Entered Law Program With Your Projected Debt Load
at Time of Graduation? (% Law Students by Year & Graduates)
Debt Load Anticipated First Year
Second Year
Third Year Graduates
Yes, would have entered anyway 81.6 76.6 71.0 73.8 Yes, but would have delayed entry 7.3 8.3 6.2 4.8 Yes, but would have entered a different law program 2.3 3.5 5.5 4.8
No, would not have entered any law program 1.3 3.3 5.0 4.1
Uncertain 7.5 8.3 12.3 12.6 D. Summary There has been a slight increase in the debt at entry reported by students entering the law
program at the five Ontario law schools since the deregulation of tuition for professional
programs. Although over the same period, nearly one-half of students entered law school
having incurred no debt at all, the proportion of law students with no debt at entry has
decreased slightly over the last seven years. The increasing debt pattern of entering law
students since tuition deregulation is consistent with the increase in undergraduate program
costs over this same period. However, the median debt at entry for students entering law
school for the past few years has been on average $2,000 less than that of undergraduate
students graduating from university with a bachelor's degree in the year 2000; this finding
suggests that bachelor’s-degree graduates with high debt may have been discouraged from
entering law school as well as other post-bachelor's degree programs directly upon graduation.
One-fifth of all current law students expected to graduate from law school with no debt, but 27
percent expected to have debt of $40,000 to $70,000 and 13 percent expected to graduate with
over $70,000 of debt. The proportion of current students projecting high debt upon graduation
from law school is substantially higher than for graduates.
159
Chapter VI – Debt and Impact of Debt
Older students and those students and graduates with dependents tended to project or have
had more debt at graduation from law school than did younger students and students and
graduates without dependents. For graduates, slightly more women had high debt and more
men had low debt.
In general, law students and recent law graduates who reported French as their language of
comfort were more likely to have low to moderate debt than were those who reported that their
language of comfort was English. Law students and graduates whose parents had higher levels
of education were more likely to have no debt and were less likely to have high debt than
students and graduates whose parents had less education.
Black students and students of South Asian background were more likely than non-minority
students to anticipate having debt at exit from their law program (greater than $40,000) and
were less likely to anticipate having no debt at graduation. Students of Southeast Asian
background were more likely than non-minority students to anticipate having debt at exit from
their law program greater than $60,000. Students of Chinese background were less likely to
have debt over $40,000 and were more likely to have no debt than non-minority students.
Graduates, especially those with low debt, relied more than students on their savings as a major
source of funding their legal education. Students with low debt were far more likely than
graduates to indicate that their parents were a major source of financial support. High-debt
students were more likely than graduates to indicate that bank loans were a major source of
funding and were less likely than graduates to indicate that OSAP was a major source of
financial support.
While some students felt that their rapidly accumulating debt was negatively affecting every
aspect of their lives, other students were untouched by concerns about debt. Approximately 30
percent of Year 2 students with debt (65.1% of Year 2 respondents) indicated that their debt had
a substantial effect on their articling and practising decisions; for example, many felt obliged to
seek out high-paying positions rather than those in public service or smaller communities. For
current students with high debt, the area of law that they hoped to practise was the aspect of
their lives that they believed was most adversely affected by their debt. In comparison,
graduates with high debt claimed that their satisfaction with the law school experience was the
aspect of their lives most adversely affected by their debt.
160

Chapter VI – Debt and Impact of Debt
161
Upper-year students with moderate and high debt were the most likely of all respondent groups
to report that a particular aspect of their academic or personal lives was affected ‘to a great
extent’ by their debt, while graduates were the least likely to report that their lives during law
school were greatly impacted by their debt. Overall, it appears that more students have felt the
impact of debt on all aspects of their lives than did graduates.
CHAPTER VII – SUMMARY AND FUTURE DIRECTIONS
A. Introduction In this final chapter, we summarize the findings of the study in response to the questions raised
at the outset of this report. We also present a brief summary of the ‘myths’ to which some law
students ascribe and address these myths by reference to the findings. A brief outline of factors
contributing to the academic, professional and financial strains experienced by law students is
provided as context for the discussion on future directions that concludes this chapter.
The study was designed to examine changes in the characteristics of law students since the
deregulation of tuition using two primary data sources: (1) law school application and Year 1
registration information from the Ontario Law School Application Service (OLSAS) for the years
1997 to 2003; and (2) surveys of law school graduates enrolled in Year 1 in 1997 to 2000 and
students enrolled in Year 1 in 2001 to 2003.
B. Summary of Findings 1. Who Goes to Law School? Ontario law schools enrol a diverse student population with regard to ethnocultural
background, mature student status, disability status and geographic region of origin, in
keeping with their admissions goals related to diversity. There are some differences in
characteristics between students at the five Ontario law schools and their approximate age
group in the Ontario population. That is, law schools enrol proportionally: (1) more women
than men, as is the case with university programs in general; (2) more students from affluent
homes headed by parents with a university education (two-thirds of law students come from
the top 40 percent of the Canadian family income distribution and about 10 percent from the
bottom 40 percent of the distribution); (3) more students of Arab, Chinese, Korean and
South-Asian descent; (4) fewer Aboriginal students; and (5) more students from the Greater
Toronto Area and fewer from Northern Ontario.
2. Have there been changes in the background characteristics of law students since tuition deregulation?
There have been some slight but notable changes in the characteristics of law school
enrolees over the past seven years that may be attributed to tuition deregulation. They
include: (1) an increase of 4.7 percent in the proportion of law students’ parents who earn
163
Chapter VII – Analysis, Summary and Recommendations
incomes in the top 40 percent of the average family income distribution for Canada and a
decrease in the proportion of students whose parents earn incomes in the middle 20 percent
of the distribution; (2) an increase in the proportion of 24- and 25- year-old Year 1
registrants; (3) a decline in the proportion of registrants 23 and younger, indicating that a
higher proportion of Year 1 registrants are entering law school later than did their pre-tuition
deregulation counterparts; (4) an increase in the proportion of visible minority students,
particularly those individuals of South Asian and Chinese descent; (5) a decrease in the
proportion of students whose first language is French; and, (6) a decrease in the already
small proportion of students from Northern Ontario.
3. What are the major sources of student financial support, and to what extent have they changed since tuition deregulation?
Since the deregulation of tuition for professional programs at the end of 1997, tuition fees at
four of the five Ontario law schools have more than doubled, and tuition at the other has
more than tripled. Over this same period, the cost of law school excluding tuition—i.e.,
ancillary fees, living expenses and law program expenses (e.g., books, duplicating and other
supplies)—has increased by 14 percent based on changes in the Consumer Price Index
(between 1998 and 2003). The primary sources of financial aid distributed by the law
schools to students are needs-based bursaries and merit scholarships (neither type of
funding has to be repaid).
a. University/Law School Bursaries There has been a dramatic increase in the total amount of bursary money awarded to
students over the past five years. This increase parallels the Ontario government’s legal
requirement of universities to redirect a minimum of 30 percent of all deregulated tuition
to needs-based student financial aid. One-fifth of current law students cited
university/law school bursaries as a major source of financial support, and over two-fifths
of students reported that university/law school bursaries represented at least a moderate
source of financial support. In 2003-04, the average bursary amount granted per
student at the five Ontario law schools ranged from $2,059 to $4,752 and the percentage
of students receiving bursaries ranged from 46.8 percent to 68.5 percent. For most
students receiving the maximum bursaries, these awards cover the cost of their tuition.
However, for over one-half of current students, tuition increases have added to the cost
of their legal education.
164
Chapter VII – Analysis, Summary and Recommendations
b. Canada Millennium Bursaries A Canada Millennium Bursary is a federal government bursary that pays $3,000 per
academic year to students in financial need who have already completed some post-
secondary education. In Ontario, OSAP assesses students’ financial need and overall
eligibility for the Canada Millennium Bursary. If a student qualifies for the Millennium
Bursary in Ontario, he/she receives the bursary in addition to an OSAP loan amount that
is reduced by the bursary amount. One-quarter of Year 2 and 3 students and one-fifth of
Year 1 students consider the Canada Millennium Bursary to be a major source of
financial support. The Canada Millennium Bursary was first awarded in 2000 and has
not increased in amount since then.
c. Scholarships/Awards/Prizes Scholarships, awards and prizes are typically awarded based on assessments of a
student’s academic performance; however, at least two of the five law schools have a
number of ‘needs-based’ scholarships that assess a student’s financial need in
combination with academic achievement. There are more entrance scholarships than
upper year scholarships, meaning that a disproportionate amount of scholarship money
is awarded to Year 1 students. Between 11.2 and 18 percent of students across the five
law schools received scholarships, awards and prizes in 2003-04, and the average
scholarship/ award/prize amount granted per student ranged from $1,313 to $3,736.
While the total monies allocated to scholarships/awards/prizes have increased in recent
years, the number of students receiving this type of funding has not changed
substantially.
d. Parental support Parents represent a major source of financial support for just over one-quarter of current
students. The proportion of current students whose parents represent a major source of
financial support was similar to that of recent graduates. Students who identified parents
as a major source of financial support were far less likely to incur substantial debt while
at law school than students who do not.
165
Chapter VII – Analysis, Summary and Recommendations
e. Savings and Summer Jobs Almost all post-secondary students take on some kind of paid work during the four
months that they are not at university. Rather than entering the program directly upon
completion of their bachelor’s degree, some students may also have been in the work
force full time before beginning law school, providing them with an opportunity to
accumulate savings while they were employed. Fewer current students than graduates
stated that their own income/savings were a major source of financial support and nearly
twice as many students as graduates indicated that their savings were ‘little or no
source’ of financial support.
There is a great deal of competition between students in Years 1 and 2 of the law
program for summer jobs with law firms. Positions with Toronto law firms located on Bay
Street are the most highly contested as they tend to provide the highest salaries. Large
firms like those found on Bay Street, are also popular with students because they may
agree to pay a student’s Bar Admission Course costs as well as pay them a salary
during the Academic Phase of the course. It is clear that the debt load that a student
must carry is greatly reduced if he/she secures a well-paid summer job with a firm that
also provides funding during the Academic Phase of the Bar Admission Course.
f. Paid Part-Time/School Year Jobs Law students who wish to reduce their reliance on loans may choose to work part time
during the school year. About one-fifth of Year 1 and about two-fifths of Years 2 and 3
students held part-time jobs at the time of the survey, and one-fifth of the students who
worked did so for over 16 hours a week. Although those students who take on paid
employment while at school may reduce their debt, some believe that their academic
performance is negatively affected due to the time that they are required to spend doing
paid work. The majority of current law students who worked during the school year did
so in order to defray program-related costs. More than half of Year 2 and 3 students
who had paid employment worked in law-related positions. Surprisingly, fewer current
law students worked part time than did law graduates.
166
Chapter VII – Analysis, Summary and Recommendations
The provincial government provides funding for part-time student employment through
the Ontario Work Study Plan administered by the Ontario Student Assistance Program
(up to a maximum of $1,000 per term); nevertheless, very few students appear to take
advantage of this program.
g. Loans
i. Personal Loans Law students who negotiate personal loans typically do so with their parents.
Personal loans are preferable to other types of loans because they most often
involve minimal or no interest payments and tend to have flexible repayment
schedules. Approximately 13 percent of Year 2 and 3 students had personal loans.
The proportion of students indicating personal loans as a major source of financial
support has increased slightly since tuition deregulation.
ii. Canada-Ontario Integrated Student Loans (OSAP) The provincial and federal governments fund post-secondary educational loans
jointly through the Canada-Ontario Integrated Student Loan Program. Students who
wish to receive government student loans must apply to the Ontario Student
Assistance Program (OSAP) and submit evidence of their financial need. In Ontario,
law students are eligible to receive a maximum of $9,350 in government student
loans per academic year. When surveyed, over one-half of Year 2 and 3
respondents held OSAP-administered student loans. A greater proportion of
students than graduates considered OSAP-administered loans to be ‘little or no
source of financial support’. This result is not surprising given that the maximum
amount of OSAP funding has not increased in nine years and has, therefore,
decreased in real terms as a proportion of law school costs.
iii. Bank Loans, Lines of Credit and Credit Cards Of all the sources of financial support available to law students, bank funding
represents one of the few resources providing funding in amounts surpassing tuition
fees at the five Ontario law schools. Some Ontario law schools have recognized the
importance of bank funding for students by making special arrangements for their
students with a particular bank(s) although most major banks already offer special
rates to those individuals in professional programs. Few students entered their law
167
Chapter VII – Analysis, Summary and Recommendations
program holding bank loans; however, when in Years 2 and 3 approximately two-
fifths of students cited bank loans as a major source of financial support. The
proportion of current students who reported that bank loans represented a major
source of financial support (37.8%) is greater than that for graduates (25.8%).
h. Out-of-Province Student Loans While over 17 percent of law students at the five Ontario law schools were originally from
other provinces, less than 3 percent of current students reported that out-of-province
government student loans represent a major funding source. Twice as many graduates
as students relied on government loans from other provinces as a major source of
financial support.
i. Funding for Aboriginal Law Students Approximately 1 percent of law students relied on First Nation Education Authority Grant
funding as a major source of financial support, a number consistent with the
representation of grant-eligible Aboriginal students within the law student population.
More current students than graduates reported that First Nation Education Authority
Grant funding was a major source of financial support.
4. What is the impact of debt on law students? a. Debt at Program Entry and Graduation There has been a slight increase in the median debt at program entry reported by
students entering the law program at the five Ontario law schools since the deregulation
of tuition for professional programs. During this time, nearly one-half of students entered
law school having incurred no debt at all. However, the median debt at entry to law
school for the past few years has been about $2,000 less than that of students
graduating from university with a bachelor’s degree in the year 2000. This finding
suggests that those with high debt may have been discouraged from entering law school
or other post-bachelor’s degree programs directly following their undergraduate
graduation. One-fifth of all current law students expected to graduate from law school
with no debt, but 27 percent of them expected to have debt of $40,000 to $70,000 and
13 percent expected to graduate with over $70,000 of debt. Current students projected
more debt at graduation than the actual debt reported by graduates.
168
Chapter VII – Analysis, Summary and Recommendations
b. Characteristics of Students with More or Less Debt In general, law students and recent law graduates who reported French as their
language of comfort were more likely to have low to moderate debt than were those who
reported that their language of comfort was English. Law students and graduates whose
parents had higher levels of education were more likely to have no debt and were less
likely to have high debt than students and graduates whose parents had less education.
Black students and students of South Asian descent were more likely than non-minority
students to anticipate having debt at exit from their law program (greater than $40,000)
and were less likely to anticipate having no debt at graduation. Students of Southeast
Asian descent were more likely than non-minority students to anticipate having debt at
exit from their law program greater than $60,000. Students of Chinese descent were
less likely to have high debt and were more likely to have no debt than non-minority
students.
Older students and those students and graduates with dependents tended to project or
have had more debt at graduation from law school than did younger students and
students and graduates without dependents. Graduates, especially those with low debt,
relied more than students on their savings as a major source of funding their legal
education. Students with low debt were far more likely than graduates to indicate that
their parents were a major source of financial support. High-debt students were more
likely than graduates to indicate that bank loans were a major source of financial support
and were less likely than graduates to indicate that OSAP was a major source of
financial support. For students and graduates with low debt, personal savings and parents were the
primary sources of support, while for students and graduates with high debt, bank and
government loans provided the major portion of education funding.
c. Impact of Debt on Students Students with debt tended to view their debt as having a significant adverse impact on
several important aspects of their academic and personal life, including articling and
practising decisions, satisfaction with the law school experience, basic needs and
family/personal relationships. Approximately 30 percent of all Year 2 students with debt
169
Chapter VII – Analysis, Summary and Recommendations
(i.e., 65.1% of Year 2 respondents) indicated that their articling and practising decisions
were substantially affected by their debt; for example, many felt obliged to seek out high-
paying positions rather than those in public service or smaller communities. For current
students with high debt, the area of law that they hoped to practise was the aspect of
their academic and personal lives that they believed was most affected by their debt. In
comparison, graduates with high debt claimed that their satisfaction with the law school
experience was the aspect of their lives most affected by their debt. Overall, upper-year
students in the moderate- to high-debt categories were the most likely of all respondent
groups to report that a particular aspect of their academic or personal lives was affected
‘to a great extent’ by their debt, while graduates were the least likely of all respondent
groups to report the same. It appears that, since tuition deregulation, more students
have felt the impact of debt on all aspects of their lives than did graduates.
While some students felt that their rapidly accumulating debt was affecting every aspect
of their lives, other students were untouched by concerns about debt, the need to work
part time and how debt affected career planning. The wide variability in student debt
and in articling and employment prospects generates tension in an atmosphere where
the vast majority of students view a fair and open competition for highly valued
articling/practising positions as extremely important.
C. Understanding The Law School Experience
The range of emotions expressed by students in focus groups and in responding to the survey
regarding legal education costs and their impact was quite remarkable. Student responses
varied widely in terms of their experiences with debt while in law school. For example, some
students felt that their rapidly accumulating debt was affecting every aspect of their lives – from
their personal relationships to their career paths. On the other hand, some students were
untouched by concerns about debt, the need to work part-time and career stages. The drive of
many students toward prestigious, well-paying positions was tempered by the commitment of
others to serve society by working in Legal Aid settings, non-governmental organizations, and
government agencies. The following brief discussion summarizes the strains and pressures
that evolve for students throughout the course of their legal education.
170
Chapter VII – Analysis, Summary and Recommendations
Among all university professional programs, law school is most closely integrated with the
profession. Law students’ achievement is functionally linked to the articling process and,
ultimately, their professional career from the moment that they begin the program. As early as
Year 1, students will compete for the few summer jobs made available by the most prestigious
firms. First semester grades are the only objective criteria available to law firms for assessing
Year 1 students for summer jobs emphasizing the need for high achievement. In Year 2,
students compete again for articling positions that affect their entire career, as employers seek
the best and brightest among them with guidelines developed by the Law Society of Upper
Canada. The competition is more overt than in most other university programs because law
students are in constant contact with each other sharing thoughts and competing for marks.
Since achievement in law school is directly associated with the opportunity to access
placements and permanent employment, there is an interrelationship between factors that
influence achievement and opportunities to access the higher paying/higher status opportunities
for articling placements and future jobs. Most of these factors are directly or indirectly related to
student finances and accumulation of debt while in law school. For example, students reported
that the need to hold paid jobs while completing their legal studies reduced the time spent on
course work and assignments and, consequently, affected achievement and access to high-
status placements. Also, a lack of funds prevented some students from attending the full range
of out-of-town interviews that might provide them with access to prestigious articling and
practising positions.
Very few students graduate to article and/or work in public service settings. A small number do
not obtain any articling position at all. For law graduates, the range of starting salaries is
probably greater than in any other profession; however, at least one-third will find themselves in
relatively low-paying settings. The wide variability in student debt and articling and employment
prospects generates tension in an atmosphere where the vast majority of students view a fair
and open competition for highly valued articling/practising positions as extremely important.
D. Myths/Realities In the highly charged world of an Ontario Law School, where every event seems to have a
bearing on student careers, it is not surprising that myths and half-truths develop among law
students. This section examines some of the issues raised by law school students and recent
171
Chapter VII – Analysis, Summary and Recommendations
graduates and attempts to address any misconceptions by reference to data collected during
this study.
Two main themes emerge from the myths/realities held by those in law: the first theme is
related to the background characteristics of the law student population and, the second theme
relates to the magnitude and impact of debt on students. It is important to recognize that there
may be substantial variability on these issues across the five law schools.
1. With increased tuition, there is a growing trend among law schools to serve only
the children of affluent parents.
It seems that the law school population is very unrepresentative in socio-economic status. Aside from ethnicity, almost all students seem to be from the upper middle class and upper class. Higher tuition is only furthering ensuring this divide. (Year 3, Female)
Although it is true that law schools enrol disproportionately high numbers of students
from middle- and upper-class homes, there has only been slight change in the
socioeconomic characteristics of law school students over the past seven years.
2. Members of visible minorities are underrepresented at law schools, and there is
an increasing trend for this situation to worsen.
… It’s almost offensive that they’d ask me to pose for a brochure for the faculty to show diversity, when none exists! (Year 2, Female)
At the five law schools, members of visible minority groups, except for Aboriginal
students, are represented proportionately to their distribution within Ontario society, and
the trend since tuition deregulation has been towards an increase rather than a decrease
in visible minority representation.
3. Most students will have a massive debt burden at graduation.
Due to the huge debt most law students will have to repay when they graduate the law school experience is severely diminished. It puts undue stress on students…. (Year 1, Male)
172
Chapter VII – Analysis, Summary and Recommendations
A consistent definition of ‘massive’ debt would be helpful in this instance. About 40
percent of current students anticipate having a debt of over $40,000 at graduation and
13 percent over $70,000. On the other hand, about 20 percent of students expect to
have no debt at graduation, and another 10 percent will have relatively low debt. This is
not to minimize the significance of high debt for those who feel they must seek high-
paying positions in an uncertain job market.
4. Many bursaries go to those who are not in financial need.
Financial aid should be better tailored. I know many people who live at home and are dependent whose parents are very wealthy and they get maximum OSAP and consequently law school bursaries after lying that they are independent. (Year 2, Male)
Generally speaking this belief does not hold true – although there may be exceptions.
All of the law schools have systematic assessment processes in place that aid in
identifying students with financial needs. Bursaries are then awarded in differing
amounts depending on students’ assessed level of financial need. Our analysis of
student financial circumstances and sources of their financial support indicate that, for
the most part, bursaries go to those with the greatest need. Millennium Bursary awards
are based on OSAP criteria and appear to be awarded to those in most financial need.
5. Many students are prevented from practising in the area of social justice and
public interest because they must obtain high-paying jobs to pay down law school
debts.
My heavy debt load has severely limited my range of options after law school… I feel that many of my peers are constrained by their debts. I often hear, “Well, I’d like to do social justice/environmental/poverty law, but I think I have to go to Bay Street….” Talk about skewing the legal profession! (Year 2, Male)
Ironically, there are few jobs in sectors such as legal aid clinics and non-governmental
organizations, and those that are available tend to go to more experienced lawyers. Nor
do such organizations actively recruit at law schools—a phenomenon that further
mythologizes their appeal. This is not to deny the interest in social justice/service that
draws some students into the field of law, but rather to make the point that very few law
173
Chapter VII – Analysis, Summary and Recommendations
school graduates will have the opportunity to work in these fields whether they were
prevented by their debt load or not.
E. Future Directions
It would take a huge funding increase to reduce the amount of debt that many law school
students will have accumulated by graduation, and this is not likely to take place. The numbers,
academic quality and background characteristics of applicants appear to be relatively unaffected
by increased law school tuition. However, there is a need to refine the sources of student
financial support, to increase the availability and conditions of student financial support while in
the program, and to consider the implementation of debt-relief programs after graduation.
1. Increase Maximum Assistance from OSAP The Ontario Student Assistance Program currently has a cap of $9,350 per student award
each year. This amount represents less than half of the total annual cost of law school;
consequently, more and more law students are turning to banks in order to deal with their
debt. OSAP offers better terms than banks, as well as, standardized conditions of
repayment and should, therefore, increase maximum amounts available to students in
professional programs such as law.
2. Examine the Feasibility of a Debt-Relief Program In an income-contingent tuition fee program, the student agrees to an annual repayment
rate fixed as a percentage of income per $1,000 borrowed; that is, the extent of the students
obligation to repay the loan will vary with his/her income level (Pardy, 2004). Although
Elizabeth Witmer, an unsuccessful leadership candidate in the 2002 Ontario election,
proposed that such a program be instituted for post-secondary loans, the idea for such a
program has not yet been implemented in Canada; however, it has been attempted with
some degree of success in the Australia, New Zealand and the United States (Pardy, 2004).
A great deal has been written in the United States about the benefits of loan forgiveness
programs and such programs are currently offered by American universities such as:
Cornell, Duke, Harvard (since 1986), Northwestern, Stanford, the University of Michigan, the
University of Pennsylvania and Yale (Stutzman, 2003). Loan forgiveness programs are
generally touted as a means to encourage students to pursue non-traditional and public-
service-oriented careers that are often associated with lower salaries. For example, one
174
Chapter VII – Analysis, Summary and Recommendations
recent study on law students and public service careers concluded that $6,000 a year in
available loan repayment assistance would result in increased interest in a post-graduate
federal government job for 83 percent of student respondents (author only—title in refs
Equal Justice Works, NALP and the Partnership for Public Service, 2002).
In Canada, debt relief programs have only recently been examined for viability. None of the
five Ontario law schools involved in this accessibility study offers such an alternative
financial aid program. The University of Toronto’s law school has instituted a back-end debt
relief program (http://www.utoronto.ca) and a proposal is under discussion at McGill
University’s law school for future incoming law students to pledge part of their future salary
to the law school after graduation (National Post, 2002). These programs are novel
because they recognize the actual employment income of graduates rather than assuming
that all graduates uniformly earn high salaries. The University of Toronto program applies to
all graduates from 1999 onwards, and law graduates can apply for the program at any time
in the ten years following their graduation. A set percentage of a graduate’s loan debt is
forgiven each year for ten years (or for however long they continue to be eligible for the
program). If an individual still qualifies for the program at the end of ten years (i.e., their
income is still sufficiently low) and their loans still have not been repaid at that time, the
remaining balance of their loans will be forgiven at the end of the program period.
If a province-wide debt-relief program were introduced rather than being managed by each
law school, a standardized approach to administration could be undertaken by an already
existing agency such as OSAP. This approach would encourage fairness and consistency
in program delivery.
3. Refine the Work Study Plan The Work Study Plan financed through OSAP appears to need fine-tuning. The rate of pay
available to students in the program should be consistent with other part-time work
opportunities, and the nature of the work funded though the plan should clearly be relevant
to the practice of law.
175
Chapter VII – Analysis, Summary and Recommendations
4. Align Bursary Allocations More Consistently with Student Financial Need There has been a dramatic increase in bursary money available to students from law
schools over the past few years. Generally speaking, this money has been made available
to students on the basis of financial need. More precise targeting of bursary funds to
students with the greatest financial need would be beneficial.
5. Ensure Openness, Fairness and Support for Students in Search of Articling Positions
It is difficult to know how to relieve the pressure on law students created by the intensely
competitive environment in law school regarding academic achievement and the search for
optimum articling settings. This tension is further exacerbated by some students’ concerns
about debt repayment and their perceptions of how opportunities for success at school and
in their careers are affected by their financial circumstances. Ensuring equal opportunity to
participate in articling interviews and law program-related activities for all law students is a
laudable goal, but may be impossible to achieve. Nevertheless, maintaining and building on
the student support system already in place in the law schools is worth the effort required.
F. Concluding Statement This study provided the background to answer fundamental questions about the cost of a legal
education in Ontario over the past seven years. A number of questions were left unanswered;
of particular relevance among them are:
1. What are the characteristics of undergraduate students who are academically qualified
and interested in law as a career but do not apply to law school for financial reasons?
2. What is the pattern of law school graduates’ debt repayment, and to what extent does
debt incurred while in law school affect career-related decision making? and,
3. Why is there such variability in accumulated debt across the law student population, and
what kind of strategies could be implemented to help students manage their finances
more effectively?
176

Chapter VII – Analysis, Summary and Recommendations
177
The study is timely in that it provides useful information for individual law schools regarding
current financial issues as well as a contribution to the larger issue of the financing of higher
education in Ontario.
References
Allen, Mary and Chantal Vaillancourt. 2004. Class of 2000: Profile of Post-secondary
Graduates and Student Debt. Statistics Canada.
Articling Handbook for Principals and Students. The Law Society of Upper Canada. 2004.
Articling Recruitment Procedures 2004-2005 Articling Term. Articling & Placement Office, Bar
Admission Office. The Law Society of Upper Canada.
Bar Admission Course: Fees Schedule for 2004. The Law Society of Upper Canada.
Barr-Telford, Lynn, Cartwright, Fernando, Prasil, Sandrine and Kristina Shimmons. 2003.
Access, Persistence and Financing: First Results from the Postsecondary Education
Participation Survey (PEPS). Statistics Canada.
Bicentennial Report and Recommendations on Equity Issues in the Legal Profession, Report to
Bicentennial Convocation. May 1997. The Law Society of Upper Canada.
Black, Sandra E. and Amir Sufi. 2002. Who Goes to College? Differential Enrollment by Race
and Family Background. National Bureau of Economic Research Working Paper,
http://www/nber.org/papers/w9310.
Blishen, Bernard R., Carroll, William K. and Catherine Moore. 1987. The 1981 Socioeconomic
Index for Occupations in Canada. Canadian Review of Sociology and Anthropology, 24 (4),
465-488.
Bonnell, Greg. Gay Activists Take Issue with Survey’s Numbers. Toronto Star, June 15, 2004.
Booth, Tom. CAUT Bulletin. Toronto: Jan 2002, Vol. 49, Issue 1, A3.
Boyd, Monica and Michael Vickers. 2000. 100 Years of Immigration in Canada. Canadian
Social Trends. Statistics Canada.
Canadian Community Health Survey. The Daily, Statistics Canada. Tuesday, June 15, 2004.
Canadian Council on Social Development’s Disability Information Sheet: Number 2, 2001
(Methodological Issues). Canadian Council on Social Development, http://www/ccsd.ca.
Career Planning Handbook. 2004. Faculty of Law, Queen’s University
179
Cervenan, Amy and Alex Usher. 2004. The More Things Change…Undergraduate Student
Living Standards After 40 years of the Canada Student Loans Program. Educational Policy
Institute.
Chambers, David L. 1992. The Burdens of Educational Loans: the Impacts of Debt on Job
Choice and Standards of Living for Students at Nine American Law schools. Journal of
Legal Education, 42, 187-231.
Chui, Tina and Danielle Zietsma. 2003. Earnings of Immigrants in the 1990s. Canadian Social
Trends. Statistics Canada.
Corak, Miles, Lipps, Garth and John Zhao. 2003. Family Income and Participation in Post-
Secondary Education. Statistics Canada.
Cosette, Lucie and Édith Duclos. 2002. A Profile of Disability in Canada, 2001. Statistics
Canada.
Council of Ontario Universities: Briefing Notes. Issue: Tuition Fees—October 2000,
http://www.cou.on.ca.
Cowan, James. Atonement. Toronto-Life, v.36(9), June 2002, 57-58.
Crawford, Michael G. The 1997 Canadian Lawyer National Compensation Survey. Canadian
Lawyer, June 1997, 21-29.
Crawford, Michael G. The 1999 Canadian Lawyer National Compensation Survey. Canadian
Lawyer, June 1999, 21-28.
Cunningham, Diane. 2002. Government Invests in Supports for Students with Disabilities.
Canada News Wire, Ottawa: February 7, 1.
Davies, Scott and Linda Quirke. 2002. The new entrepreneurship in higher education: the
impact of tuition increases at an Ontario University. The Canadian Journal of Higher
Education, Toronto, Vol. 32(3).
Dhalla, Irfan A., Kwong, Jeff C., Streiner, David L., Baddour, Ralph E., Waddell, Andrea E. and
Ian L. Johnson. 2002. Characteristics of First-Year Students in Canadian Medical Schools.
Canadian Medical Association Journal, 166 (8), 1029-1035.
Dwyer, Victor. 1997. Privilege and Pressure. Maclean’s, Toronto, Vol. 110(40), 16-19.
180
Fichten, Catherine S., Asuncion, Jennison V., Barile, Maria, Robillard, Chantal, Fossey, Myrtis
E. and Daniel Lamb. 2003. Canadian Postsecondary Students with Disabilities: Where Are
They? The Canadian Journal of Higher Education, Toronto, Vol 33(3), 71-114.
Financing Legal Education: Loan Forgiveness Programs. 1989. Journal of Legal Education,
39(5).
Frangou, Christine. 1997. Possibility of Tuition Hikes Worrying. Kingston Whig-Standard,
Ontario: December 19, 6.
Frank, Erica and Shamiram Feinglass. 1999. Student Loan Debt Does Not Predict Female
Physicians’ Choice of Primary Care Specialty. Journal of General Internal Medicine, 14(6),
347-350.
Frenette, Marc. 2002. Too Far To Go On? Distance to School and University Participation.
Statistics Canada.
Goyder, John, Guppy, Neil and Mary Thompson. 2003. The Allocation of Male and Female
Occupational Prestige in an Ontario Urban Area: A Quarter-Century Replication. The
Canadian Review of Sociology and Anthropology, 40(4), 417-440.
Graham, Bill. 2001. Government of Canada Funds Learning Disabilities Association of Ontario.
Canada News Wire, Ottawa: August 28, 1.
Guppy, Neil. 2003. Socioeconomic Status, in J. Ponzetti (Ed.) International Encyclopedia of
Marriage and Family, New York: MacMillan Reference, 2nd Edition, 1545-1549.
Hartley, T and Massuca, J. April 24, 2002. Medical Professionals Again Top Gallup’s Honesty
and Ethics Poll. Gallup Canada Inc., Vol No. 62, No. 23.
Health Canada. 2002. A Report on Mental Illnesses in Canada.
Highlights: From the 2003-2004 Ontario University Graduate Survey. Council of Ontario
Universities. April 2004.
Hou, Feng and Garnett Picot. Visible Minority Neighbourhoods in Toronto, Montréal, and
Vancouver. Canadian Social Trends, Spring 2004. Statistics Canada.
Hutchinson, Allan. 2000. The Law School Book: Succeeding at Law School. Concord, ON:
Irwin Law.
Johnson, Trevor V. 1996. Getting Into Law School: The Canadian Guide. Toronto: Harcourt
Brace & Co. Canada Ltd.
181
Johnston, Ann Dowsett. 1997. Judging Canadian Law Schools. Maclean’s, Toronto: October
6, Vol. 110, Issue 40, 12-14.
Junor, Sean and Alexander Usher. 2002. The Price of Knowledge: Access and Student
Finance in Canada. Canada Millennium Scholarship Foundation Research Series.
Kay, Fiona M., Masuch, Cristi and Paula Curry. 2004a. The Contemporary Legal Profession in
Ontario. Law Society of Upper Canada.
Kay, Fiona M., Masuch, Cristi and Paula Curry. 2004b. Women’s Careers in the Legal
Profession. Law Society of Upper Canada.
King A, Warren W, Boyer J, and King M. 2004. Double Cohort Study: Phase 4 Report for the
Ontario Ministry of Education (in progress). Kingston: Queen’s University.
King A, Warren W, Boyer J, and King M. 2003. Double Cohort Study: Phase 3 Report for the
Ontario Ministry of Education. Kingston: Queen’s University.
King AJC, Beazley RP, Warren WK, Hawkins CA, Robertson AS and Radford JL. 1989.
Canada Youth and AIDS Study. Kingston: Queen’s University.
Knighton, Tamara and Sheba Mirza. Postsecondary Participation: The Effects of Parents’
Education and Household Income. Education Quarterly Review, Vol. 8, No. 3, 25-32.
Kornhauser, Lewis A and Richard L Revesz. 1995. Legal Education and Entry into the Legal
Profession: the Role of Race, Gender, and Educational Debt. New York University Law
Review, 70, 829-964.
Kwong, Jeff C., Irfan A. Dhalla, David L. Streiner, Ralph E. Baddour, Andrea E. Waddell and Ian
L. Johnson. 2002. Effects of rising tuition fees on medical school class composition and
financial outlook. Canadian Medical Association Journal, 166(8), 1023-1028.
Law, John. 2002. Articling in Canada. South Texas Law Review, Vol 43(2), 449-478.
Law Society of Upper Canada (LSUC), Articling Handbook. 2004.
Law Society Reforms Bar Admission Process. News Updates (online). Law Society of Upper
Canada. Monday, September 18, 2004.
Law Student 2000, a project of United Kingdom Centre for Legal Education, June 2004.
182
Looker, E. Dianne and Graham S. Lowe. 2001. Post-Secondary Access and Student Financial
Aid in Canada: Current Knowledge and Research Gaps. Canadian Policy Research
Networks Workshop on Post-Secondary Access and Student Financial Aid, February 1,
2001 (sponsored by the Canadian Millennium Scholarship Foundation).
McMahon, Kirsten. The 2003 Canadian Lawyer Law Firm Associates’ Survey. Canadian
Lawyer, November/December 2003, 23-26.
McMahon, Kirsten. The 2003 Canadian Lawyer National Compensation Survey. Canadian
Lawyer, June 2003, 39-42.
McMahon, Kirsten. The 2002 Canadian Lawyer National Compensation Survey. Canadian
Lawyer, July 2002, 22-28.
McMahon, Kirsten. The 2001 Canadian Lawyer National Compensation Survey. Canadian
Lawyer, June 2001, 39-44.
Milan, Anne and Kelly Tran. 2004. Blacks in Canada: A Long History. Canadian Social
Trends, Statistics Canada. Ottawa: Spring, 2-7.
Neuman, Shirley. 2003. Provost’s Study of Accessibility and Career Choice in the Faculty of
Law. University of Toronto.
O’Donnell, Vivian and Heather Tait. 2003. Aboriginal Peoples Survey 2001 – Initial Findings:
Well-Being of the Non-Reserve Aboriginal Population. Statistics Canada.
Olivas, Michael A. 1999. Paying for a Law Degree: Trends in Student Borrowing and the
Ability to Repay Debt. Journal of Legal Education, 49(3) 333-341.
Ontario Law School Application Service (OLSAS), Summary Reports. 2003.
Ontario Student Assistance Program (OSAP) (www.osap.on.ca).
Pardy, Bruce. 2004. Poor Students, Well-Paid Lawyers: Post-Graduation Income-Contingent
Tuition Fees for Law Schools. Queen’s Law Journal, 29, 848-867.
Parker, Patricia, Hagan, John and Ronit Dinovitzer. 2003. Choice and Circumstance: Social
Capital and Planful Competence in the Attainment of Immigrant Youth. Canadian Journal of
Sociology, Vol. 28, Issue 4.
Participation and Activity Limitation Survey: A Profile of Disability in Canada. The Daily,
Tuesday, December 3, 2002. Statistics Canada.
183
Perry, Ann. 1999. Law ‘n’ Ardour: How Bay St. Courts Students; Competition Fierce Among
Top Law Firms for Tomorrow’s Best. Toronto Star, Ontario: November 14, 1.
Placement Report 2002. Articling & Placement Office, Bar Admission Office. The Law Society
of Upper Canada. April 1, 2002.
Procedures Governing the Recruitment of Students for Summer 2004 Positions in the City of
Toronto. Articling & Placement Office, Bar Admission Office. The Law Society of Upper
Canada.
Purcell, Catherine. 1994. Guide to Law Schools in Canada. Toronto: ECW Press.
Report from the Task Force on the Continuum of Legal Education. 2003. The Law Society of
Upper Canada.
Sandefur, Rebecca L. 2001. Work and Honour in the Law: Prestige and the Division of
Lawyers’ Labour. American Sociological Review, 66(3), 382-403.
Schofield, John. Conduct Unbecoming. Maclean’s, Toronto, Vol. 114, Issue 10, pg. 56.
Smith, Frank. 2004 Federal Budget. National Educational Association of Disabled Students,
http://www.neads.ca.
Sokoloff, Heather. Law Students May be Asked to Share Future Pay: McGill University
Explores Ways to Solve Funding Woes. Don Mills: August 17, B1.
St. Lewis, Joanne and Benjamin Trevino. 1999. Racial Equality in the Canadian Legal
Profession. Canadian Bar Association.
Statistics Canada. 2003. 2001 Census of Canada.
Statistics Canada. 2000. Survey of Labour & Income Dynamics.
Stutzman, Erika. 2003. Loan Forgiveness: Financial Aid After Graduation. Selections,
3(1), 3-4.
Taylor, H, Scientists, Firemen, Doctors, Teachers and Nurses Top List as Most Prestigious
Occupations. October 1, 2003. The Harris Poll #57, www.harrisinteractive.com.
Tong, Dawna and W. Wesley Pue. 1999. The Best and the Brightest?: Canadian Law School
Admissions. Osgoode Hall Law Journal, Vol. 37, 843-876. Toronto Star. June 14, 2004.
Watson, Casey. The 1998 Canadian Lawyer National Compensation Survey. Canadian
Lawyer, June 1998, 23-30.
184

185
Watson, Casey. The 2000 Canadian Lawyer National Compensation Survey. Canadian
Lawyer, June 2000, 25-29.
Woodworth, Philip A., Frederic C. Chang and Stephen D. Helmer. 2000. Debt and other
influences on career choices among surgical and primary care residents in a community-
based hospital system. American Journal of Surgery, 180(6), 570-576.
Related Documents