Welcome message from author
This document is posted to help you gain knowledge. Please leave a comment to let me know what you think about it! Share it to your friends and learn new things together.
Transcript
Geography
Study & Master
Helen Collett • Cheryl Williams • Norma Winearls • Caron Olivier
Grade 11Teacher’s Guide
University Printing House, Cambridge CB2 8BS, United Kingdom
One Liberty Plaza, 20th Floor, New York, NY 10006, USA
477 Williamstown Road, Port Melbourne, VIC 3207, Australia
314–321, 3rd Floor, Plot 3, Splendor Forum, Jasola District Centre, New Delhi – 110025, India
79 Anson Road, #06–04/06, Singapore 079906
The Water Club, Beach Road, Granger Bay, Cape Town 8005, South Africa
Cambridge University Press is part of the University of Cambridge.
It furthers the University’s mission by disseminating knowledge in the pursuit of education, learning and research at the highest international levels of excellence.
www.cambridge.orgInformation on this title: www.cambridge.org/9781107381568
© Cambridge University Press 2012, 2020
This publication is in copyright. Subject to statutory exception and to the provisions of relevant collective licensing agreements, no reproduction of any part may take place without the written permission of Cambridge University Press.
First published 2012Updated 2020Reprinted 2021
ISBN 978-1-107-38156-8
Editor: Barbara HuttonTypesetter: Brink Publishing & DesignIllustrator: Susan Abraham……………………………………………………………………………………………………………Acknowledgements Photographs: Afripics: p. 223Maps: Chief Directorate: National Geo-spatial Information: Department of Rural Development & Land Reform: pp. 213, 225, 242, 243, 276–281……………………………………………………………………………………………………………Cambridge University Press has no responsibility for the persistence or accuracy of URLs for external or third-party internet websites referred to in this publication, and does not guarantee that any content on such websites is, or will remain, accurate or appropriate. Information regarding prices, travel timetables and other factual information given in this work are correct at the time of first printing but Cambridge University Press does not guarantee the accuracy of such information thereafter.……………………………………………………………………………………………………………notice to teachers The photocopy masters in this publication may be photocopied or distributed [electronically] free of charge for classroom use within the school or institution which purchases the publication. Worksheets and copies of them remain in the copyright of Cambridge University Press and such copies may not be distributed or used in any way outside the purchasing institution.……………………………………………………………………………………………………………Every effort has been made to trace the copyright holders. Should any infringement have occurred, please inform the publishers who will correct these in the event of a reprint.……………………………………………………………………………………………………………If you want to know more about this book or any other Cambridge University Press publication, phone us at +27 21 4127800, fax us at +27 21 419-8418 or send an e-mail to [email protected]

1. Introduction 1
2. Lesson-by-lesson 17
Module 1: The atmosphere: Geographical knowledge 19 Unit 1: The Earth’s energy balance 20
Unit 2: Global air circulation 26Unit 3: Africa’s weather and climate 34Unit 4: Droughts and desertification 43
Fieldwork 1 49Geography in Practice 1: The atmosphere 49
Module 2: The atmosphere: Geographical skills and techniques 51Unit 1: Aerial photographs and orthophoto maps 52Unit 2: Geographical Information Systems (GIS) 55
Review: Term 1 59
Module 3: Geomorphology: Geographical knowledge 62Unit 1: Topography associated with horizontally layered rocks 63Unit 2: Topography associated with inclined/tilted rock strata 68Unit 3: Topography associated with massive igneous rocks 73Unit 4: Slopes 76Unit 5: Mass movements and human responses 81
Module 4: Geomorphology: Geographical skills and techniques 86Unit 1: Topographic maps 87 Unit 2: Geographical Information Systems (GIS) 91Unit 3: Fieldwork 94
Geography in Practice 2: Geomorphology 96Review: Term 2 98
Module 5: Development geography: Geographical knowledge 102Unit 1: The concept of development 103Unit 2: Frameworks for development 111Unit 3: Trade and development 120Unit 4: Development issues and challenges 126Unit 5: The role of development aid 129
Fieldwork 2 133
Module 6: Development geography: Geographical skills and techniques 134Unit 1: Mapworks skills 135 Unit 2: Using atlases 139
Review: Term 3 141
Contents
Module 7: Resources and sustainability: Geographical knowledge 143 Unit 1: Using resources 144
Unit 2: Soil and soil erosion 148Unit 3: Conventional energy resources and their impact on
the environment 153Unit 4: Non-conventional energy sources 162Unit 5: Energy management in South Africa 168
Fieldwork 3 171Geography in Practice 3: Resources and sustainability 172
Module 8: Resources and sustainability: Geographical skills and techniques 175Unit 1: Topographic maps 176Unit 2: Geographical Information Systems 180
Review: Term 4 183Examination preparation 186
3. Formal assessment 195
4. Resources 263
5. Documents 331
Contents
1. INTRODUCTION
1
1. Curriculum and Assessment Policy Statement (CAPS) 2
2. Geography as a subject 2
3. How Study & Master Geography Grade 11 works 4
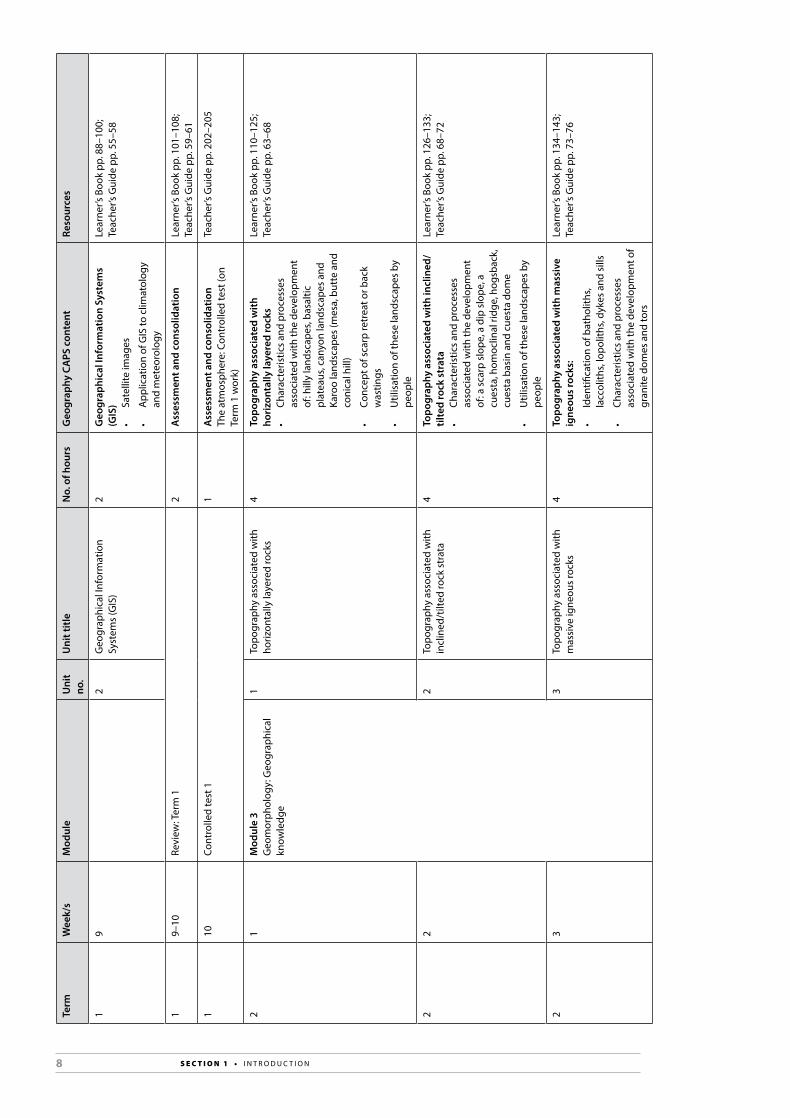
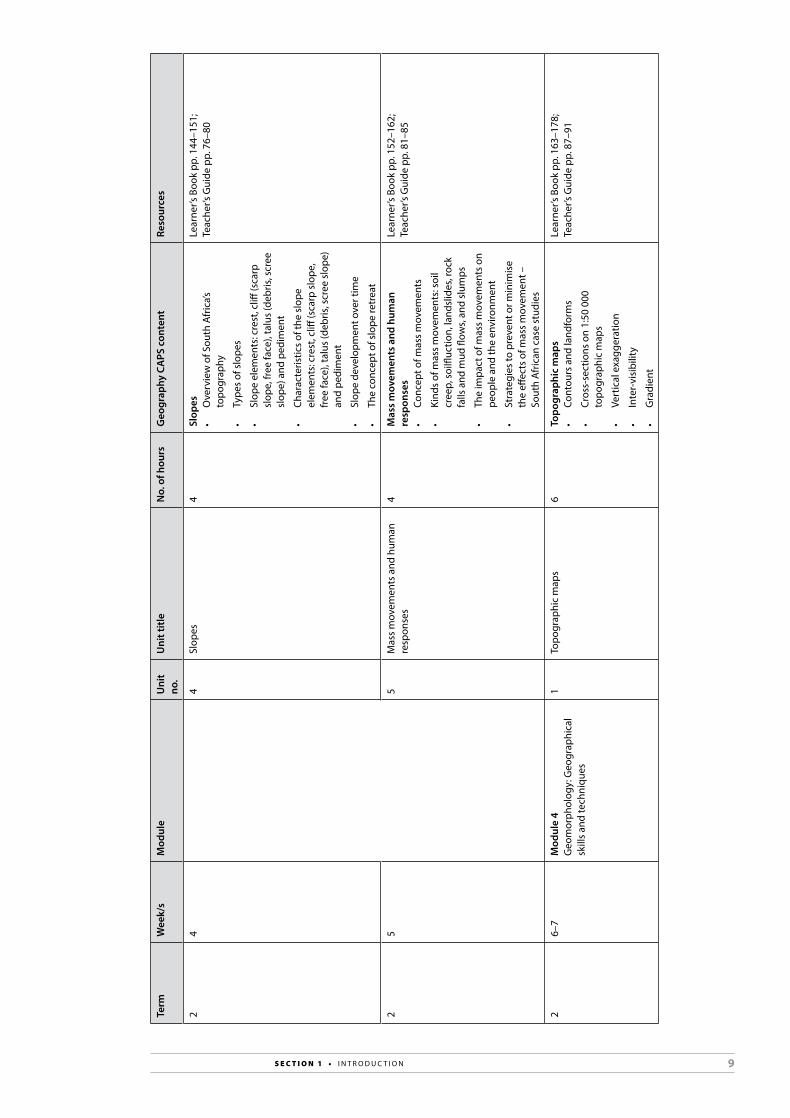
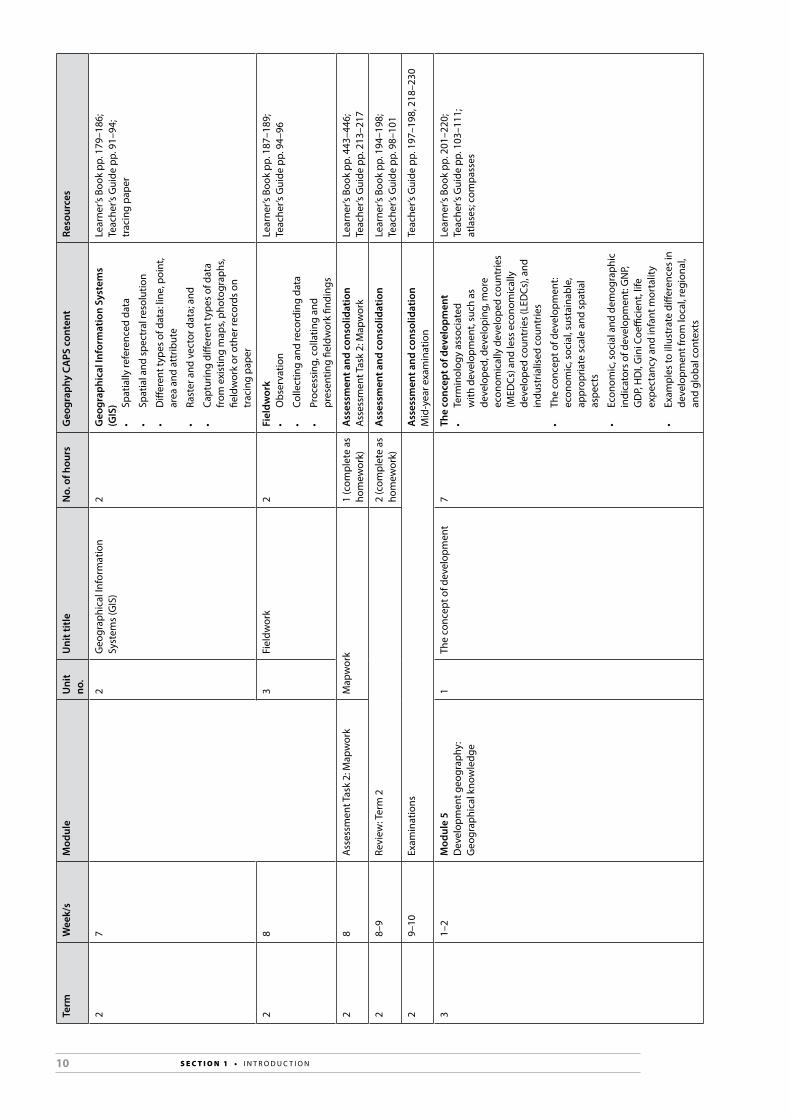
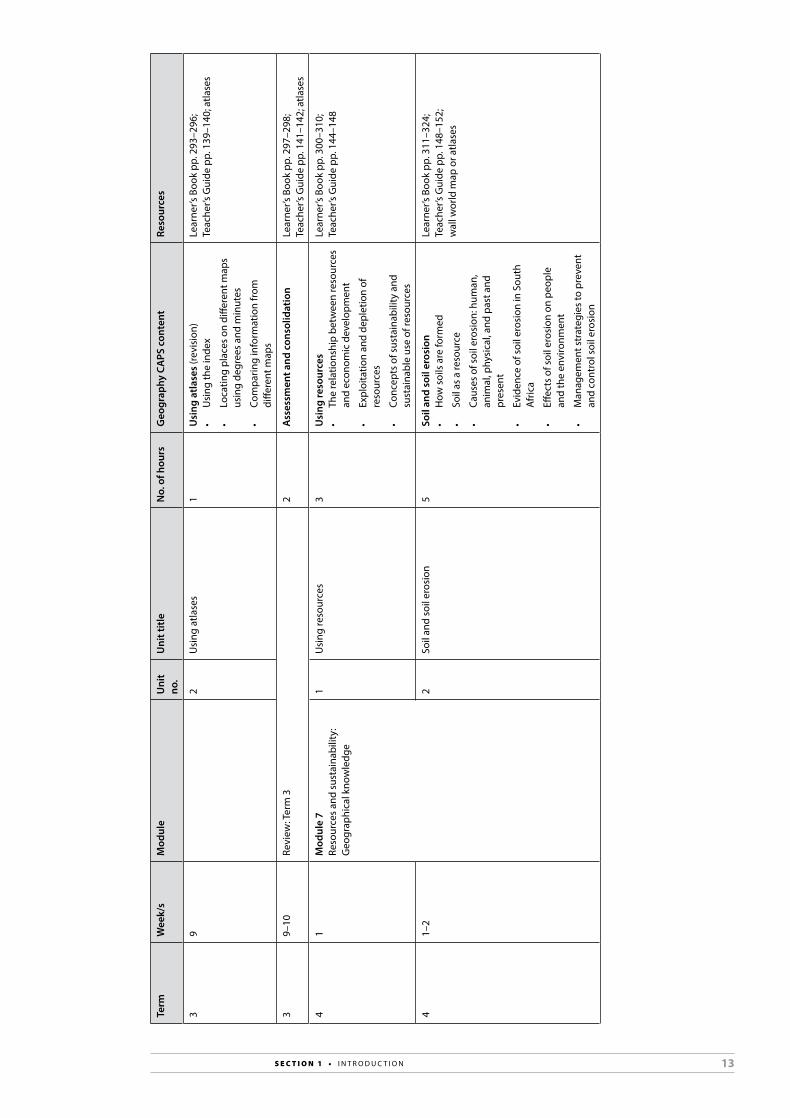
4. Grade 11 Year Plan 6
2 S E C T I O N 1 • I N T R O D U C T I O N
1. Curriculum and Assessment Policy Statement (CAPS)A single Curriculum and Assessment Policy Statement (CAPS) exists for each school subject. The CAPS for each subject details the minimum outcomes and standards of the learning process as well as assessment processes and procedures.
For more information on the CAPS, please see Section 1 of the CAPS document for Geography.
2. Geography as a subjectAimsGeography is an elective subject that focuses on the study of the human and the physical environments. There are different branches of Geography (for example, Physical Geography and Human Geography) but they all focus on the concept of space in a continuously changing environment.
Geography in Grades 10 to 12 seeks to develop the following knowledge, skills and attitudes in the learners:• explaining and interpreting both physical and human geographical
processes • describing and explaining the dynamic interrelationship between the
physical and human worlds • developing knowledge about where places are and the nature of a range
of different places at different scales • practising essential transferable skills – literacy, numeracy, oracy,
graphicacy • promoting the use of new technologies, such as Information
Communication Technology (ICT) and Geographical Information Systems (GIS)
• developing a commitment towards sustainable development • creating awareness and sensitivity for inequality in the world • fostering empathy, tolerance and fairness • making and justifying informed decisions and judgements about social
and environmental issues.
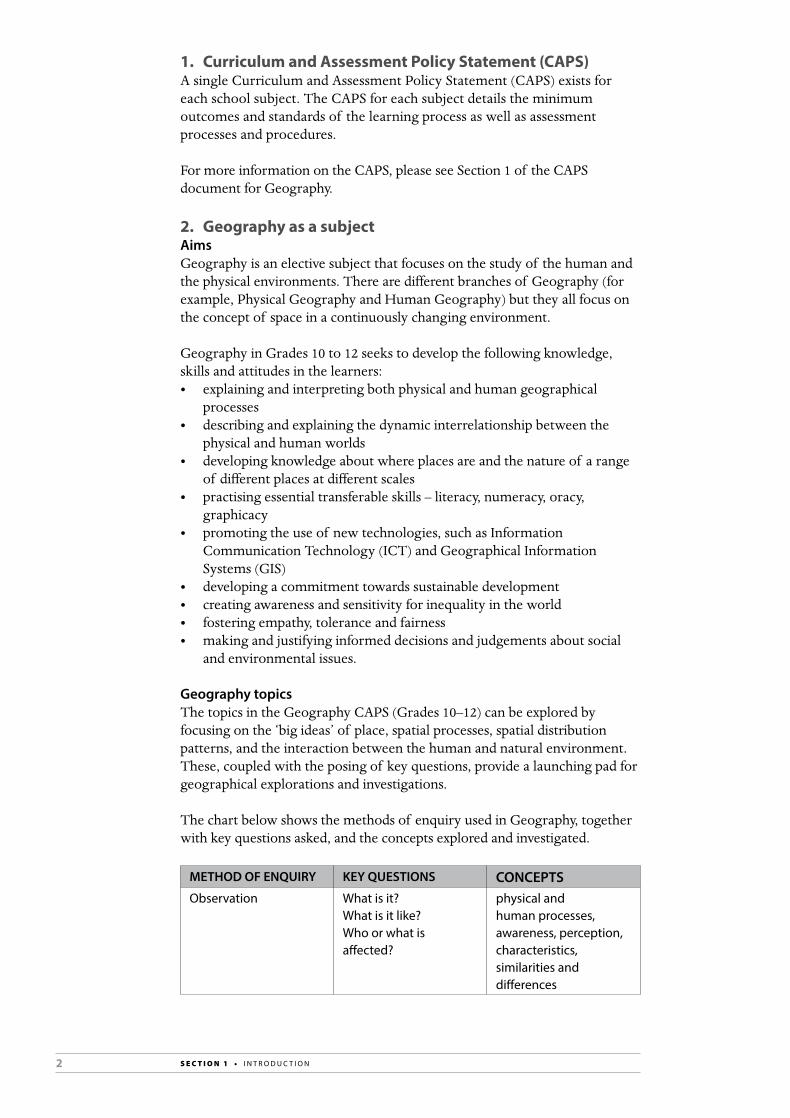
Geography topicsThe topics in the Geography CAPS (Grades 10–12) can be explored by focusing on the ‘big ideas’ of place, spatial processes, spatial distribution patterns, and the interaction between the human and natural environment. These, coupled with the posing of key questions, provide a launching pad for geographical explorations and investigations.
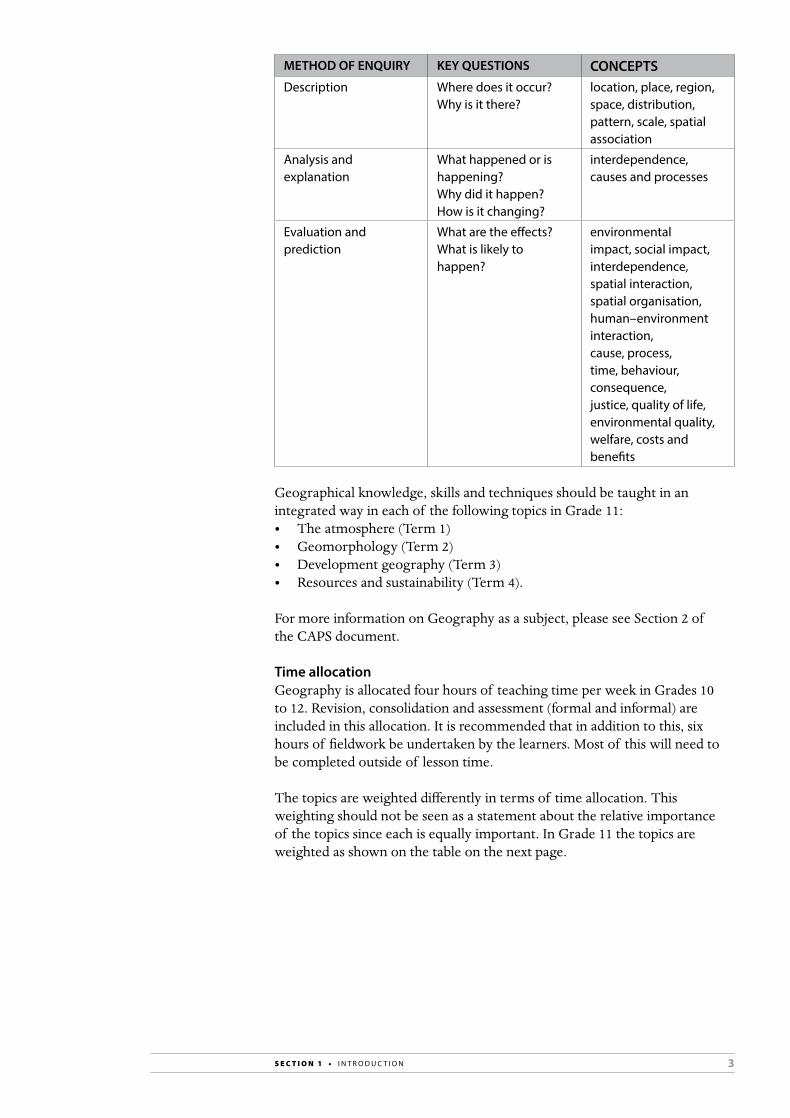
The chart below shows the methods of enquiry used in Geography, together with key questions asked, and the concepts explored and investigated.
METHOD OF ENQUIRY KEY QUESTIONS CONCEPTS Observation What is it?
What is it like? Who or what is affected?
physical and human processes, awareness, perception, characteristics, similarities and differences
3S E C T I O N 1 • I N T R O D U C T I O N
METHOD OF ENQUIRY KEY QUESTIONS CONCEPTS Description Where does it occur?
Why is it there? location, place, region, space, distribution, pattern, scale, spatial association
Analysis and explanation
What happened or is happening? Why did it happen? How is it changing?
interdependence, causes and processes
Evaluation and prediction
What are the effects? What is likely to happen?
environmental impact, social impact, interdependence, spatial interaction, spatial organisation, human–environment interaction, cause, process, time, behaviour, consequence, justice, quality of life, environmental quality, welfare, costs and benefits
Geographical knowledge, skills and techniques should be taught in an integrated way in each of the following topics in Grade 11:• The atmosphere (Term 1)• Geomorphology (Term 2)• Development geography (Term 3)• Resources and sustainability (Term 4).
For more information on Geography as a subject, please see Section 2 of the CAPS document.
Time allocation Geography is allocated four hours of teaching time per week in Grades 10 to 12. Revision, consolidation and assessment (formal and informal) are included in this allocation. It is recommended that in addition to this, six hours of fieldwork be undertaken by the learners. Most of this will need to be completed outside of lesson time.
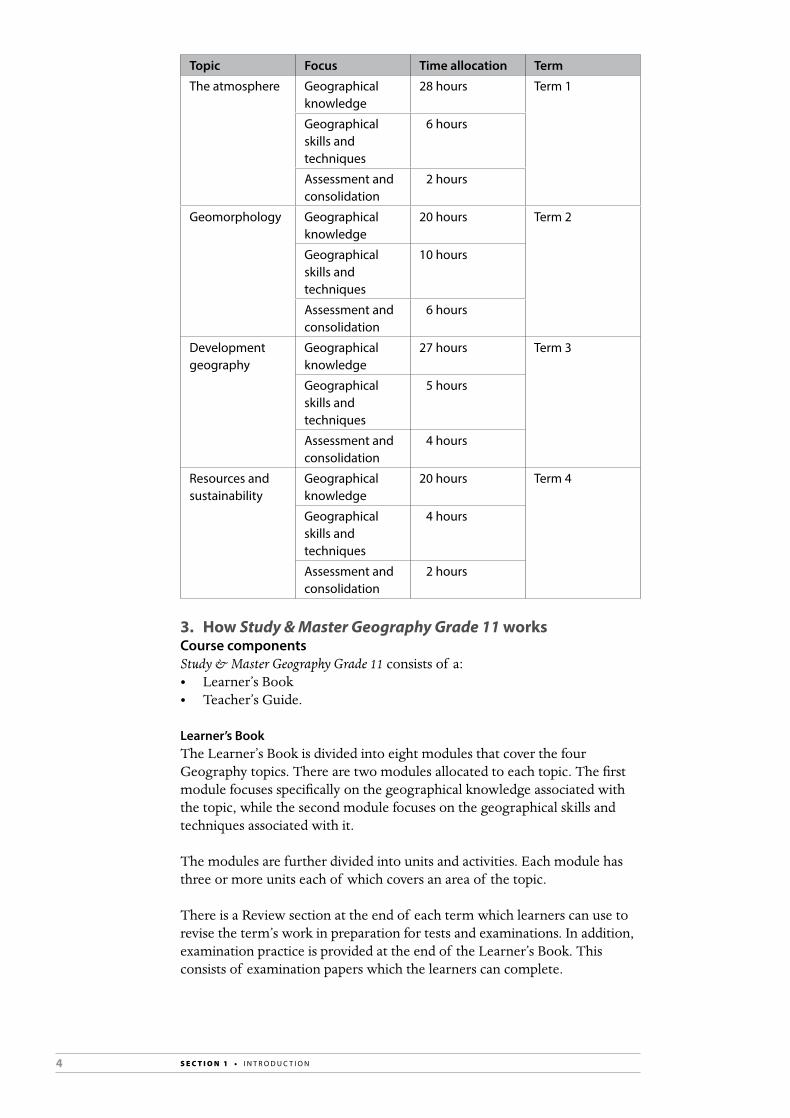
The topics are weighted differently in terms of time allocation. This weighting should not be seen as a statement about the relative importance of the topics since each is equally important. In Grade 11 the topics are weighted as shown on the table on the next page.
4 S E C T I O N 1 • I N T R O D U C T I O N
Topic Focus Time allocation Term
The atmosphere Geographical knowledge
28 hours Term 1
Geographical skills and techniques
6 hours
Assessment and consolidation
2 hours
Geomorphology Geographical knowledge
20 hours Term 2
Geographical skills and techniques
10 hours
Assessment and consolidation
6 hours
Development geography
Geographical knowledge
27 hours Term 3
Geographical skills and techniques
5 hours
Assessment and consolidation
4 hours
Resources and sustainability
Geographical knowledge
20 hours Term 4
Geographical skills and techniques
4 hours
Assessment and consolidation
2 hours
3. How Study & Master Geography Grade 11 worksCourse componentsStudy & Master Geography Grade 11 consists of a:• Learner’s Book• Teacher’s Guide.
Learner’s BookThe Learner’s Book is divided into eight modules that cover the four Geography topics. There are two modules allocated to each topic. The first module focuses specifically on the geographical knowledge associated with the topic, while the second module focuses on the geographical skills and techniques associated with it.
The modules are further divided into units and activities. Each module has three or more units each of which covers an area of the topic. There is a Review section at the end of each term which learners can use to revise the term’s work in preparation for tests and examinations. In addition, examination practice is provided at the end of the Learner’s Book. This consists of examination papers which the learners can complete.
5S E C T I O N 1 • I N T R O D U C T I O N
Fieldwork is provided for in a practical and enjoyable way. It is included in the activities of Module 4 for the topic, ‘Geomorphology’. For the other topics in Grade 11, fieldwork activities are suggested at the end of Modules 1, 5 and 7. Fieldwork activities provide learners with an opportunity to apply and deepen their geographical knowledge, skills and techniques as they use what they have learnt to explore and investigate their environment first-hand. As such, these activities are an integral part of learning and help learners to experience the relevance of what they learn in the classroom and transfer it to outside the classroom.
All formal assessment activities (controlled tests and assessment tasks (research and mapwork) and examinations) are provided in the Teacher’s Guide.
Teacher’s GuideThe Teacher’s Guide provides information and guidance on:• Geography as a subject (Section 1)• planning for the Grade 11 year and lessons (Sections 1 and 2)• using the modules and units in the Learner’s Book to create lessons
(Section 2)• suggested answers for all activities in the Learner’s Book (Section 2)• suggested remedial and extension activities (Section 2)• informal assessment suggestions (Section 2)• a programme of assessment (Section 3)• controlled tests and assessment tasks (research and mapwork) (Section 3)• model mid-year and end-of-year examination papers (Section 3)• guidance on the assessment of all Formal Assessment Tasks (Section 3)• memorandums for all Formal Assessment Tasks (Section 3)• recording and reporting on formal assessment (Section 3)• a list of useful websites (Section 4)• additional worksheets and activities on all Geography topics (Section 4).
Section 2 mirrors the Learner’s Book and is divided into modules. It indicates how the modules and units in the Learner’s Book can be used to create lessons.
Inclusivity An important part of teaching is to accommodate all learners, including those who experience barriers to learning. Study & Master Geography takes into account that learners come from different backgrounds and have different abilities. So it offers learning material that learners can relate to, while extending their learning and experiences. There are a variety of types of activities – activities that appeal to learners of all levels and backgrounds, and that offer opportunities to work individually, in pairs, in groups or as a whole class. This Teacher’s Guide also provides remedial and extension activities for each unit which teachers need when they have to manage a class of diverse learners. Section 4 (Resources) also provides further worksheets for learners and ideas for activities.
5
6 S E C T I O N 1 • I N T R O D U C T I O N
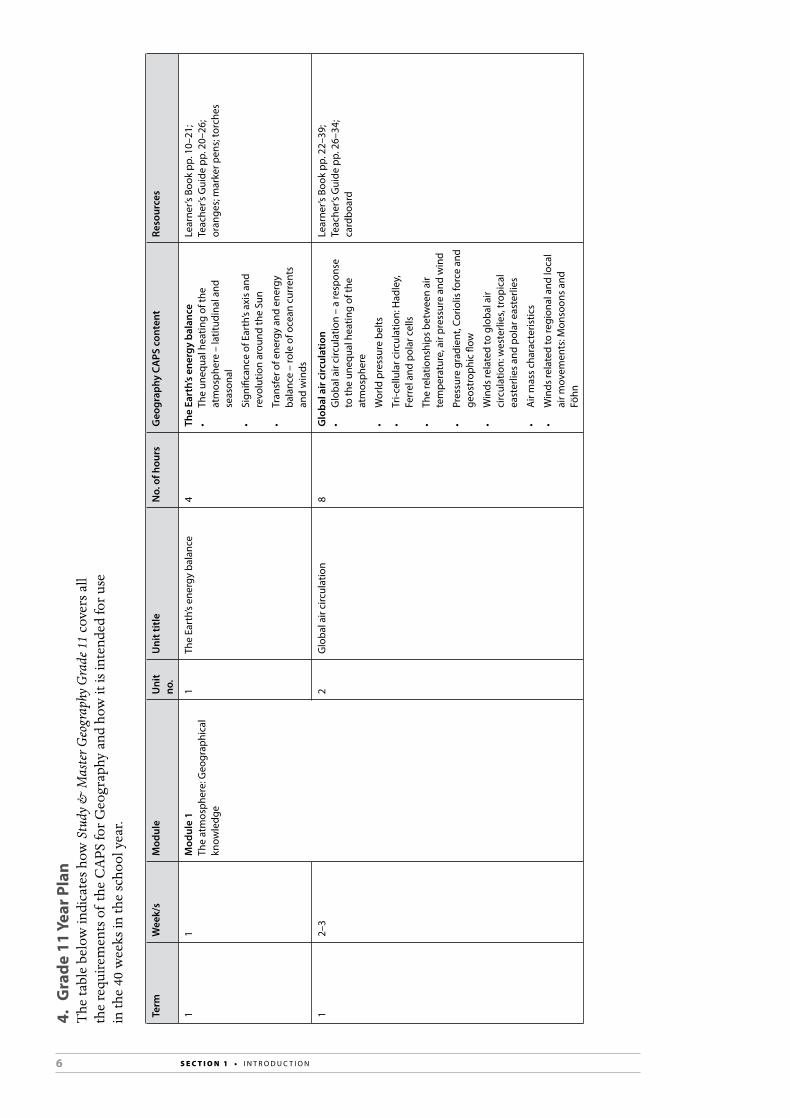
4. G
rade
11
Year
Pla
nT
he ta
ble
belo
w in
dica
tes h
ow S
tudy
& M
aste
r Geo
grap
hy G
rade
11
cove
rs a
ll th
e re
quire
men
ts o
f th
e C
APS
for G
eogr
aphy
and
how
it is
inte
nded
for u
se
in th
e 40
wee
ks in
the
scho
ol y
ear.
Term
Wee
k/s
Mod
ule
Uni
t no
.U
nit t
itle
No.
of h
ours
Geo
grap
hy C
APS
con
tent
Reso
urce
s
11
Mod
ule
1 Th
e at
mos
pher
e: G
eogr
aphi
cal
know
ledg
e
1Th
e Ea
rth’
s en
ergy
bal
ance
4
The
Eart
h’s
ener
gy b
alan
ce
• Th
e un
equa
l hea
ting
of th
e at
mos
pher
e –
latit
udin
al a
nd
seas
onal
• Si
gnifi
canc
e of
Ear
th’s
axis
and
re
volu
tion
arou
nd th
e Su
n
• Tr
ansf
er o
f ene
rgy
and
ener
gy
bala
nce
– ro
le o
f oce
an c
urre
nts
and
win
ds
Lear
ner’s
Boo
k pp
. 10–
21;
Teac
her’s
Gui
de p
p. 2
0–26
; or
ange
s; m
arke
r pen
s; to
rche
s
12–
32
Glo
bal a
ir ci
rcul
atio
n 8
Glo
bal a
ir c
ircul
atio
n
• G
loba
l air
circ
ulat
ion
– a
resp
onse
to
the
uneq
ual h
eatin
g of
the
atm
osph
ere
• W
orld
pre
ssur
e be
lts
• Tr
i-cel
lula
r circ
ulat
ion:
Had
ley,
Fe
rrel
and
pol
ar c
ells
• Th
e re
latio
nshi
ps b
etw
een
air
tem
pera
ture
, air
pres
sure
and
win
d
• Pr
essu
re g
radi
ent,
Corio
lis fo
rce
and
geos
trop
hic
flow
• W
inds
rela
ted
to g
loba
l air
circ
ulat
ion:
wes
terli
es, t
ropi
cal
east
erlie
s an
d po
lar e
aste
rlies
• A
ir m
ass
char
acte
ristic
s
• W
inds
rela
ted
to re
gion
al a
nd lo
cal
air m
ovem
ents
: Mon
soon
s an
d Fö
hn
Lear
ner’s
Boo
k pp
. 22–
39;
Teac
her’s
Gui
de p
p. 2
6–34
; ca
rdbo
ard
7S E C T I O N 1 • I N T R O D U C T I O N
Term
Wee
k/s
Mod
ule
Uni
t no
.U
nit t
itle
No.
of h
ours
Geo
grap
hy C
APS
con
tent
Reso
urce
s
14–
53
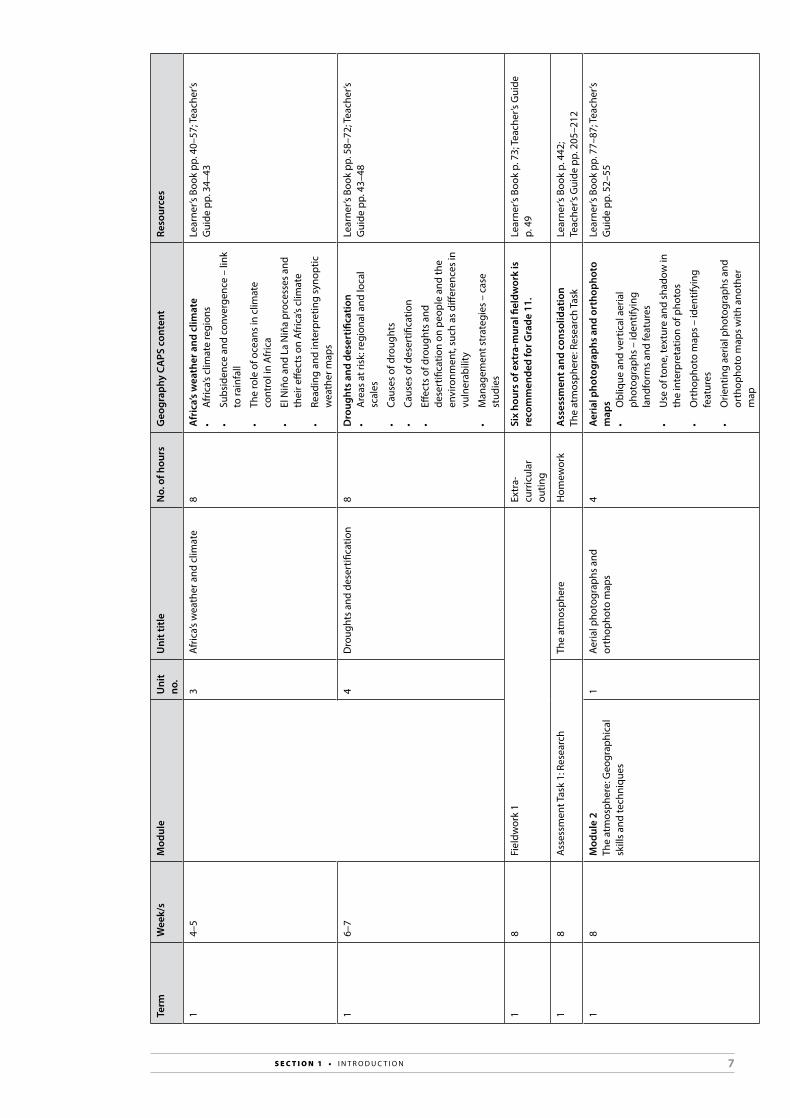
Afr
ica’s
wea
ther
and
clim
ate
8A
fric
a’s
wea
ther
and
clim
ate
• A
fric
a’s c
limat
e re
gion
s
• Su
bsid
ence
and
con
verg
ence
– li
nk
to ra
infa
ll
• Th
e ro
le o
f oce
ans
in c
limat
e co
ntro
l in
Afr
ica
• El
Niñ
o an
d La
Niñ
a pr
oces
ses
and
thei
r effe
cts
on A
fric
a’s c
limat
e
• Re
adin
g an
d in
terp
retin
g sy
nopt
ic
wea
ther
map
s
Lear
ner’s
Boo
k pp
. 40–
57; T
each
er’s
Gui
de p
p. 3
4–43
16–
74
Dro
ught
s an
d de
sert
ifica
tion
8D
roug
hts
and
dese
rtifi
catio
n •
Are
as a
t ris
k: re
gion
al a
nd lo
cal
scal
es
• Ca
uses
of d
roug
hts
• Ca
uses
of d
eser
tifica
tion
• Eff
ects
of d
roug
hts
and
dese
rtifi
catio
n on
peo
ple
and
the
envi
ronm
ent,
such
as
diffe
renc
es in
vu
lner
abili
ty
• M
anag
emen
t str
ateg
ies
– ca
se
stud
ies
Lear
ner’s
Boo
k pp
. 58–
72; T
each
er’s
Gui
de p
p. 4
3–48
18
Fiel
dwor
k 1
Extr
a-cu
rric
ular
ou
ting
Six
hour
s of
ext
ra-m
ural
fiel
dwor
k is
re
com
men
ded
for G
rade
11.
Lear
ner’s
Boo
k p.
73;
Teac
her’s
Gui
de
p. 4
9
18
Ass
essm
ent T
ask
1: R
esea
rch
The
atm
osph
ere
Hom
ewor
kA
sses
smen
t and
con
solid
atio
nTh
e at
mos
pher
e: R
esea
rch
Task
Le
arne
r’s B
ook
p. 4
42;
Teac
her’s
Gui
de p
p. 2
05–2
12
18
Mod
ule
2Th
e at
mos
pher
e: G
eogr
aphi
cal
skill
s an
d te
chni
ques
1Ae
rial p
hoto
grap
hs a
nd
orth
opho
to m
aps
4A
eria
l pho
togr
aphs
and
ort
hoph
oto
map
s•
Obl
ique
and
ver
tical
aer
ial
phot
ogra
phs
– id
entif
ying
la
ndfo
rms
and
feat
ures
• U
se o
f ton
e, te
xtur
e an
d sh
adow
in
the
inte
rpre
tatio
n of
pho
tos
• O
rtho
phot
o m
aps
– id
entif
ying
fe
atur
es
• O
rient
ing
aeria
l pho
togr
aphs
and
or
thop
hoto
map
s w
ith a
noth
er
map
Lear
ner’s
Boo
k pp
. 77–
87; T
each
er’s
Gui
de p
p. 5
2–55
8 S E C T I O N 1 • I N T R O D U C T I O N
Term
Wee
k/s
Mod
ule
Uni
t no
.U
nit t
itle
No.
of h
ours
Geo
grap
hy C
APS
con
tent
Reso
urce
s
19
2G
eogr
aphi
cal I
nfor
mat
ion
Syst
ems
(GIS
)2
Geo
grap
hica
l Inf
orm
atio
n Sy
stem
s (G
IS)
• Sa
telli
te im
ages
• A
pplic
atio
n of
GIS
to c
limat
olog
y an
d m
eteo
rolo
gy
Lear
ner’s
Boo
k pp
. 88–
100;
Te
ache
r’s G
uide
pp.
55–
58
19–
10Re
view
: Ter
m 1
2A
sses
smen
t and
con
solid
atio
n Le
arne
r’s B
ook
pp. 1
01–1
08;
Teac
her’s
Gui
de p
p. 5
9–61
110
Cont
rolle
d te
st 1
1A
sses
smen
t and
con
solid
atio
nTh
e at
mos
pher
e: C
ontr
olle
d te
st (o
n Te
rm 1
wor
k)
Teac
her’s
Gui
de p
p. 2
02–2
05
21
Mod
ule
3G
eom
orph
olog
y: G
eogr
aphi
cal
know
ledg
e
1To
pogr
aphy
ass
ocia
ted
with
ho
rizon
tally
laye
red
rock
s4
Topo
grap
hy a
ssoc
iate
d w
ith
hori
zont
ally
laye
red
rock
s•
Char
acte
ristic
s an
d pr
oces
ses
asso
ciat
ed w
ith th
e de
velo
pmen
t of
: hill
y la
ndsc
apes
, bas
altic
pl
atea
us, c
anyo
n la
ndsc
apes
and
Ka
roo
land
scap
es (m
esa,
but
te a
nd
coni
cal h
ill)
• Co
ncep
t of s
carp
retr
eat o
r bac
k w
astin
gs
• U
tilis
atio
n of
thes
e la
ndsc
apes
by
peop
le
Lear
ner’s
Boo
k pp
. 110
–125
; Te
ache
r’s G
uide
pp.
63–
68
22
2To
pogr
aphy
ass
ocia
ted
with
in
clin
ed/t
ilted
rock
str
ata
4To
pogr
aphy
ass
ocia
ted
with
incl
ined
/til
ted
rock
str
ata
• Ch
arac
teris
tics
and
proc
esse
s as
soci
ated
with
the
deve
lopm
ent
of: a
sca
rp s
lope
, a d
ip s
lope
, a
cues
ta, h
omoc
linal
ridg
e, h
ogsb
ack,
cu
esta
bas
in a
nd c
uest
a do
me
• U
tilis
atio
n of
thes
e la
ndsc
apes
by
peop
le
Lear
ner’s
Boo
k pp
. 126
–133
; Te
ache
r’s G
uide
pp.
68–
72
23
3To
pogr
aphy
ass
ocia
ted
with
m
assi
ve ig
neou
s ro
cks
4To
pogr
aphy
ass
ocia
ted
with
mas
sive
ig
neou
s ro
cks:
• Id
entifi
catio
n of
bat
holit
hs,
lacc
olith
s, lo
polit
hs, d
ykes
and
sill
s
• Ch
arac
teris
tics
and
proc
esse
s as
soci
ated
with
the
deve
lopm
ent o
f gr
anite
dom
es a
nd to
rs
Lear
ner’s
Boo
k pp
. 134
–143
; Te
ache
r’s G
uide
pp.
73–
76
9S E C T I O N 1 • I N T R O D U C T I O N
Term
Wee
k/s
Mod
ule
Uni
t no
.U
nit t
itle
No.
of h
ours
Geo
grap
hy C
APS
con
tent
Reso
urce
s
24
4Sl
opes
4Sl
opes
•
Ove
rvie
w o
f Sou
th A
fric
a’s
topo
grap
hy
• Ty
pes
of s
lope
s
• Sl
ope
elem
ents
: cre
st, c
liff (s
carp
sl
ope,
free
face
), ta
lus
(deb
ris, s
cree
sl
ope)
and
ped
imen
t
• Ch
arac
teris
tics
of th
e sl
ope
elem
ents
: cre
st, c
liff (s
carp
slo
pe,
free
face
), ta
lus
(deb
ris, s
cree
slo
pe)
and
pedi
men
t
• Sl
ope
deve
lopm
ent o
ver t
ime
• Th
e co
ncep
t of s
lope
retr
eat
Lear
ner’s
Boo
k pp
. 144
–151
; Te
ache
r’s G
uide
pp.
76–
80
25
5M
ass
mov
emen
ts a
nd h
uman
re
spon
ses
4M
ass
mov
emen
ts a
nd h
uman
re
spon
ses
•
Conc
ept o
f mas
s m
ovem
ents
• Ki
nds
of m
ass
mov
emen
ts: s
oil
cree
p, s
oilfl
uctio
n, la
ndsl
ides
, roc
k fa
lls a
nd m
ud fl
ows,
and
slum
ps
• Th
e im
pact
of m
ass
mov
emen
ts o
n pe
ople
and
the
envi
ronm
ent
• St
rate
gies
to p
reve
nt o
r min
imis
e th
e eff
ects
of m
ass
mov
emen
t –
Sout
h A
fric
an c
ase
stud
ies
Lear
ner’s
Boo
k pp
. 152
–162
; Te
ache
r’s G
uide
pp.
81–
85
26–
7M
odul
e 4
Geo
mor
phol
ogy:
Geo
grap
hica
l sk
ills
and
tech
niqu
es
1To
pogr
aphi
c m
aps
6To
pogr
aphi
c m
aps
•
Cont
ours
and
land
form
s
• Cr
oss-
sect
ions
on
1:50
000
to
pogr
aphi
c m
aps
• Ve
rtic
al e
xagg
era t
ion
• In
ter-
visi
bilit
y
• G
radi
ent
Lear
ner’s
Boo
k pp
. 163
–178
; Te
ache
r’s G
uide
pp.
87–
91
10 S E C T I O N 1 • I N T R O D U C T I O N
Term
Wee
k/s
Mod
ule
Uni
t no
.U
nit t
itle
No.
of h
ours
Geo
grap
hy C
APS
con
tent
Reso
urce
s
27
2G
eogr
aphi
cal I
nfor
mat
ion
Syst
ems
(GIS
)2
Geo
grap
hica
l Inf
orm
atio
n Sy
stem
s (G
IS)
• Sp
atia
lly re
fere
nced
dat
a
• Sp
atia
l and
spe
ctra
l res
olut
ion
• D
iffer
ent t
ypes
of d
ata:
line
, poi
nt,
area
and
att
ribut
e
• Ra
ster
and
vec
tor d
ata;
and
• Ca
ptur
ing
diffe
rent
type
s of
dat
a fr
om e
xist
ing
map
s, ph
otog
raph
s, fie
ldw
ork
or o
ther
reco
rds
on
trac
ing
pape
r
Lear
ner’s
Boo
k pp
. 179
–186
; Te
ache
r’s G
uide
pp.
91–
94;
trac
ing
pape
r
28
3Fi
eldw
ork
2Fi
eldw
ork
• O
bser
vatio
n
• Co
llect
ing
and
reco
rdin
g da
ta
• Pr
oces
sing
, col
latin
g an
d pr
esen
ting
field
wor
k fin
ding
s
Lear
ner’s
Boo
k pp
. 187
–189
; Te
ache
r’s G
uide
pp.
94–
96
28
Ass
essm
ent T
ask
2: M
apw
ork
Map
wor
k1
(com
plet
e as
ho
mew
ork)
Ass
essm
ent a
nd c
onso
lidat
ion
Ass
essm
ent T
ask
2: M
apw
ork
Lear
ner’s
Boo
k pp
. 443
–446
; Te
ache
r’s G
uide
pp.
213
–217
28–
9Re
view
: Ter
m 2
2 (c
ompl
ete
as
hom
ewor
k)A
sses
smen
t and
con
solid
atio
n Le
arne
r’s B
ook
pp. 1
94–1
98;
Teac
her’s
Gui
de p
p. 9
8–10
1
29–
10Ex
amin
atio
nsA
sses
smen
t and
con
solid
atio
nM
id-y
ear e
xam
inat
ion
Teac
her’s
Gui
de p
p. 1
97–1
98, 2
18–2
30
31–
2M
odul
e 5
Dev
elop
men
t geo
grap
hy:
Geo
grap
hica
l kno
wle
dge
1Th
e co
ncep
t of d
evel
opm
ent
7Th
e co
ncep
t of d
evel
opm
ent
• Te
rmin
olog
y as
soci
ated
w
ith d
evel
opm
ent,
such
as
deve
lope
d, d
evel
opin
g, m
ore
econ
omic
ally
dev
elop
ed c
ount
ries
(MED
Cs) a
nd le
ss e
cono
mic
ally
de
velo
ped
coun
trie
s (L
EDCs
), an
d in
dust
rialis
ed c
ount
ries
• Th
e co
ncep
t of d
evel
opm
ent:
econ
omic
, soc
ial,
sust
aina
ble,
ap
prop
riate
sca
le a
nd s
patia
l as
pect
s
• Ec
onom
ic, s
ocia
l and
dem
ogra
phic
in
dica
tors
of d
evel
opm
ent:
GN
P, G
DP,
HD
I, G
ini C
oeffi
cien
t, lif
e ex
pect
ancy
and
infa
nt m
orta
lity
• Ex
ampl
es to
illu
stra
te d
iffer
ence
s in
de
velo
pmen
t fro
m lo
cal,
regi
onal
, an
d gl
obal
con
text
s
Lear
ner’s
Boo
k pp
. 201
–220
; Te
ache
r’s G
uide
pp.
103
–111
; at
lase
s; c
ompa
sses

11S E C T I O N 1 • I N T R O D U C T I O N
Term
Wee
k/s
Mod
ule
Uni
t no
.U
nit t
itle
No.
of h
ours
Geo
grap
hy C
APS
con
tent
Reso
urce
s
32–
42
Fram
ewor
ks fo
r dev
elop
men
t6
Fram
ewor
ks fo
r dev
elop
men
t
• Fa
ctor
s th
at a
ffect
dev
elop
men
t, in
clud
ing:
acc
ess
to re
sour
ces,
ener
gy, h
isto
ry, t
rade
imba
lanc
es,
popu
latio
n gr
owth
, edu
catio
n an
d tr
aini
ng, n
atur
al re
sour
ce
limita
tions
and
env
ironm
enta
l de
grad
atio
n (n
ote:
lear
ners
nee
d to
ex
plor
e th
e co
mpl
exity
and
inte
r-re
late
d na
ture
of t
hese
fact
ors)
• D
evel
opm
ent m
odel
s: fr
ee m
arke
t m
odel
s, su
ch a
s Ro
stow
’s m
odel
w
ith it
s lim
itatio
ns a
nd c
ritic
ism
s, co
re a
nd p
erip
hery
mod
els
with
th
eir a
pplic
atio
n at
diff
eren
t sc
ales
, sus
tain
abili
ty m
odel
s w
ith th
eir e
cono
mic
, soc
ial,
and
envi
ronm
enta
l ele
men
ts
• Co
mm
unity
bas
ed d
evel
opm
ent,
incl
udin
g ap
proa
ches
to ru
ral a
nd
urba
n de
velo
pmen
t (w
ith e
xam
ples
fr
om a
roun
d th
e w
orld
)
Lear
ner’s
Boo
k pp
. 221
–240
; Te
ache
r’s G
uide
pp.
111
–120
; atla
ses
34–
53
Trad
e an
d de
velo
pmen
t6
Trad
e an
d de
velo
pmen
t •
Inte
rnat
iona
l tra
de a
nd w
orld
m
arke
ts: c
omm
oditi
es tr
aded
and
te
rms
of tr
ade
• Ty
pes
of tr
adin
g re
latio
nshi
ps,
incl
udin
g: fr
ee tr
ade,
trad
e ba
rrie
rs,
subs
idie
s an
d fa
ir tr
ade
• Th
e co
ncep
t of g
loba
lisat
ion
and
its
impa
ct o
n de
velo
pmen
t
• Ex
port
-led
deve
lopm
ent –
crit
ical
ly
exam
ined
(with
exa
mpl
es fr
om
arou
nd th
e w
orld
)
Lear
ner’s
Boo
k pp
. 241
–256
; Te
ache
r’s G
uide
pp.
120
–125
; la
rge
wor
ld m
ap

12 S E C T I O N 1 • I N T R O D U C T I O N
Term
Wee
k/s
Mod
ule
Uni
t no
.U
nit t
itle
No.
of h
ours
Geo
grap
hy C
APS
con
tent
Reso
urce
s
35–
64
Dev
elop
men
t iss
ues
and
chal
leng
es4
Dev
elop
men
t iss
ues
and
chal
leng
es
• Th
e ro
le o
f wom
en in
dev
elop
men
t: ge
nder
issu
es re
late
d to
pow
er,
acce
ss to
reso
urce
s an
d at
titud
es
• Th
e eff
ect o
f dev
elop
men
t on
the
envi
ronm
ent
• Th
e ro
le o
f the
sta
te a
nd b
usin
ess
in d
evel
opm
ent i
n So
uth
Afr
ica,
in
clud
ing
cent
ral c
ontr
ol b
y th
e st
ate,
wea
k st
ate
cont
rol a
nd p
ublic
or
priv
ate
part
ners
hips
Lear
ner’s
Boo
k pp
. 257
–268
; Te
ache
r’s G
uide
pp.
126
–129
; atla
ses
36–
75
The
role
of d
evel
opm
ent a
id4
Role
of d
evel
opm
ent a
id
• Co
ncep
t of d
evel
opm
ent a
id a
nd
deve
lopm
ent c
o-op
erat
ion
• Ty
pes
of d
evel
opm
ent a
id –
te
chni
cal,
cond
ition
al, h
uman
itaria
n
• Im
pact
of a
id o
n de
velo
pmen
t (in
clud
ing
case
stu
dies
of
deve
lopm
ent a
id –
pos
itive
and
ne
gativ
e)
Lear
ner’s
Boo
k pp
. 269
–279
; Te
ache
r’s G
uide
pp.
129
–133
37
Cont
rolle
d te
st 2
11
Ass
essm
ent a
nd c
onso
lidat
ion
Dev
elop
men
t geo
grap
hy: C
ontr
olle
d te
st
Teac
her’s
Gui
de p
p. 2
31–2
33
37
Fiel
dwor
k 2
Extr
a-cu
rric
ular
Six
hour
s of
ext
ra-m
ural
fiel
dwor
k is
re
com
men
ded
for G
rade
11.
Lear
ner’s
Boo
k p.
280
; Te
ache
r’s G
uide
p. 1
33
38
Mod
ule
6D
evel
opm
ent g
eogr
aphy
: G
eogr
aphi
cal s
kills
and
te
chni
ques
1M
apw
ork
skill
s4
Map
wor
k sk
ills
(with
refe
renc
e to
1:
50 0
00 to
pogr
aphi
c m
aps)
• Lo
catin
g ex
act p
ositi
on: d
egre
es,
min
utes
and
sec
onds
• Re
lativ
e po
sitio
n: d
irect
ion
and
mag
netic
bea
ring
• Sc
ale:
wor
d, ra
tio a
nd li
ne s
cale
• D
ista
nce:
mea
surin
g di
stan
ces
and
conv
ertin
g to
gro
und
dist
ance
, st
raig
ht li
ne a
nd c
urve
d (p
ract
ise)
• Ca
lcul
atin
g ar
ea
Lear
ner’s
Boo
k pp
. 281
–292
; Te
ache
r’s G
uide
pp.
135
–138
; atla
ses
13S E C T I O N 1 • I N T R O D U C T I O N
Term
Wee
k/s
Mod
ule
Uni
t no
.U
nit t
itle
No.
of h
ours
Geo
grap
hy C
APS
con
tent
Reso
urce
s
39
2U
sing
atla
ses
1U
sing
atla
ses
(revi
sion
) •
Usi
ng th
e in
dex
• Lo
catin
g pl
aces
on
diffe
rent
map
s us
ing
degr
ees
and
min
utes
• Co
mpa
ring
info
rmat
ion
from
di
ffere
nt m
aps
Lear
ner’s
Boo
k pp
. 293
–296
; Te
ache
r’s G
uide
pp.
139
–140
; atla
ses
39–
10Re
view
: Ter
m 3
2A
sses
smen
t and
con
solid
atio
n Le
arne
r’s B
ook
pp. 2
97–2
98;
Teac
her’s
Gui
de p
p. 1
41–1
42; a
tlase
s
41
Mod
ule
7Re
sour
ces
and
sust
aina
bilit
y:
Geo
grap
hica
l kno
wle
dge
1U
sing
reso
urce
s3
Usi
ng re
sour
ces
• Th
e re
latio
nshi
p be
twee
n re
sour
ces
and
econ
omic
dev
elop
men
t
• Ex
ploi
tatio
n an
d de
plet
ion
of
reso
urce
s
• Co
ncep
ts o
f sus
tain
abili
ty a
nd
sust
aina
ble
use
of re
sour
ces
Lear
ner’s
Boo
k pp
. 300
–310
; Te
ache
r’s G
uide
pp.
144
–148
41–
22
Soil
and
soil
eros
ion
5So
il an
d so
il er
osio
n •
How
soi
ls a
re fo
rmed
• So
il as
a re
sour
ce
• Ca
uses
of s
oil e
rosi
on: h
uman
, an
imal
, phy
sica
l, an
d pa
st a
nd
pres
ent
• Ev
iden
ce o
f soi
l ero
sion
in S
outh
A
fric
a
• Eff
ects
of s
oil e
rosi
on o
n pe
ople
an
d th
e en
viro
nmen
t
• M
anag
emen
t str
ateg
ies
to p
reve
nt
and
cont
rol s
oil e
rosi
on
Lear
ner’s
Boo
k pp
. 311
–324
; Te
ache
r’s G
uide
pp.
148
–152
; w
all w
orld
map
or a
tlase
s

14 S E C T I O N 1 • I N T R O D U C T I O N
Term
Wee
k/s
Mod
ule
Uni
t no
.U
nit t
itle
No.
of h
ours
Geo
grap
hy C
APS
con
tent
Reso
urce
s
43–
43
Conv
entio
nal e
nerg
y re
sour
ces
and
thei
r im
pact
on
the
envi
ronm
ent
5Co
nven
tiona
l ene
rgy
sour
ces
and
thei
r im
pact
on
the
envi
ronm
ent
• M
aps
and
grap
hs to
sho
w th
erm
al,
hydr
o, a
nd n
ucle
ar e
nerg
y pr
oduc
tion
in S
outh
Afr
ica
• Th
erm
al e
lect
ricity
gen
erat
ion
usin
g co
al –
out
line
of p
rinci
ples
an
d pr
oces
ses
• Th
e im
pact
of c
oal m
inin
g an
d th
erm
al p
ower
sta
tions
–
envi
ronm
enta
l des
polia
tion,
sol
id
was
te, w
aste
gas
es a
nd a
cid
rain
• Ca
se s
tudy
of n
ucle
ar e
nerg
y –
adva
ntag
es a
nd d
isad
vant
ages
• So
uth
Afr
ica’s
pot
entia
l to
mee
t lo
ng-t
erm
ene
rgy
need
s us
ing
conv
entio
nal s
ourc
es
Lear
ner’s
Boo
k pp
. 325
–352
; Te
ache
r’s G
uide
pp.
153
–162
; at
lase
s
44–
54
Non
-con
vent
iona
l ene
rgy
sour
ces
4N
on-c
onve
ntio
nal e
nerg
y so
urce
s •
Sola
r ene
rgy
– ex
ampl
es fr
om
Sout
h A
fric
a an
d th
e w
orld
• W
ind
ener
gy –
exa
mpl
es fr
om
Sout
h A
fric
a an
d th
e w
orld
• Fu
ture
of n
on-c
onve
ntio
nal e
nerg
y in
Sou
th A
fric
a
• Po
ssib
le e
ffect
s of
usi
ng m
ore
non-
conv
entio
nal e
nerg
y on
the
Sout
h A
fric
an e
cono
my
and
the
envi
ronm
ent
Lear
ner’s
Boo
k pp
. 353
–378
; Te
ache
r’s G
uide
pp.
162
–168
45
5En
ergy
man
agem
ent i
n So
uth
Afr
ica
3En
ergy
man
agem
ent i
n So
uth
Afr
ica
•
Sout
h A
fric
a’s c
hang
ing
ener
gy
need
s
• En
ergy
man
agem
ent,
tow
ards
gr
eene
r eco
nom
ies
and
sust
aina
ble
life
styl
es: r
espo
nsib
ilitie
s of
go
vern
men
ts, b
usin
esse
s an
d in
divi
dual
s
Lear
ner’s
Boo
k pp
. 379
–392
; Te
ache
r’s G
uide
pp.
168
–171
45
Fiel
dwor
k 3
Extr
a-cu
rric
ulua
rSi
x ho
urs
of e
xtra
-mur
al fi
eldw
ork
is
reco
mm
ende
d fo
r Gra
de 1
1.Le
arne
r’s B
ook
p. 3
93;
Teac
her’s
Gui
de p
p. 1
71–1
72; s
pade
s;
cam
eras
/cel
l pho
nes
with
cam
eras
; pa
per;
penc
ils; e
rase
rs
15S E C T I O N 1 • I N T R O D U C T I O N
Term
Wee
k/s
Mod
ule
Uni
t no
.U
nit t
itle
No.
of h
ours
Geo
grap
hy C
APS
con
tent
Reso
urce
s
46
Mod
ule
8Re
sour
ces
and
sust
aina
bilit
y:
Geo
grap
hica
l ski
lls a
nd
tech
niqu
es
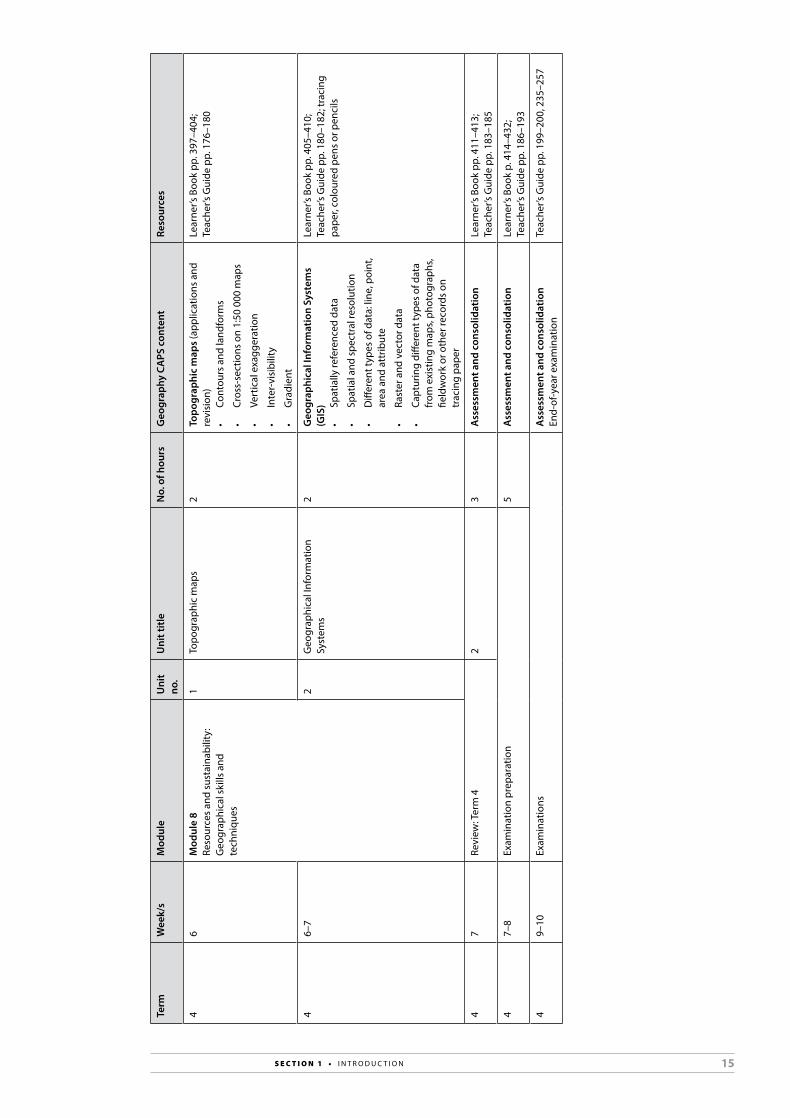
1To
pogr
aphi
c m
aps
2To
pogr
aphi
c m
aps
(app
licat
ions
and
re
visi
on)
• Co
ntou
rs a
nd la
ndfo
rms
• Cr
oss-
sect
ions
on
1:50
000
map
s
• Ve
rtic
al e
xagg
erat
ion
• In
ter-
visi
bilit
y
• G
radi
ent
Lear
ner’s
Boo
k pp
. 397
–404
; Te
ache
r’s G
uide
pp.
176
–180
46–
72
Geo
grap
hica
l Inf
orm
atio
n Sy
stem
s2
Geo
grap
hica
l Inf
orm
atio
n Sy
stem
s (G
IS)
• Sp
atia
lly re
fere
nced
dat
a
• Sp
atia
l and
spe
ctra
l res
olut
ion
• D
iffer
ent t
ypes
of d
ata:
line
, poi
nt,
area
and
att
ribut
e
• Ra
ster
and
vec
tor d
ata
• Ca
ptur
ing
diffe
rent
type
s of
dat
a fr
om e
xist
ing
map
s, ph
otog
raph
s, fie
ldw
ork
or o
ther
reco
rds
on
trac
ing
pape
r
Lear
ner’s
Boo
k pp
. 405
–410
; Te
ache
r’s G
uide
pp.
180
–182
; tra
cing
pa
per,
colo
ured
pen
s or
pen
cils
47
Revi
ew: T
erm
42
3A
sses
smen
t and
con
solid
atio
nLe
arne
r’s B
ook
pp. 4
11–4
13;
Teac
her’s
Gui
de p
p. 1
83–1
85
47–
8Ex
amin
atio
n pr
epar
atio
n5
Ass
essm
ent a
nd c
onso
lidat
ion
Lear
ner’s
Boo
k p.
414
–432
; Te
ache
r’s G
uide
pp.
186
–193
49–
10Ex
amin
atio
nsA
sses
smen
t and
con
solid
atio
nEn
d-of
-yea
r exa
min
atio
nTe
ache
r’s G
uide
pp.
199
–200
, 235
–257

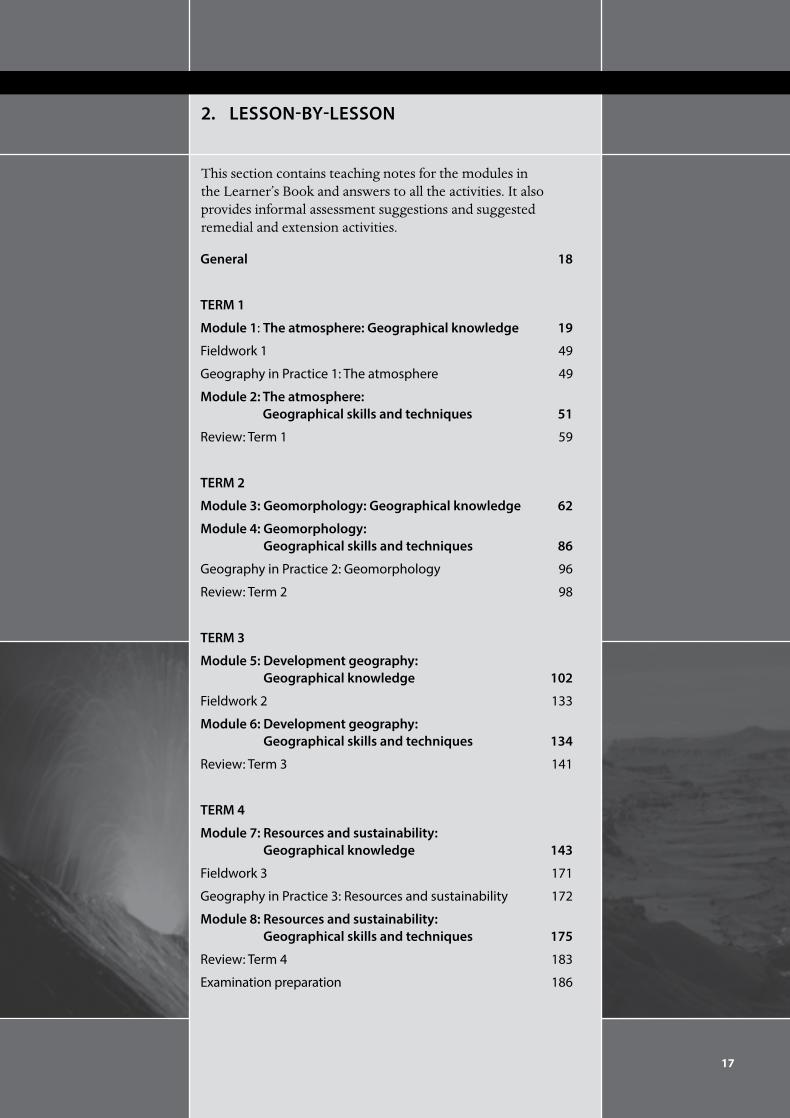
17
2. LESSON-BY-LESSON
This section contains teaching notes for the modules in the Learner’s Book and answers to all the activities. It also provides informal assessment suggestions and suggested remedial and extension activities.
General 18
TERM 1
Module 1: The atmosphere: Geographical knowledge 19
Fieldwork 1 49
Geography in Practice 1: The atmosphere 49
Module 2: The atmosphere: Geographical skills and techniques 51
Review: Term 1 59
TERM 2
Module 3: Geomorphology: Geographical knowledge 62
Module 4: Geomorphology: Geographical skills and techniques 86
Geography in Practice 2: Geomorphology 96
Review: Term 2 98
TERM 3
Module 5: Development geography: Geographical knowledge 102
Fieldwork 2 133
Module 6: Development geography: Geographical skills and techniques 134
Review: Term 3 141
TERM 4
Module 7: Resources and sustainability: Geographical knowledge 143
Fieldwork 3 171
Geography in Practice 3: Resources and sustainability 172
Module 8: Resources and sustainability: Geographical skills and techniques 175
Review: Term 4 183
Examination preparation 186

18 S E C T I O N 2 • L E S S O N - B Y - L E S S O N
General• Many of the activities are bite-sized, quick and easy to do. Because of this
you can often work through as many as two or three activities in a lesson.• The information boxes (those with a magnifying glass), case studies and
other information in boxes in the Learner’s Book provide additional information, examples, or applications for some teaching points in the main body text.
• Use a variety of approaches for reading these boxes – for example, read the box to the class, ask a learner to read the box to the class, or ask learners to read the box on their own (use this approach for short, easy-to-read boxes).
• In most cases, these boxes are there for teaching and learning purposes (they are always linked to activities), but not for revision purposes. Point out to your learners that when they use the book for revision, they need only focus on the main body text.
• In this Teacher’s Guide, the instruction, ‘Instruct the learners to work on Activity x’, includes going through the answers with the class once they have completed the activity. This is unless the activity is set for, or finished off, as homework. In this case, remember to go through the answers to the activity at the start of the next lesson.

19M O D U L E 1 • T H E AT M O S P H E R E : G E O G R A P H I C A L K N O W L E D G E
THE ATMOSPHERE:
GEOGRAPHICAL KNOWLEDGE
TERM 1Learner’s Book pages 10–75Duration: 28 hours
MODULE 1
This module focuses on the heating of the atmosphere. It builds on the concept of insolation (incoming sunlight) and covers global air circulation, Africa’s weather and climate, and droughts and desertification. As with the Grade 10 module on the atmosphere, it deals with some difficult physical concepts. Curriculum and Assessment Policy Statement (CAPS) content
The Earth’s energy balance • The unequal heating of the atmosphere – latitudinal and seasonal• Significance of Earth’s axis and revolution around the Sun• Transfer of energy and energy balance – role of ocean currents
and winds
Global air circulation • Global air circulation – a response to the unequal heating of
the atmosphere• World pressure belts• Tri-cellular circulation: Hadley, Ferrel and polar cells• The relationships between air temperature, air pressure and wind• Pressure gradient, Coriolis force and geostrophic flow• Winds related to global air circulation: westerlies, tropical easterlies
and polar easterlies• Air mass characteristics• Winds related to regional and local air movements: Monsoons
and Föhn
Africa’s weather and climate • Africa’s climate regions• Subsidence and convergence – link to rainfall• The role of oceans in climate control in Africa• El Niño and La Niña processes and their effects on Africa’s climate• Reading and interpreting synoptic weather maps
Droughts and desertification • Areas at risk: regional and local scales• Causes of droughts• Causes of desertification• Effects of droughts and desertification on people and the
environment, such as differences in vulnerability• Management strategies – case studies
20 S E C T I O N 2 • L E S S O N - B Y - L E S S O N
Key geographical skills and techniques• using verbal, quantitative and symbolic data forms such as text, pictures,
graphs, tables, diagrams and maps• practising field observation and mapping, interviewing people,
interpreting sources, working with statistics • applying communication, thinking, practical and social skills• practising the following specific skills:
– identifying questions and issues– collecting and structuring information – processing, interpreting, and evaluating data – making decisions and judgements– deciding on a point of view– suggesting solutions to problems– working co-operatively and independently
Key words/conceptslatitude; equator; pole; mid-latitudes; season; orbit; revolution; solstice; equinox; tropics; polar regions; convection; convection cell; wind; ocean current; global air circulation; air pressure/atmospheric pressure; pressure gradient; adiabatic cooling; adiabatic warming; tri-cellular model; Hadley cell; Ferrel cell; polar cell; equatorial low/Intertropical Convergence Zone (ITCZ); subtropical high; subpolar low; global wind; tropical easterlies/trade winds; westerlies; polar easterlies; Coriolis effect; geostrophic wind; air mass; monsoon; Harmattan; Föhn; weather; climate; biome; Mediterranean climate; subsidence; convergence; maritime climate; sea breeze; land breeze; Walker circulation; El Niño; La Niña; southern oscillation; El Niño/La Niña-Southern Oscillation (ENSO); synoptic map; isobar; station model; drought; climate change; desertification; drylands; deforestation; overgrazing; biodiversity; wildfire/veldfire; heat wave; dust storm
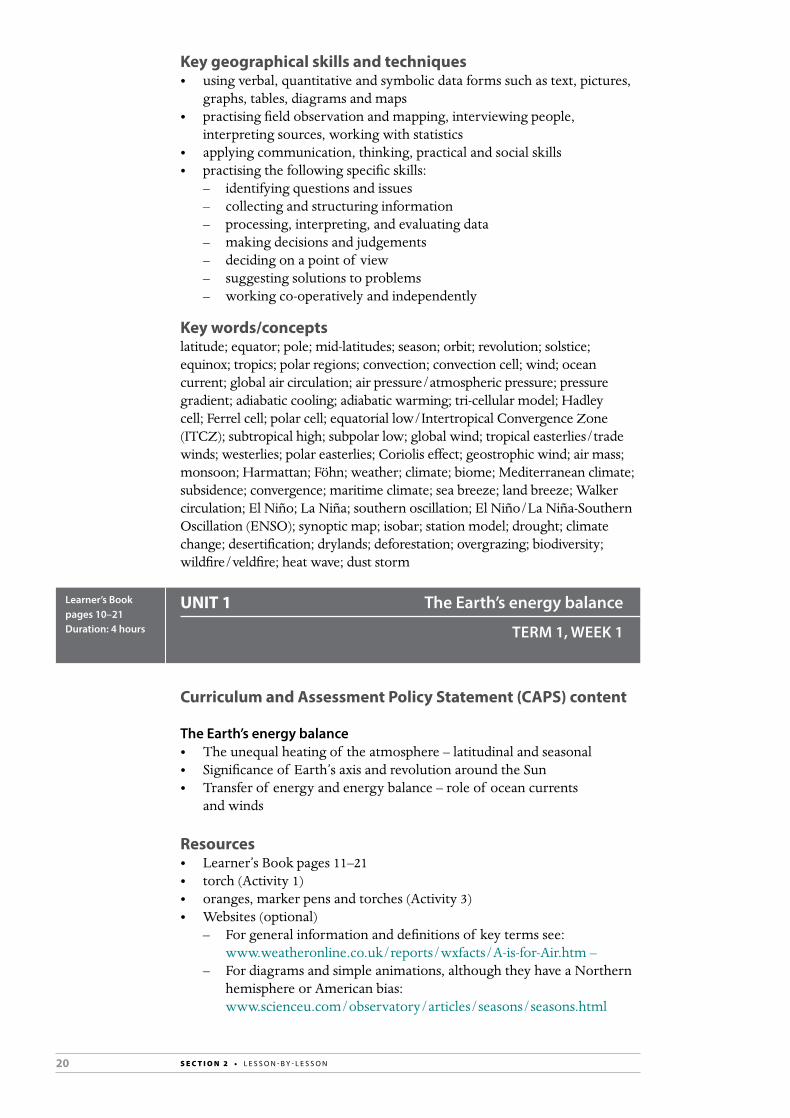
UNIT 1 The Earth’s energy balance
TERM 1, WEEK 1
Learner’s Book pages 10–21Duration: 4 hours
Curriculum and Assessment Policy Statement (CAPS) content
The Earth’s energy balance• The unequal heating of the atmosphere – latitudinal and seasonal• Significance of Earth’s axis and revolution around the Sun• Transfer of energy and energy balance – role of ocean currents
and winds
Resources• Learner’s Book pages 11–21• torch (Activity 1) • oranges, marker pens and torches (Activity 3)• Websites (optional)
– For general information and definitions of key terms see: www.weatheronline.co.uk/reports/wxfacts/A-is-for-Air.htm – – For diagrams and simple animations, although they have a Northern
hemisphere or American bias: www.scienceu.com/observatory/articles/seasons/seasons.html

21M O D U L E 1 • T H E AT M O S P H E R E : G E O G R A P H I C A L K N O W L E D G E
www.astronomy.org/programs/seasons/ www.youtube.com/watch?v=DuiQvPLWziQ www.universetoday.com/18835/solar-cycle/– For a table of dates and times of solstices and equinoxes
until 2017 see: http://en.wikipedia.org/wiki/Solstice
www.coolantarctica.com• a globe is very useful
Preparation• Read through the unit and familiarise yourself with the content that
you will need to teach. Think about what the learners may already know about the topics and any areas of difficulty that you think they might encounter.
Teaching the unit
Lesson 1
• Read through, or ask learners to read through, the Module 1 introductory paragraphs. You can use it as the basis of an opening discussion to assess what learners already know. If necessary, write up and display the four Key questions on the board for the duration of the module.
• Read through, or ask learners to read through, the Unit 1 introductory paragraph. Point out to learners that the Key questions for each unit form the unit headings.
• Work through the section, ‘Why does the Earth and its atmosphere heat up unevenly?’ (page 11). Revise the concept of insolation (see the Revision box) and refer to Figure 1.1.1.
• Work through the section on latitude and refer to Figure 1.1.2.
Activity 1• Do Part A as a demonstration for the class. The beam of light from the
torch represents a beam of light from the Sun. • In Part B of the activity, learners note how the angle of the Sun affects
the concentration of light/insolation.
• Work through the section on the seasons. Emphasise that if the Earth were not tilted in its axis, there would be no seasons.
• Focus on Figure 1.1.4. Point out the solstice and equinox positions in the Earth’s orbit around the Sun.
• Work through the section, ‘How does the Earth’s axis and revolution around the Sun affect the Earth’s energy balance?’ (page 13).
Activity 2• In this activity, learners focus on Figure 1.1.4 and Figure 1.1.5 which show
the Earth’s orbit around the Sun and the Earth’s position at the time of the solstices and equinoxes.
Lesson 2
• In this lesson, focus on Activity 3 and Activity 4.• Learners can fall into the trap of thinking they already know about the
seasons and the Earth’s orbit around the Sun, but it’s important that they model the Earth’s tilt and orbit.

22 S E C T I O N 2 • L E S S O N - B Y - L E S S O N
Activity 3 • In this activity, learners set up a model of the Sun and the Earth using an
orange and a torch. They see for themselves how the Sun is directly over the tropic lines at the time of the solstices and directly over the equator at the time of the equinoxes.
• Learners should do this activity in pairs or groups of three to four.
Activity 4• Read the features, ‘The Earth’s distance from the Sun changes during the
year’ (page 15) and ‘The solstices, the equinoxes and seasonal lag’ (page 16). • In this activity, learners answer questions on the two features and look at
seasonal temperature data.• If necessary, learners can finish this activity for homework.
Lesson 3
• If Activity 4 was finished for homework, go through the answers with the class.
• In this lesson, focus on Activity 5.
Activity 5• Read the features, ‘Antarctica’s longest day and longest night’ (page 16)
and ‘The variation in solar altitude and temperature at the equator and the South Pole’ (page 17).
• In this activity, learners answer questions on the two features and do some temperature calculations.
Lesson 4
• Work through the section, ‘How is heat energy transferred to restore the energy balance?’ (page 19). The three methods of heat transfer are convection, conduction and radiation. Remind learners that convection is one of the mechanisms of heat transfer that they learnt about in Grade 10. The principle of convection is fundamental to weather science. For convection, learners need only remember these four words: hot rises, cold sinks.
• Work through the section on ocean currents. Make up a quiz to see what learners remember about ocean currents from Grade 10.
• Focus on the heat map or thermomap of sea surface temperatures in Figure 1.1.11.
Activity 6• In this activity, learners answer questions on the ocean currents and their
temperature effects.• Learners can do this activity for homework.
23M O D U L E 1 • T H E AT M O S P H E R E : G E O G R A P H I C A L K N O W L E D G E
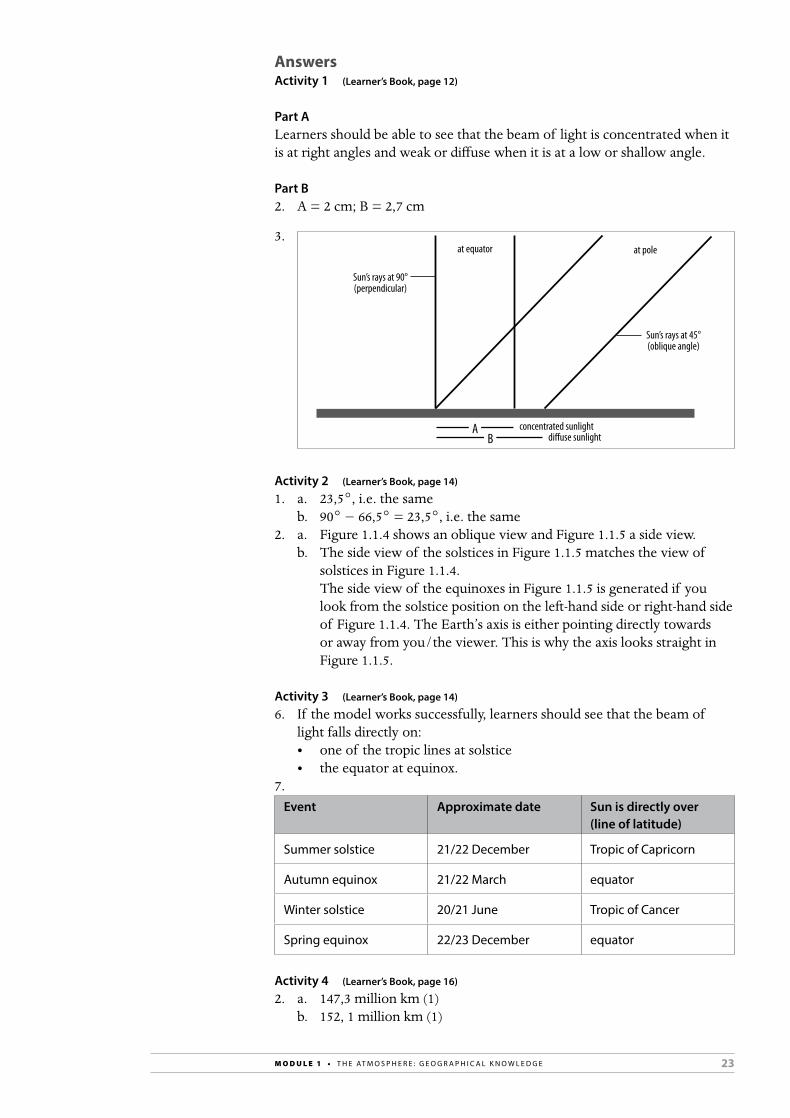
Answers Activity 1 (Learner’s Book, page 12)
Part ALearners should be able to see that the beam of light is concentrated when it is at right angles and weak or diffuse when it is at a low or shallow angle.
Part B2. A = 2 cm; B = 2,7 cm
3.
A
B
Sun’s rays at 90°(perpendicular)
at equator
concentrated sunlightdi�use sunlight
at pole
Sun’s rays at 45°(oblique angle)
Activity 2 (Learner’s Book, page 14)
1. a. 23,5°, i.e. the same b. 90° − 66,5° = 23,5°, i.e. the same2. a. Figure 1.1.4 shows an oblique view and Figure 1.1.5 a side view.
b. The side view of the solstices in Figure 1.1.5 matches the view of solstices in Figure 1.1.4.
The side view of the equinoxes in Figure 1.1.5 is generated if you look from the solstice position on the left-hand side or right-hand side of Figure 1.1.4. The Earth’s axis is either pointing directly towards or away from you/the viewer. This is why the axis looks straight in Figure 1.1.5.
Activity 3 (Learner’s Book, page 14)
6. If the model works successfully, learners should see that the beam of light falls directly on:• one of the tropic lines at solstice • the equator at equinox.
7. Event Approximate date Sun is directly over
(line of latitude)
Summer solstice 21/22 December Tropic of Capricorn
Autumn equinox 21/22 March equator
Winter solstice 20/21 June Tropic of Cancer
Spring equinox 22/23 December equator
Activity 4 (Learner’s Book, page 16)
2. a. 147,3 million km (1)b. 152, 1 million km (1)
24 S E C T I O N 2 • L E S S O N - B Y - L E S S O N
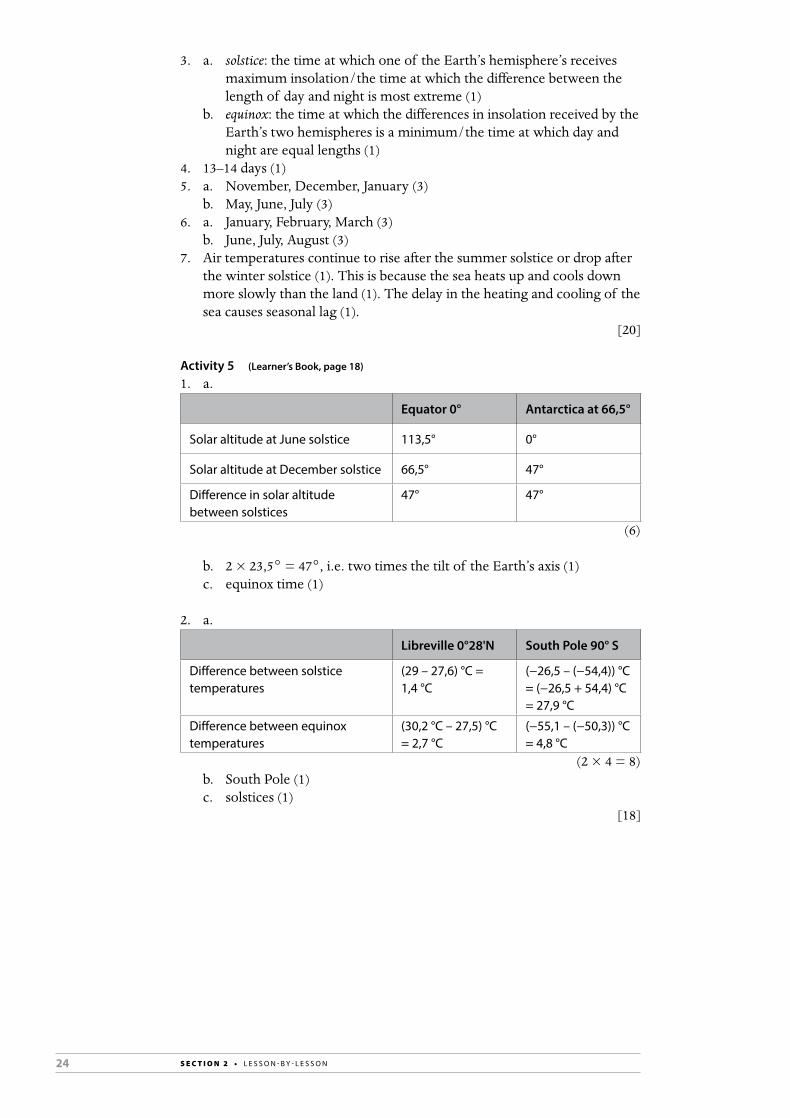
3. a. solstice: the time at which one of the Earth’s hemisphere’s receives maximum insolation/the time at which the difference between the length of day and night is most extreme (1)
b. equinox: the time at which the differences in insolation received by the Earth’s two hemispheres is a minimum/the time at which day and night are equal lengths (1)
4. 13–14 days (1)5. a. November, December, January (3) b. May, June, July (3)6. a. January, February, March (3)
b. June, July, August (3)7. Air temperatures continue to rise after the summer solstice or drop after
the winter solstice (1). This is because the sea heats up and cools down more slowly than the land (1). The delay in the heating and cooling of the sea causes seasonal lag (1).
[20]
Activity 5 (Learner’s Book, page 18)
1. a.
Equator 0° Antarctica at 66,5°
Solar altitude at June solstice 113,5° 0°
Solar altitude at December solstice 66,5° 47°
Difference in solar altitude between solstices
47° 47°
(6)
b. 2 × 23,5° = 47°, i.e. two times the tilt of the Earth’s axis (1)c. equinox time (1)
2. a.
Libreville 0°28'N South Pole 90° S
Difference between solstice temperatures
(29 – 27,6) °C = 1,4 °C
(−26,5 – (−54,4)) °C = (−26,5 + 54,4) °C = 27,9 °C
Difference between equinox temperatures
(30,2 °C – 27,5) °C = 2,7 °C
(−55,1 – (−50,3)) °C = 4,8 °C
(2 × 4 = 8)b. South Pole (1)c. solstices (1)
[18]

25M O D U L E 1 • T H E AT M O S P H E R E : G E O G R A P H I C A L K N O W L E D G E
Activity 6 (Learner’s Book, page 21)
1. a. east (1) b. the cold Peru Current (1)2. a. i. Lüderitz temperatures are lowered by the cold Benguela Current
(1); Maputo temperatures are raised by the warm Mozambique Current (1)
ii. Lima temperatures are lowered by the cold Peru Current (1); Salvador temperatures are raised by the warm Brazil Current (1)
b. i. the warm waters of the equatorial Indian Ocean (1)ii. the cool waters of the eastern South Atlantic (1)
c. Humboldt (1)[9]
Informal assessmentActivity 1• Go through the answers with the class. Write up the answers for Part B
on the board.
Activity 2• Go through the answers with the class. Ask learners to offer answers.
Activity 3• Write up the answers on the board.
Activity 4• Go through the answers with the class. Ask learners to offer answers. • If you choose, you can ask learner’s to mark their answers according to
the mark allocation given in the Answers section. Ask those learners who got less than 14/20 for the activity to do the remedial activity (see the Remedial section below).
Activity 5• Go through the answers with the class. Ask learners to offer answers.• If you choose, you can ask learner’s to mark their answers according to
the mark allocation given in the Answers section. Ask those learners who got less than 12/18 for the activity to do the remedial activity (see the Remedial section below).
Activity 6• Go through the answers with the class. Ask learners to offer answers.• If you choose, you can ask learner’s to mark their answers according
to the mark allocation given in the Answers section. Ask those learners who got less than 6/9 for the activity to do the remedial activity (see the Remedial section below).
Remedial/extensionRemedial:• For learners who struggled with this unit, ask them to complete
Worksheet 1 (pages 265–266) in the Resources section of this Teacher’s Guide.
26 S E C T I O N 2 • L E S S O N - B Y - L E S S O N
Extension: For learners who struggled with this unit, ask them to complete Worksheet 2 (page 267) in the Resources section of this Teacher’s Guide.
Ask learners to do one or more of the following:• Find out the dates for this year for: (a) the equinoxes and solstices;
(b) perihelion and aphelion.• Find out why day and night at equinox aren’t exactly equal. (Answer: The
speed with which the Earth travels around the Sun varies a bit. The Earth speeds up when it is nearest the Sun (about 3 January) and slows down when it is furthest away (about 4 July).)
• Find out about the solar cycle – the 11 year cycle in which the Sun switches magnetic poles. The number of sunspots and flares increases every 11 years; during this time, the Sun is hotter.
• Find out more about seasons on other planets. See: www.nasa.gov/audience/forstudents/k-4/home/F_Planet_Seasons.html.
UNIT 2 Global air circulation
TERM 1, WEEKS 2–3
Learner’s Book pages 22–39Duration: 8 hours
Curriculum and Assessment Policy Statement (CAPS) content
Global air circulation • Global air circulation – a response to the unequal heating of the
atmosphere• World pressure belts• Tri-cellular circulation: Hadley, Ferrel and polar cells• The relationships between air temperature, air pressure and wind • Pressure gradient, Coriolis force and geostrophic flow• Winds related to global air circulation: westerlies, tropical easterlies and
polar easterlies• Air mass characteristics• Winds related to regional and local air movements: Monsoons and Föhn
Resources• Learner’s Book pages 22–39• cardboard, cut from boxes to make cardboard discs (Activity 6)• Websites (optional)
– For a good overview on global air circulation see: www.physicalgeography.net/fundamentals/7p.html
– For information on jet streams see: www.physicalgeography.net/fundamentals/7q.html
Preparation• Unit 2 is probably the most difficult unit in this module. Read through
the unit and familiarise yourself with the content that you will need to teach. Think about what the learners may already know about the topics and any areas of difficulty that you think they might encounter.
• See the resources needed for Activity 6 listed above.
27M O D U L E 1 • T H E AT M O S P H E R E : G E O G R A P H I C A L K N O W L E D G E
Teaching the unit
Lesson 1
• Read through, or ask learners to read through, the Unit 2 introductory paragraphs. Emphasise that this unit is about wind.
• Work through the section, ‘What is global air circulation?’ (page 22). Refer to Figure 1.2.1 which shows the single-cell model for heat transfer.
• Work through the section, ‘The world pressure belts’ (page 23). Focus on Figure 1.2.2.
• Work through the section, ‘The world pressure belts shift with the seasons’ (page 23). Focus on Figure 1.2.3 (page 24). Ask learners to pick out the key difference between the two air pressure maps: The high pressure zones shift north in the July map, as does the ITCZ line, which is the thermal equator.
Activity 1• Read the feature, ‘Stuck in the doldrums’ (page 25).• Learners answer questions on the feature.
Lesson 2
• If Activity 1 was completed for homework, go through the answers with the class.
• Work through the section, ‘Are the world pressure belts a product of tri-cellular circulation?’ (page 25). Focus on Figure 1.2.5.
Activity 2• This activity helps learners identify the parts of the tri-cellular air
circulation model. • If necessary, learners can do or finish this activity for homework.
• Work through the section, ‘What is the relationship between air temperature, air pressure and wind?’ (page 27).
• Emphasise that changes in air temperature cause changes in air pressure; and that changes in air pressure cause changes in air temperature. For example, when you pump a tyre full of air, it gets hotter as the air molecules are squashed together.
• Remind learners:– Why does warm air rise? As air warms, it expands – which means that
the air molecules move further apart. As it expands, it gets lighter.– Why does air cool as it rises? As air rises, it uses up heat. It exchanges
heat energy for kinetic energy – energy for movement. As it loses heat energy, it cools.
– Why does cool air sink? As air cools, it contracts – which means that the air molecules move closer together. As it contracts, it gets denser and heavier. When there is more air pressing down over a fixed area, air pressure increases.
• Focus on Figure 1.2.7 and on the concepts of adiabatic warming and cooling, which will feature again when you look at Föhn winds.
• Point out that convection evens out temperature differences. Point out that the ‘warm air’ in a convection cell can be quite cool, but it is warmer than the cold air.
28 S E C T I O N 2 • L E S S O N - B Y - L E S S O N
Activity 3• This activity helps learners reinforce the concept of a convection cell.
Lesson 3
• Work through the section, ‘Why do the global winds follow a curved path?’ (page 28) and the section on the pressure gradient. Focus on Figure 1.2.8.
• Use this example for the concept of a pressure gradient: If you blow air into a balloon or pump air into a tyre, the air pressure inside is higher than it is on the outside. If you let the balloon go or puncture the tyre, the air comes rushing out to fill the low pressure of the surroundings. The difference between the two air pressures is a pressure gradient. The bigger the difference, the steeper the gradient, and the faster the air moves.
Activity 4• In this activity, learners calculate pressure gradients and see the effect of
distance and pressure difference.
• Work through the section on the Coriolis effect (page 29).• Focus on Figure 1.2.9 and point out that the force is at a minimum at the
equator and at a maximum at the poles. • Refer to Figure 1.2.10 – it is often a surprise to discover that although the
Earth spins in one direction, the direction of rotation is anti-clockwise if viewed from above the North Pole, and clockwise if viewed from above the South Pole.
Activity 5• In this activity, learners use cardboard discs to demonstrate to themselves:
(1) the different direction of rotation in the two hemispheres; (2) how the winds are deflected in the two hemispheres.
Lesson 4
• Work through the section on geostrophic flow. Focus on Figure 1.2.12.
Activity 6• This activity reinforces the concepts of the pressure gradient force and
Coriolis force.
• Work through the section, ‘Which winds are related to global air circulation?’ (page 32). Focus on Figure 1.2.14.
• Remind learners that winds are named after the direction they blow from, not towards.
Activity 7• Read the feature, ‘Using the prevailing global winds to discover
America and explore Africa’ (page 33).• Learners answer questions on the feature and prevailing winds.
29M O D U L E 1 • T H E AT M O S P H E R E : G E O G R A P H I C A L K N O W L E D G E
Lesson 5
• Work through the section, ‘What are air masses and what is their role in global air circulation?’ (page 34).
• Focus on Figure 1.2.16 which is a general map of the world’s air masses. Point out that maritime tropical airmasses (mT) dominate the Southern hemisphere.
• Point out for air mass temperature:– warm air masses form over tropics (T) and equator (E)– cold air masses form over polar regions/mid-latitudes 55–60° latitudes
(P) or Arctic (A) or Antarctic (AA).• Point out that for air mass moisture content:
– dry air masses form over land – c for continental– moist air masses form over the sea – m for maritime.
Activity 8• In this activity, learners summarise the types and properties of air masses.
Lesson 6
• Work through the section, ‘Which winds are related to regional and local air movements?’ (page 36) and the sections on monsoons.
• Remind learners that the oceans play a big role in the Earth’s weather.• Focus on Figure 1.2.17 which shows how the ITCZ shifts in the wet and
dry seasons, together with the continental and maritime air masses.
Activity 9• Read the feature, ‘Rain by the metre – the monsoon in South Asia’
(page 37). • Learners answer questions on the feature.• If necessary, learners can finish this activity for homework.
Lesson 7
• If Activity 9 was completed for homework, go through the answers with the class.
• Work through the section on Föhn winds (page 38). • Focus on Figure 1.2.20 and the principles of adiabatic cooling and
warming.
Activity 10• Read the feature, ‘A berg wind: The wind as hot as a hairdryer’ (page 38). • Learners answer questions on the feature.

30 S E C T I O N 2 • L E S S O N - B Y - L E S S O N
Answers Activity 1 (Learner’s Book, page 25)
1. Intertropical Convergence Zone (ITCZ) or equatorial low2. There is a lot of warm, moist rising air which generates storms/is
unstable.3. The ITCZ shifts as the seasons change and because the land and the
oceans heat up and cool down at different rates.4. subpolar highs
Activity 2 (Learner’s Book, page 26)
1. X = polar; Y = Ferrel; Z = Hadley (3)2. Ferrel cell (1)3. A3; B4; C6; D1; E2; F5 (6)4. a. 0° and 60°N and S (2)
b. 30°N and S (1)5. a. 0° and 60°N and S (2)
b. 30°N and S (1)[16]
Activity 3 (Learner’s Book, page 28)
rising warm,moist air
descendingcool, dry air
low pressurehigh pressurewind
pressure gradient
warmer air in stratosphere forces air to move horizontally
Activity 4 (Learner’s Book, page 30)
1. tropical easterlies2. a. trade winds
b. westerliesc. westerlies
3.Tropical easterlies (trade winds) blow from …
Westerlies of mid-latitudes blow from …
Northern hemisphere NE SW
Southern hemisphere SE NW
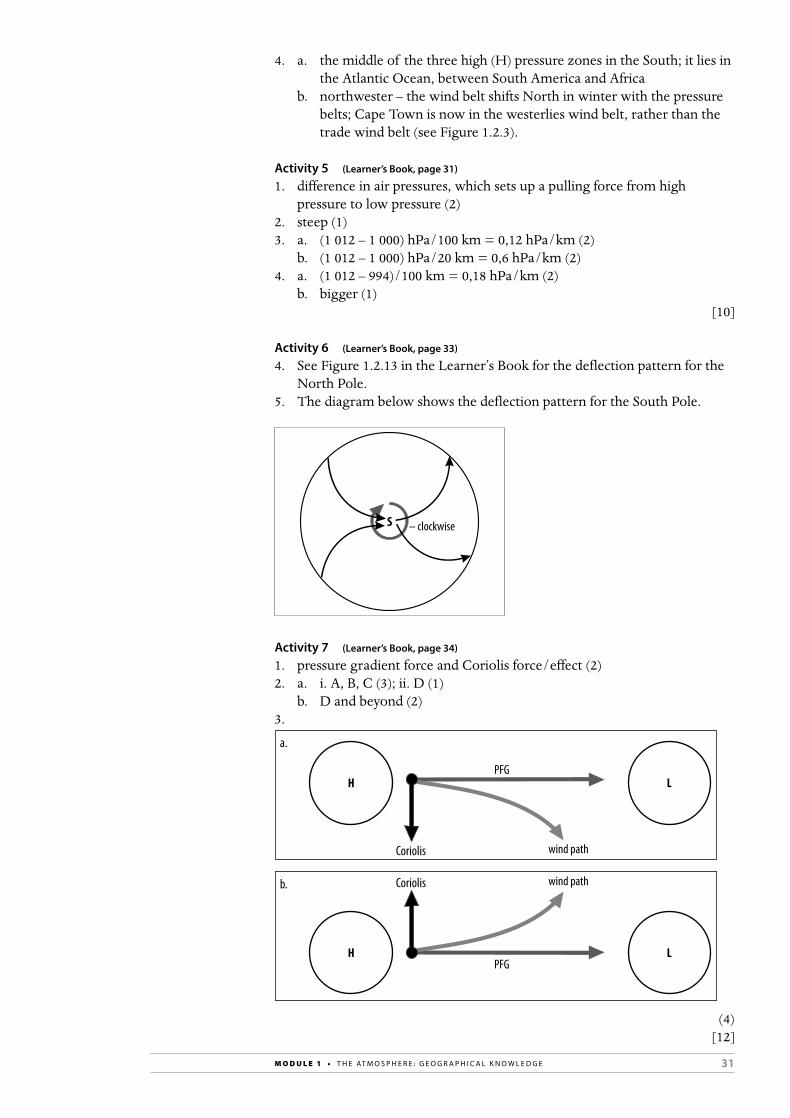
31M O D U L E 1 • T H E AT M O S P H E R E : G E O G R A P H I C A L K N O W L E D G E
4. a. the middle of the three high (H) pressure zones in the South; it lies in the Atlantic Ocean, between South America and Africa
b. northwester – the wind belt shifts North in winter with the pressure belts; Cape Town is now in the westerlies wind belt, rather than the trade wind belt (see Figure 1.2.3).
Activity 5 (Learner’s Book, page 31)
1. difference in air pressures, which sets up a pulling force from high pressure to low pressure (2)
2. steep (1)3. a. (1 012 – 1 000) hPa/100 km = 0,12 hPa/km (2)
b. (1 012 – 1 000) hPa/20 km = 0,6 hPa/km (2)4. a. (1 012 – 994)/100 km = 0,18 hPa/km (2)
b. bigger (1)[10]
Activity 6 (Learner’s Book, page 33)
4. See Figure 1.2.13 in the Learner’s Book for the deflection pattern for the North Pole.
5. The diagram below shows the deflection pattern for the South Pole.
– clockwise
Activity 7 (Learner’s Book, page 34)
1. pressure gradient force and Coriolis force/effect (2)2. a. i. A, B, C (3); ii. D (1)
b. D and beyond (2)3.
Coriolis
Coriolis
(4)[12]
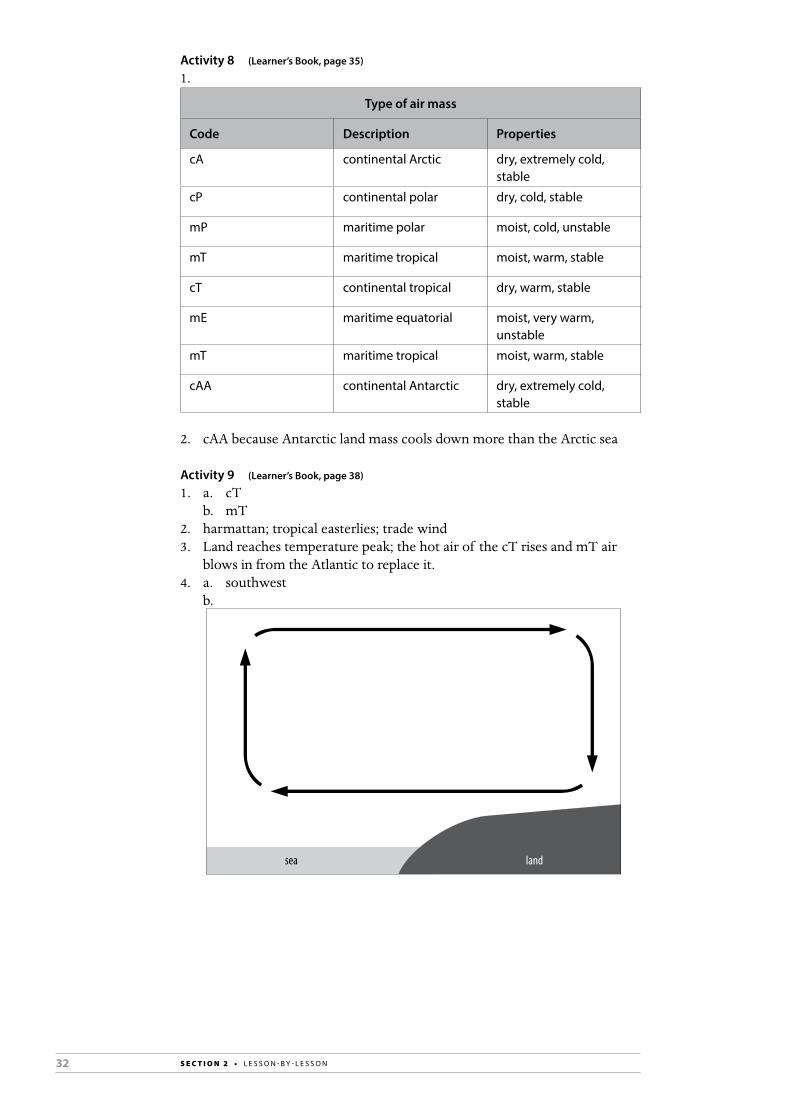
32 S E C T I O N 2 • L E S S O N - B Y - L E S S O N
Activity 8 (Learner’s Book, page 35)
1.
Type of air mass
Code Description Properties
cA continental Arctic dry, extremely cold, stable
cP continental polar dry, cold, stable
mP maritime polar moist, cold, unstable
mT maritime tropical moist, warm, stable
cT continental tropical dry, warm, stable
mE maritime equatorial moist, very warm, unstable
mT maritime tropical moist, warm, stable
cAA continental Antarctic dry, extremely cold, stable
2. cAA because Antarctic land mass cools down more than the Arctic sea
Activity 9 (Learner’s Book, page 38)
1. a. cTb. mT
2. harmattan; tropical easterlies; trade wind3. Land reaches temperature peak; the hot air of the cT rises and mT air
blows in from the Atlantic to replace it.4. a. southwest b.
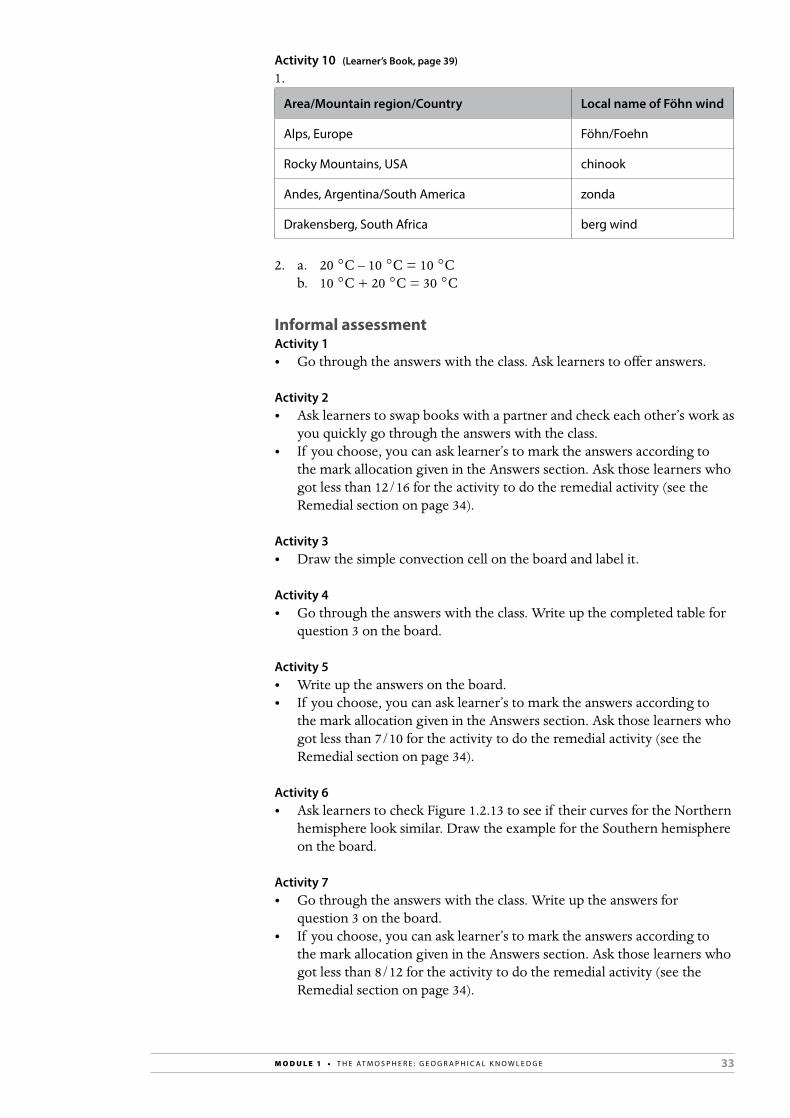
33M O D U L E 1 • T H E AT M O S P H E R E : G E O G R A P H I C A L K N O W L E D G E
Activity 10 (Learner’s Book, page 39)
1.
Area/Mountain region/Country Local name of Föhn wind
Alps, Europe Föhn/Foehn
Rocky Mountains, USA chinook
Andes, Argentina/South America zonda
Drakensberg, South Africa berg wind
2. a. 20 °C – 10 °C = 10 °C b. 10 °C + 20 °C = 30 °C
Informal assessmentActivity 1• Go through the answers with the class. Ask learners to offer answers.
Activity 2• Ask learners to swap books with a partner and check each other’s work as
you quickly go through the answers with the class.• If you choose, you can ask learner’s to mark the answers according to
the mark allocation given in the Answers section. Ask those learners who got less than 12/16 for the activity to do the remedial activity (see the Remedial section on page 34).
Activity 3• Draw the simple convection cell on the board and label it.
Activity 4• Go through the answers with the class. Write up the completed table for
question 3 on the board.
Activity 5• Write up the answers on the board. • If you choose, you can ask learner’s to mark the answers according to
the mark allocation given in the Answers section. Ask those learners who got less than 7/10 for the activity to do the remedial activity (see the Remedial section on page 34).
Activity 6 • Ask learners to check Figure 1.2.13 to see if their curves for the Northern
hemisphere look similar. Draw the example for the Southern hemisphere on the board.
Activity 7• Go through the answers with the class. Write up the answers for
question 3 on the board. • If you choose, you can ask learner’s to mark the answers according to
the mark allocation given in the Answers section. Ask those learners who got less than 8/12 for the activity to do the remedial activity (see the Remedial section on page 34).

34 S E C T I O N 2 • L E S S O N - B Y - L E S S O N
Activity 8• Write up the completed table on the board.
Activity 9• Go through the answers with the class. Draw the winter Monsoon wind
for question 4b on the board.
Activity 10• Ask learners to swap books with a partner and check each other’s work as
you quickly go through the answers with the class.
Remedial/extensionRemedial:• For learners who struggled with Activity 2, Activity 5 and Activity 7, ask
them to complete Worksheet 3 (pages 268–269) in the Resources section of this Teacher’s Guide.
Extension: • Ask learners to complete Worksheet 4 (pages 270–271) in the Resources
section of this Teacher’s Guide.
UNIT 3 Africa’s weather and climate
TERM 1, WEEKS 4–5
Learner’s Book pages 40–57Duration: 8 hours
Curriculum and Assessment Policy Statement (CAPS) content
Africa’s weather and climate • Africa’s climate regions• Subsidence and convergence – link to rainfall• The role of oceans in climate control in Africa• El Niño and La Niña processes and their effects on Africa’s climate• Reading and interpreting synoptic weather maps
Resources• Learner’s Book pages 40–57• Websites (optional)
– For information on El Niño and La Niña see: http://dev2.weathersa.co.za/web/Content.asp?contentID=75
– A useful site for you or advanced learners see: http://www.ucar.edu/learn/
– The South African Weather Services website for weather forecasts see: www.weathersa.co.za
– This site posts a synoptic weather chart for South Africa daily: www.koolasun.co.za/weather/sa-weather-chart.html
Preparation• Read through the unit and familiarise yourself with the content that
you will need to teach. Think about what the learners may already know about the topics and any areas of difficulty that you think they might encounter.
35M O D U L E 1 • T H E AT M O S P H E R E : G E O G R A P H I C A L K N O W L E D G E
Teaching the unit
Lesson 1
• Read through, or ask learners to read through, the Unit 3 introductory paragraphs. Again, remind learners that the oceans play a significant role in Africa’s climate and weather. Point out that the Pacific Ocean has a very significant effect.
• Work through the section, ‘Which are Africa’s main climate regions?’ (page 40).
• Focus on the map in Figure 1.3.1. Point out that:– the tropics are dominated by tropical air masses.– the mid-latitudes are affected by two different or conflicting air
masses: tropical and polar. Here, the weather conditions are very changeable.
– temperatures are lower in highland areas in eastern Africa (because temperature decreases with altitude).
Activity 1• In this activity, learners answer questions on the climate map and
Köeppen’s Climate Classification system.
Activity 2• In this activity, learners answer questions on the graph in Figure 1.3.3 and
Köeppen’s Climate Classification system.
Lesson 2
• In this lesson, focus on Activity 3 and begin Activity 4 by reading the feature, ‘What is a climograph?’ (page 44).
Activity 3• Read the feature, ‘Africa’s coldest and hottest temperatures’ (page 43). • In this activity, learners answer questions on the feature.
Lesson 3
• In this lesson, focus on Activity 4.
Activity 4• In this activity, learners plot climographs and practise bar graph and line
graph drawing skills.• Learners work in groups of five. Each group produces five climographs
and each learner produces one graph.
Lesson 4
• Work through the section, ‘How are air subsidence and convergence linked to Africa’s rainfall?’ (page 46). This section links to global air circulation and pressure belts in Unit 2.
• Focus on Figure 1.3.7. Point out that air convergence produces cloudy conditions. Also point out that low pressure belts are linked to cloudy conditions and high pressure belts are linked to sunny conditions.

36 S E C T I O N 2 • L E S S O N - B Y - L E S S O N
Activity 5• In this activity, learners answer questions on air convergence and subsidence.
Lesson 5
• Work through the section, ‘What is the role of oceans in climate control in Africa?’ (page 47).
• Focus on Figure 1.3.8 which shows land and sea breezes. Point out that coasts are breezy or windy – they get sea breezes in daytime and land breezes at night.
Activity 6• In this activity, learners plot minimum and maximum temperature data.• For the section on ‘Temperature control and rainfall: The effect of ocean
currents’, draw learners attention to Figure 1.3.9 (page 48). The Namib Desert is a coastal desert caused by the cold Benguela Current.
Activity 7• Read the feature, ‘South Africa’s climate’ (page 49). • In this activity, learners answer questions on the feature.• Learners can do this activity for homework.
Lesson 6
• Go through the answers for Activity 7. • Work through the section, ‘How do El Niño and La Niña processes affect
Africa’s climate?’ (page 49). • For the section on Walker circulation, focus on Figure 1.3.10 which shows
the system of longitudinal air circulation cells. Point out that while global air circulation systems are across the latitudes, these circulation systems are across longitude. Also point out the cold and warm parts of the equatorial Pacific Ocean.
• Work through the sections on El Niño and La Niña. Compare Figures 1.3.11 and 1.3.12. Point out the weak and strong trade winds and the gentle and steep thermocline.
Activity 8• In this activity, learners answer questions on atmospheric circulation and
El Niño and La Niña.
Lesson 7
• Continue the section on El Niño and La Niña.
Activity 9• Read the feature, ‘El Niño and La Niña: The boy child and his little sister’
(page 51). • In this activity, learners answer questions on this feature.
• Begin the section, ‘How do we read and interpret synoptic weather maps?’ (page 54). Work through the information in the revision box.
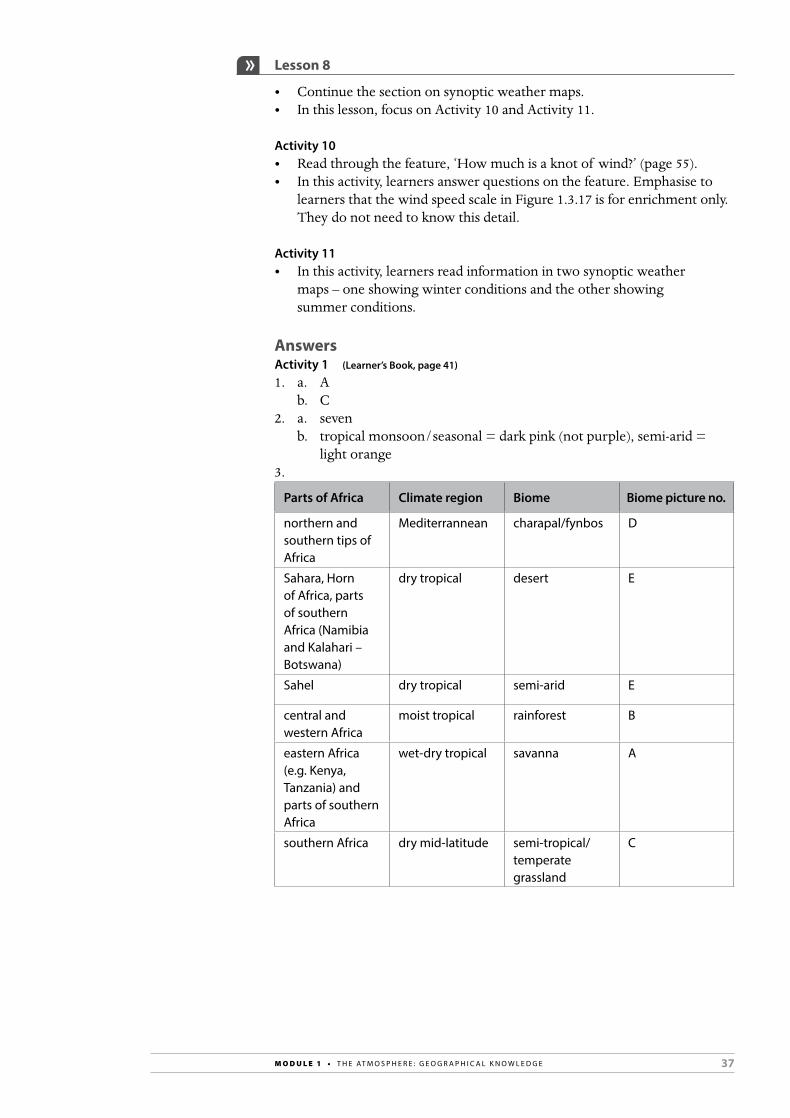
37M O D U L E 1 • T H E AT M O S P H E R E : G E O G R A P H I C A L K N O W L E D G E
Lesson 8
• Continue the section on synoptic weather maps.• In this lesson, focus on Activity 10 and Activity 11.
Activity 10• Read through the feature, ‘How much is a knot of wind?’ (page 55). • In this activity, learners answer questions on the feature. Emphasise to
learners that the wind speed scale in Figure 1.3.17 is for enrichment only. They do not need to know this detail.
Activity 11• In this activity, learners read information in two synoptic weather
maps – one showing winter conditions and the other showing summer conditions.
AnswersActivity 1 (Learner’s Book, page 41)
1. a. Ab. C
2. a. sevenb. tropical monsoon/seasonal = dark pink (not purple), semi-arid =
light orange 3.
Parts of Africa Climate region Biome Biome picture no.
northern and southern tips of Africa
Mediterrannean charapal/fynbos D
Sahara, Horn of Africa, parts of southern Africa (Namibia and Kalahari – Botswana)
dry tropical desert E
Sahel dry tropical semi-arid E
central and western Africa
moist tropical rainforest B
eastern Africa (e.g. Kenya, Tanzania) and parts of southern Africa
wet-dry tropical savanna A
southern Africa dry mid-latitude semi-tropical/temperate grassland
C
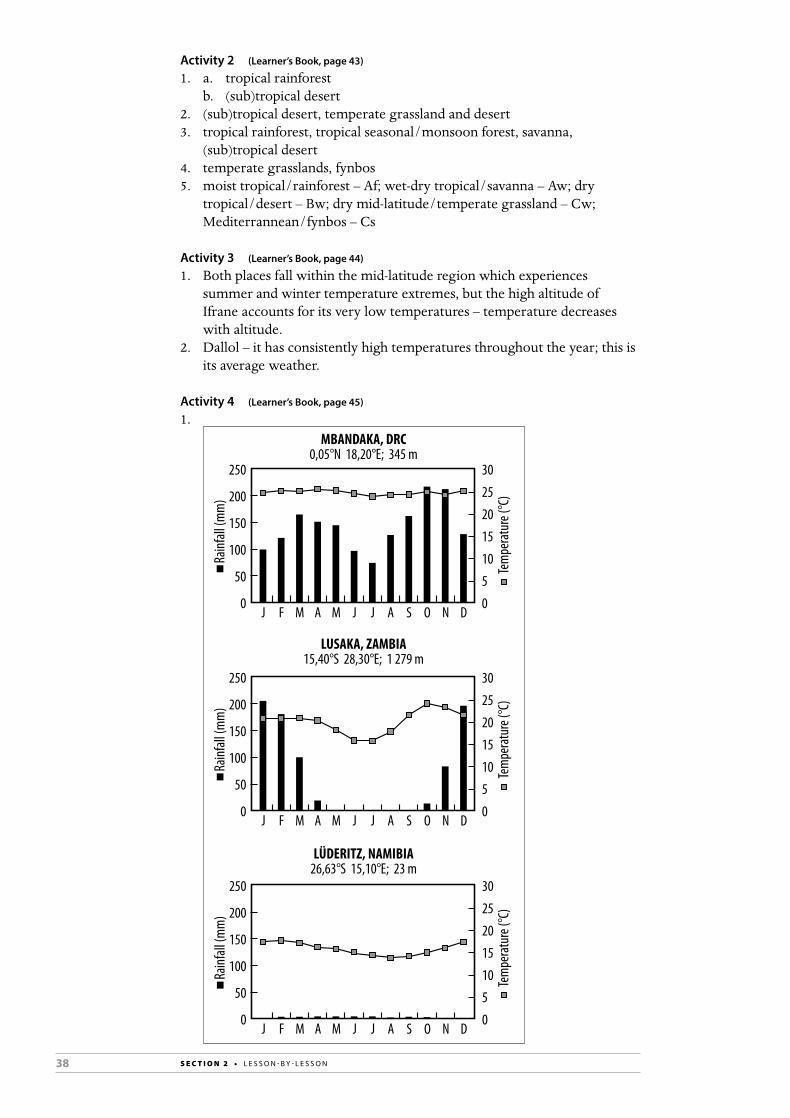
38 S E C T I O N 2 • L E S S O N - B Y - L E S S O N
Activity 2 (Learner’s Book, page 43)
1. a. tropical rainforestb. (sub)tropical desert
2. (sub)tropical desert, temperate grassland and desert3. tropical rainforest, tropical seasonal/monsoon forest, savanna,
(sub)tropical desert4. temperate grasslands, fynbos5. moist tropical/rainforest – Af; wet-dry tropical/savanna – Aw; dry
tropical/desert – Bw; dry mid-latitude/temperate grassland – Cw; Mediterrannean/fynbos – Cs
Activity 3 (Learner’s Book, page 44)
1. Both places fall within the mid-latitude region which experiences summer and winter temperature extremes, but the high altitude of Ifrane accounts for its very low temperatures – temperature decreases with altitude.
2. Dallol – it has consistently high temperatures throughout the year; this is its average weather.
Activity 4 (Learner’s Book, page 45)
1. MBANDAKA, DRC
0,05°N 18,20°E; 345 m
LUSAKA, ZAMBIA15,40°S 28,30°E; 1 279 m
LÜDERITZ, NAMIBIA26,63°S 15,10°E; 23 m
BLOEMFONTEIN, SOUTH AFRICA29,10°S 26,30°E; 1 351 m
Rainf
all (m
m)
Rainf
all (m
m)
Rainf
all (m
m)
Rainf
all (m
m)
Tem
pera
ture
(°C)
Tem
pera
ture
(°C)
Tem
pera
ture
(°C)
Tem
pera
ture
(°C)
Tem
pera
ture
(°C)

39M O D U L E 1 • T H E AT M O S P H E R E : G E O G R A P H I C A L K N O W L E D G E
BLOEMFONTEIN, SOUTH AFRICA29,10°S 26,30°E; 1 351 m
CAPE TOWN, SOUTH AFRICA33,55°S 18,25°E; 42 m
Rainf
all (m
m)
Rainf
all (m
m)
Rainf
all (m
m)
Tem
pera
ture
(°C)
Tem
pera
ture
(°C)
Tem
pera
ture
(°C)
Tem
pera
ture
(°C)
Tem
pera
ture
(°C)
Activity 5 (Learner’s Book, page 47)
1. a. 0°b. 30°N and S
2. a. 0°; also 60°N and Sb. 30°N and S; also 90°N and S
3. a. Converging air masses push against each other and are forced to rise. For condensation to take place, air must rise and cool.
b. Sinking air warms and dries as it descends; for this reason, clouds do not form.
4. equinox
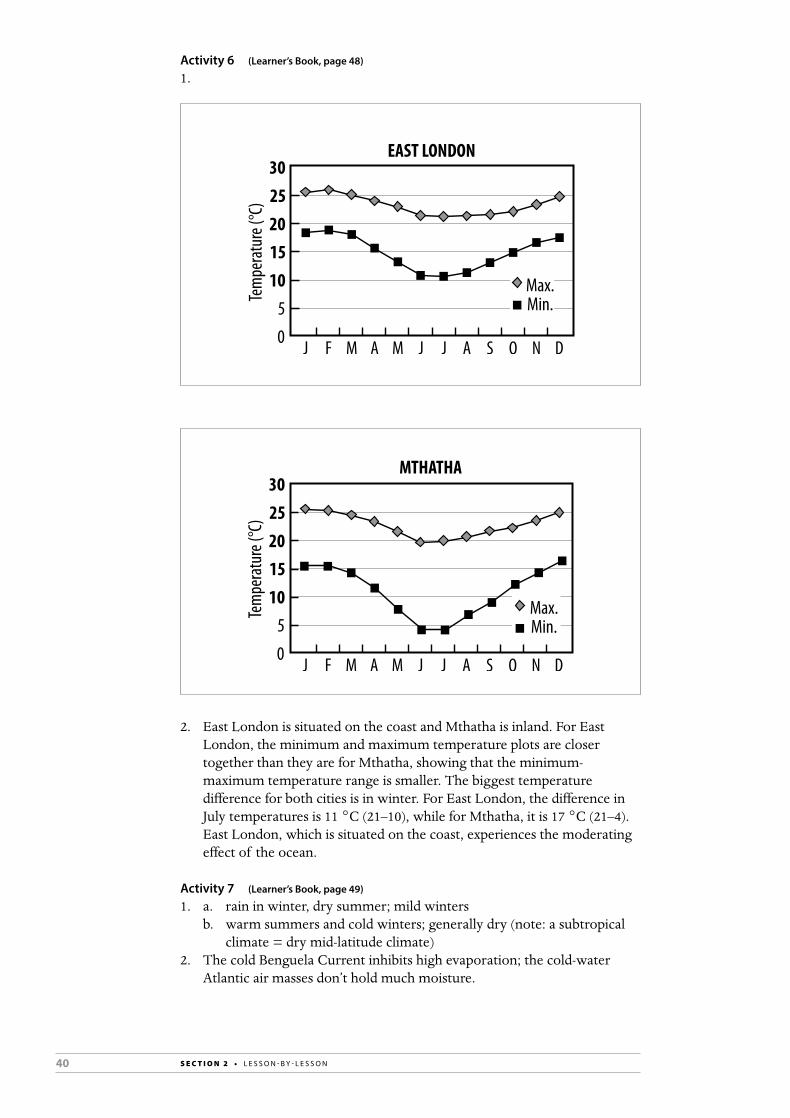
40 S E C T I O N 2 • L E S S O N - B Y - L E S S O N
Activity 6 (Learner’s Book, page 48)
1.
EAST LONDON
Tem
pera
ture
(°C)
3025201510
5
0
Max.Min.
MTHATHA
Tem
pera
ture
(°C)
3025201510
5
0
Max.Min.
2. East London is situated on the coast and Mthatha is inland. For East London, the minimum and maximum temperature plots are closer together than they are for Mthatha, showing that the minimum-maximum temperature range is smaller. The biggest temperature difference for both cities is in winter. For East London, the difference in July temperatures is 11 °C (21–10), while for Mthatha, it is 17 °C (21–4). East London, which is situated on the coast, experiences the moderating effect of the ocean.
Activity 7 (Learner’s Book, page 49)
1. a. rain in winter, dry summer; mild wintersb. warm summers and cold winters; generally dry (note: a subtropical
climate = dry mid-latitude climate)2. The cold Benguela Current inhibits high evaporation; the cold-water
Atlantic air masses don’t hold much moisture.

41M O D U L E 1 • T H E AT M O S P H E R E : G E O G R A P H I C A L K N O W L E D G E
3. The inland parts of South Africa (in the northeast) are elevated on the plateau; although they are nearer to the equator, their high altitude makes them cooler than they would otherwise be.
4. • Western Cape: Mediterranean: warm, dry summers and mild, wet winters
• Eastern Cape: part subtropical, part Mediterranean• Free State: summer rain, very cold, clear winters• Northern Cape: semi-desert; some parts fall in winter rainfall area• North West Province: hot and dry• KZN: coast is subtropical with colder temperatures inland; summer
rain; relatively high rainfall• Gauteng: rainy summer season with afternoon thunderstorms; clear,
crisp winters• Limpopo: subtropical with high summer temperatures• Mpumalanga: subtropical; rainfall in summer
Activity 8 (Learner’s Book, page 53)
1. west (1)2. (North) Equatorial (1)3. trade wind/tropical easterlies (1)4. warm air rises over warm water; air convergence takes place here (2)5. cool air sinks over cooler water; air subsidence takes place here (2)6. a. a water temperature slope/gradient (1)
b. i. La Niña (1) ii. El Niño (1)
[10]
Activity 9 (Learner’s Book, page 53)
1. The name means Christ Child, because El Niño strikes around Christmas time.
2. summer3. El Niño blocks the cold upwelling of nutrient-rich water which
encourages the growth of phytoplankton – a key source of food for fish populations, such as sardines. During La Niña, the cold upwelling of water is stronger than usual.
4. hotter, drier summers than usual; sometimes droughts5. milder and wetter summers than usual; sometimes floods
Activity 10 (Learner’s Book, page 55)
1. 9 km·h−1 (5 × 1,8 km·h−1)2. a. 41–55 knots
b. 73,8–99 km·h−1
c. This is the windspeed symbol for 80 knots:

42 S E C T I O N 2 • L E S S O N - B Y - L E S S O N
Activity 11 (Learner’s Book, page 55)
1. These are the unmanned/automatic weather stations.2. Temperatures for the summer map are generally higher; summer
temperatures for Upington and Pretoria are 40 °C and 35 °C respectively; winter temperatures are 22 °C and 19 °C, respectively.
3. a. i. 22 °C and 14 °C; difference = 8 °C ii. 34 °C and 22 °C; difference = 12 °C
b. The Atlantic Ocean has a moderating effect on Walvis Bay’s temperatures; Walvis Bay is colder than it would otherwise be because of the cold Benguela Current.
4. a. subpolar highb. It has shifted northwards (now lies up near Nambia and Angola); this
is because the ITCZ has shifted north in winter.
Informal assessmentActivity 1• Go through the answers with the class. Write up the completed table on
the board.
Activity 2• Go through the answers with the class. Ask learners to offer answers.
Activity 3• Go through the answers with the class. Ask learners to offer answers.
Activity 4• Peer and self assessment. Learners compare each group’s graphs which
are displayed in the classroom.
Activity 5• Ask learners to swap books with a partner and check each other’s work as
you go through the answers with the class.
Activity 6• Plot the graphs on the board.
Activity 7• Go through the answers with the class. Ask learners to offer answers.
Activity 8• Ask learners to swap books with a partner and check each other’s work as
you go through the answers with the class.• If you choose, you can ask learner’s to mark the answers according to
the mark allocation given in the Answers section. Ask those learners who got less than 7/10 for the activity to do the remedial activity (see the Remedial section on page 43).
Activity 9• Go through the answers with the class. Ask learners to offer answers.
Activity 10• Ask learners to swap books with a partner and check each other’s work
as you go through the answers with the class. Draw the answer for (2c) on the board.
43M O D U L E 1 • T H E AT M O S P H E R E : G E O G R A P H I C A L K N O W L E D G E
Activity 11• Ask learners to swap books with a partner and check each other’s work as
you go through the answers with the class.
Remedial/extensionRemedial:• Ask learners to complete Worksheet 5 (pages 272–273) in the Resources
section of this Teacher’s Guide.• For learners who struggled with Activity 8, ask them to complete
Worksheet 6 (page 274) in the Resources section of this Teacher’s Guide.
Extension: • Ask learners to look at this site on El Niño and La Niña, which has an
Australian bias: www.abc.net.au/science/slab/elnino/story.htm• Ask very advanced learners to look at this paper on the influence of
La Niña on rainfall in Africa: http://128.186.98.10/people/nicholson/papers/lanina.pdf
UNIT 4 Droughts and desertification
TERM 1, WEEKS 6–7
Learner’s Book pages 58–72Duration: 8 hours
Curriculum and Assessment Policy Statement (CAPS) content
Droughts and desertification • Areas at risk: regional and local scales• Causes of droughts• Causes of desertification• Effects of droughts and desertification on people and the environment,
such as differences in vulnerability• Management strategies – case studies
Resources• Learner’s Book pages 58–72• Websites (optional) – http://saweatherobserver.blogspot.com/2010/01/eastern-cape-dam-
levels – html links to GIS interactive map, that marks dams in Eastern Cape
– can check current dam levels. (SA Weather Disaster Information Service)
Preparation• Read through the unit and familiarise yourself with the content that you
will need to teach. Think about what the learners may already know about the topics and any areas of difficulty that you think they might encounter.
Teaching the unit
Lesson 1
• Read through, or ask learners to read through, the introductory paragraph. • Work through the section, ‘What is drought?’ (page 58). Begin by asking
learners for their definitions of drought.
44 S E C T I O N 2 • L E S S O N - B Y - L E S S O N
• Work through the section, ‘What is desertification’ (page 59). Begin by asking learners for their definitions of desertification.
• Work through the section, ‘Which areas of the world are most at risk of drought and desertification?’ (page 59). Focus on the map in Figure 1.4.3 and emphasise that with climate change, drought and desertification is a real threat to some parts of sub-Saharan Africa.
• Begin the section, ‘Areas at risk – regional and local scales’ (page 60). To distinguish between regional and local, give examples: the Sahel is a region in Africa; the Succulent Karoo and Nama Karoo are regions in South Africa; a province is a region, but a town district or a small area within a region is a local area.
Lesson 2
• Focus on the two case studies, ‘The threat to the Sahel’ (page 60) and ‘How big is the risk of desertification in the Succulent Karoo and the Nama Karoo?’ (page 62).
• Point out that the region of the Sahel is not clearly/absolutely defined.
Activity 1• Read the feature, ‘The threat to the Sahel’ (page 60). • Do this activity with the class. Work through the questions and
answers together.
Activity 2• Read the feature, ‘How big is the risk of desertification in the Succulent
Karoo and the Nama Karoo?’ (page 62). • Learners answer questions on this feature. They can do this activity
for homework.
Lesson 3
• If learners did Activity 2 for homework, go through the answers with the class.
• Work through the section, ‘What are the causes of droughts?’ (page 64). Point out that there is a human element to the causes of drought. Remind learners of the link between El Niño events and droughts in Africa, although El Niño events don’t always trigger droughts.
• Work through the section, ‘What are the causes of desertification?’ (page 64).
Activity 3• Read the feature, ‘Overgrazing by ostriches’ (page 65). • Learners answer questions on this feature.
Lesson 4
• Begin the section, ‘What are the effects of drought and desertification on people and the environment?’ (page 66).
• Work through the section on the impact on the environment. Make this analogy: the Earth’s soil is like a skin.
• Point out that soil salination can also contribute to desertification. Soil salination is caused by irrigation in dry areas. Fast evaporation draws minerals and salts from the water table towards the soil surface. This forms a crusty layer, which then blocks the seepage of water into the soil.
45M O D U L E 1 • T H E AT M O S P H E R E : G E O G R A P H I C A L K N O W L E D G E
• Refer to the interest box on USA. These grasslands were ploughed and planted with wheat and maize; farmers also reared cattle. During the time of the drought, a gale swept away most of the region’s top soil. Farmers and farmworkers abandoned the region.
Activity 4• Read the feature, ‘China puts up a green wall to stop a yellow dragon’
(page 67). Point out that the Gobi Desert is the third largest desert in the world.
• Learners answer questions on this feature.
Lesson 5
• Work through the section, ‘Impact of drought and desertification on people’ (page 68).
• Point out that rainfall variability is a real challenge for subsistence farmers in semi-arid regions.
• Ask learners for their suggestions why developing countries are more vulnerable. Point out that poverty puts pressure on land resources because people rely heavily on the land.
Activity 5• This activity is a class discussion. It gives learners an opportunity to
express opinions and pose questions.
Lesson 6
• Work through the section, ‘What are some strategies for managing droughts and desertification effectively?’ (page 69).
Activity 6• Read the feature, ‘The United Nations Convention to Combat
Desertification’ (page 70). • Learners answer questions on this feature.
Lesson 7
• Focus on the first two case studies on drought and desertification management strategies.
Activity 7• Read the case studies, ‘Lessons from the drought of the 1980s and 1990s
in South Africa’ (page 70) and ‘Drought risk management in Malawi and Ethiopia’ (page 71).
• Learners answer questions on these case studies.
Lesson 8
• Continue and complete the case studies on drought and desertification management strategies.
Activity 8• Read the case study, ‘The Thuo-Boswa Landcare Cattle Project in the
North-West province’ (page 72). • Learners answer questions on this case study.
46 S E C T I O N 2 • L E S S O N - B Y - L E S S O N
AnswersActivity 1 (Learner’s Book, page 62)
1. The Sahel is on the edge of the Sahara Desert, like the shoreline on the edge of the sea.
2. Guinea-Bissau, Senegal, Mauritania, Mali, Burkina Faso, Algeria, Niger, Chad, Sudan
3. a. negativeb. A 40 year period of drought/below-average rainfall with above-
average rainfall in three or four years only.4. the warming of the Indian Ocean5. the harvesting of wood/trees for fuel; the restriction of nomadic herders
to villages; overgrazing by livestock6. a. wood harvesting; overgrazing
b. population and resource pressure
Activity 2 (Learner’s Book, page 64)
1. dryland: a region where rainfall is low and evaporation is high, which means the soil is dry (1)
biome: the complex relationship between the climate and vegetation of a region, as well as the animals that inhabit it (1)
biodiversity: the range of plant and animal species (1)2. a. Western Cape, Northern Cape (2)
b. Namibia (1)3. Any two: mining; stock farming/overgrazing; crop farming/agriculture (2)4. invasion of natural veld by foreign plant species; accumulation of salt in
the soil (from irrigation); soil erosion (3)5. a. Succulent Karoo (1)
b. high density/population (1)c. It is limited to towns that are commercial farming regions. (1)
[14]
Activity 3 (Learner’s Book, page 65)
1. overgrazing: the practice of allowing grazing animals to feed intensively on the vegetation without giving it a chance to grow back or recover
overstocking: the practice of raising more livestock animals than the land can support
2. Ostriches scratch, dig, nest, continually forage – in other words, in high numbers they are pretty destructive!
3. Ostrich farmers are learning the importance of finding a balance between use and conservation of natural veld.
Activity 4 (Learner’s Book, page 68)
2. Yellow Asian dust from the Gobi Desert that is blown from the northwest every spring.
3. westerlies4. Farmers and herders depend on the land for their food and income.5. It is an extensive forest belt that is being planted on the desert margins in
an attempt to prevent the Gobi Desert from spreading.6. ban ploughing; check overgrazing
47M O D U L E 1 • T H E AT M O S P H E R E : G E O G R A P H I C A L K N O W L E D G E
Activity 5 (Learner’s Book, page 69)
Here are some examples:1. The poor are the causes of desertification in these ways:
• They deplete the land of trees and vegetation – by cutting down trees for fuel or allowing overgrazing. With loss of vegetation there is loss of topsoil and land degradation.
• As a generalisation, the poor tend to have more children than the rich. The poor contribute to population growth, and population growth puts pressure on the land.
The poor are the victims of desertification in these ways:• They are heavily dependent on the land. When the land fails to
support them, they are badly affected.• Desertification leads to other social problems. Because the poor have
few resources or options, they are always the hardest hit.2. Developed countries are responsible for desertification in these ways:
• The contribution of developed countries to global warming and climate change is high. Climate change can make drought periods in dry regions longer and more intense. Drought contributes to desertification.
• One can argue that in a capitalist society/economy, the rich are rich at the expense of the poor, and to a certain degree, developed countries are rich at the expense of developing countries. For example, multinational companies make use of cheap labour in developing countries.
Activity 6 (Learner’s Book, page 70)
1. about 14%, i.e. 1/7 billion2. The slogan encompasses cause and effect. The verb ‘desert’ is used with
two meanings: a) to turn into desert-like land by degrading it; and b) to desert the land – to abandon it.
3. United Nations Environment Programme
Activity 7 (Learner’s Book, page 72)
1. It focused on emergency relief rather than reducing the risk of drought.2. The use of boreholes can significantly lower the water table – reducing
ground water supplies and triggering infiltration by salt water (if the region is near the sea). The setting up of boreholes can encourage informal settlements.
3. setting up early-warning systems; identifying those who are most vulnerable to the effects of drought/prioritising assistance; reducing the risk of drought
4. The government is insuring against low rainfall.5. It has developed a social-protection scheme that pays communities to
build their own water-harvesting systems.
Activity 8 (Learner’s Book, page 72)
1. rehabilitation2. grazing areas were fenced and given a long enough rest period to allow
grass to grow back/recover3. small actions/simple remedial measures can often make a difference and
inspire others

48 S E C T I O N 2 • L E S S O N - B Y - L E S S O N
Informal assessmentActivity 1• Go through the answers with the class. Ask learners to offer answers.
Activity 2• Go through the answers with the class. Ask learners to offer answers. • If you choose, you can ask learner’s to mark the answers according to
the mark allocation given in the Answers section. Ask those learners who got less than 10/14 for the activity to do the remedial activity (see the Remedial section below).
Activity 3• Go through the answers with the class. Ask learners to offer answers.
Activity 4• Go through the answers with the class. Ask learners to offer answers.
Activity 5• Assess learners’ engagement in the discussion and ability to express an
opinion or argue a point of view.
Activity 6• Go through the answers with the class. Ask learners to offer answers.
Activity 7• Go through the answers with the class. Ask learners to offer answers.
Activity 8• Go through the answers with the class. Ask learners to offer answers.
Remedial/extensionRemedial: • Ask learners who had difficulty with this unit (for example, Activity 2)
to go through the mind map in Figure 1.4.11 on page 64 in the Learner’s Book and define or explain each of the underlined terms.
Extension: • Ask learners to write a one-page essay on desertification.
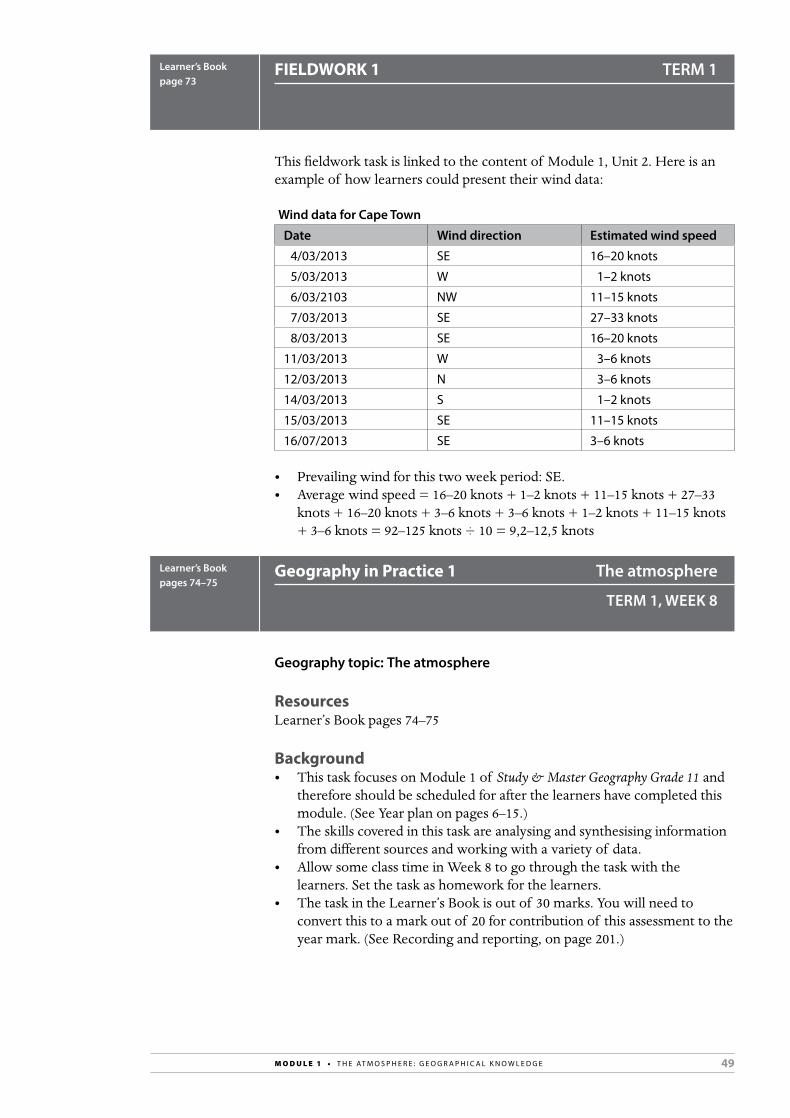
49M O D U L E 1 • T H E AT M O S P H E R E : G E O G R A P H I C A L K N O W L E D G E
FIELDWORK 1 TERM 1Learner’s Book page 73
This fieldwork task is linked to the content of Module 1, Unit 2. Here is an example of how learners could present their wind data:
Wind data for Cape Town
Date Wind direction Estimated wind speed
4/03/2013 SE 16–20 knots
5/03/2013 W 1–2 knots
6/03/2103 NW 11–15 knots
7/03/2013 SE 27–33 knots
8/03/2013 SE 16–20 knots
11/03/2013 W 3–6 knots
12/03/2013 N 3–6 knots
14/03/2013 S 1–2 knots
15/03/2013 SE 11–15 knots
16/07/2013 SE 3–6 knots
• Prevailing wind for this two week period: SE.• Average wind speed = 16–20 knots + 1–2 knots + 11–15 knots + 27–33
knots + 16–20 knots + 3–6 knots + 3–6 knots + 1–2 knots + 11–15 knots + 3–6 knots = 92–125 knots ÷ 10 = 9,2–12,5 knots
Geography in Practice 1 The atmosphere
TERM 1, WEEK 8
Learner’s Book pages 74–75
Geography topic: The atmosphere
ResourcesLearner’s Book pages 74–75
Background• This task focuses on Module 1 of Study & Master Geography Grade 11 and
therefore should be scheduled for after the learners have completed this module. (See Year plan on pages 6–15.)
• The skills covered in this task are analysing and synthesising information from different sources and working with a variety of data.
• Allow some class time in Week 8 to go through the task with the learners. Set the task as homework for the learners.
• The task in the Learner’s Book is out of 30 marks. You will need to convert this to a mark out of 20 for contribution of this assessment to the year mark. (See Recording and reporting, on page 201.)

50 S E C T I O N 2 • L E S S O N - B Y - L E S S O N
Preparing the learners• Remind the learners that they should work on their own and answer all
questions.• Let them read through the task and ask questions about any part of it
that they do not understand.• Remind them that they can consult Module 1 in the Learner’s Book if
they need to.• Give them a due date for their completed tasks.
The taskYou will find Geography in Practice 1 on pages 74–75 of the Learner’s Book. A marking memorandum is supplied below under the heading, ‘Assessment guidance’.
Assessment guidanceMemorandum: Geography in Practice 1 (Learner’s Book, pages 74–75)
1. Intertropical Convergence Zone (1)2. Hadley cell (1)3. • Insolation is high at the ITCZ. The heat energy evaporates
large amounts of water.• It is a low pressure belt where the trade winds converge.
Air convergence helps to lift the warm, moist air and encourages convective rainfall. (2)
4. As the Earth revolves around the Sun on its tilted axis, the overhead position of the midday Sun shifts from the Tropic of Capricorn (at the December solstice) to the Tropic of Cancer (at the June solstice). The ITCZ is the thermal/heat equator, and so as the seasons change, it shifts from one hemisphere to the other. (2)
5. a. Mbandaka; March and October (3)b. Lusaka; January (2)c. tropical moist/rainforest; high temperatures throughout the
year with high rainfall (2)d. wet-dry tropical/savannah; semi-dry with a short rainy season (2)
6. tropical easterlies (1)7. The winds are deflected by the rotation of the Earth as it spins on
its axis – this phenomenon is called the Coriolis effect. In the Northern hemisphere, the rotation is anti-clockwise, which deflects winds to their right. In the Southern hemisphere, the rotation is clockwise, which deflects winds to their left. (3)
8. Harmattan (1)9. SW; monsoon (2)10. a. cT/tropical continental (1)
b. mT/tropical maritime (1)11. a. Sahel (1)
b. dry tropical/semi-arid; hot and dry with low rainfall and mild winters (2)
c. Any three: loss of vegetation; heat waves; dust storms; desertification/degradation of dryland; crop failure; hunger/malnutrition (3)
Total: 30 marks
© You may photocopy this page for use with Study & Master Geography Grade 11.

51M O D U L E 2 • T H E AT M O S P H E R E : G E O G R A P H I C A L S K I L L S A N D T E C H N I Q U E S
Term 1Learner’s Book pages 63–74Duration: 6 hours
MODULE 2
THE ATMOSPHERE: GEOGRAPHICAL
SKILLS AND TECHNIQUES
This module focuses on geographical skills and techniques pertaining to the atmosphere.
It is unlikely that you will be pressured for time as you work through the units in this module. You can make good use of the extension and remedial activities to reinforce the content.
Curriculum and Assessment Policy Statement (CAPS) content
Aerial photographs and orthophoto maps • Oblique and vertical aerial photographs – identifying landforms
and features• Use of tone, texture and shadow in the interpretation of photos• Orthophoto maps – identifying features• Orienting aerial photographs and orthophoto maps with
another map
Geographical Information Systems (GIS) • Satellite images• Application of GIS to climatology and meteorology
Key geographical skills and techniques• using verbal, quantitative and symbolic data forms such as text, pictures,
graphs, tables, diagrams and maps• practising field observation and mapping, interviewing people,
interpreting sources, working with statistics• applying communication, thinking, practical and social skills• practising the following specific skills
– identifying questions and issues– collecting and structuring information – processing, interpreting, and evaluating data – making decisions and judgements– deciding on a point of view– suggesting solutions to problems– working co-operatively and independently
Key words/conceptsaerial photograph; horizontal photograph; orthophoto map; feature; landform; tone; texture; shadow; topographical map; distance; area; vertical exaggeration; gradient; position; relief; contour; Geographical Information Systems (GIS); spatial data; remote sensing; sensor; electromagnetic radiation; passive sensor; active sensor; satellite image; spectral resolution; climatology; meteorology; geopotential; vorticity
52 S E C T I O N 2 • L E S S O N - B Y - L E S S O N
UNIT 1 Aerial photographs and orthophoto maps
TERM 1, WEEK 8
Learner’s Book pages 77–87Duration: 4 hours
Curriculum and Assessment Policy Statement (CAPS) content
Aerial photographs and orthophoto maps • Oblique and vertical aerial photographs – identifying landforms
and features• Use of tone, texture and shadow in the interpretation of photos• Orthophoto maps – identifying features• Orienting aerial photographs and orthophoto maps with another map
Resources• Learner’s Book pages 77–87• Websites (optional)
– For information on oblique and vertical aerial photographs: http://www.geog.ucsb.edu/~jeff/115a/lectures/geometry_of_
aerial_photographs_notes.html– For information on the use of tone, texture and shadow in the
interpretation of photos: http://books.google.co.za/books?id=rmiPV3ABi9EC&pg=PA104&lp
g=PA104&dq=*+use+of+tone,+texture+and+shadow+in+the+interpretation+of+photos&source=bl&ots=7a_Jey06BD&sig=Ifn1XL0m5ek0AHyihrxYJN-20Zk&hl=en&sa=X&ei=u-wJT6PYIYuXhQe2vLStCQ&ved=0CC8Q6AEwBA#v=onepage&q&f=false
– For information on orthophoto maps and identifying features: http://www.maptown.com/referencemaptypes.html
Preparation• Read through the unit and familiarise yourself with the content that
you will need to teach. Think about what the learners may already know about the topics and any areas of difficulty that you think they might encounter.
Teaching the unit
Lesson 1
• For the first five minutes of the lesson brainstorm with learners to find out what they know about oblique and aerial photographs and the identification of landforms and features. Allow for discussion. Always allow for an open-forum teaching approach. Both teacher and learner input should be respected.
• Facilitate the lesson by explaining and informing learners about oblique and aerial photographs – landforms and features.
• With the learners, work through the section, ‘What are oblique and vertical aerial photographs?’ (page 77). Emphasise that an orthophoto map is a vertical aerial photograph.
• Draw attention to Table 2.1.1 ‘Advantages and disadvantages of aerial photographs’ (page 79).
53M O D U L E 2 • T H E AT M O S P H E R E : G E O G R A P H I C A L S K I L L S A N D T E C H N I Q U E S
• Draw attention to how landforms and features are shown on oblique and vertical aerial photographs.
• Refer to the glossary box definition of landforms (page 79). It explains that landforms are physical features that are represented by different contour patterns on a map.
Activity 1• Allow learners to start the activity in class in case they need to ask
questions about the activity.• Facilitate the activity by helping those learners who need help. • Learners should finish the activity for homework.
Lesson 2
• Go through the answers to Activity 1 with the class.• For the next five minutes of the lesson, brainstorm with learners to find
out what they know about the use of tone, texture and shadow in the interpretation of photos.
• Work through the section, ‘How are tone, texture and shadow used in the interpretation of photos?’ (page 80).
• Emphasise that tone refers to the colour of features on a map or photograph. Pay particular attention to the information on the tone of black and white photographs as this will help learners to better interpret photographs.
• Point out that Figure 2.1.5 illustrates texture on a high oblique aerial photograph.
Activity 2• Allow learners to start the activity in class.• Facilitate the activity by helping those learners who need help. • Learners may refer to Module 6 to find out more about direction, if they
need to.• Learners should finish the activity for homework.
Lesson 3
• Go through the answers to Activity 2 with the class.• For the next five minutes of the lesson, brainstorm with learners to find
out what they know about orthophoto maps and identifying features.• Work through the section, ‘What are the identifying features of
orthophoto maps?’ (page 82).• Focus on the information on how features are identified on orthophoto
maps.• Refer to Figure 2.1.8 which shows map symbols used on a topographical
map to show features.
Activity 3• Allow learners to start this activity in class.• Facilitate the activity by helping those learners who need help.
Lesson 4
• Go through the answers to Activity 1 with the class.• For the next five minutes of the lesson, brainstorm with the learners
to find out what they know about orientating aerial photographs and, topographical and orthophoto maps.
54 S E C T I O N 2 • L E S S O N - B Y - L E S S O N
• Work through the section, ‘How do we orientate aerial photographs, orthophoto maps and topographical maps?’ (page 84). Focus on Figures 2.1.9, 2.1.10 and 2.1.11 of Diepsloot. Point out how the three maps differ.
Activity 4• Allow learners to complete the activity in class and then go through the
answers with them.
AnswersActivity 1 (Learner’s Book, page 79)
1. Oblique aerial photograph: taken with the camera slanted at an angle to the Earth’s surface.
2. physical features are easily identified; relative height between certain features are shown
3. vertical aerial photograph4. Any of the following: drawn to scale; accurate measurement of
distance; position and relief; used for planning and development (GIS spatial planning)
Activity 2 (Learner’s Book, page 81)
1. This is a black and white photograph so tone is reflected by different shades of grey. The darker an object appears, the less amount of light it reflects. Water masses in this photograph are therefore reflected in a very dark shade of grey.
2. Industrial purposes. Large buildings can be identified and the distance between buildings is greater.
Activity 3 (Learner’s Book, page 84)
1. An orthophoto map provides a bigger version that zooms in on a specific area on a topographical map.
2. Map symbols are signs used on orthophoto maps that represent features found in reality.
3. Contour patterns show the various types of landforms on orthophoto maps.
Activity 4 (Learner’s Book, page 84)
1. Any two: contour lines; spot heights; trig. beacons are found on an orthophoto map and not on a vertical aerial photograph.
2. Tone, texture and shadow are used to identify landforms and features on an aerial photograph.
3. 14 July 19774. Maps are drawn to scale to represent geographical features in their true
ground position.5. Scale of the orthophoto map = 1: 20 000. Scale of the topographical
map = 1:50 000.6. Orthophoto maps are drawn to a bigger scale, therefore they provide a
bigger version that zooms in on a specific area on a topographical map.
55M O D U L E 2 • T H E AT M O S P H E R E : G E O G R A P H I C A L S K I L L S A N D T E C H N I Q U E S
Informal assessment Activity 1• Go through the answers with the class. Encourage learners to offer
answers.
Activity 2• Go through the answers with the class. • Encourage learners to give answers. • Allow learners to check their peers’ answers.
Activity 3• Go through the answers with the class. • Encourage learners to offer answers in an open forum.
Activity 4• Allow learners to mark their peers’ work.• Go through the answers with the class. • Ask those learners who got less than 50% for the activity to do the
remedial activity below.
Remedial/extensionRemedial: For learners who need extra practice with the concepts in this unit let them complete Worksheet 7 (pages 275–282) in the Resources section of this Teacher’s Guide. This worksheet can also be used for revision purposes.
UNIT 2 Geographical Information Systems (GIS)
TERM 1, WEEK 9
Learner’s Book pages 88–100Duration: 2 hours
Curriculum and Assessment Policy Statement (CAPS) content
Geographical Information Systems (GIS) • Satellite images • Application of GIS to climatology and meteorology
Resources• Learner’s Book pages 88–100• Websites (optional):
– For information about GIS applications in Climate and Meteorology: http://proceedings.esri.com/library/userconf/proc00/professional/papers/PAP159/p159.htm
– For information about application of GIS to climatology and meteorology – books:
http://www.iste.co.uk/index.php?f=a&ACTION=View&id=152
Preparation• Read through the unit and familiarise yourself with the content that you
will need to teach. Think about what learners may already know about the topics and any areas of difficulty that you think they might encounter.

56 S E C T I O N 2 • L E S S O N - B Y - L E S S O N
Teaching the unit
Lesson 1
• With the learners, work through the sections, ‘What are the functions of Geographical Information Systems (GIS)?’ (page 88) and ‘How does remote sensing work?’ (page 89). Allow learners to ask questions.
• Work through the section, ‘How are satellite images used and interpreted?’ (page 90). Concentrate on how the elements of shape, size, tone and patterns help us to decode satellite images.
• Point out the importance of ‘spectral resolution’ to tone.• Highlight the differences between Figure 2.2.5 and Figure 2.2.6.• Go through Activities 1 to 3 so that the learners can begin them in
class and then work through them at their own pace. They will need to complete these activities as homework if they are unable to finish in class.
Activity 1• Allow learners to start the activity in class.• This activity focuses on the importance of the different processes of
satellite images for GIS.
Activity 2• Help learners to differentiate between shape, size and tone.
Activity 3• Encourage learners to look at Figure 2.2.8 as an example of how land-
cover textures are derived from satellite images to create texture on a map.• Help learners to understand and see the different textures on the map.
Lesson 2
• Go through the answers to Activities 1 to 3 with the class.• Work though the information on how pattern and shadow help us to
decode satellite images.• For the next five minutes of the lesson, brainstorm with the learners
to find out what they know about the use of application of GIS to climatology and meteorology.
• With the learners, work though the section, ‘How are Geographical Information Systems (GIS) applied to climatology and meteorology?’ (page 96).
• Point out Figure 2.2.11 which is a (GIS) model and precipitation over parts of South Africa.
• Point out Figure 2.2.12 A and B which shows the minimum and maximum temperatures of South Africa.
• Point out Figure 2.2.13 which shows expected storms over parts of the country.
Activity 4• Allow learners to begin the activity in class and then complete it as
homework.• Help learners to understand and interpret Figure 2.2.13.• Ask learners to finish the activity for homework.
57M O D U L E 2 • T H E AT M O S P H E R E : G E O G R A P H I C A L S K I L L S A N D T E C H N I Q U E S
Activity 5• Allow learners to begin the activity in class and then complete it as
homework.• This is a case study. Allow learners to read it for themselves.
AnswersActivity 1 (Learner’s Book, page 91)
1. sensing objects or events at remote places; observing data (objects or events); recording the data
2. Data is collected from a distance. This is called encoding. Encoding includes the inputting of satellite imagery. Decoding is the opposite or reverse process of encoding. It is the conversion of an encoded format back into the original information.
3. An active sensor is a satellite which sends out its own radiation towards the Earth’s surface. A passive sensor is a small sensor on a satellite which measures and records radiation which is reflected from the Earth.
4. radar5. A satellite image is a photograph of the Earth taken from space.
Activity 2 (Learner’s Book, page 93)
1. Natural water bodies are irregular in shape, while most human-made water bodies have a definite shape, such as rectangular or circular.
2. Size includes length, width, height and area. A satellite image or map may show absolute or relative sizes.
3. The tone refers to the colours of features in the satellite image.4. In a true-colour image, the original colour of an image is reflected. In a
false-colour image, colour is changed.
Activity 3 (Learner’s Book, page 93)
1. Texture is often referred to as coarse and fine, or smooth.2. Texture is created on a GIS image by using texture technique.3. Texture shows us how the landscape looks in real life.
Activity 4 (Learner’s Book, page 99)
1. from 6 June to 8 June 20112. • the Eastern Cape is surrounded by a high pressure cell; warm
weather• the North West is affected by a low pressure cell; very cold weather
conditions3. The black contour lines indicate the pressure systems.4. gale force weather and thunderstorms5. • the red shading illustrates warm weather; the weather ranges
between 2 and 12; the numbers between 6 and 12 illustrates very warm weather.
• the blue shading illustrates stormy and cyclonic weather; the darker the blue, the stronger the storms
6. It is very effective as it illustrates the weather in colour. It shows the severity of the weather conditions.
7. The GIS models used are very effective. They give a clear indication of the weather experienced in Africa.

58 S E C T I O N 2 • L E S S O N - B Y - L E S S O N
Activity 5 (Learner’s Book, page 100)
1. drought-stricken Africa2. Kenya, Djibouti, Ethiopia, Somalia 3. barren land or soil erosion4. NASA5. NASA satellite tracked the severity of an African drought
Informal assessment Activity 1• Go through the answers with the class. Ask learners to offer answers.
Activity 2• Allow learners to mark their peers’ work.• Go through the answers with the class.
Activity 3• Go through the answers with the class. Ask learners to offer answers.
Activity 4• Go through the answers with the class. Encourage learners to offer
answers. Informally assess learners by observing them to see whether they could apply themselves to the different maps they used. This will reveal whether learners understood the concepts in this unit.
Activity 5• Go through the answers with the class. Encourage learners to offer
answers. Allow learners to swap work to check for plagiarism (learners are not allowed to copy chunks of work from extracts).
Remedial/extensionRemedial:• Give learners more practice with weather pattern maps.• Allow learners more opportunities to contrast and compare GIS weather
maps showing different pressure systems.
59M O D U L E 2 • T H E AT M O S P H E R E : G E O G R A P H I C A L S K I L L S A N D T E C H N I Q U E S
Learner’s Book pages 101–108
REVIEW TERM 1
These activities provide an opportunity for learners to consolidate concepts and skills learnt in Term 1. Learners can complete them in class or as homework. It is suggested that they complete the activities individually as a means of self-assessment.
You can write the answers on the board for the learners and/or call them out where more appropriate. However, if possible, it is suggested that you photocopy the answers and give them to the learners so that they have them for revision purposes.
Activity 1 (Learner’s Book, page 101)
1. insolation: incoming sunlight/the energy the Earth receives from the Sunequinox: the time at which both hemispheres receive equal insolation
solstice: the time at which one hemisphere receives maximum insolation and the other receives minimum insolation
2. 30°S 3. a. 0°S
b. 90°S c. At the time of the equinoxes, the Sun is directly overhead/over
the equator.d. i. approximately 400 W∙m−2, i.e. 400–0 ii. approximately 0–100 W∙m−2, i.e. 400–400 for November and
February and 500–400 for December 4. The Earth is a sphere/ball-shaped. The Earth’s axis is tilted at 23,5°.5. a. convection: hot air/water rises and cool air/water sinks, forming a
convection loopb. ocean currents: warm surface water at the equator flows towards the
poles; cold surface water at the poles flows towards the equatorc. winds/global air circulation: warm air and cold air is circulated in each
hemisphere in three air convection cells
Activity 2 (Learner’s Book, page 102)
1. 1 = ITCZ/equatorial low; 2 = subtropical high; 3 = subpolar low; 4 = polar easterlies; 5 = westerlies; 6 = tropical easterlies/trade winds; 7 = polar cell; 8 = Ferrel cell; 9 = Hadley cell
2. a. high, lowb. leftc. equal and opposite
Activity 3 (Learner’s Book, page 102)
1. A = La Niña; B = El Niño2. a. Pacific Ocean; b. equatorial current; c. equatorial counter current;
d. trade winds; e. Walker circulation3. The low pressure system forms over the western tropical Pacific region;
the eastern side of Africa and other parts of Africa become wetter than usual and storms are more severe.
© You may photocopy this page for use with Study & Master Geography Grade 11.
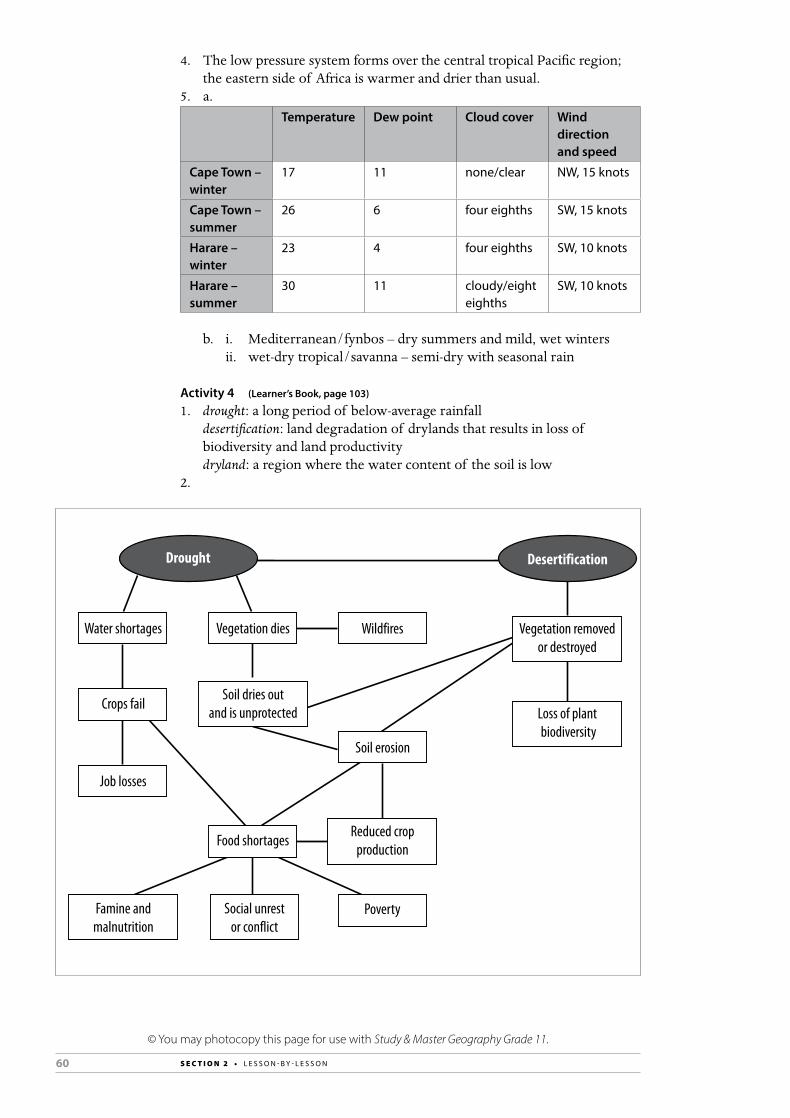
60 S E C T I O N 2 • L E S S O N - B Y - L E S S O N
4. The low pressure system forms over the central tropical Pacific region; the eastern side of Africa is warmer and drier than usual.
5. a.Temperature Dew point Cloud cover Wind
direction and speed
Cape Town – winter
17 11 none/clear NW, 15 knots
Cape Town – summer
26 6 four eighths SW, 15 knots
Harare – winter
23 4 four eighths SW, 10 knots
Harare – summer
30 11 cloudy/eight eighths
SW, 10 knots
b. i. Mediterranean/fynbos – dry summers and mild, wet winters ii. wet-dry tropical/savanna – semi-dry with seasonal rain
Activity 4 (Learner’s Book, page 103)
1. drought: a long period of below-average rainfall desertification: land degradation of drylands that results in loss of
biodiversity and land productivitydryland: a region where the water content of the soil is low
2.
© You may photocopy this page for use with Study & Master Geography Grade 11.

61M O D U L E 2 • T H E AT M O S P H E R E : G E O G R A P H I C A L S K I L L S A N D T E C H N I Q U E S
Activity 5 (Learner’s Book, page 103)
1. High angle oblique aerial photograph – the camera is at a 60° angle to the vertical line.
2. Physical features are easily identified; the relative height between certain features is shown.
3. A high angle oblique aerial photograph is used to show the features of a particular place on the Earth’s surface. It always shows the horizon and gives us a view of a specific area.
4. a. Agulhas currentb. East London has warm and humid weather with high rainfall due to
high levels of evaporation.
Activity 6 (Learner’s Book, page 104)
1. The orthophoto map is drawn on a 1: 20 000 scale and the topographical map is drawn on a 1:50 000 scale. The orthophoto map is therefore drawn on a bigger scale and shows a larger view of the Earth’s surface with more detail than the topographical map.
2. Landforms are illustrated on the orthophoto map with darker shades. The steeper the landform, the darker the shade or tone on the orthophoto map.
3. Nahoon Valley Park is a valley. A valley is a low-lying area surrounded by a spur. Contour lines are used to illustrate the valley on the topographical map and orthophoto map. The contours in a valley are V-shaped and point upslope towards higher land. Contours in a spur are V-shaped and point downslope towards lower land.
4. The climate in a valley is warm during the day and very cold at night. People therefore usually settle on the upper north facing slopes of valleys.
5. 20 m6. Southeast. The contour lines are decreasing in a southeasterly direction.
Rivers always flow towards the ocean.7. Perennial. The river is represented with a continuous blue line.8. spot heights; trig. beacons; benchworks9. A is an industrial area. B is a residential area.
Activity 7 (Learner’s Book, page 104)
1. high pressure cells; low pressure cells2. Yes, low pressure cells indicate that cold fronts are approaching; and high
pressure cells indicate warm weather. 3. three fronts4. warm front brings warm weather; cold front brings cold weather
Activity 8 (Learner’s Book, page 104)
1. >800 mm2. inland3. more dark blue areas are displayed inland4. 400 mm–600 mm
© You may photocopy this page for use with Study & Master Geography Grade 11.
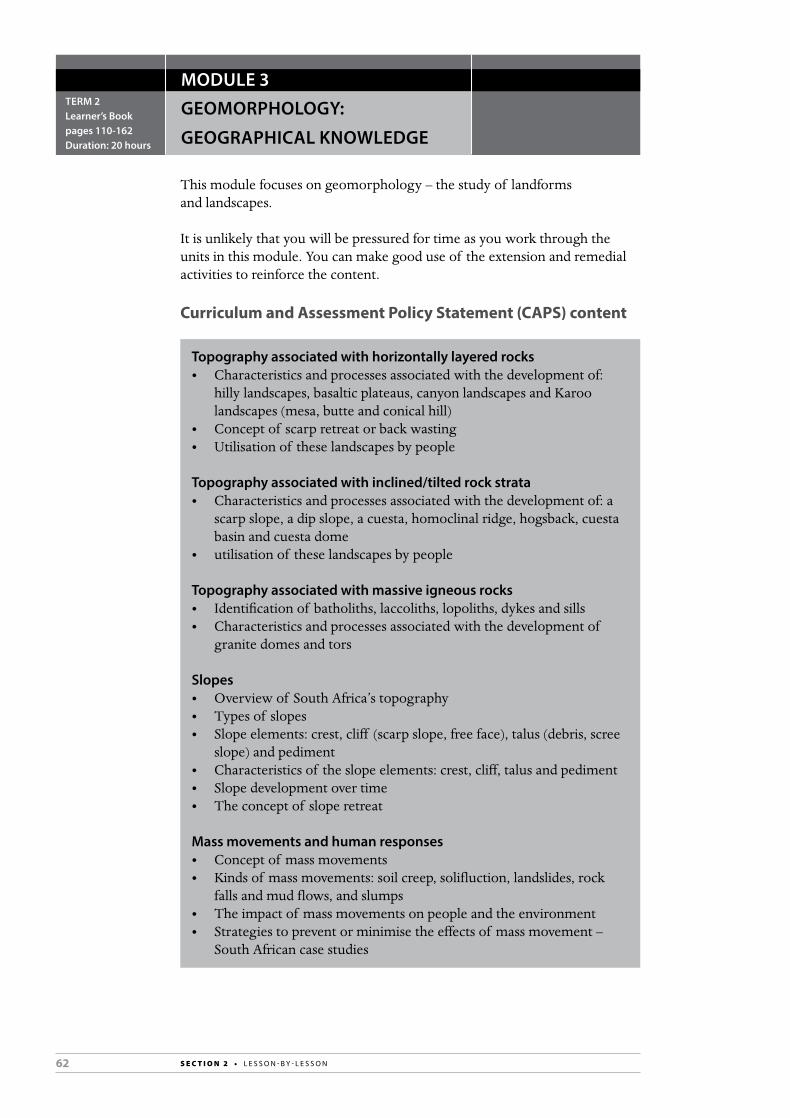
62 S E C T I O N 2 • L E S S O N - B Y - L E S S O N
MODULE 3TERM 2Learner’s Book pages 110-162Duration: 20 hours
GEOMORPHOLOGY:
GEOGRAPHICAL KNOWLEDGE
This module focuses on geomorphology – the study of landforms and landscapes.
It is unlikely that you will be pressured for time as you work through the units in this module. You can make good use of the extension and remedial activities to reinforce the content.
Curriculum and Assessment Policy Statement (CAPS) content
Topography associated with horizontally layered rocks• Characteristics and processes associated with the development of:
hilly landscapes, basaltic plateaus, canyon landscapes and Karoo landscapes (mesa, butte and conical hill)
• Concept of scarp retreat or back wasting• Utilisation of these landscapes by people
Topography associated with inclined/tilted rock strata• Characteristics and processes associated with the development of: a
scarp slope, a dip slope, a cuesta, homoclinal ridge, hogsback, cuesta basin and cuesta dome
• utilisation of these landscapes by people
Topography associated with massive igneous rocks• Identification of batholiths, laccoliths, lopoliths, dykes and sills• Characteristics and processes associated with the development of
granite domes and tors
Slopes • Overview of South Africa’s topography• Types of slopes• Slope elements: crest, cliff (scarp slope, free face), talus (debris, scree
slope) and pediment• Characteristics of the slope elements: crest, cliff, talus and pediment• Slope development over time• The concept of slope retreat
Mass movements and human responses• Concept of mass movements• Kinds of mass movements: soil creep, solifluction, landslides, rock
falls and mud flows, and slumps• The impact of mass movements on people and the environment• Strategies to prevent or minimise the effects of mass movement –
South African case studies
63M O D U L E 3 • G E O M O R P H O L O G Y : G E O G R A P H I C A L K N O W L E D G E
Key geographical skills and techniques• using verbal, quantitative and symbolic data forms such as text, pictures,
graphs, tables, diagrams and maps• practising field observation and mapping, interviewing people,
interpreting sources, working with statistics• applying communication, thinking, practical and social skills• practising the following specific skills:
– identifying questions and issues– collecting and structuring information – processing, interpreting and evaluating data – making decisions and judgements– deciding on a point of view– suggesting solutions to problems– working co-operatively and independently
New words/conceptsgeomorphology; uplift; weathering; mass wasting; erosion; strata; bedding plane; hilly landscape; sheetwash; peneplain; basaltic plateau; canyon landscape; mesa; butte; conical hill; pediplain; scarp retreat/back wasting; dome; basin; scarp slope; dip slope; dip; cuesta; homoclinal ridge; hogsback; cuesta dome; cuesta basin; igneous intrusion; batholith; laccolith; lopolith; dyke; sill; granite dome; exfoliation; joint; tor; core stone; topography; plateau; Great Escarpment; escarpment; coastal plain; crest; cliff; talus slope; pediment; knickpoint; slope retreat; slope decline; parallel retreat/scarp retreat; slope replacement; mass movement/mass wasting; regolith; soil creep; soil fluction/solifluction; permafrost; debris flow; mud flow; slump; landslide; rock fall; geohazard
UNIT 1 Topography associated with horizontally layered rocks
TERM 2, WEEK 1
Learner’s Book pages 111–125Duration: 4 hours
Curriculum and Assessment Policy Statement (CAPS) content
Topography associated with horizontally layered rocks• Characteristics and processes associated with the development of: hilly
landscapes, basaltic plateaus, canyon landscapes and Karoo landscapes (mesa, butte and conical hill)
• Concept of scarp retreat or back wasting• Utilisation of these landscapes by people
Resources• Learner’s Book pages 111–125• Websites (optional)
– For a 3-D surround view of the Drakensberg, see Wikipedia: en.wikipedia.org/wiki/Drakensberg
– For information on the Molatse/Blyde River Canyon see:• kruger2canyons.com/travelguide/blydecanyon.php• www.naviquan.com/idea/motlatse• www.theworldwonders.com/africa/blyde-river-canyon.html
64 S E C T I O N 2 • L E S S O N - B Y - L E S S O N
– For information on the Grand Canyon (suitable for advanced learners) see:• www.bobspixels.com/kaibab.org/geology/gc_geol.htm• www.nature.nps.gov/geology/parks/grca
• Books (optional)Some useful books for this unit and the other units in this module are:– Mountains of Southern Africa by David Bristow and Clive Ward– Geological Journeys by Nick Norman and GavinWhitfield (Struik)– The Rocks and Mountains of Cape Town by John S Compton
(Double Storey)Scout your school library, public library and second-hand bookstores for these books and others on South Africa’s geology and mountains.
Preparation• Read through the unit and familiarise yourself with the content that you
will need to teach. Think about what the learners may already know about the topics and any areas of difficulty that you think they might encounter.
Teaching the unit
Lesson 1
• Read through, or ask learners to read through, the Module 3 introductory paragraphs on page 110. Write up the four key ideas on the board.
• Read through, or ask learners to read through, the Unit 1 introductory paragraph on page 111. Emphasise, as the introduction does, that rivers shape all four types of landscape you will be looking at.
• Work through the section, ‘How are landscapes formed?’ on page 111. This section gives background and context for the module.
• Draw attention to Figure 3.1.1 which summarises three important factors in landscape formation.
• Draw attention to Figure 3.1.2 which shows how a river shapes a landscape. Point out that landscapes are formed by repeated cycles of building up and breaking down.
• Draw attention to Figure 3.1.3 which shows the difference between weathering, erosion and mass wasting.
• Point out that climate affects weathering. For example, in arid regions, resistant rocks are: quartzites, basalt, conglomerate and limestone. In humid regions, non-resistant rock is shale, slate and limestone.
Activity 1• In this activity, learners list landscape building-up and breaking-down
processes.• Work through the section, ‘What are rock strata?’ (page 113). Emphasise
the analogy of a layered cake: The sedimentary rock layers are like the cake; the igneous rock is like the icing in between the layers and on top.
Activity 2• This is mainly a Grade 10 revision activity.• Learners can finish this activity for homework if necessary.
Lesson 3
• If learners finished Activity 2 for homework, go through the answers with the class.
65M O D U L E 3 • G E O M O R P H O L O G Y : G E O G R A P H I C A L K N O W L E D G E
• Work through the section, ‘What characteristics and processes are associated with the development of hilly landscapes and basaltic plateaus?’ (page 114).
• Focus on Figure 3.1.5 which shows the stages in the development of hilly landscapes.
• Focus on Figure 3.1.7 which shows the stages in the development of basaltic plateaus.
• Refer to Figure 3.1.8. Emphasise the large area that is covered by the plateau. Ask learners to compare the flat table-like top of this plateau with the flat top of the Drakensberg in Figure 3.1.9.
• Point out that the Drakensberg is a UNESCO World Heritage Site (see the Interest box and the feature on the Drakensberg on page 117). (The Drakensberg and the Vredefort Dome are South Africa’s two geological sites. See Unit 2, page 132 for a feature on the Vredefort Dome. See also the Extension activity for Unit 2 on page 72 of this Teacher’s Guide.
• Point out that Figure 3.1.10 (page 118) shows both the Drakensberg and the Valley of a Thousand Hills.
Activity 3• Read the feature, ‘The mighty Drakensberg or uKhahlamba – the Barrier
of Spears’ (page 117).• In this activity, learners answer questions on the Drakensberg – an
example of a basaltic plateau.
Activity 4• Read the feature, ‘The Valley of a Thousand Hills: It inspires writers and
challenges runners’ (page 118).• In this activity, learners answer questions on the Valley of a Thousand
Hills – an example of a hilly landscape.• Learners can do this activity for homework.
Lesson 3
• If learners did Activity 4 for homework, go through the answers with the class.
• Work through the section, ‘What characteristics and processes are associated with the development of canyon landscapes and Karoo landscapes?’ (page 119).
• Focus on Figure 3.1.12 which shows how resistant rock forms the steep sides of the canyon and less resistant rock forms the gentler slopes. (This links to the feature on the angle of repose in Unit 4).
• Focus on Figure 3.1.13 which shows the stages in the development of canyon landscapes.
• Focus on Figure 3.1.15 which shows the landforms that make up a Karoo landscape.
• Work through the section, ‘What is scarp retreat?’ (page 122).
Activity 5• Read the features, ‘The Fish River Canyon’ (page 122) and ‘The Three
Sisters’ (page 123).• In this activity, learners answer questions on the Fish River Canyon – an
example of a canyon landscape – and the Three Sisters – an example of a Karoo landscape.
• Learners can do or finish this activity for homework.
66 S E C T I O N 2 • L E S S O N - B Y - L E S S O N
Lesson 4
• If learners did Activity 5 for homework, go through the answers with the class.
• Work through the section, ‘How do people use these landscapes?’ (page 123).
• Ask learners to suggest which of the four landscapes is most suitable for settlement. (Answer: hilly landscapes).
• Refer to the photos in Figure 3.1.21A–D to Figure 3.1.24A–D which illustrate a key use for each type of landscape.
Activity 6• Ask learners to read through the four features again by themselves so as
to understand their different stages of development and uses.• In this activity, learners extract information from the features on the ways
in which people used these landscapes.
AnswersActivity 1 (Learner’s Book, page 113)
1. geomorphology: the study of landscapes weathering: the breakdown of rock by physical/mechanical, chemical and
biological processes erosion: the transport of broken down rock by wind, water or glaciers mass wasting: the movement of sediment and rock debris downslope
under the pull of gravity2. a. weathering, erosion, mass wasting
b. uplift, volcanic activity, folding, faulting
Activity 2 (Learner’s Book, page 114)
1. Sample table:
Sedimentary rock Igneous rock Metamorphic rock
How it forms
from layers of sediment deposited on the sea floor
from molten magma (intrusive) or lava (extrusive)
from sedimentary or igneous rock that is heated and put under pressure
Examples sandstone, shale, breccias, conglomerate, limestone, coal
intrusive: granite, gabbro, doleriteextrusive: rhyolite, basalt, pumice
quartzite, slate, gneiss, marble, anthracite
2. strata: layers of rock – usually sedimentary rock or metamorphosed sedimentary rock
cap rock: a layer of igneous rock that covers the top of sedimentary strata (it can be extrusive rock or intrusive rock that has become exposed, e.g. sills)
sill: a flat layer of igneous rock, sandwiched between other rock layers; it is formed by magma intrusion
contact metamorphism: the process in which the rock layers or part of the rock closest to the igneous intrusion are turned into metamorphic rock by the intense heat
67M O D U L E 3 • G E O M O R P H O L O G Y : G E O G R A P H I C A L K N O W L E D G E
Activity 3 (Learner’s Book, page 118)
1. The break-up of Gondwanaland 180 million years ago triggered volcanic activity and a flood basalt. The Drakensberg is the eroded remains of a very thick layer of basalt that covered most of southern Africa. The joints in the basalt have produced the steep-sided blocks of the mountain.
2. a. basaltb. sandstone
3. Lesotho4. Any river that has its source in the Drakensberg. Two large, well-known
ones are the Orange River and the Tugela/uThukela River.
Activity 4 (Learner’s Book, page 119)
1. granite; gneiss2. Mgeni/Umgeni River; Msundusi/Dusi River3. Moist and warm. The high temperatures contribute to chemical and
biological weathering. The high rainfall causes sheetwash erosion and mass wasting, which form the rounded hills.
4. The valleys will widen and the hills will flatten. In the long distant future, the area will become a flat plain that has been eroded down to sea level.
5. the hilly coastal regions of the Transkei
Activity 5 (Learner’s Book, page 123)
1. Namibia2. It is Africa’s largest canyon and the second-largest canyon in the world.3. a. sandstone
b. shale4. United States of America, Arizona; Colorado River5. buttes6. The buttes have formed from scarp retreat of mesas, which in turn,
would have made up a plateau. The sides have eroded away at a constant angle: the more resistant dolerite cap retreats almost vertically and the less resistant sandstone retreats as a gentler slope.
Activity 6 (Learner’s Book, page 125)
Table 3.1.1 Stage of development and usage of four landscapes
Stage of development
Use
Drakensberg mature A tourist attraction, especially for hikers and climbers.
Valley of a Thousand Hills
young to mature The up and down hills make a challenging course for the Comrades Marathon. Its two main rivers host the Dusi Canoe Marathon.
Fish River Canyon young to mature A tourist attraction – for hikers or those who go to see its striking scenery.
Three Sisters old An interesting landmark for motorists travelling on the N1. It is a sheep and goat farming area.
For Stages of development, allocate 4 × 1 marks.
For Use, allocate 4 × 2 marks. [12]
68 S E C T I O N 2 • L E S S O N - B Y - L E S S O N
Informal assessment Activity 1• Go through the answers with the class. Ask learners to offer answers.
Activity 2• For question 1, write up the completed table on the board.• For question 2, go through the answers.
Activity 3• Go through the answers with the class. Ask learners to offer answers.
Activity 4• Go through the answers with the class. Ask learners to offer answers.
Activity 5• Ask learners to swap books with a partner and check each other’s work as
you go through the answers with the class.
Activity 6• Go through the answers with the class.• If you choose, you can ask learner’s to mark their answers according
to the mark allocation given in the Answers section. Ask those learners who got less than 9/12 for the activity to do the remedial activity (see the Remedial section below).
Remedial/extensionRemedial: For learners who struggled with Activity 6, let them complete Worksheet 8 (pages 283–284) in the Resources section of this Teacher’s Guide. This worksheet can also be used for revision purposes.
Extension: • Ask learners to find out more about one or more of these basaltic/basalt
plateaus: Ethiopian Highlands, Columbia River, Kerguelen Plateau.• Ask learners to find out more about one or more of these canyons:
Grand Canyon, Colcha Canyon.• Ask learners to find out more about Monument Valley in the United
States. (It is a Karoo-like landscape).
UNIT 2 Topography associated with inclined/tilted rock strata
TERM 2, WEEK 2
Learner’s Book pages 126–133Duration: 4 hours
Curriculum and Assessment Policy Statement (CAPS) content
Topography associated with inclined/tilted rock strata• Characteristics and processes associated with the development of: a scarp
slope, a dip slope, a cuesta, homoclinal ridge, hogsback, cuesta basin and cuesta dome
• Utilisation of these landscapes by people
69M O D U L E 3 • G E O M O R P H O L O G Y : G E O G R A P H I C A L K N O W L E D G E
Resources• Learner’s Book pages 126–133• Websites (optional)
– For information features associated with horizontal strata and tilted strata: 216.130.16.10/~lhanson/gls210/gls210_struct.htm
– This site has some information on homoclinal ridges and includes other information relevant to Unit 1: myweb.cwpost.liu.edu/vdivener/notes/structure_landforms.htm
– For information on domes and basins for advanced learners see: www.slackpacker.com/domesandbasins.html
Preparation• Read through the unit and familiarise yourself with the content that you
will need to teach. Think about what learners may already know about the topics and any areas of difficulty that you think they might encounter.
Teaching the unit
Lesson 1
• Read through, or ask learners to read through, the Unit 2 introductory paragraphs on page 126.
• Work through the section, ‘How do rock strata become tilted?’ (page 126). • Focus on Figure 3.2.1. Remind learners that faulting and folding were
covered in Grade 10 and revised in Unit 1 of this module.
Activity 1• This activity gets learners to focus on Figure 3.2.1, which shows how rock
layers can become tilted. It also revises the Grade 10 concepts of faulting and folding.
• Begin the section, ‘What are the characteristics and processes associated with the development of tilted rock strata? (page 127).
• Work through the section, ‘How scarp slopes and dip slopes form’ (page 127). Focus on Figure 3.2.2 which shows the scarp slope and the dip slope. For interest, you can point out that the strike of a slope is the direction along the length of the ridge.
Activity 2• In this activity, learners identify the elements of an asymmetrical ridge
and apply the concept of scarp retreat (which they learnt about in Unit 1).
Lesson 2
• Focus on Figure 3.2.4 which shows the difference between a cuesta, a homoclinal ridge and a hogsback. Emphasise that they are distinguished by how steeply they tilt – in other words, by the angle of their dip slope.
• Work through the section on cuestas (page 128). Note the tip box: cuesta is pronounced ‘questa’ (i.e. kwesta).
• Point out the gentle slope of the cuesta in the photograph in Figure 3.2.5. Learners will read the angle of the slope off the protractor in Activity 3.
70 S E C T I O N 2 • L E S S O N - B Y - L E S S O N
Activity 3• Read the feature, ‘The Magaliesberg cuestas’ on page 128. • In this activity, learners answer questions on the feature and read the
angle of dip in Figure 3.2.5.• For those learners who do not know the Magaliesberg area and do not
know the dam, ask them to find out by searching on the Internet. Or give them a clue: For example, part of the name includes the name of an antelope (i.e. hartebeest). The dam takes its name from the Hartebeespoort farm, the land it was built on.
• Work through the section on homoclinal ridges. Point out that the distinction between a cuesta and a homoclinal ridge and a hogsback is sometimes blurred (see the Tip box on page 128). The Magaliesberg are sometimes referred to as homoclinal ridges.
• Point out that the San Rafael Swell formed from a dome-like structure which is steeper on one side than the other (see the section on cuesta domes). It is made up of layers of sandstone, shale and limestone. The sandstone layers are the most resistant.
Lesson 3
• Work through the section on hogsbacks. • Draw attention to the photo of Hogsback Mountain Peak in Figure 3.2.8.
Ask learners to identify the dip slope (on the right-hand side) and the scarp slope (on the left-hand side).
Activity 4• Read the feature, ‘Dakota Hogback’ (page 130). Point out that Americans
use the term ‘hogback’ rather than ‘hogsback’ (with an s).• In this activity, learners answer questions on the feature.• Begin the section on cuesta domes and cuesta basins.
Lesson 4
• Work through the section on cuesta domes and basins. • Focus on Figure 3.2.11. Point out that upward folding forms a dome and
downward folding forms a basin. Also point out that the scarp slopes form the inner slopes of a cuesta dome and the outer slopes of a cuesta basin. Finally, point out that the topography (shape) of domes doesn’t always reflect their structure (how they formed and their original shape). What is structurally a dome can look like a basin, once it has eroded.
• Work through the section ‘How do people use these landscapes?’ (page 133).
Activity 5• Read the features, ‘The Richat Structure: the Eye of the Sahara’
(page 131) and ‘The Vredefort Dome’ (page 132).• In this activity, learners answer questions on these two features. Learners
practise their comprehension skills.• If necessary, learners can finish this activity for homework.

71M O D U L E 3 • G E O M O R P H O L O G Y : G E O G R A P H I C A L K N O W L E D G E
AnswersActivity 1 (Learner’s Book, page 126)
1. a. faulting – the cracking (1) and displacement/shifting (1) of a block of rock caused by movements in the Earth’s crust
b. i. normal fault (1) (to answer this, learners need to remember what they learnt in Grade 10)
ii. reverse/thrust fault (1) (to answer this, learners need to remember what they learnt in Grade 10)
2. a. folding – the bending (1) of layers in rock in response to movements in the Earth’s crust (1)
b. an anticline is an upward fold (1); a syncline is a downward fold (1)c. a dome is a protrusion formed by pushing up of the Earth’s crust (1);
a basin is a hollow/depression formed by sagging or pushing down of the Earth’s crust (1)
d. The domes are formed by upward folds (1); their outer slopes are shallow (dip slopes) (1); and their inner slopes are steep (scarp slopes) (1); the basins are formed by downward folds (1); their inner slopes are shallow (dip slopes) (1); and their outer slopes are steep (scarp slopes). (1)
[16]
Activity 2 (Learner’s Book, page 127)
1. 1 = dip slope; 2 = bedding plane; 3 = scarp slope; 4 = resistant strata, e.g. quartzite; 5 = less resistant strata, e.g. shale (5)
2. The dip slope is protected from erosion by the resistant layer of rock that forms the ridges ‘backbone’. (1) The ridge erodes on the scarp slope (1); and is worn away parallel to the scarp slope by the process of scarp retreat. (1)
[8]
Activity 3 (Learner’s Book, page 129)
1. 12° 2. a. A huge igneous intrusion event – the Bushveld Igneous Complex –
that pushed down on the sediments.b. quartzite, shale, dolomite c. Hartebeespoort Dam
Activity 4 (Learner’s Book, page 130)
1. The dip slope is on the left-hand side; the scarp slope is on the right-hand side.
2. fold mountains3. 30 million years ago4. Fossil prints and remains are preserved in the sediments that pile up
to form sedimentary rock. Igneous rock is formed from molten rock beneath the Earth’s surface. The remains of animals do not collect beneath the Earth’s surface. If they were submerged by subduction events, they would be destroyed by the heat and the pressure.
Activity 5 (Learner’s Book, page 133)
1. cuesta domes2. • The Richat Structure was formed by uplift. The top of the dome has
been worn away by erosion. The circle of cuesta ridges is formed by slow erosion of the resistant rock layers; and fast erosion of the less resistant rock layers.
72 S E C T I O N 2 • L E S S O N - B Y - L E S S O N
• The Vredefort Dome was formed by a meteorite impact. The meteorite pushed up layers of rock to form a dome in the centre of the crater. Erosion has produced cuestas; part of a circle of cuesta ridges remains.
3. A dome becomes a basin-like structure as its exposed top is worn away by erosion. It is worn away from the centre out. This makes a basin or hollow in its centre.
Informal assessment Activity 1• Write up the answers on the board. Ask learners to swap books with
a partner. • If you choose, you can ask learners to mark each other’s work according
to the mark allocation given in the Answers section. Ask those learners who got less than 12/16 for the activity to do the remedial activity (see the Remedial section below).
Activity 2• Write up the answers on the board. Ask learners to swap books with
a partner. • If you choose, you can ask them to mark each other’s work according
to the mark allocation given in the Answers section. Ask those learners who got less than 6/8 for the activity to do the remedial activity (see the Remedial section below).
Activity 3• Go through the answers with the class. Ask learners to offer answers.
Activity 4• Go through the answers with the class. Ask learners to offer answers.
Informally assess learners’ understanding of the concepts. You can gauge their understanding by the answers they give or the questions they ask.
Activity 5• Go through the answers with the class. Ask learners to offer answers. Ask
learners to assess whether they have copied answers from the text directly, or whether they have put together the answers in their own words.
Remedial/extensionRemedial: For those learners who struggled with Activity 1 and Activity 2, ask them to complete Worksheet 9 (pages 285–286) in the Resources section of this Teacher’s Guide. This activity is also useful revision for all learners.
Extension: • Ask learners to find out more about one of the geological structures
described in the features or shown in a photograph.• Ask learners to find out which are South Africa’s eight World Heritage
Sites. (Answers: Fossil Hominid Sites of Sterkfontein, Swartkrans and Kromdraai; iSimangaliso Wetland Park; Robben Island; uKhahlamba/Drakensberg Park; Mapungubwe Cultural Landscape; Cape Floral Region Protected Areas; Vredefort Dome; Richtersveld Cultural and Botanical Landscape.)
73M O D U L E 3 • G E O M O R P H O L O G Y : G E O G R A P H I C A L K N O W L E D G E
UNIT 3 Topography associated with massive igneous rocks
TERM 2, WEEK 3
Learner’s Book pages 134–143Duration: 4 hours
Curriculum and Assessment Policy Statement (CAPS) content
Topography associated with massive igneous rocks• Identification of batholiths, laccoliths, lopoliths, dykes and sills• Characteristics and processes associated with the development of granite
domes and tors
Resources• Learner’s Book pages 134–143• Websites (optional)
– For more information on the Bushveld Igneous Complex see: factoidz.com/the-bushvald-igneous-complex-of-south-africa/
– For more information on the Great Dyke of Zimbabwe see: factoidz.com/the-great-dyke-of-zimbabwe/
– For more information on Pilanesberg see: • www.ecotravel.co.za/game-nature-reserves/pilanesberg-national-
park/geology.htm• www.pilanesbergsafaris.com/pilanesberg_park.php
– For more information on Sibebe rock see: swazinet.com/sibebe-rock-swaziland
Preparation• Read through the unit and familiarise yourself with the content that you
will need to teach. Think about what learners may already know about the topics and any areas of difficulty that you think they might encounter.
Teaching the unit
Lesson 1
• Read through, or ask learners to read through the Unit 3 introductory paragraphs. Remind learners that they learnt about igneous intrusions in Grade 10.
• Begin the section, ‘Which landforms are produced by massive igneous intrusions?’ (page 134).
Activity 1• This is a revision-type activity on the different types of igneous intrusions.
• Work through the section on batholiths. They will feature again in the section on granite domes and tors.
• Begin the section on laccoliths and lopoliths.• Refer to Figure 3.3.2 of Tierra del Fuego and Figure 3.3.3 of the Great
Dyke of Zimbabwe. Point out that in the same way that the Zimbabwe lopolith can be mistaken for a dyke, the Chilean laccolith can be mistaken for a sill.
74 S E C T I O N 2 • L E S S O N - B Y - L E S S O N
Lesson 2
• Continue the section on laccoliths and lopoliths.
Activity 2• Read the feature, ‘The Bushveld Igneous Complex: A cluster of lopoliths’
(page 137).• In this activity, learners answer questions on the feature.
Lesson 3
• Work through the section on dykes.• Refer to Figure 3.3.5 of Bannerman’s Pass. Emphasise that in this
example, the dyke has worn away to form a gap.
Activity 3• Read the features, ‘The dolerite dykes of Namibia’ (page 138) and ‘The
ring dyke structure of Pilanesberg’ (page 138).• In this activity, learners answer questions on the two features.
• Work through the section on sills. • Refer to Figure 3.3.8. Point out that the ‘Tall One’ is the cliff formed by a
resistant sill.• Refer to Figure 3.3.9. Point out that the step-like terraces are formed
by sills.
Activity 4• Read the feature, ‘The dolerite pillars of the Valley of Desolation’
(page 140).• In this activity, learners answer questions on the feature.• Learners can finish this activity for homework.
Lesson 4
• If learners finished Activity 4 for homework, go through the answers with the class.
• Work through the section, ‘How do granite domes and tors form and what are their characteristics?’ (page 141).
• Remind learners that they learnt a bit about granite domes and tors in Grade 10. Ask them what they can remember about these geological features.
• Focus on Figure 3.3.11 which shows how a granite dome forms.• Focus on Figure 3.3.13 which shows how a tor forms.
Activity 5• Read the feature, ‘The bald heads of the Matopos’ (page 142). • In this activity, learners answer questions on the feature.
Answers Activity 1 (Learner’s Book, page 134)
There are many variations for acceptable definitions. Here are examples:• batholith – a deep, large, irregular shaped igneous intrusion• laccolith – a mushroom-shaped igneous intrusion• lopolith – a saucer-shaped igneous intrusion• dyke – an igneous intrusion that is perpendicular to the existing rock layers• sill – a flat sheet-like igneous intrusion
75M O D U L E 3 • G E O M O R P H O L O G Y : G E O G R A P H I C A L K N O W L E D G E
Activity 2 (Learner’s Book, page 137)
1. It is rich in mineral deposits (1), such as platinum. (1) South Africa has some of the best platinum deposits in the world.
2. 2 billion years (1)3. runny/silica-poor (1)4. Magaliesberg (1)
[5]
Activity 3 (Learner’s Book, page 139)
1. sticky/silica-rich (1)2. granite = the grey rock (1), dolerite = the black rock (1)3. A ring dyke structure is a set of dykes arranged in rings or concentric
circles. (1) It forms underneath some volcanoes and is exposed by erosion. (1)
4. fault (1)[6]
Activity 4 (Learner’s Book, page 141)
1. Karoo landscape (1)2. The dolerite columns were formed from a very thick sill (1) of jointed
dolerite (1) which weathered and eroded along its vertical cracks. (1)3. It is hard like iron (yster). (1)
[5]
Activity 5 (Learner’s Book, page 143)
1. The Matopos granite tors formed from a batholith – an igneous intrusion deep underground that cooled quickly (relatively speaking) and developed many joints or cracks. When the batholith was raised near the surface, erosion exposed the granite. Weathering took place along the joints, which divided the granite into blocks. Gradually, the blocks of granite eroded to form a stack of core stones.
2. A granite dome forms from a batholith that has cooled slowly and so does not develop many joints or cracks. As the batholith is raised to the surface, the granite expands, making it crack in curved layers near its surface. The rounded dome shape is produced by exfoliation weathering.
Informal assessment Activity 1• Go through the answers with the class. Ask learners to offer answers.
Activity 2• Ask learners to swap books with a partner and check each other’s work as
you go through the answers with the class.• If you choose, you can ask learners to mark their partner’s answers
according to the mark allocation given in the Answers section. Ask those learners who got less than 4/5 to do the remedial activity (see the Remedial section on page 76).
Activity 3• Ask learners to swap books with a partner and check each other’s work as
you go through the answers with the class.• If you choose, you can ask learners to mark their partner’s answers
according to the mark allocation given in the Answers section.

76 S E C T I O N 2 • L E S S O N - B Y - L E S S O N
Ask those learners who got less than 4/6 to do the remedial activity (see the Remedial section on page 76).
Activity 4• Ask learners to swap books with a partner and check each other’s work as
you go through the answers with the class.• If you choose, you can ask learners to mark their partner’s answers
according to the mark allocation given in the Answers section. Ask those learners who got less than 3/5 to do the remedial activity (see the Remedial section below).
Activity 5• Go through the answers with the class. Ask learners to offer answers.
Remedial/extensionRemedial: For those learners who struggled with Activity 2, Activity 3 and Activity 4, ask them to complete Worksheet 10 (pages 288–289) in the Resources section of this Teacher’s Guide. This activity is also useful revision for all learners.
Extension: • Ask learners to find out more about one of the geological structures
described in the features or shown in a photograph.• Let the learners complete Worksheet 11 (pages 290–292) in the Resources
section of this Teacher’s Guide. It draws on all the concepts in this module and focuses on Paarl Rock as a case study.
UNIT 4 Slopes
TERM 2, WEEK 4
Learner’s Book pages 144–151Duration: 4 hours
Curriculum and Assessment Policy Statement (CAPS) content
Slopes • Overview of South Africa’s topography• Types of slopes• Slope elements: crest, cliff (scarp slope, free face), talus (debris, scree
slope) and pediment• Characteristics of the slope elements: crest, cliff, talus and pediment• Slope development over time• The concept of slope retreat
Resources• Learner’s Book pages 144–151• Atlases• Websites (optional)
– For more information on South Africa’s topography see: myfundi.co.za/e/South_Africa’s_geography:_Physical_features
• Books (optional)– For advanced learners, for extension: The Morphology of the Earth
by Lester King • Access to computers and the Internet is useful for Activity 2

77M O D U L E 3 • G E O M O R P H O L O G Y : G E O G R A P H I C A L K N O W L E D G E
Preparation• Read through the unit and familiarise yourself with the content that you
will need to teach. Think about what learners may already know about the topics and any areas of difficulty that you think they might encounter.
Teaching the unit
Lesson 1
• Read through, or ask learners to read through, the Unit 4 introductory paragraph.
• Work through the section, ‘What are the main features of South Africa’s topography?’ (page 144). You can point out that the term ‘terrain’ is more or less interchangeable with the term ‘topography’. Terrain refers to the lie of the land.
• Focus on the relief maps in Figure 3.4.1 and Figure 3.4.2. Point out how the escarpment extends beyond South Africa in both the East and the West.
• Focus on Figure 3.4.3. Point out that this profile represents a cross-section of South Africa from West to East. It shows that the Great Escarpment is higher on the East side of the country than the West.
Activity 1• In this activity, learners answer questions on the two relief maps
(Figures 3.4.1 and 3.4.2).
Lesson 2
• Spend this lesson on Activity 2. If you have access to computers and the Internet, allow learners time to search for the answers for question 3 in Activity 2. Alternatively, learners could use atlases. They could also look for lists of mountains belonging to the Cape Fold Mountains and the Great Escarpment.
Activity 2• Read the feature, ‘South Africa’s Great Escarpment’ (page 146).• In this activity, learners answer questions on the Great Escarpment and
look up the names of mountains that form the Great Escarpment in other southern African countries.
Lesson 3
• Work through the section, ‘What are the different types of slopes?’ (page 147).
• Focus on Figure 3.4.6 which illustrates slopes.• Work through the section, ‘What are the elements of a slope and what
are their characteristics?’ (page 148).• Focus on Figure 3.4.7. Point out that the South African geologist,
Lester King, identified these four slope elements in Karoo landscapes in the 1950s.
• Point out the alternative terms for the cliff and the talus slope (see the Tip box). You can also point out that the crest with its convex slope is sometimes referred to as the waxing slope. (The term ‘waxing’ is also used for the growing moon. When it is bigger than half moon, both sides are convex in shape.)
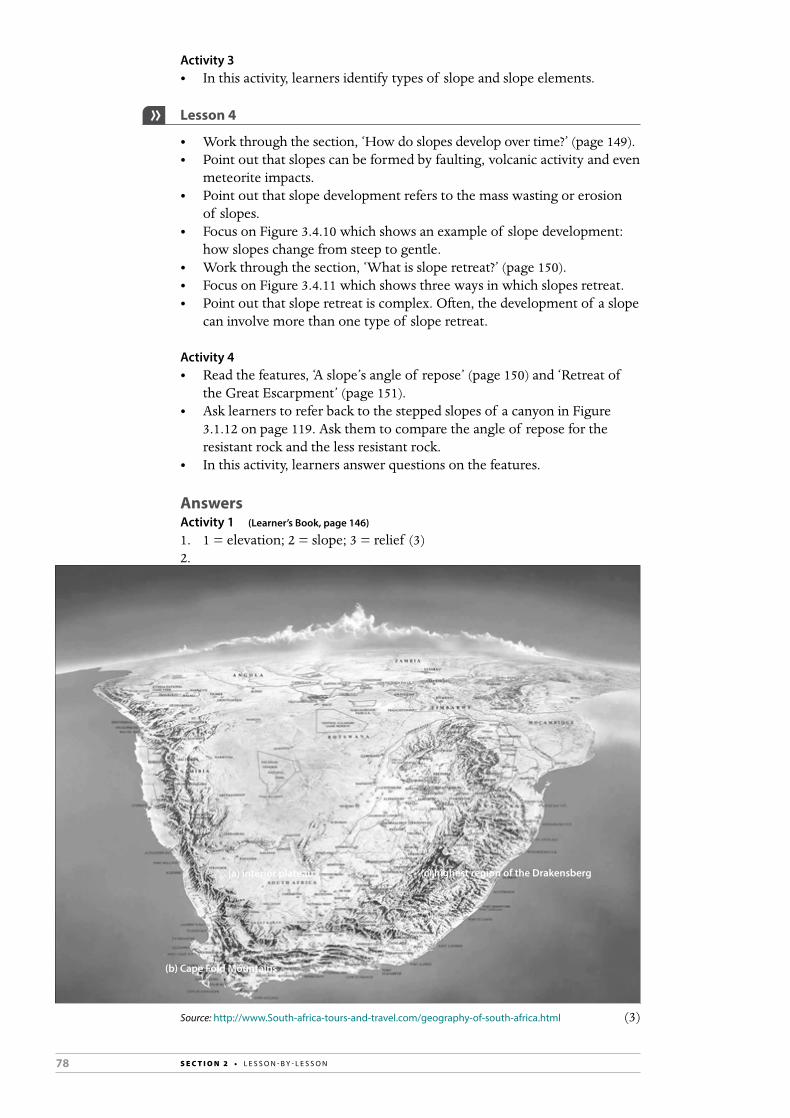
78 S E C T I O N 2 • L E S S O N - B Y - L E S S O N
Activity 3• In this activity, learners identify types of slope and slope elements.
Lesson 4
• Work through the section, ‘How do slopes develop over time?’ (page 149).• Point out that slopes can be formed by faulting, volcanic activity and even
meteorite impacts.• Point out that slope development refers to the mass wasting or erosion
of slopes.• Focus on Figure 3.4.10 which shows an example of slope development:
how slopes change from steep to gentle.• Work through the section, ‘What is slope retreat?’ (page 150).• Focus on Figure 3.4.11 which shows three ways in which slopes retreat.• Point out that slope retreat is complex. Often, the development of a slope
can involve more than one type of slope retreat.
Activity 4• Read the features, ‘A slope’s angle of repose’ (page 150) and ‘Retreat of
the Great Escarpment’ (page 151).• Ask learners to refer back to the stepped slopes of a canyon in Figure
3.1.12 on page 119. Ask them to compare the angle of repose for the resistant rock and the less resistant rock.
• In this activity, learners answer questions on the features.
AnswersActivity 1 (Learner’s Book, page 146)
1. 1 = elevation; 2 = slope; 3 = relief (3)2.
Source: http://www.South-africa-tours-and-travel.com/geography-of-south-africa.html (3)
(a) interior plateau
(b) Cape Fold Mountains
(c) highest region of the Drakensberg

79M O D U L E 3 • G E O M O R P H O L O G Y : G E O G R A P H I C A L K N O W L E D G E
3. a. Cederberg, Langeberg, Outeniqua Mountains (3) Others not listed on the map include the mountains of: Winterhoek,
Du Toitskloof, Simonsberg, Hottentots-Holland, Riviersonderend, Langkloof and Baviaanskloof. (See http://en.wikipedia.org/wiki/Cape_Fold_Belt for a full list. Note that the Overberg is a region, not a mountain range.)
b. Bushveld, Highveld, Middleveld (3)c. i. Middleveld (1)
ii. Bushveld (1)iii. Highveld (1)
[15]
Activity 2 (Learner’s Book, page 147)
1. The mountainous margin between southern Africa’s interior plateau and the coastal plain.
2. Kamiesberge, Roggeveld, Nuweveld, Suurberg, Stormberg, Drakensberg3. a. Serra da Chela
b. Khomas Hochland and Tsarisberge c. Chimanimani Mountainsd. Chimanimani Mountains and Nyanga Mountains
4. Mpumalanga
Activity 3 (Learner’s Book, page 148)
1. A = gentle; B = concave; C = convex; D = steep (4)2. a. butte (1)
b. 1 = crest; 2 = cliff; 3 = talus slope; 4 = pediment (4)c. dry/semi-arid (1)
[10]
Activity 4 (Learner’s Book, page 151)
1. slope decline (1)2. sandstone (1)3. 2 = 90°; 3 = 45° (these are approximate values) (2)4. Parallel retreat is the dominant form of slope retreat for the Drakensberg
because the mountain has retained its steep sides and flat top. (2)5. coastal plain (2) 6. a. 1,5 m per 1 000 years (1)
b. 1,5 mm per year (1)[10]
Informal assessmentActivity 1• Go through the answers with the class. Ask learners to offer answers. • If you choose, you can ask learners to mark their own answers according
to the mark allocation given in the Answers section. Ask those learners who got less than 10/15 to do the first remedial activity (see the Remedial section on page 80).
Activity 2• Go through the answers with the class. Ask learners to offer answers.
80 S E C T I O N 2 • L E S S O N - B Y - L E S S O N
Activity 3• Go through the answers with the class. Ask learners to offer answers. • If you choose, you can ask learners to mark their own answers according
to the mark allocation given in the Answers section. Ask those learners who got less than 6/10 to do the remedial activity (see the Remedial section below).
Activity 4• Go through the answers with the class. Ask learners to offer answers. • If you choose, you can ask learners to mark their own answers according
to the mark allocation given in the Answers section. Ask those learners who got less than 6/10 to do the remedial activity (see the Remedial section below).
Remedial/extensionRemedial: • For those learners who struggled with Activity 2, Activity 3 and
Activity 4, ask them to complete Worksheet 12 (pages 293–294) in the Resources section of this Teacher’s Guide. This activity is also useful revision for all learners.
• For learners who need extra practice with the concepts in this module let them complete Worksheet 13 (pages 295–297) in the Resources section of this Teacher’s Guide. This worksheet can also be used for revision purposes.
Extension: • Ask learners to find out more about South Africa’s topography
(see, for example, the suggested website under ‘Resources’ on page 76).• Ask advanced learners to find and browse through a copy of
The Morphology of the Earth by Lester King.
81M O D U L E 3 • G E O M O R P H O L O G Y : G E O G R A P H I C A L K N O W L E D G E
UNIT 5 Mass movements and human responses
TERM 2, WEEK 5
Learner’s Book pages 152–162Duration: 4 hours
Curriculum and Assessment Policy Statement (CAPS) content
Mass movements and human responses• Concept of mass movements• Kinds of mass movements: soil creep, solifluction, landslides, rock falls
and mud flows, and slumps• The impact of mass movements on people and the environment• Strategies to prevent or minimise the effects of mass movement – South
African case studies
Resources• Learner’s Book pages 152–162• Websites (optional)
– For a pdf on Slope Systems for advanced learners: earthds.info/pdfs/EDS_11.PDF
Preparation• Read through the unit and familiarise yourself with the content that you
will need to teach. Think about what learners may already know about the topics and any areas of difficulty that you think they might encounter.
Teaching the unit
Lesson 1
• Read through, or ask learners to read through, the Unit 5 introductory paragraph.
• Work through the section, ‘What is mass movement?’ (page 152). Learners should already be familiar with the term ‘mass wasting’, which was introduced in Unit 1.
• Talk learners through Figure 3.5.1.– Point out that mass wasting or mass movement takes place only on
slopes, not on flat land. – Point out that mass movement takes place on slopes only when
the downslope force contributed by gravity is greater than the resistance force.
– Resistance force/friction is the rubbing force between the loose material on the slope and the body/bulk of the slope. The resistance force holds material in place.
• Work through the section, ‘What factors cause mass movements?’ (page 152). Focus on Figure 3.5.2 which shows two ways in which slopes are oversteepened. The left-hand side diagrams show oversteepening of the slopes. The right-hand side diagrams show how mass movement takes place to stabilise the slopes.
Activity 1• This activity focuses on human modification of slopes.
82 S E C T I O N 2 • L E S S O N - B Y - L E S S O N
Lesson 2
• Work through the section, ‘What are the different kinds of mass movement?’ (page 154).
• Focus on Figure 3.5.4 which illustrates the different types of mass movement.
Activity 2• In this activity, learners identify and define different types of mass
movement.
Activity 3• Read the feature, ‘Soil fluction on Mount Kenya’ (page 157).• In this activity, learners answer questions on the feature. • Learners can do this activity for homework.
Lesson 3
• If learners did Activity 3 for homework, go through the answers with the class.
• Work through the section, ‘What is the impact of mass movement on people and the environment?’ (page 157). The focus for this lesson is on the case studies and feature.
Activity 4• Read the case studies, ‘Italy’s Vanjont Dam disaster’ (page 158) and
‘KwaZulu-Natal floods trigger mudslide’ (page 159) and the feature, ‘Submarine mass movements and megatsunamis’ (page 159).
• In this activity, learners look at the causes and effects of mass movements.• If necessary learners can finish this activity for homework.
Lesson 4
• If learners finished Activity 4 for homework, go through the answers with the class.
• Work through the section, ‘What strategies can be used to prevent or minimise the effects of mass movement?’ (page 160). Focus on the two case studies.
Activity 5• Read the case study, ‘Efforts to stop rock falls on Chapman’s Peak’
(page 160).• This is a class discussion activity. • If your learners don’t know Chapman’s Peak, help them answer question 1
by asking: Which two prestigious international events take place along this route? (Answer: The Cape Argus Cycle Tour and the Two Oceans Marathon.) Give clues if necessary.
Activity 6• Read the case study, ‘A landslide hazard map for South Africa’ (page 161).• In this activity, learners practise their map-reading/data-reading skills.• Learners can complete this activity for homework.
83M O D U L E 3 • G E O M O R P H O L O G Y : G E O G R A P H I C A L K N O W L E D G E
AnswersActivity 1 (Learner’s Book, page 153)
1. A = excavated for quarrying; B = for construction of roads or passes; C = for the building of hillside homes – often homes with a view; D = for farming – steep slopes are sometimes terraced (formed into steps)
2. a. by changing the angle of the slope by cutting into its sideb. the slope is made up of strong rockc. wet conditions; water makes loose debris heavier and lubricates it,
making it slide more easily
Activity 2 (Learner’s Book, page 156)
1. A = slump; B = mudflow; C = rock fall; D = soil creep; E = landslide; F = soil fluction (6)
2. • slump: part of the slope drops in one movement/all together along a spoon-shaped slippage plane
• mudflow: silt/clay debris and water flows fast downslope in a river valley• rock fall: rock falls from the cliff face• soil creep: particles of soil and rock slowly move downslope as they
expand and contract with repeated cycles of freezing and thawing or wetting and drying
• landslide: a common form of mass movement – a combination of a slump and a debris flow
• soil fluction: the top layer of water-saturated/soaked soil flows slowly downhill in polar regions or high altitude regions where there is permafrost (6 × 2) (12)
[18]Activity 3 (Learner’s Book, page 157)
1. • permafrost: soil water that is permanently frozen• soil fluction/solifluction: the movement of the top layer of water-
saturated soil in cold regions2. flow movement3. slow movement4. from slowest to fastest: soil creep, soil fluction, mud flow, landslide,
rock fall
Activity 4 (Learner’s Book, page 159)
1. weak slope materials – the slopes were weak limestone in clay; saturation of slope materials with water – the rising water levels in the dam soaked the slopes; modification of slopes by humans – engineers dammed the river that ran through the valley slopes
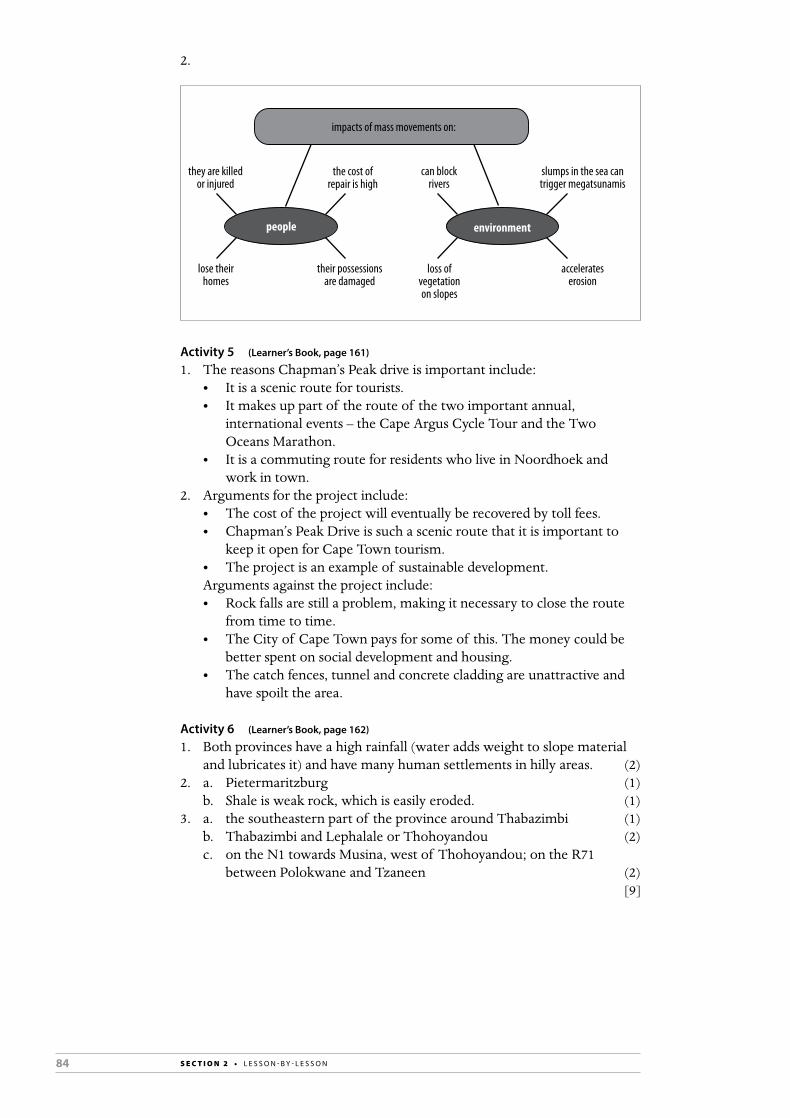
84 S E C T I O N 2 • L E S S O N - B Y - L E S S O N
2.
impacts of mass movements on:
people environment
they are killedor injured
the cost ofrepair is high
lose theirhomes
their possessionsare damaged
loss ofvegetationon slopes
accelerateserosion
can blockrivers
slumps in the sea cantrigger megatsunamis
Activity 5 (Learner’s Book, page 161)
1. The reasons Chapman’s Peak drive is important include:• It is a scenic route for tourists.• It makes up part of the route of the two important annual,
international events – the Cape Argus Cycle Tour and the Two Oceans Marathon.
• It is a commuting route for residents who live in Noordhoek and work in town.
2. Arguments for the project include:• The cost of the project will eventually be recovered by toll fees.• Chapman’s Peak Drive is such a scenic route that it is important to
keep it open for Cape Town tourism.• The project is an example of sustainable development.
Arguments against the project include:• Rock falls are still a problem, making it necessary to close the route
from time to time.• The City of Cape Town pays for some of this. The money could be
better spent on social development and housing.• The catch fences, tunnel and concrete cladding are unattractive and
have spoilt the area.
Activity 6 (Learner’s Book, page 162)
1. Both provinces have a high rainfall (water adds weight to slope material and lubricates it) and have many human settlements in hilly areas. (2)
2. a. Pietermaritzburg (1) b. Shale is weak rock, which is easily eroded. (1)3. a. the southeastern part of the province around Thabazimbi (1)
b. Thabazimbi and Lephalale or Thohoyandou (2)c. on the N1 towards Musina, west of Thohoyandou; on the R71
between Polokwane and Tzaneen (2)[9]

85M O D U L E 3 • G E O M O R P H O L O G Y : G E O G R A P H I C A L K N O W L E D G E
Informal assessmentActivity 1• Go through the answers with the class. Ask learners to offer answers.
Activity 2• Go through the answers with the class. • If you choose, you can mark this activity yourself according to the mark
allocation given in the Answers section. Ask those learners who got less than 13/18 to do the remedial activity (see the Remedial section below).
Activity 3• Go through the answers with the class. Ask learners to offer answers.
Activity 4• Go through the answers with the class. For question 2, write up an
example mind-map on the board.
Activity 5• Informally assess learners on their contribution to the discussion.
Activity 6• Go through the answers with the class. • If you choose, you can ask learners to mark their answers according
to the mark allocation given in the Answers section. Ask those learners who got less than 6/9 to do the remedial activity (see the Remedial section below).
Remedial/extensionRemedial:For learners who struggled with Activity 2 and Activity 6, let them complete Worksheet 14 (page 298) in the Resources section of this Teacher’s Guide. This worksheet can also be used for revision purposes for all learners.
Extension:Let the learners complete Worksheet 15 (pages 299–300) in the Resources section of this Teacher’s Guide.
86 S E C T I O N 2 • L E S S O N - B Y - L E S S O N
TERM 2Learner’s Book pages 163–189Duration: 10 hours
GEOMORPHOLOGY: GEOGRAPHICAL
SKILLS AND TECHNIQUES
MODULE 4
This module focuses on geographical skills and techniques related to geomorphology.
Topographical maps and aerial photographs show many different landform features. GIS also allows us to zoom in on landform features and view them at high resolution.
Curriculum and Assessment Policy Statement (CAPS) content
Topographic maps • Contours and landforms• Cross-sections on 1:50 000 topographic maps• Vertical exaggeration• Inter-visibility• Gradient
Geographical Information Systems (GIS) • Spatially referenced data• Spatial and spectral resolution• Different types of data: line, point, area and attribute• Raster and vector data• Capturing different types of data from existing maps, photographs,
fieldwork or other records on tracing paper
Fieldwork • Observation• Collecting and recording data• Processing, collating and presenting fieldwork findings
Key geographical skills and techniques• using verbal, quantitative and symbolic data forms such as text, pictures,
graphs, tables, diagrams and maps• practising field observation and mapping• applying communication, thinking, practical and social skills• processing, interpreting, and evaluating data • working co-operatively and independently
Key words/conceptscontour line; altitude; contour interval; valley; spur; river valley; hill; ridge; saddle/ass; neck; cliff; waterfall; mesa; butte; escarpment; cross-section; relief; vertical exaggeration (VE); intervisibility; gradient; vertical interval; spatially referenced data; attribute data; spatial analysis; resolution; spatial resolution; pixel; spectral resolution; vector model; raster model; spatial information
87M O D U L E 4 • G E O M O R P H O L O G Y : G E O G R A P H I C A L S K I L L S A N D T E C H N I Q U E S
UNIT 1 Topographic maps
TERM 2, WEEKS 6–7
Learner’s Book pages 164–178Duration: 6 hours
Curriculum and Assessment Policy Statement (CAPS) content
Topographic maps • Contours and landforms• Cross-sections on 1:50 000 topographic maps• Vertical exaggeration• Inter-visibility• Gradient
Resources• Learner’s Book pages 164–178• Websites (optional)
– For information on topographic maps: http://geography.about.com/od/topographicmaps/Topographic_
Maps.htm– For information on contours and landforms: http://www.geojeff.org/course-materials/physical-geology-lab/lab-
8-mapping/landforms-on-contour-maps/depressions.html
Preparation• Read through the unit and familiarise yourself with the content that you
will need to teach. Think about what the learners may already know about the topics and any areas of difficulty that you think they might encounter.
Teaching the unit
Lesson 1
• For the first five minutes of the lesson, brainstorm with the learners to find out what they know about contour lines and landforms.
• Work through the introductory part of the section, ‘How are contour lines and landforms identified on topographical maps?’ and ‘What are contour lines?’ (page 164).
• Draw attention to the description of contours lines and to Figure 4.1.1. Show learners how to interpret height and sea level.
Activity 1• Allow learners to do the activity in class.• Help learners find different heights on the map using the contour lines.• Go through the answers with the learners.
Lesson 2
• Work through the material on how different slopes are represented on topographical maps. Allow questions and comments from the learners.
88 S E C T I O N 2 • L E S S O N - B Y - L E S S O N
• Ask the learners to work in pairs and to look at other topographical maps in the Learner’s Book. Let them identify and describe steep, gradual, convex and concave slopes on these maps.
Lesson 3
• Remind learners that landforms are physical features that are represented by different contour patterns on a map.
• Work through the section, ‘What are landforms?’ (page 166) with the learners. Allow questions as you go.
Activity 2• Allow learners to begin the activity in class and then complete it as
homework.• Facilitate the answering of any questions the learners may have and assist
learners who need help.• Help learners distinguish between the different landforms.
Lesson 4
• Go through the answers to Activity 2 with the class.• For the next five minutes of the lesson, brainstorm with the learners to
find out what they know about cross-sections on 1:50 000 topographic maps.
• Work through the section, ‘How is a cross-section drawn from a 1:50 000 topographical map?’ (page 172). Draw the learners’ attention to the example of a cross-section in Figure 4.1.18.
• Work through the section, ‘How is vertical exaggeration measured on a topographical map?’ (page 174).
• Emphasise the importance of vertical exaggeration by using the cross-section in Figure 4.1.19.
• Take your time working through the method of calculating vertical exaggeration and do additional examples with the learners if necessary.
Lesson 5
Allow this lesson for the completion of Activity 3. This will allow you to assist learners who need it.
Activity 3• Let learners work on the activity in pairs.• Once everyone has completed it, go through the answers with the class
and explain how they are arrived at.
Lesson 6
• Work through the sections, ‘How is intervisibility measured on a topographical map?’ and ‘How is gradient measured on a topographical map?’ (page 176).
• Take your time working through method of the measuring gradient and do additional examples with the learners if necessary.
Activity 4• Let learners work on the activity in pairs.• Once everyone has completed it, go through the answers with the class
and explain how they are arrived at.

89M O D U L E 4 • G E O M O R P H O L O G Y : G E O G R A P H I C A L S K I L L S A N D T E C H N I Q U E S
AnswersActivity 1 (Learner’s Book, page 164)
1. Contour lines are lines drawn on a map to join land and places of equal altitude (height above sea level).
2. 20 m3. hill4. 339,7 m5. Contour line is steeper at A than at B.
Activity 2 (Learner’s Book, page 172)
1. gentle/gradual slope2. uphill3. Gradual to flat land allows for the development of settlements in the
southeast.4. contour pattern is circular5. hill6. Southwest. Contour lines are decreasing in a southwest direction.
Activity 3 (Learner’s Book, page 174)
1. 1 785,6 m2.
x
y
scale = 1:50 000
1580
1600
1620
1640
1660
1680
1700
verti
cal h
eight
1 cm
= 20
m
1720
1740
1760
Cross section from trig. beacon 358to spot height 1744
3. VE = VS ___ HS
= 1:2 000 _______ 1:50 000
= 1 _____ 2 000
______ 1 ______ 50 000
= 1 _____ 2 000 × 50 000 ______ 1
= 25 times4. valley5. gentle/gradual slope6. The rivers are flowing from high lying areas to gradual to flat land.7. summer rainfall
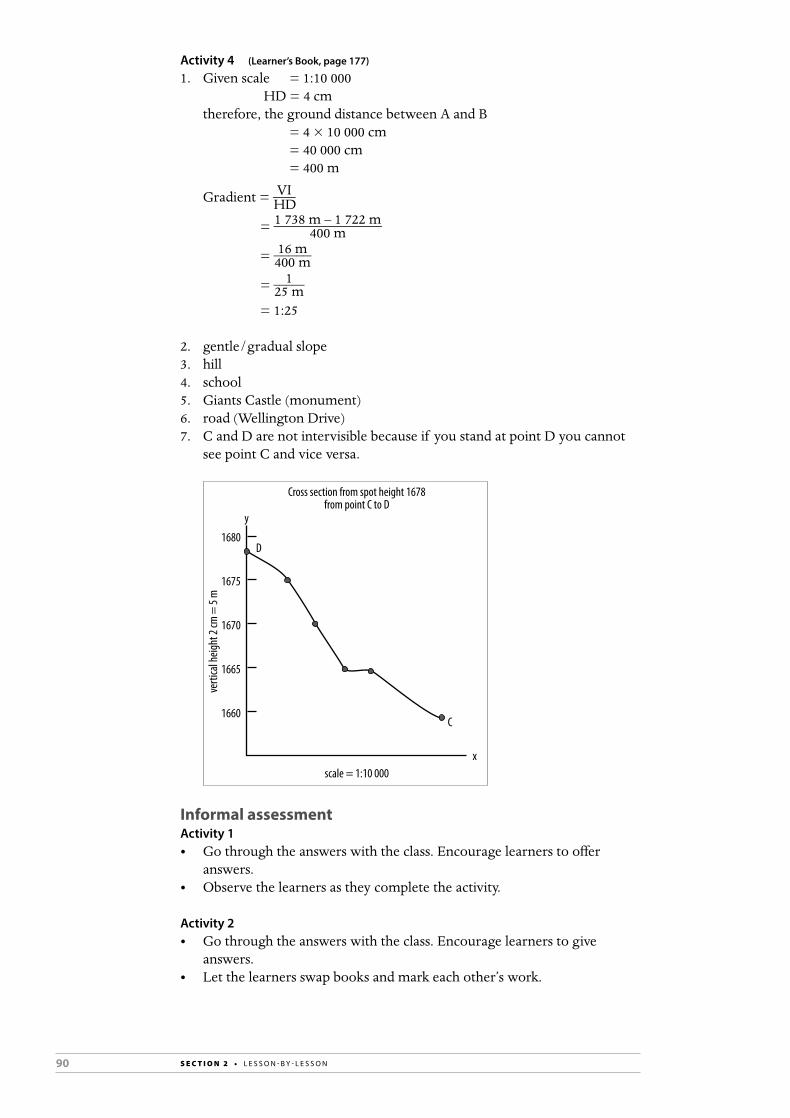
90 S E C T I O N 2 • L E S S O N - B Y - L E S S O N
Activity 4 (Learner’s Book, page 177)
1. Given scale = 1:10 000 HD = 4 cm therefore, the ground distance between A and B = 4 × 10 000 cm = 40 000 cm = 400 m
Gradient = VI ___ HD
= 1 738 m – 1 722 m _______________ 400 m
= 16 m _____ 400 m
= 1 _____ 25 m
= 1:25
2. gentle/gradual slope3. hill4. school5. Giants Castle (monument)6. road (Wellington Drive)7. C and D are not intervisible because if you stand at point D you cannot
see point C and vice versa.
x
y
scale = 1:10 000
1660
1665
1670
1675
1680
verti
cal h
eight
2 cm
= 5
m
Cross section from spot height 1678from point C to D
D
C
Informal assessment Activity 1• Go through the answers with the class. Encourage learners to offer
answers. • Observe the learners as they complete the activity.
Activity 2• Go through the answers with the class. Encourage learners to give
answers. • Let the learners swap books and mark each other’s work.
91M O D U L E 4 • G E O M O R P H O L O G Y : G E O G R A P H I C A L S K I L L S A N D T E C H N I Q U E S
Activity 3• Go through the answers with the class. Encourage learners to give
answers. • Let the learners swap books and mark each other’s work.• Observe the learners as they complete the activity.
Activity 4• Let the learners swap books and mark each other’s work.• Go through the answers with the class.
Remedial/extensionRemedial:• Ask learners to do an extra cross-section and gradient calculation from
the map in Figure 4.1.2 on page 165.
Extension:• Ask learners to research and bring along any landforms pictures and
explanations that they can find.
UNIT 2 Geographical Information Systems (GIS)
TERM 2, WEEK 7
Learner’s Book pages 179–186Duration: 2 hours
Curriculum and Assessment Policy Statement (CAPS) content
Geographical Information Systems (GIS) • Spatially referenced data• Spatial and spectral resolution• Different types of data: line, point, area and attribute• Raster and vector data• Capturing different types of data from existing maps, photographs,
fieldwork or other records on tracing paper
Resources• Learner’s Book pages 179–186• Tracing paper• Websites (optional):
– For information about spatially referenced data: http://www.geoscience.org.za/index.php?option=com_content&tas
k=view&id=206&Itemid=100 – For information about GIS data models, raster and vector models: http://bgis.sanbi.org/GIS-primer/page_19.htm
Preparation• Read through the unit and familiarise yourself with the content that you
will need to teach. Think about what learners may already know about the topics and any areas of difficulty that you think they might encounter.
92 S E C T I O N 2 • L E S S O N - B Y - L E S S O N
Teaching the unit
Lesson 1
• Work through the section, ‘What is spatially referenced data?’ (page 179). Allow for questions.
• Spend some time examining Figure 4.2.1 with the learners as it provides an authentic example of spatially referenced data.
• Make sure the learners understand the difference between spatially referenced data and attribute data.
• Spend some time examining Figure 4.2.2 with the learners as it provides an authentic example of attribute data.
• Work through the section, ‘Why do we use GIS for spatial analysis?’ (page 180).
Activity 1• This activity gets learners to focus on the importance of spatially
referenced data.• Go through the activity but allow learners to complete it as homework.
• Work through the section, ‘What is spatial and spectral resolution?’ (page 181).
• Make sure that learners understand the difference between spatial and spectral resolution. After you have worked through the material, you could ask the learners to turn to a partner and quickly explain the difference.
• Explain the difference between low spatial resolution by examining Figures 4.2.4 and 4.2.5.
Activity 2• Allow learners to begin the activity in class and then complete it as
homework.• Remind them to make use of the information in the unit as they
complete the activity.
Lesson 2
• Go through the answers to Activities 1 and 2 with the class.• Work through the section, ‘What is the significance of different types of
data?’ (page 183) with the learners.
Activity 3 • Complete this activity as a whole class activity that is done verbally.
• Work through the section, ‘What is the difference between raster and vector data models?’ (page 184) with the learners.
• Emphasise the advantages of the vector model and the disadvantages of the raster model.
• Work through the section on capturing different types of data using tracing paper. Focus particularly on the capturing of information.
Activity 4• Allow learners to complete this activity as homework.• They should complete it individually as a summarising activity.
93M O D U L E 4 • G E O M O R P H O L O G Y : G E O G R A P H I C A L S K I L L S A N D T E C H N I Q U E S
Activity 5• Divide the learners into pairs. • Hand out the tracing paper.• Remind them to make sure that they insert key pieces of information
(like the outline) so that they will be able to place the sheets of paper accurately on top of each other for analysis later.
AnswersActivity 1 (Learner’s Book, page 180)
1. Spatial data identifies the geographic location of features on Earth. Attribute data represents non-spatial data and is descriptive data.
2. Spatially referenced data is data that identifies the geographic location of features on Earth and encodes this to be data referenced.
3. Spatial analysis allows us to geographically link data or it allows data from multiple sources to be integrated.
4. A database provides certain information, e.g. the spatial layers assist town planners in planning for the future.
Activity 2 (Learner’s Book, page 182)
1. Spatial resolution refers to the size of objects and the details of an image. Spectral resolution refers to the specific wavelength intervals in the electromagnetic spectrum at which a satellite sensor can record data.
2. It is context-driven.3. Satellite imagery is context-driven and high spatial; and spectral
resolution images can be used for problem-solving.4. Both Landsat and Spot sensor record high spectral resolution.5. a. The South Western Cape’s relief ranges from open low mountains, to
high mountains and plains with high hills, to moderate hills.b. Gauteng’s relief ranges from tablelands with moderate relief to
considerate relief.c. The coastline of South Africa consists of hills and mountains.
Activity 3 (Learner’s Book, page 183)
1. A line feature would be any road shown on the picture.2. A point would be the trees on the NE of the picture.3. An area would be any of the residential areas shown in the picture.4. An attribute of the residential area in the NE corner of the picture would
be the high population density. High population density is a characteristic of the residential area.
Activity 4 (Learner’s Book, page 186)
1. GIS data is collected from maps, aerial photographs and satellite remote sensing.
2. Data must be analysed, manipulated and processed to provide accurate locations for geographical features.
3. Landforms, physical relief and vegetation differ according to texture and colour in a GIS model.

94 S E C T I O N 2 • L E S S O N - B Y - L E S S O N
Informal assessment Activity 1• Go through the answers with the class. Encourage learners to give answers. • Let the learners swap books and mark each other’s work.• Observe whether learners could apply the skills and concepts they
were taught.
Activity 2• Go through the answers with the class. Encourage learners to give answers. • Let the learners swap books and mark each other’s work.• Go through the answers with the class.
Activity 3• Go through the answers with the class. Encourage learners to
offer answers.
Activity 4• Go through the answers with the class. Encourage learners to
offer answers.
Activity 5• Ask the learners to complete the activity, move around the classroom
observing and listening to them. Provide assistance where it is required. Notice which learners struggle with this activity.
Remedial/extensionRemedial:Ask learners to complete Worksheet 16 (pages 301–302) in the Resources section of this Teacher’s Guide.
Extension:• Ask learners to research or find out more about GIS. • Ask learners to collect GIS pictures or maps. You can use these pictures
or maps to create revision activities for the learners or remedial activities for learners who struggle with GIS.
UNIT 3 Fieldwork
TERM 2, WEEK 8
Learner’s Book pages 187–189Duration: 2 hours
Curriculum and Assessment Policy Statement (CAPS) content
Fieldwork • Observation• Collecting and recording data• Processing, collating and presenting fieldwork findings
Resources• Learner’s Book pages 187–189• Websites (optional):
– For information about fieldwork/research: http://en.wikipedia.org/wiki/Field_research and
http://geographyfieldwork.com/Fieldwork%20Methodology.htm
95M O D U L E 4 • G E O M O R P H O L O G Y : G E O G R A P H I C A L S K I L L S A N D T E C H N I Q U E S
Preparation• Read through the unit and familiarise yourself with the content that you
will need to teach. Think about what learners may already know about the topics and any areas of difficulty that you think they might encounter.
• You will need to arrange the fieldtrip for data collection in Lesson 2. Make sure that you have the learners’ parents’/guardians’ written consent.
• Make sure that learners prepare their data collection sheets before Lesson 2.
Teaching the unitSet aside two lessons for the fieldwork in this unit. Learners will also need to complete some of the activities outside of class time.
Lesson 1
• For the next five minutes of the lesson, brainstorm with the learners to find out what they know about fieldwork.
• Read through the information and activities in the whole unit with the learners making sure that they understand what is expected of them.
• Point out to learners that fieldwork has three very important components: a) observation; b) collecting and recording data; c) processing, collating and presenting fieldwork findings.
Activity 1• Work on this activity with the whole class.• Allow the learners to write notes of the answers to the questions as they
will need this information in Activity 5.
Activity 2• Let learners work in pairs or small groups to complete this activity.• Allow learners to begin the activity in class and then complete it as
homework.
Activity 3• Allow learners to begin the activity in class and then complete it as
homework. They should work in the same groups as they were in for Activity 2.
• They will need their questions for data collection in the next lesson.
Lesson 2
In this lesson the learners focus on data collection. You will need to take them on a fieldtrip to do this.
Activity 4• Before you leave on the fieldtrip, ask learners to read through the steps in
this activity to remind them what needs to be accomplished.
Activity 5• Learners will need to complete this activity as homework.• Allow them about 1 week before they have to submit their reports.
96 S E C T I O N 2 • L E S S O N - B Y - L E S S O N
Informal assessment Observe learners as they work through their fieldwork. Note whether they are able to:• formulate a hypothesis• develop a set of questions that will help them to collect the information
they require• collect information through observation and interviewing• compile a short report on their findings• make recommendations based on their findings.
Geography in Practice 2 Geomorphology
TERM 2, WEEK 8
Learner’s Book pages 190–193
Geography topic: Geomorphology (skills and techniques associated with topographic maps and orthophoto maps)
Resources• Learner’s Book pages 190–193 • Mathematical instruments
Background• This task focuses on Modules 3 and 4 of Study & Master Geography
Grade 11 and therefore should be scheduled for after the learners have completed these modules. (See Year plan on pages 6–15.)
• The skills covered in this task are reading, analysing and interpreting maps; working with concepts, date, procedures related to GIS; and evaluating, expressing and supporting a point of view.
• Allow 1 hour of class time for the learners to begin the task. Learners who have not completed the task in class, should do so for homework.
• The task in the Learner’s Book is out of 30 marks. You will need to convert this to a mark out of 20 for contribution of this assessment to the year mark. (See ‘Recording and reporting’ on page 201.)
Preparing the learners• Remind the learners that they should work on their own and answer
all questions.• Let them read through the task and ask questions about any part of it
that they do not understand.• Remind them that they can consult Modules 3 and 4 in the Learner’s
Book if they need to.• Give them a due date for their completed tasks.
The taskYou will find Geography in Practice 2 on pages 190–193 of the Learner’s Book. You will find a marking memorandum is on the next page under the heading, ‘Assessment guidance’.
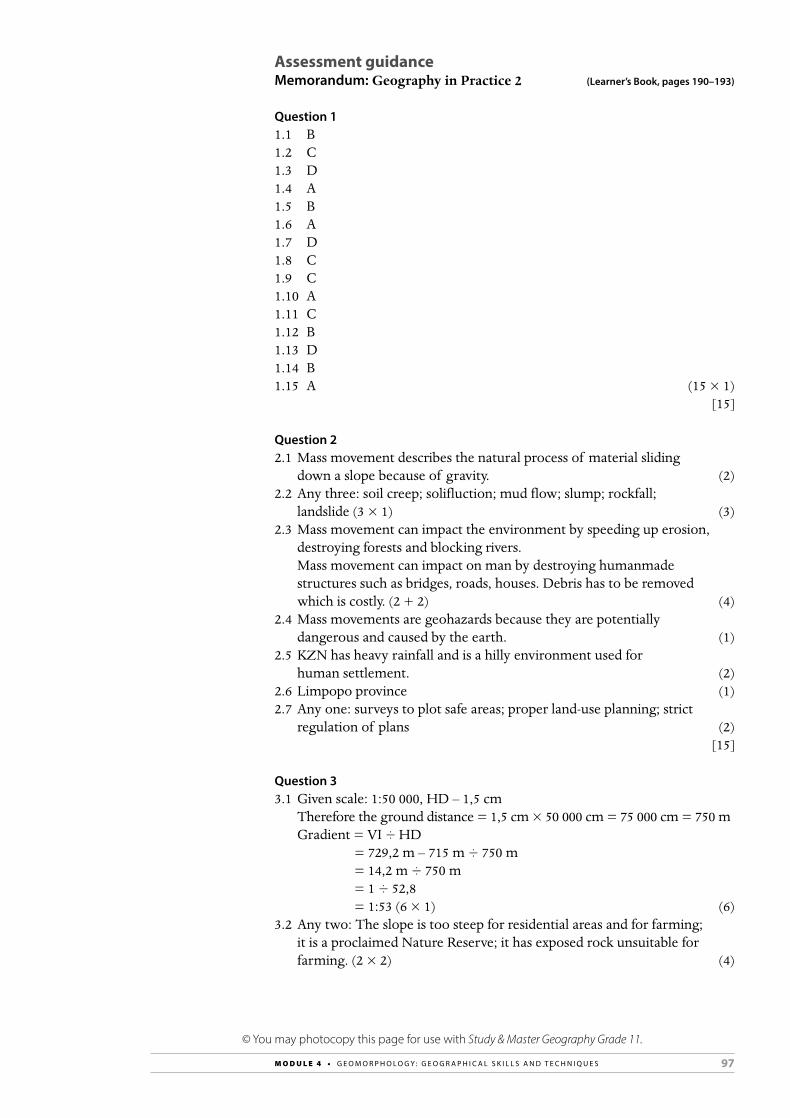
97M O D U L E 4 • G E O M O R P H O L O G Y : G E O G R A P H I C A L S K I L L S A N D T E C H N I Q U E S
Assessment guidanceMemorandum: Geography in Practice 2 (Learner’s Book, pages 190–193)
Question 11.1 B1.2 C1.3 D1.4 A1.5 B1.6 A1.7 D1.8 C1.9 C1.10 A1.11 C1.12 B1.13 D1.14 B1.15 A (15 × 1)
[15]
Question 22.1 Mass movement describes the natural process of material sliding
down a slope because of gravity. (2)2.2 Any three: soil creep; solifluction; mud flow; slump; rockfall;
landslide (3 × 1) (3)2.3 Mass movement can impact the environment by speeding up erosion,
destroying forests and blocking rivers. Mass movement can impact on man by destroying humanmade
structures such as bridges, roads, houses. Debris has to be removed which is costly. (2 + 2) (4)
2.4 Mass movements are geohazards because they are potentially dangerous and caused by the earth. (1)
2.5 KZN has heavy rainfall and is a hilly environment used for human settlement. (2)
2.6 Limpopo province (1)2.7 Any one: surveys to plot safe areas; proper land-use planning; strict
regulation of plans (2) [15]
Question 33.1 Given scale: 1:50 000, HD – 1,5 cm Therefore the ground distance = 1,5 cm × 50 000 cm = 75 000 cm = 750 m Gradient = VI ÷ HD = 729,2 m – 715 m ÷ 750 m = 14,2 m ÷ 750 m = 1 ÷ 52,8 = 1:53 (6 × 1) (6)3.2 Any two: The slope is too steep for residential areas and for farming;
it is a proclaimed Nature Reserve; it has exposed rock unsuitable for farming. (2 × 2) (4)
© You may photocopy this page for use with Study & Master Geography Grade 11.
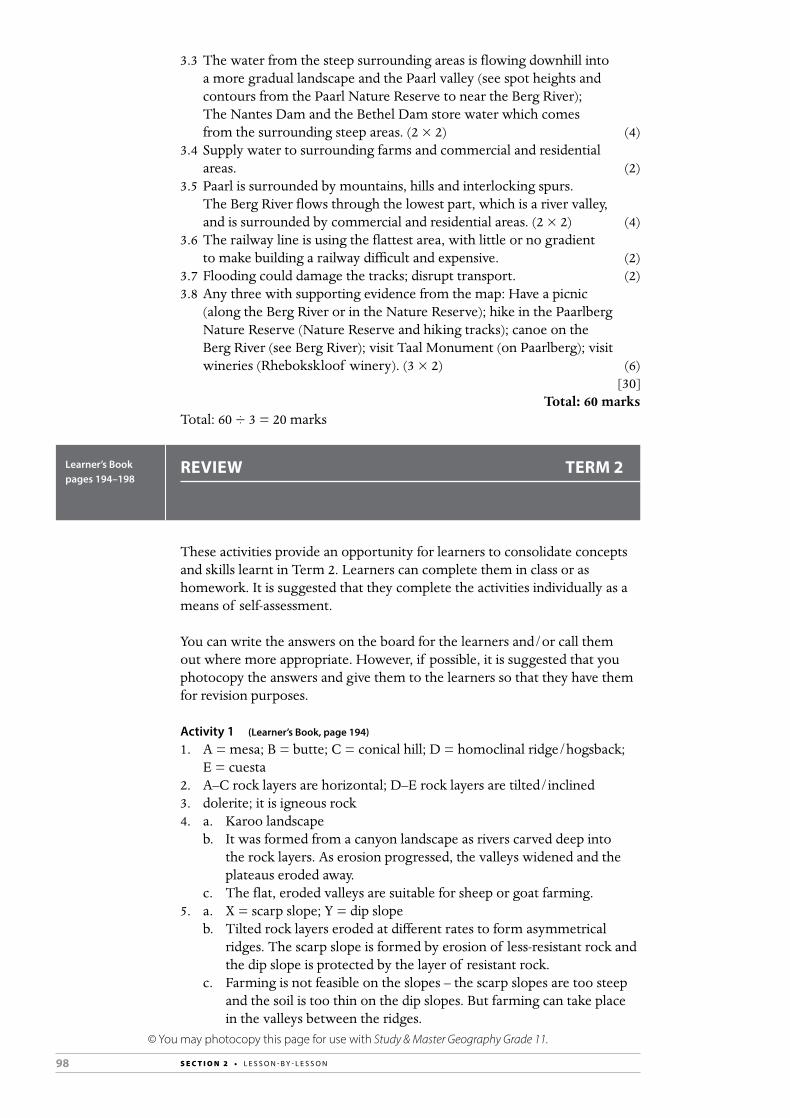
98 S E C T I O N 2 • L E S S O N - B Y - L E S S O N
3.3 The water from the steep surrounding areas is flowing downhill into a more gradual landscape and the Paarl valley (see spot heights and contours from the Paarl Nature Reserve to near the Berg River); The Nantes Dam and the Bethel Dam store water which comes from the surrounding steep areas. (2 × 2) (4)
3.4 Supply water to surrounding farms and commercial and residential areas. (2)
3.5 Paarl is surrounded by mountains, hills and interlocking spurs. The Berg River flows through the lowest part, which is a river valley, and is surrounded by commercial and residential areas. (2 × 2) (4)
3.6 The railway line is using the flattest area, with little or no gradient to make building a railway difficult and expensive. (2)
3.7 Flooding could damage the tracks; disrupt transport. (2)3.8 Any three with supporting evidence from the map: Have a picnic
(along the Berg River or in the Nature Reserve); hike in the Paarlberg Nature Reserve (Nature Reserve and hiking tracks); canoe on the Berg River (see Berg River); visit Taal Monument (on Paarlberg); visit wineries (Rhebokskloof winery). (3 × 2) (6)
[30]Total: 60 marks
Total: 60 ÷ 3 = 20 marks
Learner’s Book pages 194–198
REVIEW TERM 2
These activities provide an opportunity for learners to consolidate concepts and skills learnt in Term 2. Learners can complete them in class or as homework. It is suggested that they complete the activities individually as a means of self-assessment.
You can write the answers on the board for the learners and/or call them out where more appropriate. However, if possible, it is suggested that you photocopy the answers and give them to the learners so that they have them for revision purposes.
Activity 1 (Learner’s Book, page 194)
1. A = mesa; B = butte; C = conical hill; D = homoclinal ridge/hogsback; E = cuesta
2. A–C rock layers are horizontal; D–E rock layers are tilted/inclined3. dolerite; it is igneous rock4. a. Karoo landscape
b. It was formed from a canyon landscape as rivers carved deep into the rock layers. As erosion progressed, the valleys widened and the plateaus eroded away.
c. The flat, eroded valleys are suitable for sheep or goat farming.5. a. X = scarp slope; Y = dip slope
b. Tilted rock layers eroded at different rates to form asymmetrical ridges. The scarp slope is formed by erosion of less-resistant rock and the dip slope is protected by the layer of resistant rock.
c. Farming is not feasible on the slopes – the scarp slopes are too steep and the soil is too thin on the dip slopes. But farming can take place in the valleys between the ridges.
© You may photocopy this page for use with Study & Master Geography Grade 11.
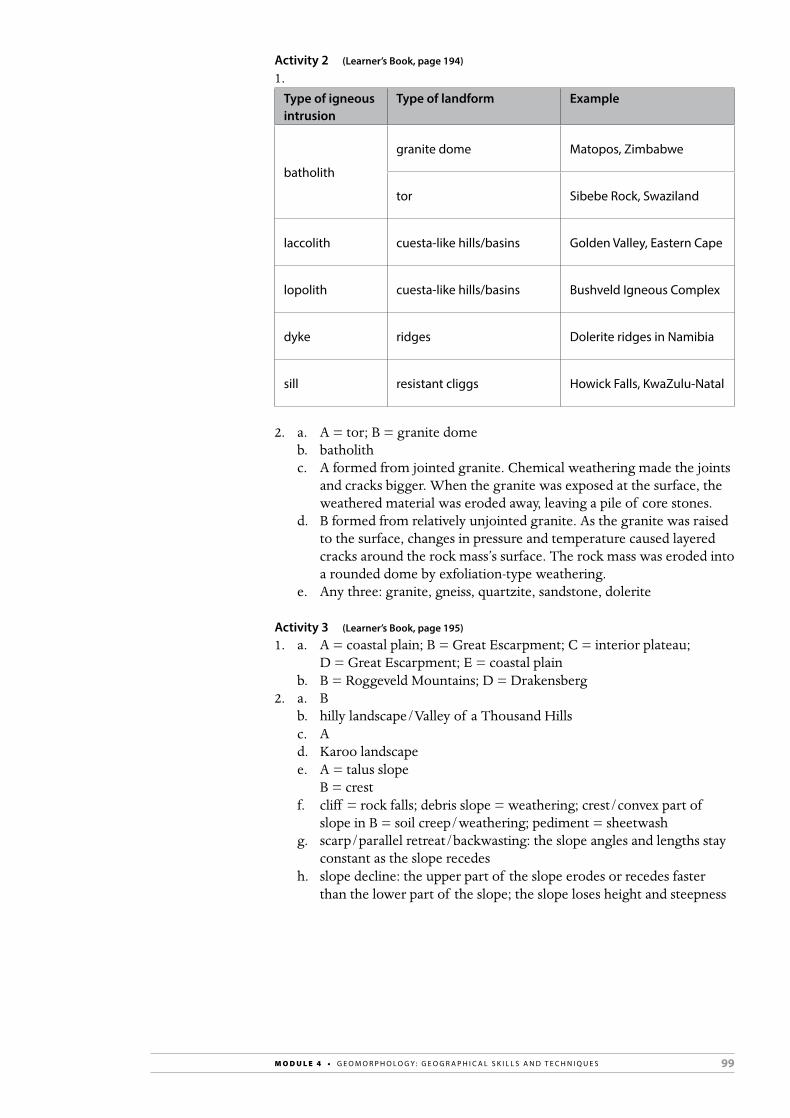
99M O D U L E 4 • G E O M O R P H O L O G Y : G E O G R A P H I C A L S K I L L S A N D T E C H N I Q U E S
Activity 2 (Learner’s Book, page 194)
1. Type of igneous intrusion
Type of landform Example
batholith
granite dome Matopos, Zimbabwe
tor Sibebe Rock, Swaziland
laccolith cuesta-like hills/basins Golden Valley, Eastern Cape
lopolith cuesta-like hills/basins Bushveld Igneous Complex
dyke ridges Dolerite ridges in Namibia
sill resistant cliggs Howick Falls, KwaZulu-Natal
2. a. A = tor; B = granite domeb. batholithc. A formed from jointed granite. Chemical weathering made the joints
and cracks bigger. When the granite was exposed at the surface, the weathered material was eroded away, leaving a pile of core stones.
d. B formed from relatively unjointed granite. As the granite was raised to the surface, changes in pressure and temperature caused layered cracks around the rock mass’s surface. The rock mass was eroded into a rounded dome by exfoliation-type weathering.
e. Any three: granite, gneiss, quartzite, sandstone, dolerite
Activity 3 (Learner’s Book, page 195)
1. a. A = coastal plain; B = Great Escarpment; C = interior plateau; D = Great Escarpment; E = coastal plain
b. B = Roggeveld Mountains; D = Drakensberg2. a. B
b. hilly landscape/Valley of a Thousand Hills c. A
d. Karoo landscape e. A = talus slope
B = crestf. cliff = rock falls; debris slope = weathering; crest/convex part of
slope in B = soil creep/weathering; pediment = sheetwashg. scarp/parallel retreat/backwasting: the slope angles and lengths stay
constant as the slope recedesh. slope decline: the upper part of the slope erodes or recedes faster
than the lower part of the slope; the slope loses height and steepness
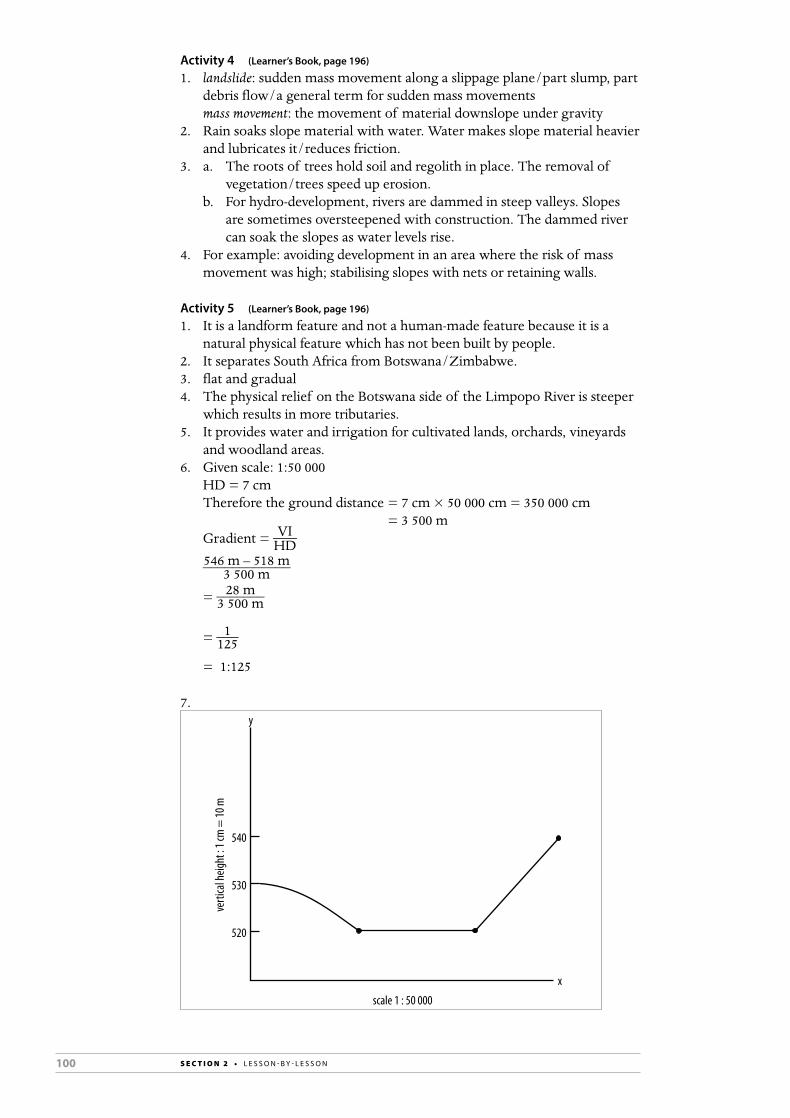
100 S E C T I O N 2 • L E S S O N - B Y - L E S S O N
Activity 4 (Learner’s Book, page 196)
1. landslide: sudden mass movement along a slippage plane/part slump, part debris flow/a general term for sudden mass movementsmass movement: the movement of material downslope under gravity
2. Rain soaks slope material with water. Water makes slope material heavier and lubricates it/reduces friction.
3. a. The roots of trees hold soil and regolith in place. The removal of vegetation/trees speed up erosion.
b. For hydro-development, rivers are dammed in steep valleys. Slopes are sometimes oversteepened with construction. The dammed river can soak the slopes as water levels rise.
4. For example: avoiding development in an area where the risk of mass movement was high; stabilising slopes with nets or retaining walls.
Activity 5 (Learner’s Book, page 196)
1. It is a landform feature and not a human-made feature because it is a natural physical feature which has not been built by people.
2. It separates South Africa from Botswana/Zimbabwe.3. flat and gradual4. The physical relief on the Botswana side of the Limpopo River is steeper
which results in more tributaries.5. It provides water and irrigation for cultivated lands, orchards, vineyards
and woodland areas.6. Given scale: 1:50 000
HD = 7 cmTherefore the ground distance = 7 cm × 50 000 cm = 350 000 cm = 3 500 mGradient = VI ____ HD
546 m – 518 m ____________ 3 500 m
= 28 m _______ 3 500 m
= 1 ___ 125
= 1:125
7.
540
530
520
verti
cal h
eight
: 1 cm
= 10
m
x
y
scale 1 : 50 000
101M O D U L E 4 • G E O M O R P H O L O G Y : G E O G R A P H I C A L S K I L L S A N D T E C H N I Q U E S
8. VE = VS ___ HS
1:10000 _______ 1:50 000 or 1 ______ 10 000
______ 1 ______ 50 000
= 1 __ 10 × 500 ___ 1 or 1 ___ 100 × 50 000 ______ 1
= 50 times
9. hill10. landing strip11. flat gradual land, large open space12. Zimbabwe
Activity 6 (Learner’s Book, page 198)
1. Vector data model. Lines, polygons and areas have been used to represent data on the map.
2. The physical relief is steep and mountainous. Mountains are represented in their true or natural colour.
3. The contour lines are far apart representing gradual to flat land.4. Spatial referencing provides the exact position or location of spatial data,
e.g. the dam. 5. The dam in the centre of the mapped area supplies water to its
surrounding ecosystems, which supports environmental development of the mapped area.
102 S E C T I O N 2 • P H Y S I C A L E D U C AT I O N
TERM 3Learner’s Book pages 200–280Duration: 27 hours
DEVELOPMENT GEOGRAPHY:
GEOGRAPHICAL KNOWLEDGE
MODULE 5
The vocabulary used with development geography, especially the investigation of reasons for economic growth, levels of development, and differences between countries in levels of economic development, is studied. The spatial context covers South African examples that are local, regional and national, as well as SADC areas, the African continent, and the world.
Curriculum and Assessment Policy Statement (CAPS) content
The concept of development • Terminology associated with development, such as developed,
developing, more economically developed countries (MEDCs) and less economically developed countries (LEDCs), and industrialised countries
• The concept of development: economic, social, sustainable, appropriate scale and spatial aspects
• Economic, social and demographic indicators of development: GNP, GDP, HDI, Gini-coefficient, life expectancy and infant mortality
• Examples to illustrate differences in development from local, regional, and global contexts
Frameworks for development • Factors that affect development, including: access to resources,
energy, history, trade imbalances, population growth, education and training, natural resource limitations and environmental degradation (note: learners need to explore the complexity and inter-related nature of these factors)
• Development models: free market models, such as Rostow’s model with its limitations and criticisms, core and periphery models with their application at different scales; sustainability models with their economic, social, and environmental elements
• Community based development, including approaches to rural and urban development (with examples from around the world)
Trade and development • International trade and world markets: commodities traded and
terms of trade• Types of trading relationships, including: free trade, trade barriers,
subsidies and fair trade• The concept of globalisation and its impact on development• Export-led development – critically examined (with examples from
around the world)

103M O D U L E 5 • D E V E L O P M E N T G E O G R A P H Y : G E O G R A P H I C A L K N O W L E D G E
Development issues and challenges • The role of women in development: gender issues related to power,
access to resources and attitudes• The effect of development on the environment• The role of the state and business in development in South Africa,
including central control by the state, weak state control and public or private partnerships
Role of development aid • Concept of development aid and development co-operation• Types of development aid – technical, conditional, humanitarian• Impact of aid on development (including case studies of development
aid – positive and negative)
Key geographical skills and techniques• using verbal, quantitative and symbolic data forms such as text, pictures,
graphs, tables, diagrams and maps• practising field observation and mapping, interviewing people,
interpreting sources and working with statistics• identifying questions and issues• collecting and structuring information• processing, interpreting and evaluating data• making decisions and judgements• deciding on a point of view• suggesting solutions to problems• working co-operatively and independently
Key words/conceptsdeveloped; developing; North-South divide; emerging market; economic development; social development; sustainable; economies of scale; spatial aspects; Gross Domestic Product (GDP); GDP per capita; Gross National Product (GNP); Human Development Index (HDI); Gini Coefficient; life expectancy; Infant Mortality Rate (IMR); resource; renewable resource; non-renewable resource; energy; Balance of Trade; Trade Imbalance; surplus; deficit; capital; fertility rate; free market; controlled/command market; international trade; commodity; comparative advantage; terms of trade; free trade; import quota; tariff; trade agreement; government subsidy; protectionist; trade bloc; sweatshop; globalisation; multinational corporation (MNC); brain-drain; factors of production; South-South trade; diversification; privatisation; public-private partnership; conditional aid; bilateral aid; multilateral aid
UNIT 1 The concept of development
TERM 3, WEEKS 1–2
Learner’s Book pages 201–220Duration: 7 hours
Curriculum and Assessment Policy Statement (CAPS) content
The concept of development • Terminology associated with development, such as developed,
developing, more economically developed countries (MEDCs) and less economically developed countries (LEDCs), and industrialised countries
104 S E C T I O N 2 • L E S S O N - B Y - L E S S O N
• The concept of development: economic, social, sustainable, appropriate scale and spatial aspects
• Economic, social and demographic indicators of development: GNP, GDP, HDI, Gini Coefficient, life expectancy and infant mortality
• Examples to illustrate differences in development from local, regional, and global contexts
Resources• Learner’s Book pages 201–220• Atlases• Compasses• Websites (optional):
– For information on terminology and the concept of development, see: en.wiki.org/wiki/Economic_development; www.webdictionary.co.ul/definition-phy?query=development; www.thefreedictionary.com/development; www.ocw.mit.edu/Economics.MIT
– For information on economic, social and demographic indicators of development, see: www.data.worldbank.org/data-catalog/world development indicators; www.info.gov.za/view/DownloadFileAction? Id=137217; www.mercycorp.org; www.hdr.undp.org
Preparation• Read through the unit and familiarise yourself with the content that you
will need to teach. Think about what learners may already know about the topics and any areas of difficulty that you think they might encounter.
Teaching the unit
Lesson 1
• Read through, or ask learners to read through the Module 5 Introduction paragraph. The terms, factors, models, types of trade, issues that face development, and the role of aid, are the key areas of this module. Write them on the board and discuss them with the learners. You can ask them to make mind-maps using the key ideas, and share these. Summarise their points on the board as an introduction to development geography.
• Draw attention to the photograph (page 200). Ask the learners why the picture was used – to show the global reach of multinationals such as Coca Cola (an American company) operating in South Africa – with all the wealth and power that a multinational company has at its disposal, contrasted with the relative poverty of the people in the picture. It shows differences of levels of development in one country.
• Work through the opening paragraph of Unit 1 and begin the section, ‘What terminology is associated with development?’ (page 201).
• Refer to the maps, Figures 5.1.1–5.1.3. Use an atlas if necessary to name the countries that are shaded.
• Locate the EAGLEs using an atlas; this will relate to Figure 5.1.4 as well.• Refer to the bar graph, Figure 5.1.4. The emerging countries are predicted
to have a faster rate of growth from 2010–2020 than the G7 countries. Explain that developments in education, wider job opportunities, salaries and higher standards of living, as well as global advertising and market penetration by multinationals, have created a demand for goods in developing countries. Export-driven economic growth and investment in the country by multinationals has also increased GDP for the EAGLEs.
105M O D U L E 5 • D E V E L O P M E N T G E O G R A P H Y : G E O G R A P H I C A L K N O W L E D G E
Lesson 2
• Allow learners to use this lesson to complete Activity 1 and then go through the answers with them.
Activity 1• Let the learners work on this activity in pairs or individually.
Lesson 3
• Work through the section, ‘What does the concept ‘development’ mean?’ (page 205). Allow time for questions from the learners.
• Use an atlas to locate the SADC countries (Figure 5.1.5). Ask learners if anyone has visited a SADC country or knows someone from there. Point out those countries that most of the class have some information about, and those countries that are least known. Try to figure out with the class what the least known SADC member countries would have to do to become better known by South Africans.
• Use an atlas and refer to Figure 5.1.5. Find the geographical boundaries of each country. Start with South Africa, then go on to other Sub-Saharan African countries. Then find the spatial aspects of the eight regional economic communities, such as the SADC.
• Explain the importance of creating regional unions for trade and development and bargaining power. Advantages would be united power, freedom of movement of goods and people, and less time spent at border posts and customs; possible disadvantages could be economic unions grouping together against a hostile state.
• Discuss the multiplier effect by using the image of a stone thrown into a pool: the stone is the economic investment, and the ripples refer to the spreading of the effect of wealth through the economy (or water).
• The ‘poverty cycle’, Figure 5.1.7, can be broken by inserting either money, or infrastructural development, or education and skills training, or jobs.
Activity 2• Allow learners to begin the activity in class and then complete it as
homework.
Lesson 4
• Go through the answers to Activity 2 with the class. Ask for ways in which the ‘circle of poverty’ can be broken; sketch the diagram on the board and correct the homework.
• Read through economic, social and demographic indicators of development. Remind them of the use of an indicator in a car: to show which direction you are travelling. In a country, the economic, social and demographic indicators show where the country is headed.
• Refer to an atlas to locate the countries in Figure 5.1.8 and Table 5.1.1.
Activity 3• Do this activity as a class. Allow learners to answer the questions verbally.
• Work through the information on GNP and HDI.
Activity 4• Go through this activity with the learners so that they understand what is
expected of them. Set it as a homework task.

106 S E C T I O N 2 • L E S S O N - B Y - L E S S O N
• Work through the information on the Gini Coefficient.• Refer to Figure 5.1.9. Explain that HDI indicators may be lower (or
higher) than they anticipate for the regions of the world shown, because the wealth is not shared amongst all (or is).
• Draw a rough sketch of the Gini Coefficient, Figure 5.1.11, on the board. On the curve, place a number of points which you can label from A to E. Ask learners to describe the levels of equality for people living in countries A to E until they grasp the concept.
Activity 5• Allow learners to begin the activity in class and then complete it
as homework.• They could work in pairs or individually.
Lesson 5
• Go through the answers to Activities 4 and 5 with the class.
• Work through the information on life expectancy and IMR.• Write the headings, ‘economic, social and demographic’ on the board.
Ask the learners to categorise GNP, GDP, HDI, Gini Coefficient, life expectancy and infant mortality under the given headings. Discuss reasons for their choices and correct if necessary.
• Refer to Figure 5.1.12. Ask learners if there are any surprises in countries ranked on the graph in terms of levels of inequality.
• Refer to Table 5.1.3 (page 214). Work out the percentage change in infant mortality in developing and developed countries between 1990 and 2009. Comment on the changes shown in the table.
Activity 6• This activity draws on the material covered thus far in the unit. It
provides an opportunity for learners to work on a case study. • Allow the rest of the lesson for the learners to work on this activity.• They can work in pairs or individually.• If they cannot complete the activity in class time, they should do so
for homework.
Lesson 6
• Go through the answers to Activity 6 with the class.• Work through the information on local differences in development.• Refer to Figure 5.1.15 and the examples from your geographic area, of
differences in levels of development. Emphasise some of the things to think about: housing, street lights, pavements, access to schools, hospitals and, transport and shops.
Activity 7• In this activity learners summarise information and then use this
information to interpret photographs in the context of development.• Go through this activity with the learners so that they understand what is
expected of them. • Allow learners to begin the activity in class and then complete it as
homework.
• Work through the section, ‘Regional differences in development’ (page 217).
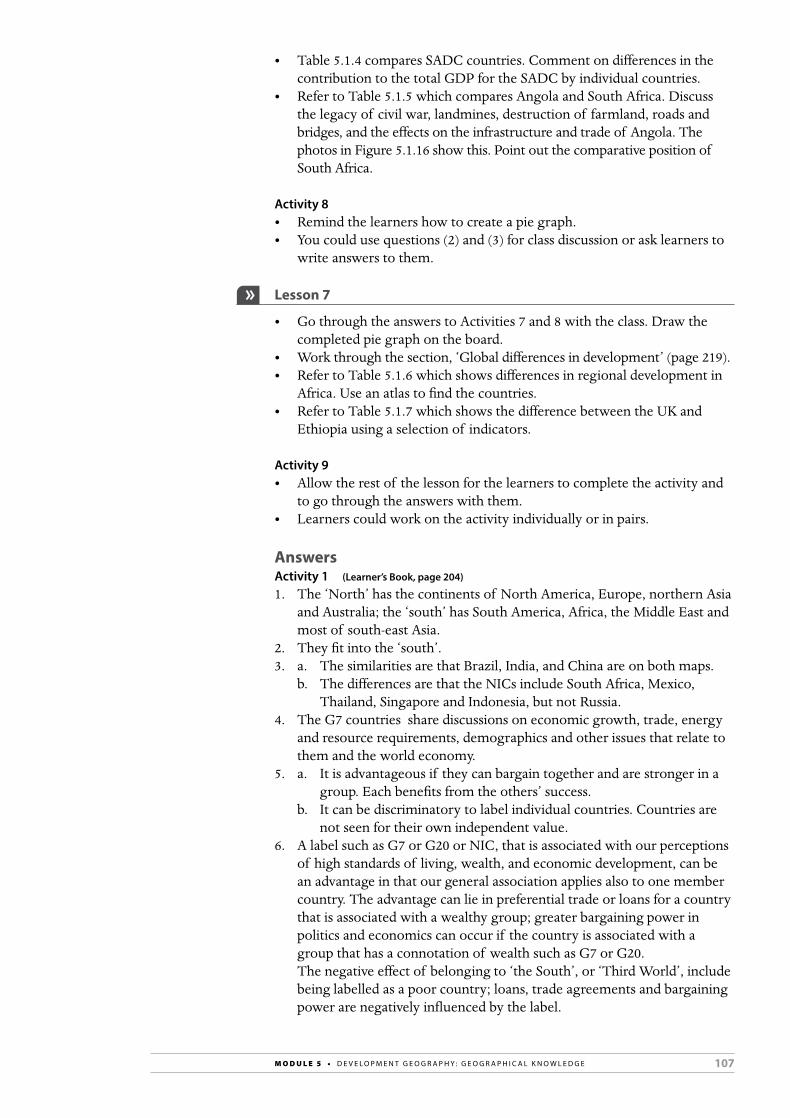
107M O D U L E 5 • D E V E L O P M E N T G E O G R A P H Y : G E O G R A P H I C A L K N O W L E D G E
• Table 5.1.4 compares SADC countries. Comment on differences in the contribution to the total GDP for the SADC by individual countries.
• Refer to Table 5.1.5 which compares Angola and South Africa. Discuss the legacy of civil war, landmines, destruction of farmland, roads and bridges, and the effects on the infrastructure and trade of Angola. The photos in Figure 5.1.16 show this. Point out the comparative position of South Africa.
Activity 8• Remind the learners how to create a pie graph.• You could use questions (2) and (3) for class discussion or ask learners to
write answers to them.
Lesson 7
• Go through the answers to Activities 7 and 8 with the class. Draw the completed pie graph on the board.
• Work through the section, ‘Global differences in development’ (page 219).• Refer to Table 5.1.6 which shows differences in regional development in
Africa. Use an atlas to find the countries.• Refer to Table 5.1.7 which shows the difference between the UK and
Ethiopia using a selection of indicators.
Activity 9• Allow the rest of the lesson for the learners to complete the activity and
to go through the answers with them.• Learners could work on the activity individually or in pairs.
AnswersActivity 1 (Learner’s Book, page 204)
1. The ‘North’ has the continents of North America, Europe, northern Asia and Australia; the ‘south’ has South America, Africa, the Middle East and most of south-east Asia.
2. They fit into the ‘south’.3. a. The similarities are that Brazil, India, and China are on both maps. b. The differences are that the NICs include South Africa, Mexico,
Thailand, Singapore and Indonesia, but not Russia.4. The G7 countries share discussions on economic growth, trade, energy
and resource requirements, demographics and other issues that relate to them and the world economy.
5. a. It is advantageous if they can bargain together and are stronger in a group. Each benefits from the others’ success.
b. It can be discriminatory to label individual countries. Countries are not seen for their own independent value.
6. A label such as G7 or G20 or NIC, that is associated with our perceptions of high standards of living, wealth, and economic development, can be an advantage in that our general association applies also to one member country. The advantage can lie in preferential trade or loans for a country that is associated with a wealthy group; greater bargaining power in politics and economics can occur if the country is associated with a group that has a connotation of wealth such as G7 or G20.
The negative effect of belonging to ‘the South’, or ‘Third World’, include being labelled as a poor country; loans, trade agreements and bargaining power are negatively influenced by the label.
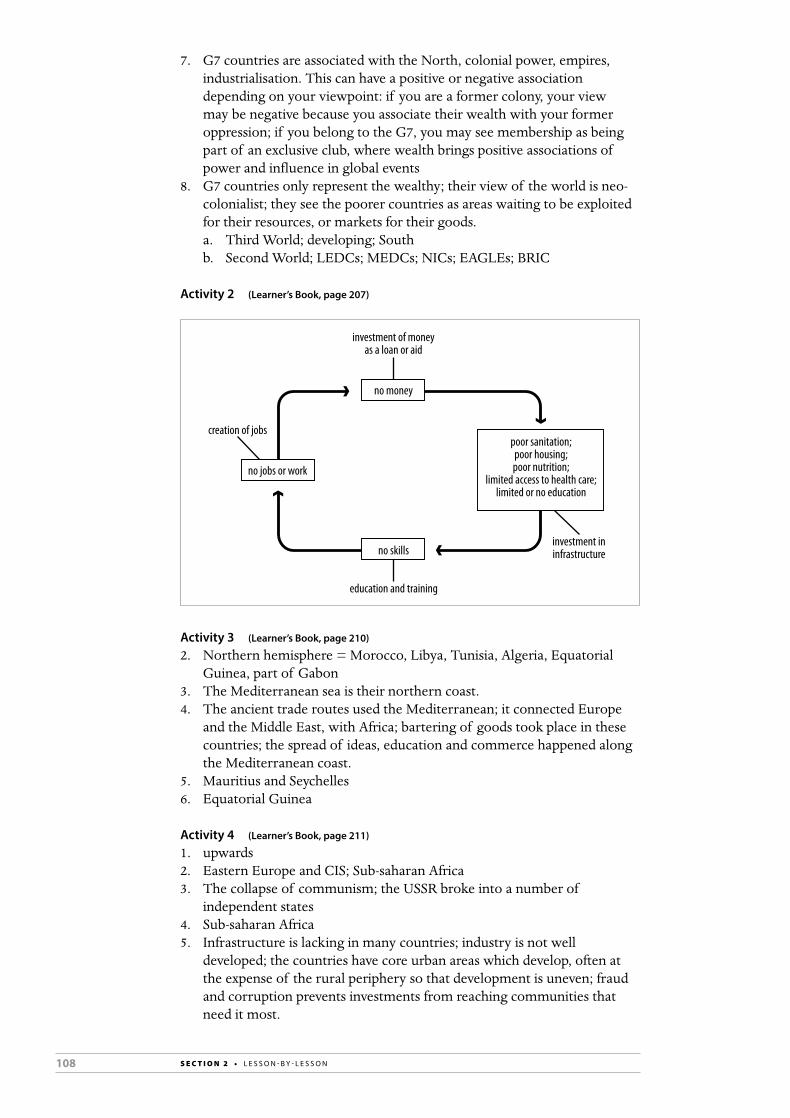
108 S E C T I O N 2 • L E S S O N - B Y - L E S S O N
7. G7 countries are associated with the North, colonial power, empires, industrialisation. This can have a positive or negative association depending on your viewpoint: if you are a former colony, your view may be negative because you associate their wealth with your former oppression; if you belong to the G7, you may see membership as being part of an exclusive club, where wealth brings positive associations of power and influence in global events
8. G7 countries only represent the wealthy; their view of the world is neo-colonialist; they see the poorer countries as areas waiting to be exploited for their resources, or markets for their goods.
a. Third World; developing; Southb. Second World; LEDCs; MEDCs; NICs; EAGLEs; BRIC
Activity 2 (Learner’s Book, page 207)
no money
no jobs or work
no skills
poor sanitation;poor housing;poor nutrition;
limited access to health care;limited or no education
creation of jobs
investment of moneyas a loan or aid
education and training
investment ininfrastructure
Activity 3 (Learner’s Book, page 210)
2. Northern hemisphere = Morocco, Libya, Tunisia, Algeria, Equatorial Guinea, part of Gabon
3. The Mediterranean sea is their northern coast.4. The ancient trade routes used the Mediterranean; it connected Europe
and the Middle East, with Africa; bartering of goods took place in these countries; the spread of ideas, education and commerce happened along the Mediterranean coast.
5. Mauritius and Seychelles6. Equatorial Guinea
Activity 4 (Learner’s Book, page 211)
1. upwards2. Eastern Europe and CIS; Sub-saharan Africa3. The collapse of communism; the USSR broke into a number of
independent states4. Sub-saharan Africa5. Infrastructure is lacking in many countries; industry is not well
developed; the countries have core urban areas which develop, often at the expense of the rural periphery so that development is uneven; fraud and corruption prevents investments from reaching communities that need it most.

109M O D U L E 5 • D E V E L O P M E N T G E O G R A P H Y : G E O G R A P H I C A L K N O W L E D G E
Activity 5 (Learner’s Book, page 213)
1. It rose slowly until the mid 1970s before dropping.2. Income inequality increased in Mexico after 1970.3. Norway, closely followed by Bulgaria.4. These countries show a rise in income inequality over the years.5. it possibly means that job opportunities are more difficult to get; and
that social welfare is not favouring the poor sufficiently to raise their level of income
Activity 6 (Learner’s Book, page 216)
1. a. GDP or GNP statistics are figures which, if adjusted through purchasing power parity and to one common currency, the US$, can be used to compare countries in terms of economic development.
b. GDP does not focus sufficiently on the importance of humans and their needs and welfare.
2. Source A: Human development is more important than economic development.
Source B: Development includes the quality of life for humans. Source C: GDP does not focus on human needs.3. GDP is not a fair measurement for LEDCs. It does not take into account
the distribution of wealth in the community, but looks only at the sum total.
4. Gini Coefficient5. HDI; Infant mortality; life expectancy6. Infant mortality is high where economic development is low, because a
poor infrastructure means little education, or health care, and a lack of good nutrition.
7. Discuss the answers given by the learners; there are no right or wrong answers. Learners should be able to motivate a reason for their answer.
Activity 7 (Learner’s Book, page 217)
1.–3.
Indicators Rural development Urban development
Social health clinics parks
schools skyscrapers
electricity universities
Economic roads, bridges airports
agricultural machinery commercial areas
large farms new developments
4. Photograph A has tin roofs; housing is close together; there is no area for recreation; there appears to be little view. Photograph B shows a suburb with proper roads; there are houses of different sizes, with different roofs; there are also views.
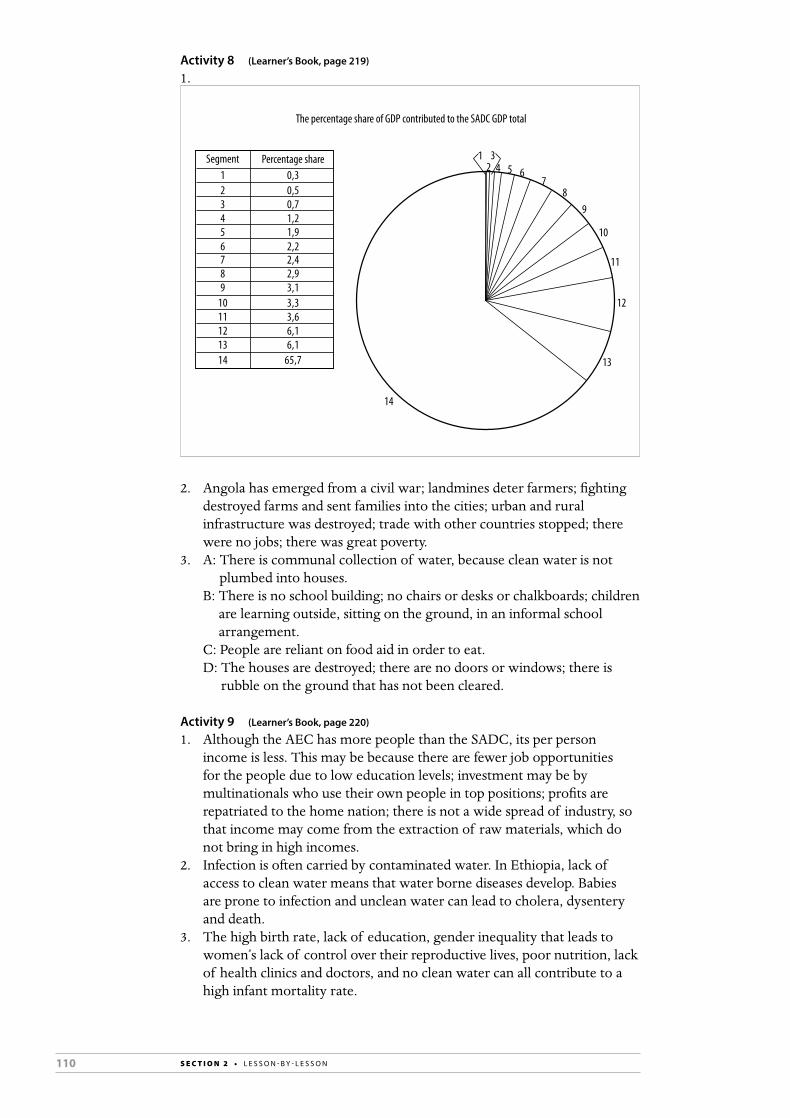
110 S E C T I O N 2 • L E S S O N - B Y - L E S S O N
Activity 8 (Learner’s Book, page 219)
1.
The percentage share of GDP contributed to the SADC GDP total
12
34 5 6
78
9
10
11
12
13
14
Segment
21
3456789
1011121314
0,50,3
0,71,21,92,22,42,93,13,33,66,16,1
65,7
Percentage share
2. Angola has emerged from a civil war; landmines deter farmers; fighting destroyed farms and sent families into the cities; urban and rural infrastructure was destroyed; trade with other countries stopped; there were no jobs; there was great poverty.
3. A: There is communal collection of water, because clean water is not plumbed into houses.
B: There is no school building; no chairs or desks or chalkboards; children are learning outside, sitting on the ground, in an informal school arrangement.
C: People are reliant on food aid in order to eat. D: The houses are destroyed; there are no doors or windows; there is
rubble on the ground that has not been cleared.
Activity 9 (Learner’s Book, page 220)
1. Although the AEC has more people than the SADC, its per person income is less. This may be because there are fewer job opportunities for the people due to low education levels; investment may be by multinationals who use their own people in top positions; profits are repatriated to the home nation; there is not a wide spread of industry, so that income may come from the extraction of raw materials, which do not bring in high incomes.
2. Infection is often carried by contaminated water. In Ethiopia, lack of access to clean water means that water borne diseases develop. Babies are prone to infection and unclean water can lead to cholera, dysentery and death.
3. The high birth rate, lack of education, gender inequality that leads to women’s lack of control over their reproductive lives, poor nutrition, lack of health clinics and doctors, and no clean water can all contribute to a high infant mortality rate.
111M O D U L E 5 • D E V E L O P M E N T G E O G R A P H Y : G E O G R A P H I C A L K N O W L E D G E
4. There are no right or wrong answers. Ask learners to read out their answers and correct them in class. Answers should show that learners want to bring improvements by encouraging access to education, more medical services, better nutrition through agricultural aid and access to irrigation in areas where this is possible. Aid should avoid corrupt officials, and have access to the community.
Informal assessment• During discussion activities, listen to the learners’ contributions and
assess whether they have grasped the concepts taught in the unit. Also note whether their contributions are sufficiently insightful.
• For written activities, go through the answers with the class. Encourage learners to share their answers. Let the learners swap books and mark each other’s work.
• Take in the learners’ notebooks about every third week to review their work yourself so that you are able to identify any problem areas.
Remedial/extensionRemedial: • Let learners who have difficulty with the concepts in this section
create a mindmap summary of the unit and a list of concepts and their definitions.
Extension:• Allow the learners to explore some of the websites indicated under
‘Resources’ on page 104 of this Teacher’s Guide.• Let learners find out what South Africa is doing to address high infant
mortality rates.
UNIT 2 Frameworks for development
TERM 3, WEEKS 2–4
Learner’s Book pages 221–240Duration: 6 hours
Curriculum and Assessment Policy Statement (CAPS) content
Frameworks for development • Factors that affect development, including: access to resources, energy,
history, trade imbalances, population growth, education and training, natural resource limitations and environmental degradation (note: learners need to explore the complexity and inter-related nature of these factors)
• Development models: free market models, such as Rostow’s model with its limitations and criticisms, core and periphery models with their application at different scales; sustainability models with their economic, social, and environmental elements
• Community based development, including approaches to rural and urban development (with examples from around the world)
112 S E C T I O N 2 • L E S S O N - B Y - L E S S O N
Resources• Learner’s Book pages 221–240• Atlases• Websites (optional): answers.yahoo.com; www.chforum.org/library/
xc123.shtml; makewealthyhistory.org/geographical-factors-that-affect-development; www.odi.uk/opinion/docs/5623; www.questia.com/googleScholar.qst?docid=5001871787
Preparation• Read through the unit and familiarise yourself with the content that you
will need to teach. Think about what learners may already know about the topics and any areas of difficulty that you think they might encounter.
Teaching the unit
Lesson 1
• Work through the unit’s introductory paragraphs on page 221.• For the next five minutes of the lesson, brainstorm with the learners to
find out what they know about factors that affect development. Write their ideas on the board.
• Read through ‘Resources affect development’ (page 221). Ask learners for the categories they may remember we use for resources. Write these on the board.
• Refer to the map, Figure 5.2.1, to point out the wealth of natural resources found on the African continent. Point out where oil is found and discuss the importance of this as an energy resource and an export commodity. Point out the wealth of other minerals found throughout the SADC countries, especially South Africa. Discuss their role in industry.
• Refer to Table 5.2.1 which outlines the SADC’s main natural resources. Discuss which countries have the potential to develop beyond their present position, or think of reasons why they haven’t yet reached a high level of development, even though they have resources.
Activity 1• This is a quick activity. Allow the learners to work on (1), (2) and (4)
in pairs. • Go through the answers with the class once all the learners have
completed it. Do (3) as a class discussion.
• Read through how energy affects development, relating its contents to the map, Figure 5.2.1, to point out in which countries coal, oil, natural gas, or uranium are.
Activity 2• Go through this activity with the learners so that they understand what is
expected of them. Set it as a homework task.
• Work through how history affects development, referring to the map of colonial occupation in Figure 5.2.4. Discuss the slave trade, trying to understand who benefited and who suffered. Mention that slavery and human trafficking continues today, and that CNN, for example, is using its airtime to fight against the evil and wrongs of human trafficking.

113M O D U L E 5 • D E V E L O P M E N T G E O G R A P H Y : G E O G R A P H I C A L K N O W L E D G E
• Neo-colonialism is an extension of colonial influence in new ways. Discuss how this is happening in the world, and the extent to which multinational brands, companies, advertising, songs, films, and TV programmes spread the dominant Western culture throughout the world.
Activity 3• This activity looks at the effects on colonialism on development in Africa.• Allow learners to begin the activity in class and then complete it as
homework.
Lesson 2
• Go through the answers to Activities 2 and 3 with the class.• Work through how the Balance of Trade affects development. Point out
that it is not in volume of goods traded, but in the monetary value of goods traded. Raise the idea of challenges for trade, such as differences in currency values, commodity price changes, low prices for raw materials.
Activity 4• Use the questions in this activity for a class discussion. Alternatively, set it
as a written homework task.
• Work through the section, ‘Population growth affects development’ (page 227). Refer to the line graph, Figure 5.2.7, that shows the percentage increase in the population growth for the world. Remind learners of the target reached by population growth on 31 October 2011, of 7 billion people.
• Refer to the map in Figure 5.2.8 that shows figures for fertility rates. Ask learners about the effects of a high or low fertility rate in a country: the ageing or a largely youthful population, and the problems that each of those stages could bring to a country.
Activity 5• Allow learners to begin the activity in class and then complete it
as homework.• If you do not have an atlas for each learner, allow them to work in pairs
or small groups.
Lesson 3
• Go through the answers to Activity 5 with the class.• Read the case study, ‘The lost kingdom of Niger’ (page 230) to the learners.
Activity 6• Go through this activity with the learners so that they understand what is
expected of them. Set it as a homework task.• If learners have time at the end of the lesson, they can start working on
this activity.
• Work though the sections, ‘Education and training affect development’ (page 230), ‘Restricted natural resources affect development’ (page 232) and ‘Environmental degradation affects development’ (page 232).
114 S E C T I O N 2 • L E S S O N - B Y - L E S S O N
Activity 7• Use the questions in this activity for a class discussion. Alternatively, set it
as a written homework task.
Activity 8• Allow learners to begin the activity in class and then complete it
as homework.• If you do not have an atlas for each pair of learners, allow them to work
in small groups.
Lesson 4
• Go through the answers to Activities 6 and 8 with the class.• Work through the section, ‘What development models are there?’
(page 232). Point out Clarke’s Economic Sector Development Model, Table 5.2.2.
Activity 9• Go through this activity with the learners so that they understand what is
expected of them. Set it as a homework task.• If learners have time at the end of the lesson, they can start working on
this activity.
• Work through the section, ‘Stages of Economic Growth’ (page 234).• Refer to Figure 5.2.10 to show Rostow’s development model. Draw this
on the board, and discuss the characteristics of the stages that are in Table 5.2.3.
Activity 10• Allow learners to begin the activity in class and then complete it as
homework. They should work in pairs.• If you do not have an atlas for each pair of learners, allow them to work
in small groups.
Lesson 5
• Go through the answers to Activities 9 and 10 with the class.• Work through the section, ‘Core-Periphery Model’ (page 235).• Refer to Figure 5.2.11 to show Friedman’s Core-Periphery Model.
Explain the scale of the model, which means it can be used to show the relationship between cities and the surrounding areas, or capitals and the provinces, or colonies and the imperial power.
Activity 11• Let learners complete this activity in small groups.• After about 15 minutes, allow time for learners to share their answers
with the class.
• Work though the section, ‘Sustainability models’ (page 237).• Figure 5.2.13 shows the model of the three legs of sustainable
development: the economy, society and the environment. Point out that if one part of the three is overlooked, then there is no sustainability. The three need to receive the same focus in development strategies.

115M O D U L E 5 • D E V E L O P M E N T G E O G R A P H Y : G E O G R A P H I C A L K N O W L E D G E
Lesson 6
• Go through the answers to Activity 10 with the class.• Work through the section, ‘What is community-based development?’
(page 238). Refer to the map of Africa in Figure 5.2.15 to show the location of community based development projects led by Khanya-AICDD.
• Allow the rest of the lesson for the completion of Activities 12 and 13.
Activity 12• Use the questions in this activity for class discussion. Alternatively, set it
as a written homework task.
Activity 13• Allow learners to begin the activity in class and then complete it
as homework.• Let learners complete this activity individually.
AnswersActivity 1 (Learner’s Book, page 223)
1. and 2.
Land Labour Capital Entrepreneurship
forest forestry worker investment twitter
airport pilot desk Handy Andy
iron ore farmer stock exchange
maize aircraft
a house
vineyards
3. The development and cultivation of vineyards may be thought of as entrepreneurship, as they are an output of a more developed mind, as is the construction of an aircraft.
4. A = renewable (wind turbine energy); B = non-renewable (mining); C = non-renewable (forestry); D = renewable (human capital)
Activity 2 (Learner’s Book, page 224)
1. Sub-Saharan Africa is rich in natural resources.2. Agree: energy in the form of natural gas or petroleum commands high
prices and is the single factor that distinguishes the wealth and economic development of one country from another.
Disagree: although petroleum and natural gas can bring wealth they are not the single factor that affects the level of economic development of countries of Africa, as African countries with diamonds, gold, coal and uranium, such as South Africa, have developed without access to deposits of petrol or natural gas.
3. Namibia and South Africa4. Uranium is used for nuclear energy, which is cleaner than thermal
energy; it is also a component in a nuclear weapon, and weapons are politically and militarily strategic to have.
5. Madagascar, South Africa and Zimbabwe6. Angola
116 S E C T I O N 2 • L E S S O N - B Y - L E S S O N
Activity 3 (Learner’s Book, page 226)
2. a. The UK received cotton and raw materials for its industries; the products of the industries were then sold in the African countries. This had a positive impact on the UK.
b. Africa lost thousands of young, healthy, workers. This had a negative effect on the demographics of the area. African countries exposed to the slave trade suffered culturally, socially, politically and economically as a result of a de-stabilisation process of slavery. The slave trade had a negative effect on African countries.
3.
Colonial power Present African country
1 Belgium Democratic Republic of the Congo, Burundi, Rwanda
2 France Morocco, Algeria, Tunisia, Mauritania, Mali, Niger, Chad, Gabon, Madagascar, Mauritius
3 Germany Namibia, Tanzania, Benin, Cameroon
4 Italy Libya, Eritrea, Somalia
5 Portugal Angola, Mozambique
6 Spain Western Sahara, Equatorial Guinea
7 UK Egypt, Sudan, Uganda, Kenya, Malawi, Zambia, South Africa, Zimbabwe, Botswana, Lesotho, Swaziland, Nigeria, Ghana
4. UK, France, and then Germany/Belgium/Italy5. Colonialism: having a colony in another country that is formally ruled or
controlled by the mother country. Neo-colonialism: exerting an informal power over another country for purposes of natural resource exploitation or trade.
6. India, China, Russia and America7. Africa has strategic raw material resources; there are few rules and
regulations regarding their exploitation; Africa provides cheap labour; Africa provides a huge market for manufactured articles
Activity 4 (Learner’s Book, page 227)
1. Poorer countries lack infrastructure such as education, transport and industrial development. This makes them dependent on the export of raw materials, which have less value than a final product.
2. Fair trade is a movement designed to bring more equity to world trade by empowering producers and farmers in poorer countries. Preferential trade agreements, and reducing import tariffs and quotas, is another way that poorer countries can be helped to trade.
3. The value of the exports must balance with the value of the imports.
Activity 5 (Learner’s Book, page 229)
1. After 1960 it increased, reaching a peak before 1970.2. It has been dropping downwards since then, with two small spikes
upwards in the 1980s.3. North America, Europe, Asia and Australia4. Angola, The DRC, Mali, Chad, Somalia5. Africa
117M O D U L E 5 • D E V E L O P M E N T G E O G R A P H Y : G E O G R A P H I C A L K N O W L E D G E
6. Overpopulation occurs when the population in a country is greater than the resources necessary to sustain the people.
7. access to family planning; later age of marriage; education; more equal roles for women in society; job opportunities
Activity 6 (Learner’s Book, page 230)
1. Land: groundnuts, uranium, people, arable land. Labour: people, foreign aid. Capital: budget, income, foreign aid.
2. a. A problem is that other countries may fight to gain possession of uranium because it is strategically important as a resource.
b. An advantage is that the country will become powerful, or receive money which can be used for economic development and growth.
3. The country is very poor. Half of its so called ‘wealth’ comes from other people giving aid.
4. It is a good thing because Mali is desperately poor and its citizens need help of any sort.
It is a bad thing because it could go to corrupt officials; it could discourage Malians from doing work to promote their own development.
5. One commodity for export is a problem. Prices for the commodity could decline, or the product’s use could decline if an alternative substance replaced it. This would impact the economy, because it is the sole source of income from exports.
6. The rate of desertification has been 160 km in 25 years.7. There is poverty, little education, no infrastructure, no job opportunities.
Life is hard. There is a high infant mortality rate. Women have no access to family planning, and have little control over their reproductive lives.
8. a. There will never be sufficient schools for the young population.b. Job opportunities may exist but cannot be filled if there are an
insufficient number of educated people.c. Overpopulation will affect the quality of life for the citizens of Niger.
9. If there is a predominantly young population, it will place demands on the government to educate them, but the proportion of active population is too small, suggesting the need for foreign aid.
10. There are no right or wrong answers, but listen to the answers of a number of learners to point them in the right direction: there is very little one can do with an income of R1 190 per year.
Activity 7 (Learner’s Book, page 231)
1. Technical training teaches you how to do things; Tertiary education teaches you how to think.
2. Tertiary education: become leaders, innovators, professionals. Technical training: become vocationally qualified as draughtsmen,
electricians, engineers, plumbers.3. Problems such as resentment, frustration, and agitation can develop if
skilled people are not employed.
Activity 8 (Learner’s Book, page 232)
1. Use an atlas to check this. The areas between the tropics are generally amongst the poorer nations of the world.
2. yes3. Any three: (1) money for the raw material – wood; (2) space for
agriculture, pasture for animals; (3) use of materials for fuel, furniture and housing; (4) space for communication road networks (5) space for housing

118 S E C T I O N 2 • L E S S O N - B Y - L E S S O N
4. (1) The trees are an invaluable, scarce resource. (2) Forests provide the ecosystem and habitat for thousands of species of plants and animals. (3) Forests provide unexplored wealth of resources for pharmaceuticals, e.g. medicines.
5. There will be various opinions: developed countries have taken what they want and if they are still taking resources they are responsible for degradation. Through oil exploration they continue to ruin forests. The developing countries have a need to develop and create wealth for their citizens. This may mean having no option but to use their forest resources.
6. Learners own opinions.
Activity 9 (Learner’s Book, page 233)
1. They must have relevance; they must be simple; they can be scaled up or down; they are general templates.
2. A command economy is found in a dictatorship or repressive, strongly centralised, and controlled state, e.g. a communist state. A free market economy is part of a democratic government where prices adjust according to supply and demand and there is the minimum of government intervention.
3. investment4. job increases, in the secondary and tertiary sectors5. They were made, using the template of development of the wealthier
North. The poorer South is not as developed as the North. Perhaps they could be applied to the South, if the North did not exist except as a resource base for the South. It is impossible to predict because the South faces the competitive markets of the North.
Activity 10 (Learner’s Book, page 235)
1. and 2.
Stages of Development
World examples South African examples
1 Traditional society Amazonian tribes Rural tribal communities
2 Pre-take off Mali, Niger Eastern and Northern Cape
3 Take off Libya, Algeria Parts of the Eastern Cape
4 Drive to maturity Namibia Parts of Gauteng, Western Cape
5 Age of mass consumption
USA, UK Provincial capitals
3. multilateral or bilateral aid in the form of investment4. Yes. This is the development of the highest standard of living to which all
people should be able to aspire.
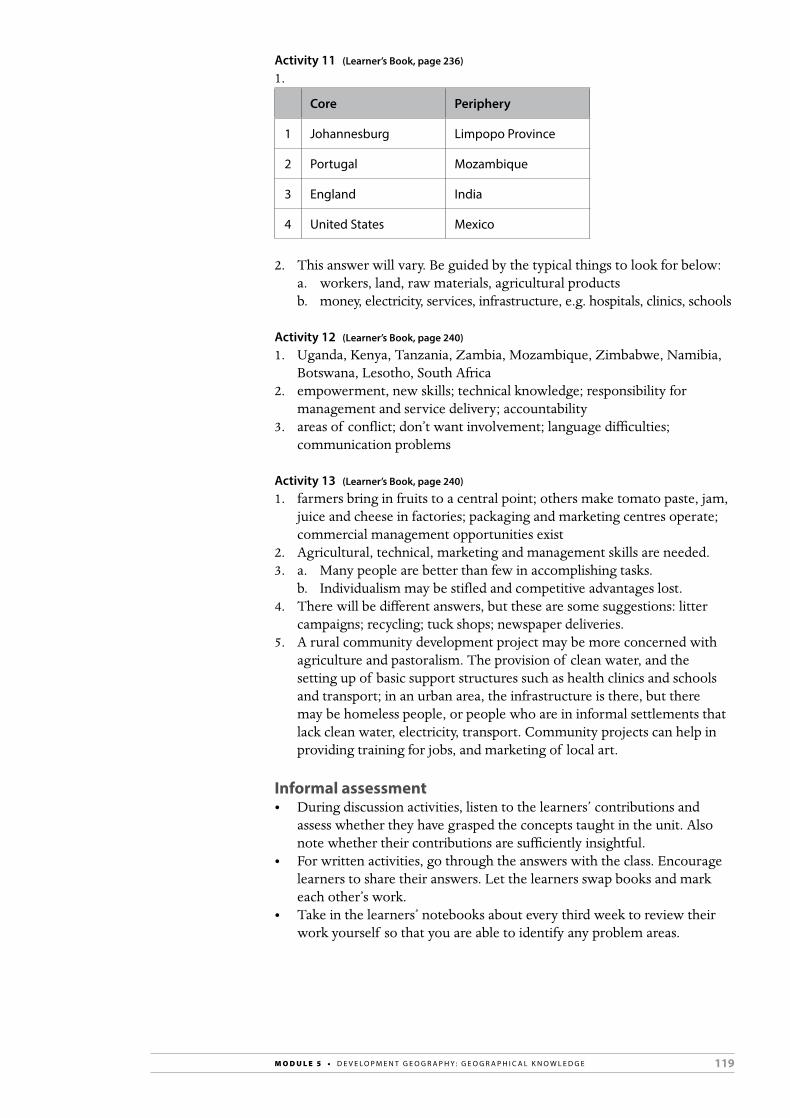
119M O D U L E 5 • D E V E L O P M E N T G E O G R A P H Y : G E O G R A P H I C A L K N O W L E D G E
Activity 11 (Learner’s Book, page 236)
1.
Core Periphery
1 Johannesburg Limpopo Province
2 Portugal Mozambique
3 England India
4 United States Mexico
2. This answer will vary. Be guided by the typical things to look for below:a. workers, land, raw materials, agricultural productsb. money, electricity, services, infrastructure, e.g. hospitals, clinics, schools
Activity 12 (Learner’s Book, page 240)
1. Uganda, Kenya, Tanzania, Zambia, Mozambique, Zimbabwe, Namibia, Botswana, Lesotho, South Africa
2. empowerment, new skills; technical knowledge; responsibility for management and service delivery; accountability
3. areas of conflict; don’t want involvement; language difficulties; communication problems
Activity 13 (Learner’s Book, page 240)
1. farmers bring in fruits to a central point; others make tomato paste, jam, juice and cheese in factories; packaging and marketing centres operate; commercial management opportunities exist
2. Agricultural, technical, marketing and management skills are needed.3. a. Many people are better than few in accomplishing tasks.
b. Individualism may be stifled and competitive advantages lost.4. There will be different answers, but these are some suggestions: litter
campaigns; recycling; tuck shops; newspaper deliveries.5. A rural community development project may be more concerned with
agriculture and pastoralism. The provision of clean water, and the setting up of basic support structures such as health clinics and schools and transport; in an urban area, the infrastructure is there, but there may be homeless people, or people who are in informal settlements that lack clean water, electricity, transport. Community projects can help in providing training for jobs, and marketing of local art.
Informal assessment• During discussion activities, listen to the learners’ contributions and
assess whether they have grasped the concepts taught in the unit. Also note whether their contributions are sufficiently insightful.
• For written activities, go through the answers with the class. Encourage learners to share their answers. Let the learners swap books and mark each other’s work.
• Take in the learners’ notebooks about every third week to review their work yourself so that you are able to identify any problem areas.
120 S E C T I O N 2 • L E S S O N - B Y - L E S S O N
Remedial/extensionRemedial: • For learners who need extra practice with the concepts in this module
thus far, let them complete Worksheet 17 on pages 303–306 in the Resources section of this Teacher’s Guide. This worksheet can also be used for revision purposes.
Extension: • Allow the learners to explore some of the websites indicated under
‘Resources’ on page 112 of this Teacher’s Guide.
UNIT 3 Trade and development
TERM 3, WEEKS 4–5
Learner’s Book pages 241–256Duration: 6 hours
Curriculum and Assessment Policy Statement (CAPS) content
Trade and development • International trade and world markets: commodities traded and terms
of trade• Types of trading relationships, including: free trade, trade barriers,
subsidies and fair trade• The concept of globalisation and its impact on development• Export-led development – critically examined (with examples from
around the world)
Resources• Learner’s Book pages 241–256• Large world map or atlases• Websites (optional): en.wikipedia.org/wiki/Trade_and_development;
www.unctad.org; www.wto.org; ictsd.org/events/tdsf; www.sadc.int/
Preparation• Read through the unit and familiarise yourself with the content that you
will need to teach. Think about what learners may already know about the topics and any areas of difficulty that you think they might encounter.
Teaching the unit
Lesson 1
• Work through the introduction to the unit and the section, ‘How did international trade develop?’ (page 241).
• Ask the learners what obstacles could have hindered trade long ago and how trade differs now.
• Use a world map or class atlases to discuss how early sea voyages of exploration opened up the world for trade. Locate the major rivers and waterways of the world. Point out how rivers spread knowledge, culture, people, and goods. Use the map of the world, or of continents to find physical obstacles that impeded man’s exploration and ability to trade.
• Focus on the meaning of ‘terms of trade’ and ‘balance of trade’.• Read the differences between LEDCs and MEDCs with regard to trade.

121M O D U L E 5 • D E V E L O P M E N T G E O G R A P H Y : G E O G R A P H I C A L K N O W L E D G E
Lesson 2
• Set aside this lesson for the learners to complete Activities 1 and 2.
Activity 1• Use the questions in this activity for class discussion. Alternatively, set it
as a written group task.
Activity 2• Let the learners work on this activity in pairs.• Allow learners to begin the activity in class and then complete it
as homework.
Lesson 3
• Go through the answers to Activity 2 with the class.• Work through the section, ‘What types of trading relationships exist?’
(page 245), beginning with ‘Free trade’ and then moving on to ‘Free trade blocs’.
• Refer to the round of talks that occur through GATT and the WTO, and that these two organisations are products of the United Nations. Discuss the advantages that the SADC has with trade, and the talks to bring about a Common Market for East and Southern Africa.
• Refer to the world map in Figure 5.3.8 to show free trade areas in the world.
Activity 3 • Allow learners to begin the activity in class and then complete it
as homework.• Let the learners work on the activity individually or in pairs.
Lesson 4
• Go through the answers to Activity 3 with the class.• Work through the section, ‘Trade barriers and subsidies’ (page 247) with
the learners, making sure that the concept is understood.• The line graph in Figure 5.3.9 shows the import of textiles and clothing
by SA from the world and from China. Indicate what happened to the graph line when quotas were introduced in 2006/2007. Discuss the positive and negative effects of quotas for a country. In the case of protection of our domestic textile industry, ask the learners if they can see what the effect on more recent imports has been (refer to Figure 5.3.9).
Activity 4• Go through this activity with the learners so that they understand what is
expected of them. Set it as a homework task.• If learners have time at the end of the lesson, they can start working on
this activity.
• Work through the section, ‘Fair trade’ (page 248), with a focus on the ethical dimension of the free trade debate. Ask the learners to collect free trade logos on goods, or to look out for them in magazines or on food items.
122 S E C T I O N 2 • L E S S O N - B Y - L E S S O N
Lesson 5
• Go through the answers to Activity 4 with the class.• Work through the section, ‘How has globalisation impacted on
development?’ (page 249), pointing out the wide nature of globalisation in all areas of life, its origins and fast growth. Ask the learners if they feel the world should accept and speed up globalisation, or if they feel people might fight the spread of globalisation, and if so – why they feel that it may happen.
• The case studies and Figure 5.3.11 reveal inequalities in the world. Discuss these with the class.
Activity 5• Allow learners to work on this activity in pairs and complete it in class.
Activity 6• Go through this activity with the learners so that they understand what is
expected of them. • Allow learners to begin the activity in class and then complete it as
homework.
Lesson 6
• Go through the answers to Activities 5 and 6 with the class.• Work through the section, ‘What is export-led development?’ (page 252).• Refer to the line graph, Figure 5.3.14, that compares China’s exports
with that of the average exports for the developed and developing countries of the world. Discuss the role of China as a giant factory for the world. Ask the learners what goods or textiles that they find from China. Discuss why China can produce goods so cheaply and saturate the markets through exports: huge population, abundant resources, drive to industrialisation, major government drive to export to the world.
Activity 7• Use the questions in this activity for class discussion.
• Work through the section, ‘Advantages and disadvantages of export-led development’ (page 253).
• Refer to the histogram in Table 5.3.1 that shows the breakdown of exports for South Africa, 2009. Comment on the variety of exports. Point out the benefits of a spread of exports.
Activity 8• Allow the learners to complete this activity in class. They could work
individually or in pairs.• After about 15 minutes, go through the activity with the learners
allowing them to share their answers.
Activity 9• Go through this activity with the learners so that they understand what is
expected of them. Set it as a homework task.• If learners have time at the end of the lesson, they can start working on
this activity.

123M O D U L E 5 • D E V E L O P M E N T G E O G R A P H Y : G E O G R A P H I C A L K N O W L E D G E
AnswersActivity 1 (Learner’s Book, page 244)
1. food, skins, wood2. International trade needed nations, or countries, or States across borders
to be called ‘international’. 3. Sea routes had not been discovered around Africa; air routes did not exist.4. Rivers were often navigable for long distances from the ocean up towards
the source. This meant that communities living alongside the river could use the river to transport heavy goods and trade with each other.
5. a. Portugal gained first access by sea to the spices and resources of Africa and India. This was an advantage in creating a wealthy empire.
b. African coastal areas received weapons, new products, and came into contact with European civilisation.
c. India received goods from Europe which could not be found in India. Their own resources were traded and brought them either goods they wanted or wealth.
6. Ask the class to read out their answers, correcting where necessary. Benefits included access to new goods, and knowledge; disadvantages included contact with diseases from Europe, culture clashes, breakdown of way of life.
Activity 2 (Learner’s Book, page 244)
1. ‘Terms of trade’ refers to the price of a country’s exports relative to the price of the country’s imports.
2. The volume of exports can increase and be positive if the value of the exports also rises.
3. LEDCs can export commodities such as sugar, coffee, tea, rubber, hardwood and other agricultural raw materials or minerals as ore.
4. Better farming methods, better crops, pesticides – can all lead to more being produced for export. Hybrid crops are more hardy and resistant to changes in climate.
5. ‘Deteriorating terms of trade’ means that the value of the exports of LEDCs drops.
6. Natural disasters such as earthquakes, tropical cyclones, flooding, tsunamis, and volcanoes can all affect agricultural and mineral output.
7. All countries need to trade in goods where they have a comparative advantage, and can produce more cheaply than other countries, in order to receive what they need.
Activity 3 (Learner’s Book, page 247)
1. Free trade has no regulations such as quotas, taxes, tariffs and subsidies regarding the amount or price of the goods.
2. A trade bloc reduces regulations amongst member countries, making it easier for goods to cross borders without customs’ controls; the bloc has greater bargaining power in reducing the regulations of other countries, so as to encourage trade; business, services as well as trade in goods is encouraged and simplified.
3. Protection of domestic, new industries or of agricultural products has to be forgotten in favour of the greater scheme of the trading bloc.
4. GATT stands for General Agreement on Tariffs and Trade.5. GATT initiated talks to remove rules and regulations protecting the
industries and output of countries in order to free trade for all countries.6. World Trade Organisation (WTO)7. 75 member countries

124 S E C T I O N 2 • L E S S O N - B Y - L E S S O N
8. Goals of WTO are: to improve the standards of all people by correcting imbalances of trade between LEDCs and MEDCs. This will promote growth and development and help reduce poverty.
9. No. There is an imbalance of trade between LEDCs and MEDCs because of the difference in the value of the exports of each group. To create a more equal basis of trade, the LEDCs should be allowed to raise up to 20% in tariff increases on their agricultural products and raw materials.
10. NAFTA (North American Free Trade Association); European Union; Southern African Development Community
Activity 4 (Learner’s Book, page 248)
Answers will be different. Some advantages are: trade barriers and subsidies protect domestic production, stimulate economic growth and job opportunities. Disadvantages are that domestic production is not encouraged to be competitive, and will collapse with better quality imports being bought. This leads to higher costs, and inflation in a country, and job losses.
Activity 5 (Learner’s Book, page 251)
1. Globalisation is the worldwide trade in goods and services, as well as the worldwide spread of culture, style, communication, marketing and cyber-connections.
2. Anything: e.g. computer, camera, jeans, trainers, software programmes, movies.
3.
Advantages Disadvantages
1 culture spreads lose one’s own culture
2 language is universal lose one’s own languages
3 access to cheaper imports domestic output can’t compete
4 food is universal national food is forgotten
Activity 6 (Learner’s Book, page 252)
1. a. similar: large impersonal factory; many workers; no view; work stations only
b. different: Mexico has a chaotic, poorly organised system while the sweatshops are highly organised
2. there is little ventilation or air-conditioning; working conditions are hard; people sweat
3. poor wages; long hours; six days a week labour; no unions to represent them; underage children
4. Figure 5.3.13B – (a) usual Nike logo shape; (b) unusual strapline, e.g. ‘Sweatshops: poverty is awesome’.
5. To shock users of Nike into awareness of the issues of sweatshops operated by Nike.
6. Globalisation allows large corporations to go where rules and regulations are non-existent. The wages are low, and operating costs are lower, allowing the large multinationals to maximise their profits.

125M O D U L E 5 • D E V E L O P M E N T G E O G R A P H Y : G E O G R A P H I C A L K N O W L E D G E
Activity 7 (Learner’s Book, page 253)
1. Countries stimulate their economic growth by encouraging and helping in the export of goods.
2. China3. 1998, 2006/20074. there may have been a worldwide economic decline and a drop in the
demand for goods5. Developed countries are importing cheaper goods produced where
labour costs are lower, amongst the developing countries, which are exporting more.
Activity 8 (Learner’s Book, page 255)
1. a. 6,73%b. 32,39%c. 2,72%d. 14,36%e. 34,49%
2. They may be high in volume but lower in value.3. No. Agricultural goods do not have value added.
Activity 9 (Learner’s Book, page 256)
1. Southern African Development Community2. An export-led economic growth would reduce dependence on imports.
Imports are expensive because they would come from more developed countries. Malawi’s raw materials do not get much money. They need to diversify from commodities to industrial exports.
3. (1) tax allowances of up to 15% of all export revenue if it is other than the commodities exported; (2) no duties on imports of equipment used in manufacturing the exports; (3) no corporate tax; (4) no VAT; (5) no duty on raw materials
4. to diversify what Malawi is able to export and to move away from the commodity based exports
5. Free Trade Area
Informal assessment• During discussion activities, listen to the learners’ contributions and
assess whether they have grasped the concepts taught in the unit. Also note whether their contributions are sufficiently insightful.
• For written activities, go through the answers with the class. Encourage learners to share their answers. Let the learners swap books and mark each other’s work.
• Take in the learners’ notebooks about every third week to review their work yourself so that you are able to identify any problem areas.
Remedial/extensionRemedial: • Let learners who have difficulty with the concepts in this section create a
mindmap summary of the unit and a list of concepts and their definitions.
Extension:• Let the learners complete Worksheet 18 on page 307 in the Resources
section of this Teacher’s Guide. It draws on all the concepts in this unit and focuses on globalisation.

126 S E C T I O N 2 • L E S S O N - B Y - L E S S O N
UNIT 4 Development issues and challenges
TERM 3, WEEKS 5–6
Learner’s Book pages 257–268Duration: 4 hours
Curriculum and Assessment Policy Statement (CAPS) content
Development issues and challenges • The role of women in development: gender issues related to power,
access to resources and attitudes• The effect of development on the environment• The role of the state and business in development in South Africa,
including central control by the state, weak state control and public or private partnerships
Resources• Learner’s Book pages 257–268• Atlases• Websites (optional): www.dotchley.co.uk/page/99/women.developing
world; www.un.ngs.org/spip.ph; www.worldbank.org; www.ucl.uk./UN_1999_World_Survey_Women_in_Developing
• You may find National Geographic DVDs that focus on the effects of development on the environment. Hurricane Katrina can be shown to focus on how the effects of storms are greater because of man’s interference with the environment.
Preparation• Read through the unit and familiarise yourself with the content that you
will need to teach. Think about what learners may already know about the topics and any areas of difficulty that you think they might encounter.
Teaching the unit
Lesson 1
• Work through the section, ‘What is the role of women in development?’ (page 257) pointing out that it is fairly recent in the world’s history that women have been able to vote.
• Refer to Table 5.4.1 showing women in positions of power both in South Africa and the world. Discuss attitudes towards women in positions of power. Ask learners for their opinions and capture their ideas on the board.
Activity 1• Allow learners to begin the activity in class and then complete it as
homework.• If you do not have an atlas for each learner, allow them to work in pairs
or small groups.

127M O D U L E 5 • D E V E L O P M E N T G E O G R A P H Y : G E O G R A P H I C A L K N O W L E D G E
Activity 2• Go through this activity with the learners so that they understand what is
expected of them. Set it as a homework task.• If learners have time at the end of the lesson, they can start working on
this activity.
Lesson 2
• Go through the answers to Activities 1 and 2 with the class.• For the next five minutes of the lesson, brainstorm with the learners
to find out what they know about the effect of development on the environment.
• Work through the section, ‘What effect does development have on the environment?’ (page 261).
• Refer to Figure 5.4.7 which shows coastal pollution in South Africa. Ask the learners for examples of pollution from development, and write these on the board. Discuss how the impact of development can be less harmful and more sensitive to the environment.
• Refer to Figure 5.4.9 pointing out the importance of coral reefs. Refer to the map in Figure 5.4.10 which shows where coral reefs are located and where they are most threatened.
Lesson 3
• Allow this lesson for the learners to complete Activity 3 and for you to go through the answers.
Activity 3• Go through this activity with the learners so that they understand what is
expected of them.• Let the learners work on the task in pairs.• Allow time at the end of the lesson to go through the answers with the
learners. Let them share their responses with the class.
Lesson 4
• Work through the section, ‘What role do the State and business play in development in South Africa?’ (page 265). Learners may remember some of this work from EMS.
• Refer to Table 5.4.2 to point out the various categories of small businesses. Ask learners for examples of each enterprise, from the surrounding community, and write these on the board to consolidate their learning.
Activity 4• Use the questions in this activity for class discussion. Alternatively, set it
as a written homework task.
Activity 5• Allow learners to begin the activity in class and then complete it
as homework.• They could work in pairs or individually on the activity.
128 S E C T I O N 2 • L E S S O N - B Y - L E S S O N
AnswersActivity 1 (Learner’s Book, page 260)
1. Greenland, parts of Indonesia, Western Sahara2. Ireland3. Niger, Chad, Somalia, Angola, DRC, Peru, North Korea, Saudi Arabia,
Iraq, Iran, Afghanistan, Thailand, and Papua New Guinea4. developing world5. A poor infrastructure limits education, and women or girls suffer most.
Discrimination is often greatest where knowledge is least.
Activity 2 (Learner’s Book, page 261)
1. Women are not children! Their work is demanding and responsible and they are often the sole figure of authority in the house if the man leaves for work elsewhere, yet they are not recognised legally in their own right, which is demeaning.
2. Women are prevented from borrowing money, cannot conduct business, are dependent on men in the family for the schooling of their children, cannot buy or sell houses. This means that half of the workforce is unable to conduct business, which must hinder economic development.
3. The Maputo Protocol was signed by 15 countries that agreed to eliminate discriminatory gender laws by 2015.
4. Political: women cannot apply for passports and have no power in the eyes of the law
Social: women cannot borrow money or own property; they are dependent on male members of their family
5. Discriminatory practices against women will have to stop. Women must have equal rights in the law and in finance.
Activity 3 (Learner’s Book, page 265)
1. Generally in the tropics or on the eastern coasts of continents; around the Red Sea and Gulf of Arabia.
2. Pacific Ocean3. Warm currents flow from the equator southwards down the east side of
continents.4. dynamite fishing5. pollution6. pollution from factories into the atmosphere causes acid rain which
affects coral growth; pollution on land into the rivers affects the coral reefs in the sea
7. Indian Ocean, then SE Asia and Middle East almost equal, then Caribbean and finally the Pacific Ocean
8. Winds and ocean currents carry pollution across national boundaries. It is difficult to prevent their impact elsewhere.
9. Listen to the learners answers. Points: destruction of coral reefs highlight amount of rising sea temperatures, acid rain, and pollutants in the ocean. Coral reefs generate $375 billion in annual revenue; protects the coastlines of 109 countries; habitat for 25% of our fish species; can be a source of pharmaceutical research; basis for 10% of the world’s diet.
10. Yes. It rhymes with ‘reefs’ and we should grieve for what is happening to the coral in the world.
129M O D U L E 5 • D E V E L O P M E N T G E O G R A P H Y : G E O G R A P H I C A L K N O W L E D G E
Activity 4 (Learner’s Book, page 267)
1. Listen to learners’ answers and check if you feel they are appropriate. Write the answers on the board to capture a variety of examples for (a) to (e).
2. Listen again to the answers and correct if necessary, using Table 5.4.2 as your reference.
3. to encourage economic development, provide more jobs, wages, and a positive growth effect for the country; to safeguard the workers
Activity 5 (Learner’s Book, page 268)
1. connection to the electricity grid; an organic farm; a composting facility and food-processing plant; offices; a guest house; sanitation and clean water; an arts and culture centre; and more job opportunities
2. Yes. It is community based, is relevant, necessary as a basic need ( jobs, food, education, and clean water).
3. The State wishes to focus on education, basic human needs, job creation and the reduction of poverty, sustainable development. This is fostered by public-private partnerships as in this example.
Informal assessment• During discussion activities, listen to the learners’ contributions and
assess whether they have grasped the concepts taught in the unit. Also note whether their contributions are sufficiently insightful.
• For written activities, go through the answers with the class. Encourage learners to share their answers. Let the learners swap books and mark each other’s work.
• Take in the learners’ notebooks about every third week to review their work yourself so that you are able to identify any problem areas.
Remedial/extensionRemedial: • Let learners who have difficulty with the concepts in this section create a
mindmap summary of the unit and a list of concepts and their definitions.
Extension:• Allow the learners to explore some of the websites indicated under
‘Resources’ on page 126 of this Teacher’s Guide.• Let learners research the role women play in politics and in the business
world in any developing country of their choice.
UNIT 5 The role of development aid
TERM 3, WEEKS 6–7
Learner’s Book pages 269–279Duration: 4 hours
Curriculum and Assessment Policy Statement (CAPS) content
Role of development aid • Concept of development aid and development co-operation• Types of development aid – technical, conditional, humanitarian• Impact of aid on development (including case studies of development aid
– positive and negative)
130 S E C T I O N 2 • L E S S O N - B Y - L E S S O N
Resources• Learner’s Book pages 269–279• Websites (optional): en.wikipedia.org/usaid; www.oecd.org.dac/; www.
wto.org/trade topics/development; www.reliefweb.int/node/21608• Your library may have copies of topical news magazines such as Time,
The Economist, Newsweek, as well as newspapers, which all contain information about developing countries and aid.
Preparation• Read through the unit and familiarise yourself with the content that you
will need to teach. Think about what learners may already know about the topics and any areas of difficulty that you think they might encounter.
Teaching the unit
Lesson 1
• Ask the learners for their ideas about aid and write them on the board. • Work through the section, ‘What does development aid and development
co-operation mean?’ (page 269).• Focus on the four issues raised by the Africa Partnership Forum, 2011.
Write them on the board and discuss why each is important for effective development programmes in Africa.
• Discuss the contributions of over 0,7% of the GNI of wealthy countries towards aid. Table 5.5.1 shows the highest contributors, and Table 5.5.2 shows countries that had not reached the target of 0,7% for aid giving. Are there any surprises?
Lesson 2
• Allocate this lesson for the completion of Activity 1.
Activity 1• Go through this activity with the learners so that they understand what is
expected of them.• Let them work on the activity in pairs or individually.• Allow time at the end of the lesson to go through the learners’ answers.
Lesson 3
• Work through the section, ‘What types of development aid are there – technical, conditional, humanitarian?’ (page 273).
• Refer to Table 5.5.3 that shows the types of aid, with examples. • The Green Revolution was studied in Grade 9. Ask the learners what it
means and write their points on the board. Refer to Figure 5.5.7 which shows the outcome of improvements brought about by the Green Revolution.
Activity 2• Go through this activity with the learners so that they understand what is
expected of them. Set it as a homework task.• If learners have time at the end of the lesson, they can start working on
this activity.
• Point out problems of conditional aid.
131M O D U L E 5 • D E V E L O P M E N T G E O G R A P H Y : G E O G R A P H I C A L K N O W L E D G E
Activity 3• Use the questions in this activity for class discussion. Alternatively, set it
as a written homework task.
• Read the case study, ‘Money in the bank’ (page 277) with the learners.
Activity 4• Allow learners to begin the activity in class and then complete it as
homework.• Let learners work on this activity in pairs.
Lesson 4
• Go through the answers to Activities 2 and 4 with the class.• Work through the section, ‘What is the impact of aid on development?’
(page 278). Discuss the fact that aid is not always positive, and can be viewed with suspicion by states as a form of neo-colonialism, is often subject to corruption, and is rarely paid back.
• Figure 5.5.10 shows the fact that most aid has little effect on economic growth.
• Discuss the criticisms of giving aid and ask learners for their opinions of how aid can be useful.
Activity 5• Allow learners to begin the activity in class and then complete it as
homework.• Learners need to complete the activity individually.
AnswersActivity 1 (Learner’s Book, page 272)
1. Countries will always need aid either because they are in dire poverty and need help to develop, or because of natural disasters, or because conflict has destroyed their infrastructure and economies and they need to rebuild.
2. a. Red Crossb. community outreach programmes; hospice
3. a. Answers will differ. To which four organisations; for what reason the money would be given.
b. Answers will differ.c. only some people may get the money; people giving the money may
be corrupt too; it might not be what the people want; people may resent the gift; aid in the form of work or assistance may be better accepted and needed
d. Work from the bottom-up with the community to ask their needs and how best to fill them.
4. Austria, Canada, Finland, Germany, Ireland5. No. They are small, but one of the wealthiest nations. Social conscience
is strong.
Activity 2 (Learner’s Book, page 275)
1. The use of technology and innovation in all forms of agriculture.2. Two tons per hectare in India (using FAO figures). Use Figure 5.5.7 for
the average for developing countries: it is one half ton per hectare.3. two and half tons per hectare (FAO figures)4. 500% increase
132 S E C T I O N 2 • L E S S O N - B Y - L E S S O N
5. Poorer countries do not have the infrastructure to maintain technology. Hybrid seeds can only be used for one sowing and farmers cannot buy more if they don’t have enough money.
Activity 3 (Learner’s Book, page 277)
1. Multilateral aid is aid given by many for many, e.g. UNESCO. Bilateral aid is between two countries and comes with strings attached, e.g. weapons for oil.
2. Conditional aid means there are conditions that have to be met before the aid is given. In this sense, a country is tied to a policy if it wants to keep the aid.
3. Bilateral aid is an extension of influence or power over the poorer country by the wealthy country. The USA’s bilateral aid packages are removed if a country acts independent of the USA or deals with countries that the USA is hostile towards.
Activity 4 (Learner’s Book, page 278)
1. Humanitarian aid helps people who are in distress or suffering.2. Advantages: people receive first-hand help in emergencies; food; clean
water; medicine; and shelter Disadvantages: aid can be abused; food and medicine can be sold on the
black market; shelters can be taken away in armed conflict3. identify priorities; provide protection; transport to the point of need;
provide basic needs; and safeguard the distribution of aid
Activity 5 (Learner’s Book, page 279)
1. A paragraph should contain several sentences. The paragraph should clearly show ‘disadvantages’ and ‘advantages’ of giving aid to developing countries.
Disadvantages: corrupt officials, armed conflict, looting, riots for receiving aid, a culture of dependency where aid is regarded as handouts to be expected.
Advantages: help in extreme need which is life-saving, can provide investment for community projects that are sustainable and help in economic growth, can prevent diseases, can increase knowledge of improved farming to sustain people.
Informal assessment• During discussion activities, listen to the learners’ contributions and
assess whether they have grasped the concepts taught in the unit. Also note whether their contributions are sufficiently insightful.
• For written activities other than Activity 5, go through the answers with the class. Encourage learners to share their answers. Let the learners swap books and mark each other’s work. For Activity 5, take the learners’ books in and assess their paragraphs yourself.
• Take in the learners’ notebooks about every third week to review their work yourself so that you are able to identify any problem areas.
Remedial/extensionRemedial: • Let learners who have difficulty with the concepts in this section
create a mindmap summary of the unit and a list of concepts and their definitions.
Extension:
133M O D U L E 5 • D E V E L O P M E N T G E O G R A P H Y : G E O G R A P H I C A L K N O W L E D G E
• Allow the learners to explore some of the websites indicated under ‘Resources’ on page 130 in this Teacher’s Guide.
• Ask the learners to select an aid agency from Table 5.5.3 (page 273) to research further.
Learner’s Book page 280
FIELDWORK 2 TERM 3
This fieldwork task is linked to the content of Module 3.
• Use a class atlas to find the area you are in.• If you have a 1:50 000 topographical map of your area, place this on
the wall for the learners to consult. (You can obtain one from the Department of Land Surveying and Mapping, Mowbray, Cape Town).
• Remind the learners about what is needed to present their assessment: A4 paper, a sketch map of the area, and Core and Periphery annotated on the sketch map. Learners must refer to the sketch map when they discuss levels of development in the Core and Periphery.
• Remind learners of the Core-Periphery Model and the terms associated with it which they need to use correctly, such as backwash; spread; trickle-down; trickle-up.
• Ask them how the model can be applied to the area where they are. • Get them to create mindmaps and to share their ideas. Put some of their
ideas on the board.• Go through the ‘What to do’ list.• The sketch map can be done in class.• Encourage the learners to draw two columns, labelled ‘core’ and
‘periphery’. They can list the differences in levels of development in this table, as a start.
• Ask a learner to explain one point under his/her list of core, and one point from the periphery column.
• Why was the point chosen? What is the reason for the development or lack of development? What positive or negative effects can flow from each point?
• Once the learners understand the process of analysis, explanation, and the evaluation and assessment of the impact of the differences in development in the area, they are in a position to offer their own opinion in a conclusion.
• The conclusion must comment on what is necessary to bring a more equal state of development to the area.
• Point out that the standard of living must not drop; one hopes to raise the standard of living for all people.
134 S E C T I O N 2 • L E S S O N - B Y - L E S S O N
DEVELOPMENT GEOGRAPHY:
GEOGRAPHICAL SKILLS AND
TECHNIQUES
MODULE 6TERM 3Learner’s Book pages 281–296Duration: 5 hours
This module focuses on geographical skills and techniques related to development geography. Learners explore how maps can be used to determine the position and location of human settlements as well as how we calculate and determine distances between places and features on maps.
Curriculum and Assessment Policy Statement (CAPS) content
Mapwork skills (with reference to 1:50 000 topographic maps) • Locating exact position: degrees, minutes and seconds• Relative position: direction and magnetic bearing• Scale: word, ratio and line scale• Distance: measuring distances and converting to ground distance,
straight line and curved (practise)• Calculating area
Using atlases (revision) • Using the index• Locating places on different maps using degrees and minutes• Comparing information from different maps
Key geographical skills and techniques• using verbal, quantitative and symbolic data forms such as texts, pictures,
graphs, tables, diagrams and maps• applying communication, thinking, practical and social skills• processing, interpreting, and evaluating data • working co-operatively and independently
Key words/conceptsreference grid; minute; second; site; location; settlement; relative position; direction; magnetic bearing; true bearing; back bearing; scale; distance; straight line distance; curved distance; area; thematic map
135M O D U L E 6 • D E V E L O P M E N T G E O G R A P H Y : G E O G R A P H I C A L S K I L L S A N D T E C H N I Q U E S
UNIT 1 Mapwork skills (with reference to 1:50 000 topographic maps)
TERM 3, WEEK 8
Learner’s Book pages 282–292Duration: 4 hours
Curriculum and Assessment Policy Statement (CAPS) conten
Mapwork skills (with reference to 1:50 000 topographic maps) • Locating exact position: degrees, minutes and seconds• Relative position: direction and magnetic bearing• Scale: word, ratio and line scale• Distance: measuring distances and converting to ground distance,
straight line and curved (practise)• Calculating area
Resources• Learner’s Book pages 282–292• Atlases• Websites (optional): – http://atschool.eduweb.co.uk/woodhouse-high/maptitlepage.htm
– http://www.teachingideas.co.uk/geography/contents.htm
Preparation• Read through the unit and familiarise yourself with the content that you
will need to teach. Think about what the learners may already know about the topics and any areas of difficulty that you think they might encounter.
Teaching the unit
Lesson 1
• For the first five minutes of the lesson, brainstorm with the learners to find out what they know about locating the exact position of a place on a map.
• Work through the section, ‘How do we locate exact position on a map?’ (page 282).
• Draw attention to Figure 6.1.1 which shows the lines of latitude and longitude.
• Table 6.1.1 (page 282) summarises information that should already be familiar to the learners.
• Draw the learners’ attention to the method of grid referencing. Provide other examples if necessary.
• Draw the correlation between ‘site and location’ with that of ‘position’. • Focus on the two different types of settlements: rural and urban.• Emphasise the importance of Table 6.1.2 (page 284) which concentrates
on the main differences between subsistence farming and commercial farming.
• Focus on Table 6.1.3 (page 286) which details the four main urban land-use zones in South Africa.
Activity 1• Allow learners to begin the activity in class.• Allocate some time at the end of the lesson to go through the answers
with the learners. Let them share their answers with the rest of the class.
136 S E C T I O N 2 • L E S S O N - B Y - L E S S O N
Lesson 2
• Explain what ‘relative position’ is.• Work through the sections, ‘How do we locate relative position?’ and
‘Compass direction’ (page 286) with the learners.
Activity 2• Allow learners to begin the activity in class and then complete it as
homework.• If you do not have an atlas for each learner, allow them to work in pairs
or small groups.
• Work through the section, ‘Magnetic bearing’ (page 287) with the learners. Focus on the methods of how to determine true bearing (TB) and back bearing (BB). Provide additional examples, if necessary.
Activity 3• Allow learners to begin the activity in class.• Refer learners to the Roodepoort 1:50 000 topopgraphical map (page 288)
to measure and determine TB and BB.• Observe learners while they are doing the activity.• Go through the answers with the class.
Lesson 3
• If necessary, go through the answers to Activity 2 with the class.• Work through the section, ‘What are the three types of scale used on
maps?’ (page 289). Emphasise the different types of scale used.• Focus on the importance of scale for both the topographical and
orthophoto maps.
Activity 4• Allow learners to begin the activity in class and then complete it
as homework.• Remind them that this is the scale from the Roodepoort 1:50 000
topographical map in Figure 6.1.8 (page 288).
Lesson 4
• Go through the answers to Activity 4 with the class.• Work through the section, ‘How do we measure distances?’ (page 290). • Emphasise the correlation between scale and distance.• Emphasise the difference between straight line distance and curved
distance. Draw learners’ attention to Figure 6.1.10 and Figure 6.1.11 (page 290).
• Draw attention to the method of calculating distance. Use the example to show how distance is measured. Provide more examples if necessary.
Activity 5• Allow learners to do the activity in class.• Observe how learners use scale to calculate distance.• Go through the activity with learners and encourage learners to
offer answers.• Work through the case study example of area with the learners. Focus on
the method used for calculations.
137M O D U L E 6 • D E V E L O P M E N T G E O G R A P H Y : G E O G R A P H I C A L S K I L L S A N D T E C H N I Q U E S
Activity 6• Allow learners to do the activity in class.• Observe how learners calculate area.• Go through the activity with learners and encourage learners to
offer answers.
AnswersActivity 1 (Learner’s Book, page 286)
1. Lines of latitude: lines running parallel to the equator. Lines of longitude: lines that run vertically on a map.
2. Degrees: the distance a line of longitude or latitude is from the Greenwich Meridian Line or equator. Seconds: a minute on a map is divided into seconds. Minutes: the segment of the latitudinal or longitudinal line on a map.
3. Dispersed: farmsteads are widely scattered. Nucleated: farmsteads are situated close together.
4. primary functions; large agricultural land available; water availability; minimal services rendered; low-order functions
5. tertiary and secondary functions; CBD; built-up areas; more services rendered; high-order functions; planned infrastructure
6. CBD or central business district consists of high rise buildings, commercial activities, high rentals; industrial areas have large open land available to them, wide streets so that trucks can turn easily, curving roads for the same reason; residential areas are single-storey buildings, buildings are generally spaced apart from each other, there is greenery; recreational areas will have open sites, trees, tennis courts or golf estates or football fields, paths for running.
Activity 2 (Learner’s Book, page 287)
1. A cargo liner must sail southeast.2. The goods must be transported southwest.3. The imported goods must be transported southeast.
Activity 3 (Learner’s Book, page 289)
1. 125º2. 55º3. 157º4. 23º
Activity 4 (Learner’s Book, page 290)
1. 1:50 0002. ratio scale3. 1 cm on the map represents 50 000 cm in reality4. word scale/line scale
Activity 5 (Learner’s Book, page 291)
1. distance on map = 5,5 cm scale of map = 1:50 000 therefore, 1 cm = 50 000 ______ 100 000 = 0,5 km distance in reality = distance on map × scale = 5,5 cm × 0,5 km = 2,75 km
138 S E C T I O N 2 • L E S S O N - B Y - L E S S O N
2. distance on map = 3 cm scale of map = 1:50 000 therefore, 1cm = 50 000 ______ 100 000 = 0,5 km distance in reality = distance on map × scale = 3 cm × 0,5 km = 1,5 km
Activity 6 (Learner’s Book, page 292)
1. scale of map = 1:50 000
therefore, 1 cm = 50 000 ______ 100 000 = 0,5 km area of map = length (L) × breadth (B) L = 9,5 cm B = 7,5 cm L = 9,5 cm × 0,5 km
= 4,75 km and B = 7,5 cm × 0,5 km
= 3,75 km therefore, L × B = 4,75 km × 3,75 km = 17,8 km2
Informal assessmentActivity 1• Go through the answers with the class. Encourage learners to
give answers.
Activity 2• Go through the answers with the class. Encourage learners to
give answers. • Let the learners swap books and mark each other’s work. Activity 3• Go through the answers with the class. Encourage learners to
give answers. • Encourage learners to offer answers in an open forum.
Activity 4• Go through the answers with the class. Encourage learners to
give answers. • Encourage learners to offer answers in an open forum. • Ask those learners who under achieved in the activity to do the remedial
activity below.
Activities 5 and 6• Observe the learners as they complete the activity.• Go through the answers with the class. Encourage learners to give answers. • Let the learners swap books and mark each other’s work.
Remedial/extensionRemedial: • Allow learners to do more calculations with scale, distance and area using
the Roodepoort 1:50 000 topographical map in Figure 6.1.8 (page 288).
139M O D U L E 6 • D E V E L O P M E N T G E O G R A P H Y : G E O G R A P H I C A L S K I L L S A N D T E C H N I Q U E S
UNIT 2 Using atlases
TERM 3, WEEK 9
Learner’s Book pages 293–296Duration: 1 hour
Curriculum and Assessment Policy Statement (CAPS) content
Using atlases (revision) • Using the index• Locating places on different maps using degrees and minutes• Comparing information from different maps
Resources• Learner’s Book pages 293–296• Websites (optional):
– http://www.ehow.com/how_2069524_use-atlas.html
Preparation• Read through the unit and familiarise yourself with the content that you
will need to teach. Think about what learners may already know about the topics and any areas of difficulty that you think they might encounter.
Teaching the unit
Lesson 1
• Work through the unit with the learners. Allow learners to ask questions as you go along.
• Focus on how the index of an atlas is used. • Focus on comparing information from the different maps of Somalia.
Make sure learners know and understand that each different map provides different information about Somalia.
• Allow time for the learners to complete the activities.
Activity 1• Allow learners time to do the activity in class.• If you do not have an atlas for each learner, allow them to work in pairs
or small groups.• Assist those learners who need help. • Go through the answers with the class.
Activity 2• Allow learners to complete the activity in class.• Go through the answers with the class. Encourage learners to
give answers.
Activity 3• Allow learners to complete the activity in class.• Observe how learners work to find the location of Somalia. • Go through the answers with the class. Encourage learners to
give answers.
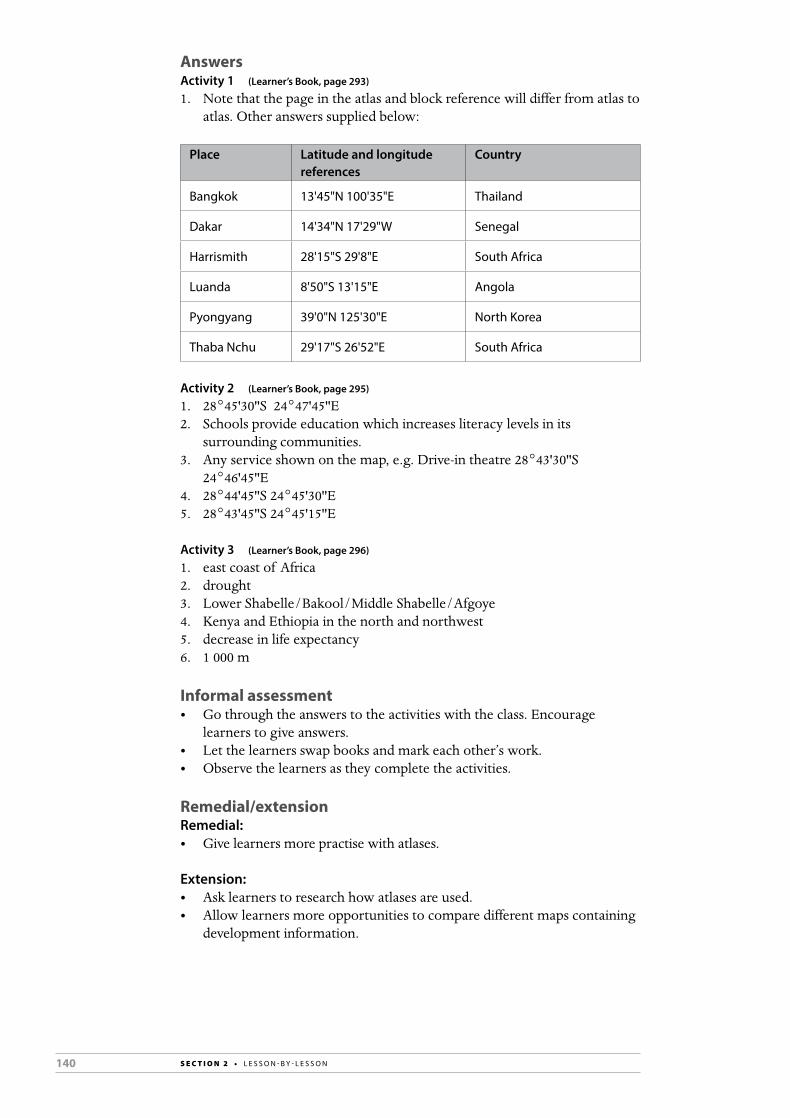
140 S E C T I O N 2 • L E S S O N - B Y - L E S S O N
AnswersActivity 1 (Learner’s Book, page 293)
1. Note that the page in the atlas and block reference will differ from atlas to atlas. Other answers supplied below:
Place Latitude and longitude references
Country
Bangkok 13'45"N 100'35"E Thailand
Dakar 14'34"N 17'29"W Senegal
Harrismith 28'15"S 29'8"E South Africa
Luanda 8'50"S 13'15"E Angola
Pyongyang 39'0"N 125'30"E North Korea
Thaba Nchu 29'17"S 26'52"E South Africa
Activity 2 (Learner’s Book, page 295)
1. 28°45'30''S 24°47'45''E2. Schools provide education which increases literacy levels in its
surrounding communities.3. Any service shown on the map, e.g. Drive-in theatre 28°43'30''S
24°46'45''E4. 28°44'45''S 24°45'30''E5. 28°43'45''S 24°45'15''E
Activity 3 (Learner’s Book, page 296)
1. east coast of Africa2. drought3. Lower Shabelle/Bakool/Middle Shabelle/Afgoye4. Kenya and Ethiopia in the north and northwest5. decrease in life expectancy6. 1 000 m
Informal assessment • Go through the answers to the activities with the class. Encourage
learners to give answers. • Let the learners swap books and mark each other’s work.• Observe the learners as they complete the activities.
Remedial/extensionRemedial: • Give learners more practise with atlases.
Extension:• Ask learners to research how atlases are used.• Allow learners more opportunities to compare different maps containing
development information.
141M O D U L E 6 • D E V E L O P M E N T G E O G R A P H Y : G E O G R A P H I C A L S K I L L S A N D T E C H N I Q U E S
Learner’s Book pages 297–298Duration: 2 hours
REVIEW TERM 3
These activities provide an opportunity for learners to consolidate concepts and skills learnt in Term 3. Learners can complete them in class or as homework. It is suggested that they complete the activities individually as a means of self-assessment.
You can write the answers on the board for the learners and/or call them out where more appropriate. However, if possible, it is suggested that you photocopy the answers and give them to the learners so that they have them for revision purposes.
Activity 1 (Learner’s Book, page 297)
1. Human Development Index2. It assesses the levels of development by looking at standards of living.3. HDI gives the human side of development. GDP does not measure
personal income or levels of development or standard of living, but only the total value of the country’s production.
4. life expectancy, education and GNP per person5. infant mortality and life expectancy6. Australia, New Zealand, Europe, North America, Argentina and Chile7. there are few people living there (Greenland); it may be a repressive
regime (North Korea); it may be an area of conflict (western Sahara)8. a. poor infrastructure, particularly with education; education and
work opportunitiesb. These are the areas that are focused on: education, life expectancy
and GNP per person. If a country ranks low, it is because it has not invested in its infrastructure, so that education and health issues affect training and skills, as well as life expectancy and infant mortality. If skills are low, there is unemployment, and consequently, income per person is low.
Activity 2 (Learner’s Book, page 297)
1. Any five: resources; trade; investment; infrastructure; technology; quality of life; productive output
2. renewable and non-renewable; human and physical3. Yes and no. A country can export its resources in raw form, but receive
little money in return as no value has been added. This will slow or prevent its development. If a country has focused on education, its human capital is well developed. It may import raw materials at a low cost and use its human capital to add value to the products which are exported at a higher cost, bringing more wealth to the country.
Activity 3 (Learner’s Book, page 298)
1. See Figure 5.2.10 on page 234 in the Learner’s Book.2. environment; economy; society3. a. Backwash effect happens when resources from the periphery are used
for the core. It is a negative effect.b. Spread effect happens when skills, investment and infrastructure
trickles-down from the core to the periphery. It is a positive effect.
© You may photocopy this page for use with Study & Master Geography Grade 11.
142 S E C T I O N 2 • L E S S O N - B Y - L E S S O N
Activity 4 (Learner’s Book, page 298)
1. It shows the social, legal, political and economic discrimination that women face.
2. Gender equality has been adopted as a goal to be reached by 2015 across the world. This would stop discrimination against women in particular, and allow them equality in every respect.
3. It prevents half of the workforce from contributing to development.4. Maputo Protocol5. Women represent an available, but untapped human resource.
Their equality with men would double the workforce and increase productivity. Their additional income would increase the multiplier effect in the economy, which brings in more investment for the infrastructure of the country.
Activity 5 (Learner’s Book, page 298)
a. Multilateral aid is done by international organisations in many countries.b. Bilateral aid is conditional aid between two countries, with strings
attached.c. Technical aid is the transfer of knowledge in agriculture, technology or
engineering.d. Humanitarian aid is aid for individuals in times of natural disaster or civil
disturbances.e. Emergency aid is a short-term response to a natural disaster or civil crisis.
Activity 6 (Learner’s Book, page 298)
1. a. 10°0'N, 84°0'Wb. 30°30'S, 25°45'Ec. 60°0'N, 86°0'Wd. 39°5'N, 86°0'W
2. a. 34°2'S, 23°2'Eb. 25°49'S, 25°30'Ec. 25°29'S, 30°59'Ed. 28°48'S, 32°6'E
3. a. Accrab. Benonic. Dakar
© You may photocopy this page for use with Study & Master Geography Grade 11.

143M O D U L E 7 • R E S O U R C E S A N D S U S TA I N A B I L I T Y : G E O G R A P H I C A L K N O W L E D G E
TERM 4Learner’s Book pages 300–396Duration: 20 hours
RESOURCES AND SUSTAINABILITY:
GEOGRAPHICAL KNOWLEDGE
MODULE 7
This module deals with resources. It investigates our relationship with resources, including our sustainable use of resources. Soil is investigated as a fundamental resource, necessary for all plant, animal and human life. Ways in which soil can be conserved from erosion, and managed, are part of this section. Then our attention turns to conventional and unconventional sources of energy and the management of energy in South Africa – all critical topics for more sustainable living.
Curriculum and Assessment Policy Statement (CAPS) content
Using resources • The relationship between resources and economic development• Exploitation and depletion of resources• Concepts of sustainability and sustainable use of resources
Soil and soil erosion • How soils are formed• Soil as a resource• Causes of soil erosion: human, animal, physical, and past and present • Evidence of soil erosion in South Africa• Effects of soil erosion on people and the environment• Management strategies to prevent and control soil erosion
Conventional energy sources and their impact on the environment • Maps and graphs to show thermal, hydro, and nuclear energy
production in South Africa• Thermal electricity generation using coal – outline of principles
and processes• The impact of coal mining and thermal power stations –
environmental despoliation, solid waste, waste gases and acid rain• Case study of nuclear energy – advantages and disadvantages• South Africa’s potential to meet long-term energy needs using
conventional sources
Non-conventional energy sources • Solar energy – examples from South Africa and the world• Wind energy – examples from South Africa and the world• Future of non-conventional energy in South Africa• Possible effects of using more non-conventional energy on the
South African economy and the environment
Energy management in South Africa • South Africa’s changing energy needs• Energy management, towards greener economies and sustainable life
styles: responsibilities of governments, businesses and individuals
144 S E C T I O N 2 • L E S S O N - B Y - L E S S O N
Key geographical skills and techniques• using verbal, quantitative and symbolic data forms such as texts, pictures,
graphs, tables, diagrams and maps• applying communication, thinking, practical and social skills• identifying questions and issues• collecting and structuring information• processing, interpreting and evaluating data• making decisions and judgements• deciding on a point of view• suggesting solutions to problems• working co-operatively and independently• showing concern for the sustainable and fair use of resources for the
benefit of all• applying geographical knowledge and skills• promoting fairness, sustainability and equality
Key words/conceptsnatural resource; exploitation; depletion; sustainability; biotic; abiotic; soil profile; zone of eluviation; zone of accumulation; bedrock; erosion; eutrophication; conventional energy sources; non-renewable resources; fossil fuel; thermal energy; combustion; thermal electricity; surface mining; coal seam; underground mining; longwall mining; room-and-pillar mining; kinetic energy; environmental despoliation; environmental degradation; overburden; solid waste; waste gases; acid rain; pH scale; uranium; nuclear radiation; nuclear meltdown; potential energy; renewable; solar energy; solar thermal power; silicon chip; photovoltaic energy; photon; electrons; wind energy; wind power; onshore wind turbine; offshore wind turbine; capacity factor
UNIT 1 Using resources
TERM 4, WEEK 1
Learner’s Book pages 301–310Duration: 3 hours
Curriculum and Assessment Policy Statement (CAPS) content
Using resources • The relationship between resources and economic development• Exploitation and depletion of resources• Concepts of sustainability and sustainable use of resources
Resources• Learner’s Book pages 301–310• Websites (optional): en.wikipedia.org/wiki/exploitation; www.bbc.
co.uk/home/Geography/resources; reef.edu.au/contents/ps/fr_resources; www.towards-sustainability.co.uk/
• Your school library may have the DVD, An Inconvenient Truth. This is about sustainability and the importance of conserving our resources, minimising unnecessary resource exploitation, and preventing pollution of the planet.
• If possible, research the international conference held in Durban in November 2011 about climate change, called ‘COP 17’. Some of the outcomes will continue to be mentioned in magazines, in TV reports and in newspapers.
145M O D U L E 7 • R E S O U R C E S A N D S U S TA I N A B I L I T Y : G E O G R A P H I C A L K N O W L E D G E
Preparation• Read through the unit and familiarise yourself with the content that you
will need to teach. Think about what learners may already know about the topics and any areas of difficulty that you think they might encounter.
Teaching the unit
Lesson 1
• Work through the section, ‘What is the relationship between resources and economic development?’ (page 301). Point out that often countries that are wealthy in resources have failed to reach their economic potential and are amongst the LEDCs in the world.
• Refer to Table 7.1.1 which shows the relationship between resources and economic development for the top developed countries of the world and the least developed countries of the world. Discuss surprises that may arise: Switzerland has little natural capital, but its human capital is highly rated. Madagascar has a wealth of natural resources, but its human resources are fairly low in rating.
Activity 1• This activity consolidates the information and concepts covered so far
in the unit.• Allow learners to begin the activity in class and then complete it
as homework.
Lesson 2
• Go through the answers to Activity 1 with the class.• Work through the section, ‘How does the exploitation and depletion of
resources impact on the environment?’ (page 304). Point out the meaning of a negative connotation to the word ‘exploitation’ and ask learners why the word has this association.
• The map in Figure 7.1.2 shows the equatorial rain forests. You may want to find the countries where these lie, using class atlases or referring to a world map.
• Discuss the importance of the COP 17 conference in November 2011 in Durban.
• Refer to the diagram in Figure 7.1.4. It is the Environmental Kuznets Curve (EKC), which represents the relationship between changes in income or levels of economic development, and the rate of environmental pollution caused by a society.
• Figure 7.1.5 shows the remaining life span of a variety of natural resources if we continue to use them at the present rate. Ask learners why we need to use these resources, and what we use as alternatives.
Activity 2• Allow learners to begin the activity in class and then complete it
as homework.• Let them work in pairs or individually.
Activity 3• Go through this activity with the learners so that they understand what is
expected of them. Set it as a homework task.
146 S E C T I O N 2 • L E S S O N - B Y - L E S S O N
• If learners have time at the end of the lesson, they can start working on this activity.
Lesson 3
• Go through the answers to Activities 2 and 3 with the class.• Work through the section, ‘What actions can we take to ensure the
sustainable use of our resources?’ (page 307) with the learners.• Point out the irony in the situation of President Roosevelt discussing the
conservation of resources and then embarking on a hunting safari for thousands of trophies. Figure 7.1.6 shows him with one of his kills.
• Discuss the amendment to the Millennium Goals about sustaining bio-diversity; also the shared principles of sustainability that signatories agree to. Write this quotation on the board: ‘Sustainability is a 21st word for justice’, from Planeta.com’s website. Ask learners to consider and debate it.
Activity 4• Allow learners to begin the activity in class and then complete it
as homework.
AnswersActivity 1 (Learner’s Book, page 304)
1. People need resources to fulfil their basic needs, make their lives more comfortable and easy, as well as for complex answers to their wants.
2. No. Countries can trade what they can produce easily, for the items that they may need and can’t produce easily. All countries have human resources which do need to be educated to a high level of technical skill and expertise. The example of Switzerland proves that you do not have to have a high level of natural resources to become wealthy and economically developed.
3. Developing countries often export their raw materials without any value added, for example, in the manufacturing process. The value is then less, and the human capital may remain untrained and uneducated, causing slow economic growth. ‘The Dutch disease’ occurs when a country focuses only on one of its raw materials for export, at the expense of diversifying or beginning domestic manufacturing, so that the country slows its overall growth.
4. Where the human capital is high, so is produced capital, even if natural resource wealth is low, e.g. Switzerland. Madagascar shows the opposite: when human capital is low, so is produced capital, even if natural resource wealth is high.
Activity 2 (Learner’s Book, page 307)
1. Any four: population increases; more space for housing; more space for agriculture; more need for resources; more space for transport communications
2. they act as the lungs of the world, taking in carbon-dioxide and giving out oxygen; they have thousands of species of plant and animal and bird life; they are a resource for medicines; they cannot be replenished in our life time
3. The tropical rain forests of the world are found in most of the LEDCs that need to use their resources for export and for their own needs.
147M O D U L E 7 • R E S O U R C E S A N D S U S TA I N A B I L I T Y : G E O G R A P H I C A L K N O W L E D G E
4. Burning rain forests means that smoke enters the atmospheric winds and gets carried elsewhere. The smoke is one of the contributors to global warming which affects everyone.
5. Forest destruction causes global warming and climate change. The Durban Conference was about climate changes.
Activity 3 (Learner’s Book, page 307)
1. the relationship between environmental pollution and economic growth2. Once a turning point is reached at a certain level of economic
development, environmental degradation and pollution slows down and reverses, as countries look after their natural resources through conservation programmes.
3. the depletion of our natural resources if we continue to use them at the present (2009 figures on graph) rate of consumption.
4. a. indiumb. aluminium
5. indium, silver, antimony, tin, lead, gold, zinc, uranium, copper, nickel6. We will have to do without them, or find alternatives.7. through sustainable development; or slowing our use; using alternatives;
conserving and managing what exists now
Activity 4 (Learner’s Book, page 310)
1. Answers should include: there will be nothing left for our children if we continue to use resources at this rate.
2. His hunting destroyed thousands of animals, thus leaving nothing for our children.
3. 1987 with the outcome of the Brundtland Commission4. The UN wants to make the world aware of the importance of
sustainable development because it wants to stop exploitation of natural resources, depletion of natural resources, and economic growth from being affected.
5. Answers must include: the wealthy use 80% of the resources, but only form 20% of the world population – yet they want to stop the other 80% of poorer people from using the remaining resources for themselves to get out of poverty.
6. own answers
Informal assessmentActivity 1• Correct the questions in Activity 1 by asking learners for their answers
and writing them on the board if more than one good suggestion is made.
Activities 2-4• Go through the answers with the class. Encourage learners to
give answers. • Let the learners swap books and mark each other’s work.
148 S E C T I O N 2 • L E S S O N - B Y - L E S S O N
Remedial/extensionRemedial: • Learners who need extra practice with the concepts in this unit can
complete Worksheet 19 on pages 308–310 in the Resources section of this Teacher’s Guide. This worksheet can also be used for revision purposes.
Extension:• Allow the learners to explore some of the websites indicated under
‘Resources’ (page 144) of this Teacher’s Guide.• Let learners find out more about the Kyoto Protocol and how successful
it has or has not been in addressing climate change.
UNIT 2 Soil and soil erosion
TERM 4, WEEKS 1–2
Learner’s Book pages 311–324Duration: 5 hours
Curriculum and Assessment Policy Statement (CAPS) content
Soil and soil erosion • How soils are formed• Soil as a resource• Causes of soil erosion: human, animal, physical, and past and present• Evidence of soil erosion in South Africa• Effects of soil erosion on people and the environment• Management strategies to prevent and control soil erosion
Resources• Learner’s Book pages 311–324• Wall world map or atlases• Websites (optional): en.wikipedia.org/wiki/soil; www.
enchantedlearning.com/geolog/soil; www.bcb.ac.za/envfacts/facts/soil; www.environment.gov.za/enviro-info
Preparation• Read through the unit and familiarise yourself with the content that you
will need to teach. Think about what learners may already know about the topics and any areas of difficulty that you think they might encounter.
Teaching the unit
Lesson 1
• Work through the section, ‘How are soils formed?’ (page 311). Draw the soil profile in Figure 7.2.1 on the board and use Table 7.2.1 to describe the characteristics of a soil profile. Explain how the diagram is a model of a well-developed profile that shows all the layers. In reality, layers may be smaller or larger, depending on the factors that produce the soil.
Activity 1• Let the learners draw Figure 7.2.1 themselves in answer to question 1 and
then annotate the soil profile sketch in question 2 and question 3.• They can complete this activity in class.• Allow time at the end of the lesson to go through the activity with them.

149M O D U L E 7 • R E S O U R C E S A N D S U S TA I N A B I L I T Y : G E O G R A P H I C A L K N O W L E D G E
Lesson 2
• Work through the section, ‘How is soil a valuable resource?’ (page 313).• Refer to Figure 7.2.2 to point out where the most fertile soils in the world
are found, the mollisols and alfisols. You can show that these soil areas coincide with the grain growing areas of Europe, Asia, the Americas, and India. Point out the absence of these soils in Africa, and the limited supply around the coastline of New Zealand. Discuss the relationship between distribution of soil types and LEDCs or MEDCs.
• Use a world map or class atlases to locate the fertile river valleys of the Tigris, Euphrates, Indus, Ganges, Mekong, Irrawaddy, Nile and Mississippi. The importance of rivers and flood plains for water and alluvial soil is tied to people’s first settlements and the development of towns.
Activity 2• Allow learners to begin the activity in class and then complete it
as homework.• If you do not have an atlas for each learner, allow them to work in pairs
or small groups.
Lesson 3
• Go through the answers to Activity 2 with the class.• Work through the section, ‘What are the causes of soil erosion: human,
animal, physical, and past and present?’ (page 315) with the learners.• Refer to Figures 7.2.3, 7.2.4 and 7.2.5 to show the scale of soil erosion.
Figure 7.2.6 shows the impact a single drop of rain has on the surface of the earth. From this, we can understand how heavy rains cause soil erosion on a large scale.
• Write on the board, ‘causes of soil erosion’ and two headings – ‘people’ and ‘nature’. Ask the class for causes of soil erosion for each of the categories, and write them on the board to consolidate learning.
Activity 3• Allow learners to begin the activity in class and then to complete it
as homework.
Lesson 4
• Go through the answers to Activity 3 with the class.• Work through the section, ‘What evidence is there of soil erosion in
South Africa?’ (page 317) with the learners.• Refer to Figure 7.2.8 which shows the catchment area of the Orange
River. Use class atlases or refer to a large wall map of South Africa which shows the provinces. Locate the provinces that lie in the catchment area of the Orange River. Ask the class what responsibilities these provinces have in conserving soil erosion and managing the flow of the river.
Activity 4• Allow learners to begin the activity in class and then to complete it
as homework.• If you do not have an atlas for each learner, allow them to work in pairs
or small groups.
150 S E C T I O N 2 • L E S S O N - B Y - L E S S O N
Lesson 5
• Go through the answers to Activity 4 with the class.• Work through the section, ‘What are the effects of soil erosion on people
and the environment?’ (page 319). Ask learners to describe areas close to the school where there is soil erosion, or if they have encountered muddy streams, eroded pathways, and wind storms.
Activity 5• Use the questions in this activity for a class discussion. Alternatively, set it
as a written homework task.
• Work though the section, ‘What management strategies can be used to prevent and control soil erosion?’ (page 321). Use the board to consolidate learning of the ways in which people can conserve the soil and manage it as a resource. Ask the learners for their ideas and use the text in the Learner’s Book as your resource.
• Figures 7.2.11, 7.2.12 and 7.2.13 are photographic evidence of how people are managing the problem of soil erosion. Refer to them to emphasise the work you have put on the board about conservation and management strategies.
• Figure 7.2.14 highlights our need to conserve the soil. It shows the food chain in the soil. Remind learners that fertile soil is a combination of organic matter and other matter, and that for fertility to be maintained or enhanced in a sustainable manner, we must encourage the growth of organisms in the soil. Otherwise we will be forced to buy at a high cost, artificial organic supplements in the form of fertilisers.
• Refer to the diagram in Figure 7.2.15 which shows how vegetation can be best used to protect the soil, because soil is such a valuable resource.
Activity 6• Work through Activity 6 in class, going through the answers with the
learners. You can draw the sketches on the board or ask a learner to do this.
AnswersActivity 1 (Learner’s Book, page 313)
1. Refer to Figure 7.2.1 on page 312 in the Learner’s Book.2. a. B horizon
b. D horizonc. C horizond. A horizone. E horizonf. O horizon
3. a. Lateriteb. Pedalferc. Pedocal
Activity 2 (Learner’s Book, page 315)
1. It takes between 100 and 400 years to form 1 cm of soil. Soil is necessary as the basis of plant life, on which animals, birds and humans directly and indirectly depend on food.
2. Aridisols and Entisols3. Mollisols: USA, Canada, Russia, China, Argentina
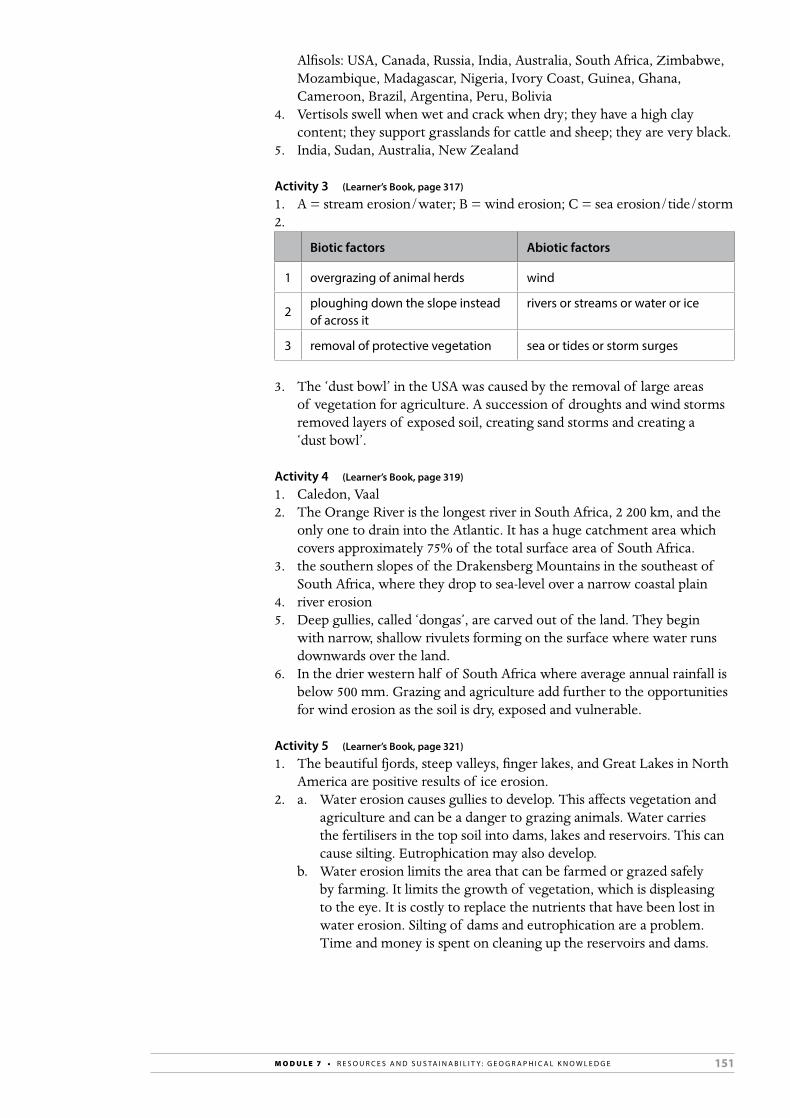
151M O D U L E 7 • R E S O U R C E S A N D S U S TA I N A B I L I T Y : G E O G R A P H I C A L K N O W L E D G E
Alfisols: USA, Canada, Russia, India, Australia, South Africa, Zimbabwe, Mozambique, Madagascar, Nigeria, Ivory Coast, Guinea, Ghana, Cameroon, Brazil, Argentina, Peru, Bolivia
4. Vertisols swell when wet and crack when dry; they have a high clay content; they support grasslands for cattle and sheep; they are very black.
5. India, Sudan, Australia, New Zealand
Activity 3 (Learner’s Book, page 317)
1. A = stream erosion/water; B = wind erosion; C = sea erosion/tide/storm2.
Biotic factors Abiotic factors
1 overgrazing of animal herds wind
2ploughing down the slope instead of across it
rivers or streams or water or ice
3 removal of protective vegetation sea or tides or storm surges
3. The ‘dust bowl’ in the USA was caused by the removal of large areas of vegetation for agriculture. A succession of droughts and wind storms removed layers of exposed soil, creating sand storms and creating a ‘dust bowl’.
Activity 4 (Learner’s Book, page 319)
1. Caledon, Vaal2. The Orange River is the longest river in South Africa, 2 200 km, and the
only one to drain into the Atlantic. It has a huge catchment area which covers approximately 75% of the total surface area of South Africa.
3. the southern slopes of the Drakensberg Mountains in the southeast of South Africa, where they drop to sea-level over a narrow coastal plain
4. river erosion5. Deep gullies, called ‘dongas’, are carved out of the land. They begin
with narrow, shallow rivulets forming on the surface where water runs downwards over the land.
6. In the drier western half of South Africa where average annual rainfall is below 500 mm. Grazing and agriculture add further to the opportunities for wind erosion as the soil is dry, exposed and vulnerable.
Activity 5 (Learner’s Book, page 321)
1. The beautiful fjords, steep valleys, finger lakes, and Great Lakes in North America are positive results of ice erosion.
2. a. Water erosion causes gullies to develop. This affects vegetation and agriculture and can be a danger to grazing animals. Water carries the fertilisers in the top soil into dams, lakes and reservoirs. This can cause silting. Eutrophication may also develop.
b. Water erosion limits the area that can be farmed or grazed safely by farming. It limits the growth of vegetation, which is displeasing to the eye. It is costly to replace the nutrients that have been lost in water erosion. Silting of dams and eutrophication are a problem. Time and money is spent on cleaning up the reservoirs and dams.
152 S E C T I O N 2 • L E S S O N - B Y - L E S S O N
3. Answer should include reasons why soil erosion should be prevented. Points that should be present are: soil is a valuable resource; soil is non-renewable; people depend on soil; soil erosion is unsightly; combating the effects is costly; it is dangerous to animals in the fields; it prevents the growth of trees; and it can limit the space available for cultivation.
Activity 6 (Learner’s Book, page 324)
1. soil is a vital resource; it is non-renewable; it nourishes life2. through poor farming techniques, insensitive development, and removal
of natural vegetation3. a. Wetlands act as sponges, protecting flooding and further erosion.
b. Grasslands bind the soil, and slow the impact of rain by giving cover to the earth, and preventing water erosion.
4. top dressing; closer inter-locked planting of trees; spaced tree planting; wind breaks; debris dams; protection of river banks; encouraging wetlands; and placing barriers across the steep gradients
5. A triangle with 5 levels: the base is 1 and the top is 5. 1 = photosynthesis; 2 = decomposers, mutualists, pathogens, parasites and root feeders; 3 = shredders, predators, grazers; 4 = higher level predators, e.g. moles; 5 = highest level predators, e.g. birds and animals.
Informal assessment• For Activities 1 to 4, go through the answers with the class. Encourage
learners to share their answers. Let the learners swap books and mark each other’s work.
• During Activities 5 and 6, listen to the learners’ contributions and assess whether they have grasped the concepts taught in the unit. Also note whether their contributions are sufficiently insightful.
Remedial/extensionRemedial: • Let learners who have difficulty with the concepts in this section create a
mindmap summary of the unit and a list of concepts and their definitions.
Extension:• Allow the learners to explore some of the websites indicated under
‘Resources’ (page 148) of this Teacher’s Guide.• Let learners find out an innovative soil management project that is
rehabilitating the soil in a specific area or protecting its quality.
153M O D U L E 7 • R E S O U R C E S A N D S U S TA I N A B I L I T Y : G E O G R A P H I C A L K N O W L E D G E
UNIT 3 Conventional energy resources and their impact on the environment
TERM 4, WEEKS 3–4
Learner’s Book pages 325–352Duration: 5 hours
Curriculum and Assessment Policy Statement (CAPS) content
Conventional energy sources and their impact on the environment • Maps and graphs to show thermal, hydro, and nuclear energy production
in South Africa• Thermal electricity generation using coal – outline of principles
and processes• The impact of coal mining and thermal power stations – environmental
despoliation, solid waste, waste gases and acid rain• Case study of nuclear energy – advantages and disadvantages• South Africa’s potential to meet long-term energy needs using
conventional sources
Resources• Learner’s Book pages 325–352• Atlases• Websites (optional)
– For information on conventional energy sources and their impact on the environment:
http://mhathwar.tripod.com/thesis/intro/environment.html– For information on environmental impacts of renewable energy
technologies: http://www.ucsusa.org/clean_energy/technology_and_impacts/
impacts/environmental-impacts-of.html– For information on clean energy:
http://www.ucsusa.org/clean_energy/
Preparation• Read through the unit and familiarise yourself with the content that you
will need to teach. Think about what the learners may already know about the topics and any areas of difficulty that you think they might encounter.
Teaching the unit
Lesson 1
• For the first five minutes of the lesson, brainstorm with the learners to find out what they know about conventional energy sources. Encourage all learners to participate in an interactive discussion.
• Work through the section, ‘Where are thermal, hydro and nuclear energy produced in South Africa?’ (page 325) with the learners.
• Emphasise that conventional energy sources is another name for non-renewable energy sources.
• Point out Figure 7.3.1 (page 325) which shows the world’s energy sources.
• Point out Figure 7.3.2 (South Africa’s main energy supply in 2007) to learners and explain the importance of coal. Explain why South Africa uses coal to generate thermal electricity.

154 S E C T I O N 2 • L E S S O N - B Y - L E S S O N
Activity 1• The activity requires learners to understand the difference between
conventional and non-conventional energy sources. • Allow learners to begin the activity in class and then complete it
as homework.
• Work through the section, ‘Principles involved in coal-generated thermal electricity’ (page 327) with the learners.
• Point out Table 7.3.1 (South African coal reserves) to learners. Use the map of South Africa in Figure 7.3.4 (page 328) to show learners where the coal reserves are located.
Activity 2• Learners need to use interpretative skills to complete the activity.
Encourage the learners to read through the whole activity before trying to answer any of the questions.
• Go through this activity with the learners so that they understand what is expected of them. Set it as a homework task.
• If learners have time at the end of the lesson, they can start working on this activity.
Lesson 2
• Go through the answers to Activities 1 and 2 with the class.• Work through the section, ‘The processes involved in coal-generated
thermal electricity’ (page 329) with the learners. • Explain why the process of surface or open-cast mining is conducted. Explain to learners why the process of underground mining is conducted.• Point out to learners the difference between the process of longwall
mining (Figure 7.3.6, page 330) and the process of room-and-pillar mining (Figure 7.3.8, page 331).
• Use an atlas and Table 7.3.2 (page 332) to show learners the location of fossil fuel power plants in South Africa.
Activity 3• Learners need to know the nine provinces in order for them to answer
some of the questions.• Go through this activity with the learners so that they understand what is
expected of them. Set it as a homework task.• If learners have time at the end of the lesson, they can start working on
this activity.
• Brainstorm with the learners to find out what they know about the environmental impact of coal mining and thermal power stations. Encourage all learners to participate in an interactive discussion.
• Work through the section, ‘Environmental despoliation’ (page 333) with the learners. Emphasise the effects of environmental despoliation. Explain the difference between environmental despoliation and environmental degradation.

155M O D U L E 7 • R E S O U R C E S A N D S U S TA I N A B I L I T Y : G E O G R A P H I C A L K N O W L E D G E
Activity 4• This activity focuses on environmental despoliation.• Allow learners to work in groups of four. Encourage all learners to
participate in the group discussion.• Go through the answers with the class.
Lesson 3
• Go through the answers to Activity 3 with the class.• Work through the sections, ‘Solid waste dumping’ (page 335) and
‘Air pollution: waste gases’ (page 336) with the learners.• Explain to learners what ‘waste gases’ are.• Show learners how dust is blown from mine dumps situated close to the
Krugersdorp area.• Explain what acid rain is and why it is detrimental to the environment.
Activity 5• This activity focuses on thermal pollution in the environment.• Let the learners complete it on their own.• Allow learners to begin the activity in class and then to complete it
as homework.
• Explain what nuclear energy is.• Work through the section, ‘What are the advantages and disadvantages
of nuclear energy?’ (page 338) with the learners.• Draw their attention to Figure 7.3.16 on page 338, the Koeberg Nuclear
Power Station at work.• Point out the geographical location of the Koeberg Nuclear Power
Station in Figure 7.3.18.• Focus on why nuclear energy is important for the Cape Town area.
Activity 6• This activity focuses on nuclear energy.• Let the learners complete it in pairs.• Observe how learners interact and listen to their discussions.• If there is time at the end of the lesson, go through the answers with
the learners.
Lesson 4
• Go through the answers to Activity 5 with the class. If you did not have time to do this for Activity 6 at the end of the previous lesson, go through these answers too.
• Work through the section, ‘The disposal of radioactive solid waste’ (page 340) with the learners.
• Emphasise the process of the disposal of radioactive solid waste from the Koeberg Nuclear Power Station.
• Point out the importance of the ‘capping process’ by referring to the pictures (page 341).
• Discuss the importance of the advantages and disadvantages of nuclear energy by referring to Table 7.3.4 (page 342).
156 S E C T I O N 2 • L E S S O N - B Y - L E S S O N
Activity 7• This activity focuses on the disposal of solid waste from nuclear
power stations.• Let the learners work in pairs.• Allow learners to begin the activity in class and then to complete it
as homework.
• Read through the two case studies on the Chernobyl and Fukushima nuclear disasters with the learners.
• Explain the effects of radiation by referring to Figure 7.3.29 (page 345).
Activity 8• Allow learners to begin the activity in class and then to complete it
as homework.
Lesson 5
• Go through the answers to Activities 7 and 8 with the class.• For the next five minutes of the lesson, brainstorm with the learners to
find out whether they think South Africa can meet its long-term energy needs using conventional energy sources.
• Work through the section, ‘Can South Africa meet its long-term energy needs using conventional energy resources?’ (page 346) with the learners.
• Discuss the effects of increasing coal-generated electricity supply for South Africa.
• Emphasise the effects of increasing nuclear energy for South Africa.• Emphasise the process of the pumped hydro-electric storage scheme by
using the flow chart (page 348). It is important for learners to understand the process.
• Point out the advantages and disadvantages of hydro-electric energy by referring to Table 7.3.5 (page 349).
Activity 9• This activity focuses on South Africa’s hydro-electrical power stations.• Go through this activity with the learners so that they understand what is
expected of them. Set it as a homework task.
• Work through the case study on the Palmiet Pumped Hydro-electric Storage Scheme (page 350).
Activity 10• This activity focuses on the case study.• Allow learners to begin the activity in class and then to complete it
as homework.
Activity 11• Go through this activity with the learners so that they understand what is
expected of them. Set it as a homework task.• If learners have time at the end of the lesson, they can start working on
this activity.
Activity 12• This activity focuses on South Africa’s management of conventional
energy sources.
157M O D U L E 7 • R E S O U R C E S A N D S U S TA I N A B I L I T Y : G E O G R A P H I C A L K N O W L E D G E
• Go through this activity with the learners so that they understand what is expected of them. Set it as a homework task.
• If learners have time at the end of the lesson, they can start working on this activity.
AnswersActivity 1 (Learner’s Book, page 327)
1. Conventional energy resources refers to energy provided by traditional means. It includes fossil fuels and other non-renewable resources, which take millions of years to form and cannot be replaced as fast as they are used up. Non-conventional energy resources are alternative sources of energy.
2. Any two: coal; natural gas; oil3. When thermal energy is used to generate electricity, a large amount of
heat is produced by the combustion of fossil fuels in fossil fuel power plants. Thermal energy that is used to generate electricity is called thermal electricity.
4. 93,8%5. Hydro-electricity is a renewable source of energy. Water can be replaced
unlike other conventional energy sources which are non-renewable and take millions of years to form.
6. South Africa is increasing its generation of nuclear and hydro-electric energy in order to lessen the usage of coal generation.
Activity 2 (Learner’s Book, page 328)
1. highveld2. 31%3. 30%4. South Rand and Utrecht5. The Limpopo Province hosts about 50% of the country’s coal reserves.6. South Western Cape7. Yes, coal is one of South Africa’s main energy resources. Almost 90%
of South Africa’s energy supply comes from conventional energy sources, with almost three-quarters coming from non-renewable fossil fuels, for example, coal.
Activity 3 (Learner’s Book, page 333)
1. Mpumalanga. Twelve of South Africa’s 20 fossil fuel power plants are situated in Mpumalanga.
2. KwaZulu-Natal3. Kusile4. Medupi will have the same installed capacity as Kusile when it becomes
operational.5. 176. due to South Africa’s increasing energy needs
Activity 4 (Learner’s Book, page 334)
1. Advantages – coal produces a lot of energy; large coal reserves are still available in South Africa; surface mining is a relatively easy way to mine when coal deposits are found in shallow coal seams.
Disadvantages – burning coal causes the emission of carbon dioxide, nitrous oxide, sulphur dioxide and other air pollutants; underground mining is dangerous and causes health risks to miners; coal mining causes environmental degradation; the cost of mining and production of coal is increasing.

158 S E C T I O N 2 • L E S S O N - B Y - L E S S O N
2. Environmental degradation is the erosion of the environment through the depletion of natural resources, the destruction of ecosystems, and the extinction of plant and animal species. Environmental despoliation is the process of forcefully breaking down and removing the Earth’s surface.
3. mining4. Drilling and charging blast holes with explosives in order to breakdown
and destroy the Earth’s surface during surface mining; damaging and disrupting the existing vegetation and ecosystems; damaging the soil profile by removing trees, plants and topsoil from mining areas and causing soil erosion and flooding; changing and scarring the general topography and landscape of mining areas.
5. Reduce the extraction of coal reserves. Encourage businesses to move towards green economies that rely on non-conventional energy sources.
Activity 5 (Learner’s Book, page 337)
1. Air pollution is the release of waste gases into the atmosphere, including carbon dioxide, nitrous oxide, sulphur dioxide and other air pollutants.
2. global warming and acid rain3. Any two: carbon dioxide; nitrous oxide; sulphur dioxide4. Global warming is the slow increase in the average temperature of the
Earth’s oceans and lower atmosphere.5. Any two: melting snow and ice; rising sea levels; more extreme weather
(for example, storms, floods, droughts and heat waves); climate change; threat to ecosystems
6. Acid rain occurs when sulphur dioxide and nitrous oxide are released into the atmosphere and turn into acids. The acids then dissolve into moisture in the atmosphere, and fall to the Earth’s surface as very weak acid, in precipitation, in the form of rain, snow, vapour or fog.
7. Any two: damage to, and death of, plants and trees; water pollution; damage to buildings, metals and motor vehicles
8. No, because globally it is the main cause of increased carbon dioxide emissions.
Activity 6 (Learner’s Book, page 340)
1. Nuclear energy is the use of uranium to produce energy.2. uranium3. Nuclear energy is produced through a process called nuclear fission,
which occurs in a nuclear reactor in a nuclear power plant. During this process, uranium atoms are split and a large amount of nuclear energy is released. This energy heats water to create steam; the steam spins a large turbine generator, which produces electricity.
4. due to increasing energy needs in the Western Cape5. Koeberg Nuclear Power Station6. two7. one8. during peak demand periods

159M O D U L E 7 • R E S O U R C E S A N D S U S TA I N A B I L I T Y : G E O G R A P H I C A L K N O W L E D G E
Activity 7 (Learner’s Book, page 342)
1. nuclear rods2. The process whereby radioactive waste is buried at Vaalputs is called the
capping process:• steel drums containing nuclear rods are delivered and examined • the steel drums are off-loaded into a landfill site, which consists of
cement troughs cast deep into the Earth’s surface• the cement troughs are covered and sealed with clay• the radioactive waste is safely closed and buried.
3. Northern Cape4. Nuclear rods contain uranium which is a radioactive mineral resource
and is the main source of poisonous radioactive waste. Radioactivity occurs when particles of radioactive material enter the environment and the human body and cause nuclear radiation.
5. Any two: nuclear power stations can produce energy if coal and oil become exhausted; if operated properly, nuclear power stations give very little exposure to radiation; nuclear energy is an economical source of energy because less fuel in the form of uranium is used in comparison to the amount of coal used in fossil fuel power stations; nuclear energy is a sustainable source of energy as less greenhouse gases are released from nuclear power stations, decreasing environmental degradation; the production of nuclear energy is not affected by changing weather conditions
6. it is very expensive to extract uranium; there are serious medical, environmental and economic risks due to nuclear radiation, from leaks and overheating of nuclear reactors; the disposal of solid radioactive waste from nuclear power stations is expensive as it must be buried safely underground to prevent dangerous nuclear radiation
Activity 8 (Learner’s Book, page 345)
1. Ukraine2. Soviet Union; Scandanavia; United Kingdom3. Large amounts of fauna and flora died shortly after the explosion.
Infrastructure (roads, buildings, bridges, drainage pipes and electricity cables) disintegrated.
4. Economic development declined; medical care and evacuation costs rose to approximately US$250 000.
5. Yes, nuclear fission went out of control in the nuclear reactor causing a nuclear explosion and the emission of huge amounts of nuclear radiation.
6. Japan7. The Fukushima Nuclear Power Station was struck by a tsunami, caused
by an earthquake off the Japanese coastline. 8. After an explosion in Reactor One, which caused a nuclear leak, the
Japanese government faced the threat of the cooling system in Reactor Three failing. Steam containing small amounts of nuclear radiation was released from the power station to reduce pressure in Reactor Three.
9. The accident at the Chernobyl Nuclear Power Station was more severe and destructive, as more lives were lost than at the Fukushima Nuclear Power Station.
10. Safety measures must take priority. Residential areas must be located far away from nuclear power stations in case of nuclear leaks. With the development and planning stages of nuclear stations, safety must take preference.
11. Learners own opinion with a good justification.
160 S E C T I O N 2 • L E S S O N - B Y - L E S S O N
Activity 9 (Learner’s Book, page 350)
1. eight2. In the Western Cape, Eastern Cape, Free State and KwaZulu-Natal.3. During peak periods of demand for electicity in the Western Cape,
electricity from the Palmiet Pumped Hydro-electric Storage Power Station is used to supplement the electricity supplied by the Koeberg Nuclear Power Station.
4. Palmiet Pumped Hydro-electric Storage Power Station in the Drakensberg
Activity 10 (Learner’s Book, page 351)
1. Western Cape2. During peak demand periods for electricity, water is released from the
upper Rockview Dam into two reversible turbines at the pumping plant. The water goes through the turbines to produce hydro-electric energy. During the off-peak periods the reversible turbines pump the water back from the lower Kogelberg Dam to the upper Rockview Dam, where it is stored for later use during peak demand periods. The Scheme operates on a weekly cycle.
3. during peak and emergency demand periods for electricity in the winter season in the Western Cape
4. Kogelberg Dam on the Palmiet River and the Rockview Dam between the Steenbras and Palmiet Rivers
Activity 11 (Learner’s Book, page 351)
1. Free State and KwaZulu-Natal2. 40 000 MW3. The energy generated by the Ingula Pumped Storage Scheme will be
used to generate power to the national electricity grid.
Activity 12 (Learner’s Book, page 352)
1. South Africa has 40% of coal reserves left.2. No. It is a conventional source of energy.3. • Over the next 10 years there will be an imbalance between the supply
and demand of coal. • The existing reserves need to be used in a more sustainable way if
they are to last more than a century.4. Hydro-electric power is a renewable source of energy. With South
Africa’s limited coal reserves and the high emissions of carbon dioxide it would be advisable to develop more hydro-electric power.
5. South Africa has a low average rainfall and the Western Cape experiences severe drought during their summer months.
6. yes7. Yes, South Africa is rich in uranium. South Africa exports uranium
to China.8. • South Africa’s rugged, continuous coastline is ideal for the
development of nuclear power stations, as it allows for the cooling of reactors with ocean water.
• Enough uranium to support the demand and needs of the increasing population.
9. There are many risks involved such as health risks and safety risks.
161M O D U L E 7 • R E S O U R C E S A N D S U S TA I N A B I L I T Y : G E O G R A P H I C A L K N O W L E D G E
Informal assessment Activity 1• Observe how learners apply themselves when answering the activity.
Do they continuously look up the answers or do they remember the work taught.
• Go through the answers with the class. Encourage learners to offer answers.
• Those learners who under-achieved in this activity need to do the remedial activity below.
Activity 2• Go through the answers with the class. Encourage learners to
give answers. • Let the learners swap books and mark each other’s work.• Those learners who under-achieved in this activity could do the remedial
activity below.
Activities 3–5• Go through the answers with the class. Encourage learners to
give answers.
Activity 6• Go through the answers with learners.• Those learners who under-achieved in this activity need to do the
remedial activity below.
Activities 7–12• Go through the answers with the class. Encourage learners to share
their answers. • Let the learners swap books and mark each other’s work.• Take in the learners’ notebooks at the end of the unit to review their
work yourself so that you are able to identify any problem areas.
Remedial/extensionRemedial: Let learners who have difficulty with the concepts in this section complete the following questions.1. Define the following concepts: thermal energy, nuclear energy, hydro-
electrical energy.2. Why is it important to manage the disposal of solid waste from nuclear
power stations?3. Explain how radioactive waste from the Koeberg Nuclear Power Station
is disposed of.4. What percentage of South Africa’s national energy supply does Koeberg
Nuclear Power Station generate?
Answers:1. Thermal energy is heat in transfer. It is not the same as heat, but is the
energy that is given off during the process of heat being transferred from one source to another. Nuclear energy is generated from uranium rods in nuclear power stations. Hydro-electrical energy: when water is released from a great height, the velocity or speed causes potential energy stored in the water to change energy.

162 S E C T I O N 2 • L E S S O N - B Y - L E S S O N
2. The nuclear rods used to generate nuclear energy contain uranium which is a radioactive mineral resource and is the main source of poisonous radioactive waste.
3. The process whereby radioactive waste is buried at Vaalputs is called the capping process: Steel drums containing nuclear rods are delivered and examined. The steel drums are off-loaded into the landfill site, which consists of cement troughs cast deep into the Earth’s surface. The cement troughs are covered and sealed with clay. The radioactive waste is safely closed and buried.
4. 5%
Extension:• Ask learners to work in pairs to research the benefits of conventional
energy use for South Africa.
UNIT 4 Non-conventional energy sources
TERM 4, WEEKS 4–5
Learner’s Book pages 353–378Duration: 4 hours
Curriculum and Assessment Policy Statement (CAPS) content
Non-conventional energy sources • Solar energy – examples from South Africa and the world• Wind energy – examples from South Africa and the world • Future of non-conventional energy in South Africa• Possible effects of using more non-conventional energy on the South
African economy and the environment
Resources• Learner’s Book pages 353–378• Websites (optional):
– For information about solar energy: http://en.wikipedia.org/wiki/Solar_energy
– For information about wind energy: http://www.windturbinestore.co.za/
Preparation• Read through the unit and familiarise yourself with the content that you
will need to teach. Think about what learners may already know about the topics and any areas of difficulty that you think they might encounter.
Teaching the unit
Lesson 1
• Work through the section, ‘What is solar energy?’ (page 353) with the learners.• Point out Figure 7.4.3 (page 355) which shows the components required
to generate photovoltaic electricity.
Activity 1• This activity provides an opportunity for learners to create a summary of
the material covered thus far in the unit.

163M O D U L E 7 • R E S O U R C E S A N D S U S TA I N A B I L I T Y : G E O G R A P H I C A L K N O W L E D G E
• Allow them to begin the activity in class and then to complete it as homework.
• Brainstorm with the learners to find out what examples of solar energy from South Africa they know of.
• Work through the section, ‘Examples of solar energy from South Africa’ (page 355) with the learners.
• Emphasise the annual solar radiation in South Africa by referring to Figure 7.4.4 (page 355).
• Work through the section, ‘Examples of solar energy from Africa’ (page 356) with the learners.
• Point out Figure 7.4.11 (page 359) which emphasises a practical alternative to providing power to remote areas.
Activity 2• This activity is based on the case study, ‘The Sun is free’ (page 358).• Allow learners to begin the activity in class and then to complete it
as homework.
Lesson 2
• Go through the answers to Activities 1 and 2 with the class.
Activity 3• Use the questions in this activity for class discussion. Alternatively, set it
as a written homework task.
• Work through the section, ‘Which global areas are suitable for solar energy?’ (page 359) with the learners.
• Draw the learners’ attention to Figure 7.4.13 (page 360), which shows photovoltaic solar resources in different countries.
Activity 4• This activity consolidates the concepts associated with solar energy.• Go through this activity with the learners so that they understand what is
expected of them. Set it as a homework task.• If learners have time at the end of the lesson, they can start working on
this activity.
• Brainstorm with the learners to find out what they know about wind energy.
• Work through the section, ‘What is wind energy?’ (page 361) and ‘The process of generating electricity from wind energy’ (page 362) with the learners.
• Show learners how wind turbines are arranged in large groups on a wind farm and connected to a network to generate electricity by referring to Figure 7.4.17 (page 363).
• Explain the three different kinds of wind turbines.• Explain how a wind turbine works by referring to Figure 7.4.18 (page 363).
Activity 5• This activity consolidates the concepts associated with wind energy.• Go through this activity with the learners so that they understand what is
expected of them. Set it as a homework task.• If learners have time at the end of the lesson, they can start working on
this activity.

164 S E C T I O N 2 • L E S S O N - B Y - L E S S O N
• Work through the section, ‘Examples of wind energy from South Africa’ (page 364) with the learners. Draw the learners’ attention to the wind energy projects detailed in Table 7.4.1 (page 364).
• Work through the sections, ‘Examples of wind energy from Africa’ (page 365) and ‘Examples of wind energy from other areas in the world’ (page 366) with the learners.
• Begin the section, ‘Which global areas are suitable for wind energy’. Refer to Table 7.4.2 (page 367) on wind energy installed capacity of the top 10 countries.
Activity 6• Allow learners to begin the activity in class and then to complete it
as homework.• They could work in pairs or individually.
Lesson 3
• Go through the answers to Activities 4, 5 and 6 with the class.• Continue to work through the section on which global areas are suitable
for wind energy.
Activity 7• This activity focuses on global wind energy capacity.• Use the questions in this activity for class discussion. Alternatively, set it
as a written homework task.
• Work through the section, ‘What is the future of non-conventional energy sources in South Africa?’ (page 372) with the learners.
• Read and emphasise the case study of South Africa’s carbon footprint (page 373).
Activity 8• This activity focuses on a case study. • Allow learners to begin the activity in class and then to complete it
as homework.• Let them work in pairs or small groups.
Lesson 4
• Go through the answers to Activity 8 with the class.• Work through the section, ‘The future for solar and wind energy in
South Africa’ (page 374) with the learners. • Explain the availability of wind power in South Africa by referring to
Figure 7.4.36. • Refer learners to the case study (page 376) to explain why South Africa
gets a US$250 million loan for wind and solar power.• Ask learners what the possible impact of using more non-conventional
energy would be on the South African economy and the environment. Allow learners to discuss this in an open forum.
• Work through the section, ‘What are the possible effects of using more non-conventional energy on the South African economy and the environment?’ (page 376) with the learners.
Activity 9• This activity focuses on the possible effects of using more non-
conventional energy in South Africa.
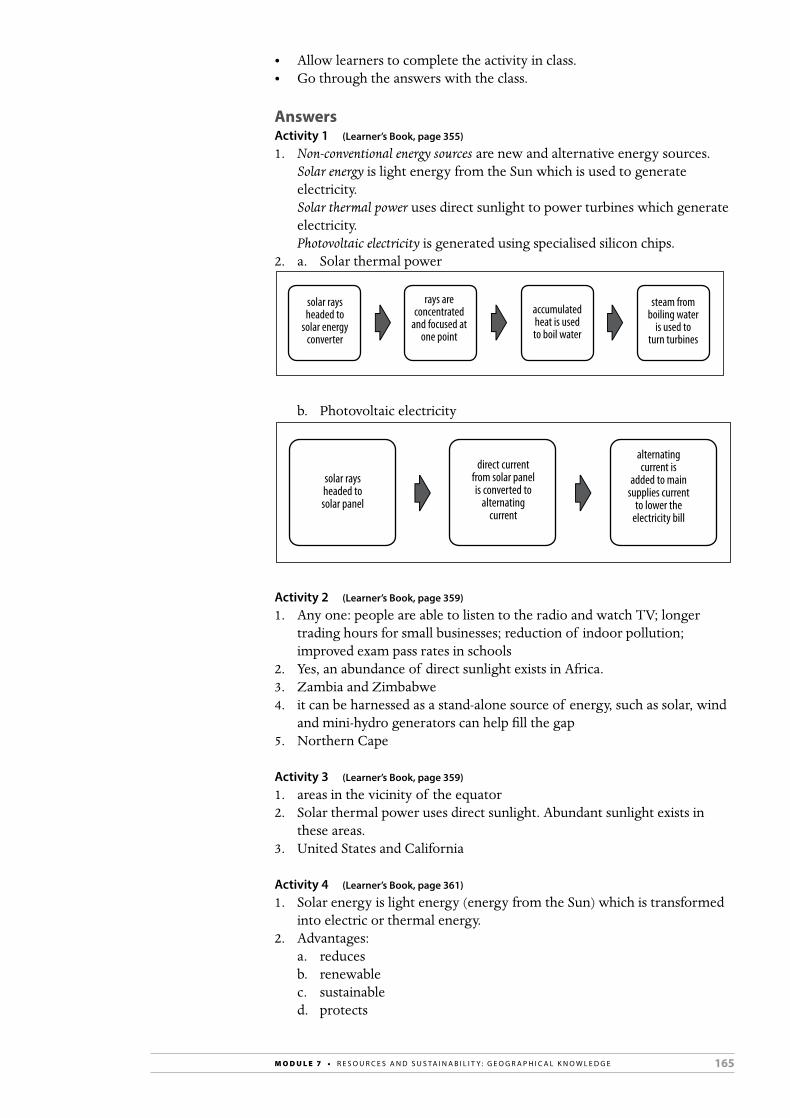
165M O D U L E 7 • R E S O U R C E S A N D S U S TA I N A B I L I T Y : G E O G R A P H I C A L K N O W L E D G E
• Allow learners to complete the activity in class.• Go through the answers with the class.
AnswersActivity 1 (Learner’s Book, page 355)
1. Non-conventional energy sources are new and alternative energy sources. Solar energy is light energy from the Sun which is used to generate
electricity. Solar thermal power uses direct sunlight to power turbines which generate
electricity. Photovoltaic electricity is generated using specialised silicon chips.2. a. Solar thermal power
solar raysheaded to
solar energyconverter
rays areconcentrated
and focused atone point
accumulatedheat is usedto boil water
steam fromboiling water
is used toturn turbines
b. Photovoltaic electricity
alternatingcurrent is
added to mainsupplies current
to lower theelectricity bill
direct currentfrom solar panelis converted to
alternatingcurrent
solar raysheaded tosolar panel
Activity 2 (Learner’s Book, page 359)
1. Any one: people are able to listen to the radio and watch TV; longer trading hours for small businesses; reduction of indoor pollution; improved exam pass rates in schools
2. Yes, an abundance of direct sunlight exists in Africa.3. Zambia and Zimbabwe4. it can be harnessed as a stand-alone source of energy, such as solar, wind
and mini-hydro generators can help fill the gap5. Northern Cape
Activity 3 (Learner’s Book, page 359)
1. areas in the vicinity of the equator2. Solar thermal power uses direct sunlight. Abundant sunlight exists in
these areas.3. United States and California
Activity 4 (Learner’s Book, page 361)
1. Solar energy is light energy (energy from the Sun) which is transformed into electric or thermal energy.
2. Advantages:a. reduces b. renewablec. sustainable d. protects
166 S E C T I O N 2 • L E S S O N - B Y - L E S S O N
e. diversify f. solution Disadvantage:a. unaffordable
Activity 5 (Learner’s Book, page 364)
1. Wind energy is the energy of the wind which is changed into electrical energy.
A wind farm is a whole system of turbines generating wind. 2. The greater the speed of the wind, the more electricity can be generated.3. Wind energy is enhanced by how often the wind blows and when it
blows.4. Areas with an annual average wind speed of around 20–28 km per hour
(6–8 m/s), at a height of 80 metres, are generally considered to have suitable wind power. This is because to work efficiently, a wind turbine needs a wind speed of at least 22 km per hour so that it can turn the turbine fast enough to generate electricity. If the wind is too slow, the turbines will not run. If it is too fast, the turbines will shut down.
5. offshore winds and onshore winds6. Any of the advantages mentioned in Activity 4, question 2.7. Wind turbines can be expensive; the blades can destroy airborne animals
like birds and bats, if erected in their migratory path. This will impact on the ecosystems; the rotors can produce noise pollution; wind turbines standing in a field or along a coastline ruin the natural landscape, especially in rural areas.
Activity 6 (Learner’s Book, page 368)
1. The global environment can make use of renewable energy more and more which will increase energy security.
2. Open ended answer. It could include: due to the negative impacts conventional energy has on the environment, e.g. global warming.
3. It is the total capacity of wind.4. The global use of wind energy is on the increase for the future.
Activity 7 (Learner’s Book, page 371)
1. The table gives us the region, the total capacity of wind and the contribution it makes to the global market.
2. Europe has the highest. Latin America & Caribbean has the lowest.3. They are developing countries and they do not have the capital to invest
in wind energy, whereas Europe is developed and has the money.4. Developed: Europe, North America, Pacific Region.
Developing: Africa and Middle East, Asia, and Latin America & Caribbean.
Activity 8 (Learner’s Book, page 374)
1. In 2008, South Africa faced a chronic shortage of electricity.2. Load shedding was used as a last resort to prevent the collapse of the
national supply grid. 3. No, it is estimated that load shedding will remain high until 2013.4. It is the amount of carbon emissions produced by a country.5. South Africa’s carbon footprint is already huge, with 93% of Eskom’s
electricity generated from coal-fired stations. 6. a. give off little or no carbon emissions
b. are inexhaustiblec. they are cheap
167M O D U L E 7 • R E S O U R C E S A N D S U S TA I N A B I L I T Y : G E O G R A P H I C A L K N O W L E D G E
Activity 9 (Learner’s Book, page 378)
1. energy usage will become cheaper; solar energy industry grows; job opportunities are created; biofuels industry sector grows
2. the environment will become cleaner; health facility grows; crops will grow better; lower pollution levels
3. Sustainable development means substituting our use of conventional energy sources with the responsible use of more sustainable, renewable resources.
Informal assessment Activities 1–3• Go through the answers with the class. Ask learners to offer answers. • Let the learners swap books and mark each other’s work.
Activity 4• Listen to the learners’ contributions and assess whether they have
grasped the concepts taught in the unit. Also note whether their contributions are sufficiently insightful.
Activities 5–8• Go through the answers with the class. Ask learners to offer answers. • Let the learners swap books and mark each other’s work.
Activity 9• Listen to the learners’ contributions and assess whether they have
grasped the concepts taught in the unit. Also note whether their contributions are sufficiently insightful.
Remedial/extensionRemedial:Let those learners who under-achieved in Activity 2 complete the following:1. Explain these terms: solar energy, wind energy.2. Are these statements True or False:
a. South Africa has extremely favourable conditions to generate electricity from solar energy.
b. Parts of the Sahara, Kalahari and Namib Deserts have very high average daily sunlight, with temperatures often reaching up to 45 ºC.
c. At the equator, the Sun is directly overhead all year round, which allows countries near to the equator to have high solar renewable energy.
d. Power generation of wind energy can happen via offshore wind only.
3. Name one type of wind turbine and provide an explanation for it.
Answers1. Solar energy is light energy (energy from the Sun) which is transformed to
electric or thermal energy. Wind energy is the energy of the wind which is changed into electrical energy, via wind turbines or windmills. It is a renewable resource.
2. a) T; b) T; c) T; d) F3. Any one: • the three bladed upwind turbine is most commonly used
• the large grid-connected wind turbine produces power more cheaply than earlier models

168 S E C T I O N 2 • L E S S O N - B Y - L E S S O N
• the blades of the larger turbines move more slowly than the smaller turbines making the blades easier to see and safer for airborne animals
Extension:• Let learners research information pertaining to the use of non-
conventional energy and how it will benefit South Africa.
UNIT 5 Energy management in South Africa
TERM 4, WEEK 5
Learner’s Book pages 379–392Duration: 3 hours
Curriculum and Assessment Policy Statement (CAPS) content
Energy management in South Africa • South Africa’s changing energy needs• Energy management, towards greener economies and sustainable life
styles: responsibilities of governments, businesses and individuals
Resources• Learner’s Book pages 379–392• Websites (optional):
– For information about solar aid: http://www.solar-aid.org/projects/sunnymoney-microsolar.html?gclid=CJreu_Oe0q0CFRIhtAod4T4t2A
– For information about energy management projects: http://agama.co.za/home/energy-management/projects-review
Preparation• Read through the unit and familiarise yourself with the content that you
will need to teach. Think about what learners may already know about the topics and any areas of difficulty that you think they might encounter.
Teaching the unit
Lesson 1
• For the first ten minutes of the lesson brainstorm with the learners to find out what they know about South Africa’s changing energy needs. Encourage all learners to participate in an interactive discussion.
• Work through the section, ‘What are South Africa’s changing energy needs?’ (page 379) with the learners.
• Emphasise that there is a demand for clean energy resources.• Use the case study of the Southern Kalahari (page 381) as an example of
rising temperatures.
Activity 1• This is a short activity that focuses on South Africa moving to a low
carbon economy.• Learners may do the activity in class and work on their own.• Allow time at the end of the lesson to go through the answers with
the learners.
169M O D U L E 7 • R E S O U R C E S A N D S U S TA I N A B I L I T Y : G E O G R A P H I C A L K N O W L E D G E
Lesson 2
• Work through the section, ‘What is energy management towards greener economies and sustainable lifestyles?’ (page 382) with the learners.
• Emphasise the importance of strategies for environmental sustainability.• Point out the ‘three pillars of a sustainable development’ by referring to
Figure 7.5.5 (page 383).• Explain what a ‘green economy’ is.• Focus on the benefits of green economies and the management strategies
to promote green economies.• Draw learners’ attention to the case study on the ‘GreenCape Initiative’
(page 384) so that learners may have a better understanding of what a green economy is.
Activity 2• This activity focuses on a case study.• Allow learners to work in pairs and to begin the activity in class. They
can complete it as homework.
Activity 3• This activity focuses on environmental sustainability.• Go through this activity with the learners so that they understand what is
expected of them. Set it as a homework task.• If learners have time at the end of the lesson, they can start working on
this activity.
Lesson 3
• Go through the answers to Activities 2 and 3 with the class.• Work through the section, ‘What is government’s responsibility towards
energy management?’ (page 385). Ask learners what they think the responsibility of governments should be.
• Emphasise South Africa’s government’s responsibility by referring to the Bill of Rights (page 385).
• Draw the learners’ attention to Figure 7.5.8 which illustrates the renewable energy output in South Africa.
• Emphasise the importance of businesses managing their energy resources effectively.
• Allow learners to read the case studies to gain a better understanding of sustainable energy management.
Activity 4• Allow learners to complete the activity in class.• Allow them to work in pairs. • Allow time at the end of the lesson to go through the answers.
• Emphasise the importance of individual responsibility towards the management of energy resources.
Activity 5• Allow learners to work in pairs to complete the activity in class.• Allow time at the end of the lesson to go through the answers.

170 S E C T I O N 2 • L E S S O N - B Y - L E S S O N
AnswersActivity 1 (Learner’s Book, page 382)
1. to reduce its carbon emissions2. the affect of population increase on natural resources3. Carbon emissions increase global warming, which causes rising sea levels,
rising temperatures and melting of polar ice caps.4. the environment is affected in a negative manner
Activity 2 (Learner’s Book, page 384)
1. Non-conventional energy use can become the pathway to sustainable energy, an energy source that will not become depleted.
2. Tax reforms and rebates that improve environmental sustainability should be well thought through. Subsidies, which provide for unsustainable economic activity and environmental degradation should not be supported as ‘businesses and their activities’ continue to exploit our natural capital.
3. environmental, societal and economical4. Environmental indicators measure how people are affected by the
environment in positive and negative ways.
Activity 3 (Learner’s Book, page 385)
1. A renewable energy and green economy conference in Cape Town.2. It is a new initiative to promote renewable energy and the green
economy in the Western Cape.3. One of the aims of the initiative is to achieve significant growth and jobs.4. The objective of the initiative is to ensure that the Western Cape is at the
forefront of green technology.5. The primary goals are to serve as a ‘shop window’ for the sector and
to promote the transition of the Western Cape economy to greater resource efficiency and a low-carbon future.
Activity 4 (Learner’s Book, page 389)
1. CSP – Concentrating Solar Power2. Yes, because it has high theoretical and technical potential.3. 174. No, it has low theoretical and technical potential.
Activity 5 (Learner’s Book, page 392)
1. Households are faced with the increasing cost of electricity and other forms of energy, as well as the ongoing possibility of disruptive load shedding.
2. ‘greening’ the energy supply of their homes and offices to supplant coal-fired electricity with clean, renewable alternatives
3. solar options4. Use other renewable and alternative options, including geothermal
energy, wind power, biomass and waste generation, gas and hydroelectric power.
171M O D U L E 7 • R E S O U R C E S A N D S U S TA I N A B I L I T Y : G E O G R A P H I C A L K N O W L E D G E
Informal assessment • Go through the answers to the activities with the class. Encourage
learners to share their answers. • Let the learners mark their own work or swap books and mark each
other’s work.• Take in the learners’ notebooks at the end of the unit to review their
work yourself so that you are able to identify any problem areas.
Remedial/extensionExtension:• Let the learners complete Worksheet 20 on pages 311–312 in the
Resources section of this Teacher’s Guide. It draws on all the concepts in this unit and focuses on energy management and climate change.
Learner’s Book page 393
FIELDWORK 3 TERM 4
This fieldwork task is linked to the content of Module 7, Unit 2.
TaskTo investigate and analyse soil profiles.
Preparation• Prepare the class for this fieldwork ahead of time. • Ensure that the place you will visit has soil that can be dug to at least
1 metre in depth.• Choose an afternoon and plan the fieldwork using the school term
calendar, or choose one whole day.• It may be necessary to book transport and write letters to parents ahead
of the exercise.• Make sure you have a suitable field or open area where you have
permission from the necessary authorities to dig a couple of trenches for checking the soil profile.
• Bring boots, clothes that can get dirty, spades, cameras, or cell phones with cameras.
• Remind learners of the factors that affect soil formation and the different layers in a soil profile.
Process• Take photos of the area before digging begins: this is for evidence of the
vegetation cover, topography, and any other factor that could help explain the profile you will see.
• Remind the learners to make a sketch of the area, and to make notes on the topography, vegetation, climate, rocks, drainage, farming, people’s impact on the environment, or anything else of interest in the area.
• Begin by digging a trench that is at least 1 metre deep. • Take photos of your progress. Try to show the layers in the profile in
your photo. Learners can sketch what they see.• If you are able to safely dig deeper and make a longer trench, you may
get more layers appearing.
172 S E C T I O N 2 • L E S S O N - B Y - L E S S O N
• When you have completed gaining your visual evidence, make sure that the soil is replaced, and that the area does not look unsightly. Collect any items brought for the exercise and bring them back to the school safely.
• If you have had to get permission to use the field, give a learner the task of writing a thank-you letter on behalf of the class.
Conclusion• The evaluation of the evidence of vegetation, topography, climate and
rock can be written up as homework. Learners must attach their field notes and sketches as part of the assignment.
• Neat diagrams, photos, sketch maps, are all visual evidence to be part of the investigation.
• In conclusion, the learner’s personal opinion must be given as to whether it is possible to make improvements to the soil profile that was recorded.
Geography in Practice 3 Resources and sustainability
TERM 4, WEEK 6
Learner’s Book pages 394–396
Geography topic: Resources and sustainability
Resources• Learner’s Book pages 394–396 • Drawing instruments
Background• This task focuses on Module 7 of Study & Master Geography Grade 11 and
therefore should be scheduled for after the learners have completed this module. (See Year plan on pages 6–15.)
• The skills covered in this task are making sketches, labelling diagrams, working with concepts and, evaluating arguments and expressing and supporting a point of view.
• Allow 1 hour of class time for the learners to begin the task. Learners who have not completed the task in class should do so for homework.
• The task in the Learner’s Book is out of 30 marks. You will need to convert this to a mark out of 20 for contribution of this assessment to the year mark. (See ‘Recording and reporting’ on page 201.)
Preparing the learners• Remind the learners that they should work on their own and answer
all questions.• Let them read through the task and ask questions about any part of it
that they do not understand.• Remind them that they can consult Module 7 in the Learner’s Book if
they need to.• Give them a due date for their completed tasks.
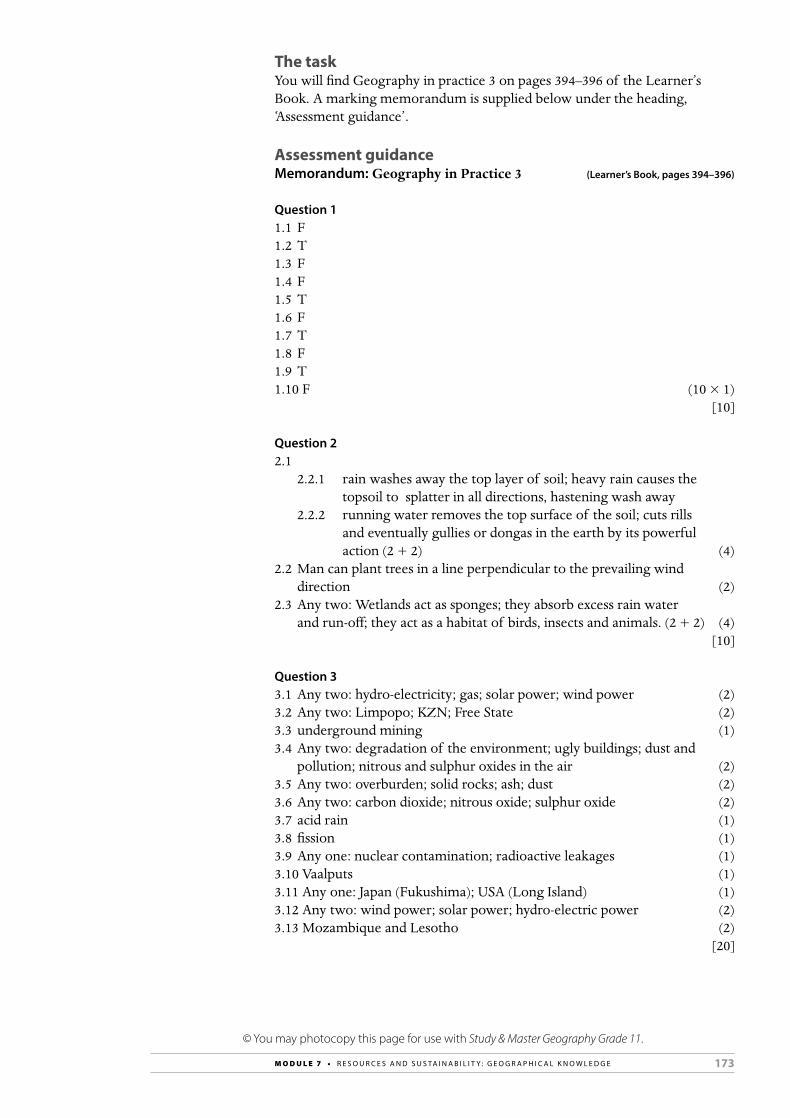
173M O D U L E 7 • R E S O U R C E S A N D S U S TA I N A B I L I T Y : G E O G R A P H I C A L K N O W L E D G E
The taskYou will find Geography in practice 3 on pages 394–396 of the Learner’s Book. A marking memorandum is supplied below under the heading, ‘Assessment guidance’.
Assessment guidanceMemorandum: Geography in Practice 3 (Learner’s Book, pages 394–396)
Question 11.1 F1.2 T1.3 F1.4 F1.5 T1.6 F1.7 T1.8 F1.9 T1.10 F (10 × 1)
[10]
Question 22.1 2.2.1 rain washes away the top layer of soil; heavy rain causes the
topsoil to splatter in all directions, hastening wash away 2.2.2 running water removes the top surface of the soil; cuts rills
and eventually gullies or dongas in the earth by its powerful action (2 + 2) (4)
2.2 Man can plant trees in a line perpendicular to the prevailing wind direction (2)
2.3 Any two: Wetlands act as sponges; they absorb excess rain water and run-off; they act as a habitat of birds, insects and animals. (2 + 2) (4)
[10]
Question 33.1 Any two: hydro-electricity; gas; solar power; wind power (2)3.2 Any two: Limpopo; KZN; Free State (2)3.3 underground mining (1)3.4 Any two: degradation of the environment; ugly buildings; dust and
pollution; nitrous and sulphur oxides in the air (2)3.5 Any two: overburden; solid rocks; ash; dust (2)3.6 Any two: carbon dioxide; nitrous oxide; sulphur oxide (2)3.7 acid rain (1)3.8 fission (1)3.9 Any one: nuclear contamination; radioactive leakages (1)3.10 Vaalputs (1)3.11 Any one: Japan (Fukushima); USA (Long Island) (1)3.12 Any two: wind power; solar power; hydro-electric power (2)3.13 Mozambique and Lesotho (2)
[20]
© You may photocopy this page for use with Study & Master Geography Grade 11.

174 S E C T I O N 2 • L E S S O N - B Y - L E S S O N
Question 44.1 Any two:
Advantages of nuclear power Disadvantages of nuclear power1 Clean Has potential life-threatening
hazards2 Less stock piling Expensive to start up3 Less impact on environment Needs safety procedures for storing
old waste(2 × 2) (4)
4.2 No. Due to South Africa mainly using conventional sources of energy and its demand for energy rapidly increasing due to an increase in population and economic growth rate, conventional sources of energy (which are mainly non-renewable energy resources) are being used up faster than they can be replaced and will eventually become depleted if not used sparingly. (2 + (1 × 2) (4)
4.3 The impact of opencast mining on the environment is great. Huge areas are stripped of their natural cover; grasslands are eradicated, or forests. The natural habitat of insects, birds, and small animals is destroyed. Pollution in the form of noise, air, visual pollution and pollution to the underground and freshwater supplies occur. When mining is underground, the equipment and dumps are above the ground, creating the same visual, air, water and noise pollution. (2 + (2 × 2) (6)
4.4 4.4.1 Energy management refers to the measures planned and
implemented to regulate the type of energy used and the amount of energy used. (2)
4.4.2 A sustainable lifestyle meets the needs of the present without compromising the ability of future generations to meet their own needs. (2)
4.4.3 A green economy fosters and implements sustainable development and economic growth. It can generate growth and improvements in people’s lives in ways consistent with sustainable development. (2)
[20]Total: 60 ÷ 3 = 20 marks
Total: 60 marks
© You may photocopy this page for use with Study & Master Geography Grade 11.
175M O D U L E 8 • R E S O U R C E S A N D S U S TA I N A B I L I T Y : G E O G R A P H I C A L S K I L L S A N D T E C H N I Q U E S
TERM 4Learner’s Book pages 397–410Duration: 4 hours
RESOURCES AND SUSTAINABILITY:
GEOGRAPHICAL SKILLS AND
TECHNIQUES
MODULE 8
This module provides the learners with an opportunity to further develop their practical skills and to consolidate what they have learnt about contours and landforms on topographical maps, GIS, drawing cross-sections and calculating vertical exaggeration and gradient. This is done within a context of extending their knowledge and understanding of the relationship between resources and sustainability.
Curriculum and Assessment Policy Statement (CAPS) content
Topographic maps (applications and revision)• Contours and landforms• Cross-sections on 1:50 000 maps• Vertical exaggeration• Inter-visibility• Gradient
Geographical Information Systems (GIS) • Spatially referenced data• Spatial and spectral resolution• Different types of data: line, point, area and attribute• Raster and vector data• Capturing different types of data from existing maps, photographs,
fieldwork or other records on tracing paper
Key geographical skills and techniques• analysing and explaining maps and photos• applying communication, thinking, practical and social skills• processing, interpreting, and evaluating data• understanding the role of people in the environment
176 S E C T I O N 2 • L E S S O N - B Y - L E S S O N
UNIT 1 Topographic maps
TERM 4, WEEK 6
Learner’s Book pages 398–404Duration: 2 hours
Curriculum and Assessment Policy Statement (CAPS) content
Topographic maps (applications and revision)• Contours and landforms• Cross-sections on 1:50 000 maps• Vertical exaggeration• Inter-visibility• Gradient
Resources• Learner’s Book pages 398–404• Tracing paper• Coloured pens or pencils
Preparation• Read through the unit and work through the activities yourself before
assigning them to the learners to complete.
Teaching the unit• This unit should be completed in two lessons. Apart from a brief
introduction by you in the first lesson, the rest of the time should be allocated to the learners working through the activities.
• Let the learners work individually or in pairs.• Ask the learners to work through the activities. Circulate around the
classroom providing assistance where necessary.• Remind learners to refer to Modules 2, 4 and 6 of the Learner’s Book for
assistance with the activities.
Lesson 1
• Introduce the module by explaining that all the skills and concepts, in this unit and the next, learners have come across earlier in the year and that these units provide an opportunity for the learners to revise them.
• Read through the information in the Learner’s Book about calculating distance using contours and landforms, drawing cross-sections and determining vertical exaggeration, intervisibility and gradient.
• Allow the rest of the lesson for the learners to complete Activities 1 to 7.• What learners are not able to complete in class they should complete
as homework.
Lesson 2
• Go through the answers to Activities 1 to 7 with the learners.• Allow the rest of the lesson for the learners to complete Activities 8 to 15.• What learners are not able to complete in class they should complete
as homework.

177M O D U L E 8 • R E S O U R C E S A N D S U S TA I N A B I L I T Y : G E O G R A P H I C A L S K I L L S A N D T E C H N I Q U E S
AnswersActivity 1 (Learner’s Book, page 398)
1. 170o
2. Slimes Dam3. South-Southwest4. 26º54'45''S 26º48'45''E5. Distance map = 6 cm Scale of map = 1:50 000 1 cm represents 50 000 cm
1 cm = 50 000 km _________ 100 000
Therefore, 1 cm represents 0,5 km Distance in reality = distance on map × scale = 6 cm × 0,5 km = 3 km
Activity 2 (Learner’s Book, page 398)
1. No, it has a gradual incline. The contour lines are far apart.2. a. Given scale = 1:50 000 HD = 2 cm Therefore the ground distance = 2 cm × 50 000 cm = 100 000 cm = 1 000 m
Gradient = VI ____ HD
= 1 308,1 – 1 294 ____________ 1 000 m
= 14,1 _______ 1 000 m
= 1 ____ 70,9
= 1:71b. Yes, the physical relief is flat to gradual for the development of
the waterworks.3. The contour heights on the mapped area indicate that Stilfontein is a
high-lying area situated at a high altitude (height above sea level) and therefore receives high amounts of solar radiation.
Activity 3 (Learner’s Book, page 400)
1. Vaal River2. West. The contour heights are decreasing in a westerly direction.3. The Vaal River provides water and irrigation for mining, cultivated land
and recreation on either side of the river.
Activity 4 (Learner’s Book, page 400)
1. The main primary activity is mining and the main secondary activity is industry.
2. gold3. six4. Shaft mining. Diggings, excavations, mine dumps, shafts and slime
dumps are shown on the map.5. road and railway6. Mining is the main primary activity in the mapped area.
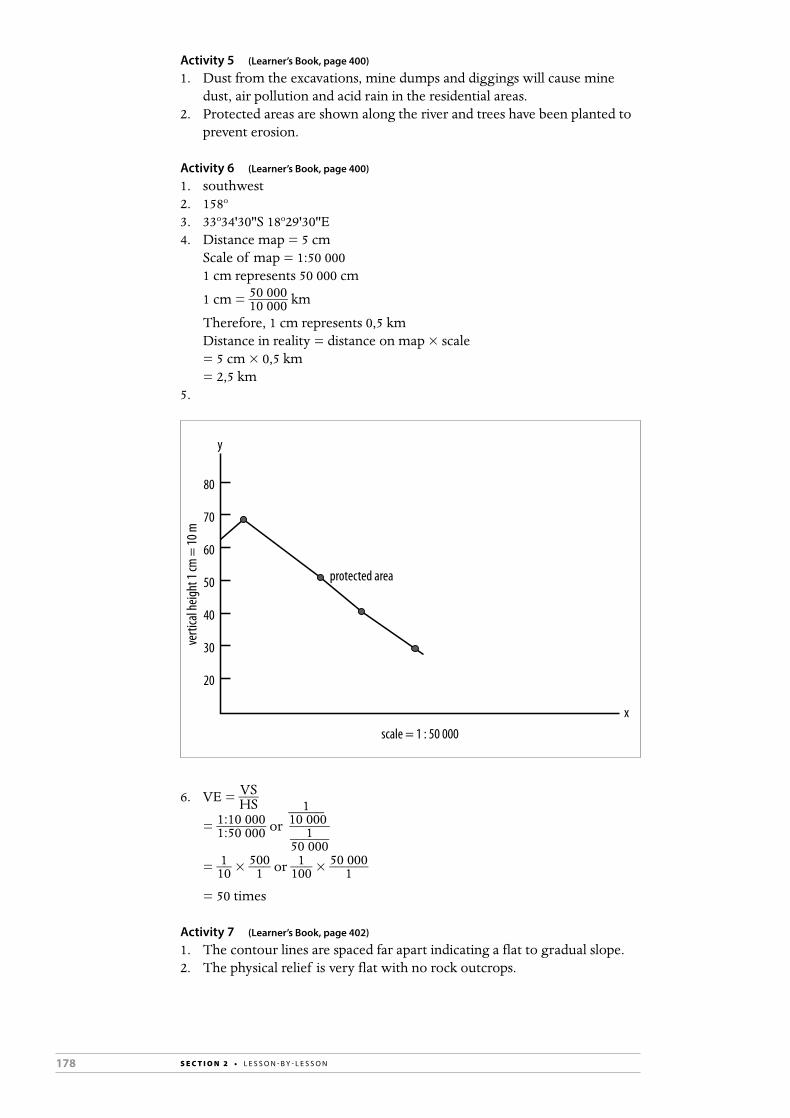
178 S E C T I O N 2 • L E S S O N - B Y - L E S S O N
Activity 5 (Learner’s Book, page 400)
1. Dust from the excavations, mine dumps and diggings will cause mine dust, air pollution and acid rain in the residential areas.
2. Protected areas are shown along the river and trees have been planted to prevent erosion.
Activity 6 (Learner’s Book, page 400)
1. southwest2. 158o
3. 33o34'30''S 18o29'30''E4. Distance map = 5 cm Scale of map = 1:50 000 1 cm represents 50 000 cm
1 cm = 50 000 ______ 10 000 km
Therefore, 1 cm represents 0,5 km Distance in reality = distance on map × scale = 5 cm × 0,5 km = 2,5 km 5.
x
y
scale = 1 : 50 000
20
30
40
50
60
70
80
verti
cal h
eight
1 cm
= 10
m
protected area
6. VE = VS ___ HS
= 1:10 000 _______ 1:50 000 or 1 _____ 10 000
______ 1 ______ 50 000
= 1 __ 10 × 500 ___ 1 or 1 ___ 100 × 50 000 ______ 1
= 50 times
Activity 7 (Learner’s Book, page 402)
1. The contour lines are spaced far apart indicating a flat to gradual slope.2. The physical relief is very flat with no rock outcrops.

179M O D U L E 8 • R E S O U R C E S A N D S U S TA I N A B I L I T Y : G E O G R A P H I C A L S K I L L S A N D T E C H N I Q U E S
Activity 8 (Learner’s Book, page 402)
1. Southwest. The contour lines are decreasing in a southwest direction; the river is flowing towards the sea.
2. The mapped area receives seasonal rainfall and the Donkergatrivier is a tributary to the Soutrivier.
Activity 9 (Learner’s Book, page 402)
1. three2. flat to gradual land; non-perennial water; reservoirs3. industrial area4. the Western Cape Province and the national power grid during peak
demand periods for electricity5. water is used to cool the electrical turbines and then released into the ocean
Activity 10 (Learner’s Book, page 402)
1. Yes. The Koeberg Nature Reserve, recreational areas and rows of trees are shown on the map.
2. A possible nuclear leakage/meltdown would cause nuclear radiation to the surrounding residential areas.
Activity 11 (Learner’s Book, page 403)
1. Distance map = 13 cm Scale of map = 1:50 000 1 cm represents 50 000 cm
1 cm = 50 000 ______ 100 000 km
Therefore, 1 cm represents 0,5 km Distance in reality = distance on map × scale = 13 cm × 0,5 km = 6,5 km2. west3. No, the contour lines indicate that the land is flat to gradual.4. Scale of map = 1: 50 000 Therefore, 1 cm = 50 000 ______ 100 000 = 0,5 km Area of map = length (L) × breadth (B) L = 6 cm B = 3,5 cm L = 6 cm × 0,5 km
= 3 km and B = 3,5 cm × 0,5 km
= 1,75 km Therefore, L × B = 3 km × 1,75 km = 5,25 km2
Activity 12 (Learner’s Book, page 403)
1. The contour lines are far apart indicating that the Grootgeluk Mine is situated on a flat to gradual slope.
2. kop; butte
Activity 13 (Learner’s Book, page 403)
1. reservoirs and furrows2. Seasonal rainfall. Non-perennial rivers; reservoirs; furrows are shown on
the map.

180 S E C T I O N 2 • L E S S O N - B Y - L E S S O N
Activity 14 (Learner’s Book, page 403)
1. mining2. The mineral (coal) can be found in coal seams close to the surface of
the Earth. 3. The cutline is the area where land has been excavated in long and narrow
trenches in an open-cast mine for surface mining.4. conveyor belts5. to supply electricity to the surrounding areas
Activity 15 (Learner’s Book, page 403)
1. Yes. Slimes Dams have been used to store waste from the mine.
Informal assessment• Move around the classroom as the learners are completing the activities.
Take note of any learners that may need your assistance. If necessary, provide them with additional remedial activities.
• Go through the answers with the class. Encourage learners to share their answers. Let the learners mark their own work or swap books and mark each other’s work.
UNIT 2 Geographical Information Systems
TERM 4, WEEKS 6–7
Learner’s Book pages 405–410Duration: 2 hours
Curriculum and Assessment Policy Statement (CAPS) content
Geographical Information Systems (GIS) • Spatially referenced data• Spatial and spectral resolution• Different types of data: line, point, area and attribute• Raster and vector data• Capturing different types of data from existing maps, photographs,
fieldwork or other records on tracing paper
Resources• Learner’s Book pages 405–410• tracing paper
Preparation• Read through the unit and work through the activities yourself before
assigning them to the learners to complete.
Teaching the unit• This unit should be completed in two lessons. Allocate plenty of time for
the learners to work through the activities.• Let the learners work individually or in pairs.• Ask the learners to work through the activities, circulate around the
classroom providing assistance where necessary.• Remind learners to refer to Module 4 of the Learner’s Book for assistance
with the activities.
181M O D U L E 8 • R E S O U R C E S A N D S U S TA I N A B I L I T Y : G E O G R A P H I C A L S K I L L S A N D T E C H N I Q U E S
Lesson 1
• Go through the answers to Activities 8 to 15 from Unit 1 with the class.• Work through the sections, ‘How to identify spatially referenced and
other types of data?’ (page 405) and ‘How to identify spatial and spectral resolution’? (page 406).
• Allow the rest of the lesson for the learners to complete Activities 1 and 2.
• What learners are not able to complete in class they should complete as homework.
Lesson 2
• Go through the answers to Activities 1 and 2 with the learners.• Allow time for the learners to work through the rest of the information
in the unit and complete Activities 3 and 4.• What learners are not able to complete in class they should complete as
homework.• Go through the answers to Activities 3 and 4 with the learners.
AnswersActivity 1 (Learner’s Book, page 406)
1. Grootgeluk Mine; Mokolo River; Lephalale2. Grootgeluk Mine provides coal; Mokolo River provides irrigation and
water to surrounding areas; Lephalale provides services to residents3. An image is context-driven when it has high spatial and spectral
resolution.
Activity 2 (Learner’s Book, page 408)
1. Limpopo River; Mokolo River; Lephalale; Steenbokspan2. sample localities with regard to weathering3. It does not reflect the true colour of physical relief.4. The map has a high spatial and spectral resolution as definite
demarcation of areas is highlighted.
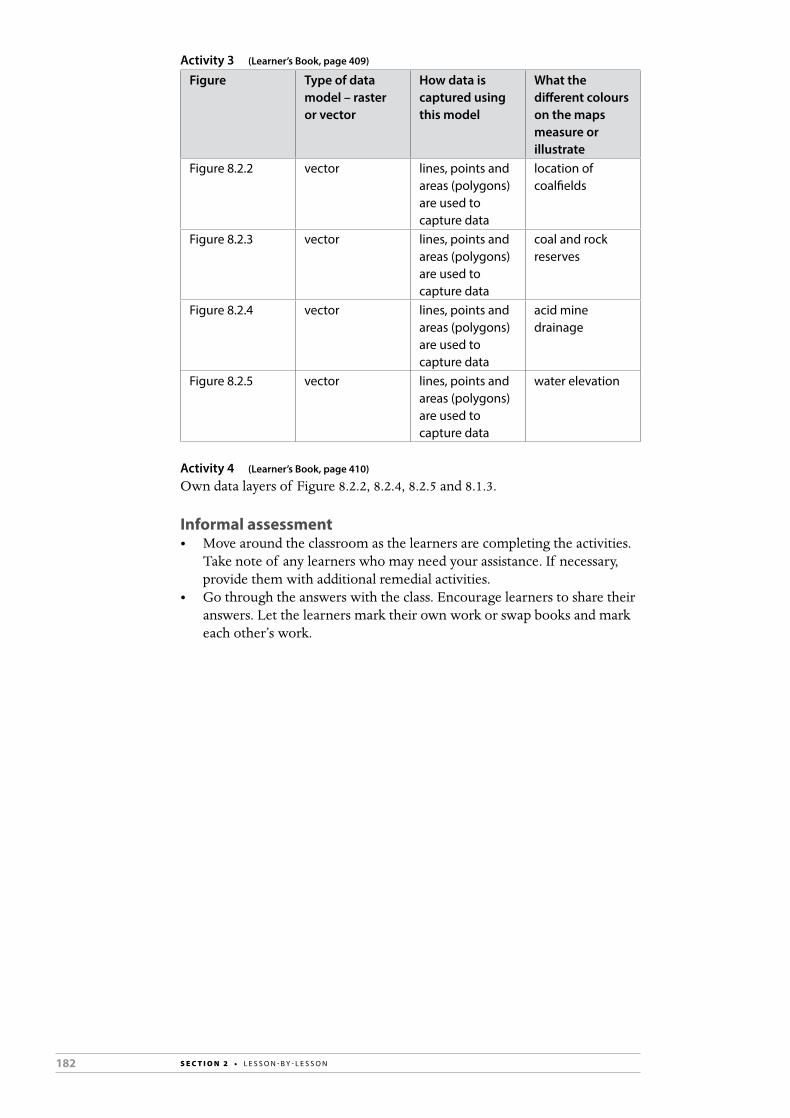
182 S E C T I O N 2 • L E S S O N - B Y - L E S S O N
Activity 3 (Learner’s Book, page 409)
Figure Type of data model – raster or vector
How data is captured using this model
What the different colours on the maps measure or illustrate
Figure 8.2.2 vector lines, points and areas (polygons) are used to capture data
location of coalfields
Figure 8.2.3 vector lines, points and areas (polygons) are used to capture data
coal and rock reserves
Figure 8.2.4 vector lines, points and areas (polygons) are used to capture data
acid mine drainage
Figure 8.2.5 vector lines, points and areas (polygons) are used to capture data
water elevation
Activity 4 (Learner’s Book, page 410)
Own data layers of Figure 8.2.2, 8.2.4, 8.2.5 and 8.1.3.
Informal assessment• Move around the classroom as the learners are completing the activities.
Take note of any learners who may need your assistance. If necessary, provide them with additional remedial activities.
• Go through the answers with the class. Encourage learners to share their answers. Let the learners mark their own work or swap books and mark each other’s work.
183M O D U L E 8 • R E S O U R C E S A N D S U S TA I N A B I L I T Y : G E O G R A P H I C A L S K I L L S A N D T E C H N I Q U E S
Learner’s Book pages 411–413
REVIEW TERM 4
These activities provide an opportunity for learners to consolidate concepts and skills learnt in Term 4. Learners can complete them in class or as homework. It is suggested that they complete the activities individually as a means of self-assessment.
You can write the answers on the board for the learners and/or call them out where more appropriate. However, if possible, it is suggested that you photocopy the answers and give them to the learners so that they have them for revision purposes.
Activity 1
1. Resources are the basis for all development, categorised as land, labour, capital and entrepreneurship.
2. The ‘resource curse’ is the inability of countries with rich resources, to develop them independently, investing the profits back into the development of the infrastructure. When a single resource or commodity such as oil is exploited, its export value can affect the rate of currency exchange, making it more difficult for a country to remain competitive in the export of other products. The effect is that the development growth slows down in a country, which is seen as a ‘curse’.
3. Human resources develop technology that can better-use resources, create industries, and manufacture products for export. An educated population provides employable people at all levels of each sector of the economy, creating a balanced, well-functioning country.
4. The Environmental Kuznets Curve shows the relationship between environmental degradation and the level of national income/development.
5. Degradation means over-use, or exploitation that is unsustainable; it has a negative effect associated with pollution and wastage and spoiling the environment for future generations.
Activity 21. Sustainable development is development which ensures that there are
enough resources left for future generations to satisfy their needs.2. a. The future generations will have access to resources.
b. It is difficult for poorer nations to slow down their resource usage as they have to sell their resources for currency.
3. Human capital can be educated to create alternative resources, or develop new uses for existing products, such as wind power, solar power, biomass.
Activity 31. Abiotic factors are parent material, climate, topography and time; biotic
factors are people and animals.2. Soil is necessary for growing plants, which feed people and animals, both
directly and indirectly.3. Refer to Figure 7.2.1 (page 312) in the Learner’s Book.4. Mollisols and Alfisols
184 S E C T I O N 2 • L E S S O N - B Y - L E S S O N
5. a. farmers ploughing downhill instead of around, following the contours; and animals work paths into the land by eroding the vegetation
b. wind blows uncovered soil away; water carries soil away; the sea can erode cliffs
6. we must keep the Earth covered with vegetation; we must not plant in vulnerable areas where rainfall is erratic
7. vegetation cover will bind the top soil layers; maintaining wetlands allows them to act as sponges when water levels rise, so that soil is not carried away; not allowing over-grazing will prevent the surface from becoming exposed and vulnerable; good planting techniques will prevent water from running down the hill
Activity 4Paragraph to include:• Rapid population growth in South Africa increases the use of
conventional energy sources.• With the electricity demand increasing due to the increase in population,
South Africa has been depending largely on fossil fuel, i.e. coal. • With the increased use of fossil fuels there has been an increase in carbon
dioxide emissions.• Carbon emissions are due to the generation of electricity from
conventional energy resources in South Africa.• The use of fossil fuels increases carbon dioxide emissions and has a
negative impact on society and the environment.• If resources are not managed in a sustainable way, South Africa may be
heading for a disaster.• Carbon emissions increase global warming, which causes rising sea levels,
rising temperatures and melting of polar ice caps.
Activity 5Paragraph to include:• Non-conventional, alternative energy sources provide a better and more
sustainable future for South Africa.• Non-conventional energy sources include solar and wind energy.• Renewable sources of energy can be regarded as sustainable because they
can be replaced as fast as they are used up.• South Africa is rich in renewable energy sources such as the Sun and wind.• In the Northern Cape high radiation occurs, while along the coastal
areas, strong winds are experienced which is good for energy generation.• The increased use of renewable sources for energy generation is a
solution to global warming.• Renewable energy generation is sustainable and South Africa can only
gain from using it.
Activity 6• Greener economies and sustainable lifestyles are important economically
and environmentally.• Promoting awareness of the sensitivity for the environment.• Promoting responsibility towards the environment.• Promoting and sustaining ecological conservation.• It is important for us to adopt an environmental sustainability ethic and
change our personal lifestyles so that we do not destroy and use up all the resources on the Earth.

185M O D U L E 8 • R E S O U R C E S A N D S U S TA I N A B I L I T Y : G E O G R A P H I C A L S K I L L S A N D T E C H N I Q U E S
Activity 71.
1 635
1 630
1 640
1 645
1 650
1 655
1 660
2. VE = VS ___ HS
1:500 _______ 1:10 000 or 1 ___ 500
______ 1 ______ 10 000
1 __ 5 × 100 ___ 1 or 1 __ 5 × 100 ___ 1
= 20 times 3. Lenasia South has been developed on gently undulating to flat land. The
contour lines are far apart in the Lenasia South area. 4. hill 5. to provide electricity to Lenasia South6. Gauteng7. Electricity is generated from burning coal in fossil fuel power stations.
Activity 81. • The physical and human-made features can be identified by a definite
geographic location (absolute position).• The physical and human-made features are more prominent, as high
spatial resolution includes the smallest of space to include all objects. The shape of features is clear.
2. The satellite image is context-driven because: (a) It is very informative. (b) Many features are present such as a residential area, a mine and power lines.
3. Town planners can use this satellite image for various developments and planning because the mapped area is context-driven.
4. Limpopo 5. At Grootgeluk Coal Mine, coal is extracted from the Earth. This coal is
then used at the power station to generate electricity. Coal is heavy to transport and it is for this reason that the power station is situated in close proximity to the mine.
6. The surrounding residential area and the greater Lephalale area.
186 S E C T I O N 2 • E X A M I N AT I O N P R E PA R AT I O N
Learner’s Book pages 414–427
EXAMINATION PREPARATION
These exam papers help learners to prepare for the end-of-year examination. Learners can complete the papers in class or as homework. It is suggested that they complete them individually as a means of self-assessment.
You can write the answers on the board for learners and/or call them out where more appropriate. However, if possible, it is suggested that you photocopy the answers and give them to learners so that they have them for revision purposes.
Memorandum: Model Exam Paper 1: The Atmosphere, Geomorphology, Mapwork (Learner’s Book, page 415)
TOTAL MARKS: 150
Question 1: The atmosphere 1.1.1 H1.1.2 I1.1.3 A1.1.4 J1.1.5 G1.1.6 B1.1.7 C1.1.8 D1.1.9 E1.1.10 M1.1.11 O1.1.12 F1.1.13 K1.1.14 L1.1.15 N [15]
1.2.1 Föhn wind (1)1.2.2 Any two: hot, dry, gusty (2)1.2.3 Mediterranean Sea, the Alps (2)1.2.4 It makes the climate warmer than it would otherwise be. (1)1.2.5 berg wind (1)1.2.6 adiabatic descent/adiabatic warming (1)1.2.7 As moist air is forced to rise up the slope, (1) it cools adiabatically/
expands and cools. (1) The moisture condenses over the mountain and most of it is shed as rain. (1) (3)
1.2.8 As the dry air descends, (1) it warms up as it is compressed (1). (2)1.2.9 The difference in temperature is due to the difference in moisture
content (1) of the air and the difference in adiabatic cooling and adiabatic warming rates, (1) i.e. dry air warms faster than moist air cools. (2)
[15]
1.3.1 Walker circulation (1)
© You may photocopy this page for use with Study & Master Geography Grade 11.

187S E C T I O N 2 • E X A M I N AT I O N P R E PA R AT I O N
1.3.2 east to west (2)1.3.3 Temperature differences between the two sides of the tropical Pacific.
(1) Waters in the east are cooler than in the west (1) by about 10 °C. This is because: the trade winds blow the warm surface water west (1) and the equatorial current carries the warm water west. (1) (4)
1.3.4 With an El Niño event, there is a shift in the wind and currents. (1) The trade winds weaken, or reverse direction (1) and the equatorial counter current dominates, (1) which means that warm tropical Pacific water now flows west to east (1) (instead of east to west). As a result, surface sea temperatures rise on the east side of the Pacific (1) and air pressure drops. (1) This switch or oscillation in air pressure systems means that the eastern side of Africa is hotter (1) and drier (1) than normal. (8)
[15]
1.4.1 a Intertropical Convergence Zone/ITCZ/equatorial low (1) b The convergence of the trade winds helps to lift the warm moist
air (1) and encourages the development of convective rain. (1) (2) c tropical moist climate, rainforest biome (2)
1.4.2 a subtropical high (1) b Air subsidence takes place here; as air descends, it warms and
dries. (2)1.4.3 a The cold Benguela current lowers sea temperatures along the
Atlantic (western) coast. Because of this evaporation is low/the air mass over the sea holds little moisture. (2)
b Harmattan (or northeast trade winds or northeast tropical easterlies) (1)
1.4.4 Mediterranean (1)1.4.5 a Any two:
• The Sahel is a sensitive/fragile area or dryland on the edge of the Sahara Desert.
• The Sahel has suffered a prolonged period of drought. • Many people depend on the resources of the Sahel – trees are
cut down for fuel. • The migration routes of the nomadic herders were cut off
when new boundaries or territories were declared, leading to overgrazing in confined areas. (2)
b Any one: • South Africa is semi-arid and more sparsely populated. • It is a more developed country than the Sahel countries
– people are less dependent on the land for subsistence/resources. (1)
[15] [60 marks]
© You may photocopy this page for use with Study & Master Geography Grade 11.

188 S E C T I O N 2 • E X A M I N AT I O N P R E PA R AT I O N
Question 2: Geomorphology2.1.1 erosion2.1.2 dip slope2.1.3 batholith2.1.4 pediment2.1.5 talus slope2.1.6 gravity2.1.7 slope decline2.18 laccolith2.1.9 dip2.1.10 sheetwash2.1.11 hogsback2.1.12 regolith2.1.13 permafrost2.1.14 solifluction2.1.15 dyke [15]
2.2.1 Arizona/United States of America (1)2.2.2 The canyon was carved by the Colorado River. (1) Uplift of the
Colorado Plateau gave the river great eroding power. (1) The rejuvenated river cut down deeply to form the steep sides of the valley. (1) (3)
2.2.3 a A = sandstone; sandstone is a resistant rock and so it forms steep slopes or cliffs (2)
b B = shale; shale is a weak, easily eroded rock and so it forms gentle slopes (2)
2.2.4 a the movement of material downslope by gravity (1) b rock falls (1) c debris flow or landslide slump (1) d scarp retreat; it is the dominant form of slope retreat in semi-arid
regions OR the canyon widens slowly over time without the walls loosing steepness or height (2)
2.2.5 tourist attraction (1)2.2.6 Fish River Canyon (1) [15]
2.3.1 Gauteng (near Pretoria/Tshwane) and North-West (2)2.3.2 cuesta/homoclinal ridge (1); its dip slope is not as steep (1) as a
hogsback; it is inclined at 10–20° (1) (whereas a hogsback is inclined at more than 45°) (3)
2.3.3 A = dip slope, B = scarp slope (2)2.3.4 Three billion years ago, (1) sediments were deposited in an inland sea.
(1) One billion years ago, (1) a huge upwelling of magma occurred (1) – an igneous intrusion known as the Bushveld Igneous Complex. (1) The weight of the intrusion pushed down on the sediments below and tilted them up. (1) The broken raised edges formed the scarp slopes, (1) which are made of resistant metamorphic quartzite. (1) (8)
[15]
2.4.1 The break-up of Gondwanaland (1) produced a huge volcanic outpouring of basalt (1) several million years ago. (2)
2.4.2 extrusive (1)2.4.3 rock falls (1)
© You may photocopy this page for use with Study & Master Geography Grade 11.
189S E C T I O N 2 • E X A M I N AT I O N P R E PA R AT I O N
2.4.4 a Water seeps in between the cracks and air spaces in rocks and soil. (1) It wears down material physically (by its movement or its expansion as it freezes) (1) and chemically (by dissolving certain minerals). (1) (3)
b Groundwater at high altitude is seasonally frozen. (1) As the water in the soil begins to thaw near the surface, the soil becomes water-logged (1) and because of its weight, flows slowly down the slope. (1) This is called solifluction. (1) (4)
2.4.5 It is cracked or jointed. (1)2.4.6 tor (1)2.4.7 The cliff-like slope is undercut. (1). It becomes more prone to rock
falls. (1) (2) [15] [60 marks]
Question 3: Mapwork 1.1 Map distance is 7,8 cm. On a 1:50 000 map, divide this by 2 for an answer
in kilometres. Answer is: 3,9 km. (2)1.2 33°57’00” S and 21°27’30” E (3)1.3 Measuring clockwise with a protractor, the answer is 342° (allow error of
3° either way). (2)1.4 Map distance is 3,8 cm, which is 1 900 m. Thembalethu is close to 200 m
contour line, and Pacaltsdorp Industria is at approximate altitude 180 m, so difference is 20 m. 1 900 ÷ 20 is a gradient of 1:95 (allow up to 20% error in answer) (3)
[10]
2.1 Camfersdrift River is flowing south-west. The contours that the blue line representing the river crosses indicate that the slope is sloping down in a south-westerly direction. (2)
2.2 Camfersdrift River is perennial. This is indicated by an unbroken blue line. (2)
2.3 The symbol for cultivated land is shown on either side of the river – water possibly used for irrigation; no settlement on the river banks – possible danger of flooding. (4)
2.4.1 One of: Fancourt, Kingwood, Oubaai (1)2.4.2 There is a significant proportion of wealthy individuals (probably
retirees with time to spend on the golf course) in the area. (1)2.5 The orthophotomap, because the scale is much larger, and objects are
shown in reality, not by symbols. (2) [12]
3.1 Collecting or gathering data without the sensor being in contact with the subject (camera, for example) (2)
3.2 Data or information that is linked to a particular spot, or place, typically map-coordinates (2)
3.3 Raster and vector (2)3.4 Geographical (spatial) decision making and problem solving (2) [8] [30 marks] TOTAL: 150 marks
© You may photocopy this page for use with Study & Master Geography Grade 11.
190 S E C T I O N 2 • E X A M I N AT I O N P R E PA R AT I O N
Memorandum: Model Exam Paper 2: Development Geography, Resources and Sustainability, Mapwork (Learner’s Book page 422)
TOTAL MARKS: 150
Question 1: Development Geography1.1.1 The expansion and growth of a country’s economy and wealth (1)1.1.2 False (1)1.1.3 A developing country has not reached its growth potential, and is
poorer than a developed country, which is wealthy, with a strong economy. (2)
1.1.4 Developing (1)1.1.5 NIC stands for newly industrialised country; the Far East (2)1.1.6 Any two of: China, Russia, India, Brazil, South Africa (2)1.1.7 The value of all goods and services produced in a country in a year (2)1.1.8 The HDI is a measure of the living standard of citizens of a country
(the population). (2)1.1.9 The number of deaths in the young child population of a country (1)1.1.10 The difference (in money terms) between what a country imports,
and exports (1) [15]
1.2.1 Economic development is the ability of a country to access, control, use and add value to its resources in order to benefit from their economic value and to generate wealth. Social development is the improvement in the standard of living, hygiene, nutrition, education, medicine, equality and human rights, that raise the quality of life for people (4)
1.2.2 The Gini coefficient is a statistical measurement used to plot the level of inequality in a country or between countries. It is stated as a percentage where 0 is total equality and 100 is total inequality. (2)
1.2.3 Economies of scale refers to the proportionate saving in costs gained by an increased level of production, for example, mass production in a big factory is more efficient than a small home industry. (3)
1.2.4 A renewable resource can be used over and over again. A non-renewable resource cannot be replenished; once it is used up, it is finished. (2)
1.2.5 Not all of Africa is equally developed, and this applies at national level, and also within individual countries there are local and regional differences in levels of development. (4)
[15]
1.3.1 EITHER: The Slave Trade led to 12 million Africans being taken from mainly west Africa (1) to work as labourers in the colonies of North and South America. (1) The Slave Trade took the youngest and healthiest of the population, and left behind the elderly and sick. (1) This affected the future economic and social development of Africa. (1) The colonial powers extracted precious raw materials from their colonies, (1) took these back to their mother country, developed their industries, (1) and exported the final products back to the colony. (1) This process took away the ability of the colony to develop its own economy. (1)
© You may photocopy this page for use with Study & Master Geography Grade 11.
191S E C T I O N 2 • E X A M I N AT I O N P R E PA R AT I O N
OR: The period of colonialism was when European countries took control over huge areas of the world. (1) They wanted access to scarce resources. (1) Geographical boundaries were drawn and countries were created by the colonising powers, with little regard for local tribes, ethnic groups, cultural or language identities of the local people. (1) The colonisation of Africa created conflict. (1) Groups of people with common identities were often split across a number of countries. (1) The colonial powers extracted precious raw materials from their colonies, took these back to their mother country, developed their industries, (1) and exported the final products back to the colony. (1) This process took away the ability of the colony to develop its own economy. (1) (8)
1.3.2 Education and training has a positive effect on development because the skills of the population are improved and increased, making workers more productive. (2)
1.3.3 Energy (electricity) is vital to power factories, offices and transport and to develop an economy. (2)
1.3.4 A model designed to explain how, where and why development will take place. Examples are the Free Market Model and the Core-Periphery Model. (3)
[15]
1.4.1 International trade is trade between different countries. World markets are part of the global economy, that is, trading globally on a supply and demand basis. (4)
1.4.2 Globalisation is a process that brings together the economies of different nations into one world-wide economy. (1) It involves the free flow of goods, services, money/capital, technology and labour across national borders. (2) It often involves the expansion of large multinational corporations (MNC). (1) Problems with globalisation include exploitation of cheap labour and resources in developing countries. (2) However, globalisation has opened up job markets around the world, (1) allowing highly skilled people to go where the demand is. (1) (8)
1.4.3 Development aid is aid or assistance from developed, wealthy countries to developing, poorer countries. Relief aid assists where there have been natural disasters. Humanitarian aid assists people in crisis. Technical and financial aid may help a country with its development programme. (3)
[15] [60 marks]
© You may photocopy this page for use with Study & Master Geography Grade 11.
192 S E C T I O N 2 • E X A M I N AT I O N P R E PA R AT I O N
Question 2: Resources and Sustainability2.1.1 a F (1)
b F (1) c T (1) d T (1) e F (1)
2.1.2 a The eastern Highveld (Mpumalanga) (1) b Wind turbine (1) c Wind farm (1) d The amount of carbon dioxide created by economic activity
and burning fossil fuels (1) e Non-living factors, namely minerals, air and water (1)
2.1.3 a coal (1) b water (1) c green (1) d Koeberg (1) e pollution (1)
[15]
2.2.1 Atmospheric pollution, global warming, habitat destruction, deforestation, loss of species diversity, soil erosion, over-exploitation of natural resources are all negative impacts. Discussion could include any six negative impacts. Give 1 or 2 marks extra if learner explains, rather than simply lists, for a total of 8 marks maximum. (8)
2.2.2 Environmental, social, economic (3)2.2.3 Soil is needed to grow crops to produce food for both animals and
people. Soil is the source of life for living plants and, indirectly, animals and people. South Africa generally has nutrient-poor, fairly shallow soils. (4)
[15]
2.3.1 Thermal energy is generated in Eskom’s coal-fired power stations, (1) most of which are on the Highveld. (1) Thermal energy provides the bulk of South Africa’s electricity. (1) Hydroelectricity is fairly limited because South Africa is an arid country. (1) Large dams (Gariep) (1) and various water storage and transfer schemes produce some hydroelectricity. (1) Nuclear power is limited to the Koeberg nuclear power station at Koeberg (Western Cape). (1) All Eskom-generated electricity is fed into a national grid serving the whole country. (1) (8)
2.3.2 Advantages: clean, efficient, silent. Disadvantages: expensive to build a nuclear power station, environmental concerns (radioactivity), disposal of spent nuclear fuel. (4)
2.3.3 Solar energy is energy generated from the sun. In a solar array, a large number of solar panels convert the sun’s energy into electricity. Because South Africa receives so much sunshine, solar energy is a promising future source of electricity generation. (3)
[15]
© You may photocopy this page for use with Study & Master Geography Grade 11.
193S E C T I O N 2 • E X A M I N AT I O N P R E PA R AT I O N
2.4.1 As South Africa develops, more electricity is needed to power both industry, and for domestic use. People are turning from other energy sources such as wood or paraffin, to electricity, so the demand for electricity is rising constantly. (3)
2.4.2 Green energy is produced by renewable resources such as wind, running water and solar power. It is any clean energy source that has little or no impact on the environment. A green economy relies principally on green energy as its main source of energy. (5)
2.4.3 Both the government, through Eskom’s electricity generation and distribution, must ensure that things run efficiently with energy supply. Businesses must use energy carefully and responsibly, and must play a part in reducing pollution. Government and business need to work together to ensure efficient and sustainable energy management. (4)
2.4.4 Individuals can use energy sparingly in the home, office or workplace. This can involve simple things such as turning off lights, as well as installing solar panels in the home. (3)
[15] [60 marks]
Question 3: Mapwork (30 marks) 1.1 76° (east of true north) (1)1.2 280° (west of true north) (1)1.3 C (the railway line); it says on the map 61 km, which is further than by
either road (2)1.4 Measuring on the map it is 5,4 cm. On a 1: 50 000 scale, this is 2,7 km. (2)1.5 Measuring on the map, it is 4,2 cm. At a scale of 1:10 000, this is 420 m. (2)1.6 Beacon 119 is at 188 m. Stompkopbank is at sea level (0 m) so the answer
is 188 m. (2) [10]
2.1 Industrial – factories or manufacturing (2)2.2 Industry needs flat land; there is not much slope here (see the contour
lines) so it is an ideal site for industry. (2)2.3 Factories may generate air pollution and produce waste, so pollution
(also, of groundwater and streams) needs to be prevented. (2)2.4 Landing strip; aviation or flying (2)2.5 J is urban residential (note the street pattern), so it has the higher
population density (3)2.6 Road, or factory, or warehouse (accept any of the three) (1) [12]
3.1 A GIS (Geographical Information System) is a computer-based software program for dealing with spatial data and its attributes. (2)
3.2.1 Two types of GIS data format (1)3.2.2 A is raster (squares, or pixels), and B is vector (lines and points) (3)3.3 Yes (1)3.4 Both (1) [8] [30 marks] TOTAL: 150 marks
© You may photocopy this page for use with Study & Master Geography Grade 11.

3. FORMAL ASSESSMENT
195
1. Assessment in Geography in Grade 11 196
2. Programme of assessment 196
3. Formal assessment: tasks, tests and examinations 197
4. Recording and reporting 201
5. Photocopiable assessment resources 262

196 S E C T I O N 3 • F O R M A L A S S E S S M E N T
1. ASSESSMENT IN GEOGRAPHY
IN GRADE 11
Assessment in Grade 11 is made up of:• informal or daily assessment• formal assessment.
In Study & Master Geography Grade 11:• informal assessment advice is given as part of the lesson guidance in the
Lesson-by-lesson section (pages 17–185) of this Teacher’s Guide• formal assessment guidance and assessment tools are provided below.
2. PROGRAMME OF ASSESSMENT
The programme of assessment provided in Study & Master Geography Grade 11 is in line with the Curriculum and Assessment Policy Statement for Geography and the Abridged Section 4: FET Grade 10–11 CAPS amendments (implementation in January 2020), and thus spreads out the formal assessment tasks throughout the year. It is made up of two tasks, two controlled tests and two examinations. For promotion purposes, a year mark is added to the end-of-year examination mark. The year mark is made up of marks obtained in the tasks, controlled tests and June examination. This is reflected in the table below.
Term Week Type of formal assessment
Content and skills focus of assessment
Learner’s Book and/or Teacher’s Guide page reference
Total number of marks
Contribution to year mark
Term 1 8 Controlled test 1
The atmosphere Teacher’s Guide p. 202–203
60 marks 20 marks
Term 1 10 Assessment Task 1: Research
The atmosphere Learner’s Book p. 442; Teacher’s Guide p. 205
100 marks 20 marks
Term 2 8 Assessment Task 2
Mapwork Learner’s Book pp. 443–446; Teacher’s Guide pp. 213–217
60 marks 20 marks
Term 2 9–10 Mid-year examination
Work covered in Terms 1 and 2
Teacher’s Guide pp. 218–226
150 marks 20 marks
Term 3 7 Controlled test 2
Development geography
Teacher’s Guide pp. 231–232
60 marks 20 marks
Term 4 9–10 End-of-year examination
Work covered throughout year
Teacher’s Guide pp. 235–244 and 249–252
300 marks 300 marks
For more information on formal assessment, see Section 4 of the CAPS document.

197S E C T I O N 3 • F O R M A L A S S E S S M E N T
3. FORMAL ASSESSMENT: TASKS,
TESTS AND EXAMINATIONS
Controlled test 1 The atmosphere
TERM 1, WEEK 10Teacher’s Guide pages 202–203
Geography topic: The atmosphere
ResourcesPhotocopies of Controlled test 1 (pages 202–203)
Background• This test focuses on Modules 1 and 2 of Study & Master Geography
Grade 11 and therefore should be scheduled for after the learners have completed these modules and had time to do some revision activities. (See Year plan on pages 6–15.)
• Allow 60 minutes for the test.• The test is out of 60 marks. You will need to convert this to a mark out of
10 for contribution of this assessment to the year mark. (See ‘Recording and reporting’ on page 201.)
Preparing the learners• Remind the learners that they should answer all questions.
The testYou will find a test on ‘the atmosphere’ on pages 202–203 of this Teacher’s Guide. You may photocopy the test. A marking memorandum for the test is supplied on pages 204–205.
Mid-year examination
TERM 2, WEEKS 9–10
Teacher’s Guide pages 218–226
Geography topics: The atmosphere, Geomorphology, Mapwork
ResourcesPhotocopies of mid-year examination in this Teacher’s Guide (pages 218–226).
Background• The mid-year examination focuses on all material covered in Terms 1 and
2 and the questions require lower order, middle order and higher order thinking skills from the learners.

198 S E C T I O N 3 • F O R M A L A S S E S S M E N T
© You may photocopy this page for use with Study & Master Geography Grade 11.
The examination is divided into two papers as follows:– Question 1: The atmosphere (60 marks). Consists of:
• short, objective questions (15 marks)• three questions of 15 marks each on The Atmosphere, with ONE
paragraph question of 8 marks in any of the three questions (45 marks)
– Question 2: Geomorphology (60 marks). Consists of:• short, objective questions (15 marks)• three questions of 15 marks each on Geomorphology, with ONE
paragraph question of 8 marks in any of the three questions (45 marks)
– Question 3: Mapwork (30 marks). Consists of:• map skills and calculations (10 marks)• map interpretation (12 marks) • GIS (8 marks)
• The mid-year examination is out of 150 marks. You will need to convert this to a mark out of 20 for contribution of this assessment to the year mark. (See ‘Recording and reporting’ on page 201.)
Preparing the learners• At the beginning of Term 2, spend some time discussing what material
learners will need to cover for the examination.• In week 4 or 5 of Term 2, spend some time discussing the format of
the examination, including how much time learners will be given to complete it. You can refer to the section below, ‘Background’, to help you with this explanation.
• Remind the learners that they will need to revise all the work covered in Modules 1 to 4.
• Explain that the way that the examination is structured means that they will not be able to leave out any sections of work as they prepare for it.
The mid-year examinationYou will find a mid-year examination that you could use on pages 218–226 of this Teacher’s Guide. You may photocopy this examination.
Assessment guidanceYou will find a memorandum for the mid-year examination on pages 227–230 of this Teacher’s Guide. You may photocopy this memorandum if you wish.
Controlled test 2 Population
TERM 3, WEEK 7
Teacher’s Guide pages 231–232
Geography topic: Development geography
ResourcesPhotocopies of Controlled test 2 (pages 231–232) of this Teacher’s Guide.
BackgroundThis test forms part of the formal assessment for Grade 11 and covers work done in Term 3. Refer to the CAPS amended document (2020) on assessment.
199S E C T I O N 3 • F O R M A L A S S E S S M E N T
• This test counts 60 marks.• The time allocated is 60 minutes.• You are not obliged to use this particular test. If you set your own test,
make sure it covers work done in the third term only.
Preparing the learners• Remind the learners that they should answer all questions.
The testYou will find a test on ‘Population’ on pages 231–232 of this Teacher’s Guide. You may photocopy the test. A marking memorandum for the test is supplied on pages 233–234.
End-of-year examination
TERM 4, WEEKS 9–10
Teacher’s Guide pages 235–244 and 249–252
Geography topics: The atmosphere, Geomorphology, Development geography, Resources and sustainability (geographic knowledge, skills and techniques)
ResourcesPhotocopies of one of the end-of-year examinations in this Teacher’s Guide (pages 235–242 and 249–252)
Important note to the teacher: The FET CAPS amendments with regard to the Programme of Assessment for Grade 11 Geography states the following on page 58 of the document: Both the topographical and the orthophotos used for examination purposes MUST be A4 size and printed to scale. The topographical map should be printed in colour and MUST be together on an A3 page as indicated in the exemplar (on page 58). In the exam papers provided, reduced map extracts are shown, but the questions can be used on the true scale A3 page which will have to be sourced for the exams in both Papers 1 and 2.
Background• Paper 1
– Question 1: The atmosphere (60 marks). Consists of:• short, objective questions (15 marks)• three questions of 15 marks each on The Atmosphere, with ONE
paragraph question of 8 marks in any of the three questions (45 marks)
– Question 2: Geomorphology (60 marks). Consists of:• short, objective questions (15 marks)• three questions of 15 marks each on Geomorphology, with ONE
paragraph question of 8 marks in any of the three questions (45 marks)
– Question 3: Mapwork (30 marks). Consists of:• map skills and calculations (10 marks)• map interpretation (12 marks) • GIS (8 marks)

200 S E C T I O N 3 • F O R M A L A S S E S S M E N T
• Paper 2– Question 1: Development Geography (60 marks). Consists of:
• short, objective questions (15 marks)• three questions of 15 marks each on Development Geography
and Urban Settlement, with ONE paragraph question of 8 marks in any of the three questions (45 marks)
– Question 2: Resources and Sustainability of South Africa (60 marks). Consists of:• short, objective questions (15 marks)• three questions of 15 marks each on Resources and Sustainability
of South Africa, with ONE paragraph question of 8 marks in any of the three questions (45 marks)
– Question 3: Mapwork (30 marks). Consists of:• map skills and calculations (10 marks)• map interpretation (12 marks) • GIS (8 marks)
• The end-of-year examination is out of 300 marks. The year mark is added to this to create a final mark for Geography for promotion purposes. (See ‘Recording and reporting’ on page 201.)
Preparing the learners• At the beginning of Term 4, spend some time discussing with the
learners what material they will need to cover for the examination.• In week 4 or 5 of Term 4, spend some time discussing the format of
the examination, including how much time learners will be given to complete it. Refer to the notes under ‘Background’ (above) to help you with this explanation. Refer the learners to page 414 of the Learner’s Book where this information appears.
• Remind the learners that they will need to revise all the work covered during the year.
• Explain that the way that the examination is structured means that they will not be able to leave out any sections of work as they prepare for it.
The end-of-year examinationYou will find an end-of-year examination that you could use on pages 235–244 and 249–252 of this Teacher’s Guide. You may photocopy this examination.
Assessment guidanceYou will find a memorandum for the end-of-year examination on pages 245–248 and 253–257 of this Teacher’s Guide. You may photocopy this memorandum if you wish.

201S E C T I O N 3 • F O R M A L A S S E S S M E N T
4. RECORDING AND REPORTING
The results of all formal assessments should be recorded and are used for reporting on learners’ performance each term. The Programme of Assessment (Teacher’s Guide page 195) details how the learner’s Geography mark for each term is arrived at.
The following photocopiable assessment recording tools are provided on pages 258–261 of this Teacher’s Guide:• Record sheet for formal assessment: Term 1• Record sheet for formal assessment: Term 2• Record sheet for formal assessment: Term 3• Record sheet for formal assessment: Term 4
The following rating codes and descriptors should be used for reporting on the learners’ progress in Geography:
Rating Code Description of competence Percentage7 Outstanding achievement 80–1006 Meritorious achievement 70–795 Substantial achievement 60–694 Adequate achievement 50–593 Moderate achievement 40–492 Elementary achievement 30–391 Not achieved 0–29
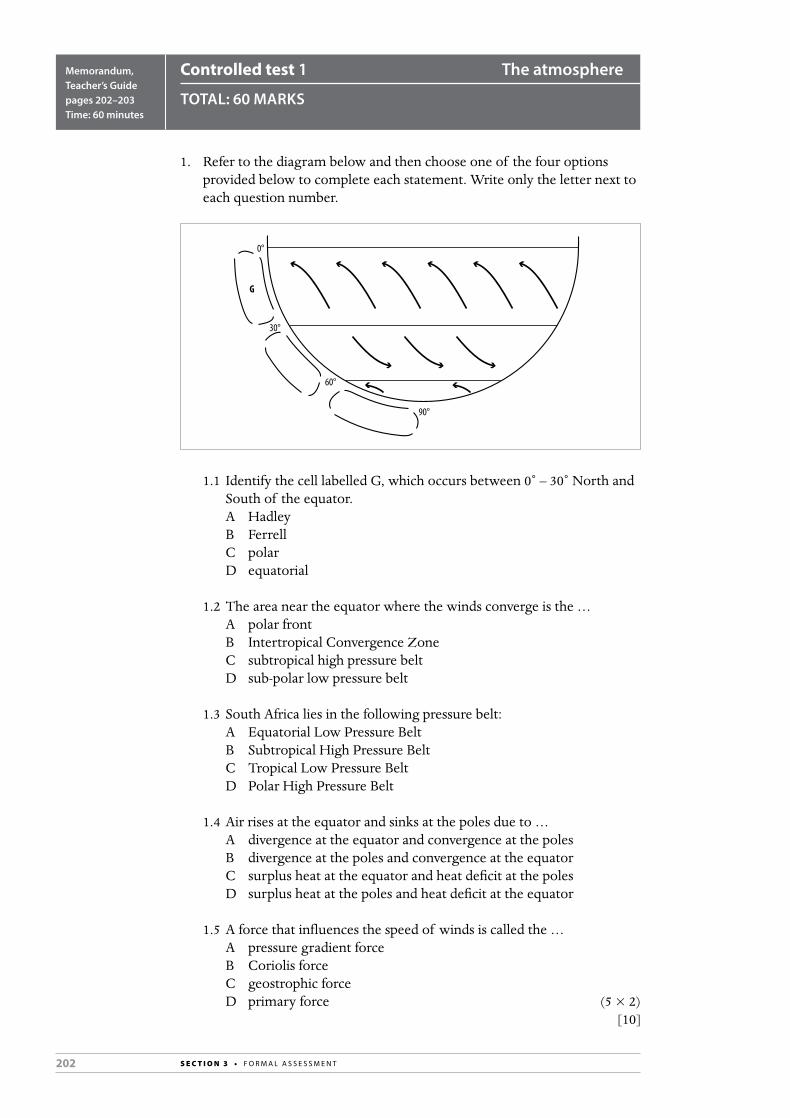
202 S E C T I O N 3 • F O R M A L A S S E S S M E N T
Controlled test 1 The atmosphere
TOTAL: 60 MARKS
Memorandum, Teacher’s Guide pages 202–203Time: 60 minutes
1. Refer to the diagram below and then choose one of the four options provided below to complete each statement. Write only the letter next to each question number.
90°
0°
30°
60°
G
1.1 Identify the cell labelled G, which occurs between 0˚ – 30˚ North and South of the equator.
A Hadley B Ferrell C polar D equatorial
1.2 The area near the equator where the winds converge is the … A polar front B Intertropical Convergence Zone C subtropical high pressure belt D sub-polar low pressure belt
1.3 South Africa lies in the following pressure belt: A Equatorial Low Pressure Belt B Subtropical High Pressure Belt C Tropical Low Pressure Belt D Polar High Pressure Belt
1.4 Air rises at the equator and sinks at the poles due to … A divergence at the equator and convergence at the poles B divergence at the poles and convergence at the equator C surplus heat at the equator and heat deficit at the poles D surplus heat at the poles and heat deficit at the equator
1.5 A force that influences the speed of winds is called the … A pressure gradient force B Coriolis force C geostrophic force D primary force (5 × 2)
[10]
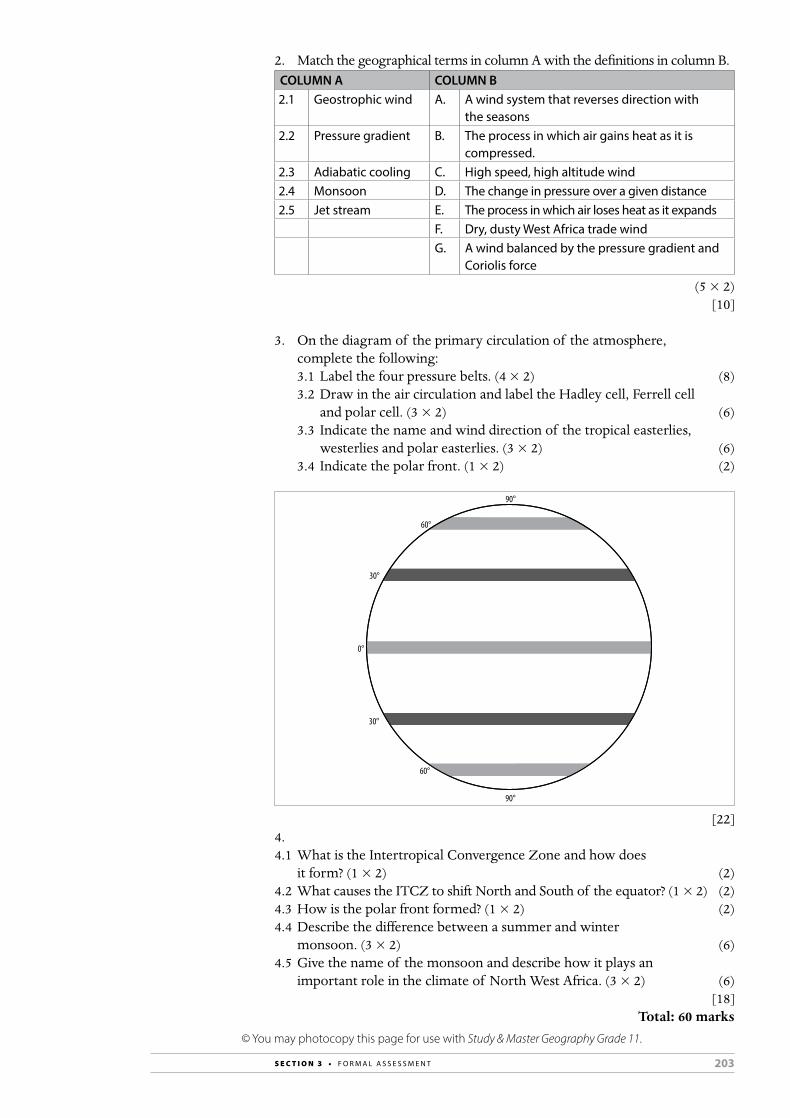
203S E C T I O N 3 • F O R M A L A S S E S S M E N T
2. Match the geographical terms in column A with the definitions in column B.COLUMN A COLUMN B2.1 Geostrophic wind A. A wind system that reverses direction with
the seasons2.2 Pressure gradient B. The process in which air gains heat as it is
compressed.2.3 Adiabatic cooling C. High speed, high altitude wind2.4 Monsoon D. The change in pressure over a given distance2.5 Jet stream E. The process in which air loses heat as it expands
F. Dry, dusty West Africa trade windG. A wind balanced by the pressure gradient and
Coriolis force
(5 × 2)[10]
3. On the diagram of the primary circulation of the atmosphere, complete the following:3.1 Label the four pressure belts. (4 × 2) (8)3.2 Draw in the air circulation and label the Hadley cell, Ferrell cell
and polar cell. (3 × 2) (6)3.3 Indicate the name and wind direction of the tropical easterlies,
westerlies and polar easterlies. (3 × 2) (6)3.4 Indicate the polar front. (1 × 2) (2)
60°
90°
90°
30°
0°
30°
60°
[22]4. 4.1 What is the Intertropical Convergence Zone and how does
it form? (1 × 2) (2)4.2 What causes the ITCZ to shift North and South of the equator? (1 × 2) (2)4.3 How is the polar front formed? (1 × 2) (2)4.4 Describe the difference between a summer and winter
monsoon. (3 × 2) (6)4.5 Give the name of the monsoon and describe how it plays an
important role in the climate of North West Africa. (3 × 2) (6)[18]
Total: 60 marks
© You may photocopy this page for use with Study & Master Geography Grade 11.
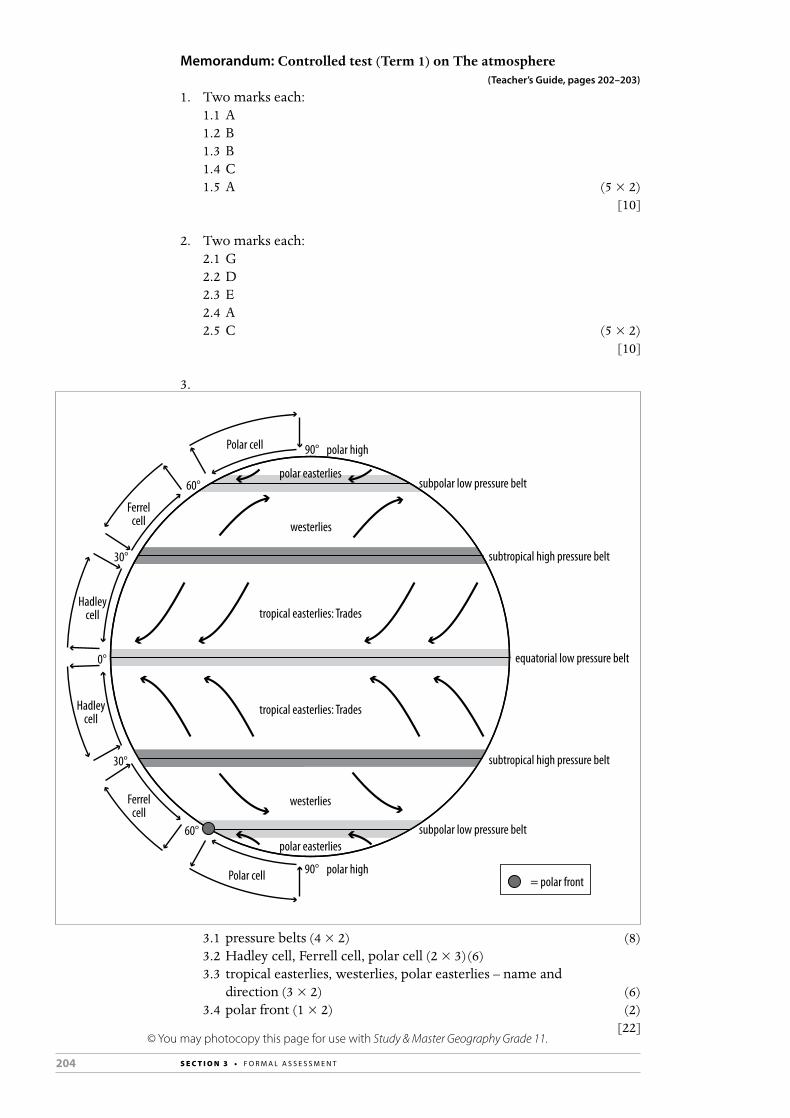
204 S E C T I O N 3 • F O R M A L A S S E S S M E N T
Memorandum: Controlled test (Term 1) on The atmosphere (Teacher’s Guide, pages 202–203)
1. Two marks each:1.1 A1.2 B1.3 B1.4 C1.5 A (5 × 2)
[10]
2. Two marks each:2.1 G2.2 D2.3 E2.4 A2.5 C (5 × 2)
[10]
3.
60°
90°
90°
30°
0°
30°
60°
subpolar low pressure belt
subpolar low pressure belt
subtropical high pressure belt
subtropical high pressure belt
equatorial low pressure belt
polar high
polar high
westerlies
westerlies
tropical easterlies: Trades
tropical easterlies: Trades
polar easterlies
polar easterlies
Hadleycell
Hadleycell
Ferrelcell
Ferrelcell
Polar cell
Polar cell
= polar front
3.1 pressure belts (4 × 2) (8)3.2 Hadley cell, Ferrell cell, polar cell (2 × 3) (6)3.3 tropical easterlies, westerlies, polar easterlies – name and
direction (3 × 2) (6)3.4 polar front (1 × 2) (2)
[22]© You may photocopy this page for use with Study & Master Geography Grade 11.
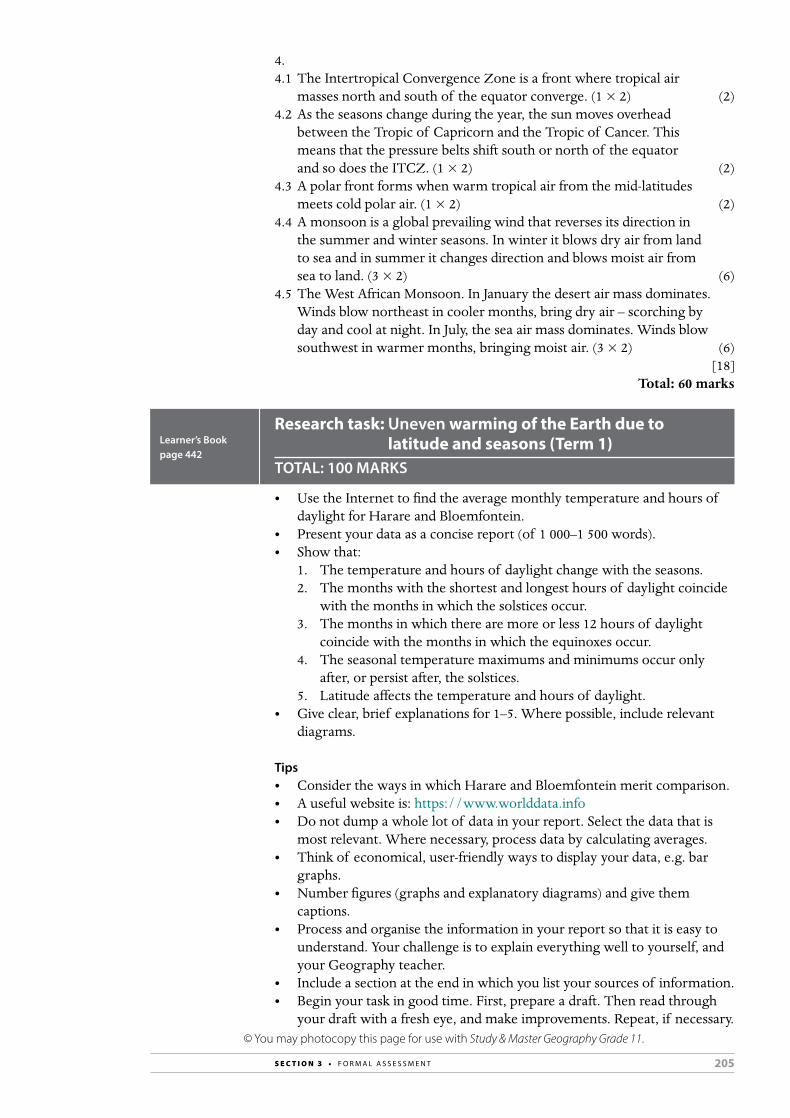
205S E C T I O N 3 • F O R M A L A S S E S S M E N T
4. 4.1 The Intertropical Convergence Zone is a front where tropical air
masses north and south of the equator converge. (1 × 2) (2)4.2 As the seasons change during the year, the sun moves overhead
between the Tropic of Capricorn and the Tropic of Cancer. This means that the pressure belts shift south or north of the equator and so does the ITCZ. (1 × 2) (2)
4.3 A polar front forms when warm tropical air from the mid-latitudes meets cold polar air. (1 × 2) (2)
4.4 A monsoon is a global prevailing wind that reverses its direction in the summer and winter seasons. In winter it blows dry air from land to sea and in summer it changes direction and blows moist air from sea to land. (3 × 2) (6)
4.5 The West African Monsoon. In January the desert air mass dominates. Winds blow northeast in cooler months, bring dry air – scorching by day and cool at night. In July, the sea air mass dominates. Winds blow southwest in warmer months, bringing moist air. (3 × 2) (6)
[18]Total: 60 marks
Research task: Uneven warming of the Earth due to latitude and seasons (Term 1)
TOTAL: 100 MARKS
Learner’s Book page 442
• Use the Internet to find the average monthly temperature and hours of daylight for Harare and Bloemfontein.
• Present your data as a concise report (of 1 000–1 500 words).• Show that:
1. The temperature and hours of daylight change with the seasons.2. The months with the shortest and longest hours of daylight coincide
with the months in which the solstices occur. 3. The months in which there are more or less 12 hours of daylight
coincide with the months in which the equinoxes occur.4. The seasonal temperature maximums and minimums occur only
after, or persist after, the solstices.5. Latitude affects the temperature and hours of daylight.
• Give clear, brief explanations for 1–5. Where possible, include relevant diagrams.
Tips• Consider the ways in which Harare and Bloemfontein merit comparison.• A useful website is: https://www.worlddata.info• Do not dump a whole lot of data in your report. Select the data that is
most relevant. Where necessary, process data by calculating averages.• Think of economical, user-friendly ways to display your data, e.g. bar
graphs.• Number figures (graphs and explanatory diagrams) and give them
captions.• Process and organise the information in your report so that it is easy to
understand. Your challenge is to explain everything well to yourself, and your Geography teacher.
• Include a section at the end in which you list your sources of information.• Begin your task in good time. First, prepare a draft. Then read through
your draft with a fresh eye, and make improvements. Repeat, if necessary.© You may photocopy this page for use with Study & Master Geography Grade 11.
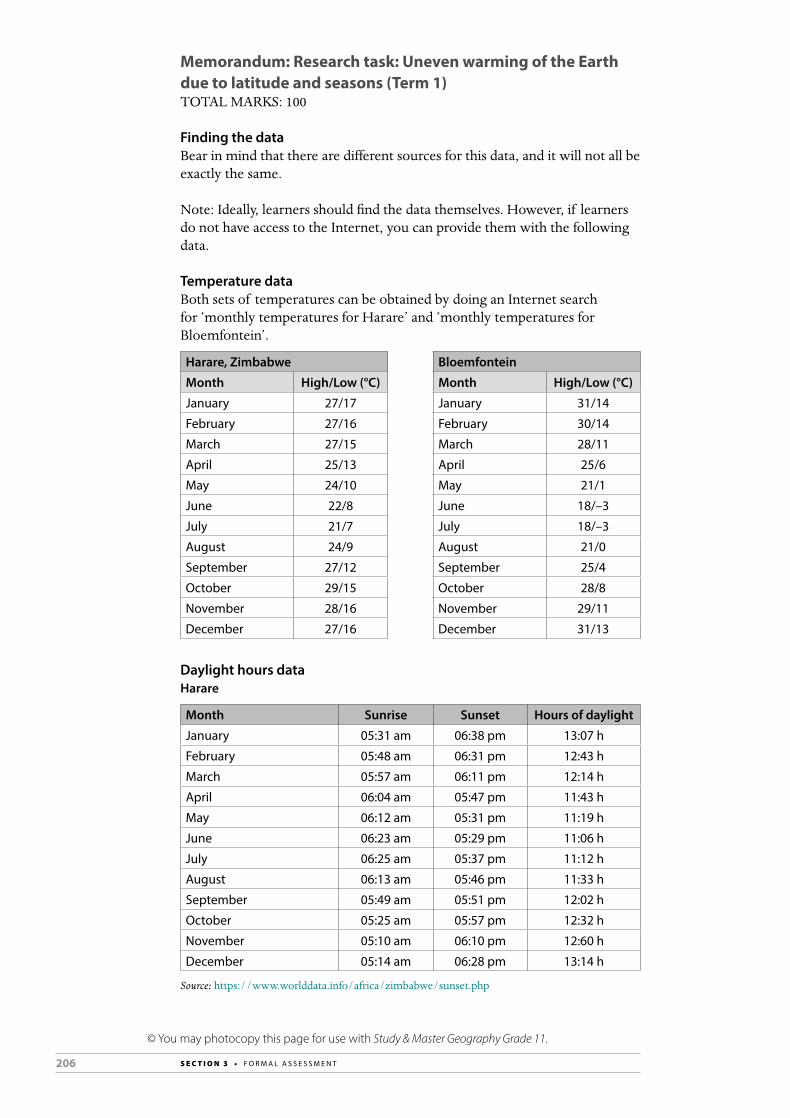
206 S E C T I O N 3 • F O R M A L A S S E S S M E N T
Memorandum: Research task: Uneven warming of the Earth due to latitude and seasons (Term 1)TOTAL MARKS: 100
Finding the dataBear in mind that there are different sources for this data, and it will not all be exactly the same.
Note: Ideally, learners should find the data themselves. However, if learners do not have access to the Internet, you can provide them with the following data.
Temperature dataBoth sets of temperatures can be obtained by doing an Internet search for ‘monthly temperatures for Harare’ and ‘monthly temperatures for Bloemfontein’.
Harare, Zimbabwe Bloemfontein
Month High/Low (°C) Month High/Low (°C)
January 27/17 January 31/14
February 27/16 February 30/14
March 27/15 March 28/11
April 25/13 April 25/6
May 24/10 May 21/1
June 22/8 June 18/–3
July 21/7 July 18/–3
August 24/9 August 21/0
September 27/12 September 25/4
October 29/15 October 28/8
November 28/16 November 29/11
December 27/16 December 31/13
Daylight hours dataHarare
Month Sunrise Sunset Hours of daylight
January 05:31 am 06:38 pm 13:07 h
February 05:48 am 06:31 pm 12:43 h
March 05:57 am 06:11 pm 12:14 h
April 06:04 am 05:47 pm 11:43 h
May 06:12 am 05:31 pm 11:19 h
June 06:23 am 05:29 pm 11:06 h
July 06:25 am 05:37 pm 11:12 h
August 06:13 am 05:46 pm 11:33 h
September 05:49 am 05:51 pm 12:02 h
October 05:25 am 05:57 pm 12:32 h
November 05:10 am 06:10 pm 12:60 h
December 05:14 am 06:28 pm 13:14 h
Source: https://www.worlddata.info/africa/zimbabwe/sunset.php
© You may photocopy this page for use with Study & Master Geography Grade 11.
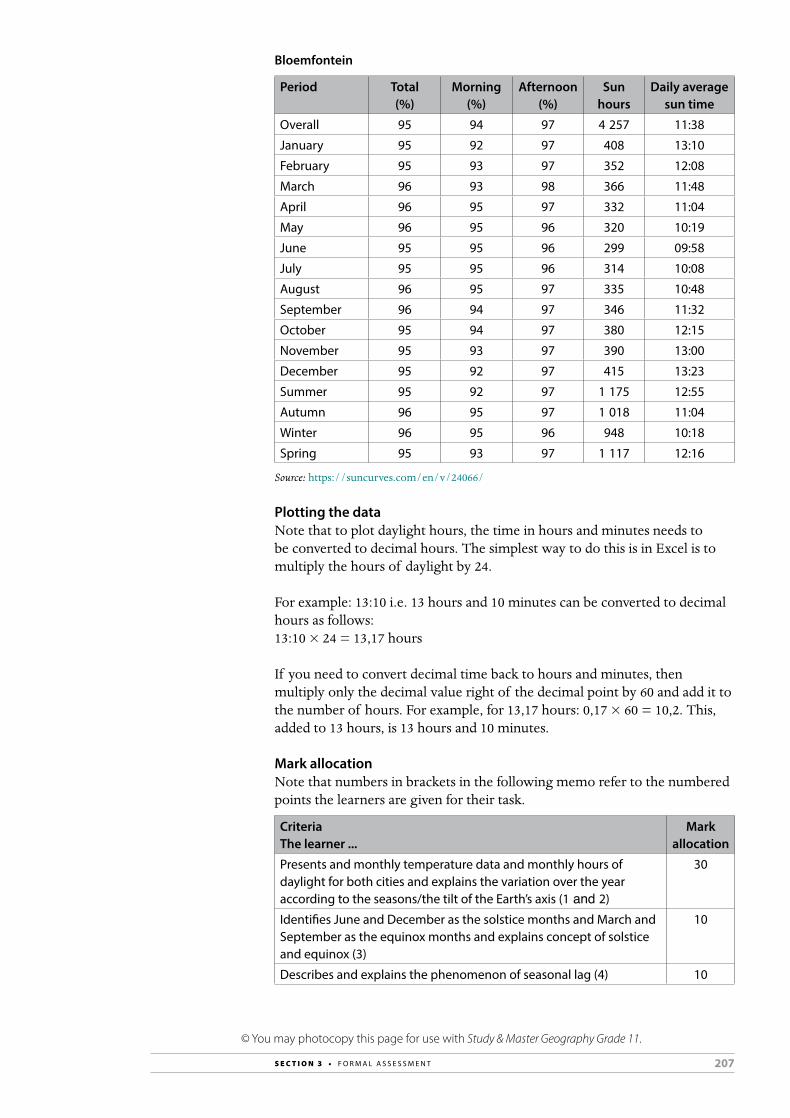
207S E C T I O N 3 • F O R M A L A S S E S S M E N T
Bloemfontein
Period Total (%)
Morning (%)
Afternoon (%)
Sun hours
Daily average sun time
Overall 95 94 97 4 257 11:38
January 95 92 97 408 13:10
February 95 93 97 352 12:08
March 96 93 98 366 11:48
April 96 95 97 332 11:04
May 96 95 96 320 10:19
June 95 95 96 299 09:58
July 95 95 96 314 10:08
August 96 95 97 335 10:48
September 96 94 97 346 11:32
October 95 94 97 380 12:15
November 95 93 97 390 13:00
December 95 92 97 415 13:23
Summer 95 92 97 1 175 12:55
Autumn 96 95 97 1 018 11:04
Winter 96 95 96 948 10:18
Spring 95 93 97 1 117 12:16
Source: https://suncurves.com/en/v/24066/
Plotting the dataNote that to plot daylight hours, the time in hours and minutes needs to be converted to decimal hours. The simplest way to do this is in Excel is to multiply the hours of daylight by 24.
For example: 13:10 i.e. 13 hours and 10 minutes can be converted to decimal hours as follows:13:10 × 24 = 13,17 hours
If you need to convert decimal time back to hours and minutes, then multiply only the decimal value right of the decimal point by 60 and add it to the number of hours. For example, for 13,17 hours: 0,17 × 60 = 10,2. This, added to 13 hours, is 13 hours and 10 minutes.
Mark allocationNote that numbers in brackets in the following memo refer to the numbered points the learners are given for their task.
CriteriaThe learner ...
Mark allocation
Presents and monthly temperature data and monthly hours of daylight for both cities and explains the variation over the year according to the seasons/the tilt of the Earth’s axis (1 and 2)
30
Identifies June and December as the solstice months and March and September as the equinox months and explains concept of solstice and equinox (3)
10
Describes and explains the phenomenon of seasonal lag (4) 10
© You may photocopy this page for use with Study & Master Geography Grade 11.
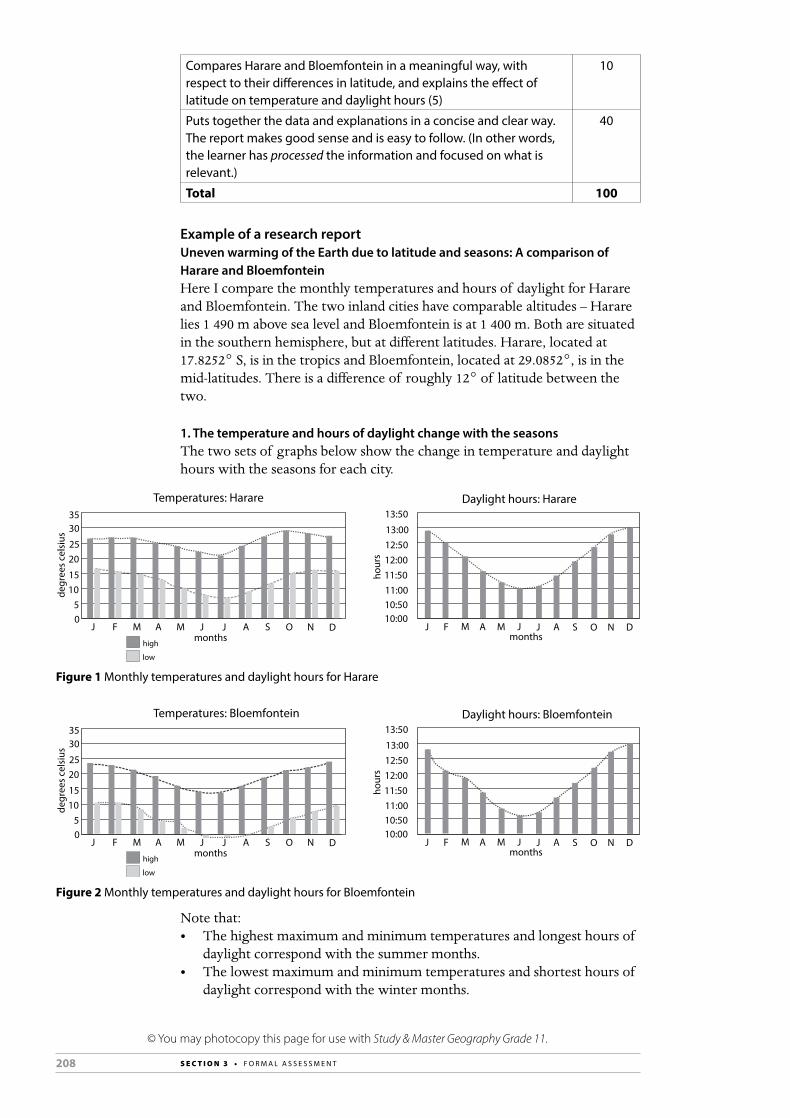
208 S E C T I O N 3 • F O R M A L A S S E S S M E N T
Compares Harare and Bloemfontein in a meaningful way, with respect to their differences in latitude, and explains the effect of latitude on temperature and daylight hours (5)
10
Puts together the data and explanations in a concise and clear way. The report makes good sense and is easy to follow. (In other words, the learner has processed the information and focused on what is relevant.)
40
Total 100
Example of a research reportUneven warming of the Earth due to latitude and seasons: A comparison of Harare and BloemfonteinHere I compare the monthly temperatures and hours of daylight for Harare and Bloemfontein. The two inland cities have comparable altitudes – Harare lies 1 490 m above sea level and Bloemfontein is at 1 400 m. Both are situated in the southern hemisphere, but at different latitudes. Harare, located at 17.8252° S, is in the tropics and Bloemfontein, located at 29.0852°, is in the mid-latitudes. There is a difference of roughly 12° of latitude between the two.
1. The temperature and hours of daylight change with the seasonsThe two sets of graphs below show the change in temperature and daylight hours with the seasons for each city.
Temperatures: Harare
degr
ees
cels
ius
2025
3035
10
05
15
monthshigh
low
J F NOSAJJMAM D
Daylight hours: Harare
12:0012:5013:00
13:50
11:00
10:0010:50
11:50
monthsJ F NOSAJJMAM D
hour
s
Figure 1 Monthly temperatures and daylight hours for Harare
Figure 2 Monthly temperatures and daylight hours for Bloemfontein
Temperatures: Bloemfontein
degr
ees
cels
ius
2025
3035
10
05
15
monthshigh
low
J F NOSAJJMAM D
Daylight hours: Bloemfontein
12:0012:5013:00
13:50
11:00
10:0010:50
11:50
monthsJ F NOSAJJMAM D
hour
s
Note that:• The highest maximum and minimum temperatures and longest hours of
daylight correspond with the summer months.• The lowest maximum and minimum temperatures and shortest hours of
daylight correspond with the winter months.
© You may photocopy this page for use with Study & Master Geography Grade 11.

209S E C T I O N 3 • F O R M A L A S S E S S M E N T
The reason for the seasons is the Earth’s tilted axis. As the Earth orbits the Sun during the year’s cycle, different parts of the Earth receive the most direct sunlight (insolation). Figure 3 shows that when the South Pole tilts towards the Sun, it is summer in the Southern hemisphere.
Figure 3 Summer in the Southern hemisphere
Figure 4 shows that when the North Pole tilts towards the Sun, it is winter in the Southern hemisphere.
Figure 4 Winter in the Southern hemisphere
2. The months with the shortest and longest hours of daylight coincide with the months in which the solstices occurIn the Southern hemisphere, the winter solstice is in June (around the 21st) and the summer solstice in December (around the 21st). In both the graphs for Harare and Bloemfontein above (see Figures 1 and 2), the shortest average hours of daylight are in June and the longest are in December.
At the time of the solstices the Sun’s rays are perpendicular to one of the 23.5° lines of latitude. This is because the Earth’s axis is tilted at an angle of 23.5°. Figure 5 shows that in winter, the Sun is directly over the Tropic of Cancer and in summer, the Sun is directly over the Tropic of Capricorn.
Figure 5 The solstices
Sun’
s ra
ys
EquatorEquatEq
winter summer
Sun’
s ra
ys
Tropic of Cancer
Equator
Tropic of Cancer
Tropic of CapricornTropic of Capricorn
Earth axis Earth axis
© You may photocopy this page for use with Study & Master Geography Grade 11.

210 S E C T I O N 3 • F O R M A L A S S E S S M E N T
3. The months in which there are more or less 12 hours of daylight coincide with the months in which the equinoxes occurTwice a year, at the time of the equinoxes (around 20 March and 23 September), the Earth’s axis is not tilted towards or away from the Sun. The Sun’s rays are perpendicular to the equator and all parts of the Earth (except for the extreme poles) experience days and nights of more or less equal length.
Figure 6 The equinox
Sun’
s ra
ys
Equator
Tropic of Cancer
Tropic of Capricorn
Earth axis
Antarctic Circle
Arctic Circle
In both the graphs for Harare and Bloemfontein above (see Figures 1 and 2), the hours of daylight approach 12 in or near the month of the equinoxes.
4. The seasonal temperature maximums and minimums occur only after, or persist after, the solsticesThe plot of temperatures in Figures 1 and 2 above shows the following:• For winter in Harare, July is slightly colder than June.• For winter in Bloemfontein, June and July are equally cold.• For summer in Harare, the highs for December, January and February are
all 27 °C. (But note that the hottest month in Harare is in fact October. This is just before the rains, when heat builds up without the cooling effect of cloud cover.)
• For summer in Bloemfontein the highs for December and January are both 31 °C.
In other words, the winter and summer temperature extremes occur only after the month of the solstice, or persist after the solstice.
This delay in the temperature extremes after the dates of maximum and minimum insolation is called seasonal lag (see Figure 7).
© You may photocopy this page for use with Study & Master Geography Grade 11.

211S E C T I O N 3 • F O R M A L A S S E S S M E N T
Figure 7 Seasonal
Seasonal lag
solar exposure average temperature
M MMarch March
A FM JJ J A DS O N
full newlast
spring summer autumn winter
�rst
The reason for this phenomenon is that more than two thirds of the Earth is covered by oceans, and water takes longer to heat up and cool down than the land does. In other words, water absorbs and releases heat more slowly than dry soil – it has a higher heat capacity.
5. Latitude affects the temperature and hours of daylightThe temperature differences and the variation in the daylight hours becomes more pronounced as the distance increases from the equator towards the poles.
The dotted lines in Figures 1 and 2 above show the range in temperature highs and lows. It is clear that the range for Bloemfontein (represented by the width of the band between the two dotted lines) is greater than it is for Harare, and this is because Bloemfontein is further from the equator. For Harare, the difference in the average of the highs and the average of the lows is 13 °C, while for Bloemfontein it is 19 °C. [Note to teacher: This is calculated by averaging the monthly highs (summing and dividing by 12), averaging the monthly lows and subtracting the one from the other.] And the difference in temperature extremes is greater for Bloemfontein (34 °C) than it is for Harare (22 °C). [Note to teacher: This is calculated by identifying the highest high – for example 31 °C for Bloemfontein and subtracting from it the lowest low, which is –3 °C.]
Also, insolation is greatest at the equator because the sun passes directly overhead (or is perpendicular relative to the horizon) every day of the year. As the distance from the equator decreases, insolation decreases. The average of the high and low temperatures for Harare is 19.3 °C, and for Bloemfontein 15.9 °C. [Note to teacher: This is taking the average of all 24 temperature values, both highs and lows.]
© You may photocopy this page for use with Study & Master Geography Grade 11.

212 S E C T I O N 3 • F O R M A L A S S E S S M E N T
Figure 8 Insolation decreases from the equator because the angle at which the Sun strikes the Earth becomes more oblique
Sun’
s ra
ysmost direct
sunlight Equator
In Figures 1 and 2, the dotted lines on the daylight hour graphs show that the difference between the longest daylight hours and the shortest daylight hours is more pronounced for Bloemfontein than it is for Harare (the dotted line dips lower). For Harare, the difference between the shortest and longest hours of daylight is 2h08, and for Bloemfontein it is 3h25. [Note to teacher: This is calculated by identifying the longest daylight hours and the shortest daylight hours and subtracting the one from the other e.g. 13h14 – 11h06.]
Figure 9 shows how latitude affects hours of daylight at the time of the solstices. The latitude 30°S approximates Bloemfontein’s latitude.
Figure 9 Variation of day length for the solstices due to latitude
December solstice June solstice
66.5O N = 0 hours 66.5O N = 24 hours
66.5O S = 24 hours
30O N = 10.25 hours
0O = 12 hours
0O = 12 hours
30O S = 10.25 hours
30O N = 14 hours
30O S = 14 hours
66.5O S = 0 hours
Sources• Source of temperature data for Harare and Bloemfontein is NOAA.• Daylight hours data for Harare was obtained from: www.worlddata.info• Daylight hours data for Bloemfontein was obtained from: suncurves.com Total: 100
© You may photocopy this page for use with Study & Master Geography Grade 11.
Aenyuser
Rectangle
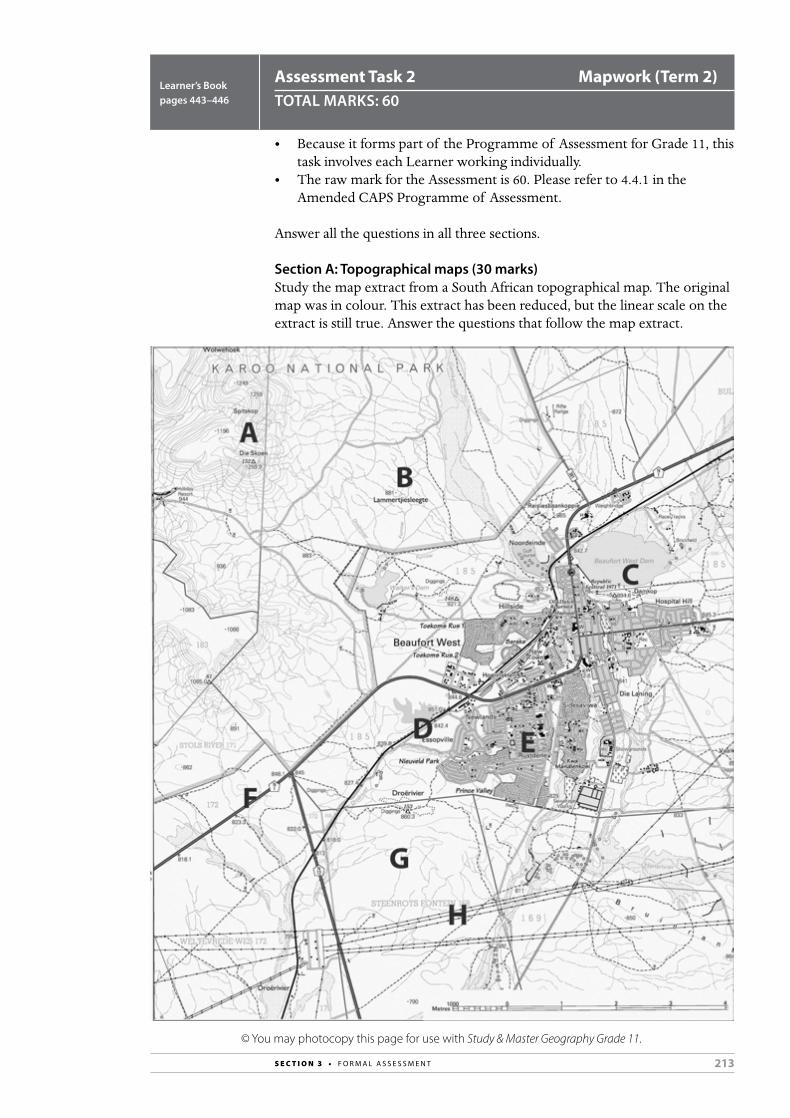
213S E C T I O N 3 • F O R M A L A S S E S S M E N T
Assessment Task 2 Mapwork (Term 2)TOTAL MARKS: 60
Learner’s Book pages 443–446
• Because it forms part of the Programme of Assessment for Grade 11, this task involves each Learner working individually.
• The raw mark for the Assessment is 60. Please refer to 4.4.1 in the Amended CAPS Programme of Assessment.
Answer all the questions in all three sections.
Section A: Topographical maps (30 marks)Study the map extract from a South African topographical map. The original map was in colour. This extract has been reduced, but the linear scale on the extract is still true. Answer the questions that follow the map extract.
© You may photocopy this page for use with Study & Master Geography Grade 11.

214 S E C T I O N 3 • F O R M A L A S S E S S M E N T
1. By definition, what is a topographical map? (2)2. What is the standard scale used for South African topographical maps? (1)3. Using the scale at the bottom of the map, calculate the straight-line
distance between A and D. (3)4. Which part of this landscape is the flattest; the north or the south?
Explain your answer. (2)5. What physical feature is found at A? (2)6. In which direction do the drainage lines at B flow? (1)7. Is this perennial or non-perennial drainage? Explain your answer. (2)8. Why is the feature at C so important to the town of Beaufort West? (2)9. What type of transport route is represented by D? (1)10. Does urban or rural settlement occur at E? Explain your answer. (2)11. What evidence is there on the map that at least part of this area is a
conservation and nature protection area? (2)12. What type of transport route is represented by F? (1)13. In what direction is the stream at G flowing? (1)14. What is represented by H? (1)15. Use a protractor to calculate the true bearing between B and C. (3)16. What is the difference between a true bearing, and a magnetic bearing,
on a topographical map? (1)17. What evidence from the map suggests that this area is very arid (dry) and
not suitable for crop farming? (3) [30]
Section B: Geographical Information Systems (16 marks)1. What is the difference between:
a) a geographic information system (GIS) and remote sensing? (2)b) a computer model and a data set? (2)
2. Look at the following figure and answer the questions that follow:
Summary layer
top
base
A
B
C
D
E
Population distribution
Average income per household
Employment%
Averageages
Educationdata
© You may photocopy this page for use with Study & Master Geography Grade 11.

215S E C T I O N 3 • F O R M A L A S S E S S M E N T
a) Give the figure a suitable heading or caption (2)b) What is represented by each of A to E? (1)c) What is meant by a summary layer? (1)d) Why are A to E exactly the same size and shape, and arranged the
way they are? (2)e) In this particular case, what appears to be the subject around
which information has been gathered or collected? (2)3. Give four real-world examples or situations where a GIS might
be used. (4) [16]
Section C: Graphs (14 marks) 1. Study the following diagram and answer the questions that follow:
Global energy sources
natural gas
oil
coal
other
a) What type of graph (diagram) is this? (1)b) Use a protractor to work out the proportion of each energy type
represented in the diagram. (2)c) Convert the proportions to percentages of global energy sources. (2) d) From your findings, say which energy source is the most
important. (1)2. Study the following diagram and answer the questions that follow:
Elec
tricity
dema
nd (m
egaw
atts)
Electricity generation (megawatts)
J NOSAJJAMF D
4040
30
20
50
10
20
30
50
10
MonthsM
demand
supply
© You may photocopy this page for use with Study & Master Geography Grade 11.
216 S E C T I O N 3 • F O R M A L A S S E S S M E N T
a) What two types of graph (diagram) are shown above? (2)b) What are the two graphs showing? (2)c) Name the two months where demand is greater than supply. (1) d) Name the two months in which there is a critical balance between
supply and demand. (1)e) What is the situation within the other eight months of the year? (1)f ) Assuming this is a southern hemisphere country, when is peak
demand; winter or summer? (1) [14] Total: 60 marks
Memorandum: Assessment Task 2: Mapwork (Term 2)TOTAL MARKS: 60
Section A: Topographical maps (30 marks)1. A large-scale map (usually 1:50 000) showing both physical and human
features of an area. (2)2. 1: 50 000 (1)3. Measure the distance A to B on the map with a ruler or piece of paper,
and place on the scale line to read off the true distance, which is 5,1 km (allow an error of 100 m either way) (3)
4. The south (bottom of the map extract) is the flattest as the contours here are generally further apart. The really high ground is in the north west. (2)
5. Steep slope/spitskop/mesa/butte/koppie/hill (any of these) (2)6. In a south-easterly direction (1)7. Non-perennial; dashed lines (2)8. Because the dam supplies the town with water (2)9. Railway line (1)10. Urban; the street pattern shows density of settlement and this area is
within the town. (2)11. The Karoo National Park is clearly indicated (2)12. National road (N1) (1)13. South west (1)14. Power lines or electricity cables (1)15. Measuring clockwise from the vertical at B to C, the answer is 113°
(allow error of 3° either side). (3)16. True bearing is the angle measured between points on the map, while
magnetic bearing is a compass bearing, which will differ from the true bearing by the value of the declination. (1)
17. Non-perennial streams, no large dams, no use of the agriculture symbol, sandy river beds (3)
[30]
Section B: Geographical Information Systems (16 marks)1. a) A GIS is a computer software system for working with spatial
information and data, while remote sensing is the capturing of data, without being in contact with the object being sensed (using a camera, for example). (2)
b) A computer model is a program that can processes spatial data, while a data set is the actual information, typically in digital format. (2)
2. a) GIS model showing relationships between population and demographic information (2)
© You may photocopy this page for use with Study & Master Geography Grade 11.

217S E C T I O N 3 • F O R M A L A S S E S S M E N T
© You may photocopy this page for use with Study & Master Geography Grade 11.
b) Layers in the GIS, each dealing with a specific aspect of the demographics of the area (1)
c) The summary layer combines the information from each layer to provide answers or information for practical problem solving for example, where to build a school. (1)
d) Because the area covered by the GIS ‘map’ is an exact predefined area (2)
e) Population distribution, and information regarding levels of social development (2)
3. Any four examples, ranging from physical planning, environmental conservation, health or education, or any other reasonable answers. (4)
[16]
Section C: Graphs (14 marks) 1. a) Pie chart/diagram/graph (1)
b) oil: 128°; coal: 97°; natural gas: 80°; other: 55° (2)c) oil: 36%; coal: 27%; natural gas: 22%; other: 15% (2)d) Oil is the most important. (1)
2. a) bar graph and line graph (2)b) Line graph shows electricity demand, bar graph shows electricity
supply. (1)c) June and July (2)d) May and August (2)e) Supply matches or slightly exceeds demand (1)f ) Winter (mid-year) (1) [14] Total: 60 marks
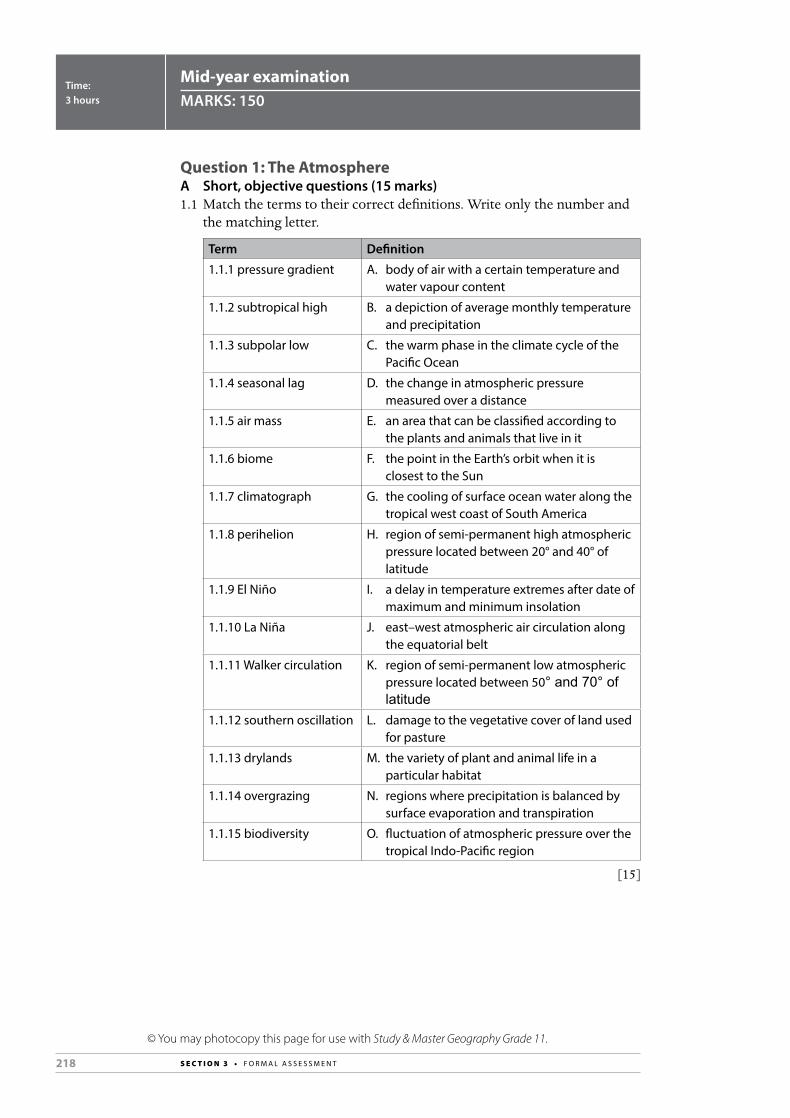
218 S E C T I O N 3 • F O R M A L A S S E S S M E N T
© You may photocopy this page for use with Study & Master Geography Grade 11.
Mid-year examinationMARKS: 150
Time: 3 hours
Question 1: The AtmosphereA Short, objective questions (15 marks)1.1 Match the terms to their correct definitions. Write only the number and
the matching letter.
Term Definition
1.1.1 pressure gradient A. body of air with a certain temperature and water vapour content
1.1.2 subtropical high B. a depiction of average monthly temperature and precipitation
1.1.3 subpolar low C. the warm phase in the climate cycle of the Pacific Ocean
1.1.4 seasonal lag D. the change in atmospheric pressure measured over a distance
1.1.5 air mass E. an area that can be classified according to the plants and animals that live in it
1.1.6 biome F. the point in the Earth’s orbit when it is closest to the Sun
1.1.7 climatograph G. the cooling of surface ocean water along the tropical west coast of South America
1.1.8 perihelion H. region of semi-permanent high atmospheric pressure located between 20° and 40° of latitude
1.1.9 El Niño I. a delay in temperature extremes after date of maximum and minimum insolation
1.1.10 La Niña J. east–west atmospheric air circulation along the equatorial belt
1.1.11 Walker circulation K. region of semi-permanent low atmospheric pressure located between 50° and 70° of latitude
1.1.12 southern oscillation L. damage to the vegetative cover of land used for pasture
1.1.13 drylands M. the variety of plant and animal life in a particular habitat
1.1.14 overgrazing N. regions where precipitation is balanced by surface evaporation and transpiration
1.1.15 biodiversity O. fluctuation of atmospheric pressure over the tropical Indo-Pacific region
[15]
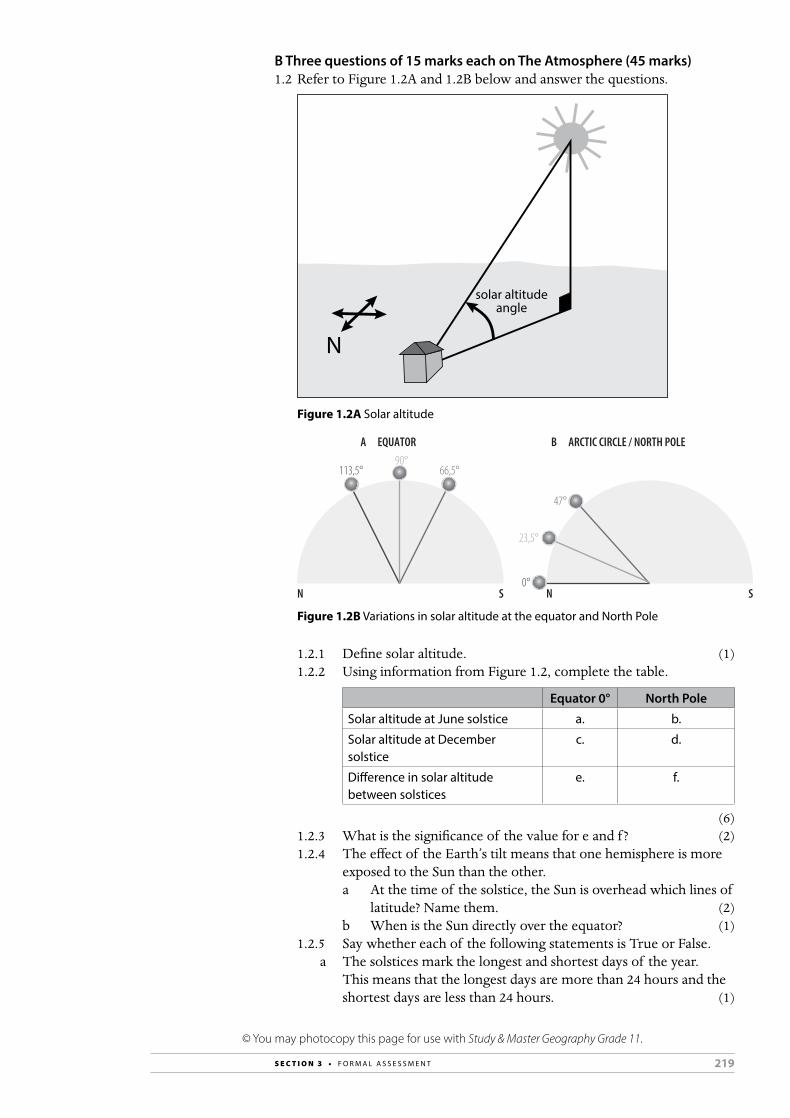
219S E C T I O N 3 • F O R M A L A S S E S S M E N T
© You may photocopy this page for use with Study & Master Geography Grade 11.
B Three questions of 15 marks each on The Atmosphere (45 marks)1.2 Refer to Figure 1.2A and 1.2B below and answer the questions.
N
solar altitudeangle
Figure 1.2A Solar altitude
N NS S0°
113,5°90°
66,5°
23,5°
47°
EQUATOR ARCTIC CIRCLE / NORTH POLEA B
Figure 1.2B Variations in solar altitude at the equator and North Pole
1.2.1 Define solar altitude. (1)1.2.2 Using information from Figure 1.2, complete the table.
Equator 0° North Pole
Solar altitude at June solstice a. b.
Solar altitude at December solstice
c. d.
Difference in solar altitude between solstices
e. f.
(6)1.2.3 What is the significance of the value for e and f ? (2)1.2.4 The effect of the Earth’s tilt means that one hemisphere is more
exposed to the Sun than the other. a At the time of the solstice, the Sun is overhead which lines of
latitude? Name them. (2) b When is the Sun directly over the equator? (1)1.2.5 Say whether each of the following statements is True or False. a The solstices mark the longest and shortest days of the year.
This means that the longest days are more than 24 hours and the shortest days are less than 24 hours. (1)

220 S E C T I O N 3 • F O R M A L A S S E S S M E N T
© You may photocopy this page for use with Study & Master Geography Grade 11.
b The solstice marks two moments in the year when the Sun’s apparent path in the sky is furthest north or south of the equator. (1)
c At equinox time, day and night are approximately equal length all over the Earth. (1)
[15]
1.3.1 Refer to Figure 1.3A below. Choose the correct bracketed term to make each of the statements below TRUE.
90° Equator 90°
DE
A
B
C
Figure 1.3A Cross-section view of the tri-cellular model of atmospheric circulation
a A represents a (Ferrel/polar) front. (1) b B is a (tropical/mid-latitude) cell. (1) c C represents a zone of (low/high) pressure. (1) d D represents the (westerly/tropical easterly) wind belt. (1) e Surface (convergence/divergence) takes place at E. (1)
1.3.2 Refer to the Figure 1.3B and answer the questions that follow.
ITCZ
30°N
0°
30°S
Figure 1.3B
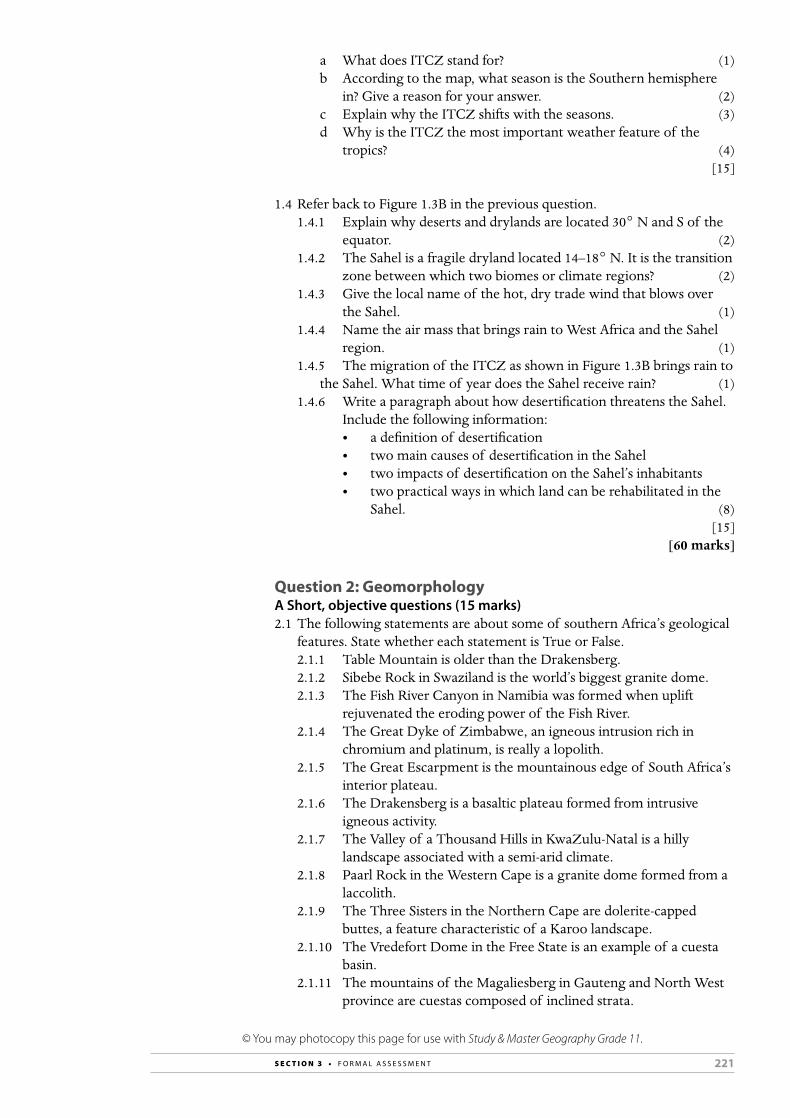
221S E C T I O N 3 • F O R M A L A S S E S S M E N T
© You may photocopy this page for use with Study & Master Geography Grade 11.
a What does ITCZ stand for? (1) b According to the map, what season is the Southern hemisphere
in? Give a reason for your answer. (2) c Explain why the ITCZ shifts with the seasons. (3) d Why is the ITCZ the most important weather feature of the
tropics? (4) [15]
1.4 Refer back to Figure 1.3B in the previous question.1.4.1 Explain why deserts and drylands are located 30° N and S of the
equator. (2)1.4.2 The Sahel is a fragile dryland located 14–18° N. It is the transition
zone between which two biomes or climate regions? (2)1.4.3 Give the local name of the hot, dry trade wind that blows over
the Sahel. (1)1.4.4 Name the air mass that brings rain to West Africa and the Sahel
region. (1)1.4.5 The migration of the ITCZ as shown in Figure 1.3B brings rain to
the Sahel. What time of year does the Sahel receive rain? (1)1.4.6 Write a paragraph about how desertification threatens the Sahel.
Include the following information: • a definition of desertification • two main causes of desertification in the Sahel • two impacts of desertification on the Sahel’s inhabitants • two practical ways in which land can be rehabilitated in the
Sahel. (8) [15] [60 marks]
Question 2: GeomorphologyA Short, objective questions (15 marks)2.1 The following statements are about some of southern Africa’s geological
features. State whether each statement is True or False.2.1.1 Table Mountain is older than the Drakensberg.2.1.2 Sibebe Rock in Swaziland is the world’s biggest granite dome.2.1.3 The Fish River Canyon in Namibia was formed when uplift
rejuvenated the eroding power of the Fish River.2.1.4 The Great Dyke of Zimbabwe, an igneous intrusion rich in
chromium and platinum, is really a lopolith.2.1.5 The Great Escarpment is the mountainous edge of South Africa’s
interior plateau.2.1.6 The Drakensberg is a basaltic plateau formed from intrusive
igneous activity.2.1.7 The Valley of a Thousand Hills in KwaZulu-Natal is a hilly
landscape associated with a semi-arid climate.2.1.8 Paarl Rock in the Western Cape is a granite dome formed from a
laccolith.2.1.9 The Three Sisters in the Northern Cape are dolerite-capped
buttes, a feature characteristic of a Karoo landscape.2.1.10 The Vredefort Dome in the Free State is an example of a cuesta
basin.2.1.11 The mountains of the Magaliesberg in Gauteng and North West
province are cuestas composed of inclined strata.
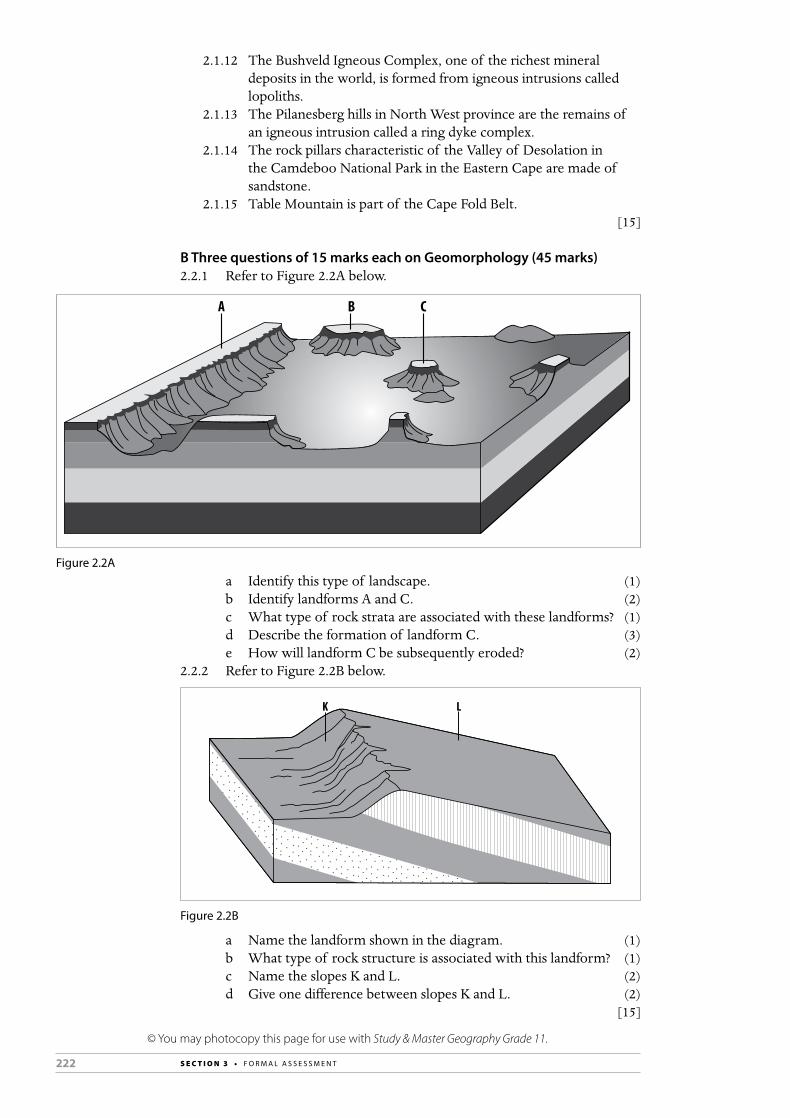
222 S E C T I O N 3 • F O R M A L A S S E S S M E N T
© You may photocopy this page for use with Study & Master Geography Grade 11.
2.1.12 The Bushveld Igneous Complex, one of the richest mineral deposits in the world, is formed from igneous intrusions called lopoliths.
2.1.13 The Pilanesberg hills in North West province are the remains of an igneous intrusion called a ring dyke complex.
2.1.14 The rock pillars characteristic of the Valley of Desolation in the Camdeboo National Park in the Eastern Cape are made of sandstone.
2.1.15 Table Mountain is part of the Cape Fold Belt. [15]
B Three questions of 15 marks each on Geomorphology (45 marks)2.2.1 Refer to Figure 2.2A below.
A B C
Figure 2.2A a Identify this type of landscape. (1) b Identify landforms A and C. (2) c What type of rock strata are associated with these landforms? (1) d Describe the formation of landform C. (3) e How will landform C be subsequently eroded? (2)
2.2.2 Refer to Figure 2.2B below.
Figure 2.2B
K L
a Name the landform shown in the diagram. (1) b What type of rock structure is associated with this landform? (1) c Name the slopes K and L. (2) d Give one difference between slopes K and L. (2) [15]
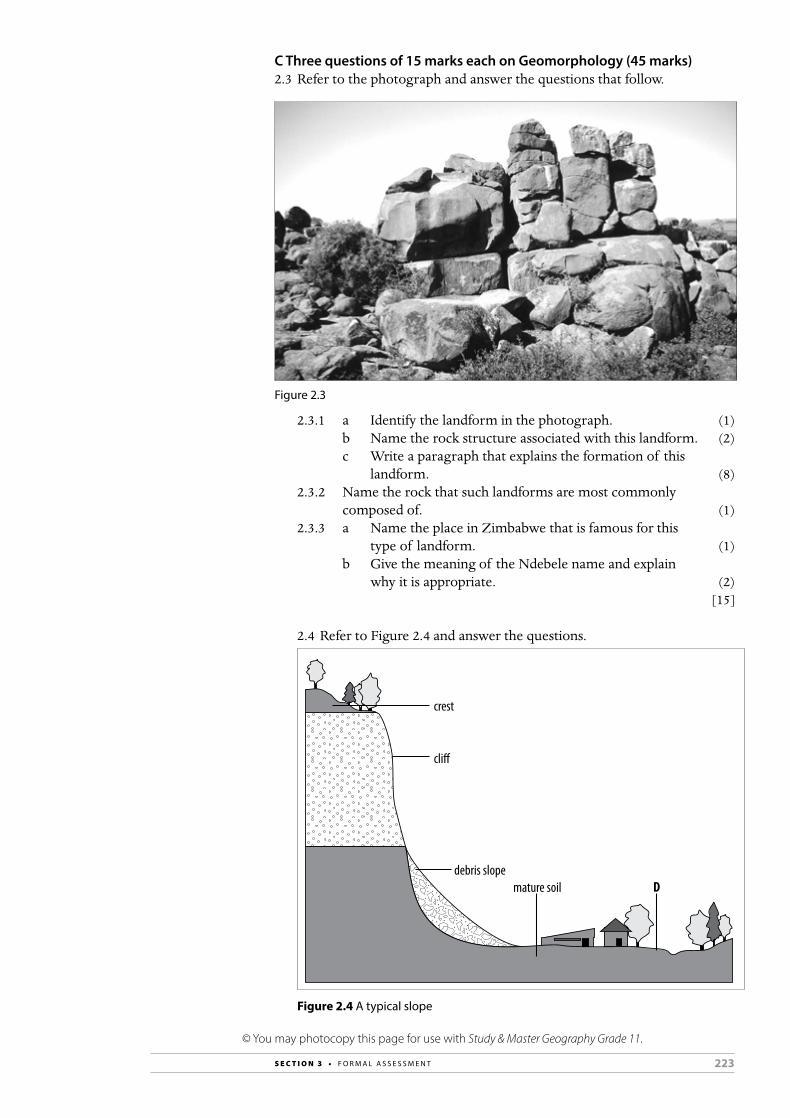
223S E C T I O N 3 • F O R M A L A S S E S S M E N T
© You may photocopy this page for use with Study & Master Geography Grade 11.
C Three questions of 15 marks each on Geomorphology (45 marks)2.3 Refer to the photograph and answer the questions that follow.
Figure 2.3
2.3.1 a Identify the landform in the photograph. (1) b Name the rock structure associated with this landform. (2) c Write a paragraph that explains the formation of this
landform. (8)2.3.2 Name the rock that such landforms are most commonly
composed of. (1)2.3.3 a Name the place in Zimbabwe that is famous for this
type of landform. (1) b Give the meaning of the Ndebele name and explain
why it is appropriate. (2) [15]
2.4 Refer to Figure 2.4 and answer the questions.
crest
cli�
debris slopemature soil D
Figure 2.4 A typical slope

224 S E C T I O N 3 • F O R M A L A S S E S S M E N T
© You may photocopy this page for use with Study & Master Geography Grade 11.
2.4.1 Give a definition for a slope. (1)2.4.2 a Describe the shape of the crest. (1) b Describe one way in which the crest and cliff are very
different. (2)2.4.3 a Give another term for a cliff. (1) b Explain why the cliff slope is very steep. (1)2.4.4 a Give another term for the debris slope. (1) b List two characteristics of the debris slope. (2)2.4.5 a Name the slope element labelled D. (1) b List two characteristics of this slope. (2)2.4.6 On which slope element would the following occur? a soil creep (1) b sheetwash (1) c rock falls (1) [15] [60 marks]
Question 3: Mapwork (30 marks) A Map skills and calculations (10 marks)1.1 On a 1: 50 000 topographical map, how many kilometres/metres are
represented by:1.1.1 4,6 cm1.1.2 23,42 cm (2)
1.2 Look at the following diagram and answer the questions that follow the diagram:
X Y
(m)
400
450
500
550
550
C
B
A DE
F
1.2.1 Give the diagram a suitable heading (2)1.2.2 What topographical map feature is represented by B? (1)1.2.3 Is A visible from B? (1)1.2.4 Is C visible from D (1)1.2.5 What do E and F represent respectively? (2)1.2.6 What is the term we use to describe the enlargement of the
vertical map scale to make features stand out in a diagram such as the one above? (1)
[10]
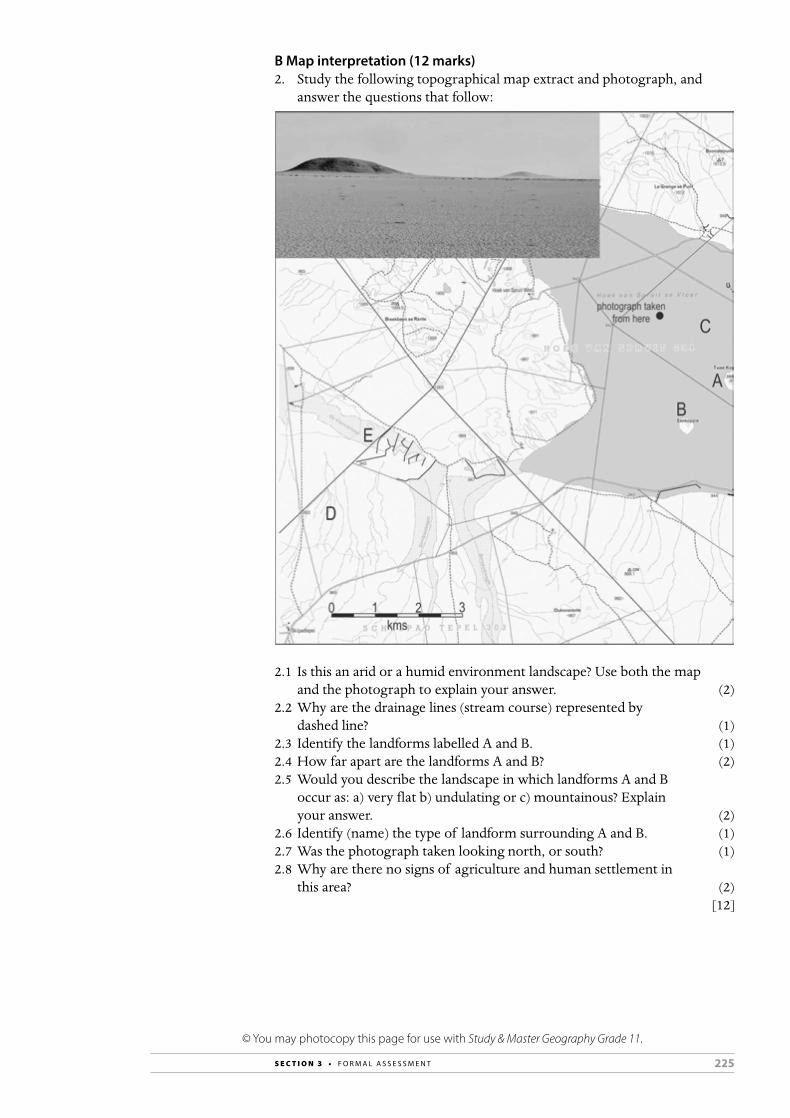
225S E C T I O N 3 • F O R M A L A S S E S S M E N T
© You may photocopy this page for use with Study & Master Geography Grade 11.
B Map interpretation (12 marks)2. Study the following topographical map extract and photograph, and
answer the questions that follow:
2.1 Is this an arid or a humid environment landscape? Use both the map and the photograph to explain your answer. (2)
2.2 Why are the drainage lines (stream course) represented by dashed line? (1)
2.3 Identify the landforms labelled A and B. (1)2.4 How far apart are the landforms A and B? (2)2.5 Would you describe the landscape in which landforms A and B
occur as: a) very flat b) undulating or c) mountainous? Explain your answer. (2)
2.6 Identify (name) the type of landform surrounding A and B. (1)2.7 Was the photograph taken looking north, or south? (1)2.8 Why are there no signs of agriculture and human settlement in
this area? (2) [12]

226 S E C T I O N 3 • F O R M A L A S S E S S M E N T
© You may photocopy this page for use with Study & Master Geography Grade 11.
GIS (8 marks) 3.1 Define the following terms:
3.1.1 Spatially referenced data (2)3.1.2 Attribute data (2)
3.2 Distinguish between (3.2.1) spatial resolution and (3.2.2) spectral resolution in a GIS and/or remote sensing exercise. (2)
3.3 Look at the following diagram of a GIS model and answer the questions that follow:
A
B
C
D
E
X
3.3.1 What do each of A to E represent? (1)3.3.2 What is represented by X? (1) [8] [30 marks] TOTAL: 150 marks

227S E C T I O N 3 • F O R M A L A S S E S S M E N T
© You may photocopy this page for use with Study & Master Geography Grade 11.
Memorandum: Mid-year examination TOTAL MARKS: 150
Question 1: The Atmosphere (60 marks)1.1.1 D1.1.2 H1.1.3 K1.1.4 I1.1.5 A1.1.6 E1.1.7 B1.1.8 F1.1.9 C1.1.10 G1.1.11 J1.1.12 O1.1.13 N1.1.14 L1.1.15 M [15]
1.2.1 the angle/position of the Sun (or height of the Sun in the sky) relative to the Earth’s horizon (1)
1.2.2 a 113,5° b 0° c 66,5° d 47° e 47° f 47° (6)1.2.3 It is 2 × 23,5° which is double the tilt of the Earth’s axis. (2)1.2.4 a 23,5° N and S, i.e. Tropic of Capricorn and Tropic of Cancer (2) b at the equinox (1)1.2.5 a False (1) b True (1) c True (1) [15]
1.3.1 a polar (1) b mid-latitude (1) c high (1) d tropical easterly (1) e convergence (1)1.3.2 a Intertropical Convergence Zone (1) b winter (1); the ITCZ is north of the equator (1) (2) c With the change in seasons during the year, the position of
the Sun’s highest point in the sky migrates between the Tropic of Capricorn and the Tropic of Cancer. (1) This means that patterns of maximum insolation/heat distribution change too. (1) And the ITZC and the other pressure belts shift with the seasons. (1) (3)
228 S E C T I O N 3 • F O R M A L A S S E S S M E N T
© You may photocopy this page for use with Study & Master Geography Grade 11.
d The ITCZ is a front where tropical air masses north and south of the equator converge/meet.(1) The equator receives more solar radiation than the other latitudes. (1) The heat evaporates large amounts of water, (1) giving rise to convective rain and thunderstorms. (1) (4)
[15]
1.4.1 The 30° latitudes are associated with stable descending air/air subsidence (1) which is not conducive to rainfall. Generally, conditions are hot and dry (1). (2)
1.4.2 the Sahara Desert and tropical grasslands (2)1.4.3 harmattan (1)1.4.4 continental tropical (1)1.4.5 during the Southern hemisphere’s winter OR May to September (1)1.4.6 Desertification is land degradation in drylands (1) that results in loss
of soil fertility and biodiversity. (1) The main causes of desertification in the Sahel region are (any two):
1) overgrazing (made worse by colonial powers imposing boundaries that disrupted migration routes for nomadic herders)
2) deforestation (mainly for fuel) 3) over-cultivation of the land 4) poor irrigation practices. (2)
The impact on the inhabitants in this region include (any two): hardship due to shortage of resources such as water, arable land and food; conflict due to competition for limited resources; and migration of subsistence farmers to town and cities. (2)
Ways of rehabilitating degraded land include (any two): using an old local tradition of planting pits or zai holes; water harvesting; use of mobile bomas to coral livestock at night; agroforestry, which is growing trees in croplands. (2) (8)
[15] [60 marks]
Question 2: Geomorphology2.1.1 True2.1.2 True2.1.3 True2.1.4 True2.1.5 True2.1.6 False2.1.7 False2.1.8 False2.1.9 True2.1.10 False2.1.11 True2.1.12 True2.1.13 True2.1.14 False2.1.15 True [15]
229S E C T I O N 3 • F O R M A L A S S E S S M E N T
© You may photocopy this page for use with Study & Master Geography Grade 11.
2.2.1 a Karoo landscape (1) b A = plateau, C = butte (2) c horizontal rock strata (1) d A plateau is divided (1) by downward erosion of running water
into blocks of rock which become mesas. (1) Scarp retreat (1) of mesas reduces the rectangular mesa to a conical shaped butte. (3)
e The butte will lose its cap of resistant rock (1) and become a conical hill. (1) (2)
2.2.2 a cuesta (1) b inclined/tilted rocks strata (1) c K = scarp slope, L = dip slope (2) d K/scarp slope is steep and L/dip slope is gentle OR K/scarp
slope is perpendicular to resistant rock strata whereas L/dip slope is parallel. (2)
[15]
2.3.1 a tor (1) b massive (1) igneous (1) rock (2) c Chemical erosion (1) takes place in the joints and cracks (1)
on the batholith (1) under the Earth’s surface, (1) dividing the massive rock into large blocks. (1) Later the overlying layers of the earth are removed (1) due to mechanical erosion and weathering, exposing these blocks of rock. Further mechanical weathering by wind and water rounds these blocks (1) into core stones or cornerstones (1), which come to look like a stack of rocks that have been fitted together. (8)
2.3.2 granite (1)2.3.3 a Matobo/Matopos Hills (1) b bald heads; (1) some of the tors looks like figures or statues with
the top-most rocks looking like heads (1) (2) [15]
2.4.1 An incline (or the angle) between high and low ground (1)2.4.2 a convex/rounded (1) b The crest is more or less horizontal, while the cliff is more
or less vertical. OR The crest is covered with a thin layer of soil, while the cliff is
practically naked of soil. (2)2.4.3 a scarp/freeface (1) b The cliff is composed of hard resistant rock OR scarp retreat/
parallel retreat has taken place. (1)2.4.4 a talus slope/scree slope (1) b angle of repose is 35°; all debris collects/accumulates on this
slope (2)2.4.5 a pediment (1) b a gentle concave slope; it merges with the valley floor (2)2.4.6 a crest (1) b pediment (1) c cliff (1) [15] [60 marks]
230 S E C T I O N 3 • F O R M A L A S S E S S M E N T
© You may photocopy this page for use with Study & Master Geography Grade 11.© You may photocopy this page for use with Study & Master Geography Grade 11.
Question 3: Mapwork 1.1.1 2,3 km (1)1.1.2 11,71 km (1)1.2.1 Cross section of a landscape (2)1.2.2 Beacon or trig beacon (1)1.2.3 No, not quite (1)1.2.4 Yes (1)1.2.5 Vertical scale (E) and horizontal scale (F) (2) 1.2.6 Vertical exaggeration (1) [10]
2.1 Arid environment; no vegetation, no rivers or standing water (2)2.2 Non-perennial drainage; streams hardly ever flow (1)2.3 Hills, or koppies, or inselbergs (1)2.4 Using the scale on the map: 1,7 km (allow 100 m error either way) (2)2.5 a) very flat; this is evident from the lack of contours on the map, and
can be seen on the photograph. (2)2.6 Pan, or dry lake, or playa (1) 2.7 South (1)2.8 Because it is so dry; very little farming; just some stock and game farming
(2) [12]
3.1.1 Data (information) that is linked to map coordinates in a GIS. (2)3.1.2 Information in table format, linked to spatial features. The spatial
data is the where and attribute data the what and why. (2)3.2.1 Spatial resolution has to do with scale and detail on a GIS map.3.2.2 Spectral resolution has to do with the different wave lengths that a
remote sensing device can handle. (2)3.3.1 Layers (each one covering a specific topic or aspect of the physical or
human landscape) (1)3.3.2 X is the summary layer, which brings it all together in the GIS. (1) [8] [30 marks] TOTAL: 150 marks
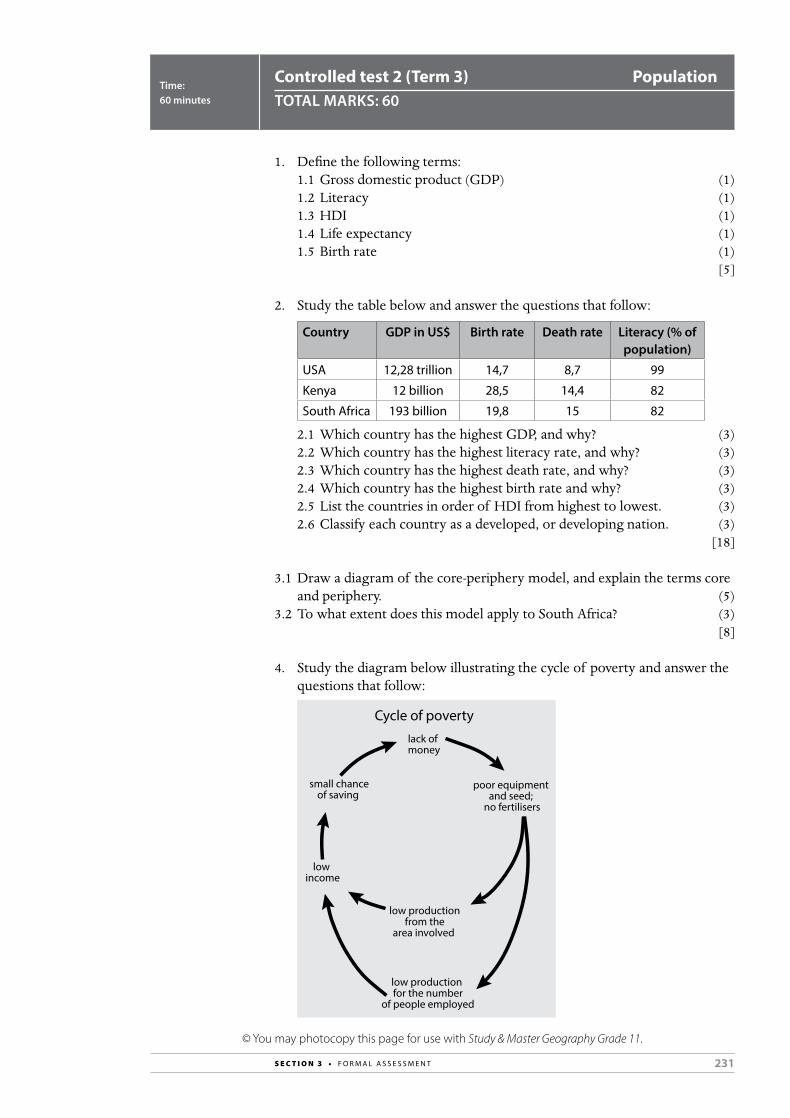
231S E C T I O N 3 • F O R M A L A S S E S S M E N T
© You may photocopy this page for use with Study & Master Geography Grade 11.
Controlled test 2 (Term 3) PopulationTOTAL MARKS: 60
Time:60 minutes
1. Define the following terms:1.1 Gross domestic product (GDP) (1)1.2 Literacy (1)1.3 HDI (1)1.4 Life expectancy (1)1.5 Birth rate (1)
[5]
2. Study the table below and answer the questions that follow:
Country GDP in US$ Birth rate Death rate Literacy (% of population)
USA 12,28 trillion 14,7 8,7 99
Kenya 12 billion 28,5 14,4 82
South Africa 193 billion 19,8 15 82
2.1 Which country has the highest GDP, and why? (3) 2.2 Which country has the highest literacy rate, and why? (3)2.3 Which country has the highest death rate, and why? (3)2.4 Which country has the highest birth rate and why? (3)2.5 List the countries in order of HDI from highest to lowest. (3)2.6 Classify each country as a developed, or developing nation. (3)
[18]
3.1 Draw a diagram of the core-periphery model, and explain the terms core and periphery. (5)
3.2 To what extent does this model apply to South Africa? (3) [8]
4. Study the diagram below illustrating the cycle of poverty and answer the questions that follow:
Cycle of poverty
lack of money
small chanceof saving
poor equipment and seed;
no fertilisers
low income
low productionfrom the
area involved
low production for the number
of people employed
232 S E C T I O N 3 • F O R M A L A S S E S S M E N T
© You may photocopy this page for use with Study & Master Geography Grade 11.
4.1 Where, in South Africa, is this cycle of poverty most noticeable? (3) 4.2 List some practical steps that need to be taken by government, the private
sector, and the people themselves to break the cycle of poverty. (8) [11]
5. What is meant by a model of sustainable development and what are the three important groups of factors in such a model?
[4]
6. Explain the term ‘globalisation’. What are the positive and negative aspects of globalisation?
[6]
7. Explain how the slave trade and colonialisation impacted on the development of different parts of the world.
[8] Total: 60 marks
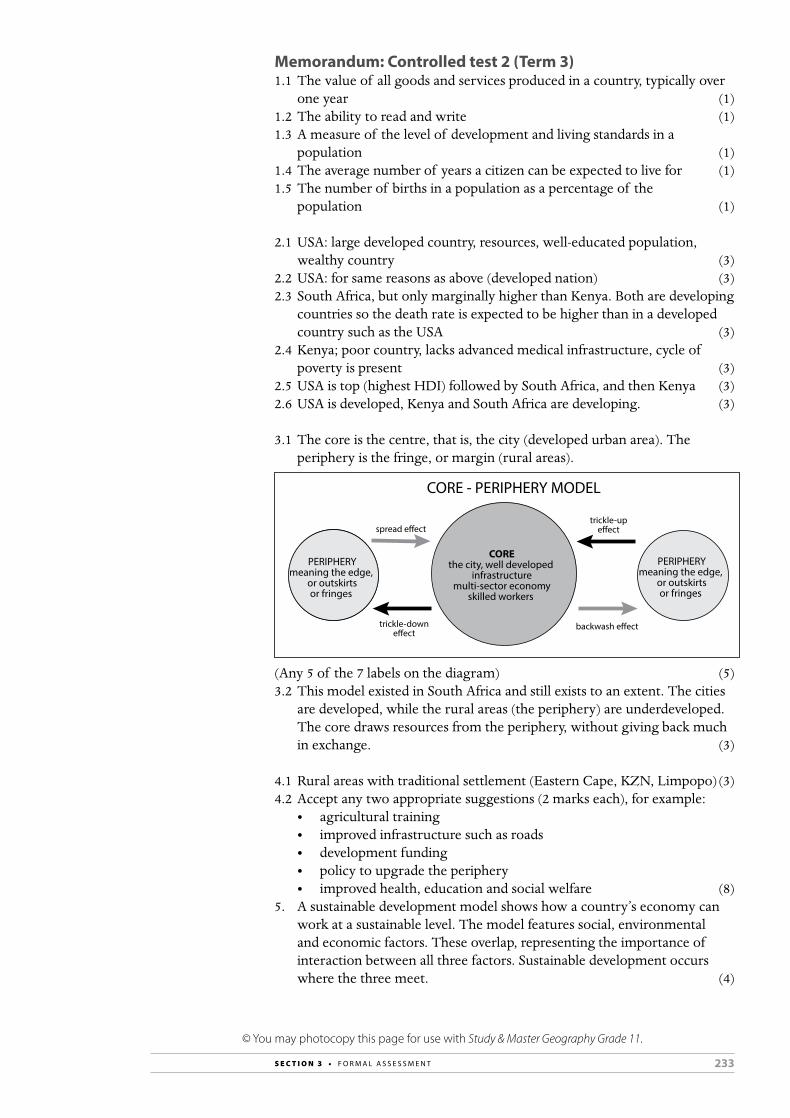
233S E C T I O N 3 • F O R M A L A S S E S S M E N T
© You may photocopy this page for use with Study & Master Geography Grade 11.
Memorandum: Controlled test 2 (Term 3)1.1 The value of all goods and services produced in a country, typically over
one year (1)1.2 The ability to read and write (1)1.3 A measure of the level of development and living standards in a
population (1)1.4 The average number of years a citizen can be expected to live for (1)1.5 The number of births in a population as a percentage of the
population (1)
2.1 USA: large developed country, resources, well-educated population, wealthy country (3)
2.2 USA: for same reasons as above (developed nation) (3)2.3 South Africa, but only marginally higher than Kenya. Both are developing
countries so the death rate is expected to be higher than in a developed country such as the USA (3)
2.4 Kenya; poor country, lacks advanced medical infrastructure, cycle of poverty is present (3)
2.5 USA is top (highest HDI) followed by South Africa, and then Kenya (3)2.6 USA is developed, Kenya and South Africa are developing. (3)
3.1 The core is the centre, that is, the city (developed urban area). The periphery is the fringe, or margin (rural areas).
COREthe city, well developed
infrastructuremulti-sector economy
skilled workers
PERIPHERYmeaning the edge,
or outskirtsor fringes
spread e�ecttrickle-up
e�ect
trickle-downe�ect
backwash e�ect
CORE - PERIPHERY MODEL
PERIPHERYmeaning the edge,
or outskirtsor fringes
(Any 5 of the 7 labels on the diagram) (5)3.2 This model existed in South Africa and still exists to an extent. The cities
are developed, while the rural areas (the periphery) are underdeveloped. The core draws resources from the periphery, without giving back much in exchange. (3)
4.1 Rural areas with traditional settlement (Eastern Cape, KZN, Limpopo) (3) 4.2 Accept any two appropriate suggestions (2 marks each), for example:
• agricultural training• improved infrastructure such as roads• development funding• policy to upgrade the periphery• improved health, education and social welfare (8)
5. A sustainable development model shows how a country’s economy can work at a sustainable level. The model features social, environmental and economic factors. These overlap, representing the importance of interaction between all three factors. Sustainable development occurs where the three meet. (4)

234 S E C T I O N 3 • F O R M A L A S S E S S M E N T
© You may photocopy this page for use with Study & Master Geography Grade 11.
6. Globalisation is a process that involves bringing together the economies of different nations into one global economy. It involves the free flow of goods, services, money (capital), technology and labour from one country to another. It often involves the expansion of large corporations called multinational corporations (MNC) to increase their markets and their profits. A positive aspect of globalisation is that it can increase wealth in a country or region and it can provide jobs. The main negative aspect is the exploitation of workers and resources in poorer countries, to the benefit of the rich nations. (6)
7. The Slave Trade led to approximately 12 million Africans being forcibly removed to work as labourers in the colonies of North and South America. This created wealth for the slave and plantation owners, but devastation to the African communities. This affected the future economic and social development of Africa. The period of colonialism was when European countries raced to claim control over huge areas of the world. They wanted access to resources for their factories.
The colonial powers extracted raw materials from their colonies, took these back to their mother country, developed their industries, and exported the products back to the colony. This process took away the ability of the colony to develop its own economy. (8)
Total: 60 marks

235S E C T I O N 3 • F O R M A L A S S E S S M E N T
© You may photocopy this page for use with Study & Master Geography Grade 11.
End-of-year examination Paper 1 (The Atmosphere, Geomorphology, Mapwork)MARKS: 150
Time:3 hours
Question 1: The AtmosphereA Short, objective questions (15 marks)1.1 Select the correct bracketed option to make the statements true. Write
down only the number and the correct option.1.1.1 The position in the Earth’s orbit when it is furthest from the Sun
is called the (aphelion/perihelion).1.1.2 Another term for the subtropical highs are the (horse latitudes/
doldrums).1.1.3 The prevailing easterlies are also known as the (trade winds/
doldrums).1.1.4 A geostrophic wind blows (perpendicular/parallel) to the isobars.1.1.5 In North America a Föhn wind is called a (berg/chinook) wind.1.1.6 The saucer-shaped cloud that often forms over the mountain
when a Föhn wind blows is called a (lenticular/stratus) cloud.1.1.7 The northern and southern extremes of Africa are characterised
by a sub-(tropical/Mediterranean) climate.1.1.8 The coastal regions in the (tropics/mid-latitudes) have a maritime
climate in which the sea moderates the temperature extremes.1.1.9 A (tropical/temperate) climate has high temperatures and rainfall
throughout the year.1.1.10 At the time of El Niño, waters off the coast of Peru are (warmer/
colder) than normal and consequently the fishing is bad.1.1.11 Land breezes tend to blow during the (day/night).1.1.12 Air convergence occurs at a zone of (low/high) pressure.1.1.13 The process in which air loses heat as it expands id called
(thermodynamic/adiabatic) cooling.1.1.14 A (monsoon/harmattan) is a seasonal prevailing wind in south
and south-east Asia.1.1.15 The unit of windspeed, the (knot/millibar), is roughly 2 km/
hour. [15]
B Three questions of 15 marks each on The Atmosphere (45 marks)1.2 Refer to Figure 1.2 and answer the questions.
30°
60°
D
E
F
12
G
H
0°
B
C
A
Figure 1.2 The pattern of air circulation in the Southern hemisphere
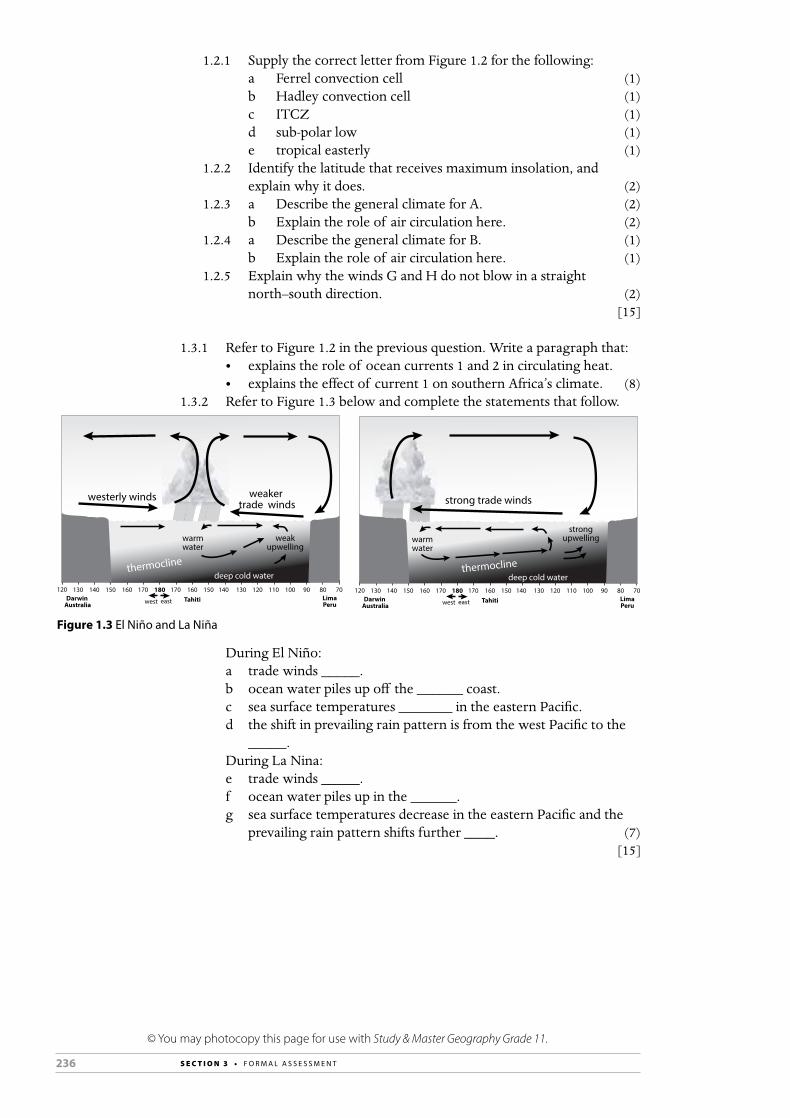
236 S E C T I O N 3 • F O R M A L A S S E S S M E N T
© You may photocopy this page for use with Study & Master Geography Grade 11.
1.2.1 Supply the correct letter from Figure 1.2 for the following: a Ferrel convection cell (1) b Hadley convection cell (1) c ITCZ (1) d sub-polar low (1) e tropical easterly (1)1.2.2 Identify the latitude that receives maximum insolation, and
explain why it does. (2)1.2.3 a Describe the general climate for A. (2) b Explain the role of air circulation here. (2)1.2.4 a Describe the general climate for B. (1) b Explain the role of air circulation here. (1)1.2.5 Explain why the winds G and H do not blow in a straight
north–south direction. (2) [15]
1.3.1 Refer to Figure 1.2 in the previous question. Write a paragraph that: • explains the role of ocean currents 1 and 2 in circulating heat. • explains the effect of current 1 on southern Africa’s climate. (8)
1.3.2 Refer to Figure 1.3 below and complete the statements that follow.
westerly winds weaker trade winds
thermocline deep cold water
weakupwelling
warmwater
Darwin Australia
Tahiti LimaPeruwest east
120 80130 90140 150 100180170 70110170 160 150 140 130 120160
strong trade winds
thermocline deep cold water
strongupwelling
warmwater
Darwin Australia
Tahiti LimaPeruwest east
120 80130 90140 150 100180170 70110170 160 150 140 130 120160
Figure 1.3 El Niño and La Niña
During El Niño: a trade winds _____. b ocean water piles up off the ______ coast. c sea surface temperatures _______ in the eastern Pacific. d the shift in prevailing rain pattern is from the west Pacific to the
_____. During La Nina: e trade winds _____. f ocean water piles up in the ______. g sea surface temperatures decrease in the eastern Pacific and the
prevailing rain pattern shifts further ____. (7) [15]
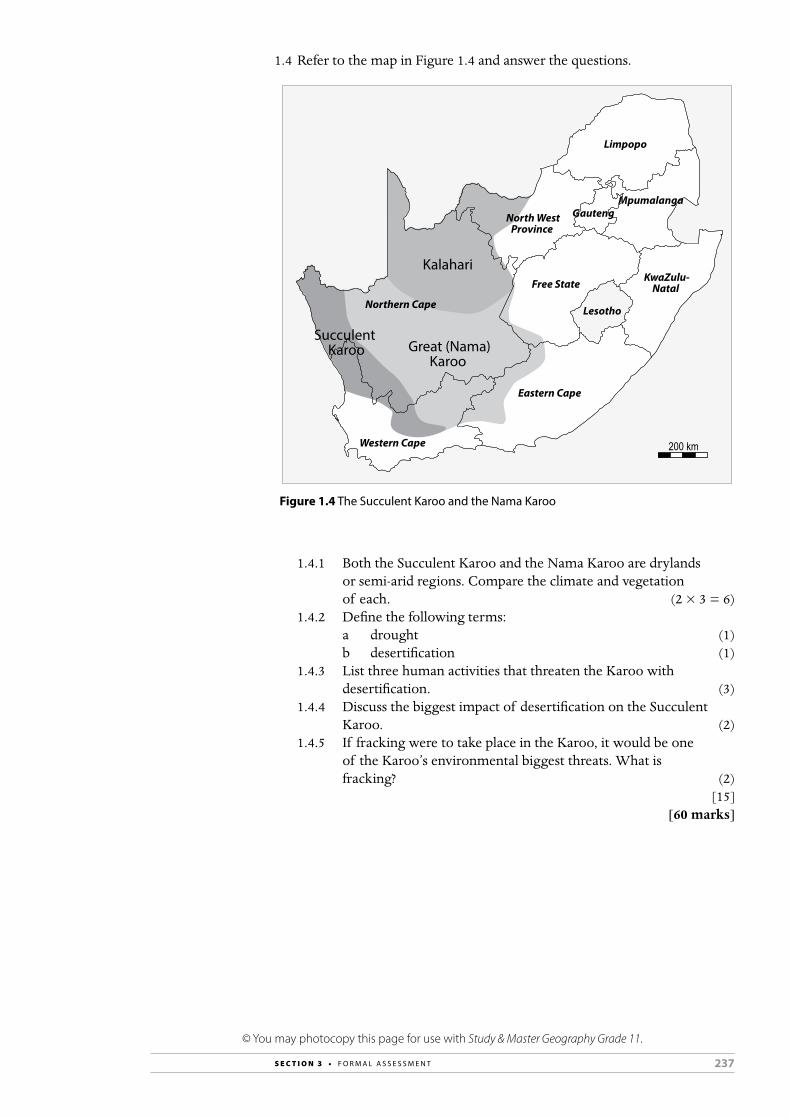
237S E C T I O N 3 • F O R M A L A S S E S S M E N T
© You may photocopy this page for use with Study & Master Geography Grade 11.
1.4 Refer to the map in Figure 1.4 and answer the questions.
200 km
Kalahari
Great (Nama)Karoo
Succulent Karoo
Western Cape
Northern Cape
North WestProvince
Free State
Lesotho
Limpopo
MpumalangaGauteng
Eastern Cape
KwaZulu-Natal
Figure 1.4 The Succulent Karoo and the Nama Karoo
1.4.1 Both the Succulent Karoo and the Nama Karoo are drylands or semi-arid regions. Compare the climate and vegetation of each. (2 × 3 = 6)
1.4.2 Define the following terms: a drought (1) b desertification (1)1.4.3 List three human activities that threaten the Karoo with
desertification. (3)1.4.4 Discuss the biggest impact of desertification on the Succulent
Karoo. (2)1.4.5 If fracking were to take place in the Karoo, it would be one
of the Karoo’s environmental biggest threats. What is fracking? (2)
[15] [60 marks]
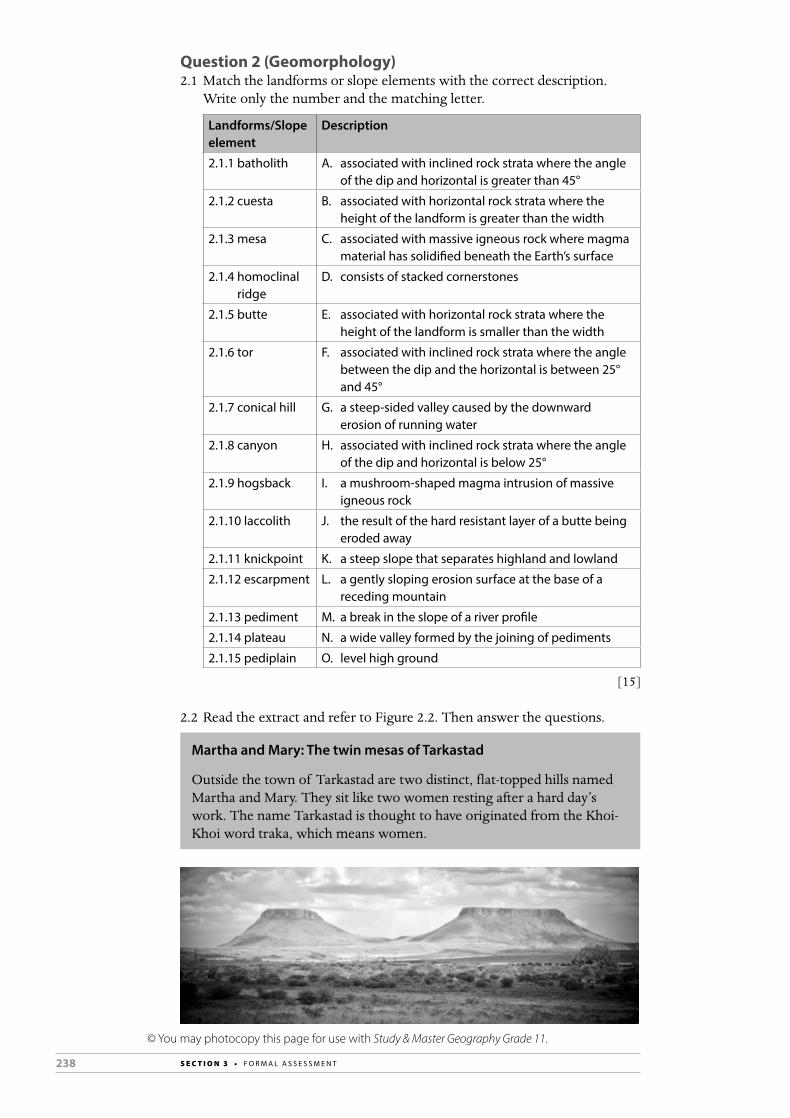
238 S E C T I O N 3 • F O R M A L A S S E S S M E N T
© You may photocopy this page for use with Study & Master Geography Grade 11.
Question 2 (Geomorphology)2.1 Match the landforms or slope elements with the correct description.
Write only the number and the matching letter.
Landforms/Slope element
Description
2.1.1 batholith A. associated with inclined rock strata where the angle of the dip and horizontal is greater than 45°
2.1.2 cuesta B. associated with horizontal rock strata where the height of the landform is greater than the width
2.1.3 mesa C. associated with massive igneous rock where magma material has solidified beneath the Earth’s surface
2.1.4 homoclinal ridge
D. consists of stacked cornerstones
2.1.5 butte E. associated with horizontal rock strata where the height of the landform is smaller than the width
2.1.6 tor F. associated with inclined rock strata where the angle between the dip and the horizontal is between 25° and 45°
2.1.7 conical hill G. a steep-sided valley caused by the downward erosion of running water
2.1.8 canyon H. associated with inclined rock strata where the angle of the dip and horizontal is below 25°
2.1.9 hogsback I. a mushroom-shaped magma intrusion of massive igneous rock
2.1.10 laccolith J. the result of the hard resistant layer of a butte being eroded away
2.1.11 knickpoint K. a steep slope that separates highland and lowland
2.1.12 escarpment L. a gently sloping erosion surface at the base of a receding mountain
2.1.13 pediment M. a break in the slope of a river profile
2.1.14 plateau N. a wide valley formed by the joining of pediments
2.1.15 pediplain O. level high ground
[15]
2.2 Read the extract and refer to Figure 2.2. Then answer the questions.
Martha and Mary: The twin mesas of Tarkastad
Outside the town of Tarkastad are two distinct, flat-topped hills named Martha and Mary. They sit like two women resting after a hard day’s work. The name Tarkastad is thought to have originated from the Khoi-Khoi word traka, which means women.
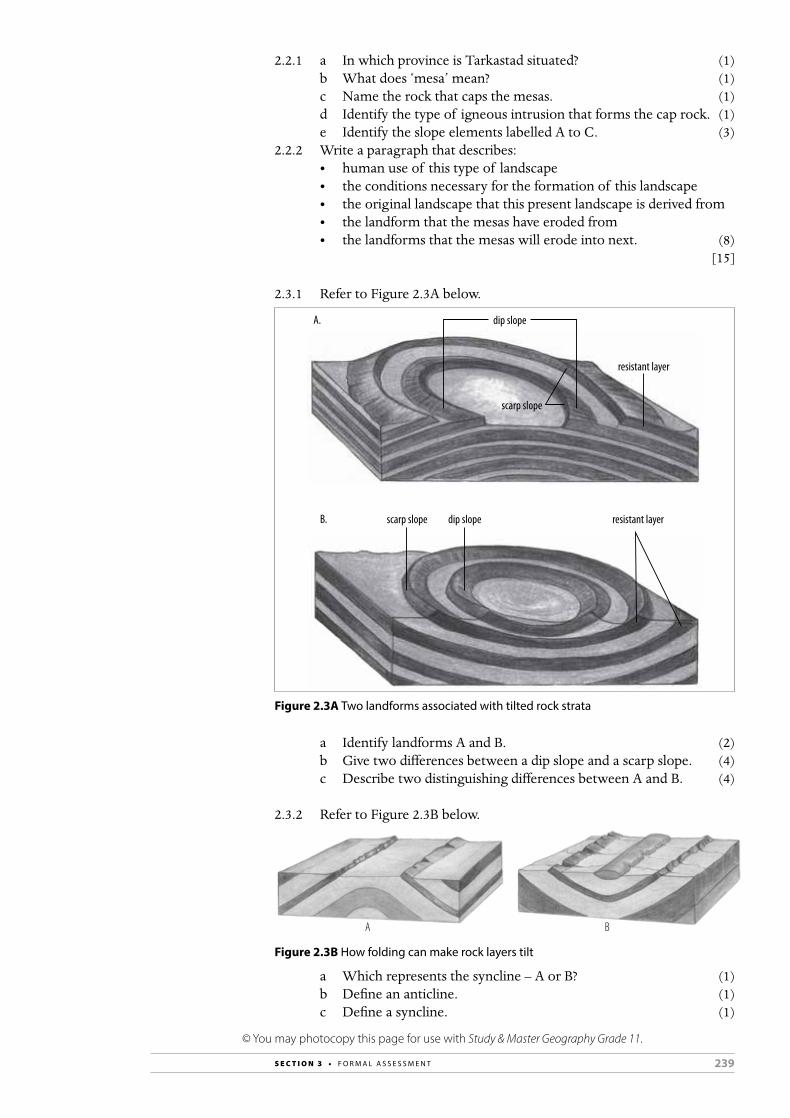
239S E C T I O N 3 • F O R M A L A S S E S S M E N T
© You may photocopy this page for use with Study & Master Geography Grade 11.
2.2.1 a In which province is Tarkastad situated? (1) b What does ‘mesa’ mean? (1) c Name the rock that caps the mesas. (1) d Identify the type of igneous intrusion that forms the cap rock. (1) e Identify the slope elements labelled A to C. (3)
2.2.2 Write a paragraph that describes: • human use of this type of landscape • the conditions necessary for the formation of this landscape • the original landscape that this present landscape is derived from • the landform that the mesas have eroded from • the landforms that the mesas will erode into next. (8) [15]
2.3.1 Refer to Figure 2.3A below.
dip slope
dip slope
scarp slope
scarp slope
resistant layer
resistant layer
A.
B.
Figure 2.3A Two landforms associated with tilted rock strata
a Identify landforms A and B. (2) b Give two differences between a dip slope and a scarp slope. (4) c Describe two distinguishing differences between A and B. (4)
2.3.2 Refer to Figure 2.3B below.
A B
Figure 2.3B How folding can make rock layers tilt
a Which represents the syncline – A or B? (1) b Define an anticline. (1) c Define a syncline. (1)
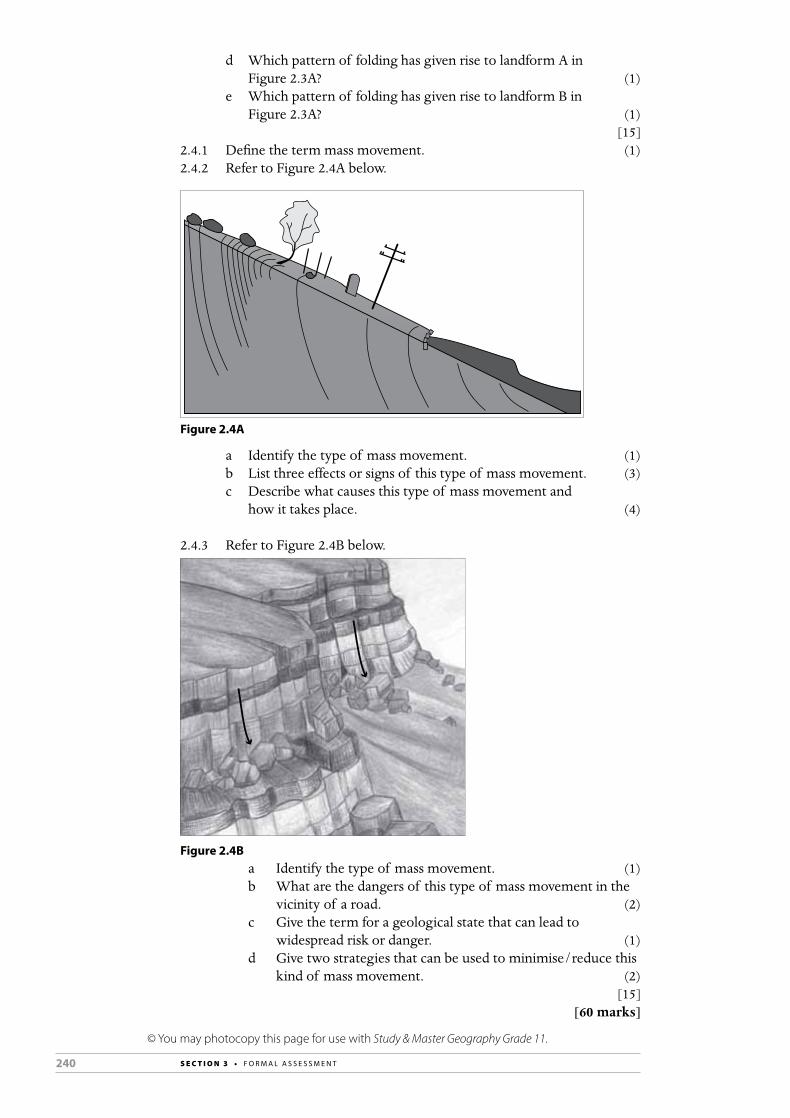
240 S E C T I O N 3 • F O R M A L A S S E S S M E N T
© You may photocopy this page for use with Study & Master Geography Grade 11.
d Which pattern of folding has given rise to landform A in Figure 2.3A? (1)
e Which pattern of folding has given rise to landform B in Figure 2.3A? (1)
[15]2.4.1 Define the term mass movement. (1)2.4.2 Refer to Figure 2.4A below.
Figure 2.4A
a Identify the type of mass movement. (1) b List three effects or signs of this type of mass movement. (3) c Describe what causes this type of mass movement and
how it takes place. (4)
2.4.3 Refer to Figure 2.4B below.
Figure 2.4B a Identify the type of mass movement. (1) b What are the dangers of this type of mass movement in the
vicinity of a road. (2) c Give the term for a geological state that can lead to
widespread risk or danger. (1) d Give two strategies that can be used to minimise/reduce this
kind of mass movement. (2) [15] [60 marks]
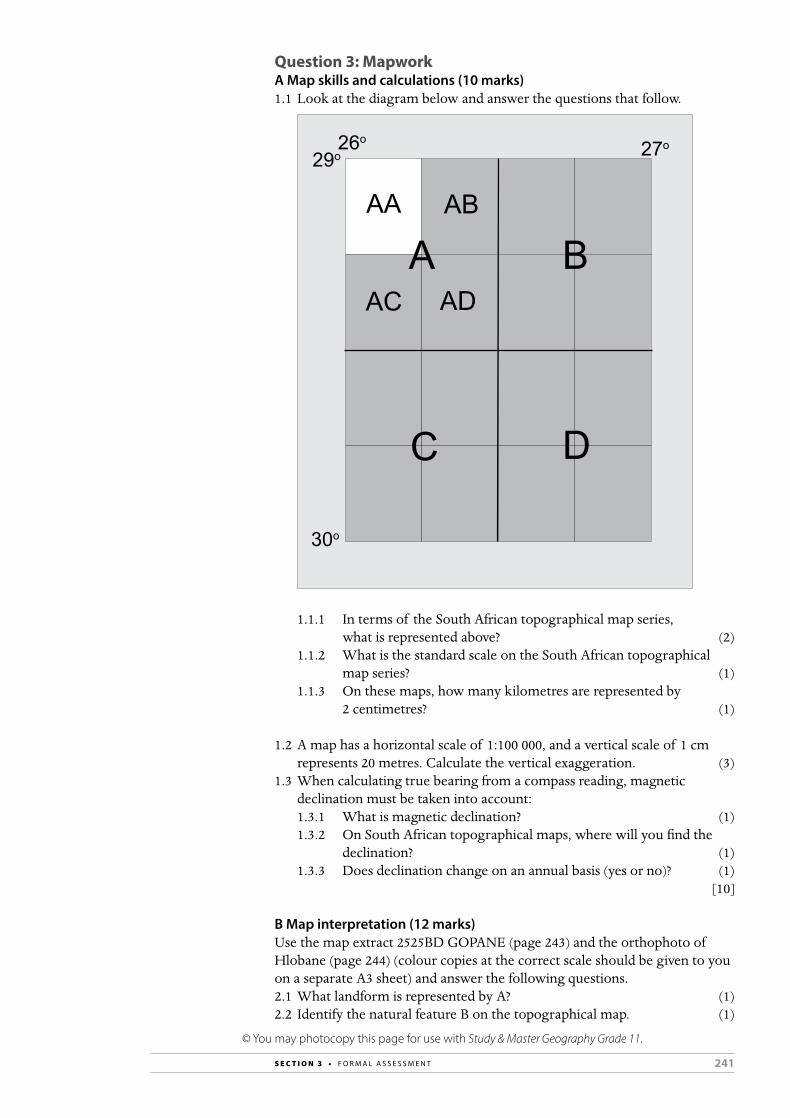
241S E C T I O N 3 • F O R M A L A S S E S S M E N T
© You may photocopy this page for use with Study & Master Geography Grade 11.
Question 3: Mapwork A Map skills and calculations (10 marks)1.1 Look at the diagram below and answer the questions that follow.
29o
30o
26o27o
A B
C D
AA AB
AC AD
1.1.1 In terms of the South African topographical map series, what is represented above? (2)
1.1.2 What is the standard scale on the South African topographical map series? (1)
1.1.3 On these maps, how many kilometres are represented by 2 centimetres? (1)
1.2 A map has a horizontal scale of 1:100 000, and a vertical scale of 1 cm represents 20 metres. Calculate the vertical exaggeration. (3)
1.3 When calculating true bearing from a compass reading, magnetic declination must be taken into account:1.3.1 What is magnetic declination? (1)1.3.2 On South African topographical maps, where will you find the
declination? (1)1.3.3 Does declination change on an annual basis (yes or no)? (1)
[10]
B Map interpretation (12 marks)Use the map extract 2525BD GOPANE (page 243) and the orthophoto of Hlobane (page 244) (colour copies at the correct scale should be given to you on a separate A3 sheet) and answer the following questions. 2.1 What landform is represented by A? (1)2.2 Identify the natural feature B on the topographical map. (1)
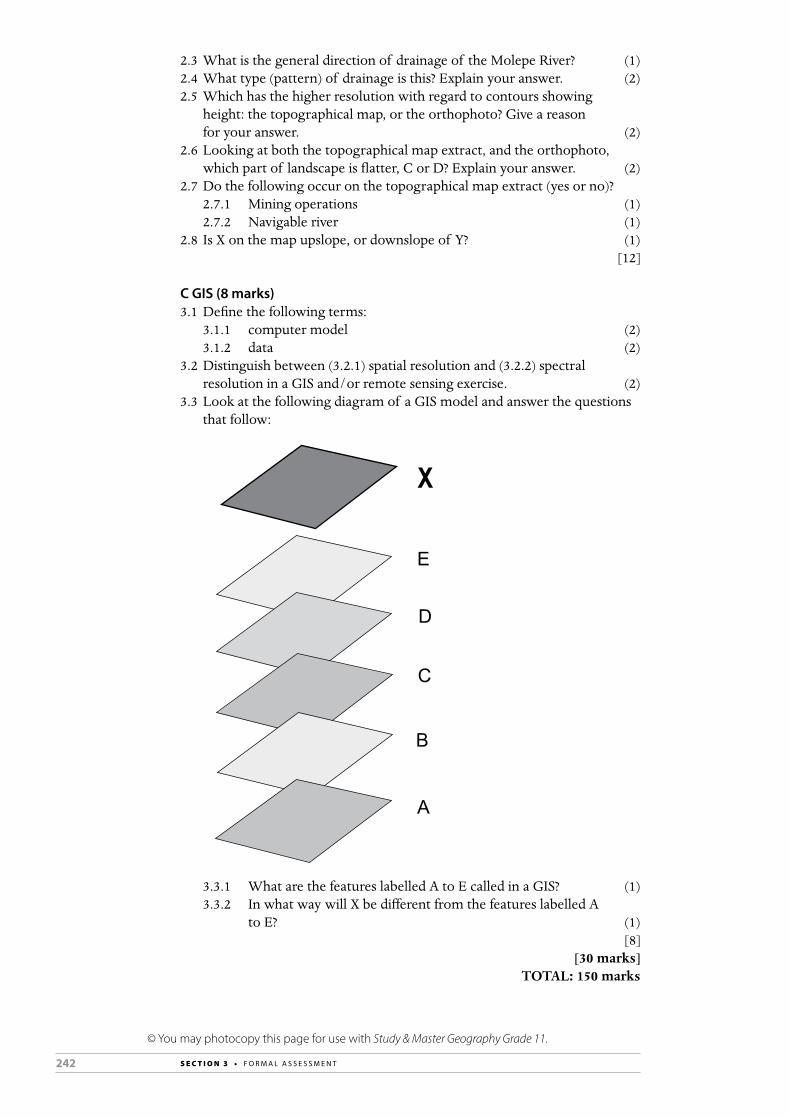
242 S E C T I O N 3 • F O R M A L A S S E S S M E N T
© You may photocopy this page for use with Study & Master Geography Grade 11.
2.3 What is the general direction of drainage of the Molepe River? (1)2.4 What type (pattern) of drainage is this? Explain your answer. (2)2.5 Which has the higher resolution with regard to contours showing
height: the topographical map, or the orthophoto? Give a reason for your answer. (2)
2.6 Looking at both the topographical map extract, and the orthophoto, which part of landscape is flatter, C or D? Explain your answer. (2)
2.7 Do the following occur on the topographical map extract (yes or no)?2.7.1 Mining operations (1)2.7.2 Navigable river (1)
2.8 Is X on the map upslope, or downslope of Y? (1) [12]
C GIS (8 marks) 3.1 Define the following terms:
3.1.1 computer model (2)3.1.2 data (2)
3.2 Distinguish between (3.2.1) spatial resolution and (3.2.2) spectral resolution in a GIS and/or remote sensing exercise. (2)
3.3 Look at the following diagram of a GIS model and answer the questions that follow:
A
B
C
D
E
X
3.3.1 What are the features labelled A to E called in a GIS? (1)3.3.2 In what way will X be different from the features labelled A
to E? (1) [8] [30 marks] TOTAL: 150 marks

243S E C T I O N 3 • F O R M A L A S S E S S M E N T
© You may photocopy this page for use with Study & Master Geography Grade 11.
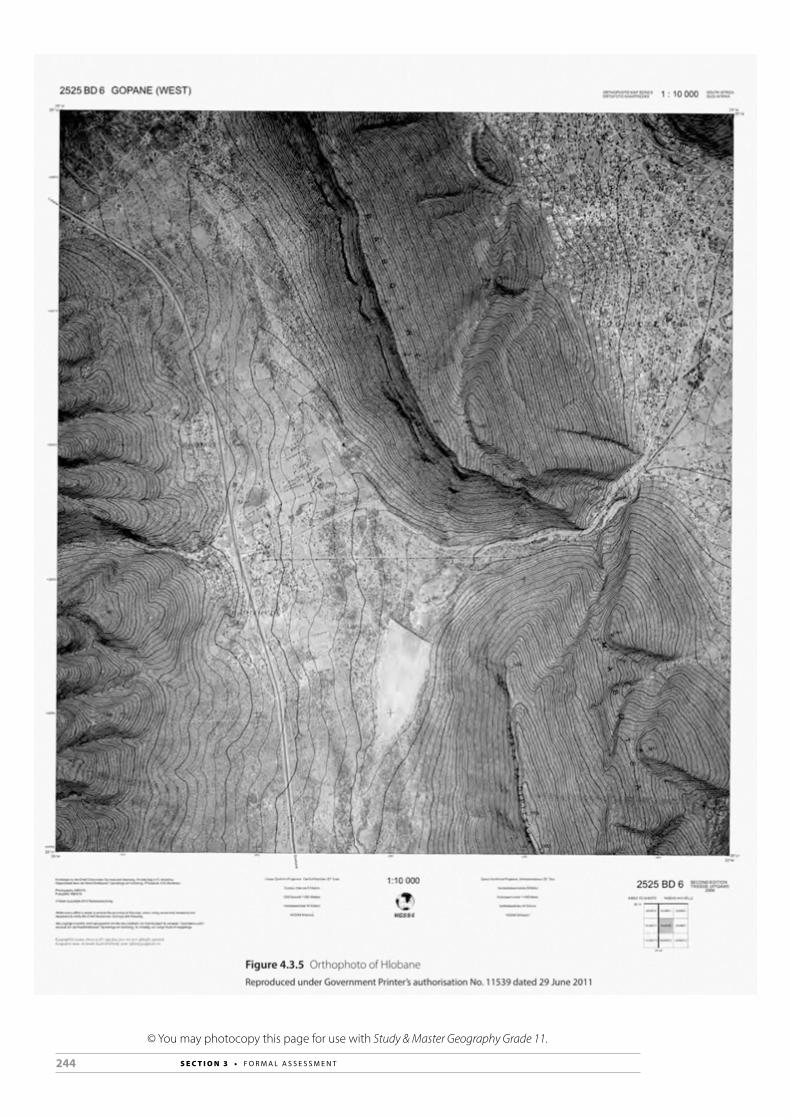
244 S E C T I O N 3 • F O R M A L A S S E S S M E N T
© You may photocopy this page for use with Study & Master Geography Grade 11.
245S E C T I O N 3 • F O R M A L A S S E S S M E N T
© You may photocopy this page for use with Study & Master Geography Grade 11.
Memorandum: End-of-year examination Paper 1TOTAL MARKS: 150
Question 1: The Atmosphere1.1.1 aphelion1.1.2 horse latitudes1.1.3 trade winds1.1.4 parallel1.1.5 chinook1.1.6 lenticular1.1.7 Mediterranean1.1.8 mid-latitudes1.1.9 tropical1.1.10 warmer1.1.11 night1.1.12 low1.1.13 adiabatic1.1.14 monsoon1.1.15 knot [15]
1.2.1 a E (1) b F (1) c A (1) d C (1) e G (1)
1.2.2 0°/equator. The Sun’s rays are almost directly overhead/perpendicular/strike this part of the Earth at a high angle. OR Insolation is more concentrated at the equator. (2)
1.2.3 a high temperatures and high rainfall OR tropical moist climate (2) b Air convergence encourages convective rainfall. (2)
1.2.4 a dry summers and wet winters/dry mid-latitude climate (2) b Air subsidence is associated with warm dry air and clear skies. (2)
1.2.5 The winds move in a north–south direction along the pressure gradient, but they are deflected/curved by the spinning of the Earth, (1) which produces the Coriolis effect. (1) (2)
[15]
1.3.1 The ocean currents redistribute heat by convection. Current 1 is the cold Benguela current, (1) which carries cold water from the mid-latitudes to the tropics. (1) Current 2 is the warm Mozambique current, (1) which carries warm water from the tropics to the mid-latitudes. (1)
The cold Benguela flows along the west coast (1) of southern Africa. Because of cold temperatures, evaporation is low (1) and so the maritime air mass holds less water vapour (1) than it otherwise would. The coastal strip and western half of South Africa, Namibia (characterised by the Namib Desert, which stretches most of the way along its coastline) and Angola is therefore dry/has low rainfall. (1) (8)

246 S E C T I O N 3 • F O R M A L A S S E S S M E N T
© You may photocopy this page for use with Study & Master Geography Grade 11.
1.3.2 a decrease/weaken b South American c increase/rise d central Pacific e increase/strengthen f western Pacific g west (7) [15]
1.4.1 The Succulent Karoo has a winter rainfall. (1) Its vegetation consists mainly of succulent plants (1) and bulbs. (1) The Nama Karoo has a summer rainfall. (1) Its vegetation consists of low shrubs (1) and grasses. (1) (6)
1.4.2 a a long period of below-average rainfall (1) b land degradation/loss of soil fertility in drylands (1)
1.4.3 Any three: overgrazing (sheep and goat farming); ostrich farming; overstocking; mining – diamonds and minerals such as gypsum and kaolin; agriculture/crop cultivation; depleting groundwater with boreholes; salinising soil by irrigating with water drawn from boreholes (3)
1.4.4 The Succulent Karoo is a biodiversity hotspot, (1) boasting one of the largest numbers of plant species in the world. The biggest impact of desertification in this region is loss of biodiversity. (1) (2)
1.4.5 Fracking is a form of shale gas mining carried out by the petroleum industry. (1) It involves drilling down and injecting a mixture of water, sand and chemicals at high pressure into rock to release the gas. (1) (2)
[15] [60 marks]
Question 2: Geomorphology2.1.1 C2.1.2 H2.1.3 E2.1.4 F2.1.5 B2.1.6 D2.1.7 J2.1.8 G2.1.9 A2.1.10 I2.1.11 M2.1.12 K2.1.13 L2.1.14 O2.1.15 N [15]
2.2.1 a Eastern Cape (1) b table (1) c dolerite (1) d sill (1) e A = crest, B = cliff, C = talus slope (3)

247S E C T I O N 3 • F O R M A L A S S E S S M E N T
© You may photocopy this page for use with Study & Master Geography Grade 11.
2.2.2 The eroded, flat valleys/peneplains of Karoo landscapes are arid and therefore sparsely populated and suitable only for sheep farming. (1) Like all Karoo landscapes, this landscape developed from a canyon landscape. (1) Both canyon and Karoo landscapes form in dry regions/climates (1) where there are horizontal rock strata (1) of unequal resistance. (1) The harder rock weathers and erodes more slowly than the softer rock and therefore has steeper sides – these are the cliff-like caps of the two mesas. These two mesas have eroded from a single plateau (1) (divided in two by erosion). In time the mesas will erode by scarp retreat (1) into rounder hills (more like the one on the left in the photograph/Figure 2.2) to become buttes. (1) (8)
[15]
2.3.1 a A = cuesta dome, B = cuesta basin (2) b A dip slope is a gentle (1) slope, whereas a scarp slope is steep. (1) A dip slope is parallel (1) to the hard resistant layer, whereas the
scarp slope is perpendicular. (1) (4) c For A/cuesta dome: the centre is convex (1) and the dip slope of
the concentric ridges is on the outside and the scarp slope is on the inside. (1)
For B/cuesta basin: the centre is concave (1) and the scarp slope of the concentric ridges is on the outside and the dip slope is on the inside. (1)
Also accept: for A/cuesta dome the oldest strata are in the centre, whereas for B/cuesta basin the youngest strata are in the centre. (4)
2.3.2 a B (1) b a fold of layered/stratified rock in which the strata slope
downward from the crest OR an arch-shaped fold in stratified rock OR the upward bend in a fold (1)
c a trough-shaped fold in stratified rock OR the downward bend in a fold (1)
d A/anticline (1) e B/syncline (1)
[15]
2.4.1 The down-slope movement of material on a slope due to the force of gravity. (1)
2.4.2 a soil creep (1) b Any three: ripples in the soil (perpendicular to the slope), curved
tree trunks, tilted posts, deformed walls or fences (3) c Soil creep is caused by repeated cycles of expansion and
contraction (1) of soil particles due to wetting/freezing (this is when particles expand) and drying/melting (1) (this is when particles shrink). With each cycle of expansion, particles are raised perpendicular to slope, (1) and then when they contract, they sink back fractionally downslope of their original position. (1) (4)
2.4.3 a rockfalls (1) b Falling rocks can damage or crush cars and injure or kill
people. (1) Fallen rocks can block the road/make dangerous obstacles. (1) (2)
c geohazard (1)
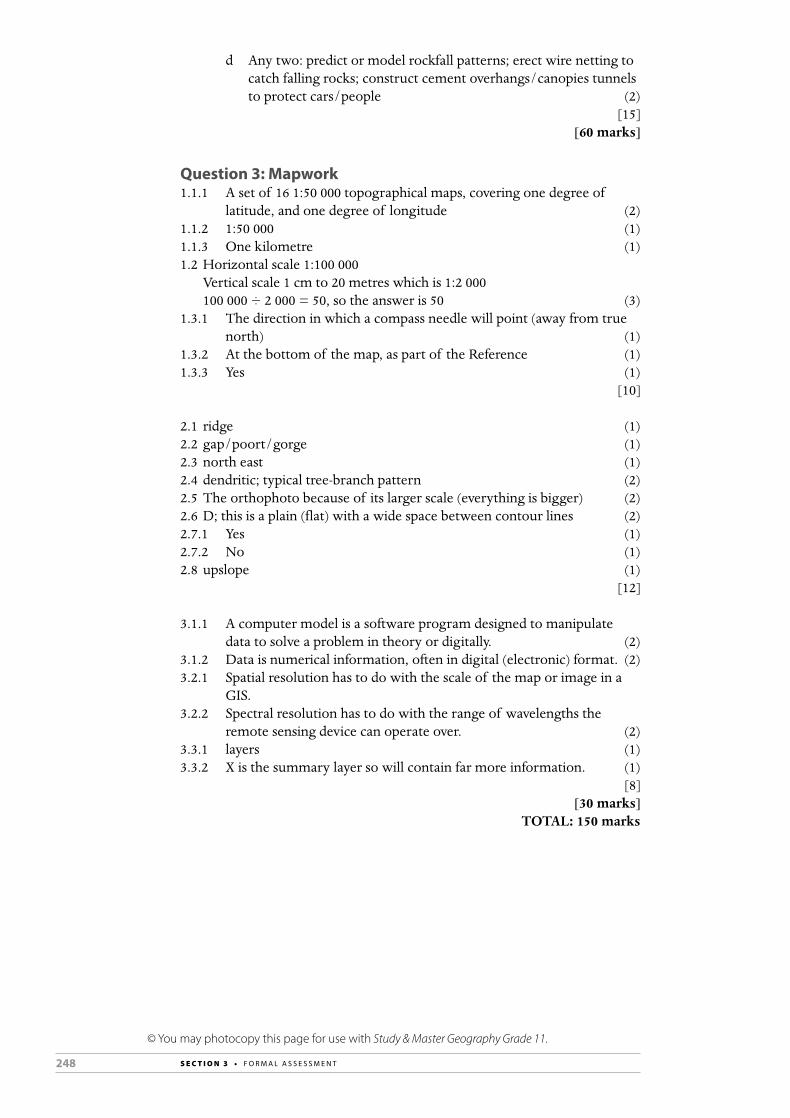
248 S E C T I O N 3 • F O R M A L A S S E S S M E N T
© You may photocopy this page for use with Study & Master Geography Grade 11.
d Any two: predict or model rockfall patterns; erect wire netting to catch falling rocks; construct cement overhangs/canopies tunnels to protect cars/people (2)
[15] [60 marks]
Question 3: Mapwork1.1.1 A set of 16 1:50 000 topographical maps, covering one degree of
latitude, and one degree of longitude (2)1.1.2 1:50 000 (1)1.1.3 One kilometre (1)1.2 Horizontal scale 1:100 000 Vertical scale 1 cm to 20 metres which is 1:2 000 100 000 ÷ 2 000 = 50, so the answer is 50 (3)1.3.1 The direction in which a compass needle will point (away from true
north) (1)1.3.2 At the bottom of the map, as part of the Reference (1)1.3.3 Yes (1) [10]
2.1 ridge (1)2.2 gap/poort/gorge (1)2.3 north east (1)2.4 dendritic; typical tree-branch pattern (2)2.5 The orthophoto because of its larger scale (everything is bigger) (2)2.6 D; this is a plain (flat) with a wide space between contour lines (2)2.7.1 Yes (1)2.7.2 No (1)2.8 upslope (1) [12]
3.1.1 A computer model is a software program designed to manipulate data to solve a problem in theory or digitally. (2)
3.1.2 Data is numerical information, often in digital (electronic) format. (2)3.2.1 Spatial resolution has to do with the scale of the map or image in a
GIS.3.2.2 Spectral resolution has to do with the range of wavelengths the
remote sensing device can operate over. (2)3.3.1 layers (1)3.3.2 X is the summary layer so will contain far more information. (1) [8] [30 marks] TOTAL: 150 marks

249S E C T I O N 3 • F O R M A L A S S E S S M E N T
© You may photocopy this page for use with Study & Master Geography Grade 11.
End-of-year examination Paper 2 (Development Geography, Resources and Sustainability, Mapwork)
MARKS: 150
Time: 3 hours
Question 1: Development GeographyA Short, objective questions (15 marks)1.1 Answer the following questions:
1.1.1 What is meant by development? (1)1.1.2 What is meant by sustainable development? (1)1.1.3 Explain the term developing country (or economy). (1) 1.1.4 Explain the term developed country. (1)1.1.5 Does South Africa have a developed, or a developing economy? (1)1.1.6 What is a resource? (1)1.1.7 Explain the term Gross Domestic Product (GDP). (2)1.1.8 Name two BRICS countries. (2)1.1.9 What is the Gini coefficient? (1)1.1.10 Explain what the term Human Development Index (HDI)
means. (2) 1.1.11 What do mortality rates refer to? (1)1.1.12 Explain the term Balance of Trade. (1)
[15]
B Three questions of 15 marks each on Development Geography (45 marks)1.2.1 Explain the difference between economic development and social
development. (4)1.2.2 In what way is the infant mortality rate a good indicator of the level
of development in a country? (2)1.2.3 Explain the term economies of scale, and give an example. (3)1.2.4 Explain why developed countries are wealthier than developing
countries. (2)1.2.5 In Africa, there are differences in the level of development at a local,
regional and international (between nations) scale. What does this statement mean? (4)
[15]
1.3.1 Explain how the development of African countries has been influenced by history. (8)
1.3.2 In what ways do education and training affect development? (2)1.3.3 How does the availability of energy affect development? (2)1.3.4 What is a development model? Name one development model. (3) [15]
1.4.1 What is community-based development? (4)1.4.2 Explain the concept of globalisation and its results. (8)1.4.3 Explain what is meant by fair trade in the world today. (3) [15] [60 marks]
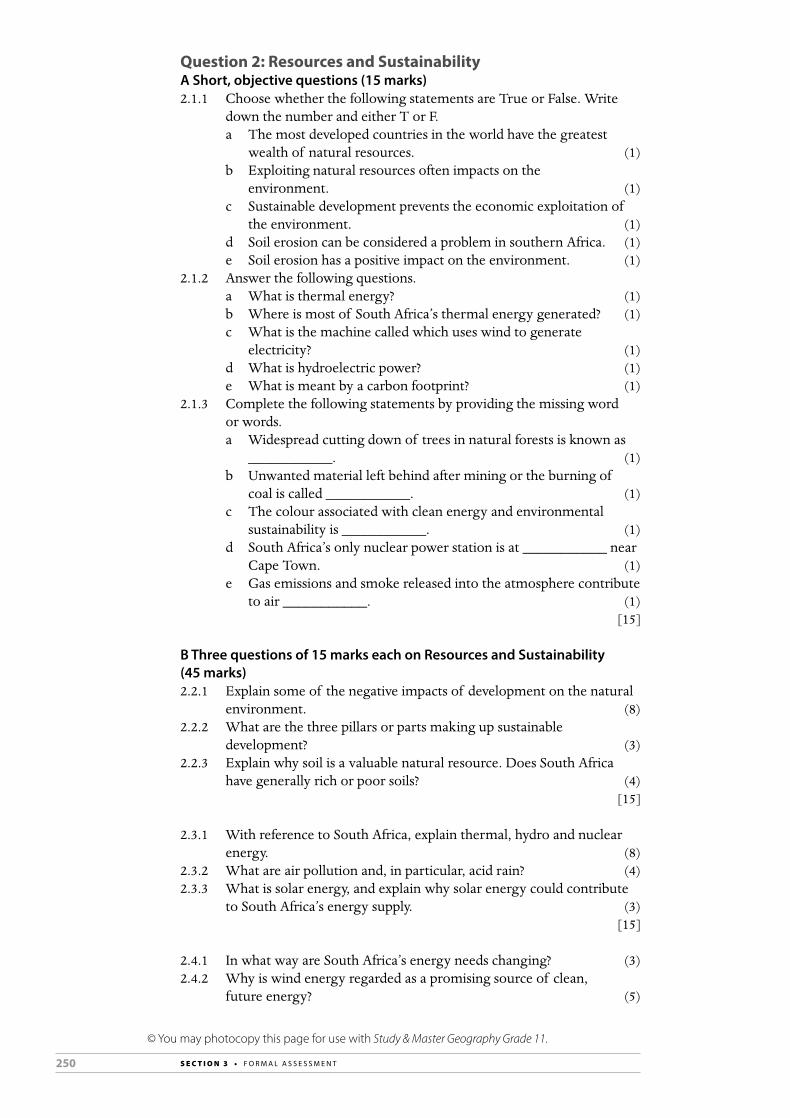
250 S E C T I O N 3 • F O R M A L A S S E S S M E N T
© You may photocopy this page for use with Study & Master Geography Grade 11.
Question 2: Resources and SustainabilityA Short, objective questions (15 marks)2.1.1 Choose whether the following statements are True or False. Write
down the number and either T or F. a The most developed countries in the world have the greatest
wealth of natural resources. (1) b Exploiting natural resources often impacts on the
environment. (1) c Sustainable development prevents the economic exploitation of
the environment. (1) d Soil erosion can be considered a problem in southern Africa. (1) e Soil erosion has a positive impact on the environment. (1)
2.1.2 Answer the following questions. a What is thermal energy? (1) b Where is most of South Africa’s thermal energy generated? (1) c What is the machine called which uses wind to generate
electricity? (1) d What is hydroelectric power? (1) e What is meant by a carbon footprint? (1)
2.1.3 Complete the following statements by providing the missing word or words.
a Widespread cutting down of trees in natural forests is known as ___________. (1)
b Unwanted material left behind after mining or the burning of coal is called ___________. (1)
c The colour associated with clean energy and environmental sustainability is ___________. (1)
d South Africa’s only nuclear power station is at ___________ near Cape Town. (1)
e Gas emissions and smoke released into the atmosphere contribute to air ___________. (1)
[15]
B Three questions of 15 marks each on Resources and Sustainability (45 marks)2.2.1 Explain some of the negative impacts of development on the natural
environment. (8)2.2.2 What are the three pillars or parts making up sustainable
development? (3)2.2.3 Explain why soil is a valuable natural resource. Does South Africa
have generally rich or poor soils? (4) [15]
2.3.1 With reference to South Africa, explain thermal, hydro and nuclear energy. (8)
2.3.2 What are air pollution and, in particular, acid rain? (4)2.3.3 What is solar energy, and explain why solar energy could contribute
to South Africa’s energy supply. (3) [15]
2.4.1 In what way are South Africa’s energy needs changing? (3)2.4.2 Why is wind energy regarded as a promising source of clean,
future energy? (5)

251S E C T I O N 3 • F O R M A L A S S E S S M E N T
© You may photocopy this page for use with Study & Master Geography Grade 11.
2.4.3 Both government, as well as businesses, have a responsibility towards better energy management. Explain what this means. (4)
2.4.4 In what ways can you, as an individual, manage and use energy in a more sustainable way? (3)
[15] [60 marks]
Question 3: MapworkA Map skills and calculations (10 marks)1. Look at the contour map extract below and answer the questions that
follow.
680
660
640
600
620
640
660
680
700
700
720
A
BC732
A
A
B
Bkms
m
580600
720
620640660680700
740
210 3
620
600
1.1 Calculate the straight-line distance between A and C. (2)1.2 Using the frame provided (copy it into your answer sheet) draw a cross-
section (profile) between A and B. (3)1.3 Calculate the gradient between spot height B and point C. (2)1.4 Calculate the vertical exaggeration of the above profile. (3) [10]
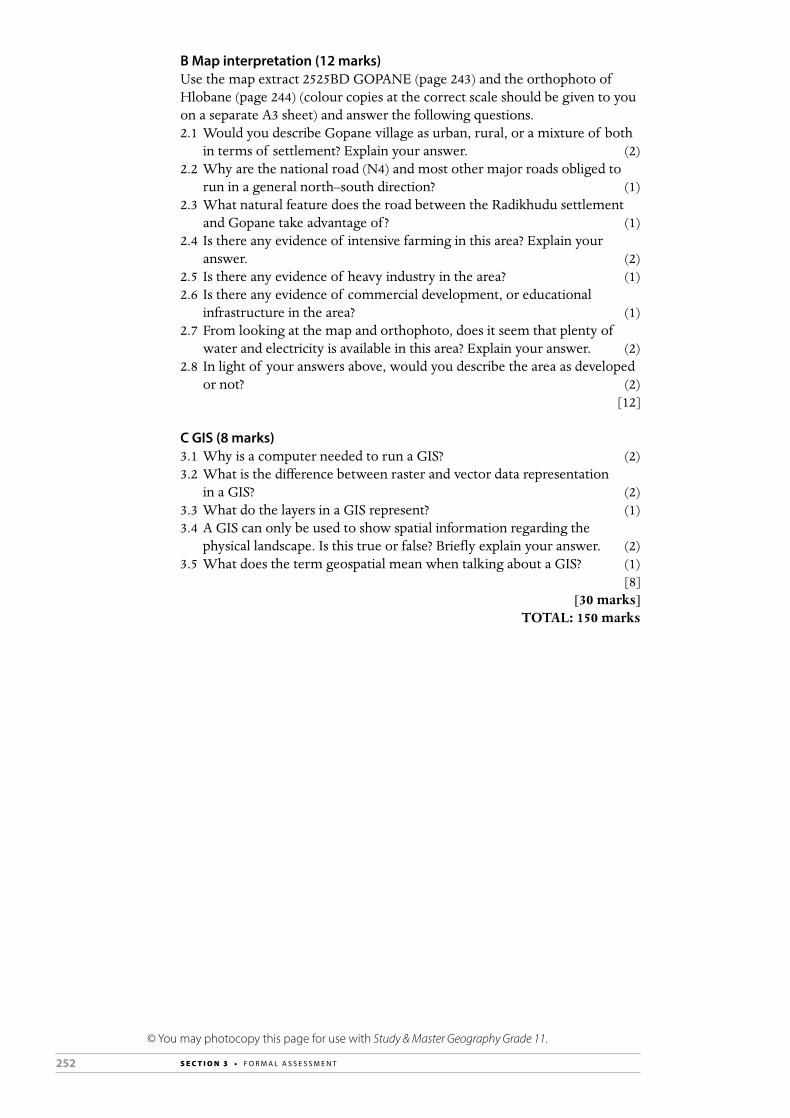
252 S E C T I O N 3 • F O R M A L A S S E S S M E N T
© You may photocopy this page for use with Study & Master Geography Grade 11.
B Map interpretation (12 marks)Use the map extract 2525BD GOPANE (page 243) and the orthophoto of Hlobane (page 244) (colour copies at the correct scale should be given to you on a separate A3 sheet) and answer the following questions. 2.1 Would you describe Gopane village as urban, rural, or a mixture of both
in terms of settlement? Explain your answer. (2)2.2 Why are the national road (N4) and most other major roads obliged to
run in a general north–south direction? (1)2.3 What natural feature does the road between the Radikhudu settlement
and Gopane take advantage of ? (1)2.4 Is there any evidence of intensive farming in this area? Explain your
answer. (2)2.5 Is there any evidence of heavy industry in the area? (1)2.6 Is there any evidence of commercial development, or educational
infrastructure in the area? (1)2.7 From looking at the map and orthophoto, does it seem that plenty of
water and electricity is available in this area? Explain your answer. (2)2.8 In light of your answers above, would you describe the area as developed
or not? (2) [12]
C GIS (8 marks)3.1 Why is a computer needed to run a GIS? (2)3.2 What is the difference between raster and vector data representation
in a GIS? (2)3.3 What do the layers in a GIS represent? (1)3.4 A GIS can only be used to show spatial information regarding the
physical landscape. Is this true or false? Briefly explain your answer. (2)3.5 What does the term geospatial mean when talking about a GIS? (1) [8] [30 marks] TOTAL: 150 marks
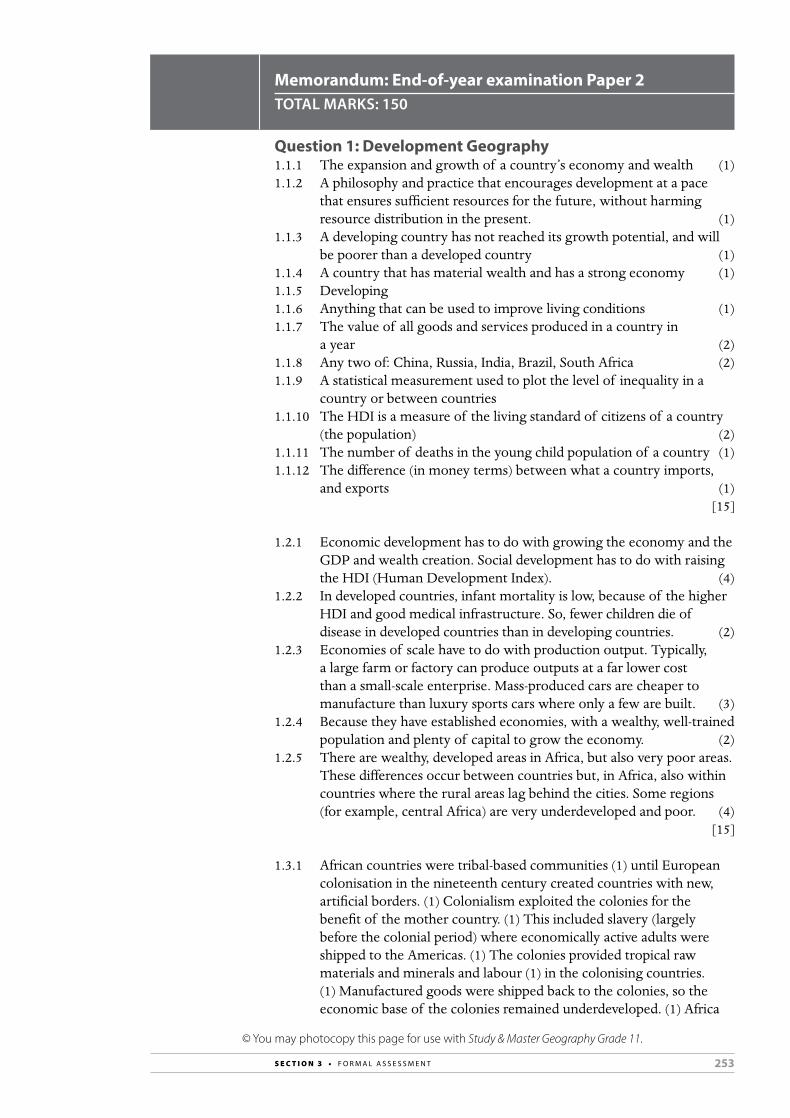
253S E C T I O N 3 • F O R M A L A S S E S S M E N T
© You may photocopy this page for use with Study & Master Geography Grade 11.
Memorandum: End-of-year examination Paper 2TOTAL MARKS: 150
Question 1: Development Geography1.1.1 The expansion and growth of a country’s economy and wealth (1)1.1.2 A philosophy and practice that encourages development at a pace
that ensures sufficient resources for the future, without harming resource distribution in the present. (1)
1.1.3 A developing country has not reached its growth potential, and will be poorer than a developed country (1)
1.1.4 A country that has material wealth and has a strong economy (1)1.1.5 Developing1.1.6 Anything that can be used to improve living conditions (1)1.1.7 The value of all goods and services produced in a country in
a year (2)1.1.8 Any two of: China, Russia, India, Brazil, South Africa (2)1.1.9 A statistical measurement used to plot the level of inequality in a
country or between countries1.1.10 The HDI is a measure of the living standard of citizens of a country
(the population) (2) 1.1.11 The number of deaths in the young child population of a country (1)1.1.12 The difference (in money terms) between what a country imports,
and exports (1) [15]
1.2.1 Economic development has to do with growing the economy and the GDP and wealth creation. Social development has to do with raising the HDI (Human Development Index). (4)
1.2.2 In developed countries, infant mortality is low, because of the higher HDI and good medical infrastructure. So, fewer children die of disease in developed countries than in developing countries. (2)
1.2.3 Economies of scale have to do with production output. Typically, a large farm or factory can produce outputs at a far lower cost than a small-scale enterprise. Mass-produced cars are cheaper to manufacture than luxury sports cars where only a few are built. (3)
1.2.4 Because they have established economies, with a wealthy, well-trained population and plenty of capital to grow the economy. (2)
1.2.5 There are wealthy, developed areas in Africa, but also very poor areas. These differences occur between countries but, in Africa, also within countries where the rural areas lag behind the cities. Some regions (for example, central Africa) are very underdeveloped and poor. (4)
[15]
1.3.1 African countries were tribal-based communities (1) until European colonisation in the nineteenth century created countries with new, artificial borders. (1) Colonialism exploited the colonies for the benefit of the mother country. (1) This included slavery (largely before the colonial period) where economically active adults were shipped to the Americas. (1) The colonies provided tropical raw materials and minerals and labour (1) in the colonising countries. (1) Manufactured goods were shipped back to the colonies, so the economic base of the colonies remained underdeveloped. (1) Africa
254 S E C T I O N 3 • F O R M A L A S S E S S M E N T
© You may photocopy this page for use with Study & Master Geography Grade 11.
only got rid of this legacy about 75 years ago, and so has a lot of catching up to do. (1) (8)
1.3.2 Education and training improve the skills of the labour force, and this promotes economic development. (2)
1.3.3 To develop, a country needs a reliable and relatively cheap energy (electricity) supply. Without this, it is impossible for, for example, industries to develop. (2)
1.3.4 A theoretic method of explaining how development works. The model may be applied to real-world situations and lead to improvements in development. The core-periphery, and free market models are examples. (3)
[15]
1.4.1 The community-based model of development is a grassroots, bottom-up model. It focuses on development at the micro level rather than at the macro level, which focuses on government strategies to meet the country’s needs, both nationally and internationally. (4)
1.4.2 Globalisation refers to a world-wide economy in which the economies of different national economies function in a single global economy (1) where no country can exist in economic isolation. (1) It involves the free flow of goods, services, money/capital, (1) technology and labour (1) across national borders. (1) It involves the expansion of multinational corporations to increase their markets and profits. (1) The idea is that everyone benefits (1) though it can lead to exploitation of developing countries (1) in the same way that colonialism did. (8)
1.4.3 Fair trade is a moral attitude; no country’s resources, or labour, is to be exploited. Workers must receive a fair wage, and there must be no environmental exploitation when producing, say, agricultural crops in a developing country. (3)
[15] [60 marks]
Question 2: Resources and Sustainability2.1.1 a F (1)
b T (1) c T (1) d T 1) e F (1)
2.1.2 a Energy (electricity) produced from burning fossil fuel such as coal (1)
b On the Mpumalanga Highveld (1) c Wind turbine (1) d Electricity generated from the power of running water (1) e The carbon dioxide pollution resulting from economic activity,
particularly resulting from industries and vehicles, in a country (1)2.1.3 a deforestation (1)
b waste (1) c green (1) d Koeberg (1) e pollution (1)
[15]
255S E C T I O N 3 • F O R M A L A S S E S S M E N T
© You may photocopy this page for use with Study & Master Geography Grade 11.
2.2.1 Atmospheric pollution, global warming, habitat destruction, deforestation, loss of species diversity, soil erosion, over-exploitation of natural resources are all negative impacts. Discussion could include any six negative impacts. Give 1 or 2 marks extra if learner explains, rather than simply lists, for a total of 8 marks maximum. (8)
2.2.2 Environmental, social, economic (3)2.2.3 Soil is needed to grow crops to produce food for both animals and
people. Soil is the source of life for living plants and, indirectly, animals and people. South Africa generally has nutrient-poor, fairly shallow soils. (4)
[15]
2.3.1 Thermal energy is generated in Eskom’s coal-fired power stations, (1) most of which are on the Highveld. (1) Thermal energy provides the bulk of South Africa’s electricity. (1) Hydroelectricity generates electric power using the force of falling water. (1) Hydroelectricity is fairly limited because South Africa is an arid country. (1) Large dams (Gariep) and various water storage and transfer schemes produce some hydroelectricity. (1) Nuclear power is limited to the Koeberg nuclear power station at Koeberg (Western Cape). (1) All Eskom-generated electricity is fed into a national grid serving the whole country. (1) (8)
2.3.2 Air pollution is any harmful gas, liquid or even solid emission escaping or released into the atmosphere and having a negative environmental impact. Acid rain forms when sulfur and nitrogen oxides combine with rainwater to form a weak acid, which is harmful to the environment. (4)
2.3.3 Solar energy is electricity generated by the sun’s rays falling on a photo-electric array of solar panels, which convert the sun’s energy into electricity. Because South Africa experiences a high number of sunshine days, solar energy has great potential. (3)
[15]
2.4.1 As South Africa develops, more electricity is needed to power both industry and for domestic use. People are turning from other energy sources such as wood or paraffin, to electricity, so the demand is rising constantly. (3)
2.4.2 Wind is a clean and efficient energy source which has little impact on the environment, other than that windfarms are unsightly (visual impact) and can impact on bird life. If the wind does not blow, then no electricity is generated. Wind energy is growing in popularity in developed countries, and also in South Africa. (5)
2.4.3 The government, through Eskom’s electricity generation and distribution, must ensure an efficient energy supply. Businesses must use energy carefully and responsibly, and must play a part in reducing pollution. Government and business need to work together to ensure efficient and sustainable energy management. (4)
2.4.4 Individuals can use energy sparingly in the home, office or workplace. This can involve simple things such as turning off lights, to more complex actions such as installing solar panels in the home. (3)
[15] [60 marks]
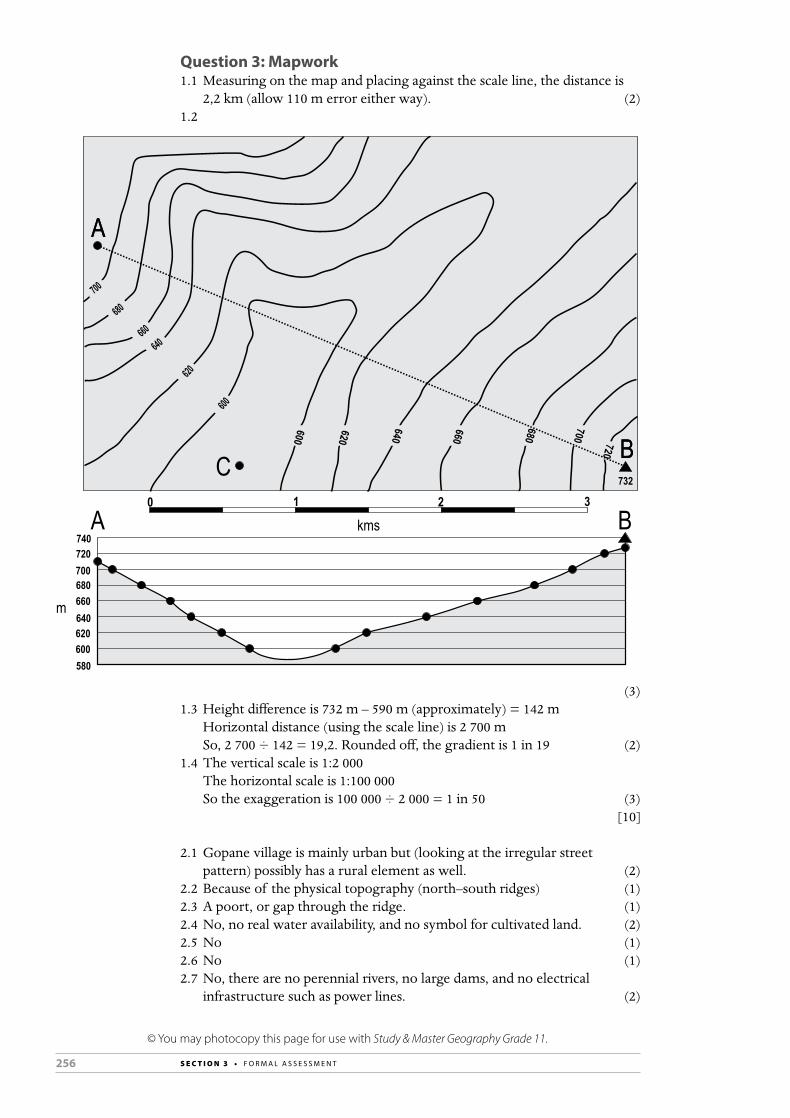
256 S E C T I O N 3 • F O R M A L A S S E S S M E N T
© You may photocopy this page for use with Study & Master Geography Grade 11.
Question 3: Mapwork1.1 Measuring on the map and placing against the scale line, the distance is
2,2 km (allow 110 m error either way). (2)1.2
680
660640
600
620
640
660
680
700
700
720
A
BC732
A
A
B
Bkms
m
580600
720
620640660680700
740
210 3
620
600
(3)1.3 Height difference is 732 m – 590 m (approximately) = 142 m Horizontal distance (using the scale line) is 2 700 m So, 2 700 ÷ 142 = 19,2. Rounded off, the gradient is 1 in 19 (2)1.4 The vertical scale is 1:2 000 The horizontal scale is 1:100 000 So the exaggeration is 100 000 ÷ 2 000 = 1 in 50 (3) [10]
2.1 Gopane village is mainly urban but (looking at the irregular street pattern) possibly has a rural element as well. (2)
2.2 Because of the physical topography (north–south ridges) (1)2.3 A poort, or gap through the ridge. (1)2.4 No, no real water availability, and no symbol for cultivated land. (2) 2.5 No (1)2.6 No (1)2.7 No, there are no perennial rivers, no large dams, and no electrical
infrastructure such as power lines. (2)
257S E C T I O N 3 • F O R M A L A S S E S S M E N T
© You may photocopy this page for use with Study & Master Geography Grade 11.
2.8 This area is clearly not well developed in terms of economic infrastructure or economic activities. (2)
[12]
3.1 Because GIS programs are computer software packages and computer based. (2)
3.2 Raster data is made up of blocks or pixels, vector data is made up of points or paths. (2)
3.3 Different components of spatial information or data (1)3.4 False; a GIS can also represent and deal with human components of the
landscape such as economic or social data. (2)3.5 Geographical data, which has a certain position, or coordinates in the
landscape. (1) [8] [30 marks] TOTAL: 150 marks

258 S E C T I O N 3 • F O R M A L A S S E S S M E N T
© You may photocopy this page for use with Study & Master Geography Grade 11.
Reco
rd s
heet
for f
orm
al a
sses
smen
t: Te
rm 1
Cla
ss:
Year
:
Lear
ner’s
nam
esCo
ntro
lled
test
mar
k
(60
mar
ks)
Cont
ribu
tion
to y
ear
mar
k (2
0 m
arks
)*A
sses
smen
t Tas
k 1
(Res
earc
h) m
ark
(1
00 m
arks
)
Cont
ribu
tion
to y
ear
mar
k (2
0 m
arks
)**
Term
1 m
ark
(6
0 m
arks
)***
Term
1
perc
enta
ge~
Ratin
g co
de
Ratin
g co
des
and
desc
ript
ors:
7:
Out
stan
ding
ach
ieve
men
t (80
%–1
00%
)
6: M
erito
rious
ach
ieve
men
t (70
%–7
9%)
5:
Sub
stan
tial a
chie
vem
ent (
60%
–69%
)
4: A
dequ
ate
achi
evem
ent (
50%
–59%
)
3: M
oder
ate
achi
evem
ent (
40%
–49%
) 2:
Ele
men
tary
ach
ieve
men
t (30
%–3
9%)
1:
Not
ach
ieve
d (0
%–2
9%)
* D
ivid
e th
e le
arne
r’s te
st m
ark
by 3
.**
D
ivid
e th
e le
arne
r’s m
ark
by 5
. **
* A
dd th
e C
ontr
olle
d te
st m
ark
and
the
Ass
essm
ent T
ask
1 (R
esea
rch)
mar
k.
~
Div
ide
the
num
ber i
n th
e pr
evio
us c
olum
n by
160
and
mul
tiply
by
100
to c
onve
rt th
e Te
rm 1
mar
k to
a p
erce
ntag
e.
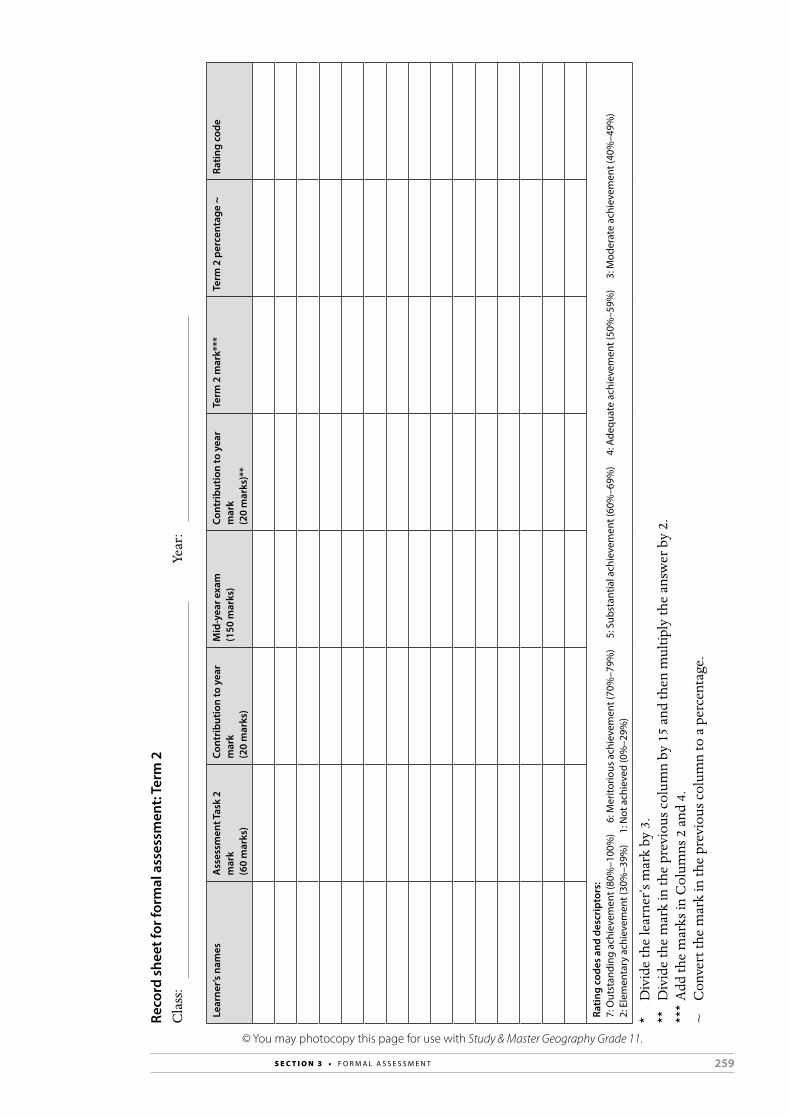
259S E C T I O N 3 • F O R M A L A S S E S S M E N T
© You may photocopy this page for use with Study & Master Geography Grade 11.
Reco
rd s
heet
for f
orm
al a
sses
smen
t: Te
rm 2
Cla
ss:
Year
:
Lear
ner’s
nam
esA
sses
smen
t Tas
k 2
mar
k
(60
mar
ks)
Cont
ribu
tion
to y
ear
mar
k
(20
mar
ks)
Mid
-yea
r exa
m
(150
mar
ks)
Cont
ribu
tion
to y
ear
mar
k
(20
mar
ks)*
*
Term
2 m
ark*
**Te
rm 2
per
cent
age
~Ra
ting
code
Ratin
g co
des
and
desc
ript
ors:
7:
Out
stan
ding
ach
ieve
men
t (80
%–1
00%
)
6: M
erito
rious
ach
ieve
men
t (70
%–7
9%)
5:
Sub
stan
tial a
chie
vem
ent (
60%
–69%
)
4: A
dequ
ate
achi
evem
ent (
50%
–59%
)
3: M
oder
ate
achi
evem
ent (
40%
–49%
) 2:
Ele
men
tary
ach
ieve
men
t (30
%–3
9%)
1:
Not
ach
ieve
d (0
%–2
9%)
* D
ivid
e th
e le
arne
r’s m
ark
by 3
.**
D
ivid
e th
e m
ark
in th
e pr
evio
us c
olum
n by
15
and
then
mul
tiply
the
answ
er b
y 2.
***
Add
the
mar
ks in
Col
umns
2 a
nd 4
.~
C
onve
rt th
e m
ark
in th
e pr
evio
us c
olum
n to
a p
erce
ntag
e.
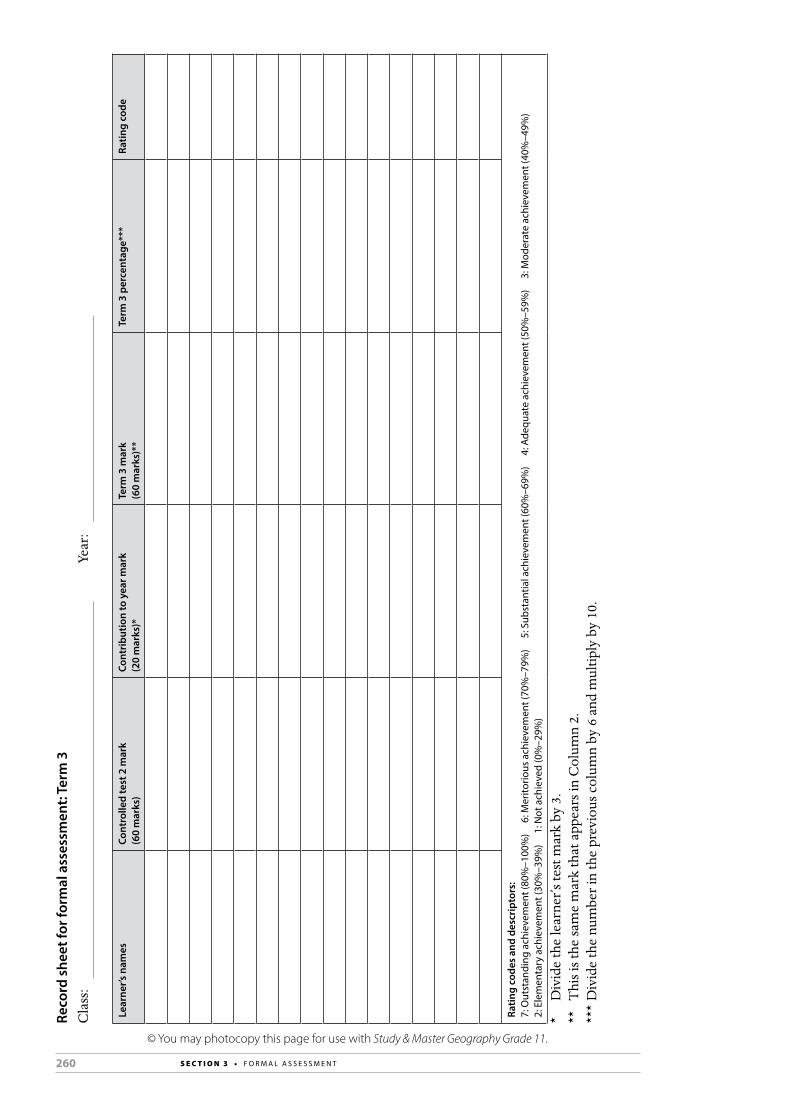
260 S E C T I O N 3 • F O R M A L A S S E S S M E N T
© You may photocopy this page for use with Study & Master Geography Grade 11.
Reco
rd s
heet
for f
orm
al a
sses
smen
t: Te
rm 3
Cla
ss:
Year
:
Lear
ner’s
nam
esCo
ntro
lled
test
2 m
ark
(6
0 m
arks
)Co
ntri
butio
n to
yea
r mar
k (2
0 m
arks
)*Te
rm 3
mar
k
(60
mar
ks)*
*Te
rm 3
per
cent
age*
**Ra
ting
code
Ratin
g co
des
and
desc
ript
ors:
7:
Out
stan
ding
ach
ieve
men
t (80
%–1
00%
)
6: M
erito
rious
ach
ieve
men
t (70
%–7
9%)
5:
Sub
stan
tial a
chie
vem
ent (
60%
–69%
)
4: A
dequ
ate
achi
evem
ent (
50%
–59%
)
3: M
oder
ate
achi
evem
ent (
40%
–49%
) 2:
Ele
men
tary
ach
ieve
men
t (30
%–3
9%)
1:
Not
ach
ieve
d (0
%–2
9%)
* D
ivid
e th
e le
arne
r’s te
st m
ark
by 3
.**
T
his i
s the
sam
e m
ark
that
app
ears
in C
olum
n 2.
***
Div
ide
the
num
ber i
n th
e pr
evio
us c
olum
n b y
6 a
nd m
ultip
ly b
y 10
.

261S E C T I O N 3 • F O R M A L A S S E S S M E N T
© You may photocopy this page for use with Study & Master Geography Grade 11.
Reco
rd s
heet
for f
orm
al a
sses
smen
t: Te
rm 4
Cla
ss:
Year
:
Lear
ner’s
nam
esYe
ar-e
nd e
xam
: Pa
per 1
mar
k
(150
mar
ks)
Year
-end
exa
m:
Pape
r 2 m
ark
(1
50 m
arks
)
Tota
l mar
k fo
r Ye
ar-e
nd e
xam
(3
00 m
arks
)*
Year
mar
k
(100
mar
ks)*
*Te
rm 4
mar
k (4
00 m
arks
)***
Term
4 p
erce
ntag
e~Ra
ting
code
Ratin
g co
des
and
desc
ript
ors:
7:
Out
stan
ding
ach
ieve
men
t (80
%–1
00%
)
6: M
erito
rious
ach
ieve
men
t (70
%–7
9%)
5:
Sub
stan
tial a
chie
vem
ent (
60%
–69%
)
4: A
dequ
ate
achi
evem
ent (
50%
–59%
)
3:
Mod
erat
e ac
hiev
emen
t (40
%–4
9%)
2: E
lem
enta
ry a
chie
vem
ent (
30%
–39%
)
1: N
ot a
chie
ved
(0%
–29%
)
* A
dd th
e m
arks
in C
olum
ns 2
and
3.
**
To w
ork
out t
he y
ear m
ark
of f o
r eac
h le
arne
r add
the
mar
ks in
the
colu
mns
indi
cate
d fr
om th
is ta
ble
and
the
tabl
es fo
r the
oth
er te
rms:
Te
rm 1
, Col
umn
3 +
Ter
m 1
, Col
umn
5 +
Ter
m 2
, Col
umn
3 +
Ter
m 2
, Col
umn
5 +
Ter
m 3
, Col
umn
3 +
Ter
m 4
, Col
umn
4**
* A
dd th
e m
arks
in C
olum
ns 4
and
5.
~
Div
ide
the
mar
k in
Col
umn
6 by
4.


4. RESOURCES
263
1. Useful websites 264
2. Photocopiable worksheets 265
3. Answers for photocopiable worksheets 314
4. Lesson plan template 330
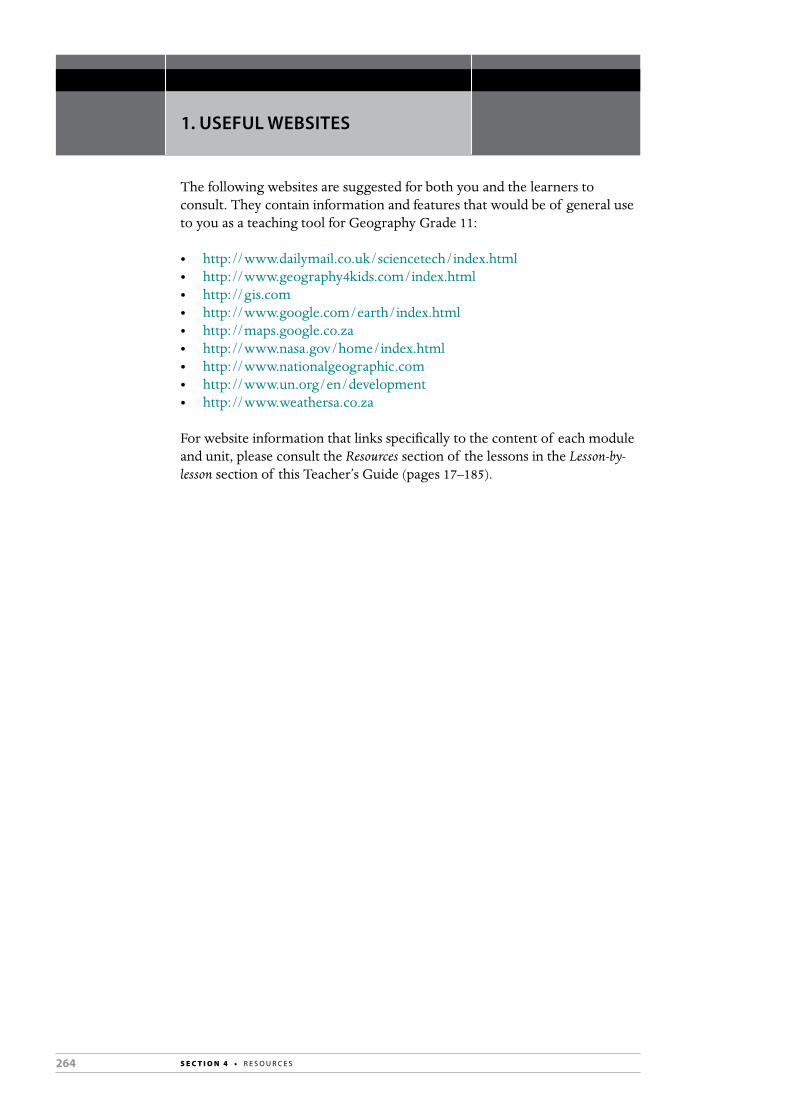
264 S E C T I O N 4 • R E S O U R C E S
1. USEFUL WEBSITES
The following websites are suggested for both you and the learners to consult. They contain information and features that would be of general use to you as a teaching tool for Geography Grade 11:
• http://www.dailymail.co.uk/sciencetech/index.html• http://www.geography4kids.com/index.html• http://gis.com• http://www.google.com/earth/index.html• http://maps.google.co.za• http://www.nasa.gov/home/index.html• http://www.nationalgeographic.com• http://www.un.org/en/development• http://www.weathersa.co.za
For website information that links specifically to the content of each module and unit, please consult the Resources section of the lessons in the Lesson-by-lesson section of this Teacher’s Guide (pages 17–185).

265S E C T I O N 4 • R E S O U R C E S
2. PHOTOCOPIABLE WORKSHEETS
The following worksheets may be photocopied for use with Study & Master Geography Grade 11. Please refer to the Lesson-by-lesson section of this Teacher’s Guide for suggestions on when to use these worksheets. The remedial worksheets can also be used for revision purposes. Answers for the photocopiable worksheets are provided on pages 313–328 of this section.
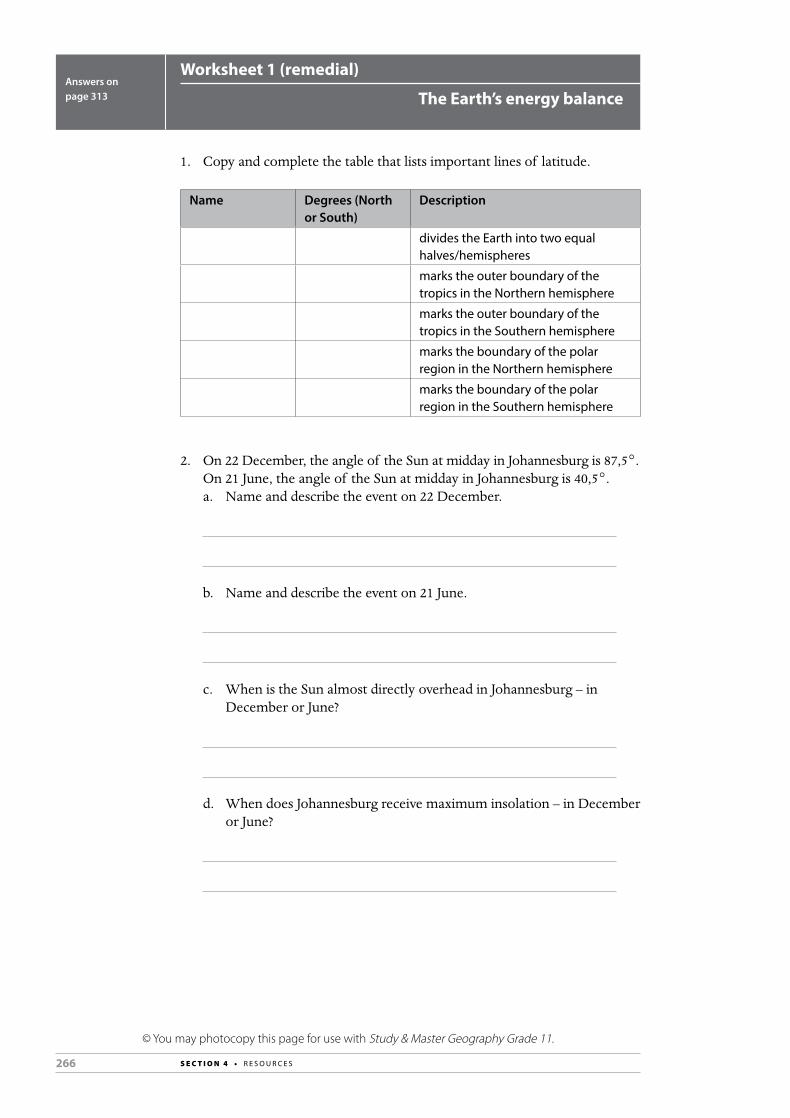
266 S E C T I O N 4 • R E S O U R C E S
© You may photocopy this page for use with Study & Master Geography Grade 11.
Worksheet 1 (remedial)
The Earth’s energy balanceAnswers on page 313
1. Copy and complete the table that lists important lines of latitude.
Name Degrees (North or South)
Description
divides the Earth into two equal halves/hemispheres
marks the outer boundary of the tropics in the Northern hemisphere
marks the outer boundary of the tropics in the Southern hemisphere
marks the boundary of the polar region in the Northern hemisphere
marks the boundary of the polar region in the Southern hemisphere
2. On 22 December, the angle of the Sun at midday in Johannesburg is 87,5°. On 21 June, the angle of the Sun at midday in Johannesburg is 40,5°.a. Name and describe the event on 22 December.
b. Name and describe the event on 21 June.
c. When is the Sun almost directly overhead in Johannesburg – in December or June?
d. When does Johannesburg receive maximum insolation – in December or June?

267S E C T I O N 4 • R E S O U R C E S
© You may photocopy this page for use with Study & Master Geography Grade 11.
e. Calculate the difference between the two angles. What is the significance of this value?

268 S E C T I O N 4 • R E S O U R C E S
© You may photocopy this page for use with Study & Master Geography Grade 11.
Worksheet 2 (extension)
The Earth’s energy balanceAnswers on page 313
Explain how the revolving of the Earth around the Sun and the tilt of the Earth on its own axis, determines the seasons, the spring and autumn equinoxes, and summer and winter solstices. Use the diagram below to help you.
23,5ºN
23,5ºS
23,5ºN (Tropic of Cancer) 23,5ºS (Tropic of Capricorn)23,5ºS
0º 23,5ºN
Spring equinox21 March
Autumn equinox21 September
Summer solstice21 June
Winter solstice21 December
N to Polaris
N to Polaris
N to PolarisN to Polaris
rotationcounterclockwise
N Pole
N Pole N Pole
axis
Equator
North Pole
0º
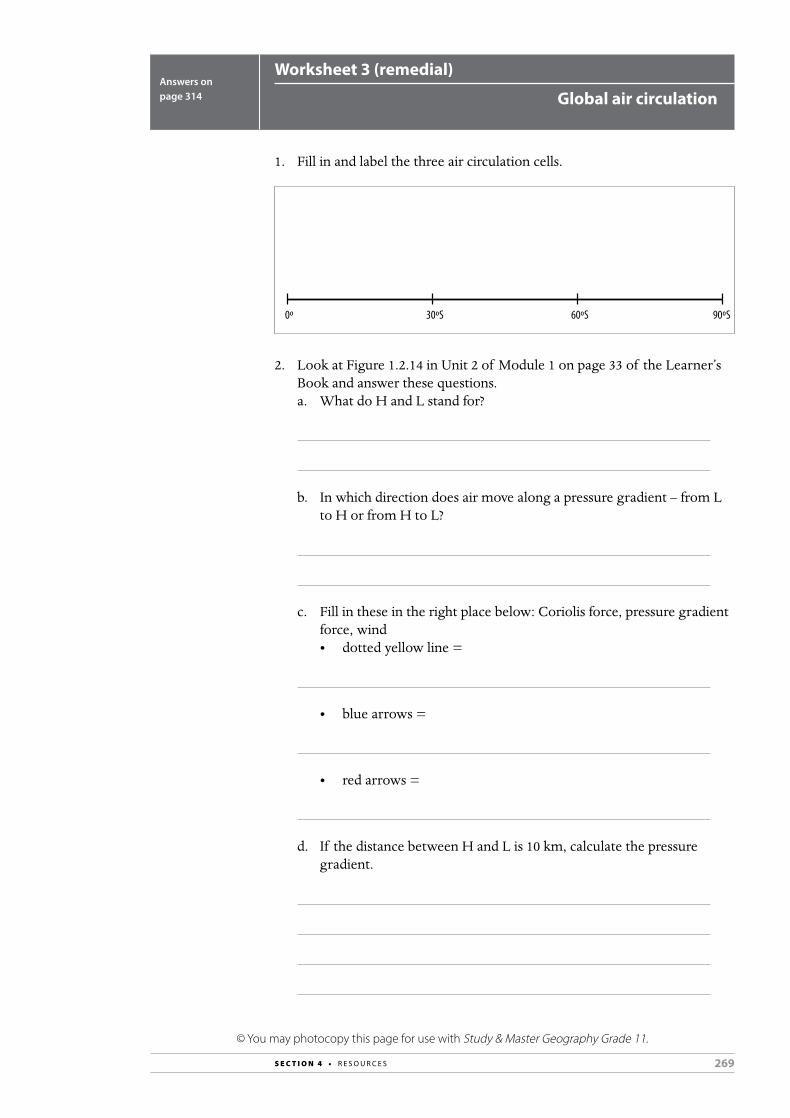
269S E C T I O N 4 • R E S O U R C E S
© You may photocopy this page for use with Study & Master Geography Grade 11.
Worksheet 3 (remedial)
Global air circulationAnswers on page 314
1. Fill in and label the three air circulation cells.
0º 30ºS 60ºS 90ºS
2. Look at Figure 1.2.14 in Unit 2 of Module 1 on page 33 of the Learner’s Book and answer these questions.a. What do H and L stand for?
b. In which direction does air move along a pressure gradient – from L to H or from H to L?
c. Fill in these in the right place below: Coriolis force, pressure gradient force, wind• dotted yellow line =
• blue arrows =
• red arrows =
d. If the distance between H and L is 10 km, calculate the pressure gradient.

270 S E C T I O N 4 • R E S O U R C E S
© You may photocopy this page for use with Study & Master Geography Grade 11.
e. Because the wind is deflected to the right, which hemisphere does this take place in?
f. Draw the version for the opposite hemisphere.
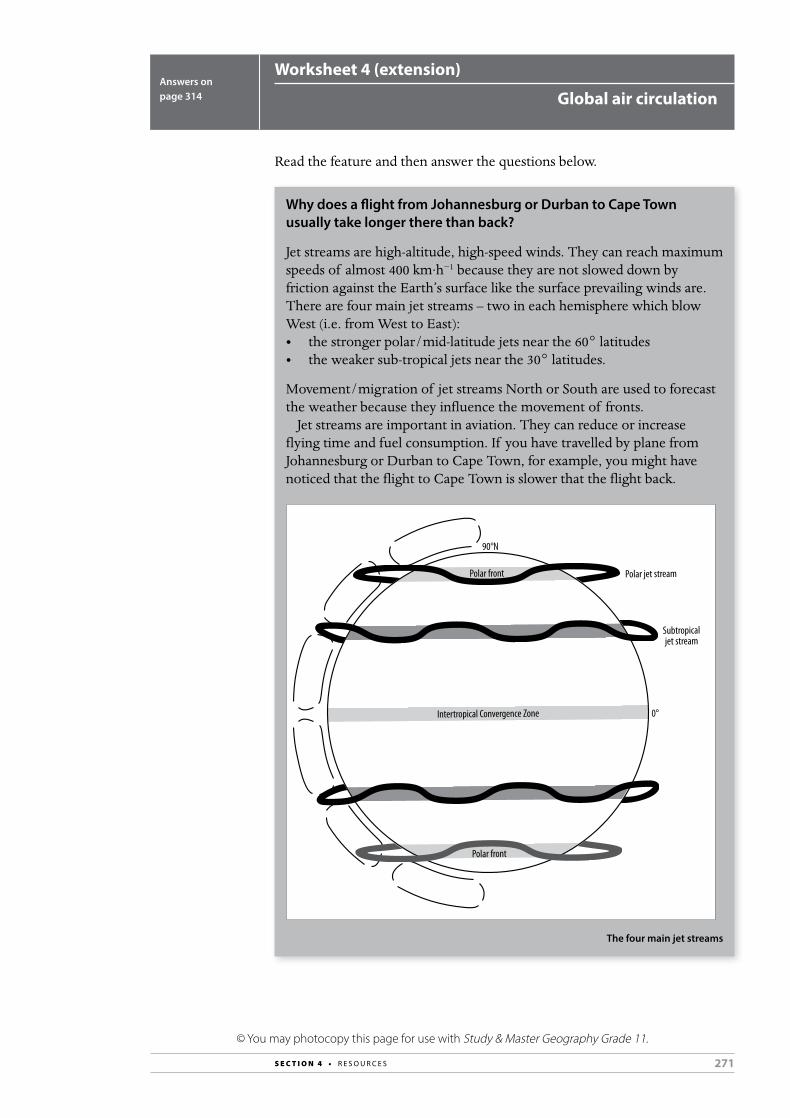
271S E C T I O N 4 • R E S O U R C E S
© You may photocopy this page for use with Study & Master Geography Grade 11.
Worksheet 4 (extension)
Global air circulationAnswers on page 314
Read the feature and then answer the questions below.
Why does a flight from Johannesburg or Durban to Cape Town usually take longer there than back?
Jet streams are high-altitude, high-speed winds. They can reach maximum speeds of almost 400 km·h−1 because they are not slowed down by friction against the Earth’s surface like the surface prevailing winds are. There are four main jet streams – two in each hemisphere which blow West (i.e. from West to East): • the stronger polar/mid-latitude jets near the 60° latitudes • the weaker sub-tropical jets near the 30° latitudes.
Movement/migration of jet streams North or South are used to forecast the weather because they influence the movement of fronts.
Jet streams are important in aviation. They can reduce or increase flying time and fuel consumption. If you have travelled by plane from Johannesburg or Durban to Cape Town, for example, you might have noticed that the flight to Cape Town is slower that the flight back.
90°N
0°Intertropical Convergence Zone
Subtropicaljet stream
Polar jet stream
Polar front
Polar front
The four main jet streams
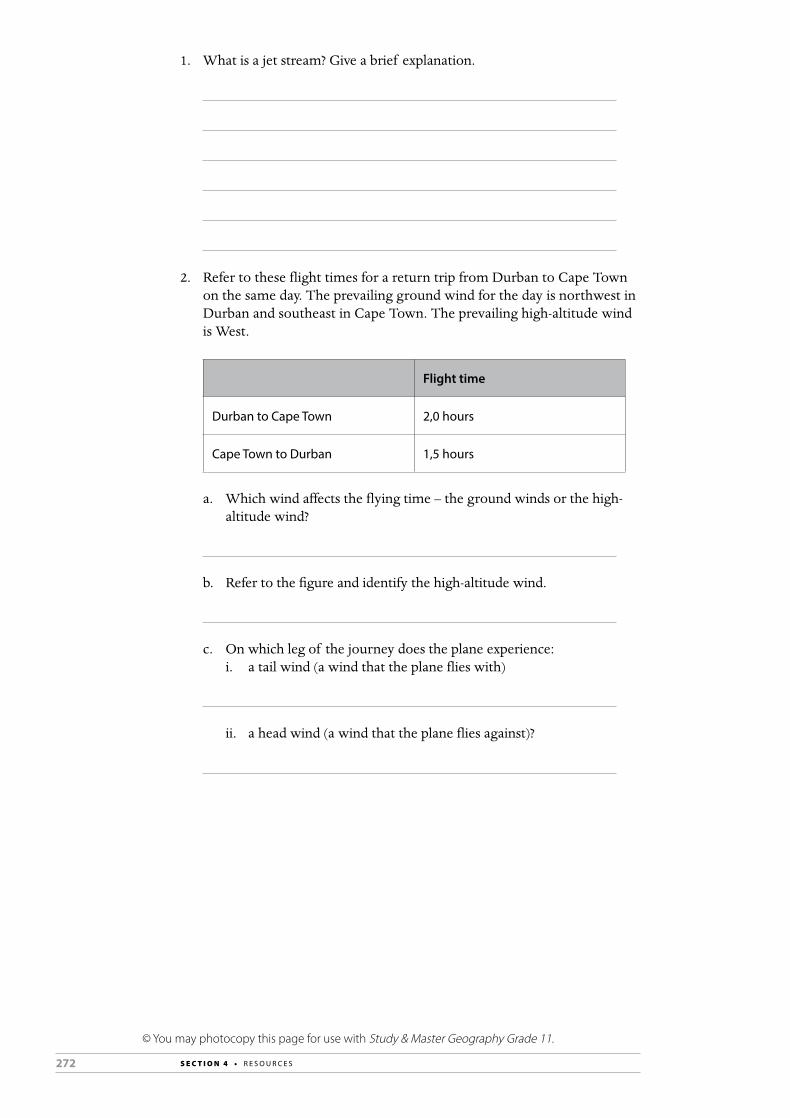
272 S E C T I O N 4 • R E S O U R C E S
© You may photocopy this page for use with Study & Master Geography Grade 11.
1. What is a jet stream? Give a brief explanation.
2. Refer to these flight times for a return trip from Durban to Cape Town on the same day. The prevailing ground wind for the day is northwest in Durban and southeast in Cape Town. The prevailing high-altitude wind is West.
Flight time
Durban to Cape Town 2,0 hours
Cape Town to Durban 1,5 hours
a. Which wind affects the flying time – the ground winds or the high-altitude wind?
b. Refer to the figure and identify the high-altitude wind.
c. On which leg of the journey does the plane experience:i. a tail wind (a wind that the plane flies with)
ii. a head wind (a wind that the plane flies against)?

273S E C T I O N 4 • R E S O U R C E S
© You may photocopy this page for use with Study & Master Geography Grade 11.
Worksheet 5 (remedial)
Climatic regions and biomes of AfricaAnswers on page 315
1. Indicate the different biomes of Africa on the map below. Shade each biome a different colour.
2. Give your map a key.
Key

274 S E C T I O N 4 • R E S O U R C E S
© You may photocopy this page for use with Study & Master Geography Grade 11.
3. Complete the table below. Name and describe the different biomes and associated climatic regions of Africa.
Name of biome
Description of biome
Associated climatic region
Description of climatic region
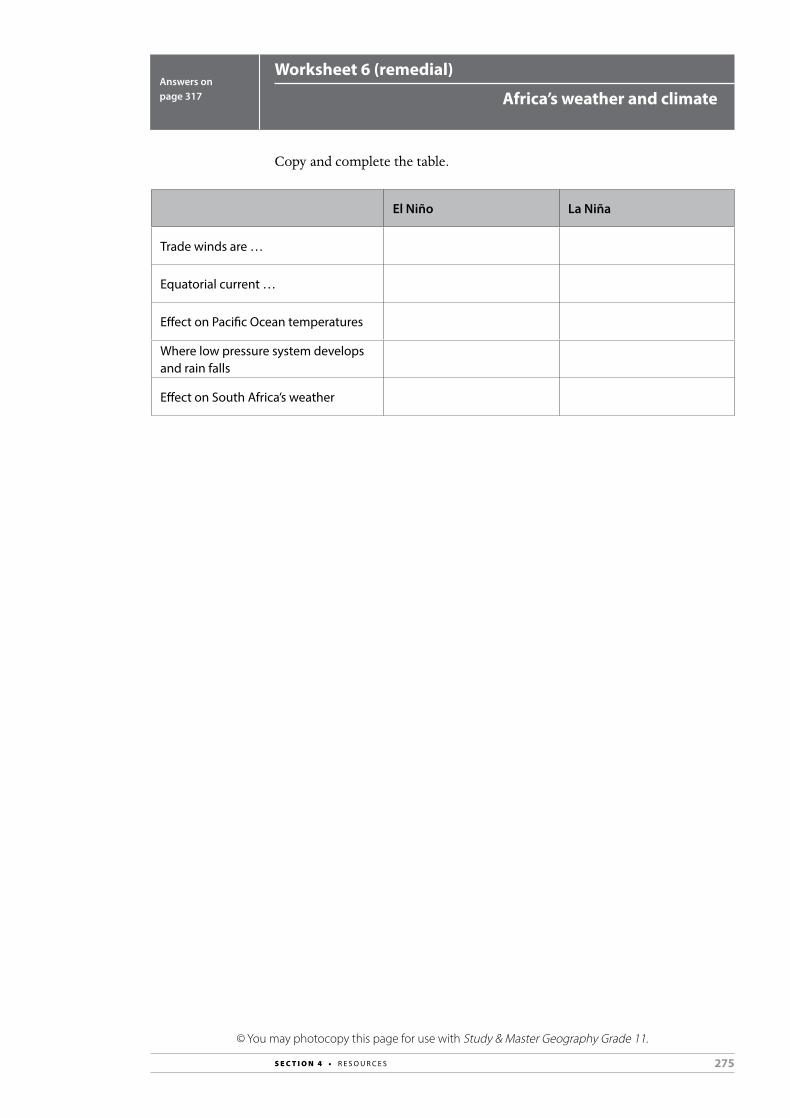
275S E C T I O N 4 • R E S O U R C E S
© You may photocopy this page for use with Study & Master Geography Grade 11.
Worksheet 6 (remedial)
Africa’s weather and climateAnswers on page 317
Copy and complete the table.
El Niño La Niña
Trade winds are …
Equatorial current …
Effect on Pacific Ocean temperatures
Where low pressure system develops and rain falls
Effect on South Africa’s weather
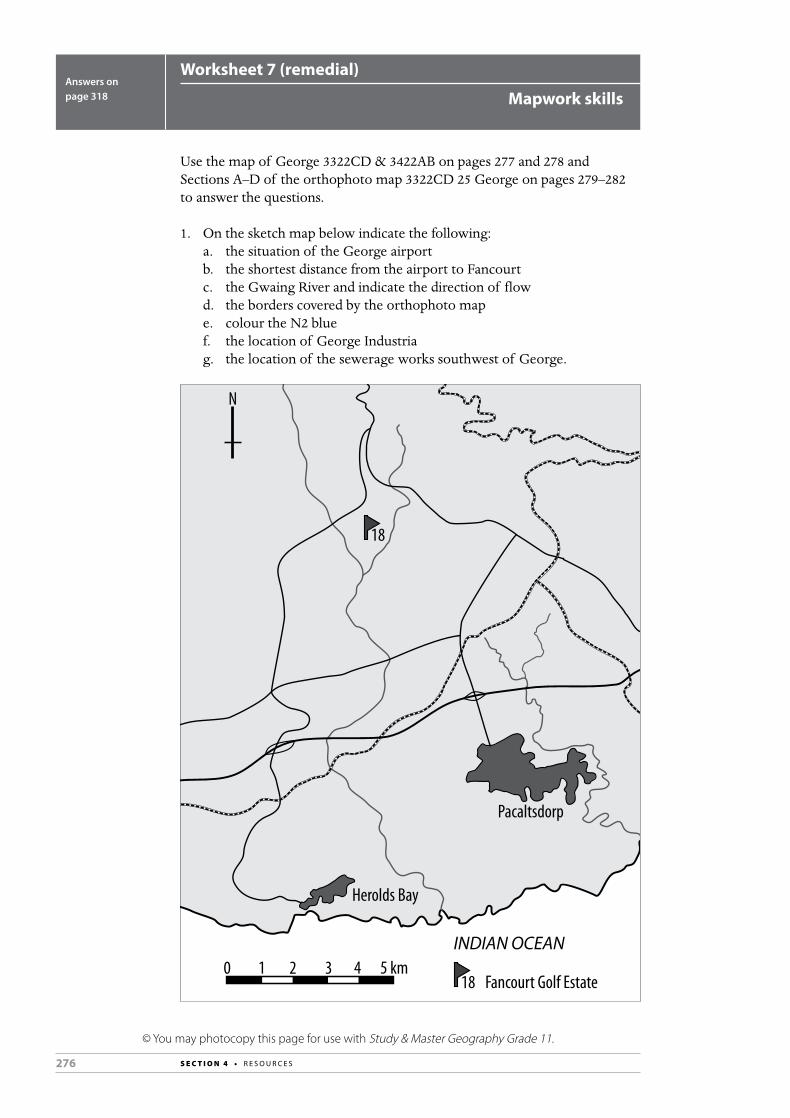
276 S E C T I O N 4 • R E S O U R C E S
© You may photocopy this page for use with Study & Master Geography Grade 11.
Worksheet 7 (remedial)
Mapwork skillsAnswers on page 318
Use the map of George 3322CD & 3422AB on pages 277 and 278 and Sections A–D of the orthophoto map 3322CD 25 George on pages 279–282 to answer the questions.
1. On the sketch map below indicate the following:a. the situation of the George airportb. the shortest distance from the airport to Fancourtc. the Gwaing River and indicate the direction of flowd. the borders covered by the orthophoto mape. colour the N2 bluef. the location of George Industriag. the location of the sewerage works southwest of George.
Pacaltsdorp
Herolds Bay
18
0 1 2 3 4 5 km18 Fancourt Golf Estate
N
INDIAN OCEAN
277S E C T I O N 4 • R E S O U R C E S
© You may photocopy this page for use with Study & Master Geography Grade 11.
2. Identify the following features on the orthophoto map. Use the topographical map to help you.
a. A:
b. B:
c. C:
d. D:
e. E:
3. Describe three advantages of orthophoto maps.

278 S E C T I O N 4 • R E S O U R C E S
© You may photocopy this page for use with Study & Master Geography Grade 11.
Con
tour
Inte
rval
20
Met
res
A
B
3322
CD
& 3
422A
B G
EORG
E 1:
50 0
0022
o 21'3
0''
33o 54
'30'
'
55'
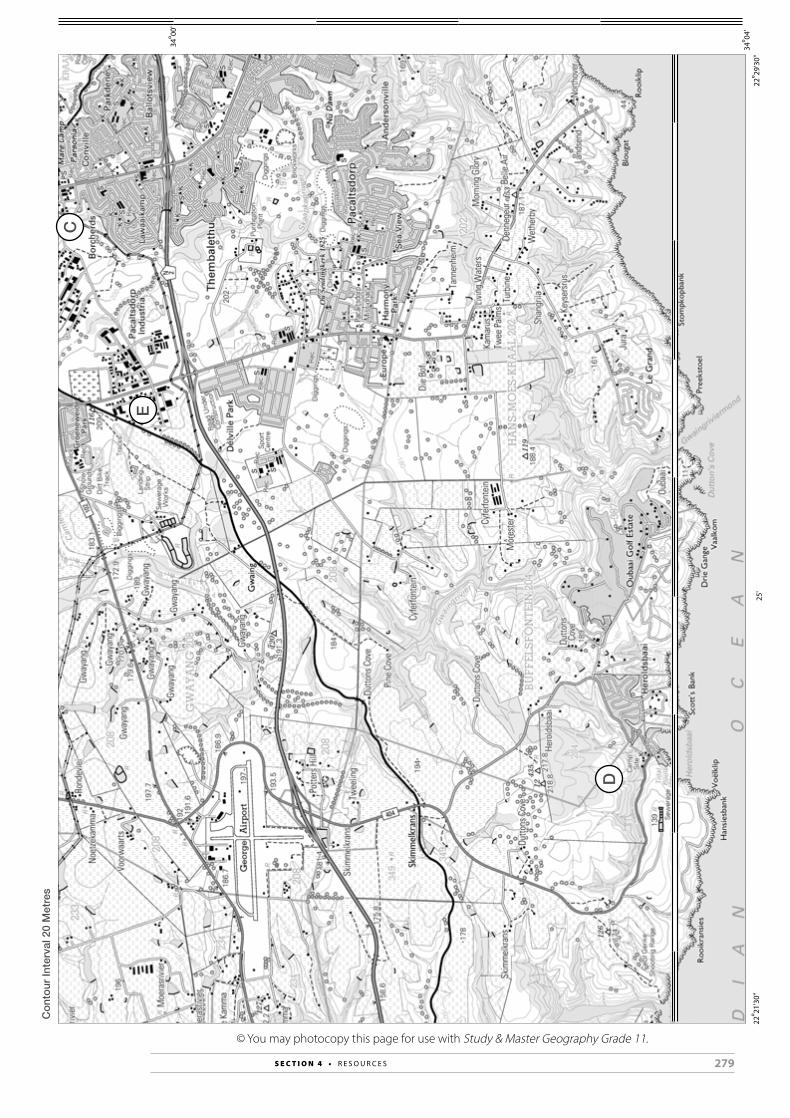
279S E C T I O N 4 • R E S O U R C E S
© You may photocopy this page for use with Study & Master Geography Grade 11.
Con
tour
Inte
rval
20
Met
res
C
E
D
22o 29
'30'
'22
o 21'3
0''
34o 04
'
34o 00
'
25'

280 S E C T I O N 4 • R E S O U R C E S
© You may photocopy this page for use with Study & Master Geography Grade 11.A
B
Con
tour
Inte
rval
5 M
etre
sG
auss
Con
form
Pro
ject
ion.
Cen
tral M
erid
ian
23̊ E
ast
Grid
Inte
rval
1 00
0 M
etre
s
3322 CD 25 GEORGE 1:10 000
A
C

281S E C T I O N 4 • R E S O U R C E S
© You may photocopy this page for use with Study & Master Geography Grade 11.
B
B
Con
tour
Inte
rval
5 M
etre
sG
auss
Con
form
Pro
ject
ion.
Cen
tral M
erid
ian
23̊ E
ast
Grid
Inte
rval
1 00
0 M
etre
s

282 S E C T I O N 4 • R E S O U R C E S
© You may photocopy this page for use with Study & Master Geography Grade 11.C
C
D
1:10 000
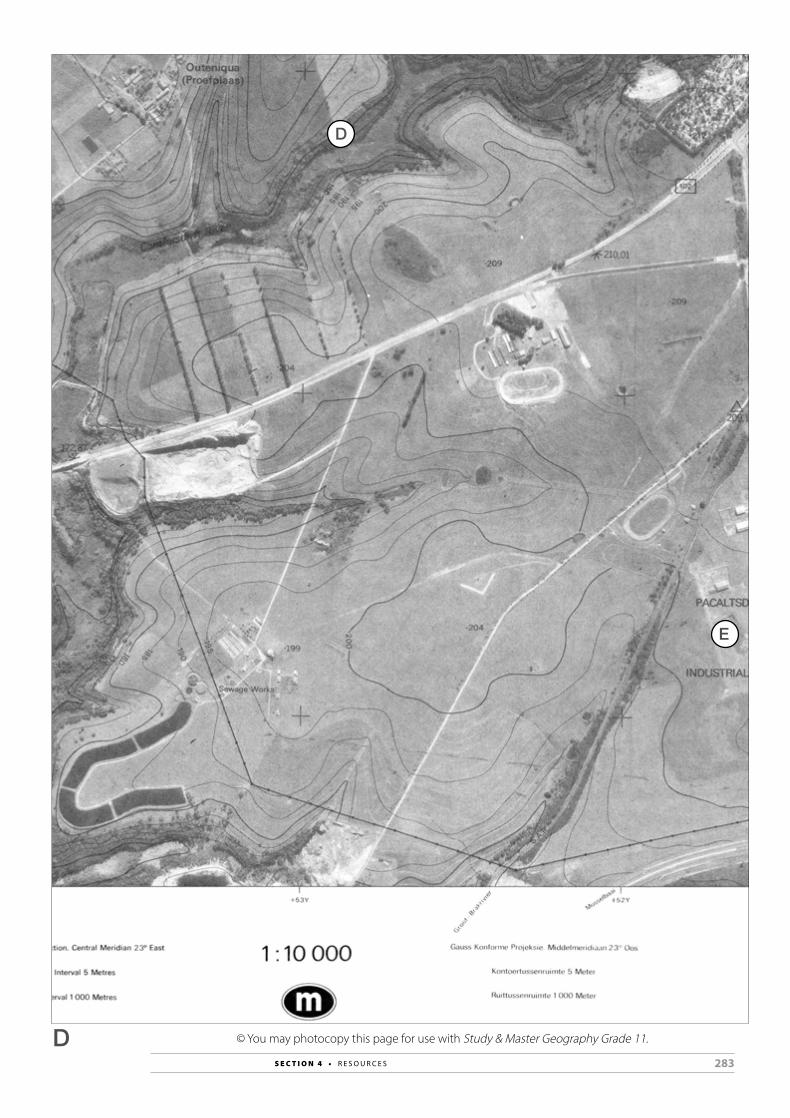
283S E C T I O N 4 • R E S O U R C E S
© You may photocopy this page for use with Study & Master Geography Grade 11.
D
E
D

284 S E C T I O N 4 • R E S O U R C E S
© You may photocopy this page for use with Study & Master Geography Grade 11.
Worksheet 8 (remedial)
Topography associated with horizontally layered rocksAnswers on page 319
1. Refer to Figures 3.1.5 (page 115), 3.1.7 (page 116) and 3.1.13 (page 120) in the Learner’s Book. Write a short description or caption for each of the stages.
a. Hilly landscapesYoung:
Mature:
Old:
b. Basaltic plateausYoung:
Mature:
Old:
c. Canyon and Karoo landscapesYoung:
Mature:
Old:

285S E C T I O N 4 • R E S O U R C E S
© You may photocopy this page for use with Study & Master Geography Grade 11.
2. Refer to the section, ‘How do people use these landscapes?’ on page 123 of the Learner’s Book. Complete the summary table below.
Hilly landscapes
Basaltic plateaus
Canyon landscapes
Karoo landscapes
Strata of equal/unequal resistance
Climate
Use

286 S E C T I O N 4 • R E S O U R C E S
© You may photocopy this page for use with Study & Master Geography Grade 11.
Worksheet 9 (remedial)
Topography associated with inclined/tilted rock strataAnswers on page 320
1. Match the labels to a number on the diagrams: folding, faulting, syncline, anticline, normal fault, thrust fault, dip slope,
scarp slope, resistant rock, less resistant rock.
1. ...............................................................
2. ...............................................................
8. ...............................................................
3. ...............................................................
9. ............................................................... 10. ...............................................................
4 45 5
667 7
1.
2.
3.
4.
5.
6.
7.
8.
9.
10.

287S E C T I O N 4 • R E S O U R C E S
© You may photocopy this page for use with Study & Master Geography Grade 11.
2. a. Identify ridges A–C.
A B C
A.
B.
C.
b. Match each of these examples: San Rafael Swell, Hogsback Mountain Peak, Magaliesberg.
3. a. Match the labels to a number on the diagram: cuesta basin, cuesta dome, scarp slope, dip slope, resistant rock, less
resistant rock.
1. ............................................................... 2. ...............................................................
5 6
43
5 6
43
1.
2.
3.
4.
5.
6.
288 S E C T I O N 4 • R E S O U R C E S
© You may photocopy this page for use with Study & Master Geography Grade 11.
b. Complete these statements by underlining the correct word/option in the brackets.i. In a cuesta dome, the (youngest/oldest) rock layers are in the
centre and the (youngest/oldest) rock layers are on the outside.ii. In a cuesta basin, the (youngest/oldest) rock layers are in the
centre and the (youngest/oldest) rock layers are on the outside.
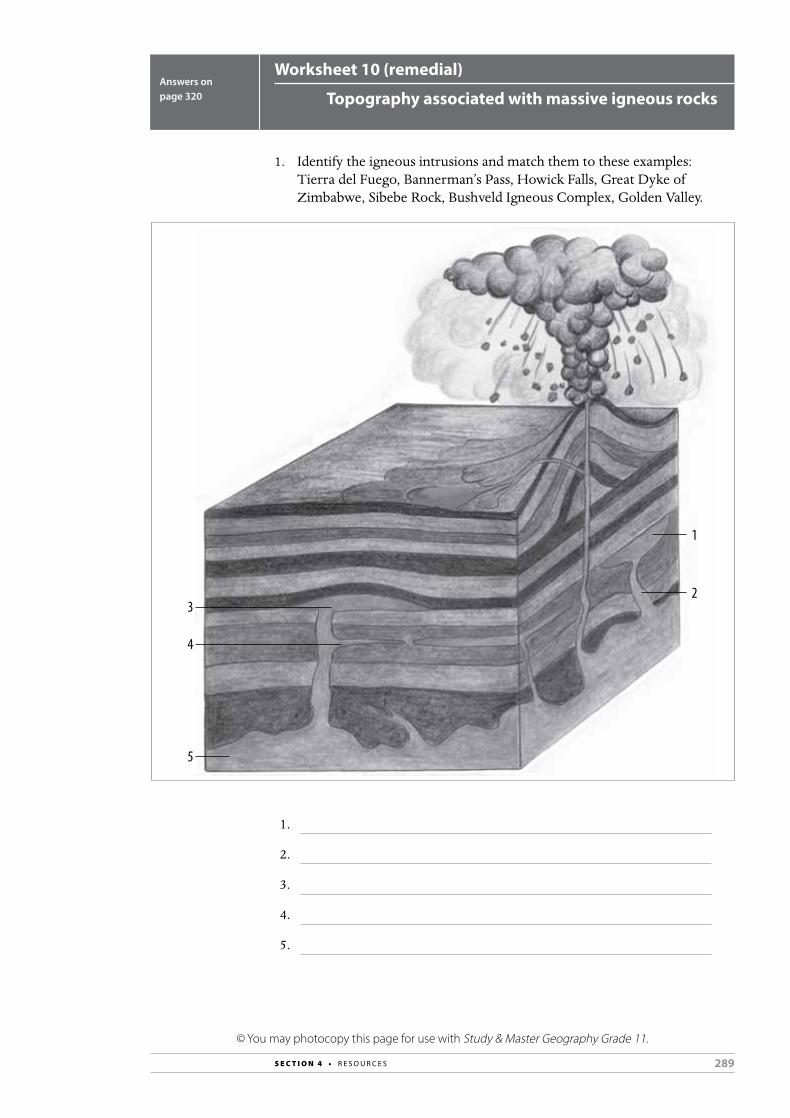
289S E C T I O N 4 • R E S O U R C E S
© You may photocopy this page for use with Study & Master Geography Grade 11.
Worksheet 10 (remedial)
Topography associated with massive igneous rocksAnswers on page 320
1. Identify the igneous intrusions and match them to these examples: Tierra del Fuego, Bannerman’s Pass, Howick Falls, Great Dyke of
Zimbabwe, Sibebe Rock, Bushveld Igneous Complex, Golden Valley.
1
3
4
5
2
1.
2.
3.
4.
5.
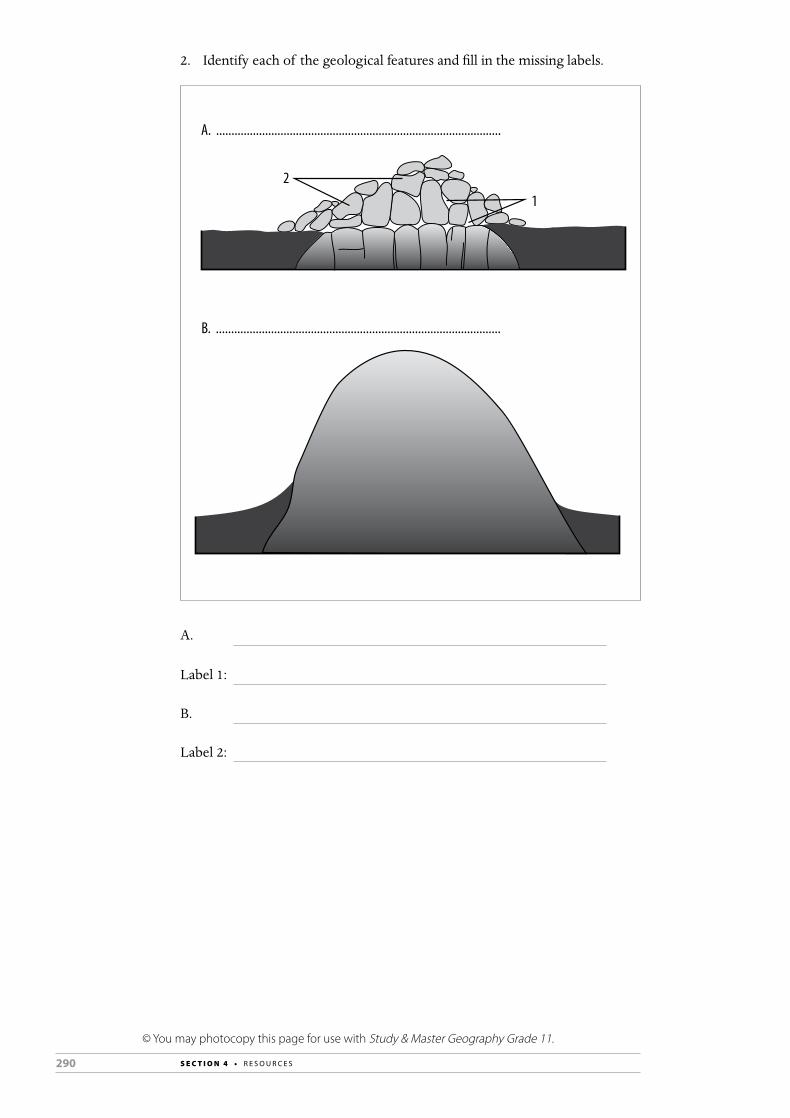
290 S E C T I O N 4 • R E S O U R C E S
© You may photocopy this page for use with Study & Master Geography Grade 11.
2. Identify each of the geological features and fill in the missing labels.
A. .............................................................................................
B. .............................................................................................
21
A.
Label 1:
B.
Label 2:
291S E C T I O N 4 • R E S O U R C E S
© You may photocopy this page for use with Study & Master Geography Grade 11.
Worksheet 11 (extension)
GeomorphologyAnswers on page 320
1. Read the extract on Paarl Rock.
Paarl Rock
In 1657, while Abraham Gabemma was searching for additional meat resources for the new Dutch settlement at the Cape of Good Hope, he saw a giant granite rock glistening in the Sun after a rainstorm and named it ‘de Diamondt en de Peerlberg’ (Diamond and Pearl Mountain). The ‘diamonds’ soon disappeared from the name and it became simply known as Paarl Mountain or Paarl Rock. The fertile soil and the Mediterranean climate of this region provided perfect conditions for farming. The settlers planted vineyards, which today produce some of the best red wines in the world.
Paarl Mountain is a granite mountain and is known to have intruded into the crust of the Earth about 548 million years ago. This intrusion also known as a batholith, is one of many intrusions of the Cape Granite.
Because Paarl Rock is made of granite which is a type of volcanic intrusive rock, it is hard and tough and has gained widespread use as construction stone. Granite is an igneous rock formed below the Earth’s surface by crystallisation of molten rock known as magma. During the crystallisation process the characteristic chemical composition of all granite magmas produces basically three distinctive minerals, namely feldspar, quartz and mica.
The huge rounded granite domes that crown Paarl Mountain are magnificent examples of the geological process known as exfoliation, the tendency for granite to develop onion skin-like cracks as the surface layers of the Earth’s crust are successively eroded away, releasing the pressure that compressed the granite, allowing the granite to expand, and causing huge concentric cracks as a result. Granite is a natural source of radiation, like most natural stones. However, some granites have been reported to have higher radioactivity thereby raising some concerns about their safety.
Source: www.geocaching.com
2. Answer the following questions:a. Where does the word ‘Paarl Rock’ come from?

292 S E C T I O N 4 • R E S O U R C E S
© You may photocopy this page for use with Study & Master Geography Grade 11.
b. How long ago did it form?
c. What type of landform is Paarl Rock?
d. Describe the formation of this landform.
e. Paarl Rock is made of granite. Name the three minerals found in granite and give the colour of each one.
f. Explain what determines the size of the quartz crystals in granite.
g. Exfoliation takes place on Paarl Rock. Describe this process of weathering.

293S E C T I O N 4 • R E S O U R C E S
© You may photocopy this page for use with Study & Master Geography Grade 11.
h. Of what use is Paarl Rock to the inhabitants of Paarl?
i. How is granite used in everyday life?
j. What could be of concern to the inhabitants of Paarl?
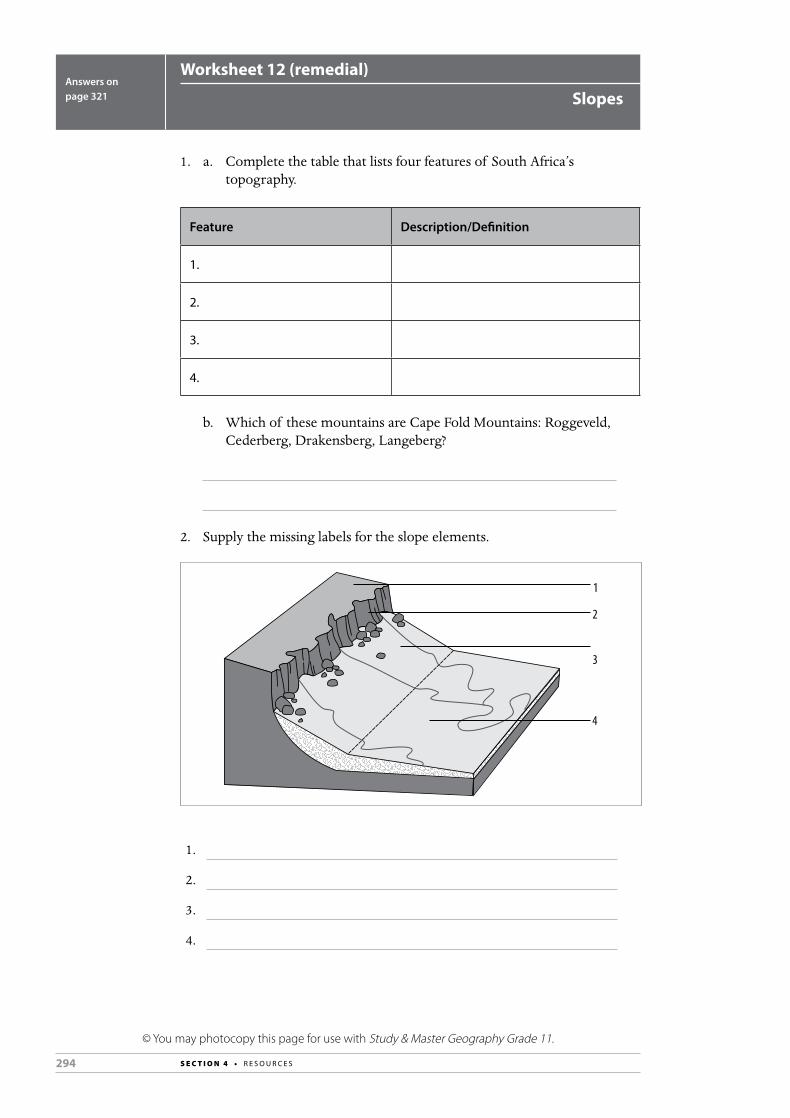
294 S E C T I O N 4 • R E S O U R C E S
© You may photocopy this page for use with Study & Master Geography Grade 11.
Worksheet 12 (remedial)
SlopesAnswers on page 321
1. a. Complete the table that lists four features of South Africa’s topography.
Feature Description/Definition
1.
2.
3.
4.
b. Which of these mountains are Cape Fold Mountains: Roggeveld, Cederberg, Drakensberg, Langeberg?
2. Supply the missing labels for the slope elements.
1
2
3
4
1.
2.
3.
4.
295S E C T I O N 4 • R E S O U R C E S
© You may photocopy this page for use with Study & Master Geography Grade 11.
3. Look at Figure 3.1.12 on page 119 of the Learner’s Book. a. Estimate the angle of repose for the resistant rock.
b. Estimate the angle of repose for the less resistant rock.

296 S E C T I O N 4 • R E S O U R C E S
© You may photocopy this page for use with Study & Master Geography Grade 11.
Worksheet 13 (remedial)
GeomorphologyAnswers on page 321
1. Refer to the diagram below and answer the questions that follow.
A BCX YZ
GH
basalt
sandstone
shale
conglomerate
quartzite
granite
D E
F
J
North South
a. Identify the landforms A, B and C.
b. What type of geological rock strata is associated with these landforms?
c. Describe the formation of landforms A, B and C.
297S E C T I O N 4 • R E S O U R C E S
© You may photocopy this page for use with Study & Master Geography Grade 11.
d. Draw a diagram illustrating the various types of slope forms found on the feature marked B.
e. Give one characteristic of each of the slope forms you have drawn.
f. Identify landforms D and E.
g. What type of geological rock strata is associated with these landforms?
h. Describe the formation of landforms D and E.
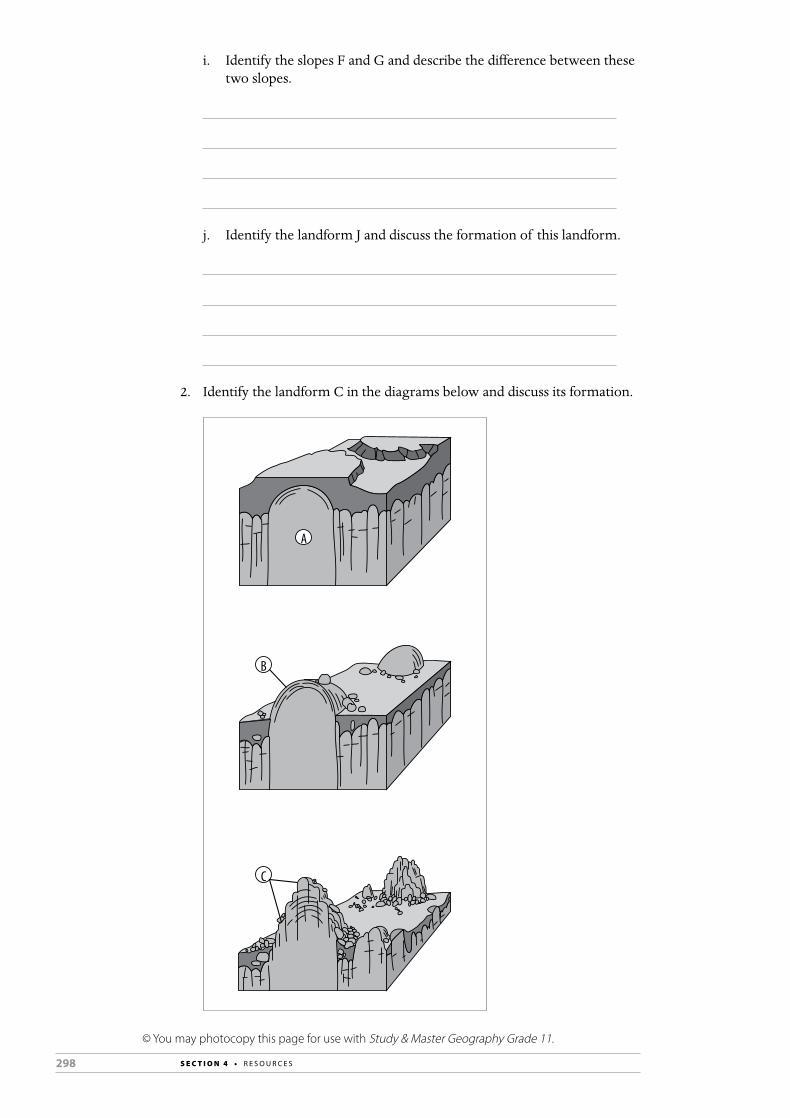
298 S E C T I O N 4 • R E S O U R C E S
© You may photocopy this page for use with Study & Master Geography Grade 11.
i. Identify the slopes F and G and describe the difference between these two slopes.
j. Identify the landform J and discuss the formation of this landform.
2. Identify the landform C in the diagrams below and discuss its formation.
B
C
A

299S E C T I O N 4 • R E S O U R C E S
© You may photocopy this page for use with Study & Master Geography Grade 11.
Worksheet 14 (remedial)
Mass movements and human responsesAnswers on page 323
1. Complete the table by filling in the type of mass movement.
Type of mass movement Definition
drop of slope material along a spoon-shaped slippage plane
slow flow of saturated soil in cold regions
sudden mass movement; a combination of slump and debris flow
free fall of rock
very slow movement of individual particles
fast flow of fine sand particles and water
2. List three signs of soil creep.
3. Refer to Figure 3.5.13 on page 162 in the Learner’s Book.a. Give two reasons why the landslide risk is high in Limpopo Province.
b. Identify an area on the map where the risk is very high but there have been no landslide incidents.
c. Identify the area with the highest number of landslide incidents.

300 S E C T I O N 4 • R E S O U R C E S
© You may photocopy this page for use with Study & Master Geography Grade 11.
Worksheet 15 (extension)
Mass movements and human responsesAnswers on page 323
Refer to Figure 3.5.13 on page 162 in the Learner’s Book.1. The term ‘landslide’ is used loosely here. Which types of mass
movements are a significant geohazard?
2. The GIS landslide hazard map is produced by overlaying or combining different sets of data or information. Comment on how each of these factors or sets of information contributes to the risk: a. rock type
b. rainfall
c. slope angle
d. seismic activity
301S E C T I O N 4 • R E S O U R C E S
© You may photocopy this page for use with Study & Master Geography Grade 11.
3. Explain how the information in a landslide hazard map is useful to:a. town planners
b. civil engineers
4. The map shows incidents of landslides on roads.a. Give two reasons why mass movements on roads is a problem.
b. Explain how the construction of roads on slopes can cause mass movements.
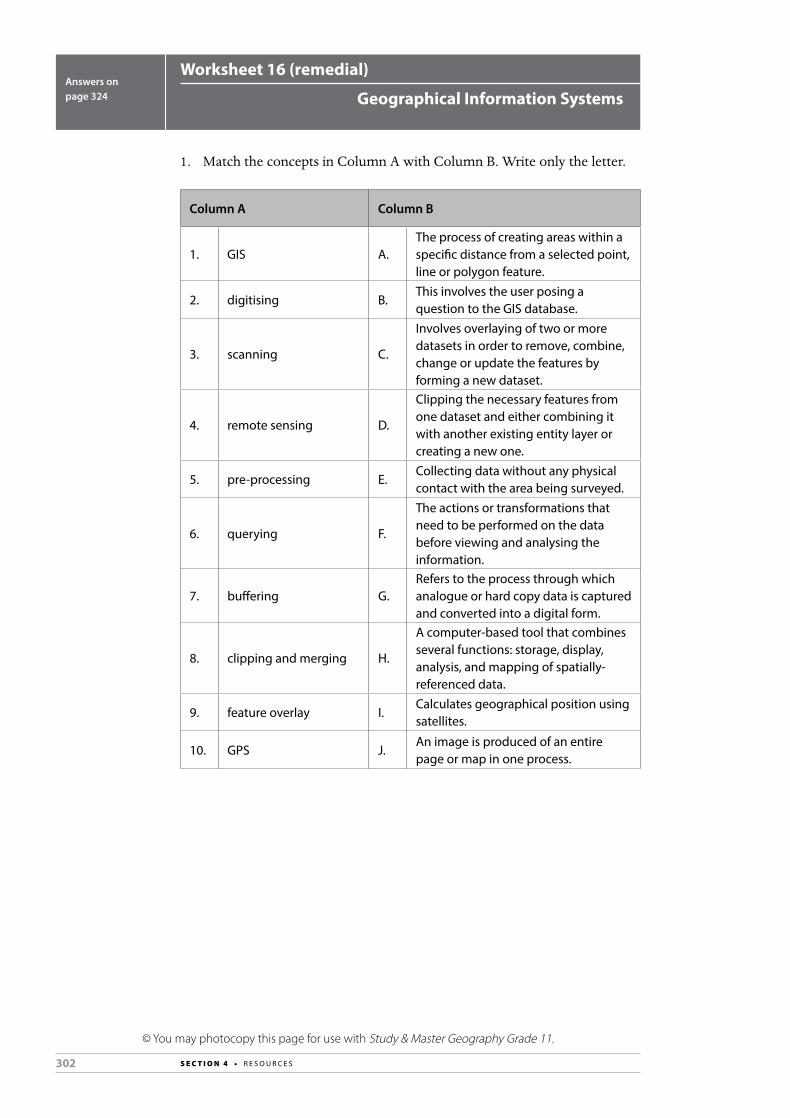
302 S E C T I O N 4 • R E S O U R C E S
© You may photocopy this page for use with Study & Master Geography Grade 11.
Worksheet 16 (remedial)
Geographical Information SystemsAnswers on page 324
1. Match the concepts in Column A with Column B. Write only the letter.
Column A Column B
1. GIS A.The process of creating areas within a specific distance from a selected point, line or polygon feature.
2. digitising B.This involves the user posing a question to the GIS database.
3. scanning C.
Involves overlaying of two or more datasets in order to remove, combine, change or update the features by forming a new dataset.
4. remote sensing D.
Clipping the necessary features from one dataset and either combining it with another existing entity layer or creating a new one.
5. pre-processing E.Collecting data without any physical contact with the area being surveyed.
6. querying F.
The actions or transformations that need to be performed on the data before viewing and analysing the information.
7. buffering G.Refers to the process through which analogue or hard copy data is captured and converted into a digital form.
8. clipping and merging H.
A computer-based tool that combines several functions: storage, display, analysis, and mapping of spatially-referenced data.
9. feature overlay I.Calculates geographical position using satellites.
10. GPS J.An image is produced of an entire page or map in one process.

303S E C T I O N 4 • R E S O U R C E S
© You may photocopy this page for use with Study & Master Geography Grade 11.
2. GIS usually consists of a baseline map with layers of information that can be overlayed and displayed on the same map. By layering different sets of data over each other you can begin to see the relationship between different things.
Your school would like to provide a bus to transport learners to and from school every day in order to try to make transportation more sustainable. They have asked you to use GIS to determine whether it is a good or bad idea. How would you go about it?
304 S E C T I O N 4 • R E S O U R C E S
© You may photocopy this page for use with Study & Master Geography Grade 11.
Worksheet 17 (remedial)
Development geographyAnswers on page 324
1. Define the following terms:a. development
b. economically developed
c. developing countries
d. sustainable development
2. Describe the difference between less developed and more developed countries in terms of:a. infrastructure
305S E C T I O N 4 • R E S O U R C E S
© You may photocopy this page for use with Study & Master Geography Grade 11.
b. death rate
c. literacy rate
3. Discuss four factors that affect the development of a country.
4. Describe Rostow’s Model of Economic Growth.

306 S E C T I O N 4 • R E S O U R C E S
© You may photocopy this page for use with Study & Master Geography Grade 11.
5. How does economic development in South Africa reflect elements of Rostow’s Model?
6. In the 1960s and 1970s the Nationalist government decided that there was an overconcentration of economic activities and people in core areas of South Africa. They developed the National Physical Development Plan 1975.a. Describe this plan.
b. How did this plan contradict the policies of apartheid?
7. Discuss the Basic Needs Approach and the Reconstruction and Development Programme.

307S E C T I O N 4 • R E S O U R C E S
© You may photocopy this page for use with Study & Master Geography Grade 11.
8. What is meant by the Gender Development Index (GDI)?
9. Discuss three ways in which women around the world have been discriminated against.
10. Do you think gender discrimination is still evident in South Africa? Explain your answer.
308 S E C T I O N 4 • R E S O U R C E S
© You may photocopy this page for use with Study & Master Geography Grade 11.
Worksheet 18 (extension)
GlobalisationAnswers on page 326
1. Read the following.
Globalisation and development From the perspective of poorest countries, undemocratic global governance has allowed the economic dimension of globalisation to dance to the tune of big business. Globalisation not only distributes its favours too unevenly, but also accelerates patterns of unsustainable consumption. Recent financial chaos may prompt world leaders to be more conscious of the complex social and environmental consequences of unrestrained markets.
Winners and losersGlobalisation has drawn attention to itself as a consequence of rapid acceleration. The spread and integration of people, commerce, knowledge and culture across the planet has advanced since the dawn of civilisation.
It is only over the most recent generation that, driven by wonders of microchip technology and the efficiency of container shipping, the intensity of globalisation has delivered controversial results.
Source: Globalisation and Development Guide uk.oneworld.net
2. Define globalisation.
3. What does the heading, ‘Winners and losers’ refer to?
4. On a separate sheet of paper, write a one page essay on the anti-globalisation movement. Your essay should include:a. a meaningful titleb. an introduction, body and conclusionc. recent and relevant facts and examples.
309S E C T I O N 4 • R E S O U R C E S
© You may photocopy this page for use with Study & Master Geography Grade 11.
Worksheet 19 (remedial)
Resources and sustainabilityAnswers on page 327
1. Define the following terms:a. natural resources
b. human resources
c. renewable resources
d. non-renewable resources
2. Name four renewable resources in Africa.
3. If Africa is so rich in these renewable resources then why do we have problems with food security, poverty and lack of water?

310 S E C T I O N 4 • R E S O U R C E S
© You may photocopy this page for use with Study & Master Geography Grade 11.
4. Name four important non-renewable resources in Africa.
5. What are the economic advantages of these non-renewable resources for Africa?
6. How can countries in Africa improve the contribution of mining to the GDP?
7. There are two approaches to the management of resources. Define:a. resource conservation
b. resource preservation

311S E C T I O N 4 • R E S O U R C E S
© You may photocopy this page for use with Study & Master Geography Grade 11.
8. What are transfrontier parks?
9. Why are there often land-use conflicts in national parks?
10. Describe three essential values and attitudes that should be embraced when dealing with the management of resources.

312 S E C T I O N 4 • R E S O U R C E S
© You may photocopy this page for use with Study & Master Geography Grade 11.
Worksheet 20 (extension)
Energy and sustainable developmentAnswers on page 327
1. Read the article below.
Durban 2011: Deal or no deal?
In five days time world leader and international delegates will descend on Durban in South Africa for the next round of global climate talks. COP 17. After the disappointment of the Copenhagen talks in 2009 and dubious progress at last year’s talks at Cancun, senior negotiators are already dampening expectations that a meaningful deal can be achieved.
Whilst it would be fantastic for the international community to commit to a legally binding agreement to supersede the Kyoto Protocol, most do not expect to see a new treaty. Perhaps a more realistic step in the right direction would be an agreement to work on a successor to Kyoto. But it’s not just about the detail of whatever treaty comes out – it’s about politicians sending a clear signal about the world’s commitment to reducing emissions.
A multilateral deal is one way to approach climate change that we must not give up on. But if the talks next week do fail, it shouldn’t be an excuse for efforts here in the UK to fade. Strong political leadership at a national and regional level can go a long way towards delivering similar benefits. It’s important to continue to work hard on decarbonising the UK energy sector, convincing politicians that it’s possible to decouple economic growth and emissions. Investing in renewable energy offers an opportunity to reduce carbon emissions and improve energy security in a sustainable way.
Earlier this month the International Energy Agency warned that there is just five years remaining to cut greenhouse gas emissions to avert ‘irreversible’ climate change. Whatever happens in Durban, there is no doubt that the clock is ticking and time is running out.
Source: www.goodenergy.co.uk
2. On a separate sheet of paper, write a page to explain the link between energy use, carbon emissions and climate change.
3. Write a paragraph outlining the agreement that was signed at the Kyoto Protocol in Japan in 1997.
313S E C T I O N 4 • R E S O U R C E S
© You may photocopy this page for use with Study & Master Geography Grade 11.
4. Discuss three types of renewable energy sources.
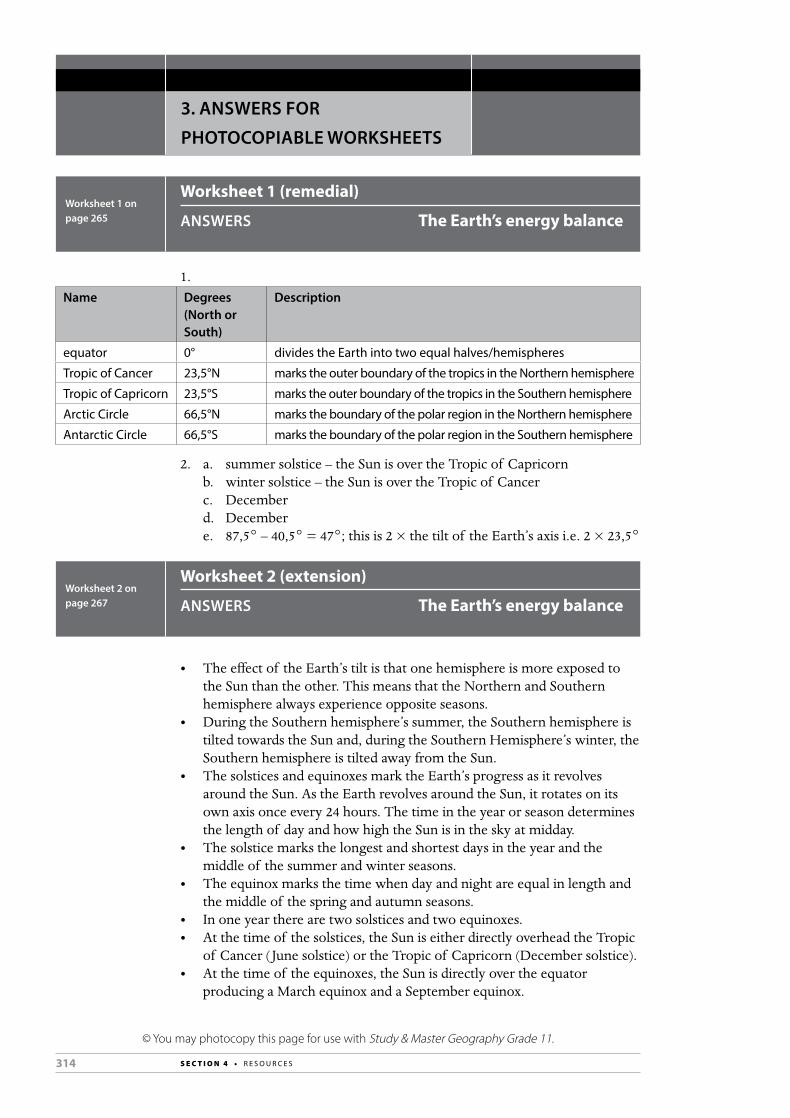
314 S E C T I O N 4 • R E S O U R C E S
© You may photocopy this page for use with Study & Master Geography Grade 11.
3. ANSWERS FOR
PHOTOCOPIABLE WORKSHEETS
Worksheet 1 (remedial)
ANSWERS The Earth’s energy balanceWorksheet 1 on page 265
1.Name Degrees
(North or South)
Description
equator 0° divides the Earth into two equal halves/hemispheres
Tropic of Cancer 23,5°N marks the outer boundary of the tropics in the Northern hemisphere
Tropic of Capricorn 23,5°S marks the outer boundary of the tropics in the Southern hemisphere
Arctic Circle 66,5°N marks the boundary of the polar region in the Northern hemisphere
Antarctic Circle 66,5°S marks the boundary of the polar region in the Southern hemisphere
2. a. summer solstice – the Sun is over the Tropic of Capricornb. winter solstice – the Sun is over the Tropic of Cancerc. December d. December e. 87,5° – 40,5° = 47°; this is 2 × the tilt of the Earth’s axis i.e. 2 × 23,5°
Worksheet 2 (extension)
ANSWERS The Earth’s energy balanceWorksheet 2 on page 267
• The effect of the Earth’s tilt is that one hemisphere is more exposed to the Sun than the other. This means that the Northern and Southern hemisphere always experience opposite seasons.
• During the Southern hemisphere’s summer, the Southern hemisphere is tilted towards the Sun and, during the Southern Hemisphere’s winter, the Southern hemisphere is tilted away from the Sun.
• The solstices and equinoxes mark the Earth’s progress as it revolves around the Sun. As the Earth revolves around the Sun, it rotates on its own axis once every 24 hours. The time in the year or season determines the length of day and how high the Sun is in the sky at midday.
• The solstice marks the longest and shortest days in the year and the middle of the summer and winter seasons.
• The equinox marks the time when day and night are equal in length and the middle of the spring and autumn seasons.
• In one year there are two solstices and two equinoxes.• At the time of the solstices, the Sun is either directly overhead the Tropic
of Cancer ( June solstice) or the Tropic of Capricorn (December solstice).• At the time of the equinoxes, the Sun is directly over the equator
producing a March equinox and a September equinox.
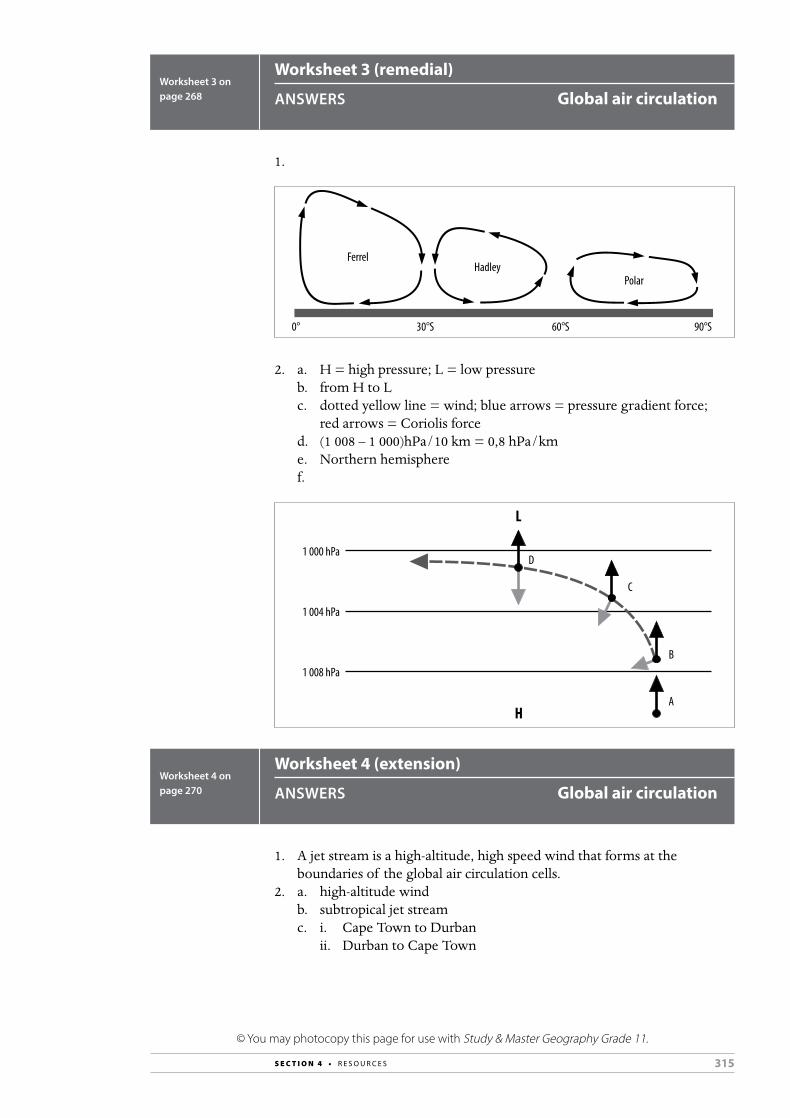
315S E C T I O N 4 • R E S O U R C E S
© You may photocopy this page for use with Study & Master Geography Grade 11.
Worksheet 3 (remedial)
ANSWERS Global air circulationWorksheet 3 on page 268
1.
0° 30°S 90°S60°S
PolarHadley
Ferrel
2. a. H = high pressure; L = low pressureb. from H to Lc. dotted yellow line = wind; blue arrows = pressure gradient force;
red arrows = Coriolis forced. (1 008 – 1 000)hPa/10 km = 0,8 hPa/km e. Northern hemispheref.
1 000 hPa
1 004 hPa
1 008 hPa
H
L
A
B
C
D
Worksheet 4 (extension)
ANSWERS Global air circulationWorksheet 4 on page 270
1. A jet stream is a high-altitude, high speed wind that forms at the boundaries of the global air circulation cells.
2. a. high-altitude windb. subtropical jet streamc. i. Cape Town to Durban
ii. Durban to Cape Town
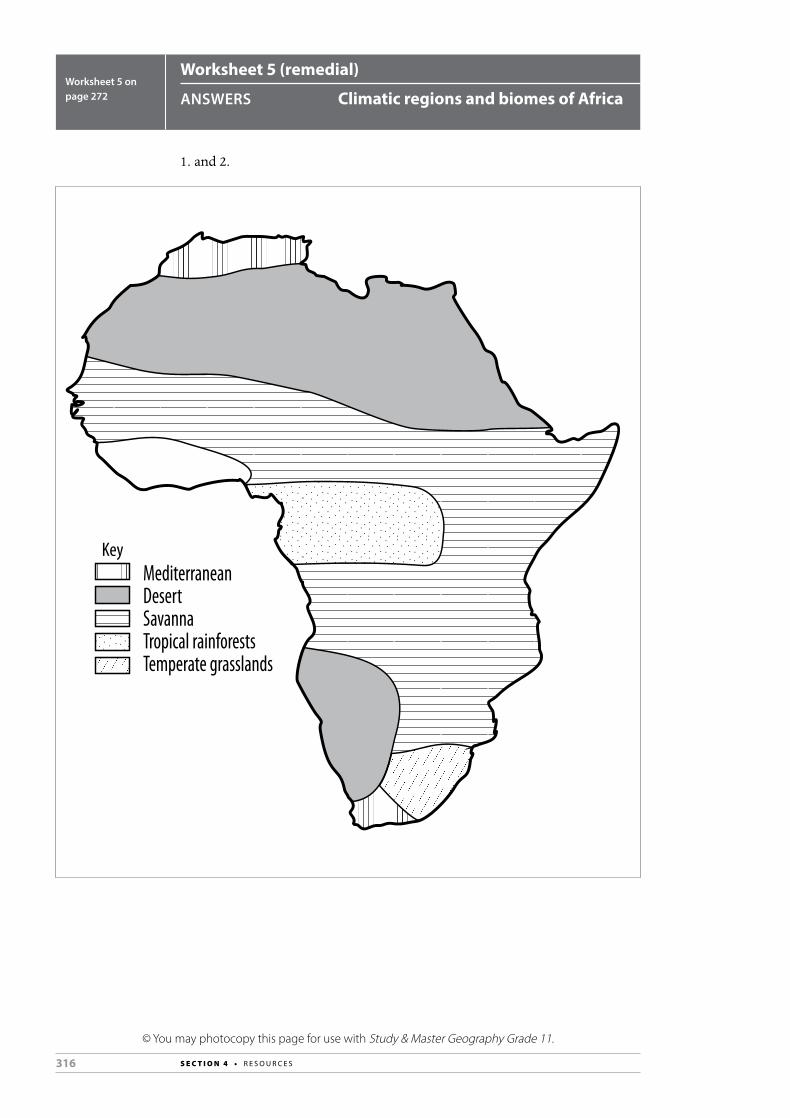
316 S E C T I O N 4 • R E S O U R C E S
© You may photocopy this page for use with Study & Master Geography Grade 11.
Worksheet 5 (remedial)
ANSWERS Climatic regions and biomes of AfricaWorksheet 5 on page 272
1. and 2.
KeyMediterraneanDesertSavannaTropical rainforestsTemperate grasslands
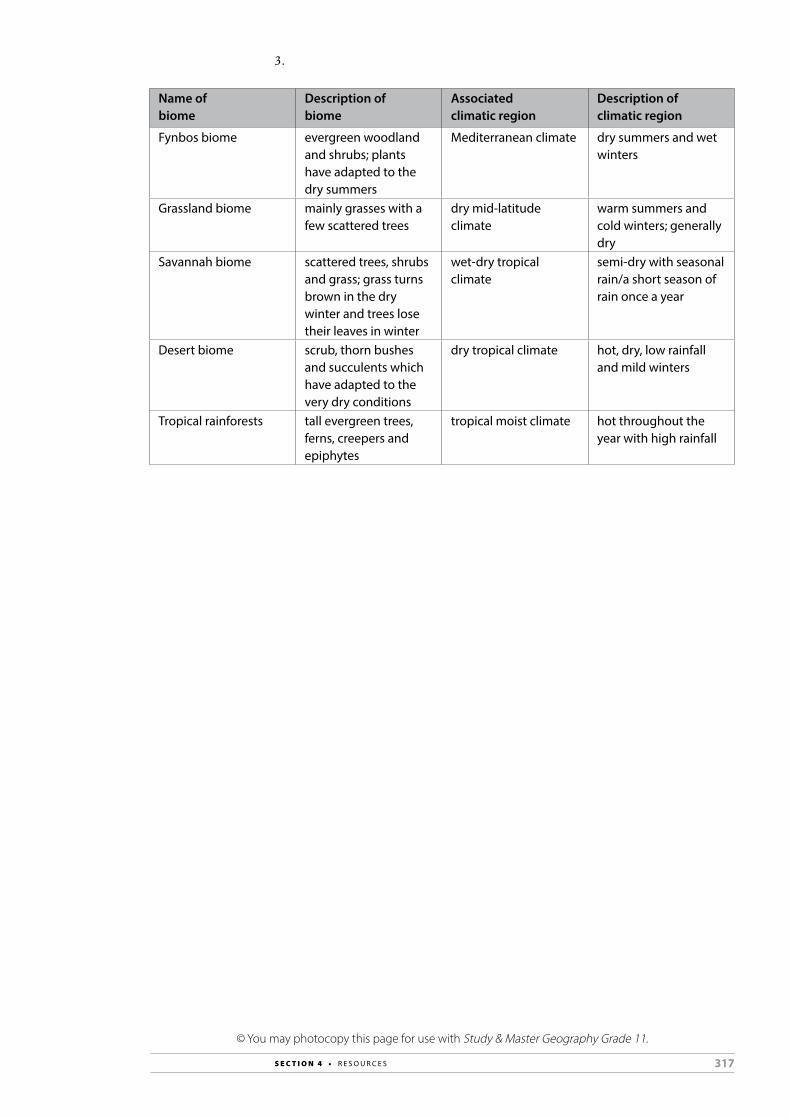
317S E C T I O N 4 • R E S O U R C E S
© You may photocopy this page for use with Study & Master Geography Grade 11.
3.
Name of biome
Description of biome
Associated climatic region
Description of climatic region
Fynbos biome evergreen woodland and shrubs; plants have adapted to the dry summers
Mediterranean climate dry summers and wet winters
Grassland biome mainly grasses with a few scattered trees
dry mid-latitude climate
warm summers and cold winters; generally dry
Savannah biome scattered trees, shrubs and grass; grass turns brown in the dry winter and trees lose their leaves in winter
wet-dry tropical climate
semi-dry with seasonal rain/a short season of rain once a year
Desert biome scrub, thorn bushes and succulents which have adapted to the very dry conditions
dry tropical climate hot, dry, low rainfall and mild winters
Tropical rainforests tall evergreen trees, ferns, creepers and epiphytes
tropical moist climate hot throughout the year with high rainfall
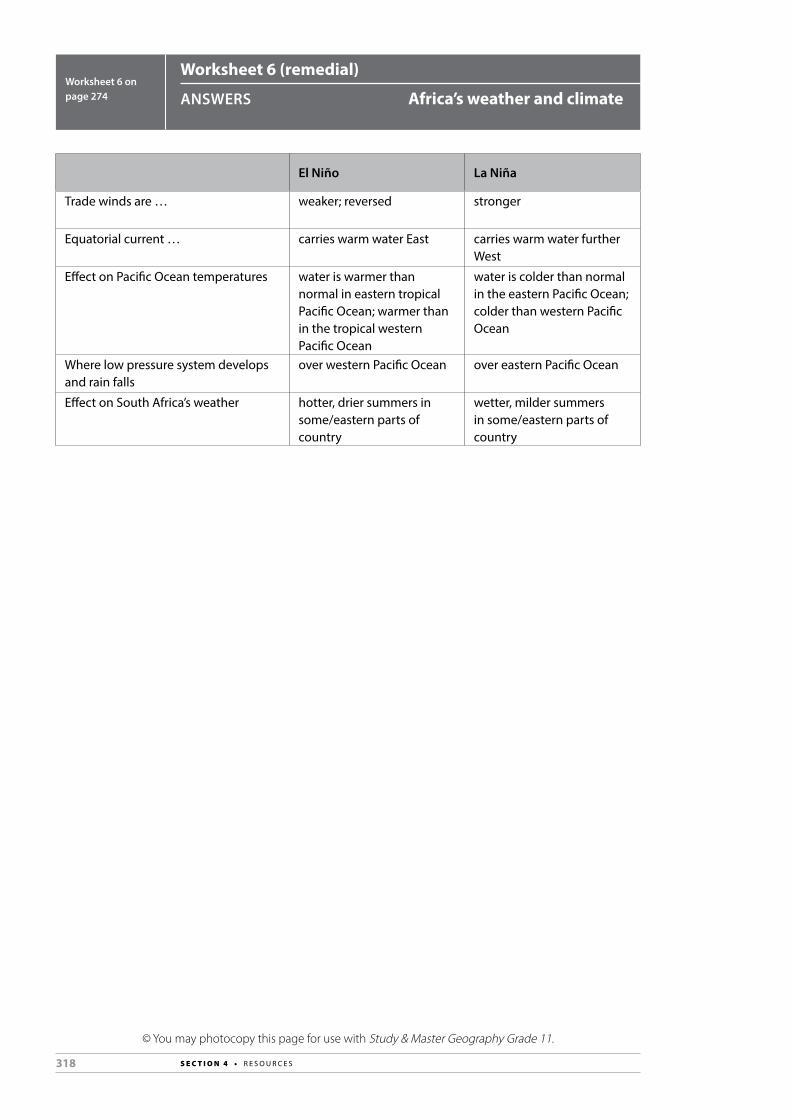
318 S E C T I O N 4 • R E S O U R C E S
© You may photocopy this page for use with Study & Master Geography Grade 11.
Worksheet 6 (remedial)
ANSWERS Africa’s weather and climateWorksheet 6 on page 274
El Niño La Niña
Trade winds are … weaker; reversed stronger
Equatorial current … carries warm water East carries warm water further West
Effect on Pacific Ocean temperatures water is warmer than normal in eastern tropical Pacific Ocean; warmer than in the tropical western Pacific Ocean
water is colder than normal in the eastern Pacific Ocean; colder than western Pacific Ocean
Where low pressure system develops and rain falls
over western Pacific Ocean over eastern Pacific Ocean
Effect on South Africa’s weather hotter, drier summers in some/eastern parts of country
wetter, milder summers in some/eastern parts of country
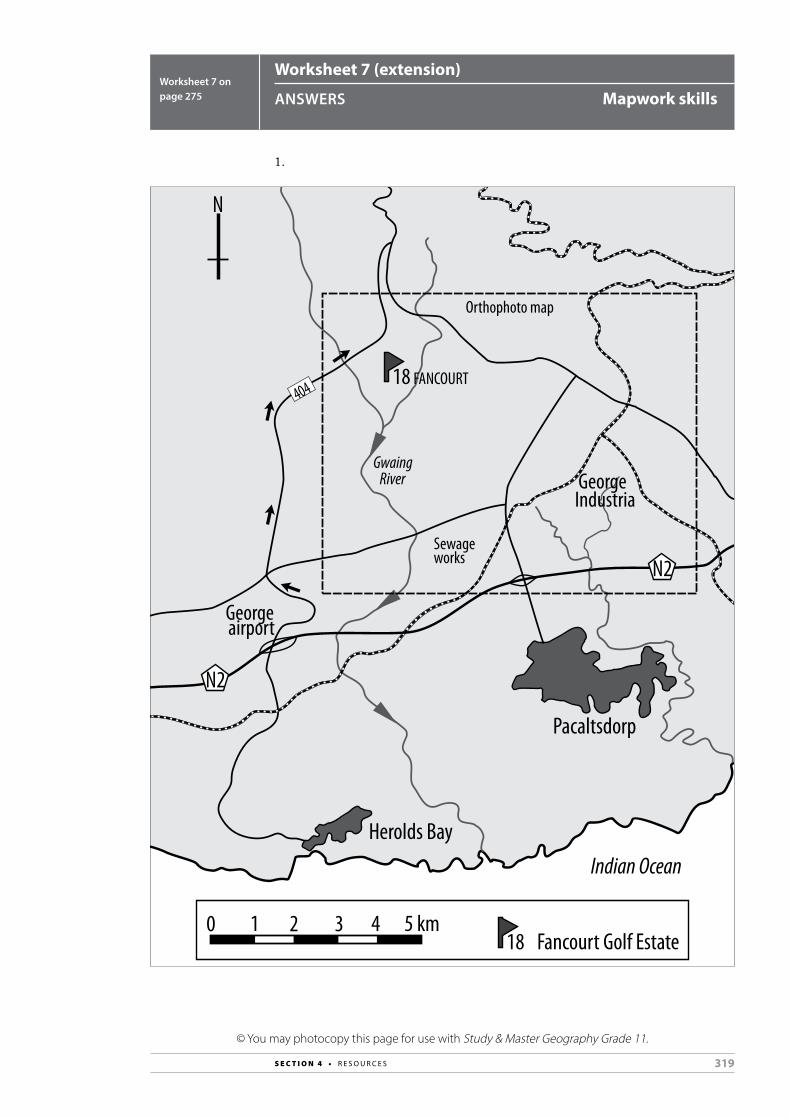
319S E C T I O N 4 • R E S O U R C E S
© You may photocopy this page for use with Study & Master Geography Grade 11.
Worksheet 7 (extension)
ANSWERS Mapwork skillsWorksheet 7 on page 275
1.
Pacaltsdorp
Herolds BayIndian Ocean
18
0 1 2 3 4 5 km18 Fancourt Golf Estate
N
George airport
George
N2
N2
FANCOURT404
Orthophoto map
Sewageworks
Industria
GwaingRiver
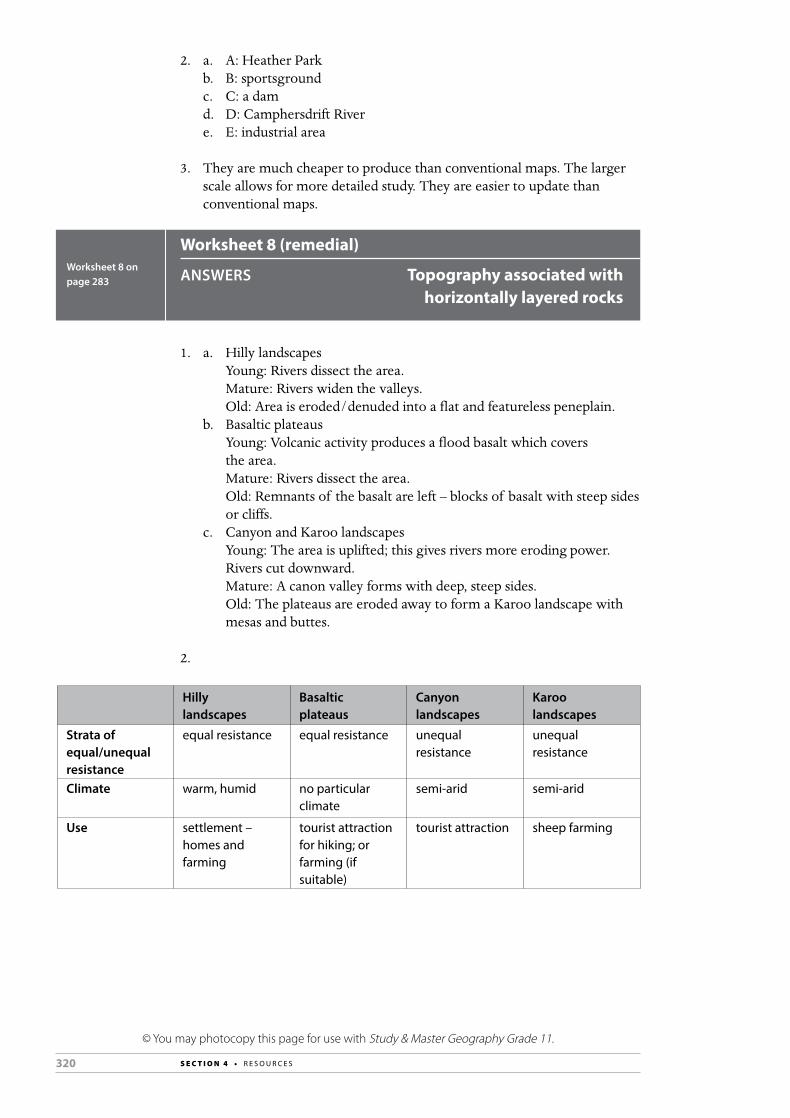
320 S E C T I O N 4 • R E S O U R C E S
© You may photocopy this page for use with Study & Master Geography Grade 11.
2. a. A: Heather Parkb. B: sportsgroundc. C: a damd. D: Camphersdrift Rivere. E: industrial area
3. They are much cheaper to produce than conventional maps. The larger scale allows for more detailed study. They are easier to update than conventional maps.
Worksheet 8 (remedial)
ANSWERS Topography associated with horizontally layered rocks
Worksheet 8 on page 283
1. a. Hilly landscapes Young: Rivers dissect the area. Mature: Rivers widen the valleys. Old: Area is eroded/denuded into a flat and featureless peneplain.b. Basaltic plateaus Young: Volcanic activity produces a flood basalt which covers
the area. Mature: Rivers dissect the area. Old: Remnants of the basalt are left – blocks of basalt with steep sides
or cliffs.c. Canyon and Karoo landscapes Young: The area is uplifted; this gives rivers more eroding power.
Rivers cut downward. Mature: A canon valley forms with deep, steep sides. Old: The plateaus are eroded away to form a Karoo landscape with
mesas and buttes.
2.
Hilly landscapes
Basaltic plateaus
Canyon landscapes
Karoo landscapes
Strata of equal/unequal resistance
equal resistance equal resistance unequal resistance
unequal resistance
Climate warm, humid no particular climate
semi-arid semi-arid
Use settlement – homes and farming
tourist attraction for hiking; or farming (if suitable)
tourist attraction sheep farming

321S E C T I O N 4 • R E S O U R C E S
© You may photocopy this page for use with Study & Master Geography Grade 11.
Worksheet 9 (remedial)
ANSWERS Topography associated with inclined/tilted rock strata
Worksheet 9 on page 285
1. 1 = folding; 2 = syncline; 3 = anticline; 4 = dip slope; 5 = scarp slope; 6 = resistant rock; 7 = less resistant rock; 8 = faulting; 9 = thrust fault; 10 = normal fault
2. A = cuesta, e.g. MagaliesbergB = hogsback, e.g. Hogsback Mountain PeakC = homoclinal ridge, e.g. San Rafael Swell
3. a. 1 = cuesta basin; 2 = cuesta dome; 3 = scarp slope; 4 = dip slope;
5 = less resistant rock; 6 = resistant rockb. i. oldest; youngest ii. youngest; oldest
Worksheet 10 (remedial)
ANSWERS Topography associated with massive igneous rocks
Worksheet 10 on page 288
1. 1 = lopolith, e.g. Great Dyke of Zimbabwe, Bushveld Igneous Complex2 = dyke, e.g. Bannerman’s Pass3 = laccolith, e.g. Tierra del Fuego4 = sill, e.g. Howick Falls, Golden Valley5 = batholith, e.g. Sibebe Rock
2. A = tor; B = granite dome; 1 = joint; 2 = core stone
Worksheet 11 (extension)
ANSWERS GeomorphologyWorksheet 11 on page 290
2. a. In 1657, while Abraham Gabemma was searching for additional meat
resources for the new Dutch settlement at the Cape of Good Hope, he saw a giant granite rock glistening in the Sun after a rain storm and named it ‘de Diamondt en de Peerlberg’ (Diamond and Pearl Mountain). The ‘diamonds’ soon disappeared from the name and it became simply known as Paarl Mountain or Paarl Rock.
b. 548 million years agoc. batholithd. Magma solidified within the Earth’s crust and was later exposed on the
surface of the Earth as the overlying layers were eroded away resulting in a batholith.
e. feldspar – white; mica – black; quartz – pink or white crystalsf. The slower the rate of cooling the larger the quartz crystal.
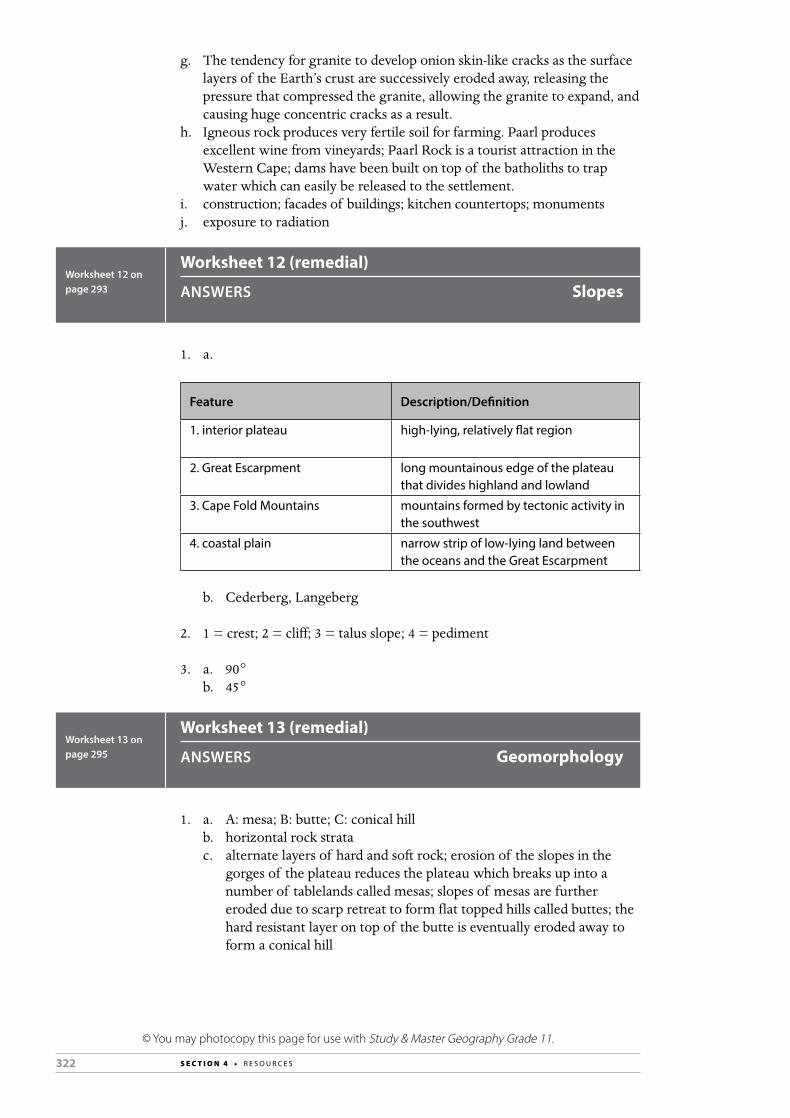
322 S E C T I O N 4 • R E S O U R C E S
© You may photocopy this page for use with Study & Master Geography Grade 11.
g. The tendency for granite to develop onion skin-like cracks as the surface layers of the Earth’s crust are successively eroded away, releasing the pressure that compressed the granite, allowing the granite to expand, and causing huge concentric cracks as a result.
h. Igneous rock produces very fertile soil for farming. Paarl produces excellent wine from vineyards; Paarl Rock is a tourist attraction in the Western Cape; dams have been built on top of the batholiths to trap water which can easily be released to the settlement.
i. construction; facades of buildings; kitchen countertops; monumentsj. exposure to radiation
Worksheet 12 (remedial)
ANSWERS SlopesWorksheet 12 on page 293
1. a.
Feature Description/Definition
1. interior plateau high-lying, relatively flat region
2. Great Escarpment long mountainous edge of the plateau that divides highland and lowland
3. Cape Fold Mountains mountains formed by tectonic activity in the southwest
4. coastal plain narrow strip of low-lying land between the oceans and the Great Escarpment
b. Cederberg, Langeberg
2. 1 = crest; 2 = cliff; 3 = talus slope; 4 = pediment
3. a. 90°b. 45°
Worksheet 13 (remedial)
ANSWERS GeomorphologyWorksheet 13 on page 295
1. a. A: mesa; B: butte; C: conical hillb. horizontal rock stratac. alternate layers of hard and soft rock; erosion of the slopes in the
gorges of the plateau reduces the plateau which breaks up into a number of tablelands called mesas; slopes of mesas are further eroded due to scarp retreat to form flat topped hills called buttes; the hard resistant layer on top of the butte is eventually eroded away to form a conical hill

323S E C T I O N 4 • R E S O U R C E S
© You may photocopy this page for use with Study & Master Geography Grade 11.
d.
1
2
3
4
e. Crest: convex in shape; area of soil creep Cliff: almost vertical angle 80°; usually hard resistant layer; no debris can
collect on this slope Talus: angle of repose 35°; debris collects on this slope Pediment: concave in shape; this slope merges with the valley floorf. D: cuesta/homoclinal ridge; E: homoclinal ridgeg. inclined rock stratah. When horizontal layers of rock are tilted due to crustal activities such
as folding and faulting, the layers are pushed up at an angle due to compressional forces.
i. F: dip slope; G: scarp slope. A dip slope is a gentle slope and is parallel to the hard resistant rock, whereas the scarp slope is a steeper slope and is perpendicular to the hard resistant rock.
j. J: laccolith. Formed when magma wells up into the Earth’s crust and solidifies. The mushroom-shape is a result of the overlying rock being forced up before solidification.
2. a tor• Magma welled up beneath the Earth’s surface and solidified to form
massive batholiths, shown in diagram A.• Over millions of years the overlying layers of Earth were eroded
away to expose the top of the batholiths, now known as a monolith as shown in diagram B.
• Over time, the cracks and joints in the monolith create corestones which are rounded, and the landform is called a tor as in diagram C.
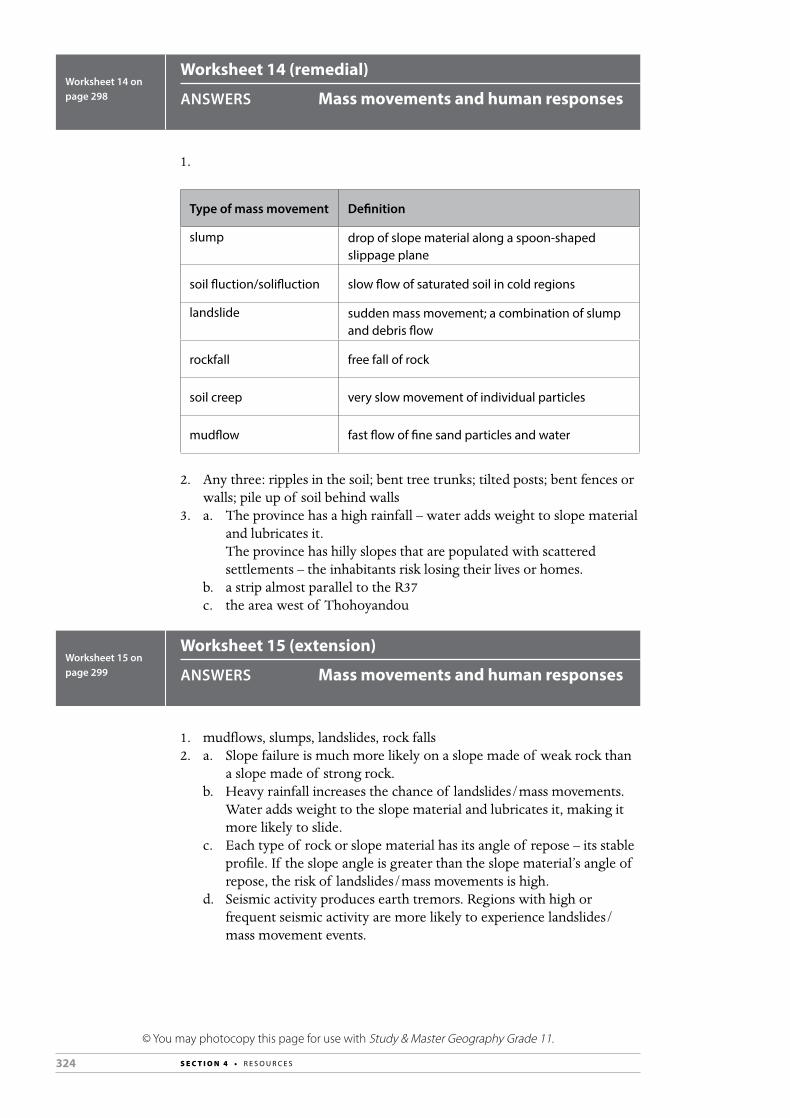
324 S E C T I O N 4 • R E S O U R C E S
© You may photocopy this page for use with Study & Master Geography Grade 11.
Worksheet 14 (remedial)
ANSWERS Mass movements and human responsesWorksheet 14 on page 298
1.
Type of mass movement Definition
slump drop of slope material along a spoon-shaped slippage plane
soil fluction/solifluction slow flow of saturated soil in cold regions
landslide sudden mass movement; a combination of slump and debris flow
rockfall free fall of rock
soil creep very slow movement of individual particles
mudflow fast flow of fine sand particles and water
2. Any three: ripples in the soil; bent tree trunks; tilted posts; bent fences or walls; pile up of soil behind walls
3. a. The province has a high rainfall – water adds weight to slope material and lubricates it.
The province has hilly slopes that are populated with scattered settlements – the inhabitants risk losing their lives or homes.
b. a strip almost parallel to the R37c. the area west of Thohoyandou
Worksheet 15 (extension)
ANSWERS Mass movements and human responsesWorksheet 15 on page 299
1. mudflows, slumps, landslides, rock falls2. a. Slope failure is much more likely on a slope made of weak rock than
a slope made of strong rock.b. Heavy rainfall increases the chance of landslides/mass movements.
Water adds weight to the slope material and lubricates it, making it more likely to slide.
c. Each type of rock or slope material has its angle of repose – its stable profile. If the slope angle is greater than the slope material’s angle of repose, the risk of landslides/mass movements is high.
d. Seismic activity produces earth tremors. Regions with high or frequent seismic activity are more likely to experience landslides/mass movement events.

325S E C T I O N 4 • R E S O U R C E S
© You may photocopy this page for use with Study & Master Geography Grade 11.
3. a. Town planners can use the information to prevent development taking place on or below unstable slopes. They can also use the information to introduce regulations and safety measures for building and construction.
b. Civil engineers build roads and dams. They can use the information to identify the most stable slopes for construction. They can also use the information to work out appropriate methods of slope reinforcement.
4. a. Falling/fallen debris is dangerous for motorists. Fallen debris can block roads.
b. Construction of roads can oversteepen slopes or partly strip slopes of vegetation which holds soil and regolith in place.
Worksheet 16 (remedial)
ANSWERS Geographical Information SystemsWorksheet 16 on page 301
1. 1. H; 2. G; 3. J; 4. E; 5. F; 6. B; 7. A; 8. D; 9, C; 10. I
2. • Get a map of the area surrounding the school.• Collect data on the areas from which the learners come.• overlay of population density• overlay of transport routes• overlay of areas from which the school population comes from
Worksheet 17 (remedial)
ANSWERS Development geographyWorksheet 17 on page 303
1. a. development: a process of growing gradually, to become mature, advanced or organised
b. economically developed: progress in an economy, or the qualitative measure of this; the adoption of new technologies, transition from agriculture-based to industrial-based economy and general improvement in living standards
c. developing countries: nations with a low level of material well-beingd. sustainable development: a pattern of resource-use that aims to meet
human basic needs while preserving the environment so that these needs can be met not only in the present but also for generations to come
2. a. More developed countries usually have a well-developed infrastructure, while less developed countries often have a poorly developed infrastructure.
b. More developed countries usually have a low death rate, while less developed countries usually have a high death rate.
326 S E C T I O N 4 • R E S O U R C E S
© You may photocopy this page for use with Study & Master Geography Grade 11.
c. More developed countries have a high rate of literacy, while less developed countries have a low rate of literacy.
3. For example: availablilty of resources – water, minerals; accessibility to medical care and education; food security; infrastructure; wars
4. The traditional society: little access to modern science, reliant on subsistence agriculture and traditional systems of management, which usually do not cope with population growth.The pre-conditions for take-off: countries begin to shift at a high political level; importance is placed on modernisation of the economy – the stimulus to change does not come from within a country but rather is external. It comes from outside interests and countries invading and destroying traditional society.Take-off: rapid economic growth, with new techniques in agriculture and industry.The drive to maturity: the economy of the country has developed to an extent that it can produce anything it chooses because it has the necessary technological and human capacity.The age of high mass consumption: the economies of most advanced countries where production is focused on the tertiary sector.
5. The core economic regions of South Africa reflect stages 4 and 5 of Rostow’s Model, while some rural areas in South Africa are still experiencing stages 1 and 2.
6. a. They decided to invest in centres identified as growth points and growth poles and planned to support development along certain development axes. They planned to develop poorer areas.
b. This contradicted the objectives of apartheid which focused on separate and limited development for black people.
7. Basic Needs Approach: all people have the right to basic needs such as shelter, water, sanitation and education.
Reconstruction and Development Programme: implemented in 1994 to address the problems of inequality and poverty in almost all aspects of life and society in South Africa. It followed the basic needs philosophy and focused on job creation, land reform, shelter and housing, clean drinking water, telecommunication, eradication of malnutrition and hunger, and improved health care.
8. The GDI uses three measures to evaluate gender inequalities between men and women – life expectancy, education and income.
9. Examples: in some parts of the world girls are not given equal access to education or girls are married at a young age; many women lack access to primary health care for childbirth and pregnancy; gender discrimination in food distribution leads to malnutrition among many women; in many countries, women cannot secure access to land; sometimes women are not consulted even in the lowest level of decision-making; most heads of state are male
10. Example: Yes. In many rural areas in South Africa, women have to stay home and look after the children and are subservient because of traditions and customs; while there has been a significant change in terms of more females in the workforce, women still make up the majority of the lowest paid workers. There are more male than female CEOs.

327S E C T I O N 4 • R E S O U R C E S
© You may photocopy this page for use with Study & Master Geography Grade 11.
Worksheet 18 (extension)
ANSWERS GlobalisationWorksheet 18 on page 307
2. Globalisation is a system of interaction among countries of the world in order to develop the global economy. It refers to the integration of economics and societies all over the world. It involves, technological, political, economic and cultural changes made possible largely by advances in communication, transportation and infrastructure development.
3. The advantages and disadvantages of globalisation.4. The anti-globalisation movement bases its criticism on a number of
related ideas:• They are opposed to large multinational corporations having
unregulated political power through trade agreements and unregulated financial markets.
• They accuse corporations of seeking maximum profit at the expense of work safety conditions and standard, labour hiring and environmental and conservation principles.
• They call for forms of global integration that better provide for democratic representation, human rights, fair trade and sustainable development.
• They believe that globalisation is characterised by a ‘ruling elite’ who seek to harness the expansion of world markets for their own interests.
• They believe that corporations exercise privileges that human citizens cannot, such as moving freely across borders, extracting desired natural resources and utilising a diversity of human resources.
• Rich countries with legal obligations to reduce greenhouse gas emissions have incentives to outsource their production to developing nations.
• Many industrial and financial corporations become larger entities than the developing countries with which they are involved.
• Whilst booming corporations become rich, global poverty remains and even grows.
• India has had success as a participant in the globalised economy, yet it still has over a third of the world’s poverty.
• Whereas Internet technology has revolutionised our capacity for knowledge and interaction, large numbers of people in South Asia and Africa have no electricity, let alone computers.
• Whereas the global supply chain of our supermarket culture deliver exotic year-round affordable foods, over 900 million people in the developing world experience hunger.
• Those who describe our world as a global village in which we can understand and support each other in our increasingly common lifestyles, overlook the exclusion of many countries from the opportunities of globalisation.
Source: adapted from: uk.oneworld.net/guides/globalization
328 S E C T I O N 4 • R E S O U R C E S
© You may photocopy this page for use with Study & Master Geography Grade 11.
Worksheet 19 (remedial)
ANSWERS Resources and sustainabilityWorksheet 19 on page 308
1. a. natural resources: these are physical resources, e.g. water, mineralsb. human resources: education or any human skill, e.g. teachingc. renewable resources: resources that can be replenished or renewed by
natural processesd. non-renewable resources: can only be used once; they need a geological
period to develop2. water, soil, vegetation, animals and fish3. uneven distribution and poor quality of natural resources; soils are not
fertile enough to support communities; droughts and floods impact on land quality; resource mismanagement; ownership of land is an issue in Africa.
4. diamonds, gold, platinum and copper5. income from minerals contributes to the GDP; the development of
link industries contributes to the local community; the development of infrastructure improves, e.g. roads and railways; provides employment; major export market for African countries which brings in foreign trade and investment
6. A large number of minerals are exported in unprocessed form. So African countries need to look at developing their manufacturing industries so that the processing of these minerals makes them more valuable. This will also provide more jobs and skills. Many countries in Africa experience political conflict, corruption and instability, which have an adverse effect on mining. Countries should try to resolve these conflicts.
7. a. resource conservation: this is the sustained and responsible use of resources.
b. resource preservation: this is the protection of a natural area from all use8. These are parks that span across international boundaries and allow the
natural migration of wildlife to take place.9. There is conflict between authorities and people who may have claim to
the land but were forced off due to apartheid. Poor communities in the area often have no choice but to use the natural resources in the park, e.g. firewood. This results in conflict between conservationists and hunters.
10. Everything in nature is related: a change in one thing will affect another. As populations increase, so the impact on our resources increases. Everybody does not have the same cultural, ethical and moral view on management of resources.
Worksheet 20 (extension)
ANSWERS Energy and sustainable developmentWorksheet 20 on page 311
2. The use of fossil fuels such as coal and oil as the most important sources of global energy, has a huge impact on global environments. The burning of fossil fuels results in greater levels of CO2, sulphur dioxide, nitrous oxide and methane in the atmosphere. Higher levels of these gases results in greater absorption of terrestrial radiation and therefore the Earth’s atmosphere becomes warmer. World temperatures have risen by 0,5% since the middle of the last century.

329S E C T I O N 4 • R E S O U R C E S
© You may photocopy this page for use with Study & Master Geography Grade 11.
The results of global warming are that the polar ice caps start to melt, sea levels and sea temperatures will rise which will affect marine life and the intensity and frequency of Tropical cyclones. Pollution from the burning of fossil fuels also causes acid rain, as water vapour condenses on hygroscopic nuclei (pollution in the atmosphere) which will increase the acidity in water masses, groundwater, death of trees and vegetation, and respiratory problems in humans.
The only way to curb these greenhouse gas emissions and climate change is to reduce the burning of fossil fuels and to find alternate sources of energy.
3. The Kyoto Protocol in 1997 required all signatories to reduce their greenhouse gas emissions and in this way reduce global warming. Countries were also committed to using energy more efficiently and investigating the use of renewable sources of energy. The Protocol requires countries to reduce their greenhouse gas emissions according to specific targets. The targets have to be met between 2008 and 2012. Developed countries have larger targets as they have historically contributed more to the greenhouse gas emissions and are more able to pay the costs involved in cutting emissions. Developed countries need to cut their emissions by 5% by 2012, while developing countries had no specific target. However, despite many countries signing the Protocol, many have not created legislation to control emissions.
4. • hydro-electricity: dependent on the supply of fast-flowing water, which is stored in a dam; the costs are high; once structures are in place there is a continued source of renewable energy; hydro-electricity now supplies 20% of the world’s energy; hydro-electricity is clean energy
• solar energy: solar energy from the Sun is harnessed by solar panels to generate electricity
• wind energy: wind generators called turbines can be up to 50 m tall with wind blades of 30 m in length; while wind is free, the cost of construction is high
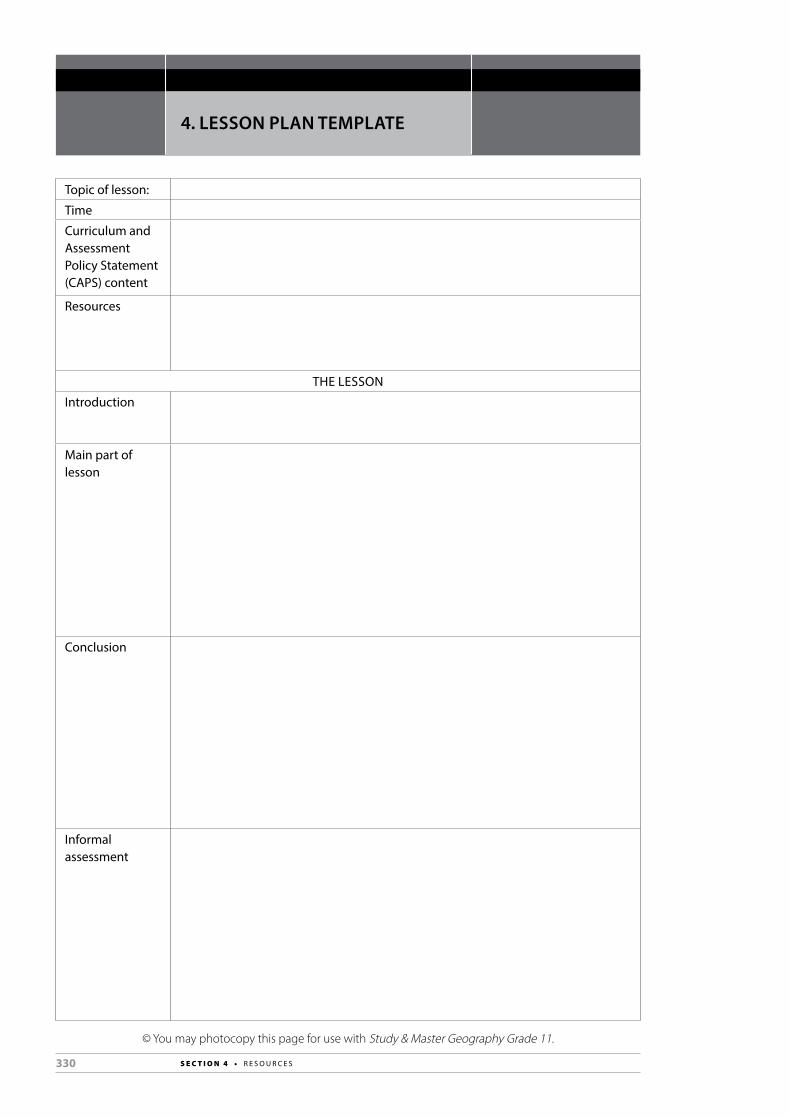
330 S E C T I O N 4 • R E S O U R C E S
© You may photocopy this page for use with Study & Master Geography Grade 11.
4. LESSON PLAN TEMPLATE
Topic of lesson:
Time
Curriculum and Assessment Policy Statement (CAPS) content
Resources
THE LESSON
Introduction
Main part of lesson
Conclusion
Informal assessment
331
This section can be used to file the Curriculum and Assessment Policy Statement (CAPS) for Geography (Grades 10–12) and any other documents supplied by the Department of Basic Education.
5. DOCUMENTS
Related Documents