Studies on the intra- and intermolecular distributions of substituents in commercial pectins Stéphanie Guillotin

Welcome message from author
This document is posted to help you gain knowledge. Please leave a comment to let me know what you think about it! Share it to your friends and learn new things together.
Transcript
Studies on the intra- and intermolecular
distributions of substituents in
commercial pectins
Stéphanie Guillotin
Promotor: prof. dr. ir. A.G.J. Voragen
Hoogleraar in de levensmiddelenchemie
Wageningen Universiteit
Co-promotor: dr. H.A. Schols
Universitair docent, leerstoelgroep levensmiddelenchemie
Wageningen Universiteit
Promotiecommissie: prof. dr. M.A. Cohen Stuart, Wageningen Universiteit
prof. dr. ir. A.J.J. Van Ooyen, Wageningen Universiteit
prof. dr. A-M. Hermansson, SIK, Göteborg, Sweden
dr. C.M.G.C. Renard, INRA, Rennes, France
Dit onderzoek is uitgevoerd binnen de onderzoekschool VLAG (Voeding, Levensmiddelen-
technologie, Agrobiotechnologie en Gezondheid)
Studies on the intra- and intermolecular
distributions of substituents in
commercial pectins
Stéphanie Guillotin
Proefschrift
ter verkrijging van de graad van doctor
op gezag van de rector magnificus
van Wageningen Universiteit,
prof. dr. M.J. Kropff,
in het openbaar te verdedigen
op maandag 12 september 2005
des namiddags te vier uur in de Aula
Guillotin, Stéphanie E.
Studies on the intra- and intermolecular distributions of substituents in commercial pectins
Ph.D. thesis Wageningen University, The Netherlands, 2005
with summaries in Dutch and in French
ISBN 90-8504-265-8
Je dédie cette thèse
à mon frère
et à mes parents

Abstract
Abstract
Guillotin, S.E. Studies on the intra- and intermolecular distributions of substituents in commercial
pectins
Ph.D. thesis Wageningen University, Wageningen, The Netherlands, 2005
Key Words Commerical pectins, intramolecular, intramolecular characterisation, degree of
methyl-esterification, amidation, substitution, distribution of methyl-esters, amide groups
Commercial pectins are mainly used for the gelling, thickening and stabilizing properties in
food products. The different physical properties of pectins strongly depend on the galacturonic
acid level and the level of methyl-esterification as well as on the molecular weight
distribution. However, the conventional chemical analysis of the pectins does not always
show differences between pectins while they behave differently. Two highly methyl-esterified
pectins with similar chemical characteristics but different reactivity towards calcium were
analysed. They were found to be a mixture of pectic populations differing in the degree of
methyl-esterification as well as in the distribution of these methyl-esters. The non-calcium
sensitive pectin was found to contain higher proportions of pectic populations with more
random distribution of the methyl-esters but populations with a blockwise distribution of the
methyl-esters were also present. These results confirm the heterogeneity of commercial pectin
preparations and illustrate the need to analyse pectins on the level of (sub)populations.
Amidated pectins with similar chemical features but different calcium sensitivity were also
analysed and were also found to be a mixture of different pectic populations. Methods were
adapted to determine the degree of amidation and the distribution of the amide groups over the
pectic backbone. The degree of substitution was different for some of the pectic populations
of the commercial amidated pectins. The populations with a similar total substitution showed
differences in the relative proportions of amide groups and methyl-esters as well as in the
distribution of these substituents. These differences in the characteristics of the pectic
populations are expected to influence the physical properties of the originating mixture as
discussed for some applications.

Contents
List of abbreviations Chapter 1 General introduction 1 Chapter 2 Rapid HPLC method to screen pectins for heterogeneity in methyl-
esterification 25 Chapter 3 Populations having different GalA blocks characteristics are present in
commercial pectins which are chemically similar but have different functionalities 41
Chapter 4 Determination of the degree of substitution, degree of amidation and
degree of blockiness of commercial pectins by using capillary electrophoresis 59
Chapter 5 Degree of blockiness of amide groups as indicator for differences
between amidated pectins 77 Chapter 6 Chromatographic and enzymatic strategies to reveal differences
between amidated pectins on molecular level 97 Chapter 7 Concluding remarks 115 Summary 133 Samenvatting 137 Résumé 141 Acknowledgements 145 Curriculum vitae 149 List of publications 151 Addendum 153 Overview of completed training activities 155

List of abbreviations
List of abbreviations
ADD: Acid Dairy Drinks
ASRS: ultra-Self-Regenerating Anion Suppressor
BS-ir: Block Sequence Interior and/or at the Reducing end
BS-nr: Block Sequence at the Non-Reducing end
CE: Capillary Electrophoresis
CSRS: ultra-Self-Regenerating Cation Suppressor
CV: Column Volume
DAm: Degree of Amidation
DB: Degree of Blockiness
DBabs: Degree of Blockiness absolute
DEAE: DiEthylAminoEthyl cellulose DM: Degree of Methyl-esterification
DP: Degree of Polymerisation
DS: Degree of Substitution
EM: Electrophoretic Mobility
Endo-PG: Endo-PolyGalacturonase
Exo-PG: Exo-PolyGalacturonase
FTIR: Fourier Transform Infra-Red
GalA: Galacturonic Acid
GalA-nr: free Galacturonic Acid at the Non-Reducing end
GalA-ir: free Galacturonic Acid Interior and/or at the Reducing end
GC: Gas Chromatography
HM: High Methyl-esterified
HPAEC: High Performance Anion Exchange Chromatography
HPLC: High Performance Liquid Chromatography
HPSEC: High Performance Size Exclusion Chromatography
IR: Infra-Red
LM: Low Methyl-esterified
LMA: Low Methyl-esterified Amidated
MALDI-TOF MS: Matrix Assisted Laser Desorption/Ionization Time-Of-Flight Mass Spectrometry
Mw: Molecular Weight
NMR: Nuclear Magnetic Resonance
NS: Neutral Sugar
PAD: Pulse Amperometric Detection
PME: Pectin Methyl-Esterase
PG: PolyGalacturonase
PGA: PolyGalacturonic acid
SAG: Standard Acid in Glass
(D)sap: (pectin D) saponified
(D2)s: (population D2) saponified
UV: Ultra-Violet
WAX: Weak Anion Exchanger

Chapter 1
Chapter 1
General introduction
1 1
Chapter 1
1. Localisation of pectins, structure
1.1. History
Pectin has been discovered in the 19th century by a french scientist named Braconnot
(Braconnot, 1825a; Braconnot, 1825b). He found this “acid” in so many plants that he studied
the molecule and emphasised on its gelling properties. He named it “pectic acid” which is the
translation of coagulum in latin. This molecule has several functional properties (e.g. gelling,
thickening, emulsifying) and is widely used nowadays in food industry and in pharmaceutical
products for its health effects.
1.2. Localisation
Pectins are present in almost all higher plants (Braconnot, 1825b) and in certain fresh water
algae (De Vries, 1983). Pectins are mainly present in the primary wall and in the middle
lamella of plant cells and they represent around 40% (dry matter basis) of the cell wall of
fruits and vegetables (Brett & Waldron, 1996). In citrus fruits, they are present in several
tissues at a cellular level (membranes, juice vesicules and core) in different quantities
depending on the fruit variety and maturity stage (May, 1990). Pectins have a lubricating and
cementing function. They are degraded during attack by plant pathogens and
oligogalacturonides (ca DP 10) function as elicitors in the host-pathogen interaction
(Albersheim et al., 1981).
1.3. Structure
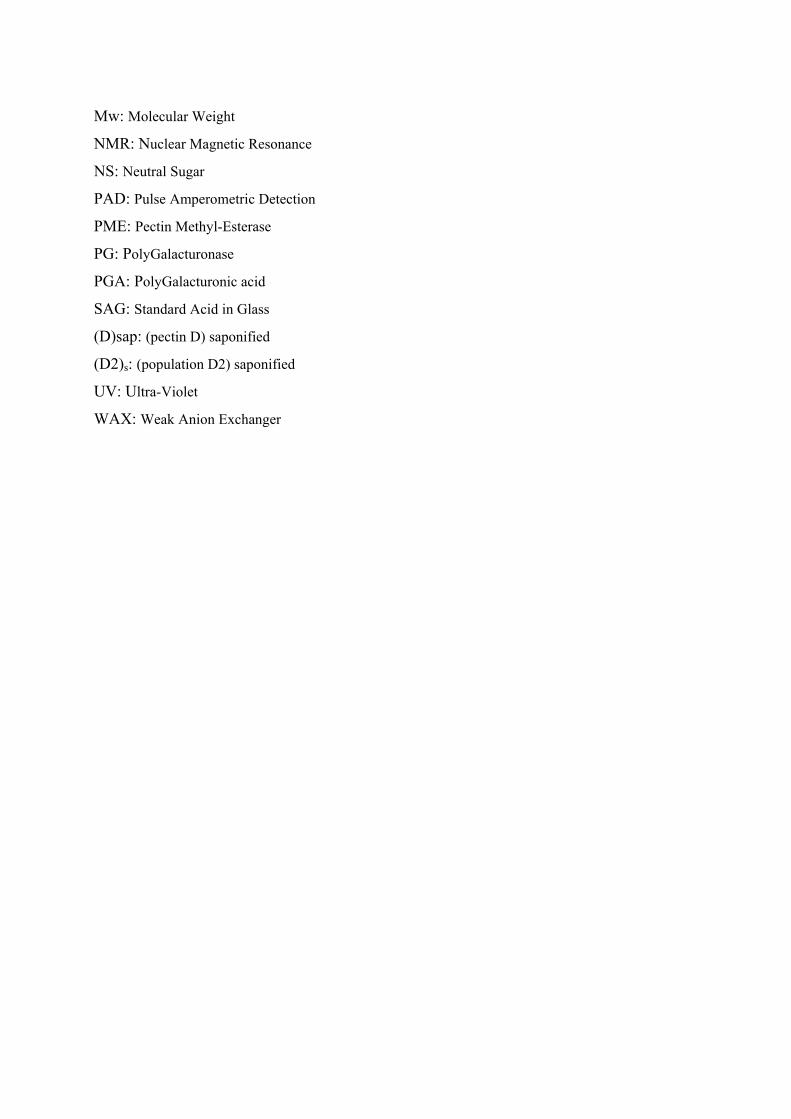
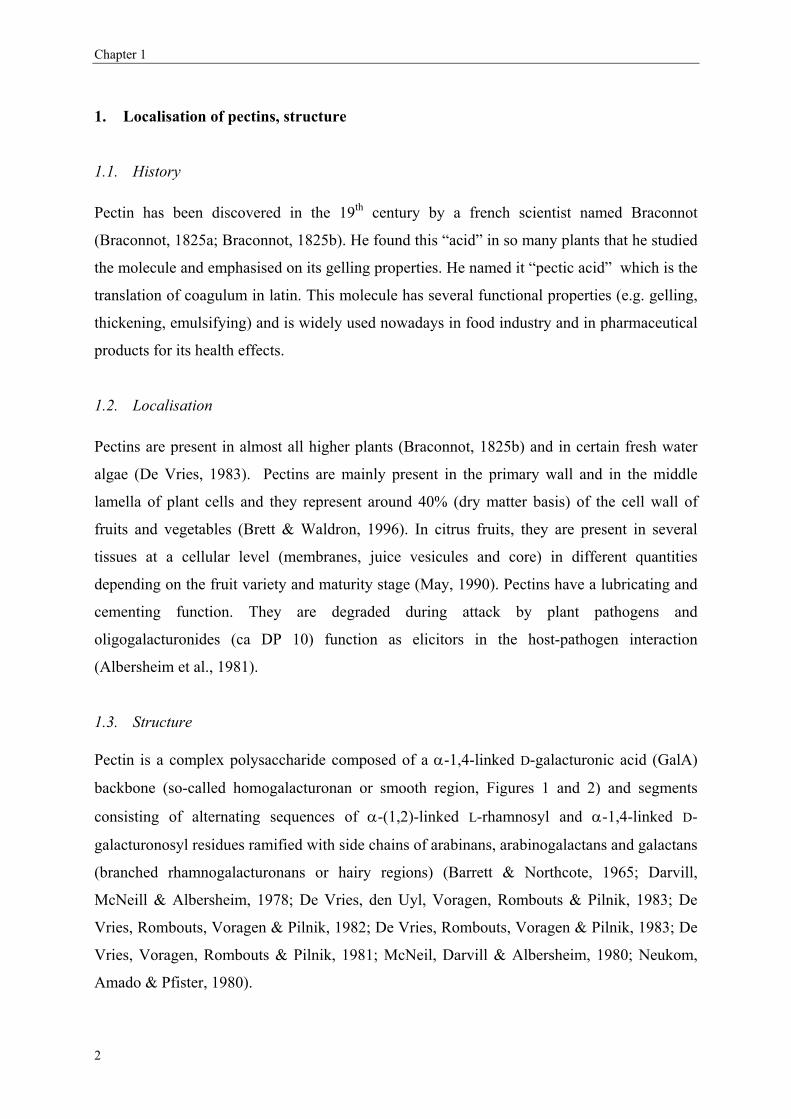
Pectin is a complex polysaccharide composed of a α-1,4-linked D-galacturonic acid (GalA)
backbone (so-called homogalacturonan or smooth region, Figures 1 and 2) and segments
consisting of alternating sequences of α-(1,2)-linked L-rhamnosyl and α-1,4-linked D-
galacturonosyl residues ramified with side chains of arabinans, arabinogalactans and galactans
(branched rhamnogalacturonans or hairy regions) (Barrett & Northcote, 1965; Darvill,
McNeill & Albersheim, 1978; De Vries, den Uyl, Voragen, Rombouts & Pilnik, 1983; De
Vries, Rombouts, Voragen & Pilnik, 1982; De Vries, Rombouts, Voragen & Pilnik, 1983; De
Vries, Voragen, Rombouts & Pilnik, 1981; McNeil, Darvill & Albersheim, 1980; Neukom,
Amado & Pfister, 1980).
2
General introduction
O
O
H
OH
OH
H
H
H
COOCH3
HO
O
H
OH
OH
H
H
H
COOCH3
HO
O
H
OH
OH
H
H
H
COOH
HO
O
H
OH
OH
H
H
H
COOCH3
HO
O
H
OH
OH
H
H
H
COOH
HO
O
H
OH
OH
H
H
H
COOH
HO
O
O
H
OH
OH
H
H
H
COOCH3
HO
O
H
OH
OH
H
H
H
COOCH3
HO
O
H
OH
OH
H
H
H
COOH
HO
O
H
OH
OH
H
H
H
COOCH3
HO
O
H
OH
OH
H
H
H
COOH
HO
O
H
OH
OH
H
H
H
COOH
HO
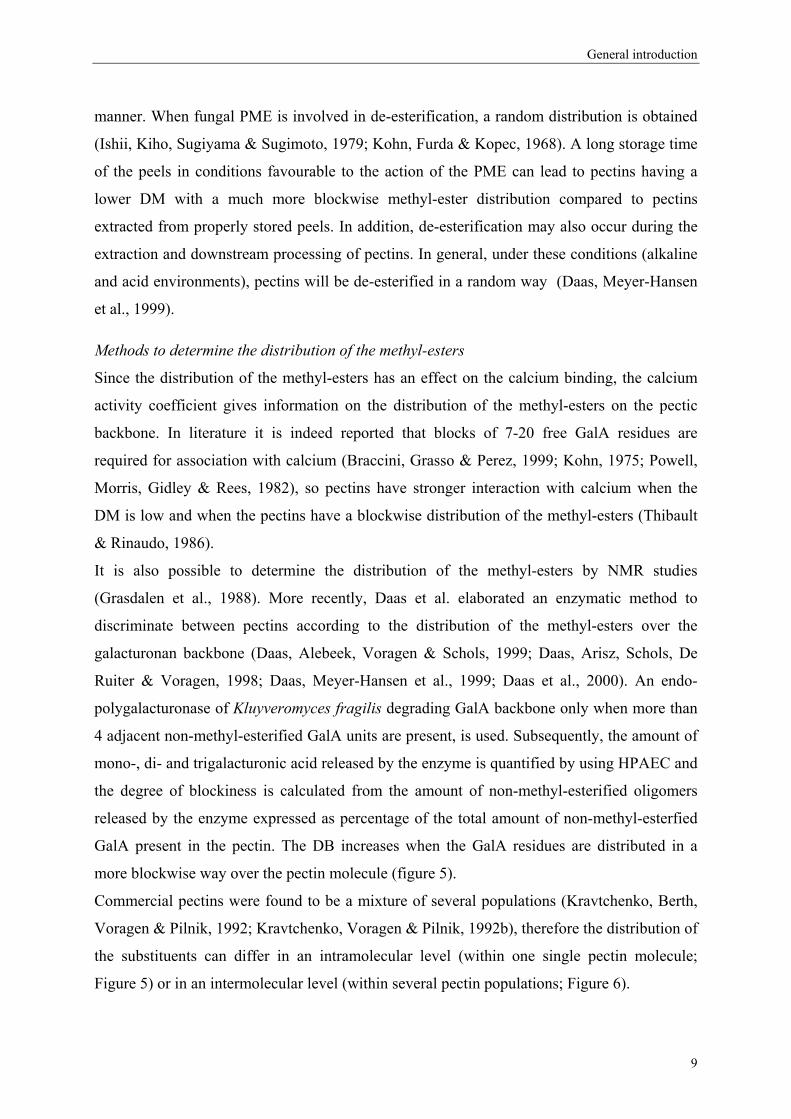
Figure 1: Homogalacturonan constituted of α-1,4-linked D-galacturonic acids.
Smooth Region Hairy Region(Homogalacturonan)
Smooth Region Hairy Region(Homogalacturonan)
Figure 2: Pectin structure (constituted of smooth regions and hairy regions).
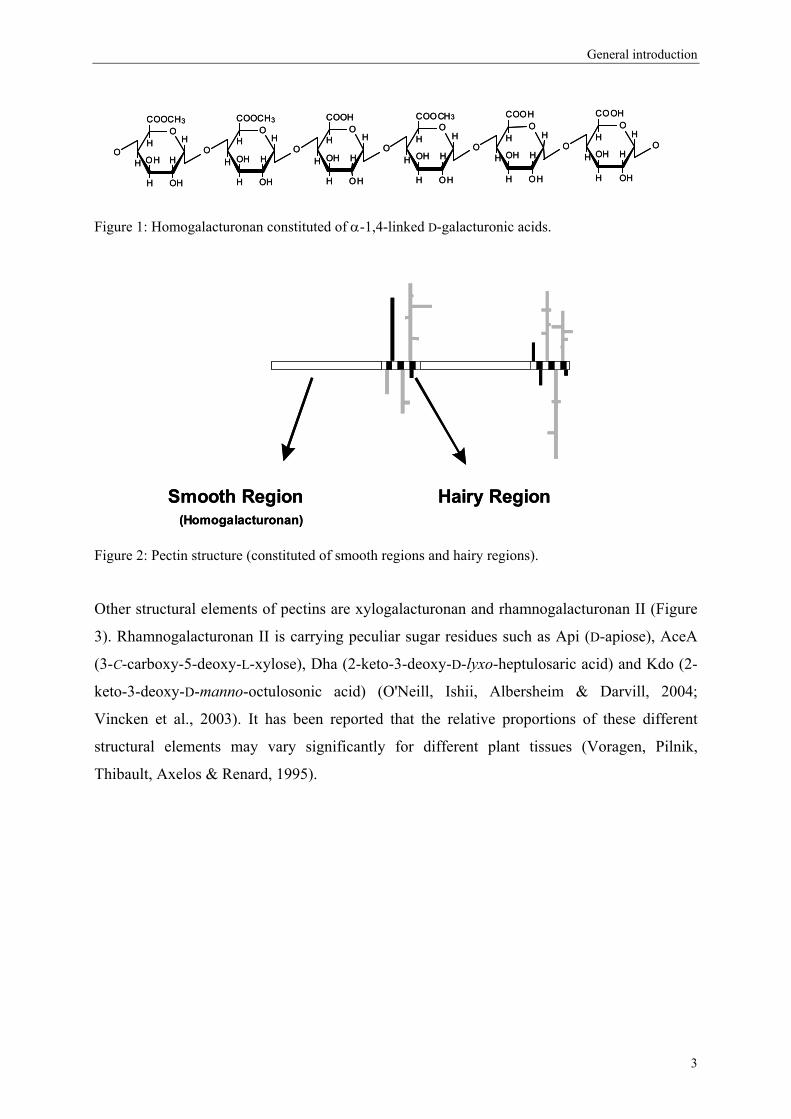
Other structural elements of pectins are xylogalacturonan and rhamnogalacturonan II (Figure
3). Rhamnogalacturonan II is carrying peculiar sugar residues such as Api (D-apiose), AceA
(3-C-carboxy-5-deoxy-L-xylose), Dha (2-keto-3-deoxy-D-lyxo-heptulosaric acid) and Kdo (2-
keto-3-deoxy-D-manno-octulosonic acid) (O'Neill, Ishii, Albersheim & Darvill, 2004;
Vincken et al., 2003). It has been reported that the relative proportions of these different
structural elements may vary significantly for different plant tissues (Voragen, Pilnik,
Thibault, Axelos & Renard, 1995).
3
Chapter 1
Figure 3: Different structural elements present in pectins (Vincken et al., 2003).
1.4. Commercial pectins
Pectins are used in food products for their thickening, gelling and stabilizing properties. As a
result of the acid extraction, commercial pectins are essentially constituted of
homogalacturonans and contain only small amounts of neutral sugars (Guillotin et al., 2005;
Kravtchenko, Voragen & Pilnik, 1992a). These homogalacturonans vary from one pectin to
another in function of their substituents: the GalA residues can be present as free carboxyl
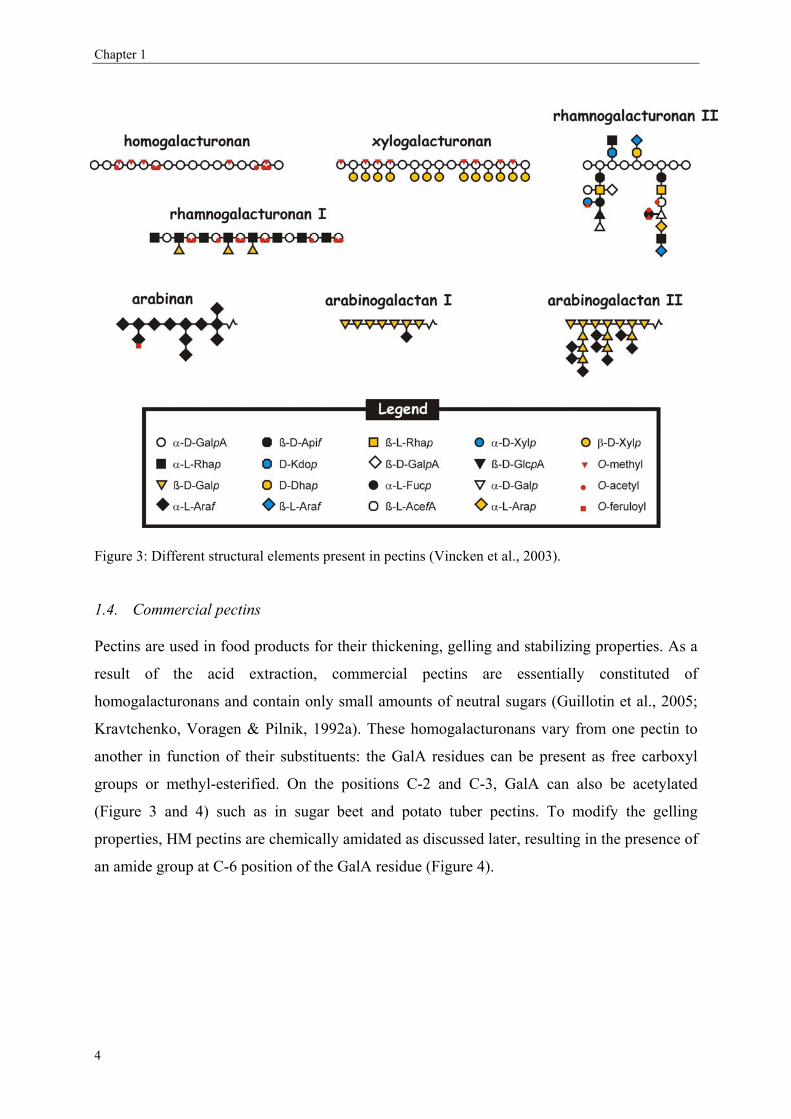
groups or methyl-esterified. On the positions C-2 and C-3, GalA can also be acetylated
(Figure 3 and 4) such as in sugar beet and potato tuber pectins. To modify the gelling
properties, HM pectins are chemically amidated as discussed later, resulting in the presence of
an amide group at C-6 position of the GalA residue (Figure 4).
4
General introduction
COOH
H
H
HOH
O
CONH2
H
H
HOH
OH
OH
H
HOH
OH
O
HO
H
HO
HO
HO
H
COOCH3
O
C
CH3
O
COOH
H
H
HOH
O
CONH2
H
H
HOH
OH
OH
H
HOH
OH
O
HO
H
HO
HO
HO
H
COOCH3
O
C
CH3
O
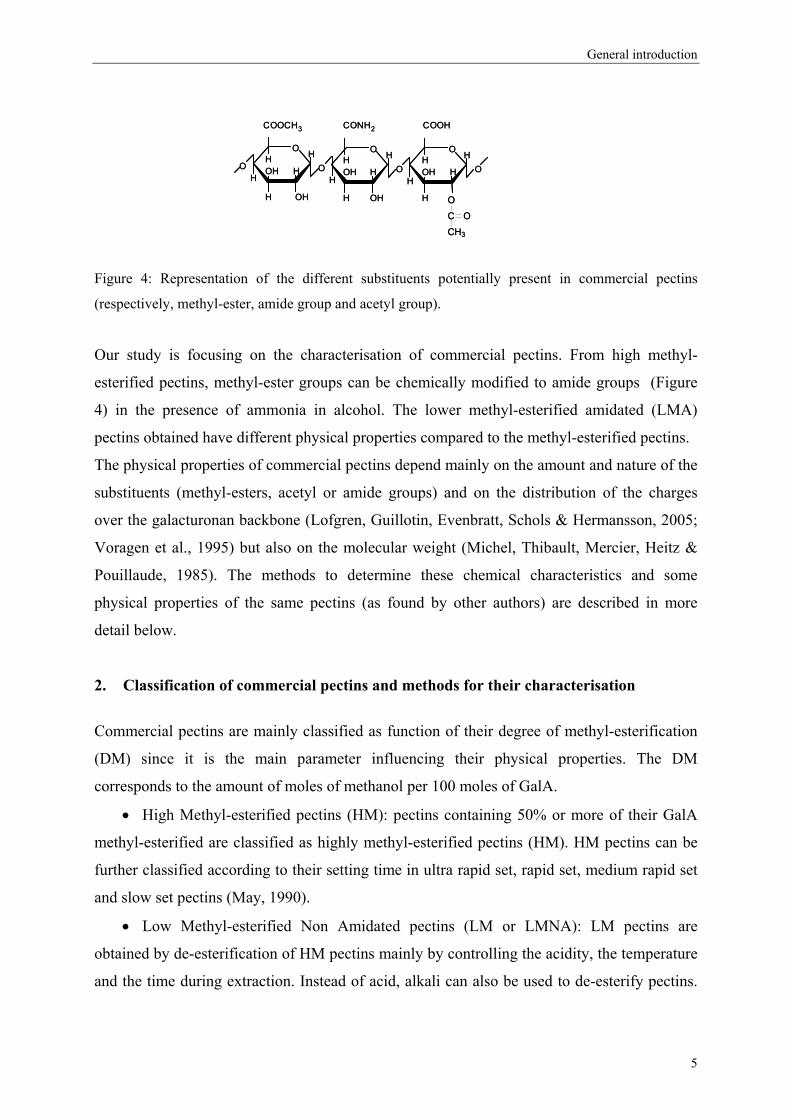
Figure 4: Representation of the different substituents potentially present in commercial pectins
(respectively, methyl-ester, amide group and acetyl group).
Our study is focusing on the characterisation of commercial pectins. From high methyl-
esterified pectins, methyl-ester groups can be chemically modified to amide groups (Figure
4) in the presence of ammonia in alcohol. The lower methyl-esterified amidated (LMA)
pectins obtained have different physical properties compared to the methyl-esterified pectins.
The physical properties of commercial pectins depend mainly on the amount and nature of the
substituents (methyl-esters, acetyl or amide groups) and on the distribution of the charges
over the galacturonan backbone (Lofgren, Guillotin, Evenbratt, Schols & Hermansson, 2005;
Voragen et al., 1995) but also on the molecular weight (Michel, Thibault, Mercier, Heitz &
Pouillaude, 1985). The methods to determine these chemical characteristics and some
physical properties of the same pectins (as found by other authors) are described in more
detail below.
2. Classification of commercial pectins and methods for their characterisation
Commercial pectins are mainly classified as function of their degree of methyl-esterification
(DM) since it is the main parameter influencing their physical properties. The DM
corresponds to the amount of moles of methanol per 100 moles of GalA.
•
•
High Methyl-esterified pectins (HM): pectins containing 50% or more of their GalA
methyl-esterified are classified as highly methyl-esterified pectins (HM). HM pectins can be
further classified according to their setting time in ultra rapid set, rapid set, medium rapid set
and slow set pectins (May, 1990).
Low Methyl-esterified Non Amidated pectins (LM or LMNA): LM pectins are
obtained by de-esterification of HM pectins mainly by controlling the acidity, the temperature
and the time during extraction. Instead of acid, alkali can also be used to de-esterify pectins.
5
Chapter 1
LM pectins obtained have less than 50% of the GalA residues methyl-esterified. The pectins
possess different gelling behavior compared to HM pectins as discussed later.
• Low Methyl-esterified Amidated pectins (LMA pectins): HM pectins are chemically
amidated to obtain LMA pectins with different physical properties compared to HM and LM
pectins.
A short overview will be given below, on methods available to characterize pectins in detail.
2.1. Uronic acid content
The GalA content on dry basis of commercial pectins should be higher than 65% according to
FAO, FCC and EU laws for food products and higher than 74% according to US
Pharmacopoeia (Rolin, 2002).
Methods to determine the GalA content:
A simple titration method can be used to quantify the amount of GalA in pectins but the
titration has to be corrected for the presence of substituents (methyl-esters, amide groups and
acetyl groups) (Voragen et al., 1995). The GalA content can also be determined with a
spectrophotometer after acid hydrolysis of pectic polymers and transformation of these
monomers in furfural like compounds giving specific colours after reaction with phenol
derivatives (Ahmed & Labavitch, 1977; Blumenkrantz & Asboe-Hansen, 1973; Thibault,
1979). Methyl-esters and acetyl groups have been found to interfere in the colour formation
and therefore it is recommended to saponify the samples prior to their analysis. The GalA
content can also be determined by HPLC after complete hydrolysis of the polymers with
methanolysis or sulphuric acid hydrolysis to the constituent monomeric sugars. The
monomers can then be quantified by using anion exchange chromatography (De Ruiter,
Schols, Voragen & Rombouts, 1992; Verhoef et al., 2002). Infra-Red (IR) spectrometry of
pectins can also be used for quantification of the GalA content (Bociek & Welti, 1975;
Monsoor, Kalapathy & Proctor, 2001).
2.2. Neutral sugar content
Commercial pectins contain low amounts of neutral sugar as a result of the acid extraction.
The neutral sugar (NS) content is around 5% and is constituted mainly of galactose, arabinose
and rhamnose (Christensen, 1986; Guillotin et al., 2005; Kravtchenko, Voragen et al., 1992a).
6
General introduction
Methods to determine the NS content:
The neutral sugar content of pectins can be determined after hydrolysis of the pectins in
concentrated sulphuric acid by using spectrophotometric detection after reaction with phenol
like reagents such as orcinol (Thibault & Robin, 1975). A more accurate method is the
determination of the NS content by gas chromatography after hydrolysis of the pectins and
reduction of the hydrolysed compounds into their corresponding alditol acetates (Englyst &
Cummings, 1984). NS can also be quantified by using HPAEC after methanolysis, sulphuric
acid or TFA hydrolysis of the samples (De Ruiter et al., 1992; Verhoef et al., 2002).
2.3. Degree of actetylation of pectins
The presence of acetyl groups results in poor gelling and thickening properties (Pippen,
McCready & Owens, 1950; Ralet, Crepeau, Buchholt & Thibault, 2003) but promotes the
emulsifying properties of pectins (Leroux, Langendorff, Schick, Vaishnav & Mazoyer, 2003).
So far, only pectins from sugar beet, olives and potato are reported to be acetylated (May,
1990; Vierhuis, Korver, Schols & Voragen).
Methods to determine the degree of acetylation
Acetyl groups of pectin can be released by alkaline saponification and the acetic acid released
in the medium is quantified by using HPLC with a resin based column (e.g Aminex HPX87H)
or a reversed phase (e.g. C18) column (Levigne, Thomas, Ralet, Quemener & Thibault, 2002;
Voragen, Schols & Pilnik, 1986a). The acetic acid released after saponification of the pectins
can also be quantified by using a commercial acetic acid enzymatic assay kit (Chen, Schols &
Voragen, 2004).
2.4. Degree of amidation
Determination of the degree of amidation of LMA pectins is important to better understand
their physical behavior. By international regulation only 25% of the GalA may be substituted
with amide groups in food products (Rolin & De Vries, 1990) therefore the level of amidation
is limited.
7
Chapter 1
Methods used to determine the degree of amidation:
To determine the DAm of LMA pectins, food industries are using the titration method (Food
Chemical Codex, 1981). The drawbacks of this method are that a high amount of sample is
needed and that it is rather time-consuming. IR spectrometry is also a nice tool to calculate the
DAm (Sinitsya, Copikova, Prutyanov, Skoblya & Machovie, 2000) but this method can
hardly be automated.
2.5. Degree of methyl-esterification
As discussed already above, the amount of methyl-esters over the pectic backbone is
important for the physical properties of pectins.
Methods used to determine the DM
The degree of methyl-esterification can be determined using several methods such as titration
(Food Chemical Codex, 1981), IR spectrometry (Gnanasambandam & Proctor, 2000; Haas &
Jager, 1986; Reintjes, Musco & Joseph, 1962), NMR spectrometry (Grasdalen, Bakoy &
Larsen, 1988). These methods are rather time consuming and can hardly be automated. Other
methods using HPLC (Chatjigakis et al., 1998; Levigne et al., 2002; Voragen, Schols &
Pilnik, 1986b) and GC-headspace (Huisman, Oosterveld & Schols, 2004; Walter, Sherman &
Lee, 1983) analysing the methanol content after saponification of the pectins have been
developed. A capillary electrophoresis method has been used a few years ago to determine the
DM of the polymers as such (Jiang, Liu, WU, Chang & Chang, 2005; Jiang, Wu, Chang &
Chang, 2001; Zhong, Williams, Goodall & Hansen, 1998; Zhong, Williams, Keenan, Goodall
& Rolin, 1997). An advantage of the CE method is that the GalA content of the samples is not
required to calculate the DM whereas the GalA values have to be known prior to the DM
analysis using GC headspace and HPLC methods.
2.6. Distribution of the non-methyl-esterified GalA
Knowledge about the distribution of the charges was shown to be important in understanding
the physical properties of pectins (Daas, Meyer-Hansen, Schols, De Ruiter & Voragen, 1999;
Daas, Voragen & Schols, 2000; Daas, Voragen & Schols, 2001; Lofgren et al., 2005;
Williams, Buffet, Foster & Norton, 2001). Citrus peels used for the extraction of pectins may
contain pectin methyl-esterases (PME) which are known to de-esterify pectins in a blockwise
8
General introduction
manner. When fungal PME is involved in de-esterification, a random distribution is obtained
(Ishii, Kiho, Sugiyama & Sugimoto, 1979; Kohn, Furda & Kopec, 1968). A long storage time
of the peels in conditions favourable to the action of the PME can lead to pectins having a
lower DM with a much more blockwise methyl-ester distribution compared to pectins
extracted from properly stored peels. In addition, de-esterification may also occur during the
extraction and downstream processing of pectins. In general, under these conditions (alkaline
and acid environments), pectins will be de-esterified in a random way (Daas, Meyer-Hansen
et al., 1999).
Methods to determine the distribution of the methyl-esters
Since the distribution of the methyl-esters has an effect on the calcium binding, the calcium
activity coefficient gives information on the distribution of the methyl-esters on the pectic
backbone. In literature it is indeed reported that blocks of 7-20 free GalA residues are
required for association with calcium (Braccini, Grasso & Perez, 1999; Kohn, 1975; Powell,
Morris, Gidley & Rees, 1982), so pectins have stronger interaction with calcium when the
DM is low and when the pectins have a blockwise distribution of the methyl-esters (Thibault
& Rinaudo, 1986).
It is also possible to determine the distribution of the methyl-esters by NMR studies
(Grasdalen et al., 1988). More recently, Daas et al. elaborated an enzymatic method to
discriminate between pectins according to the distribution of the methyl-esters over the
galacturonan backbone (Daas, Alebeek, Voragen & Schols, 1999; Daas, Arisz, Schols, De
Ruiter & Voragen, 1998; Daas, Meyer-Hansen et al., 1999; Daas et al., 2000). An endo-
polygalacturonase of Kluyveromyces fragilis degrading GalA backbone only when more than
4 adjacent non-methyl-esterified GalA units are present, is used. Subsequently, the amount of
mono-, di- and trigalacturonic acid released by the enzyme is quantified by using HPAEC and
the degree of blockiness is calculated from the amount of non-methyl-esterified oligomers
released by the enzyme expressed as percentage of the total amount of non-methyl-esterfied
GalA present in the pectin. The DB increases when the GalA residues are distributed in a
more blockwise way over the pectin molecule (figure 5).
Commercial pectins were found to be a mixture of several populations (Kravtchenko, Berth,
Voragen & Pilnik, 1992; Kravtchenko, Voragen & Pilnik, 1992b), therefore the distribution of
the substituents can differ in an intramolecular level (within one single pectin molecule;
Figure 5) or in an intermolecular level (within several pectin populations; Figure 6).
9
Chapter 1
free GalA
methyl-esterified GalA
free GalA
methyl-esterified GalA
A
B
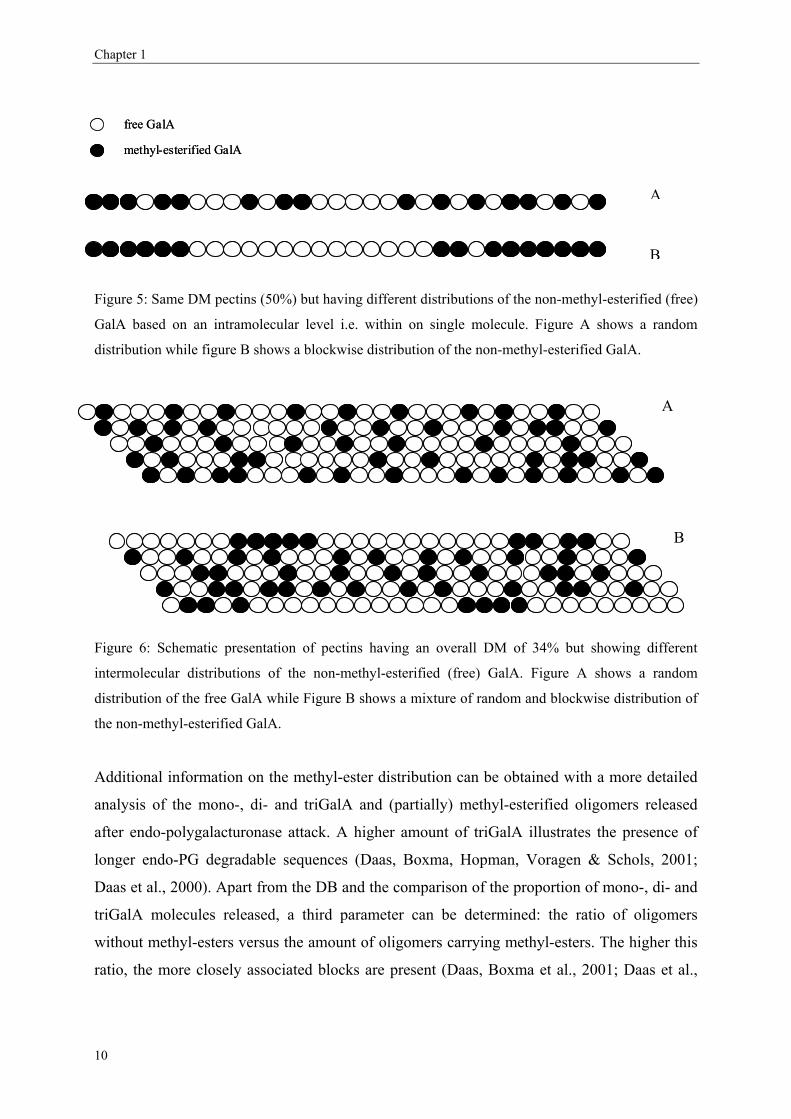
Figure 5: Same DM pectins (50%) but having different distributions of the non-methyl-esterified (free)
GalA based on an intramolecular level i.e. within on single molecule. Figure A shows a random
distribution while figure B shows a blockwise distribution of the non-methyl-esterified GalA.
A
B
Figure 6: Schematic presentation of pectins having an overall DM of 34% but showing different
intermolecular distributions of the non-methyl-esterified (free) GalA. Figure A shows a random
distribution of the free GalA while Figure B shows a mixture of random and blockwise distribution of
the non-methyl-esterified GalA.
Additional information on the methyl-ester distribution can be obtained with a more detailed
analysis of the mono-, di- and triGalA and (partially) methyl-esterified oligomers released
after endo-polygalacturonase attack. A higher amount of triGalA illustrates the presence of
longer endo-PG degradable sequences (Daas, Boxma, Hopman, Voragen & Schols, 2001;
Daas et al., 2000). Apart from the DB and the comparison of the proportion of mono-, di- and
triGalA molecules released, a third parameter can be determined: the ratio of oligomers
without methyl-esters versus the amount of oligomers carrying methyl-esters. The higher this
ratio, the more closely associated blocks are present (Daas, Boxma et al., 2001; Daas et al.,
10
General introduction
2000). This ratio thus provides more information on the distribution of non-methyl-esterified
blocks.
The distribution of the substituents of LMA pectins is more complex to study compared to
methyl-esterified pectins as a result of their substitution with both amide groups and methyl-
esters. Controversial results have been found for the distribution of amide groups since some
authors suggested a blockwise distribution of the amide groups (Racape, Thibault, Reitsma &
Pilnik, 1989; Racape, Thibault, Reitsma & Pilnik, 1987) (with calcium activity coefficients
studies) while others found a random distribution of these groups (enzymatic studies and ion
exchange separation) (Anger & Dongowski, 1988; Voragen, Schols, Clement & Pilnik, 1984).
This controversy may also be due to differences in the method used to study the distribution
of the substituents or even in the preparation of the amidated samples studied.
2.7. Molecular weight
The physical properties of pectins strongly depend on the molecular weight. Higher molecular
weights of the pectins lead to a stronger gel (Christensen, 1954; Owens, Svenson & Schultz,
1933; Van Deventer-Schriemer & Pilnik, 1987). In the case of oil-water emulsions, it has
been reported that the surface tension is reduced when the degree of polymerization is
decreased, probably due to a faster kinetic of these low molecular weight molecules to the
interface (Leroux et al., 2003).
Methods to determine the molecular weight:
The molecular weight (Mw) of pectins is difficult to determine and is the source of many
debates. HPSEC (High Performance Size Exclusion Chromatography) using pectins to
calibrate the system has been widely used in food industry to determine the Mw of pectins.
This method is fast but the separation depends on the shape of the pectins (hydrodynamic
volume) rather than the molecular weight (Mw). Accurate molecular weight measurement is
possible only when the molecules analysed have the same molecular shape and density as the
standards used (Kravtchenko, Voragen et al., 1992a). Since the hydrodynamic volume of
pectins depends on the degree of methyl-esterification of pectins (Kravtchenko, Berth et al.,
1992) and/or to the degree of branching with neutral sugars (Kravtchenko, Voragen et al.,
1992a), the HPSEC is not always an accurate method.
11
Chapter 1
To optimise the Mw analysis, HPSEC can be coupled to an on-line viscosity detector
although the intrinsic viscosity is also related to the hydrodynamic volume (Corredig, Kerr &
Wicker, 2000). Pectins eluting from the size exclusion columns can also be analysed with
light scattering detection, but the drawback of this method is that pectins can form aggregates
perturbing the light scattering detection. Prior to analysis, the aggregates have to be removed
by filtration. The average Mw of pectins estimated in literature is varying from 140 up to 225
kDa (Corredig & Wicker, 2001; Lecacheux & Brigand, 1988; Morris, Foster & Harding,
2000; Yoo, Fishman, Hotchkiss & Lee, 2005) although much higher values can be found.
3. Sources and extraction of commercial pectins
3.1. Source of pectins
Pectins are present in almost all higher plants. Several by-products of the food industries are
used for their extraction, such as citrus peels (by-product of lemon juice production), apple
pommace (by-product of apple juice manufacture), sugar beet (by-product of the beet-sugar
industry) and in a minor extend potatoes fibres, sunflower heads (by-product of oil
production) and onions (May, 1990).
3.1.1. Extraction of pectins
Extraction of pectins has to be fast to avoid degradation of pectins in the raw materials by
enzymes produced by micro-organisms (PME, PG, PL etc) or by native PME present in the
raw material (May, 1990). The degradation of pectins during storage of the source materials
by enzymes may lead to pectins with completely different gelling behavior. To avoid this, raw
materials have to be dried immediately after production.
3.1.1.1. HM pectins
HM pectins are extracted from the pomace or peels in hot diluted mineral acid at pH1-3 at 50-
90 ºC during 3-12 hours (Rolin, 2002). Dry citrus peels contain 20 to 30% of pectin on a dry
matter basis, lower amounts are present in dried apple pomace (10 to 15%) (Christensen,
1986). By adding alcohol (usually isopropanol but methanol or ethanol are also used) the
pectins are precipitated. Finally, the gelatinous mass is pressed, washed, dried and ground
12
General introduction
(May, 1990). Depending on the process conditions, pectins with a DM from 55 to 80% are
obtained (Rolin, 2002).
3.1.1.2. LM pectins
To produce other types of pectins, esters can be hydrolysed by the action of acid or alkali
either before or during an extraction, as concentrated liquid or in the alcoholic slurry before
separation and drying. When alkali is used the reaction has to be performed at a low
temperature and in aqueous solutions to avoid β-eliminative degradation of the polymers
(Kravtchenko, Arnould, Voragen & Pilnik, 1992). LM pectins can also be extracted with
aqueous chelating agents such as hexametaphosphate (e.g. potato pectins) (Voragen et al.,
1995). The use of PME for the production of LM pectins can be an alternative for the
chemical extraction (Christensen, 1986). The low methyl-esterified pectins obtained can form
gels in the presence of calcium at a higher pH range compared to HM pectins as described
later.
3.1.1.3. LMA pectins
The acid de-esterification process in order to obtain LM pectin is time consuming and the gel
formation is not easy to control with LM pectins. Therefore a new process has been set up: the
amidation of HM pectins. Pectins can be amidated in heterogeneous phases (in the presence of
water/alcohol/ammonia) (Anger & Dongowski, 1988) but also in homogeneous phases
(concentrated aqueous ammonia) (Black & Smit, 1972). The amidated pectins obtained are
used in other applications than the methyl-esterified pectins since they have different physical
properties (Black & Smit, 1972).
3.1.1.4. Acetylated pectins
Since the second world war, pectins have been extracted from sugar beet residues. These
pectins are not of a very high quality in terms of gelation due to a lower Mw of these pectins,
the presence of a considerable amount of acetyl groups, a higher NS content and consequently
a lower GalA content. Treatment in acidic methanol removes the acetyl groups and increases
the level of methyl-esters but this treatment also decreases the Mw significantly. The GalA
content is even often below the limit permitted by regulations (Rolin, 2002). However,
acetylated pectins are used for their emulsifying properties (Leroux et al., 2003).
13
Chapter 1
4. Physical behavior of pectins
The gelling behavior of pectins depends on several parameters as described above (GalA,
degree of substitution, nature of the substituents, Mw). It is also important to know the pKa of
pectins to understand their gelling behavior according to the pH: the pKa value is in the range
of 3.5-4.5 (Plaschina, Braudo & Tolstoguzov, 1978; Ravanat & Rindaudo, 1980; Rolin,
2002).
4.1. HM pectins
HM pectins are generally used at low pH (2.5-3.8) with high sugar content (around 55%) but
without calcium addition (May, 1990; Voragen et al., 1995). The low pH used for gelling
decreases the charge repulsions while the presence of sugar reduces the water binding
(Voragen et al., 1995). The speed of setting of the gels is determined by the DM. To obtain a
wide range of gelling properties pectin preparations (from different sources) can be blended
but generally they are chemically modified by de-esterification or amidation as described
above. The mechanism of the gel formation is still unclear but there is some evidence that in
the junction zones of such gel, hydrophobic bonds between methyl-ester groups are involved
as well as hydrogen bonds (Lapasin & Pricl, 1995). The nature of the sugar co-solute (e.g.
glucose or fructose) as well as its concentration are very important (May, 1990). The HM
pectin gels are not thermo-reversible (Rolin & De Vries, 1990).
4.2. LM pectins
LM pectins are used mainly in the presence of calcium within a wide pH range (2.8-7). It was
also shown that LM pectins can gel at acidic pH (1.6) without calcium (Gilsenan, Richardson
& Morris, 2000; Voragen et al., 1995). LM pectins gels are thermoreversible (Rolin & De
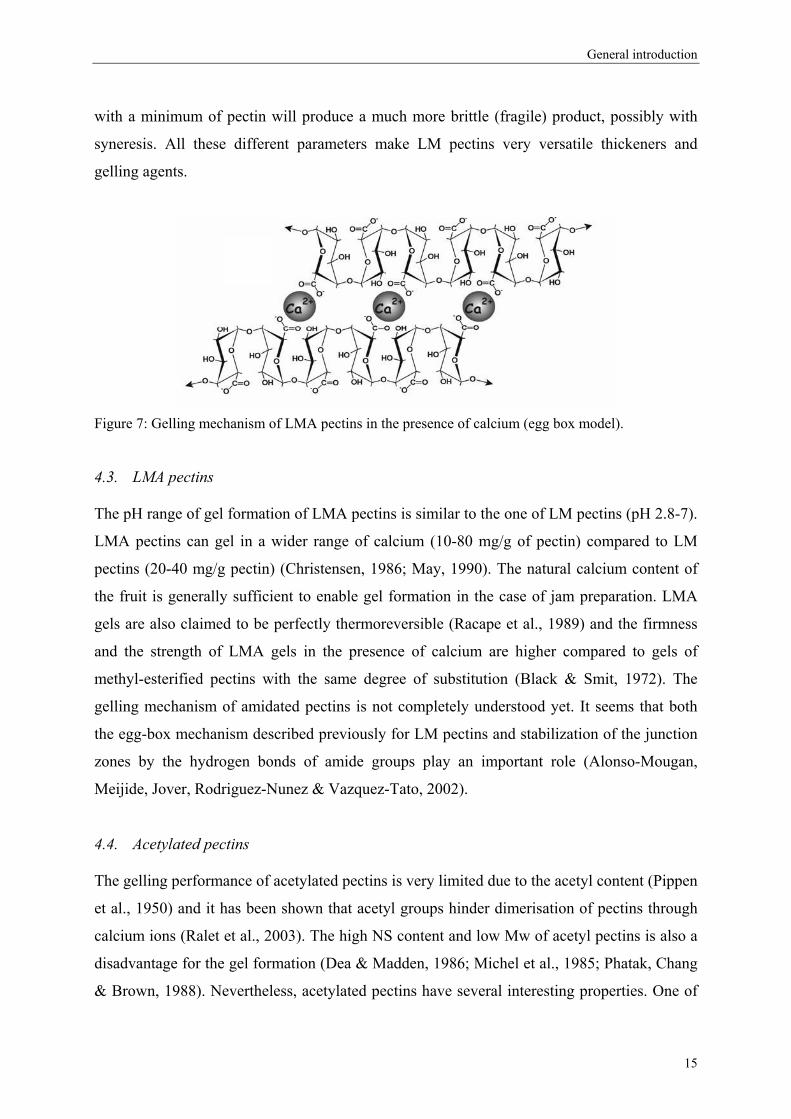
Vries, 1990). They are believed to gel by the “egg box” mechanism (De Vries, Rombouts et
al., 1983) first suggested for alginates (Clark & Ross-Murphi, 1987). Sections of two pectic
chains, which must be free of ester groups, are held together by a number of calcium ions
(Figure 7). It is reported that blocks of 7-20 free GalA residues are required for association
with calcium (Braccini et al., 1999; Kohn, 1975; Powell et al., 1982). The texture of LM
pectin gels can be adjusted by controlling the calcium to pectin ratio. A high pectin content
with relatively low amounts of calcium will give an elastic gel, while the use of more calcium
14
General introduction
with a minimum of pectin will produce a much more brittle (fragile) product, possibly with
syneresis. All these different parameters make LM pectins very versatile thickeners and
gelling agents.
Figure 7: Gelling mechanism of LMA pectins in the presence of calcium (egg box model).
4.3. LMA pectins
The pH range of gel formation of LMA pectins is similar to the one of LM pectins (pH 2.8-7).
LMA pectins can gel in a wider range of calcium (10-80 mg/g of pectin) compared to LM
pectins (20-40 mg/g pectin) (Christensen, 1986; May, 1990). The natural calcium content of
the fruit is generally sufficient to enable gel formation in the case of jam preparation. LMA
gels are also claimed to be perfectly thermoreversible (Racape et al., 1989) and the firmness
and the strength of LMA gels in the presence of calcium are higher compared to gels of
methyl-esterified pectins with the same degree of substitution (Black & Smit, 1972). The
gelling mechanism of amidated pectins is not completely understood yet. It seems that both
the egg-box mechanism described previously for LM pectins and stabilization of the junction
zones by the hydrogen bonds of amide groups play an important role (Alonso-Mougan,
Meijide, Jover, Rodriguez-Nunez & Vazquez-Tato, 2002).
4.4. Acetylated pectins
The gelling performance of acetylated pectins is very limited due to the acetyl content (Pippen
et al., 1950) and it has been shown that acetyl groups hinder dimerisation of pectins through
calcium ions (Ralet et al., 2003). The high NS content and low Mw of acetyl pectins is also a
disadvantage for the gel formation (Dea & Madden, 1986; Michel et al., 1985; Phatak, Chang
& Brown, 1988). Nevertheless, acetylated pectins have several interesting properties. One of
15

Chapter 1
their advantage is the ability of their gel to be dehydrated and rehydrated (May, 1990). Sugar
beet pectins also carry ferulic acid residues, ester linked to arabinosyl or galactosyl residues of
neutral sugar side chains. These ferulate monomers can be coupled into dehydrodimers by
treatment with hydrogen peroxide/peroxidase or ammonium persulfate and this mechanism
increases the viscosity and gelling of beet pectins (Thibault, Garreau & Durand, 1987). The
gel formation of acetylated pectins in the presence of calcium can as well be improved after
enzymatic treatment with pectin acetyl esterase besides pectin esterase (Oosterveld, Beldman,
Searle-van Leeuwen & Voragen, 2000). Finally, acetylated pectins are important for their
good emulsifying ability compared to non-acetylated pectins (Leroux et al., 2003). It is
suggested in literature that beet pectins are able to reduce the interfacial tension between an
oil phase and a water phase resulting in efficient emulsion. Acetyl groups of the pectins may
play a role by reducing the calcium bridging floculation (Leroux et al., 2003) or by enhancing
the hydrophobicity of pectins (Dea & Madden, 1986).
4.5. Use of pectins in food products and drinks
Since decades, food industries spend time and money to improve food products or to innovate
new products in texture, taste and appearance. Several gelling agents such as carragenan,
alginate, guar, xanthan, gelatin, starch and pectin are used to change the texture of food
material. These main hydrocolloids are used in different applications since their gelling and
thickening properties depend on the conditions of the product (pH, presence of co-solute, salts
and temperature). Pectins are mainly extracted from fruits and are thus natural gelling agents.
As natural product and due to their different physical properties, pectins are widely used for
several food systems: jams, marmelades, dairy drinks, dessert (fillings in bakery products),
candies, salad dressing, fruit and tomato pastes (Braddock, 1999). Pectic acid and short chains
of polygalacturonic acid (at pH 5,5) can be used as clarification agents to precipitate the
cloudiness of fruit juices (Braddock, 1999). In dairy drinks, pectins can be used to stabilise
cloud (Voragen et al., 1995). The different types of pectins can be used in different
applications. HM pectins are used in high sugar products such as jams (above 60% soluble
solids). They can also be used in dairy products since they prevent aggregation of casein on
heating at a pH below 4.3 e.g. in the case of UHT (ultra-high-temperature)-treated drinkable
yoghurts (May, 1990). With the increase of low calorie products on the market due to the
awareness of the consumers of their weight, reduced sugar jams of ≈ 30% soluble solids or
16
General introduction
lower are produced using LM pectins. LMA pectins can be used for bakery purposes (such as
fillings for cakes) since their gels are thermally reversible (they will melt and reset to a good
gel on cooling). Glazes for pastries, flans, low sugar content yogurts with fruits addition are
also made with amidated pectins. LMA pectin gels have also less tendency to give syneresis
(Rolin, 2002). LMA pectins can gel under the same conditions as the HM pectins and at lower
temperature as the methyl-esterified ones with the same amount of charges (Rolin, 2002).
Amidation improves the gelling properties of low esterified pectins (May, 1990).
Some syneresis problems may occur in jams and this cannot always be avoided using a
different type or amount of pectin, a different pH or a different soluble solid or calcium
content. An alternative can be the addition of neutral gums but the drawback is the flavour
decrease of the product (May, 1990).
Standardisation of the gelling power of pectins
Pectin characteristics depend on several external factors such as the fruit variety, the ripening
conditions and the availability of the raw material, which is fluctuating on the market. Pectin
manufacturers therefore standardize pectins by mixing different batches of pectins or by
mixing the pectin with sucrose (up to 50% of sucrose is allowed; Rolin, 2002).
To determine the gelling power of HM pectins the SAG (standard acid in glass) value is
determined. Boiled pectin solutions with sugar added are poured in a standardized jelly glass
containing a precalculated amount of acid. After mixing, a gel forms on cooling to 25 °C after
20-24 hours. The gels are removed from the glass by turning it upside down and the sagging
of the gel under its own weight after 2 minutes standing is measured. This value corresponds
to the gel strength and is converted to a ‘Jelly Grade” of the pectin (May, 1990).
5. Aim and outline of the thesis
Pectin manufacturers are still not able to predict conveniently the physical properties of
commercial pectins. Some pectins have similar chemical features whereas the gelling
behavior is quite different.
The aim of this thesis was to broaden our knowledge of the fine structure of commercial
pectins used as ingredients in the food industry to better understand their technical
functionality. For this reason, the research focussed on the distribution of galacturonosyl
residues with free carboxyl groups in HM, LM and amidated pectins taking into account the
17
Chapter 1
heterogeneity of pectin preparations. Methods had to be developed to establish the
heterogeneity of pectin preparations, to fractionate these preparations in sub-populations and
to adapt and further develop the approach of Daas et al. (Daas, Alebeek et al., 1999; Daas et
al., 1998; Daas, Meyer-Hansen et al., 1999; Daas et al., 2000) to further characterise pectins,
in particular amidated pectins.
The approach followed in this thesis was to analyse the samples with similar chemical
characteristics and to develop new methods to detect differences on a molecular level and to
clarify the link between their structure and their physical properties. So far, the distribution of
the free GalA was analysed on crude commercial samples (Daas, Boxma et al., 2001; Daas,
Meyer-Hansen et al., 1999; Daas et al., 2000; Limberg et al., 2000). Pectins are known to be
heterogeneous with respect to their charge (Kravtchenko, Voragen et al., 1992b; Schols,
Reitsma, Voragen & Pilnik, 1989). Our study focussed on the study of the pectin populations
fractionated from commercial pectins to obtain more information about the gelling behavior
as function of the fine chemical structure and to explain unclear behavior of commercial
pectin preparations with very similar chemical specifications. These pectic populations were
separated on anion exchange chromatography and characterised. Since amidated pectins have
not been studied extensively in the past, amidated samples were included in this research to
analyse the distribution of substituents.
We first aimed to find a rapid method to differentiate pectins using anion exchange HPLC
(chapter 2). HM pectins with similar chemical characteristics and different behavior in
application have been fractionated by preparative anion exchange chromatography (chapter 3)
to study the features of these pectic populations in detail. We also included amidated pectins
in our research. Since available methods to determine the degree of amidation are limited, we
first adapted a method using capillary electrophoresis (CE) to analyse the degree of amidation
of the samples and compare the results with the results obtained using FTIR and titration
methods (Chapter 4). Finally, the distribution of amide groups has been investigated using
enzymatic digestion and analysis of the oligomers with CE (chapter 4) and HPAEC at pH5
(Chapter 5). Two LMA pectins with similar chemical characteristics but different gelling
behavior were fractionated and the fractions were characterized with respect to the
distribution of substituents (Chapter 6). Chapter 7 discusses the relation between pectin
structure and the physical properties.
18
General introduction
References
Ahmed A. E. R., Labavitch J. M. (1977). Journal of Food Biochemistry, 1, 361-365.
Albersheim P., Darvill A. G., McNeil M., Valent B. S., Han M. G., Lyon G., Sharp J. K., Desjardins A.-E.,
Spellman M. W., Ross L. M., Robertson B. K., Aman P., Fransen L. E. (1981). Pure and Applied
Chemistry, 53, 79.
Alonso-Mougan M., Meijide F., Jover A., Rodriguez-Nunez E., Vazquez-Tato J. (2002). Rheological behaviour
of an amide pectin. Journal of Food Engineering, 55, 123-129.
Anger H., Dongowski G. (1988). Amidated pectins - characterization and enzymatic degradation. Food
Hydrocolloid., 2, (5), 371-379.
Barrett A. J. B., Northcote D. H. (1965). Apple fruit pectic substances. Biochemical Journal, (94), 617-627.
Black S. A., Smit C. J. B. (1972). The effect of demethylation procedures on the quality of low-ester pectins
used in dessert gels. Journal of Food Science, 37, (II), 730-732.
Blumenkrantz N., Asboe-Hansen G. (1973). New method for quantitative determination of uronic acids.
Analytical Biochemistry, 54, 484-489.
Bociek S., Welti D. (1975). The quantitative analysis of uronic acid polymers by infrared spectroscopy.
Carbohydrate Research, 42, 217-226.
Braccini I., Grasso R. P., Perez S. (1999). Conformational and configurational features of acidic polysaccharides
and their interactions with calcium ions: a molecular modeling investigation. Carbohydrate Research,
317, 119-130.
Braconnot H. (1825a). Nouvelles observations sur l'acide pectique. Annales de chimie et de physique, 30, 96-
102.
Braconnot H. (1825b). Recherches sur un nouvel acide universellement répandu dans tous les végétaux. Annales
de chimie et de physique, 28, 173-178.
Braddock R. J., (1999). In: Handbook of citrus by-products and processing technology; Wiley, J. & Sons, Inc,
New-York.
Brett C., Waldron K., (1996). In: Physiology and biochemistry of plant cell walls. Cambridge.
Chatjigakis A. K., Pappas C., proxenia N., Kalantzi O., Rodis P., Polissiou M. (1998). FT-IR spectroscopic
determination of the degree of esterification of cell wall pectins from stored peaches and correlation to
textural changes. Carbohydrate Polymers, 37, 395-408.
Chen Z., Schols H. A., Voragen A. G. J. (2004). Differently sized granules from acetylated potato and sweet
potato starches differ in the acetyl substitution pattern of their amylose populations. Carbohydrate
Polymers, 56, 219-226.
Christensen P. E. (1954). Methods of grading pectin in relation to the molecular weight (intrinsec viscosity) of
pectin. Food Research, 19, 163.
Christensen S. H. (1986). Pectins. Food Hydrocolloids, 3, 205-230.
Clark A. H., Ross-Murphi S. B. (1987). Structural and mechanical properties of biopolymer gels. Advances in
Polymer Science, 83, 57-192.
19
Chapter 1
Corredig M., Kerr W., Wicker L. (2000). Molecular characterisation of commercial pectins by separation with
linear mix gel permeation columns in-line with multi-angle light scattering detection. Food
Hydrocolloids, 14, 41-47.
Corredig M., Wicker L. (2001). Changes in the molecular weight distribution of three commercial pectins after
valve homogenization. Food Hydrocolloids, 15, 17-23.
Daas P. J. H., Alebeek G. J. W. M. v., Voragen A. G. J., Schols H. A., (1999). Determination of the distribution
of non-esterified glacturonic acid in pectin with endo-polygalacturonase. In: Gums and Stabilisers for
the food industry; Williams P. A., Phillips G. O. eds, Wrexham, The Royal Society of Chemistry, p3-
18.
Daas P. J. H., Arisz P. W., Schols H. A., De Ruiter G. A., Voragen A. G. J. (1998). Analysis of Partially Methyl-
Esterified Galacturonic Acid Oligomers by High-Performance Anion-Exchange Chromatography and
Matrix-Assisted laser Desorption/Ionization Time-of Flight Spectrometry. Analytical Biochemistry,
257, 195-202.
Daas P. J. H., Boxma B., Hopman A. M. C. P., Voragen A. G. J., Schols H. A. (2001). Nonesterified
Galacturonic Acid Sequence Homology of Pectins. Biopolymers., 58, 1-8.
Daas P. J. H., Meyer-Hansen K., Schols H. A., De Ruiter G. A., Voragen A. G. J. (1999). Investigation of the
non-esterified galacturonic acid distribution in pectin with endopolygalacturonase. Carbohydrate
Research, 318, 135-145.
Daas P. J. H., Voragen A. G. J., Schols H. A. (2000). Characterisation of non-esterified galacturonic acid
sequences in pectin with endopolygalacturonase. Carbohydrate Research, 326, 120-129.
Daas P. J. H., Voragen A. G. J., Schols H. A. (2001). Study of the Methyl Ester Distribution in Pectin with
Endo-polygalacturonase and High Performance Size exclusion Chromatography. Biopolymers, 58, 195-
203.
Darvill A. G., McNeill M., Albersheim P. (1978). Structure of plant cell walls: VIII. A new pectic
polysaccharide. Plant Physiology, 62, 418-422.
De Ruiter G. A., Schols H. A., Voragen A. G. J., Rombouts F. M. (1992). Carbohydrate analysis of water-
soluble uronic acid containing polysaccharides with high-performance anion-exchange using
methanolysis combined with TFA hydrolysis is superior to four other methods. Analytical
Biochemistry, 207, 176-185.
De Vries J. A., (1983). Structural features of apple pectic substances. Ph.D Thesis, Wageningen Agricultural
university, The Netherlands.
De Vries J. A., den Uyl C. H., Voragen A. G. J., Rombouts F. M., Pilnik W. (1983). Structural features in the
neutral sugar side chains of apple pectic substances. Carbohydrate Polymers, 6, 193-205.
De Vries J. A., Rombouts F. M., Voragen A. G. J., Pilnik W. (1982). Enzymatic degradation of apple pectins.
Carbohydrate Polymers, 2, 25-33.
De Vries J. A., Rombouts F. M., Voragen A. G. J., Pilnik W. (1983). Distribution of methoxyl groups in apple
pectic substances. Carbohydrate Polymers, 3, 245-258.
De Vries J. A., Voragen A. G. J., Rombouts F. M., Pilnik W. (1981). Extraction and purification of pectins from
alcohol insoluble solids from ripe and unripe apples. Carbohydrate Polymers, 1, 117-127.
20
General introduction
Dea I. C. M., Madden J. K. (1986). Acetylated pectic polysaccharides of sugar beet. Food Hydrocolloids, 1, 71-
88.
Englyst H. N., Cummings J. H. (1984). Simplified method for the measurement of total non-starch
polysaccharides by gas-liquid chromatography of constituent sugars as alditol acetates. Analyst, 109,
937-942.
Food Chemical Codex, (1981) 3rd Ed., National Academy of Sciences, Washington, DC.
Gilsenan P. M., Richardson R. K., Morris E. R. (2000). Thermally reversible acid-induced gelation of low-
methoxy pectin. Carbohydrate Polymers, 41, 339-349.
Gnanasambandam R., Proctor A. (2000). Determination of pectin degree of esterification by diffuse refelectance
Fourier transform infrared spectroscopy. Food Chemistry, 68, 327-332.
Grasdalen H., Bakoy O. E., Larsen B. (1988). Determination of the degree of esterification and the distribution
of methylated and free carboxyl groups in pectins by h-nmr spectroscopy. Carbohydrate Research, 184,
183-191.
Guillotin S. E., Bakx E. J., Boulenguer P., Mazoyer J., Schols H. A., Voragen A. G. J. (2005). Populations
having different GalA blocks characteristics are present in commercial pectins which are chemically
similar but have different functionalities. Carbohydrate Polymers, 60, 391-398.
Haas U., Jager M. (1986). Degree of esterification of pectins determined by photoacoustic near infrared
spectroscopy. Journal of Food Science, 51, (4), 1087-1088.
Huisman M. M. H., Oosterveld A., Schols H. A. (2004). New method for fast determination of the degree of
methylation of pectins by headspace GC. Food Hydrocolloids., 18, (4), 665-668.
Ishii S., Kiho K., Sugiyama S., Sugimoto H. (1979). Low-Methoxyl Pectin Prepared by Pectinesterase from
Aspergillus japonicus. Journal of Food Science, 44, 611-614.
Jiang C. M., Liu S.-H., WU M.-H., Chang W.-M., Chang H.-M. (2005). Determination of the degree of
esterification of alkaline de-esterified pectins by capillary zone electrophoresis. Food Chemistry, 91,
551-555.
Jiang C. M., Wu M. C., Chang W.-H., Chang H.-M. (2001). Determination of random- and blockwise-type de-
esterified pectins by capillary zone electrophoresis. Journal of Agricultural and Food Chemistry, 49,
5584-5588.
Kohn R. (1975). Ion binding on polyuronates. Alginate and pectin. Pure and Applied Chemistry, 42, 371-397.
Kohn R., Furda I., Kopec Z. (1968). Distribution of free carboxyl groups in the pectin molecule after treatment
with pectin esterase. Collection of Czechoslovak Chemical Communications, 33, 264-269.
Kravtchenko T. P., Arnould I., Voragen A. G. J., Pilnik W. (1992). Improvement of the selective
depolymerisation of pectic substances by chemical beta-elimination in aqueous solution. Carbohydrate
Polymers, 19, 237-242.
Kravtchenko T. P., Berth G., Voragen A. G. J., Pilnik W. (1992). Studies on the intermolecular distribution of
industrial pectins by means of preparative size exclusion chromatography. Carbohydrate Polymers, 18,
253-263.
Kravtchenko T. P., Voragen A. G. J., Pilnik W. (1992a). Analytical comparison of three industrial pectin
preparations. Carbohydrate Polymers, 18, 17-25.
21
Chapter 1
Kravtchenko T. P., Voragen A. G. J., Pilnik W. (1992b). Studies on the intermolecular distribution of industrial
pectins by means of preparative ion-exchange chromatography. Carbohydrate Polymers, 19, 115-124.
Lapasin R., Pricl S., (1995). In: Rheology of industrial polysaccharides: theory and applications; London, UK.
Lecacheux D., Brigand G. (1988). Preparative fractionation of natural polysaccharides by size exclusion
chromatography. Carbohydrate Polymers, 8, 119-130.
Leroux J., Langendorff V., Schick G., Vaishnav V., Mazoyer J. (2003). Emulsion stabilizing properties of pectin.
Food Hydrocolloids, 17, 455-462.
Levigne S., Thomas M., Ralet M. C., Quemener B., Thibault J.-F. (2002). Determination of the degrees of
methylation and acetylation of pectins using a C18 column and internal standards. Food Hydrocolloids,
Limberg G., Korner R., Buchholt H. C., Christensen T. M. I. E., Roepstorff P., Mikkelsen D. J. (2000).
Quantification of the amount of galacturonic acid residues in blocksequences in pectin
homogalacturonan by enzymatic fingerprinting with exo- and endo-polygalacturonase II from
Aspergillus niger. Carbohydrate Research, 327, 321-332.
Lofgren C., Guillotin S., Evenbratt H., Schols H., Hermansson A.-M. (2005). Effects of calcium, pH and
blockiness on kinetic rheological behavior and microstructure. Biomacromolecules, 6, 646-652.
May C. D. (1990). Industrial pectins: sources, production and applications. Carbohydrate Polymers, 12, 79-99.
McNeil M., Darvill A. G., Albersheim P. (1980). Structure of plant cell walls. X. Rhamnogalacturonan I, a
structurally complex pectic polysaccharide in the walls of suspension-cultured sycamore cells. Plant
Physiology, 66, 1128-1134.
Michel F., Thibault J.-F., Mercier C., Heitz F., Pouillaude F. (1985). Extraction and characterization of pectins
from sugar beet pulp. Journal of food science, 50, 1499-1502.
Monsoor M., Kalapathy U., Proctor A. (2001). Determination of polygalacturonic acid content in pectin extracts
by diffuse reflectance Fourier transform infrared spectroscopy. Food Chemistry, 74, 233-238.
Morris G. A., Foster T. J., Harding S. E. (2000). The effect of the degree of esterification on the hydrodynamic
properties of citrus pectin. Food Hydrocolloids, 14, 227-235.
Neukom H., Amado R., Pfister M. (1980). Neuere erkenntnisse auf dem gebiete der pektinstoffe. Lebensm.wiss.u
technology, 13, 1-6.
O'Neill M. A., Ishii T., Albersheim P., Darvill A. G. (2004). Rhamnogalacturonan II: Structure and function of a
borate cross-linked cell wall pectic polysaccharide. Annual Review of Plant Biology, 55, (1), 109-139.
Oosterveld A., Beldman G., Searle-van Leeuwen M. J. F., Voragen A. G. J. (2000). Effect of enzymatic
deacetylation on gelation of sugar beet pectin in the presence of calcium. Carbohydrate Polymers, 43,
249-256.
Owens H. S., Svenson H. A., Schultz T. H., (1933). In. Natural Plant Hydrocolloids, Advances in Chemistry;
Washington DC: Ameridan Chemical Society, 10.
Phatak L., Chang K. C., Brown G. (1988). Journal of Food Science, 53, 830-833.
Pippen E. L., McCready R. M., Owens H. S. (1950). Journal of the American Chemical Society, 72, 813-816.
Plaschina I. G., Braudo E. E., Tolstoguzov V. B. (1978). Circular dicroism studies of pectin solutions.
Carbohydrate Research, 60, (1),
22
General introduction
Powell D. A., Morris E. R., Gidley M. J., Rees D. A. (1982). Conformations and interactions of pectins II.
Influence of residue sequence on chain association in calcium pectate gels. Journal of molecal biology,
155, 517-531.
Racape E., Thibault J. F., Reitsma J. C. E., Pilnik W. (1989). Properties of amidated pectins II. Polyelectrolyte
behavior and calcium binding of amidate pectins and amidated pectic acids. Biopolymers, 28, 1435-
1448.
Racape E., Thibault J.-F., Reitsma J. C. E., Pilnik W. (1987). Preparation and characterisation of amidated pectic
acids, Food Hydrocolloids, 1, (5/6), 571-572.
Ralet M. C., Crepeau M. J. C., Buchholt H. C., Thibault J.-F. (2003). Polyelectrolyte behaviour and calcium
binding properties of sugar beet pectins differing in their degrees of methylation and acetylation.
Biochemical Engineering Journal, 3735, 1-11.
Ravanat G., Rindaudo M. (1980). Investigation on oligo- and polygalacturonic acids by potentiometry and
circular dichroism. Biopolymers, 19, 2209-2222.
Reintjes M., Musco D. D., Joseph G. H. (1962). Journal of food sciences, 27, 441-445.
Rolin C., (2002). Commercial pectin preparations. In: Pectins and their Manipulation; Seymour G. B., Knox J.
P., Blackwell Publishing Ltd, 222-239.
Rolin C., De Vries J. A., (1990). Pectin. In: Food gels; Harris, P.J., 401-434.
Schols H. A., Reitsma J. C. E., Voragen A. G. J., Pilnik W. (1989). High-performance ion exchange
chromatography of pectins. Food Hydrocolloids, 3, (2), 115-121.
Sinitsya A., Copikova J., Prutyanov V., Skoblya S., Machovie V. (2000). Amidation of highly methoxylated
citrus pectin with primary amines. Carbohydrate Polymers, 42, 359-368.
Thibault J.-F. (1979). Automatisation du dosage des substances pectiques par la méthode au meta-
hydroxydiphenyl. Lebensmittel Wissenschaft und Technologie, 12, 247-251.
Thibault J.-F., Garreau C., Durand D. (1987). Kinetics and mechanism of the reaction of ammonium persulfate
with ferulic acid and sugar-beet pectins. Carbohydrate Research, 163, 15-27.
Thibault J.-F., Rinaudo M. (1986). Chain association of pectic molecules during calcium-induced gelation.
Biopolymers, 25, 456-468.
Thibault J.-F., Robin J.-P. (1975). Automatisation du dosage des acides uroniques par la méthode au carbazol.
Application au cas des matières pectiques. ann. techno. agric., 24, (I), 99-110.
Van Deventer-Schriemer W. H., Pilnik W. (1987). Studies on pectin degradation. Acta Alimentaria, 16, 143.
Verhoef R., de Waard P., Schols H. A., Rätto M., Siika-aho M., Voragen A. G. J. (2002). Structural elucidation
of the EPS of slime producing Brevundimonas vesicularis sp. isolated from a paper machine.
Carbohydrate Research, 337, 1821-1831.
Vierhuis E., Korver M., Schols H. A., Voragen A. G. J. Structural characteristics of pectic polysaccharides from
olive fruit (Olea europaea cv Moraiolo) in relation to processing for oil extraction. Carbohydrate
Polymers, 51, 135-148.
Vincken J.-P., Schols H. A., Oomen R. J. F. J., McCann M. C., Ulvskov P., Voragen A. G. J., Visser R. G. F.
(2003). If homogalacturonan were a side chain of rhamnogalacturonan I. Implications for cell wall
architecture. Plant Physiology, 132, 1781-1789.
23
Chapter 1
24
Voragen A. G. J., Pilnik W., Thibault J.-F., Axelos M. A. V., Renard C. M. G. C., (1995). Pectins. In: Food
polysaccharides and their applications; Stephen A. M., New York: Marcel Dekker Inc, 287-339.
Voragen A. G. J., Schols H. A., Clement A. J. J., Pilnik W., (1984). Enzymic analysis of pectins. In: Gums and
stabilisers for the food industry.2. Applications of Hydrocolloids; Philips G. O., Wedlock D. J.,
Williams P. A., ed, Elsevier London, 517-521.
Voragen A. G. J., Schols H. A., Pilnik W. (1986a). Analysis of the degree of methylation and acetylation of
pectins by hplc. Food Hydrocolloids, 1, (1), 65-70.
Walter R. H., Sherman R. M., Lee C.-Y. (1983). A comparison of methods for polyuronide methoxyl
determination. 37, 12.
Williams M. A. K., Buffet G. M. C., Foster T. J., Norton I. T. (2001). Simulation of endo-PG digest patterns and
implications for the determination of pectin fine structure. Carbohydrate Research, 334, 243-250.
Yoo S. H., Fishman M. L., Hotchkiss A. T., Lee H. G. (2005). Viscometric behavior of high-methoxy and low-
methoxy pectin solutions. Food Hydrocolloids,
Zhong H. J., Williams M. A. K., Goodall D. M., Hansen M. E. (1998). Capillary electrophoresis studies of
pectins. Carbohydrate Research, 308, 1-8.
Zhong H. J., Williams M. A. K., Keenan R. D., Goodall D. M., Rolin C. (1997). Separation and quantification of
pectins using capillary electrophoresis. Carbohydrate Polymers, 32, (1), 27-32.
Chapter 2
Rapid HPLC method to screen pectins for heterogeneity in
methyl-esterification To be submitted in Food Hydrocolloids as
S.E. Guillotin, A. Van Loey, P. Boulenguer, H.A. Schols and A. G. J. Voragen.
Abstract
Functionality of pectins as a food ingredient is strongly related to their chemical fine structure.
Chemical characteristics of pectins are determined by many different parameters in their
manufacture (choice of the raw material and extraction conditions). Pectin companies are thus
in need for rapid methods to check the performance of extracted pectins. An important factor
in the characterisation is the homogeneity of the pectin preparation, which is usually
determined by laborious, time consuming, soft gel based chromatographic procedures. A rapid
method using a weak anion exchange column (WAX column) to screen commercial pectins
prior to fractionation on preparative scale is presented and exemplified with the rapid analysis
of pectins having different levels and distributions of methyl-ester groups. Amidated pectins
were also included in the study.
25

Chapter 2
1. Introduction
Pectins are mainly used in food industries for their gelling and stabilizing properties.
For industrial applications, they are usually extracted from lemon peels and apple pomaces.
Traditionally, they are used as gelling agents in jams, jellies and marmalades to compensate
for the lack of pectin in the fruits themself but they are also used in confectionery, bakery
fillings and milk acid products (May, 1990; Rolin, 2002).
Pectins are complex mixtures of polysaccharides composed of a galacturonan backbone
(homogalacturonan or so-called smooth region) of which variable proportions can be methyl-
esterified (Barrett & Northcote, 1965; De Vries, Voragen, Rombouts & Pilnik, 1981). In
addition, so-called hairy regions are present, constituted of alternative sequences of rhamnose
and galacturonic acid (rhamnogalacturonan I) carrying neutral side chains (arabinans,
arabinogalactans) attached to the rhamnose moieties (Darvill, McNeill & Albersheim, 1978;
McNeill, Darvill & Albersheim, 1980; Neukom, Amado & Pfister, 1980; Pilnik & Voragen,
1991; Voragen, Pilnik, Thibault, Axelos & Renard, 1995). Next to these structural elements,
three other elements have been found in pectins: xylogalacturonan, apiogalacturonan,
rhamnogalacturonan II (O'Neill, Ishii, Albersheim & Darvill, 2004; Vincken et al., 2003). As
a result of the acid extraction, commercial pectins are rich in GalA (> 70%, w/w) and contain
only small amounts of neutral sugars (5-10%, w/w) (Guillotin et al., 2005; Kravtchenko,
Voragen & Pilnik, 1992a; Lecacheux & Brigand, 1988).
Depending on the degree of methyl-esterification (DM), pectins are classified as high methyl-
esterified (HM) pectins or as low methyl-esterified non amidated (LM) pectins. HM pectins
can also be chemically amidated to obtain low methyl-esterified and amidated (LMA) pectins.
HM pectins are used mainly in sugar-acid gels whereas LM and LMA pectins are used in
pectate gels. Both gelling and stabilizing properties are influenced by the molecular weight
(Christensen, 1954; Owens, Svenson & Schultz, 1933; Van Deventer-Schriemer & Pilnik,
1987), the level and distribution of methyl-esters (Lofgren, Guillotin, Evenbratt, Schols &
Hermansson, 2005; Rolin, 2002; Thibault & Rinaudo, 1986; Voragen et al., 1995).
Differences in gelling behavior of pectins with almost identical chemical characteristics could
be attributed to differences in the distribution of methyl-esterified carboxyl groups over the
pectic backbone. Differences in the methyl-ester distribution can be observed within one
pectic molecule (intramolecular level) or between different molecules (intermolecular level).
The gelling properties of commercial samples are complex to study since it has been shown
26
Pectin analysis on analytical WAX column
with anion exchange chromatography (Guillotin et al., 2005; Kravtchenko, Berth, Voragen &
Pilnik, 1992; Ralet & Thibault, 2002; Schols, Reitsma, Voragen & Pilnik, 1989) or size
exclusion chromatography (Kravtchenko, Berth et al., 1992; Ralet, Bonnin & Thibault, 2001)
that they are not homogenous but constituted of several pectic populations with different
chemical features. These populations also showed variations in the amount of methyl-esters
(Kravtchenko, Berth et al., 1992; Kravtchenko, Voragen & Pilnik, 1992b; Schols et al., 1989)
and in the distribution of the substituents as it was recently shown for LM and HM pectins
after elution on Source-Q anion exchanger (Guillotin et al., 2005). However, using anion
exchange chromatography on a “soft” gel (DEAE-sepharose CL-6B) and conductometric
characterization, Ralet & Thibault (2002) were not able to see an effect of the methyl-ester
distribution. These contradictory results may be due to the different anion exchanger used
leading to different separation mechanisms. Both chromatographic methods used are
conventional semi-preparative separations that require high amounts of samples and take long
elution times (∼6 hours).
There is a need for a rapid analytical screening procedure to analyze pectins. Schols et al.
(1989) were able to separate pectic populations present in commercial pectins according to
their charges, using an HPLC system equipped with an anion exchange column (MA7P
column) on an analytical scale. This method was much less time consuming compared to the
earlier methods performed with conventional ion exchange chromatography using DEAE
columns (Anger & Dongowski, 1984; Heri, Neukom & Deuel, 1961). Since the MA7P
column used by Schols et al. (1989) is not available anymore, other anion-exchange columns
have been tested in order to find an alternative column able to fractionate pectins in the same
way. Samples with different levels and distributions of methyl-esters and amide groups have
been used to examine the potential of a Dionex Propac WAX-10 column (WAX-10) in the
rapid analysis of pectins.
2. Experimental
2.1. Samples
Pectins C56 and C67 (Copenhagen pectin A/S; Lille Skensved, Denmark) used in this study
and pectins M93, M85, R70, CR52 and CR31 obtained after demethyl-esterification or
methyl-esterification of pectin C67 were characterised in detail in the study of Daas et al.
(Daas, Meyer-Hansen, Schols, De Ruiter & Voragen, 1999).
27
Chapter 2
The pectin M93 has then been treated in our study with tomato PME or Aspergillus aculeatus
PME. The pectin (4 mg/ml) was incubated either with tomato PME (0.19 U/ml in 0.1M Tris-
HCl pH 8) at 55°C or Aspergillus aculeatus PME (0.14 U/ml in 0.1 M Na-Acetate pH 4.5) at
50 °C. Pectins are mixed 3 min with the enzyme and incubated for 7, 13, and 18 min. The
enzyme was inactivate at 80°C during 2 min. Pectins were obtained with a DM of 79, 71 60
and 53% with Aspergillus PME (Asp79, Asp71, Asp60, Asp 53) and a DM of 81, 75, 70 and
66% with tomato PME (Tom81, Tom75, Tom70 and Tom66). Two samples were included as
control: pectin M93 without enzyme in buffer solution at pH 4.5 and 8. All the samples were
ultrafiltrated (Millipore filter device, 10 kDa) and diluted in 15 mM phosphate buffer pH 6
prior to injection on a PropacTM WAX-10 (WAX) column.
Pectins A and B were kindly provided by Degussa Texturant Systems (Baupte, France). In a
previous study, they were also called respectively Calcium Sensitive (CS) pectin and Non
Calcium Sensitive (NCS) pectin. Their different physical properties in the presence of calcium
have been studied (Laurent & Boulenguer, 2003). Both pectins A and B were obtained from
lemon peel (same citrus variety) but using a different process and were selected for having
nearly the same molecular weight (82 and 78kDa, respectively), degree of methyl-
esterification (74% and 72%, respectively) and galacturonic acid content (82 and 74 w/w %,
respectively) (Guillotin et al., 2005). The neutral sugar (NS) content is low for both pectins
(7 and 12 w/w %, respectively). The low methyl-esteried and amidated (LMA) pectins D and
G were also from Degussa Texturant Systems and were selected for their different physical
properties in the presence of calcium. Pectins D and G have the same Mw (≈ 73 kDa), similar
DM (29 and 31%, respectively), degree of amidation (DAm) (19 and 18%, respectively) and
GalA content (68 and 70 % w/w, respectively).
2.2. Analytical methods
2.2.1. Chromatographic analysis of pectins on analytical scale
An Akta purifier system equipped with an A-900 autosampler (Amersham Biosciences) was
used for the separation of pectins on a Dionex PropacTM WAX-10 column (WAX; 250 × 4
mm). After an equilibration step of 10 min (1 ml/min) with “Millipore” water, 200 µl of
pectin solution (5 mg/ml) was injected (pectin powder was wetted in ethanol prior to
solubilisation in water). Elution (1 ml/min) was performed with a linear gradient from 0 to 0.6
28
Pectin analysis on analytical WAX column
M of sodium phosphate buffer (pH 6) in 15 min and the gradient was hold at 0.6M sodium
phosphate (pH 6) for 25 min. At the end of the gradient, the column was washed for two min
with “Millipore” water and was then eluted with 0.1 M sodium hydroxide for 8 min.
Detection was accomplished with an UV detector (Amersham Biosciences) set at 215 nm.
The baseline of all elution patterns were corrected by using the baseline obtained upon
injection of 200 µl of water.
2.2.2. Uronic acid and neutral sugars contents
The uronic acid content was determined by the automated colorimetric m-hydroxydiphenyl
method (Ahmed & Labavitch, 1977; Blumenkrantz & Asboe-Hansen, 1973; Thibault, 1979).
Total neutral sugars were estimated with the automated orcinol method (Tollier & Robin,
1979), using galactose as a standard.
2.2.3. Degree of methyl-esterification
The amount of methanol formed after saponification of the pectins was analysed by using a
colorimetric method (Klavons & Bennett, 1986). In this method, methanol is oxidized to
formaldehyde with alcohol oxidase, followed by the condensation of the formaldehyde with
2,4-pentanedione to the colored product 3,5-diacetyl-1,4-dihydro-2,6-dimethylpyridine
(Wood & Siddiqui, 1971). This colored product is determined with a spectrophotometer at
412 nm. Alcohol oxidase from Pichia pastoris with an activity of 25 units/mg (EC 1.1.3.13)
was purchased from Sigma. One unit will oxidize 1 µmol of methanol to formaldehyde per
minute at pH 7.5 and 25°C (Sigma). Triplicates were analysed and the average methanol
concentration was calculated.
3. Results and discussion
3.1. Separation of commercial pectins on WAX column
Since the experimental MA7P column used by Schols et al. (1989) was not further
commercialised, this rapid HPLC method never found application in pectin analysis. In order
to find an alternative column able to fractionate pectins in the same way, other anion-
exchange columns have been tested. Technical problems occurred with the anion exchange
29
Chapter 2
mini Q column (Amersham Biosciences; 30 × 3.2 mm) due to the high back pressure of the
column during the gradient. These pressure problems may be due to the interactions of the
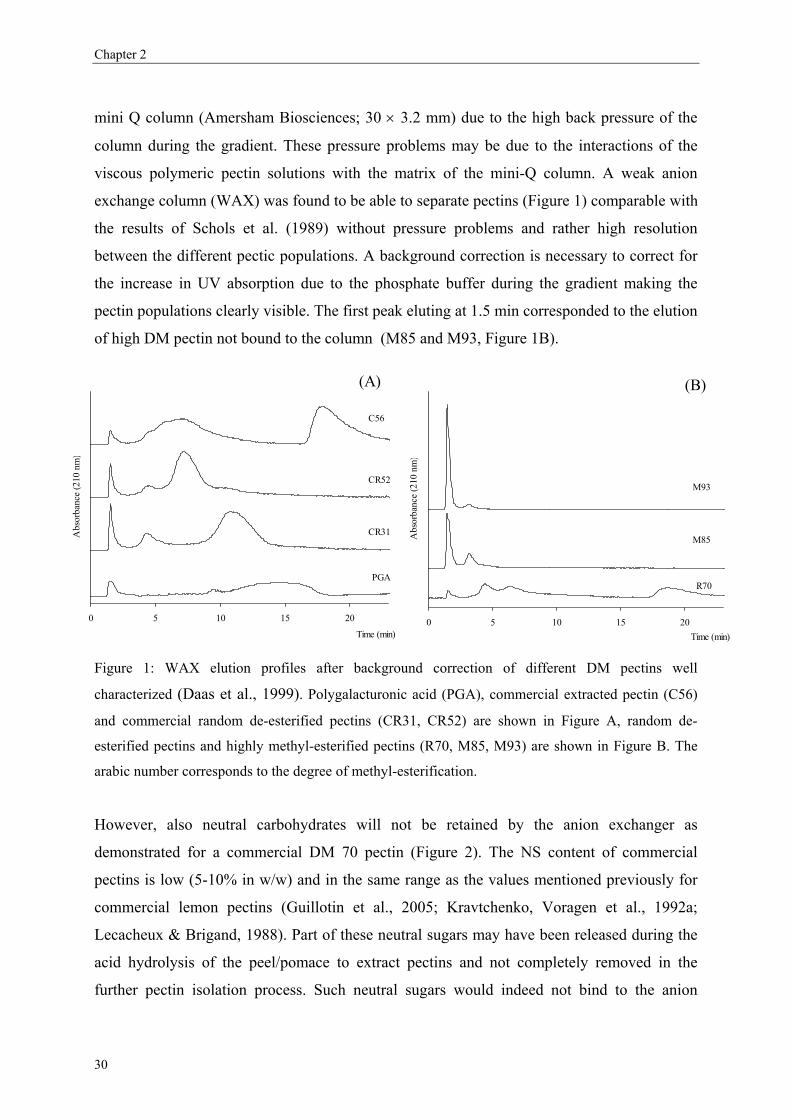
viscous polymeric pectin solutions with the matrix of the mini-Q column. A weak anion
exchange column (WAX) was found to be able to separate pectins (Figure 1) comparable with
the results of Schols et al. (1989) without pressure problems and rather high resolution
between the different pectic populations. A background correction is necessary to correct for
the increase in UV absorption due to the phosphate buffer during the gradient making the
pectin populations clearly visible. The first peak eluting at 1.5 min corresponded to the elution
of high DM pectin not bound to the column (M85 and M93, Figure 1B).
0 5 10 15 20Time (min)
Abs
orba
nce
(210
nm
)
M85
M93
R70
0 5 10 15 20
Time (min)
Abs
orba
nce
(210
nm
)
CR31
CR52
C56
PGA
(B) (A)
Figure 1: WAX elution profiles after background correction of different DM pectins well
characterized (Daas et al., 1999). Polygalacturonic acid (PGA), commercial extracted pectin (C56)
and commercial random de-esterified pectins (CR31, CR52) are shown in Figure A, random de-
esterified pectins and highly methyl-esterified pectins (R70, M85, M93) are shown in Figure B. The
arabic number corresponds to the degree of methyl-esterification.
However, also neutral carbohydrates will not be retained by the anion exchanger as
demonstrated for a commercial DM 70 pectin (Figure 2). The NS content of commercial
pectins is low (5-10% in w/w) and in the same range as the values mentioned previously for
commercial lemon pectins (Guillotin et al., 2005; Kravtchenko, Voragen et al., 1992a;
Lecacheux & Brigand, 1988). Part of these neutral sugars may have been released during the
acid hydrolysis of the peel/pomace to extract pectins and not completely removed in the
further pectin isolation process. Such neutral sugars would indeed not bind to the anion
30
Pectin analysis on analytical WAX column
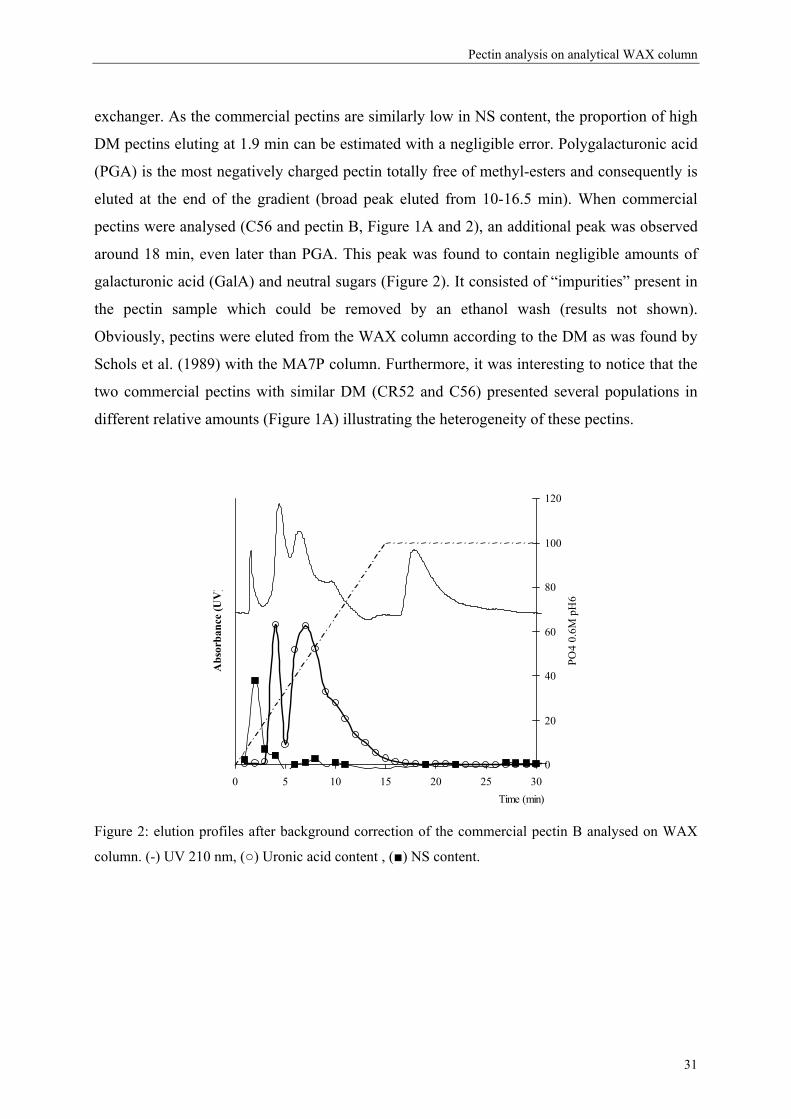
exchanger. As the commercial pectins are similarly low in NS content, the proportion of high
DM pectins eluting at 1.9 min can be estimated with a negligible error. Polygalacturonic acid
(PGA) is the most negatively charged pectin totally free of methyl-esters and consequently is
eluted at the end of the gradient (broad peak eluted from 10-16.5 min). When commercial
pectins were analysed (C56 and pectin B, Figure 1A and 2), an additional peak was observed
around 18 min, even later than PGA. This peak was found to contain negligible amounts of
galacturonic acid (GalA) and neutral sugars (Figure 2). It consisted of “impurities” present in
the pectin sample which could be removed by an ethanol wash (results not shown).
Obviously, pectins were eluted from the WAX column according to the DM as was found by
Schols et al. (1989) with the MA7P column. Furthermore, it was interesting to notice that the
two commercial pectins with similar DM (CR52 and C56) presented several populations in
different relative amounts (Figure 1A) illustrating the heterogeneity of these pectins.
0 5 10 15 20 25 30Time (min)
Abs
orba
nce
(UV
)
0
20
40
60
80
100
120
PO4
0.6M
pH
6
Figure 2: elution profiles after background correction of the commercial pectin B analysed on WAX
column. (-) UV 210 nm, (○) Uronic acid content , (■) NS content.
31
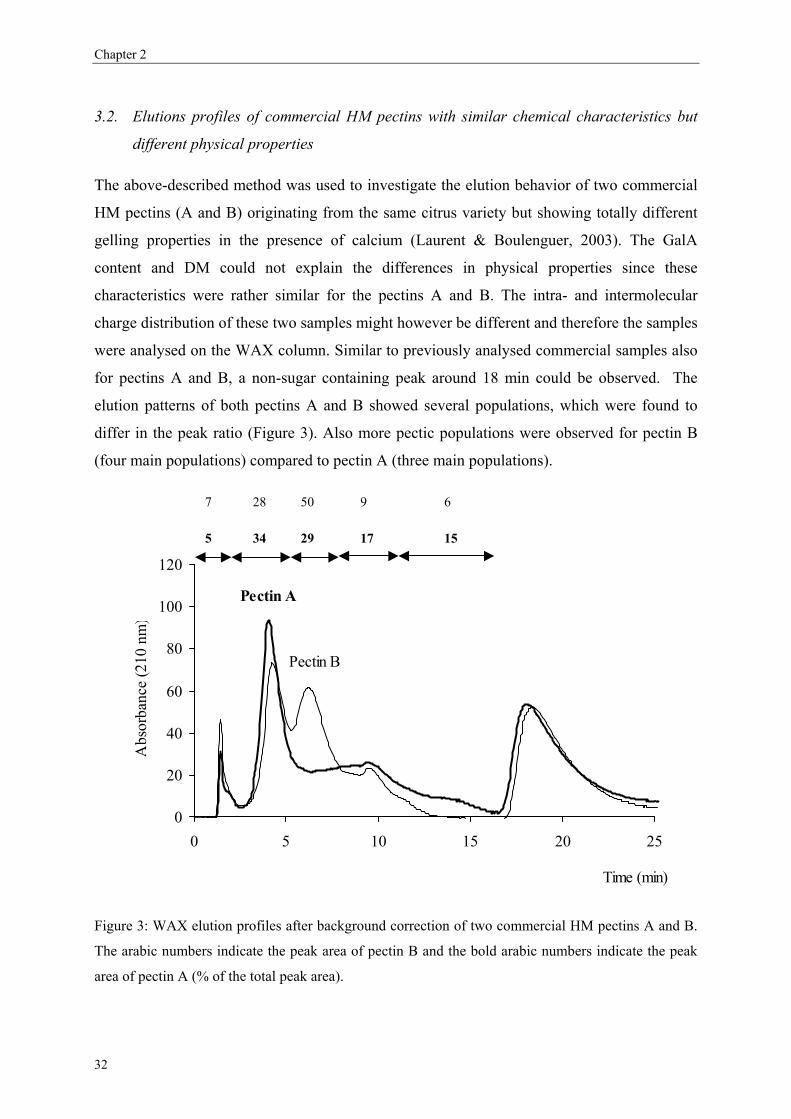
Chapter 2
3.2. Elutions profiles of commercial HM pectins with similar chemical characteristics but
different physical properties
The above-described method was used to investigate the elution behavior of two commercial
HM pectins (A and B) originating from the same citrus variety but showing totally different
gelling properties in the presence of calcium (Laurent & Boulenguer, 2003). The GalA
content and DM could not explain the differences in physical properties since these
characteristics were rather similar for the pectins A and B. The intra- and intermolecular
charge distribution of these two samples might however be different and therefore the samples
were analysed on the WAX column. Similar to previously analysed commercial samples also
for pectins A and B, a non-sugar containing peak around 18 min could be observed. The
elution patterns of both pectins A and B showed several populations, which were found to
differ in the peak ratio (Figure 3). Also more pectic populations were observed for pectin B
(four main populations) compared to pectin A (three main populations).
0
20
40
60
80
100
120
0 5 10 15 20 25
Time (min)
Abs
orba
nce
(210
nm
)
Pectin A
Pectin B
34 5 29 17 15
7 28 50 9 6
Figure 3: WAX elution profiles after background correction of two commercial HM pectins A and B.
The arabic numbers indicate the peak area of pectin B and the bold arabic numbers indicate the peak
area of pectin A (% of the total peak area).
32
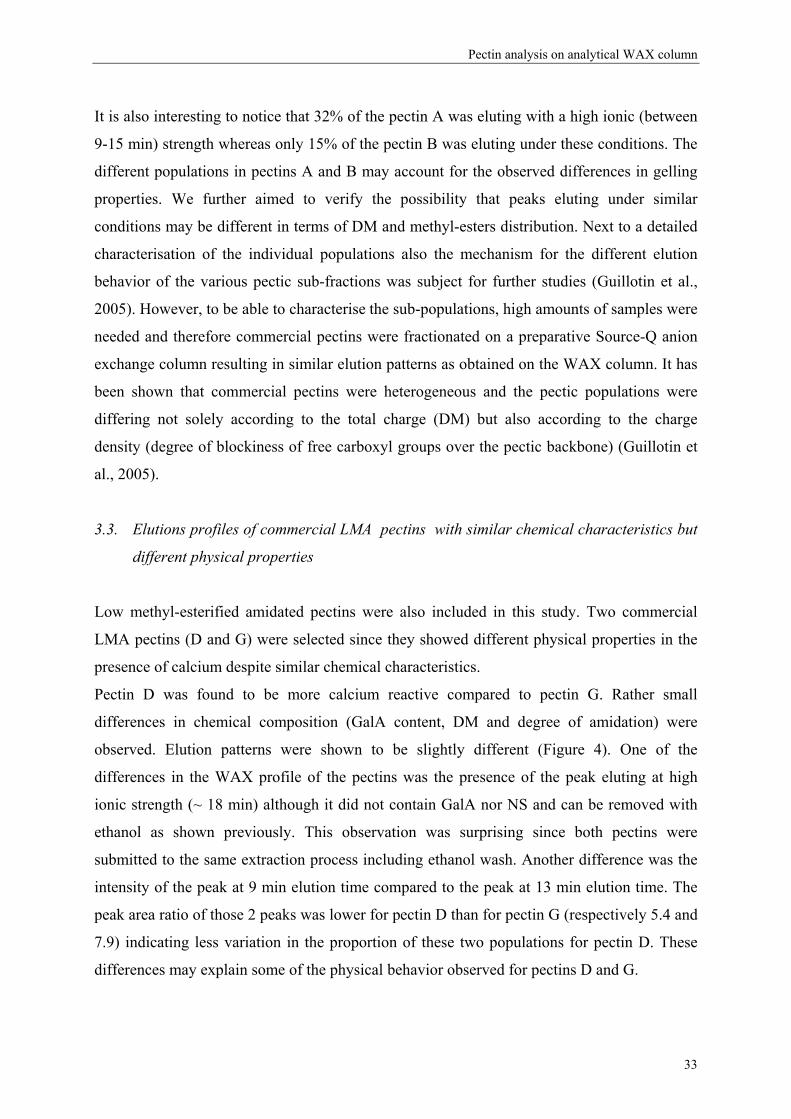
Pectin analysis on analytical WAX column
It is also interesting to notice that 32% of the pectin A was eluting with a high ionic (between
9-15 min) strength whereas only 15% of the pectin B was eluting under these conditions. The
different populations in pectins A and B may account for the observed differences in gelling
properties. We further aimed to verify the possibility that peaks eluting under similar
conditions may be different in terms of DM and methyl-esters distribution. Next to a detailed
characterisation of the individual populations also the mechanism for the different elution
behavior of the various pectic sub-fractions was subject for further studies (Guillotin et al.,
2005). However, to be able to characterise the sub-populations, high amounts of samples were
needed and therefore commercial pectins were fractionated on a preparative Source-Q anion
exchange column resulting in similar elution patterns as obtained on the WAX column. It has
been shown that commercial pectins were heterogeneous and the pectic populations were
differing not solely according to the total charge (DM) but also according to the charge
density (degree of blockiness of free carboxyl groups over the pectic backbone) (Guillotin et
al., 2005).
3.3. Elutions profiles of commercial LMA pectins with similar chemical characteristics but
different physical properties
Low methyl-esterified amidated pectins were also included in this study. Two commercial
LMA pectins (D and G) were selected since they showed different physical properties in the
presence of calcium despite similar chemical characteristics.
Pectin D was found to be more calcium reactive compared to pectin G. Rather small
differences in chemical composition (GalA content, DM and degree of amidation) were
observed. Elution patterns were shown to be slightly different (Figure 4). One of the
differences in the WAX profile of the pectins was the presence of the peak eluting at high
ionic strength (~ 18 min) although it did not contain GalA nor NS and can be removed with
ethanol as shown previously. This observation was surprising since both pectins were
submitted to the same extraction process including ethanol wash. Another difference was the
intensity of the peak at 9 min elution time compared to the peak at 13 min elution time. The
peak area ratio of those 2 peaks was lower for pectin D than for pectin G (respectively 5.4 and
7.9) indicating less variation in the proportion of these two populations for pectin D. These
differences may explain some of the physical behavior observed for pectins D and G.
33
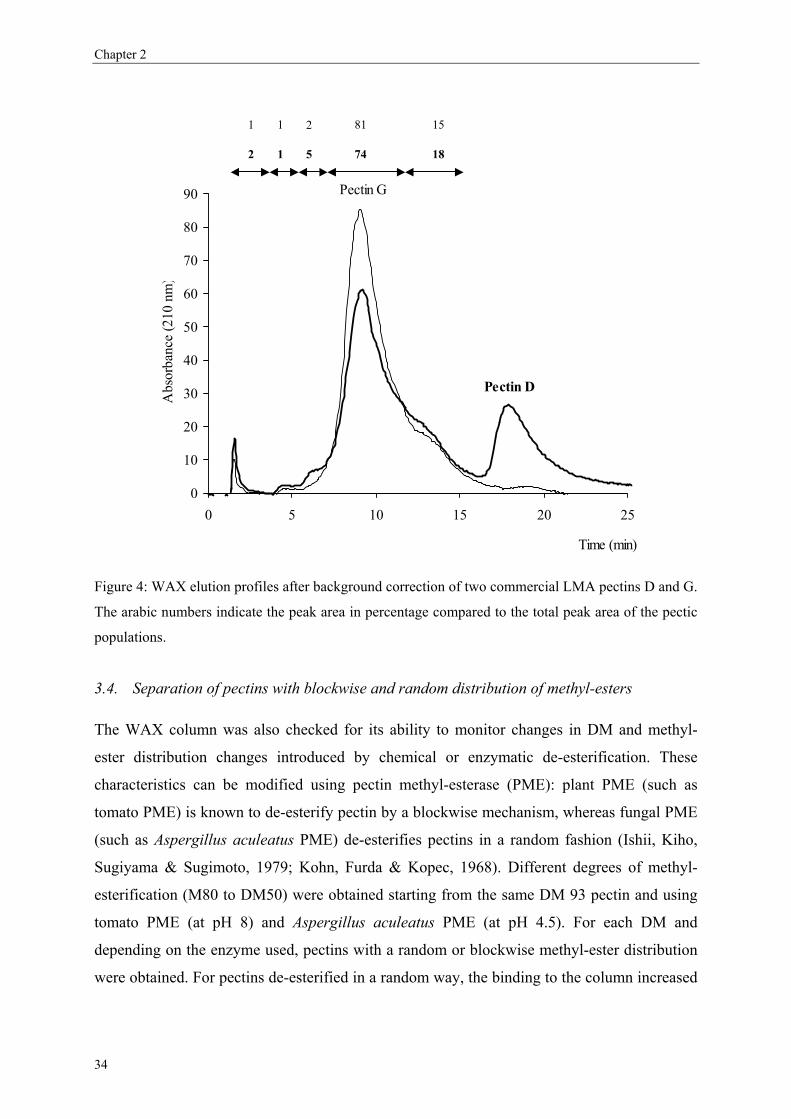
Chapter 2
0
10
20
30
40
50
60
70
80
90
0 5 10 15 20 25
Time (min)
Abs
orba
nce
(210
nm
)
Pectin D
Pectin G
2 1 5 74 18
1 1 2 81 15
Figure 4: WAX elution profiles after background correction of two commercial LMA pectins D and G.
The arabic numbers indicate the peak area in percentage compared to the total peak area of the pectic
populations.
3.4. Separation of pectins with blockwise and random distribution of methyl-esters
The WAX column was also checked for its ability to monitor changes in DM and methyl-
ester distribution changes introduced by chemical or enzymatic de-esterification. These
characteristics can be modified using pectin methyl-esterase (PME): plant PME (such as
tomato PME) is known to de-esterify pectin by a blockwise mechanism, whereas fungal PME
(such as Aspergillus aculeatus PME) de-esterifies pectins in a random fashion (Ishii, Kiho,
Sugiyama & Sugimoto, 1979; Kohn, Furda & Kopec, 1968). Different degrees of methyl-
esterification (M80 to DM50) were obtained starting from the same DM 93 pectin and using
tomato PME (at pH 8) and Aspergillus aculeatus PME (at pH 4.5). For each DM and
depending on the enzyme used, pectins with a random or blockwise methyl-ester distribution
were obtained. For pectins de-esterified in a random way, the binding to the column increased
34
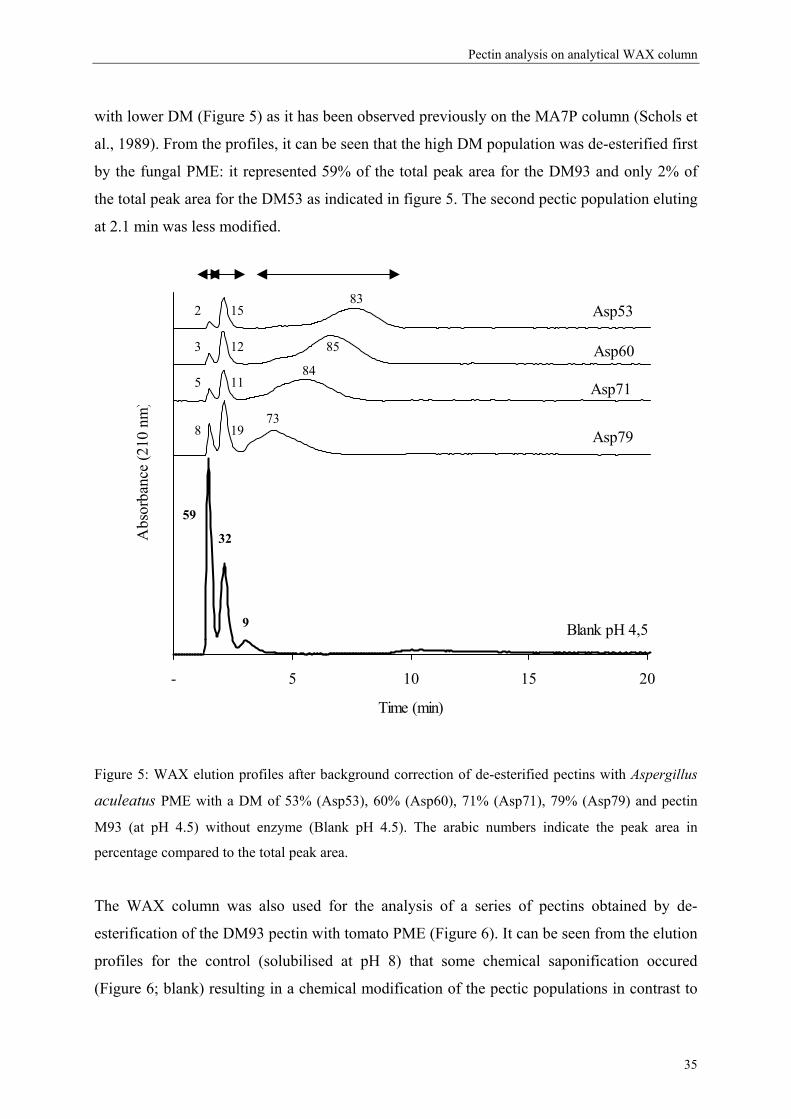
Pectin analysis on analytical WAX column
with lower DM (Figure 5) as it has been observed previously on the MA7P column (Schols et
al., 1989). From the profiles, it can be seen that the high DM population was de-esterified first
by the fungal PME: it represented 59% of the total peak area for the DM93 and only 2% of
the total peak area for the DM53 as indicated in figure 5. The second pectic population eluting
at 2.1 min was less modified.
- 5 10 15 20
Time (min)
Abs
orba
nce
(210
nm
)
Asp79
Asp71
Asp60
Asp53
Blank pH 4,5
85
8
5
3
2
11
12
15
19
84
83
73
59 32
9
Figure 5: WAX elution profiles after background correction of de-esterified pectins with Aspergillus
aculeatus PME with a DM of 53% (Asp53), 60% (Asp60), 71% (Asp71), 79% (Asp79) and pectin
M93 (at pH 4.5) without enzyme (Blank pH 4.5). The arabic numbers indicate the peak area in
percentage compared to the total peak area.
The WAX column was also used for the analysis of a series of pectins obtained by de-
esterification of the DM93 pectin with tomato PME (Figure 6). It can be seen from the elution
profiles for the control (solubilised at pH 8) that some chemical saponification occured
(Figure 6; blank) resulting in a chemical modification of the pectic populations in contrast to
35

Chapter 2
the blank solubilised at pH 4.5 (Figure 5). Furthermore, modifications by using tomato PME
(Figure 6) lead to an increase of pectin populations eluting at high ionic strength: from 0 till
45% of the total peak area was eluted between 10-17min. The presence of this very broad
peak indicated a non-homogenous pectin sample (Figure 6). In contrast to the Aspergillus
aculeatus PME results, the peak corresponding to very high DM pectins (~ 1.5 min) was not
degraded. The second pectic population (~ 4 min) was more degraded since it represents 60%
of the total peak area in the blank and only 38% in the pectin Tom66. This indicated a
preference for this population by tomato PME.
- 5 10 15 20
Time (min)
Abs
orba
nce
(210
nm
)
Tom81
Tom75
Tom70
Tom66
Blank pH 8
16 38
45
19 39 41
24 46 29
25 51
25
11 66
23
Figure 6: WAX elution profiles after background correction of de-methyl-esterified pectins with
tomato PME with a DM of 66% (Tom66), 70% (Tom70), 75% (Tom75), 81% (Tom81) and pectin
M93 (at pH 8.0) without enzyme (Blank pH 8.0). The arabic numbers indicate the peak area in
percentage compared to the total peak area.
In the literature, it has been reported that plant PME cannot act on a fully methyl-esterified
pectin and needs a minimum of 5% free carboxyl groups for degradation (Massiot, Perron,
Baron & Drilleau, 1997; Solms & Deuel, 1955). This may explain why the HM pectin
36
Pectin analysis on analytical WAX column
population (~ 1.5 min) was not modified: its DM was too high to allow the action of tomato
PME. However, the plant PME was able to de-esterify the second population to a higher
extent than the fungal PME. This behavior can be explained by the fact that the enzyme is
degrading pectin polymers in a single chain mechanism (Kohn et al., 1968).
Previous studies indicated that plant PME was able to degrade pectins until a DM around 40
% corresponding to its de-esterification limit (Massiot et al., 1997). Our results showed that
some pectic populations were eluting at the same elution time as PGA pointing to a higher de-
esterification level. Another explanation may be that pectins with large blocks of non-methyl-
esterified galacturonic acid residues eluted similarly as PGA. Different elution profiles have
been observed by Schols et al. (1989) when using citrus pectin esterase. These authors found
more heterogenous pectic populations compared to our study and this difference may be
explained by a different ratio enzyme-pectin used. With a high dose of enzyme several
polymers can be de-esterify resulting in numerous but short de-esterified GalA blocks while a
lower enzyme dose creates less but larger de-esterified GalA blocks. It is also possible that
the differences in elution profiles are due to the absence of chemical saponification since
Schols et al. (1989) de-esterified pectins with the plant PME at pH 7 instead of pH 8 used in
this study.
Conclusions Pectins were separated according to the total charge as it has been shown previously (Schols
et al., 1989). Amidated pectins were also separated according to the same mechanism as
methyl-esterified pectins. Amidated moieties were indeed recognised as non-charged GalA
residues such as methyl-esters and they did not contribute to the binding of the pectins to the
anion exchanger. Finally, pectins with random distribution of the methyl-esters seemed to
behave differently on the anion exchange material compared to pectins with a blockwise
distribution of the methyl-esters.
37
Chapter 2
References Ahmed A. E. R., Labavitch J. M. (1977). Journal of Food Biochemistry, 1, 361-365.
Anger H., Dongowski G. (1984). Studies on the distribution pattern of free carboxyl groups in pectins by
fractionation on deae-cellulose. Die Nahrung., 28, 199-206.
Barrett A. J. B., Northcote D. H. (1965). Apple fruit pectic substances. Biochemical Journal, 94, 617-627.
Blumenkrantz N., Asboe-Hansen G. (1973). New method for quantitative determination of uronic acids.
Analytical Biochemistry, 54, 484-489.
Christensen P. E. (1954). Methods of grading pectin in relation to the molecular weight (intrinsec viscosity) of
pectin. Food Research, 19, 163.
Daas P. J. H., Meyer-Hansen K., Schols H. A., De Ruiter G. A., Voragen A. G. J. (1999). Investigation of the
non-esterified galacturonic acid distribution in pectin with endopolygalacturonase. Carbohydrate
Research, 318, 135-145.
Darvill A. G., McNeill M., Albersheim P. (1978). Structure of plant cell walls: VIII. A new pectic
polysaccharide. Plant Physiology, 62, 418-422.
De Vries J. A., Voragen A. G. J., Rombouts F. M., Pilnik W. (1981). Extraction and purification of pectins from
alcohol insoluble solids from ripe and unripe apples. Carbohydrate Polymers, 1, 117-127.
Guillotin S. E., Bakx E. J., Boulenguer P., Mazoyer J., Schols H. A., Voragen A. G. J. (2005). Populations
having different GalA blocks characteristics are present in commercial pectin which are chemically
similar but have different functionalities. Carbohydrate Polymers, 60, 391-398.
Heri W., Neukom H., Deuel H. (1961). Chromatographische fraktionierung von pektinstoffen an
diathylaminoathyl-cellulose. Helvetica Chimica Acta, XLIV, (VII), 239.
Ishii S., Kiho K., Sugiyama S., Sugimoto H. (1979). Low-methoxyl pectin prepared by pectinesterase from
Aspergillus japonicus. Journal of Food Science, 44, 611-614.
Klavons J. A., Bennett R. B. (1986). Determination of methanol using alcohol oxidase and its application to
methyl ester content of pectins. Journal of Agricultural and Food Chemistry, 34, 597-599.
Kohn R., Furda I., Kopec Z. (1968). Distribution of free carboxyl groups in the pectin molecule after treatment
with pectin esterase. Collection of Czechoslovak Chemical Communications, 33, 264-269.
Kravtchenko T. P., Berth G., Voragen A. G. J., Pilnik W. (1992). Studies on the intermolecular distribution of
industrial pectins by means of preparative size exclusion chromatography. Carbohydrate Polymers, 18,
253-263.
Kravtchenko T. P., Voragen A. G. J., Pilnik W. (1992a). Analytical comparison of three industrial pectin
preparations. Carbohydrate Polymers, 18, 17-25.
Kravtchenko T. P., Voragen A. G. J., Pilnik W. (1992b). Studies on the intermolecular distribution of industrial
pectins by means of preparative ion-exchange chromatography. Carbohydrate Polymers, 19, 115-124.
Laurent M. A., Boulenguer P. (2003). Stabilization mechanism of acid dairy drinks (ADD) induced by pectin.
Food Hydrocolloids, 17, 445-454.
Lecacheux D., Brigand G. (1988). Preparative fractionation of natural polysaccharides by size exclusion
chromatography. Carbohydrate Polymers, 8, 119-130.
38
Pectin analysis on analytical WAX column
Lofgren C., Guillotin S., Evenbratt H., Schols H., Hermansson A.-M. (2005). Effects of calcium, pH and
blockiness on kinetic rheological behavior and microstructure. Biomacromolecules, 6, 646-652.
Massiot P., Perron V., Baron A., Drilleau J. F. (1997). Release of methanol and depolymeriztion of highly
methyl esterified apple pectin with an endopolygalacturonase from Aspergillus niger and pectin
methylesterases from A. niger or from Orange. Lebensmittel Wissenschaft und Technologie, 30, 697-
702.
May C. D. (1990). Industrial pectins: Sources, production and applications. Carbohydrate Polymers, 12, 79-99.
McNeill M., Darvill A. G., Albersheim P. (1980). Structure of plant cell walls : X. Rhamnogalacturonan I A
structurally complex polysaccharide in the walls of suspension-cultured sycamore cells. Plant
Physiology, 66, 1128-1134.
Neukom H., Amado R., Pfister M. (1980). Neuere erkenntnisse auf dem gebiete der pektinstoffe. Lebensm.wiss.u
technology, 13, 1-6.
O'Neill M. A., Ishii T., Albersheim P., Darvill A. G. (2004). Rhamnogalacturonan II: Structure and function of a
borate cross-linked cell wall pectic polysaccharide. Annual Review of Plant Biology, 55, (1), 109-139.
Owens H. S., Svenson H. A., Schultz T. H., (1933). In: Natural Plant Hydrocolloids, Advances in Chemistry;
Washington DC, Ameridan Chemical Society, 10.
Pilnik W., Voragen A. G. J., (1991). In: Food Enzymology; London, Elsevier Applied Science, 303-306.
Ralet M. C., Bonnin E., Thibault J.-F. (2001). Chromatographic study of highly methoxylated lime pectins de-
esterified by different pectin methyl-esterases. Journal of Chromatography B, 753, 157-166.
Ralet M. C., Thibault J.-F. (2002). Interchain heterogeneity of enzymatically deesterified lime pectins.
Biomacromolecules, 3, 917-925.
Rolin C., (2002). Commercial pectin preparations. In: Pectins and their Manipulation; Seymour G. B., Knox J.
P., Blackwell Publishing Ltd, 222-239.
Schols H. A., Reitsma J. C. E., Voragen A. G. J., Pilnik W. (1989). High-performance ion exchange
chromatography of pectins. Food Hydrocolloids., 3, (2), 115-121.
Solms J., Deuel H. (1955). Uber den mechanismum der enzymatischen verseifung von pektinstoffen. Helvetica
Chimica Acta, 38, 321-329.
Thibault J.-F. (1979). Automatisation du dosage des substances pectiques par la méthode au méta-
hydroxydiphenyl. Lebensmittel Wissenschaft und Technologie, 12, 247-251.
Thibault J.-F., Rinaudo M. (1986). Chain association of pectic molecules during calcium-induced gelation.
Biopolymers, 25, 456-468.
Tollier M. T., Robin J. P. (1979). Adaptation de la méthode à l'orcinol sulfurique au dosage automatique des
glucides neutres totaux: conditions d'application aux extraits d'origine. ann. techno. agric., 28, (1), 1.
Van Deventer-Schriemer W. H., Pilnik W. (1987). Studies on pectin degradation. Acta Alimentaria, 16, 143.
Vincken J.-P., Schols H. A., Oomen R. J. F. J., McCann M. C., Ulvskov P., Voragen A. G. J., Visser R. G. F.
(2003). If homogalacturonan were a side chain of rhamnogalacturonan I. Implications for cell wall
architecture. Plant Physiology, 132, 1781-1789.
Voragen A. G. J., Pilnik W., Thibault J.-F., Axelos M. A. V., Renard C. M. G. C., (1995). Pectins. In: Food
polysaccharides and their applications; Stephen A. M., New York: Marcel Dekker Inc., 287-339.
39
Chapter 2
40
Wood P. J., Siddiqui I. R. (1971). Determination of methanol and its application to measurement of pectin ester
content and pectin methyl-esterase activity. Analytical Biochemistry, 93, 418-428.
Chapter 3
Populations having different GalA blocks characteristics
are present in commercial pectins which are
chemically similar but have different functionalities. Published as
S.E. Guillotin, E.J. Bakx, P. Boulenguer, J. Mazoyer, H.A. Schols and A. G. J. Voragen. Carbohydate polymers:
30, 391-398 (2005).
Abstract
Two commercially extracted pectins having different physical properties but similar chemical
characteristics were fractionated into sub-populations by using ion exchange chromatography.
Individual sub-populations were characterised by using established strategies (galacturonic
acid and neutral sugar content, degree of methyl-esterification) including the use of enzymes
(endo- and exo-polygalacturonases) as analytical tool. Some purified populations showed
similar degree of methyl-esterification whereas they were eluting at different ionic strength. It
was shown that these populations mainly differed in the number of galacturonic acid moieties
in ‘endo-polygalacturonase degradable blocks’ and in the location of these blocks within the
molecule. The size of the blocks present at the non-reducing end of the pectin was also
different within the molecules. The separation of pectins on anion exchanger combined with
the use of enzymes allowed us to differentiate between pectic sub-populations. Commercial
pectins appeared to be a mixture of several polymers differing in total charge as well as in the
distribution of the charges.
41
Chapter 3
1. Introduction
Pectins are mainly present in the primary cell wall and in the middle lamella of plants.
They constitute around 40 % (dry matter basis) of the cell wall of fruits and vegetables (Brett
& Waldron, 1996). The nature of pectin depends on the origin, the growing and harvesting
conditions of the crop and also on its localisation in the plant tissue and cell wall. Pectins are
complex mixtures of polysaccharides composed of a galacturonic acid backbone
(homogalacturonan or so-called smooth regions) of which variable proportions can be methyl-
esterified. In addition, so-called hairy regions are present, constituted of alternative sequences
of rhamnose and galacturonic acid (rhamnogalacturonan I) carrying variously sized neutral
side chains (arabinans, arabinogalactans) attached to rhamnose moieties (Pilnik & Voragen,
1991; Voragen, Pilnik, Thibault, Axelos & Renard, 1995). Pectins are used as food
ingredients mainly for their gelling properties, while also pharmaceutical properties as
antidiarrhea, detoxicant, regulation and protection of gastrointestinal tract and anti-tumour
activity have been mentioned (Voragen et al., 1995; Waldron & Selvendran, 1993). Different
plant materials are used for the extraction of pectins (e.g. citrus peel, apples pomace and sugar
beet pulp) and differences in functional properties are observed according to the process and
origin of the raw material. It is known that gelling properties of commercial pectins strongly
depend on the degree of methyl-esterification of the galacturonic acid residues (Voragen et
al., 1995). Nevertheless, various pectins with similar chemical characteristics (galacturonic
acid (GalA) and neutral sugar (NS) content, degree of methyl-esterification (DM)) may
behave differently in gel formation.
In addition to the common chemical characterisation of pectins (determination of the GalA
content and DM), new parameters to distinguish pectins were introduced (Daas, Alebeek,
Voragen & Schols, 1999; Daas, Arisz, H.A., De Ruiter & Voragen, 1998; Daas, Meyer-
Hansen, Schols, De Ruiter & Voragen, 1999; Daas, Voragen & Schols, 2000, 2001; Korner,
Limberg, Mikkelsen & Roepstorff, 1998; Limberg et al., 2000). Daas et al. used enzymatic
degradation of the pectins with an endo-polygalacturonase of Kluyveromyces fragilis and
analysed the partially methylated oligogalacturonides released. From these data they defined
the degree of blockiness (DB) of pectins represented by the amount of non methyl-esterified
mono-, di- and trigalacturonic acid released by the enzyme relative to the total amount of non-
methylesterified galacturonide residues present in the pectin. The higher the DB of pectins
having a similar DM, the more blockwise the distribution of the methyl-esters in the pectin.
42
Analysis of HM pectins on preparative anion exchange chromatography
Pectins having similar DM and DB values, may still differ in the size of the blocks. This
difference can be characterised by a second parameter: the proportion of mono-, di- and
trigalacturonic acid in the endo-PG digests. Long degradable blocks will lead to the release of
high amounts of di- and trigalacturonic acid compared to monogalacturonic acid upon
enzymatic digestion. The third parameter described by Daas et al. is the ratio of the total peak
area of oligomers with methyl-esters to the total of peak areas of oligomers without methyl-
esters (Me+/Me- ratio). This is an indication of the location of the degradable blocks within
the backbone: the higher this ratio, the more clustered are the degradable blocks distributed
over the pectin molecule (Daas, Alebeek et al., 1999; Daas et al., 1998; Daas, Meyer-Hansen
et al., 1999; Daas et al., 2000).
Chromatography performed on an anion exchange column (Schols, Reitsma, Voragen &
Pilnik, 1989) or size exclusion column (Kravtchenko, Berth, Voragen & Pilnik, 1992) showed
that commercial pectins were not composed of one single pectic population but they are
constituted of various populations with different features. Anger and Dongowski (1984),
Schols et al. (1989) and Kravtchenko, Voragen, and Pilnik (1992) suggested that elution on an
anion exchange column may vary according to the degree of methyl-esterification, but as well
as to the distribution of the charges. More recently, Ralet and Thibault (2002) studied the
effect of charge distribution on the behavior on an anion exchanger of pectins demethylated
by plant PME or fungus PME using conductometric measurements. In their study they could
not show any influence of the charge distribution on the elution on an anion exchanger.
Until now, the approach of Daas, Alebeek et al. (1999), Daas et al. (1998), Daas, Meyer-
Hansen et al. (1999), Daas et al. (2000, 2001) using the DB, mono-, di- and trigalacturonic
proportions and the Me+/Me- ratio of a pectin preparation “as is” has not been extended with
fractionation of the pectin into sub-populations and characterisation of these sub-populations.
This approach would enable the estimation of the intramolecular distribution (distribution of
methyl-esters within one pectic molecule) as well as the intermolecular distribution of methyl-
esters (distribution of methyl-esters over several pectic molecules). These distributions are
expected to be related to the gelling behaviour in the presence of calcium. In this research,
two pectins having different calcium reactivity and extracted from the same raw material with
similar chemical characteristics are studied using these state-of-the-art approaches and tools.
43
Chapter 3
2. Experimental
2.1. Samples
The samples were kindly provided by Degussa Texturant Systems (Baupte, France). Pectins A
and B were selected for having nearly the same degree of methyl-esterification (DM of 74%
and 72%, respectively), galacturonic acid content (GalA of 82% w/w and 74 % w/w,
respectively) and intrinsic viscosity but different calcium sensitivity (Laurent & Boulenguer,
2003). The intrinsic viscosity and the calcium sensitivity have been published already
(Laurent & Boulenguer, 2003). Pectin A, also called calcium sensitive (CS) pectin and pectin
B, also called Non Calcium Sensitive (NCS) have an intrinsic viscosity of 723 and 739 ml/g
and a calcium sensitivity of 297 mPa.s-1 and 39 mPa.s-1, respectively (Laurent & Boulenguer,
2003).
2.2. Size exclusion chromatography of pectins
High-performance size exclusion chromatography (HPSEC) was performed with three Tosoh
Biosciences TSK gel columns (G 4000, 3000, 2500 PWXL, each 300 × 7.5 mm) in series and
in combination with a PWXL guard column (Tosoh Biosciences; 40 × 6 mm). Elution was
performed at 30° C with 0.2 M sodium nitrate at 0.8 ml/min. The eluate was monitored using
a Shodex SE-61 refractive index detector. Twenty µl of pectin (5 mg/ml) was injected.
2.3. Preparative chromatography of commercial pectins
An Akta explorer system was used for separation of pectins on a preparative scale. Pectin (0.5
g) was dissolved in 100 ml of 0.03 M of sodium phosphate buffer. Elution was performed on
a Source-Q column (115 × 60 mm; Amersham Biosciences) using ‘Millipore’ water during 4
column volumes (CV) followed by a linear gradient in steps: 0-0.12 M of sodium phosphate
buffer (pH 6) in 13 CV at 60 ml/min; 0.12-0.42 M of sodium phosphate buffer (pH 6) in 44
CV; 0.42-0.6 M sodium phosphate (pH 6) in 2 CV and finally 8.5 CV of 0.6 M sodium
phosphate pH 6. The column was washed with 1 M sodium hydroxide for 5 CV. Detection
was accomplished with an UV detector set at 215 nm.
The fractions (250 ml) were pooled and ultrafiltrated with a Pellicon 10 kDa membrane (size
of 50 cm2) till a conductivity of < 10 µS. After ultrafiltration, the fractions were freeze-dried.
44

Analysis of HM pectins on preparative anion exchange chromatography
Then the different pools were resuspended and dialysed with dialysis tubing (cut of 12-14
kDa for proteins) against ‘Millipore water’ to remove last traces of salts prior to freeze-
drying.
2.4. Uronic acid and neutral sugar content
Pectins (60 µg/ml) were boiled (1h), cooled and then saponified with sodium hydroxide
(40mM). The uronic acid content was determined by the automated colorimetric m-
hydroxydiphenyl method (Ahmed & Labavitch, 1977; Blumenkrantz & Asboe-Hansen, 1973;
Thibault, 1979). Total neutral sugars were estimated with the automated orcinol method
(Tollier & Robin, 1979), using galactose as a standard. Populations A5 and B5 were not
soluble, so, a pre-hydrolysis step with sulfuric acid (72% in w/w) was performed on these
samples prior to the colour reaction.
2.5. Neutral sugar content
The neutral sugar composition was determined by gas chromatography according to Englyst
and Cummings (1984) using inositol as an internal standard. The samples were treated with
72% (w/w) H2SO4 (1h, 30 °C) followed by hydrolysis with 1 M H2SO4 for 3 h at 100 °C and
the constituent sugars released were analysed as their alditol acetates.
2.6. Methyl-ester content
The methyl-ester content was determined by GC headspace analysis of the free methanol
released after alkaline de-esterification of pectins (Huisman, Oosterveld & Schols, 2004).
2.7. Degree of blockiness
The degree of blockiness has been determined as described previously (Daas, Meyer-Hansen
et al., 1999; Daas et al., 2000). Samples (5 mg/ml) were diluted in sodium acetate 50 mM pH5
and incubated with an overdose of endo-polygalacturonase of Kluyveromyces fragilis (0.04
units/ml) for 24 hours. The specific activity of this enzyme for PGA was 128 U/mg. Pectin
digests were prepared by incubation of pectic solution with endo-polygalacturonase (0.04
units/ml) for 24 hours. As a result of the extended endo-polygalacturonase incubation
employed, end-products were observed as was demonstrated by the use of an excess of
45
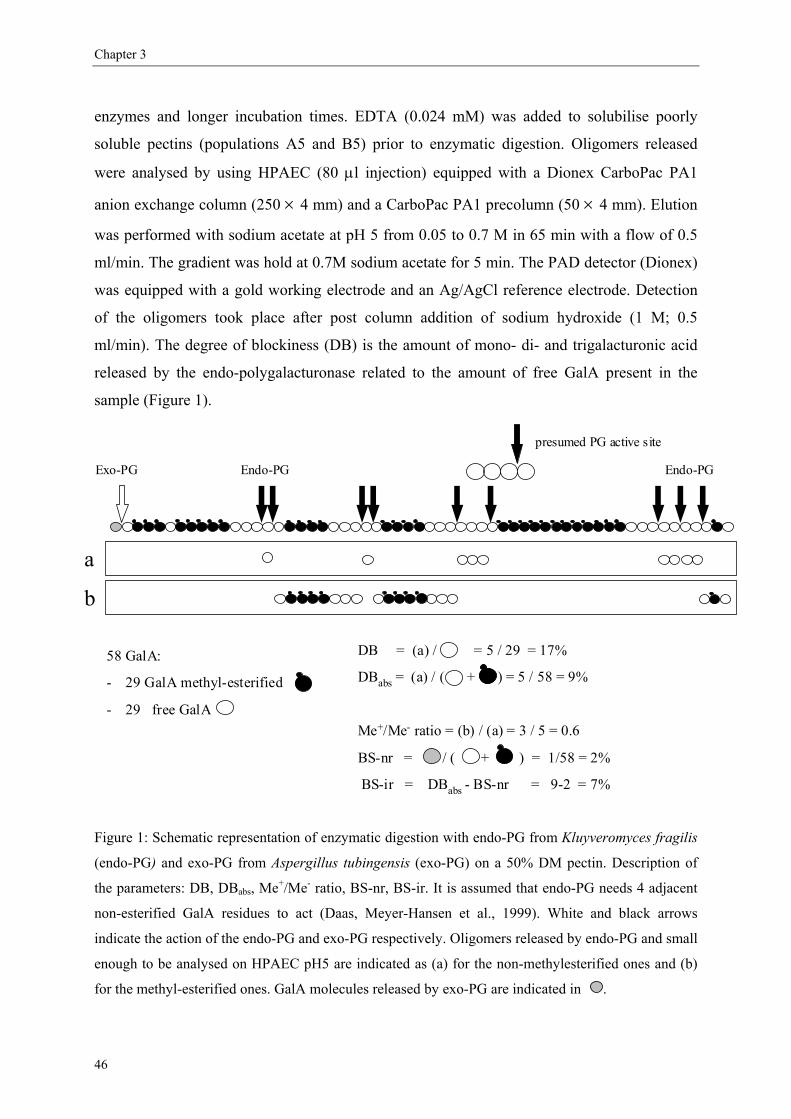
Chapter 3
enzymes and longer incubation times. EDTA (0.024 mM) was added to solubilise poorly
soluble pectins (populations A5 and B5) prior to enzymatic digestion. Oligomers released
were analysed by using HPAEC (80 µl injection) equipped with a Dionex CarboPac PA1
anion exchange column (250 × 4 mm) and a CarboPac PA1 precolumn (50 × 4 mm). Elution
was performed with sodium acetate at pH 5 from 0.05 to 0.7 M in 65 min with a flow of 0.5
ml/min. The gradient was hold at 0.7M sodium acetate for 5 min. The PAD detector (Dionex)
was equipped with a gold working electrode and an Ag/AgCl reference electrode. Detection
of the oligomers took place after post column addition of sodium hydroxide (1 M; 0.5
ml/min). The degree of blockiness (DB) is the amount of mono- di- and trigalacturonic acid
released by the endo-polygalacturonase related to the amount of free GalA present in the
sample (Figure 1).
presumed PG active site
58 GalA:
- 29 GalA methyl-esterified
- 29 free GalA
DB = (a) / = 5 / 29 = 17%
DBabs = (a) / ( + ) = 5 / 58 = 9%
Me+/Me- ratio = (b) / (a) = 3 / 5 = 0.6
BS-nr = / ( + ) = 1/58 = 2%
BS-ir = DBabs - BS-nr = 9-2 = 7%
Endo-PGExo-PG Endo-PG
a
b
Figure 1: Schematic representation of enzymatic digestion with endo-PG from Kluyveromyces fragilis
(endo-PG) and exo-PG from Aspergillus tubingensis (exo-PG) on a 50% DM pectin. Description of
the parameters: DB, DBabs, Me+/Me- ratio, BS-nr, BS-ir. It is assumed that endo-PG needs 4 adjacent
non-esterified GalA residues to act (Daas, Meyer-Hansen et al., 1999). White and black arrows
indicate the action of the endo-PG and exo-PG respectively. Oligomers released by endo-PG and small
enough to be analysed on HPAEC pH5 are indicated as (a) for the non-methylesterified ones and (b)
for the methyl-esterified ones. GalA molecules released by exo-PG are indicated in .
46
Analysis of HM pectins on preparative anion exchange chromatography
The absolute degree of blockiness (DBabs) is the amount of mono- di- and trigalacturonic acid
released by the endo-polygalacturonase related to the total amount of GalA (free and methyl-
esterified GalA) present in the sample (Figure 1).
2.8. Free GalA blocks at the non-reducing end
Samples (5mg/ml) were diluted in sodium acetate 50 mM and incubated with exo-
polygalacturonase of Aspergillus tubingensis (Kester, Someren, Muller & Visser, 1996). The
specific activity of this enzyme for PGA was 118U/mg. Pectin digests were prepared by
incubation of pectic solution with exo-polygalacturonase (0.04 units/ml) for 24 hours.
MonoGalA from the exo-polygalacturonase digests samples was analysed on HPAEC at
pH12 equipped with a Dionex Carbopac PA1 column (250 × 4 mm) and a CarboPac PA-1
precolumn (50 × 4 mm). Sample (50 µl of 5 mg/ml pectin digest) was injected on the column
and elution started with a pre-equilibration step of 15 min with 0.1 M NaAcetate in 0.1 M
NaOH (1 ml/min) followed by a linear gradient of 1 M NaAcetate in 0.1 M NaOH (0.01 M-1
M during 60 min) and a washing step of 5 min with 1 M NaAcetate in 0.1 M NaOH.
Oligomers were detected with a PAD-detector (Dionex) equipped with a gold working
electrode and an Ag/AgCl reference electrode. During each series, the PAD response area of a
standard amount of monoGalA (0.2 mg/ml) was determined. The amount of free GalA present
at the non reducing end related to the amount of total GalA in the sample is determined and
defined as the so-called Block Size at the Non Reducing end; BS-nr (Figure 1). The amount
of GalA present interior and/or at the reducing end of the sample is determined as well (so-
called Block Size Interior and/or at the Reducing end; BS-ir, Figure 1).
3. Results and discussion
3.1. Fractionation of commercial pectin preparations in sub-fractions on preparative anion
exchange chromatography
Two commercial HM pectins (pectins A and B) originating from the same citrus variety
showed totally different gelling properties in presence of calcium. The chemical
characteristics (GalA, NS, DM; Table I) of these pectins did not explain the different gelling
behavior since they were similar. Schols et al. (1989) were able to separate pectic populations
present in commercial pectins with different degree of methyl-esterification (DM) according
47
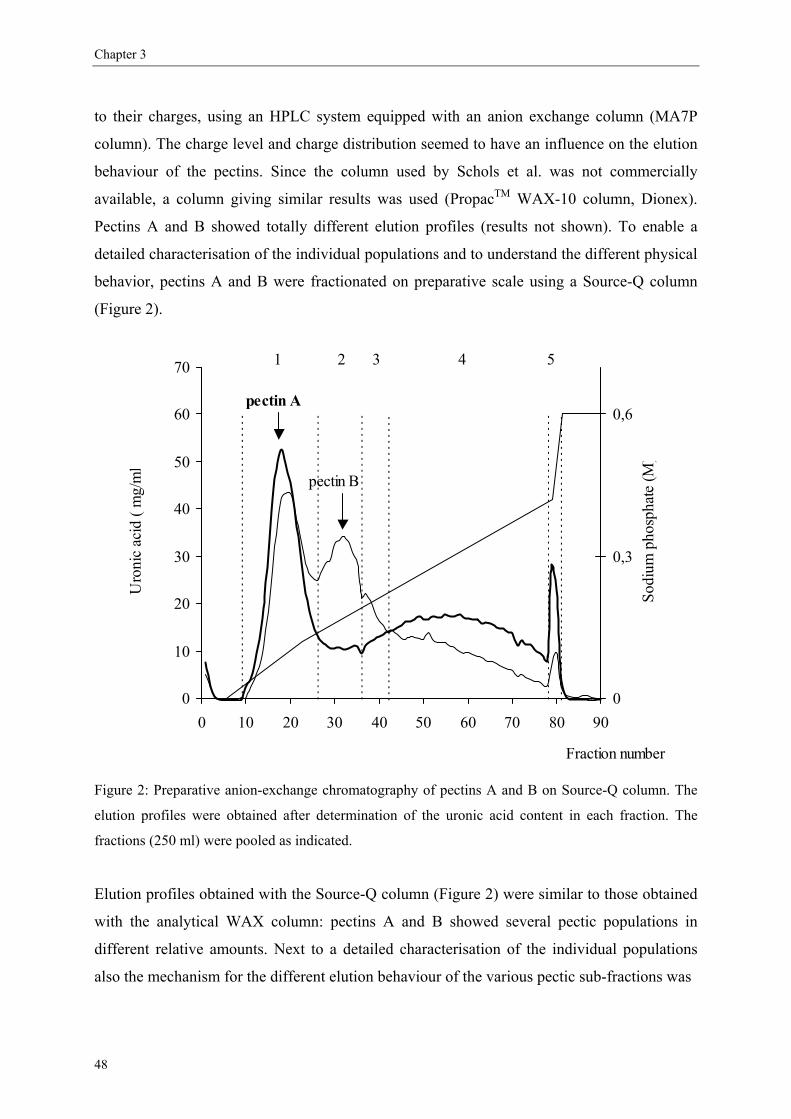
Chapter 3
to their charges, using an HPLC system equipped with an anion exchange column (MA7P
column). The charge level and charge distribution seemed to have an influence on the elution
behaviour of the pectins. Since the column used by Schols et al. was not commercially
available, a column giving similar results was used (PropacTM WAX-10 column, Dionex).
Pectins A and B showed totally different elution profiles (results not shown). To enable a
detailed characterisation of the individual populations and to understand the different physical
behavior, pectins A and B were fractionated on preparative scale using a Source-Q column
(Figure 2).
0
10
20
30
40
50
60
70
0 10 20 30 40 50 60 70 80 90
Fraction number
Uro
nic
acid
( m
g/m
l
0
0,3
0,6
Sodi
um p
hosp
hate
(M)
pectin A
pectin B
1 2 3 4 5
Figure 2: Preparative anion-exchange chromatography of pectins A and B on Source-Q column. The
elution profiles were obtained after determination of the uronic acid content in each fraction. The
fractions (250 ml) were pooled as indicated.
Elution profiles obtained with the Source-Q column (Figure 2) were similar to those obtained
with the analytical WAX column: pectins A and B showed several pectic populations in
different relative amounts. Next to a detailed characterisation of the individual populations
also the mechanism for the different elution behaviour of the various pectic sub-fractions was
48
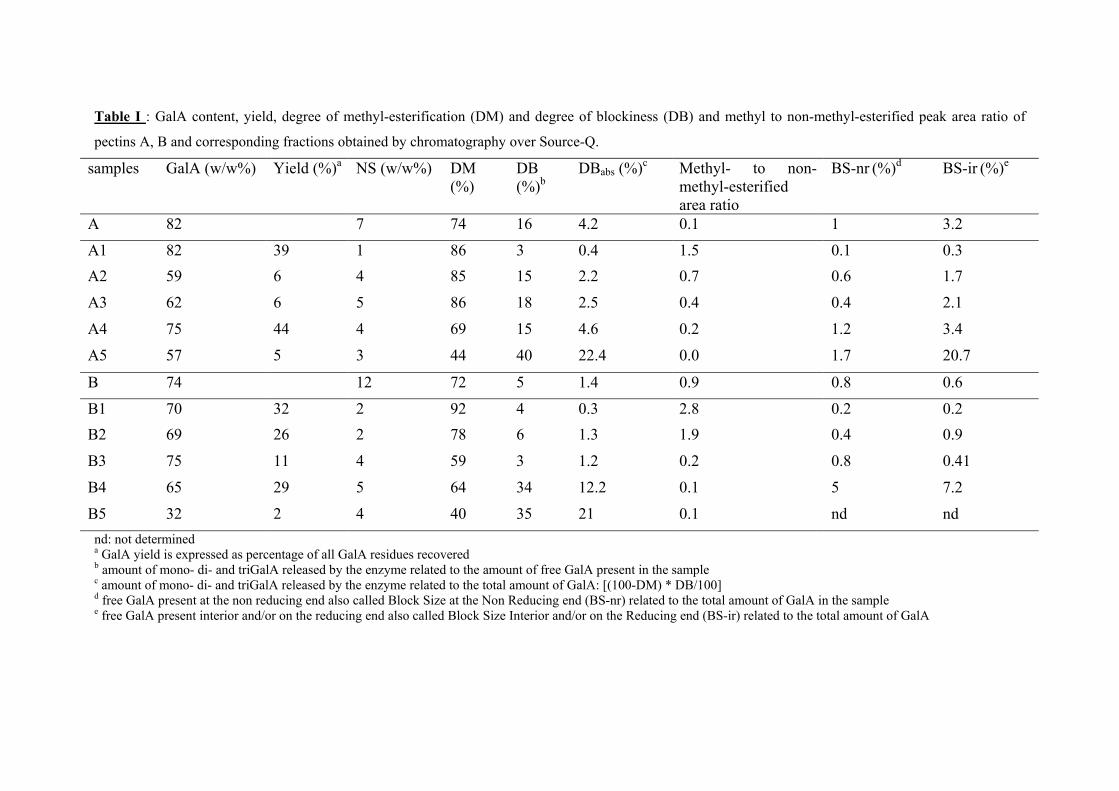
Table I : GalA content, yield, degree of methyl-esterification (DM) and degree of blockiness (DB) and methyl to non-methyl-esterified peak area ratio of
pectins A, B and corresponding fractions obtained by chromatography over Source-Q.
samples GalA (w/w%) Yield (%)a NS (w/w%) DM (%)
DB (%)b
DBabs (%)c Methyl- to non-methyl-esterified area ratio
BS-nr (%)d BS-ir (%)e
A 82 7 74 16 4.2 0.1 1 3.2
A1 82 39 1 86 3 0.4 1.5 0.1 0.3A2
59 6 4 85 15 2.2 0.7 0.6 1.7
A3 62 6 5 86 18 2.5 0.4 0.4 2.1
A4 75 44 4 69 15 4.6 0.2 1.2 3.4
A5 57 5 3 44 40 22.4 0.0 1.7 20.7
B 74 12 72 5 1.4 0.9 0.8 0.6
B1 70 32 2 92 4 0.3 2.8 0.2 0.2B2
69 26 2 78 6 1.3 1.9 0.4 0.9
B3 75 11 4 59 3 1.2 0.2 0.8 0.41
B4 65 29 5 64 34 12.2 0.1 5 7.2
B5 32 2 4 40 35 21 0.1 nd ndnd: not determined
a GalA yield is expressed as percentage of all GalA residues recovered b amount of mono- di- and triGalA released by the enzyme related to the amount of free GalA present in the sample c amount of mono- di- and triGalA released by the enzyme related to the total amount of GalA: [(100-DM) * DB/100] d free GalA present at the non reducing end also called Block Size at the Non Reducing end (BS-nr) related to the total amount of GalA in the sample e free GalA present interior and/or on the reducing end also called Block Size Interior and/or on the Reducing end (BS-ir) related to the total amount of GalA
49
Analysis of HM pectins on preparative anion exchange chromatography
subject for further studies. So fractions were pooled, ultra-filtrated before freeze-drying and
further analysed.
3.2. Chemical characterisation of the different populations obtained after preparative
Source-Q chromatography
3.2.1. Galacturonic acid and neutral sugar content in pectic populations
The recovery of pectin was measured by comparison of the GalA content of the injected
sample and the GalA content measured in all fractions. Pectins A and B were recovered after
chromatography for 76% and 79%, respectively. These values are not uncommon in this scale
of chromatography (Kravtchenko, Voragen et al., 1992). Fractions eluted from the column
were analysed for GalA content, DM and DB. The length and distribution of the blocks were
also studied (Figure 1). It is shown in Table I that the GalA content was quite high for
populations 1-4 from both pectins A and B and lower for the populations eluted with a higher
ionic strength (populations A5 and B5). This phenomenon was observed previously by
Kravtchenko, Berth et al. (1992). The neutral sugar content was low for all the populations
(from 1 to 5%, w/w). The non-carbohydrate material may be due to insufficient removal of
salts by ultrafiltration.
3.2.2. Degree of methyl-esterification in the various pectic populations
As charge and charge density are the most important parameters that influence the elution of
pectic polysaccharides from an anion exchange column (Schols et al., 1989), the DM of all
the pectin pools was determined. In general, pectic molecules with a lower DM were bound
more strongly to the column and needed thus higher salt concentrations to be eluted (Table I).
This is in agreement with the findings of Kravtchenko, Berth et al. (1992) for lemon pectins
eluted from a DEAE-Sepharose column. However, some populations with similar DM were
found to elute at different buffer concentrations: sub-population A1, A2 and A3 (all DM 86)
eluted at 0.1, 0.17 and 0.21 M buffer respectively. On the other hand, populations A3 and B3
presented different DM values whereas they eluted at the same ionic strength. These
observations may be explained by a different distribution of the methyl-esters over the pectin
backbone. To check this hypothesis the degree of blockiness, reflecting the distribution of
methyl-esters over the pectic backbone, was determined. Some results are in contrast with
50
Chapter 3
Kravtchenko, Berth et al. (1992) since the latest pectins eluted (A5 and B5) presented a low
DM (44% and 40% DM, respectively).
3.2.3. Degree of blockiness of the pectic populations
All pectic populations were digested with polygalacturonase of Kluyveromyces fragilis (PGkf)
and degradation products were analyzed and quantified using HPAEC pH 5. All oligomers
observed in the elution pattern have been previously identified using Maldi-TOF MS (Daas et
al., 1998). From these results, two different parameters were determined: the DB and the
Me+/Me- ratio (Daas, Meyer-Hansen et al., 1999; Daas et al., 2000) (Table I). A high DB
value is indicative for a blockwise distribution of non-esterified galacturonic acid residues in a
pectin. The Me+/Me- ratio is indicative for the distribution of the non-esterified GalA ‘blocks’
over the pectin backbone (Daas et al., 2000). The higher this ratio, the closer the non-
esterified GalA ‘blocks’ are. The mother pectin B presented a more random distribution of the
methyl-esters than parental pectin A since the DB is 5% for pectin B and 16% for pectin A
(Table I). These values fit in the range mentioned by Daas, Meyer-Hansen et al. (1999): DB
of 1% for a random DM70 pectin (R70) and DB of 11% for a blockwise DM70 (B71).
To check whether the populations of pectins A and B had different charge distributions, the
DB of each sub-fraction was analyzed. For similar DM pectins (populations A1- A3), the DB
value is increasing for populations eluting at higher ionic strength (DB of 3% for pectin A1,
15% for pectin A2 and 18% pectin A3). As expected on forehand, the more blockwise the
distribution of free GalA residues within the pectin (higher DB), the later the pectin eluted.
The DB gives information about the presence of blocks (3 to 18% of all non-esterified GalA
residues are grouped for pectin A1-A3). It is obvious that the DB is not enough to explain the
elution behavior of the sub-populations on the anion exchanger. For example, populations A3
and A4 are both blockwise pectins but the DM is different so the proportion of blocks is
different. Taking this into account, we introduced the DBabs (Figure 1). This parameter gives
information about the absolute number of blocks in the pectin samples without correction of
the DM (Figure 1). It is clear that blocks of free GalA were influencing the elution behavior
of the pectins: the more blocks of non-methyl-esterified GalA in the pectic sample, the later
the elution is (Table I). The DBabs was increasing from 0.4% for A1 to 22% for A5 and from
0.3% for B1 to 21% for B5. Only fraction B2 was slightly deviating from this rule. This
fraction B2 contained a few more blocks or larger ones than pectin B3, while these blocks
51
Analysis of HM pectins on preparative anion exchange chromatography
were closer to each other compared to pectin B3 (Me+/Me- ratio was, respectively, 1.9 and
0.2). Anger and Dongowski (1984), Schols et al. (1989) and Kravchentko, Voragen et al.
(1992) explained the elution behavior by the charge distribution. Our results confirmed this
hypothesis although our findings differed from the results published recently by Ralet and
Thibault (2002) using a DEAE-Sepharose CL-6B column for chromatography of pectins.
It has also been noticed above, that pectins A3 and B3 eluted at the same ionic strength
whereas their DM were different (86% and 59%, respectively). The DBabs of population A3
(2.5%; Table I) was higher compared to DBabs of population B3 (1.2%). Also the Me+/Me-
ratio of fraction A3 was twice as high than that for fraction B3 (0.4% and 0.2%, respectively).
So less degradable blocks were present in pectin B3, but more distant from each others
compared to the pectin A3. This may explain their similar binding on the anion exchanger.
Obviously, the co-elution of a 86% DM pectin having some blocks of GalA residues with a
random 59% DM pectin complicated the interpretation of anion exchange patterns, but the
enzymatic degradation of these populations showed us that these pectins were different
concerning the amount and distribution of free GalA blocks. Another surprising finding was
the co-elution of populations A2 and B2 with similar DM but different DBabs (2.2% and 1.3%,
respectively) and Me+/Me- ratio (0.7 and 1.9, respectively). Population B2 contained less
‘endo-PG degradable’ blocks more clustered compared to population A2. These data revealed
that the anion exchange column does not make any distinction between the ‘random’ pectin
B2 with some clustered but rather short GalA blocks and the blockwise pectin A2 with only
few, more distant blocks. Our findings clearly showed that the column was not able to
distinguish between all different pectin populations present, but the enzymatic degradation of
the pectins showed that this populations presented different endo-PG degradable blocks.
3.2.4. Does the molecular size distribution influence the behaviour of the pectic populations
in anion exchange chromatography?
To establish whether the molecular size of the various populations could explain their
behaviour on the anion exchange column, each pectic population was analysed by high
performance size exclusion chromatography (HPSEC). It can be seen that the molecular size
was slightly higher for pectins eluting at high ionic strength (Figure 3) except for population
A5. Since HPSEC elution profiles from most of the pectic populations showed rather similar
molecular distribution in the range of 100-43 kDa (18-24 min; Figure 3), it could be
52
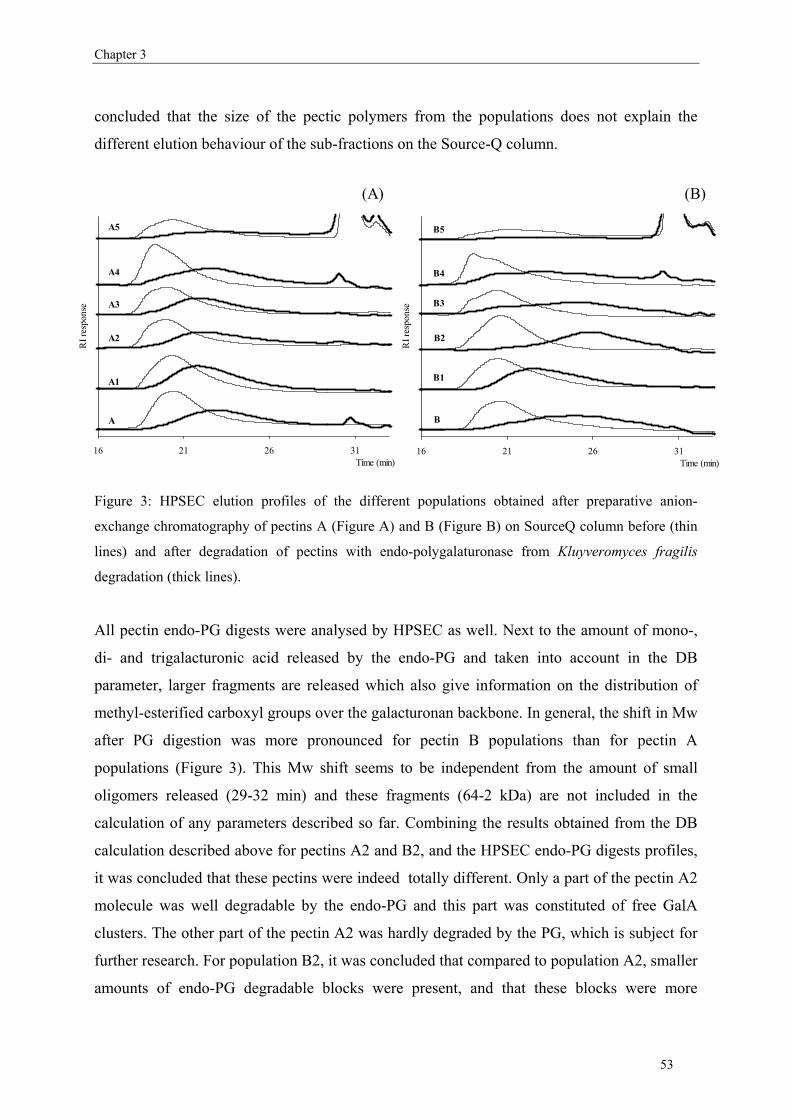
Chapter 3
concluded that the size of the pectic polymers from the populations does not explain the
different elution behaviour of the sub-fractions on the Source-Q column.
16 21 26 31Time (min)
RI r
espo
nse
B1
B2
B3
B4
B5
B
16 21 26 31Time (min)
RI r
espo
nse
A1
A2
A3
A4
A5
A
(A) (B)
Figure 3: HPSEC elution profiles of the different populations obtained after preparative anion-
exchange chromatography of pectins A (Figure A) and B (Figure B) on SourceQ column before (thin
lines) and after degradation of pectins with endo-polygalaturonase from Kluyveromyces fragilis
degradation (thick lines).
All pectin endo-PG digests were analysed by HPSEC as well. Next to the amount of mono-,
di- and trigalacturonic acid released by the endo-PG and taken into account in the DB
parameter, larger fragments are released which also give information on the distribution of
methyl-esterified carboxyl groups over the galacturonan backbone. In general, the shift in Mw
after PG digestion was more pronounced for pectin B populations than for pectin A
populations (Figure 3). This Mw shift seems to be independent from the amount of small
oligomers released (29-32 min) and these fragments (64-2 kDa) are not included in the
calculation of any parameters described so far. Combining the results obtained from the DB
calculation described above for pectins A2 and B2, and the HPSEC endo-PG digests profiles,
it was concluded that these pectins were indeed totally different. Only a part of the pectin A2
molecule was well degradable by the endo-PG and this part was constituted of free GalA
clusters. The other part of the pectin A2 was hardly degraded by the PG, which is subject for
further research. For population B2, it was concluded that compared to population A2, smaller
amounts of endo-PG degradable blocks were present, and that these blocks were more
53
Analysis of HM pectins on preparative anion exchange chromatography
randomly distributed over the pectic backbone. This explained the large decrease in Mw of
pectin B2 compared to pectin A2. The same phenomenon was observed for populations A3
and B3.
3.2.5. GalA blocks present at the non reducing end, interior and/or at the reducing end
The presence of endo-PG degradable blocks at the extremities of the molecule may also lead
to a less pronounced decrease in Mw for pectin A polymers compared to those of pectin B. To
obtain more information about the localisation of free GalA blocks in the galacturonan
backbone, an exo-polygalacturonase (exo-PG) was used to degrade the pectins. Since this
enzyme is known to release only non-methyl-esterified GalA from the non-reducing end of
pectins (Benen, Vincken & Alebeek, 2002) and needs two non-methyl-esterified GalA to act
(only one free GalA at the non-reducing end is not a substrate for the exo-PG) (Korner,
Limberg, Christensen, Mikkelsen & Roepstorff, 1999; Limberg et al., 2000), it is possible to
determine whether pectins contain different block sizes of un-esterified GalA at the non-
reducing end. Exo-PG digests were analysed with HPAEC at pH 12. Only monogalacturonic
acid is released by the enzyme during pectin digestion. The amount of GalA released by the
exo-PG, related to the total amount of GalA present on the pectin (Block Sequence on the
Non Reducing end: BS-nr), was 1% for pectin A and 0.8% for pectin B. So pectin A was
slightly more degraded with exo-PG (Table I). This indicated the presence of larger blocks of
non-methyl-esterified GalA on the non-reducing end for pectin A. These results can be
compared with previous results of Limberg et al. (2000) where the authors also analysed the
exo-PG digests of a pectin with similar chemical characteristics as pectin A (blockwise pectin
with a DM of 76, reference P76 in the publication). Based on their published values, we
calculated that they found a BS-nr of 1.4 % which is in the same range of the BS-nr of 1%
found in our study for pectin A. The BS-nr increased for populations eluting at increasing
ionic strength except for populations A3 (BS-nr of 0.4% compared to 0.6% for population
A2). In general, we can assume that the longer the block of free GalA on the non-reducing
end of pectins, the later is the elution. The DBabs is giving information on the block recurrence
over the galacturonan backbone. The exo-PG is giving information about the GalA blocks
present at the non-reducing end. Therefore, it is possible to determine the amount of blocks in
the interior and/or in the reducing end of the galacturonan backbone by determining the BS-ir
(Block Sequence Inside and on the Reducing end) parameter. This parameter was calculated
54
Chapter 3
by substracting the DBabs with the BS-nr (Block Sequence on the Non-Reducing end). From
the data presented in Table I, we deduced that the higher the amount of GalA in block
sequences located in the interior and/or on the reducing end, the stronger was the binding of
the pectin on the anion exchanger. The BS-ir was 0.3% for population A1 and increased up to
20.7% for pectin A5. Population B3 was deviating from this rule. These results may explain
the differences in elution behaviour of the pectic populations. Pectins were shown to be
different from each other by different localisation of the free GalA blocks: some pectins
presented more blocks on the non-reducing end, others on the reducing end and/or inside the
pectic backbone.
Conclusions
Commercial pectins showed to be a mixture of different populations which can be separated
on a preparative Source-Q column. This lead to differentiations between pectins with similar
chemical features but different gelling behaviour. Separation of the pectins was depending on
the DM as observed previously (Kravtchenko, Voragen et al., 1992; Schols et al., 1989) but
the degree of blockiness (DBabs) influenced the elution behaviour as well which is in
agreement with previous suggestions (Schols et al., 1989). The position of the non methyl-
esterified GalA blocks is also varying in the populations purified from the parental
commercial pectin. Nevertheless, it is important to notice that some populations with similar
DM and different distribution of the methyl-esters eluted at the same ionic strength, which
made it difficult to interpret anion exchange elution patterns. The parameters described by
Daas, Meyer-Hansen et al., (1999) and Daas et al. (2000) to characterise pectins in terms of
size and type of distribution of free GalA blocks over the galacturonan backbone is not fully
adequate. The parameters described in this study (DBabs, BS-nr and BS-ir) and elaborated on
the method of Daas, Meyer-Hansen et al., (1999) and Daas et al. (2000) and Limberg et al.
(2000), provided further valuable information on the fine structure of more homogeneous
pectic populations and on the behaviour of these pectins on an anion exchanger.
The combination of HPAEC and enzymatic digestion allowed us to visualise and characterise
the different pectic polymers present in commercial pectins.
Acknowledgments: the authors would like to thank Dr Jac Benen who kindly provided the
exo-polygalacturonase used in this study.
55
Analysis of HM pectins on preparative anion exchange chromatography
References
Ahmed A. E. R., Labavitch J. M. (1977). Journal of Food Biochemistry, 1, 361-365.
Anger H., Dongowski G. (1984). Die Nahrung., 28, 199-206.
Benen J. A. E., Vincken J.-P., Alebeek G.-J. V., (2002). Microbial pectinases. In: Pectins and their
Manipulation; Seymour G. A., Tucker G. B. , Blackwell Publishing Ltd., 174-215.
Blumenkrantz N., Asboe-Hansen G. (1973). New method for quantitative determination of uronic acids.
Analytical Biochemistry, 54, 484-489.
Brett C., Waldron K., (1996). Physiology and biochemistry of plant cell walls. Cambridge.
Daas P. J. H., Alebeek G. J. W. M. v., Voragen A. G. J., Schols H. A., (1999). Determination of the distribution
of non-esterified glacturonic acid in pectin with endo-polygalacturonase. In: Gums and Stabilisers for
the food industry; Williams P. A., Phillips G. O., Wrexham: The Royal Society of Chemistry, 3-18.
Daas P. J. H., Arisz P. W., H.A. S., De Ruiter G. A., Voragen A. G. J. (1998). Analysis of partially methyl-
esterified galacturonic acid oligomers by high-performance anion-exchange chromatography and
matrix-assisted laser desorption/ionization time-of flight spectronomy. Analytical Biochemistry, 257,
195-202.
Daas P. J. H., Meyer-Hansen K., Schols H. A., De Ruiter G. A., Voragen A. G. J. (1999). Investigation of the
non-esterified galacturonic acid distribution in pectin with endopolygalacturonase. Carbohydrate
Research, 318, 135-145.
Daas P. J. H., Voragen A. G. J., Schols H. A. (2000). Characterisation of non-esterified galacturonic acid
sequences in pectin with endopolygalacturonase. Carbohydrate Research, 326, 120-129.
Daas P. J. H., Voragen A. G. J., Schols H. A. (2001). Study of the methyl ester distribution in pectin with endo-
polygalacturonase and high performance size exclusion chromatography. Biopolymers, 58, 195-203.
Englyst H. N., Cummings J. H. (1984). Simplified method for the measurement of total non-starch
polysaccharides by gas-liquid chromatography of constituent sugars as alditol acetates. Analyst, 109,
937-942.
Huisman M. M. H., Oosterveld A., Schols H. A. (2004). New method for fast determination of the degree of
methylation of pectins by headspace GC. Food Hydrocolloids., 18, (4), 665-668.
Kester H. C. M., Someren M. A. K.-V., Muller Y., Visser J. (1996). Primary structure and characterisation of an
exopolygalacturonase from Aspergillus tubengensis. Euopean Journal of Biochemistry, 240, 738-746.
Korner R., Limberg G., Mikkelsen J. D., Roepstorff P. (1998). Characterization of enzymatic pectin digests by
matrix-assisted Laser Desorption/Ionisation Mass Spectrometry. Journal of Mass Spectrometry, 33,
836-842.
Korner R., Limberg G., Christensen T. M. I. E., Mikkelsen J. D., Roepstorff P. (1999). Sequencing of partially
methyl-esterified oligogalacturonases by tandem mass spectrometry and its use to determine pectinase
specificities. Analytical Chemistry, 71, 1421-1427.
Kravtchenko T. P., Berth G., Voragen A. G. J., Pilnik W. (1992). Studies on the intermolecular distribution of
industrial pectins by means of preparative size exclusion chromatography. Carbohydrate polymers, 18,
253-263.
56
Chapter 3
Kravtchenko T. P., Voragen A. G. J., Pilnik W. (1992). Studies on the intermolecular distribution of industrial
pectins by means of preparative ion-exchange chromatography. Carbohydrate polymers, 19, 115-124.
Laurent M. A., Boulenguer P. (2003). Stabilization mechanism of acid dairy drinks (ADD) induced by pectin.
Food hydrocolloids, 17, 445-454.
Limberg G., Korner R., Buchholt H. C., Christensen T. M. I. E., Roepstorff P., Mikkelsen D. J. (2000).
Quantification of the amount of galacturonic acid residues in blocksequences in pectin
homogalacturonan by enzymatic fingerprinting with exo- and endo-polygalacturonase II from
Aspergillus niger. Carbohydrate research, 327, 321-332.
Pilnik W., Voragen A. G. J., (1991). In: Food Enzymology; Fox P. F., London, Elsevier Applied Science, 303-
306.
Ralet M. C., Thibault J.-F. (2002). Interchain heterogeneity of enzymatically deesterified lime pectins.
Biomacromolecules, 3, 917-925.
Schols H. A., Reitsma J. C. E., Voragen A. G. J., Pilnik W. (1989). High-performance ion exchange
chromatography of pectins. Food Hydrocolloids., 3, (2), 115-121.
Thibault J.-F. (1979). Automatisation du dosage des substances pectiques par la methode au meta-
hydroxydiphenyl. Lebensm. -Wiss. u. -Technol., 12, 247-251.
Tollier M. T., Robin J. P. (1979). ann. techno. agric., 28, (1), 1.
Voragen A. G. J., Pilnik W., Thibault J.-F., Axelos M. A. V., Renard C. M. G. C., (1995). Pectins. In: Food
polysaccharides and their applications; Stephen A. M., New York, Marcel Dekker Inc., 287-339.
Waldron K. W., Selvendran R. R., (1993). In: Food and cancer prevention, chemical and biological aspects;
Waldron K. W., Johnson I. T., Fenwick G. R., The Royal Society of Chemistry, 307-326.
57

Analysis of HM pectins on preparative anion exchange chromatography
58

Chapter 4
Determination of the degree of substitution, degree of
amidation and degree of blockiness of commercial pectins
by using capillary electophoresis.
To be submitted in Food Hydrocolloids as:
S.E. Guillotin, E.J. Bakx, P. Boulenguer, H.A. Schols and A. G. J. Voragen
Abstract
It is more and more realized that pectins are complex mixtures of many different molecules
and research is directed towards the fractionation and characterization of these pectic sub-
populations. Since fractionation of pectins generally results in only low amounts of purified
material, rapid methods using low amounts of samples are required. In this study, capillary
electrophoresis was chosen because only tiny amounts of sample are needed for the analysis.
A new CE protocol was developed to determine the degree of amidation, the degree of
methyl-esterification (DM) and consequently the degree of substitution (DS) of pectins by
analyzing the pectins before and after removal of the methyl-esters. The CE results were
compared with the results obtained by titration and FTIR spectroscopy methods. The CE
method was found to be rather reliable with small standard deviations for the DS and DAm.
The CE method had the advantage of being rapid due to the limited sample preparation and
automation of the analysis. In addition, CE was used successfully to determine the degree of
blockiness of the free GalA residues over the pectic backbone.
59
Chapter 4
1. Introduction
Food industries have to satisfy the demand of the market for innovative food products
and functional foods. For this purpose, more than 20 main hydrocolloids are used to modify
textures and quality aspects during processing and cooking. Pectin is one of these food
ingredients used for its gelling and stabilizing properties. They are mostly extracted from
lemon peels and apple pomaces (May, 1990; Rolin, 2002). Pectins are polysaccharides
composed mainly of α-D-1.4 linked galacturonic acid (GalA) chains (also called
homogalacturonan or smooth regions) in which the carboxyl groups of the GalA can be free
or methyl-esterified. Pectins are also constituted of hairy regions (also called
rhamnogalacturonan I) with GalA-rhamnose regions where the rhamnose moieties can be
substituted with neutral sugars (mainly arabinans and arabinogalactans) (Pilnik & Voragen,
1991; Voragen, Pilnik, Thibault, Axelos & Renard, 1995). Only small amounts of neutral
sugars are present in commercial pectins as a result of the acid extraction (Guillotin et al.,
2005; Kravtchenko, Voragen & Pilnik, 1992). Several types of pectins can be used as gelling
agents in food since their gelling properties depend mainly on the nature of the substituents
(methyl-esters, amide or acetyl groups) and the level of substitution. High methyl-esterified
pectins (HM) with a degree of methyl-esterification (DM) of 50% or higher are distinguished
from low methyl-esterified (LM) pectins with a DM up to 50% and low methyl-esterified and
amidated (LMA) pectins. These pectins behave totally differently in food systems since HM
pectins are mainly used in acid (pH below 3.5) and high sugar content products, while LM
and LMA pectins are used in low sugar content at neutral and acidic pH and in the presence of
calcium (Gilsenan, Richardson & Morris, 2000; May, 1990; Voragen et al., 1995). Low
methyl-esterified amidated pectins (LMA) are obtained from HM pectins by amidation and
partly de-esterification in a heterogeneous system in the presence of ammonia and alcohol
(Anger & Dongowski, 1988) or in a homogeneous system using concentrated aqueous
ammonia (Black & Smit, 1972). Not more than 25% of the total amount of carboxyl groups is
allowed in the amide form for food products (Rolin & De Vries, 1990). Gels of LMA pectins
have been compared to gels of methyl-esterified pectins with the same amount of free
carboxy-groups and it was found that the higher firmness and strength of the LMA gel could
be attributed to the presence of amide groups (Black & Smit, 1972). LMA pectins are used to
achieve a better gelling control compared to low methyl-esterified pectins (LM) since they are
less calcium sensitive than LM pectins and their gels are more thermoreversible (Racape,
60
DS, DAm, DB by using capillary electrophoresis Thibault, Reitsma & Pilnik, 1989). LM pectins are also used for the stabilisation of acid dairy
drinks. The gelling mechanism of LMA pectins is not completely understood. Some authors
stated that the “egg-box” model (Axelos, Thibault & Lefebvre, 1989; Grant, Morris, Rees,
Smith & Thom, 1973; Thibault, Renard, Axelos, Roger & Crepeau, 1993; Thibault &
Rinaudo, 1986) was not completely explaining the LMA pectins gels formation and it is
known indeed that hydrogen bonds of amide groups are stabilizing the junctions zones as well
(Alonso-Mougan, Meijide, Jover, Rodriguez-Nunez & Vazquez-Tato, 2002; Voragen et al.,
1995).
In addition of the DM, the degree of amidation (DAm) is an important parameter to
understand the different gelling behaviour of amidated pectins. To determine this DAm, food
industries are using the titration method (Food Chemical Codex, 1981). The drawbacks of this
method are the high amount of sample required, the non-specificity and the time needed to
run the method. Another method used is infra-red spectroscopy and it was proven to be a
useful and relatively quick tool to determine the DAm (Sinitsya, Copikova, Prutyanov,
Skoblya & Machovie, 2000).
An alternative CE method has been developed to analyse pectic polymers according to their
charge and to determine their DM (Jiang, Liu, WU, Chang & Chang, 2005; Jiang, Wu, Chang
& Chang, 2001; Zhong, Williams, Goodall & Hansen, 1998; Zhong, Williams, Keenan,
Goodall & Rolin, 1997). It is a fast method compared to FTIR and titration methods, accurate,
and requiring very low amount of samples (nanoliters). These two last advantages are
important in analytical studies, particularly for research purposes where sensitive methods
using low amounts of samples are required since only low amounts of purified fractions are
available.
Another benefit of CE is the possibility of the simultaneous analysis of polymers and
oligomers in enzyme digests of pectins (Jiang et al., 2005; Jiang et al., 2001; Strom &
Williams, 2004; Williams, Buffet & Foster, 2002; Williams, Foster & Schols, 2003; Zhong et
al., 1998). This makes it possible to determine the distribution of methyl-esters over the
galacturonan backbone by determining the degree of blockiness (DB) of commercial pectins
with CE. The method commonly used to determine the DB has been described previously and
is based on the analysis of the oligomers released after endo-polygalacturonase digestion of
the pectins and their quantification using HPAEC at pH 5 (Daas, Meyer-Hansen, Schols, De
Ruiter & Voragen, 1999; Daas, Voragen & Schols, 2000).
61
Chapter 4
CE has not been explored yet as a tool to analyse the degree of amidation of pectins. A CE
protocol was therefore developed in this study to determine the degree of substitution, the
DAm and the DM of commercial pectins. The CE results are compared with the results
obtained using the FTIR and titration methods. CE was also successfully used to determine
the degree of blockiness of several commercial pectins and results were compared with the
DB values determined using the HPAEC method as described previously.
2. Experimental
2.1. Samples
Pectin samples were kindly provided by Degussa texturant systems, Danisco and CP Kelco
(Table I). Pectins C67, C56 and C30 have been obtained as described previously (Daas,
Meyer-Hansen et al., 1999).
Pectins containing only amide groups were obtained by alkaline saponification. For this
purpose, pectins (4 g) were dissolved in 500ml water at 40°C. An equal volume of 0.1 M
sodium hydroxide was added in cold condition (4°C) to avoid β-elimination. After 24 hours,
the samples were neutralised by adding 500 ml 0.1 M acetic acid. Pectins were then
ultrafiltrated (Millipore Pellicon membrane; 10 kDa) and freeze dried. The saponified pectins
are indicated with the denomination “sap” (e.g. Dsap, Gsap, O27sap-O5sap; Table I). The
number associated to the code of some pectins corresponds to the DAm for amidated pectins
and DM for methyl-esterified pectins.
2.2. Degree of methylation, degree of amidation of the pectins and uronic acid content of
pectins used as references
The pectins obtained from CP Kelco, Danisco and Degussa texturant systems and used as
references are characterised in Table I. The DAm and the DM of CP Kelco and Danisco
pectins were determined by using the titration method (Food Chemical Codex, 1981). The
first end-point of the titration corresponded to the amount of free carboxyl groups while the
second end-point determined the amount of saponified carboxyl groups (since methyl-esters
are saponified). The solution was then distillated and the distillate was titrated to determine
the degree of amidation of the sample. The DAm of the samples provided by Degussa
texturant systems was determined using the titration method, but the DM was estimated by
62
DS, DAm, DB by using capillary electrophoresis using the GC-headspace analysis of the free methanol released after alkaline de-esterification
of pectins (Huisman, Oosterveld & Schols, 2004). The DM of the samples R70, C67, C56,
CR52 and C30 was determined by HPLC as described previously (Daas, Meyer-Hansen et al.,
1999).
The uronic acid content was determined by the automated colorimetric m-hydroxydiphenyl
method (Ahmed & Labavitch, 1977; Blumenkrantz & Asboe-Hansen, 1973; Thibault, 1979).
2.3. Determination of the DAm ,DM and DS by using FTIR method
Fourier Transform Infrared spectroscopy (FTIR) was performed on a Bio-Rad FTS 6000
spectrometer. At pH 6, methyl-esters, free carboxyl groups and amide groups have different
wavelengths. Spectra were obtained with the detector MCT/DTGS set at 4 cm-1 resolution and
100 interferograms were collected to obtain a high signal to noise ratio.
The method for sample preparation was adapted from Chatjigakis et al., 1998: pectins (5
mg/ml) were dissolved in buffer phospate 0.02 M pH 6. Pectin solution (50 µl) was spread
over the Fourier crystal and dried with a flush of air carefully onto the crystal surface. The
integration (using PeakFit software; Aspire Software International) of each spectra area was
obtained by using multiple gaussian decomposition of the characteristic bands in an IR
spectrum in the region of 1800-1500 cm-1. The peak area of the amide (absorption band at
1681 cm-1) was divided by the sum of the peak area of the methyl-esters (absorption band at
1742 cm-1) and the peak area of the free carboxyl groups (absorption band at 1611 cm-1) to
calculate the degree of amidation.
2.4. Determination of the DAM, DM and DS by using capillary electrophoresis
The analysis of the degree of amidation was adapted from the CE method developed
previously to determine the DM (Zhong et al., 1998). Phosphate buffer 50 mM pH 7 was used
as electrophoresis buffer. Samples and standards were wetted in 10 µl ethanol and dissolved
in the buffer (5 mg/ml). At pH 7, pectins are fully ionised. Samples were analysed on an
automated CE system (Beckman P/ACE MDQ) equipped with a UV Detector. A fused silica
capillary internal diameter 50 µm, total length of 50.2 cm with 40 cm length capillary from
inlet to detector, thermostated at 25oC was used. New capillaries were conditioned by rinsing
for 15 min with 0.1 M NaOH, 30 min with distilled water and 30 min with phosphate buffer at
20 Psi. Between two runs the capillary was washed for 2 min with 0.1 M NaOH, 1min with
63
Chapter 4
distilled water and 2 min with phosphate buffer at 20 Psi. All solutions were filtered over a
0.2 µm membrane. Detection was carried out by using UV absorbance at 190 nm with a
bandwidth of 10 nm. Samples (50 µl) were loaded hydrodynamically (5 sec at 9.5 Psi) and
electrophoresis was performed during 30 min in phosphate buffer pH 7 across a voltage of 20
kV for DS, DM and DAm analysis and 17 kV for the DB analysis and in normal polarity. L-
methionine ethylester hydrochloride (0.044 mg/ml sample) was used as internal standard for
CE in all samples.
The shift of the migration time of the internal standard, observed sometimes within a sample
sequence, is corrected using the following transformation: tcor = 1/ [(1/t) –(x)], where tcor is the
migration time of the sample corrected from the internal standard shift, t is the migration time
of the sample observed, x is the value to match the internal standard migration time for all
samples.
The correlation of Electrophoretic Mobility (EM) with expected total charge was used for the
determination of the degree of amidation. The equation to calculate the EM is described
below:
EM = EMp - EMm = (lL /V) [(1/tp) – (1/tm)]
where EMp corresponds to the observed mobility of the pectin and EMm to the observed
mobility of the internal marker, l is the distance from the inlet to the detector, L is the total
length of the capillary, V the applied voltage, tp and tm are the migration times of the pectin
and the internal marker respectively (Zhong et al., 1998).
2.5. Determination of the degree of blockiness of pectins with capillary electrophoresis
The determination of the degree of blockiness was adapted from the CE method developed
previously for the separation of oligomers (Strom & Williams, 2004; Williams et al., 2002;
Williams et al., 2003). Phosphate buffer 50 mM pH 7 was used as electrophoresis buffer.
Pectin digests (5 mg/ml) were prepared as described previously (Guillotin et al., 2005) and
dissolved in the buffer. Mono-, di- and triGalA (1 mg/ml buffer) were used as standards. L-
methionine ethylester chloride (0.044 mg/ml sample) was added to pectin digests and
standards as internal standard. Experiments were carried out on an automated CE system
(Beckman P/ACE MDQ) equipped with a UV Detector as described previously for the
determination of the degree of amidation. Samples (50 µl) were loaded hydrodynamically (5
64
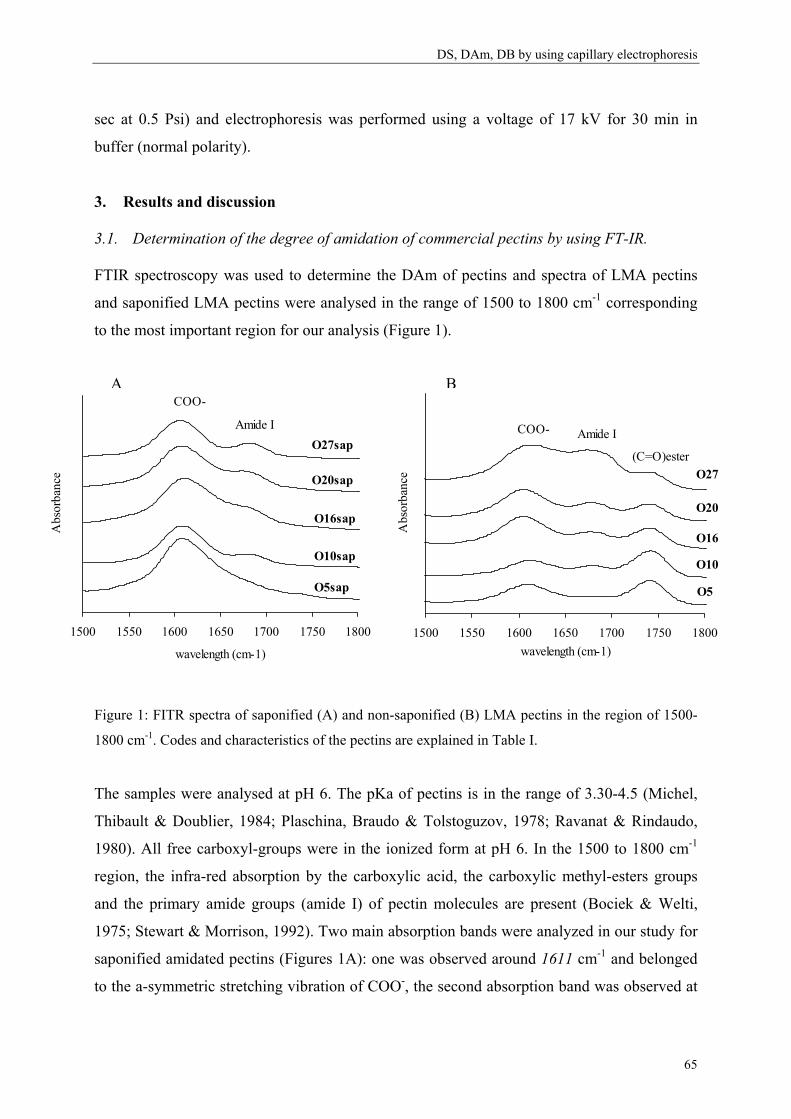
DS, DAm, DB by using capillary electrophoresis sec at 0.5 Psi) and electrophoresis was performed using a voltage of 17 kV for 30 min in
buffer (normal polarity).
3. Results and discussion
3.1. Determination of the degree of amidation of commercial pectins by using FT-IR.
FTIR spectroscopy was used to determine the DAm of pectins and spectra of LMA pectins
and saponified LMA pectins were analysed in the range of 1500 to 1800 cm-1 corresponding
to the most important region for our analysis (Figure 1).
1500 1550 1600 1650 1700 1750 1800
wavelength (cm-1)
Abs
orba
nce
COO-
Amide I
O5sap
O10sap
O16sap
O20sap
O27sap
1500 1550 1600 1650 1700 1750 1800wavelength (cm-1)
Abs
orba
nce
COO- Amide I
(C=O)ester
O5
O10
O16
O20
O27
BA
Figure 1: FITR spectra of saponified (A) and non-saponified (B) LMA pectins in the region of 1500-
1800 cm-1. Codes and characteristics of the pectins are explained in Table I.
The samples were analysed at pH 6. The pKa of pectins is in the range of 3.30-4.5 (Michel,
Thibault & Doublier, 1984; Plaschina, Braudo & Tolstoguzov, 1978; Ravanat & Rindaudo,
1980). All free carboxyl-groups were in the ionized form at pH 6. In the 1500 to 1800 cm-1
region, the infra-red absorption by the carboxylic acid, the carboxylic methyl-esters groups
and the primary amide groups (amide I) of pectin molecules are present (Bociek & Welti,
1975; Stewart & Morrison, 1992). Two main absorption bands were analyzed in our study for
saponified amidated pectins (Figures 1A): one was observed around 1611 cm-1 and belonged
to the a-symmetric stretching vibration of COO-, the second absorption band was observed at
65
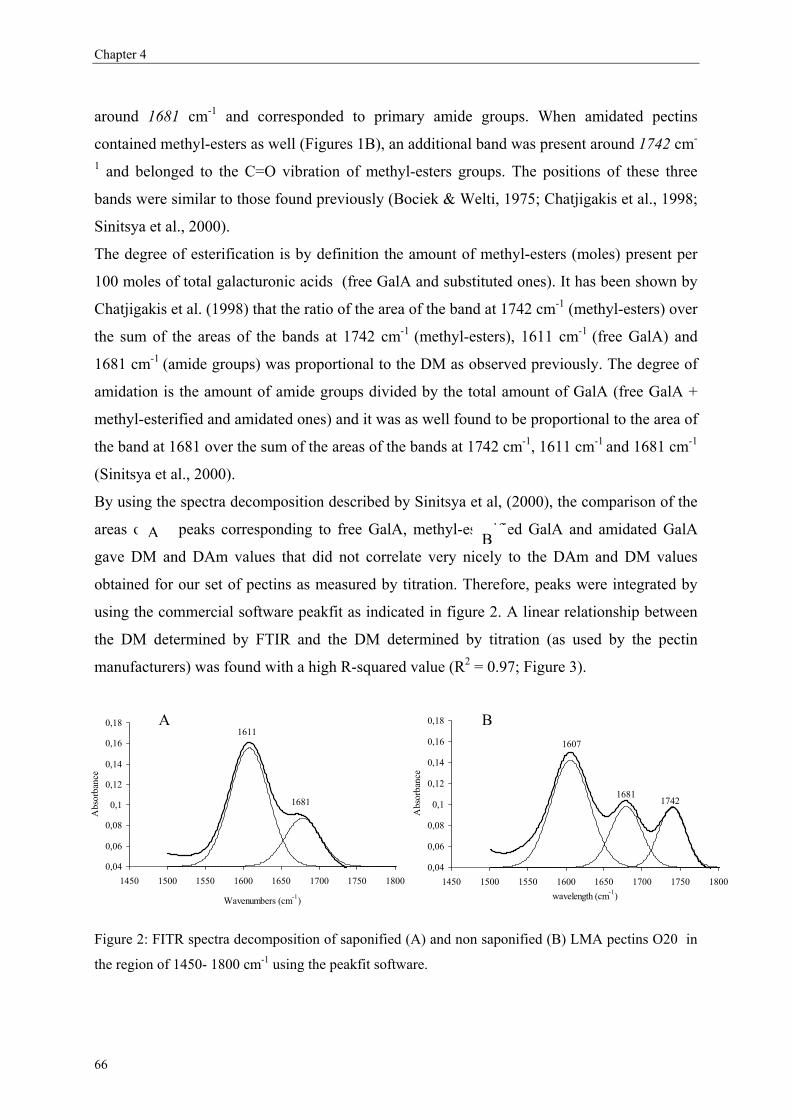
Chapter 4
around 1681 cm-1 and corresponded to primary amide groups. When amidated pectins
contained methyl-esters as well (Figures 1B), an additional band was present around 1742 cm-
1 and belonged to the C=O vibration of methyl-esters groups. The positions of these three
bands were similar to those found previously (Bociek & Welti, 1975; Chatjigakis et al., 1998;
Sinitsya et al., 2000).
The degree of esterification is by definition the amount of methyl-esters (moles) present per
100 moles of total galacturonic acids (free GalA and substituted ones). It has been shown by
Chatjigakis et al. (1998) that the ratio of the area of the band at 1742 cm-1 (methyl-esters) over
the sum of the areas of the bands at 1742 cm-1 (methyl-esters), 1611 cm-1 (free GalA) and
1681 cm-1 (amide groups) was proportional to the DM as observed previously. The degree of
amidation is the amount of amide groups divided by the total amount of GalA (free GalA +
methyl-esterified and amidated ones) and it was as well found to be proportional to the area of
the band at 1681 over the sum of the areas of the bands at 1742 cm-1, 1611 cm-1 and 1681 cm-1
(Sinitsya et al., 2000).
By using the spectra decomposition described by Sinitsya et al, (2000), the comparison of the
areas of the peaks corresponding to free GalA, methyl-esterified GalA and amidated GalA
gave DM and DAm values that did not correlate very nicely to the DAm and DM values
obtained for our set of pectins as measured by titration. Therefore, peaks were integrated by
using the commercial software peakfit as indicated in figure 2. A linear relationship between
the DM determined by FTIR and the DM determined by titration (as used by the pectin
manufacturers) was found with a high R-squared value (R2 = 0.97; Figure 3).
A B
0,04
0,06
0,08
0,1
0,12
0,14
0,16
0,18
1450 1500 1550 1600 1650 1700 1750 1800wavelength (cm-1)
Abs
orba
nce
1607
16811742
0,04
0,06
0,08
0,1
0,12
0,14
0,16
0,18
1450 1500 1550 1600 1650 1700 1750 1800
Wavenumbers (cm-1)
Abs
orba
nce
1611
1681
BA
Figure 2: FITR spectra decomposition of saponified (A) and non saponified (B) LMA pectins O20 in
the region of 1450- 1800 cm-1 using the peakfit software.
66
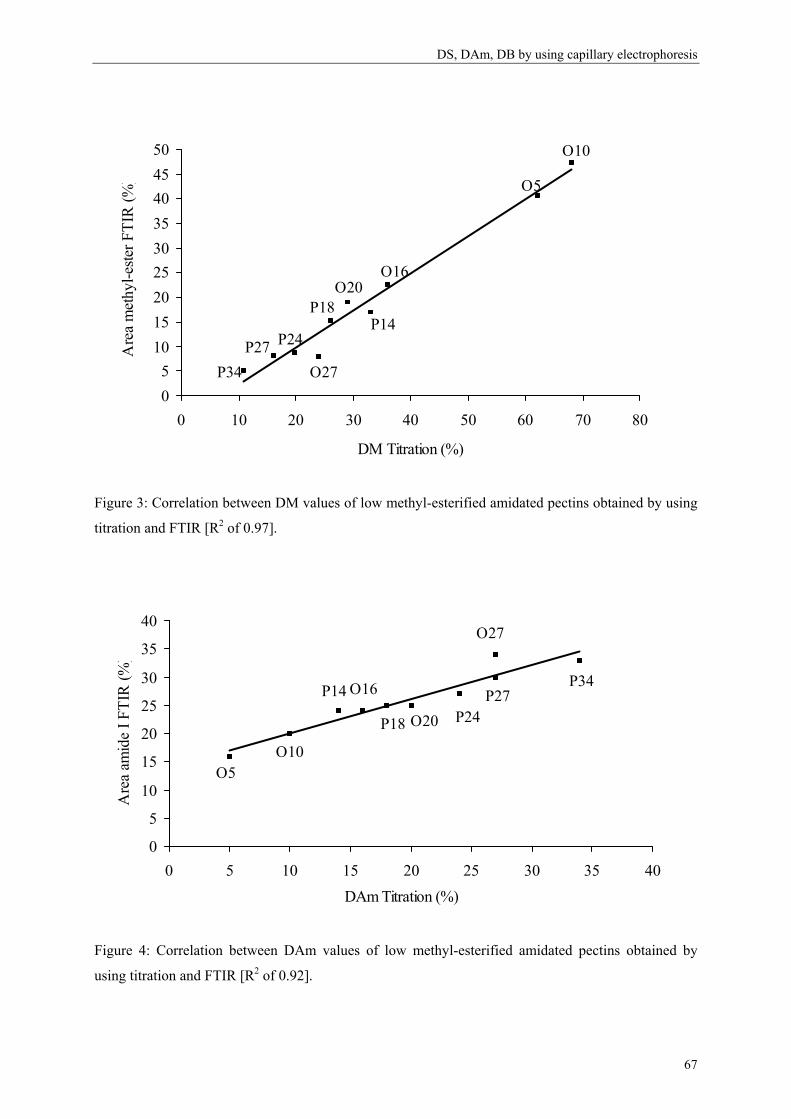
DS, DAm, DB by using capillary electrophoresis
05
101520253035404550
0 10 20 30 40 50 60 70 8
DM Titration (%)
Are
a m
ethy
l-este
r FTI
R (%
)
P34P27 P24
O27
P18P14
O16O20
O5
O10
0
Figure 3: Correlation between DM values of low methyl-esterified amidated pectins obtained by using
titration and FTIR [R2 of 0.97].
0
5
10
15
20
25
30
35
40
0 5 10 15 20 25 30 35 40DAm Titration (%)
Are
a am
ide
I FTI
R (%
)
O5O10
P14 O16
P18 O20 P24
O27
P34P27
Figure 4: Correlation between DAm values of low methyl-esterified amidated pectins obtained by
using titration and FTIR [R2 of 0.92].
67
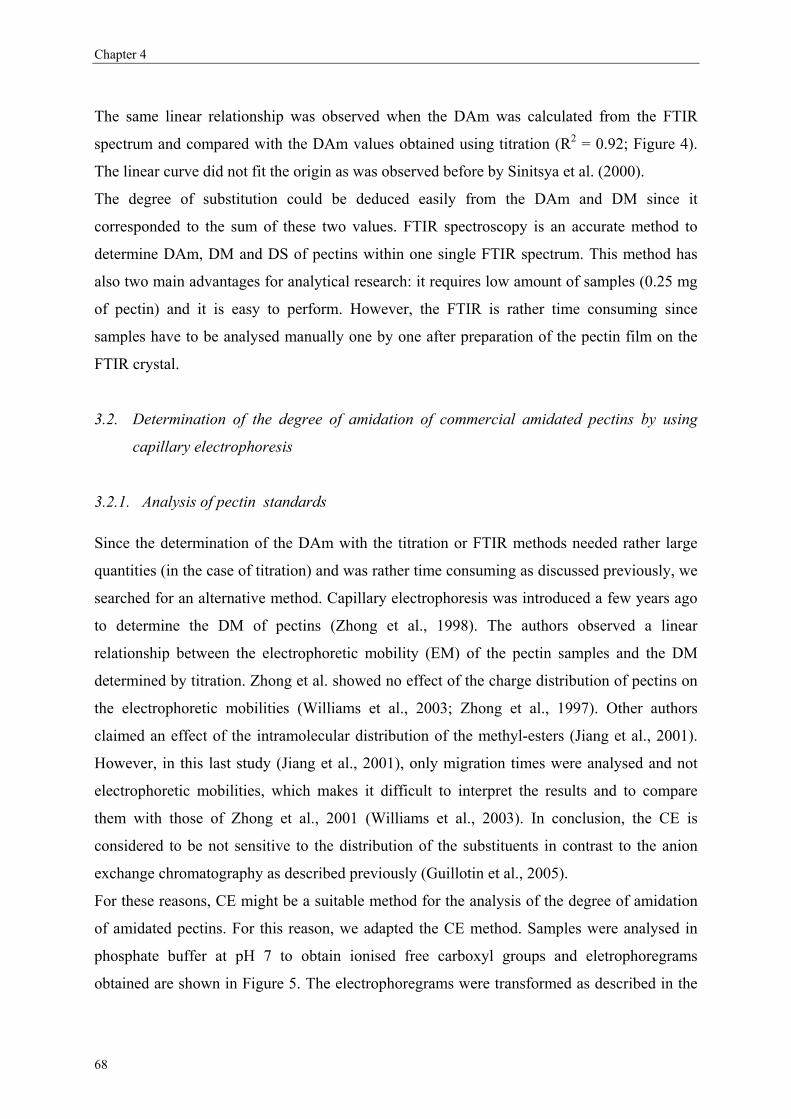
Chapter 4
The same linear relationship was observed when the DAm was calculated from the FTIR
spectrum and compared with the DAm values obtained using titration (R2 = 0.92; Figure 4).
The linear curve did not fit the origin as was observed before by Sinitsya et al. (2000).
The degree of substitution could be deduced easily from the DAm and DM since it
corresponded to the sum of these two values. FTIR spectroscopy is an accurate method to
determine DAm, DM and DS of pectins within one single FTIR spectrum. This method has
also two main advantages for analytical research: it requires low amount of samples (0.25 mg
of pectin) and it is easy to perform. However, the FTIR is rather time consuming since
samples have to be analysed manually one by one after preparation of the pectin film on the
FTIR crystal.
3.2. Determination of the degree of amidation of commercial amidated pectins by using
capillary electrophoresis
3.2.1. Analysis of pectin standards
Since the determination of the DAm with the titration or FTIR methods needed rather large
quantities (in the case of titration) and was rather time consuming as discussed previously, we
searched for an alternative method. Capillary electrophoresis was introduced a few years ago
to determine the DM of pectins (Zhong et al., 1998). The authors observed a linear
relationship between the electrophoretic mobility (EM) of the pectin samples and the DM
determined by titration. Zhong et al. showed no effect of the charge distribution of pectins on
the electrophoretic mobilities (Williams et al., 2003; Zhong et al., 1997). Other authors
claimed an effect of the intramolecular distribution of the methyl-esters (Jiang et al., 2001).
However, in this last study (Jiang et al., 2001), only migration times were analysed and not
electrophoretic mobilities, which makes it difficult to interpret the results and to compare
them with those of Zhong et al., 2001 (Williams et al., 2003). In conclusion, the CE is
considered to be not sensitive to the distribution of the substituents in contrast to the anion
exchange chromatography as described previously (Guillotin et al., 2005).
For these reasons, CE might be a suitable method for the analysis of the degree of amidation
of amidated pectins. For this reason, we adapted the CE method. Samples were analysed in
phosphate buffer at pH 7 to obtain ionised free carboxyl groups and eletrophoregrams
obtained are shown in Figure 5. The electrophoregrams were transformed as described in the
68
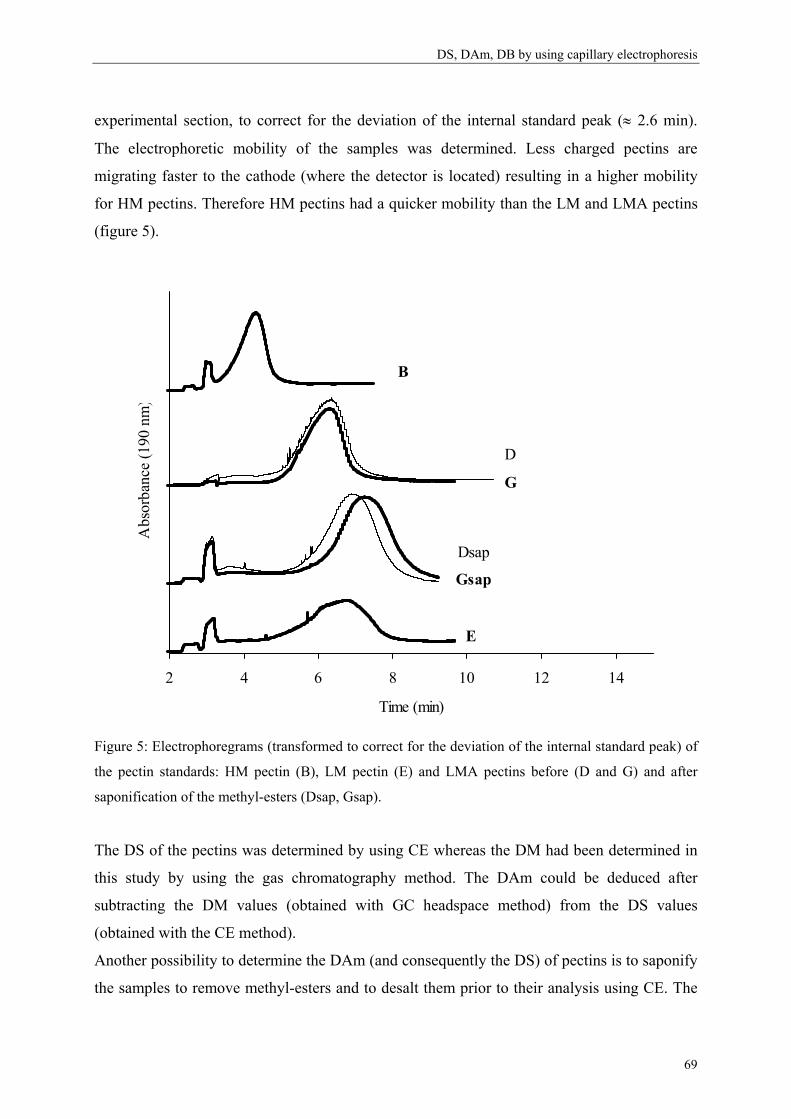
DS, DAm, DB by using capillary electrophoresis experimental section, to correct for the deviation of the internal standard peak (≈ 2.6 min).
The electrophoretic mobility of the samples was determined. Less charged pectins are
migrating faster to the cathode (where the detector is located) resulting in a higher mobility
for HM pectins. Therefore HM pectins had a quicker mobility than the LM and LMA pectins
(figure 5).
2 4 6 8 10 12 14
Time (min)
Abs
orba
nce
(190
nm
)
B
D
G
Dsap
Gsap
E
Figure 5: Electrophoregrams (transformed to correct for the deviation of the internal standard peak) of
the pectin standards: HM pectin (B), LM pectin (E) and LMA pectins before (D and G) and after
saponification of the methyl-esters (Dsap, Gsap).
The DS of the pectins was determined by using CE whereas the DM had been determined in
this study by using the gas chromatography method. The DAm could be deduced after
subtracting the DM values (obtained with GC headspace method) from the DS values
(obtained with the CE method).
Another possibility to determine the DAm (and consequently the DS) of pectins is to saponify
the samples to remove methyl-esters and to desalt them prior to their analysis using CE. The
69
Chapter 4
DAm of pectins is not higher than 25%, which is the maximum allowed in food products.
Therefore, commercial amidated pectins do not cover the whole range of DAm (up to 100 %).
To get a wider range of substituted pectins for the calibration curve, methyl-esterified pectin
were also used in addition to crude amidated pectins and saponified amidated pectins (figure
6). A linear relationship between the EM and the DAm/DS obtained by titration was found
with a high R-squared value of 0.98 (Figure 6).
0
20
40
60
80
100
0,000 0,005 0,010 0,015 0,020 0,025 0,030
EM
DS
Titra
tion
(%)
O5sap
O10sapO16sap
O20sap
O27sapE
P24P14
C56
A
I
M
Figure 6: Linear regression of the electrophoretic mobility (EM) of commercial HM pectins,
saponified and non saponified LMA pectins according to the DM and DAm (e.g. degree of
substitution: DS) [R2 = 0.98]. Codes for pectins included in the curve are explained in Table I.
Results were reproducible with small deviations (lower than 2%). Pectins having the same
DM (L, H and J) but having a different distribution of the methyl-esters (DB of 6, 10 and 3%,
respectively), showed a similar electrophoretic mobility (respectively, DM of 79, 80 and
79%). These results confirmed the previous findings where no effect of the charge distribution
was observed by using CE (Williams et al., 2003; Zhong et al., 1997).
To check whether the presence of amide groups instead of a methyl-ester could modify the
electrophoretic mobility of pectins, samples with similar DS but with and without amide
groups were compared.
70
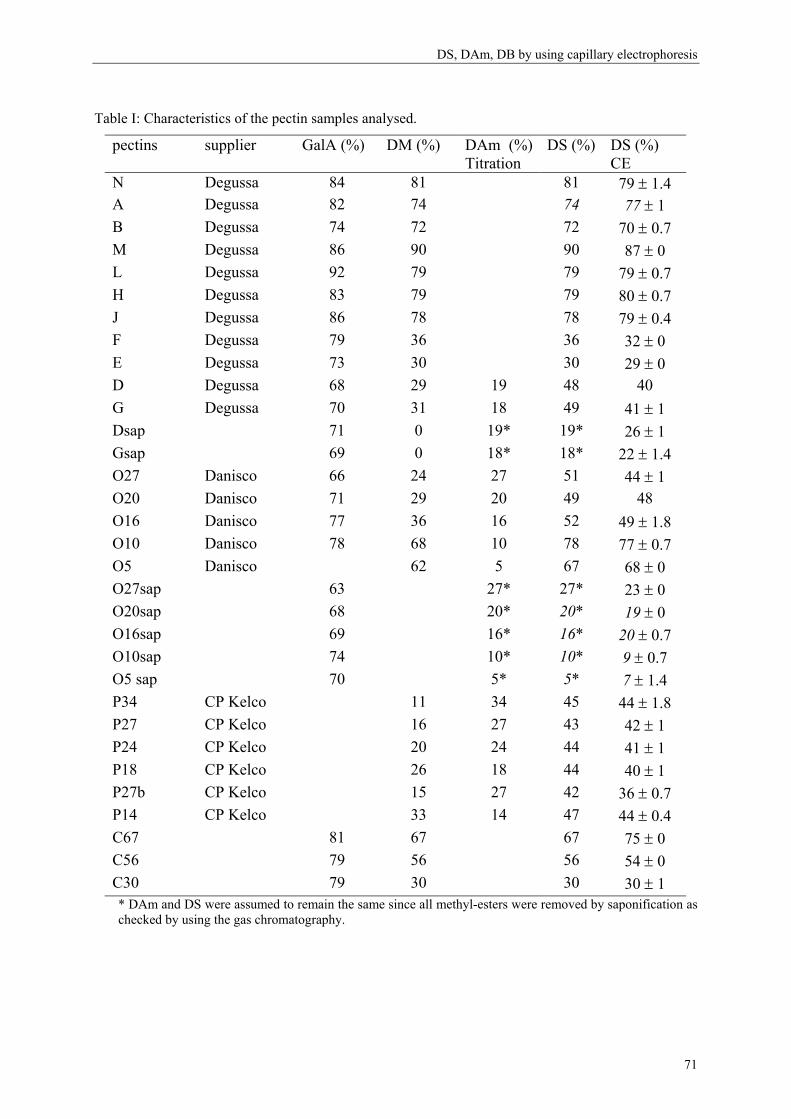
DS, DAm, DB by using capillary electrophoresis Table I: Characteristics of the pectin samples analysed.
pectins supplier GalA (%) DM (%) DAm (%) Titration
DS (%) DS (%) CE
N Degussa 84 81 81 79 ± 1.4 A Degussa 82 74 74 77 ± 1 B Degussa 74 72 72 70 ± 0.7 M Degussa 86 90 90 87 ± 0 L Degussa 92 79 79 79 ± 0.7 H Degussa 83 79 79 80 ± 0.7 J Degussa 86 78 78 79 ± 0.4 F Degussa 79 36 36 32 ± 0 E Degussa 73 30 30 29 ± 0 D Degussa 68 29 19 48 40 G Degussa 70 31 18 49 41 ± 1 Dsap 71 0 19* 19* 26 ± 1 Gsap 69 0 18* 18* 22 ± 1.4 O27 Danisco 66 24 27 51 44 ± 1 O20 Danisco 71 29 20 49 48 O16 Danisco 77 36 16 52 49 ± 1.8 O10 Danisco 78 68 10 78 77 ± 0.7 O5 Danisco 62 5 67 68 ± 0 O27sap 63 27* 27* 23 ± 0 O20sap 68 20* 20* 19 ± 0 O16sap 69 16* 16* 20 ± 0.7 O10sap 74 10* 10* 9 ± 0.7 O5 sap 70 5* 5* 7 ± 1.4 P34 CP Kelco 11 34 45 44 ± 1.8 P27 CP Kelco 16 27 43 42 ± 1 P24 CP Kelco 20 24 44 41 ± 1 P18 CP Kelco 26 18 44 40 ± 1 P27b CP Kelco 15 27 42 36 ± 0.7 P14 CP Kelco 33 14 47 44 ± 0.4 C67 81 67 67 75 ± 0 C56 79 56 56 54 ± 0 C30 79 30 30 30 ± 1 * DAm and DS were assumed to remain the same since all methyl-esters were removed by saponification as checked by using the gas chromatography.
71
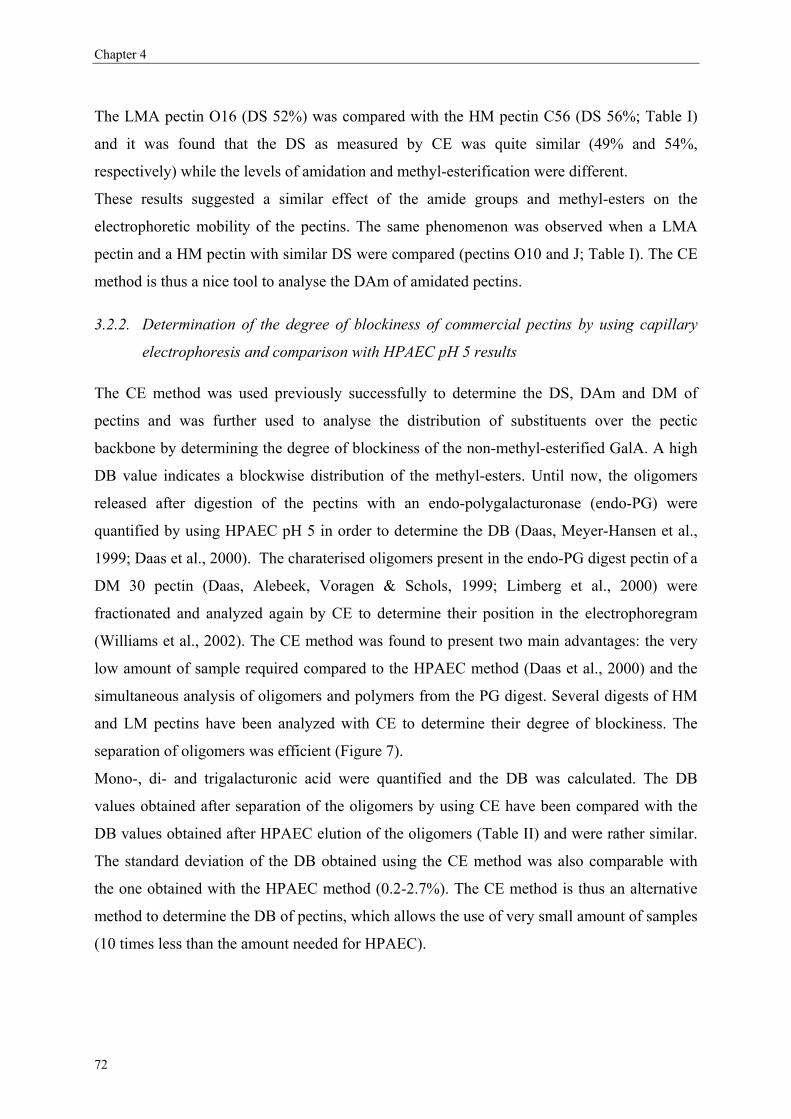
Chapter 4
The LMA pectin O16 (DS 52%) was compared with the HM pectin C56 (DS 56%; Table I)
and it was found that the DS as measured by CE was quite similar (49% and 54%,
respectively) while the levels of amidation and methyl-esterification were different.
These results suggested a similar effect of the amide groups and methyl-esters on the
electrophoretic mobility of the pectins. The same phenomenon was observed when a LMA
pectin and a HM pectin with similar DS were compared (pectins O10 and J; Table I). The CE
method is thus a nice tool to analyse the DAm of amidated pectins.
3.2.2. Determination of the degree of blockiness of commercial pectins by using capillary
electrophoresis and comparison with HPAEC pH 5 results
The CE method was used previously successfully to determine the DS, DAm and DM of
pectins and was further used to analyse the distribution of substituents over the pectic
backbone by determining the degree of blockiness of the non-methyl-esterified GalA. A high
DB value indicates a blockwise distribution of the methyl-esters. Until now, the oligomers
released after digestion of the pectins with an endo-polygalacturonase (endo-PG) were
quantified by using HPAEC pH 5 in order to determine the DB (Daas, Meyer-Hansen et al.,
1999; Daas et al., 2000). The charaterised oligomers present in the endo-PG digest pectin of a
DM 30 pectin (Daas, Alebeek, Voragen & Schols, 1999; Limberg et al., 2000) were
fractionated and analyzed again by CE to determine their position in the electrophoregram
(Williams et al., 2002). The CE method was found to present two main advantages: the very
low amount of sample required compared to the HPAEC method (Daas et al., 2000) and the
simultaneous analysis of oligomers and polymers from the PG digest. Several digests of HM
and LM pectins have been analyzed with CE to determine their degree of blockiness. The
separation of oligomers was efficient (Figure 7).
Mono-, di- and trigalacturonic acid were quantified and the DB was calculated. The DB
values obtained after separation of the oligomers by using CE have been compared with the
DB values obtained after HPAEC elution of the oligomers (Table II) and were rather similar.
The standard deviation of the DB obtained using the CE method was also comparable with
the one obtained with the HPAEC method (0.2-2.7%). The CE method is thus an alternative
method to determine the DB of pectins, which allows the use of very small amount of samples
(10 times less than the amount needed for HPAEC).
72
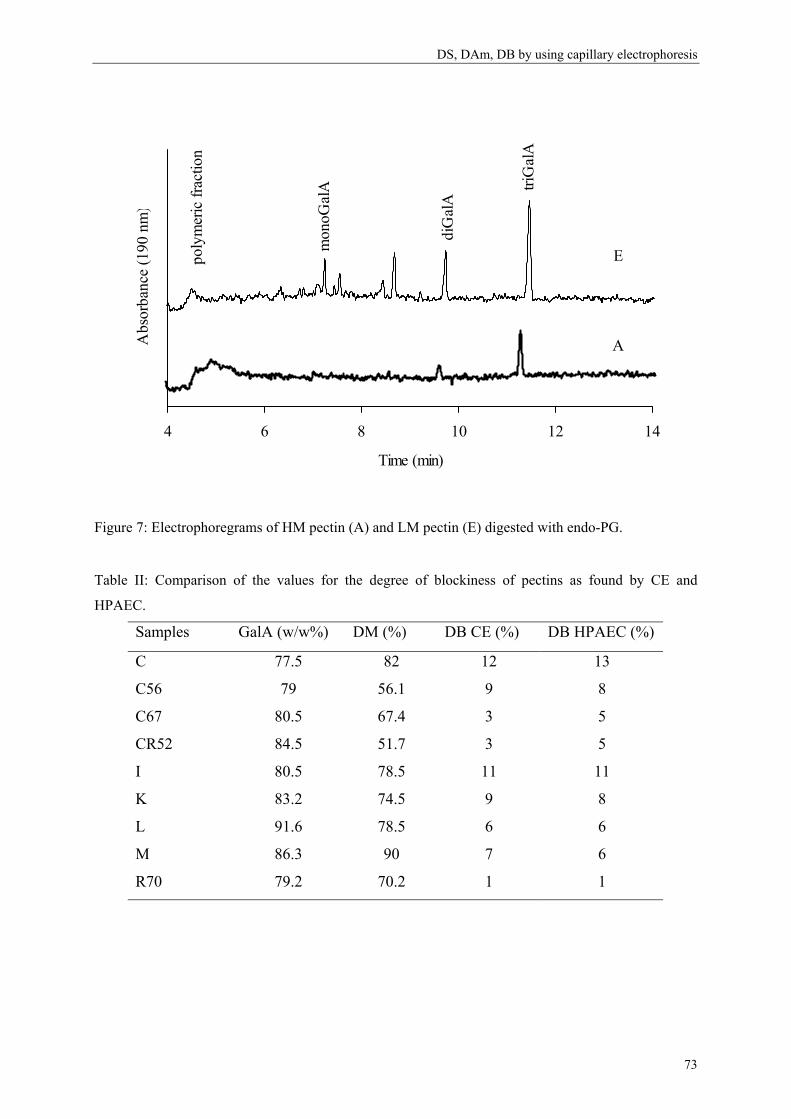
DS, DAm, DB by using capillary electrophoresis
4 6 8 10 12
Time (min)
Abs
orba
nce
(190
nm
)
A
Emon
oGal
A
diG
alA
triG
alA
poly
mer
ic fr
actio
n
14
Figure 7: Electrophoregrams of HM pectin (A) and LM pectin (E) digested with endo-PG.
Table II: Comparison of the values for the degree of blockiness of pectins as found by CE and
HPAEC.
Samples GalA (w/w%) DM (%) DB CE (%) DB HPAEC (%)
C 77.5 82 12 13
C56 79 56.1 9 8
C67 80.5 67.4 3 5
CR52 84.5 51.7 3 5
I 80.5 78.5 11 11
K 83.2 74.5 9 8
L 91.6 78.5 6 6
M 86.3 90 7 6
R70 79.2 70.2 1 1
73
Chapter 4
Conclusions
The CE method is an accurate and fast method to determine the degree of amidation
compared to the titration method and to the FTIR method since samples were analysed over
night automatically without laborious sample pre-treatment procedures. It is now possible to
characterise the DM, DS and DAm of pectins as well as the degree of blockiness by using
only CE and thus very low amounts of samples (≈ 10 nl; 50 µg of pectin). This is very
convenient in studies of the fine structure of pectins and pectin fractions. The CE method is a
promising tool in the characterisation of pectins.
Acknowledgments: the authors would like to thank E. Ananta for her contribution in this
work.
References
Ahmed A. E. R., Labavitch J. M. (1977). Journal of Food Biochemistry, 1, 361-365.
Alonso-Mougan M., Meijide F., Jover A., Rodriguez-Nunez E., Vazquez-Tato J. (2002). Rheological behaviour
of an amide pectin. Journal of Food Engineering, 55, 123-129.
Anger H., Dongowski G. (1988). Amidated pectins - characterization and enzymatic degradation. Food
Hydrocolloids., 2, (5), 371-379.
Axelos M. A. V., Thibault J.-F., Lefebvre L. (1989). Structure of citrus pectins and viscosimetric study of their
solution properties. Int. Journal Biol. Macromol., 11, 186.
Black S. A., Smit C. J. B. (1972). The effect of demethylation procedures on the quality of low-ester pectins
used in dessert gels. Journal of Food Science, 37, (II), 730-732.
Blumenkrantz N., Asboe-Hansen G. (1973). New method for quantitative determination of uronic acids.
Analytical Biochemistry, 54, 484-489.
Bociek S., Welti D. (1975). The quantitative analysis of uronic acid polymers by infrared spectroscopy.
Carbohydrate Research, 42, 217-226.
Chatjigakis A. K., Pappas C., proxenia N., Kalantzi O., Rodis P., Polissiou M. (1998). FT-IR spectroscopic
determination of the degree of esterification of cell wall pectins from stored peaches and correlation to
textural changes. Carbohydrate Polymers, 37, 395-408.
Daas P. J. H., Alebeek G. J. W. M. v., Voragen A. G. J., Schols H. A., (1999). Determination of the distribution
of non-esterified glacturonic acid in pectin with endo-polygalacturonase. In: Gums and Stabilisers for
the food industry; Williams P. A., Phillips G. O., Wrexham, The Royal Society of Chemistry, 3-18.
74
DS, DAm, DB by using capillary electrophoresis Daas P. J. H., Meyer-Hansen K., Schols H. A., De Ruiter G. A., Voragen A. G. J. (1999). Investigation of the
non-esterified galacturonic acid distribution in pectin with endopolygalacturonase. Carbohydrate
Research, 318, 135-145.
Daas P. J. H., Voragen A. G. J., Schols H. A. (2000). Characterisation of non-esterified galacturonic acid
sequences in pectin with endopolygalacturonase. Carbohydrate Research, 326, 120-129.
Food Chemical Codex, (1981) 3rd Ed., National Academy of Sciences, Washington, DC
Gilsenan P. M., Richardson R. K., Morris E. R. (2000). Thermally reversible acid-induced gelation of low-
methoxy pectin. Carbohydrate Polymers, 41, 339-349.
Grant G. T., Morris E. R., Rees D. A., Smith P. J. C., Thom D. (1973). Biological interactions between
polysaccharides and divalent cations: the egg-box model. FEBS Letters, 32, 195.
Guillotin S. E., Bakx E. J., Boulenguer P., Mazoyer J., Schols H. A., Voragen A. G. J. (2005). Populations
having different GalA blocks characteristics are present in commercial pectins which are chemically
similar but have different functionalities. Carbohydrate Polymers, 60, 391-398.
Huisman M. M. H., Oosterveld A., Schols H. A. (2004). New method for fast determination of the degree of
methylation of pectins by headspace GC. Food Hydrocolloids., 18, (4), 665-668.
Jiang C. M., Liu S.-H., WU M.-H., Chang W.-M., Chang H.-M. (2005). Determination of the degree of
esterification of alkaline de-esterified pectins by capillary zone electrophoresis. Food Chemistry, 91,
551-555.
Jiang C. M., Wu M. C., Chang W.-H., Chang H.-M. (2001). Determination of random- and blockwise-type de-
esterified pectins by capillary zone electrophoresis. Journal of Agricultural and Food Chemistry, 49,
5584-5588.
Kravtchenko T. P., Voragen A. G. J., Pilnik W. (1992). Analytical comparison of three industrial pectin
preparations. Carbohydrate Polymers, 18, 17-25.
Limberg G., Korner R., Buchholt H. C., Christensen T. M. I. E., Roepstorff P., Mikkelsen D. J. (2000).
Quantification of the amount of galacturonic acid residues in blocksequences in pectin
homogalacturonan by enzymatic fingerprinting with exo- and endo-polygalacturonase II from
Aspergillus niger. Carbohydrate Research, 327, 321-332.
May C. D. (1990). Industrial pectins: sources, production and applications. Carbohydrate Polymers, 12, 79-99.
Michel F., Thibault J.-F., Doublier J.-L. (1984). Viscosimetric and potentiometric study of high-methoxyl
pectins in the presence of sucrose. Carbohydrate Polymers, 4, (283),
Pilnik W., Voragen A. G. J., (1991). In Fox P. F. Food Enzymology (303-306). London: Elsevier Applied
Science.
Plaschina I. G., Braudo E. E., Tolstoguzov V. B. (1978). Circular dichroism studies of pectin solutions.
Carbohydrate Research, 60, (1),
Racape E., Thibault J. F., Reitsma J. C. E., Pilnik W. (1989). Properties of amidated pectins II. Polyelectrolyte
behavior and calcium binding of amidate pectins and amidated pectic acids. Biopolymers, 28, 1435-
1448.
Ravanat G., Rindaudo M. (1980). Investigation on oligo- and polygalacturonic acids by potentiometry and
circular dichroism. Biopolymers, 19, 2209-2222.
75
Chapter 4
76
Rolin C., (2002). Commercial pectin preparations. In: Pectins and their Manipulation; Seymour G. B., Knox J.
P., Blackwell Publishing Ltd., 222-239.
Rolin C., De Vries J. A., (1990). Pectin: Elsevier.
Sinitsya A., Copikova J., Prutyanov V., Skoblya S., Machovie V. (2000). Amidation of highly methoxylated
citrus pectin with primary amines. Carbohydrate Polymers, 42, 359-368.
Stewart D., Morrison I. M. (1992). FT-IR Spectroscopy as a tool for the study of biological and chemical
treatments of barley straw. Journal of the Science of Food and Agriculture, 60, 431-436.
Strom A., Williams M. A. K. (2004). On the separation, detection and quantification of pectin derived
oligosaccharides by capillary electrophoresis. Carbohydrate Research, 339, 1711-1716.
Thibault J.-F. (1979). Automatisation du dosage des substances pectiques par la méthode au meta-
hydroxydiphenyl. Lebensmittel Wissenschaft und Technologie, 12, 247-251.
Thibault J.-F., Renard C. M. G. C., Axelos M. A. V., Roger P., Crepeau M.-J. (1993). Studies of the lenght of
homogalacturonic regions in pectins by acid hydrolysis. Carbohydrate Research, 238, 271-286.
Thibault J.-F., Rinaudo M. (1986). Chain association of pectic molecules during calcium-induced gelation.
Biopolymers, 25, 456-468.
Voragen A. G. J., Pilnik W., Thibault J.-F., Axelos M. A. V., Renard C. M. G. C., (1995). Pectins. In: Food
polysaccharides and their applications; Stephen A. M., New York: Marcel Dekker Inc., 287-339.
Williams M. A. K., Buffet G. M. C., Foster T. J. (2002). Analysis of partially methyl-esterified galacturonic acid
oligomers by capillary electrophoresis. Analytical Biochemistry, 301, 117-122.
Williams M. A. K., Foster T. J., Schols H. A. (2003). Elucidation of pectin methylester distributions by capillary
electrophoresis. Journal of Agricultural and Food Chemistry, 51, 1777-1781.
Zhong H. J., Williams M. A. K., Goodall D. M., Hansen M. E. (1998). Capillary electrophoresis studies of
pectins. Carbohydrate Research, 308, 1-8.
Zhong H. J., Williams M. A. K., Keenan R. D., Goodall D. M., Rolin C. (1997). Separation and quantification of
pectins using capillary electrophoresis. Carbohydrate Polymers, 32, (1), 27-32.
Chapter 5
Degree of blockiness of amide groups as indicator for
differences between amidated pectins. To be submitted in Biopolymers as:
S.E Guillotin, J. Van Kampen, P.Boulenguer, , H.A. Schols and A. G. J. Voragen.
Abstract
Thickening and gelling properties of commercial amidated pectins depend on the degree of
amidation and methyl-esterification, but also the distribution of these groups is of great
importance. Methods have been developed during the last few years to determine the
distribution of methyl-esters over the pectic backbone. We applied the strategies developed
for the analysis of high methyl-esterified pectins for studying the distribution of amide groups
in amidated pectins. Low methyl-esterified amidated (LMA) pectins were digested before and
after removal of methyl-esters by an endo-polygalacturonase to determine the degree of
blockiness of the substituents. The nature of the substituents (amide groups compared to
methyl-esters) did not modify the behavior of the enzyme. Oligomers released were separated
by using high-performance anion exchange chromatography at pH 5. Fractions collected after
on-line desalting were identified by using MALDI-TOF mass spectrometry. Oligomers were
found to elute from the column as function of their total charge. For the same overall charge
and size, oligomers with methyl-esters eluted before oligomers with amide groups. Both
amide groups and methyl-esters of the LMA pectins studied were found to be semi-randomly
distributed over the pectic backbone, but this may vary according to the amidation process
used.
77
Chapter 5
1. Introduction
Pectins are used in the food industry for their gelling, thickening and stabilizing
properties. Pectins are mainly composed of α-D-1.4 linked galacturonic acid residues (GalA)
(Barrett & Northcote, 1965; De Vries, Voragen, Rombouts & Pilnik, 1981). In nature, the
carboxyl groups on C-6 of the GalA residus can be free or methyl-esterified. Native pectins
also contain regions of GalA-rhamnose sequences to which most of the neutral sides chains
are attached (Darvill, McNeill & Albersheim, 1978; McNeill, Darvill & Albersheim, 1980;
Neukom, Amado & Pfister, 1980; Pilnik & Voragen, 1991; Voragen, Pilnik, Thibault, Axelos
& Renard, 1995). As a result of the acid extraction of pectins (mainly from lemon peels), the
neutral sugar (NS) content of pectins is really low (5-10% in w/w%) (Guillotin et al., 2005;
Kravtchenko, Voragen & Pilnik, 1992a; Lecacheux & Brigand, 1988). The different gelling
properties of the extracted material depend on many factors (e.g. varieties of lemons, growing,
harvesting and processing conditions). At a molecular level, the physical properties of pectins
are influenced by the molecular weight (Christensen, 1954; Owens, Svenson & Schultz, 1933;
Van Deventer-Schriemer & Pilnik, 1987), the degree of substitution, the nature and the
distribution of the substituents (randomly or blockwise distributed over the GalA backbone)
(Lofgren, Guillotin, Evenbratt, Schols & Hermansson, 2005; Powell, Morris, Gidley & Rees,
1982; Rolin, 2002; Thibault & Rinaudo, 1986; Voragen et al., 1995). Commercial pectins are
classified in high methyl-esterified pectins also called HM pectins (degree of methyl-
esterification higher or equal to 50%) and low methyl-esterified pectins also called LM
pectins (degree of methyl-esterification below 50%). HM pectins are amidated for a better
control of their gelling behavior. Furthermore low methyl-esterified amidated pectins (LMA)
give more thermoreversible gels, need less calcium to gel when compared to LM pectins with
similar degree of substitution (Black & Smit, 1972; Racape, Thibault, Reitsma & Pilnik,
1989) and their gels are stronger below pH 3 compared to LM pectins (Lootens et al., 2003).
Commercial amidated pectins with similar chemical characteristics (molecular weight,
galacturonic acid and neutral sugar content, degree of methyl-esterification and degree of
amidation) have different gelling properties in the presence of calcium. These differences in
physical behavior may be due to a different distribution of methyl-esters and/or amide groups.
A way to characterise differences in distribution of these substituents is to establish the degree
of blockiness (DB) of both methyl-esters and amide groups. The method to determine the
degree of blockiness of methyl-esters has been described previously (Daas, Meyer-Hansen,
78

Determination of DBAm by using HPAEC
Schols, De Ruiter & Voragen, 1999; Daas, Voragen & Schols, 2000). Methyl-esterified
pectins were digested with an endo-polygalacturonase (endo-PG) obtained from
Kluyveromyces fragilis and degradation products were analyzed and quantified using HPAEC
pH 5. All fully and partially methyl-esterified oligogalacturonides observed in the elution
pattern were previously identified by using Maldi-TOF mass spectrometry (Daas, Arisz,
Schols, De Ruiter & Voragen, 1998; Daas et al., 1999; Daas et al., 2000). The amount of
mono, di- and trigalacturonic acid released by the enzyme compared to the amount of free
GalA presents in the sample was used to calculate the DB. A high DB value is indicative for a
blockwise distribution of non-esterified galacturonic acid residues in pectins. The ratio of
non-methyl-esterified oligomers versus methyl-esterified oligomers is also important for the
characterisation of pectins since it indicates whether the PG degradable blocks are closer to
each other or distant. In this study, all the degradation products present in the PG digest of
amidated pectins were identified by using off-line coupled HPAEC-MALDI-TOF mass
spectrometry. The method was applied to study differences in the distribution of methyl-esters
and/or amide groups in commercial LMA pectins having similar chemical characteristics but
different calcium sensitivity.
2. Material and methods
2.1. Pectins samples
Pectins were kindly provided by Degussa Texturant Systems, Danisco and Copenhagen
Pectins (Table I). The galacturonic acid content (GalA) was determined by using the
automated colorimetric m-hydroxydiphenyl method (Guillotin et al., 2005), the degree of
methyl-esterification (DM) by using GC headspace method (Guillotin et al., 2005; Huisman,
Oosterveld & Schols, 2004). The degree of amidation of these pectins was determined by the
pectin manufacturer by using the titration method (Food Chemical Codex, 1981). All
information about these pectins was summarized in Table I.
2.2. Saponification of the pectins
Pectins containing only amide groups were obtained by alkaline saponification. For this
purpose, pectins (4 g) were dissolved in 500 ml water at 40°C. An equal volume of 0.1 M
sodium hydroxide was added in cold condition (4°C) to avoid β-elimination. After 24 hours,
79
Chapter 5
the samples were neutralised by adding 500 ml 0.1 M acetic acid. Pectins were then
ultrafiltrated (Millipore Pellicon membrane; 10 kDa) and freeze dried. The saponified pectins
are indicated with the denomination “sap” (Table I).
2.3. Analysis of oligomers and determination of the degree of blockiness by HPAEC pH 5
equipped with a PA1 column.
Pectins were digested with an endo-polygalacturonase (endo-PG) obtained from
Kluyveromyces fragilis as described previously (Guillotin et al., 2005). Oligomers released
upon PG treatment of the pectins were analysed by HPAEC (100 µl of 5 mg/ml digests)
equipped with a Dionex CarboPac PA1 anion exchange column (250 × 2 mm) and a CarboPac
PA-1 pre-column (50 × 2 mm). The column was equilibrated with 0.01 M sodium acetate pH
5 during 10 min. Elution was performed in two steps: from 0.01 to 0.55 M of sodium acetate
pH 5 in 40 min and from 0.55 M to 1 M sodium acetate pH 5 in 60 min with a flow of 0.2
ml/min. The gradient was hold at 1 M sodium acetate pH 5 for 10 min. The PAD detector
(Dionex) was equipped with a gold working electrode and an Ag/AgCl reference electrode.
Detection of the oligomers was possible after post column addition of sodium hydroxide (1 M
NaOH; 0.2 ml/min).
After the detector, two desalting units (Dionex) were connected in series: the ultra-self-
regenerating anion suppressor 4 mm-unit (ASRS) was connected first to exchange the sodium
ions for hydronium ions (H3O+). In addition, an ultra-self-regenerating cation suppressor 4
mm-unit (CSRS) was installed in series to exchange the acetate ions for hydroxide ions (OH-).
The continuous desalting of the eluent was achieved by the electrolysis of deionized water (8
ml/min) in both suppressors. Fractions (120 µl) were collected in a 96-well-plate equipped
with filter (Millipore; 1.2 µm hydrophilic), using a Gilson FC-203B fraction collector.
The DB is the amount of mono- di- and trigalacturonic acid released by the endo-
polygalacturonase related to the amount of free GalA present in the sample. The absolute
degree of blockiness (DBabs) is the amount of mono- di- and trigalacturonic acid released by
the endo-polygalacturonase related to the total amount of GalA (free and methyl-esterified
GalA) present in the sample (Guillotin et al., 2005).
80
Determination of DBAm by using HPAEC
2.4. Characterisation of oligomers by matrix-assisted laser desorption/ionization time-of-
flight mass spectrometry (MALDI-TOF MS) after HPAEC pH 5 elution
Fractions (120 µl) were desalted by using H+-Dowex AG 50 WX8. Fractions were then
filtered (1.2 µm hydrophilic filter to remove the H+- Dowex) and collected in a second 96-
well plate by using a vacuum pump. The desalted fractions were applied (1 µl) on the Maldi
sample plate. On the top of this layer, 1 µl of matrix solution was added (dihydroxybenzoic
acid (9 mg/ml) dissolved in 50% (v/v) acetonitrile).
MALDI-TOF MS analysis in the reflector mode was performed by using an Ultraflex
instrument (Bruker Daltonic’s) equipped with a nitrogen laser of 337 nm. The mass
spectrometer was selected for positive ions. After a delayed extraction time of 200 ns, the ions
were accelerated to a kinetic energy of 12 kV. Hereafter, the ions were detected in the
reflector mode. The lowest laser power required to obtain good spectra was used and at least
100 spectra were collected. The MALDI-TOF MS was externally calibrated with a mixture of
oligoGalA.
3. Results and discussion:
3.1. Separation of oligomers obtained after enzymatic degradation of amidated pectins by
endo-PG
The relation between chemical structure and functionality of two LMA pectins (D and G) has
not been understood so far. The pectins had different gelling properties in the presence of
calcium, while the chemical characteristics (GalA content, the DM, the DAm) were quite
similar (Table I). The NS content of both LMA pectins is low (5% w/w). A different
distribution of the substituents (methyl-esters and/or amide groups) may explain the different
physical behavior of these two pectins. Therefore, we aimed to determine the degree of
blockiness of these substituents as published for the determination of the DB of HM and LM
pectins (Daas et al., 1999; Daas et al., 2000).
81
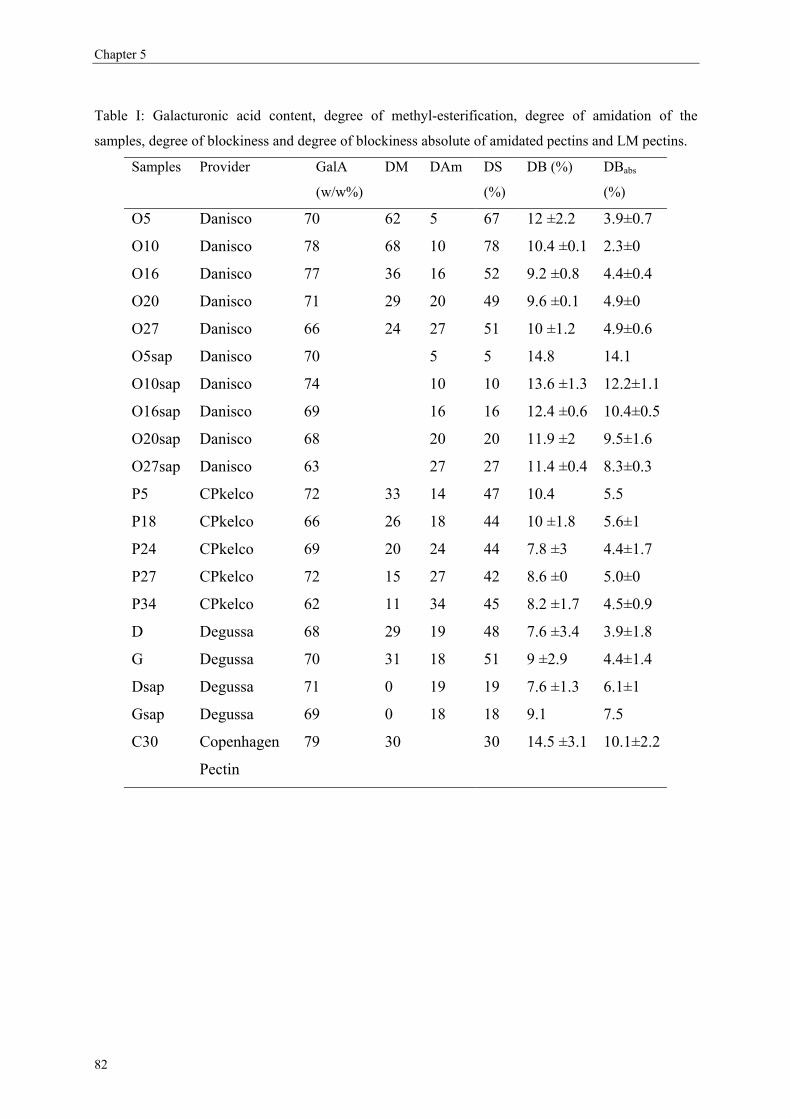
Chapter 5
Table I: Galacturonic acid content, degree of methyl-esterification, degree of amidation of the
samples, degree of blockiness and degree of blockiness absolute of amidated pectins and LM pectins.
Samples Provider GalA
(w/w%)
DM DAm DS
(%)
DB (%) DBabs
(%)
O5 Danisco 70 62 5 67 12 ±2.2 3.9±0.7
O10 Danisco 78 68 10 78 10.4 ±0.1 2.3±0
O16 Danisco 77 36 16 52 9.2 ±0.8 4.4±0.4
O20 Danisco 71 29 20 49 9.6 ±0.1 4.9±0
O27 Danisco 66 24 27 51 10 ±1.2 4.9±0.6
O5sap Danisco 70 5 5 14.8 14.1
O10sap Danisco 74 10 10 13.6 ±1.3 12.2±1.1
O16sap Danisco 69 16 16 12.4 ±0.6 10.4±0.5
O20sap Danisco 68 20 20 11.9 ±2 9.5±1.6
O27sap Danisco 63 27 27 11.4 ±0.4 8.3±0.3
P5 CPkelco 72 33 14 47 10.4 5.5
P18 CPkelco 66 26 18 44 10 ±1.8 5.6±1
P24 CPkelco 69 20 24 44 7.8 ±3 4.4±1.7
P27 CPkelco 72 15 27 42 8.6 ±0 5.0±0
P34 CPkelco 62 11 34 45 8.2 ±1.7 4.5±0.9
D Degussa 68 29 19 48 7.6 ±3.4 3.9±1.8
G Degussa 70 31 18 51 9 ±2.9 4.4±1.4
Dsap Degussa 71 0 19 19 7.6 ±1.3 6.1±1
Gsap Degussa 69 0 18 18 9.1 7.5
C30 Copenhagen
Pectin
79 30 30 14.5 ±3.1 10.1±2.2
82
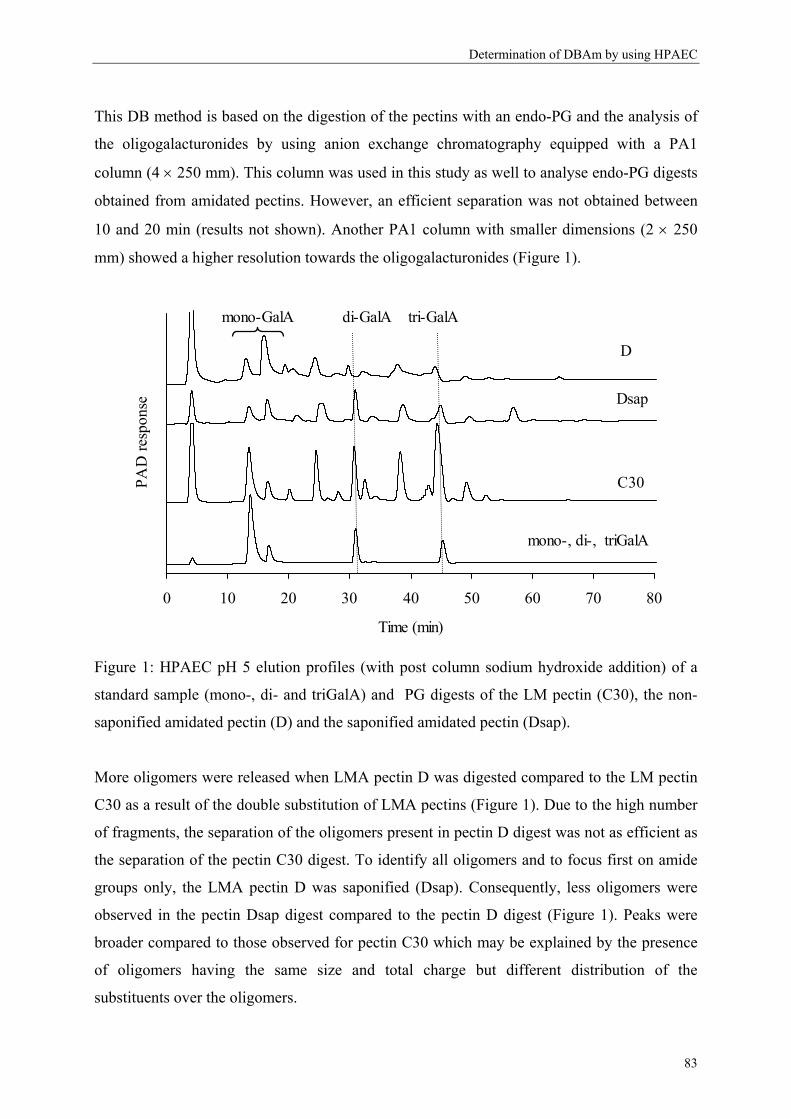
Determination of DBAm by using HPAEC
This DB method is based on the digestion of the pectins with an endo-PG and the analysis of
the oligogalacturonides by using anion exchange chromatography equipped with a PA1
column (4 × 250 mm). This column was used in this study as well to analyse endo-PG digests
obtained from amidated pectins. However, an efficient separation was not obtained between
10 and 20 min (results not shown). Another PA1 column with smaller dimensions (2 × 250
mm) showed a higher resolution towards the oligogalacturonides (Figure 1).
0 10 20 30 40 50 60 70 80
Time (min)
PAD
resp
onse
C30
D
Dsap
mono-, di-, triGalA
di-GalA tri-GalAmono-GalA
Figure 1: HPAEC pH 5 elution profiles (with post column sodium hydroxide addition) of a
standard sample (mono-, di- and triGalA) and PG digests of the LM pectin (C30), the non-
saponified amidated pectin (D) and the saponified amidated pectin (Dsap).
More oligomers were released when LMA pectin D was digested compared to the LM pectin
C30 as a result of the double substitution of LMA pectins (Figure 1). Due to the high number
of fragments, the separation of the oligomers present in pectin D digest was not as efficient as
the separation of the pectin C30 digest. To identify all oligomers and to focus first on amide
groups only, the LMA pectin D was saponified (Dsap). Consequently, less oligomers were
observed in the pectin Dsap digest compared to the pectin D digest (Figure 1). Peaks were
broader compared to those observed for pectin C30 which may be explained by the presence
of oligomers having the same size and total charge but different distribution of the
substituents over the oligomers.
83
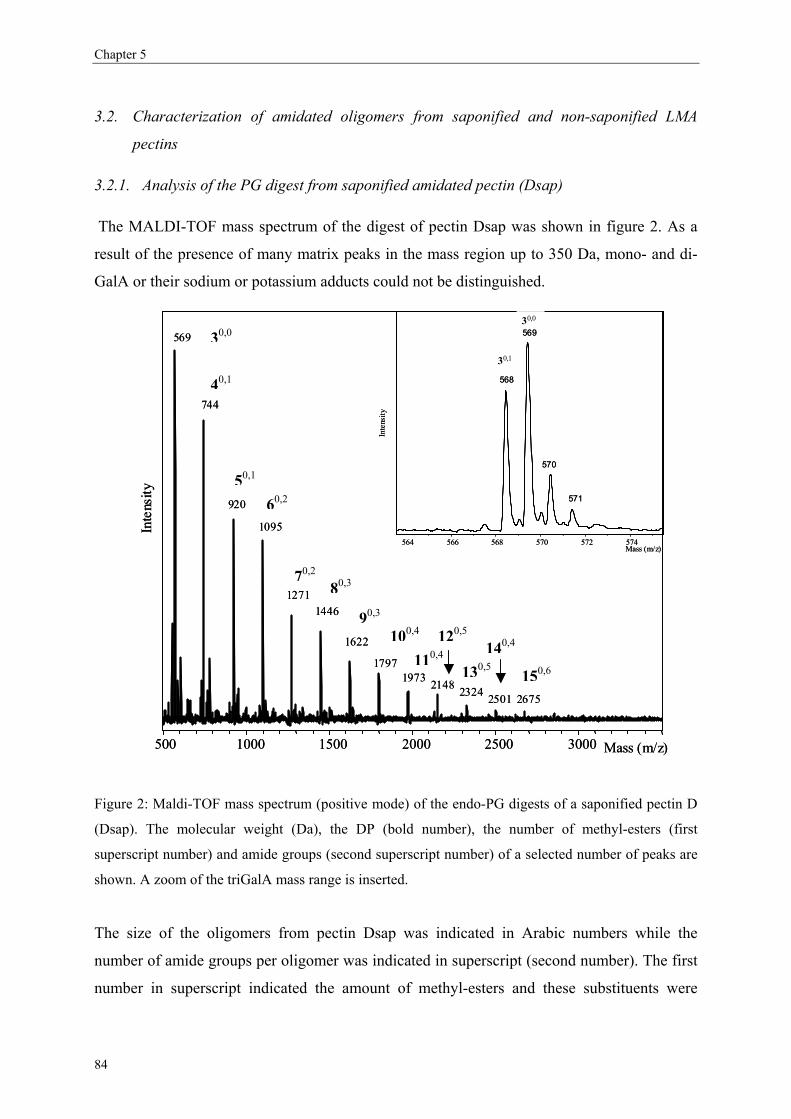
Chapter 5
3.2. Characterization of amidated oligomers from saponified and non-saponified LMA
pectins
3.2.1. Analysis of the PG digest from saponified amidated pectin (Dsap)
The MALDI-TOF mass spectrum of the digest of pectin Dsap was shown in figure 2. As a
result of the presence of many matrix peaks in the mass region up to 350 Da, mono- and di-
GalA or their sodium or potassium adducts could not be distinguished.
569
744
920
1095
12711446
1622
17971973 2148 2324 2501 2675
500 1000 1500 2000 2500 3000 Mass (m/z)
Inte
nsity
569
744
920
1095
12711446
1622
17971973 2148 2324 2501 2675
500 1000 1500 2000 2500 3000 Mass (m/z)
Inte
nsity
569
568
570
571
564 566 568 570 572 574Mass (m/z)
Inte
nsit y
30,1
30,0
569
568
570
571
564 566 568 570 572 574Mass (m/z)
Inte
nsit y
30,1
30,0
150,6
140,4
130,5
120,5
110,4100,4
90,3
80,370,2
60,250,1
40,1
30,0
Figure 2: Maldi-TOF mass spectrum (positive mode) of the endo-PG digests of a saponified pectin D
(Dsap). The molecular weight (Da), the DP (bold number), the number of methyl-esters (first
superscript number) and amide groups (second superscript number) of a selected number of peaks are
shown. A zoom of the triGalA mass range is inserted.
The size of the oligomers from pectin Dsap was indicated in Arabic numbers while the
number of amide groups per oligomer was indicated in superscript (second number). The first
number in superscript indicated the amount of methyl-esters and these substituents were
84
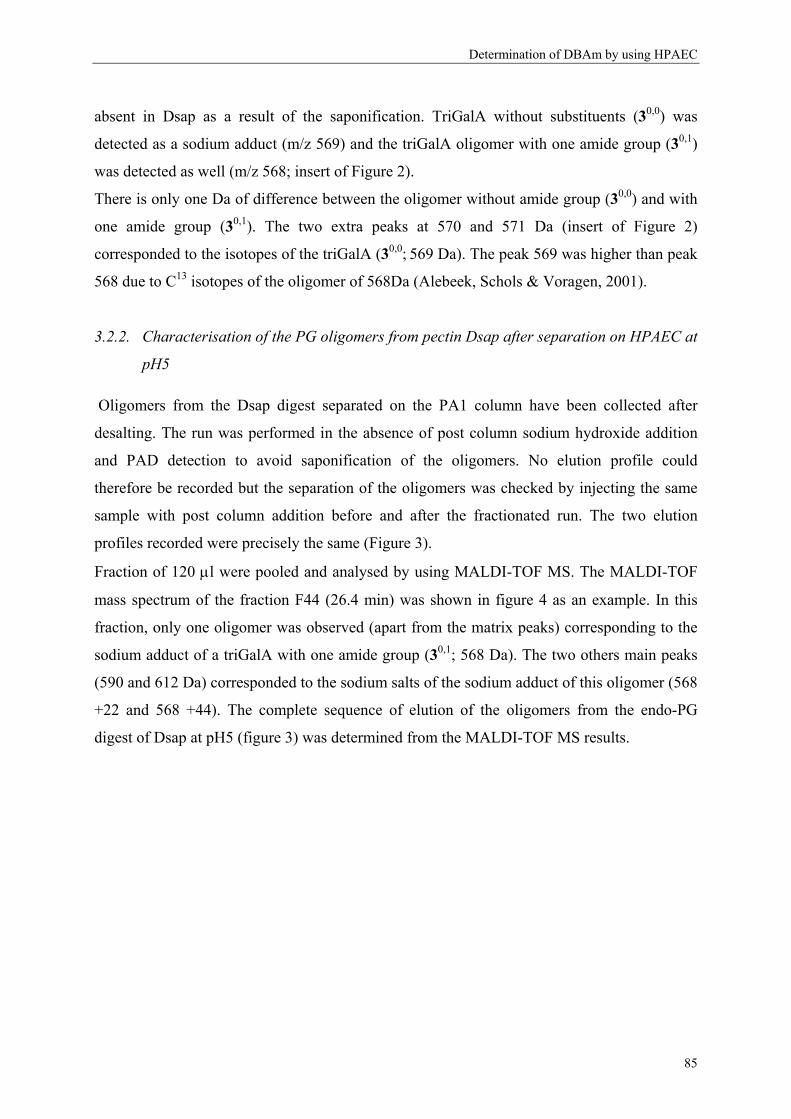
Determination of DBAm by using HPAEC
absent in Dsap as a result of the saponification. TriGalA without substituents (30,0) was
detected as a sodium adduct (m/z 569) and the triGalA oligomer with one amide group (30,1)
was detected as well (m/z 568; insert of Figure 2).
There is only one Da of difference between the oligomer without amide group (30,0) and with
one amide group (30,1). The two extra peaks at 570 and 571 Da (insert of Figure 2)
corresponded to the isotopes of the triGalA (30,0; 569 Da). The peak 569 was higher than peak
568 due to C13 isotopes of the oligomer of 568Da (Alebeek, Schols & Voragen, 2001).
3.2.2. Characterisation of the PG oligomers from pectin Dsap after separation on HPAEC at
pH5
Oligomers from the Dsap digest separated on the PA1 column have been collected after
desalting. The run was performed in the absence of post column sodium hydroxide addition
and PAD detection to avoid saponification of the oligomers. No elution profile could
therefore be recorded but the separation of the oligomers was checked by injecting the same
sample with post column addition before and after the fractionated run. The two elution
profiles recorded were precisely the same (Figure 3).
Fraction of 120 µl were pooled and analysed by using MALDI-TOF MS. The MALDI-TOF
mass spectrum of the fraction F44 (26.4 min) was shown in figure 4 as an example. In this
fraction, only one oligomer was observed (apart from the matrix peaks) corresponding to the
sodium adduct of a triGalA with one amide group (30,1; 568 Da). The two others main peaks
(590 and 612 Da) corresponded to the sodium salts of the sodium adduct of this oligomer (568
+22 and 568 +44). The complete sequence of elution of the oligomers from the endo-PG
digest of Dsap at pH5 (figure 3) was determined from the MALDI-TOF MS results.
85
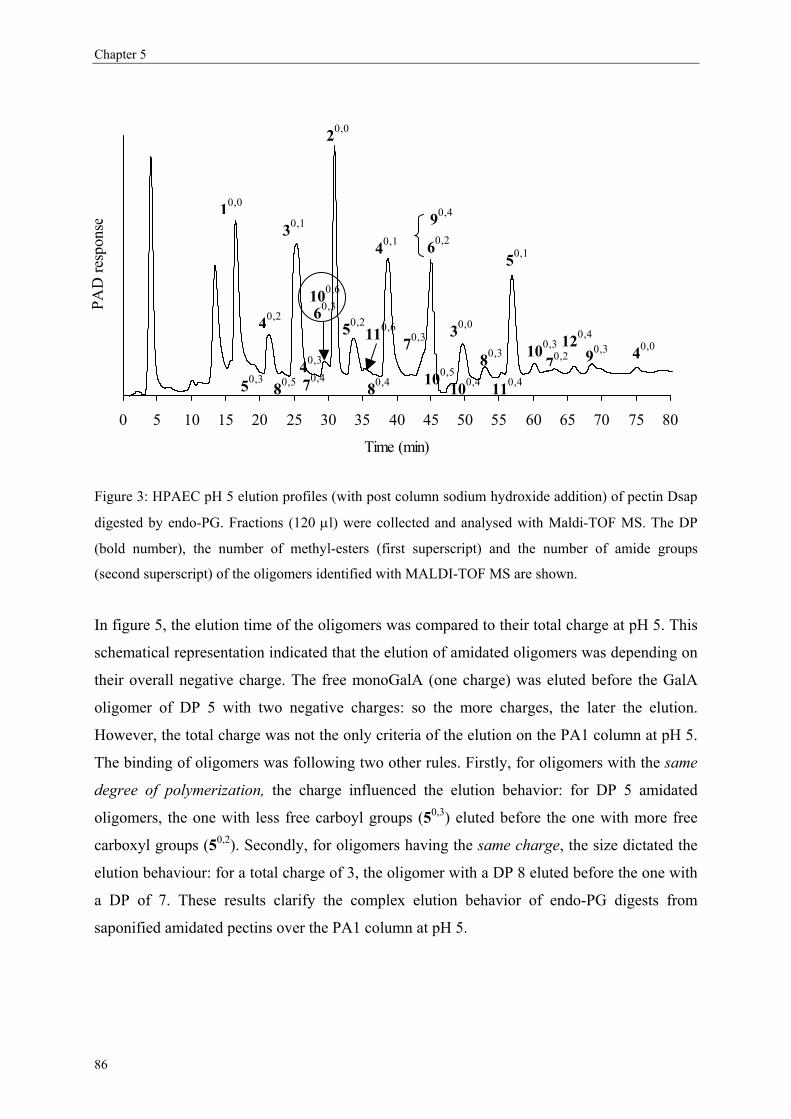
Chapter 5
0 5 10 15 20 25 30 35 40 45 50 55 60 65 70 75 80
Time (min)
PAD
resp
onse
10,0
20,0
30,0
30,1
40,1
50,240,2
50,380,5
40,3
70,4
100,6
60,3
80,4
70,3
60,2
90,4
80,3
50,1
70,2 90,3 40,0
100,5
100,4
100,3 120,4110,6
110,4
Figure 3: HPAEC pH 5 elution profiles (with post column sodium hydroxide addition) of pectin Dsap
digested by endo-PG. Fractions (120 µl) were collected and analysed with Maldi-TOF MS. The DP
(bold number), the number of methyl-esters (first superscript) and the number of amide groups
(second superscript) of the oligomers identified with MALDI-TOF MS are shown.
In figure 5, the elution time of the oligomers was compared to their total charge at pH 5. This
schematical representation indicated that the elution of amidated oligomers was depending on
their overall negative charge. The free monoGalA (one charge) was eluted before the GalA
oligomer of DP 5 with two negative charges: so the more charges, the later the elution.
However, the total charge was not the only criteria of the elution on the PA1 column at pH 5.
The binding of oligomers was following two other rules. Firstly, for oligomers with the same
degree of polymerization, the charge influenced the elution behavior: for DP 5 amidated
oligomers, the one with less free carboyl groups (50,3) eluted before the one with more free
carboxyl groups (50,2). Secondly, for oligomers having the same charge, the size dictated the
elution behaviour: for a total charge of 3, the oligomer with a DP 8 eluted before the one with
a DP of 7. These results clarify the complex elution behavior of endo-PG digests from
saponified amidated pectins over the PA1 column at pH 5.
86
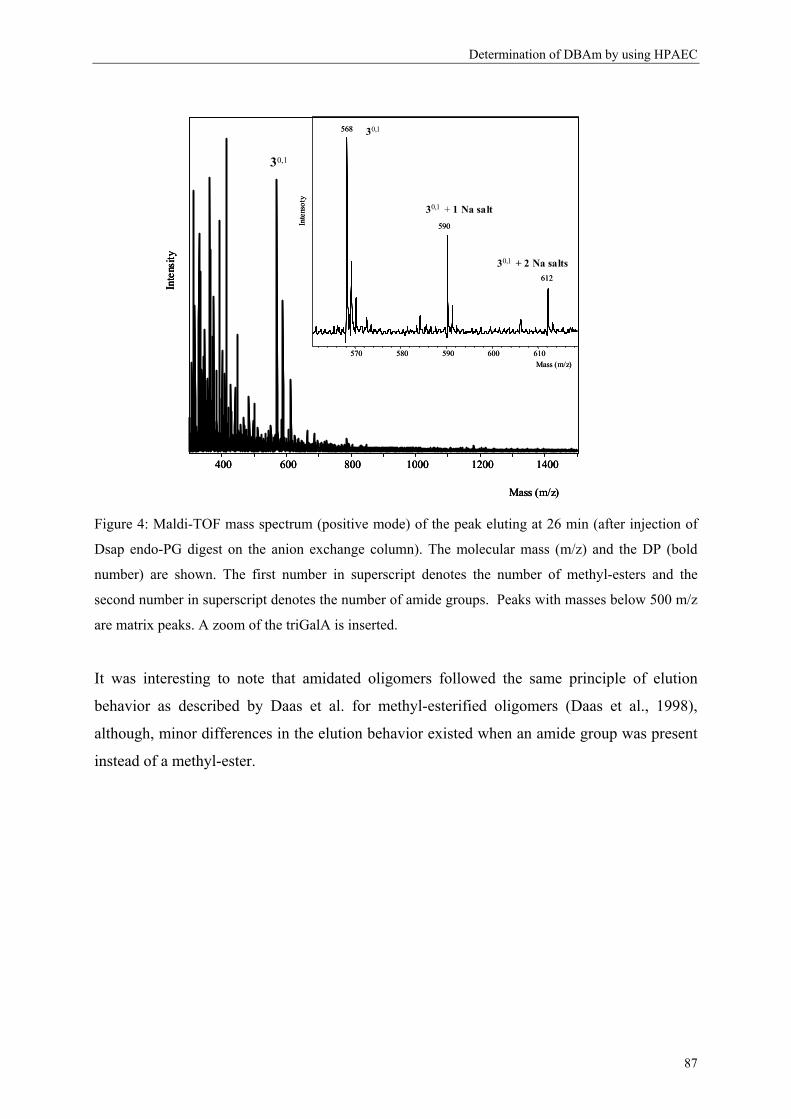
Determination of DBAm by using HPAEC
400 600 800 1000 1200 1400
Mass (m/z)
Inte
nsity
30,1
400 600 800 1000 1200 1400
Mass (m/z)
Inte
nsity
400 600 800 1000 1200 1400
Mass (m/z)
Inte
nsity
30,1
568
590
612
570 580 590 600 610Mass (m/z)
30,1
30,1 + 1 Na salt
30,1 + 2 Na salts
Inte
nsot
y
568
590
612
570 580 590 600 610Mass (m/z)
30,1
30,1 + 1 Na salt
30,1 + 2 Na salts
Inte
nsot
y
Figure 4: Maldi-TOF mass spectrum (positive mode) of the peak eluting at 26 min (after injection of
Dsap endo-PG digest on the anion exchange column). The molecular mass (m/z) and the DP (bold
number) are shown. The first number in superscript denotes the number of methyl-esters and the
second number in superscript denotes the number of amide groups. Peaks with masses below 500 m/z
are matrix peaks. A zoom of the triGalA is inserted.
It was interesting to note that amidated oligomers followed the same principle of elution
behavior as described by Daas et al. for methyl-esterified oligomers (Daas et al., 1998),
although, minor differences in the elution behavior existed when an amide group was present
instead of a methyl-ester.
87
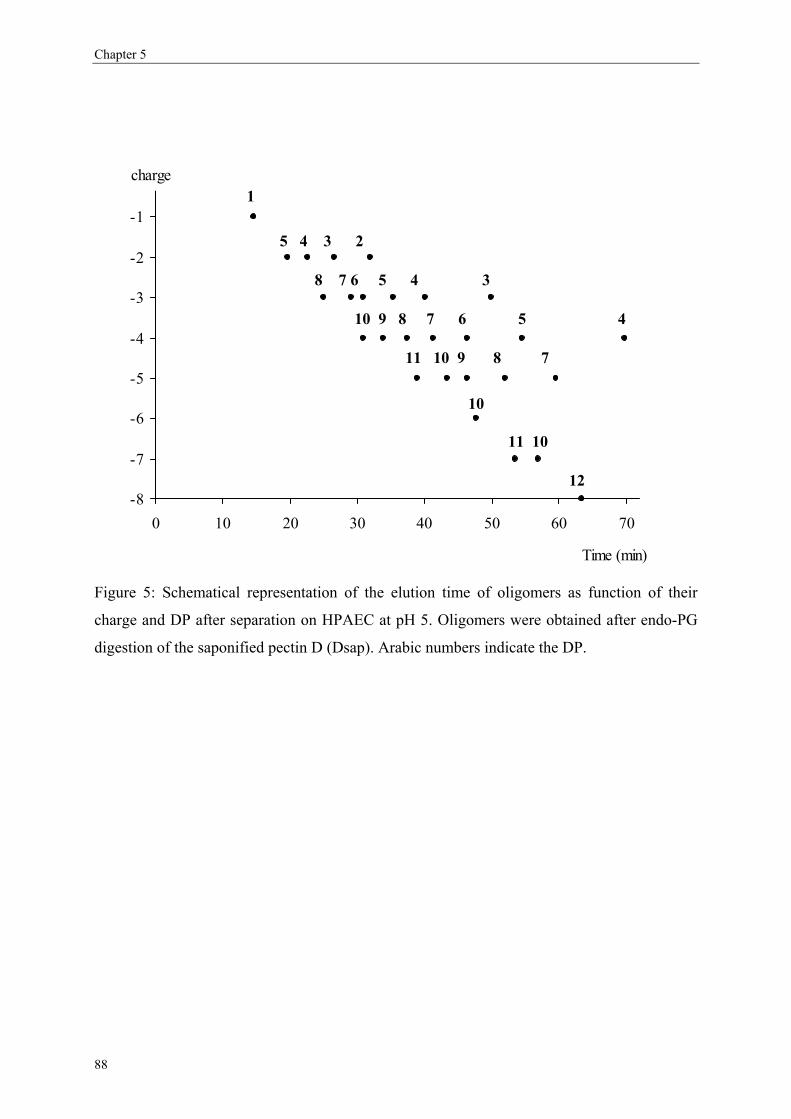
Chapter 5
-8
-7
-6
-5
-4
-3
-2
-1
0
0 10 20 30 40 50 60 70
Time (min)
charge 1
5 4 3 2
8 7 6 5 4 3
10 9 8 7 6 5 4
11 10 9 8 7
10
11 10
12
Figure 5: Schematical representation of the elution time of oligomers as function of their
charge and DP after separation on HPAEC at pH 5. Oligomers were obtained after endo-PG
digestion of the saponified pectin D (Dsap). Arabic numbers indicate the DP.
88

5 15 25 35 45 55 65
Time (min)
PAD
resp
onse
C30
D
Dsap
42, 0
40, 2
3 1,
0
3 0,
1
9 5,
0 6
3, 0
90, 5
60, 3
2 52,
0
50, 2
8 4,
0
8 0,
4
4 1,
0 4
0,1
6 2,
0 9
4, 0
6 0,
2 9 0
, 4
3
5 1,
0
5 0,
1
7 2,
0
7 0,
2 4 10 4,
0
7 0,
4
Figure 6: HPAEC pH 5 elution behaviour of partly amidated AND methyl-esterified galacturonic acid oligomers present in an endo-PG digest of LMA pectin
D. These oligomers are also compared to those obtained from the PG digests of LM pectin C30 and the saponified LMA pectins Dsap. The arabic number
indicates the DP. The first number in superscript denotes the number of methyl-esters and the second number in superscript denotes the number of amide
groups.
89
Chapter 5
3.2.3. Characterisation of the endo-PG oligomers from pectin D after separation on HPAEC
at pH 5
The digest from pectin D (with amide groups and methyl-esters) was also identified with
MALDI-TOF MS (Figure 6). It was interesting to note that for the same DP and overall
charge, an oligomer with a methyl-ester eluted before an oligomer with an amide group: a
trimer of GalA with an methyl-ester group (31,0) eluted before a trimer of GalA with an amide
group (30,1) as indicated in Figure 6. We speculated that this might be explained by the higher
steric hindrance of a methyl-ester, which would decrease the interaction of a neighboring
carboxylate group with the anion exchanger compared to an amide group, or, to the weaker
binding on the anion exchanger of 31,0 compared to 30,1 as a result of the slightly higher
polarity of the amide group compared to a methyl-ester.
3.3. Degree of blockiness of amide groups from saponified and non saponified LMA pectins
Since all peaks observed in the elution patterns of the amidated pectins digests at pH 5 were
characterized, the degree of blockiness of several LMA pectins and saponified LMA pectins
was calculated (Table I). A high DB value is indicative for a blockwise distribution of non-
substituted galacturonic acid residues in pectin (Daas et al., 1999; Daas et al., 2000).
3.3.1. Polygalacturonase behaviour towards amide groups on pectins
The endo-polygalacturonase used needs at least 4 free GalA to degrade the methyl-esterified
pectins (Pasculli, Geraeds, Voragen & Pilnik, 1991). It was assumed in our study that endo-
PG acted in the same way towards methyl-esters and amide groups. This assumption was
based on the fact that saponified amidated pectins (DAm of 20 %) were degraded by endo-PG
in a rather similar way as a LM pectin with a similar DS (DM17%; C17) (Daas, Boxma,
Hopman, Voragen & Schols, 2001) as monitored by HPSEC (results not shown). The pectins
Dsap and Gsap were slightly less digested by the endo-PG compared to the pectin C17 but
this may be due to a different distribution of the substituents, since pectin C17 was found to
have a blockwise distribution of the methyl-esters (DB of 38.9%). A similar sensitivity of the
endo-PG for methyl-esters and amide groups was also found by comparison of the DS 50
pectins (LM and amidated pectins). This enzyme activity was confirmed by other studies
90
Determination of DBAm by using HPAEC
where the degradation of both LMA and LM pectins with endo-PG and pectin esterase was
compared (Anger & Dongowski, 1988).
3.3.2. Distribution of amide groups over the galacturonic acid backbone
The degree of blockiness of several amidated pectins differing in the amount of methyl-esters
and amide groups were studied to analyse the distribution of the amide groups and/or methyl-
esters. The standard deviation of the DB and DBabs values of all the samples analysed was low
(respectively, 0-3.4% and 0-2.2%). The DBabs values give information about the absolute
number of PG degradable blocks in the whole pectin sample as described in detail previously
(Guillotin et al., 2005).
The degree of blockiness of saponified amidated pectins (O5sap-O27sap) was determined
(Table I) to analyse the distribution of amide groups. When the degree of amidation was
decreasing (DAm 27→5%) the degree of blockiness of amide groups was increasing (DB
11.4-14.8%) as a result of the higher amount of free GalA present. The same conclusions can
be made when analysing the DBabs.
The saponified amidated pectin O16sap was compared to a similar DS pectin (DM17). For
this methyl-esterified pectin, Daas et al. calculated a DBabs of 38.9% (Daas et al., 2001),
which is much higher than the DBabs found in our study with pectin O16sap (DBabs of 10.4%).
This indicated that the amide groups were semi-randomly distributed over the pectic
backbone as it has been observed previously (Anger & Dongowski, 1988; Voragen, Schols,
Clement & Pilnik, 1984). These results were in contrast with previous findings where a
blockwise distribution of the amide groups was suggested (Racape et al., 1989).
It was proven already that commercial HM pectins were constituted of several pectic
populations (Guillotin et al., 2005; Kravtchenko, Berth, Voragen & Pilnik, 1992;
Kravtchenko, Voragen & Pilnik, 1992b; Ralet, Bonnin & Thibault, 2001; Ralet & Thibault,
2002; Schols, Reitsma, Voragen & Pilnik, 1989). Therefore, different pectic populations were
expected to be present for amidated pectins as well. During the heterogeneous amidation
process in the presence of a mixture of water/alcohol/ammonia (Anger & Dongowski, 1988),
pectins are not soluble. It was suggested (Racape et al., 1989) that only the outer layers of
pectin particles are in contact with the solvent and available for alkali attack. This would
explain the blockwise distribution of the amide groups. The amidated pectins analysed in our
study were also non-homogenous polymers. Only few PG degradable blocks were indicated
91
Chapter 5
in these populations. Therefore, these amidated pectins could not be qualified as fully
blockwise amidated pectins. It is important to note that the distribution of the amide groups
will vary according to the amidation process: the distribution of these substituents in pectins
amidated in a homogeneous phase (concentrated ammonia (Black & Smit, 1972)) is expected
to be different than the distribution of the pectins amidated in a heterogeneous phase (Anger
& Dongowski, 1988).
3.3.3. Distribution of both amide groups and methyl-esters
Three LMA pectins (O16, O20 and O27) were prepared from the same pectin preparation,
which meant that the initial distribution of the methyl-esters was the same for all three
samples. These pectins contained a similar degree of substitution (respectively, 52, 49 and
51%) but a different ratio of amide groups versus methyl-esters (respectively, ratio amide
groups/methyl-esters of 0.4, 0.7 and 1.35). They were analysed to check whether a different
ratio of amide groups would change the degree of blockiness of the overall substitutents (table
I). These three pectins had a similar DB (9.2-10%) and DBabs (4.4-4.9%) suggesting a similar
distribution of the substituents. This similar distribution might be due to the same mother
pectin prior to amidation. Methyl-esters were only replaced by amide groups resulting in a
similar distribution of the substituents. These results also emphasized on the similar behavior
of the endo-PG towards amide groups and methyl-esters as observed previously.
The LMA pectins O16-O27 were compared to a methyl-esterified pectin with a similar degree
of substitution (DM56%) studied previously (Daas et al., 1999). Daas et al. found a DBabs
value of 13.9% for a blockwise DM56 pectin, and a DBabs of 1.7% for a random DM52 pectin
(Daas et al., 1999): the DBabs values of the three LMA pectins (DBabs from 8 to 10%) were in
between a random and a blockwise distribution of the substituents and thus semi-random.
3.3.4. Comparison of the distribution of the substituents of two LMA pectins with similar
chemical characteristics but different physical properties
Two commercial LMA pectins (D and G) with similar GalA, DM and DAm were analysed
since they presented totally different gelling properties in the presence of calcium (pectin D
was more calcium sensitive compared to pectin G). To check whether these physical
differences were due to a different distribution of the methyl-esters and/or amide groups,
these two samples have been analysed in more detail. The DBabs of pectin D was slightly
92
Determination of DBAm by using HPAEC
lower compared to pectin G but the endo-PG degradable blocks were similar when the pectins
were saponified (comparison of pectin D with Dsap and G with Gsap; Table I). It seems that
the removal of methyl-esters did not result in the production of more unsubstituted free GalA
blocks large enough to be degraded by endo-PG. This would indicate that the methyl-esters
were rather regularly distributed. The ratio of substituted oligomers versus non-substituted
oligomers (S+/S- ratio) was determined to get information about the position of the blocks. A
high S+/S- ratio is indicative of closed or longer PG degradable blocks over the pectic
backbone. The free GalA blocks of pectin G were found to be more closely neighboring or
longer compared to pectin D (respectively, S+/S- ratio of 1.4 and 1.9). It may be that the
higher calcium sensitivity of pectin D is due to the distribution of the free GalA blocks.
4. Conclusions
A method has now been validated to determine the degree of blockiness of amide groups from
LMA pectins by using the endo-polygalacturonase from Kluyveromyces fragilis. The enzyme
seems to have the same specificity towards methyl-esters and amide groups. All oligomers
released by the enzyme and analysed on HPAEC pH 5 with sodium hydroxide post column
addition were characterized. The distribution of amide groups over the pectic backbone of the
LMA pectins analysed in this study appeared to be semi-random while the distribution of the
methyl-esters was regular for some LMA pectins (only few PG degradable blocks).
Obviously, the distribution of both methyl-esters and amide groups depended on the
distribution of the starting material and might cause a wide range of blockiness for amidated
pectins. The DB values of two commercial LMA pectins with different gelling behavior in the
presence of calcium but with similar chemical characteristics were analysed and the
distribution of the substituents of the pectin D seemed to be slightly more random compared
to pectin G. However, the DB values obtained corresponded to an average and it was shown
that these pectins may contained different pectic populations with different features as
observed previously for HM pectins (Guillotin et al., 2005). Differences in populations and in
their characteristics may further explain the different physical properties of these LMA
pectins.
93
Chapter 5
References
Alebeek G.-J. W. M. v., Schols H. A., Voragen A. G. J. (2001). Amidation of methyl-esterified
oligogalacturonides: examination of the reaction products using MALDI-TOF MS. Carbohydrate
Polymers, 46, 311-321.
Anger H., Dongowski G. (1988). Amidated pectins - characterization and enzymatic degradation. Food
Hydrocolloid., 2, (5), 371-379.
Barrett A. J. B., Northcote D. H. (1965). Apple fruit pectic substances. Biochemical Journal, (94), 617-627.
Black S. A., Smit C. J. B. (1972). The effect of demethylation procedures on the quality of low-ester pectins
used in dessert gels. Journal of Food Science, 37, (II), 730-732.
Christensen P. E. (1954). Methods of grading pectin in relation to the molecular weight (intrinsec viscosity) of
pectin. Food Research, 19, 163.
Daas P. J. H., Arisz P. W., Schols H. A., De Ruiter G. A., Voragen A. G. J. (1998). Analysis of partially methyl-
esterified galacturonic acid oligomers by high-performance anion-exchange chromatography and
matrix-assisted laser desorption/ionization time-of flight spectrometry. Analytical Biochemistry, 257,
195-202.
Daas P. J. H., Boxma B., Hopman A. M. C. P., Voragen A. G. J., Schols H. A. (2001). Nonesterified
galacturonic acid sequence homology of pectins. Biopolymers, 58, 1-8.
Daas P. J. H., Meyer-Hansen K., Schols H. A., De Ruiter G. A., Voragen A. G. J. (1999). Investigation of the
non-esterified galacturonic acid distribution in pectin with endopolygalacturonase. Carbohydrate
Research, 318, 135-145.
Daas P. J. H., Voragen A. G. J., Schols H. A. (2000). Characterisation of non-esterified galacturonic acid
sequences in pectin with endopolygalacturonase. Carbohydrate Research, 326, 120-129.
Darvill A. G., McNeill M., Albersheim P. (1978). Structure of plant cell walls: VIII. A new pectic
polysaccharide. Plant Physiology, 62, 418-422.
De Vries J. A., Voragen A. G. J., Rombouts F. M., Pilnik W. (1981). Extraction and purification of pectins from
alcohol insoluble solids from ripe and unripe apples. Carbohydrate Polymers, 1, 117-127.
Food Chemical Codex, (1981) 3rd Ed., National Academy of Sciences, Washington, DC
Guillotin S. E., Bakx E. J., Boulenguer P., Mazoyer J., Schols H. A., Voragen A. G. J. (2005). Populations
having different GalA blocks characteristics are present in commercial pectins which are chemically
similar but have different functionalities. Carbohydrate Polymers, 60, 391-398.
Huisman M. M. H., Oosterveld A., Schols H. A. (2004). New method for fast determination of the degree of
methylation of pectins by headspace GC. Food Hydrocolloids., 18, (4), 665-668.
Kravtchenko T. P., Berth G., Voragen A. G. J., Pilnik W. (1992). Studies on the intermolecular distribution of
industrial pectins by means of preparative size exclusion chromatography. Carbohydrate Polymers, 18,
253-263.
Kravtchenko T. P., Voragen A. G. J., Pilnik W. (1992a). Analytical comparison of three industrial pectin
preparations. Carbohydrate Polymers, 18, 17-25.
94

Determination of DBAm by using HPAEC
Kravtchenko T. P., Voragen A. G. J., Pilnik W. (1992b). Studies on the intermolecular distribution of industrial
pectins by means of preparative ion-exchange chromatography. Carbohydrate Polymers, 19, 115-124.
Lecacheux D., Brigand G. (1988). Preparative fractionation of natural polysaccharides by size exclusion
chromatography. Carbohydrate Polymers, 8, 119-130.
Lofgren C., Guillotin S., Evenbratt H., Schols H., Hermansson A.-M. (2005). Effects of calcium, pH and
blockiness on kinetic rheological behavior and microstructure. Biomacromolecules, 6, 646-652.
Lootens D., Capel F., Durand D., Nicolai T., Boulenguer P., Langendorff V. (2003). Influence of pH, Ca
concentration, temperature and amidation on the gelation of low methoxyl pectin. Food Hydrocolloids,
17, 237-244.
McNeill M., Darvill A. G., Albersheim P. (1980). Structure of plant cell walls: X. Rhamnogalacturonan I A
structurally complex polysaccharide in the walls of suspension-cultured sycamore cells. Plant
Physiology, 66, 1128-1134.
Neukom H., Amado R., Pfister M. (1980). Neuere erkenntnisse auf dem gebiete der pektinstoffe. Lebensm.wiss.u
technology, 13, 1-6.
Owens H. S., Svenson H. A., Schultz T. H., (1933). In: Natural Plant Hydrocolloids, Advances in Chemistry;
American Chemical Society, 10.
Pasculli R., Geraeds C., Voragen F., Pilnik W. (1991). Characterization of polygalacturonases form yeast and
fungi. Lebensmittel Wissenschaft und Technologie, 24, 63-70.
Pilnik W., Voragen A. G. J., (1991). In: Food Enzymology; Fox P. F., London, Elsevier Applied Science, 303-
306.
Powell D. A., Morris E. R., Gidley M. J., Rees D. A. (1982). Conformations and interactions of pectins II.
Influence of residue sequence on chain association in calcium pectate gels. Journal of molecular
biology, 155, 517-531.
Racape E., Thibault J. F., Reitsma J. C. E., Pilnik W. (1989). Properties of amidated pectins II. Polyelectrolyte
behavior and calcium binding of amidate pectins and amidated pectic acids. Biopolymers, 28, 1435-
1448.
Ralet M. C., Bonnin E., Thibault J.-F. (2001). Chromatographic study of highly methoxylated lime pectins de-
esterified by different pectin methyl-esterases. Journal of Chromatography B, 753, 157-166.
Ralet M. C., Thibault J.-F. (2002). Interchain heterogeneity of enzymatically deesterified lime pectins.
Biomacromolecules, 3, 917-925.
Rolin C., (2002). Commercial pectin preparations. In: Pectins and their Manipulation; Seymour G. B., Knox J.
P., Blackwell Publishing Ltd., 222-239.
Schols H. A., Reitsma J. C. E., Voragen A. G. J., Pilnik W. (1989). High-performance ion exchange
chromatography of pectins. Food Hydrocolloids, 3, (2), 115-121.
Thibault J.-F., Rinaudo M. (1986). Chain association of pectic molecules during calcium-induced gelation.
Biopolymers, 25, 456-468.
Van Deventer-Schriemer W. H., Pilnik W. (1987). Studies on pectin degradation. Acta Alimentaria, 16, 143.
Voragen A. G. J., Pilnik W., Thibault J.-F., Axelos M. A. V., Renard C. M. G. C., (1995). Pectins. In: Food
polysaccharides and their applications; Stephen A. M., New York, Marcel Dekker Inc., 287-339.
95

Chapter 5
96
Voragen A. G. J., Schols H. A., Clement A. J. J., Pilnik W., (1984). Enzymic analysis of pectins. In: Gums and
stabilisers for the food industry 2. Applications of Hydrocolloids; Philips G. O., Wedlock D. J.,
Williams P. A., ed., Elsevier London, 517-521.
Chapter 6
Chromatographic and enzymatic strategies to reveal
differences between amidated pectins on molecular level. To be submitted in Biomacromolecules as:
S.E Guillotin, N. Mey, E. Ananta, P.Boulenguer, H.A. Schols and A. G. J. Voragen.
Abstract
When applying pectins as a food ingredient, the “routine’ analysis usually performed
(galacturonic and neutral sugar content, molecular weight distribution and level of methyl-
esterification and amidation) does not always explain differences between pectins having
different functional properties. This is particularly true for low methyl-esterified amidated
pectins (LMA) since not much is known so far on the two ‘independent’ and complex
distributions of both methyl esters and amide groups. To get more knowledge about the
chemical structure of such pectins, the distribution of amide groups within two commercial
LMA pectins was studied after removal of the methyl-esters followed by fractionation of the
different populations by anion exchange chromatography. Despite the different elution
behavior on the anion exchange column, the different populations had almost equal degrees of
amidation suggesting different distributions of the amide groups. This was indeed
substantiated by establishing the degree of blockiness (DB) by using endo-polygalacturonase
as an analytical tool. However, the distribution of amide groups for most populations should
be considered as semi-random since blockwise distributed pectins would have much higher
DB values. Digestion of populations obtained after anion exchange chromatography of the
methyl esterified amidated pectins ‘as is’ showed a rather random distribution for almost all
populations. However, a striking difference between the different populations was that,
despite of the same level of substitution, the ratio between amide groups and methyl esters
varied significantly indicating an heterogeneous amidation process.
97
Chapter 6
1. Introduction
Nowadays, pectin is widely used as gelling and thickening compound, but is also known for
its health effect such as antidiarrhea and detoxicant properties, the regulation and protection
of gastrointestinal tract and anti-tumour activity (Voragen, Pilnik, Thibault, Axelos & Renard,
1995; Waldron & Selvendran, 1993). It has been demonstrated that pectin is a complex
polysaccharide composed of an α-1,4-linked D-galacturonic acid (GalA) backbone (smooth
regions). This homogalacturonan is interrupted by alternating rhamnose/GalA sequences
where neutral sugars are substituted to the rhamnose moieties (hairy regions) (Barrett &
Northcote, 1965; Darvill, McNeill & Albersheim, 1978; De Vries, den Uyl, Voragen,
Rombouts & Pilnik, 1983; De Vries, Rombouts, Voragen & Pilnik, 1982; De Vries,
Rombouts, Voragen & Pilnik, 1983; De Vries, Voragen, Rombouts & Pilnik, 1981; McNeil,
Darvill & Albersheim, 1980; Neukom, Amado & Pfister, 1980). Commercial pectins are
extracted from lemon peels or apple pommace mainly yielding high methyl-esterified (HM)
pectins meaning that 50% or more of the galacturonic acids are methyl-esterified. These HM
pectins can be de-esterified to produce low methyl-esterified (LM) pectins (less than 50% of
the galacturonic acid residus in the backbone is methyl-esterified). Both types of pectins have
completely different gelling conditions. The LM pectins are used mainly in the presence of
calcium at neutral pH but as well at acidic conditions without calcium (Gilsenan, Richardson
& Morris, 2000; Voragen et al., 1995). HM pectins are used at low pH (below 3.5) in the
presence of sugar and without calcium addition (Voragen et al., 1995). The gels of LM
pectins are known to be thermoreversible, which is not the case for the HM pectin gels (Rolin
& De Vries, 1990). A third category of pectin is obtained by chemical amidation of HM
pectins to obtain low methyl-esterified amidated pectins (LMA pectins). These LMA pectins
need less calcium to gel and are claimed to be perfectly thermoreversible (Racape, Thibault,
Reitsma & Pilnik, 1989). Furthermore, the firmness and the strength of the gels obtained in
the presence of calcium are higher for LMA compared to the LM pectins with similar degree
of substitution (Black & Smit, 1972).
The gelling mechanism of amidated pectins is not completely understood yet. It seems that
both the egg-box mechanism described previously for LM pectins (Voragen et al., 1995) and
the stabilization of the junction zones with the hydrogen bonds of amide groups on pectins
(Alonso-Mougan, Meijide, Jover, Rodriguez-Nunez & Vazquez-Tato, 2002) play an
important role. The gelling mechanisms of pectins are influenced by several factors such as
98
Characterisation of LMA pectic populations
their molecular weight (Christensen, 1954; Owens, Svenson & Schultz, 1933; Van Deventer-
Schriemer & Pilnik, 1987), their total charge and the distribution of their charges over the
pectic backbone (Lofgren, Guillotin, Evenbratt, Schols & Hermansson, 2005; Rolin & De
Vries, 1990; Thibault & Rinaudo, 1986; Voragen et al., 1995).
In this study, we set out for a more detailed characterisation by using anion exchange
chromatography of two LMA pectins with similar chemical characteristics but different
gelling behavior in the presence of calcium. Pectins and pectic fractions were studied in the
original form and also after saponification to study the distribution of amide groups only.
Populations were also digested with endo-polygalacturonase to determine the distribution of
the substituents over the galacturonan backbone.
2. Material and methods
2.1. Pectin samples
The samples D and G were kindly provided by Degussa Texturant Systems. The galacturonic
acid content (GalA), the degree of methyl-esterification and the degree of amidation of these
pectins are described in Table I.
2.2. Saponification of pectins D and G
Pectin samples were wetted with ethanol, solubilised in water (0.8%) and cooled on ice. Then
an equal volume of NaOH (0.1 M) was added. The solutions were stirred and stored overnight
at 4°C. An equal volume of acetic acid (0.1 M) was added to neutralise. Acetate and methanol
were removed by dialysis with dialysis tubing (cut off 12 – 14 kDa for proteins) and samples
were freeze-dried. No β-elimination occurred as indicated by HPSEC analysis of the
saponified pectins (results not shown).
2.3. Preparative chromatography of commercial pectins
An Akta explorer system was used for separation of pectins on a preparative scale. Pectin (0.5
g) was dissolved in 100 ml of 0.03 M of sodium phosphate buffer. Elution was performed on
a Source-Q column (115 × 60 mm; Amersham Biosciences) using “Millipore” water during 4
column volumes (CV) followed by a linear gradient in steps: 0 to 0.12 M of sodium
phosphate buffer (pH 6) in 13 CV at 60 ml/min; 0.12 M to 0.42 M of sodium phosphate buffer
99
Chapter 6
(pH 6) in 44 CV; 0.42 M to 0.6 M sodium phosphate (pH 6) in 2 CV and finally 8.5 CV of 0.6
M sodium phosphate pH 6. The column was washed with 1 M sodium hydroxide for 5 CV.
Detection was accomplished with an UV detector set at 215 nm.
The fractions (250 ml) were pooled and ultrafiltrated with a Pellicon 10 kDa membrane (size
of 50 cm2) till a conductivity < 10 µS. After ultrafiltration, the fractions were freeze-dried.
Then the different pools were resuspended and dialysed with dialysis tubing (cut of 12-14
kDa for proteins) against “Millipore water” to remove last traces of salts prior to freeze-
drying.
2.4. Uronic acid content
Pectin solutions (60 µg/ml) were boiled (1h), cooled and then saponified with sodium
hydroxide (40 mM). The uronic acid content was determined by the automated colorimetric
m-hydroxydiphenyl method (Ahmed & Labavitch, 1977; Blumenkrantz & Asboe-Hansen,
1973; Thibault, 1979).
2.5. Neutral sugar content
The neutral sugar composition was determined by gas chromatography according to Englyst
and Cummings (1984) using inositol as an internal standard. The samples were treated with
72% (w/w) H2SO4 (1h, 30 °C) followed by hydrolysis with 1 M H2SO4 for 3 h at 100 °C and
the constituent sugars released were analysed as their alditol acetates.
2.6. Methyl-ester content
The methyl-ester content was determined by GC headspace analysis of the free methanol
released after alkaline de-esterification of pectins (Huisman, Oosterveld & Schols, 2004).
2.7. Digestion of the pectins with endo-polygalacturonase to determine the degree of
blockiness of the free GalA
Samples (5mg/ml) were diluted in sodium acetate 50 mM pH 5 and incubated with an
overdose of endo-polygalacturonase of Kluyveromyces fragilis (0.04 units/ml) for 24 hours.
The specific activity of this enzyme for PGA was 128 U/mg. Pectin digests were prepared by
incubation of pectic solutions with endo-polygalacturonase (0.04 units/ml) for 24 hours. As a
100
Characterisation of LMA pectic populations
result of the extended endo-polygalacturonase incubation employed, only end-products were
observed as was demonstrated by the use of an excess of enzymes and longer incubation
times. Oligomers released were analysed by HPAEC or CE as described below and the degree
of blockiness was calculated. The degree of blockiness (DB) is the amount of mono-, di- and
trigalacturonic acid released by the endo-polygalacturonase related to the amount of free
GalA present in the sample. The absolute degree of blockiness (DBabs) is the amount of mono-
di- and trigalacturonic acid released by the endo-polygalacturonase related to the total amount
of GalA (free and substituted GalA) present in the sample (Guillotin, Bakx et al., 2005).
2.8. CE analysis to determine the degree of amidation, degree of substitution and degree of
blockiness of amidated pectins
Analysis of the degree of amidation was performed as described previously (Guillotin, Ananta
et al., 2005). Phosphate buffer 50 mM pH 7 was used as electrophoresis buffer. Samples and
standards were wetted in 10 µl ethanol and dissolved in the phosphate buffer (5 mg/ml).
Experiments were carried out on an automated CE system (P/ACE MDQ) equipped with an
UV Detector (stated at 190 nm and 200 nm). A fused silica capillary internal diameter 50 µm,
total length of 50.2 cm with 40 cm length capillary from inlet to detector was used and
thermostatted at 25oC. New capillaries were conditioned by rinsing for 15 min with 0.1 M
NaOH, 30 min distilled water and 30 min phosphate buffer. Between two runs the capillary
was washed for 2 min with 0.1 M NaOH, 1min with distilled water and 2 min with phosphate
buffer. All solutions were filtered on a 0.2 µm membrane. Samples (50 µl) were loaded
hydrodynamically (5 sec at 9.5 Psi) and electrophoresis was performed across a potential
difference of 20 kV (during 37 min in phosphate buffer pH 7) for DS, DM and DAm analysis
and 17 kV for the DB analysis (performed only on the populations fractionated from the crude
pectins D and G). The separation process is performed in normal polarity.
The shift of the electro-osmotic flow (eof), observed sometimes within a sample sequence,
was corrected by using the following transformation: tcor = 1/ [(1/t) –(x)] where tcor is the
migration time of the sample corrected from the eof shift, t is the migration time of the sample
observed, x is the value to match the eof migration time for all samples.
The correlation of the Electrophoretic Mobility (EM) with total charge expected was used for
determination of the degree of amidation. The equation to calculate the EM is described
below
101
Chapter 6
EM = EMp - EMm = (lL /V) [(1/tp) – (1/tm)]
where EMp corresponds to the observed mobility of the pectin and EMm to the observed
mobility of the eof, l is the distance from the inlet to the detector, L is the total length of the
capillary, V the applied voltage, tp and tm are the migration times of pectins and neutral
markers, respectively (Zhong, Williams, Goodall & Hansen, 1998).
2.8.1. HPAEC pH5 analysis of oligomers for the determination of the degree of blockiness
Oligomers released in endo-polygalacturonase digests (of the populations fractionated from
Dsap and Gsap) were analysed by HPAEC on a Thermo-Quest HPLC system (100 µl
injection) equipped with a Dionex CarboPac PA1 anion exchange column (250 × 2mm) and a
CarboPac PA1 pre-column (50 × 2mm). The column was equilibrated with 0.01 M sodium
actetate pH 5 during 10 min. Elution was performed in two steps: a linear gradient from 0.01
to 0.55 M of sodium acetate pH 5 in 40 min and another linear gradient from 0.55 M to 1 M
sodium acetate pH 5 in 60 min with a flow of 0.2 ml/min. The gradient was hold at 1 M
sodium acetate pH 5 for 10 min. The PAD detector (Dionex) was equipped with a gold
working electrode and an Ag/AgCl reference electrode. Detection of the oligomers was
possible after post column sodium hydroxide addition (1 M; 0.2 ml/min). Mono-, di- and tri-
GalA peaks were integrated by using the peakfit software (Aspire Software International).
3. Results and discussion:
3.1. Separation of pectic populations from saponified LMA pectins by preparative anion
exchange chromatography
Two LMA pectins were analysed to understand their different gelling behavior in presence of
calcium. Pectin D was found to be more sensitive to calcium compared to pectin G during gel
formation (results not shown), but routine chemical analysis (GalA and NS content, DM and
DAm; Table I) showed similar chemical characteristics. The degree of blockiness (DB),
which is a parameter to reveal the distribution of the charges over the pectic backbone, has
been introduced previously (Daas, Meyer-Hansen, Schols, De Ruiter & Voragen, 1999; Daas,
Voragen & Schols, 2000; Guillotin, Bakx et al., 2005). Pectins are digested with an endo-
polygalacturonase known to release mono-, di and triGalA oligomers when sequences of more
than four free GalA blocks are present. The DB is the percentage of these non-methyl-
102
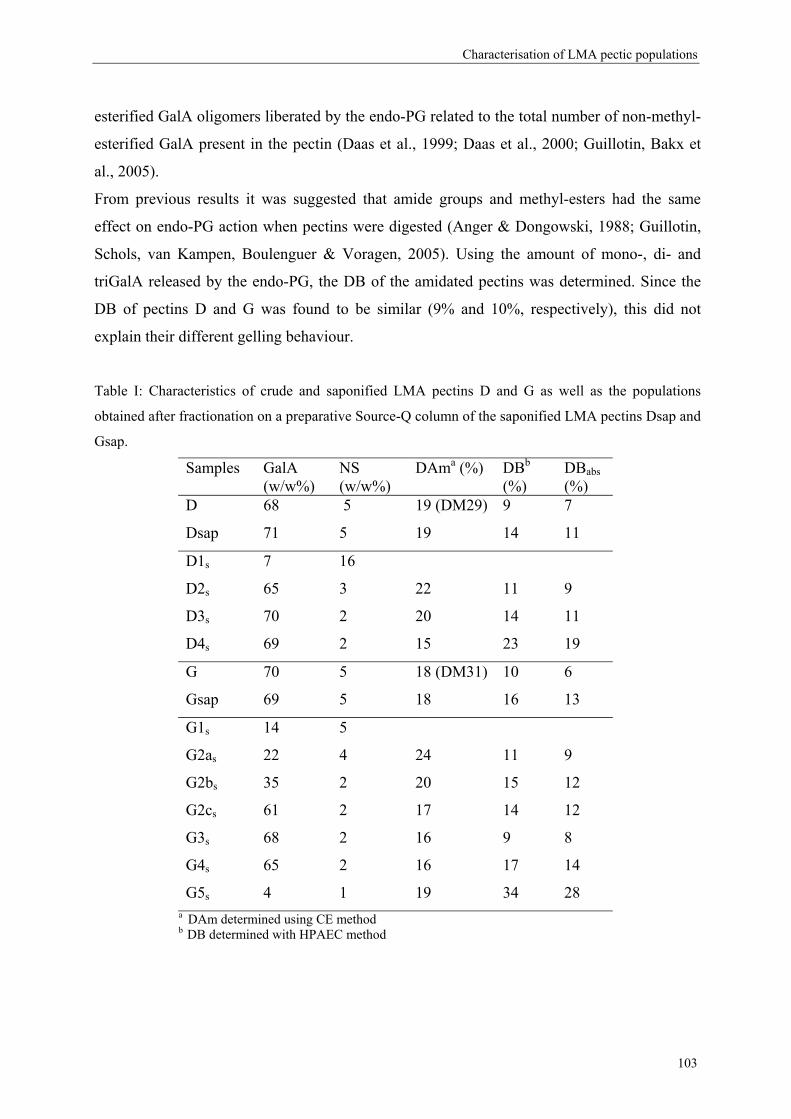
Characterisation of LMA pectic populations
esterified GalA oligomers liberated by the endo-PG related to the total number of non-methyl-
esterified GalA present in the pectin (Daas et al., 1999; Daas et al., 2000; Guillotin, Bakx et
al., 2005).
From previous results it was suggested that amide groups and methyl-esters had the same
effect on endo-PG action when pectins were digested (Anger & Dongowski, 1988; Guillotin,
Schols, van Kampen, Boulenguer & Voragen, 2005). Using the amount of mono-, di- and
triGalA released by the endo-PG, the DB of the amidated pectins was determined. Since the
DB of pectins D and G was found to be similar (9% and 10%, respectively), this did not
explain their different gelling behaviour.
Table I: Characteristics of crude and saponified LMA pectins D and G as well as the populations
obtained after fractionation on a preparative Source-Q column of the saponified LMA pectins Dsap and
Gsap.
Samples GalA (w/w%)
NS (w/w%)
DAma (%) DBb (%)
DBabs (%)
D 68 5 19 (DM29) 9 7
Dsap 71 5 19 14 11
D1s 7 16
D2s 65 3 22 11 9
D3s 70 2 20 14 11
D4s 69 2 15 23 19
G 70 5 18 (DM31) 10 6
Gsap 69 5 18 16 13
G1s 14 5
G2as 22 4 24 11 9
G2bs 35 2 20 15 12
G2cs 61 2 17 14 12
G3s 68 2 16 9 8
G4s 65 2 16 17 14
G5s 4 1 19 34 28 a DAm determined using CE method b DB determined with HPAEC method
103
Chapter 6
The distribution of the substituents of these pectins were rather random since Daas et al. found
a higher DB (33% for a DM 56.4 pectin) for a blockwise methyl-esterified pectin with a
similar DS (Daas, Boxma, Hopman, Voragen & Schols, 2001) as the amidated pectins.
Recently, commercial HM pectin preparations were found to be composed of populations with
different characteristics concerning the total charge and the distribution of these charges
(Guillotin, Bakx et al., 2005), which may account for the different gelling behavior of the
pectins. The amidated pectin preparations were suspected to contain different pectin
populations with different chemical features as well, therefore the pectic populations of
amidated pectins were separated on preparative anion exchange chromatography by using the
same approach as described previously (Guillotin, Bakx et al., 2005).
Since LMA pectins contain both methyl-esters and amide groups, we saponified pectins to
focus first on the distribution of the amide groups. The DB of saponified pectin G (Gsap, DB
16%; Table I) was slightly higher than the one of saponified pectin D (Dsap, DB 14%)
indicating a slightly more blockwise distribution of the amide groups in pectin G compared to
pectin D. However, these rather low DB values indicated a rather random distribution of the
amide groups compared to a blockwise methyl-esterified pectin (DB of 39% for a DM 17
pectin) with similar DS (Daas et al., 2001). From the slightly different DB results of the
saponified amidated pectins and the similar DB of the crude amidated pectins, methyl-esters of
the crude pectin G were suggested to be more randomly distributed compared to pectin D.
As expected, several pectic populations were also found to be present in saponified amidated
pectins Dsap and Gsap after separation on anion exchange chromatography (Figure 1).
The elution profiles of saponified pectins Dsap and Gsap were rather similar with only
differences in the relative proportion of the populations present (fractions 40-69, 70-77 and
78-83, respectively). Pectin Gsap contained slightly more pectin molecules eluting at high
ionic strength and less pectin molecules eluting at lower ionic strength compared to pectin
Dsap. Neutral sugars were found in populations eluting at low ionic strength (mainly D1s), but
the NS content was low (results not shown).
The populations may differ in their total charge and/or in the distribution of the charges since
it has been demonstrated that the elution behavior of pectins on this column is sensitive to
these two different features (Guillotin, Bakx et al., 2005). Fractions were collected and pooled
as shown in Figure 1 and characterised (Table I). The recovery of GalA content was 89% and
91% for pectins Dsap and Gsap, respectively.
104
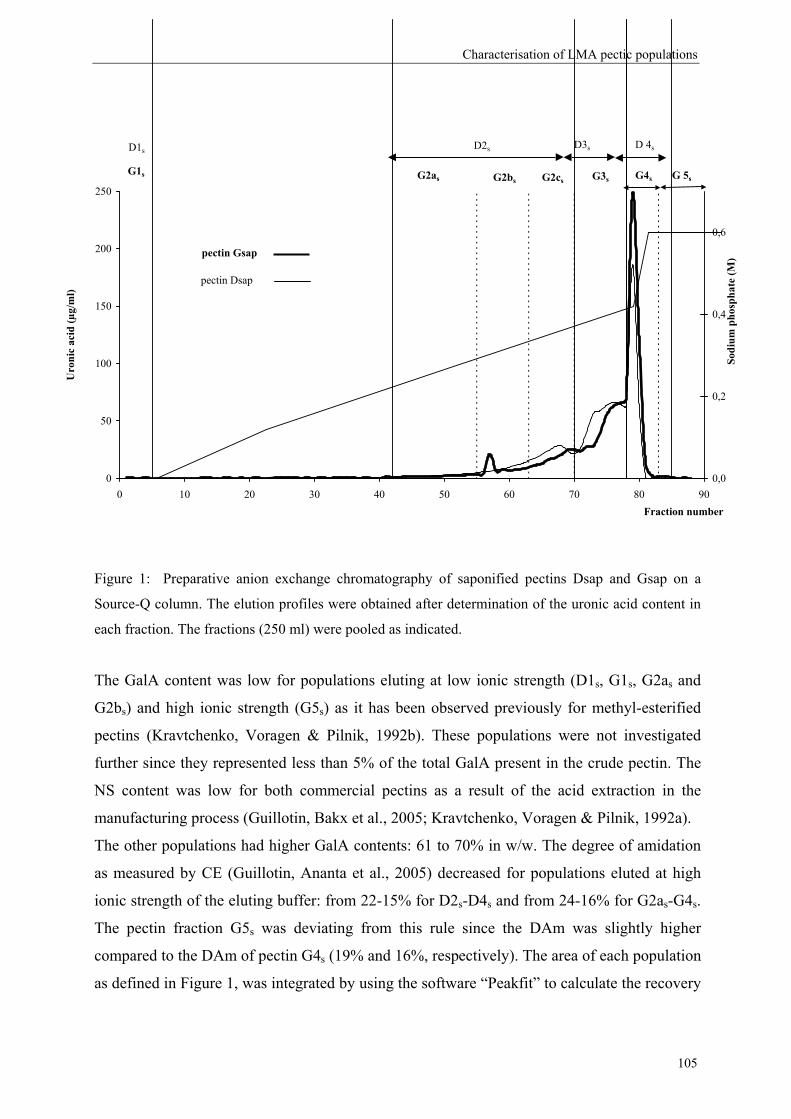
Characterisation of LMA pectic populations
0
50
100
150
200
250
0 10 20 30 40 50 60 70 80 90Fraction number
Uro
nic
acid
(µg/
ml)
0,0
0,2
0,4
0,6
Sodi
um p
hosp
hate
(M)
D1s
G1s
D2s
G2bs G2as G2cs G3s
D3s D 4s
G4s G 5s
pectin Gsap
pectin Dsap
Figure 1: Preparative anion exchange chromatography of saponified pectins Dsap and Gsap on a
Source-Q column. The elution profiles were obtained after determination of the uronic acid content in
each fraction. The fractions (250 ml) were pooled as indicated.
The GalA content was low for populations eluting at low ionic strength (D1s, G1s, G2as and
G2bs) and high ionic strength (G5s) as it has been observed previously for methyl-esterified
pectins (Kravtchenko, Voragen & Pilnik, 1992b). These populations were not investigated
further since they represented less than 5% of the total GalA present in the crude pectin. The
NS content was low for both commercial pectins as a result of the acid extraction in the
manufacturing process (Guillotin, Bakx et al., 2005; Kravtchenko, Voragen & Pilnik, 1992a).
The other populations had higher GalA contents: 61 to 70% in w/w. The degree of amidation
as measured by CE (Guillotin, Ananta et al., 2005) decreased for populations eluted at high
ionic strength of the eluting buffer: from 22-15% for D2s-D4s and from 24-16% for G2as-G4s.
The pectin fraction G5s was deviating from this rule since the DAm was slightly higher
compared to the DAm of pectin G4s (19% and 16%, respectively). The area of each population
as defined in Figure 1, was integrated by using the software “Peakfit” to calculate the recovery
105
Chapter 6
of amide groups. The recovery of amide groups was 100% for Dsap populations and 84% for
Gsap populations. The elution behavior of the populations on the anion exchanger could not
be explained by the DAm only since populations G3s and G4s for example had the same DAm
whereas they eluted at different ionic strength. The parameter reflecting the distribution of free
and amidated carboxyl groups (degree of blockiness) was determined for the relevant
populations. We saw previously that population D2s, D3s and D4s eluted as a function of their
charge. In addition, D4s was found to have a more blockwise distribution of the amide groups
compared to D2s and D3s. An increase of PG degradable blocks was also observed for
populations G3s, G4s and G5s (DB of 10%, 18% and 34%, respectively). The populations G3s
and G4s presented the same DAm but G4s had a more blockwise distribution of amide groups
explaining the later elution of this population. The late elution time of population G5s also had
to be attributed to a considerably more blockwise distribution of the free GalA (DB of 34%)
since the DAm was even higher compared to populations G2cs, G3s and G4s.
Recently we also introduced the DBabs corresponding to the ratio of GalA residues released
from endo-polygalacturonase and the total number of GalA residues (substituted and non
substituted ones) in the pectic population. The Source-Q column was found to discriminate
between pectic populations with different DBabs (Guillotin, Bakx et al., 2005). The more endo-
PG degradable blocks in the pectic populations, the later the elution on the anion exchanger.
This was observed as well in this study except for the population G3s.
When we compared the characteristics of Dsap and Gsap populations, we observed that even
though populations eluted at the same ionic strength, they slightly differed either in their DAm
or in the distribution of the amide groups. For example, the elution of population D3s G3s was
dictated by the DAm and not by the difference in the distribution of the amide (DBabs of 11%
and 8%, respectively).
Pectic populations were found to be different with respect to the level and distribution of the
amide groups. To obtain more information about the crude pectins D and G, their pectic
populations were isolated by using anion exchange chromatography and characterised.
3.2. Separation of pectic populations from crude LMA pectins on preparative anion
exchange chromatography
Pectins D and G were fractionated by preparative anion exchange chromatography (Figure 2).
Obviously, pectic populations from pectins D and G eluted earlier compared to those of pectin
106

Characterisation of LMA pectic populations
Dsap and Gsap as a result of the higher degree of substitution (DS of 46% and 50% compared
to 18 and 19%, respectively) and consequently lower netto charge. Both crude pectins showed
quite similar elution profiles, but pectin D contained more pectin molecules eluting at lowest
ionic strength (from 0.2 M-0.25 M phosphate buffer) and at high ionic strength (0.4 M
phosphate buffer) compared to pectin G. Fractions were pooled for both pectins D and G as
shown in figure 2, and characterised (Table II).
The GalA recovery was 83% for both pectins D and G. The populations eluting at low ionic
strength (D1, G1, D2 and G2) had a lower GalA content (respectively, 4%, 10%, 48% and
38% in w/w) while the GalA content of the other pectin fractions was in a higher range (57-
76% in w/w).
0
20
40
60
80
100
120
0 10 20 30 40 50 60 70 80 90Fraction number
Uro
nic
acid
(µg/
ml)
0,0
0,2
0,4
0,6
Sodi
um p
hosp
hate
(M)
P8
P1 P2 P3 P5 P6 P7P4
pectin G
pectin D
Figure 2: Preparative anion exchange chromatography of pectins D and G on a Source-Q column. The
elution profiles were obtained after determination of the uronic acid content in each fraction. The
fractions (250 ml) were pooled as indicated.
The NS content was high for the unbound fractions (D1 and G1) and for pectin D2 (50%, 24%
and 15% in w/w, respectively) and was lower for the other fractions (2-6% in w/w). The
107
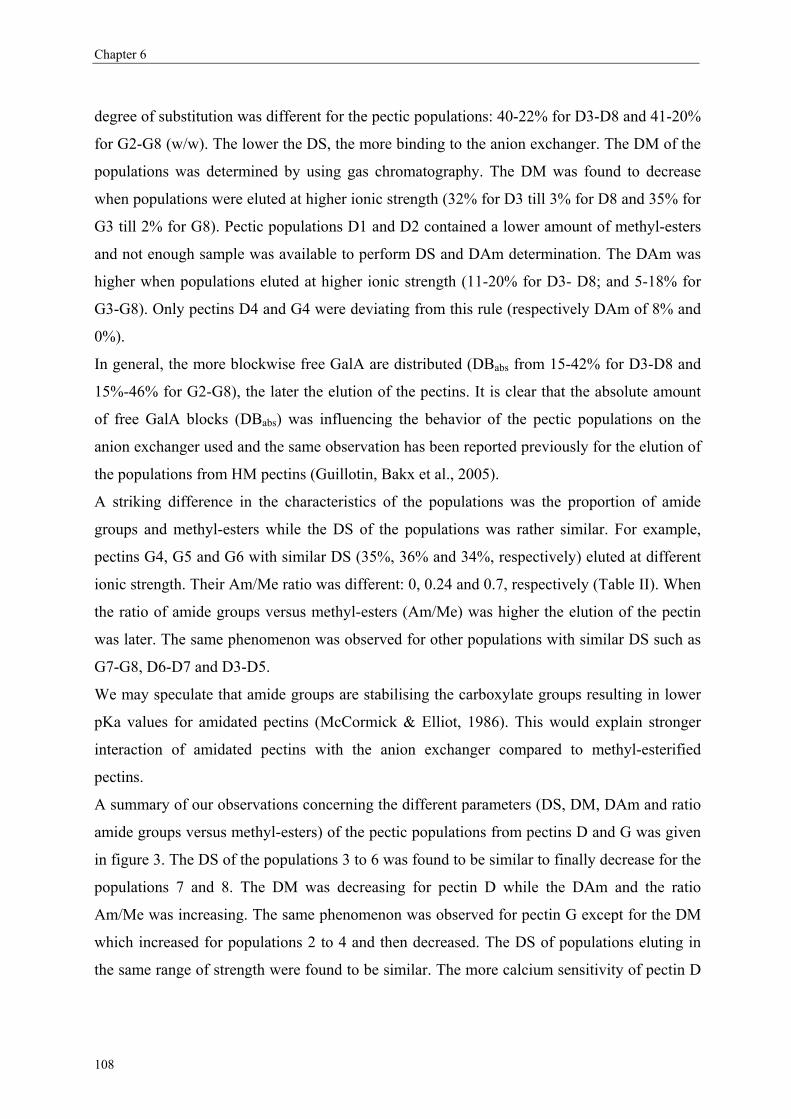
Chapter 6
degree of substitution was different for the pectic populations: 40-22% for D3-D8 and 41-20%
for G2-G8 (w/w). The lower the DS, the more binding to the anion exchanger. The DM of the
populations was determined by using gas chromatography. The DM was found to decrease
when populations were eluted at higher ionic strength (32% for D3 till 3% for D8 and 35% for
G3 till 2% for G8). Pectic populations D1 and D2 contained a lower amount of methyl-esters
and not enough sample was available to perform DS and DAm determination. The DAm was
higher when populations eluted at higher ionic strength (11-20% for D3- D8; and 5-18% for
G3-G8). Only pectins D4 and G4 were deviating from this rule (respectively DAm of 8% and
0%).
In general, the more blockwise free GalA are distributed (DBabs from 15-42% for D3-D8 and
15%-46% for G2-G8), the later the elution of the pectins. It is clear that the absolute amount
of free GalA blocks (DBabs) was influencing the behavior of the pectic populations on the
anion exchanger used and the same observation has been reported previously for the elution of
the populations from HM pectins (Guillotin, Bakx et al., 2005).
A striking difference in the characteristics of the populations was the proportion of amide
groups and methyl-esters while the DS of the populations was rather similar. For example,
pectins G4, G5 and G6 with similar DS (35%, 36% and 34%, respectively) eluted at different
ionic strength. Their Am/Me ratio was different: 0, 0.24 and 0.7, respectively (Table II). When
the ratio of amide groups versus methyl-esters (Am/Me) was higher the elution of the pectin
was later. The same phenomenon was observed for other populations with similar DS such as
G7-G8, D6-D7 and D3-D5.
We may speculate that amide groups are stabilising the carboxylate groups resulting in lower
pKa values for amidated pectins (McCormick & Elliot, 1986). This would explain stronger
interaction of amidated pectins with the anion exchanger compared to methyl-esterified
pectins.
A summary of our observations concerning the different parameters (DS, DM, DAm and ratio
amide groups versus methyl-esters) of the pectic populations from pectins D and G was given
in figure 3. The DS of the populations 3 to 6 was found to be similar to finally decrease for the
populations 7 and 8. The DM was decreasing for pectin D while the DAm and the ratio
Am/Me was increasing. The same phenomenon was observed for pectin G except for the DM
which increased for populations 2 to 4 and then decreased. The DS of populations eluting in
the same range of strength were found to be similar. The more calcium sensitivity of pectin D
108
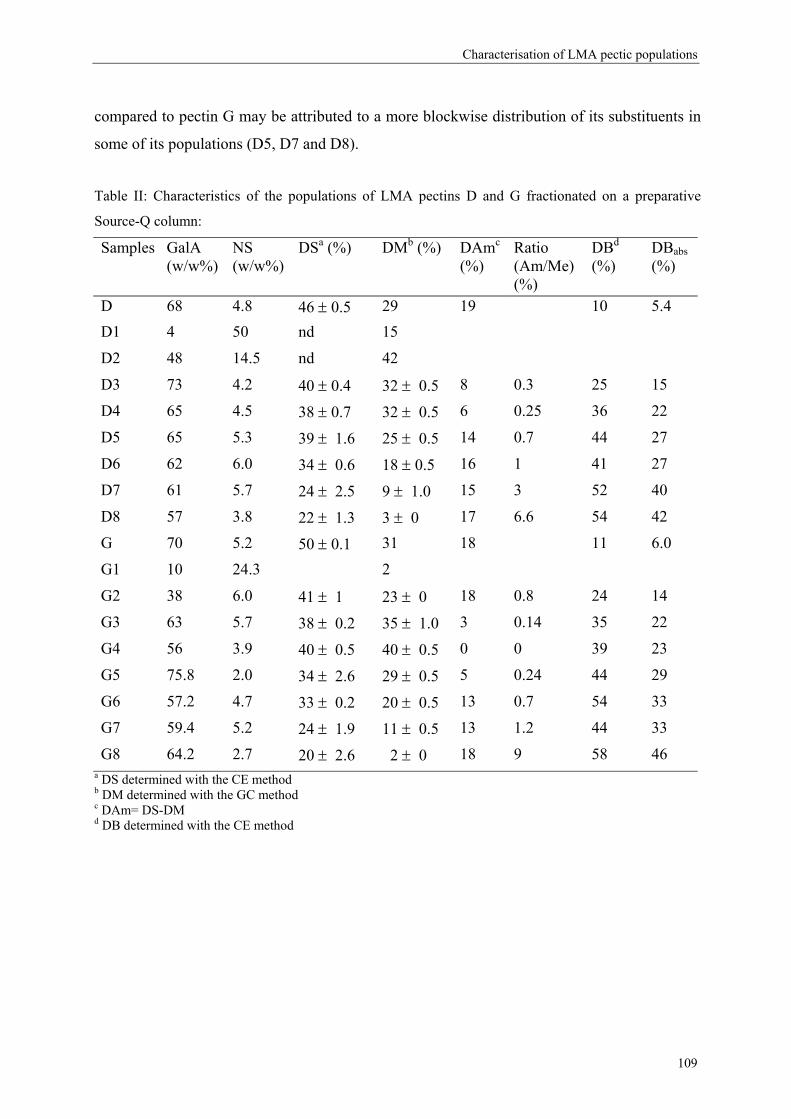
Characterisation of LMA pectic populations
compared to pectin G may be attributed to a more blockwise distribution of its substituents in
some of its populations (D5, D7 and D8).
Table II: Characteristics of the populations of LMA pectins D and G fractionated on a preparative
Source-Q column:
Samples GalA (w/w%)
NS (w/w%)
DSa (%) DMb (%) DAmc (%)
Ratio (Am/Me) (%)
DBd (%)
DBabs (%)
D 68 4.8 46 ± 0.5 29 19 10 5.4 D1 4 50 nd 15
D2 48 14.5 nd 42
D3 73 4.2 40 ± 0.4 32 ± 0.5 8 0.3 25 15
D4 65 4.5 38 ± 0.7 32 ± 0.5 6 0.25 36 22
D5 65 5.3 39 ± 1.6 25 ± 0.5 14 0.7 44 27
D6 62 6.0 34 ± 0.6 18 ± 0.5 16 1 41 27
D7 61 5.7 24 ± 2.5 9 ± 1.0 15 3 52 40
D8 57 3.8 22 ± 1.3 3 ± 0 17 6.6 54 42
G 70 5.2 50 ± 0.1 31 18 11 6.0
G1 10 24.3 2
G2 38 6.0 41 ± 1 23 ± 0 18 0.8 24 14
G3 63 5.7 38 ± 0.2 35 ± 1.0 3 0.14 35 22
G4 56 3.9 40 ± 0.5 40 ± 0.5 0 0 39 23
G5 75.8 2.0 34 ± 2.6 29 ± 0.5 5 0.24 44 29
G6 57.2 4.7 33 ± 0.2 20 ± 0.5 13 0.7 54 33
G7 59.4 5.2 24 ± 1.9 11 ± 0.5 13 1.2 44 33
G8 64.2 2.7 20 ± 2.6 2 ± 0 18 9 58 46 a DS determined with the CE method b DM determined with the GC method c DAm= DS-DM d DB determined with the CE method
109
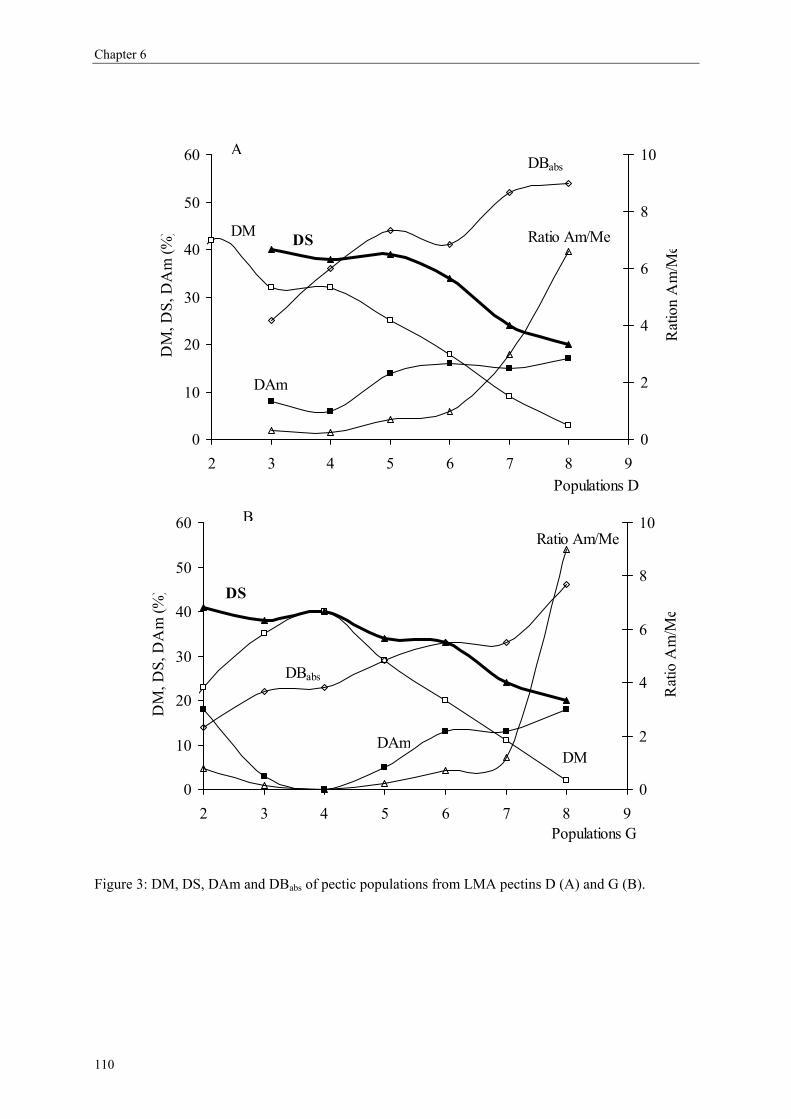
Chapter 6
0
10
20
30
40
50
60
2 3 4 5 6 7 8 9Populations G
DM
, DS,
DA
m (%
)
0
2
4
6
8
10
Rat
io A
m/M
e
DAm
DS
DM
DBabs
Ratio Am/Me
0
10
20
30
40
50
60
2 3 4 5 6 7 8 9Populations D
DM
, DS,
DA
m (%
)
0
2
4
6
8
10
Rat
ion
Am
/Me
DM
DAm
DS
DBabs
Ratio Am/Me
B
A
Figure 3: DM, DS, DAm and DBabs of pectic populations from LMA pectins D (A) and G (B).
110
Characterisation of LMA pectic populations
4. Conclusions
Our study revealed important variations in the features of the pectic populations present in
commercial amidated pectins. The results showed differences in the degree of substitution (DS
from 20 till 41%), although the populations making up the largest part of the commercial
pectin did have rather similar levels of substitution (ca 40). However, the ratio between methyl
esters and amide groups changed significantly (0.1 – 9) indicating the presence of pectins
almost without methyl esters being present next to molecules rather poor in amide groups.
This observation proved the frequently stated suggestion that the amidation process by using a
heterogeneous system (insoluble pectins suspended in ethanol) leads to a heterogeneous
distribution. However, starting from a HM pectin (DM 70-50) it was surprising that the DS
was lowered to the same level (ca 40), despite a different type of substitution. Furthermore, it
is striking that the degradability by endo-PG of the different populations of both LMA pectins
were rather similar to the degradability of the pectic fractions without methyl esterification,
where the amide groups were shown to be distributed not completely random. This would
indicate that the methyl esters were rather regularly distributed along the molecule mixed with
the amide group distribution in such a way that removal of the methyl esters did not create
additional sites for endo-PG.
References
Ahmed A. E. R., Labavitch J. M. (1977). Journal of Food Biochemistry, 1, 361-365.
Alonso-Mougan M., Meijide F., Jover A., Rodriguez-Nunez E., Vazquez-Tato J. (2002). Rheological behaviour
of an amide pectin. Journal of Food Engineering, 55, 123-129.
Anger H., Dongowski G. (1988). Amidated pectins - characterization and enzymatic degradation. Food
Hydrocolloids, 2, (5), 371-379.
Barrett A. J. B., Northcote D. H. (1965). Apple fruit pectic substances. Biochemical Journal, (94), 617-627.
Black S. A., Smit C. J. B. (1972). The effect of demethylation procedures on the quality of low-ester pectins
used in dessert gels. Journal of Food Science, 37, (II), 730-732.
Blumenkrantz N., Asboe-Hansen G. (1973). New method for quantitative determination of uronic acids.
Analytical Biochemistry, 54, 484-489.
Christensen P. E. (1954). Methods of grading pectin in relation to the molecular weight (intrinsec viscosity) of
pectin. Food Research, 19, 163.
Daas P. J. H., Boxma B., Hopman A. M. C. P., Voragen A. G. J., Schols H. A. (2001). Nonesterified
galacturonic acid sequence homology of pectins. Biopolymers, 58, 1-8.
111

Chapter 6
Daas P. J. H., Meyer-Hansen K., Schols H. A., De Ruiter G. A., Voragen A. G. J. (1999). Investigation of the
non-esterified galacturonic acid distribution in pectin with endopolygalacturonase. Carbohydrate
Research, 318, 135-145.
Daas P. J. H., Voragen A. G. J., Schols H. A. (2000). Characterisation of non-esterified galacturonic acid
sequences in pectin with endopolygalacturonase. Carbohydrate Research, 326, 120-129.
Darvill A. G., McNeill M., Albersheim P. (1978). Structure of plant cell walls: VIII. A new pectic
polysaccharide. Plant Physiology, 62, 418-422.
De Vries J. A., den Uyl C. H., Voragen A. G. J., Rombouts F. M., Pilnik W. (1983). Structural features in the
neutral sugar side chains of apple pectic substances. Carbohydrate Polymers, 6, 193-205.
De Vries J. A., Rombouts F. M., Voragen A. G. J., Pilnik W. (1982). Enzymatic degradation of apple pectins.
Carbohydrate Polymers, 2, 25-33.
De Vries J. A., Rombouts F. M., Voragen A. G. J., Pilnik W. (1983). Distribution of methoxyl groups in apple
pectic substances. Carbohydrate Polymers, 3, 245-258.
De Vries J. A., Voragen A. G. J., Rombouts F. M., Pilnik W. (1981). Extraction and purification of pectins from
alcohol insoluble solids from ripe and unripe apples. Carbohydrate Polymers, 1, 117-127.
Gilsenan P. M., Richardson R. K., Morris E. R. (2000). Thermally reversible acid-induced gelation of low-
methoxy pectin. Carbohydrate Polymers, 41, 339-349.
Guillotin S. E., Ananta E., Bakx E. J., Boulenguer P., Schols H. A., Voragen A. G. J. (to be submitted).
Determination of the degree of substitution and degree of amidation of commercial pectins with
capillary electrophoresis.
Guillotin S. E., Bakx E. J., Boulenguer P., Mazoyer J., Schols H. A., Voragen A. G. J. (2005). Populations
having different GalA blocks characteristics are present in commercial pectins which are chemically
similar but have different functionalities. Carbohydrate Polymers, 60, 391-398.
Guillotin S. E., Schols H. A., van Kampen J., Boulenguer P., Voragen A. G. J. (to be submitted). Degree of
blockiness of amide groups as indicator for differences between amidated pectins.
Huisman M. M. H., Oosterveld A., Schols H. A. (2004). New method for fast determination of the degree of
methylation of pectins by headspace GC. Food Hydrocolloids, 18, (4), 665-668.
Kravtchenko T. P., Voragen A. G. J., Pilnik W. (1992a). Analytical comparison of three industrial pectin
preparations. Carbohydrate Polymers, 18, 17-25.
Kravtchenko T. P., Voragen A. G. J., Pilnik W. (1992b). Studies on the intermolecular distribution of industrial
pectins by means of preparative ion-exchange chromatography. Carbohydrate Polymers, 19, 115-124.
Lofgren C., Guillotin S., Evenbratt H., Schols H., Hermansson A.-M. (2005). Effects of calcium, pH and
blockiness on kinetic rheological behavior and microstructure. Biomacromolecules, 6, 646-652.
McCormick C. L., Elliot D. L. (1986). Water-soluble copolymers. 14. Potentiometric and turbidimetric studies of
water-soluble copolymers of acrylamide: comparison of carboxylated and sulfonated copolymers.
Macromolecules, 19, 542-547.
McNeil M., Darvill A. G., Albersheim P. (1980). Structure of plant cell walls. X. Rhamnogalacturonan I, a
structurally complex pectic polysaccharide in the walls of suspension-cultured sycamore cells. Plant
Physiology, 66, 1128-1134.
112
Characterisation of LMA pectic populations
Neukom H., Amado R., Pfister M. (1980). Neuere erkenntnisse auf dem gebiete der pektinstoffe. Lebensm.wiss.u
technology, 13, 1-6.
Owens H. S., Svenson H. A., Schultz T. H., (1933). In: Natural Plant Hydrocolloids, Advances in Chemistry;
Washington DC, American Chemical Society, 10.
Racape E., Thibault J. F., Reitsma J. C. E., Pilnik W. (1989). Properties of amidated pectins II. Polyelectrolyte
behavior and calcium binding of amidate pectins and amidated pectic acids. Biopolymers, 28, 1435-
1448.
Rolin C., De Vries J. A., (1990). Pectin. In: Food gels; Harris, P.J, 401-434.
Thibault J.-F. (1979). Automatisation du dosage des substances pectiques par la méthode au méta-
hydroxydiphenyl. Lebensmittel Wissenschaft und Technologie, 12, 247-251.
Thibault J.-F., Rinaudo M. (1986). Chain association of pectic molecules during calcium-induced gelation.
Biopolymers, 25, 456-468.
Van Deventer-Schriemer W. H., Pilnik W. (1987). Studies on pectin degradation. Acta Alimentaria, 16, 143.
Voragen A. G. J., Pilnik W., Thibault J.-F., Axelos M. A. V., Renard C. M. G. C., (1995). Pectins. In: Food
polysaccharides and their applications; Stephen A. M., New York, Marcel Dekker Inc., 287-339.
Waldron K. W., Selvendran R. R., (1993). In Waldron K. W., Johnson I. T., Fenwick G. R. Food and cancer
prevention, chemical and biological aspects (307-326).: Royal Soc. Chem.
Zhong H. J., Williams M. A. K., Goodall D. M., Hansen M. E. (1998). Capillary electrophoresis studies of
pectins. Carbohydrate Research, 308, 1-8.
113

Chapter 6 Chapter 6
114 114

Chapter 7
Concluding remarks
115
Chapter 7
1. Research motives
Pectins are widely used in the food industry as ingredients for their thickening, gelling and
stabilizing properties. Pectin manufacturers are not always able to control the performance of
the pectins extracted. One of the reasons is that they do not always have access to the same
raw material since the amount and nature of raw material is fluctuating on the world market.
As a consequence, pectin industries can not always obtain the best raw material to extract the
pectins (e.g. lime or lemon) and they may have to use a different raw material (e.g. orange)
which leads to other chemical and physical characteristics of the pectin extracted. Industries
can also not control the growing conditions and the harvesting time of the fruits from which
their starting material is obtained whereas different maturation stages are known to influence
pectin characteristics (De Figueiredo, Lajolo, Alves & Filgueiras, 2002; Fischer, 1993;
Redgwell et al., 1997). The same lack in control may take place during the juice extraction
process from the fruits and the storage of the peels before the extraction of pectins. All these
variations may result in pectins having different molecular weights, different amounts of
methyl-esters and different distributions of these constituents over the pectic backbones. A
rapid screening of the pectin characteristics allowing a fast prediction of their performance in
a specific application (e.g. as a gelling, thickening or emulsifying agent) would be highly
beneficial for the pectin producers as well as for the pectin users.
In this study, we therefore focussed on the analysis of the chemical fine structure of
commercial pectins. Our goal was to extend our analytical toolbox to analyse the chemical
structure in more detail to be able to better understand the different gelling behaviour of
pectins with similar chemical features.
A simple and rapid HPLC method was developed to visualise the presence of different pectin
populations in commercial pectins, known to have very similar chemical characteristics with
“routine” analysis but exhibiting a different gelling behavior. In addition, a preparative
chromatography system enabling large-scale fractionation of pectin samples was developed.
This allowed us to study pectins in more detail with special emphasis on the distribution of
methyl esters over the backbone.
The second part of our research focussed on low methyl esterified amidated (LMA) pectins
obtained by chemical amidation of the high methyl-esterified (HM) pectins. Methods were
adapted to determine the overall methyl-esterification and amidation in crude pectins as well
116
Concluding remarks
as the distribution of both substituents in the pectic populations present in the original pectin
mixture.
In this chapter, the chemical characteristics of the different HM and LMA pectic populations
will be summarized and possible reasons for these variations such as enzymatic modification
in the plant material before extraction of the pectins and/or chemical and enzymatic changes
during the process will be discussed. Finally, the relation between the structure of pectins and
rheological behaviour will be described.
2. HM pectins
Two HM pectins having similar chemical characteristics (molecular weight, galacturonic acid
and neutral sugar content, degree of methyl-esterification) but with different reactivity
towards calium ions were analysed. Pectin A was observed to be more calcium sensitive
compared to pectin B when they were used as stabilizers in acid dairy drinks (Laurent &
Boulenguer, 2003). In our studies (Guillotin et al., 2005), endo-polygalacturonase (endo-PG)
from Kluyveromyces fragiles was used to analyse the distribution of the non-methyl esterified
GalA residues over the pectic backbone. This endo-PG splits within the galacturonan
backbone when at least 4 adjacent free GalA are present (Chen & Mort, 1996; Zhan, Jansson
& Mort, 1998) releasing mono-, di- and trigalacturonic acids and higher methyl-esterified
oligomers which allow us to discriminate between a randomly esterified pectin and a
blockwise esterified pectin. The degree of blockiness (DB) corresponds to the number of non-
methylesterified residues liberated by endo-PG expressed as the percentage of the total
number of non-methylesterified GalA residues in the undigested polymer: the higher the DB,
the more blockwise are the free GalA residues distributed over the pectin molecule (Daas,
Alebeek, Voragen & Schols, 1999).
The more calcium sensitive pectin A had a blockwise distribution of the free GalA and it is
known from literature, that a sequence of 7-20 free GalA residues is required for association
with calcium (Braccini, Grasso & Perez, 1999; Kohn, 1975; Powell, Morris, Gidley & Rees,
1982). The higher calcium sensitivity of the pectin A is probably caused by the presence of
the non-methyl esterified GalA blocks.
The commercial pectins were fractionated on a Source-Q anion exchanger in order to obtain
homogeneous populations and in sufficient amounts for further characterisation. The
molecular weight of these pectic populations was found to be rather similar and in general
117
Chapter 7
slightly higher for the pectic populations of pectin A compared to the populations of pectin B.
The pectic populations from both pectins A and B showed differences in their degree of
methyl-esterification as expected but also differences in the distribution of their substituents.
For example, the crude pectin A contained three pectic populations having the same DM but
one of these populations has a random distribution of the free GalA blocks (pectin A1) and
the two others (pectins A2 and A3) have a more blockwise distribution of the charges
(Guillotin et al., 2005).
Taking into account the molecular weight (Mw) of the pectins as shown in Table I and as
determined by using HPSEC, the amount of GalA units present in the pectins was calculated
(Table I). From these GalA units and the DBabs determined (Guillotin et al., 2005), the amount
of free GalA units in PG degradable blocks in the pectin populations per molecule was
calculated (GalA-b). Compared to the amount of free GalA present in the pectins A and B, the
amount of non-methyl esterified oligomers released by the endo-PG was low in populations
A1 and B1 - B3 (3, 2, 6 and 6 free GalA residues, respectively) indicating the presence of
short blocks in these populations. Populations A2 - A5 and B4 – B5 had a higher amount of
free GalA residues in blocks (12, 13, 26, 117, 69, 88 GalA residues, respectively) and are
expected to be more calcium sensitive. These populations with a blockwise distribution of the
non-methyl-esterified GalA residues may strongly determined the physical properties of the
crude pectins A and B especially for pectin A since these specific pectins are present in higher
levels in pectin A. An important conclusion of our research is that only part of the molecules
present in a commercial pectin preparation might be responsible for the physical behavior of
commercial pectins.
In addition to the digestion of the pectins by an endo-PG to quantify the total amount of free
GalA residues in blocks, an exo-polygalacturonase was used to screen for non-methyl-
esterified GalA blocks specifically present at the non-reducing end of the pectic polymers
(Benen, Vincken & Alebeek, 2002; Korner, Limberg, Christensen, Mikkelsen & Roepstorff,
1999; Limberg et al., 2000). When crude pectins were analysed, the non calcium sensitive
HM pectin B had a lower amount of free GalA blocks at the non-reducing end compared to
the calcium sensitive pectin A (GalA-nr; Table I) although these “blocks” still were rather
short: two GalA residues at the non-reducing end for pectin B compared to five GalA residues
for the pectin A. However, the exo-PG digestion was performed on the crude commercial
samples resulting in an average value for the number of the free GalA blocks at the non-
reducing end for the molecules constituting the pectins. The size of the free GalA blocks at
118
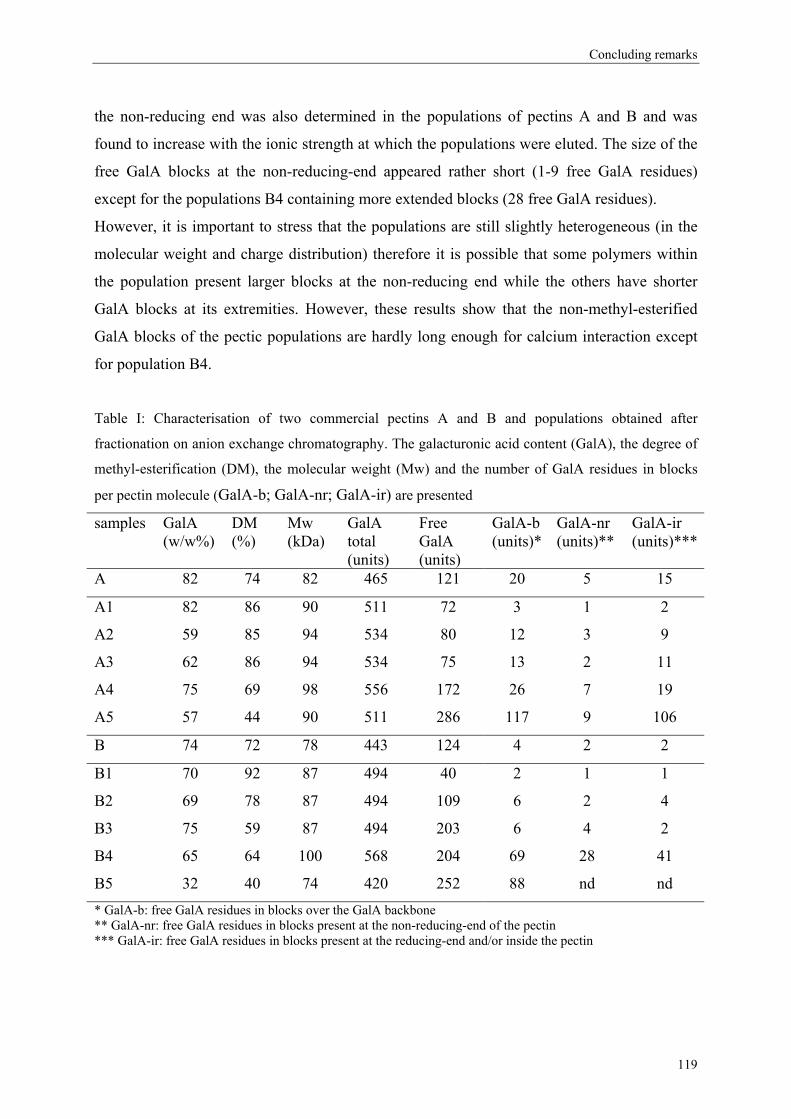
Concluding remarks
the non-reducing end was also determined in the populations of pectins A and B and was
found to increase with the ionic strength at which the populations were eluted. The size of the
free GalA blocks at the non-reducing-end appeared rather short (1-9 free GalA residues)
except for the populations B4 containing more extended blocks (28 free GalA residues).
However, it is important to stress that the populations are still slightly heterogeneous (in the
molecular weight and charge distribution) therefore it is possible that some polymers within
the population present larger blocks at the non-reducing end while the others have shorter
GalA blocks at its extremities. However, these results show that the non-methyl-esterified
GalA blocks of the pectic populations are hardly long enough for calcium interaction except
for population B4.
Table I: Characterisation of two commercial pectins A and B and populations obtained after
fractionation on anion exchange chromatography. The galacturonic acid content (GalA), the degree of
methyl-esterification (DM), the molecular weight (Mw) and the number of GalA residues in blocks
per pectin molecule (GalA-b; GalA-nr; GalA-ir) are presented
samples GalA (w/w%)
DM (%)
Mw (kDa)
GalA total (units)
Free GalA (units)
GalA-b (units)*
GalA-nr (units)**
GalA-ir (units)***
A 82 74 82 465 121 20 5 15
A1 82 86 90 511 72 3 1 2
A2 59 85 94 534 80 12 3 9
A3 62 86 94 534 75 13 2 11
A4 75 69 98 556 172 26 7 19
A5 57 44 90 511 286 117 9 106
B 74 72 78 443 124 4 2 2
B1 70 92 87 494 40 2 1 1
B2 69 78 87 494 109 6 2 4
B3 75 59 87 494 203 6 4 2
B4 65 64 100 568 204 69 28 41
B5 32 40 74 420 252 88 nd nd * GalA-b: free GalA residues in blocks over the GalA backbone ** GalA-nr: free GalA residues in blocks present at the non-reducing-end of the pectin *** GalA-ir: free GalA residues in blocks present at the reducing-end and/or inside the pectin
119
Chapter 7
The origin of these non-methyl-esterified blocks and the reason for such heterogeneous pectic
populations are still unclear and will be discussed later.
2.1. Pectins and pectinases in plant
It is stated in literature that non-methyl-esterified GalA blocks are obtained after degradation
of the pectins with plant PME generally assumed to de-esterify pectins in a blockwise way
rather than the fungal PME which removes methyl-esters randomly (Ishii, Kiho, Sugiyama &
Sugimoto, 1979; Kohn, Furda & Kopec, 1968). The cause of the presence of the wide
variation in pectic molecules differing in the level and distribution of the substituents is not
known. It is frequently suggested that citrus endogeneous PME may be initiated during the
storage of the peel although it is also possible that different molecules are already present in
the tissues of the fruits even before juice extraction.
Firstly, a short inventory of the presence of different PME in plants will be shown to discuss
the putative modifications of pectins in situ. The genome of members of the citrus plant
variety has not been revealed completely yet whereas the entire genome of a well-known
plant (Arabidopsis thaliana) has been fully characterised. We therefore looked for the
Arabidopsis thaliana genome to make an inventory of the putative pectinases present in this
plant. The characteristics of the pectin methyl-esterases (PME) present in situ may be an
indication for the formation of blockwise esterified pectins in situ. However, a gene sequence
is not a proof for the expression of the corresponding enzyme neither for the presence of its
substrate in the plant tissue.
So far, it is reported in literature that 5 genes coding for PME are present in Arabidopsis
thaliana and around 60 other putative PME genes are present (Table II). It may be speculated
that the PME’s genes may be expressed during the growth and the development of the plant
tissues. These enzymes can present different mechanism of digestion resulting in pectins with
different levels and distribution of the methyl-esters over the pectic backbone. In Citrus
sinensis (sweet orange), two PME enzymes were expressed (Nairn, Lewandowski & Burns,
1998) and two putative PME enzymes were found so far.
Pectin molecules modified by PME in the cell wall may either change the architecture of the
cell walls by making it stronger (formation of calcium gels) or weaker since the free GalA
blocks are substrate for the endo-PG and can be degraded.
120
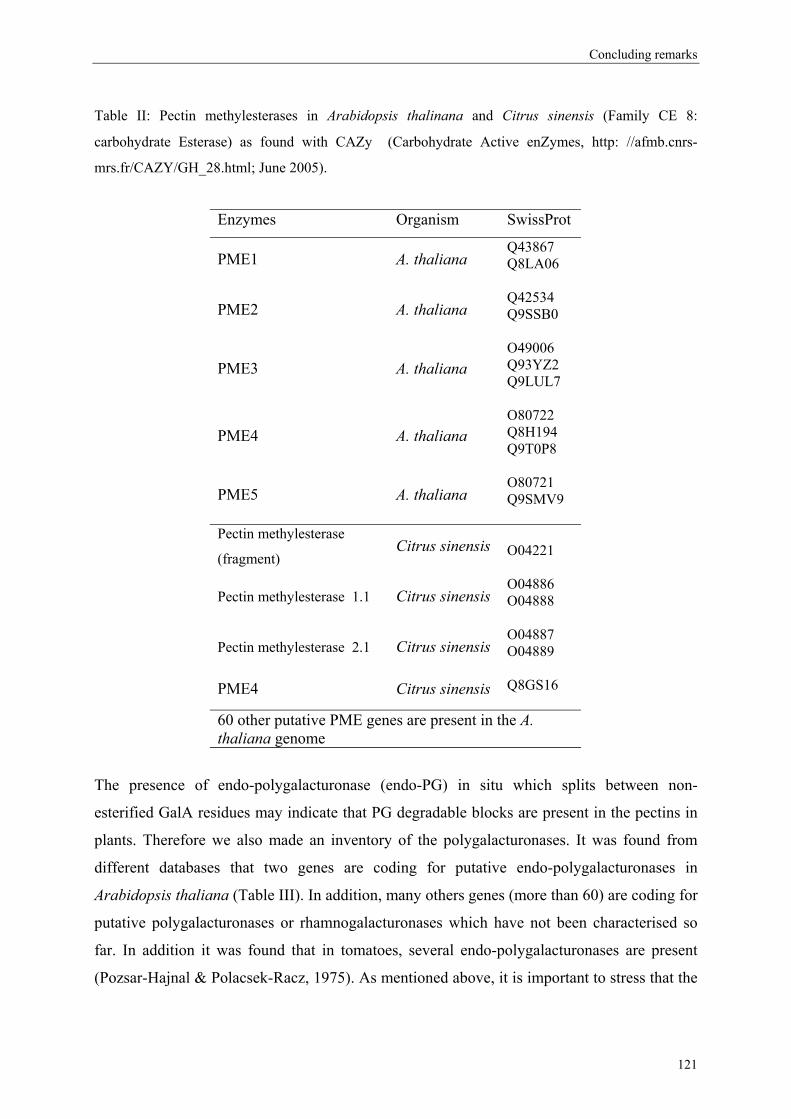
Concluding remarks
Table II: Pectin methylesterases in Arabidopsis thalinana and Citrus sinensis (Family CE 8:
carbohydrate Esterase) as found with CAZy (Carbohydrate Active enZymes, http: //afmb.cnrs-
mrs.fr/CAZY/GH_28.html; June 2005).
Enzymes Organism SwissProt
PME1 A. thaliana Q43867 Q8LA06
PME2 A. thaliana Q42534 Q9SSB0
PME3 A. thaliana O49006 Q93YZ2 Q9LUL7
PME4 A. thaliana O80722 Q8H194 Q9T0P8
PME5 A. thaliana O80721 Q9SMV9
Pectin methylesterase
(fragment) Citrus sinensis O04221
Pectin methylesterase 1.1 Citrus sinensis O04886 O04888
Pectin methylesterase 2.1 Citrus sinensis O04887 O04889
PME4 Citrus sinensis Q8GS16
60 other putative PME genes are present in the A. thaliana genome
The presence of endo-polygalacturonase (endo-PG) in situ which splits between non-
esterified GalA residues may indicate that PG degradable blocks are present in the pectins in
plants. Therefore we also made an inventory of the polygalacturonases. It was found from
different databases that two genes are coding for putative endo-polygalacturonases in
Arabidopsis thaliana (Table III). In addition, many others genes (more than 60) are coding for
putative polygalacturonases or rhamnogalacturonases which have not been characterised so
far. In addition it was found that in tomatoes, several endo-polygalacturonases are present
(Pozsar-Hajnal & Polacsek-Racz, 1975). As mentioned above, it is important to stress that the
121
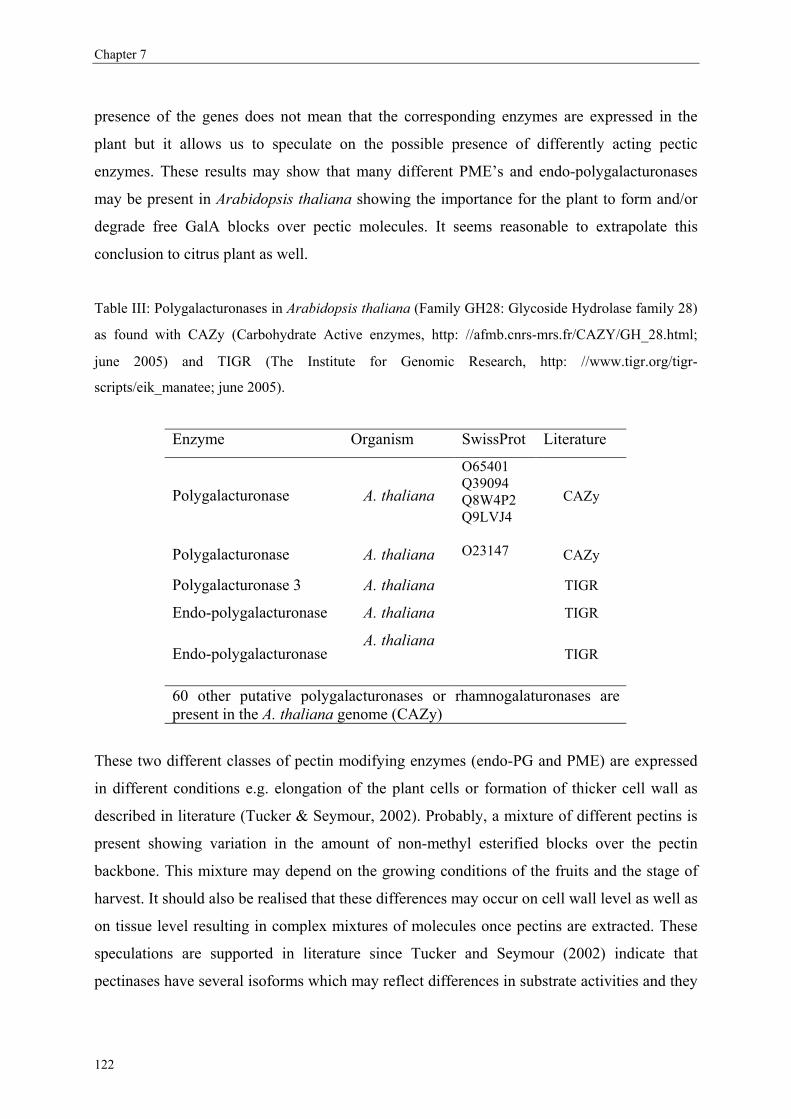
Chapter 7
presence of the genes does not mean that the corresponding enzymes are expressed in the
plant but it allows us to speculate on the possible presence of differently acting pectic
enzymes. These results may show that many different PME’s and endo-polygalacturonases
may be present in Arabidopsis thaliana showing the importance for the plant to form and/or
degrade free GalA blocks over pectic molecules. It seems reasonable to extrapolate this
conclusion to citrus plant as well.
Table III: Polygalacturonases in Arabidopsis thaliana (Family GH28: Glycoside Hydrolase family 28)
as found with CAZy (Carbohydrate Active enzymes, http: //afmb.cnrs-mrs.fr/CAZY/GH_28.html;
june 2005) and TIGR (The Institute for Genomic Research, http: //www.tigr.org/tigr-
scripts/eik_manatee; june 2005).
Enzyme Organism SwissProt Literature
Polygalacturonase A. thaliana
O65401 Q39094 Q8W4P2 Q9LVJ4
CAZy
Polygalacturonase A. thaliana O23147
CAZy
Polygalacturonase 3 A. thaliana TIGR
Endo-polygalacturonase A. thaliana TIGR
Endo-polygalacturonase A. thaliana
TIGR
60 other putative polygalacturonases or rhamnogalaturonases are present in the A. thaliana genome (CAZy)
These two different classes of pectin modifying enzymes (endo-PG and PME) are expressed
in different conditions e.g. elongation of the plant cells or formation of thicker cell wall as
described in literature (Tucker & Seymour, 2002). Probably, a mixture of different pectins is
present showing variation in the amount of non-methyl esterified blocks over the pectin
backbone. This mixture may depend on the growing conditions of the fruits and the stage of
harvest. It should also be realised that these differences may occur on cell wall level as well as
on tissue level resulting in complex mixtures of molecules once pectins are extracted. These
speculations are supported in literature since Tucker and Seymour (2002) indicate that
pectinases have several isoforms which may reflect differences in substrate activities and they
122
Concluding remarks
also indicate that the distribution of specific pectinases such as PG and PME varies both
between species and within plant tissues (Tucker & Seymour, 2002).
Another way to verify the presence of free GalA blocks in pectins in plants is to use
antibodies specific for pectins. Several antibodies have been recently developed. JIM 5 and
JIM 7 are thought to bind to low methyl esterified pectins and high methylesterified pectins
respectively (Knox, Linstead, King, Cooper & Roberts, 1990; Willats et al., 2000) but they
were shown to have quite some cross-reactivity. The antibody 2F4 recognises dimers of
calcium-homogalacturonan complexes (Liners, Letesson, Didembourg & van Cutsem, 1989;
Liners, Thibault & van Cutsem, 1992). Two antibodies are specific indicators for the presence
of non-methyl-esterified GalA blocks: the PAM 1 antibody recognises sequences of
approximately 30 de-esterified GalA residues (Willats, Gilmartin, Mikkelsen & Knox, 1999;
Willats et al., 2000), while the antibody LM 7 is claimed to be specific for a random pattern of
free GalA (Willats, Orfila et al., 2001). The precise epitopes to be recognised by these
antibodies and the localisation of these structures in plant cells has been reviewed recently
(Tucker & Seymour, 2002). With this immuno-labelling technique, homogalacturonans are
generally found to be distributed throughout the primary cell walls and in the middle lamella
but the extend and distribution of methyl-esters was found to vary as reviewed by Tucker &
Seymour (2002). Willats et al. showed for sections of pea stem (Willats, Orfila et al., 2001) as
well as for Arabidopsis thaliana roots and seeds (Willats, MacCartney & Knox, 2001) that
pectins present in different cell types show different pectin structures with respect to methyl-
ester level and distribution.
The presence of several PME and endo-PG genes in the genome of Arabidopsis thalina and
the presence of pectins with a different level and distribution of methyl-esters as indicated by
immuno-labeling at different positions in the cell wall emphasises the importance of pectin
structure for the plants. This also indicates the possibility for the plant to express these
different enzymes to modify pectins with respect to their molecular weight, charge, gelling
ability with calcium and enzymatic degradability.
2.2. Pectins and their chemical extraction
In our study, commercial pectins are extracted from lemon peel in acid conditions which also
affect the distribution of the methyl-esters. Acid and alkaline extraction of pectins are indeed
known to de-esterify pectins in a random way (Daas, Meyer-Hansen, Schols, De Ruiter &
123

Chapter 7
Voragen, 1999). It is demonstrated in literature that the nature of acid, the pH, the temperature
and the time of extraction of sugar beet pectins modify the degree of methyl-esterification,
degree of actelylation and molecular weight of the extracted pectins (Levigne, Ralet &
Thibault, 2002). Both enzymatic modifications occurring before the extraction of pectins (in
situ) and chemical modifications during the extraction and down stream processing of the
pectin can influence the presence and the distribution of the free GalA. Therefore, the origin
of the different distribution of the substituents over the pectin is still complex to understand.
2.3. Pectins in acid dairy drinks
The differences between the calcium sensitive pectin A and the non calcium sensitive pectin
B were very pronounced in their stabilisation properties of Acid Dairy Drinks (ADD)
products. ADD usually consists of a neutral base (milk) with an acidic medium (e.g. fruits).
ADD products are stabilised by the addition of sugar and HM pectins to prevent
sedimentation of the casein micelles. Laurent et al (Laurent & Boulenguer, 2003) analyzed the
sediment formation of the products stabilized with pectins A and B (also used in our study) to
determine the effect of the distribution of methyl-esters on the mechanism of stabilization. An
important finding was the fact that only the calcium sensitive fraction present in the crude
pectin was involved in the stabilization of ADD (Glahn & Rolin, 1996). This emphasises the
importance of the characterisation of individual pectic populations present in commercial
pectin preparations since some of these populations were found to be more important for the
desired physical property in the given application. It was suggested that the higher
stabilization properties of the calcium sensitive pectin (especially at low milk concentrations)
was due to the larger GalA blocks present at the non-reducing end of the calcium sensitive
pectin which bound to the protein (in acid dairy drinks) by a single point attach mechanism. A
relatively thick layer of the pectins around the proteins would favour a better stabilisation of
the drink compared to multiple attaches of the non calcium sensitive pectin to the protein
(Laurent & Boulenguer, 2003). However, from our results, it was found that the binding to the
proteins is probably due to the blocks present inside the molecule or at the reducing end but
not from the free Gala blocks at the non-reducing end. Furthermore, as shown in chapter 3,
the digestion of individual populations with endo-PG results in a rather distinct shift in the
Mw as measured by HPSEC which would not have been the case when PG degradable blocks
were only located at the non-reducing end.
124
Concluding remarks
2.4. HM pectins in gel formation
The gel formation of pectins A and B (0.75%) has been evaluated by the group of
Hermansson at pH 3 and 3,5 in presence of sucrose (60%) (Lofgren, Guillotin, Evenbratt,
Schols & Hermansson, 2005). It has been noticed that the gelling time at pH 3 is dependent
on the distribution of the methyl-esters over the molecule: the more free GalA blocks (and
thus methyl-esterified GalA blocks), the faster the gelation time. The non-calcium sensitive
pectin B gave a weaker gel compared to the calcium sensitive pectin A. It is suggested that the
methyl-ester blocks in commercial pectins may interact stronger through hydrophobic
interactions when compared to methyl-esterified residues are distributed at random. This
mechanism of blockwise HM pectins would form faster and stronger gels. When the gels
formed were examined by microscopy, no differences in the gel structure were observed. Both
pectins A and B had a coarse network structure as described previously (Lofgren et al., 2005).
Calcium was added for gel formation at pH 3 and the gels of both pectins A and B were
different from the ones formed at pH 3 without calcium. The difference in gel strength
between the two pectins A and B, as observed for the gels without calcium at pH 3 is less
pronounced in the presence of calcium. However, in the presence of calcium, pectin A is
forming a gel within few minutes whereas pectin B needs few hours to form a gel. The gel is
slightly stronger after 10 hours for pectin B. The structure of the gel as observed by
microscopy is more heterogeneous in pectin A and may be a result of the faster gel formation
of pectin A whereas the molecules of pectin B have more time to arrange themselves in a
more homogeneous way due to the longer gelling time. It is suggested that the addition of
calcium to pectins having more blocks of free GalA residues leads to a too fast gel formation
since both hydrogen binding and calcium interaction may occur. In the case of the randomly
methyl-esterified pectin B, the calcium can bind only weakly since only a few free GalA
blocks are present but this small interaction may bring the pectin molecules together enabling
interaction through hydrogen binding of the random methyl-esters. At a pH of 3.5 and in the
presence of calcium, a completely different physical behaviour for both pectins was observed.
Pectin A had a very slow gel formation while almost no gel formation was observed for pectin
B. At this pH, more free GalA groups are present in the ionised form creating more
electrostatic repulsion between the polymers. The pectin A was able to form a gel very slowly
as a result of the calcium interaction with the free GalA blocks while these blocks were
present at too low levels in pectin B for such interaction. The mechanism of gelling behavior
125
Chapter 7
through hydrogen bonding is overruled. The use of purified and characterised populations for
rheology experiments may result in a better understanding of the gelling mechanisms since
the pectic populations present in the crude pectins might interact differently in the gelling
mechanism.
3. Amidated pectins
The distribution of amide groups and methyl-esters in amidated pectins remains unclear. The
method used to fractionate and characterise HM pectins was used to analyse amidated pectins
as well. Amidated pectins from our study were found to be rather heterogeneous. The
populations of pectins D and G were found to be heterogeneous and three parameters were
found to vary significantly depending on the individual population present in the two
commercial LMA pectins: the degree of substitution, the distribution of the substituents (DB)
and the ratio of amide groups versus methyl-esters. However no straight correlation was
found with the physical properties of the commercial pectins.
Until now the rheological experiments using amidated pectins were performed with crude
pectins, not using purified samples. The gelation mechanism remains unclear. The different
ratio of amide groups versus methyl-esters may be important for the gelling properties of the
amidated pectins since it has been suggested that amide groups play an important role in
gelation by promoting hydrogen bonding (Alonso-Mougan, Meijide, Jover, Rodriguez-Nunez
& Vazquez-Tato, 2002; Gross, 1979). The gellation of amidated pectins in the presence of
calcium and at different temperature has been compared to LM pectins (Lootens et al., 2003).
Amidated pectins were found to have stronger gels at pH below 3 compared to the LM
pectins. However, the degree of substitution of the LMA pectins and LM pectins used were
different, which makes it difficult to interpret the different gelling properties since the pectins
present differences in their total charges as well as differences in the nature of the
substituents. Our findings and strategies to evaluate pectin structures present in LMA
preparations may be used to control the amidation process in a better way and even to come to
better functional properties of the end product.
126
Concluding remarks
4. Are pectins linked with proteins and polyphenols?
Commercial pectins contain around 1.5 to 3% of proteins (Kravtchenko, Voragen & Pilnik,
1992). The amino acid composition of the proteins in the lemon pectins studied was found to
be similar (Kravtchenko et al., 1992) but the proteins were not studied in detail so far. When
pectins A and B were fractionated in our study on an anion exchanger into their composite
populations, the UV absorbance at 280 nm was recorded. Molecules with aromatic rings e.g.
aromatic amino acids in proteins (tyrosine and tryptophane) and polyphenols absorb at this
wavelength. Some pectic fractions were found to absorb at 280 nm and this may indicate the
presence of proteins in these samples (results not shown). The covalent binding of small
amounts of protein to pectin has been suggested earlier by Akhtar et al (Akhtar, Dickinson,
Mazoyer & Langendorff, 2002) as a result of their observation that only part of the pectin
molecules could stabilise emulsions although no structural information on the protein was
presented. Recently, it was suggested that small amounts of arabinogalactan proteins may be
covalently attached to pectins isolated from carrot seeds and roots as was demonstrated by
precipitation of pectin-AGP complexes with the AGP-specific Yariv-reagent (Immerzeel,
2005). However, the populations obtained in our study did not react with the Yariv reagent
suggesting that arabinogalactan proteins were not present in our pectin preparations.
Furthermore, it is known from literature that proteins are associated to pectins in the cell wall
since proteins like wall-associated kinases can be released after endo-PG digestion of the cell
wall (Mort, 2002). It is suggested in literature that the carboxyl groups of GalA residues in
pectins may interact with the amino groups of proteins through electrostatic interactions
(Mort, 2002) and also hydrogen binding is suggested to be important in protein-pectin
complexes in model systems (Girard, Turgeon & Gauthier, 2002).
Another group of compounds which may absorb at 280 nm are phenolic compounds in
general. Again, their amount in commercial pectins has been reported to be rather low (<1%)
(Kravtchenko et al., 1992). It is known that pectins (mainly HM pectins and RGII dimers) can
be associated with some polyphenols (e.g. tannins) (Le Bourvellec, 2003; Riou, Vernhet,
Doco & Moutounet, 2002). The mechanism is unclear but hydrogen and hydrophobic
interactions are suggested.
127
Chapter 7
5. Pectin analysis in the near future
With our analytical approach we were able to reveal differences in pectin preparations of
similar chemical structure. The separation of commercial pectins in pectic populations on
preparative scale appeared to be rather time consuming: one day for the separation and
collection of the pectic fraction. The further purification process of the populations was time
consuming as well (3 days for salt removing). Since the analytical WAX HPLC column was
shown to fractionate the pectic populations in the same way as the preparative Source-Q
column, we were aiming at the characterisation of the populations fractionated on small scale
(1.5 mg of pectin injected on the column). Low concentrations of each fraction obtained will
then directly be characterised for DM and the distribution of the methyl-esters using CE
before and after endo-PG digestion of the samples. However, the electrophoretic mobility of
the samples was highly dependant on the level of salts present in the samples and therefore a
desalting step was necessary before analysis on CE. As a first attempt, the populations of the
commercial pectin B were separated and fractionated using the analytical WAX column
(results not shown). The DM of the fractions of pectin B was then analysed by CE after
desalting with centrifugal eppendorf devices (10 kDa membranes). Although still problems
concerning reproducibility and recovery of methyl-esters occur, we believe that this approach
can be used for the rapid characterisation of a whole range of pectin preparations.
6. Medical applications of homogalacturonan
The determination of the distribution of methyl-esters in pectic molecules is important, not
only for food systems as described in our studies but also in medical applications. Since
dietary fibers (including pectins) are not hydrolysed by enzymes in the small intestine, they
can bind to drugs and influence their absorption and thus their bioavailability (Dongowski,
Neubert, Haase & Schnorrenberger, 1996). It has been shown that the DM or the distribution
of free and methyl-esterified GalA residues of pectin can influence the transport or
permeation of drugs (Dongowski et al., 1996). The interaction of pectins and propranolol (β-
blocker) has been studied. Propranolol is a drug used for the treatment of high blood pressure,
prophylaxis, migraine or anti-anxyolitic and its transport through an artificial membrane is
studied in the presence of pectins. The action of HM pectins with a blockwise or random
distribution of the non-esterified GalA was compared. The transport of the propranolol was
delayed when the DM of the pectins decreased and a longer delay has been observed for the
128
Concluding remarks
pectin with blocks of non-methyl-esterified blocks compared to the pectins with a random
distribution of the charges (Dongowski et al., 1996). Food components containing LM pectins
and blockwise HM pectins may decrease the bioavailability of propranolol indicating the
importance of the distribution of the substituents over pectic backbone in drug interaction.
In general, it can be stated that our study gave us quite some new insights in the complexity of
commercial pectin preparations and new tools are presented to characterise individual
populations present in the crude mixture. Right now, it seems that the next step should be the
large-scale fractionation of commercial pectins into their populations allowing functional
characterisation of these populations with respect to their gelling, emulsifying and thickening
properties and to link these findings with the chemical fine structure to be established as well.
References
Akhtar M., Dickinson E., Mazoyer J., Langendorff V. (2002). Emulsion stabilizing properties of depolymerized
pectin. Food Hydrocolloids, 16, 249-256.
Alonso-Mougan M., Meijide F., Jover A., Rodriguez-Nunez E., Vazquez-Tato J. (2002). Rheological behaviour
of an amide pectin. Journal of Food Engineering, 55, 123-129.
Benen J. A. E., Vincken J.-P., Alebeek G.-J. V., (2002). Microbial pectinases. In; Pectins and their
Manipulation, Seymour G. A., Tucker G. B. ,Blackwell Publishing Ltd.,174-215.
Braccini I., Grasso R. P., Perez S. (1999). Conformational and configurational features of acidic polysaccharides
and their interactions with calcium ions: a molecular modeling investigation. Carbohydrate Research,
317, 119-130.
Chen E. M. W., Mort A. J. (1996). Nature of sites hydrolysable by endo-polygalacturonase in partially-esterified
homogalacturonans. Carbohydrate Polymers, 29, 129-136.
Daas P. J. H., Alebeek G. J. W. M. v., Voragen A. G. J., Schols H. A., (1999). Determination of the distribution
of non-esterified glacturonic acid in pectin with endo-polygalacturonase. In: Gums and Stabilisers for
the food industry; Williams P. A., Phillips G. O., Wrexham, The Royal Society of Chemistry, 3-18
Daas P. J. H., Meyer-Hansen K., Schols H. A., De Ruiter G. A., Voragen A. G. J. (1999). Investigation of the
non-esterified galacturonic acid distribution in pectin with endopolygalacturonase. Carbohydrate
Research, 318, 135-145.
De Figueiredo R. W., Lajolo F. M., Alves R. E., Filgueiras H. A. C. (2002). Physical-chemical changes in early
dwarf cashew pseudofruits during development and maturation. Food Chemistry, 77, 343-347.
Dongowski G., Neubert R., Haase H., Schnorrenberger B. (1996). Interactions between food components and
drugs. Part 4: Influence of pectins and bile salts on propranolol absorption. International Journal of
Pharmaceutics, 144, 233-239.
129
Chapter 7
Fischer M., (1993). Changes in the pectic substances during the ripening of apples. Ph.D Thesis, Zurich,
Switzerland.
Girard M., Turgeon S. L., Gauthier S. F. (2002). Interbiopolymer complexing between beta-lactoglobulin and
low- and high-methylated pectin measured by potentiometric titration and ultrafiltration. Food
Hydrocolloids, 16, (6), 585-591.
Glahn P. E., Rolin C., (1996). Properties and food uses of pectin fractions. In: Gums and stabilisers for the food
industry; Phillips G. O., Wedlock D. J., Williams P. A., Oxford: Pergamon press, 393-402.
Gross M. O., (1979). Chemical sensory and rheological characterization of low-methoxyl pectin gels.
Guillotin S. E., Bakx E. J., Boulenguer P., Mazoyer J., Schols H. A., Voragen A. G. J. (2005). Populations
having different GalA blocks characteristics are present in commercial pectins which are chemically
similar but have different functionalities. Carbohydrate Polymers, 60, 391-398.
Immerzeel P., (2005). Characterization of carrot arabinogalactan proteins. Ph.D Thesis, Wageningen university,
The Netherlands.
Ishii S., Kiho K., Sugiyama S., Sugimoto H. (1979). Low-Methoxyl Pectin Prepared by Pectinesterase from
Aspergillus japonicus. Journal of Food Science, 44, 611-614.
Knox J. P., Linstead P. J., King J., Cooper C., Roberts K. (1990). Pectin esterification is spatially regulated both
within cell walls and between developing tissues of root apices. Planta, 181, 512-521.
Kohn R. (1975). Ion binding on polyuronates. Alginate and pectin. Pure and Applied Chemistry, 42, 371-397.
Kohn R., Furda I., Kopec Z. (1968). Distribution of free carboxyl groups in the pectin molecule after treatment
with pectin esterase. Collection of Czechoslovak Chemical Communications, 33, 264-269.
Korner R., Limberg G., Christensen T. M. I. E., Mikkelsen D. J., Roepstorff P. (1999). Sequencing of parially
methyl-esterified oligogalacturonates by tandem mass spectrometry and its use to determine pectinase
specificities. Analytical Chemistry, 71, 1421-1427.
Kravtchenko T. P., Voragen A. G. J., Pilnik W. (1992). Analytical comparison of three industrial pectin
preparations. Carbohydrate Polymers, 18, 17-25.
Laurent M. A., Boulenguer P. (2003). Stabilization mechanism of acid dairy drinks (ADD) induced by pectin.
Food Hydrocolloids, 17, 445-454.
Le Bourvellec C., (2003). Association entre les procyanidols et les polymers parietaux de pommes:
quantification et concequences. Ph.D Thesis, UFR Sciences de la vie et de l'environnement, Rennes,
France.
Levigne S., Ralet M. C., Thibault J.-F. (2002). Characterisation of pectins extracted from fresh sugar beet roots
under different conditions using an experimental design. Carbohydrate Polymers, 49, 145-153.
Limberg G., Korner R., Buchholt H. C., Christensen T. M. I. E., Roepstorff P., Mikkelsen D. J. (2000).
Quantification of the amount of Galacturonic acid residues in blocksequences in pectin
homogalacturonan by enzymatic fingerprinting with exo- and endo-polygalacturonase II from
Aspergillus niger. Carbohydrate Research, 327, 321-332.
Liners F., Letesson J. J., Didembourg C., van Cutsem P. (1989). Monoclonal Antibodies against pectin. Plant
Physiology, 91, 1419-1424.
130
Concluding remarks
Liners F., Thibault J.-F., van Cutsem P. (1992). Influence of the degree of polymerisation of oligogalacturonates
and of esterification pattern of pectin on their recognition by monoclonal antibodies. Plant Physiology,
99, 1099-1104.
Lofgren C., Guillotin S., Evenbratt H., Schols H., Hermansson A.-M. (2005). Effects of calcium, pH and
blockiness on kinetic rheological behavior and microstructure. Biomacromolecules, 6, 646-652.
Lootens D., Capel F., Durand D., Nicolai T., Boulenguer P., Langendorff V. (2003). Influence of pH, Ca
concentration, temperature and amidation on the gelation of low methoxyl pectin. Food Hydrocolloids,
17, 237-244.
Mort A. J., (2002). Interactions between pectins and other polymers. In: Pectins and their Modification; Knox J.
P. , Blackwell Publishing Ltd., 30-47.
Nairn C. J., Lewandowski D. J., Burns J. K. (1998). Genetics and expression of two pectinesterase genes in
Valencia orange. Physiologia Plantarum, 102, 226-235.
Powell D. A., Morris E. R., Gidley M. J., Rees D. A. (1982). Conformations and interactions of pectins II.
Influence of residue sequence on chain association in calcium pectate gels. Journal of molecal biology,
(155), 517-531.
Pozsar-Hajnal K., Polacsek-Racz M. (1975). Determination of pectinmethylesterases, polygalacturonase and
pectics substances in some fruits and vegetables. Part I. Study into the pectolytic enzyme content of
tomatoes. Acta Alimentaria, 4, 271-289.
Redgwell R., MacRae E., Hallett I., Fischer M., Perry J., Harker R. (1997). In vivo and in vitro swelling of cell
walls during fruit ripening. Planta, 203, 162-173.
Riou V., Vernhet A., Doco T., Moutounet M. (2002). Aggregation of grape seed tannins in model wine-effect of
wine polysaccharides. Food Hydrocolloids, 16, 17-23.
Tucker G. A., Seymour G. B., (2002). Modification and degradation of pectins. In: Pectins and their
Modification ; Seymour G.B. and Knox J.P., Blackwell Publishing Ltd., 150-168.
Willats W. G. T., Gilmartin P. M., Mikkelsen J. D., Knox P. J. (1999). Cell wall antibodies without
immunization: generation and use of de-esterified homogalacturonan block-specific antibodies from a
native phage display library. The Plant Journal, 18, (1), 57-65.
Willats W. G. T., Limberg G., Buchholt H. C., Alebeek G. J., Benen J., Christensen T. M. I. E., Visser J.,
Voragen A., Mikkelsen J. D., Knox J. P. (2000). Analysis of pectic epitopes recognised by hybridoma
and phage display monoclonal anitbodies using defined oligosaccharides, polysaccharides, and
enzymatic degradation. Carbohydrate Research, 327, 309-320.
Willats W. G. T., MacCartney L., Knox J. P. (2001). In-situ analysis of pectic polysaccharides in seed mucilage
and at the root surface of Arabidopsis thaliana. Planta, 213, 37-44.
Willats W. G. T., Orfila C., Limberg G., Buchholt H. C., van Alebeek G. W. M., Voragen A. G. J., Marcus S. E.,
Christensen T. M. I. E., Mikkelsen D. J., Murray B. S., Knox J. P. (2001). Modulation of the degree and
pattern of methyl-esterification of pectic homogalacturonan in plant cell walls. Implications for pectin
methyl esterase action, matrix properties, and cell adhesion. The journal of biological chemistry, 276,
(22 (june 1)), 19404-19413.
131
Chapter 7
132
Zhan D., Jansson P., Mort A. J. (1998). Scarcity or complete lack of single rhamnose residues interspersed
within the homogalacturonan regions of citrus pectin. Carbohydrate Research, 308, 373-380.
Summary
Summary
The aim of this thesis was to extend the analytical toolbox to analyse the chemical structure of
pectins in more detail with the hope to be able to explain or even to predict the gelling
behavior of these biopolymers more accurately. As summarized in chapter 1, the “standard”
analysis of pectins by the manufacturer do not always make distinction between pectins
having different gelling, thickening or stabilizing properties. These physical differences can
be due to large variations in intramolecular and intermolecular distributions of the methyl-
esters over the pectic backbone. Therefore these parameters were analyzed in our study.
Commercial pectins were firstly analyzed on an analytical weak anion exchange (WAX)
column (chapter 2). The separation was shown to be dependent on the level and distribution of
the methyl-esters as observed by comparison of pectins de-esterified in a blockwise manner
(with plant PME) and in a random manner (fungal PME). In addition, this column was found
to be able to discriminate between two commercial HM pectins known to have similar
chemical characteristics by conventional analysis but exhibiting different gelling behavior, in
a simple and rapid way. Elution profiles obtained, indicated the presence of several
populations within the mother pectins.
Since a detailed characterization of such individual populations required higher amounts of
sample, commercial HM pectins needed to be fractionated on a preparative scale. A Source-Q
anion exchange column gave an identical fractionation as the analytical WAX column
(chapter 3). The “routine” chemical characteristics such as the molecular weight (Mw)
distribution and the galacturonic acid (GalA) content were found to be similar for most
populations. Information about the distribution of the methyl-esters was obtained by
determining the DBabs which is the amount of mono-, di- and triGalA released after endo-
polygalacturonase digestion of the pectins, divided by the amount of GalA in the sample (free
GalA and substituted GalA). The degree of methyl-esterification (DM) and the distribution of
the methyl-esters (DBabs) were different for the various pectic populations. It was also shown
that most of the PG degradable blocks were located inside the galacturonan backbone or at the
reducing end since digestion of the pectins with an exo-polygalacturonase released only small
amounts of free GalA from the non-reducing end. These free GalA blocks at the non-reducing
end were found to fluctuate from one pectic population to another although the length of these
133
Summary
small blocks may still be too short to have a large influence on the physical behavior of the
pectins.
The second part of this research focussed on commercial amidated pectins obtained by
chemical amidation of the HM pectins. The distribution of the methyl-esters and amide groups
over the pectin backbone reported in literature is controversial since it is mentioned to be both
blockwise and random. This study focussed on the quantification of amide groups and on
revealing the precise distribution pattern of the amide groups in amidated pectins.
To be able to determine the degree of substitution (DS), DM and degree of amidation (DAm)
of a small amount of samples, a capillary electrophoresis (CE) method was adapted and
validated (chapter 4). The CE method separates pectins as function of the total charge: similar
eletrophoretic mobilities were observed for pectins substituted to the same degree with either
amide groups or methyl-esters. It was concluded that the total charge and not the distribution
of the charges determines the electrophoretic mobilities confirming earlier literature. In
contrast to CE, the distribution of the charges over the pectic molecules has an effect on the
elution from the anion exchanger. Results obtained using CE fitted nicely with results
obtained by FTIR (chapter 4). The CE was also used to determine the degree of blockiness
(DB) of pectins which was determined so far using HPAEC at pH 5. For this purpose, methyl-
esterified pectins were digested with an endo-polygalacturonase and the mono-, di- and tri
GalA released were analysed on CE. The DB values obtained using CE were found to be
similar to those obtained using the HPAEC method.
The HPAEC method used to determine the DB was further adapted to determine the
distribution of the amide groups over the pectic backbone (chapter 5). Amidated pectins were
digested with an endo-polygalacturonase and oligomers released were identified using
HPAEC and MALDI-TOF MS. The elution from the PA1 anion exchanger was shown to be
related to the charge of the oligomers as well as to the nature of the substituents. Considering
oligomers of the same size and charge, methyl-esterified oligomers were found to elute before
amidated oligomers. Furthermore, the distribution of both amide groups and methyl-esters
was found to be rather random in the amidated pectins studied although small differences
were found between two commercial pectins.
In chapter 6, the fractionation and characterisation of these two amidated samples having
similar chemical characteristics but different calcium sensitivity was described. Different
populations were obtained by preparative anion exchange chromatography. Most of the pectic
populations had a similar degree of substitution but differed in the ratio of amide groups
134

Summary
versus methyl-esters (Am/Me). This different ratio Am/Me in pectic populations indicated a
heterogeneous amidation process of the HM pectins.
In chapter 7, the results of this thesis are discussed and efforts are made to correlate our
findings to the physical behavior of these same pectins as published in literature. The various
possibilities for the origin of the enormous variation in the chemical fine structure of pectins is
discussed with focus on the enzymatic modification of pectins in the plant tissue itself and in
the corresponding peel before and during the extraction process.
135

Summary
136
Samenvatting
Samenvatting
Het doel van dit proefschrift was om het analytische gereedschap voor de analyse van de
chemische structuur van pectines uit te breiden, zodat het geleergedrag van deze
biopolymeren beter kan worden verklaard en zo mogelijk voorspeld. Zoals is samengevat in
hoofdstuk 1, maakt de “standaardanalyse” van pectines door de fabrikant niet altijd
onderscheid in pectines die verschillende gelerende, verdikkende of stabiliserende
eigenschappen bezitten. Deze fysische verschillen kunnen te wijten zijn aan grote variaties in
de intra- en intermoleculaire verdeling van methylesters over de hoofdketen en daarom zijn
deze parameters in dit onderzoek geanalyseerd. Commerciële pectines zijn eerst geanalyseerd
op een zwakke anionwisselingskolom (WAX-10). Door pectines, waarvan methylesters
bloksgewijs zijn verwijderd (met plant-PME), te vergelijken met pectines, waarvan
methylesters willekeurig zijn verwijderd (met schimmel-PME), is gebleken dat de scheiding
afhankelijk is van het gehalte aan en de verdeling van methylesters. Bovendien bleek deze
kolom op eenvoudige en snelle wijze in staat onderscheid te maken tussen twee commerciële
HM-pectines met vergelijkbare chemische eigenschappen, maar met verschillend
geleergedrag. De elutieprofielen duidden op de aanwezigheid van verschillende populaties in
beide pectines.
Omdat voor een gedetailleerde karakterisering van zulke individuele populaties grote
hoeveelheden materiaal nodig waren, zijn de commerciële HM-pectines op preparatieve
schaal gefractioneerd. Een Source-Q anionwisselingskolom vertoonde dezelfde fractionering
als de analytische WAX-10 kolom (hoofdstuk 3). Chemische eigenschappen zoals de
verdeling van het molecuulgewicht (Mw) en het gehalte aan galacturonzuur (GalA) bleken
overeenkomstig voor de meeste populaties. Informatie over de verdeling van methylesters is
verkregen aan de hand van DBabs: de hoeveelheid mono-, di- en tri-GalA vrijgemaakt door
pectineafbraak met endo-polygalacturonase gedeeld door de totale hoeveelheid GalA in het
monster (zowel vrij als gesubstitueerd GalA). De veresteringsgraad (DM) en de verdeling van
de methylesters (DBabs) waren verschillend voor de pectinepopulaties. Er is bovendien
aangetoond dat de meeste PG-afbreekbare blokken zich in de galacturonzuurketen of aan het
reducerende einde bevonden, want bij de afbraak van pectines met een exo-polygalacturonase
kwamen slechts kleine hoeveelheden vrij GalA van het niet-reducerende einde vrij. Deze vrije
GalA-blokken aan het niet-reducerende einde bleken in omvang te fluctueren tussen de ene en
137
Samenvatting
de andere pectinepopulatie. De lengte van deze kleine blokken is waarschijnlijk te klein om
een grote invloed op het fysische gedrag van de pectines uit te oefenen.
Het tweede deel van het onderzoek richtte zich op commerciële, geamideerde pectines,
verkregen door chemische amidering van de HM-pectines. Literatuurgegevens over de
verdeling van methylesters en amidegroepen over de hoofdketen van pectine zijn
tegenstrijdig, omdat deze zowel bloksgewijs als willekeurig wordt genoemd. In dit onderzoek
was de nadruk gefocust op het kwantificeren van amidegroepen en het ontrafelen van de
precieze verdeling van amidegroepen in geamideerde pectines.
Om de substitutiegraad (DS), de methyleringsgraad (DM) en de amideringsgraad (DAm) te
kunnen bepalen van een kleine hoeveelheid monster is een methode voor capillaire
electroforese (CE) aangepast en gevalideerd (hoofdstuk 4). De CE-methode scheidt pectines
als functie van de totale lading: voor pectines met dezelfde DAm of DM is een
overeenkomstige electroforetische mobiliteit waargenomen. Er is geconcludeerd dat de totale
lading en niet de ladingsverdeling de electroforetische mobiliteit bepaalt en daarmee werd
eerdere literatuur bevestigd. In tegenstelling tot CE heeft de verdeling van lading over
pectinemoleculen wel invloed op de elutie van een anionwisselingskolom. Resultaten
verkregen met CE voor de DS, DM en DAm kwamen goed overeen met resultaten verkregen
met FTIR (hoofdstuk 4). CE is tevens gebruikt om de mate van bloksgewijze verdeling (DB)
te bepalen, die tot dusver alleen met HPAEC bij pH 5 bepaald kon vorden. Hiervoor zijn
methylveresterde pectines afgebroken met endo-polygalacturonase en zijn de vrijgekomen
mono-, di- en tri-GalA geanalyseerd met CE. Ook de DB-waarden verkregen met CE waren
overeenkomstig met waarden bepaald met HPAEC.
De HPAEC-methode, die werd gebruikt voor de bepaling van DB werd verder aangepast om
de verdeling van amidegroepen over de hoofdketen van pectine te bepalen (hoofstuk 5).
Geamideerde pectines zijn afgebroken met een endo-polygalacturonase en vrijgekomen
oligomeren zijn geïdentificeerd met HPAEC en MALDI-TOF MS. De elutie van de PA1
anionwisselingskolom bleek te zijn gerelateerd aan zowel de lading van de oligomeren als de
soort substituenten. Wat betreft oligomeren met dezelfde grootte en lading, bleken
methylveresterde oligomeren vóór geamideerde oligomeren te elueren. Bovendien bleek de
verdeling van zowel amidegroepen als methylesters in de bestudeerde geamideerde pectines
behoorlijk willekeurig, hoewel kleine verschillen werden gevonden tussen de twee
commerciële pectines.
In hoofdstuk 6 is de fractionering en karakterisering van deze twee geamideerde pectines met
overeenkomstige chemische eigenschappen maar verschillende calciumgevoeligheid
138
Samenvatting
beschreven. Met preparatieve anionwisselingschromatografie zijn verschillende populaties
verkregen. De meeste pectinepopulaties hadden een overeenkomstige substitutiegraad, maar
verschilden in de ratio amidegroepen / methylesters (Am/Me). Dit verschil in Am/Me ratio in
pectinepopulaties duidt op een heterogeen amideringsproces van HM-pectines.
In hoofdstuk 7 zijn de resultaten van het proefschrift bediscussieerd en zijn pogingen
ondernomen de resultaten te correleren aan literatuurgegevens over fysisch gedrag van
dezelfde pectines. Verscheidene mogelijkheden voor de oorsprong van de enorme variatie in
de chemische fijnstructuur van pectines worden besproken met de nadruk op enzymatische
modificaties van pectines in het plantenweefsel zelf en in de bijbehorende by produkten vóór
en tijdens het extractieproces.
139

Samenvatting Samenvatting
140 140
Résumé
Résumé
Le but de cette thèse était d’augmenter le nombre d’outils disponibles pour analyser la
structure des pectines plus en détail et tenter d’expliquer voire de prédire le comportement
gélifiant de ces bio-polymères de façon plus précise. Comme indiqué dans le chapitre 1,
l’analyse “standard” des pectines par les industriels ne permet pas toujours de distinguer les
pectines présentant différentes propriétés gélifiantes, épaississantes ou stabilisantes. Les
différences de ces propriétés physiques peuvent être dues à des variations importantes dans la
distribution des groupes méthylés du squelette pectique au niveau intramoléculaire ou
intermoléculaire. Ces paramètres ont donc été analysés dans cette étude. Les pectines
commerciales ont tout d’abord été analysées sur une colonne analytique faiblement
échangeuse d’anions (WAX-10 ; chapitre 2). Il fut démontré que la séparation des pectines sur
cette colonne était due à la quantité et à la distribution des groupes méthyles après
comparaison des pectines dé-méthylées en blocs (utilisation de la PME des plantes) et de
manière aléatoire (utilisation de la PME des champignons). En outre, cette méthode de
séparation simple et rapide permet de distinguer deux pectines commerciales hautement
méthylées (HM) qui possèdent des caractéristiques chimiques similaires (d’après les méthodes
d’analyses conventionnelles) mais des propriétés gélifiantes différentes. Les profils d’élution
obtenus ont indiqué la présence de plusieurs populations pectiques au sein des pectines mères.
Comme la caractérisation détaillée de ces populations pectiques nécessite de plus grandes
quantités d’échantillon, les pectines commerciales HM ont été fragmentées à l’échelle
préparative. Une colonne Source-Q échangeuse d’anions a donné une fragmentation similaire
à celle obtenue avec la colonne analytique WAX-10 (chapitre 3). Les caractéristiques
chimiques “standards” comme la distribution du poids moléculaire (Mw) et le contenu en
acide galacturonique (GalA) furent similaires pour la plupart des populations. Des
informations sur la distribution des groupes méthylés ont été obtenues en déterminant le DB
(degré des substituants en blocs). Le DB correspond à la quantité d’acides mono-, di- et
trigalacturoniques, libérés après digestion des pectines (par une endo-polygalacturonase) par
rapport à la teneur en acide galacturonique dans les échantillons (GalA libre et substitué). Le
degré de méthyl-esterification (DM) et la distribution des méthyl-esters (DBabs) des
populations pectiques purifiées furent différents. En utilisant une exo-polygalacturonase
libérant peu de GalA non méthly-esterifiés à l’extrémité non réduite des pectines, il fut
141
Résumé
démontré que les blocs dégradés par l’endo-PG étaient localisés à l’intérieur ou à l’extrémité
réduite du squelette pectique. La taille de ces blocs d’acides galacturoniques libres à
l’extrémité réduite fluctua d’une population pectique à l’autre mais cette taille est
probablement trop petite pour avoir un effet important sur les propriétés physiques des
pectines.
La deuxième partie de cette étude focalise sur les pectines amidées obtenues après amidation
chimique des pectines HM. Les résultats concernant la distribution des méthyl-esters et des
groupes amidés sur le squelette pectique décrits dans la littérature sont contradictoires : une
distribution des substituants en blocs mais également une distribution aléatoire sont suggérés.
Notre étude focalise sur la quantification des groupes amidés et sur la distribution de ces
groupes dans les pectines amidées.
Afin de déterminer le degré de substitution (DS), le degré de méthylation (DM) et le degré
d’amidation (DAm) de faibles quantités de pectines, une méthode a été développée et validée
en utilisant une électrophorèse capillaire (CE ; chapitre 4). Cette méthode utilisant la CE
sépare les pectines en fonction de leur charge totale : des migrations électrophorètiques
similaires ont été trouvées pour des pectines ayant le même degré de substitution. Il fut déduit
que la charge totale et non la distribution des charges détermine les déplacements
électrophorètiques ce qui confirme les résultats des précédentes publications. Contrairement a
ce qui fut observé en CE, la distribution des charges sur les molécules pectiques a un effet sur
leur élution lorsqu’un échangeur d’anions est utilisé. Les résultats obtenus avec la CE (DS,
DM, DAm) concordèrent avec ceux obtenus par FTIR (chapitre 4). La CE a aussi été utilisée
pour déterminer le degré d’acides libres en blocs (DB) dans les pectines. Ce DB était
déterminé auparavant par chromatographie échangeuse d’anions (HPAEC) à pH5. Dans ce
but, les pectines méthyl-esterifiées ont été dégradées avec une endo-polygalacturonase et les
acides mono-, di- and trigalacturoniques libérés ont été analysés par CE. Les valeurs de DB
obtenues furent similaires à celles obtenues en utilisant la méthode HPAEC.
La méthode utilisant l’HPAEC pour calculer le DB a été adaptée pour déterminer la
distribution des groupes amides sur le squelette pectique (chapitre 5). Les pectines amidées
ont été dégradées par une endo-polygalacturonase et les oligomères libérés ont été identifiés
en utilisant l’HPAEC et le MALDI-TOF MS. L’ordre d’élution sur la colonne échangeuse
d’anion (PA1) fut dicté par la charge des oligomères mais aussi par la nature des substituents.
Lorsque les oligomères furent de taille et de charge identiques, les oligomères méthyl-
esterifiés ont élué avant les oligomères amidés. De plus, la distribution des groupes amidés
142
Résumé
mais aussi des méthyl-esters fut trouvée comme étant relativement aléatoire dans les pectines
amidées étudiées et les deux pectines commerciales amidées n’ont montré que de faibles
différences.
Dans le chapitre 6, ces deux pectines amidées avec des caractéristiques chimiques similaires
mais une sensibilité différente au calcium sont fractionnées et les fractions sont caractérisées.
Les différentes populations furent obtenues par chromatographie préparative échangeuse
d’anions. La plupart des populations pectiques présentèrent un degré de substitution similaire
mais différents rapports entre les groupes amidés et les méthyl-esters (Am/Me). Ces différents
rapports indiquent que le procédé d’amidation des pectins HM fut hétérogène.
Les résultats de cette thèse sont discutés dans le chapitre 7 et les possibles corrélations entre
les informations de cette thèse et le comportement physique des pectines décrites dans la
littérature sont relatés. L’origine de cette énorme variation dans la structure fine des pectines
est aussi analysée en insistant sur les modifications enzymatiques des pectines dans les tissus
de la plante et dans la peau des fruits avant et pendant l’extraction des pectines.
143

Résumé
144

Acknowledgements
Acknowledgements
Since most of the persons are reading this page first, I will make a short summary of my thesis
in this part as well…. Ok I won’t. This part is rather stressful since I do not want to forget
anybody. These four years have been really rich scientifically (I enjoyed a lot the trips for
conferences in Japan, USA, Italy, Wales!!) and humanly since I meet so many persons from
so many different countries.
First I would like to thank my supervisor Henk for his way of guidance that I liked a lot
(straightforward and efficient!), his happiness, his support and the garden talks when I was not
so optimistic. I want to thank as well my promotor Fons for his availability and his advices.
I am also grateful to the company Degussa Texturants Systems, especially to Karin Born,
Patrick Boulenguer, Jacques Mazoyer, Georg Schick for their valuable discussions and their
support. I am as well thankful to Catherine Renard who informed me about the Ph.D position
in the Netherlands and who has always been available for help. I would like to thank as well
Anne-Marie Hermansson, Caroline Löfgren and Camilla Lundell (you are a great “crêpes”
cooker!) for the nice discussions.
My great colleagues: Chen (the scientific noodle expert and great noodle cooker!), Peter I (I
have to show you a festnoze in Bretagne completely different from your techno…), Gerd Jan
(I was not homesick since you are often singing the song from Edith Piaf “non rien de rien”!)
and Hauke (you are my favorite Calimero!): I will miss you guys! I had a lot of fun and great
moments will stay in my mind (especially when Gerd-Jan and Hauke are buying ice cream
and chocolate to support me!). I would also like to thank Steph P: ça a commencé par un
même prénom (pas pratique à nous différencier au labo) puis par de grands fous rires même
dans les moments durs! Avec Fred, Miki et Christophe on a passé beaucoup de week-end
mémorables sur Bruxelles (merci les garçons pour ces bons moments!). Je voudrais aussi
remercier Franck, Véro et les enfants (vous faites partie de ma famille et votre présence me fût
d’un grand réconfort!).
I would also like to thank Sandra (my shopping partner! we keep in touch for sure!), Mirjam
(always there when people need you, you are an amazing women!), Wil (thanks for making
145
Acknowledgements
my dutch summary and for being always so nice, oh no! except when your stomach is
empty…), René V (instead of walking to the south of France, you have to walk next year with
Jodie to Bretagne!), Chantal (the baby sitting of Tosca was great even though at 3 years old
she was speaking dutch better than me…), my two sweeties Julia and Renate (I will manage to
stop in roller skates…), Peter W (I promise, I will not to switch to English when you speak
French!), Kerensa (beautiful bride!), Gerrit vK (for giving me a nice surname that also
corresponds to him by the way…), Bas (I have to present you my French friends all so nice!
Vive la France et la Hollande!), Nathalie (tous les ans on se fait le festival de Gand?), Bram
(you suffered with the CE as much as I did…), Laurice (Nantes dans la Bretagne ou
pas…éternelle polémique!), Lynn (hey! you are in France now so I will see you often!),
Catriona (thanks for your happiness!), Sergio (you had the feeling to be retired after your
thesis and I have a similar feeling…), Mark (you can cycle to Bretagne!), Jolanda (thanks for
your help and your kindness and see you in France to practice the French of your son!),
Miranda (dynamic woman! I enjoyed a lot working with you), Lex (you have to go back to
Bretagne when I will be over there!), Ben (thanks for the enzyme info and for your
happiness!), Margaret (always helping me when I needed), Edwin (thanks a lot for the help on
CE and with MS), Jan (you are always so sympathic!), Jolan, René K for his help when I
wanted to throw away the instruments since they were not “always” working. Gerrit B and
Jean-Paul for the discussions and their help. I would like also to thank the students who
contributed to this thesis: Joke, Janine, Marta, Edna and Nicolas.
I want to thank as well my french friends, always there when I need them: Alex et Régis (la
Guyane c’est loin, mais je viendrai vous voir!), Babeth (on a décidé de faire notre thèse à
l’étranger et c’était un bon choix!), Audrey (ton séjour en Hollande restera gravé dans pas mal
d’esprits…), Sabrina (ca y est je rentre en France et on va pouvoir passer plus de temps
ensemble!!), Flo (ma cocotte française en Hollande, j’ai beaucoup apprécié les après-midi
shopping à pipeletter), Karine LR (merci pour ton soutien et toutes les belles cartes!), Steph C
(j’ai beaucoup apprécié la boîte de bonbons français mais pas autant que la glace au citron de
notre jeunesse!), Peg (ma parisienne adorée!), Sev (ma globe trotteuse préferrée!), Lydie (tu
es venue en Hollande avec moi, heureusement que tu étais la!), Gilles (casse des verres dans
la brioche, oh le gâchis!), Gaëlle (ca y est! c’est fini pour moi aussi!), Céline et David (mes
tourtereaux préferrés!), Arno (mon “msneur” préferré!), Flo K (j’ai hâte de vous voir plus
146
Acknowledgements
souvent ainsi que bébé Cylia!), Zourata (je viendrai te voir au Burkina!), William and Yaite
(on se reverra en France!).
The last but not the least I would like to thank my family. Je voudrais remercier ma grand-
mère que j’adore et qui m’a manqué (tu me feras de la langue de boeuf, s’il te plaît?!) ainsi
que mon oncle Pierrot, ma tante Christiane et les enfants. Et enfin, le lien le plus fort qui me
rappelle en France: je voudrais remercier mes parents et mon petit “grand” frère (“la soeur”
revient, attention aux oreilles!) pour leur soutien. Je trouve pas de mot pour vous dire ce que
je ressens: j’ai hâte de pouvoir à nouveau être parmi vous!
Stéphanie
147

Acknowledgements
148
Curriculum vitae
Curriculum vitae
Stéphanie Emmanuelle Guillotin was born on 13th of June 1977 in Vannes (France). She
obtained her degree of life sciences (DEUG) in 1997 at the university of Southern Brittany
and in 1998 she graduated (Licence, BSc) in organisms and population biology in Rennes. In
1999, she passed the 4th year degree (maîtrise) in cell biology and physiology (speciality
plant physiology) at the university of Rennes (mention assez bien). Finally, she obtained the
MSc degree at Rennes in Plant adaptations and productions (speciality physiology of
cultivated plants) in 2000 (mention bien). Thereafter, she came to Wageningen (The
Netherlands) and started her Ph.D at the laboratory of Food Chemistry at the Wageningen
University, working on the structural features of commercial pectins as described in this
thesis. This project was supported by Degussa Texturant systems (Baupte, France). Since
april 2005, she is working as a Post-Doc at the laboratory of Food Chemistry at the
Wageningen university since april 2005 on a project in collaboration with Sara Lee/ DE.
149

List of publications
List of publications
Full papers
Guillotin, S.E., Bakx, E.J., Boulenguer P., Mazoyer J., Schols H.A., Voragen A.G.J., (2004).
Populations having different GalA blocks characteristics are present in commercial pectins
which are chemically similar but have different gelling properties, Carbohydrate Polymers,
60, 391-398.
Guillotin S.E. Schols H.A. van Kampen J., Boulenguer P., Mazoyer J., Voragen A.G.J.
(2003). Analysis of partially amidated and methyl-esterified galacturonic acid oligomers by
high performance anion exchange chromatography and matrix-laser desorption-ionisation
time of flight mass spectrometry, In Williams P. A., Phillips G. O. Gums and Stabilisers for
the food industry 12, Wrexham: The Royal Society of Chemistry, 303-310.
Guillotin S.E., Van Loey A., Boulenguer P., Schols H.A., Voragen, A.G.J. Rapid HPLC
method to screen pectins for heterogeneity in methyl-esterification. To be submitted in Food
Hydrocolloids.
Guillotin S.E., Bakx, E.J., Boulenguer P., Schols H.A., Voragen, A.G.J. Determination of the
degree of substitution, degree of amidation and degree of blockiness of commercial pectins by
using capillary electrophoresis. To be submitted in Food Hydrocolloids.
Guillotin S.E., Van Kampen J., Boulenguer P., Schols H.A., Voragen, A.G.J. Degree of
blockiness of amide groups as indicator for differences between amidated pectins. To be
submitted in Biopolymers.
Guillotin S.E., Mey N. Ananta E., Boulenguer P., Schols H.A., Voragen, A.G.J.
Chromatographic and enzymatic strategies to reveal differences between amidated pectins on
molecular level. To be submitted in Biomacromolecules.
151
List of publications
152
Caroline Löfgren, Stéphanie Guillotin, Hanne Evenbratt, Henk Schols and Anne-Marie
Hermansson (2005). Effect of calcium, pH and blockiness on kinetic rheological behavior
and microstructure of HM pectin gels. Biomacromolecules, 6, 646-652.
Abstracts
Guillotin S.E., Bakx E.J. , Boulenguer P., Mazoyer J., Schols H.A. and Voragen A.G.J.
(2004). Differences in pectin’s structure revealed by the characterization of pectic
populations, X cell wall meeting, Sorrento, Italy.
Catherine M.G.C. Renard, A. Gacel, S. Guillotin, Ch. Massacrier & P. Guillermin (2001).
Systematic difference in cell wall structure between tables and cider apples ?. IX cell wall
meeting, Rotterdam, The Netherlands.
Guillotin S.E., Schols H.A., Ananta E., Bakx E.J., Boulenguer P., Voragen A.G.J. (2004).
Chromatographic and enzymatic strategies to reveal differences in saponified amidated
pectin’s structure. X cell wall meeting, Sorrento, Italy.
Addendum
Addendum
The work described in this thesis has been carried out with the financial support from Degussa
Texturants Systems (Baupte, France).
153

Training activities
Overview of completed training activities
Discipline specific activities
Courses: VLAG International advanced course: Advanced food analysis (Wageningen, March 2002)
VLAG Summer school glycosciences (Wageningen, March 2002)
Applied Statistics by Dr. W. Hammers (Wageningen, 2002-2003)
Conferences: Second international symposium: Pectins and pectinases (Rotterdam, The Netherlands, May 2001)
Cell wall meeting in Toulouse (France, September 2001)
Gums and stabilisers for the food industry (Wrexham, Wales, June 2003)
Scientific exchange (Hamburg, Germany, 2004)
Cell wall meeting (Sorrento, Italy, September 2004)
General courses: PhD student week VLAG (Bilthoven, The Netherlands, 2001)
Food Chemistry PhD trip (USA, November 2002)
Food Chemistry PhD trip (Japan, December 2004)
Additional activities: Preparation Ph.D proposal
Degussa scientific meetings (2001-2005)
Food Chemistry Seminars (Wageningen, 2001-2005)
Food Chemistry Colloquia (Wageningen, 2001-2005)
Food Chemistry Pectin meetings (Wageningen, 2001-2005)
155

Related Documents


